User login
Following Patient Safety Practices
Healthcare delivery organizations are under increasing pressure to improve patient safety. The fundamental underpinning of efforts to improve safety has been the establishment of a no‐blame culture, one that focuses less on individual transgressions and more on system improvement.[1, 2] As evidence‐based practices to improve care have emerged, and the pressures to deliver tangible improvements in safety and quality have grown, providers, healthcare system leaders, and policymakers are struggling with how best to balance the need for accountability with this no‐blame paradigm.
In dealing with areas such as hand hygiene, where there is strong evidence for the value of the practice yet relatively poor adherence in many institutions, Wachter and Pronovost have argued that the scales need to tip more in the direction of accountability, including the imposition of penalties for clinicians who habitually fail to follow certain safety practices.[3] Although not obviating the critical importance of systems improvement, they argue that a failure to enforce such measures undermines trust in the system and invites external regulation. Chassin and colleagues made a similar point in arguing for the identification of certain accountability measures that could be used in public reporting and pay‐for‐performance programs.[4]
Few organizations have enacted robust systems to hold providers responsible for adhering to accountability measures.[4] Although many hospitals have policies to suspend clinical privileges for failing to sign discharge summaries or obtain a yearly purified protein derivative test, few have formal programs to identify and deal with clinicians whose behavior is persistently problematic.[3] Furthermore, existing modes of physician accountability, such as state licensing boards, only discipline physicians retroactively (and rarely) when healthcare organizations report poor performance. State boards typically do not consider prevention of injury, such as adherence to safety practices, to be part of their responsibility.[5] Similarly, credentialing boards (eg, the American Board of Internal Medicine) do not assess adherence to such practices in coming to their decisions.
It is estimated that strict adherence to infection control practices, such as hand hygiene, could prevent over 100,000 hospital deaths every year; adherence to other evidence‐based safety practices such as the use of a preoperative time‐out would likely prevent many more deaths and cases of medical injury.[3, 6] Although there are practical issues, such as how to audit individual clinician adherence in ways that are feasible and fair, that make enforcing individual provider accountability challenging, there seems little doubt that attitudes regarding the appropriateness of enacting penalties for safety transgressions will be key determinants of whether such measures are considered. Yet no study to date has assessed the opinions of different stakeholders (physicians, nurses, trainees, patients) regarding various strategies, including public reporting and penalties, to improve adherence to safety practices. We aimed to assess these attitudes across a variety of such stakeholders.
METHODS
Survey Development and Characteristics
To understand the perceptions of measures designed to improve patient safety, we designed a survey of patients, nurses, medical students, resident physicians, and attending physicians to be administered at hospitals associated with the University of California, San Francisco (UCSF). Institutional review board approval was obtained from the UCSF Committee on Human Research, and all respondents provided informed consent.
The survey was developed by the authors and pilot tested with 2 populations. First, the survey was administered to a group of 12 UCSF Division of Hospital Medicine research faculty; their feedback was used to revise the survey. Second, the survey was administered to a convenience sample of 2 UCSF medical students, and their feedback was used to further refine the survey.
The questionnaire presented 3 scenarios in which a healthcare provider committed a patient‐safety protocol lapse; participants were asked their opinions about the appropriate responses to each of the violations. The 3 scenarios were: (1) a healthcare provider not properly conducting hand hygiene before a patient encounter, (2) a healthcare provider not properly conducting a fall risk assessment on a hospitalized patient, and (3) a healthcare provider not properly conducting a preoperative timeout prior to surgery. For each scenario, a series of questions was asked about a variety of institutional responses toward a provider who did not adhere to each safety protocol. Potential responses included feedback (email feedback, verbal feedback, meeting with a supervisor, a quarterly performance review meeting, and a quarterly report card seen only by the provider), public reporting (posting the provider's infractions on a public website), and penalties (fines, suspension without pay, and firing).
We chose the 3 practices because they are backed by strong evidence, are relatively easy to perform, are inexpensive, are linked to important and common harms, and are generally supported within the patient‐safety community. Improved adherence to hand hygiene significantly reduces infection transmission in healthcare settings.[7, 8, 9, 10, 11] Performing fall risk assessments has been shown to reduce falls in hospitalized patients,[12] and using preoperative checklists, including a surgical time‐out, can reduce mortality and complication risks by approximately 40%.[13]
Respondents were asked how many cases of documented nonadherence would be necessary for the penalties to be appropriate (1 time, 25 times, 610 times, 1115 times, 16+ times, or would never be appropriate). Finally, respondents were asked to rate the potential harm to patients of each protocol lapse (nonelow, medium, or high).
Demographic information collected from the healthcare providers and medical students included age, gender, position, department, and years' experience in their current position. Demographic information collected from the patients included age, gender, insurance status, race, education level, household income level, and relationship status.
Survey Administration
Surveys were administered to convenience samples of 5 groups of individuals: attending physicians in the UCSF Department of Internal Medicine based at UCSF Medical Center and the San Francisco Veterans Affairs Medical Center, nurses at UCSF Medical Center, residents in the UCSF internal medicine residency program, medical students at UCSF, and inpatients in the internal medicine service at UCSF Medical Center's Moffitt‐Long Hospital. Attending physicians and nurses were surveyed at their respective departmental meetings. For resident physicians and medical students, surveys were distributed at the beginning of lectures and collected at the end.
Patients were eligible to participate if they spoke English and were noted to be alert and oriented to person, time, and place. A survey administrator located eligible patients in the internal medicine service via the electronic medical record system, determined if they were alert and oriented, and approached each patient in his or her room. If the patients verbally consented to consider participation, the surveys were given to them and retrieved after approximately 30 minutes.
Healthcare professionals were offered the opportunity to enter their e‐mail addresses at the end of the survey to become eligible for a drawing for a $100 gift card, but were informed that their e‐mail addresses would not be included in the analytic dataset. Inpatients were not offered any incentives to participate. All surveys were administered by a survey monitor in paper form between May 2011 and July 2012.
Data Analysis
Data analysis was conducted using the Statistical Analysis Software (SAS) package (SAS Institute Inc., Cary, NC) and Stata (StataCorp, College Station, TX). Descriptive analysis and frequency distributions were tallied for all responses. Responses to protocol lapses were grouped into 3 categories: feedback, public reporting, and penalty as described above. As all surveyed groups endorsed feedback as an appropriate response to all of the scenarios, we did not examine feedback, concentrating our analysis instead on public reporting and penalties.
Appropriateness ratings for each response to each protocol lapse were aggregated in 2 ways: ever appropriate (ie, the response would be appropriate after some number of documented lapses) versus never appropriate, and the threshold for the response. Whereas public reporting was only asked about as a single option, 3 separate responses were collapsed into the single response, penalties: fine, suspension, or firing. Individuals were classified as endorsing a penalty if they rated any 1 of these responses as ever appropriate. The threshold for penalty was the smallest number of occurrences at which 1 of the penalty responses was endorsed.
Differences among the 5 groups in the perceived harm of each protocol lapse were tested with 2 analyses. Group differences in ratings of whether public reporting and penalties were ever appropriate were tested with logistic regression analyses for each scenario separately, controlling for age, sex, and perceived harm of the protocol lapse. To determine if the 5 groups differed in their tendency to support public reporting or penalties regardless of the type of protocol lapse, we conducted logistic regression analyses across all 3 scenarios, accounting for multiple observations per individual through use of cluster‐correlated robust variance.[14] Differences among groups in the number of transgressions at which public reporting and penalties were supported were examined with log‐rank tests.
RESULTS
A total of 287 individuals were given surveys, and 183 completed them: 22 attending physicians, 33 resident physicians, 61 nurses, 47 medical students, and 20 patients (overall response rate 64%). Response rate for attending and resident physicians was 73%, for nurses 59%, and for medical students 54%. Among patients who were approached and agreed to accept a survey, 87% returned completed surveys (Table 1). The average age of attending physicians was 35.8 years (standard deviation [SD]: 5.3), residents was 28.3 years (SD: 1.7), nurses was 43.6 years (SD: 11.1), medical students was 26.6 years (SD: 2.9), and inpatients was 48.2 years (SD: 15.9). Thirty‐two percent of attending physicians were female, 67% of resident physicians were female, 88% of nurses were female, 66% of medical students were female, and 47% of inpatients were female.
| Attending Physician | Resident Physician | Nurse | Medical Student | Patient | |
|---|---|---|---|---|---|
| |||||
| No. | 22 | 33 | 61 | 47 | 20 |
| Response rate* | 73% | 73% | 59% | 54% | 87% |
| Age, y, meanSD | 365 | 282 | 4411 | 273 | 4816 |
| Sex, female, % (n) | 32% (7) | 67% (22) | 88% (53) | 66% (31) | 47% (9) |
Perceived Harm
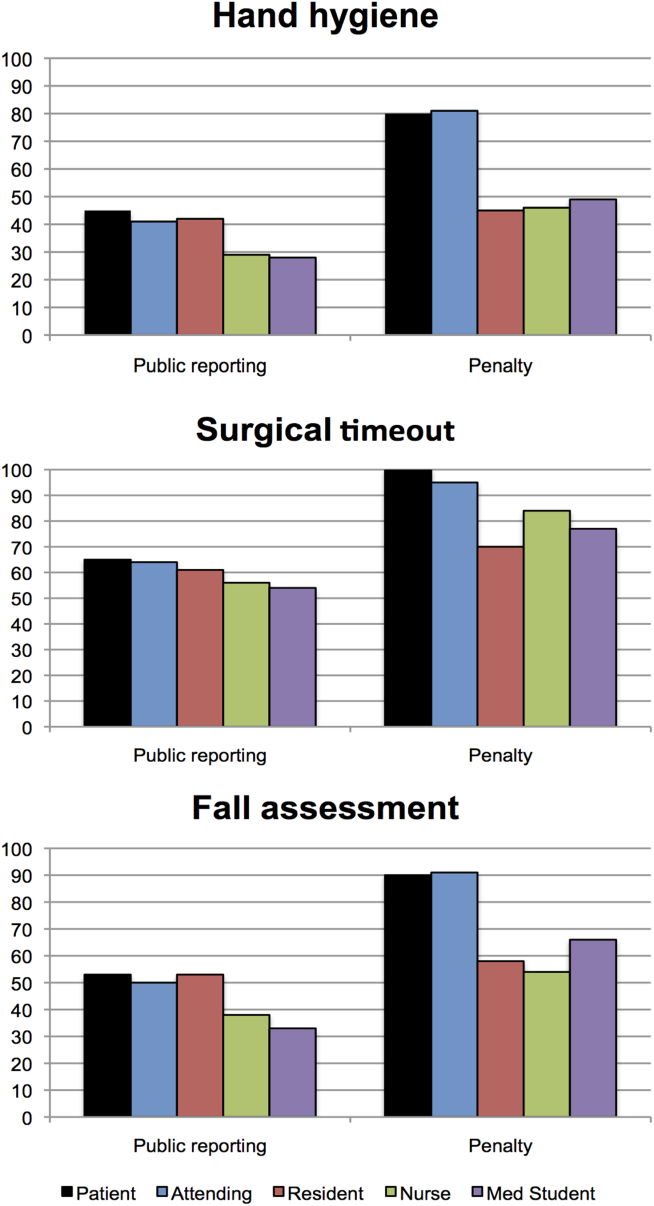
Out of the 3 scenarios presented in in the survey, participants believed that not conducting preoperative time‐outs in surgery presented the highest risk to patient safety, with 57% (residents) to 86% (nurses) rating the potential harm as high (Figure 1). Not conducting fall risk assessments was perceived as second most potentially harmful, and not properly practicing hand hygiene was perceived as least potentially harmful to patient safety. There were significant differences among groups in perceptions of potential harm for all 3 scenarios (P<0.001 for all).

Appropriateness of Public Reporting and Penalties
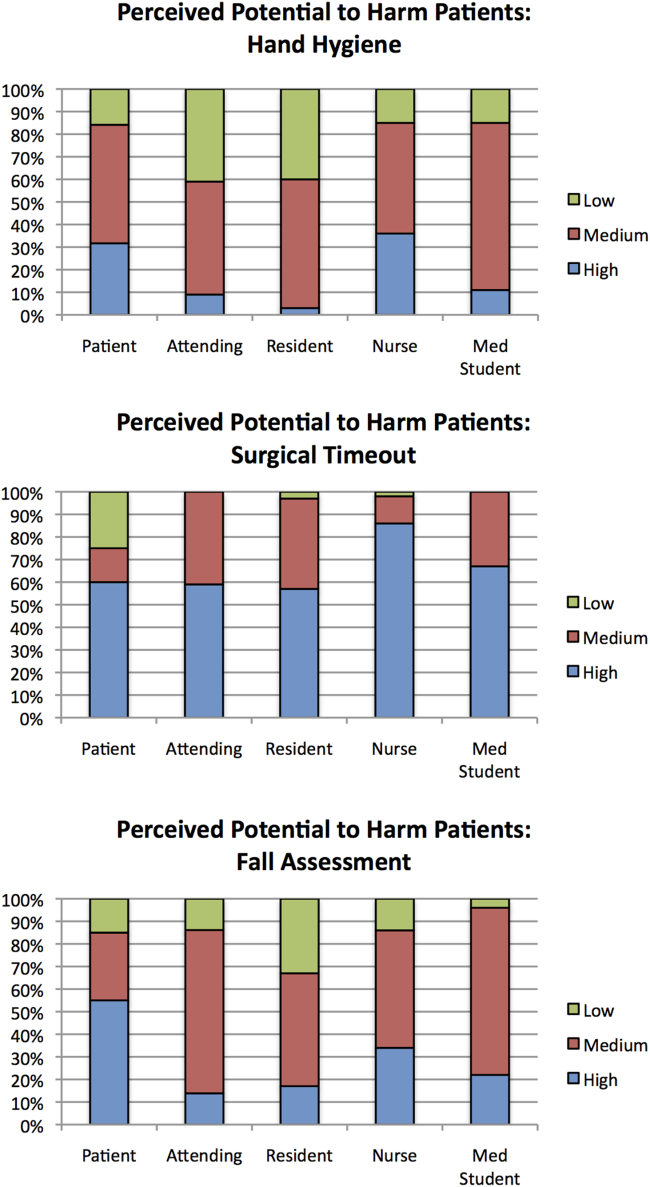
Public reporting was viewed as ever appropriate by 34% of all respondents for hand‐hygiene protocol lapses, 58% for surgical time‐out lapses, and 43% for fall risk assessment lapses. There were no significant differences among groups in endorsement of public reporting for individual scenarios (Figure 2). Penalties were endorsed more frequently than public reporting for all groups and all scenarios. The proportion of attending physicians and patients who rated penalties as ever appropriate were similar for each scenario. Residents, medical students, and nurses were less likely than patients and attending physicians to support penalties (P<0.05 for all differences).
The aggregated analysis revealed that nurses and medical students were significantly less likely than patients to endorse public reporting across scenarios. In terms of endorsement of penalties, we found no significant differences between attending physicians and patients, but residents (odds ratio [OR]: 0.09, 95% confidence interval [CI]: 0.03‐0.32), students (OR: 0.12, 95% CI: 0.04‐0.34), and nurses (OR: 0.17, 95% CI: 0.03‐0.41) had significantly lower odds of favoring penalties than did patients (Table 2).
| Odds Ratio (95% CI) | ||
|---|---|---|
| Public Reporting | Penalty | |
| ||
| Group, across all scenarios | ||
| Patients | Reference | Reference |
| Attending physicians | 0.58 (0.172.01) | 0.88 (0.203.84) |
| Resident physicians | 0.42 (0.121.52) | 0.09 (0.020.32) |
| Nurses | 0.32 (0.120.88) | 0.17 (0.030.41) |
| Medical students | 0.22 (0.060.80) | 0.12 (0.040.34) |
| Scenario, across all groups | ||
| Hand hygiene | Reference | Reference |
| Surgical time‐out | 2.82 (2.033.91) | 4.29 (2.976.20) |
| Fall assessment | 1.47 (1.091.98) | 1.74 (1.272.37) |
Across all surveyed groups, public reporting was more often supported for lapses of surgical timeout (OR: 2.82, 95% CI: 2.03‐3.91) and fall risk assessment protocols (OR: 1.47, 95% CI: 1.09‐1.98) than for the referent, hand‐hygiene lapses. Across all groups, penalties were more likely to be supported for surgical timeout (OR: 4.29, 95% CI: 2.97‐6.20) and fall risk assessment protocol lapses (OR: 1.74, 95% CI: 1.27‐2.37) than for hand‐hygiene lapses.
Thresholds for Public Reporting and Penalties
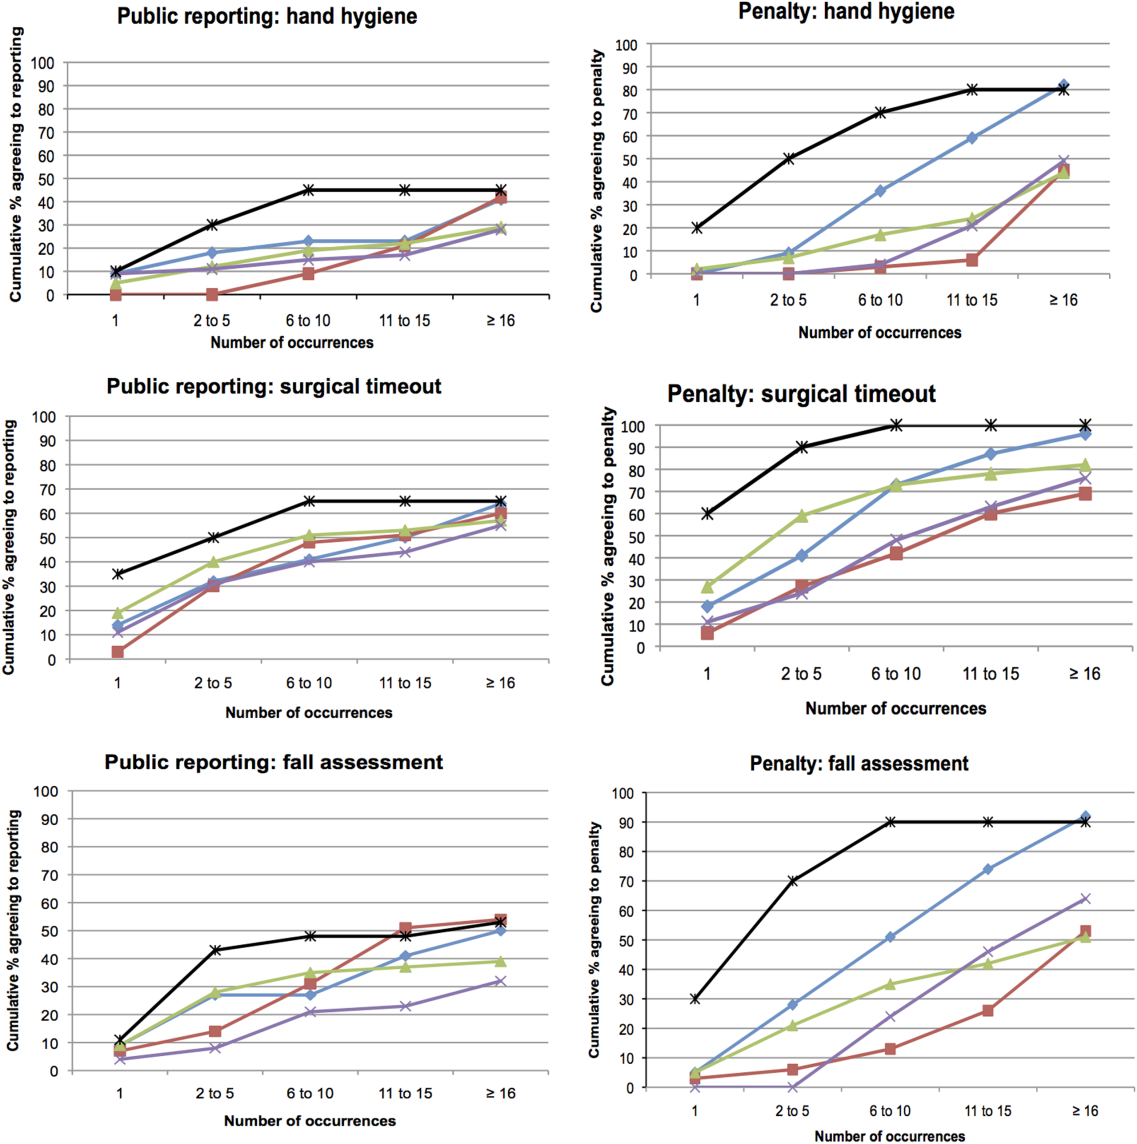
The log‐rank test showed no significant differences among the surveyed groups in the number of transgressions at which public reporting was deemed appropriate in any of the 3 scenarios (P=0.37, P=0.71, and P=0.32 for hand hygiene, surgical time‐out, and fall risk assessment, respectively) (Figure 3). However, patients endorsed penalties after significantly fewer occurrences than residents, medical students, and nurses for all 3 scenarios (P<0.001 for all differences), and at a significantly lower threshold than attending physicians for surgical timeout and fall risk assessment (P<0.001 and P=0.03, respectively).
DISCUSSION
This survey assessed attitudes of healthcare professionals, trainees, and inpatients toward public reporting and penalties when clinicians do not follow basic safety protocols. Respondents tended to favor more aggressive measures when they deemed the safety risk from protocol violations to be higher. Almost all participants favored providing feedback after safety protocol lapses. Healthcare professionals tended to favor punitive measures, such as fines, suspension, and firing, more than public reporting of transgressions. Patients had a lower threshold than both providers and trainees for public reporting and punitive measures. In aggregate, our study suggests that after a decade of emphasis on a no‐blame response to patient safety hazards, both healthcare providers and patients now believe clinicians should be held accountable for following basic safety protocols, though their thresholds and triggers vary.
A surprising finding was that providers were more likely to favor penalties (such as fines, suspension, or firing) than public reporting of safety transgressions. Multiple studies have suggested that public reporting of hospital quality data has improved adherence to care processes and may improve patient outcomes.[15, 16, 17] Although our data do not tell us why clinicians appear to be more worried about public reporting than penalties, they do help explain why transparency has been a relatively powerful strategy to motivate changes in practice, even when it is unaccompanied by significant shifts in consumer choices.[18] It would be natural to consider public reporting to be a softer strategy than fines, suspension, or firing; however, our results indicate that many clinicians do not see it that way. Alternatively, the results could also suggest that clinicians prefer measures that provide more immediate feedback than public reporting generally provides. These attitudes should be considered when enacting public reporting strategies.
Another interesting finding was that patients and attending physicians tended to track together regarding their attitudes toward penalties for safety lapses. Although patients had a lower threshold for favoring penalties than attendings, similar proportions of patients and attending physicians believed that penalties should be enacted for safety transgressions, and both groups were more penal than physician trainees and nurses. We speculate that attendings and patients may have the most skin in the game, patients as the ones directly harmed by a preventable adverse event, and attending physicians as the most responsible clinicians, at least in the eyes of the malpractice system, licensing boards, and credentials committees.
Even though our study illustrates relatively high levels of endorsement for aggressive measures to deal with clinicians who fail to follow evidence‐based safety practices, a shift in this direction has risks and benefits. The no‐blame paradigm in patient safety grew out of a need to encourage open discussion about medical mistakes.[2] Whereas shifting away from a purely no‐ blame approach may lead to greater adherence with safety practices, and one hopes fewer cases of preventable harm, it also risks stifling the open discussions about medical errors that characterize learning organizations.[13, 19] Because of this, a movement in this direction should be undertaken carefully, starting first with a small number of well‐established safety practices, and ensuring that robust education and system improvements precede and accompany the imposition of penalties for nonadherence.
Our study has limitations. The survey was developed using convenience samples of UCSF faculty and medical students, so broader inclusion of physicians, nurses, trainees, and patients may have yielded a different survey instrument. As a survey, we cannot be certain that any of the groups' responses in real life (eg, in a vote of the medical staff on a given policy) would mirror their survey response. Additionally, the responses to protocol lapses did not include all possible administrative responses, such as mandatory training/remediation or rewards for positive behaviors. The responses could have also been different if participants were presented with different patient safety scenarios. The study population was limited in several ways. Attending and resident physicians were drawn from an academic department of internal medicine; it is possible that other specialties would have different attitudes. Patients were relatively young (likely due to the inclusion criteria), as were attending physicians (due to oversampling of hospitalist physicians). The relatively small number of participants could also limit statistical power to detect differences among groups. Additionally, the study population was limited to patients and healthcare professionals in academic medical centers in San Francisco. It is possible that attitudes would be different in other regions and practice settings.
The no‐blame approach to patient safety has been crucial in refocusing the lens on systems failures and in encouraging the active engagement by clinicians, particularly physicians.[2, 3] On the other hand, there are legitimate concerns that a unidimensional no‐blame approach has permitted, perhaps even promoted, nonadherence to evidence‐based safety practices that could prevent many cases of harm. Although it may not be surprising that patients favor harsher consequences for providers who do not follow basic safety protocols, our study demonstrates relatively widespread support for such consequences even among clinicians and trainees. However, all groups appear to recognize the nuances underlying this set of issues, with varying levels of enthusiasm for punitive responses based on perceived risk and number of transgressions. Future studies are needed to investigate how best to implement public reporting and penalties in ways that can maximize the patient safety benefits.
Acknowledgements
The authors are grateful to the clinicians, trainees, and patients who participated in the survey.
- . Understanding Patient Safety. 2nd ed. New York, NY: McGraw Hill Medical; 2012.
- . Error in medicine. JAMA. 1994;272(23):1851–1857.
- , . Balancing "no blame" with accountability in patient safety. N Engl J Med. 2009;361(14):1401–1406.
- , , , . Accountability measures—using measurement to promote quality improvement. N Engl J Med. 2010;363(7):683–688.
- , . Problem doctors: is there a system‐level solution? Ann Intern Med. 2006;144(2):107–115.
- , , , et al. A surgical safety checklist to reduce morbidity and mortality in a global population. N Engl J Med. 2009;360(5):491–499.
- , , , , . Effectiveness of a comprehensive hand hygiene program for reduction of infection rates in a long‐term care facility. Am J Infect Control. 2013;41(1):39–44.
- , . Impact of a hospital‐wide hand hygiene promotion strategy on healthcare‐associated infections. Antimicrob Resist Infect Control. 2012;1(1):13.
- , , , et al. Determinants of hand hygiene noncompliance in intensive care units. Am J Infect Control. 2013;41(2):131–135.
- , , , , , . Impact of a hospital‐wide hand hygiene initiative on healthcare‐associated infections: results of an interrupted time series. BMJ Qual Saf. 2012;21(12):1019–1026.
- , , , . Effectiveness of multifaceted hand hygiene interventions in long‐term care facilities in Hong Kong: a cluster‐randomized controlled trial. Infect Control Hosp Epidemiol. 2012;33(8):761–767.
- , , , , . Development, implementation, and evaluation of a comprehensive fall risk program. J Spec Pediatr Nurs 2011;16(2):130–139.
- , , , . A systematic review of the effectiveness, compliance, and critical factors for implementation of safety checklists in surgery. Ann Surg. 2012;256(6):925–933.
- . A note on robust variance estimation for cluster‐correlated data. Biometrics. 2000;56(2):645–646.
- , , , et al. Public reporting and pay for performance in hospital quality improvement. N Engl J Med. 2007;356(5):486–496.
- , , , , . Improving the outcomes of coronary artery bypass surgery in New York State. JAMA. 1994;271(10):761–766.
- , , . Declines in hospital mortality associated with a regional initiative to measure hospital performance. Am J Med Qual. 1997;12(2):103–112.
- , , , . The public release of performance data: what do we expect to gain? A review of the evidence. JAMA. 2000;283(14):1866–1874.
- . Continuing education meets the learning organization: the challenge of a systems approach to patient safety. J Contin Educ Health Prof. 2000;20(4):197–207.
Healthcare delivery organizations are under increasing pressure to improve patient safety. The fundamental underpinning of efforts to improve safety has been the establishment of a no‐blame culture, one that focuses less on individual transgressions and more on system improvement.[1, 2] As evidence‐based practices to improve care have emerged, and the pressures to deliver tangible improvements in safety and quality have grown, providers, healthcare system leaders, and policymakers are struggling with how best to balance the need for accountability with this no‐blame paradigm.
In dealing with areas such as hand hygiene, where there is strong evidence for the value of the practice yet relatively poor adherence in many institutions, Wachter and Pronovost have argued that the scales need to tip more in the direction of accountability, including the imposition of penalties for clinicians who habitually fail to follow certain safety practices.[3] Although not obviating the critical importance of systems improvement, they argue that a failure to enforce such measures undermines trust in the system and invites external regulation. Chassin and colleagues made a similar point in arguing for the identification of certain accountability measures that could be used in public reporting and pay‐for‐performance programs.[4]
Few organizations have enacted robust systems to hold providers responsible for adhering to accountability measures.[4] Although many hospitals have policies to suspend clinical privileges for failing to sign discharge summaries or obtain a yearly purified protein derivative test, few have formal programs to identify and deal with clinicians whose behavior is persistently problematic.[3] Furthermore, existing modes of physician accountability, such as state licensing boards, only discipline physicians retroactively (and rarely) when healthcare organizations report poor performance. State boards typically do not consider prevention of injury, such as adherence to safety practices, to be part of their responsibility.[5] Similarly, credentialing boards (eg, the American Board of Internal Medicine) do not assess adherence to such practices in coming to their decisions.
It is estimated that strict adherence to infection control practices, such as hand hygiene, could prevent over 100,000 hospital deaths every year; adherence to other evidence‐based safety practices such as the use of a preoperative time‐out would likely prevent many more deaths and cases of medical injury.[3, 6] Although there are practical issues, such as how to audit individual clinician adherence in ways that are feasible and fair, that make enforcing individual provider accountability challenging, there seems little doubt that attitudes regarding the appropriateness of enacting penalties for safety transgressions will be key determinants of whether such measures are considered. Yet no study to date has assessed the opinions of different stakeholders (physicians, nurses, trainees, patients) regarding various strategies, including public reporting and penalties, to improve adherence to safety practices. We aimed to assess these attitudes across a variety of such stakeholders.
METHODS
Survey Development and Characteristics
To understand the perceptions of measures designed to improve patient safety, we designed a survey of patients, nurses, medical students, resident physicians, and attending physicians to be administered at hospitals associated with the University of California, San Francisco (UCSF). Institutional review board approval was obtained from the UCSF Committee on Human Research, and all respondents provided informed consent.
The survey was developed by the authors and pilot tested with 2 populations. First, the survey was administered to a group of 12 UCSF Division of Hospital Medicine research faculty; their feedback was used to revise the survey. Second, the survey was administered to a convenience sample of 2 UCSF medical students, and their feedback was used to further refine the survey.
The questionnaire presented 3 scenarios in which a healthcare provider committed a patient‐safety protocol lapse; participants were asked their opinions about the appropriate responses to each of the violations. The 3 scenarios were: (1) a healthcare provider not properly conducting hand hygiene before a patient encounter, (2) a healthcare provider not properly conducting a fall risk assessment on a hospitalized patient, and (3) a healthcare provider not properly conducting a preoperative timeout prior to surgery. For each scenario, a series of questions was asked about a variety of institutional responses toward a provider who did not adhere to each safety protocol. Potential responses included feedback (email feedback, verbal feedback, meeting with a supervisor, a quarterly performance review meeting, and a quarterly report card seen only by the provider), public reporting (posting the provider's infractions on a public website), and penalties (fines, suspension without pay, and firing).
We chose the 3 practices because they are backed by strong evidence, are relatively easy to perform, are inexpensive, are linked to important and common harms, and are generally supported within the patient‐safety community. Improved adherence to hand hygiene significantly reduces infection transmission in healthcare settings.[7, 8, 9, 10, 11] Performing fall risk assessments has been shown to reduce falls in hospitalized patients,[12] and using preoperative checklists, including a surgical time‐out, can reduce mortality and complication risks by approximately 40%.[13]
Respondents were asked how many cases of documented nonadherence would be necessary for the penalties to be appropriate (1 time, 25 times, 610 times, 1115 times, 16+ times, or would never be appropriate). Finally, respondents were asked to rate the potential harm to patients of each protocol lapse (nonelow, medium, or high).
Demographic information collected from the healthcare providers and medical students included age, gender, position, department, and years' experience in their current position. Demographic information collected from the patients included age, gender, insurance status, race, education level, household income level, and relationship status.
Survey Administration
Surveys were administered to convenience samples of 5 groups of individuals: attending physicians in the UCSF Department of Internal Medicine based at UCSF Medical Center and the San Francisco Veterans Affairs Medical Center, nurses at UCSF Medical Center, residents in the UCSF internal medicine residency program, medical students at UCSF, and inpatients in the internal medicine service at UCSF Medical Center's Moffitt‐Long Hospital. Attending physicians and nurses were surveyed at their respective departmental meetings. For resident physicians and medical students, surveys were distributed at the beginning of lectures and collected at the end.
Patients were eligible to participate if they spoke English and were noted to be alert and oriented to person, time, and place. A survey administrator located eligible patients in the internal medicine service via the electronic medical record system, determined if they were alert and oriented, and approached each patient in his or her room. If the patients verbally consented to consider participation, the surveys were given to them and retrieved after approximately 30 minutes.
Healthcare professionals were offered the opportunity to enter their e‐mail addresses at the end of the survey to become eligible for a drawing for a $100 gift card, but were informed that their e‐mail addresses would not be included in the analytic dataset. Inpatients were not offered any incentives to participate. All surveys were administered by a survey monitor in paper form between May 2011 and July 2012.
Data Analysis
Data analysis was conducted using the Statistical Analysis Software (SAS) package (SAS Institute Inc., Cary, NC) and Stata (StataCorp, College Station, TX). Descriptive analysis and frequency distributions were tallied for all responses. Responses to protocol lapses were grouped into 3 categories: feedback, public reporting, and penalty as described above. As all surveyed groups endorsed feedback as an appropriate response to all of the scenarios, we did not examine feedback, concentrating our analysis instead on public reporting and penalties.
Appropriateness ratings for each response to each protocol lapse were aggregated in 2 ways: ever appropriate (ie, the response would be appropriate after some number of documented lapses) versus never appropriate, and the threshold for the response. Whereas public reporting was only asked about as a single option, 3 separate responses were collapsed into the single response, penalties: fine, suspension, or firing. Individuals were classified as endorsing a penalty if they rated any 1 of these responses as ever appropriate. The threshold for penalty was the smallest number of occurrences at which 1 of the penalty responses was endorsed.
Differences among the 5 groups in the perceived harm of each protocol lapse were tested with 2 analyses. Group differences in ratings of whether public reporting and penalties were ever appropriate were tested with logistic regression analyses for each scenario separately, controlling for age, sex, and perceived harm of the protocol lapse. To determine if the 5 groups differed in their tendency to support public reporting or penalties regardless of the type of protocol lapse, we conducted logistic regression analyses across all 3 scenarios, accounting for multiple observations per individual through use of cluster‐correlated robust variance.[14] Differences among groups in the number of transgressions at which public reporting and penalties were supported were examined with log‐rank tests.
RESULTS
A total of 287 individuals were given surveys, and 183 completed them: 22 attending physicians, 33 resident physicians, 61 nurses, 47 medical students, and 20 patients (overall response rate 64%). Response rate for attending and resident physicians was 73%, for nurses 59%, and for medical students 54%. Among patients who were approached and agreed to accept a survey, 87% returned completed surveys (Table 1). The average age of attending physicians was 35.8 years (standard deviation [SD]: 5.3), residents was 28.3 years (SD: 1.7), nurses was 43.6 years (SD: 11.1), medical students was 26.6 years (SD: 2.9), and inpatients was 48.2 years (SD: 15.9). Thirty‐two percent of attending physicians were female, 67% of resident physicians were female, 88% of nurses were female, 66% of medical students were female, and 47% of inpatients were female.
| Attending Physician | Resident Physician | Nurse | Medical Student | Patient | |
|---|---|---|---|---|---|
| |||||
| No. | 22 | 33 | 61 | 47 | 20 |
| Response rate* | 73% | 73% | 59% | 54% | 87% |
| Age, y, meanSD | 365 | 282 | 4411 | 273 | 4816 |
| Sex, female, % (n) | 32% (7) | 67% (22) | 88% (53) | 66% (31) | 47% (9) |
Perceived Harm
Out of the 3 scenarios presented in in the survey, participants believed that not conducting preoperative time‐outs in surgery presented the highest risk to patient safety, with 57% (residents) to 86% (nurses) rating the potential harm as high (Figure 1). Not conducting fall risk assessments was perceived as second most potentially harmful, and not properly practicing hand hygiene was perceived as least potentially harmful to patient safety. There were significant differences among groups in perceptions of potential harm for all 3 scenarios (P<0.001 for all).
Appropriateness of Public Reporting and Penalties
Public reporting was viewed as ever appropriate by 34% of all respondents for hand‐hygiene protocol lapses, 58% for surgical time‐out lapses, and 43% for fall risk assessment lapses. There were no significant differences among groups in endorsement of public reporting for individual scenarios (Figure 2). Penalties were endorsed more frequently than public reporting for all groups and all scenarios. The proportion of attending physicians and patients who rated penalties as ever appropriate were similar for each scenario. Residents, medical students, and nurses were less likely than patients and attending physicians to support penalties (P<0.05 for all differences).
The aggregated analysis revealed that nurses and medical students were significantly less likely than patients to endorse public reporting across scenarios. In terms of endorsement of penalties, we found no significant differences between attending physicians and patients, but residents (odds ratio [OR]: 0.09, 95% confidence interval [CI]: 0.03‐0.32), students (OR: 0.12, 95% CI: 0.04‐0.34), and nurses (OR: 0.17, 95% CI: 0.03‐0.41) had significantly lower odds of favoring penalties than did patients (Table 2).
| Odds Ratio (95% CI) | ||
|---|---|---|
| Public Reporting | Penalty | |
| ||
| Group, across all scenarios | ||
| Patients | Reference | Reference |
| Attending physicians | 0.58 (0.172.01) | 0.88 (0.203.84) |
| Resident physicians | 0.42 (0.121.52) | 0.09 (0.020.32) |
| Nurses | 0.32 (0.120.88) | 0.17 (0.030.41) |
| Medical students | 0.22 (0.060.80) | 0.12 (0.040.34) |
| Scenario, across all groups | ||
| Hand hygiene | Reference | Reference |
| Surgical time‐out | 2.82 (2.033.91) | 4.29 (2.976.20) |
| Fall assessment | 1.47 (1.091.98) | 1.74 (1.272.37) |
Across all surveyed groups, public reporting was more often supported for lapses of surgical timeout (OR: 2.82, 95% CI: 2.03‐3.91) and fall risk assessment protocols (OR: 1.47, 95% CI: 1.09‐1.98) than for the referent, hand‐hygiene lapses. Across all groups, penalties were more likely to be supported for surgical timeout (OR: 4.29, 95% CI: 2.97‐6.20) and fall risk assessment protocol lapses (OR: 1.74, 95% CI: 1.27‐2.37) than for hand‐hygiene lapses.
Thresholds for Public Reporting and Penalties
The log‐rank test showed no significant differences among the surveyed groups in the number of transgressions at which public reporting was deemed appropriate in any of the 3 scenarios (P=0.37, P=0.71, and P=0.32 for hand hygiene, surgical time‐out, and fall risk assessment, respectively) (Figure 3). However, patients endorsed penalties after significantly fewer occurrences than residents, medical students, and nurses for all 3 scenarios (P<0.001 for all differences), and at a significantly lower threshold than attending physicians for surgical timeout and fall risk assessment (P<0.001 and P=0.03, respectively).
DISCUSSION
This survey assessed attitudes of healthcare professionals, trainees, and inpatients toward public reporting and penalties when clinicians do not follow basic safety protocols. Respondents tended to favor more aggressive measures when they deemed the safety risk from protocol violations to be higher. Almost all participants favored providing feedback after safety protocol lapses. Healthcare professionals tended to favor punitive measures, such as fines, suspension, and firing, more than public reporting of transgressions. Patients had a lower threshold than both providers and trainees for public reporting and punitive measures. In aggregate, our study suggests that after a decade of emphasis on a no‐blame response to patient safety hazards, both healthcare providers and patients now believe clinicians should be held accountable for following basic safety protocols, though their thresholds and triggers vary.
A surprising finding was that providers were more likely to favor penalties (such as fines, suspension, or firing) than public reporting of safety transgressions. Multiple studies have suggested that public reporting of hospital quality data has improved adherence to care processes and may improve patient outcomes.[15, 16, 17] Although our data do not tell us why clinicians appear to be more worried about public reporting than penalties, they do help explain why transparency has been a relatively powerful strategy to motivate changes in practice, even when it is unaccompanied by significant shifts in consumer choices.[18] It would be natural to consider public reporting to be a softer strategy than fines, suspension, or firing; however, our results indicate that many clinicians do not see it that way. Alternatively, the results could also suggest that clinicians prefer measures that provide more immediate feedback than public reporting generally provides. These attitudes should be considered when enacting public reporting strategies.
Another interesting finding was that patients and attending physicians tended to track together regarding their attitudes toward penalties for safety lapses. Although patients had a lower threshold for favoring penalties than attendings, similar proportions of patients and attending physicians believed that penalties should be enacted for safety transgressions, and both groups were more penal than physician trainees and nurses. We speculate that attendings and patients may have the most skin in the game, patients as the ones directly harmed by a preventable adverse event, and attending physicians as the most responsible clinicians, at least in the eyes of the malpractice system, licensing boards, and credentials committees.
Even though our study illustrates relatively high levels of endorsement for aggressive measures to deal with clinicians who fail to follow evidence‐based safety practices, a shift in this direction has risks and benefits. The no‐blame paradigm in patient safety grew out of a need to encourage open discussion about medical mistakes.[2] Whereas shifting away from a purely no‐ blame approach may lead to greater adherence with safety practices, and one hopes fewer cases of preventable harm, it also risks stifling the open discussions about medical errors that characterize learning organizations.[13, 19] Because of this, a movement in this direction should be undertaken carefully, starting first with a small number of well‐established safety practices, and ensuring that robust education and system improvements precede and accompany the imposition of penalties for nonadherence.
Our study has limitations. The survey was developed using convenience samples of UCSF faculty and medical students, so broader inclusion of physicians, nurses, trainees, and patients may have yielded a different survey instrument. As a survey, we cannot be certain that any of the groups' responses in real life (eg, in a vote of the medical staff on a given policy) would mirror their survey response. Additionally, the responses to protocol lapses did not include all possible administrative responses, such as mandatory training/remediation or rewards for positive behaviors. The responses could have also been different if participants were presented with different patient safety scenarios. The study population was limited in several ways. Attending and resident physicians were drawn from an academic department of internal medicine; it is possible that other specialties would have different attitudes. Patients were relatively young (likely due to the inclusion criteria), as were attending physicians (due to oversampling of hospitalist physicians). The relatively small number of participants could also limit statistical power to detect differences among groups. Additionally, the study population was limited to patients and healthcare professionals in academic medical centers in San Francisco. It is possible that attitudes would be different in other regions and practice settings.
The no‐blame approach to patient safety has been crucial in refocusing the lens on systems failures and in encouraging the active engagement by clinicians, particularly physicians.[2, 3] On the other hand, there are legitimate concerns that a unidimensional no‐blame approach has permitted, perhaps even promoted, nonadherence to evidence‐based safety practices that could prevent many cases of harm. Although it may not be surprising that patients favor harsher consequences for providers who do not follow basic safety protocols, our study demonstrates relatively widespread support for such consequences even among clinicians and trainees. However, all groups appear to recognize the nuances underlying this set of issues, with varying levels of enthusiasm for punitive responses based on perceived risk and number of transgressions. Future studies are needed to investigate how best to implement public reporting and penalties in ways that can maximize the patient safety benefits.
Acknowledgements
The authors are grateful to the clinicians, trainees, and patients who participated in the survey.
- . Understanding Patient Safety. 2nd ed. New York, NY: McGraw Hill Medical; 2012.
- . Error in medicine. JAMA. 1994;272(23):1851–1857.
- , . Balancing "no blame" with accountability in patient safety. N Engl J Med. 2009;361(14):1401–1406.
- , , , . Accountability measures—using measurement to promote quality improvement. N Engl J Med. 2010;363(7):683–688.
- , . Problem doctors: is there a system‐level solution? Ann Intern Med. 2006;144(2):107–115.
- , , , et al. A surgical safety checklist to reduce morbidity and mortality in a global population. N Engl J Med. 2009;360(5):491–499.
- , , , , . Effectiveness of a comprehensive hand hygiene program for reduction of infection rates in a long‐term care facility. Am J Infect Control. 2013;41(1):39–44.
- , . Impact of a hospital‐wide hand hygiene promotion strategy on healthcare‐associated infections. Antimicrob Resist Infect Control. 2012;1(1):13.
- , , , et al. Determinants of hand hygiene noncompliance in intensive care units. Am J Infect Control. 2013;41(2):131–135.
- , , , , , . Impact of a hospital‐wide hand hygiene initiative on healthcare‐associated infections: results of an interrupted time series. BMJ Qual Saf. 2012;21(12):1019–1026.
- , , , . Effectiveness of multifaceted hand hygiene interventions in long‐term care facilities in Hong Kong: a cluster‐randomized controlled trial. Infect Control Hosp Epidemiol. 2012;33(8):761–767.
- , , , , . Development, implementation, and evaluation of a comprehensive fall risk program. J Spec Pediatr Nurs 2011;16(2):130–139.
- , , , . A systematic review of the effectiveness, compliance, and critical factors for implementation of safety checklists in surgery. Ann Surg. 2012;256(6):925–933.
- . A note on robust variance estimation for cluster‐correlated data. Biometrics. 2000;56(2):645–646.
- , , , et al. Public reporting and pay for performance in hospital quality improvement. N Engl J Med. 2007;356(5):486–496.
- , , , , . Improving the outcomes of coronary artery bypass surgery in New York State. JAMA. 1994;271(10):761–766.
- , , . Declines in hospital mortality associated with a regional initiative to measure hospital performance. Am J Med Qual. 1997;12(2):103–112.
- , , , . The public release of performance data: what do we expect to gain? A review of the evidence. JAMA. 2000;283(14):1866–1874.
- . Continuing education meets the learning organization: the challenge of a systems approach to patient safety. J Contin Educ Health Prof. 2000;20(4):197–207.
© 2013 Society of Hospital Medicine
Can Healthcare Go From Good to Great?
The American healthcare system produces a product whose quality, safety, reliability, and cost would be incompatible with corporate survival, were they created by a business operating in a competitive industry. Care fails to comport with best evidence nearly half of the time.1 Tens of thousands of Americans die yearly from preventable medical mistakes.2 The healthcare inflation rate is nearly twice that of the rest of the economy, rapidly outstripping the ability of employers, tax revenues, and consumers to pay the mounting bills.
Increasingly, the healthcare system is being held accountable for this lack of value. Whether through a more robust accreditation and regulatory environment, public reporting of quality and safety metrics, or pay for performance (or no pay for errors) initiatives, outside stakeholders are creating performance pressures that scarcely existed a decade ago.
Healthcare organizations and providers have begun to take notice and act, often by seeking answers from industries outside healthcare and thoughtfully importing these lessons into medicine. For example, the use of checklists has been adopted by healthcare (from aviation), with impressive results.3, 4 Many quality methods drawn from industry (Lean, Toyota, Six Sigma) have been used to try to improve performance and remove waste from complex processes.5, 6
While these efforts have been helpful, their focus has generally been at the point‐of‐careimproving the care of patients with acute myocardial infarction or decreasing readmissions. However, while the business community has long recognized that poor management and structure can thwart most efforts to improve individual processes, healthcare has paid relatively little attention to issues of organizational structure and leadership. The question arises: Could methods that have been used to learn from top‐performing businesses be helpful to healthcare's efforts to improve its own organizational performance?
In this article, we describe perhaps the best known effort to identify top‐performing corporations, compare them to carefully selected organizations that failed to achieve similar levels of performance, and glean lessons from these analyses. This effort, described in a book entitled Good to Great: Why Some Companies Make the Leapand Others Don't, has sold more than 3 million copies in its 35 languages, and is often cited by business leaders as a seminal work. We ask whether the methods of Good to Great might be applicable to healthcare organizations seeking to produce the kinds of value that patients and purchasers need and deserve.
GOOD TO GREAT METHODOLOGY
In 2001, business consultant Jim Collins published Good to Great. Its methods can be divided into 3 main components: (1) a gold standard metric to identify top organizations; (2) the creation of a control group of organizations that appeared similar to the top performers at the start of the study, but failed to match the successful organizations' performance over time; and (3) a detailed review of the methods, leadership, and structure of both the winning and laggard organizations, drawing lessons from their differences. Before discussing whether these methods could be used to analyze healthcare organizations, it is worth describing Collins' methods in more detail.
The first component of Good to Great's structure was the use of 4 metrics to identify top‐performing companies (Table 1). To select the good to great companies, Collins and his team began with a field of 1435 companies drawn from Fortune magazine's rankings of America's largest public companies. They then used the criteria in Table 1 to narrow the list to their final 11 companies, which formed the experimental group for the analysis.
|
| The company had to show a pattern of good performance punctuated by a transition point when it shifted to great performance. Great performance was defined as a cumulative total stock return of at least 3 times the general stock market for the period from the transition point through 15 years. |
| The transition from good to great had to be company‐specific, not an industry‐wide event. |
| The company had to be an established enterprise, not a startup, in business for at least 10 years prior to its transition. |
| At the time of the selection (in 1996), the company still had to show an upward trend. |
After identifying these 11 top‐performing companies, Collins created a control group, composed of companies with similar attributes that could have made the transition, but failed to do so.7 To create the control group, Collins matched and scored a pool of control group candidates based on the following criteria: similarities of business model, size, age, and cumulative stock returns prior to the good to great transition. When there were several potential controls, Collins chose companies that were larger, more profitable, and had a stronger market position and reputation prior to the transition, in order to increase the probability that the experimental companies' successes were not incidental.8 Table 2 lists the paired experimental and control companies.
| Experimental Company | Control Company |
|---|---|
| |
| Abbott | Upjohn |
| Circuit City | Silo |
| Fannie Mae | Great Western |
| Gillette | Warner‐Lambert |
| Kimberly‐Clark | Scott Paper |
| Kroger | A&P |
| Nucor | Bethlehem Steel |
| Philip Morris | R.J. Reynolds |
| Pitney Bowes | Addressograph |
| Walgreen's | Eckerd |
| Wells Fargo | Bank of America |
Finally, Collins performed a detailed historical analysis on the experimental and control groups, using materials (such as major articles published on the company, books, academic case studies, analyst reports, and financial and annual reports) that assessed the companies in real time. Good to Great relied on evidence from the period of interest (ie, accrued prior to the transition point) to avoid biases that would likely result from relying on retrospective sources of data.9
This analysis identified a series of factors that were generally present in good to great companies and absent in the control organizations. In brief, they were: building a culture of discipline, making change through gradual and consistent improvement, having a leader with a paradoxical blend of personal humility and professional will, and relentlessly focusing on hiring and nurturing the best employees. Over 6000 articles and 5 years of analysis support these conclusions.8
EFFORTS TO DATE TO ANALYZE HEALTHCARE ORGANIZATIONAL CHARACTERISTICS
We reviewed a convenience sample of the literature on organizational change in healthcare, and found only 1 study that utilized a similar methodology to that of Good to Great: an analysis of the academic medical centers that participate in the University HealthSystem Consortium (UHC). Drawing inspiration from Collins' methodologies, the UHC study developed a holistic measure of quality, based on safety, mortality, compliance with evidence‐based practices, and equity of care. Using these criteria, the investigators selected 3 UHC member organizations that were performing extremely well, and 3 others performing toward the middle and bottom of the pack. Experts on health system organization then conducted detailed site visits to these 6 academic medical centers. The researchers were blinded to these rankings at the time of the visits, but were able to perfectly predict which cohort the organizations were in.
The investigators analyzed the factors that seemed to be present in the top‐performing organizations, but were absent in the laggards, and found: hospital leadership emphasizing a patients‐first mission, an alignment of departmental objectives to reduce conflict, a concrete accountability structure for quality, a relentless focus on measurable improvement, and a culture promoting interprofessional collaboration on quality.10
While the UHC study is among the most robust exploration of healthcare organization dynamics in the literature, it has a few limitations. The first is that it studied a small, relatively specialized population: UHC members, which are large, mostly urban, well‐resourced teaching hospitals. While studying segments of populations can limit the generalizability of some of the UHC studies' findings, their approach can be a useful model to apply to studying other types of healthcare institutions. (And, to be fair, Good to Great also studies a specialized populationFortune 500 companiesand thus its lessons need to be extrapolated to other businesses, such as small companies, with a degree of caution.) The study also suffers from the relative paucity of publicly accessible organizational data in healthcare. The fact that the UHC investigators depended on both top‐performing and laggard hospitals, to voluntarily release their organizational data and permit a detailed site visit, potentially introduces a selection bias into the survey population, a bias not present in Good to Great due to Collins' protocol for matching cases and controls.
There have been several other efforts, using different methods, to determine organizational predictors of success in healthcare. The results of several important studies are shown in Table 3. Taken together, they indicate that higher performing organizations make practitioners accountable for performance measurements, and implement systems designed to both reduce errors and facilitate adherence to evidence‐based guidelines. In addition to these studies, several consulting organizations and foundations have performed focused reviews of high‐performing healthcare organizations in an effort to identify key success factors.11 These studies, while elucidating factors that influence organizational performance, suffer from variable quality measures and subjective methods for gathering organizational data, both of which are addressed within a good to great‐style analysis.12
| Study | Key Findings |
|---|---|
| |
| Keroack et al.10 | Superior‐performing organizations were distinguished from average ones by having: hospital leadership emphasizing a patients‐first mission, an alignment of departmental objectives to reduce conflict, concrete accountability structures for quality, a relentless focus on measurable improvement, and a culture promoting interprofessional collaboration toward quality improvement measures. |
| Jha et al.22 | Factors that led to the VA's improved performance included: |
| Implementation of a systematic approach to measurement, management, and accountability for quality. | |
| Initiating routine performance measurements for high‐priority conditions. | |
| Creating performance contracts to hold managers accountable for meeting improvement goals. | |
| Having an independent agency gather and monitor data. | |
| Implementing process improvements, such as an integrated, comprehensive medical‐record system. | |
| Making performance data public and distributing these data widely within the VA and among other key stakeholders (veterans' service organizations, Congress). | |
| Shortell et al.20 | Focusing on reducing the barriers and encouraging the adoption of evidence‐based organizational management is associated with better patient outcomes. Examples of reducing barriers to encourage adoption of evidence‐based guidelines include: |
| Installing an IT system to improve chronic care management. | |
| Creating a culture where practitioners can help each other learn from their mistakes. | |
| Knaus et al.21 | The interaction and coordination of each hospital's ICU staff had a greater correlation with reduced mortality rates than did the unit's administrative structure, amount of specialized treatment used, or the hospital's teaching status. |
| Pronovost et al.3 | Introducing a checklist of 5 evidence‐based procedures into a healthcare team's operation can significantly reduce the rate of catheter‐associated infections. |
| Simple process change interventions, such as checklists, must be accompanied by efforts to improve team culture and create leadership accountability and engagement. | |
| Pronovost et al.30 | Implementing evidence‐based therapies by embedding them within a healthcare team's culture is more effective than simply focusing on changing physician behavior. |
| The authors proposed a 4‐step model for implementing evidence‐based therapies: select interventions with the largest benefit and lowest barriers to use, identify local barriers to implementation, measure performance, and ensure all patients receive the interventions. | |
Perhaps the best‐known study on healthcare organizational performance is The Dartmouth Atlas, an analysis that (though based on data accumulated over more than 30 years) has received tremendous public attention, in recent years, in the context of the debate over healthcare reform.13 However, by early 2010, the Dartmouth analysis was stirring controversy, with some observers expressing concerns over its focus on care toward the end of life, its methods for adjusting for case‐mix and sociodemographic predictors of outcomes and costs, and its exclusive use of Medicare data.14, 15 These limitations are also addressed by a good to great‐style analysis.
WOULD A GOOD TO GREAT ANALYSIS BE POSSIBLE IN HEALTHCARE?
While this review of prior research on organizational success factors in healthcare illustrates considerable interest in this area, none of the studies, to date, matches Good to Great in the robustness of the analysis or, obviously, its impact on the profession. Could a good to great analysis be carried out in healthcare? It is worth considering this by assessing each of Collins' 3 key steps: identifying the enterprises that made a good to great leap, selecting appropriate control organizations, and determining the factors that contributed to the successes of the former group.
Good to Great used an impressive elevation in stock price as a summary measure of organizational success. In the for‐profit business world, it is often assumed that Adam Smith's invisible hand makes corporate information available to investors, causing an organization's stock price to capture the overall success of its business strategy, including its product quality and operational efficiency.16 In the healthcare world, mostly populated by non‐profit organizations that are simultaneously working toward a bottom line and carrying out a social mission, there is no obvious equivalent to the stock price for measuring overall organizational performance and value. All of the methods for judging top hospitals, for example, are flaweda recent study found that the widely cited U.S. News & World Report's America's Best Hospitals list is largely driven by hospital reputation,17 while another study found glaring inconsistencies among methods used to calculate risk‐adjusted mortality rates.18 A generally accepted set of metrics defining the value of care produced by a healthcare organization (including quality, safety, access, patient satisfaction, and efficiency) would be needed to mirror the first good to great step: defining top‐performing organizations using a gold standard.19 The summary measure used in the UHC study is the closest we have seen to a good to great‐style summary performance measure in healthcare.10
While it is important to identify a gold‐standard measure of organizational quality, careful selection of a control organization may be the most important step in conducting a good to great analysis. Although Collins' use of stock price as a summary measure of organizational performance is the best measure available in business, it is by no means perfect. Despite this shortcoming, however, Collins believes that the central requirement is not finding a perfect measure of organizational success, but rather determining what correlates with a divergence of performance in stock price (J. Collins, oral communication, July 2010). Similar to clinical trials, meticulous matching of a good to great organization with a control has the advantage of canceling out extraneous environmental factors, thereby enabling the elucidation of organizational factors that contribute to divergent performance. Good to Great's methods depended on substantial historical background to define top performers and controls. Unfortunately, healthcare lacks an analog to the business world's robust historical and publicly accessible record of performance and organizational data. Therefore, even if a certain organization was determined to be a top performer based on a gold‐standard measure, selecting a control organization by matching its organizational and performance data to the top performer's would be unfeasible.
Finally, the lack of a historical record in healthcare also places substantial roadblocks in the way of looking under the organization's hood. Even in pioneering organizational analyses by Shortell et al.,20 Knaus et al.,21 and Jha et al.,22 substantial parts of their analyses relied on retrospective accounts to determine organizational characteristics. To remove the bias that comes from knowing the organization's ultimate performance, Collins was careful to base his analysis of organizational structures and leadership on documents available before the good to great transition. Equivalent data in healthcare are extremely difficult to find.
While it is best to rely on an historical record, it may be possible to carry out a good to great‐type analysis through meticulous structuring of personal interviews. Collins has endorsed a non‐healthcare study that utilized the good to great matching strategy but used personal interviews to make up for lack of access to a substantial historical record.23 To reduce the bias inherent in relying on interviews, the research team ensured that the good to great transition was sustained for many years, and that the practices elicited from the interviews started before the good to great transition. Both of these techniques helped increase the probability that the identified practices contributed to the transition to superior results (in this case, in public education outcomes) and, thus, that the adoption of these practices could result in improvements elsewhere (J. Collins, oral communication, July 2010).
To make such a study possible in healthcare, more organizational data are required. Without prodding by outside stakeholders, most healthcare organizations have been reluctant to publicize performance data for fear of malpractice risk,24 or based on their belief that current data paint an incomplete or inaccurate picture of their quality.25 Trends toward required reporting of quality data (such as via Medicare's Hospital Compare Web site) offer hope that future comparisons could rely on robust organizational quality and safety data. Instituting healthcare analogs to Securities & Exchange Commission (SEC) reporting mandates would further ameliorate this information deficit.26
While we believe that Good to Great offers lessons relevant to healthcare, there are limitations that are worth considering. First, the extraordinary complexity of healthcare organizations makes it likely that a matched‐pair‐type study would need to be accompanied by other types of analyses, including more quantitative analyses of large datasets, to give a full picture of structural and leadership predictors of strong performance. Moreover, before embracing the good to great method, some will undoubtedly point to the demise of Circuit City and Fannie Mae (2 of the Good to Great companies; Table 2) as a cautionary note. Collins addresses this issue with the commonsensical argument that the success of a company needs to be judged in the context of the era. By way of analogy, he points to the value of studying a sports team, such as the John Wooden‐coached UCLA teams of the 1960s and 1970s, notwithstanding the less stellar performance of today's UCLA team. In fact, Collins' recent book mines some of these failures for their important lessons.27
GOOD TO GREAT IN HEALTHCARE
Breaking through healthcare's myopia to explore solutions drawn from other industries, such as checklists, simulation, and industrial approaches to quality improvement, has yielded substantial insights and catalyzed major improvements in care. Similarly, we believe that finding ways to measure the performance of healthcare organizations on both cost and quality, to learn from those organizations achieving superior performance, and to create a policy and educational environment that rewards superior performance and helps poor performers improve, is a defining issue for healthcare. This will be particularly crucial as the policy environment changestransitions to Accountable Care Organizations28 and bundled payments29 are likely to increase the pressure on healthcare organizations to learn the secrets of their better‐performing brethren. These shifts are likely to put an even greater premium on the kinds of leadership, organizational structure, and ability to adapt to a changing environment that Collins highlighted in his analysis. After all, it is under the most challenging conditions that top organizations often prove their mettle.
Although there are considerable challenges in performing a good to great analysis in healthcare (Table 4), the overall point remains: Healthcare is likely to benefit from rigorous, unbiased methods to distinguish successful from less successful organizations, to learn the lessons of both, and to apply these lessons to improvement efforts.
| Issue* | Good to Great* | What Exists in Healthcare | How Healthcare Can Fill in the Gaps |
|---|---|---|---|
| |||
| Gold standard measure of quality | Cumulative total stock return of at least 3 times the general market for the period from the transition point through 15 years. | Risk‐adjusted patient outcomes data (eg, mortality), process data (eg, appropriate medication use), structural data (eg, stroke center). | Create a more robust constellation of quality criteria to measure organizational performance (risk‐adjusted patient outcomes, avoidable deaths, adherence to evidence‐based guidelines, cost effectiveness, patient satisfaction); develop a generally accepted roll‐up measure. Of the studies we reviewed, the UHC study's summary measure was the closest representation to a good to great‐summary performance measure. |
| At the time of the selection, the good to great company still had to show an upward trend. | The study of the VA's transformation and the ongoing UHC study stand out as examples of studying the upward trends of healthcare organizations.22 | Make sure that the high‐performing healthcare organizations are still improvingas indicated by gold standard measures. Once the organizations are identified, study the methods these organizations utilized to improve their performance. | |
| The turnaround had to be company‐specific, not an industry‐wide event. | A few organizations have been lauded for transformations (such as the VA system).22 In most circumstances, organizations praised for high quality (eg, Geisinger, Mayo Clinic, Cleveland Clinic) have long‐established corporate tradition and culture that would be difficult to imitate. The VA operates within a system that is unique and not replicable by most healthcare organizations. | Healthcare needs to identify more examples like the VA turnaround, particularly examples of hospitals or healthcare organizations operating in more typical environmentssuch as a community or rural hospital. | |
| The company had to be an established enterprise, not a startup, in business for at least 10 years prior to its transition. | Most of the healthcare organizations of interest are large organizations with complex corporate cultures, not startups. | Not applicable. | |
| Comparison method | Collins selected a comparison company that was almost exactly the same as the good to great company, except for the transition. The selection criteria were business fit, size fit, age fit, stock chart fit, conservative test, and face validity.* | Healthcare organizational studies are mostly comparisons of organizations that all experience success; few studies compare high‐performing with nonhigh‐performing organizations. (Jha et al. compared Medicare data from non‐VA hospitals and the VA, but did not use similar criteria to select similar organizations22; Keroack and colleagues' comparison of 3 mediocre to 3 superior‐performing hospitals is the closest analog to the Good to Great methodology thus far.10) | Similar to the Good to Great study, a set of factors that can categorize healthcare organizations according to similarities must be devised (eg, outpatient care, inpatient care, academic affiliation, tertiary care center, patient demographics), but finding similar organizations whose performance diverged over time is challenging. |
| Analysis of factors that separated great companies from those that did not make the transition to greatness | Good to Great used annual reports, letters to shareholders, articles written about the company during the period of interest, books about the company, business school case studies, analyst reports written in real time. | Most of the research conducted thus far has been retrospective analyses of why organizations became top performers. | The historical source of data is almost nonexistent in comparison with the business world. A parallel effort would have to capture a mixture of structure and process changes, along with organizational variables. The most effective method would be a prospective organizational assessment of several organizations, following them over time to see which ones markedly improved their performance. |
- ,,, et al.The quality of health care delivered to adults in the United States.N Engl J Med.2003;348(26):2635–2645.
- ,,;for the Institute of Medicine (US), Committee on Quality of Health Care in America.To Err Is Human: Building a Safer Health System.Washington, DC:National Academy Press;1999. Available at: http://www.nap.edu/books/0309068371/html/. Accessed August 22, 2011.
- ,,, et al.An intervention to decrease catheter‐related bloodstream infections in the ICU.N Engl J Med.2006;355(26):2725–2732.
- ,,, et al.A surgical safety checklist to reduce morbidity and mortality in a global population.N Engl J Med.2009;360(5):491–499.
- ,,,,,.Using industrial processes to improve patient care.BMJ.2004;328(7432):162–164.
- ,,,,.Lean six sigma in healthcare.J Healthc Qual.2006;28(2):4–11.
- .Good to great.Fast Company. September 30,2001. Available at: http://www.fastcompany.com/magazine/51/goodtogreat.html. Accessed August 22, 2011.
- .Good to Great: Why Some Companies Make the Leap… and Others Don't.New York, NY:HarperBusiness;2001.
- .It's in the research.Jim Collins. Available at: http://www.jimcollins.com/books/research.html. Accessed May 23,2010.
- ,,,,,.Organizational factors associated with high performance in quality and safety in academic medical centers.Acad Med.2007;82(12):1178–1186.
- ,,,,.Hosptial Quality: Ingredients for Success—a Case Study of Beth Israel Deaconess Medical Center.New York, NY:Commonwealth Fund;2004. Available at: http://www.commonwealthfund.org/Content/Publications/Fund‐Reports/2004/Jul/Hospital‐Quality–Ingredients‐for‐Success‐A‐Case‐Study‐of‐Beth‐Israel‐Deaconess‐Medical‐Center. aspx. Accessed August 22, 2011.
- ,,;for the Commonwealth Fund.Hospital quality improvement strategies and lessons from U.S. hospitals.New York, NY:Commonwealth Fund;2007. Available at: http://www.commonwealthfund.org/usr_doc/Silow‐Carroll_hosp_quality_ improve_strategies_lessons_1009.pdf?section=4039. Accessed August 22, 2011.
- .The cost conundrum: what a Texas town can teach us about healthcare.The New Yorker. June 1,2009.
- .A map to bad policy—hospital efficiency measures in the Dartmouth Atlas.N Engl J Med.2010;362(7):569–574.
- ,.Critics question study cited in health debate.The New York Times. June 2,2010.
- Smith A. Campbell RH, Skinner AS, eds.An Inquiry Into the Nature and Causes of the Wealth of Nations.Oxford, England:Clarendon Press;1976.
- .The role of reputation in U.S. News 152(8):521–525.
- ,,,,.Variability in the measurement of hospital‐wide mortality rates.N Engl J Med.2010;363(26):2530–2539.
- .The elephant of patient safety: what you see depends on how you look.Jt Comm J Qual Patient Saf.2010;36(9):399–401.
- ,,.Improving patient care by linking evidence‐based medicine and evidence‐based management.JAMA.2007;298(6):673–676.
- ,,,.An evaluation of outcome from intensive care in major medical centers.Ann Intern Med.1986;104(3):410–418.
- ,,,.Effect of the transformation of the Veterans Affairs Health Care System on the quality of care.N Engl J Med.2003;348(22):2218–2227.
- ;for the Morrison Institute for Public Policy, Center for the Future of Arizona.Why Some Schools With Latino Children Beat the Odds, and Others Don't.Tempe, AZ:Morrison Institute for Public Policy;2006.
- ,,, et al.Error reporting and disclosure systems: views from hospital leaders.JAMA.2005;293(11):1359–1366.
- .Public release of performance data: a progress report from the front.JAMA.2000;283(14):1884–1886.
- ,,.The GAAP in quality measurement and reporting.JAMA.2007;298(15):1800–1802.
- .How the Mighty Fall: And Why Some Companies Never Give in.New York, NY:Jim Collins [distributed in the US and Canada exclusively by HarperCollins Publishers];2009.
- ,,,.Creating accountable care organizations: the extended hospital medical staff.Health Aff (Millwood).2007;26(1):w44–w57.
- ,,,.Using Medicare payment policy to transform the health system: a framework for improving performance.Health Aff (Millwood).2009;28(2):w238–w250.
- ,,.Translating evidence into practice: a model for large scale knowledge translation.BMJ.2008;337:a1714.
The American healthcare system produces a product whose quality, safety, reliability, and cost would be incompatible with corporate survival, were they created by a business operating in a competitive industry. Care fails to comport with best evidence nearly half of the time.1 Tens of thousands of Americans die yearly from preventable medical mistakes.2 The healthcare inflation rate is nearly twice that of the rest of the economy, rapidly outstripping the ability of employers, tax revenues, and consumers to pay the mounting bills.
Increasingly, the healthcare system is being held accountable for this lack of value. Whether through a more robust accreditation and regulatory environment, public reporting of quality and safety metrics, or pay for performance (or no pay for errors) initiatives, outside stakeholders are creating performance pressures that scarcely existed a decade ago.
Healthcare organizations and providers have begun to take notice and act, often by seeking answers from industries outside healthcare and thoughtfully importing these lessons into medicine. For example, the use of checklists has been adopted by healthcare (from aviation), with impressive results.3, 4 Many quality methods drawn from industry (Lean, Toyota, Six Sigma) have been used to try to improve performance and remove waste from complex processes.5, 6
While these efforts have been helpful, their focus has generally been at the point‐of‐careimproving the care of patients with acute myocardial infarction or decreasing readmissions. However, while the business community has long recognized that poor management and structure can thwart most efforts to improve individual processes, healthcare has paid relatively little attention to issues of organizational structure and leadership. The question arises: Could methods that have been used to learn from top‐performing businesses be helpful to healthcare's efforts to improve its own organizational performance?
In this article, we describe perhaps the best known effort to identify top‐performing corporations, compare them to carefully selected organizations that failed to achieve similar levels of performance, and glean lessons from these analyses. This effort, described in a book entitled Good to Great: Why Some Companies Make the Leapand Others Don't, has sold more than 3 million copies in its 35 languages, and is often cited by business leaders as a seminal work. We ask whether the methods of Good to Great might be applicable to healthcare organizations seeking to produce the kinds of value that patients and purchasers need and deserve.
GOOD TO GREAT METHODOLOGY
In 2001, business consultant Jim Collins published Good to Great. Its methods can be divided into 3 main components: (1) a gold standard metric to identify top organizations; (2) the creation of a control group of organizations that appeared similar to the top performers at the start of the study, but failed to match the successful organizations' performance over time; and (3) a detailed review of the methods, leadership, and structure of both the winning and laggard organizations, drawing lessons from their differences. Before discussing whether these methods could be used to analyze healthcare organizations, it is worth describing Collins' methods in more detail.
The first component of Good to Great's structure was the use of 4 metrics to identify top‐performing companies (Table 1). To select the good to great companies, Collins and his team began with a field of 1435 companies drawn from Fortune magazine's rankings of America's largest public companies. They then used the criteria in Table 1 to narrow the list to their final 11 companies, which formed the experimental group for the analysis.
|
| The company had to show a pattern of good performance punctuated by a transition point when it shifted to great performance. Great performance was defined as a cumulative total stock return of at least 3 times the general stock market for the period from the transition point through 15 years. |
| The transition from good to great had to be company‐specific, not an industry‐wide event. |
| The company had to be an established enterprise, not a startup, in business for at least 10 years prior to its transition. |
| At the time of the selection (in 1996), the company still had to show an upward trend. |
After identifying these 11 top‐performing companies, Collins created a control group, composed of companies with similar attributes that could have made the transition, but failed to do so.7 To create the control group, Collins matched and scored a pool of control group candidates based on the following criteria: similarities of business model, size, age, and cumulative stock returns prior to the good to great transition. When there were several potential controls, Collins chose companies that were larger, more profitable, and had a stronger market position and reputation prior to the transition, in order to increase the probability that the experimental companies' successes were not incidental.8 Table 2 lists the paired experimental and control companies.
| Experimental Company | Control Company |
|---|---|
| |
| Abbott | Upjohn |
| Circuit City | Silo |
| Fannie Mae | Great Western |
| Gillette | Warner‐Lambert |
| Kimberly‐Clark | Scott Paper |
| Kroger | A&P |
| Nucor | Bethlehem Steel |
| Philip Morris | R.J. Reynolds |
| Pitney Bowes | Addressograph |
| Walgreen's | Eckerd |
| Wells Fargo | Bank of America |
Finally, Collins performed a detailed historical analysis on the experimental and control groups, using materials (such as major articles published on the company, books, academic case studies, analyst reports, and financial and annual reports) that assessed the companies in real time. Good to Great relied on evidence from the period of interest (ie, accrued prior to the transition point) to avoid biases that would likely result from relying on retrospective sources of data.9
This analysis identified a series of factors that were generally present in good to great companies and absent in the control organizations. In brief, they were: building a culture of discipline, making change through gradual and consistent improvement, having a leader with a paradoxical blend of personal humility and professional will, and relentlessly focusing on hiring and nurturing the best employees. Over 6000 articles and 5 years of analysis support these conclusions.8
EFFORTS TO DATE TO ANALYZE HEALTHCARE ORGANIZATIONAL CHARACTERISTICS
We reviewed a convenience sample of the literature on organizational change in healthcare, and found only 1 study that utilized a similar methodology to that of Good to Great: an analysis of the academic medical centers that participate in the University HealthSystem Consortium (UHC). Drawing inspiration from Collins' methodologies, the UHC study developed a holistic measure of quality, based on safety, mortality, compliance with evidence‐based practices, and equity of care. Using these criteria, the investigators selected 3 UHC member organizations that were performing extremely well, and 3 others performing toward the middle and bottom of the pack. Experts on health system organization then conducted detailed site visits to these 6 academic medical centers. The researchers were blinded to these rankings at the time of the visits, but were able to perfectly predict which cohort the organizations were in.
The investigators analyzed the factors that seemed to be present in the top‐performing organizations, but were absent in the laggards, and found: hospital leadership emphasizing a patients‐first mission, an alignment of departmental objectives to reduce conflict, a concrete accountability structure for quality, a relentless focus on measurable improvement, and a culture promoting interprofessional collaboration on quality.10
While the UHC study is among the most robust exploration of healthcare organization dynamics in the literature, it has a few limitations. The first is that it studied a small, relatively specialized population: UHC members, which are large, mostly urban, well‐resourced teaching hospitals. While studying segments of populations can limit the generalizability of some of the UHC studies' findings, their approach can be a useful model to apply to studying other types of healthcare institutions. (And, to be fair, Good to Great also studies a specialized populationFortune 500 companiesand thus its lessons need to be extrapolated to other businesses, such as small companies, with a degree of caution.) The study also suffers from the relative paucity of publicly accessible organizational data in healthcare. The fact that the UHC investigators depended on both top‐performing and laggard hospitals, to voluntarily release their organizational data and permit a detailed site visit, potentially introduces a selection bias into the survey population, a bias not present in Good to Great due to Collins' protocol for matching cases and controls.
There have been several other efforts, using different methods, to determine organizational predictors of success in healthcare. The results of several important studies are shown in Table 3. Taken together, they indicate that higher performing organizations make practitioners accountable for performance measurements, and implement systems designed to both reduce errors and facilitate adherence to evidence‐based guidelines. In addition to these studies, several consulting organizations and foundations have performed focused reviews of high‐performing healthcare organizations in an effort to identify key success factors.11 These studies, while elucidating factors that influence organizational performance, suffer from variable quality measures and subjective methods for gathering organizational data, both of which are addressed within a good to great‐style analysis.12
| Study | Key Findings |
|---|---|
| |
| Keroack et al.10 | Superior‐performing organizations were distinguished from average ones by having: hospital leadership emphasizing a patients‐first mission, an alignment of departmental objectives to reduce conflict, concrete accountability structures for quality, a relentless focus on measurable improvement, and a culture promoting interprofessional collaboration toward quality improvement measures. |
| Jha et al.22 | Factors that led to the VA's improved performance included: |
| Implementation of a systematic approach to measurement, management, and accountability for quality. | |
| Initiating routine performance measurements for high‐priority conditions. | |
| Creating performance contracts to hold managers accountable for meeting improvement goals. | |
| Having an independent agency gather and monitor data. | |
| Implementing process improvements, such as an integrated, comprehensive medical‐record system. | |
| Making performance data public and distributing these data widely within the VA and among other key stakeholders (veterans' service organizations, Congress). | |
| Shortell et al.20 | Focusing on reducing the barriers and encouraging the adoption of evidence‐based organizational management is associated with better patient outcomes. Examples of reducing barriers to encourage adoption of evidence‐based guidelines include: |
| Installing an IT system to improve chronic care management. | |
| Creating a culture where practitioners can help each other learn from their mistakes. | |
| Knaus et al.21 | The interaction and coordination of each hospital's ICU staff had a greater correlation with reduced mortality rates than did the unit's administrative structure, amount of specialized treatment used, or the hospital's teaching status. |
| Pronovost et al.3 | Introducing a checklist of 5 evidence‐based procedures into a healthcare team's operation can significantly reduce the rate of catheter‐associated infections. |
| Simple process change interventions, such as checklists, must be accompanied by efforts to improve team culture and create leadership accountability and engagement. | |
| Pronovost et al.30 | Implementing evidence‐based therapies by embedding them within a healthcare team's culture is more effective than simply focusing on changing physician behavior. |
| The authors proposed a 4‐step model for implementing evidence‐based therapies: select interventions with the largest benefit and lowest barriers to use, identify local barriers to implementation, measure performance, and ensure all patients receive the interventions. | |
Perhaps the best‐known study on healthcare organizational performance is The Dartmouth Atlas, an analysis that (though based on data accumulated over more than 30 years) has received tremendous public attention, in recent years, in the context of the debate over healthcare reform.13 However, by early 2010, the Dartmouth analysis was stirring controversy, with some observers expressing concerns over its focus on care toward the end of life, its methods for adjusting for case‐mix and sociodemographic predictors of outcomes and costs, and its exclusive use of Medicare data.14, 15 These limitations are also addressed by a good to great‐style analysis.
WOULD A GOOD TO GREAT ANALYSIS BE POSSIBLE IN HEALTHCARE?
While this review of prior research on organizational success factors in healthcare illustrates considerable interest in this area, none of the studies, to date, matches Good to Great in the robustness of the analysis or, obviously, its impact on the profession. Could a good to great analysis be carried out in healthcare? It is worth considering this by assessing each of Collins' 3 key steps: identifying the enterprises that made a good to great leap, selecting appropriate control organizations, and determining the factors that contributed to the successes of the former group.
Good to Great used an impressive elevation in stock price as a summary measure of organizational success. In the for‐profit business world, it is often assumed that Adam Smith's invisible hand makes corporate information available to investors, causing an organization's stock price to capture the overall success of its business strategy, including its product quality and operational efficiency.16 In the healthcare world, mostly populated by non‐profit organizations that are simultaneously working toward a bottom line and carrying out a social mission, there is no obvious equivalent to the stock price for measuring overall organizational performance and value. All of the methods for judging top hospitals, for example, are flaweda recent study found that the widely cited U.S. News & World Report's America's Best Hospitals list is largely driven by hospital reputation,17 while another study found glaring inconsistencies among methods used to calculate risk‐adjusted mortality rates.18 A generally accepted set of metrics defining the value of care produced by a healthcare organization (including quality, safety, access, patient satisfaction, and efficiency) would be needed to mirror the first good to great step: defining top‐performing organizations using a gold standard.19 The summary measure used in the UHC study is the closest we have seen to a good to great‐style summary performance measure in healthcare.10
While it is important to identify a gold‐standard measure of organizational quality, careful selection of a control organization may be the most important step in conducting a good to great analysis. Although Collins' use of stock price as a summary measure of organizational performance is the best measure available in business, it is by no means perfect. Despite this shortcoming, however, Collins believes that the central requirement is not finding a perfect measure of organizational success, but rather determining what correlates with a divergence of performance in stock price (J. Collins, oral communication, July 2010). Similar to clinical trials, meticulous matching of a good to great organization with a control has the advantage of canceling out extraneous environmental factors, thereby enabling the elucidation of organizational factors that contribute to divergent performance. Good to Great's methods depended on substantial historical background to define top performers and controls. Unfortunately, healthcare lacks an analog to the business world's robust historical and publicly accessible record of performance and organizational data. Therefore, even if a certain organization was determined to be a top performer based on a gold‐standard measure, selecting a control organization by matching its organizational and performance data to the top performer's would be unfeasible.
Finally, the lack of a historical record in healthcare also places substantial roadblocks in the way of looking under the organization's hood. Even in pioneering organizational analyses by Shortell et al.,20 Knaus et al.,21 and Jha et al.,22 substantial parts of their analyses relied on retrospective accounts to determine organizational characteristics. To remove the bias that comes from knowing the organization's ultimate performance, Collins was careful to base his analysis of organizational structures and leadership on documents available before the good to great transition. Equivalent data in healthcare are extremely difficult to find.
While it is best to rely on an historical record, it may be possible to carry out a good to great‐type analysis through meticulous structuring of personal interviews. Collins has endorsed a non‐healthcare study that utilized the good to great matching strategy but used personal interviews to make up for lack of access to a substantial historical record.23 To reduce the bias inherent in relying on interviews, the research team ensured that the good to great transition was sustained for many years, and that the practices elicited from the interviews started before the good to great transition. Both of these techniques helped increase the probability that the identified practices contributed to the transition to superior results (in this case, in public education outcomes) and, thus, that the adoption of these practices could result in improvements elsewhere (J. Collins, oral communication, July 2010).
To make such a study possible in healthcare, more organizational data are required. Without prodding by outside stakeholders, most healthcare organizations have been reluctant to publicize performance data for fear of malpractice risk,24 or based on their belief that current data paint an incomplete or inaccurate picture of their quality.25 Trends toward required reporting of quality data (such as via Medicare's Hospital Compare Web site) offer hope that future comparisons could rely on robust organizational quality and safety data. Instituting healthcare analogs to Securities & Exchange Commission (SEC) reporting mandates would further ameliorate this information deficit.26
While we believe that Good to Great offers lessons relevant to healthcare, there are limitations that are worth considering. First, the extraordinary complexity of healthcare organizations makes it likely that a matched‐pair‐type study would need to be accompanied by other types of analyses, including more quantitative analyses of large datasets, to give a full picture of structural and leadership predictors of strong performance. Moreover, before embracing the good to great method, some will undoubtedly point to the demise of Circuit City and Fannie Mae (2 of the Good to Great companies; Table 2) as a cautionary note. Collins addresses this issue with the commonsensical argument that the success of a company needs to be judged in the context of the era. By way of analogy, he points to the value of studying a sports team, such as the John Wooden‐coached UCLA teams of the 1960s and 1970s, notwithstanding the less stellar performance of today's UCLA team. In fact, Collins' recent book mines some of these failures for their important lessons.27
GOOD TO GREAT IN HEALTHCARE
Breaking through healthcare's myopia to explore solutions drawn from other industries, such as checklists, simulation, and industrial approaches to quality improvement, has yielded substantial insights and catalyzed major improvements in care. Similarly, we believe that finding ways to measure the performance of healthcare organizations on both cost and quality, to learn from those organizations achieving superior performance, and to create a policy and educational environment that rewards superior performance and helps poor performers improve, is a defining issue for healthcare. This will be particularly crucial as the policy environment changestransitions to Accountable Care Organizations28 and bundled payments29 are likely to increase the pressure on healthcare organizations to learn the secrets of their better‐performing brethren. These shifts are likely to put an even greater premium on the kinds of leadership, organizational structure, and ability to adapt to a changing environment that Collins highlighted in his analysis. After all, it is under the most challenging conditions that top organizations often prove their mettle.
Although there are considerable challenges in performing a good to great analysis in healthcare (Table 4), the overall point remains: Healthcare is likely to benefit from rigorous, unbiased methods to distinguish successful from less successful organizations, to learn the lessons of both, and to apply these lessons to improvement efforts.
| Issue* | Good to Great* | What Exists in Healthcare | How Healthcare Can Fill in the Gaps |
|---|---|---|---|
| |||
| Gold standard measure of quality | Cumulative total stock return of at least 3 times the general market for the period from the transition point through 15 years. | Risk‐adjusted patient outcomes data (eg, mortality), process data (eg, appropriate medication use), structural data (eg, stroke center). | Create a more robust constellation of quality criteria to measure organizational performance (risk‐adjusted patient outcomes, avoidable deaths, adherence to evidence‐based guidelines, cost effectiveness, patient satisfaction); develop a generally accepted roll‐up measure. Of the studies we reviewed, the UHC study's summary measure was the closest representation to a good to great‐summary performance measure. |
| At the time of the selection, the good to great company still had to show an upward trend. | The study of the VA's transformation and the ongoing UHC study stand out as examples of studying the upward trends of healthcare organizations.22 | Make sure that the high‐performing healthcare organizations are still improvingas indicated by gold standard measures. Once the organizations are identified, study the methods these organizations utilized to improve their performance. | |
| The turnaround had to be company‐specific, not an industry‐wide event. | A few organizations have been lauded for transformations (such as the VA system).22 In most circumstances, organizations praised for high quality (eg, Geisinger, Mayo Clinic, Cleveland Clinic) have long‐established corporate tradition and culture that would be difficult to imitate. The VA operates within a system that is unique and not replicable by most healthcare organizations. | Healthcare needs to identify more examples like the VA turnaround, particularly examples of hospitals or healthcare organizations operating in more typical environmentssuch as a community or rural hospital. | |
| The company had to be an established enterprise, not a startup, in business for at least 10 years prior to its transition. | Most of the healthcare organizations of interest are large organizations with complex corporate cultures, not startups. | Not applicable. | |
| Comparison method | Collins selected a comparison company that was almost exactly the same as the good to great company, except for the transition. The selection criteria were business fit, size fit, age fit, stock chart fit, conservative test, and face validity.* | Healthcare organizational studies are mostly comparisons of organizations that all experience success; few studies compare high‐performing with nonhigh‐performing organizations. (Jha et al. compared Medicare data from non‐VA hospitals and the VA, but did not use similar criteria to select similar organizations22; Keroack and colleagues' comparison of 3 mediocre to 3 superior‐performing hospitals is the closest analog to the Good to Great methodology thus far.10) | Similar to the Good to Great study, a set of factors that can categorize healthcare organizations according to similarities must be devised (eg, outpatient care, inpatient care, academic affiliation, tertiary care center, patient demographics), but finding similar organizations whose performance diverged over time is challenging. |
| Analysis of factors that separated great companies from those that did not make the transition to greatness | Good to Great used annual reports, letters to shareholders, articles written about the company during the period of interest, books about the company, business school case studies, analyst reports written in real time. | Most of the research conducted thus far has been retrospective analyses of why organizations became top performers. | The historical source of data is almost nonexistent in comparison with the business world. A parallel effort would have to capture a mixture of structure and process changes, along with organizational variables. The most effective method would be a prospective organizational assessment of several organizations, following them over time to see which ones markedly improved their performance. |
- ,,, et al.The quality of health care delivered to adults in the United States.N Engl J Med.2003;348(26):2635–2645.
- ,,;for the Institute of Medicine (US), Committee on Quality of Health Care in America.To Err Is Human: Building a Safer Health System.Washington, DC:National Academy Press;1999. Available at: http://www.nap.edu/books/0309068371/html/. Accessed August 22, 2011.
- ,,, et al.An intervention to decrease catheter‐related bloodstream infections in the ICU.N Engl J Med.2006;355(26):2725–2732.
- ,,, et al.A surgical safety checklist to reduce morbidity and mortality in a global population.N Engl J Med.2009;360(5):491–499.
- ,,,,,.Using industrial processes to improve patient care.BMJ.2004;328(7432):162–164.
- ,,,,.Lean six sigma in healthcare.J Healthc Qual.2006;28(2):4–11.
- .Good to great.Fast Company. September 30,2001. Available at: http://www.fastcompany.com/magazine/51/goodtogreat.html. Accessed August 22, 2011.
- .Good to Great: Why Some Companies Make the Leap… and Others Don't.New York, NY:HarperBusiness;2001.
- .It's in the research.Jim Collins. Available at: http://www.jimcollins.com/books/research.html. Accessed May 23,2010.
- ,,,,,.Organizational factors associated with high performance in quality and safety in academic medical centers.Acad Med.2007;82(12):1178–1186.
- ,,,,.Hosptial Quality: Ingredients for Success—a Case Study of Beth Israel Deaconess Medical Center.New York, NY:Commonwealth Fund;2004. Available at: http://www.commonwealthfund.org/Content/Publications/Fund‐Reports/2004/Jul/Hospital‐Quality–Ingredients‐for‐Success‐A‐Case‐Study‐of‐Beth‐Israel‐Deaconess‐Medical‐Center. aspx. Accessed August 22, 2011.
- ,,;for the Commonwealth Fund.Hospital quality improvement strategies and lessons from U.S. hospitals.New York, NY:Commonwealth Fund;2007. Available at: http://www.commonwealthfund.org/usr_doc/Silow‐Carroll_hosp_quality_ improve_strategies_lessons_1009.pdf?section=4039. Accessed August 22, 2011.
- .The cost conundrum: what a Texas town can teach us about healthcare.The New Yorker. June 1,2009.
- .A map to bad policy—hospital efficiency measures in the Dartmouth Atlas.N Engl J Med.2010;362(7):569–574.
- ,.Critics question study cited in health debate.The New York Times. June 2,2010.
- Smith A. Campbell RH, Skinner AS, eds.An Inquiry Into the Nature and Causes of the Wealth of Nations.Oxford, England:Clarendon Press;1976.
- .The role of reputation in U.S. News 152(8):521–525.
- ,,,,.Variability in the measurement of hospital‐wide mortality rates.N Engl J Med.2010;363(26):2530–2539.
- .The elephant of patient safety: what you see depends on how you look.Jt Comm J Qual Patient Saf.2010;36(9):399–401.
- ,,.Improving patient care by linking evidence‐based medicine and evidence‐based management.JAMA.2007;298(6):673–676.
- ,,,.An evaluation of outcome from intensive care in major medical centers.Ann Intern Med.1986;104(3):410–418.
- ,,,.Effect of the transformation of the Veterans Affairs Health Care System on the quality of care.N Engl J Med.2003;348(22):2218–2227.
- ;for the Morrison Institute for Public Policy, Center for the Future of Arizona.Why Some Schools With Latino Children Beat the Odds, and Others Don't.Tempe, AZ:Morrison Institute for Public Policy;2006.
- ,,, et al.Error reporting and disclosure systems: views from hospital leaders.JAMA.2005;293(11):1359–1366.
- .Public release of performance data: a progress report from the front.JAMA.2000;283(14):1884–1886.
- ,,.The GAAP in quality measurement and reporting.JAMA.2007;298(15):1800–1802.
- .How the Mighty Fall: And Why Some Companies Never Give in.New York, NY:Jim Collins [distributed in the US and Canada exclusively by HarperCollins Publishers];2009.
- ,,,.Creating accountable care organizations: the extended hospital medical staff.Health Aff (Millwood).2007;26(1):w44–w57.
- ,,,.Using Medicare payment policy to transform the health system: a framework for improving performance.Health Aff (Millwood).2009;28(2):w238–w250.
- ,,.Translating evidence into practice: a model for large scale knowledge translation.BMJ.2008;337:a1714.