User login
Following Patient Safety Practices
Healthcare delivery organizations are under increasing pressure to improve patient safety. The fundamental underpinning of efforts to improve safety has been the establishment of a no‐blame culture, one that focuses less on individual transgressions and more on system improvement.[1, 2] As evidence‐based practices to improve care have emerged, and the pressures to deliver tangible improvements in safety and quality have grown, providers, healthcare system leaders, and policymakers are struggling with how best to balance the need for accountability with this no‐blame paradigm.
In dealing with areas such as hand hygiene, where there is strong evidence for the value of the practice yet relatively poor adherence in many institutions, Wachter and Pronovost have argued that the scales need to tip more in the direction of accountability, including the imposition of penalties for clinicians who habitually fail to follow certain safety practices.[3] Although not obviating the critical importance of systems improvement, they argue that a failure to enforce such measures undermines trust in the system and invites external regulation. Chassin and colleagues made a similar point in arguing for the identification of certain accountability measures that could be used in public reporting and pay‐for‐performance programs.[4]
Few organizations have enacted robust systems to hold providers responsible for adhering to accountability measures.[4] Although many hospitals have policies to suspend clinical privileges for failing to sign discharge summaries or obtain a yearly purified protein derivative test, few have formal programs to identify and deal with clinicians whose behavior is persistently problematic.[3] Furthermore, existing modes of physician accountability, such as state licensing boards, only discipline physicians retroactively (and rarely) when healthcare organizations report poor performance. State boards typically do not consider prevention of injury, such as adherence to safety practices, to be part of their responsibility.[5] Similarly, credentialing boards (eg, the American Board of Internal Medicine) do not assess adherence to such practices in coming to their decisions.
It is estimated that strict adherence to infection control practices, such as hand hygiene, could prevent over 100,000 hospital deaths every year; adherence to other evidence‐based safety practices such as the use of a preoperative time‐out would likely prevent many more deaths and cases of medical injury.[3, 6] Although there are practical issues, such as how to audit individual clinician adherence in ways that are feasible and fair, that make enforcing individual provider accountability challenging, there seems little doubt that attitudes regarding the appropriateness of enacting penalties for safety transgressions will be key determinants of whether such measures are considered. Yet no study to date has assessed the opinions of different stakeholders (physicians, nurses, trainees, patients) regarding various strategies, including public reporting and penalties, to improve adherence to safety practices. We aimed to assess these attitudes across a variety of such stakeholders.
METHODS
Survey Development and Characteristics
To understand the perceptions of measures designed to improve patient safety, we designed a survey of patients, nurses, medical students, resident physicians, and attending physicians to be administered at hospitals associated with the University of California, San Francisco (UCSF). Institutional review board approval was obtained from the UCSF Committee on Human Research, and all respondents provided informed consent.
The survey was developed by the authors and pilot tested with 2 populations. First, the survey was administered to a group of 12 UCSF Division of Hospital Medicine research faculty; their feedback was used to revise the survey. Second, the survey was administered to a convenience sample of 2 UCSF medical students, and their feedback was used to further refine the survey.
The questionnaire presented 3 scenarios in which a healthcare provider committed a patient‐safety protocol lapse; participants were asked their opinions about the appropriate responses to each of the violations. The 3 scenarios were: (1) a healthcare provider not properly conducting hand hygiene before a patient encounter, (2) a healthcare provider not properly conducting a fall risk assessment on a hospitalized patient, and (3) a healthcare provider not properly conducting a preoperative timeout prior to surgery. For each scenario, a series of questions was asked about a variety of institutional responses toward a provider who did not adhere to each safety protocol. Potential responses included feedback (email feedback, verbal feedback, meeting with a supervisor, a quarterly performance review meeting, and a quarterly report card seen only by the provider), public reporting (posting the provider's infractions on a public website), and penalties (fines, suspension without pay, and firing).
We chose the 3 practices because they are backed by strong evidence, are relatively easy to perform, are inexpensive, are linked to important and common harms, and are generally supported within the patient‐safety community. Improved adherence to hand hygiene significantly reduces infection transmission in healthcare settings.[7, 8, 9, 10, 11] Performing fall risk assessments has been shown to reduce falls in hospitalized patients,[12] and using preoperative checklists, including a surgical time‐out, can reduce mortality and complication risks by approximately 40%.[13]
Respondents were asked how many cases of documented nonadherence would be necessary for the penalties to be appropriate (1 time, 25 times, 610 times, 1115 times, 16+ times, or would never be appropriate). Finally, respondents were asked to rate the potential harm to patients of each protocol lapse (nonelow, medium, or high).
Demographic information collected from the healthcare providers and medical students included age, gender, position, department, and years' experience in their current position. Demographic information collected from the patients included age, gender, insurance status, race, education level, household income level, and relationship status.
Survey Administration
Surveys were administered to convenience samples of 5 groups of individuals: attending physicians in the UCSF Department of Internal Medicine based at UCSF Medical Center and the San Francisco Veterans Affairs Medical Center, nurses at UCSF Medical Center, residents in the UCSF internal medicine residency program, medical students at UCSF, and inpatients in the internal medicine service at UCSF Medical Center's Moffitt‐Long Hospital. Attending physicians and nurses were surveyed at their respective departmental meetings. For resident physicians and medical students, surveys were distributed at the beginning of lectures and collected at the end.
Patients were eligible to participate if they spoke English and were noted to be alert and oriented to person, time, and place. A survey administrator located eligible patients in the internal medicine service via the electronic medical record system, determined if they were alert and oriented, and approached each patient in his or her room. If the patients verbally consented to consider participation, the surveys were given to them and retrieved after approximately 30 minutes.
Healthcare professionals were offered the opportunity to enter their e‐mail addresses at the end of the survey to become eligible for a drawing for a $100 gift card, but were informed that their e‐mail addresses would not be included in the analytic dataset. Inpatients were not offered any incentives to participate. All surveys were administered by a survey monitor in paper form between May 2011 and July 2012.
Data Analysis
Data analysis was conducted using the Statistical Analysis Software (SAS) package (SAS Institute Inc., Cary, NC) and Stata (StataCorp, College Station, TX). Descriptive analysis and frequency distributions were tallied for all responses. Responses to protocol lapses were grouped into 3 categories: feedback, public reporting, and penalty as described above. As all surveyed groups endorsed feedback as an appropriate response to all of the scenarios, we did not examine feedback, concentrating our analysis instead on public reporting and penalties.
Appropriateness ratings for each response to each protocol lapse were aggregated in 2 ways: ever appropriate (ie, the response would be appropriate after some number of documented lapses) versus never appropriate, and the threshold for the response. Whereas public reporting was only asked about as a single option, 3 separate responses were collapsed into the single response, penalties: fine, suspension, or firing. Individuals were classified as endorsing a penalty if they rated any 1 of these responses as ever appropriate. The threshold for penalty was the smallest number of occurrences at which 1 of the penalty responses was endorsed.
Differences among the 5 groups in the perceived harm of each protocol lapse were tested with 2 analyses. Group differences in ratings of whether public reporting and penalties were ever appropriate were tested with logistic regression analyses for each scenario separately, controlling for age, sex, and perceived harm of the protocol lapse. To determine if the 5 groups differed in their tendency to support public reporting or penalties regardless of the type of protocol lapse, we conducted logistic regression analyses across all 3 scenarios, accounting for multiple observations per individual through use of cluster‐correlated robust variance.[14] Differences among groups in the number of transgressions at which public reporting and penalties were supported were examined with log‐rank tests.
RESULTS
A total of 287 individuals were given surveys, and 183 completed them: 22 attending physicians, 33 resident physicians, 61 nurses, 47 medical students, and 20 patients (overall response rate 64%). Response rate for attending and resident physicians was 73%, for nurses 59%, and for medical students 54%. Among patients who were approached and agreed to accept a survey, 87% returned completed surveys (Table 1). The average age of attending physicians was 35.8 years (standard deviation [SD]: 5.3), residents was 28.3 years (SD: 1.7), nurses was 43.6 years (SD: 11.1), medical students was 26.6 years (SD: 2.9), and inpatients was 48.2 years (SD: 15.9). Thirty‐two percent of attending physicians were female, 67% of resident physicians were female, 88% of nurses were female, 66% of medical students were female, and 47% of inpatients were female.
| Attending Physician | Resident Physician | Nurse | Medical Student | Patient | |
|---|---|---|---|---|---|
| |||||
| No. | 22 | 33 | 61 | 47 | 20 |
| Response rate* | 73% | 73% | 59% | 54% | 87% |
| Age, y, meanSD | 365 | 282 | 4411 | 273 | 4816 |
| Sex, female, % (n) | 32% (7) | 67% (22) | 88% (53) | 66% (31) | 47% (9) |
Perceived Harm
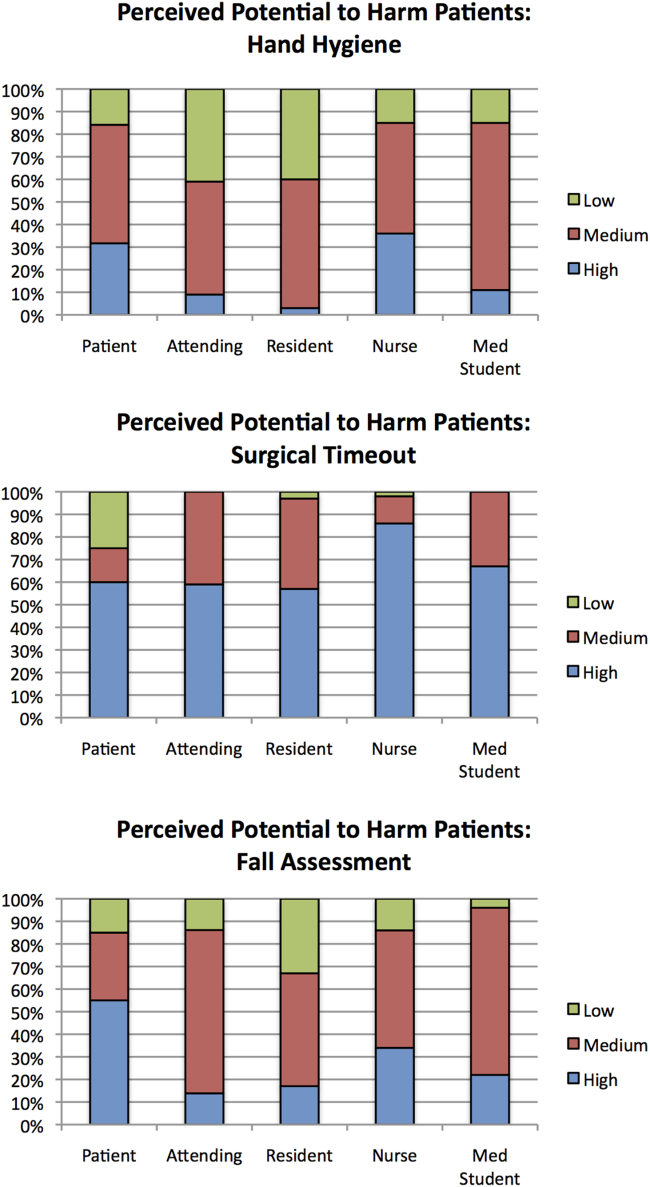
Out of the 3 scenarios presented in in the survey, participants believed that not conducting preoperative time‐outs in surgery presented the highest risk to patient safety, with 57% (residents) to 86% (nurses) rating the potential harm as high (Figure 1). Not conducting fall risk assessments was perceived as second most potentially harmful, and not properly practicing hand hygiene was perceived as least potentially harmful to patient safety. There were significant differences among groups in perceptions of potential harm for all 3 scenarios (P<0.001 for all).

Appropriateness of Public Reporting and Penalties
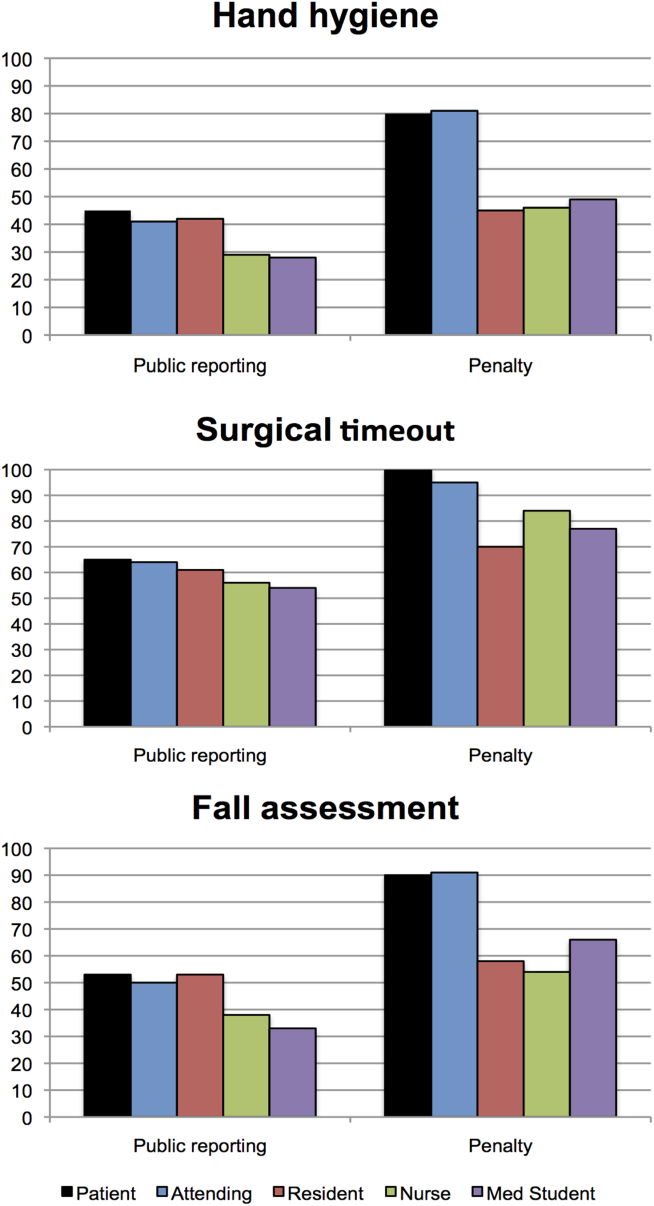
Public reporting was viewed as ever appropriate by 34% of all respondents for hand‐hygiene protocol lapses, 58% for surgical time‐out lapses, and 43% for fall risk assessment lapses. There were no significant differences among groups in endorsement of public reporting for individual scenarios (Figure 2). Penalties were endorsed more frequently than public reporting for all groups and all scenarios. The proportion of attending physicians and patients who rated penalties as ever appropriate were similar for each scenario. Residents, medical students, and nurses were less likely than patients and attending physicians to support penalties (P<0.05 for all differences).
The aggregated analysis revealed that nurses and medical students were significantly less likely than patients to endorse public reporting across scenarios. In terms of endorsement of penalties, we found no significant differences between attending physicians and patients, but residents (odds ratio [OR]: 0.09, 95% confidence interval [CI]: 0.03‐0.32), students (OR: 0.12, 95% CI: 0.04‐0.34), and nurses (OR: 0.17, 95% CI: 0.03‐0.41) had significantly lower odds of favoring penalties than did patients (Table 2).
| Odds Ratio (95% CI) | ||
|---|---|---|
| Public Reporting | Penalty | |
| ||
| Group, across all scenarios | ||
| Patients | Reference | Reference |
| Attending physicians | 0.58 (0.172.01) | 0.88 (0.203.84) |
| Resident physicians | 0.42 (0.121.52) | 0.09 (0.020.32) |
| Nurses | 0.32 (0.120.88) | 0.17 (0.030.41) |
| Medical students | 0.22 (0.060.80) | 0.12 (0.040.34) |
| Scenario, across all groups | ||
| Hand hygiene | Reference | Reference |
| Surgical time‐out | 2.82 (2.033.91) | 4.29 (2.976.20) |
| Fall assessment | 1.47 (1.091.98) | 1.74 (1.272.37) |
Across all surveyed groups, public reporting was more often supported for lapses of surgical timeout (OR: 2.82, 95% CI: 2.03‐3.91) and fall risk assessment protocols (OR: 1.47, 95% CI: 1.09‐1.98) than for the referent, hand‐hygiene lapses. Across all groups, penalties were more likely to be supported for surgical timeout (OR: 4.29, 95% CI: 2.97‐6.20) and fall risk assessment protocol lapses (OR: 1.74, 95% CI: 1.27‐2.37) than for hand‐hygiene lapses.
Thresholds for Public Reporting and Penalties
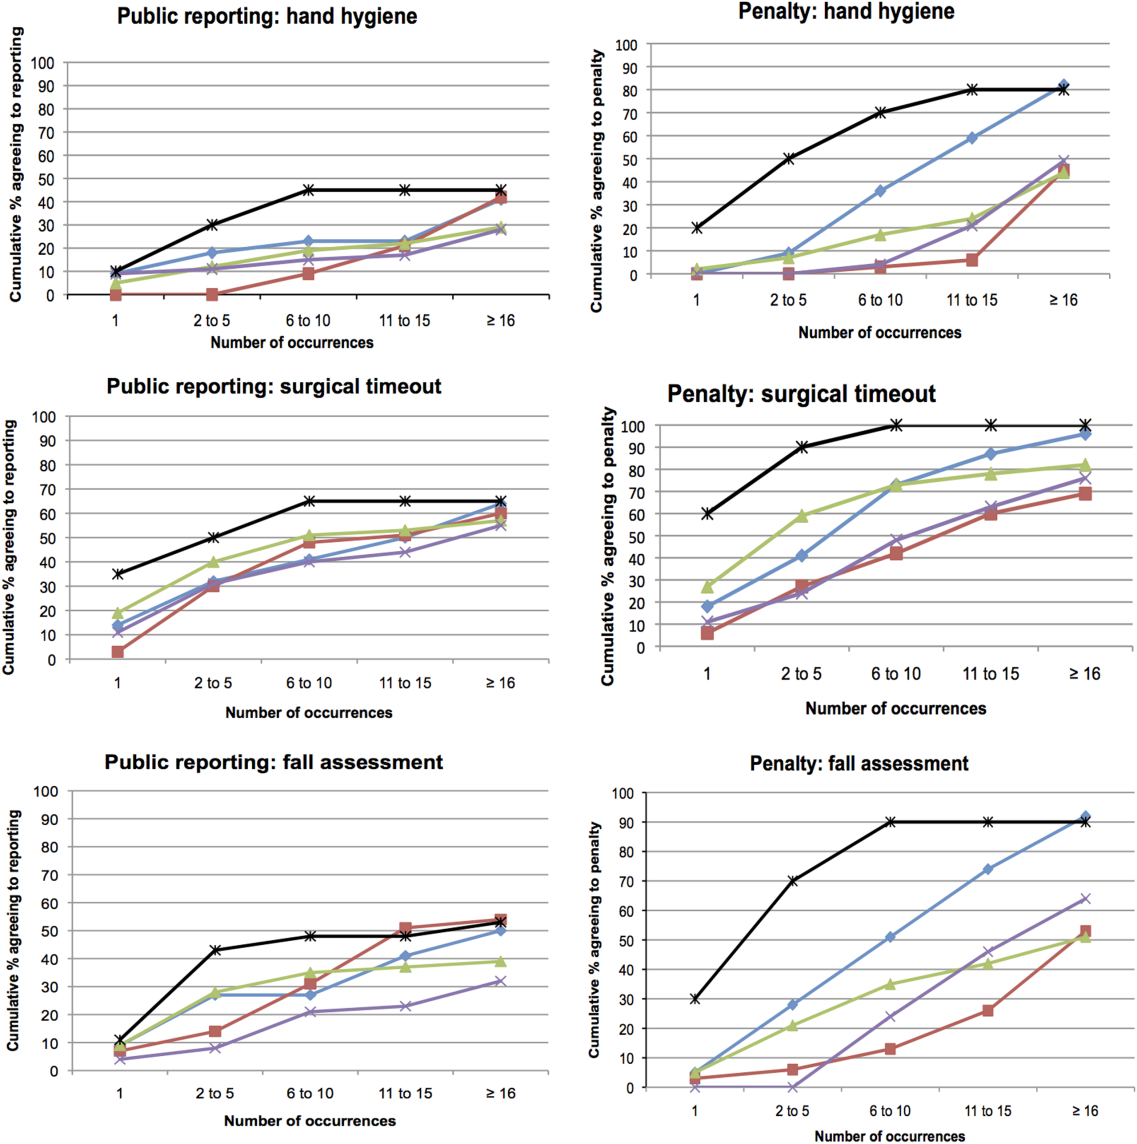
The log‐rank test showed no significant differences among the surveyed groups in the number of transgressions at which public reporting was deemed appropriate in any of the 3 scenarios (P=0.37, P=0.71, and P=0.32 for hand hygiene, surgical time‐out, and fall risk assessment, respectively) (Figure 3). However, patients endorsed penalties after significantly fewer occurrences than residents, medical students, and nurses for all 3 scenarios (P<0.001 for all differences), and at a significantly lower threshold than attending physicians for surgical timeout and fall risk assessment (P<0.001 and P=0.03, respectively).
DISCUSSION
This survey assessed attitudes of healthcare professionals, trainees, and inpatients toward public reporting and penalties when clinicians do not follow basic safety protocols. Respondents tended to favor more aggressive measures when they deemed the safety risk from protocol violations to be higher. Almost all participants favored providing feedback after safety protocol lapses. Healthcare professionals tended to favor punitive measures, such as fines, suspension, and firing, more than public reporting of transgressions. Patients had a lower threshold than both providers and trainees for public reporting and punitive measures. In aggregate, our study suggests that after a decade of emphasis on a no‐blame response to patient safety hazards, both healthcare providers and patients now believe clinicians should be held accountable for following basic safety protocols, though their thresholds and triggers vary.
A surprising finding was that providers were more likely to favor penalties (such as fines, suspension, or firing) than public reporting of safety transgressions. Multiple studies have suggested that public reporting of hospital quality data has improved adherence to care processes and may improve patient outcomes.[15, 16, 17] Although our data do not tell us why clinicians appear to be more worried about public reporting than penalties, they do help explain why transparency has been a relatively powerful strategy to motivate changes in practice, even when it is unaccompanied by significant shifts in consumer choices.[18] It would be natural to consider public reporting to be a softer strategy than fines, suspension, or firing; however, our results indicate that many clinicians do not see it that way. Alternatively, the results could also suggest that clinicians prefer measures that provide more immediate feedback than public reporting generally provides. These attitudes should be considered when enacting public reporting strategies.
Another interesting finding was that patients and attending physicians tended to track together regarding their attitudes toward penalties for safety lapses. Although patients had a lower threshold for favoring penalties than attendings, similar proportions of patients and attending physicians believed that penalties should be enacted for safety transgressions, and both groups were more penal than physician trainees and nurses. We speculate that attendings and patients may have the most skin in the game, patients as the ones directly harmed by a preventable adverse event, and attending physicians as the most responsible clinicians, at least in the eyes of the malpractice system, licensing boards, and credentials committees.
Even though our study illustrates relatively high levels of endorsement for aggressive measures to deal with clinicians who fail to follow evidence‐based safety practices, a shift in this direction has risks and benefits. The no‐blame paradigm in patient safety grew out of a need to encourage open discussion about medical mistakes.[2] Whereas shifting away from a purely no‐ blame approach may lead to greater adherence with safety practices, and one hopes fewer cases of preventable harm, it also risks stifling the open discussions about medical errors that characterize learning organizations.[13, 19] Because of this, a movement in this direction should be undertaken carefully, starting first with a small number of well‐established safety practices, and ensuring that robust education and system improvements precede and accompany the imposition of penalties for nonadherence.
Our study has limitations. The survey was developed using convenience samples of UCSF faculty and medical students, so broader inclusion of physicians, nurses, trainees, and patients may have yielded a different survey instrument. As a survey, we cannot be certain that any of the groups' responses in real life (eg, in a vote of the medical staff on a given policy) would mirror their survey response. Additionally, the responses to protocol lapses did not include all possible administrative responses, such as mandatory training/remediation or rewards for positive behaviors. The responses could have also been different if participants were presented with different patient safety scenarios. The study population was limited in several ways. Attending and resident physicians were drawn from an academic department of internal medicine; it is possible that other specialties would have different attitudes. Patients were relatively young (likely due to the inclusion criteria), as were attending physicians (due to oversampling of hospitalist physicians). The relatively small number of participants could also limit statistical power to detect differences among groups. Additionally, the study population was limited to patients and healthcare professionals in academic medical centers in San Francisco. It is possible that attitudes would be different in other regions and practice settings.
The no‐blame approach to patient safety has been crucial in refocusing the lens on systems failures and in encouraging the active engagement by clinicians, particularly physicians.[2, 3] On the other hand, there are legitimate concerns that a unidimensional no‐blame approach has permitted, perhaps even promoted, nonadherence to evidence‐based safety practices that could prevent many cases of harm. Although it may not be surprising that patients favor harsher consequences for providers who do not follow basic safety protocols, our study demonstrates relatively widespread support for such consequences even among clinicians and trainees. However, all groups appear to recognize the nuances underlying this set of issues, with varying levels of enthusiasm for punitive responses based on perceived risk and number of transgressions. Future studies are needed to investigate how best to implement public reporting and penalties in ways that can maximize the patient safety benefits.
Acknowledgements
The authors are grateful to the clinicians, trainees, and patients who participated in the survey.
- . Understanding Patient Safety. 2nd ed. New York, NY: McGraw Hill Medical; 2012.
- . Error in medicine. JAMA. 1994;272(23):1851–1857.
- , . Balancing "no blame" with accountability in patient safety. N Engl J Med. 2009;361(14):1401–1406.
- , , , . Accountability measures—using measurement to promote quality improvement. N Engl J Med. 2010;363(7):683–688.
- , . Problem doctors: is there a system‐level solution? Ann Intern Med. 2006;144(2):107–115.
- , , , et al. A surgical safety checklist to reduce morbidity and mortality in a global population. N Engl J Med. 2009;360(5):491–499.
- , , , , . Effectiveness of a comprehensive hand hygiene program for reduction of infection rates in a long‐term care facility. Am J Infect Control. 2013;41(1):39–44.
- , . Impact of a hospital‐wide hand hygiene promotion strategy on healthcare‐associated infections. Antimicrob Resist Infect Control. 2012;1(1):13.
- , , , et al. Determinants of hand hygiene noncompliance in intensive care units. Am J Infect Control. 2013;41(2):131–135.
- , , , , , . Impact of a hospital‐wide hand hygiene initiative on healthcare‐associated infections: results of an interrupted time series. BMJ Qual Saf. 2012;21(12):1019–1026.
- , , , . Effectiveness of multifaceted hand hygiene interventions in long‐term care facilities in Hong Kong: a cluster‐randomized controlled trial. Infect Control Hosp Epidemiol. 2012;33(8):761–767.
- , , , , . Development, implementation, and evaluation of a comprehensive fall risk program. J Spec Pediatr Nurs 2011;16(2):130–139.
- , , , . A systematic review of the effectiveness, compliance, and critical factors for implementation of safety checklists in surgery. Ann Surg. 2012;256(6):925–933.
- . A note on robust variance estimation for cluster‐correlated data. Biometrics. 2000;56(2):645–646.
- , , , et al. Public reporting and pay for performance in hospital quality improvement. N Engl J Med. 2007;356(5):486–496.
- , , , , . Improving the outcomes of coronary artery bypass surgery in New York State. JAMA. 1994;271(10):761–766.
- , , . Declines in hospital mortality associated with a regional initiative to measure hospital performance. Am J Med Qual. 1997;12(2):103–112.
- , , , . The public release of performance data: what do we expect to gain? A review of the evidence. JAMA. 2000;283(14):1866–1874.
- . Continuing education meets the learning organization: the challenge of a systems approach to patient safety. J Contin Educ Health Prof. 2000;20(4):197–207.
Healthcare delivery organizations are under increasing pressure to improve patient safety. The fundamental underpinning of efforts to improve safety has been the establishment of a no‐blame culture, one that focuses less on individual transgressions and more on system improvement.[1, 2] As evidence‐based practices to improve care have emerged, and the pressures to deliver tangible improvements in safety and quality have grown, providers, healthcare system leaders, and policymakers are struggling with how best to balance the need for accountability with this no‐blame paradigm.
In dealing with areas such as hand hygiene, where there is strong evidence for the value of the practice yet relatively poor adherence in many institutions, Wachter and Pronovost have argued that the scales need to tip more in the direction of accountability, including the imposition of penalties for clinicians who habitually fail to follow certain safety practices.[3] Although not obviating the critical importance of systems improvement, they argue that a failure to enforce such measures undermines trust in the system and invites external regulation. Chassin and colleagues made a similar point in arguing for the identification of certain accountability measures that could be used in public reporting and pay‐for‐performance programs.[4]
Few organizations have enacted robust systems to hold providers responsible for adhering to accountability measures.[4] Although many hospitals have policies to suspend clinical privileges for failing to sign discharge summaries or obtain a yearly purified protein derivative test, few have formal programs to identify and deal with clinicians whose behavior is persistently problematic.[3] Furthermore, existing modes of physician accountability, such as state licensing boards, only discipline physicians retroactively (and rarely) when healthcare organizations report poor performance. State boards typically do not consider prevention of injury, such as adherence to safety practices, to be part of their responsibility.[5] Similarly, credentialing boards (eg, the American Board of Internal Medicine) do not assess adherence to such practices in coming to their decisions.
It is estimated that strict adherence to infection control practices, such as hand hygiene, could prevent over 100,000 hospital deaths every year; adherence to other evidence‐based safety practices such as the use of a preoperative time‐out would likely prevent many more deaths and cases of medical injury.[3, 6] Although there are practical issues, such as how to audit individual clinician adherence in ways that are feasible and fair, that make enforcing individual provider accountability challenging, there seems little doubt that attitudes regarding the appropriateness of enacting penalties for safety transgressions will be key determinants of whether such measures are considered. Yet no study to date has assessed the opinions of different stakeholders (physicians, nurses, trainees, patients) regarding various strategies, including public reporting and penalties, to improve adherence to safety practices. We aimed to assess these attitudes across a variety of such stakeholders.
METHODS
Survey Development and Characteristics
To understand the perceptions of measures designed to improve patient safety, we designed a survey of patients, nurses, medical students, resident physicians, and attending physicians to be administered at hospitals associated with the University of California, San Francisco (UCSF). Institutional review board approval was obtained from the UCSF Committee on Human Research, and all respondents provided informed consent.
The survey was developed by the authors and pilot tested with 2 populations. First, the survey was administered to a group of 12 UCSF Division of Hospital Medicine research faculty; their feedback was used to revise the survey. Second, the survey was administered to a convenience sample of 2 UCSF medical students, and their feedback was used to further refine the survey.
The questionnaire presented 3 scenarios in which a healthcare provider committed a patient‐safety protocol lapse; participants were asked their opinions about the appropriate responses to each of the violations. The 3 scenarios were: (1) a healthcare provider not properly conducting hand hygiene before a patient encounter, (2) a healthcare provider not properly conducting a fall risk assessment on a hospitalized patient, and (3) a healthcare provider not properly conducting a preoperative timeout prior to surgery. For each scenario, a series of questions was asked about a variety of institutional responses toward a provider who did not adhere to each safety protocol. Potential responses included feedback (email feedback, verbal feedback, meeting with a supervisor, a quarterly performance review meeting, and a quarterly report card seen only by the provider), public reporting (posting the provider's infractions on a public website), and penalties (fines, suspension without pay, and firing).
We chose the 3 practices because they are backed by strong evidence, are relatively easy to perform, are inexpensive, are linked to important and common harms, and are generally supported within the patient‐safety community. Improved adherence to hand hygiene significantly reduces infection transmission in healthcare settings.[7, 8, 9, 10, 11] Performing fall risk assessments has been shown to reduce falls in hospitalized patients,[12] and using preoperative checklists, including a surgical time‐out, can reduce mortality and complication risks by approximately 40%.[13]
Respondents were asked how many cases of documented nonadherence would be necessary for the penalties to be appropriate (1 time, 25 times, 610 times, 1115 times, 16+ times, or would never be appropriate). Finally, respondents were asked to rate the potential harm to patients of each protocol lapse (nonelow, medium, or high).
Demographic information collected from the healthcare providers and medical students included age, gender, position, department, and years' experience in their current position. Demographic information collected from the patients included age, gender, insurance status, race, education level, household income level, and relationship status.
Survey Administration
Surveys were administered to convenience samples of 5 groups of individuals: attending physicians in the UCSF Department of Internal Medicine based at UCSF Medical Center and the San Francisco Veterans Affairs Medical Center, nurses at UCSF Medical Center, residents in the UCSF internal medicine residency program, medical students at UCSF, and inpatients in the internal medicine service at UCSF Medical Center's Moffitt‐Long Hospital. Attending physicians and nurses were surveyed at their respective departmental meetings. For resident physicians and medical students, surveys were distributed at the beginning of lectures and collected at the end.
Patients were eligible to participate if they spoke English and were noted to be alert and oriented to person, time, and place. A survey administrator located eligible patients in the internal medicine service via the electronic medical record system, determined if they were alert and oriented, and approached each patient in his or her room. If the patients verbally consented to consider participation, the surveys were given to them and retrieved after approximately 30 minutes.
Healthcare professionals were offered the opportunity to enter their e‐mail addresses at the end of the survey to become eligible for a drawing for a $100 gift card, but were informed that their e‐mail addresses would not be included in the analytic dataset. Inpatients were not offered any incentives to participate. All surveys were administered by a survey monitor in paper form between May 2011 and July 2012.
Data Analysis
Data analysis was conducted using the Statistical Analysis Software (SAS) package (SAS Institute Inc., Cary, NC) and Stata (StataCorp, College Station, TX). Descriptive analysis and frequency distributions were tallied for all responses. Responses to protocol lapses were grouped into 3 categories: feedback, public reporting, and penalty as described above. As all surveyed groups endorsed feedback as an appropriate response to all of the scenarios, we did not examine feedback, concentrating our analysis instead on public reporting and penalties.
Appropriateness ratings for each response to each protocol lapse were aggregated in 2 ways: ever appropriate (ie, the response would be appropriate after some number of documented lapses) versus never appropriate, and the threshold for the response. Whereas public reporting was only asked about as a single option, 3 separate responses were collapsed into the single response, penalties: fine, suspension, or firing. Individuals were classified as endorsing a penalty if they rated any 1 of these responses as ever appropriate. The threshold for penalty was the smallest number of occurrences at which 1 of the penalty responses was endorsed.
Differences among the 5 groups in the perceived harm of each protocol lapse were tested with 2 analyses. Group differences in ratings of whether public reporting and penalties were ever appropriate were tested with logistic regression analyses for each scenario separately, controlling for age, sex, and perceived harm of the protocol lapse. To determine if the 5 groups differed in their tendency to support public reporting or penalties regardless of the type of protocol lapse, we conducted logistic regression analyses across all 3 scenarios, accounting for multiple observations per individual through use of cluster‐correlated robust variance.[14] Differences among groups in the number of transgressions at which public reporting and penalties were supported were examined with log‐rank tests.
RESULTS
A total of 287 individuals were given surveys, and 183 completed them: 22 attending physicians, 33 resident physicians, 61 nurses, 47 medical students, and 20 patients (overall response rate 64%). Response rate for attending and resident physicians was 73%, for nurses 59%, and for medical students 54%. Among patients who were approached and agreed to accept a survey, 87% returned completed surveys (Table 1). The average age of attending physicians was 35.8 years (standard deviation [SD]: 5.3), residents was 28.3 years (SD: 1.7), nurses was 43.6 years (SD: 11.1), medical students was 26.6 years (SD: 2.9), and inpatients was 48.2 years (SD: 15.9). Thirty‐two percent of attending physicians were female, 67% of resident physicians were female, 88% of nurses were female, 66% of medical students were female, and 47% of inpatients were female.
| Attending Physician | Resident Physician | Nurse | Medical Student | Patient | |
|---|---|---|---|---|---|
| |||||
| No. | 22 | 33 | 61 | 47 | 20 |
| Response rate* | 73% | 73% | 59% | 54% | 87% |
| Age, y, meanSD | 365 | 282 | 4411 | 273 | 4816 |
| Sex, female, % (n) | 32% (7) | 67% (22) | 88% (53) | 66% (31) | 47% (9) |
Perceived Harm
Out of the 3 scenarios presented in in the survey, participants believed that not conducting preoperative time‐outs in surgery presented the highest risk to patient safety, with 57% (residents) to 86% (nurses) rating the potential harm as high (Figure 1). Not conducting fall risk assessments was perceived as second most potentially harmful, and not properly practicing hand hygiene was perceived as least potentially harmful to patient safety. There were significant differences among groups in perceptions of potential harm for all 3 scenarios (P<0.001 for all).
Appropriateness of Public Reporting and Penalties
Public reporting was viewed as ever appropriate by 34% of all respondents for hand‐hygiene protocol lapses, 58% for surgical time‐out lapses, and 43% for fall risk assessment lapses. There were no significant differences among groups in endorsement of public reporting for individual scenarios (Figure 2). Penalties were endorsed more frequently than public reporting for all groups and all scenarios. The proportion of attending physicians and patients who rated penalties as ever appropriate were similar for each scenario. Residents, medical students, and nurses were less likely than patients and attending physicians to support penalties (P<0.05 for all differences).
The aggregated analysis revealed that nurses and medical students were significantly less likely than patients to endorse public reporting across scenarios. In terms of endorsement of penalties, we found no significant differences between attending physicians and patients, but residents (odds ratio [OR]: 0.09, 95% confidence interval [CI]: 0.03‐0.32), students (OR: 0.12, 95% CI: 0.04‐0.34), and nurses (OR: 0.17, 95% CI: 0.03‐0.41) had significantly lower odds of favoring penalties than did patients (Table 2).
| Odds Ratio (95% CI) | ||
|---|---|---|
| Public Reporting | Penalty | |
| ||
| Group, across all scenarios | ||
| Patients | Reference | Reference |
| Attending physicians | 0.58 (0.172.01) | 0.88 (0.203.84) |
| Resident physicians | 0.42 (0.121.52) | 0.09 (0.020.32) |
| Nurses | 0.32 (0.120.88) | 0.17 (0.030.41) |
| Medical students | 0.22 (0.060.80) | 0.12 (0.040.34) |
| Scenario, across all groups | ||
| Hand hygiene | Reference | Reference |
| Surgical time‐out | 2.82 (2.033.91) | 4.29 (2.976.20) |
| Fall assessment | 1.47 (1.091.98) | 1.74 (1.272.37) |
Across all surveyed groups, public reporting was more often supported for lapses of surgical timeout (OR: 2.82, 95% CI: 2.03‐3.91) and fall risk assessment protocols (OR: 1.47, 95% CI: 1.09‐1.98) than for the referent, hand‐hygiene lapses. Across all groups, penalties were more likely to be supported for surgical timeout (OR: 4.29, 95% CI: 2.97‐6.20) and fall risk assessment protocol lapses (OR: 1.74, 95% CI: 1.27‐2.37) than for hand‐hygiene lapses.
Thresholds for Public Reporting and Penalties
The log‐rank test showed no significant differences among the surveyed groups in the number of transgressions at which public reporting was deemed appropriate in any of the 3 scenarios (P=0.37, P=0.71, and P=0.32 for hand hygiene, surgical time‐out, and fall risk assessment, respectively) (Figure 3). However, patients endorsed penalties after significantly fewer occurrences than residents, medical students, and nurses for all 3 scenarios (P<0.001 for all differences), and at a significantly lower threshold than attending physicians for surgical timeout and fall risk assessment (P<0.001 and P=0.03, respectively).
DISCUSSION
This survey assessed attitudes of healthcare professionals, trainees, and inpatients toward public reporting and penalties when clinicians do not follow basic safety protocols. Respondents tended to favor more aggressive measures when they deemed the safety risk from protocol violations to be higher. Almost all participants favored providing feedback after safety protocol lapses. Healthcare professionals tended to favor punitive measures, such as fines, suspension, and firing, more than public reporting of transgressions. Patients had a lower threshold than both providers and trainees for public reporting and punitive measures. In aggregate, our study suggests that after a decade of emphasis on a no‐blame response to patient safety hazards, both healthcare providers and patients now believe clinicians should be held accountable for following basic safety protocols, though their thresholds and triggers vary.
A surprising finding was that providers were more likely to favor penalties (such as fines, suspension, or firing) than public reporting of safety transgressions. Multiple studies have suggested that public reporting of hospital quality data has improved adherence to care processes and may improve patient outcomes.[15, 16, 17] Although our data do not tell us why clinicians appear to be more worried about public reporting than penalties, they do help explain why transparency has been a relatively powerful strategy to motivate changes in practice, even when it is unaccompanied by significant shifts in consumer choices.[18] It would be natural to consider public reporting to be a softer strategy than fines, suspension, or firing; however, our results indicate that many clinicians do not see it that way. Alternatively, the results could also suggest that clinicians prefer measures that provide more immediate feedback than public reporting generally provides. These attitudes should be considered when enacting public reporting strategies.
Another interesting finding was that patients and attending physicians tended to track together regarding their attitudes toward penalties for safety lapses. Although patients had a lower threshold for favoring penalties than attendings, similar proportions of patients and attending physicians believed that penalties should be enacted for safety transgressions, and both groups were more penal than physician trainees and nurses. We speculate that attendings and patients may have the most skin in the game, patients as the ones directly harmed by a preventable adverse event, and attending physicians as the most responsible clinicians, at least in the eyes of the malpractice system, licensing boards, and credentials committees.
Even though our study illustrates relatively high levels of endorsement for aggressive measures to deal with clinicians who fail to follow evidence‐based safety practices, a shift in this direction has risks and benefits. The no‐blame paradigm in patient safety grew out of a need to encourage open discussion about medical mistakes.[2] Whereas shifting away from a purely no‐ blame approach may lead to greater adherence with safety practices, and one hopes fewer cases of preventable harm, it also risks stifling the open discussions about medical errors that characterize learning organizations.[13, 19] Because of this, a movement in this direction should be undertaken carefully, starting first with a small number of well‐established safety practices, and ensuring that robust education and system improvements precede and accompany the imposition of penalties for nonadherence.
Our study has limitations. The survey was developed using convenience samples of UCSF faculty and medical students, so broader inclusion of physicians, nurses, trainees, and patients may have yielded a different survey instrument. As a survey, we cannot be certain that any of the groups' responses in real life (eg, in a vote of the medical staff on a given policy) would mirror their survey response. Additionally, the responses to protocol lapses did not include all possible administrative responses, such as mandatory training/remediation or rewards for positive behaviors. The responses could have also been different if participants were presented with different patient safety scenarios. The study population was limited in several ways. Attending and resident physicians were drawn from an academic department of internal medicine; it is possible that other specialties would have different attitudes. Patients were relatively young (likely due to the inclusion criteria), as were attending physicians (due to oversampling of hospitalist physicians). The relatively small number of participants could also limit statistical power to detect differences among groups. Additionally, the study population was limited to patients and healthcare professionals in academic medical centers in San Francisco. It is possible that attitudes would be different in other regions and practice settings.
The no‐blame approach to patient safety has been crucial in refocusing the lens on systems failures and in encouraging the active engagement by clinicians, particularly physicians.[2, 3] On the other hand, there are legitimate concerns that a unidimensional no‐blame approach has permitted, perhaps even promoted, nonadherence to evidence‐based safety practices that could prevent many cases of harm. Although it may not be surprising that patients favor harsher consequences for providers who do not follow basic safety protocols, our study demonstrates relatively widespread support for such consequences even among clinicians and trainees. However, all groups appear to recognize the nuances underlying this set of issues, with varying levels of enthusiasm for punitive responses based on perceived risk and number of transgressions. Future studies are needed to investigate how best to implement public reporting and penalties in ways that can maximize the patient safety benefits.
Acknowledgements
The authors are grateful to the clinicians, trainees, and patients who participated in the survey.
- . Understanding Patient Safety. 2nd ed. New York, NY: McGraw Hill Medical; 2012.
- . Error in medicine. JAMA. 1994;272(23):1851–1857.
- , . Balancing "no blame" with accountability in patient safety. N Engl J Med. 2009;361(14):1401–1406.
- , , , . Accountability measures—using measurement to promote quality improvement. N Engl J Med. 2010;363(7):683–688.
- , . Problem doctors: is there a system‐level solution? Ann Intern Med. 2006;144(2):107–115.
- , , , et al. A surgical safety checklist to reduce morbidity and mortality in a global population. N Engl J Med. 2009;360(5):491–499.
- , , , , . Effectiveness of a comprehensive hand hygiene program for reduction of infection rates in a long‐term care facility. Am J Infect Control. 2013;41(1):39–44.
- , . Impact of a hospital‐wide hand hygiene promotion strategy on healthcare‐associated infections. Antimicrob Resist Infect Control. 2012;1(1):13.
- , , , et al. Determinants of hand hygiene noncompliance in intensive care units. Am J Infect Control. 2013;41(2):131–135.
- , , , , , . Impact of a hospital‐wide hand hygiene initiative on healthcare‐associated infections: results of an interrupted time series. BMJ Qual Saf. 2012;21(12):1019–1026.
- , , , . Effectiveness of multifaceted hand hygiene interventions in long‐term care facilities in Hong Kong: a cluster‐randomized controlled trial. Infect Control Hosp Epidemiol. 2012;33(8):761–767.
- , , , , . Development, implementation, and evaluation of a comprehensive fall risk program. J Spec Pediatr Nurs 2011;16(2):130–139.
- , , , . A systematic review of the effectiveness, compliance, and critical factors for implementation of safety checklists in surgery. Ann Surg. 2012;256(6):925–933.
- . A note on robust variance estimation for cluster‐correlated data. Biometrics. 2000;56(2):645–646.
- , , , et al. Public reporting and pay for performance in hospital quality improvement. N Engl J Med. 2007;356(5):486–496.
- , , , , . Improving the outcomes of coronary artery bypass surgery in New York State. JAMA. 1994;271(10):761–766.
- , , . Declines in hospital mortality associated with a regional initiative to measure hospital performance. Am J Med Qual. 1997;12(2):103–112.
- , , , . The public release of performance data: what do we expect to gain? A review of the evidence. JAMA. 2000;283(14):1866–1874.
- . Continuing education meets the learning organization: the challenge of a systems approach to patient safety. J Contin Educ Health Prof. 2000;20(4):197–207.
© 2013 Society of Hospital Medicine
Duty Hours and Resident Inpatient Teaching
Hospital medicine is the fastest growing specialty in the history of medicine, and nearly 20% of hospitalists work in academic settings.1 Academic hospitalists often wear many hats; one of their main responsibilities is to supervise and teach residents and students. Hospitalists have responded to a number of changes to the landscape of medicine over the last 5 years, but none has had a more profound impact on an academic hospitalist's clinical teaching duties than the mandated reduction in duty hours (duty‐hour restrictions [DHR]).
In 2003, the Accreditation Council for Graduate Medical Education (ACGME) limited resident duty hours to 80 per week with no more than 30 consecutive hours,2 as a response to concerns about the impact of long duty hours on resident education, well‐being, and patient safety and pressures from impending legislation.3, 4 Data suggest many positive outcomes of these mandates,510 but one unforeseen consequence may be diminished time residents spend on teaching.1114
Academic hospitalists partner with residents to provide care and contribute to the learning of the medical team. The time spent teaching has many merits for residents, as they are valuable teachers of medical students15 and many find teaching enjoyable.16 Teaching also increases residents' own medical knowledge.17
Previous studies have demonstrated that some residents report teaching less since DHR.11, 13 Furthermore, greater than 75% of faculty educators, specifically those in Internal Medicine where the majority of academic hospitalists practice, perceive that since DHR, residents are teaching less.13 Given these concerns, and the benefits of resident teaching, it is important for academic hospitalists to understand the effects that DHR may have regarding the amount of time residents spend teaching and its consequences, in order to respond to this shift in the educational landscape and ensure trainee education while delivering exemplary patient care.
To better understand the factors related to and impact of resident teaching time since DHR, we performed a cross‐sectional survey of internal medicine residents at the University of California, San Francisco (UCSF). We hypothesize that workload elements of resident life are associated with the amount of time spent teaching. We also posit that the amount of time spent teaching may impact resident well‐being and perceptions of patient care.
Methods
Sites and Subjects
Descriptions of the survey protocol, including development and methods, have been published.11, 18 This study was performed at UCSF. The study was approved by the institutional review board at UCSF, and all 164 residents in internal medicine were eligible to participate. Data were collected beginning 1 month after DHR were implemented in February 2003 and collected for a total of 4 months.
Survey Development
After reviewing the literature and observing the residents over 1 month, the investigators identified domains pertaining to resident workload, quality of life, and patient care practices. An open‐ended question survey was created with questions regarding these domains, and given as a pilot survey to a group of residents ineligible for the study. Based on responses to the open‐ended questions, the investigators then developed a set of closed‐response items to the original questions. To establish content validity, the survey was reviewed by experts in medical education, outcomes research, and psychometrics, after which items were eliminated or reformatted if necessary. As a final check for usability and clarity, the survey was then pretested on non‐internal medicine house‐staff at the medical center and recent graduates of residency programs.
Survey Measures
Demographics
Residents were asked to report their age (30 or >30 years), sex, postgraduate year (PGY), and training program (primary care, categorical, or preliminary).
Teaching Time
Residents were asked, compared to the same (or equivalent) inpatient rotation BEFORE February 2003, how much time did you spend teaching during your most recent inpatient rotation? Answers rated on a 5‐point scale, 1 being much less, and 5 being much more. Responses were dichotomized into less or same or more as described in the Results section.
Hours Worked
Residents were asked, During your most recent inpatient rotation, how many hours did you work in 1 average week? Possible answers: 50‐59, 60‐69, 70‐79, 80‐89, 90‐99, and 100. Responses were dichotomized into <80 or 80.
Time Spent on Nonphysician Administrative Tasks
Residents were asked to report, What percent of your time is spent doing tasks that could be completed by a non‐MD? Answers ranging between 0 and 100% were filled into a blank space by the resident.
Emotional Exhaustion
A single score defined as being emotionally overextended and exhausted by work. Constructed as the mean of two highly‐correlated item responses (Cronbach's alpha = 0.84): During your most recent workweek, how often did you feel overwhelmed at work? and During your most recent workweek, how often did you feel worn out? Responses ranged from 1 (never) to 5 (very often).
Satisfaction with Patient Care
During your most recent inpatient rotation workweek, how satisfied were you with the quality of patient care you provided? Rated on a 10‐point scale with 1 being completely unsatisfied and 10 being completely satisfied.
Statistical Analyses
Univariate statistics were used first to characterize the distribution and frequency of the residents' responses. Bivariate associations among variables were assessed with correlation analyses and t‐tests.
Three regression models were constructed. First, a multivariate logistic regression model identified factors independently associated with self‐reported decreased teaching time. Variables were selected for the model based on prior hypotheses regarding factors related to decreased teaching time, observed relationships among variables, or to retain face validity of the model: age (30 versus >30 years), sex, PGY (PGY1 versus PGY2, PGY3), program (primary care versus categorical), hours worked/week, and percentage of time spent on administrative tasks. Next, a linear regression model examined the relationship between teaching time and emotional exhaustion, controlling for age, sex, PGY, program, hours worked, and time spent on administrative tasks. Finally, a linear regression model determined which of the factors in the second model, plus emotional exhaustion, were independently associated with satisfaction with patient care. All variables were retained in each model.
Results
The Residents
Of 164 eligible residents, 125 (76%) returned the survey. Sex, PGY, and program were similar between respondents and nonrespondents (P > 0.2, P > 0.45, and P > 0.6, respectively). Respondents were equally distributed among year of training, with 36.6% PGY‐1, 35.8% PGY‐2, and 27.6% PGY‐3. Most respondents were female (60%), younger than age 30 years (70%), and enrolled in the categorical residency program (62%). All (100%) reported being aware of the system changes intended to reduce hours to <80 hours/week, and 35% reported working >80 hours/week after DHR. All PGY‐1s had completed inpatient months prior to being surveyed.
Factors Associated With Spending Less Time Teaching
Of the 126 respondents, 107 completed the question regarding time teaching; 8 don't know responses were coded as missing, yielding an analytic n of 99 (60%). Twenty‐four (24.2%) residents reported spending less (n = 21) or much less (n = 3) time teaching after DHR began. Because only three individuals reported much less teaching time after DHR, the group was not large enough to yield meaningful or stable analytic results, so the groups were combined. Bivariate comparisons between those who reported less teaching compared to those who reported the same or more are shown in Table 1.
| Characteristic | Those Who Teach Same or More (n = 75) | Those Who Teach Less or Much Less (n = 24) | P Value* |
|---|---|---|---|
| |||
| PGY, n (%) | 0.0013 | ||
| PGY‐1 | 41 (93.2) | 3 (6.8) | |
| PGY‐2 | 23 (63.9) | 13 (36.1) | |
| PGY‐3 | 11 (57.9) | 8 (42.1) | |
| Training program, primary care, n (%) | 29 (38.7) | 6 (25.0) | 0.33 |
| Sex, female, n (%) | 43 (57.3) | 11 (45.8) | 0.35 |
| Age 30 years, n (%) | 55 (75.3) | 16 (66.7) | 0.43 |
| Number of hours worked <80, n (%) | 43 (58.1) | 22 (91.7) | 0.002 |
In multivariate models, working <80 hours/week (odds ratio [OR], 5.99; 95% confidence interval [CI], 1.11‐32.48]), being a PGY‐2 (OR, 7.14; 95% CI, 1.56‐32.79]) or PGY‐3 (OR, 8.23; 95% CI, 1.44‐47.09), and reporting more time on administrative tasks (OR, 1.03; 95% CI, 1.00‐1.06) were associated with reports of spending less time teaching (Table 2).
| Characteristic | OR (CI) |
|---|---|
| |
| Number of hours worked <80 | 5.99 (1.11‐32.48) |
| Age >30 years | 0.91 (0.28‐2.45) |
| Female | 0.83 (0.28‐2.45) |
| PGY‐2 | 7.14 (1.56‐32.79) |
| PGY‐3 | 8.23 (1.44‐47.09) |
| Primary care program | 0.75 (0.22‐2.51) |
| Time spent on nonphysician administrative tasks | 1.03 (1.00‐1.06) |
Impacts of Spending Less Time Teaching
In bivariate comparisons, residents who reported reduced teaching time were less emotionally exhausted (P = 0.006) and more satisfied with the patient care they provided (P = 0.003) (Table 3). In the multivariate analysis, emotional exhaustion was significantly associated with satisfaction with patient care ( = 0.52; P = 0.01), but spending less time teaching was not ( = 0.32; P = 0.46). These analyses reveal that while there was a direct relationship between emotional exhaustion and satisfaction with patient care, the relationship between teaching time and satisfaction with patient care was mediated through emotional exhaustion.
| Time Spent Teaching | P Value | ||
|---|---|---|---|
| Less or Much Less [Mean (SD)] | Same or More [Mean (SD)] | ||
| |||
| Frequency of emotional exhaustion* | 2.6 (0.8) | 3.2 (0.9) | 0.006 |
| Satisfaction with patient care | 8.1 (1.2) | 7.1 (1.8) | 0.003 |
Discussion
In this cross‐sectional survey of internal medicine residents, we found that roughly 25% of residents report spending less time teaching since DHR. Spending less time teaching was associated with working <80 hours/week, being PGY‐2 or PGY‐3 residents, and spending more time on administrative tasks. Residents' reports of spending less time teaching were in turn associated with less emotional exhaustion and more satisfaction with the quality of patient care they provided.
As hospitalists have been shown to be more effective, and possibly better, teachers than nonhospitalists,19 and are increasingly responsible for teaching duties on academic medical services,1 our findings of some residents spending less time teaching since DHR may necessitate changes in hospitalist teaching roles to adapt to this previously unrecognized shift. Although the majority of the residents in our cohort did not experience diminished teaching time, the educational impact of diminished teaching time for the quarter of our cohort that taught less frequently post‐DHR is noteworthy, as these changes affect over 22,000 internal medicine residents. Our findings enhance previous work suggesting that DHR may have some negative effects on resident education.68, 1114, 20 We also found that those who spend less time teaching are more likely to be senior residents, the main teachers of medical students,21 and therefore a reduction in time spent teaching may adversely impact medical students, as previously described.22 Academic hospitalists, in order to maintain and ensure high levels of education and educational satisfaction in the post‐DHR era will likely benefit from recognizing and responding to this change.
Our study also found that spending less time teaching was associated with fewer reports of emotional exhaustion and perceptions of higher quality patient care. Though residents enjoy teaching and would prefer to spend more time teaching if service responsibilities were fewer and if time allowed,16 it is possible that when the total amount of time to accomplish tasks in a week or day are limited, spending time teaching may lead to increased stress and pressure, overwhelming residents and leading to increased emotional exhaustion. Less emotional exhaustion and higher perceptions of patient care are positive outcomes that are, in fact, aligned with the ACGME DHR goals24 and are of prime importance to academic hospitalists as educators, role‐models, and care providers.
Balancing the challenges of a reduction of time spent teaching and the possible benefits of the reduction will necessitate both individual and system‐wide responses. Hospitalists are uniquely poised to develop these responses, which will likely have widespread impacts not only in education but also in patient care and satisfaction with the inpatient experience. Some of these responses may include teaching innovations, such as honing skills for brief teaching, incorporating focused, patient‐driven teaching and emphasizing teachable moments,2325 or workflow innovations, including decreased administrative tasks for residents or changes to the workday schedule to enhance protected teaching time. Hospitalists may also need to increase their time contribution to teaching the medical team or structure more planned didactic sessions for residents and students to ensure that educational sessions are occurring.
Many new hospitalists were trained during duty hour limitations, but the majority were not.1 The landscape of teaching on the medical wards since DHR is dramatically different, speckled with the discontinuities of multiple cross‐coverage residents.26 Residents may have unconsciously acclimated to the system change, and our findings, which give a time‐specific glimpse of the changes that took place with DHR, may inform some of the reasons behind the educational concerns of late.
Our study has several limitations. As a cross‐sectional study, we describe associations and cannot discern causal pathways, but we believe that these associations themselves enhance our understanding of the consequences of DHR. We relied upon self‐reports of teaching time, which are subject to bias. These self‐reports, however, give insight into the resident's perspective of their experience, which is, in and of itself, noteworthy. This study is also subject to recall bias, and we attempted to minimize this by administering the survey just after DHR was implemented and by carefully framing the comparisons. Findings may be sensing secular events such as the challenges of a large system change or a difficult ward month. That said, our findings are consistent with other current survey studies of resident teaching time,1114 thus validating many of the conclusions from our collected data. As the survey was given shortly after DHR, it may not have accounted for initial obstacles of the new system; however, the survey was given over 4 months following DHR implementation at our institution, which we believe allowed the residency program time to adjust to the new organizational system while allowing for real‐time feedback. Our study was conducted at a single site; however, because the medical system studied is comprised of three hospitals, each of which used a variety of dayfloat and nightfloat interventions similar to systems at other institutions, we believe the variability within our system increases the generalizability of this study to other institutions. Finally, these data were collected in 2003, and since that time, programs have likely made significant adjustments in their rotation schedules and team structure and may look different now than previously. We believe that the timing of this study adequately characterizes the potential loss of teaching time pre‐DHR and post‐DHR in a way that current data cannot, due to resident acclimatization to culture change, and therefore may better inform hospitalists regarding changes that may be implicit as opposed to explicit in resident teaching.
In conclusion, DHR has resulted in profound changes in teaching hospitals. Since education and patient care are central to the mission of academic hospitalists, they need to be aware of the potential for diminished teaching time by some of their residents, the factors that effect that change, and its impact on patient care. Hospitalists can use this information to create new systems of care delivery and education to optimize the resident and patient experience. As the duty hour issue has come again to the forefront, with the new Institute of Medicine Committee on Optimizing Graduated Medical Trainee (Resident) Hours and Work Schedules to Improve Patient Safety recommendations policies regarding duty hours,27 it is keenly important that hospitalists understand the potentially unforeseen consequences of DHR on important aspects of resident work such as teaching.
- Society of Hospital Medicine (SHM). 2008. 2007‐2008 SHM Bi‐Annual Survey: The Authoritative Source on the State of the Hospital Medicine Movement. Philadelphia, PA: Society of Hospital Medicine.
- Accreditation Council for Graduate Medical Education. Resident Duty Hours Common Program Requirements. Available at: http://www. acgme.org/acWebsite/dutyHours/dh_dutyHoursCommonPR.pdf). Accessed December2008.
- , , ;ACGME Work Group on Resident Duty Hours.Accreditation Council for Graduate Medical Education. New requirements for resident duty hours.JAMA.2002;288(9):1112–1114.
- , , , .The impact of duty hours on resident self reports of errors.J Gen Intern Med.2007;22(2):205–209.
- , , , , .The effects of work‐hour limitations on resident well‐being, patient care, and education in an internal medicine residency program.Arch Intern Med.2005;165(22):2601–2606.
- , , , .Burnout and internal medicine resident work‐hour restrictions.Arch Intern Med.2005;165(22):2595–2600.
- , , , .Resident perceptions of the impact of work hour limitations.J Gen Intern Med.2007;22(7):969–975.
- , , , , .Implementing duty hour restrictions without diminishing patient care or education.Acad Med.2006;81(1):68–75.
- , , , .Changes in outcomes for internal medicine inpatients after work‐hour regulations.Ann Intern Med.2007;147:97–103.
- , .Changes in hospital mortality associated with residency work hour regulations.Ann Intern Med.2007;147:73–80.
- , , , , .Impact of reduced duty hours on residents' educational satisfaction at the University of California, San Francisco.Acad Med.2006;81(1):76–81.
- , , , , , .The impact of resident duty hours reform on the internal medicine core clerkship: results from the clerkship directors in internal medicine survey.Acad Med.2006;81(12):1038–1044.
- , , , , , .Too little time to teach? Medical student education and work‐hour restriction.Mil Med.2007;172(10):1053–1057.
- , , .Impact of duty hour limitations on resident and student education in obstetrics and gynecology.J Reprod Med.2007;52(5):345–348.
- , .Medical students' perceptions of themselves and residents as teachers.Med Teach.1992;14:133–138.
- , , .Teaching in the clinical setting: factors influencing residents' perceptions, confidence and behavior.J Med Educ.1984;18:360–365.
- , , .Residents' perceptions of their role as teachers.J Med Educ.1988;63:900–905.
- , , , .The impact of duty hours on resident self reports of errors.J Gen Intern Med.2007;22(2):205–209.
- , , , , .Effects of hospitalist attending physicians on trainee satisfaction with teaching and with internal medicine rotations.Arch Intern Med.2004;164(17):1866–1871.
- , , .Resident job satisfaction: one year of duty hours.Am J Obstet Gynecol.2005;193(5):1823–1826.
- .House staff attitudes toward teaching.J Med Educ.1970;45(3):156–159.
- , , , .Medical students' perceptions of resident teaching: have duty hours regulations had an impact?Ann Surg.2005;242(4):548–553.
- , .Teaching internal medicine residents in the new era.J Gen Intern Med.2006;21:447–452.
- , , , .A five‐step “microskills” model of clinical teaching.J Am Board Fam Pract.1992;5(4):419–424.
- , , , , .Strategies for efficient and effective teaching in the ambulatory care setting.Acad Med.1997;72(4):277–280.
- , , , , .Managing discontinuity in academic medical centers: strategies for a safe and effective resident sign‐out.J Hosp Med.2006;1(4):257–266.
- Resident Duty Hours: Enhancing Sleep, Supervision, and Safety. Ulmer C, Wolman DM, Johns MME, eds.Committee on Optimizing Graduate Medical Trainee (Resident) Hours and Work Schedule to Improve Patient Safety, Institutes of Medicine.Washington, D.C.The National Academics Press,2008.
Hospital medicine is the fastest growing specialty in the history of medicine, and nearly 20% of hospitalists work in academic settings.1 Academic hospitalists often wear many hats; one of their main responsibilities is to supervise and teach residents and students. Hospitalists have responded to a number of changes to the landscape of medicine over the last 5 years, but none has had a more profound impact on an academic hospitalist's clinical teaching duties than the mandated reduction in duty hours (duty‐hour restrictions [DHR]).
In 2003, the Accreditation Council for Graduate Medical Education (ACGME) limited resident duty hours to 80 per week with no more than 30 consecutive hours,2 as a response to concerns about the impact of long duty hours on resident education, well‐being, and patient safety and pressures from impending legislation.3, 4 Data suggest many positive outcomes of these mandates,510 but one unforeseen consequence may be diminished time residents spend on teaching.1114
Academic hospitalists partner with residents to provide care and contribute to the learning of the medical team. The time spent teaching has many merits for residents, as they are valuable teachers of medical students15 and many find teaching enjoyable.16 Teaching also increases residents' own medical knowledge.17
Previous studies have demonstrated that some residents report teaching less since DHR.11, 13 Furthermore, greater than 75% of faculty educators, specifically those in Internal Medicine where the majority of academic hospitalists practice, perceive that since DHR, residents are teaching less.13 Given these concerns, and the benefits of resident teaching, it is important for academic hospitalists to understand the effects that DHR may have regarding the amount of time residents spend teaching and its consequences, in order to respond to this shift in the educational landscape and ensure trainee education while delivering exemplary patient care.
To better understand the factors related to and impact of resident teaching time since DHR, we performed a cross‐sectional survey of internal medicine residents at the University of California, San Francisco (UCSF). We hypothesize that workload elements of resident life are associated with the amount of time spent teaching. We also posit that the amount of time spent teaching may impact resident well‐being and perceptions of patient care.
Methods
Sites and Subjects
Descriptions of the survey protocol, including development and methods, have been published.11, 18 This study was performed at UCSF. The study was approved by the institutional review board at UCSF, and all 164 residents in internal medicine were eligible to participate. Data were collected beginning 1 month after DHR were implemented in February 2003 and collected for a total of 4 months.
Survey Development
After reviewing the literature and observing the residents over 1 month, the investigators identified domains pertaining to resident workload, quality of life, and patient care practices. An open‐ended question survey was created with questions regarding these domains, and given as a pilot survey to a group of residents ineligible for the study. Based on responses to the open‐ended questions, the investigators then developed a set of closed‐response items to the original questions. To establish content validity, the survey was reviewed by experts in medical education, outcomes research, and psychometrics, after which items were eliminated or reformatted if necessary. As a final check for usability and clarity, the survey was then pretested on non‐internal medicine house‐staff at the medical center and recent graduates of residency programs.
Survey Measures
Demographics
Residents were asked to report their age (30 or >30 years), sex, postgraduate year (PGY), and training program (primary care, categorical, or preliminary).
Teaching Time
Residents were asked, compared to the same (or equivalent) inpatient rotation BEFORE February 2003, how much time did you spend teaching during your most recent inpatient rotation? Answers rated on a 5‐point scale, 1 being much less, and 5 being much more. Responses were dichotomized into less or same or more as described in the Results section.
Hours Worked
Residents were asked, During your most recent inpatient rotation, how many hours did you work in 1 average week? Possible answers: 50‐59, 60‐69, 70‐79, 80‐89, 90‐99, and 100. Responses were dichotomized into <80 or 80.
Time Spent on Nonphysician Administrative Tasks
Residents were asked to report, What percent of your time is spent doing tasks that could be completed by a non‐MD? Answers ranging between 0 and 100% were filled into a blank space by the resident.
Emotional Exhaustion
A single score defined as being emotionally overextended and exhausted by work. Constructed as the mean of two highly‐correlated item responses (Cronbach's alpha = 0.84): During your most recent workweek, how often did you feel overwhelmed at work? and During your most recent workweek, how often did you feel worn out? Responses ranged from 1 (never) to 5 (very often).
Satisfaction with Patient Care
During your most recent inpatient rotation workweek, how satisfied were you with the quality of patient care you provided? Rated on a 10‐point scale with 1 being completely unsatisfied and 10 being completely satisfied.
Statistical Analyses
Univariate statistics were used first to characterize the distribution and frequency of the residents' responses. Bivariate associations among variables were assessed with correlation analyses and t‐tests.
Three regression models were constructed. First, a multivariate logistic regression model identified factors independently associated with self‐reported decreased teaching time. Variables were selected for the model based on prior hypotheses regarding factors related to decreased teaching time, observed relationships among variables, or to retain face validity of the model: age (30 versus >30 years), sex, PGY (PGY1 versus PGY2, PGY3), program (primary care versus categorical), hours worked/week, and percentage of time spent on administrative tasks. Next, a linear regression model examined the relationship between teaching time and emotional exhaustion, controlling for age, sex, PGY, program, hours worked, and time spent on administrative tasks. Finally, a linear regression model determined which of the factors in the second model, plus emotional exhaustion, were independently associated with satisfaction with patient care. All variables were retained in each model.
Results
The Residents
Of 164 eligible residents, 125 (76%) returned the survey. Sex, PGY, and program were similar between respondents and nonrespondents (P > 0.2, P > 0.45, and P > 0.6, respectively). Respondents were equally distributed among year of training, with 36.6% PGY‐1, 35.8% PGY‐2, and 27.6% PGY‐3. Most respondents were female (60%), younger than age 30 years (70%), and enrolled in the categorical residency program (62%). All (100%) reported being aware of the system changes intended to reduce hours to <80 hours/week, and 35% reported working >80 hours/week after DHR. All PGY‐1s had completed inpatient months prior to being surveyed.
Factors Associated With Spending Less Time Teaching
Of the 126 respondents, 107 completed the question regarding time teaching; 8 don't know responses were coded as missing, yielding an analytic n of 99 (60%). Twenty‐four (24.2%) residents reported spending less (n = 21) or much less (n = 3) time teaching after DHR began. Because only three individuals reported much less teaching time after DHR, the group was not large enough to yield meaningful or stable analytic results, so the groups were combined. Bivariate comparisons between those who reported less teaching compared to those who reported the same or more are shown in Table 1.
| Characteristic | Those Who Teach Same or More (n = 75) | Those Who Teach Less or Much Less (n = 24) | P Value* |
|---|---|---|---|
| |||
| PGY, n (%) | 0.0013 | ||
| PGY‐1 | 41 (93.2) | 3 (6.8) | |
| PGY‐2 | 23 (63.9) | 13 (36.1) | |
| PGY‐3 | 11 (57.9) | 8 (42.1) | |
| Training program, primary care, n (%) | 29 (38.7) | 6 (25.0) | 0.33 |
| Sex, female, n (%) | 43 (57.3) | 11 (45.8) | 0.35 |
| Age 30 years, n (%) | 55 (75.3) | 16 (66.7) | 0.43 |
| Number of hours worked <80, n (%) | 43 (58.1) | 22 (91.7) | 0.002 |
In multivariate models, working <80 hours/week (odds ratio [OR], 5.99; 95% confidence interval [CI], 1.11‐32.48]), being a PGY‐2 (OR, 7.14; 95% CI, 1.56‐32.79]) or PGY‐3 (OR, 8.23; 95% CI, 1.44‐47.09), and reporting more time on administrative tasks (OR, 1.03; 95% CI, 1.00‐1.06) were associated with reports of spending less time teaching (Table 2).
| Characteristic | OR (CI) |
|---|---|
| |
| Number of hours worked <80 | 5.99 (1.11‐32.48) |
| Age >30 years | 0.91 (0.28‐2.45) |
| Female | 0.83 (0.28‐2.45) |
| PGY‐2 | 7.14 (1.56‐32.79) |
| PGY‐3 | 8.23 (1.44‐47.09) |
| Primary care program | 0.75 (0.22‐2.51) |
| Time spent on nonphysician administrative tasks | 1.03 (1.00‐1.06) |
Impacts of Spending Less Time Teaching
In bivariate comparisons, residents who reported reduced teaching time were less emotionally exhausted (P = 0.006) and more satisfied with the patient care they provided (P = 0.003) (Table 3). In the multivariate analysis, emotional exhaustion was significantly associated with satisfaction with patient care ( = 0.52; P = 0.01), but spending less time teaching was not ( = 0.32; P = 0.46). These analyses reveal that while there was a direct relationship between emotional exhaustion and satisfaction with patient care, the relationship between teaching time and satisfaction with patient care was mediated through emotional exhaustion.
| Time Spent Teaching | P Value | ||
|---|---|---|---|
| Less or Much Less [Mean (SD)] | Same or More [Mean (SD)] | ||
| |||
| Frequency of emotional exhaustion* | 2.6 (0.8) | 3.2 (0.9) | 0.006 |
| Satisfaction with patient care | 8.1 (1.2) | 7.1 (1.8) | 0.003 |
Discussion
In this cross‐sectional survey of internal medicine residents, we found that roughly 25% of residents report spending less time teaching since DHR. Spending less time teaching was associated with working <80 hours/week, being PGY‐2 or PGY‐3 residents, and spending more time on administrative tasks. Residents' reports of spending less time teaching were in turn associated with less emotional exhaustion and more satisfaction with the quality of patient care they provided.
As hospitalists have been shown to be more effective, and possibly better, teachers than nonhospitalists,19 and are increasingly responsible for teaching duties on academic medical services,1 our findings of some residents spending less time teaching since DHR may necessitate changes in hospitalist teaching roles to adapt to this previously unrecognized shift. Although the majority of the residents in our cohort did not experience diminished teaching time, the educational impact of diminished teaching time for the quarter of our cohort that taught less frequently post‐DHR is noteworthy, as these changes affect over 22,000 internal medicine residents. Our findings enhance previous work suggesting that DHR may have some negative effects on resident education.68, 1114, 20 We also found that those who spend less time teaching are more likely to be senior residents, the main teachers of medical students,21 and therefore a reduction in time spent teaching may adversely impact medical students, as previously described.22 Academic hospitalists, in order to maintain and ensure high levels of education and educational satisfaction in the post‐DHR era will likely benefit from recognizing and responding to this change.
Our study also found that spending less time teaching was associated with fewer reports of emotional exhaustion and perceptions of higher quality patient care. Though residents enjoy teaching and would prefer to spend more time teaching if service responsibilities were fewer and if time allowed,16 it is possible that when the total amount of time to accomplish tasks in a week or day are limited, spending time teaching may lead to increased stress and pressure, overwhelming residents and leading to increased emotional exhaustion. Less emotional exhaustion and higher perceptions of patient care are positive outcomes that are, in fact, aligned with the ACGME DHR goals24 and are of prime importance to academic hospitalists as educators, role‐models, and care providers.
Balancing the challenges of a reduction of time spent teaching and the possible benefits of the reduction will necessitate both individual and system‐wide responses. Hospitalists are uniquely poised to develop these responses, which will likely have widespread impacts not only in education but also in patient care and satisfaction with the inpatient experience. Some of these responses may include teaching innovations, such as honing skills for brief teaching, incorporating focused, patient‐driven teaching and emphasizing teachable moments,2325 or workflow innovations, including decreased administrative tasks for residents or changes to the workday schedule to enhance protected teaching time. Hospitalists may also need to increase their time contribution to teaching the medical team or structure more planned didactic sessions for residents and students to ensure that educational sessions are occurring.
Many new hospitalists were trained during duty hour limitations, but the majority were not.1 The landscape of teaching on the medical wards since DHR is dramatically different, speckled with the discontinuities of multiple cross‐coverage residents.26 Residents may have unconsciously acclimated to the system change, and our findings, which give a time‐specific glimpse of the changes that took place with DHR, may inform some of the reasons behind the educational concerns of late.
Our study has several limitations. As a cross‐sectional study, we describe associations and cannot discern causal pathways, but we believe that these associations themselves enhance our understanding of the consequences of DHR. We relied upon self‐reports of teaching time, which are subject to bias. These self‐reports, however, give insight into the resident's perspective of their experience, which is, in and of itself, noteworthy. This study is also subject to recall bias, and we attempted to minimize this by administering the survey just after DHR was implemented and by carefully framing the comparisons. Findings may be sensing secular events such as the challenges of a large system change or a difficult ward month. That said, our findings are consistent with other current survey studies of resident teaching time,1114 thus validating many of the conclusions from our collected data. As the survey was given shortly after DHR, it may not have accounted for initial obstacles of the new system; however, the survey was given over 4 months following DHR implementation at our institution, which we believe allowed the residency program time to adjust to the new organizational system while allowing for real‐time feedback. Our study was conducted at a single site; however, because the medical system studied is comprised of three hospitals, each of which used a variety of dayfloat and nightfloat interventions similar to systems at other institutions, we believe the variability within our system increases the generalizability of this study to other institutions. Finally, these data were collected in 2003, and since that time, programs have likely made significant adjustments in their rotation schedules and team structure and may look different now than previously. We believe that the timing of this study adequately characterizes the potential loss of teaching time pre‐DHR and post‐DHR in a way that current data cannot, due to resident acclimatization to culture change, and therefore may better inform hospitalists regarding changes that may be implicit as opposed to explicit in resident teaching.
In conclusion, DHR has resulted in profound changes in teaching hospitals. Since education and patient care are central to the mission of academic hospitalists, they need to be aware of the potential for diminished teaching time by some of their residents, the factors that effect that change, and its impact on patient care. Hospitalists can use this information to create new systems of care delivery and education to optimize the resident and patient experience. As the duty hour issue has come again to the forefront, with the new Institute of Medicine Committee on Optimizing Graduated Medical Trainee (Resident) Hours and Work Schedules to Improve Patient Safety recommendations policies regarding duty hours,27 it is keenly important that hospitalists understand the potentially unforeseen consequences of DHR on important aspects of resident work such as teaching.
- Society of Hospital Medicine (SHM). 2008. 2007‐2008 SHM Bi‐Annual Survey: The Authoritative Source on the State of the Hospital Medicine Movement. Philadelphia, PA: Society of Hospital Medicine.
- Accreditation Council for Graduate Medical Education. Resident Duty Hours Common Program Requirements. Available at: http://www. acgme.org/acWebsite/dutyHours/dh_dutyHoursCommonPR.pdf). Accessed December2008.
- , , ;ACGME Work Group on Resident Duty Hours.Accreditation Council for Graduate Medical Education. New requirements for resident duty hours.JAMA.2002;288(9):1112–1114.
- , , , .The impact of duty hours on resident self reports of errors.J Gen Intern Med.2007;22(2):205–209.
- , , , , .The effects of work‐hour limitations on resident well‐being, patient care, and education in an internal medicine residency program.Arch Intern Med.2005;165(22):2601–2606.
- , , , .Burnout and internal medicine resident work‐hour restrictions.Arch Intern Med.2005;165(22):2595–2600.
- , , , .Resident perceptions of the impact of work hour limitations.J Gen Intern Med.2007;22(7):969–975.
- , , , , .Implementing duty hour restrictions without diminishing patient care or education.Acad Med.2006;81(1):68–75.
- , , , .Changes in outcomes for internal medicine inpatients after work‐hour regulations.Ann Intern Med.2007;147:97–103.
- , .Changes in hospital mortality associated with residency work hour regulations.Ann Intern Med.2007;147:73–80.
- , , , , .Impact of reduced duty hours on residents' educational satisfaction at the University of California, San Francisco.Acad Med.2006;81(1):76–81.
- , , , , , .The impact of resident duty hours reform on the internal medicine core clerkship: results from the clerkship directors in internal medicine survey.Acad Med.2006;81(12):1038–1044.
- , , , , , .Too little time to teach? Medical student education and work‐hour restriction.Mil Med.2007;172(10):1053–1057.
- , , .Impact of duty hour limitations on resident and student education in obstetrics and gynecology.J Reprod Med.2007;52(5):345–348.
- , .Medical students' perceptions of themselves and residents as teachers.Med Teach.1992;14:133–138.
- , , .Teaching in the clinical setting: factors influencing residents' perceptions, confidence and behavior.J Med Educ.1984;18:360–365.
- , , .Residents' perceptions of their role as teachers.J Med Educ.1988;63:900–905.
- , , , .The impact of duty hours on resident self reports of errors.J Gen Intern Med.2007;22(2):205–209.
- , , , , .Effects of hospitalist attending physicians on trainee satisfaction with teaching and with internal medicine rotations.Arch Intern Med.2004;164(17):1866–1871.
- , , .Resident job satisfaction: one year of duty hours.Am J Obstet Gynecol.2005;193(5):1823–1826.
- .House staff attitudes toward teaching.J Med Educ.1970;45(3):156–159.
- , , , .Medical students' perceptions of resident teaching: have duty hours regulations had an impact?Ann Surg.2005;242(4):548–553.
- , .Teaching internal medicine residents in the new era.J Gen Intern Med.2006;21:447–452.
- , , , .A five‐step “microskills” model of clinical teaching.J Am Board Fam Pract.1992;5(4):419–424.
- , , , , .Strategies for efficient and effective teaching in the ambulatory care setting.Acad Med.1997;72(4):277–280.
- , , , , .Managing discontinuity in academic medical centers: strategies for a safe and effective resident sign‐out.J Hosp Med.2006;1(4):257–266.
- Resident Duty Hours: Enhancing Sleep, Supervision, and Safety. Ulmer C, Wolman DM, Johns MME, eds.Committee on Optimizing Graduate Medical Trainee (Resident) Hours and Work Schedule to Improve Patient Safety, Institutes of Medicine.Washington, D.C.The National Academics Press,2008.
Copyright © 2009 Society of Hospital Medicine