User login
Announcing the Journal of Hospital Medicine Editorial Fellowship
The peer review and editorial processes are integral activities in academic medicine that provide ethical, independent, and unbiased critical assessment of submitted manuscripts to academic journals. Recognizing that few trainees or junior faculty are formally exposed to these processes,1 the Journal of Hospital Medicine aims to fill this opportunity gap through the launch of a one-year Editorial Fellowship.
The Fellowship is open to chief residents, hospital medicine fellows, and junior faculty (eg, Assistant Professor or Clinical Instructor). Starting in July of each year, a group of four to six applicants are paired with editorial mentors who are current JHM Deputy or Associate Editors. Structured as a distance-learning program, this program aims to allow Fellows the ability to continue in their full time professional roles while also allowing the opportunity to engage with national leaders in hospital medicine. Regular communication and interactions take place through both synchronous and asynchronous means. Fellows’ responsibilities during the 12-month experience include: completion of six guided peer reviews, preparation of one or two editorials, participation in monthly editorial meetings, and quarterly educational videoconferences. Interested Fellows may also have an opportunity to co-lead the journal’s online journal club, #JHMChat.2 Fellows are expected to attend the editorial staff meeting at the annual Society of Hospital Medicine Conference.
With this program, JHM aims to accomplish several tasks. First, we hope to offer a unique educational experience that allows for further growth, development, inspiration, and experience in academic medicine—specifically around the manuscript review and editorial processes. Second, recognizing that a journal’s quality is frequently a product of its reviewers, JHM hopes to build a cadre of well-trained and experienced reviewers and, hopefully, future members of the JHM editorial leadership team. Third, the program hopes to act as a networking experience, allowing editorial Fellows to learn from, collaborate with, and become academic leaders in the field. Finally, we hope to provide an opportunity for Fellows to be academically productive in their composition of editorial content—an output that will help catalyze their professional development.
We believe that in working closely with the JHM editorial staff, this program will help develop the next generation of leaders in academic hospital medicine. We strongly encourage applications from physicians who have been historically under-represented in leadership in academic medicine. Further details and the application can be found in the appendix and on the JHM website (www.journalofhospitalmedicine.com). It will be announced annually through the @JHospMedicine twitter handle.
Disclosures
The authors have nothing to disclose.
1. Lovejoy TI, Revenson TA, France CR. Reviewing manuscripts for peer-review journals: a primer for novice and seasoned reviewers. Ann Behav Med Publ Soc Behav Med. 2011;42(1):1-13. doi:10.1007/s12160-011-9269-x PubMed
2. Wray CM, Arora VM, Auerbach AD. The Adoption of an Online Journal Club to Improve Research Dissemination and Social Media Engagement Among Hospitalists. J Hosp Med. 2018;13(11). doi:10.12788/jhm.2987 PubMed
The peer review and editorial processes are integral activities in academic medicine that provide ethical, independent, and unbiased critical assessment of submitted manuscripts to academic journals. Recognizing that few trainees or junior faculty are formally exposed to these processes,1 the Journal of Hospital Medicine aims to fill this opportunity gap through the launch of a one-year Editorial Fellowship.
The Fellowship is open to chief residents, hospital medicine fellows, and junior faculty (eg, Assistant Professor or Clinical Instructor). Starting in July of each year, a group of four to six applicants are paired with editorial mentors who are current JHM Deputy or Associate Editors. Structured as a distance-learning program, this program aims to allow Fellows the ability to continue in their full time professional roles while also allowing the opportunity to engage with national leaders in hospital medicine. Regular communication and interactions take place through both synchronous and asynchronous means. Fellows’ responsibilities during the 12-month experience include: completion of six guided peer reviews, preparation of one or two editorials, participation in monthly editorial meetings, and quarterly educational videoconferences. Interested Fellows may also have an opportunity to co-lead the journal’s online journal club, #JHMChat.2 Fellows are expected to attend the editorial staff meeting at the annual Society of Hospital Medicine Conference.
With this program, JHM aims to accomplish several tasks. First, we hope to offer a unique educational experience that allows for further growth, development, inspiration, and experience in academic medicine—specifically around the manuscript review and editorial processes. Second, recognizing that a journal’s quality is frequently a product of its reviewers, JHM hopes to build a cadre of well-trained and experienced reviewers and, hopefully, future members of the JHM editorial leadership team. Third, the program hopes to act as a networking experience, allowing editorial Fellows to learn from, collaborate with, and become academic leaders in the field. Finally, we hope to provide an opportunity for Fellows to be academically productive in their composition of editorial content—an output that will help catalyze their professional development.
We believe that in working closely with the JHM editorial staff, this program will help develop the next generation of leaders in academic hospital medicine. We strongly encourage applications from physicians who have been historically under-represented in leadership in academic medicine. Further details and the application can be found in the appendix and on the JHM website (www.journalofhospitalmedicine.com). It will be announced annually through the @JHospMedicine twitter handle.
Disclosures
The authors have nothing to disclose.
1. Lovejoy TI, Revenson TA, France CR. Reviewing manuscripts for peer-review journals: a primer for novice and seasoned reviewers. Ann Behav Med Publ Soc Behav Med. 2011;42(1):1-13. doi:10.1007/s12160-011-9269-x PubMed
2. Wray CM, Arora VM, Auerbach AD. The Adoption of an Online Journal Club to Improve Research Dissemination and Social Media Engagement Among Hospitalists. J Hosp Med. 2018;13(11). doi:10.12788/jhm.2987 PubMed
© 2019 Society of Hospital Medicine
Moving On
After seven years at the helm of the Journal of Hospital Medicine, I am both pleased to hand over the reins and sad to let them go. My time as Editor in Chief has been wonderful, challenging, and fulfilling.
When I began my tenure, JHM managed approximately 350 papers annually, and published 10 times per year. We had no social media presence, a developing editorial sense (and developing Editor in Chief), and a pool of hard-working and passionate Editors. As of this year, we have handled more than 700 papers and are publishing content monthly, online only, and online first. Our dedicated team is deeply passionate about making every paper better through interaction with the authors—whether we accept it for publication or not.
JHM has added a presence on Facebook and Twitter, launched a Twitter Journal Club as a regular offering (#JHMChat), added visual abstracts to our Tweets and Facebook postings, and researched how these novel approaches increase not only the Journal’s social media presence but also its public face. Our efforts in social media were trendsetting in peer-reviewed literature, and the Editors who lead those efforts—Vineet Arora and Charlie Wray—are asked to consult for other journals regularly.
We launched two new series— Choosing Wisely®: Next Steps, and Choosing Wisely®: Things We Do For No Reason—with help from the ABIM Foundation and visionary Editors, Andy Masica, Ann Sheehy, and Lenny Feldman. These papers have pushed Hospitalists and Hospital Medicine to think carefully about the simple things we do every day, to think broadly about how to move past the initial ‘low-hanging fruit’ of value improvement, and point us towards policy and intervention approaches that are disruptive rather than incremental.
A special thank you to Som Mookherjee, Brian Harte, Dan Hunt, and Read Pierce who ably developed the Clinical Care Conundrums and Review series. They are assisted by teams of national correspondents and many contributors who’ve submitted work for those series.
I have been blessed by a team of more than a dozen Associate Editors who have ably, expeditiously, and collegially managed more than 2,000 papers. These Editors work out of a sense of altruism and commitment to Hospital Medicine and have made huge individual contributions to JHM through their reviewing expertise and ensuring that the editorial sense for JHM is as broad and innovative as our field.
Finally, I must thank my core team of Senior Deputy Editors who have shouldered the majority of editorial work, mentored Editors (including me) and Peer Reviewers, and provided strategic guidance.
How peer-reviewed journals are published is changing rapidly. Setting aside the questions of how we consume our medical literature and the transition from paper to digital, old financial models depending on subscriptions and advertising are either dying or evolving into something very different. The challenge is that the new model is very unclear and the old model based on ads and subscriptions is clearly nonviable but is the primary way to support the work of producing a journal. Moving from the current model to one based on clicks, views, or downloads will come down to who will derive benefit from those clicks/downloads, who will be willing to pay to read and learn from the work of authors, or who views that activity as being worthy enough advertise somewhere in that process or to monetize the data garnered from readers’ activities. In addition, many journals, including JHM, are supported by professional societies. While professional societies have a goal to serve their members, the goal of the peer-reviewed journal is to independently and broadly represent the field. One must reflect the other, but space between the two will always be required.
The speed with which research takes place is too slow, and the process of getting evidence into print (much less adopted) is even slower. But, this too is changing; the role of peer review and the publication process is evolving. In order to speed the potential discovery of new innovations, prepublication repositories (such as BioRxViv) are gaining popularity; well-publicized scandals around peer reviewing rings 1 have not gone unnoticed, and have produced greater interest in using prepublication comments and online discussions as early forms of review. As a result, the disintermediation between scientist and ‘evidence’ is paralleling the disintermediation between events and messengers elsewhere. One need only review Twitter for a moment to get a sense for how crowdsourcing can lead to evidence (or news) generation for good or ill. I agree that while the end of journals (as we understand them now) is upon us, these are also opportunities for JHM as it enters its new phase and a place for leadership. 2
I am proud of what we have done at JHM in the last seven years. We have grown substantially. We have innovated and provided great service to our authors and the field of Hospital Medicine. Our growth and forward-looking approaches to social media and our digital footprint put the journal on a great path towards adapting to the trends in Hospital Medicine research and peer-reviewed publishing. Our focus on being doctors who care for patients and our teams—not just doctors who care for hospitals—is supporting the field and our practice. I look forward to seeing where JHM goes next.
1. Retraction Watch. BioMedCentral retracting 43 papers for fake peer reviews. March 26, 2015; http://retractionwatch.com/2015/03/26/biomed-central-retracting-43-papers-for-fake-peer-review/. Accessed November 12, 2018.
2. Krumholz HM. The End of Journals. Circ Cardiovasc Qual Outcomes. 2015;8(6):533-534. doi: 10.1161/CIRCOUTCOMES.115.002415. PubMed
After seven years at the helm of the Journal of Hospital Medicine, I am both pleased to hand over the reins and sad to let them go. My time as Editor in Chief has been wonderful, challenging, and fulfilling.
When I began my tenure, JHM managed approximately 350 papers annually, and published 10 times per year. We had no social media presence, a developing editorial sense (and developing Editor in Chief), and a pool of hard-working and passionate Editors. As of this year, we have handled more than 700 papers and are publishing content monthly, online only, and online first. Our dedicated team is deeply passionate about making every paper better through interaction with the authors—whether we accept it for publication or not.
JHM has added a presence on Facebook and Twitter, launched a Twitter Journal Club as a regular offering (#JHMChat), added visual abstracts to our Tweets and Facebook postings, and researched how these novel approaches increase not only the Journal’s social media presence but also its public face. Our efforts in social media were trendsetting in peer-reviewed literature, and the Editors who lead those efforts—Vineet Arora and Charlie Wray—are asked to consult for other journals regularly.
We launched two new series— Choosing Wisely®: Next Steps, and Choosing Wisely®: Things We Do For No Reason—with help from the ABIM Foundation and visionary Editors, Andy Masica, Ann Sheehy, and Lenny Feldman. These papers have pushed Hospitalists and Hospital Medicine to think carefully about the simple things we do every day, to think broadly about how to move past the initial ‘low-hanging fruit’ of value improvement, and point us towards policy and intervention approaches that are disruptive rather than incremental.
A special thank you to Som Mookherjee, Brian Harte, Dan Hunt, and Read Pierce who ably developed the Clinical Care Conundrums and Review series. They are assisted by teams of national correspondents and many contributors who’ve submitted work for those series.
I have been blessed by a team of more than a dozen Associate Editors who have ably, expeditiously, and collegially managed more than 2,000 papers. These Editors work out of a sense of altruism and commitment to Hospital Medicine and have made huge individual contributions to JHM through their reviewing expertise and ensuring that the editorial sense for JHM is as broad and innovative as our field.
Finally, I must thank my core team of Senior Deputy Editors who have shouldered the majority of editorial work, mentored Editors (including me) and Peer Reviewers, and provided strategic guidance.
How peer-reviewed journals are published is changing rapidly. Setting aside the questions of how we consume our medical literature and the transition from paper to digital, old financial models depending on subscriptions and advertising are either dying or evolving into something very different. The challenge is that the new model is very unclear and the old model based on ads and subscriptions is clearly nonviable but is the primary way to support the work of producing a journal. Moving from the current model to one based on clicks, views, or downloads will come down to who will derive benefit from those clicks/downloads, who will be willing to pay to read and learn from the work of authors, or who views that activity as being worthy enough advertise somewhere in that process or to monetize the data garnered from readers’ activities. In addition, many journals, including JHM, are supported by professional societies. While professional societies have a goal to serve their members, the goal of the peer-reviewed journal is to independently and broadly represent the field. One must reflect the other, but space between the two will always be required.
The speed with which research takes place is too slow, and the process of getting evidence into print (much less adopted) is even slower. But, this too is changing; the role of peer review and the publication process is evolving. In order to speed the potential discovery of new innovations, prepublication repositories (such as BioRxViv) are gaining popularity; well-publicized scandals around peer reviewing rings 1 have not gone unnoticed, and have produced greater interest in using prepublication comments and online discussions as early forms of review. As a result, the disintermediation between scientist and ‘evidence’ is paralleling the disintermediation between events and messengers elsewhere. One need only review Twitter for a moment to get a sense for how crowdsourcing can lead to evidence (or news) generation for good or ill. I agree that while the end of journals (as we understand them now) is upon us, these are also opportunities for JHM as it enters its new phase and a place for leadership. 2
I am proud of what we have done at JHM in the last seven years. We have grown substantially. We have innovated and provided great service to our authors and the field of Hospital Medicine. Our growth and forward-looking approaches to social media and our digital footprint put the journal on a great path towards adapting to the trends in Hospital Medicine research and peer-reviewed publishing. Our focus on being doctors who care for patients and our teams—not just doctors who care for hospitals—is supporting the field and our practice. I look forward to seeing where JHM goes next.
1. Retraction Watch. BioMedCentral retracting 43 papers for fake peer reviews. March 26, 2015; http://retractionwatch.com/2015/03/26/biomed-central-retracting-43-papers-for-fake-peer-review/. Accessed November 12, 2018.
2. Krumholz HM. The End of Journals. Circ Cardiovasc Qual Outcomes. 2015;8(6):533-534. doi: 10.1161/CIRCOUTCOMES.115.002415. PubMed
© 2018 Society of Hospital Medicine
Estimating the Accuracy of Dobutamine Stress Echocardiography and Single-Photon Emission Computed Tomography among Patients Undergoing Noncardiac Surgery
Cardiac complications account for at least one-third of perioperative deaths, and lead to substantial morbidity and cost.1-4 Current guidelines recommend that patients undergo assessment of cardiac risk and functional status prior to noncardiac surgery.5 Preoperative cardiac stress testing is recommended for patients whose predicted cardiac risk exceeds 1%, whose functional status is limited, and for whom testing may change management.5
However, patients are not specifically selected according to risk of coronary artery disease (CAD) in current guidelines. The pretest probability of CAD may vary widely in this patient population, and the resultant accuracy of cardiac stress testing in making the diagnosis of CAD may vary as well.5 Meanwhile, CAD is a clear risk factor for perioperative cardiac events.6-8
Because the pretest probability of CAD is heterogeneous, the optimal modality of cardiac stress testing in this population is unclear. False-positive results would likely lead to inflated estimates of operative risk, expensive and high-risk downstream testing, and potentially cancellation of otherwise beneficial surgeries. Meanwhile, false-negative results would lead to overly optimistic estimates of surgical risk and potentially to surgical intervention at higher levels of risk than would be desirable. Current guidelines leave the selection of either dobutamine stress echocardiography (DSE) or pharmacological stress myocardial perfusion imaging to the clinician.5 To inform decisions regarding the selection of cardiac stress testing modality prior to noncardiac surgery, we conducted this study to estimate the diagnostic accuracy of DSE and single-photon emission computed tomography (SPECT) among this patient population.
METHODS
Surgical Cohort
The American College of Surgeons’ National Surgical Quality Improvement Program (NSQIP) samples patients undergoing surgery at participating hospitals and collects standardized clinical data on preoperative risk factors and postoperative complications.9 We acquired public use data from the 2009 NSQIP cohort, which included more than 336,000 surgical cases from 237 hospitals (principally in the United States). We excluded from our analysis patients undergoing cardiac surgery, patients with a prior diagnosis of CAD, and patients undergoing experimental surgeries. This left a sample of 300,462 for analysis.
Prediction of Dyslipidemia
The model we used to predict the presence of obstructive CAD required the presence or absence of dyslipidemia. A number of variables are common to both NSQIP and the National Health and Nutrition Examination Survey (NHANES), including age, weight, sex, tobacco use, diabetes, and prior stroke.10 Using those common variables, we developed a logistic regression to predict a diagnosis of dyslipidemia, applied that regression to the NSQIP cohort, and dichotomized. To assess the potential impact of misclassification, we performed separate sensitivity analyses in which either no patients or all patients had dyslipidemia.
Prediction of Obstructive CAD
To estimate the probability of obstructive CAD, we applied the risk prediction tool currently recommended by the European Society of Cardiology.11 The clinical version of this tool relies on age; sex; diagnoses of diabetes, hypertension, and dyslipidemia; active tobacco use; and chest pain characteristics to predict the probability of obstructive CAD on coronary angiography. We assumed that all patients in our cohort had nonspecific chest pain, the referent in the calculator.
Prediction of Perioperative Event Risk
To predict the probability of a perioperative cardiac event, we used the Myocardial Infarction or Cardiac Arrest (MICA) calculator, which was derived from an earlier cohort of NSQIP.12 All variables required for this prediction tool were included in the 2009 NSQIP cohort; our categorization of surgeries is included as an online appendix. MICA is one of three prediction tools included in the current American College of Cardiology/American Heart Association (ACC/AHA) guidelines.5
Prediction of Test Accuracy
We searched the MEDLINE database for estimates of the test characteristics of DSE and SPECT that adjusted for workup bias.13 (Also known as sequential-ordering bias, here we refer to the phenomenon whereby further workup is based on the results of diagnostic testing, resulting in underdiagnosis among patients with negative tests and falsely high estimates of sensitivity.14) Although other modalities of myocardial perfusion imaging exist, SPECT appears to be the most widely available, utilized, and studied modality of MPI.15 Our search strategy paired (“Sensitivity and Specificity” [MeSH Terms] AND “Coronary Disease/diagnostic imaging” [MAJR] AND “bias” [TIAB]) with (“Tomography, Emission-Computed, Single-Photon” [MAJR] OR “Echocardiography, Stress” [MAJR]). We reviewed the results for sensitivity and specificity estimates that corrected for workup bias. For each of SPECT and DSE, we drew the sensitivity and specificity from normal distributions based on literature estimates (see Table). We then calculated the expected accuracy of each modality for each patient in our dataset. All analyses were performed in Stata (version 14, College Station, Texas).
RESULTS
The median predicted probability of obstructive CAD was
Both accuracy and PPV were higher for DSE than for SPECT. The predicted accuracy of DSE was greater than that of SPECT in 73.5% of cases overall and in 60.5% of cases with a predicted operative cardiac risk greater than 1%. The mean PPV of DSE was 32.9% (median: 26.7%), while the equivalent PPVs for SPECT were 14.1% and 8.2%, respectively. Among cases with a predicted operative cardiac risk greater than 1%, the mean PPV of DSE was 57.5% (median: 60.2%), while the equivalent PPVs for SPECT were 29.8% and 26.7%, respectively.
DSE had a mean predicted accuracy of 93.0% (median: 96.2%), while SPECT had a mean accuracy of 92.6% (median: 95.6%). The predicted accuracies of DSE and SPECT are shown in the Figure, stratified by predicted perioperative risk across the 1% risk threshold currently used by ACC/AHA guidelines.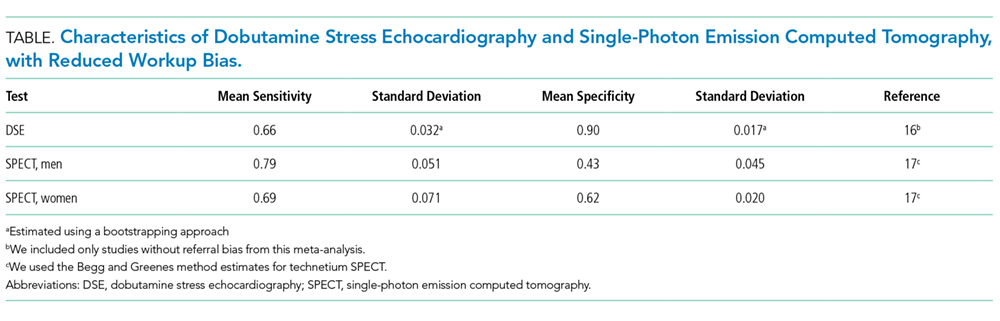
In our sensitivity analyses, dyslipidemia had little effect on the comparative accuracy. If no patients had dyslipidemia, DSE would have a higher accuracy than SPECT in 75.7% of cases. If all patients had dyslipidemia, DSE would have a higher predicted accuracy than SPECT in 72.8% of cases. For patients with an operative cardiac risk greater than 1%, the predicted accuracies were 65.0% and 59.4%, respectively.
DISCUSSION
In this study, we demonstrated that the expected accuracy of DSE in the diagnosis of obstructive CAD among patients undergoing noncardiac surgery is higher than that of SPECT. This finding was true in both unselected patients and those selected by a perioperative risk of greater than 1%. The use of SPECT, compared with DSE, would likely result in greater numbers of false-positive tests in this patient population and less accurate results overall.
Cardiac stress testing, as with any diagnostic test, is most useful at intermediate probabilities. Insofar as stress testing offers diagnostic value, our analysis suggests that, in the range of the predicted risk of CAD found in patients undergoing noncardiac surgery, DSE is a more efficient testing strategy. To the extent that making a diagnosis of CAD informs the decision to proceed to surgery, a more accurate test would be preferable. The lower cost of DSE, the lack of ionizing radiation, and the information provided by echocardiography regarding diagnoses other than CAD, if considered, would further amplify that preference.
However, it is important to note that both modalities have limited positive predictive value. In the median patient who meets the currently recommended 1% perioperative event risk threshold, SPECT would lead to 2.74 false positive results for every true positive result. DSE would produce approximately two false positive results for every three true positive results. If lower rates of false-positive testing are desired, different patient selection criteria are required.
A few key limitations of this work warrant discussion. First, our results likely overestimate the probability of obstructive CAD in this population. We assumed that all patients have nonspecific chest pain at the time of the preoperative evaluation, though many patients do not, in fact, have chest pain. Tools to estimate the pretest probability of CAD (such as the ESC tool that we used or the older Diamond-Forrester prediction) are intended to stratify higher-risk patients than are seen in a preoperative setting. If asymptomatic patients seen in preoperative risk assessment clinics have lower risk of CAD than what we have predicted, we will have understated the case for DSE. Moreover, cases sampled from hospitals participating in NSQIP are not representative of the national surgical population. This likely further inflates our estimates of CAD risk compared with the “true” surgical population. Finally, we cannot comment on current practice from these data. Current guidelines recommend preoperative cardiac stress testing for patients whose risk of a perioperative cardiac event exceeds 1%, whose functional status is poor or unknown, and only if said testing will change management.5 Using these data, we cannot determine the pretest probability of patients referred for stress testing before noncardiac surgery.
Still, this analysis suggests that, among patients undergoing noncardiac surgery, selecting patients according to the risk of perioperative events would result in a population at an overall comparatively low risk of CAD, and that in this population, DSE would be more accurate than SPECT for making the diagnosis of CAD. If a diagnosis of CAD would change the decision to proceed to surgery, DSE is likely to be a more efficient test than SPECT.
Acknowledgements
The authors would like to thank Wael Jaber, MD, for his thoughtful comments on a draft of this manuscript.
Disclosures
The authors have nothing to disclose.
Funding
The authors received no specific funding for this work.
1. Devereaux PJ, Xavier D, Pogue J, et al. Characteristics and short-term prognosis of perioperative myocardial infarction in patients undergoing noncardiac surgery: a cohort study. Ann Intern Med. 2011;154(8):523-528. doi: 10.7326/0003-4819-154-8-201104190-00003. PubMed
2. Udeh BL, Dalton JE, Hata JS, Udeh CI, Sessler DI. Economic trends from 2003 to 2010 for perioperative myocardial infarction: a retrospective, cohort study. Anesthesiology. 2014;121(1):36-45. doi: 10.1097/ALN.0000000000000233. PubMed
3. van Waes JAR, Nathoe HM, de Graaff JC, et al. Myocardial injury after noncardiac surgery and its association with short-term mortality. Circulation. 2013;127(23):2264-2271. doi: 10.1161/CIRCULATIONAHA.113.002128. PubMed
4. Wijeysundera DN, Beattie WS, Austin PC, Hux JE, Laupacis A. Non-invasive cardiac stress testing before elective major non-cardiac surgery: population based cohort study. BMJ. 2010;340(jan28 3):b5526-b5526. doi: 10.1136/bmj.b5526. PubMed
5. Fleisher LA, Fleischmann KE, Auerbach AD, et al. 2014 ACC/AHA Guideline on Perioperative Cardiovascular Evaluation and Management of Patients Undergoing Noncardiac Surgery. J Am Coll Cardiol. 2014;64(22):e77-e137. doi: 10.1016/j.jacc.2014.07.944. PubMed
6. Goldman L, Caldera DL, Nussbaum SR, et al. Multifactorial index of cardiac risk in noncardiac surgical procedures. N Engl J Med. 1977;297(16):845-850. doi:10.1056/NEJM197710202971601. PubMed
7. Devereaux PJ, Sessler DI. Cardiac Complications in patients undergoing major noncardiac surgery. N Engl J Med. 2015;373(23):2258-2269. doi:10.1056/NEJMra1502824. PubMed
8. Lee TH, Marcantonio ER, Mangione CM, et al. Derivation and prospective validation of a simple index for prediction of cardiac risk of major noncardiac surgery. Circulation. 1999;100(10):1043-1049. doi: 10.1161/01.CIR.100.10.1043. PubMed
9. Cohen ME, Ko CY, Bilimoria KY, et al. Optimizing ACS NSQIP modeling for evaluation of surgical quality and risk: patient risk adjustment, procedure mix adjustment, shrinkage adjustment, and surgical focus. J Am Coll Surg. 2013;217(2):336-46.e1. doi: 10.1016/j.jamcollsurg.2013.02.027. PubMed
10. National Health and Nutrition Examination Survey Data. https://wwwn.cdc.gov/nchs/nhanes/continuousnhanes/default.aspx?BeginYear=2011. Accessed April 20, 2018.
11. Genders TSS, Steyerberg EW, Hunink MGM, et al. Prediction model to estimate presence of coronary artery disease: retrospective pooled analysis of existing cohorts. BMJ. 2012;344:e3485. doi: 10.1136/bmj.e3485. PubMed
12. Gupta PK, Gupta H, Sundaram A, et al. Development and validation of a risk calculator for prediction of cardiac risk after surgery. Circulation. 2011;124(4):381-387. doi: 10.1161/CIRCULATIONAHA.110.015701. PubMed
13. Blackstone EH, Lauer MS. Caveat emptor: the treachery of work-up bias. J Thorac Cardiovasc Surg. 2004;128(3):341-344. doi: 10.1016/j.jtcvs.2004.03.039. PubMed
14. Ransohoff DF, Feinstein AR. Problems of spectrum and bias in evaluating the efficacy of diagnostic tests. N Engl J Med. 1978;299(17):926-930. doi: 10.1056/NEJM197810262991705. PubMed
15. Jaarsma C, Leiner T, Bekkers SC, et al. Diagnostic performance of noninvasive myocardial perfusion imaging using single-photon emission computed tomography, cardiac magnetic resonance, and positron emission tomography imaging for the detection of obstructive coronary artery disease: a meta-analysis. J Am Coll Cardiol. 2012;59(19):1719-1728. doi: 10.1016/j.jacc.2011.12.040. PubMed
16. Geleijnse ML, Krenning BJ, Soliman OII, Nemes A, Galema TW, Cate ten FJ. Dobutamine stress echocardiography for the detection of coronary artery disease in women. Am J Cardiol. 2007;99(5):714-717. doi: 10.1016/j.amjcard.2006.09.124. PubMed
17. Miller TD, Hodge DO, Christian TF, Milavetz JJ, Bailey KR, Gibbons RJ. Effects of adjustment for referral bias on the sensitivity and specificity of single photon emission computed tomography for the diagnosis of coronary artery disease. Am J Med. 2002;112(4):290-297. doi: 10.1016/S0002-9343(01)01111-1. PubMed
Cardiac complications account for at least one-third of perioperative deaths, and lead to substantial morbidity and cost.1-4 Current guidelines recommend that patients undergo assessment of cardiac risk and functional status prior to noncardiac surgery.5 Preoperative cardiac stress testing is recommended for patients whose predicted cardiac risk exceeds 1%, whose functional status is limited, and for whom testing may change management.5
However, patients are not specifically selected according to risk of coronary artery disease (CAD) in current guidelines. The pretest probability of CAD may vary widely in this patient population, and the resultant accuracy of cardiac stress testing in making the diagnosis of CAD may vary as well.5 Meanwhile, CAD is a clear risk factor for perioperative cardiac events.6-8
Because the pretest probability of CAD is heterogeneous, the optimal modality of cardiac stress testing in this population is unclear. False-positive results would likely lead to inflated estimates of operative risk, expensive and high-risk downstream testing, and potentially cancellation of otherwise beneficial surgeries. Meanwhile, false-negative results would lead to overly optimistic estimates of surgical risk and potentially to surgical intervention at higher levels of risk than would be desirable. Current guidelines leave the selection of either dobutamine stress echocardiography (DSE) or pharmacological stress myocardial perfusion imaging to the clinician.5 To inform decisions regarding the selection of cardiac stress testing modality prior to noncardiac surgery, we conducted this study to estimate the diagnostic accuracy of DSE and single-photon emission computed tomography (SPECT) among this patient population.
METHODS
Surgical Cohort
The American College of Surgeons’ National Surgical Quality Improvement Program (NSQIP) samples patients undergoing surgery at participating hospitals and collects standardized clinical data on preoperative risk factors and postoperative complications.9 We acquired public use data from the 2009 NSQIP cohort, which included more than 336,000 surgical cases from 237 hospitals (principally in the United States). We excluded from our analysis patients undergoing cardiac surgery, patients with a prior diagnosis of CAD, and patients undergoing experimental surgeries. This left a sample of 300,462 for analysis.
Prediction of Dyslipidemia
The model we used to predict the presence of obstructive CAD required the presence or absence of dyslipidemia. A number of variables are common to both NSQIP and the National Health and Nutrition Examination Survey (NHANES), including age, weight, sex, tobacco use, diabetes, and prior stroke.10 Using those common variables, we developed a logistic regression to predict a diagnosis of dyslipidemia, applied that regression to the NSQIP cohort, and dichotomized. To assess the potential impact of misclassification, we performed separate sensitivity analyses in which either no patients or all patients had dyslipidemia.
Prediction of Obstructive CAD
To estimate the probability of obstructive CAD, we applied the risk prediction tool currently recommended by the European Society of Cardiology.11 The clinical version of this tool relies on age; sex; diagnoses of diabetes, hypertension, and dyslipidemia; active tobacco use; and chest pain characteristics to predict the probability of obstructive CAD on coronary angiography. We assumed that all patients in our cohort had nonspecific chest pain, the referent in the calculator.
Prediction of Perioperative Event Risk
To predict the probability of a perioperative cardiac event, we used the Myocardial Infarction or Cardiac Arrest (MICA) calculator, which was derived from an earlier cohort of NSQIP.12 All variables required for this prediction tool were included in the 2009 NSQIP cohort; our categorization of surgeries is included as an online appendix. MICA is one of three prediction tools included in the current American College of Cardiology/American Heart Association (ACC/AHA) guidelines.5
Prediction of Test Accuracy
We searched the MEDLINE database for estimates of the test characteristics of DSE and SPECT that adjusted for workup bias.13 (Also known as sequential-ordering bias, here we refer to the phenomenon whereby further workup is based on the results of diagnostic testing, resulting in underdiagnosis among patients with negative tests and falsely high estimates of sensitivity.14) Although other modalities of myocardial perfusion imaging exist, SPECT appears to be the most widely available, utilized, and studied modality of MPI.15 Our search strategy paired (“Sensitivity and Specificity” [MeSH Terms] AND “Coronary Disease/diagnostic imaging” [MAJR] AND “bias” [TIAB]) with (“Tomography, Emission-Computed, Single-Photon” [MAJR] OR “Echocardiography, Stress” [MAJR]). We reviewed the results for sensitivity and specificity estimates that corrected for workup bias. For each of SPECT and DSE, we drew the sensitivity and specificity from normal distributions based on literature estimates (see Table). We then calculated the expected accuracy of each modality for each patient in our dataset. All analyses were performed in Stata (version 14, College Station, Texas).
RESULTS
The median predicted probability of obstructive CAD was
Both accuracy and PPV were higher for DSE than for SPECT. The predicted accuracy of DSE was greater than that of SPECT in 73.5% of cases overall and in 60.5% of cases with a predicted operative cardiac risk greater than 1%. The mean PPV of DSE was 32.9% (median: 26.7%), while the equivalent PPVs for SPECT were 14.1% and 8.2%, respectively. Among cases with a predicted operative cardiac risk greater than 1%, the mean PPV of DSE was 57.5% (median: 60.2%), while the equivalent PPVs for SPECT were 29.8% and 26.7%, respectively.
DSE had a mean predicted accuracy of 93.0% (median: 96.2%), while SPECT had a mean accuracy of 92.6% (median: 95.6%). The predicted accuracies of DSE and SPECT are shown in the Figure, stratified by predicted perioperative risk across the 1% risk threshold currently used by ACC/AHA guidelines.
In our sensitivity analyses, dyslipidemia had little effect on the comparative accuracy. If no patients had dyslipidemia, DSE would have a higher accuracy than SPECT in 75.7% of cases. If all patients had dyslipidemia, DSE would have a higher predicted accuracy than SPECT in 72.8% of cases. For patients with an operative cardiac risk greater than 1%, the predicted accuracies were 65.0% and 59.4%, respectively.
DISCUSSION
In this study, we demonstrated that the expected accuracy of DSE in the diagnosis of obstructive CAD among patients undergoing noncardiac surgery is higher than that of SPECT. This finding was true in both unselected patients and those selected by a perioperative risk of greater than 1%. The use of SPECT, compared with DSE, would likely result in greater numbers of false-positive tests in this patient population and less accurate results overall.
Cardiac stress testing, as with any diagnostic test, is most useful at intermediate probabilities. Insofar as stress testing offers diagnostic value, our analysis suggests that, in the range of the predicted risk of CAD found in patients undergoing noncardiac surgery, DSE is a more efficient testing strategy. To the extent that making a diagnosis of CAD informs the decision to proceed to surgery, a more accurate test would be preferable. The lower cost of DSE, the lack of ionizing radiation, and the information provided by echocardiography regarding diagnoses other than CAD, if considered, would further amplify that preference.
However, it is important to note that both modalities have limited positive predictive value. In the median patient who meets the currently recommended 1% perioperative event risk threshold, SPECT would lead to 2.74 false positive results for every true positive result. DSE would produce approximately two false positive results for every three true positive results. If lower rates of false-positive testing are desired, different patient selection criteria are required.
A few key limitations of this work warrant discussion. First, our results likely overestimate the probability of obstructive CAD in this population. We assumed that all patients have nonspecific chest pain at the time of the preoperative evaluation, though many patients do not, in fact, have chest pain. Tools to estimate the pretest probability of CAD (such as the ESC tool that we used or the older Diamond-Forrester prediction) are intended to stratify higher-risk patients than are seen in a preoperative setting. If asymptomatic patients seen in preoperative risk assessment clinics have lower risk of CAD than what we have predicted, we will have understated the case for DSE. Moreover, cases sampled from hospitals participating in NSQIP are not representative of the national surgical population. This likely further inflates our estimates of CAD risk compared with the “true” surgical population. Finally, we cannot comment on current practice from these data. Current guidelines recommend preoperative cardiac stress testing for patients whose risk of a perioperative cardiac event exceeds 1%, whose functional status is poor or unknown, and only if said testing will change management.5 Using these data, we cannot determine the pretest probability of patients referred for stress testing before noncardiac surgery.
Still, this analysis suggests that, among patients undergoing noncardiac surgery, selecting patients according to the risk of perioperative events would result in a population at an overall comparatively low risk of CAD, and that in this population, DSE would be more accurate than SPECT for making the diagnosis of CAD. If a diagnosis of CAD would change the decision to proceed to surgery, DSE is likely to be a more efficient test than SPECT.
Acknowledgements
The authors would like to thank Wael Jaber, MD, for his thoughtful comments on a draft of this manuscript.
Disclosures
The authors have nothing to disclose.
Funding
The authors received no specific funding for this work.
1. Devereaux PJ, Xavier D, Pogue J, et al. Characteristics and short-term prognosis of perioperative myocardial infarction in patients undergoing noncardiac surgery: a cohort study. Ann Intern Med. 2011;154(8):523-528. doi: 10.7326/0003-4819-154-8-201104190-00003. PubMed
2. Udeh BL, Dalton JE, Hata JS, Udeh CI, Sessler DI. Economic trends from 2003 to 2010 for perioperative myocardial infarction: a retrospective, cohort study. Anesthesiology. 2014;121(1):36-45. doi: 10.1097/ALN.0000000000000233. PubMed
3. van Waes JAR, Nathoe HM, de Graaff JC, et al. Myocardial injury after noncardiac surgery and its association with short-term mortality. Circulation. 2013;127(23):2264-2271. doi: 10.1161/CIRCULATIONAHA.113.002128. PubMed
4. Wijeysundera DN, Beattie WS, Austin PC, Hux JE, Laupacis A. Non-invasive cardiac stress testing before elective major non-cardiac surgery: population based cohort study. BMJ. 2010;340(jan28 3):b5526-b5526. doi: 10.1136/bmj.b5526. PubMed
5. Fleisher LA, Fleischmann KE, Auerbach AD, et al. 2014 ACC/AHA Guideline on Perioperative Cardiovascular Evaluation and Management of Patients Undergoing Noncardiac Surgery. J Am Coll Cardiol. 2014;64(22):e77-e137. doi: 10.1016/j.jacc.2014.07.944. PubMed
6. Goldman L, Caldera DL, Nussbaum SR, et al. Multifactorial index of cardiac risk in noncardiac surgical procedures. N Engl J Med. 1977;297(16):845-850. doi:10.1056/NEJM197710202971601. PubMed
7. Devereaux PJ, Sessler DI. Cardiac Complications in patients undergoing major noncardiac surgery. N Engl J Med. 2015;373(23):2258-2269. doi:10.1056/NEJMra1502824. PubMed
8. Lee TH, Marcantonio ER, Mangione CM, et al. Derivation and prospective validation of a simple index for prediction of cardiac risk of major noncardiac surgery. Circulation. 1999;100(10):1043-1049. doi: 10.1161/01.CIR.100.10.1043. PubMed
9. Cohen ME, Ko CY, Bilimoria KY, et al. Optimizing ACS NSQIP modeling for evaluation of surgical quality and risk: patient risk adjustment, procedure mix adjustment, shrinkage adjustment, and surgical focus. J Am Coll Surg. 2013;217(2):336-46.e1. doi: 10.1016/j.jamcollsurg.2013.02.027. PubMed
10. National Health and Nutrition Examination Survey Data. https://wwwn.cdc.gov/nchs/nhanes/continuousnhanes/default.aspx?BeginYear=2011. Accessed April 20, 2018.
11. Genders TSS, Steyerberg EW, Hunink MGM, et al. Prediction model to estimate presence of coronary artery disease: retrospective pooled analysis of existing cohorts. BMJ. 2012;344:e3485. doi: 10.1136/bmj.e3485. PubMed
12. Gupta PK, Gupta H, Sundaram A, et al. Development and validation of a risk calculator for prediction of cardiac risk after surgery. Circulation. 2011;124(4):381-387. doi: 10.1161/CIRCULATIONAHA.110.015701. PubMed
13. Blackstone EH, Lauer MS. Caveat emptor: the treachery of work-up bias. J Thorac Cardiovasc Surg. 2004;128(3):341-344. doi: 10.1016/j.jtcvs.2004.03.039. PubMed
14. Ransohoff DF, Feinstein AR. Problems of spectrum and bias in evaluating the efficacy of diagnostic tests. N Engl J Med. 1978;299(17):926-930. doi: 10.1056/NEJM197810262991705. PubMed
15. Jaarsma C, Leiner T, Bekkers SC, et al. Diagnostic performance of noninvasive myocardial perfusion imaging using single-photon emission computed tomography, cardiac magnetic resonance, and positron emission tomography imaging for the detection of obstructive coronary artery disease: a meta-analysis. J Am Coll Cardiol. 2012;59(19):1719-1728. doi: 10.1016/j.jacc.2011.12.040. PubMed
16. Geleijnse ML, Krenning BJ, Soliman OII, Nemes A, Galema TW, Cate ten FJ. Dobutamine stress echocardiography for the detection of coronary artery disease in women. Am J Cardiol. 2007;99(5):714-717. doi: 10.1016/j.amjcard.2006.09.124. PubMed
17. Miller TD, Hodge DO, Christian TF, Milavetz JJ, Bailey KR, Gibbons RJ. Effects of adjustment for referral bias on the sensitivity and specificity of single photon emission computed tomography for the diagnosis of coronary artery disease. Am J Med. 2002;112(4):290-297. doi: 10.1016/S0002-9343(01)01111-1. PubMed
© 2018 Society of Hospital Medicine
The Adoption of an Online Journal Club to Improve Research Dissemination and Social Media Engagement Among Hospitalists
Clinicians, educators, and medical journals are increasingly using the social media outlet, Twitter, as a medium to connect and engage with their colleagues. In particular, online journal clubs have created a space for the timely discussion of research, creation of online communities, and dissemination of research.
Social media-based journal clubs are thought to be one way in which journals can leverage the power of social networks so that researchers can engage with a diverse range of end users4 (including bedside clinicians, administrators, and patients). Several examples of these models exist. For example, #GeriMedJC acts as a complimentary, synchronous chat that takes place at the same time as a live, in-person journal club. #NephJC offers multiple 1-hour chats per month and provides an in-depth summary and analysis of each article, while #UroJC is an asynchronous discussion that takes place over 48 hours. Few data exist to describe whether any of these programs produce measurable improvements in indicators of engagement or dissemination of results.
In 2015, the Journal of Hospital Medicine (JHM) began producing a Twitter-based journal club as a means to connect and engage the Hospital Medicine community and allow for discussion and rapid exchange of information and opinions around a specific clinical topic. This study aims to describe the implementation of the first Journal-sponsored, Twitter-based online journal club and ascertain its impact on both Twitter and journal metrics.
METHODS
#JHMChat was launched in October 2015, and was initially held every 2-3 months until January 2017, when chats began to take place monthly. Each 1-hour chat focused on a recently published article in JHM, was moderated by a JHM social media editor (C.M.W., V.M.A.), and included at least 1 study author or guest expert. Articles were chosen by the social media editors based on the following criteria: (1) attractiveness to possible participants, (2) providing topic variety within the journal club series, and (3) sustainability and topic conduciveness to the online chat model. Chats were held at 9 PM EST in order to engage hospitalists across all US time zones and on different days to accommodate authors’ availability. All sessions were framed by 3-4 questions intended to encourage discussion and presented to chat participants at spaced intervals so as to stimulate a current of responses.
Chats were promoted by way of the JHM (@JHospMedicine, 3400 followers) and Society of Hospital Medicine (SHM; @SHMLive, 5800 followers) Twitter feeds beginning 1 month prior to each session. Visual Abstracts5,6 were used to publicize the sessions, also via Twitter, starting in February 2017.
Continuing Medical Education (CME) credits were offered through the SHM to registered participants, starting in July 2016.7 All sessions were cosponsored by the American Board of Internal Medicine (ABIM) Foundation and the Costs of Care Organization, a non-profit organization aimed at improving healthcare value.
Twitter Metrics
After each session, the following Twitter-based engagement metrics were obtained using the Symplur© Healthcare Hashtag project;8 total number of participants and tweets, tweets/participant, and total impressions (calculated as the number of tweets from each participant multiplied by the number of followers that participant currently had then summed up for all participants). Simply put, impressions can also be thought of as the number of times a single Tweet makes it into someone else’s Twitter feed. So as to avoid artificially inflated metrics, all were obtained 2 hours after the end of the journal club. Participants were defined as anyone who posted an original tweet or retweeted during the session and were encouraged to tag their tweets with the hashtag #JHMChat for post-discussion indexing and measurement. Because authors’ or guests’ popularity on Twitter may influence participation rates, we also assessed the number of followers for each participating author. Spearman’s rank correlation was calculated (Microsoft ExcelTM) where appropriate.
Altmetrics and Page Views
As a means to measure exposure and dissemination external to Twitter, we assessed the change (“Delta”) in the each article’s Altmetric score9, a digital-based metric that quantifies the attention received by a scientific publication on various online platforms including news, blogs, and social media. Delta Altmetric scores were calculated as the difference between the scores on the day of the session and 2 weeks after the respective session, with higher scores indicating greater global online discussion. By measuring the Altmetric score on the day of the discussion, we established a baseline score for comparison purposes. Additionally, this allowed us to better attribute any changes that may have occurred to the discussion itself.
Additionally, using information provided by the journal publisher (John Wiley & Sons Publishing) in 2016, we assessed the effect of #JHMChat on the number of article page views on the JHM website relative to the release of the electronic Table of Contents (eTOC). The eTOC release was chosen as it is historically associated with a high number of page views. In order to isolate the effect of #JHMChat, we only reviewed months in which #JHMChat was not held within 3 days of the eTOC release. Because JHM changed publishers in January 2017, we only assessed page view data on 2016 sessions, as the new publisher lacked enhanced search optimization to obtain these data.
Thematic Analysis
In addition to the above measurements, a thematic analysis of each article was conducted to assess any common themes that would influence our chosen metrics. Themes were assessed and ascribed by one author (C.M.W.) and verified by another (V.M.A.).
Participant and Author Experience
To assess the participant experience, responses to a post-session CME questionnaire that assessed (1) overall quality, (2) comprehensiveness of the discussion, (3) whether the participant would recommend the chat to a colleague, and (4) whether participation would lead to practice-changing measures were reviewed. Registration of each session for CME was also quantified. Finally, each participating author was asked to fill out an electronic post-chat survey (SurveyMonkey®) meant to assess the authors’ experience with the journal club (Appendix).
RESULTS
Between October 2015 and November 2017, a total of 15 sessions were held with a mean of 2.17 (±0.583) million impressions/session, 499 (±129) total tweets/session, and 73 (±24) participants/session (compared to a range of 21-58 participants/session from other online journal clubs, where reported) with 7.2 (±2.0) tweets/participant (Table 1). The total number of participants for all sessions was 1096. Participating authors had on average 1389 (±2714) followers, ranging from a low of 37 to a high of 10,376 (Appendix). No correlation between author following and number of participants (r = 0.19), impressions (r = 0.05), or change in Altmetric score (r = 0.17) was seen.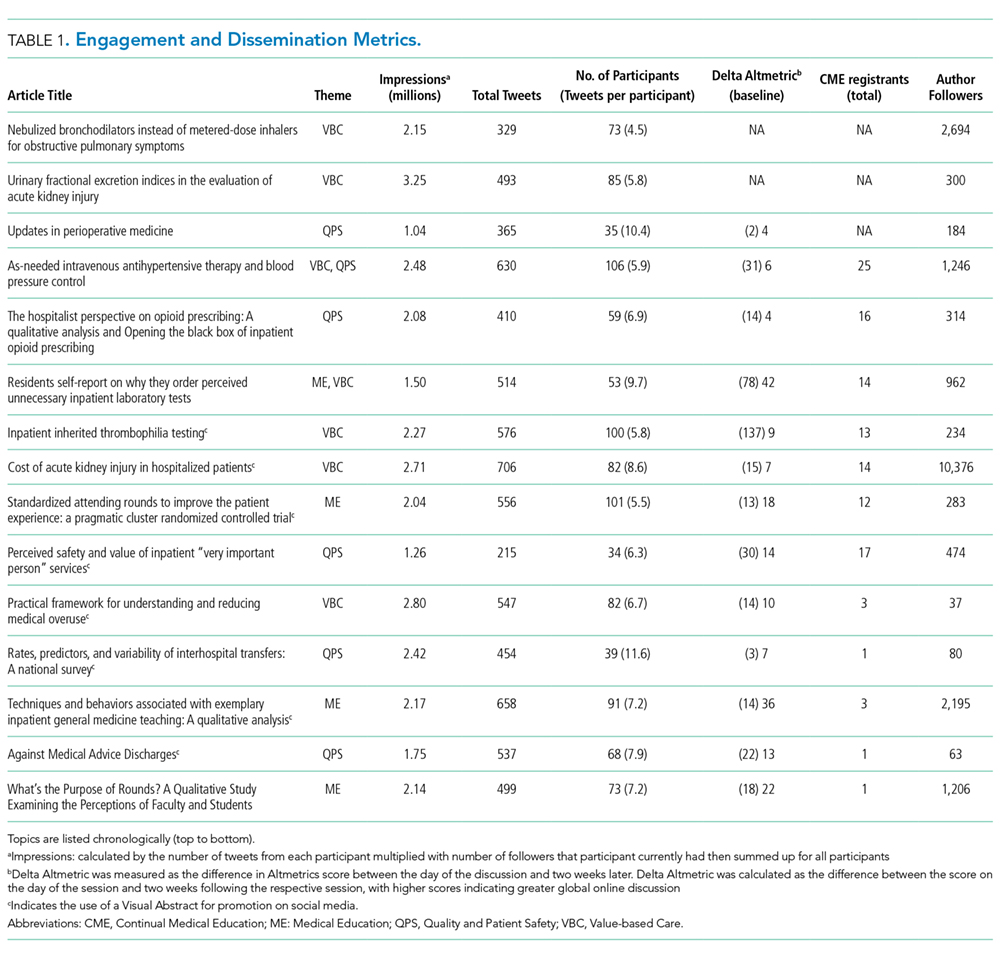
Thematic analysis revealed 3 predominant themes among the chosen articles: Value-based care (VBC), Quality and Patient Safety (QPS), and Medical Education (ME). Articles focused on VBC had the greatest number of impressions (mean ±SD: 2.61 ± 0.55 million) and participants (mean ±SD: 90 ± 12), while QPS articles had the fewest impressions (mean ±SD: 1.71 ± 0.59 million) and number of participants (mean ±SD: 47 ± 16). The mean increase in the Altmetric score among all discussed articles was 14 (±12), from an average baseline of 30 (±37). Medical Education-themed articles appeared to garner the greatest increase in Altmetric scores, averaging an increase of 32 points, compared with an average baseline score of 31 (±32). In contrast, VBC and QPS articles averaged an increase of 8.6 and 8.4 points, from average baselines of 55 (±53) and 17 (±13), respectively. A 2-month analysis of JHM articles not included in these discussions, in which Altmetric scores were measured in the same way as those from the discussion, revealed a baseline Altmetric score of 27 (±24) with an average increase of 8 (±6) 2 weeks following the chat.
Four articles met the inclusion criteria for page view analysis and suggested that article page views increased to similar levels as the eTOC release (mean: 2668 vs. 2998, respectively; P = .35) (Figure). These increases equate to a 33% and 50% increase in average daily page views (2002) for the chat and eTOC release, respectively.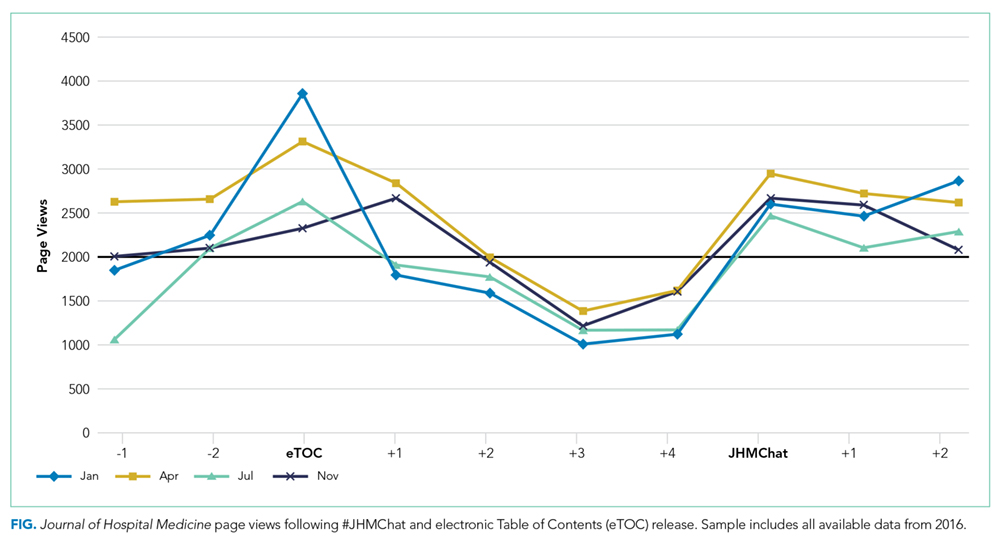
Ninety-three percent (14/15) of the participating authors responded to the post-discussion survey. All strongly agreed (5/5 on a Likert scale) that the venue allowed for an in-depth discussion about processes and challenges in conducting the study and allowed for greater dissemination and visibility of their work (5/5). Additionally, authors agreed that the journal club was a valuable experience for themselves (4.88/5) and other practitioners (4.88/5). Most agreed that the journal club allowed them to share their work with a different group of participants than usual (4.75/5) and that the experience changed how they would discuss their manuscripts in the future (4.75/5.0); Table 2).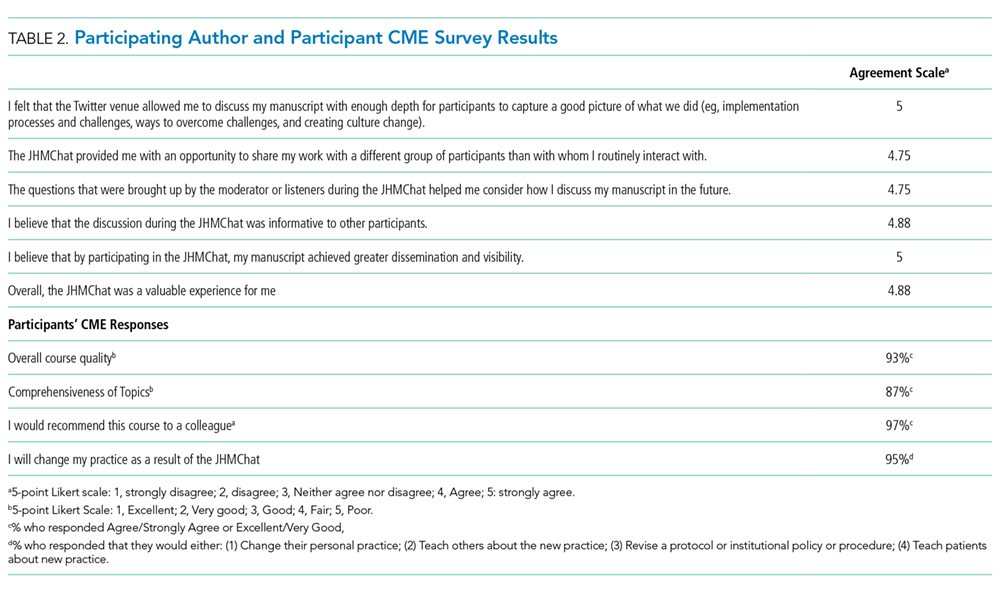
DISCUSSION
The Twitter-based journal club #JHMChat appears to increase social media awareness and dissemination of journal articles and was considered a useful engagement platform by both authors and participants.
Articles with a focus on VBC and ME had the greatest impact on dissemination metrics, particularly, total impressions and Altmetric scores, respectively. Given the strong presence and interest in these topics within Twitter and social media, these findings are not surprising.10,11 For example, over the past several years, the VBC movement has taken shape and grown alongside the expansion of social media, thus giving a space for this community to grow and engage. Of note, the cosponsorship relationship with the ABIM Foundation (which works closely with the Choosing Wisely™ campaign) and the Costs of Care Organization could have influenced the participation and dissemination rates of VBC articles. Medical education articles were also popular and appeared to have increased uptake after chats, based on their Altmetric scores. This may be explained by the fact that medical educators have long utilized social media as a means to connect and engage within their community.12–14 It is also possible that the use of Twitter by trainees (residents, students) may have driven some of the dissemination of ME articles, as this group may not be regular subscribers to JHM.
Online journal clubs offer distinct advantages over traditional in-person journal clubs. First, online journal clubs allow for increased connectivity among online communities, bringing together participants from different geographic areas with diverse training and clinical experiences. Subsequently, this allows for the rapid exchange of both personal and organizational approaches to the topic of discussion.15–17 Second, online journal clubs allow for continual access to the discussion material. For example, while the metrics used in this study only assessed active, synchronous participation, anecdotal evidence and feedback to the authors suggests that many individuals passively engaged by following along or reviewed the chat feed post hoc at their convenience. This asynchronous access is a quality not found in more traditional journal club formats. Finally, because online journal clubs commonly operate with a flattened hierarchy,18 they can break down access barriers to both the researchers who performed the study and thought leaders who commonly participate.17
Several insightful lessons were gleaned in the production and management of this online journal club. On the implementation side, promotion, preparation, and continued organization of an online journal club requires a fair amount of work. In this case, the required time and resources were provided by 2 social media editors in addition to administrative assistance from the SHM. The high attrition rate of online journal clubs over the years attests to these difficulties.24 Additionally, finding incentives to attract and sustain participation can be difficult, as we noted that neither CME nor author popularity (based on their Twitter following) appeared to influence engagement metrics (number of participants, total tweets, and tweets/participant). We also found that partnering with other journal club communities, in particular #NephJC, lead to greater participation rates and impressions. Thus, leveraging connections and topics that span clinical domains may be one way to improve and broaden engagement within these forums. Finally, feedback from participants revealed that the timing of the journal club and the inability to have in-depth discussions, a characteristic commonly associated with traditional journal clubs, were problematic.
This study has several limitations. First, the metrics used to assess social media engagement and dissemination can be easily skewed. For instance, the activity of 1 or 2 individuals with large followings can dramatically influence the number of impressions, giving a falsely elevated sense of broad dissemination. Conversely, there may have been some participants who did not use the #JHMChat hashtag, thus leading to an underestimation in these metrics. Second, while we report total impressions as a measure of dissemination, this metric represents possible interactions and does not guarantee interaction or visualization of that tweet. Additionally, we were unable to characterize our participants and their participation rates over time, as this information is not made available through Symplur© analytics. Third, our page view assessment was limited to 2016 sessions only; therefore, these data may not be an accurate reflection of the impact of #JHMChat on this metric. Fourth, given the marginal response rate to our CME questionnaire, a selection bias could have occurred. Finally, whether social media discussions such as online journal clubs act as leading indicators for future citations remains unclear, as some research has shown an association between increased Altmetric scores and increased citation rates,19-21 while others have not.22,23 Our study was not equipped to assess this correlation.
CONCLUSION
Online journal clubs create new opportunities to connect, engage, and disseminate medical research. These developing forums provide journal editors, researchers, patients, and clinicians with a means to connect and discuss research in ways that were not previously possible. In order to continue to evolve and grow, future research in online journal clubs should explore the downstream effects on citation rates, clinical uptake, and participant knowledge after the sessions.
Acknowledgments
The authors would like to thank Felicia Steele for her assistance in organizing and promoting the chats. Additionally, the authors would like to thank all the authors, guests and participants who took time from their families, work, and daily lives to participate in these activities. Your time and presence were truly appreciated.
Disclosures
The authors of this article operate as the Social Media Editors (C.M.W., V.M.A.) and the Editor-in-Chief (A.A.) for the Journal of Hospital Medicine. Dr. Wray had full access to all the data in the project, takes responsibility for the integrity of the data, and the accuracy of the data analysis.
1. Topf JM, Sparks MA, Phelan PJ, et al. The evolution of the journal club: from osler to twitter. Am J Kidney Dis Off J Natl Kidney Found. 2017;69(6):827-836. doi: 10.1053/j.ajkd.2016.12.012. PubMed
2. Thangasamy IA, Leveridge M, Davies BJ, Finelli A, Stork B, Woo HH. International urology journal club via Twitter: 12-month experience. Eur Urol. 2014;66(1):112-117. doi: 10.1016/j.eururo.2014.01.034. PubMed
3. Gardhouse AI, Budd L, Yang SYC, Wong CL. #GeriMedJC: the Twitter complement to the traditional-format geriatric medicine journal club. J Am Geriatr Soc. 2017;65(6):1347-1351. doi: 10.1111/jgs.14920. PubMed
4. Duque L. How academics and researchers can get more out of social media. Harvard Business Review. https://hbr.org/2016/06/how-academics-and-researchers-can-get-more-out-of-social-media. Accessed November 9, 2017.
5. Wray CM, Arora VM. #VisualAbstract: a revolution in communicating science? Ann Surg. 2017;266(6):e49-e50. doi: 10.1097/SLA.0000000000002339. PubMed
6. Ibrahim AM. Seeing is believing: using visual abstracts to disseminate scientific research. Am J Gastroenterol. 2017:ajg2017268. doi: 10.1038/ajg.2017.268. PubMed
7. #JHMChat. http://shm.hospitalmedicine.org/acton/media/25526/jhmchat. Accessed November 9, 2017.
8. #JHMChat-healthcare social media. Symplur. https://www.symplur.com/search/%23JHMChat. Accessed November 9, 2017.
9. Altmetric. Altmetric. https://www.altmetric.com/. Accessed November 9, 2017.
10. value-based healthcare | Symplur. https://www.symplur.com/topic/value-based-healthcare/. Accessed November 17, 2017.
11. medical education | Symplur. https://www.symplur.com/topic/medical-education/. Accessed November 17, 2017.
12. Sterling M, Leung P, Wright D, Bishop TF. The use of social media in graduate medical education: a systematic review. Acad Med. 2017;92(7):1043. doi: 10.1097/ACM.0000000000001617. PubMed
13. Davis WM, Ho K, Last J. Advancing social media in medical education. CMAJ Can Med Assoc J. 2015;187(8):549-550. doi: 10.1503/cmaj.141417. PubMed
14. Hillman T, Sherbino J. Social media in medical education: a new pedagogical paradigm? Postgrad Med J. 2015;91(1080):544-545. doi: 10.1136/postgradmedj-2015-133686. PubMed
15. Gerds AT, Chan T. Social media in hematology in 2017: dystopia, utopia, or somewhere in-between? Curr Hematol Malig Rep. 2017;12(6):582-591. doi: 10.1007/s11899-017-0424-8. PubMed
16. Mehta N, Flickinger T. The times they are a-changin’: academia, social media and the JGIM Twitter Journal Club. J Gen Intern Med. 2014;29(10):1317-1318. doi: 10.1007/s11606-014-2976-9. PubMed
17. Chan T, Trueger NS, Roland D, Thoma B. Evidence-based medicine in the era of social media: scholarly engagement through participation and online interaction. CJEM. 2017:1-6. doi: 10.1017/cem.2016.407. PubMed
18. Utengen A. The flattening of healthcare: breaking down of barriers in healthcare social media-twitter visualized. https://www.symplur.com/shorts/the-flattening-of-healthcare-twitter-visualized/. Accessed November 8, 2017.
19. Thelwall M, Haustein S, Larivière V, Sugimoto CR. Do altmetrics work? Twitter and ten other social web services. PloS One. 2013;8(5):e64841. doi: 10.1371/journal.pone.0064841. PubMed
20. Peoples BK, Midway SR, Sackett D, Lynch A, Cooney PB. Twitter predicts citation rates of ecological research. PloS One. 2016;11(11):e0166570. doi: 10.1371/journal.pone.0166570. PubMed
21. Eysenbach G. Can tweets predict citations? Metrics of social impact based on Twitter and correlation with traditional metrics of scientific impact. J Med Internet Res. 2011;13(4):e123. doi: 10.2196/jmir.2012. PubMed
22. Winter JCF de. The relationship between tweets, citations, and article views for PLOS ONE articles. Scientometrics. 2015;102(2):1773-1779. doi: 10.1007/s11192-014-1445-x.
23. Haustein S, Peters I, Sugimoto CR, Thelwall M, Larivière V. Tweeting biomedicine: an analysis of tweets and citations in the biomedical literature. J Assoc Inf Sci Technol. 2014;65(4):656-669. doi: 10.1002/asi.23101.
24. Journal club. In: Wikipedia. 2017. https://en.wikipedia.org/w/index.php?title=Journal_club&oldid=807037773. Accessed November 9, 2017.
Clinicians, educators, and medical journals are increasingly using the social media outlet, Twitter, as a medium to connect and engage with their colleagues. In particular, online journal clubs have created a space for the timely discussion of research, creation of online communities, and dissemination of research.
Social media-based journal clubs are thought to be one way in which journals can leverage the power of social networks so that researchers can engage with a diverse range of end users4 (including bedside clinicians, administrators, and patients). Several examples of these models exist. For example, #GeriMedJC acts as a complimentary, synchronous chat that takes place at the same time as a live, in-person journal club. #NephJC offers multiple 1-hour chats per month and provides an in-depth summary and analysis of each article, while #UroJC is an asynchronous discussion that takes place over 48 hours. Few data exist to describe whether any of these programs produce measurable improvements in indicators of engagement or dissemination of results.
In 2015, the Journal of Hospital Medicine (JHM) began producing a Twitter-based journal club as a means to connect and engage the Hospital Medicine community and allow for discussion and rapid exchange of information and opinions around a specific clinical topic. This study aims to describe the implementation of the first Journal-sponsored, Twitter-based online journal club and ascertain its impact on both Twitter and journal metrics.
METHODS
#JHMChat was launched in October 2015, and was initially held every 2-3 months until January 2017, when chats began to take place monthly. Each 1-hour chat focused on a recently published article in JHM, was moderated by a JHM social media editor (C.M.W., V.M.A.), and included at least 1 study author or guest expert. Articles were chosen by the social media editors based on the following criteria: (1) attractiveness to possible participants, (2) providing topic variety within the journal club series, and (3) sustainability and topic conduciveness to the online chat model. Chats were held at 9 PM EST in order to engage hospitalists across all US time zones and on different days to accommodate authors’ availability. All sessions were framed by 3-4 questions intended to encourage discussion and presented to chat participants at spaced intervals so as to stimulate a current of responses.
Chats were promoted by way of the JHM (@JHospMedicine, 3400 followers) and Society of Hospital Medicine (SHM; @SHMLive, 5800 followers) Twitter feeds beginning 1 month prior to each session. Visual Abstracts5,6 were used to publicize the sessions, also via Twitter, starting in February 2017.
Continuing Medical Education (CME) credits were offered through the SHM to registered participants, starting in July 2016.7 All sessions were cosponsored by the American Board of Internal Medicine (ABIM) Foundation and the Costs of Care Organization, a non-profit organization aimed at improving healthcare value.
Twitter Metrics
After each session, the following Twitter-based engagement metrics were obtained using the Symplur© Healthcare Hashtag project;8 total number of participants and tweets, tweets/participant, and total impressions (calculated as the number of tweets from each participant multiplied by the number of followers that participant currently had then summed up for all participants). Simply put, impressions can also be thought of as the number of times a single Tweet makes it into someone else’s Twitter feed. So as to avoid artificially inflated metrics, all were obtained 2 hours after the end of the journal club. Participants were defined as anyone who posted an original tweet or retweeted during the session and were encouraged to tag their tweets with the hashtag #JHMChat for post-discussion indexing and measurement. Because authors’ or guests’ popularity on Twitter may influence participation rates, we also assessed the number of followers for each participating author. Spearman’s rank correlation was calculated (Microsoft ExcelTM) where appropriate.
Altmetrics and Page Views
As a means to measure exposure and dissemination external to Twitter, we assessed the change (“Delta”) in the each article’s Altmetric score9, a digital-based metric that quantifies the attention received by a scientific publication on various online platforms including news, blogs, and social media. Delta Altmetric scores were calculated as the difference between the scores on the day of the session and 2 weeks after the respective session, with higher scores indicating greater global online discussion. By measuring the Altmetric score on the day of the discussion, we established a baseline score for comparison purposes. Additionally, this allowed us to better attribute any changes that may have occurred to the discussion itself.
Additionally, using information provided by the journal publisher (John Wiley & Sons Publishing) in 2016, we assessed the effect of #JHMChat on the number of article page views on the JHM website relative to the release of the electronic Table of Contents (eTOC). The eTOC release was chosen as it is historically associated with a high number of page views. In order to isolate the effect of #JHMChat, we only reviewed months in which #JHMChat was not held within 3 days of the eTOC release. Because JHM changed publishers in January 2017, we only assessed page view data on 2016 sessions, as the new publisher lacked enhanced search optimization to obtain these data.
Thematic Analysis
In addition to the above measurements, a thematic analysis of each article was conducted to assess any common themes that would influence our chosen metrics. Themes were assessed and ascribed by one author (C.M.W.) and verified by another (V.M.A.).
Participant and Author Experience
To assess the participant experience, responses to a post-session CME questionnaire that assessed (1) overall quality, (2) comprehensiveness of the discussion, (3) whether the participant would recommend the chat to a colleague, and (4) whether participation would lead to practice-changing measures were reviewed. Registration of each session for CME was also quantified. Finally, each participating author was asked to fill out an electronic post-chat survey (SurveyMonkey®) meant to assess the authors’ experience with the journal club (Appendix).
RESULTS
Between October 2015 and November 2017, a total of 15 sessions were held with a mean of 2.17 (±0.583) million impressions/session, 499 (±129) total tweets/session, and 73 (±24) participants/session (compared to a range of 21-58 participants/session from other online journal clubs, where reported) with 7.2 (±2.0) tweets/participant (Table 1). The total number of participants for all sessions was 1096. Participating authors had on average 1389 (±2714) followers, ranging from a low of 37 to a high of 10,376 (Appendix). No correlation between author following and number of participants (r = 0.19), impressions (r = 0.05), or change in Altmetric score (r = 0.17) was seen.
Thematic analysis revealed 3 predominant themes among the chosen articles: Value-based care (VBC), Quality and Patient Safety (QPS), and Medical Education (ME). Articles focused on VBC had the greatest number of impressions (mean ±SD: 2.61 ± 0.55 million) and participants (mean ±SD: 90 ± 12), while QPS articles had the fewest impressions (mean ±SD: 1.71 ± 0.59 million) and number of participants (mean ±SD: 47 ± 16). The mean increase in the Altmetric score among all discussed articles was 14 (±12), from an average baseline of 30 (±37). Medical Education-themed articles appeared to garner the greatest increase in Altmetric scores, averaging an increase of 32 points, compared with an average baseline score of 31 (±32). In contrast, VBC and QPS articles averaged an increase of 8.6 and 8.4 points, from average baselines of 55 (±53) and 17 (±13), respectively. A 2-month analysis of JHM articles not included in these discussions, in which Altmetric scores were measured in the same way as those from the discussion, revealed a baseline Altmetric score of 27 (±24) with an average increase of 8 (±6) 2 weeks following the chat.
Four articles met the inclusion criteria for page view analysis and suggested that article page views increased to similar levels as the eTOC release (mean: 2668 vs. 2998, respectively; P = .35) (Figure). These increases equate to a 33% and 50% increase in average daily page views (2002) for the chat and eTOC release, respectively.
Ninety-three percent (14/15) of the participating authors responded to the post-discussion survey. All strongly agreed (5/5 on a Likert scale) that the venue allowed for an in-depth discussion about processes and challenges in conducting the study and allowed for greater dissemination and visibility of their work (5/5). Additionally, authors agreed that the journal club was a valuable experience for themselves (4.88/5) and other practitioners (4.88/5). Most agreed that the journal club allowed them to share their work with a different group of participants than usual (4.75/5) and that the experience changed how they would discuss their manuscripts in the future (4.75/5.0); Table 2).
DISCUSSION
The Twitter-based journal club #JHMChat appears to increase social media awareness and dissemination of journal articles and was considered a useful engagement platform by both authors and participants.
Articles with a focus on VBC and ME had the greatest impact on dissemination metrics, particularly, total impressions and Altmetric scores, respectively. Given the strong presence and interest in these topics within Twitter and social media, these findings are not surprising.10,11 For example, over the past several years, the VBC movement has taken shape and grown alongside the expansion of social media, thus giving a space for this community to grow and engage. Of note, the cosponsorship relationship with the ABIM Foundation (which works closely with the Choosing Wisely™ campaign) and the Costs of Care Organization could have influenced the participation and dissemination rates of VBC articles. Medical education articles were also popular and appeared to have increased uptake after chats, based on their Altmetric scores. This may be explained by the fact that medical educators have long utilized social media as a means to connect and engage within their community.12–14 It is also possible that the use of Twitter by trainees (residents, students) may have driven some of the dissemination of ME articles, as this group may not be regular subscribers to JHM.
Online journal clubs offer distinct advantages over traditional in-person journal clubs. First, online journal clubs allow for increased connectivity among online communities, bringing together participants from different geographic areas with diverse training and clinical experiences. Subsequently, this allows for the rapid exchange of both personal and organizational approaches to the topic of discussion.15–17 Second, online journal clubs allow for continual access to the discussion material. For example, while the metrics used in this study only assessed active, synchronous participation, anecdotal evidence and feedback to the authors suggests that many individuals passively engaged by following along or reviewed the chat feed post hoc at their convenience. This asynchronous access is a quality not found in more traditional journal club formats. Finally, because online journal clubs commonly operate with a flattened hierarchy,18 they can break down access barriers to both the researchers who performed the study and thought leaders who commonly participate.17
Several insightful lessons were gleaned in the production and management of this online journal club. On the implementation side, promotion, preparation, and continued organization of an online journal club requires a fair amount of work. In this case, the required time and resources were provided by 2 social media editors in addition to administrative assistance from the SHM. The high attrition rate of online journal clubs over the years attests to these difficulties.24 Additionally, finding incentives to attract and sustain participation can be difficult, as we noted that neither CME nor author popularity (based on their Twitter following) appeared to influence engagement metrics (number of participants, total tweets, and tweets/participant). We also found that partnering with other journal club communities, in particular #NephJC, lead to greater participation rates and impressions. Thus, leveraging connections and topics that span clinical domains may be one way to improve and broaden engagement within these forums. Finally, feedback from participants revealed that the timing of the journal club and the inability to have in-depth discussions, a characteristic commonly associated with traditional journal clubs, were problematic.
This study has several limitations. First, the metrics used to assess social media engagement and dissemination can be easily skewed. For instance, the activity of 1 or 2 individuals with large followings can dramatically influence the number of impressions, giving a falsely elevated sense of broad dissemination. Conversely, there may have been some participants who did not use the #JHMChat hashtag, thus leading to an underestimation in these metrics. Second, while we report total impressions as a measure of dissemination, this metric represents possible interactions and does not guarantee interaction or visualization of that tweet. Additionally, we were unable to characterize our participants and their participation rates over time, as this information is not made available through Symplur© analytics. Third, our page view assessment was limited to 2016 sessions only; therefore, these data may not be an accurate reflection of the impact of #JHMChat on this metric. Fourth, given the marginal response rate to our CME questionnaire, a selection bias could have occurred. Finally, whether social media discussions such as online journal clubs act as leading indicators for future citations remains unclear, as some research has shown an association between increased Altmetric scores and increased citation rates,19-21 while others have not.22,23 Our study was not equipped to assess this correlation.
CONCLUSION
Online journal clubs create new opportunities to connect, engage, and disseminate medical research. These developing forums provide journal editors, researchers, patients, and clinicians with a means to connect and discuss research in ways that were not previously possible. In order to continue to evolve and grow, future research in online journal clubs should explore the downstream effects on citation rates, clinical uptake, and participant knowledge after the sessions.
Acknowledgments
The authors would like to thank Felicia Steele for her assistance in organizing and promoting the chats. Additionally, the authors would like to thank all the authors, guests and participants who took time from their families, work, and daily lives to participate in these activities. Your time and presence were truly appreciated.
Disclosures
The authors of this article operate as the Social Media Editors (C.M.W., V.M.A.) and the Editor-in-Chief (A.A.) for the Journal of Hospital Medicine. Dr. Wray had full access to all the data in the project, takes responsibility for the integrity of the data, and the accuracy of the data analysis.
1. Topf JM, Sparks MA, Phelan PJ, et al. The evolution of the journal club: from osler to twitter. Am J Kidney Dis Off J Natl Kidney Found. 2017;69(6):827-836. doi: 10.1053/j.ajkd.2016.12.012. PubMed
2. Thangasamy IA, Leveridge M, Davies BJ, Finelli A, Stork B, Woo HH. International urology journal club via Twitter: 12-month experience. Eur Urol. 2014;66(1):112-117. doi: 10.1016/j.eururo.2014.01.034. PubMed
3. Gardhouse AI, Budd L, Yang SYC, Wong CL. #GeriMedJC: the Twitter complement to the traditional-format geriatric medicine journal club. J Am Geriatr Soc. 2017;65(6):1347-1351. doi: 10.1111/jgs.14920. PubMed
4. Duque L. How academics and researchers can get more out of social media. Harvard Business Review. https://hbr.org/2016/06/how-academics-and-researchers-can-get-more-out-of-social-media. Accessed November 9, 2017.
5. Wray CM, Arora VM. #VisualAbstract: a revolution in communicating science? Ann Surg. 2017;266(6):e49-e50. doi: 10.1097/SLA.0000000000002339. PubMed
6. Ibrahim AM. Seeing is believing: using visual abstracts to disseminate scientific research. Am J Gastroenterol. 2017:ajg2017268. doi: 10.1038/ajg.2017.268. PubMed
7. #JHMChat. http://shm.hospitalmedicine.org/acton/media/25526/jhmchat. Accessed November 9, 2017.
8. #JHMChat-healthcare social media. Symplur. https://www.symplur.com/search/%23JHMChat. Accessed November 9, 2017.
9. Altmetric. Altmetric. https://www.altmetric.com/. Accessed November 9, 2017.
10. value-based healthcare | Symplur. https://www.symplur.com/topic/value-based-healthcare/. Accessed November 17, 2017.
11. medical education | Symplur. https://www.symplur.com/topic/medical-education/. Accessed November 17, 2017.
12. Sterling M, Leung P, Wright D, Bishop TF. The use of social media in graduate medical education: a systematic review. Acad Med. 2017;92(7):1043. doi: 10.1097/ACM.0000000000001617. PubMed
13. Davis WM, Ho K, Last J. Advancing social media in medical education. CMAJ Can Med Assoc J. 2015;187(8):549-550. doi: 10.1503/cmaj.141417. PubMed
14. Hillman T, Sherbino J. Social media in medical education: a new pedagogical paradigm? Postgrad Med J. 2015;91(1080):544-545. doi: 10.1136/postgradmedj-2015-133686. PubMed
15. Gerds AT, Chan T. Social media in hematology in 2017: dystopia, utopia, or somewhere in-between? Curr Hematol Malig Rep. 2017;12(6):582-591. doi: 10.1007/s11899-017-0424-8. PubMed
16. Mehta N, Flickinger T. The times they are a-changin’: academia, social media and the JGIM Twitter Journal Club. J Gen Intern Med. 2014;29(10):1317-1318. doi: 10.1007/s11606-014-2976-9. PubMed
17. Chan T, Trueger NS, Roland D, Thoma B. Evidence-based medicine in the era of social media: scholarly engagement through participation and online interaction. CJEM. 2017:1-6. doi: 10.1017/cem.2016.407. PubMed
18. Utengen A. The flattening of healthcare: breaking down of barriers in healthcare social media-twitter visualized. https://www.symplur.com/shorts/the-flattening-of-healthcare-twitter-visualized/. Accessed November 8, 2017.
19. Thelwall M, Haustein S, Larivière V, Sugimoto CR. Do altmetrics work? Twitter and ten other social web services. PloS One. 2013;8(5):e64841. doi: 10.1371/journal.pone.0064841. PubMed
20. Peoples BK, Midway SR, Sackett D, Lynch A, Cooney PB. Twitter predicts citation rates of ecological research. PloS One. 2016;11(11):e0166570. doi: 10.1371/journal.pone.0166570. PubMed
21. Eysenbach G. Can tweets predict citations? Metrics of social impact based on Twitter and correlation with traditional metrics of scientific impact. J Med Internet Res. 2011;13(4):e123. doi: 10.2196/jmir.2012. PubMed
22. Winter JCF de. The relationship between tweets, citations, and article views for PLOS ONE articles. Scientometrics. 2015;102(2):1773-1779. doi: 10.1007/s11192-014-1445-x.
23. Haustein S, Peters I, Sugimoto CR, Thelwall M, Larivière V. Tweeting biomedicine: an analysis of tweets and citations in the biomedical literature. J Assoc Inf Sci Technol. 2014;65(4):656-669. doi: 10.1002/asi.23101.
24. Journal club. In: Wikipedia. 2017. https://en.wikipedia.org/w/index.php?title=Journal_club&oldid=807037773. Accessed November 9, 2017.
© 2018 Society of Hospital Medicine
Appropriate Reconciliation of Cardiovascular Medications After Elective Surgery and Postdischarge Acute Hospital and Ambulatory Visits
Medication reconciliation at hospital discharge is a critical component of the posthospital transition of care.1 Effective reconciliation involves a clear process for documenting a current medication list, identifying and resolving discrepancies, and then documenting decisions and instructions around which medications should be continued, modified, or stopped.2 Existing studies3-5 suggest that medication discrepancies are common during hospital discharge transitions of care and lead to preventable adverse drug events, patient disability, and increased healthcare utilization following hospital discharge, including physician office visits, emergency department (ED) visits, and hospitalizations.6-8
While the majority of studies of medication discrepancies have been conducted in general medical patients, few have examined how gaps in discharge medication reconciliation might affect surgical patients.9,10 Two prior studies9,10 suggest that medication discrepancies may occur more frequently for surgical patients, compared with medical patients, particularly discrepancies in reordering home medications postoperatively, raising patient safety concerns for more than 50 million patients hospitalized for surgery each year.11 In particular, little is known about the appropriate discharge reconciliation of chronic cardiovascular medications, such as beta-blockers, renin-angiotensin system inhibitors, and statins in surgical patients, despite perioperative practice guidelines recommending continuation or rapid reinitiation of these medications after noncardiac surgery.12 Problems with chronic cardiovascular medications have been implicated as major contributors to ED visits and hospitalizations for adverse drug events,13,14 further highlighting the importance of safe and appropriate management of these medications.
To better understand the current state and impact of postoperative discharge medication reconciliation of chronic cardiovascular medications in surgical patients, we examined (1) the appropriate discharge reconciliation of 4 cardiovascular medication classes, and (2) the associations between the appropriate discharge reconciliation of these medication classes and postdischarge acute hospital and ambulatory visits in patients hospitalized for elective noncardiac surgery at an academic medical center.
METHODS
Study Design and Patient Selection
We performed a retrospective analysis of data collected as part of a cohort study of hospitalized surgical patients admitted between January 2007 and December 2011. The original study was designed to assess the impact of a social marketing intervention on guideline-appropriate perioperative beta-blocker use in surgical patients. The study was conducted at 1 academic medical center that had 2 campuses with full noncardiac operative facilities and a 600-bed total capacity. Both sites had preoperative clinics, and patients were recruited by review of preoperative clinic records. Institutional review boards responsible for all sites approved the study.
For this analysis, we included adults (age >18 years) undergoing elective noncardiac surgery, who were expected to remain hospitalized for at least 1 day and were taking antiplatelet agents (aspirin, aspirin-dipyridamole, or clopidogrel), beta-blockers, renin-angiotensin system inhibitors (angiotensin-converting-enzyme inhibitors or angiotensin-receptor blockers), or statin lipid-lowering agents.
Data Collection
Data Sources. We collected data from a structured review of medical records as well as from discharge abstract information obtained from administrative data systems. Data regarding patient demographics (age, sex, and race/ethnicity), medical history, preoperative cardiovascular medications, surgical procedure and service, and attending surgeon were obtained from a medical record review of comprehensive preoperative clinic evaluations. Data regarding complications during hospitalization were obtained from medical record review and administrative data (Supplement for International Classification of Diseases, Ninth Revision codes).15 Research assistants abstracting data were trained by using a comprehensive reference manual providing specific criteria for classifying chart abstraction data. Research assistants also were directly observed during initial chart abstractions and underwent random chart validation audits by a senior investigator to ensure consistency. Any discrepancies in coding were resolved by consensus among senior investigators.
Definition of Key Predictor: Appropriate Reconciliation. We abstracted discharge medication lists from the electronic medical record. We defined the appropriate reconciliation of cardiovascular medications at discharge as documentation in discharge instructions, medication reconciliation tools, or discharge summaries that a preadmission cardiovascular medication was being continued at discharge, or, if the medication was not continued, documentation of a new contraindication to the medication or complication precluding its use during hospitalization. Medication continuity was considered appropriate if it was continued at discharge irrespective of changes in dosage. By using this measure for individual medications, we also assessed appropriate reconciliation as an “all-or-none” complete versus incomplete measure (appropriate reconciliation of all preoperative cardiovascular medication classes the patient was taking).16
Definition of Outcomes. Our coprimary outcomes were acute hospital visits (ED visits or hospitalizations) and unplanned ambulatory visits (primary care or surgical) at 30 days after surgery. Postoperative ambulatory visits that were not planned prior to surgery were defined as unplanned. Outcomes were ascertained by patient reports during follow-up telephone questionnaires administered by trained research staff and verified by medical record review.
Definition of Covariates. Using these data, we calculated a Revised Cardiac Risk Index (RCRI) score,17 which estimates the risk of perioperative cardiac complications in patients undergoing surgery. Through chart abstraction data supplemented by diagnosis codes from administrative data, we also constructed variables indicating occurrences of postoperative complications anytime during hospitalization that might pose contraindications to continuation of the 4 cardiovascular medication classes studied. For example, if a chart indicated that the patient had an acute rise in creatinine (elevation of baseline creatinine by 50% or absolute rise of 1 mg/dL in patients with baseline creatinine greater than 3 mg/dL) during hospitalization and a preoperative renin-angiotensin system inhibitor was not prescribed at discharge, we would have considered discontinuation appropriate. Other complications we abstracted were hypotension (systolic blood pressure less than 90 mmHg) for beta-blockers and renin-angiotensin system inhibitors, bradycardia (heart rate less than 50 bpm) for beta-blockers, acute kidney injury (defined above) and hyperkalemia for renin-angiotensin system inhibitors, and bleeding (any site) for antiplatelet agents.
Statistical Analysis
We used χ2 and Kruskal-Wallis tests to compare baseline patient characteristics. To assess associations between appropriate medication reconciliation and patient outcomes, we used multilevel mixed-effects logistic regression to account for the clustering of patients by the attending surgeon. We adjusted for baseline patient demographics, surgical service, the number of baseline cardiovascular medications, and individual RCRI criteria. We constructed separate models for all-or-none appropriate reconciliation and for each individual medication class.
As a sensitivity analysis, we constructed similar models by using a simplified definition of appropriate reconciliation based entirely on medication continuity (continued or not continued at discharge) without taking potential contraindications during hospitalization into account. For complete versus incomplete reconciliation, we also constructed models with an interaction term between the number of baseline cardiovascular medications and appropriate medication reconciliation to test the hypothesis that inappropriate reconciliation would be more likely with an increasing number of preoperative cardiovascular medications. Because this interaction term was not statistically significant, we did not include it in the final models for ease of reporting and interpretability. We performed all statistical analyses using Stata 14 (StataCorp, LLC, College Station, Texas), and used 2-sided statistical tests and a P value of less than .05 to define statistical significance.
RESULTS
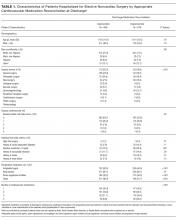
Patient Characteristics
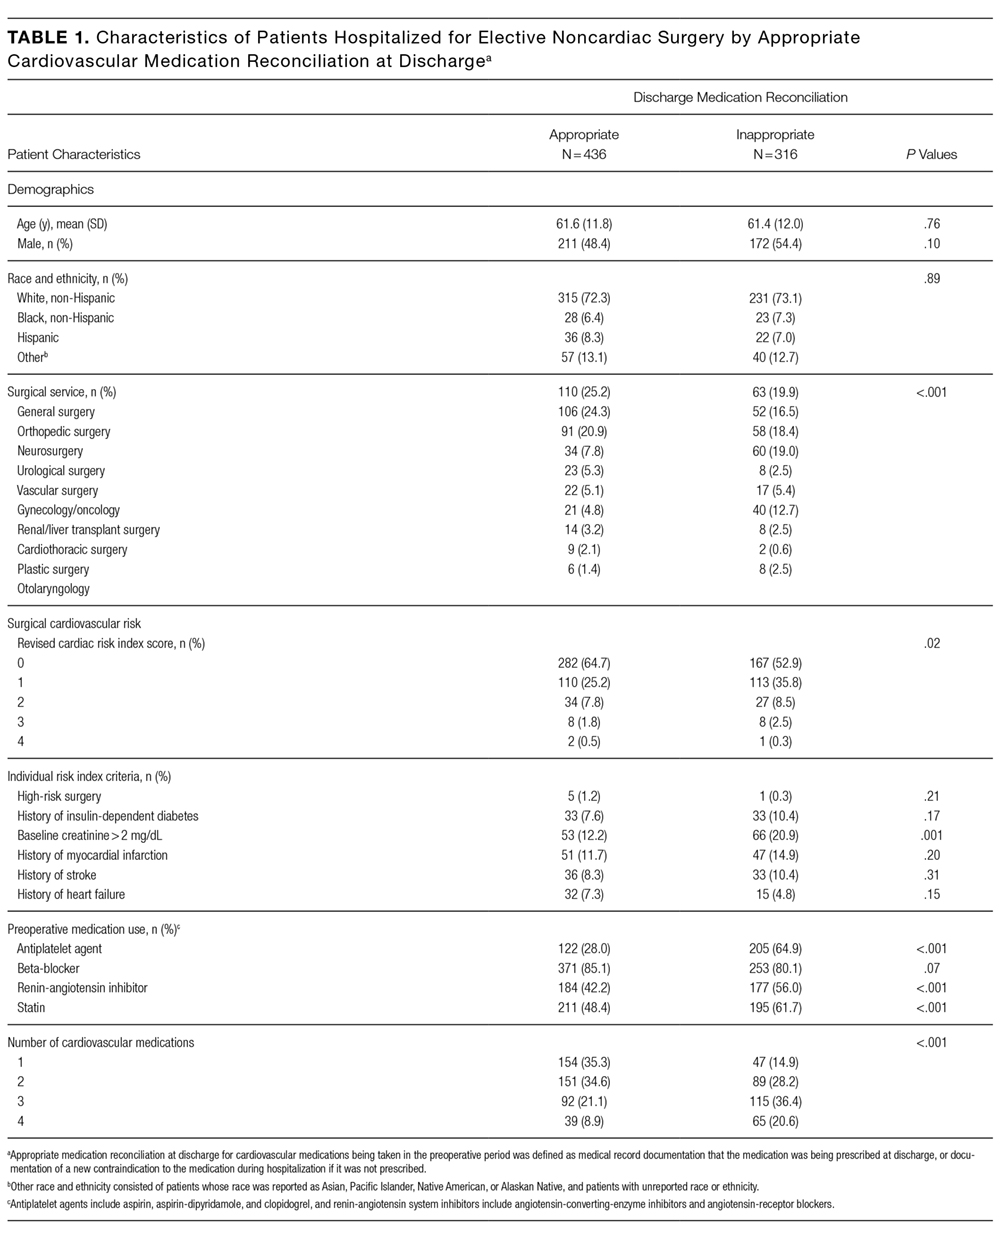
A total of 849 patients were enrolled, of which 752 (88.6%) were taking at least 1 of the specified cardiovascular medications in the preoperative period. Their mean age was 61.5; 50.9% were male, 72.6% were non-Hispanic white, and 89.4% had RCRI scores of 0 or 1 (Table 1). The majority (63.8%) were undergoing general surgery, orthopedic surgery, or neurosurgery procedures. In the preoperative period, 327 (43.5%) patients were taking antiplatelet agents, 624 (83.0%) were taking beta-blockers, 361 (48.0%) were taking renin-angiotensin system inhibitors, and 406 (54.0%) were taking statins (Table 2). Among patients taking antiplatelet agents, 271 (82.9%) were taking aspirin alone, 21 (6.4%) were taking clopidogrel alone, and 35 (10.7%) were taking dual antiplatelet therapy with aspirin and clopidogrel. Nearly three-quarters of the patients (551, 73.3%) were taking medications from 2 or more classes, and the proportion of patients with inappropriate reconciliation increased with the number of preoperative cardiovascular medications.
Patients with and without appropriate reconciliation of all preoperative cardiovascular medications were similar in age, sex, and race/ethnicity (Table 1). Patients with inappropriate reconciliation of at least 1 medication were more likely to be on the urology and renal/liver transplant surgical services, have higher RCRI scores, and be taking antiplatelet agents, statins, renin-angiotensin system inhibitors, and 3 or more cardiovascular medications in the preoperative period.
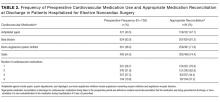
Appropriate Medication Reconciliation
Four hundred thirty-six patients (58.0%) had their baseline cardiovascular medications appropriately reconciled. Among all patients with appropriately reconciled medications, 1 (0.2%) had beta-blockers discontinued due to a documented episode of hypotension; 17 (3.9%) had renin-angiotensin system inhibitors discontinued due to episodes of acute kidney injury, hypotension, or hyperkalemia; and 1 (0.2%) had antiplatelet agents discontinued due to bleeding. For individual medications, appropriate reconciliation between the preoperative and discharge periods occurred for 156 of the 327 patients on antiplatelet agents (47.7%), 507 of the 624 patients on beta-blockers (81.3%), 259 of the 361 patients on renin-angiotensin system inhibitors (71.8%), and 302 of the 406 patients on statins (74.4%; Table 2).
Associations Between Medication Reconciliation and Outcomes
Thirty-day outcome data on acute hospital visits were available for 679 (90.3%) patients. Of these, 146 (21.5%) were seen in the ED or were hospitalized, and 111 (16.3%) were seen for an unplanned primary care or surgical outpatient visit at 30 days after surgery. Patients with incomplete outcome data were more likely to have complete medication reconciliation compared with those with complete outcome data (71.2% vs 56.6%, P = 0.02). As shown in Table 3, the proportion of patients with 30-day acute hospital visits was nonstatistically significantly lower in patients with complete medication reconciliation (20.8% vs 22.4%, P = 0.63) and the appropriate reconciliation of beta-blockers (21.9% vs 23.6%, P = 0.71) and renin-angiotensin system inhibitors (19.6% vs 20.0%, P = 0.93), and nonsignificantly higher with the appropriate reconciliation of antiplatelet agents (23.9% vs 19.9%, P = 0.40). Acute hospital visits were statistically significantly lower with the appropriate reconciliation of statins (17.9% vs 31.9%, P = 0.004).
Sensitivity Analysis
Overall, 430 (57.2%) patients had complete cardiovascular medication continuity without considering potential contraindications during hospitalization. Associations between medication continuity and acute hospital and ambulatory visits were similar to the primary analyses.
DISCUSSION
In this study of 752 patients hospitalized for elective noncardiac surgery, we found significant gaps in the appropriate reconciliation of commonly prescribed cardiovascular medications, with inappropriate discontinuation ranging from 18.8% to 52.3% for individual medications. Unplanned postdischarge healthcare utilization was high, with acute hospital visits documented in 21.5% of patients and unplanned ambulatory visits in 16.3% at 30 days after surgery. However, medication reconciliation gaps were not consistently associated with ED visits, hospitalizations, or unplanned ambulatory visits.
Our finding of large gaps in postoperative medication reconciliation is consistent with existing studies of medication reconciliation in surgical patients.9,10,18 One study found medication discrepancies in 40.2% of postoperative patients receiving usual care and discrepancies judged to have the potential to cause harm (such as the omission of beta-blockers) in 29.9%.9 Consistent with our findings, this study also found that most postoperative medication discrepancies were omissions in reordering home medications, though at a rate somewhat higher than those seen in medical patients at discharge.5 While hospitalization by itself increases the risk of unintentional discontinuation of chronic medications,3 our results, along with existing literature, suggest that the risk for omission of chronic medications is unacceptably high.
We also found significant variation in reconciliation among cardiovascular medications, with appropriate reconciliation occurring least frequently for antiplatelet agents and most frequently for beta-blockers. The low rates of appropriate reconciliation for antiplatelet agents may be attributable to deliberate withholding of antiplatelet therapy in the postoperative period based on clinical assessments of surgical bleeding risk in the absence of active bleeding. Perioperative management of antiplatelet agents for noncardiac surgery remains an unclear and controversial topic, which may also contribute to the variation noted.19 Conversely, beta-blockers demonstrated high rates of preoperative use (over 80% of patients) and appropriate reconciliation. Both findings are likely attributable in part to the timing of the study, which began prior to the publication of the Perioperative Ischemic Evaluation trial, which more definitively demonstrated the potential harms of perioperative beta-blocker therapy.20
Despite a high proportion of patients with discontinuous medications at discharge, we found no associations between the appropriate reconciliation of beta-blockers, renin-angiotensin system inhibitors, and antiplatelet agents and acute hospital or ambulatory visits in the first 30 days after discharge. One explanation for this discrepancy is that, although we focused on cardiovascular medications commonly implicated in acute hospital visits, the vast majority of patients in our study had low perioperative cardiovascular risk as assessed by the RCRI. Previous studies have demonstrated that the benefit of perioperative beta-blocker therapy is predominantly in patients with moderate to high perioperative cardiovascular risk.21,22 It is possible that the detrimental effects of the discontinuation of chronic cardiovascular medications are more prominent in populations at a higher risk of perioperative cardiovascular complications or that complications will occur later than 30 days after discharge. Similarly, while the benefits of continuation of renin-angiotensin system inhibitors are less clear,23 few patients in our cohort had a history of congestive heart failure (6.3%) or coronary artery disease (13.0%), 2 conditions in which the impact of perioperative discontinuation of renin-angiotensin inhibitor or beta-blocker therapy would likely be more pronounced.24,25 An additional explanation for the lack of associations is that, while multiple studies have demonstrated that medication errors are common, the proportion of errors with the potential for harm is much lower, and the proportion that causes actual harm is lower still.5,26,27 Thus, while we likely captured high-severity medication errors leading to acute hospital or unplanned ambulatory visits, we would not have captured medication errors with lower severity clinical consequences that did not result in medical encounters.
We did find an association between the continuation of statin therapy and reduced ED visits and hospitalizations. This finding is supported by previous studies of patients undergoing noncardiac surgery, including 1 demonstrating an association between immediate postoperative statin therapy and reduced in-hospital mortality28 and another study demonstrating an association between postoperative statin therapy and reductions in a composite endpoint of 30-day mortality, atrial fibrillation, and nonfatal myocardial infarction.29 Alternatively, this finding could reflect the effects of unaddressed confounding by factors contributing to statin discontinuation and poor health outcomes leading to acute hospital visits, such as acute elevations in liver enzymes.
Our study has important implications for patients undergoing elective noncardiac surgery and the healthcare providers caring for them. First, inappropriate omissions of chronic cardiovascular medications at discharge are common; clinicians should increase their general awareness and focus on appropriately reconciling these medications, for even if our results do not connect medication discontinuity to readmissions or unexpected clinical encounters, their impact on patients’ understanding of their medications remains a potential concern. Second, the overall high rates of unplanned postdischarge healthcare utilization in this study highlight the need for close postdischarge monitoring of patients undergoing elective surgical procedures and for further research to identify preventable etiologies of postdischarge healthcare utilization in this population. Third, further study is needed to identify specific patient populations and medication classes, in which appropriate reconciliation is associated with patient outcomes that may benefit from more intensive discharge medication reconciliation interventions.
Our study has limitations. First, the majority of patients in this single-center study were at low risk of perioperative cardiovascular events, and our results may not be generalizable to higher-risk patients undergoing elective surgery. Second, discharge reconciliation was based on documentation of medication reconciliation and not on patient-reported medication adherence. In addition, the ability to judge the accuracy of discharge medication reconciliation is in part dependent on the accuracy of the admission medication reconciliation. Thus, although we used preoperative medication regimens documented during preadmission visits to comprehensive preoperative clinics for comparison, discrepancies in these preoperative regimens could have affected our analysis of appropriate discharge reconciliation. Third, inadequate documentation of clinical reasons for discontinuing medications may have led to residual confounding by indication in our observational study. Finally, the outcomes available to us may have been relatively insensitive to other adverse effects of medication discontinuity, such as patient symptoms (eg, angina severity), patient awareness of medications, or work placed on primary care physicians needing to “clean up” erroneous medication lists.
In conclusion, gaps in appropriate discharge reconciliation of chronic cardiovascular medications were common but not consistently associated with postdischarge acute hospital or unplanned ambulatory visits in a relatively low-risk cohort of patients undergoing elective surgery. While appropriate medication reconciliation should always be a priority, further study is needed to identify medication reconciliation approaches associated with postdischarge healthcare utilization and other patient outcomes.
Disclosure
Dr. Lee reports receiving grant support from the Health Resources and Services Administration (T32HP19025). Dr. Vittinghoff reports receiving grant support from the Agency for Healthcare Research and Quality. Dr. Auerbach and Dr. Fleischmann report receiving grant support from the National Institutes of Health. Dr. Auerbach also reports receiving honorarium as Editor-in-Chief of the Journal of Hospital Medicine. Dr. Corbett reports receiving grant and travel support from Simon Fraser University. The remaining authors have no disclosures to report.
1. The Joint Commission. National Patient Safety Goals. 2016; https://www.jointcommission.org/standards_information/npsgs.aspx. Accessed June 21, 2016.
2. Institute for Healthcare Improvement. Medication Reconciliation to Prevent Adverse Drug Events. 2016; http://www.ihi.org/topics/ADEsMedicationReconciliation/Pages/default.aspx. Accessed June 24, 2016.
3. Bell CM, Brener SS, Gunraj N, et al. Association of ICU or hospital admission with unintentional discontinuation of medications for chronic diseases. JAMA. 2011;306(8):840-847. PubMed
4. Coleman EA, Smith JD, Raha D, Min SJ. Posthospital medication discrepancies: prevalence and contributing factors. Arch Intern Med. 2005;165(16):1842-1847. PubMed
5. Wong JD, Bajcar JM, Wong GG, et al. Medication reconciliation at hospital discharge: evaluating discrepancies. Ann Pharmacother. 2008;42(10):1373-1379. PubMed
6. Forster AJ, Clark HD, Menard A, et al. Adverse events among medical patients after discharge from hospital. CMAJ. 2004;170(3):345-349. PubMed
7. Forster AJ, Murff HJ, Peterson JF, Gandhi TK, Bates DW. The incidence and severity of adverse events affecting patients after discharge from the hospital. Ann Intern Med. 2003;138(3):161-167. PubMed
8. Forster AJ, Murff HJ, Peterson JF, Gandhi TK, Bates DW. Adverse drug events occurring following hospital discharge. JGIM. 2005;20(4):317-323. PubMed
9. Kwan Y, Fernandes OA, Nagge JJ, et al. Pharmacist medication assessments in a surgical preadmission clinic. Arch Intern Med. 2007;167(10):1034-1040. PubMed
10. Unroe KT, Pfeiffenberger T, Riegelhaupt S, Jastrzembski J, Lokhnygina Y, Colon-Emeric C. Inpatient Medication Reconciliation at Admission and Discharge: A Retrospective Cohort Study of Age and Other Risk Factors for Medication Discrepancies. Am J Geriatr Pharmacother. 2010;8(2):115-126. PubMed
11. CDC - National Center for Health Statistics. Fast Stats: Inpatient Surgery. http://www.cdc.gov/nchs/fastats/inpatient-surgery.htm. Accessed on June 24, 2016.
12. Fleisher LA, Fleischmann KE, Auerbach AD, et al. 2014 ACC/AHA guideline on perioperative cardiovascular evaluation and management of patients undergoing noncardiac surgery: a report of the American College of Cardiology/American Heart Association Task Force on Practice Guidelines. Circulation. 2014;130(24):e278-e333. PubMed
13. Budnitz DS, Lovegrove MC, Shehab N, Richards CL. Emergency hospitalizations for adverse drug events in older Americans. N Engl J Med. 2011;365(21):2002-2012. PubMed
14. Budnitz DS, Pollock DA, Weidenbach KN, Mendelsohn AB, Schroeder TJ, Annest JL. National surveillance of emergency department visits for outpatient adverse drug events. JAMA. 2006;296(15):1858-1866. PubMed
15. Bozic KJ, Maselli J, Pekow PS, Lindenauer PK, Vail TP, Auerbach AD. The influence of procedure volumes and standardization of care on quality and efficiency in total joint replacement surgery. J Bone Joint Surg Am. 2010;92(16):2643-2652. PubMed
16. Nolan T, Berwick DM. All-or-none measurement raises the bar on performance. JAMA. 2006;295(10):1168-1170. PubMed
17. Lee TH, Marcantonio ER, Mangione CM, et al. Derivation and prospective validation of a simple index for prediction of cardiac risk of major noncardiac surgery. Circulation. 1999;100(10):1043-1049. PubMed
18. Gonzalez-Garcia L, Salmeron-Garcia A, Garcia-Lirola MA, Moya-Roldan S, Belda-Rustarazo S, Cabeza-Barrera J. Medication reconciliation at admission to surgical departments. J Eval Clin Pract. 2016;22(1):20-25. PubMed
19. Devereaux PJ, Mrkobrada M, Sessler DI, et al. Aspirin in patients undergoing noncardiac surgery. N Engl J Med. 2014;370(16):1494-1503. PubMed
20. Devereaux PJ, Yang H, Yusuf S, et al. Effects of extended-release metoprolol succinate in patients undergoing non-cardiac surgery (POISE trial): a randomised controlled trial. Lancet. 2008;371(9627):1839-1847. PubMed
21. Lindenauer PK, Pekow P, Wang K, Mamidi DK, Gutierrez B, Benjamin EM. Perioperative beta-blocker therapy and mortality after major noncardiac surgery. N Engl J Med. 2005;353(4):349-361. PubMed
22. London MJ, Hur K, Schwartz GG, Henderson WG. Association of perioperative beta-blockade with mortality and cardiovascular morbidity following major noncardiac surgery. JAMA. 2013;309(16):1704-1713. PubMed
23. Rosenman DJ, McDonald FS, Ebbert JO, Erwin PJ, LaBella M, Montori VM. Clinical consequences of withholding versus administering renin-angiotensin-aldosterone system antagonists in the preoperative period. J Hosp Med. 2008;3(4):319-325. PubMed
24. Andersson C, Merie C, Jorgensen M, et al. Association of beta-blocker therapy with risks of adverse cardiovascular events and deaths in patients with ischemic heart disease undergoing noncardiac surgery: a Danish nationwide cohort study. JAMA Intern Med. 2014;174(3):336-344. PubMed
25. Yancy CW, Jessup M, Bozkurt B, et al. 2013 ACCF/AHA Guideline for the Management of Heart Failure A Report of the American College of Cardiology Foundation/American Heart Association Task Force on Practice Guidelines. Circulation. 2013;128(16):E240-E327. PubMed
26. Kwan JL, Lo L, Sampson M, Shojania KG. Medication reconciliation during transitions of care as a patient safety strategy: a systematic review. Ann Intern Med. 2013;158(5 Pt 2):397-403. PubMed
27. Tam VC, Knowles SR, Cornish PL, Fine N, Marchesano R, Etchells EE. Frequency, type and clinical importance of medication history errors at admission to hospital: a systematic review. CMAJ. 2005;173(5):510-515. PubMed
28. Lindenauer PK, Pekow P, Wang K, Gutierrez B, Benjamin EM. Lipid-lowering therapy and in-hospital mortality following major noncardiac surgery. JAMA. 2004;291(17):2092-2099. PubMed
29. Raju MG, Pachika A, Punnam SR, et al. Statin Therapy in the Reduction of Cardiovascular Events in Patients Undergoing Intermediate-Risk Noncardiac, Nonvascular Surgery. Clin Cardiol. 2013;36(8):456-461. PubMed
Medication reconciliation at hospital discharge is a critical component of the posthospital transition of care.1 Effective reconciliation involves a clear process for documenting a current medication list, identifying and resolving discrepancies, and then documenting decisions and instructions around which medications should be continued, modified, or stopped.2 Existing studies3-5 suggest that medication discrepancies are common during hospital discharge transitions of care and lead to preventable adverse drug events, patient disability, and increased healthcare utilization following hospital discharge, including physician office visits, emergency department (ED) visits, and hospitalizations.6-8
While the majority of studies of medication discrepancies have been conducted in general medical patients, few have examined how gaps in discharge medication reconciliation might affect surgical patients.9,10 Two prior studies9,10 suggest that medication discrepancies may occur more frequently for surgical patients, compared with medical patients, particularly discrepancies in reordering home medications postoperatively, raising patient safety concerns for more than 50 million patients hospitalized for surgery each year.11 In particular, little is known about the appropriate discharge reconciliation of chronic cardiovascular medications, such as beta-blockers, renin-angiotensin system inhibitors, and statins in surgical patients, despite perioperative practice guidelines recommending continuation or rapid reinitiation of these medications after noncardiac surgery.12 Problems with chronic cardiovascular medications have been implicated as major contributors to ED visits and hospitalizations for adverse drug events,13,14 further highlighting the importance of safe and appropriate management of these medications.
To better understand the current state and impact of postoperative discharge medication reconciliation of chronic cardiovascular medications in surgical patients, we examined (1) the appropriate discharge reconciliation of 4 cardiovascular medication classes, and (2) the associations between the appropriate discharge reconciliation of these medication classes and postdischarge acute hospital and ambulatory visits in patients hospitalized for elective noncardiac surgery at an academic medical center.
METHODS
Study Design and Patient Selection
We performed a retrospective analysis of data collected as part of a cohort study of hospitalized surgical patients admitted between January 2007 and December 2011. The original study was designed to assess the impact of a social marketing intervention on guideline-appropriate perioperative beta-blocker use in surgical patients. The study was conducted at 1 academic medical center that had 2 campuses with full noncardiac operative facilities and a 600-bed total capacity. Both sites had preoperative clinics, and patients were recruited by review of preoperative clinic records. Institutional review boards responsible for all sites approved the study.
For this analysis, we included adults (age >18 years) undergoing elective noncardiac surgery, who were expected to remain hospitalized for at least 1 day and were taking antiplatelet agents (aspirin, aspirin-dipyridamole, or clopidogrel), beta-blockers, renin-angiotensin system inhibitors (angiotensin-converting-enzyme inhibitors or angiotensin-receptor blockers), or statin lipid-lowering agents.
Data Collection
Data Sources. We collected data from a structured review of medical records as well as from discharge abstract information obtained from administrative data systems. Data regarding patient demographics (age, sex, and race/ethnicity), medical history, preoperative cardiovascular medications, surgical procedure and service, and attending surgeon were obtained from a medical record review of comprehensive preoperative clinic evaluations. Data regarding complications during hospitalization were obtained from medical record review and administrative data (Supplement for International Classification of Diseases, Ninth Revision codes).15 Research assistants abstracting data were trained by using a comprehensive reference manual providing specific criteria for classifying chart abstraction data. Research assistants also were directly observed during initial chart abstractions and underwent random chart validation audits by a senior investigator to ensure consistency. Any discrepancies in coding were resolved by consensus among senior investigators.
Definition of Key Predictor: Appropriate Reconciliation. We abstracted discharge medication lists from the electronic medical record. We defined the appropriate reconciliation of cardiovascular medications at discharge as documentation in discharge instructions, medication reconciliation tools, or discharge summaries that a preadmission cardiovascular medication was being continued at discharge, or, if the medication was not continued, documentation of a new contraindication to the medication or complication precluding its use during hospitalization. Medication continuity was considered appropriate if it was continued at discharge irrespective of changes in dosage. By using this measure for individual medications, we also assessed appropriate reconciliation as an “all-or-none” complete versus incomplete measure (appropriate reconciliation of all preoperative cardiovascular medication classes the patient was taking).16
Definition of Outcomes. Our coprimary outcomes were acute hospital visits (ED visits or hospitalizations) and unplanned ambulatory visits (primary care or surgical) at 30 days after surgery. Postoperative ambulatory visits that were not planned prior to surgery were defined as unplanned. Outcomes were ascertained by patient reports during follow-up telephone questionnaires administered by trained research staff and verified by medical record review.
Definition of Covariates. Using these data, we calculated a Revised Cardiac Risk Index (RCRI) score,17 which estimates the risk of perioperative cardiac complications in patients undergoing surgery. Through chart abstraction data supplemented by diagnosis codes from administrative data, we also constructed variables indicating occurrences of postoperative complications anytime during hospitalization that might pose contraindications to continuation of the 4 cardiovascular medication classes studied. For example, if a chart indicated that the patient had an acute rise in creatinine (elevation of baseline creatinine by 50% or absolute rise of 1 mg/dL in patients with baseline creatinine greater than 3 mg/dL) during hospitalization and a preoperative renin-angiotensin system inhibitor was not prescribed at discharge, we would have considered discontinuation appropriate. Other complications we abstracted were hypotension (systolic blood pressure less than 90 mmHg) for beta-blockers and renin-angiotensin system inhibitors, bradycardia (heart rate less than 50 bpm) for beta-blockers, acute kidney injury (defined above) and hyperkalemia for renin-angiotensin system inhibitors, and bleeding (any site) for antiplatelet agents.
Statistical Analysis
We used χ2 and Kruskal-Wallis tests to compare baseline patient characteristics. To assess associations between appropriate medication reconciliation and patient outcomes, we used multilevel mixed-effects logistic regression to account for the clustering of patients by the attending surgeon. We adjusted for baseline patient demographics, surgical service, the number of baseline cardiovascular medications, and individual RCRI criteria. We constructed separate models for all-or-none appropriate reconciliation and for each individual medication class.
As a sensitivity analysis, we constructed similar models by using a simplified definition of appropriate reconciliation based entirely on medication continuity (continued or not continued at discharge) without taking potential contraindications during hospitalization into account. For complete versus incomplete reconciliation, we also constructed models with an interaction term between the number of baseline cardiovascular medications and appropriate medication reconciliation to test the hypothesis that inappropriate reconciliation would be more likely with an increasing number of preoperative cardiovascular medications. Because this interaction term was not statistically significant, we did not include it in the final models for ease of reporting and interpretability. We performed all statistical analyses using Stata 14 (StataCorp, LLC, College Station, Texas), and used 2-sided statistical tests and a P value of less than .05 to define statistical significance.
RESULTS
Patient Characteristics
A total of 849 patients were enrolled, of which 752 (88.6%) were taking at least 1 of the specified cardiovascular medications in the preoperative period. Their mean age was 61.5; 50.9% were male, 72.6% were non-Hispanic white, and 89.4% had RCRI scores of 0 or 1 (Table 1). The majority (63.8%) were undergoing general surgery, orthopedic surgery, or neurosurgery procedures. In the preoperative period, 327 (43.5%) patients were taking antiplatelet agents, 624 (83.0%) were taking beta-blockers, 361 (48.0%) were taking renin-angiotensin system inhibitors, and 406 (54.0%) were taking statins (Table 2). Among patients taking antiplatelet agents, 271 (82.9%) were taking aspirin alone, 21 (6.4%) were taking clopidogrel alone, and 35 (10.7%) were taking dual antiplatelet therapy with aspirin and clopidogrel. Nearly three-quarters of the patients (551, 73.3%) were taking medications from 2 or more classes, and the proportion of patients with inappropriate reconciliation increased with the number of preoperative cardiovascular medications.
Patients with and without appropriate reconciliation of all preoperative cardiovascular medications were similar in age, sex, and race/ethnicity (Table 1). Patients with inappropriate reconciliation of at least 1 medication were more likely to be on the urology and renal/liver transplant surgical services, have higher RCRI scores, and be taking antiplatelet agents, statins, renin-angiotensin system inhibitors, and 3 or more cardiovascular medications in the preoperative period.
Appropriate Medication Reconciliation
Four hundred thirty-six patients (58.0%) had their baseline cardiovascular medications appropriately reconciled. Among all patients with appropriately reconciled medications, 1 (0.2%) had beta-blockers discontinued due to a documented episode of hypotension; 17 (3.9%) had renin-angiotensin system inhibitors discontinued due to episodes of acute kidney injury, hypotension, or hyperkalemia; and 1 (0.2%) had antiplatelet agents discontinued due to bleeding. For individual medications, appropriate reconciliation between the preoperative and discharge periods occurred for 156 of the 327 patients on antiplatelet agents (47.7%), 507 of the 624 patients on beta-blockers (81.3%), 259 of the 361 patients on renin-angiotensin system inhibitors (71.8%), and 302 of the 406 patients on statins (74.4%; Table 2).
Associations Between Medication Reconciliation and Outcomes
Thirty-day outcome data on acute hospital visits were available for 679 (90.3%) patients. Of these, 146 (21.5%) were seen in the ED or were hospitalized, and 111 (16.3%) were seen for an unplanned primary care or surgical outpatient visit at 30 days after surgery. Patients with incomplete outcome data were more likely to have complete medication reconciliation compared with those with complete outcome data (71.2% vs 56.6%, P = 0.02). As shown in Table 3, the proportion of patients with 30-day acute hospital visits was nonstatistically significantly lower in patients with complete medication reconciliation (20.8% vs 22.4%, P = 0.63) and the appropriate reconciliation of beta-blockers (21.9% vs 23.6%, P = 0.71) and renin-angiotensin system inhibitors (19.6% vs 20.0%, P = 0.93), and nonsignificantly higher with the appropriate reconciliation of antiplatelet agents (23.9% vs 19.9%, P = 0.40). Acute hospital visits were statistically significantly lower with the appropriate reconciliation of statins (17.9% vs 31.9%, P = 0.004).
Sensitivity Analysis
Overall, 430 (57.2%) patients had complete cardiovascular medication continuity without considering potential contraindications during hospitalization. Associations between medication continuity and acute hospital and ambulatory visits were similar to the primary analyses.
DISCUSSION
In this study of 752 patients hospitalized for elective noncardiac surgery, we found significant gaps in the appropriate reconciliation of commonly prescribed cardiovascular medications, with inappropriate discontinuation ranging from 18.8% to 52.3% for individual medications. Unplanned postdischarge healthcare utilization was high, with acute hospital visits documented in 21.5% of patients and unplanned ambulatory visits in 16.3% at 30 days after surgery. However, medication reconciliation gaps were not consistently associated with ED visits, hospitalizations, or unplanned ambulatory visits.
Our finding of large gaps in postoperative medication reconciliation is consistent with existing studies of medication reconciliation in surgical patients.9,10,18 One study found medication discrepancies in 40.2% of postoperative patients receiving usual care and discrepancies judged to have the potential to cause harm (such as the omission of beta-blockers) in 29.9%.9 Consistent with our findings, this study also found that most postoperative medication discrepancies were omissions in reordering home medications, though at a rate somewhat higher than those seen in medical patients at discharge.5 While hospitalization by itself increases the risk of unintentional discontinuation of chronic medications,3 our results, along with existing literature, suggest that the risk for omission of chronic medications is unacceptably high.
We also found significant variation in reconciliation among cardiovascular medications, with appropriate reconciliation occurring least frequently for antiplatelet agents and most frequently for beta-blockers. The low rates of appropriate reconciliation for antiplatelet agents may be attributable to deliberate withholding of antiplatelet therapy in the postoperative period based on clinical assessments of surgical bleeding risk in the absence of active bleeding. Perioperative management of antiplatelet agents for noncardiac surgery remains an unclear and controversial topic, which may also contribute to the variation noted.19 Conversely, beta-blockers demonstrated high rates of preoperative use (over 80% of patients) and appropriate reconciliation. Both findings are likely attributable in part to the timing of the study, which began prior to the publication of the Perioperative Ischemic Evaluation trial, which more definitively demonstrated the potential harms of perioperative beta-blocker therapy.20
Despite a high proportion of patients with discontinuous medications at discharge, we found no associations between the appropriate reconciliation of beta-blockers, renin-angiotensin system inhibitors, and antiplatelet agents and acute hospital or ambulatory visits in the first 30 days after discharge. One explanation for this discrepancy is that, although we focused on cardiovascular medications commonly implicated in acute hospital visits, the vast majority of patients in our study had low perioperative cardiovascular risk as assessed by the RCRI. Previous studies have demonstrated that the benefit of perioperative beta-blocker therapy is predominantly in patients with moderate to high perioperative cardiovascular risk.21,22 It is possible that the detrimental effects of the discontinuation of chronic cardiovascular medications are more prominent in populations at a higher risk of perioperative cardiovascular complications or that complications will occur later than 30 days after discharge. Similarly, while the benefits of continuation of renin-angiotensin system inhibitors are less clear,23 few patients in our cohort had a history of congestive heart failure (6.3%) or coronary artery disease (13.0%), 2 conditions in which the impact of perioperative discontinuation of renin-angiotensin inhibitor or beta-blocker therapy would likely be more pronounced.24,25 An additional explanation for the lack of associations is that, while multiple studies have demonstrated that medication errors are common, the proportion of errors with the potential for harm is much lower, and the proportion that causes actual harm is lower still.5,26,27 Thus, while we likely captured high-severity medication errors leading to acute hospital or unplanned ambulatory visits, we would not have captured medication errors with lower severity clinical consequences that did not result in medical encounters.
We did find an association between the continuation of statin therapy and reduced ED visits and hospitalizations. This finding is supported by previous studies of patients undergoing noncardiac surgery, including 1 demonstrating an association between immediate postoperative statin therapy and reduced in-hospital mortality28 and another study demonstrating an association between postoperative statin therapy and reductions in a composite endpoint of 30-day mortality, atrial fibrillation, and nonfatal myocardial infarction.29 Alternatively, this finding could reflect the effects of unaddressed confounding by factors contributing to statin discontinuation and poor health outcomes leading to acute hospital visits, such as acute elevations in liver enzymes.
Our study has important implications for patients undergoing elective noncardiac surgery and the healthcare providers caring for them. First, inappropriate omissions of chronic cardiovascular medications at discharge are common; clinicians should increase their general awareness and focus on appropriately reconciling these medications, for even if our results do not connect medication discontinuity to readmissions or unexpected clinical encounters, their impact on patients’ understanding of their medications remains a potential concern. Second, the overall high rates of unplanned postdischarge healthcare utilization in this study highlight the need for close postdischarge monitoring of patients undergoing elective surgical procedures and for further research to identify preventable etiologies of postdischarge healthcare utilization in this population. Third, further study is needed to identify specific patient populations and medication classes, in which appropriate reconciliation is associated with patient outcomes that may benefit from more intensive discharge medication reconciliation interventions.
Our study has limitations. First, the majority of patients in this single-center study were at low risk of perioperative cardiovascular events, and our results may not be generalizable to higher-risk patients undergoing elective surgery. Second, discharge reconciliation was based on documentation of medication reconciliation and not on patient-reported medication adherence. In addition, the ability to judge the accuracy of discharge medication reconciliation is in part dependent on the accuracy of the admission medication reconciliation. Thus, although we used preoperative medication regimens documented during preadmission visits to comprehensive preoperative clinics for comparison, discrepancies in these preoperative regimens could have affected our analysis of appropriate discharge reconciliation. Third, inadequate documentation of clinical reasons for discontinuing medications may have led to residual confounding by indication in our observational study. Finally, the outcomes available to us may have been relatively insensitive to other adverse effects of medication discontinuity, such as patient symptoms (eg, angina severity), patient awareness of medications, or work placed on primary care physicians needing to “clean up” erroneous medication lists.
In conclusion, gaps in appropriate discharge reconciliation of chronic cardiovascular medications were common but not consistently associated with postdischarge acute hospital or unplanned ambulatory visits in a relatively low-risk cohort of patients undergoing elective surgery. While appropriate medication reconciliation should always be a priority, further study is needed to identify medication reconciliation approaches associated with postdischarge healthcare utilization and other patient outcomes.
Disclosure
Dr. Lee reports receiving grant support from the Health Resources and Services Administration (T32HP19025). Dr. Vittinghoff reports receiving grant support from the Agency for Healthcare Research and Quality. Dr. Auerbach and Dr. Fleischmann report receiving grant support from the National Institutes of Health. Dr. Auerbach also reports receiving honorarium as Editor-in-Chief of the Journal of Hospital Medicine. Dr. Corbett reports receiving grant and travel support from Simon Fraser University. The remaining authors have no disclosures to report.
1. The Joint Commission. National Patient Safety Goals. 2016; https://www.jointcommission.org/standards_information/npsgs.aspx. Accessed June 21, 2016.
2. Institute for Healthcare Improvement. Medication Reconciliation to Prevent Adverse Drug Events. 2016; http://www.ihi.org/topics/ADEsMedicationReconciliation/Pages/default.aspx. Accessed June 24, 2016.
3. Bell CM, Brener SS, Gunraj N, et al. Association of ICU or hospital admission with unintentional discontinuation of medications for chronic diseases. JAMA. 2011;306(8):840-847. PubMed
4. Coleman EA, Smith JD, Raha D, Min SJ. Posthospital medication discrepancies: prevalence and contributing factors. Arch Intern Med. 2005;165(16):1842-1847. PubMed
5. Wong JD, Bajcar JM, Wong GG, et al. Medication reconciliation at hospital discharge: evaluating discrepancies. Ann Pharmacother. 2008;42(10):1373-1379. PubMed
6. Forster AJ, Clark HD, Menard A, et al. Adverse events among medical patients after discharge from hospital. CMAJ. 2004;170(3):345-349. PubMed
7. Forster AJ, Murff HJ, Peterson JF, Gandhi TK, Bates DW. The incidence and severity of adverse events affecting patients after discharge from the hospital. Ann Intern Med. 2003;138(3):161-167. PubMed
8. Forster AJ, Murff HJ, Peterson JF, Gandhi TK, Bates DW. Adverse drug events occurring following hospital discharge. JGIM. 2005;20(4):317-323. PubMed
9. Kwan Y, Fernandes OA, Nagge JJ, et al. Pharmacist medication assessments in a surgical preadmission clinic. Arch Intern Med. 2007;167(10):1034-1040. PubMed
10. Unroe KT, Pfeiffenberger T, Riegelhaupt S, Jastrzembski J, Lokhnygina Y, Colon-Emeric C. Inpatient Medication Reconciliation at Admission and Discharge: A Retrospective Cohort Study of Age and Other Risk Factors for Medication Discrepancies. Am J Geriatr Pharmacother. 2010;8(2):115-126. PubMed
11. CDC - National Center for Health Statistics. Fast Stats: Inpatient Surgery. http://www.cdc.gov/nchs/fastats/inpatient-surgery.htm. Accessed on June 24, 2016.
12. Fleisher LA, Fleischmann KE, Auerbach AD, et al. 2014 ACC/AHA guideline on perioperative cardiovascular evaluation and management of patients undergoing noncardiac surgery: a report of the American College of Cardiology/American Heart Association Task Force on Practice Guidelines. Circulation. 2014;130(24):e278-e333. PubMed
13. Budnitz DS, Lovegrove MC, Shehab N, Richards CL. Emergency hospitalizations for adverse drug events in older Americans. N Engl J Med. 2011;365(21):2002-2012. PubMed
14. Budnitz DS, Pollock DA, Weidenbach KN, Mendelsohn AB, Schroeder TJ, Annest JL. National surveillance of emergency department visits for outpatient adverse drug events. JAMA. 2006;296(15):1858-1866. PubMed
15. Bozic KJ, Maselli J, Pekow PS, Lindenauer PK, Vail TP, Auerbach AD. The influence of procedure volumes and standardization of care on quality and efficiency in total joint replacement surgery. J Bone Joint Surg Am. 2010;92(16):2643-2652. PubMed
16. Nolan T, Berwick DM. All-or-none measurement raises the bar on performance. JAMA. 2006;295(10):1168-1170. PubMed
17. Lee TH, Marcantonio ER, Mangione CM, et al. Derivation and prospective validation of a simple index for prediction of cardiac risk of major noncardiac surgery. Circulation. 1999;100(10):1043-1049. PubMed
18. Gonzalez-Garcia L, Salmeron-Garcia A, Garcia-Lirola MA, Moya-Roldan S, Belda-Rustarazo S, Cabeza-Barrera J. Medication reconciliation at admission to surgical departments. J Eval Clin Pract. 2016;22(1):20-25. PubMed
19. Devereaux PJ, Mrkobrada M, Sessler DI, et al. Aspirin in patients undergoing noncardiac surgery. N Engl J Med. 2014;370(16):1494-1503. PubMed
20. Devereaux PJ, Yang H, Yusuf S, et al. Effects of extended-release metoprolol succinate in patients undergoing non-cardiac surgery (POISE trial): a randomised controlled trial. Lancet. 2008;371(9627):1839-1847. PubMed
21. Lindenauer PK, Pekow P, Wang K, Mamidi DK, Gutierrez B, Benjamin EM. Perioperative beta-blocker therapy and mortality after major noncardiac surgery. N Engl J Med. 2005;353(4):349-361. PubMed
22. London MJ, Hur K, Schwartz GG, Henderson WG. Association of perioperative beta-blockade with mortality and cardiovascular morbidity following major noncardiac surgery. JAMA. 2013;309(16):1704-1713. PubMed
23. Rosenman DJ, McDonald FS, Ebbert JO, Erwin PJ, LaBella M, Montori VM. Clinical consequences of withholding versus administering renin-angiotensin-aldosterone system antagonists in the preoperative period. J Hosp Med. 2008;3(4):319-325. PubMed
24. Andersson C, Merie C, Jorgensen M, et al. Association of beta-blocker therapy with risks of adverse cardiovascular events and deaths in patients with ischemic heart disease undergoing noncardiac surgery: a Danish nationwide cohort study. JAMA Intern Med. 2014;174(3):336-344. PubMed
25. Yancy CW, Jessup M, Bozkurt B, et al. 2013 ACCF/AHA Guideline for the Management of Heart Failure A Report of the American College of Cardiology Foundation/American Heart Association Task Force on Practice Guidelines. Circulation. 2013;128(16):E240-E327. PubMed
26. Kwan JL, Lo L, Sampson M, Shojania KG. Medication reconciliation during transitions of care as a patient safety strategy: a systematic review. Ann Intern Med. 2013;158(5 Pt 2):397-403. PubMed
27. Tam VC, Knowles SR, Cornish PL, Fine N, Marchesano R, Etchells EE. Frequency, type and clinical importance of medication history errors at admission to hospital: a systematic review. CMAJ. 2005;173(5):510-515. PubMed
28. Lindenauer PK, Pekow P, Wang K, Gutierrez B, Benjamin EM. Lipid-lowering therapy and in-hospital mortality following major noncardiac surgery. JAMA. 2004;291(17):2092-2099. PubMed
29. Raju MG, Pachika A, Punnam SR, et al. Statin Therapy in the Reduction of Cardiovascular Events in Patients Undergoing Intermediate-Risk Noncardiac, Nonvascular Surgery. Clin Cardiol. 2013;36(8):456-461. PubMed
© 2017 Society of Hospital Medicine
Reducing HA VTE in 5 Academic Centers
Venous thromboembolism (VTE), comprised of pulmonary embolism (PE) and deep vein thrombosis (DVT), impacts hundreds of thousands of Americans annually.[1] The complications of VTE can be severe, including the post‐thrombotic syndrome, pulmonary hypertension, and complications of anticoagulation. VTE is often a complication of hospitalization, and PE is a common preventable cause of hospital mortality.[2, 3] Pharmacologic VTE prophylaxis (VTEP) in at‐risk patients is effective and endorsed by prominent guidelines.[4, 5, 6] However, VTEP is underutilized, with only 30% to 50% of eligible patients receiving the right drug, dose, and duration.[7, 8]
Public reporting and reimbursement policies reflect the magnitude of VTE as a public health concern. The Centers for Medicare and Medicaid Services (CMS) withholds incremental payment for VTE complications.[9] The rate of hospital‐associated VTE (HA‐VTE) is used by benchmarking organizations as a quality indicator.[10, 11]
The University of California (UC) has 5 major academic medical centers, located in Irvine (UCI), Los Angeles (UCLA), Sacramento (UC Davis [UCD]), San Diego (UCSD), and San Francisco (UCSF). In both 2010 and 2011, almost 700 UC patients suffered from HA‐VTE annually. Barriers to optimal VTEP included the absence of standardized VTE risk assessment, lack of consensus on appropriate VTEP options for various inpatient populations, and a lack of collaborative infrastructure. Other barriers included poor adherence to mechanical prophylaxis and suboptimal measurement of prophylaxis and HA‐VTE outcomes.
In late 2011, leaders from the 5 medical centers, supported by an internal competitive grant from the UC Office of the President and the Center for Health Quality and Innovation, formed a collaborative to address barriers, optimize VTEP in inpatients, and reduce HA‐VTE across the system. Prior efforts at UCSD illustrated single‐center improvement, with an increase in adequate VTEP from 50% to over 95%, and a nearly 40% reduction in the incidence of HA‐VTE.[12] We set out to scale this success across all 5 sites as a coordinated collaborative.
METHODS
This was a prospective, unblinded, open‐intervention study with historical controls that assessed prespecified outcomes before, during, and after institution of multiple VTEP strategies in 5 independent, but cooperating, academic hospitals. All adult medical and surgical inpatients were included; psychiatric, obstetricsgynecology, rehabilitation, observation status, and pediatric populations were excluded. The study period was July 1, 2012 through June 30, 2015. Calendar year (CY) 2011 was the baseline year for comparison; interventions were initiated in CY 2012 to CY 2014, and CY 2014 was considered the mature postintervention period.
Hospital Collaboration
Multiprofessional teams[1] were formed at each site. Monthly webinars, regular e‐mail, minutes, and a project management plan with task lists were utilized for coordinated collaboration. Software (Dropbox) was used for sharing tools, educational materials, and measurement techniques. REDCap (Research Electronic Data Capture) was used for secure data collection and analysis of outcomes.[13] Prior experience at UCSD and the Society of Hospital Medicine informed measurement and intervention bundle strategies.[1, 12, 14] Surveys of baseline VTE prevention protocols, measures, and order sets were performed at each site. Measures were standardized, whereas the intervention bundle was tailored for use at each medical center. Institutional review board approval with a waiver for individualized informed consent was obtained.
Interventions
All sites were tasked with implementing a defined bundle of mutually reinforcing interventions that constituted a comprehensive VTE prevention program. These protocols, order sets, educational programs, and interventions were not designed or implemented in an identical fashion at each hospital, but common principles were utilized.
VTE Prevention Protocol
This protocol incorporated (1) standardized VTE risk assessment, and (2) links to a menu of appropriate prophylaxis options for each level of risk that included guidance for management of patients with contraindications to pharmacologic prophylaxis. We used simple risk‐assessment models that grouped patients into 3 levels of risk (the 3‐bucket model) rather than more complicated point‐based systems. The 3‐bucket model was designed to offer detailed guidance and avoid over‐prophylaxis. Protocol, measurement, and order set tools were modified for special populations, such as orthopedic and neurosurgery populations. Operational definitions for bleeding risk, DVT risk, and exceptions to the protocol were explicit, which allowed for classification of adequate versus inadequate prophylaxis. High‐risk patients required combination prophylaxis, moderate risk anticoagulant prophylaxis, and low risk patients no prophylaxis beyond ambulation protocols (in the absence of contraindications). Acceptable contraindications to pharmacologic prophylaxis included an international normalized ratio >1.8, platelet count <50,000, active hemorrhage within the last 3 days, known bleeding disorders, hypertensive urgencies/emergencies, comfort careonly status, and leeway times around surgery or other events (24 hours for most surgeries, 48 hours for transplant surgery or major trauma, up to a week after central nervous system surgery). Impaired mobility was considered present unless the patient could ambulate independently more than once a day. More details regarding 3‐bucket risk models and explicit criteria can be reviewed in a recent Agency for Healthcare Quality and Research (AHRQ) publication.[1] The protocol was embedded into clinical decision‐support as required elements of admission, transfer, and postoperative order sets.
Educational Programs
Nurse and physician education programs were developed that stressed the importance of VTE prevention and adherence to thromboprophylaxis, including mechanical prophylaxis. The VTEP protocol was socialized in medical staff and nursing meetings. The educational programs recommended imaging only the proximal veins in patients with symptoms of leg DVT, and avoiding screening ultrasounds in asymptomatic patients. Physicians were coached on how to use the VTEP order sets. Content for educational programs was discussed and often shared among sites, but educational programs were tailored locally to fit perceived needs and available resources.
Measure‐vention
An active surveillance and feedback program called measure‐vention was developed to provide ongoing feedback to care providers regarding the appropriate use of VTEP over the duration of hospitalization. Key features of measure‐vention were regular measurement of adherence/lapses in VTEP delivery, coupled with concurrent intervention to correct any lapses, with a nurse/pharmacist calling the primary team if VTEP was suboptimal.[1, 12] Measure‐vention was utilized to monitor both appropriateness of orders and adherence with ordered prophylaxis, and was used to correct overprophylaxis as well as underprophylaxis. For example, our protocol specified that moderate VTE risk patients with a captured contraindication to anticoagulant should be on mechanical prophylaxis. An intervention would take place if mechanical prophylaxis was not ordered, or if it was ordered but not documented as being in place. Measure‐vention examples and further description are available in AHRQ publications.[1]
Outcomes
Thromboprophylaxis Rates
We planned to perform structured chart review on at least 30 noncritical care and 15 critical care adult inpatients per month at each site. Adult inpatients with a length of stay >48 hours, stratified by critical care versus noncritical care status, were assigned a numeric value by a random number generator. Patients were selected in order of random number assignment for chart review until the desired number of audits was completed. Development of the audit tools, as well as availability of personnel, led to delays in assessing prophylaxis rates by these standards until late 2012 to early 2013 at each site. A few sites had brief lapses in data collection during personnel changes. VTE risk, bleeding risk, prophylaxis ordered at the time of the audit, and adequacy of VTEP defined by a common standard were all assessed and recorded in the REDCap data repository. VTEP was considered adequate if combined pharmacologic and mechanical prophylaxis was present in the highest‐risk patients or anticoagulant prophylaxis was present in moderate patients. Prophylaxis was considered adequate for all low‐risk patients. Patients at risk for VTE with contraindications to anticoagulants were considered to be on adequate prophylaxis if they received mechanical prophylaxis or had documented contraindications to mechanical prophylaxis. The proper administration of ordered prophylaxis was scrutinized locally and targeted by education and other interventions at each site, but these data were not collated and analyzed centrally.
Identification of HA‐VTE
HA‐VTE rates were determined by administrative coding data, using International Classification of Diseases, Ninth Revision, Clinical Modification (ICD‐9‐CM) codes in a manner similar to AHRQ Patient Safety Indicator 12 identification of postoperative VTE cases.[10] Data were submitted by each hospital, then collated and analyzed using data from Vizient (formerly the University HealthSystem Consortium). The incidence of VTE was determined using specific ICD‐9‐CM hospital discharge codes: for PE: 415.11, 415.13, 415.19, 673.24; and for DVT: proximal DVT: 451.11, 451.19, 451.81, 453.41; distal DVT: 453.42; and other DVT: 453.40, 453.8. These codes have high positive predictive value for acute VTE.[15, 16] Mean age, average length of stay (ALOS), and admission severity of illness (SOI) scores were also captured from Vizient and summarized for the inpatient cohort each year.
All VTE cases were coupled with present on admission (POA) indicators. HA‐VTE cases included patients who were readmitted to the same hospital within 30 days for a new event (POA = Y, but readmitted), as well as patients who developed PE or DVT during their hospitalization (POA = N or U). Only patients hospitalized for 3 or more days were analyzed for inpatient development of VTE, as diagnosis of VTE in the first 2 days was deemed either likely present on admission or not preventable using VTEP started within 24 hours of admission. VTE outcomes were assigned in a hierarchical fashion: if both PE and DVT were present, the case was classified as PE. Distal DVT was distinguished from proximal DVT whenever possible. Cases were stratified based on whether the patient had undergone a major operation (surgery patients) or not (medical patients). This stratification was based on the Medicare Severity Diagnosis‐Related Group (MS‐DRG) coded in patient records. The DRG type for each MS‐DRG was based on the 2015 CMS‐MS‐DRG codes for major operations,[9] except that all trauma cases were considered surgical, and cases with vena cava filter placement and no other surgical procedure were considered medical. Cancer cases were identified using ICD‐9‐CM codes 140.00‐209.99 and 210.00‐239.99.
Review of HA‐VTE
Periodic review of selected HA‐VTE cases identified by administrative coding data was recommended as a best practice, potentially adding insight to contributing factors to HA‐VTE, included lapses in prophylaxis and suboptimal mobilization. The accuracy of diagnostic coding, and assessment of how HA‐VTE cases were identified (symptoms vs screening ultrasounds) could also be assessed. Examples of audit tools were shared. Every site reviewed some HA‐VTE cases, but the extent and duration of case review was left to the discretion of each site.
Statistical Analysis
Relative risk (RR) calculations with 95% confidence intervals (CI) were used to compare the proportions of patients with PE, DVT alone, and total HA‐VTE in 2014 versus 2011. The absolute risk reduction was multiplied by the population at risk in CY 2014 to arrive at estimates of cases of VTE averted in 2014 compared to 2011.
RESULTS
Robust sampling (421 to 728 patients at each site) revealed attainment of high rates of adequate VTE prophylaxis (82% to 96% at all sites, collectively 89%) by early 2014. Common measures for adequate VTEP were not finalized and collected by all sites until early 2013, so we did not capture baseline VTEP rates, and could not compare baseline to mature prophylaxis rates. Reliable administration of mechanical and anticoagulant prophylaxis was monitored and targeted by each institution, albeit not in an identical fashion at each site. Adherence to mechanical prophylaxis was reported as improved at the sites, but these data were not collated and analyzed centrally.
Population Demographics and Severity of Illness
There were 73,941 to 79,565 discharges that met the criteria (adult medicalsurgical inpatient with >2 day length of stay each year. Mean age and ALOS were unchanged or had no change of clinical significance. For example, in 2011 versus 2014, mean age was 55.7 versus 56.4 years, and ALOS was identical in both time periods at 7.4 days. Admission SOI scores also remained fairly static from 2011 to 2014 (2.27, 2.31, 2.32, 2.26, respectively), and the admission SOI was not statistically different in 2011 versus 2014 (estimated difference of 2 means 0.01, 95% CI: 0.00‐0.02).
Hospital‐Associated VTE
There were 2431 HA‐VTE events observed in 306,906 adult inpatients across CY 2011 to 2014 (Table 1). The baseline incidence of HA‐VTE was 0.90% (667 events in 73,941 hospitalizations in 2011). The incidence of HA‐VTE in the postintervention period was 0.69% (546 HA‐VTE events in 79,565 hospitalizations in 2014, P < 0.001), an overall reduction of 24%. The absolute risk for PE decreased from 0.49% to 0.39% (RR: 0.79, 95% CI: 0.68‐0.92), a reduction of 21%, and the absolute risk of leg DVT fell from 0.41% to 0.30% (RR: 0.73, 95% CI: 0.61‐0.86), a reduction of 27%. Both proximal and distal DVT were reduced significantly. Proximal DVT was much more commonly diagnosed than distal DVT. Proximal DVT incidence decreased from 0.32% to 0.25% (RR: 0.77, 95% CI: 0.64‐0.93), whereas distal DVT incidence decreased from 0.09% to 0.05% (RR: 0.58, 95% CI: 0.39‐0.86). The lower overall VTE rate in the postimplementation period compared with the baseline period corresponds to an estimated 170 fewer cases of VTE per year (89 DVT, 81 PE).
| 2011 (Baseline), No./% | 2012, No./% | 2013, No./% | 2014 (Mature), No./% | 2014 Versus 2011 Relative Risk (95% CI) | 2014 Versus 2011 Estimated Averted Events (95% CI) | |
|---|---|---|---|---|---|---|
| ||||||
| Total discharges (medical and surgical) | 73,941 | 76,100 | 77,300 | 79,565 | ||
| Total PE + leg DVT | 667/0.90% | 650/0.85% | 568/0.73% | 546/0.69% | 0.761 (0.680‐0.852) | 170 (103‐247) |
| Total PE | 363/0.49% | 359/0.47% | 340/0.44% | 309/0.39% | 0.791 (0.680‐0.920) | 81 (32‐135) |
| Total leg DVT | 304/0.41% | 291/0.38% | 228/0.29% | 237/0.3% | 0.725 (0.612‐0.858) | 89(40‐135) |
| Medical discharges | 31,219 | 32,597 | 33,805 | 34,875 | ||
| Total PE + leg DVT | 178/0.57% | 168/0.52% | 164/0.49% | 179/0.51% | 0.900 (0.732‐1.1071) | |
| PE | 110/0.35% | 94/0.29% | 106/0.31% | 104/0.30% | 0.846 (0.648‐1.106) | |
| Leg DVT | 68/0.22% | 74/0.23% | 58/0.17% | 75/0.22% | 0.987 (0.711‐1.371) | |
| Surgical discharges | 42,722 | 43,503 | 43,495 | 44,690 | ||
| Total PE + leg DVT | 489/1.14% | 482/1.11% | 404/0.93% | 367/0.82% | 0.718 (0.627‐0.821) | |
| PE | 253/0.59% | 265/0.61% | 234/0.54% | 205/0.46% | 0.775 (0.645‐0.931) | |
| Leg DVT | 236/0.55% | 217/0.50% | 180/0.41% | 162/0.36% | 0.656 (0.538‐0.801) | |
The baseline rate of HA‐VTE and degree of improvement varied between institutions (Figure 1). UCI and UCD began the study with significantly higher VTE rates, and enjoyed the largest improvements. UCLA's VTE rate decreased to a lesser extent, whereas UCSD and UCSF rates remained relatively flat or were marginally higher. In contrast to the highly variable 2011 baseline rate of HA‐VTE (0.60%1.36%), all 5 sites had HA‐VTE rates within a very narrow range (0.65%0.73%) at maturity in 2014.
Cancer Versus Noncancer Patients
The incidence of HA‐VTE was higher in cancer patients than in noncancer patients. In 2011, 227 of 18,487 (1.23%) cancer patients developed VTE, versus 440 of 55,454 (0.79%) noncancer patients (Figure 2). After implementation of the VTE prevention initiative, the incidence of VTE in cancer patients fell by 0.21% (210 events in 20,544 patients in 2014, 1.02%), and the incidence of VTE in noncancer patients fell by 0.22% (336 events in 59,021 patients, 0.57%). The relative risk of HA‐VTE after the VTE interventions was reduced by 17% (RR: 0.83, 95% CI: 0.69‐1.00) in cancer patients and 28% (RR: 0.72, 95% CI: 0.62‐0.83) in noncancer patients.
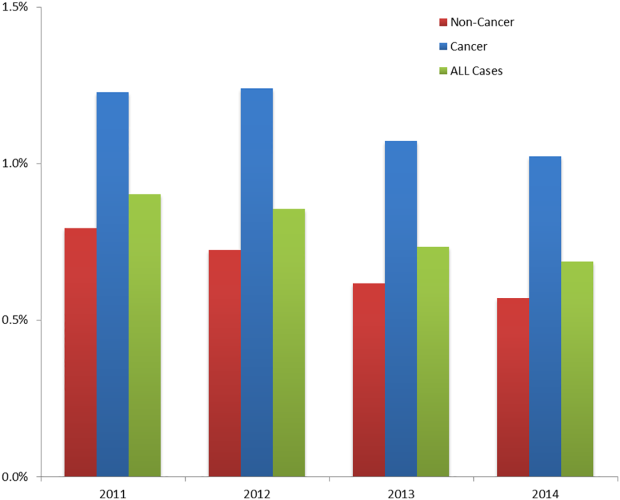
Surgical Versus Medical Patients
The impact of the VTE prevention initiative was only significant in surgical patients, for whom the risk of HA‐VTE fell by 28% (RR: 0.72, 95% CI: 0.63‐0.82) (Table 1). Medical patients experienced a nonsignificant 10% reduction in HA‐VTE (RR: 0.90, 95% CI: 0.73‐1.11). Medical patients had a significantly lower baseline incidence of HA‐VTE (0.57%) compared with surgical patients (1.14%; relative difference: 50%, P < 0.001). This finding persisted postimplementation, with a cumulative incidence in medical patients of 0.51% versus 0.82% in surgical patients (relative difference: 31%, P < 0.001).
DISCUSSION
Our initiative, comprised of a collaborative infrastructure, a proven quality‐improvement framework, and a bundle of interventions, was associated with a 24% reduction in the risk of HA‐VTE across our 5 academic medical centers. This represents avoidance of significant clinical morbidity (an estimated 81 PEs and 89 DVTs per year) and significant cost. Assuming costs of $9250 per DVT and $13,050 per PE,[17] the estimated short‐term cost savings are almost $1.9 million per year (minus expenditures on VTEP). Further savings might be expected over a longer time horizon because of the avoidance of recurrent VTE, post‐thrombotic syndrome, and the costs and complications of long‐term anticoagulation.
We believe the highly variable degree of improvement seen across our 5 sites was due to the relatively mature VTEP efforts at the onset of this collaborative improvement effort at UCSD and UCSF. As we noted earlier, the interventional bundle and methods were derived from earlier work at UCSD that had already demonstrated published marked improvement in prophylaxis and a 40% decrease in HA‐VTE.[14] The narrow range of low HA‐VTE rates in 2014 (the mature intervention time period) suggests there may be some HA‐VTE rate beyond which further prevention efforts are less productive.
Our study has several limitations. As a longitudinal collaborative improvement effort introducing a bundle of interventions, we cannot ascribe improved outcomes to individual components in the bundle; for example, we did not record the number of measure‐vention calls or resulting prophylaxis changes. We also did not measure adverse events due to VTEP, believing benefits to be greater than risks, but some adverse events likely did occur and attenuated benefits and cost savings. Although we had rigorous measures to assess the prevalence of appropriate prophylaxis, we failed to capture the baseline rate of VTEP, which means we cannot show that improved HA‐VTE rates corresponded to improvements in VTEP rates. The bundle of interventions was not implemented uniformly. Some metrics, like adherence to mechanical prophylaxis, were monitored in a decentralized fashion, without collation or collective analysis.
Were improved VTE rates due to decreases in HA‐VTE detection? We could not detect postdischarge HA‐VTE that presented to other hospitals, but we have no reason to think the proportion of missed HA‐VTE changed over the study. We discouraged the practice of routinely extending duplex ultrasound testing below the knee, and also discouraged surveillance of asymptomatic patients with Doppler ultrasound. This raises the question of ascertainment bias. Did we have fewer HA‐VTE in 2014 because our interventions worked, or did we reduce how aggressively we looked for HA‐VTE? Higher frequencies of ultrasound testing are correlated with higher rates of DVT because of surveillance bias.[18] Although some reduction in DVT was due to changes in ultrasound practices, several factors suggest the majority of improvement resulted from our interventions. First, only 1 of our 5 sites (UCD) routinely extended ultrasound testing below the knee in the baseline period. Second, we distinguished distal DVT from proximal/unspecified DVT, and the rates of both showed significant improvement. Screening asymptomatic patients with ultrasounds for DVT was limited to a few services in special circumstances (for example, the trauma service at UCSD screened patients at highest risk who could not be prophylaxed with anticoagulation). We did not have the capability to formally track which patients were being diagnosed with screening exams versus for symptoms, but screen‐detected patients were a small minority. We did not successfully dissuade these few services from stopping this approach, but we did head off some services that were considering this strategy, and think it likely that at best, we kept screening from spreading. Third, PE was reduced by over 20%, in addition to reductions in DVT, even though several of our sites acquired computed tomography scanners more sensitive for small thrombi/emncidental PE. Finally, the aggressiveness of ultrasound testing often goes up with aggressive prevention efforts, which would have led to surveillance bias with increasedrather than decreasedrates of HA‐VTE.
Our study has a number of strengths. Our effort encompassed a large and inclusive adult inpatient population over a long period of observation, with a relatively large reduction in HA‐VTE. These reductions occurred even though the proportion of patients with cancer (our most powerful predictor of VTE risk) was 34.8% in 2014 versus 33.3% in 2011. Our metrics captured patients readmitted to the hospital within 30 days of a prior VTE‐free admission as well as patients suffering VTE during the hospital stay, with the limitation that we captured only patients readmitted back to our own institutions. Our metrics for VTEP scrutinized prophylaxis rates at different points during hospitalizations, and risk‐appropriate prophylaxis was assessed, in contrast to some common regulatory measures that monitor only whether any prophylaxis is in place on the first day of admission or transfer.[11]
Our study should be instructive in terms of focusing improvement efforts. The rate of HA‐VTE was much higher in cancer and surgical patients than in medical patients, and we only achieved a nonsignificant 10% reduction in risk among medical patients (RR: 0.90, 95% CI: 0.73‐1.11). This is consistent with literature demonstrating a more limited benefit of prophylaxis in medical inpatients.[19] Although we continue to recommend prophylaxis in high‐risk medical inpatients, efforts targeting cancer and surgical populations are likely to yield greater results.
Our collaborative used methods that are portable, sustainable, and provide an excellent platform for spread of improvement across a system. The portability of these strategies is underlined by the variable baseline performance and the different stages of electronic health record development at our unique sites. Toolkits that describe the interventions (such as order sets, educational tools, measures, measure‐vention) are freely available, and reflect established guidelines.[1] Our collaborative model is consistent with successful models published in the literature.[1, 14, 20] In these models, clinical experts distill the evidence down into key best practices, and design processes that need to occur with the lowest barriers to use. Metrics, expert advice, and toolkits are assembled centrally, while each hospital identifies local barriers to implementation, educates and engages staff, executes implementation, and continually evaluates performance, modifying interventions accordingly. Embedding clinical decision and risk‐assessment into VTE prevention modules within commonly used order sets and documentation tools helps to hard‐wire the interventions, tightly linking risk assessment to appropriate prophylaxis options. The approach to standardization allows for flexibility for special populations and special needs of unique patients, while minimizing needless variation based on the ordering providers. Program management tools and regular webinars keeps sites on track, coordinate interventions, sustain enthusiasm, and provide a venue for sharing tools and lessons learned. Multiple active interventions are utilized rather than relying on passive educational techniques or order sets alone. Active surveillance (i.e., measure‐vention) deserves special attention. Measure‐vention has demonstrated utility in inpatient glycemic control and a variety of hospital‐associated infections in addition to VTE prevention, and some systems now uses measure‐ventionists as the lynchpin for a whole host of successful improvement programs.[12, 14, 21, 22] We believe high‐quality metrics, standardized protocol‐driven order sets, and measure‐vention are the crucial elements for success.
CONCLUSIONS
Hospital systems can reduce HA‐VTE by implementing a bundle of active interventions including standardized VTEP orders with embedded risk assessment and measure‐vention. Good measurement of HA‐VTE, appropriate VTEP that exceeds minimum regulatory standards, and a robust collaborative infrastructure inform and accelerate improvement. Surgical and cancer populations are at higher risk for HA‐VTE and should be a prime focus of improvement efforts.
Disclosures
Ian H Jenkins: nothing to report. Alpesh N. Amin: nothing to report. Nasim Afsarmanesh: nothing to report. Dr. Auerbach receives honorarium as Editor‐in‐Chief of the Journal of Hospital Medicine. Dr. Khanna has licensed technology to the hospital‐based electronic messaging vendor Voalte and will benefit financially from its dissemination. This does not impact this work. Dr. Maynard acts as a consultant on an expert panel overseeing a multinational trial of extended VTE prophylaxis in high‐risk medical patients (Medically Ill Patient Assessment of Rivaroxaban Versus Placebo in Reducing Post‐Discharge Venous Thrombo‐Embolism Risk), a study funded by Johnson & Johnson. Dr. White has acted as a consultant for Janssen, Boehringer‐Ingleheim, Diiachi‐Sankyo, and Bristol Meyer Squibb, and provides expert testimony for various malpractice defense lawyers for VTE, and has a grant with the Gordon and Betty Moore Foundation regarding VTE prevention.
- . Preventing Hospital‐Associated Venous Thromboembolism: A Guide for Effective Quality Improvement. 2nd ed. Rockville, MD: Agency for Healthcare Research and Quality; October 2015. AHRQ Publication No. 16–001‐EF. Available at: http://www.ahrq.gov/professionals/quality‐patient‐safety/patient‐safety‐resources/resources/vtguide/index.html. Accessed June 1, 2016.
- , , , et al. Relative impact of risk factors for deep vein thrombosis and pulmonary embolism. Arch Intern Med. 2002;162:1245–1248.
- , , , et al. Antithrombotic therapy practices in US hospitals in an era of practice guidelines. Arch Intern Med. 2005;165:1458–1464.
- , , , et al. Prevention of VTE in nonsurgical patients. Chest. 2012;141(2 suppl):e195S–e226S.
- , , , et al. Prevention of VTE in nonorthopedic surgical patients. Chest. 2012;141(2 suppl):e227S–e277S.
- , , , et al. Prevention of VTE in orthopedic surgery patients. Chest. 2012;141(2 suppl):e278S–e325S.
- , , , et al. The outcome after treatment of venous thromboembolism is different in surgical and acutely ill medical patients. Findings from the RIETE registry. J Thromb Haemost. 2004;2:1892–1898.
- , , , . Inpatient thromboprophylaxis use in U.S. hospitals: adherence to the Seventh American College of Chest Physician's recommendations for at‐risk medical and surgical patients. J Hosp Med. 2009;4:E15–E21.
- Centers for Medicare 5(1):10–18.
- , , , et al. Research electronic data capture (REDCap)—a metadata‐driven methodology and workflow process for providing translational research informatics support. J Biomed Inform. 2009;42:377–381.
- , , , et al. Mentored implementation: building leaders and achieving results through a collaborative improvement model. 2011 John M. Eisenberg Patient Safety and Quality Award, National Level. Jt Comm J Qual Patient Saf. 2012;38(7):301–310.
- , , , et al. Predictive value of the POA indicator for hospital‐acquired venous thromboembolism. Med Care. 2013:53(4):e31–e36.
- , , , et al. Improved coding of postoperative deep vein thrombosis and pulmonary embolism in administrative data (AHRQ patient safety indicator 12) after introduction of new ICD‐9‐CM diagnosis codes. Med Care. 2015:53(5):e37–e40.
- . Economic burden of venous thromboembolism in hospitalized patients. Pharmacotherapy. 2009;29(8):943–953.
- , , , et al. Evaluation of surveillance bias and the validity of the venous thromboembolism quality measure. JAMA. 2013;310(14):1482–1489.
- , , , et al. Venous thromboembolism prophylaxis in hospitalized medical patients and those with stroke: a background review for an American College of Physicians clinical practice guideline. Ann Intern Med. 2011;155(9):602–615.
- , , . Translating evidence into practice: a model for large scale knowledge translation. BMJ. 2008; 337:a1714.
- , , , et al. Impact of a hypoglycemia reduction bundle and a systems approach to inpatient glycemic management. Endocr Pract. 2015;21(4):355–367.
- . Zero adverse events: how Dignity Health achieved a new standard. Becker's Hospital Review: Infection Control and Clinical Quality website. Available at: http://www.beckershospitalreview.com/quality/zero‐adverse‐events‐how‐dignity‐health‐achieved‐a‐new‐standard.html. Accessed April 19, 2016.
Venous thromboembolism (VTE), comprised of pulmonary embolism (PE) and deep vein thrombosis (DVT), impacts hundreds of thousands of Americans annually.[1] The complications of VTE can be severe, including the post‐thrombotic syndrome, pulmonary hypertension, and complications of anticoagulation. VTE is often a complication of hospitalization, and PE is a common preventable cause of hospital mortality.[2, 3] Pharmacologic VTE prophylaxis (VTEP) in at‐risk patients is effective and endorsed by prominent guidelines.[4, 5, 6] However, VTEP is underutilized, with only 30% to 50% of eligible patients receiving the right drug, dose, and duration.[7, 8]
Public reporting and reimbursement policies reflect the magnitude of VTE as a public health concern. The Centers for Medicare and Medicaid Services (CMS) withholds incremental payment for VTE complications.[9] The rate of hospital‐associated VTE (HA‐VTE) is used by benchmarking organizations as a quality indicator.[10, 11]
The University of California (UC) has 5 major academic medical centers, located in Irvine (UCI), Los Angeles (UCLA), Sacramento (UC Davis [UCD]), San Diego (UCSD), and San Francisco (UCSF). In both 2010 and 2011, almost 700 UC patients suffered from HA‐VTE annually. Barriers to optimal VTEP included the absence of standardized VTE risk assessment, lack of consensus on appropriate VTEP options for various inpatient populations, and a lack of collaborative infrastructure. Other barriers included poor adherence to mechanical prophylaxis and suboptimal measurement of prophylaxis and HA‐VTE outcomes.
In late 2011, leaders from the 5 medical centers, supported by an internal competitive grant from the UC Office of the President and the Center for Health Quality and Innovation, formed a collaborative to address barriers, optimize VTEP in inpatients, and reduce HA‐VTE across the system. Prior efforts at UCSD illustrated single‐center improvement, with an increase in adequate VTEP from 50% to over 95%, and a nearly 40% reduction in the incidence of HA‐VTE.[12] We set out to scale this success across all 5 sites as a coordinated collaborative.
METHODS
This was a prospective, unblinded, open‐intervention study with historical controls that assessed prespecified outcomes before, during, and after institution of multiple VTEP strategies in 5 independent, but cooperating, academic hospitals. All adult medical and surgical inpatients were included; psychiatric, obstetricsgynecology, rehabilitation, observation status, and pediatric populations were excluded. The study period was July 1, 2012 through June 30, 2015. Calendar year (CY) 2011 was the baseline year for comparison; interventions were initiated in CY 2012 to CY 2014, and CY 2014 was considered the mature postintervention period.
Hospital Collaboration
Multiprofessional teams[1] were formed at each site. Monthly webinars, regular e‐mail, minutes, and a project management plan with task lists were utilized for coordinated collaboration. Software (Dropbox) was used for sharing tools, educational materials, and measurement techniques. REDCap (Research Electronic Data Capture) was used for secure data collection and analysis of outcomes.[13] Prior experience at UCSD and the Society of Hospital Medicine informed measurement and intervention bundle strategies.[1, 12, 14] Surveys of baseline VTE prevention protocols, measures, and order sets were performed at each site. Measures were standardized, whereas the intervention bundle was tailored for use at each medical center. Institutional review board approval with a waiver for individualized informed consent was obtained.
Interventions
All sites were tasked with implementing a defined bundle of mutually reinforcing interventions that constituted a comprehensive VTE prevention program. These protocols, order sets, educational programs, and interventions were not designed or implemented in an identical fashion at each hospital, but common principles were utilized.
VTE Prevention Protocol
This protocol incorporated (1) standardized VTE risk assessment, and (2) links to a menu of appropriate prophylaxis options for each level of risk that included guidance for management of patients with contraindications to pharmacologic prophylaxis. We used simple risk‐assessment models that grouped patients into 3 levels of risk (the 3‐bucket model) rather than more complicated point‐based systems. The 3‐bucket model was designed to offer detailed guidance and avoid over‐prophylaxis. Protocol, measurement, and order set tools were modified for special populations, such as orthopedic and neurosurgery populations. Operational definitions for bleeding risk, DVT risk, and exceptions to the protocol were explicit, which allowed for classification of adequate versus inadequate prophylaxis. High‐risk patients required combination prophylaxis, moderate risk anticoagulant prophylaxis, and low risk patients no prophylaxis beyond ambulation protocols (in the absence of contraindications). Acceptable contraindications to pharmacologic prophylaxis included an international normalized ratio >1.8, platelet count <50,000, active hemorrhage within the last 3 days, known bleeding disorders, hypertensive urgencies/emergencies, comfort careonly status, and leeway times around surgery or other events (24 hours for most surgeries, 48 hours for transplant surgery or major trauma, up to a week after central nervous system surgery). Impaired mobility was considered present unless the patient could ambulate independently more than once a day. More details regarding 3‐bucket risk models and explicit criteria can be reviewed in a recent Agency for Healthcare Quality and Research (AHRQ) publication.[1] The protocol was embedded into clinical decision‐support as required elements of admission, transfer, and postoperative order sets.
Educational Programs
Nurse and physician education programs were developed that stressed the importance of VTE prevention and adherence to thromboprophylaxis, including mechanical prophylaxis. The VTEP protocol was socialized in medical staff and nursing meetings. The educational programs recommended imaging only the proximal veins in patients with symptoms of leg DVT, and avoiding screening ultrasounds in asymptomatic patients. Physicians were coached on how to use the VTEP order sets. Content for educational programs was discussed and often shared among sites, but educational programs were tailored locally to fit perceived needs and available resources.
Measure‐vention
An active surveillance and feedback program called measure‐vention was developed to provide ongoing feedback to care providers regarding the appropriate use of VTEP over the duration of hospitalization. Key features of measure‐vention were regular measurement of adherence/lapses in VTEP delivery, coupled with concurrent intervention to correct any lapses, with a nurse/pharmacist calling the primary team if VTEP was suboptimal.[1, 12] Measure‐vention was utilized to monitor both appropriateness of orders and adherence with ordered prophylaxis, and was used to correct overprophylaxis as well as underprophylaxis. For example, our protocol specified that moderate VTE risk patients with a captured contraindication to anticoagulant should be on mechanical prophylaxis. An intervention would take place if mechanical prophylaxis was not ordered, or if it was ordered but not documented as being in place. Measure‐vention examples and further description are available in AHRQ publications.[1]
Outcomes
Thromboprophylaxis Rates
We planned to perform structured chart review on at least 30 noncritical care and 15 critical care adult inpatients per month at each site. Adult inpatients with a length of stay >48 hours, stratified by critical care versus noncritical care status, were assigned a numeric value by a random number generator. Patients were selected in order of random number assignment for chart review until the desired number of audits was completed. Development of the audit tools, as well as availability of personnel, led to delays in assessing prophylaxis rates by these standards until late 2012 to early 2013 at each site. A few sites had brief lapses in data collection during personnel changes. VTE risk, bleeding risk, prophylaxis ordered at the time of the audit, and adequacy of VTEP defined by a common standard were all assessed and recorded in the REDCap data repository. VTEP was considered adequate if combined pharmacologic and mechanical prophylaxis was present in the highest‐risk patients or anticoagulant prophylaxis was present in moderate patients. Prophylaxis was considered adequate for all low‐risk patients. Patients at risk for VTE with contraindications to anticoagulants were considered to be on adequate prophylaxis if they received mechanical prophylaxis or had documented contraindications to mechanical prophylaxis. The proper administration of ordered prophylaxis was scrutinized locally and targeted by education and other interventions at each site, but these data were not collated and analyzed centrally.
Identification of HA‐VTE
HA‐VTE rates were determined by administrative coding data, using International Classification of Diseases, Ninth Revision, Clinical Modification (ICD‐9‐CM) codes in a manner similar to AHRQ Patient Safety Indicator 12 identification of postoperative VTE cases.[10] Data were submitted by each hospital, then collated and analyzed using data from Vizient (formerly the University HealthSystem Consortium). The incidence of VTE was determined using specific ICD‐9‐CM hospital discharge codes: for PE: 415.11, 415.13, 415.19, 673.24; and for DVT: proximal DVT: 451.11, 451.19, 451.81, 453.41; distal DVT: 453.42; and other DVT: 453.40, 453.8. These codes have high positive predictive value for acute VTE.[15, 16] Mean age, average length of stay (ALOS), and admission severity of illness (SOI) scores were also captured from Vizient and summarized for the inpatient cohort each year.
All VTE cases were coupled with present on admission (POA) indicators. HA‐VTE cases included patients who were readmitted to the same hospital within 30 days for a new event (POA = Y, but readmitted), as well as patients who developed PE or DVT during their hospitalization (POA = N or U). Only patients hospitalized for 3 or more days were analyzed for inpatient development of VTE, as diagnosis of VTE in the first 2 days was deemed either likely present on admission or not preventable using VTEP started within 24 hours of admission. VTE outcomes were assigned in a hierarchical fashion: if both PE and DVT were present, the case was classified as PE. Distal DVT was distinguished from proximal DVT whenever possible. Cases were stratified based on whether the patient had undergone a major operation (surgery patients) or not (medical patients). This stratification was based on the Medicare Severity Diagnosis‐Related Group (MS‐DRG) coded in patient records. The DRG type for each MS‐DRG was based on the 2015 CMS‐MS‐DRG codes for major operations,[9] except that all trauma cases were considered surgical, and cases with vena cava filter placement and no other surgical procedure were considered medical. Cancer cases were identified using ICD‐9‐CM codes 140.00‐209.99 and 210.00‐239.99.
Review of HA‐VTE
Periodic review of selected HA‐VTE cases identified by administrative coding data was recommended as a best practice, potentially adding insight to contributing factors to HA‐VTE, included lapses in prophylaxis and suboptimal mobilization. The accuracy of diagnostic coding, and assessment of how HA‐VTE cases were identified (symptoms vs screening ultrasounds) could also be assessed. Examples of audit tools were shared. Every site reviewed some HA‐VTE cases, but the extent and duration of case review was left to the discretion of each site.
Statistical Analysis
Relative risk (RR) calculations with 95% confidence intervals (CI) were used to compare the proportions of patients with PE, DVT alone, and total HA‐VTE in 2014 versus 2011. The absolute risk reduction was multiplied by the population at risk in CY 2014 to arrive at estimates of cases of VTE averted in 2014 compared to 2011.
RESULTS
Robust sampling (421 to 728 patients at each site) revealed attainment of high rates of adequate VTE prophylaxis (82% to 96% at all sites, collectively 89%) by early 2014. Common measures for adequate VTEP were not finalized and collected by all sites until early 2013, so we did not capture baseline VTEP rates, and could not compare baseline to mature prophylaxis rates. Reliable administration of mechanical and anticoagulant prophylaxis was monitored and targeted by each institution, albeit not in an identical fashion at each site. Adherence to mechanical prophylaxis was reported as improved at the sites, but these data were not collated and analyzed centrally.
Population Demographics and Severity of Illness
There were 73,941 to 79,565 discharges that met the criteria (adult medicalsurgical inpatient with >2 day length of stay each year. Mean age and ALOS were unchanged or had no change of clinical significance. For example, in 2011 versus 2014, mean age was 55.7 versus 56.4 years, and ALOS was identical in both time periods at 7.4 days. Admission SOI scores also remained fairly static from 2011 to 2014 (2.27, 2.31, 2.32, 2.26, respectively), and the admission SOI was not statistically different in 2011 versus 2014 (estimated difference of 2 means 0.01, 95% CI: 0.00‐0.02).
Hospital‐Associated VTE
There were 2431 HA‐VTE events observed in 306,906 adult inpatients across CY 2011 to 2014 (Table 1). The baseline incidence of HA‐VTE was 0.90% (667 events in 73,941 hospitalizations in 2011). The incidence of HA‐VTE in the postintervention period was 0.69% (546 HA‐VTE events in 79,565 hospitalizations in 2014, P < 0.001), an overall reduction of 24%. The absolute risk for PE decreased from 0.49% to 0.39% (RR: 0.79, 95% CI: 0.68‐0.92), a reduction of 21%, and the absolute risk of leg DVT fell from 0.41% to 0.30% (RR: 0.73, 95% CI: 0.61‐0.86), a reduction of 27%. Both proximal and distal DVT were reduced significantly. Proximal DVT was much more commonly diagnosed than distal DVT. Proximal DVT incidence decreased from 0.32% to 0.25% (RR: 0.77, 95% CI: 0.64‐0.93), whereas distal DVT incidence decreased from 0.09% to 0.05% (RR: 0.58, 95% CI: 0.39‐0.86). The lower overall VTE rate in the postimplementation period compared with the baseline period corresponds to an estimated 170 fewer cases of VTE per year (89 DVT, 81 PE).
| 2011 (Baseline), No./% | 2012, No./% | 2013, No./% | 2014 (Mature), No./% | 2014 Versus 2011 Relative Risk (95% CI) | 2014 Versus 2011 Estimated Averted Events (95% CI) | |
|---|---|---|---|---|---|---|
| ||||||
| Total discharges (medical and surgical) | 73,941 | 76,100 | 77,300 | 79,565 | ||
| Total PE + leg DVT | 667/0.90% | 650/0.85% | 568/0.73% | 546/0.69% | 0.761 (0.680‐0.852) | 170 (103‐247) |
| Total PE | 363/0.49% | 359/0.47% | 340/0.44% | 309/0.39% | 0.791 (0.680‐0.920) | 81 (32‐135) |
| Total leg DVT | 304/0.41% | 291/0.38% | 228/0.29% | 237/0.3% | 0.725 (0.612‐0.858) | 89(40‐135) |
| Medical discharges | 31,219 | 32,597 | 33,805 | 34,875 | ||
| Total PE + leg DVT | 178/0.57% | 168/0.52% | 164/0.49% | 179/0.51% | 0.900 (0.732‐1.1071) | |
| PE | 110/0.35% | 94/0.29% | 106/0.31% | 104/0.30% | 0.846 (0.648‐1.106) | |
| Leg DVT | 68/0.22% | 74/0.23% | 58/0.17% | 75/0.22% | 0.987 (0.711‐1.371) | |
| Surgical discharges | 42,722 | 43,503 | 43,495 | 44,690 | ||
| Total PE + leg DVT | 489/1.14% | 482/1.11% | 404/0.93% | 367/0.82% | 0.718 (0.627‐0.821) | |
| PE | 253/0.59% | 265/0.61% | 234/0.54% | 205/0.46% | 0.775 (0.645‐0.931) | |
| Leg DVT | 236/0.55% | 217/0.50% | 180/0.41% | 162/0.36% | 0.656 (0.538‐0.801) | |
The baseline rate of HA‐VTE and degree of improvement varied between institutions (Figure 1). UCI and UCD began the study with significantly higher VTE rates, and enjoyed the largest improvements. UCLA's VTE rate decreased to a lesser extent, whereas UCSD and UCSF rates remained relatively flat or were marginally higher. In contrast to the highly variable 2011 baseline rate of HA‐VTE (0.60%1.36%), all 5 sites had HA‐VTE rates within a very narrow range (0.65%0.73%) at maturity in 2014.
Cancer Versus Noncancer Patients
The incidence of HA‐VTE was higher in cancer patients than in noncancer patients. In 2011, 227 of 18,487 (1.23%) cancer patients developed VTE, versus 440 of 55,454 (0.79%) noncancer patients (Figure 2). After implementation of the VTE prevention initiative, the incidence of VTE in cancer patients fell by 0.21% (210 events in 20,544 patients in 2014, 1.02%), and the incidence of VTE in noncancer patients fell by 0.22% (336 events in 59,021 patients, 0.57%). The relative risk of HA‐VTE after the VTE interventions was reduced by 17% (RR: 0.83, 95% CI: 0.69‐1.00) in cancer patients and 28% (RR: 0.72, 95% CI: 0.62‐0.83) in noncancer patients.
Surgical Versus Medical Patients
The impact of the VTE prevention initiative was only significant in surgical patients, for whom the risk of HA‐VTE fell by 28% (RR: 0.72, 95% CI: 0.63‐0.82) (Table 1). Medical patients experienced a nonsignificant 10% reduction in HA‐VTE (RR: 0.90, 95% CI: 0.73‐1.11). Medical patients had a significantly lower baseline incidence of HA‐VTE (0.57%) compared with surgical patients (1.14%; relative difference: 50%, P < 0.001). This finding persisted postimplementation, with a cumulative incidence in medical patients of 0.51% versus 0.82% in surgical patients (relative difference: 31%, P < 0.001).
DISCUSSION
Our initiative, comprised of a collaborative infrastructure, a proven quality‐improvement framework, and a bundle of interventions, was associated with a 24% reduction in the risk of HA‐VTE across our 5 academic medical centers. This represents avoidance of significant clinical morbidity (an estimated 81 PEs and 89 DVTs per year) and significant cost. Assuming costs of $9250 per DVT and $13,050 per PE,[17] the estimated short‐term cost savings are almost $1.9 million per year (minus expenditures on VTEP). Further savings might be expected over a longer time horizon because of the avoidance of recurrent VTE, post‐thrombotic syndrome, and the costs and complications of long‐term anticoagulation.
We believe the highly variable degree of improvement seen across our 5 sites was due to the relatively mature VTEP efforts at the onset of this collaborative improvement effort at UCSD and UCSF. As we noted earlier, the interventional bundle and methods were derived from earlier work at UCSD that had already demonstrated published marked improvement in prophylaxis and a 40% decrease in HA‐VTE.[14] The narrow range of low HA‐VTE rates in 2014 (the mature intervention time period) suggests there may be some HA‐VTE rate beyond which further prevention efforts are less productive.
Our study has several limitations. As a longitudinal collaborative improvement effort introducing a bundle of interventions, we cannot ascribe improved outcomes to individual components in the bundle; for example, we did not record the number of measure‐vention calls or resulting prophylaxis changes. We also did not measure adverse events due to VTEP, believing benefits to be greater than risks, but some adverse events likely did occur and attenuated benefits and cost savings. Although we had rigorous measures to assess the prevalence of appropriate prophylaxis, we failed to capture the baseline rate of VTEP, which means we cannot show that improved HA‐VTE rates corresponded to improvements in VTEP rates. The bundle of interventions was not implemented uniformly. Some metrics, like adherence to mechanical prophylaxis, were monitored in a decentralized fashion, without collation or collective analysis.
Were improved VTE rates due to decreases in HA‐VTE detection? We could not detect postdischarge HA‐VTE that presented to other hospitals, but we have no reason to think the proportion of missed HA‐VTE changed over the study. We discouraged the practice of routinely extending duplex ultrasound testing below the knee, and also discouraged surveillance of asymptomatic patients with Doppler ultrasound. This raises the question of ascertainment bias. Did we have fewer HA‐VTE in 2014 because our interventions worked, or did we reduce how aggressively we looked for HA‐VTE? Higher frequencies of ultrasound testing are correlated with higher rates of DVT because of surveillance bias.[18] Although some reduction in DVT was due to changes in ultrasound practices, several factors suggest the majority of improvement resulted from our interventions. First, only 1 of our 5 sites (UCD) routinely extended ultrasound testing below the knee in the baseline period. Second, we distinguished distal DVT from proximal/unspecified DVT, and the rates of both showed significant improvement. Screening asymptomatic patients with ultrasounds for DVT was limited to a few services in special circumstances (for example, the trauma service at UCSD screened patients at highest risk who could not be prophylaxed with anticoagulation). We did not have the capability to formally track which patients were being diagnosed with screening exams versus for symptoms, but screen‐detected patients were a small minority. We did not successfully dissuade these few services from stopping this approach, but we did head off some services that were considering this strategy, and think it likely that at best, we kept screening from spreading. Third, PE was reduced by over 20%, in addition to reductions in DVT, even though several of our sites acquired computed tomography scanners more sensitive for small thrombi/emncidental PE. Finally, the aggressiveness of ultrasound testing often goes up with aggressive prevention efforts, which would have led to surveillance bias with increasedrather than decreasedrates of HA‐VTE.
Our study has a number of strengths. Our effort encompassed a large and inclusive adult inpatient population over a long period of observation, with a relatively large reduction in HA‐VTE. These reductions occurred even though the proportion of patients with cancer (our most powerful predictor of VTE risk) was 34.8% in 2014 versus 33.3% in 2011. Our metrics captured patients readmitted to the hospital within 30 days of a prior VTE‐free admission as well as patients suffering VTE during the hospital stay, with the limitation that we captured only patients readmitted back to our own institutions. Our metrics for VTEP scrutinized prophylaxis rates at different points during hospitalizations, and risk‐appropriate prophylaxis was assessed, in contrast to some common regulatory measures that monitor only whether any prophylaxis is in place on the first day of admission or transfer.[11]
Our study should be instructive in terms of focusing improvement efforts. The rate of HA‐VTE was much higher in cancer and surgical patients than in medical patients, and we only achieved a nonsignificant 10% reduction in risk among medical patients (RR: 0.90, 95% CI: 0.73‐1.11). This is consistent with literature demonstrating a more limited benefit of prophylaxis in medical inpatients.[19] Although we continue to recommend prophylaxis in high‐risk medical inpatients, efforts targeting cancer and surgical populations are likely to yield greater results.
Our collaborative used methods that are portable, sustainable, and provide an excellent platform for spread of improvement across a system. The portability of these strategies is underlined by the variable baseline performance and the different stages of electronic health record development at our unique sites. Toolkits that describe the interventions (such as order sets, educational tools, measures, measure‐vention) are freely available, and reflect established guidelines.[1] Our collaborative model is consistent with successful models published in the literature.[1, 14, 20] In these models, clinical experts distill the evidence down into key best practices, and design processes that need to occur with the lowest barriers to use. Metrics, expert advice, and toolkits are assembled centrally, while each hospital identifies local barriers to implementation, educates and engages staff, executes implementation, and continually evaluates performance, modifying interventions accordingly. Embedding clinical decision and risk‐assessment into VTE prevention modules within commonly used order sets and documentation tools helps to hard‐wire the interventions, tightly linking risk assessment to appropriate prophylaxis options. The approach to standardization allows for flexibility for special populations and special needs of unique patients, while minimizing needless variation based on the ordering providers. Program management tools and regular webinars keeps sites on track, coordinate interventions, sustain enthusiasm, and provide a venue for sharing tools and lessons learned. Multiple active interventions are utilized rather than relying on passive educational techniques or order sets alone. Active surveillance (i.e., measure‐vention) deserves special attention. Measure‐vention has demonstrated utility in inpatient glycemic control and a variety of hospital‐associated infections in addition to VTE prevention, and some systems now uses measure‐ventionists as the lynchpin for a whole host of successful improvement programs.[12, 14, 21, 22] We believe high‐quality metrics, standardized protocol‐driven order sets, and measure‐vention are the crucial elements for success.
CONCLUSIONS
Hospital systems can reduce HA‐VTE by implementing a bundle of active interventions including standardized VTEP orders with embedded risk assessment and measure‐vention. Good measurement of HA‐VTE, appropriate VTEP that exceeds minimum regulatory standards, and a robust collaborative infrastructure inform and accelerate improvement. Surgical and cancer populations are at higher risk for HA‐VTE and should be a prime focus of improvement efforts.
Disclosures
Ian H Jenkins: nothing to report. Alpesh N. Amin: nothing to report. Nasim Afsarmanesh: nothing to report. Dr. Auerbach receives honorarium as Editor‐in‐Chief of the Journal of Hospital Medicine. Dr. Khanna has licensed technology to the hospital‐based electronic messaging vendor Voalte and will benefit financially from its dissemination. This does not impact this work. Dr. Maynard acts as a consultant on an expert panel overseeing a multinational trial of extended VTE prophylaxis in high‐risk medical patients (Medically Ill Patient Assessment of Rivaroxaban Versus Placebo in Reducing Post‐Discharge Venous Thrombo‐Embolism Risk), a study funded by Johnson & Johnson. Dr. White has acted as a consultant for Janssen, Boehringer‐Ingleheim, Diiachi‐Sankyo, and Bristol Meyer Squibb, and provides expert testimony for various malpractice defense lawyers for VTE, and has a grant with the Gordon and Betty Moore Foundation regarding VTE prevention.
- . Preventing Hospital‐Associated Venous Thromboembolism: A Guide for Effective Quality Improvement. 2nd ed. Rockville, MD: Agency for Healthcare Research and Quality; October 2015. AHRQ Publication No. 16–001‐EF. Available at: http://www.ahrq.gov/professionals/quality‐patient‐safety/patient‐safety‐resources/resources/vtguide/index.html. Accessed June 1, 2016.
- , , , et al. Relative impact of risk factors for deep vein thrombosis and pulmonary embolism. Arch Intern Med. 2002;162:1245–1248.
- , , , et al. Antithrombotic therapy practices in US hospitals in an era of practice guidelines. Arch Intern Med. 2005;165:1458–1464.
- , , , et al. Prevention of VTE in nonsurgical patients. Chest. 2012;141(2 suppl):e195S–e226S.
- , , , et al. Prevention of VTE in nonorthopedic surgical patients. Chest. 2012;141(2 suppl):e227S–e277S.
- , , , et al. Prevention of VTE in orthopedic surgery patients. Chest. 2012;141(2 suppl):e278S–e325S.
- , , , et al. The outcome after treatment of venous thromboembolism is different in surgical and acutely ill medical patients. Findings from the RIETE registry. J Thromb Haemost. 2004;2:1892–1898.
- , , , . Inpatient thromboprophylaxis use in U.S. hospitals: adherence to the Seventh American College of Chest Physician's recommendations for at‐risk medical and surgical patients. J Hosp Med. 2009;4:E15–E21.
- Centers for Medicare 5(1):10–18.
- , , , et al. Research electronic data capture (REDCap)—a metadata‐driven methodology and workflow process for providing translational research informatics support. J Biomed Inform. 2009;42:377–381.
- , , , et al. Mentored implementation: building leaders and achieving results through a collaborative improvement model. 2011 John M. Eisenberg Patient Safety and Quality Award, National Level. Jt Comm J Qual Patient Saf. 2012;38(7):301–310.
- , , , et al. Predictive value of the POA indicator for hospital‐acquired venous thromboembolism. Med Care. 2013:53(4):e31–e36.
- , , , et al. Improved coding of postoperative deep vein thrombosis and pulmonary embolism in administrative data (AHRQ patient safety indicator 12) after introduction of new ICD‐9‐CM diagnosis codes. Med Care. 2015:53(5):e37–e40.
- . Economic burden of venous thromboembolism in hospitalized patients. Pharmacotherapy. 2009;29(8):943–953.
- , , , et al. Evaluation of surveillance bias and the validity of the venous thromboembolism quality measure. JAMA. 2013;310(14):1482–1489.
- , , , et al. Venous thromboembolism prophylaxis in hospitalized medical patients and those with stroke: a background review for an American College of Physicians clinical practice guideline. Ann Intern Med. 2011;155(9):602–615.
- , , . Translating evidence into practice: a model for large scale knowledge translation. BMJ. 2008; 337:a1714.
- , , , et al. Impact of a hypoglycemia reduction bundle and a systems approach to inpatient glycemic management. Endocr Pract. 2015;21(4):355–367.
- . Zero adverse events: how Dignity Health achieved a new standard. Becker's Hospital Review: Infection Control and Clinical Quality website. Available at: http://www.beckershospitalreview.com/quality/zero‐adverse‐events‐how‐dignity‐health‐achieved‐a‐new‐standard.html. Accessed April 19, 2016.
© 2016 Society of Hospital Medicine

Next 20 Years of Hospital Medicine
In 1995 I took my first job as a hospitalist at a community teaching hospital where hospitalists, though then known as medical directors, had been in place for 20 years. Soon afterward, our field gained a name, and my old job no longer was mistaken for a utilization review functionary or lead of a medical unit.
I have been lucky enough to have seen the field of hospital medicine grow rapidly in scope and importance. The growth of our specialty in mere numbers alone is a testament to the value we in hospital medicine (MDs, DOs, PAs, NPs) bring to the care of acutely ill patients. We are the front line caring for the elderly and vulnerable, the glue holding transdisciplinary care teams together, and lead hospitals, health systems, and governmental organizations. Hospitalists touch the lives of our patients, and shape the health systems' practices and health policy on a national and international scale. These are remarkable achievements for a field which, just a few years ago, was concerned about becoming a job equivalent to perpetual residency training (or worse) and gained only grudging acceptance.[1] There is no doubt that the roles of hospitalists will continue to evolve, and whereas hospitalists will be able to shape the debates and development of new programs solving the problems of our health systems, we must take time to foster the mind, heart, and soul of our field.
When I speak of the mind of hospital medicine, I am thinking of our field's contribution to the evidence for how to care for patients' illnesses, a different body of knowledge than our field's focus to date on hospitals and health systems. Hospital medicine has been growing research capacity at a rate that is slower than the field overall, a problem in part due to limitations in National Institutes of Health funding for fellowships and early‐career awards, which in turn has restricted the pipeline of young and innovative researchers. Slow growth may also be a result of an emphasis on health systems rather than diseases.[2] I and others have written about the need to create mentoring support for junior research faculty as a way to promote success and avoid burnout,[3, 4, 5, 6, 7] and while at least 1 hospital medicine research network exists,[8] there is room for many more. However, at its core, our specialty needs to devote more time and focus to becoming a full scientific partner with our colleagues in cardiology, pulmonary medicine, and critical care, among others. To develop the mind of hospital medicine we will also need to think about our contributions to useful clinical guidelines for care of diseases and patients. Developing trustworthy clinical guidelines can be time consuming[9] but is a key part of ensuring patients and families understand the rationale for changes in clinical care. Hospital medicine as a field has been a leader in programs that develop approaches to implementing evidence and stands in an excellent position toperhaps in collaboration with other specialtiescreate the next‐generation guidelines that are practically minded, evidence based, and end up being used.
The heart I speak of is how we can make sure that the field of hospital medicine is one that is attractive and sustainable as a career. Electronic health records' impact on day‐to‐day work is substantial and a large part of the problem, though a more fundamental problem we face is in how to create sustainable jobs at a time where we are going to need to deliver higher‐value care to more patients with the same number (or fewer) providers. This is an issue that means we need to settle many important aspects of our workpay, relationships with our peers, control over our work on a day‐to‐day basis, hospitalists' work schedules (such as the 7 days on/7 days off model)while we also grapple with how to work within a population‐health framework. I am not prescient enough to see all the solutions to burnout, but there are at least 2 opportunities hospitalists are perhaps best suited to develop and lead. The first is how we arrange our teams in the hospital and afterward. Recent articles have talked about how medicine needs to be open to Uber‐like disruptive models,[10] where labor is deployed in fundamentally different ways. Tools such as e‐consults, the application of population health tools to inpatient care, telemedicine, or some forms of predictive analytics may be examples of these tools, which are routes to allowing more care to be delivered more effectively and more efficiently. Another opportunity lies in how we adapt our electronic health records to our work (and vice versa). The perils of sloppy and paste documentation are indicative of the burden of busywork, the pressures of needing to focus on revenue rather than clinical utility, and exhaustion; hospitalists are well positioned to think about howas payment reform continues to evolvedocumentation can be less busywork and more clinically useful, patient oriented, and shareable across sites and phases of care.
Now to the soul of our field. Hospital medicine has rightly been considered a key partner in developing the solutions hospitals and health systems need to address gaps in quality, safety, value, and clinical outcomes. However, this self‐image of hospital medicine has the downside of being viewed as doctors for hospitals, rather than doctors for patients and families who are in hospitals. As we think about burnout and jobs that are fulfilling and meaningful over the long term, I increasingly return to the factors that motivated me and many others to become physicians: meaningful relationships with patients, being an excellent clinician, and making a lasting contribution to my community through my patient care, support of my colleagues, and teaching younger physicians. It is easy for the pressures of the hospital and need to fix problems rapidly to obscure these larger motivators, but our field will need to ensure that these elements remain how we prioritize and shape our field going forward. Hospital medicine is comprised of physicians who do clinical care and who in most cases entered the field for that reason alone. Using the true north of improving and innovating care in ways that impact patient livesnot just the needs of our hospitalsin meaningful ways will need to be the soul of our field, and will allow the mind and heart of hospitalists and hospital medicine to thrive.
- . The hospitalist movement—time to move on. N Engl J Med. 2007;357(25):2627–2629.
- . An intellectual agenda for hospitalists: lessons from bloodletting. J Hosp Med. 2013;8(7):418–419.
- , , , , , . Mentorship, productivity, and promotion among academic hospitalists. J Gen Intern Med. 2012;27(1):23–27.
- , , , . Investing in the future: building an academic hospitalist faculty development program. J Hosp Med. 2011;6(3):161–166.
- , , , . Survey of US academic hospitalist leaders about mentorship and academic activities in hospitalist groups. J Hosp Med. 2011;6(1):5–9.
- , , , , , . Career satisfaction and burnout in academic hospital medicine. Arch Intern Med. 2011;171(8):782–785.
- , , , , , . Challenges and opportunities in academic hospital medicine: report from the academic hospital medicine summit. J Gen Intern Med. 2009;24(5):636–641.
- , , , et al. The Hospital Medicine Reengineering Network (HOMERuN): a learning organization focused on improving hospital care. Acad Med. 2014;89(3):415–420.
- , , , et al. Clinical practice guidelines we can trust. National Academy of Sciences website. Available at: http://www.nationalacademies.org/hmd/Reports/2011/Clinical‐Practice‐Guidelines‐We‐Can‐Trust.aspx. Published March 23, 2011. Accessed May 20, 2016.
- , . Uber's message for health care. N Engl J Med. 2016;374(9):806–809.
In 1995 I took my first job as a hospitalist at a community teaching hospital where hospitalists, though then known as medical directors, had been in place for 20 years. Soon afterward, our field gained a name, and my old job no longer was mistaken for a utilization review functionary or lead of a medical unit.
I have been lucky enough to have seen the field of hospital medicine grow rapidly in scope and importance. The growth of our specialty in mere numbers alone is a testament to the value we in hospital medicine (MDs, DOs, PAs, NPs) bring to the care of acutely ill patients. We are the front line caring for the elderly and vulnerable, the glue holding transdisciplinary care teams together, and lead hospitals, health systems, and governmental organizations. Hospitalists touch the lives of our patients, and shape the health systems' practices and health policy on a national and international scale. These are remarkable achievements for a field which, just a few years ago, was concerned about becoming a job equivalent to perpetual residency training (or worse) and gained only grudging acceptance.[1] There is no doubt that the roles of hospitalists will continue to evolve, and whereas hospitalists will be able to shape the debates and development of new programs solving the problems of our health systems, we must take time to foster the mind, heart, and soul of our field.
When I speak of the mind of hospital medicine, I am thinking of our field's contribution to the evidence for how to care for patients' illnesses, a different body of knowledge than our field's focus to date on hospitals and health systems. Hospital medicine has been growing research capacity at a rate that is slower than the field overall, a problem in part due to limitations in National Institutes of Health funding for fellowships and early‐career awards, which in turn has restricted the pipeline of young and innovative researchers. Slow growth may also be a result of an emphasis on health systems rather than diseases.[2] I and others have written about the need to create mentoring support for junior research faculty as a way to promote success and avoid burnout,[3, 4, 5, 6, 7] and while at least 1 hospital medicine research network exists,[8] there is room for many more. However, at its core, our specialty needs to devote more time and focus to becoming a full scientific partner with our colleagues in cardiology, pulmonary medicine, and critical care, among others. To develop the mind of hospital medicine we will also need to think about our contributions to useful clinical guidelines for care of diseases and patients. Developing trustworthy clinical guidelines can be time consuming[9] but is a key part of ensuring patients and families understand the rationale for changes in clinical care. Hospital medicine as a field has been a leader in programs that develop approaches to implementing evidence and stands in an excellent position toperhaps in collaboration with other specialtiescreate the next‐generation guidelines that are practically minded, evidence based, and end up being used.
The heart I speak of is how we can make sure that the field of hospital medicine is one that is attractive and sustainable as a career. Electronic health records' impact on day‐to‐day work is substantial and a large part of the problem, though a more fundamental problem we face is in how to create sustainable jobs at a time where we are going to need to deliver higher‐value care to more patients with the same number (or fewer) providers. This is an issue that means we need to settle many important aspects of our workpay, relationships with our peers, control over our work on a day‐to‐day basis, hospitalists' work schedules (such as the 7 days on/7 days off model)while we also grapple with how to work within a population‐health framework. I am not prescient enough to see all the solutions to burnout, but there are at least 2 opportunities hospitalists are perhaps best suited to develop and lead. The first is how we arrange our teams in the hospital and afterward. Recent articles have talked about how medicine needs to be open to Uber‐like disruptive models,[10] where labor is deployed in fundamentally different ways. Tools such as e‐consults, the application of population health tools to inpatient care, telemedicine, or some forms of predictive analytics may be examples of these tools, which are routes to allowing more care to be delivered more effectively and more efficiently. Another opportunity lies in how we adapt our electronic health records to our work (and vice versa). The perils of sloppy and paste documentation are indicative of the burden of busywork, the pressures of needing to focus on revenue rather than clinical utility, and exhaustion; hospitalists are well positioned to think about howas payment reform continues to evolvedocumentation can be less busywork and more clinically useful, patient oriented, and shareable across sites and phases of care.
Now to the soul of our field. Hospital medicine has rightly been considered a key partner in developing the solutions hospitals and health systems need to address gaps in quality, safety, value, and clinical outcomes. However, this self‐image of hospital medicine has the downside of being viewed as doctors for hospitals, rather than doctors for patients and families who are in hospitals. As we think about burnout and jobs that are fulfilling and meaningful over the long term, I increasingly return to the factors that motivated me and many others to become physicians: meaningful relationships with patients, being an excellent clinician, and making a lasting contribution to my community through my patient care, support of my colleagues, and teaching younger physicians. It is easy for the pressures of the hospital and need to fix problems rapidly to obscure these larger motivators, but our field will need to ensure that these elements remain how we prioritize and shape our field going forward. Hospital medicine is comprised of physicians who do clinical care and who in most cases entered the field for that reason alone. Using the true north of improving and innovating care in ways that impact patient livesnot just the needs of our hospitalsin meaningful ways will need to be the soul of our field, and will allow the mind and heart of hospitalists and hospital medicine to thrive.
- . The hospitalist movement—time to move on. N Engl J Med. 2007;357(25):2627–2629.
- . An intellectual agenda for hospitalists: lessons from bloodletting. J Hosp Med. 2013;8(7):418–419.
- , , , , , . Mentorship, productivity, and promotion among academic hospitalists. J Gen Intern Med. 2012;27(1):23–27.
- , , , . Investing in the future: building an academic hospitalist faculty development program. J Hosp Med. 2011;6(3):161–166.
- , , , . Survey of US academic hospitalist leaders about mentorship and academic activities in hospitalist groups. J Hosp Med. 2011;6(1):5–9.
- , , , , , . Career satisfaction and burnout in academic hospital medicine. Arch Intern Med. 2011;171(8):782–785.
- , , , , , . Challenges and opportunities in academic hospital medicine: report from the academic hospital medicine summit. J Gen Intern Med. 2009;24(5):636–641.
- , , , et al. The Hospital Medicine Reengineering Network (HOMERuN): a learning organization focused on improving hospital care. Acad Med. 2014;89(3):415–420.
- , , , et al. Clinical practice guidelines we can trust. National Academy of Sciences website. Available at: http://www.nationalacademies.org/hmd/Reports/2011/Clinical‐Practice‐Guidelines‐We‐Can‐Trust.aspx. Published March 23, 2011. Accessed May 20, 2016.
- , . Uber's message for health care. N Engl J Med. 2016;374(9):806–809.
Patient‐Reported Barriers to Discharge
Thirty‐six million adults were discharged from US hospitals in 2012, with approximately 45% from medicine service lines.[1, 2] Discharge planning, a key aspect of care for hospitalized patients,[3] should involve the development of a plan to enable the patient to be discharged at the appropriate time and with provision of sufficient postdischarge support and services.[4]
Central to the discharge planning process is an assessment of a patient's readiness for discharge. Readiness is often a provider‐driven process, based on specific clinical and health system benchmarks.[5] However, providers' perception of readiness for discharge does not always correlate with patients' self‐assessments or objective measures of understanding.[6] For example, nurses overestimate patients' readiness for discharge compared to patients' own self‐report.[7] As a result, the need to include the patient perspective is increasingly recognized as an important contributing factor in the discharge planning process.[8, 9]
Current approaches to assessing discharge readiness are typically single assessments. However, these assessments do not take into account the complexity of discharge planning or patients' understanding, or their ability to carry out postacute care tasks.[8] In addition, few models have included assessments of physical stability and functional ability along with measures such as ability to manage self‐care activities at home, coping and social support, or access to health system and community resources.[10, 11]
To address these gaps in the existing literature, we carried out a prospective observational study of daily, patient‐reported, assessments of discharge readiness to better understand patients' perspectives on issues that could impede the transition to home. Using these data, we then sought to determine the prevalence of patient‐reported discharge barriers and the frequency with which they were resolved prior to the day of discharge. We also explored whether problems identified at discharge were associated with 30‐day readmission.
METHODS
Study Design, Setting, and Participants
We carried out a prospective observational study at the University of California San Francisco (UCSF) Medical Center, a 600‐bed tertiary care academic hospital in San Francisco, California. The UCSF Committee on Human Research approved this study. We recruited patients between November 2013 and April 2014. Patients were eligible to participate if they were admitted to the General Medicine Service; over 18 years old; English speaking; cognitively able to provide informed consent; and not under contact, droplet, airborne, or radiation isolation. Patients were eligible to participate regardless of where they were admitted from or expected to be discharged (eg, home, skilled nursing facility). Patients were excluded if they were acutely unwell or symptomatic resulting in them being unable to complete the surveys. Caregivers were not able to participate in the study on behalf of patients. We screened daily admission charts for eligibility and approached consecutive patients to consent them into the study on their first or second day of hospitalization. An enrollment tracker was used to documented reasons for patients' exclusion or refusal.
Survey Development
We adapted an existing and validated Readiness for Hospital Discharge Survey (RHDS) previously used in obstetric, surgical, and medicine patients for our study.[10, 11, 12] This initial list was culled from 23 to 12 items, based on input from patients and physicians. This feedback step also prompted a change in the response scale from a 0 to 10 scale to a simpler yes, no, or I would like to talk with someone about this scale intended to encourage discussion between patients and providers. After this revision step, we further pretested the survey among physicians and a small set of general medical patients to assess comprehension. Thus, our final question set included 12 items in 4 domains; personal status (ie, pain, mobility), knowledge (ie, medications, problems to watch for, recovery plan), coping ability (ie, emotional support, who to call with problems), and expected support (ie, related to activities and instrumental activities of daily living).
Data Collection
We collected data from interviews of patients as well as chart abstraction. Trained research assistants approached patients to complete our revised RHDS at admission, which was either on their first or second day of hospitalization. We collected data via an intake admission survey, which asked patients about their readiness for discharge, followed by a daily readiness for discharge survey until the day of discharge. A research assistant read the survey items to patients and recorded responses on a paper version of the survey. We abstracted demographic, clinical, and 30‐day readmission information from each participant's electronic medical record.
Analytic Approach
A barrier to discharge readiness was confirmed when a patient responded no' to an item (except for presence of catheter and pain or discomfort where yes was used) and/or they stated they wanted to talk to someone about the issue. We then used descriptive statistics to summarize patients' responses by survey administration number. Multilevel mixed effect regression was used to investigate any patterns in barriers to discharge over the course of hospitalization. We described the frequency of identified barriers to discharge on the intake admission and final (48 hours of discharge) surveys. McNemar's tests compared the proportion of patients reporting each barrier, and paired t tests the mean number of barriers at these 2 survey time points. We also assessed whether persistent barriers to discharge readiness on the final survey were associated with readmission to our hospital within 30‐days using t tests, 2, or Fisher exact test. Analysis was conducted in SPSS 22.0 (IBM Corp., Armonk, NY) and Stata (StataCorp, College Station, TX).
RESULTS
Patients
There were 2045 patients admitted to the general medicine service during the study period. Medical record screening resulted in 1350 exclusions. Of the remaining 695 patients, 113 refused and 419 were further found to be unable to participate. After all exclusions were applied and following direct screening, 163 patients agreed to participate in our study (Table 1). Mean length of stay among our cohort was 5.42 days (standard deviation [SD], 11.49) and the majority of patients were admitted from and discharged to home (Table 1).
| |
| Mean age, y (SD) | 56.4 (17) |
| Female gender, no. (%) | 86 (53) |
| Race, no. (%) | |
| Asian | 13 (8) |
| African American | 27 (16) |
| White | 96 (59) |
| Other | 24 (25) |
| Declined to say | 3 (1) |
| Married, no. (%) | 78 (48) |
| Insurance, no. (%) | |
| Medicare | 59 (36) |
| Medicaid | 22 (14) |
| Private | 73 (45) |
| Self‐pay | 2 (1) |
| Other | 7 (4) |
| Patient admitted from, no. (%) | |
| Home | 118 (72) |
| Outpatient clinic | 17 (10) |
| Procedural area | 6 (4) |
| Another facility | 12 (7) |
| Other | 9 (6) |
| Patient discharged to, no. (%) | |
| Home without services | 107 (66) |
| Home with services | 40 (25) |
| Home hospice | 2 (1) |
| Skilled nursing facility | 8 (5) |
| Patient deceased | 3 (2) |
| Other | 3 (2) |
Barriers to Discharge Readiness
Patients completed on average 1.82 surveys (SD 1.10; range, 18), and in total 296 surveys were administered. Only 5% of patients were captured on their admission day, whereas 77% of patients were surveyed on their second hospital day (Table 2). Between the first and second survey administration, 51% of patients were lost to follow‐up, and then by the third survey administration a further 37% were lost to follow‐up (Table 3). Patients were unable to be reinterviewed most often because they had been (1) discharged, (2) were unavailable or having a procedure at time of recruitment, or (3) became too sick and symptomatic.
| Hospital Day | ||||||||||
|---|---|---|---|---|---|---|---|---|---|---|
| 1 | 2 | 3 | 4 | 5 | 6 | 7 | 8 | 9 | 10 | |
| No. of eligible patients hospitalized | 163 | 161 | 138 | 102 | 70 | 50 | 35 | 24 | 19 | 17 |
| No. of patients surveyed | 8 | 124 | 70 | 30 | 22 | 13 | 7 | 6 | 2 | 0 |
| % of eligible patients surveyed | 4.9 | 77.0 | 50.7 | 29.4 | 31.4 | 26.0 | 20.0 | 25.0 | 10.5 | 0 |
| Survey No. | ||||||
|---|---|---|---|---|---|---|
| 1 | 2 | 3 | 4 | 5 | 6+ | |
| ||||||
| No. of patients surveyed | 163 | 83 | 31 | 11 | 3 | 5 |
| Total barriers (all patients) | 533 | 235 | 84 | 22 | 7 | 8 |
| No. of barriers per patient, mean (SD) | 3.27(2.35) | 2.83 (2.11) | 2.71 (2.49) | 2.00 (1.73) | 2.33 (2.51) | 1.60 (2.30) |
| Median no. of barriers per patient | 3.0 | 3.0 | 2.0 | 1.0 | 2.0 | 0 |
| Median hospital day of survey administration | 2.0 | 3.0 | 5.0 | 6.0 | 8.0 | 13.0 |
| Initial admission survey, no. (%) | 163 (100.0) | 0 | 0 | 0 | 0 | 0 |
| Follow‐up survey, no. (%) | 0 | 38 (45.8) | 16 (51.6) | 4 (36.4) | 0 | 1 (20.0) |
| Survey 48 hours before discharge, no. (%) | 59 (36.2) | 45 (54.2) | 15 (48.4) | 7 (63.6) | 3 (100.0) | 4 (80.0) |
In total, over 889 individual barriers to discharge readiness were reported across all surveys. The total and mean numbers of barriers were highest on the admission intake survey, and numbers continued to decrease until the fourth survey. On average, the total number of barriers to discharge patients reported decreased by 0.15 (95% confidence interval: 0.01‐0.30) per day (P = 0.047).
Change in Barriers to Discharge
Sixty‐eight patients (42%) completed an admission intake survey as well as final survey 48 hours before discharge (Table 4). We observed a significant reduction in mean number of barriers reported between admission and discharge surveys (3.19 vs 2.53, P = 0.01). Sixty‐one patients (90%) left the hospital with 1 or more persistent barrier to a safe discharge. However, the 3 most common barriers to discharge readiness on the admission and final survey remained the same: unresolved pain, lack of understanding of plan for recovery, and daily living activities (eg, cooking, cleaning, and shopping). The number of patients with unresolved pain appeared to increase slightly, though this rise was not statistically significant. In contrast, there were significant reductions in patients reporting they were unaware of problems to watch out for postdischarge (28% vs 16%; P = 0.04) or did not understand their recovery plan (52% vs 40%; P = 0.03).
| Barrier to Discharge | Survey | |
|---|---|---|
| Admission, No. (%) | Final Survey, No. (%) | |
| ||
| Catheter is present? | 6 (7.2) | 6 (7.2) |
| Not out of bed, sitting in a chair, or walking? | 17 (20.5) | 13 (15.7) |
| Pain or discomfort? | 50 (60.2) | 52 (62.7) |
| Unable to get to the bathroom for toilet or to shower? | 15 (18.1) | 12 (14.5) |
| Unable to self‐care without help from others? | 27 (32.5) | 23 (27.7) |
| Unable to get your own medications? | 11 (13.3) | 14 (16.9) |
| Know what problems to watch for?* | 23 (27.7) | 13 (15.7) |
| Know where to call if you had problems? | 10 (12.0) | 8 (9.6) |
| Inability for personal care such as bathing, toileting, and eating? | 8 (9.6) | 11 (13.3) |
| Lack of support for emotional needs? | 16 (19.3) | 9 (10.8) |
| Unable to cook, clean, or do shopping? | 33 (39.8) | 25 (30.1) |
| Do not understand the overall plan for your recovery?* | 43 (51.8) | 33 (39.8) |
DISCUSSION
Assessing discharge readiness highlights an opportunity to engage patients directly in their discharge planning process. However, our prospective study of 163 hospitalized adults revealed that unresolved discharge barriers were common; 90% of patients were discharged with at least 1 issue that might inhibit an effective transition home. The majority of these patients were also discharged home without any support services. In addition, many of the major barriers patients reportedpain, lack of understanding around plans, and ability to provide self‐carewere consistent from admission to discharge, suggesting a missed opportunity to address problems present early in a patient's stay.
Some of the issues our patients described, such as pain; lack of understanding of a recovery plan; and functional, social, and environmental vulnerabilities that impede recovery, have been described in studies using data collected in the postacute time period.[13, 14, 15] Focus on postacute barriers is likely to be of limited clinical utility to assist in any real‐time discharge planning, particularly planning that assesses individual patients' needs and tailors programs and education appropriately. Having said this, consistency between our results and data collected from postdischarge patients again supports broad areas of improvement for health systems.
Persistent gaps in care at discharge may be a result of limited standardization of discharge processes and a lack of engagement in obtaining patient‐reported concerns. Lack of a framework for preparing individual patients for discharge has been recognized as a significant obstacle to effective discharge planning. For example, Hesselink et al.'s qualitative study with almost 200 patients and providers across multiple institutions described how lack of a standard approach to providing discharge planning resulted in gaps in information provision.[16] Similarly, Horwitz et al. described wide variation in discharge practices at a US academic medical center, suggesting lack of a standard approach to identifying patient needs.[14]
Although many transitions of care programs have supported implementation of specific care interventions at a hospital or health system level, there have been surprisingly few studies describing efforts to standardize the assessment of discharge barriers and prospectively engage individual patients.[17] One emblematic study used stakeholder interviews and process mapping to develop a readiness report within their electronic medical record (EMR).[17] Aggregate data from the EMR including orders and discharge plans were coded, extracted, and summarized into a report. The overall goal of the report was to identify progress toward completion of discharge tasks; however, a limitation was that it did not explicitly include patient self‐assessments. Another study by Grimmer et al. describes the development of a patient‐centered discharge checklist that incorporated patients and care concerns.[18] The themes incorporated into this checklist cover many transitional issues; however, outside of the checklist's development, few publications or Web resources describe it in actual use.
Our approach may represent an advance in approaches to engaging patients in discharge planning and preparing patients for leaving the hospital. Although our data do not support efficacy of our daily surveys in terms of improving discharge planning, this initial evaluation provides the framework upon which providers can develop discharge plans that are both standardized in terms of using a structured multidomain communication tool to elicit barriers, as well as patient‐centered and patient‐directed, by using the information collected in the survey tool to initiate tailored discharge planning earlier in the hospital stay. However, our program points out an important limitation of an entirely patient‐initiated program, which is difficulty obtaining truly daily assessments. During this study, we had a single research assistant visit patients as frequently as possible during hospitalization, but even daily visits did not yield complete information on all patients. Although this limitation may in part be due to the fact that our study was a focused pilot of an approach we hope to expand, it also represents the complexity of patient experience in the hospital, where patients are often out of their room for tests, are unable to complete a survey because of problematic symptoms, or simply are unwilling or unable to participate in regular surveys.
Our study has a number of limitations. First, the number of patients in our study overall, and the number who completed at least 2 surveys, was relatively small, limiting the generalizability of the study and our ability to determine the true prevalence of unresolved barriers at discharge. In addition, our selection criteria and response rates have limited our sample in that our final group may not be representative of all patients admitted to our medicine service. The broad exclusion of patients who had physical or psychosocial barriers, and those who were acutely unwell and symptomatic, has the potential to introduce selection bias given the excluded populations are those most at risk of readmission. We also acknowledge that some of the issues that patients' are reporting may be chronic ones. However, given the fact that patients feel these issues, even if chronic, are unaddressed or that they want to talk with their doctor about them, is still a very large potential gap in care and patient engagement.
However, despite these limitations, which seem most likely to produce a cohort that is more likely to be able to participate in our survey, and in turn more likely to participate in their care more broadly, we still observed disappointing resolution of discharge barriers. In addition, our adapted survey instrument, though based on well‐supported conceptual frameworks,[19] has not been extensively tested outside of our hospital setting. Finally, as a single‐center study, our results cannot be generalized to other settings.
Assessing discharge readiness highlights an opportunity to obtain patient self‐reported barriers to discharge. This can facilitate discharge planning that targets individual patient needs. This information also emphasizes potentially fruitful opportunities for improved communication and education activities, potentially if these data are fed back to providers in real time, potentially as part of team‐based dashboards or the context of interdisciplinary team models.
Acknowledgements
The authors thank all of the patients who participated in this project, and Yimdriuska Magan Gigi for her assistance with chart abstractions. The authors also acknowledge and thank John Boscardin for his statistical and analytic support.
Disclosures: James D. Harrison, and Drs. Ryan S. Greysen and Andrew D. Auerbach contributed to the concept, design, analysis, interpretation of data, drafting of the manuscript, critical revisions to the manuscript, and final approval of manuscript. Ronald Jacolbia and Alice Nguyen contributed to the acquisition of data, drafting and final approval of manuscript and project, and administrative and technical support. Dr. Auerbach was supported by National Heart, Lung, and Blood Institute grant K24 K24HL098372. Dr. Greysen is supported by the National Institutes of Health (NIH), National Institute of Aging (NIA) through the Claude D. Pepper Older Americans Independence Center (P30AG021342 NIH/NIA and K23AG045338‐01). The authors have no financial or other conflicts of interest to declare.
- , , . Trends and projections in inpatient hospital costs and utilization 2003–2013. HCUP statistical brief #175. July 2014. Rockville, MD: Agency for Healthcare Research and Quality; 2014.
- , . Overview of hospital stays in the United States 2012. HCUP statistical brief #180. October 2014. Rockville, MD: Agency for Healthcare Research and Quality; 2014.
- Joint Commision. The Joint Commission Comprehensive Accreditation Manual for Hospitals. Oak Brook, IL: The Joint Commission; 2015.
- , , . Hospital discharge and readmission. In: Post TW, ed. UpToDate website: Available at: http://www.uptodate.com/contents/hospital‐discharge‐and‐readmission. Accessed August 14, 2015.
- , . A patient centered model of care for hospital discharge. Clin Nurse Res. 2004;13:117–136.
- , , , , , . Which reasons do doctors, nurses and patients have for hospital discharge? A mixed methods study. PLoS One. 2014;9:e91333.
- , , . Nurse and patient perceptions of discharge readiness in relation to postdischarge utilization. Med Care. 2010;48:482–486.
- , . Older people's perception of their readiness for discharge and postdischarge use of community support and services. Int J Older People Nurs. 2013;8:104–115.
- , , , . The care transitions intervention: Results of a randomized controlled trial. Arch Intern Med. 2006;166:1822–1828.
- , . Psychometric properties of the Readiness for Hospital Discharge Scale. J Nurs Meas. 2006;14:163–180.
- , , , et al. Perceived readiness for hospital discharge in adult medical‐surgical patients. Clin Nurse Spec. 2007;21:31–42.
- , , , . Validation of patient and nurse short forms of the Readiness for Hospital Discharge Scale and their relationship to return to the hospital. Health Serv Res. 2014;49:304–317.
- , , , et al. “Missing Pieces”—functional, social and environmental barriers to recovery for vulnerable older adults transitioning from hospital to home. J Am Geriatr Soc. 2014;62:1556–1561.
- , , , et al. Quality of discharge practices and patient understanding at an academic medical center. JAMA Intern Med. 2013;173:1715–1722.
- , , . Brief scale measuring patient prepardeness for hospital discharge to home: Psychometric properties. J Hosp Med. 2008;3:446–454.
- , , , et al. Improving patient discharge and reducing hospital readmission by using intervention mapping. BMC Health Serv Res. 2014;14:389.
- , , , , , . Development of a discharge readiness report within the electronic health record: a discharge planning tool. J Hosp Med. 2014;9:533–539.
- , , , . Incorporating Patient and Carer Concerns in Discharge Plans: The Development of a Practical Patient‐Centred Checklist. The Internet Journal of Allied Health Sciences and Practice. 2006;4: Article 5.
- , , , . Identifying keys to success in reducing readmissions using the ideal transitions in care framework. BMC Health Serv Res. 2014;14:423.
Thirty‐six million adults were discharged from US hospitals in 2012, with approximately 45% from medicine service lines.[1, 2] Discharge planning, a key aspect of care for hospitalized patients,[3] should involve the development of a plan to enable the patient to be discharged at the appropriate time and with provision of sufficient postdischarge support and services.[4]
Central to the discharge planning process is an assessment of a patient's readiness for discharge. Readiness is often a provider‐driven process, based on specific clinical and health system benchmarks.[5] However, providers' perception of readiness for discharge does not always correlate with patients' self‐assessments or objective measures of understanding.[6] For example, nurses overestimate patients' readiness for discharge compared to patients' own self‐report.[7] As a result, the need to include the patient perspective is increasingly recognized as an important contributing factor in the discharge planning process.[8, 9]
Current approaches to assessing discharge readiness are typically single assessments. However, these assessments do not take into account the complexity of discharge planning or patients' understanding, or their ability to carry out postacute care tasks.[8] In addition, few models have included assessments of physical stability and functional ability along with measures such as ability to manage self‐care activities at home, coping and social support, or access to health system and community resources.[10, 11]
To address these gaps in the existing literature, we carried out a prospective observational study of daily, patient‐reported, assessments of discharge readiness to better understand patients' perspectives on issues that could impede the transition to home. Using these data, we then sought to determine the prevalence of patient‐reported discharge barriers and the frequency with which they were resolved prior to the day of discharge. We also explored whether problems identified at discharge were associated with 30‐day readmission.
METHODS
Study Design, Setting, and Participants
We carried out a prospective observational study at the University of California San Francisco (UCSF) Medical Center, a 600‐bed tertiary care academic hospital in San Francisco, California. The UCSF Committee on Human Research approved this study. We recruited patients between November 2013 and April 2014. Patients were eligible to participate if they were admitted to the General Medicine Service; over 18 years old; English speaking; cognitively able to provide informed consent; and not under contact, droplet, airborne, or radiation isolation. Patients were eligible to participate regardless of where they were admitted from or expected to be discharged (eg, home, skilled nursing facility). Patients were excluded if they were acutely unwell or symptomatic resulting in them being unable to complete the surveys. Caregivers were not able to participate in the study on behalf of patients. We screened daily admission charts for eligibility and approached consecutive patients to consent them into the study on their first or second day of hospitalization. An enrollment tracker was used to documented reasons for patients' exclusion or refusal.
Survey Development
We adapted an existing and validated Readiness for Hospital Discharge Survey (RHDS) previously used in obstetric, surgical, and medicine patients for our study.[10, 11, 12] This initial list was culled from 23 to 12 items, based on input from patients and physicians. This feedback step also prompted a change in the response scale from a 0 to 10 scale to a simpler yes, no, or I would like to talk with someone about this scale intended to encourage discussion between patients and providers. After this revision step, we further pretested the survey among physicians and a small set of general medical patients to assess comprehension. Thus, our final question set included 12 items in 4 domains; personal status (ie, pain, mobility), knowledge (ie, medications, problems to watch for, recovery plan), coping ability (ie, emotional support, who to call with problems), and expected support (ie, related to activities and instrumental activities of daily living).
Data Collection
We collected data from interviews of patients as well as chart abstraction. Trained research assistants approached patients to complete our revised RHDS at admission, which was either on their first or second day of hospitalization. We collected data via an intake admission survey, which asked patients about their readiness for discharge, followed by a daily readiness for discharge survey until the day of discharge. A research assistant read the survey items to patients and recorded responses on a paper version of the survey. We abstracted demographic, clinical, and 30‐day readmission information from each participant's electronic medical record.
Analytic Approach
A barrier to discharge readiness was confirmed when a patient responded no' to an item (except for presence of catheter and pain or discomfort where yes was used) and/or they stated they wanted to talk to someone about the issue. We then used descriptive statistics to summarize patients' responses by survey administration number. Multilevel mixed effect regression was used to investigate any patterns in barriers to discharge over the course of hospitalization. We described the frequency of identified barriers to discharge on the intake admission and final (48 hours of discharge) surveys. McNemar's tests compared the proportion of patients reporting each barrier, and paired t tests the mean number of barriers at these 2 survey time points. We also assessed whether persistent barriers to discharge readiness on the final survey were associated with readmission to our hospital within 30‐days using t tests, 2, or Fisher exact test. Analysis was conducted in SPSS 22.0 (IBM Corp., Armonk, NY) and Stata (StataCorp, College Station, TX).
RESULTS
Patients
There were 2045 patients admitted to the general medicine service during the study period. Medical record screening resulted in 1350 exclusions. Of the remaining 695 patients, 113 refused and 419 were further found to be unable to participate. After all exclusions were applied and following direct screening, 163 patients agreed to participate in our study (Table 1). Mean length of stay among our cohort was 5.42 days (standard deviation [SD], 11.49) and the majority of patients were admitted from and discharged to home (Table 1).
| |
| Mean age, y (SD) | 56.4 (17) |
| Female gender, no. (%) | 86 (53) |
| Race, no. (%) | |
| Asian | 13 (8) |
| African American | 27 (16) |
| White | 96 (59) |
| Other | 24 (25) |
| Declined to say | 3 (1) |
| Married, no. (%) | 78 (48) |
| Insurance, no. (%) | |
| Medicare | 59 (36) |
| Medicaid | 22 (14) |
| Private | 73 (45) |
| Self‐pay | 2 (1) |
| Other | 7 (4) |
| Patient admitted from, no. (%) | |
| Home | 118 (72) |
| Outpatient clinic | 17 (10) |
| Procedural area | 6 (4) |
| Another facility | 12 (7) |
| Other | 9 (6) |
| Patient discharged to, no. (%) | |
| Home without services | 107 (66) |
| Home with services | 40 (25) |
| Home hospice | 2 (1) |
| Skilled nursing facility | 8 (5) |
| Patient deceased | 3 (2) |
| Other | 3 (2) |
Barriers to Discharge Readiness
Patients completed on average 1.82 surveys (SD 1.10; range, 18), and in total 296 surveys were administered. Only 5% of patients were captured on their admission day, whereas 77% of patients were surveyed on their second hospital day (Table 2). Between the first and second survey administration, 51% of patients were lost to follow‐up, and then by the third survey administration a further 37% were lost to follow‐up (Table 3). Patients were unable to be reinterviewed most often because they had been (1) discharged, (2) were unavailable or having a procedure at time of recruitment, or (3) became too sick and symptomatic.
| Hospital Day | ||||||||||
|---|---|---|---|---|---|---|---|---|---|---|
| 1 | 2 | 3 | 4 | 5 | 6 | 7 | 8 | 9 | 10 | |
| No. of eligible patients hospitalized | 163 | 161 | 138 | 102 | 70 | 50 | 35 | 24 | 19 | 17 |
| No. of patients surveyed | 8 | 124 | 70 | 30 | 22 | 13 | 7 | 6 | 2 | 0 |
| % of eligible patients surveyed | 4.9 | 77.0 | 50.7 | 29.4 | 31.4 | 26.0 | 20.0 | 25.0 | 10.5 | 0 |
| Survey No. | ||||||
|---|---|---|---|---|---|---|
| 1 | 2 | 3 | 4 | 5 | 6+ | |
| ||||||
| No. of patients surveyed | 163 | 83 | 31 | 11 | 3 | 5 |
| Total barriers (all patients) | 533 | 235 | 84 | 22 | 7 | 8 |
| No. of barriers per patient, mean (SD) | 3.27(2.35) | 2.83 (2.11) | 2.71 (2.49) | 2.00 (1.73) | 2.33 (2.51) | 1.60 (2.30) |
| Median no. of barriers per patient | 3.0 | 3.0 | 2.0 | 1.0 | 2.0 | 0 |
| Median hospital day of survey administration | 2.0 | 3.0 | 5.0 | 6.0 | 8.0 | 13.0 |
| Initial admission survey, no. (%) | 163 (100.0) | 0 | 0 | 0 | 0 | 0 |
| Follow‐up survey, no. (%) | 0 | 38 (45.8) | 16 (51.6) | 4 (36.4) | 0 | 1 (20.0) |
| Survey 48 hours before discharge, no. (%) | 59 (36.2) | 45 (54.2) | 15 (48.4) | 7 (63.6) | 3 (100.0) | 4 (80.0) |
In total, over 889 individual barriers to discharge readiness were reported across all surveys. The total and mean numbers of barriers were highest on the admission intake survey, and numbers continued to decrease until the fourth survey. On average, the total number of barriers to discharge patients reported decreased by 0.15 (95% confidence interval: 0.01‐0.30) per day (P = 0.047).
Change in Barriers to Discharge
Sixty‐eight patients (42%) completed an admission intake survey as well as final survey 48 hours before discharge (Table 4). We observed a significant reduction in mean number of barriers reported between admission and discharge surveys (3.19 vs 2.53, P = 0.01). Sixty‐one patients (90%) left the hospital with 1 or more persistent barrier to a safe discharge. However, the 3 most common barriers to discharge readiness on the admission and final survey remained the same: unresolved pain, lack of understanding of plan for recovery, and daily living activities (eg, cooking, cleaning, and shopping). The number of patients with unresolved pain appeared to increase slightly, though this rise was not statistically significant. In contrast, there were significant reductions in patients reporting they were unaware of problems to watch out for postdischarge (28% vs 16%; P = 0.04) or did not understand their recovery plan (52% vs 40%; P = 0.03).
| Barrier to Discharge | Survey | |
|---|---|---|
| Admission, No. (%) | Final Survey, No. (%) | |
| ||
| Catheter is present? | 6 (7.2) | 6 (7.2) |
| Not out of bed, sitting in a chair, or walking? | 17 (20.5) | 13 (15.7) |
| Pain or discomfort? | 50 (60.2) | 52 (62.7) |
| Unable to get to the bathroom for toilet or to shower? | 15 (18.1) | 12 (14.5) |
| Unable to self‐care without help from others? | 27 (32.5) | 23 (27.7) |
| Unable to get your own medications? | 11 (13.3) | 14 (16.9) |
| Know what problems to watch for?* | 23 (27.7) | 13 (15.7) |
| Know where to call if you had problems? | 10 (12.0) | 8 (9.6) |
| Inability for personal care such as bathing, toileting, and eating? | 8 (9.6) | 11 (13.3) |
| Lack of support for emotional needs? | 16 (19.3) | 9 (10.8) |
| Unable to cook, clean, or do shopping? | 33 (39.8) | 25 (30.1) |
| Do not understand the overall plan for your recovery?* | 43 (51.8) | 33 (39.8) |
DISCUSSION
Assessing discharge readiness highlights an opportunity to engage patients directly in their discharge planning process. However, our prospective study of 163 hospitalized adults revealed that unresolved discharge barriers were common; 90% of patients were discharged with at least 1 issue that might inhibit an effective transition home. The majority of these patients were also discharged home without any support services. In addition, many of the major barriers patients reportedpain, lack of understanding around plans, and ability to provide self‐carewere consistent from admission to discharge, suggesting a missed opportunity to address problems present early in a patient's stay.
Some of the issues our patients described, such as pain; lack of understanding of a recovery plan; and functional, social, and environmental vulnerabilities that impede recovery, have been described in studies using data collected in the postacute time period.[13, 14, 15] Focus on postacute barriers is likely to be of limited clinical utility to assist in any real‐time discharge planning, particularly planning that assesses individual patients' needs and tailors programs and education appropriately. Having said this, consistency between our results and data collected from postdischarge patients again supports broad areas of improvement for health systems.
Persistent gaps in care at discharge may be a result of limited standardization of discharge processes and a lack of engagement in obtaining patient‐reported concerns. Lack of a framework for preparing individual patients for discharge has been recognized as a significant obstacle to effective discharge planning. For example, Hesselink et al.'s qualitative study with almost 200 patients and providers across multiple institutions described how lack of a standard approach to providing discharge planning resulted in gaps in information provision.[16] Similarly, Horwitz et al. described wide variation in discharge practices at a US academic medical center, suggesting lack of a standard approach to identifying patient needs.[14]
Although many transitions of care programs have supported implementation of specific care interventions at a hospital or health system level, there have been surprisingly few studies describing efforts to standardize the assessment of discharge barriers and prospectively engage individual patients.[17] One emblematic study used stakeholder interviews and process mapping to develop a readiness report within their electronic medical record (EMR).[17] Aggregate data from the EMR including orders and discharge plans were coded, extracted, and summarized into a report. The overall goal of the report was to identify progress toward completion of discharge tasks; however, a limitation was that it did not explicitly include patient self‐assessments. Another study by Grimmer et al. describes the development of a patient‐centered discharge checklist that incorporated patients and care concerns.[18] The themes incorporated into this checklist cover many transitional issues; however, outside of the checklist's development, few publications or Web resources describe it in actual use.
Our approach may represent an advance in approaches to engaging patients in discharge planning and preparing patients for leaving the hospital. Although our data do not support efficacy of our daily surveys in terms of improving discharge planning, this initial evaluation provides the framework upon which providers can develop discharge plans that are both standardized in terms of using a structured multidomain communication tool to elicit barriers, as well as patient‐centered and patient‐directed, by using the information collected in the survey tool to initiate tailored discharge planning earlier in the hospital stay. However, our program points out an important limitation of an entirely patient‐initiated program, which is difficulty obtaining truly daily assessments. During this study, we had a single research assistant visit patients as frequently as possible during hospitalization, but even daily visits did not yield complete information on all patients. Although this limitation may in part be due to the fact that our study was a focused pilot of an approach we hope to expand, it also represents the complexity of patient experience in the hospital, where patients are often out of their room for tests, are unable to complete a survey because of problematic symptoms, or simply are unwilling or unable to participate in regular surveys.
Our study has a number of limitations. First, the number of patients in our study overall, and the number who completed at least 2 surveys, was relatively small, limiting the generalizability of the study and our ability to determine the true prevalence of unresolved barriers at discharge. In addition, our selection criteria and response rates have limited our sample in that our final group may not be representative of all patients admitted to our medicine service. The broad exclusion of patients who had physical or psychosocial barriers, and those who were acutely unwell and symptomatic, has the potential to introduce selection bias given the excluded populations are those most at risk of readmission. We also acknowledge that some of the issues that patients' are reporting may be chronic ones. However, given the fact that patients feel these issues, even if chronic, are unaddressed or that they want to talk with their doctor about them, is still a very large potential gap in care and patient engagement.
However, despite these limitations, which seem most likely to produce a cohort that is more likely to be able to participate in our survey, and in turn more likely to participate in their care more broadly, we still observed disappointing resolution of discharge barriers. In addition, our adapted survey instrument, though based on well‐supported conceptual frameworks,[19] has not been extensively tested outside of our hospital setting. Finally, as a single‐center study, our results cannot be generalized to other settings.
Assessing discharge readiness highlights an opportunity to obtain patient self‐reported barriers to discharge. This can facilitate discharge planning that targets individual patient needs. This information also emphasizes potentially fruitful opportunities for improved communication and education activities, potentially if these data are fed back to providers in real time, potentially as part of team‐based dashboards or the context of interdisciplinary team models.
Acknowledgements
The authors thank all of the patients who participated in this project, and Yimdriuska Magan Gigi for her assistance with chart abstractions. The authors also acknowledge and thank John Boscardin for his statistical and analytic support.
Disclosures: James D. Harrison, and Drs. Ryan S. Greysen and Andrew D. Auerbach contributed to the concept, design, analysis, interpretation of data, drafting of the manuscript, critical revisions to the manuscript, and final approval of manuscript. Ronald Jacolbia and Alice Nguyen contributed to the acquisition of data, drafting and final approval of manuscript and project, and administrative and technical support. Dr. Auerbach was supported by National Heart, Lung, and Blood Institute grant K24 K24HL098372. Dr. Greysen is supported by the National Institutes of Health (NIH), National Institute of Aging (NIA) through the Claude D. Pepper Older Americans Independence Center (P30AG021342 NIH/NIA and K23AG045338‐01). The authors have no financial or other conflicts of interest to declare.
- , , . Trends and projections in inpatient hospital costs and utilization 2003–2013. HCUP statistical brief #175. July 2014. Rockville, MD: Agency for Healthcare Research and Quality; 2014.
- , . Overview of hospital stays in the United States 2012. HCUP statistical brief #180. October 2014. Rockville, MD: Agency for Healthcare Research and Quality; 2014.
- Joint Commision. The Joint Commission Comprehensive Accreditation Manual for Hospitals. Oak Brook, IL: The Joint Commission; 2015.
- , , . Hospital discharge and readmission. In: Post TW, ed. UpToDate website: Available at: http://www.uptodate.com/contents/hospital‐discharge‐and‐readmission. Accessed August 14, 2015.
- , . A patient centered model of care for hospital discharge. Clin Nurse Res. 2004;13:117–136.
- , , , , , . Which reasons do doctors, nurses and patients have for hospital discharge? A mixed methods study. PLoS One. 2014;9:e91333.
- , , . Nurse and patient perceptions of discharge readiness in relation to postdischarge utilization. Med Care. 2010;48:482–486.
- , . Older people's perception of their readiness for discharge and postdischarge use of community support and services. Int J Older People Nurs. 2013;8:104–115.
- , , , . The care transitions intervention: Results of a randomized controlled trial. Arch Intern Med. 2006;166:1822–1828.
- , . Psychometric properties of the Readiness for Hospital Discharge Scale. J Nurs Meas. 2006;14:163–180.
- , , , et al. Perceived readiness for hospital discharge in adult medical‐surgical patients. Clin Nurse Spec. 2007;21:31–42.
- , , , . Validation of patient and nurse short forms of the Readiness for Hospital Discharge Scale and their relationship to return to the hospital. Health Serv Res. 2014;49:304–317.
- , , , et al. “Missing Pieces”—functional, social and environmental barriers to recovery for vulnerable older adults transitioning from hospital to home. J Am Geriatr Soc. 2014;62:1556–1561.
- , , , et al. Quality of discharge practices and patient understanding at an academic medical center. JAMA Intern Med. 2013;173:1715–1722.
- , , . Brief scale measuring patient prepardeness for hospital discharge to home: Psychometric properties. J Hosp Med. 2008;3:446–454.
- , , , et al. Improving patient discharge and reducing hospital readmission by using intervention mapping. BMC Health Serv Res. 2014;14:389.
- , , , , , . Development of a discharge readiness report within the electronic health record: a discharge planning tool. J Hosp Med. 2014;9:533–539.
- , , , . Incorporating Patient and Carer Concerns in Discharge Plans: The Development of a Practical Patient‐Centred Checklist. The Internet Journal of Allied Health Sciences and Practice. 2006;4: Article 5.
- , , , . Identifying keys to success in reducing readmissions using the ideal transitions in care framework. BMC Health Serv Res. 2014;14:423.
Interdisciplinary Rounds
Care of hospitalized patients requires effective teamwork within groups composed of physicians (eg, residents, hospitalists, specialists), advanced practice providers, nurses, patient‐care technicians, pharmacists, social workers, and therapists. Sadly, hospital‐based team members often fail to communicate. For example, 2 studies found that nurses and physicians communicated with one another on only 50% to 60% of their patients' hospital days, resulting in a lack of a mutual understanding of the plan of care.[1, 2]
Failure to communicate effectively may be because the hospital setting poses important challenges to teamwork, including the use of large teams with membership that changes frequently because of the need to provide care around the clock. Furthermore, individual team members often have high workloads, care for multiple patients simultaneously, and are seldom in the same place at the same time.
Interdisciplinary rounds (IDR) are a microsystem‐level solution with the goal to share information, achieve mutual understanding, and collaboratively revise the plan of care within care teams. Though common, IDR look very different across hospitals, making studies that evaluate novel strategies to improve IDR and measure their impact of great interest to hospital medicine.
In this issue of the Journal of Hospital Medicine, Bhamidipati and colleagues present a systematic review of published studies evaluating the effect of IDR on patient outcomes.[3] The systematic review included 22 studies, including 12 experimental/quasiexperimental and 10 observational studies. Overall, 13 studies were of low to medium quality, and 9 were high quality. Importantly, relatively few studies reported the degree to which IDR were implemented as planned. The investigators found evidence that IDR had a positive effect on length of stay (LOS) and staff satisfaction, but little evidence to support an effect on patient safety or satisfaction. Furthermore, the investigators found significant variability in IDR design and team composition. Some of this variation is to be expected, as IDR, like other interventions to improve quality and safety of patient care in complex settings, should be implemented with an expectation that the team may need to make adaptations based on local contextual factors such as workload (eg, daily census), environment (eg, open vs closed intensive care unit), local politics (eg, uniquely strong support for/against the intervention), and prior experience (eg, prior failed, similar interventions).[4, 5] Moreover, objectives for IDR may differ across settings. Some hospitals may have room (and a need) to improve LOS, whereas others may prioritize improving patient safety or patient experience metrics.
Bhamidipati and colleagues explain that their review did not reveal a causal pathway between IDR design and outcomes. We believe this lack of association is because most of the included studies did not propose a causal pathway between the IDR components implemented and the outcomes assessed. That is, few studies referred to conceptual models that explain how components of the IDR intervention might influence downstream patient outcomes.
IDR have the potential to influence a number of patient outcomes, including those reflecting efficiency (eg, length of stay), patient safety (eg, adverse events), and patient centeredness (eg, patient satisfaction). However, these outcomes are influenced by many factors, including patient characteristics and other efforts to improve care. As explained by the investigators, the results of many of the included studies may have been confounded due to relatively weak study designs and statistical analyses. Importantly, few of the studies included in this review report the more proximal measure of teamwork. If we hypothesize that IDR improve patient outcomes, they do so by improving teamwork. After all, the purpose of IDR is to assemble team members so they can communicate about and coordinate care. Measuring teamwork behaviors is difficult, especially on medical services. Measuring teamwork climate, the measurable aspects of team culture, is relatively easy. A recent systematic review of teamwork climate assessments in internal medicine identified the Safety Attitudes Questionnaire and the Team Climate Inventory as having substantial validity evidence and association with improved patient outcomes.[6]
Bhamidipati and colleagues proposed a definition for IDR and taxonomy for IDR design and reporting based on their systematic review. Although very useful, the IDR definition may be too limiting as evidenced by the fact that very few studies would be included in a systematic review using this definition as the inclusion criteria. Their proposed taxonomy should serve as a useful framework for future research efforts and appropriately recommends reporting of site characteristics, components of IDR design, and outcomes.
The systematic review by Bhamidipati et al. must also be interpreted in conjunction with another recently published systematic review by Pannick and colleagues assessing the effect of interdisciplinary team care interventions on general medical wards.[7] Contrary to the findings of the Bhamidipati et al. study, Pannick and colleagues found that most interdisciplinary team care interventions had no effect on LOS, but that half of the studies found an improvement in complications of care. Importantly, Pannick and colleagues included only experimental and quasiexperimental studies in their systematic review (ie, no observational studies).
There is clearly more work to be done in researching IDR and other interventions to improve teamwork in general medical settings. Larger studies are needed to provide sufficient power to detect improvement in outcomes. Future studies need to report the degree to which interventions are implemented as planned and need to use stronger study designs (eg, cluster randomized control or interrupted time series) to avoid the influence of confounders. Qualitative methods should be used to assess the influence of contextual factors on the success of interventions.[4] Most importantly, future studies should be based on conceptual models that explain how components of the intervention influence proximal measures of teamwork and downstream patient outcomes.
In the meantime, what is a hospital leader to do? We believe efforts to improve IDR are warranted, but that IDR program leaders need to first specify their primary objective(s). For example, in some hospitals, there may be little room to further reduce LOS, so another goalreducing preventable readmissions or reducing adverse eventsmight be specified as the key performance indicator. This crucial first step of creating a shared goal informs the design, implementation, and evaluation of IDR. We also believe that geographic localization of physicians to specific units is foundational to improving IDR. Physicians cannot feasibly attend IDR if their patients are spread across multiple units (or buildings). Finally, hospital leaders also need to view IDR as part of a larger set of interventions to improve teamwork. Leaders need to assess the adequacy of staffing levels, workflow, and team composition.[8] Unit‐based interdisciplinary leadership models should be used to help link efforts at various levels within a larger system.[9] These models designate a unit medical director and nurse manager who are jointly responsible for unit performance.
In conclusion, IDR play an important role in improving patient outcomes, but only do so by improving teamwork. In redesigning IDR, leaders need to be thoughtful about what outcomes IDR can affect, how IDR affect them, and how IDR fit into larger‐scale efforts to improve performance.
Disclosure
Nothing to report.
- , , , , , . Can we talk? Priorities for patient care differed among health care providers. In: Henriksen K, Battles JB, Marks ES, Lewin DI, eds. Advances in Patient Safety: From Research to Implementation. Volume 1: Research Findings. Rockville, MD: Agency for Healthcare Research and Quality; 2005.
- , , , et al. Patterns of nurse‐physician communication and agreement on the plan of care. Qual Saf Health Care. 2010;19(3):195–199.
- , , , , , . Structure and outcomes of inter‐disciplinary rounds in hospitalized medicine patients: a systematic review and suggested taxonomny. J Hosp Med. 2016;11:513–523.
- , , , et al. Advancing the science of patient safety. Ann Intern Med. 2011;154(10):693–696.
- . Improvement interventions are social treatments, not pills. Ann Intern Med. 2014;161(7):526–527.
- , , , et al. Teamwork assessment in internal medicine: a systematic review of validity evidence and outcomes. J Gen Intern Med. 2014;29(6):894–910.
- , , , et al. Effects of interdisciplinary team care interventions on general medical wards: a systematic review. JAMA Intern Med. 2015;175(8):1288–1298.
- , , , . Improving the quality and safety of care on the medical ward: A review and synthesis of the evidence base. Eur J Intern Med. 2014;25(10):874–887.
- , , , , , . Unit‐based interprofessional leadership models in six US hospitals. J Hosp Med. 2014;9(8):545–550.
Care of hospitalized patients requires effective teamwork within groups composed of physicians (eg, residents, hospitalists, specialists), advanced practice providers, nurses, patient‐care technicians, pharmacists, social workers, and therapists. Sadly, hospital‐based team members often fail to communicate. For example, 2 studies found that nurses and physicians communicated with one another on only 50% to 60% of their patients' hospital days, resulting in a lack of a mutual understanding of the plan of care.[1, 2]
Failure to communicate effectively may be because the hospital setting poses important challenges to teamwork, including the use of large teams with membership that changes frequently because of the need to provide care around the clock. Furthermore, individual team members often have high workloads, care for multiple patients simultaneously, and are seldom in the same place at the same time.
Interdisciplinary rounds (IDR) are a microsystem‐level solution with the goal to share information, achieve mutual understanding, and collaboratively revise the plan of care within care teams. Though common, IDR look very different across hospitals, making studies that evaluate novel strategies to improve IDR and measure their impact of great interest to hospital medicine.
In this issue of the Journal of Hospital Medicine, Bhamidipati and colleagues present a systematic review of published studies evaluating the effect of IDR on patient outcomes.[3] The systematic review included 22 studies, including 12 experimental/quasiexperimental and 10 observational studies. Overall, 13 studies were of low to medium quality, and 9 were high quality. Importantly, relatively few studies reported the degree to which IDR were implemented as planned. The investigators found evidence that IDR had a positive effect on length of stay (LOS) and staff satisfaction, but little evidence to support an effect on patient safety or satisfaction. Furthermore, the investigators found significant variability in IDR design and team composition. Some of this variation is to be expected, as IDR, like other interventions to improve quality and safety of patient care in complex settings, should be implemented with an expectation that the team may need to make adaptations based on local contextual factors such as workload (eg, daily census), environment (eg, open vs closed intensive care unit), local politics (eg, uniquely strong support for/against the intervention), and prior experience (eg, prior failed, similar interventions).[4, 5] Moreover, objectives for IDR may differ across settings. Some hospitals may have room (and a need) to improve LOS, whereas others may prioritize improving patient safety or patient experience metrics.
Bhamidipati and colleagues explain that their review did not reveal a causal pathway between IDR design and outcomes. We believe this lack of association is because most of the included studies did not propose a causal pathway between the IDR components implemented and the outcomes assessed. That is, few studies referred to conceptual models that explain how components of the IDR intervention might influence downstream patient outcomes.
IDR have the potential to influence a number of patient outcomes, including those reflecting efficiency (eg, length of stay), patient safety (eg, adverse events), and patient centeredness (eg, patient satisfaction). However, these outcomes are influenced by many factors, including patient characteristics and other efforts to improve care. As explained by the investigators, the results of many of the included studies may have been confounded due to relatively weak study designs and statistical analyses. Importantly, few of the studies included in this review report the more proximal measure of teamwork. If we hypothesize that IDR improve patient outcomes, they do so by improving teamwork. After all, the purpose of IDR is to assemble team members so they can communicate about and coordinate care. Measuring teamwork behaviors is difficult, especially on medical services. Measuring teamwork climate, the measurable aspects of team culture, is relatively easy. A recent systematic review of teamwork climate assessments in internal medicine identified the Safety Attitudes Questionnaire and the Team Climate Inventory as having substantial validity evidence and association with improved patient outcomes.[6]
Bhamidipati and colleagues proposed a definition for IDR and taxonomy for IDR design and reporting based on their systematic review. Although very useful, the IDR definition may be too limiting as evidenced by the fact that very few studies would be included in a systematic review using this definition as the inclusion criteria. Their proposed taxonomy should serve as a useful framework for future research efforts and appropriately recommends reporting of site characteristics, components of IDR design, and outcomes.
The systematic review by Bhamidipati et al. must also be interpreted in conjunction with another recently published systematic review by Pannick and colleagues assessing the effect of interdisciplinary team care interventions on general medical wards.[7] Contrary to the findings of the Bhamidipati et al. study, Pannick and colleagues found that most interdisciplinary team care interventions had no effect on LOS, but that half of the studies found an improvement in complications of care. Importantly, Pannick and colleagues included only experimental and quasiexperimental studies in their systematic review (ie, no observational studies).
There is clearly more work to be done in researching IDR and other interventions to improve teamwork in general medical settings. Larger studies are needed to provide sufficient power to detect improvement in outcomes. Future studies need to report the degree to which interventions are implemented as planned and need to use stronger study designs (eg, cluster randomized control or interrupted time series) to avoid the influence of confounders. Qualitative methods should be used to assess the influence of contextual factors on the success of interventions.[4] Most importantly, future studies should be based on conceptual models that explain how components of the intervention influence proximal measures of teamwork and downstream patient outcomes.
In the meantime, what is a hospital leader to do? We believe efforts to improve IDR are warranted, but that IDR program leaders need to first specify their primary objective(s). For example, in some hospitals, there may be little room to further reduce LOS, so another goalreducing preventable readmissions or reducing adverse eventsmight be specified as the key performance indicator. This crucial first step of creating a shared goal informs the design, implementation, and evaluation of IDR. We also believe that geographic localization of physicians to specific units is foundational to improving IDR. Physicians cannot feasibly attend IDR if their patients are spread across multiple units (or buildings). Finally, hospital leaders also need to view IDR as part of a larger set of interventions to improve teamwork. Leaders need to assess the adequacy of staffing levels, workflow, and team composition.[8] Unit‐based interdisciplinary leadership models should be used to help link efforts at various levels within a larger system.[9] These models designate a unit medical director and nurse manager who are jointly responsible for unit performance.
In conclusion, IDR play an important role in improving patient outcomes, but only do so by improving teamwork. In redesigning IDR, leaders need to be thoughtful about what outcomes IDR can affect, how IDR affect them, and how IDR fit into larger‐scale efforts to improve performance.
Disclosure
Nothing to report.
- , , , , , . Can we talk? Priorities for patient care differed among health care providers. In: Henriksen K, Battles JB, Marks ES, Lewin DI, eds. Advances in Patient Safety: From Research to Implementation. Volume 1: Research Findings. Rockville, MD: Agency for Healthcare Research and Quality; 2005.
- , , , et al. Patterns of nurse‐physician communication and agreement on the plan of care. Qual Saf Health Care. 2010;19(3):195–199.
- , , , , , . Structure and outcomes of inter‐disciplinary rounds in hospitalized medicine patients: a systematic review and suggested taxonomny. J Hosp Med. 2016;11:513–523.
- , , , et al. Advancing the science of patient safety. Ann Intern Med. 2011;154(10):693–696.
- . Improvement interventions are social treatments, not pills. Ann Intern Med. 2014;161(7):526–527.
- , , , et al. Teamwork assessment in internal medicine: a systematic review of validity evidence and outcomes. J Gen Intern Med. 2014;29(6):894–910.
- , , , et al. Effects of interdisciplinary team care interventions on general medical wards: a systematic review. JAMA Intern Med. 2015;175(8):1288–1298.
- , , , . Improving the quality and safety of care on the medical ward: A review and synthesis of the evidence base. Eur J Intern Med. 2014;25(10):874–887.
- , , , , , . Unit‐based interprofessional leadership models in six US hospitals. J Hosp Med. 2014;9(8):545–550.
Mobility Sensors for Hospital Patients
Functional impairment, such as difficulty with activities of daily living or limited mobility,[1] is common among hospitalized patients and correlated with important outcomes: approximately 50% of hospitalized Medicare seniors have some level of impairment that correlates with higher rates of readmission,[2] long‐term care placement,[3] and even death.[4]
Lack of consistent, accurate, and reliable data on functional mobility during hospitalization poses an important barrier for programs seeking to improve functional outcomes in hospitalized patients.[5, 6] More accurate mobility data could improve current hospital practices to diagnose mobility problems, target mobility interventions, and measure interventions' effectiveness. Although wearable mobility sensors (small, wireless accelerometers placed on patients' wrists, ankles, or waists) hold promise in overcoming these barriers and improving current practice, existing data are from small samples of focused populations and have not integrated sensor data into patient care.[7, 8]
In this issue of the Journal of Hospital Medicine, Sallis and colleagues used mobility sensors to study 777 hospitalized patients.[9] This article has several strengths that make it unique among the handful of articles in this area: it is the largest to date, the first to consider patients on both medical and surgical units, and the first to correlate sensor data with clinical assessments of mobility by providers (nurses). The authors found that, regardless of length of stay, patients averaged 1100 steps during the final 24 hours of their hospitalization. Older patients had slightly fewer steps on average (982 per 24 hours), but, taken collectively, these findings led the authors to postulate that 1000 steps per day might be a good normative value for discharge readiness in terms of patient mobility.
This idea of a normative value for steps taken by inpatients prior to discharge raises several interesting questions. First, could numbers of steps become a value that hospital providers routinely use to optimize care of hospitalized patients similar to other values such as blood pressure or blood sugar? Such a threshold could be used to define strategies that target tight mobility control for patients at high risk for decline, and others might be managed with a more traditional ad lib approach. Alternatively, perhaps physicians should focus more on improvement in mobility regardless of a population‐defined threshold. In this case, the measure would be progress toward a patient‐centered or patient‐defined goal. Second, it is important to note that Sallis and colleagues found that patients whose nurses documented their estimated mobility more frequently in the medical record also had substantially higher sensor step counts. This raises the question of whether more data from sensors can assist front‐line inpatient providers to more effectively engage patients in mobilizing to avoid functional deconditioning during hospitalization. Often we tell our patients to try to get out of bed todaygo for a walk around the unit, but we are rarely specific about how far they should walk, and patients do not get feedback on their daily progress toward a specific mobility goal. Perhaps data on the number of steps from mobility sensors could be shown to both patients and providers so as to encourage patients to reach their goal, whether that is the normative 1000 steps per day or slightly more or less.
This article also has limitations, which raise important questions for future research. First, patients in this study were ambulatory and relatively healthy (85% had Charlson scores 0 or 1) at the time of admission, making it difficult to determine whether the approach used or threshold defined are valid in higher‐risk populations, such as those with preexisting functional limitations. Second, lack of clinical outcomes data is another important limitation in this study, which is shared by many, but not all, inpatient sensor studies. For example, a recent study correlated discharge location (skilled nursing facility vs home) to levels of step mobility; however, the authors were unable to determine the degree to which their step measures were simply mirroring clinical decision making.[10] Another recent study demonstrated that decreased inpatient step counts are associated with early mortality; however, more proximal outcomes such as postdischarge function were not measured.[11] Moreover, future studies will need to assess whether mobility sensors can reliably predict postdischarge function, and even be used to improve mobility or reduce functional impairment in hospital populations that include sicker patients.
Ultimately, the results by Sallis et al. are a useful step in the right direction, but much more work is needed to determine the clinical utility of mobility sensors as part of larger efforts to harness the potential of mobile health (mHealth) efforts to improve care for hospitalized patients.[12] The future of mobility sensors in healthcare is likely about how well patients and providers can use them to successfully guide and support behavior change. This will require a strong health‐adopter focus in coaching patients to use mobility sensors and their mobile, patient‐facing applications.[13] Ultimately, the goal must be to embed these mHealth approaches into larger behavior management and health system redesign so that clinical goals such as improved function after hospital discharge are met.[14]
Disclosures
Nothing to report.
- , , . Hospitalization‐associated disability: "She was probably able to ambulate, but I'm not sure." JAMA. 2011;306(16):1782–1793.
- , , , . Functional impairment and readmissions in Medicare seniors [published online ahead of print February 2, 2015]. JAMA Intern Med. doi: 10.1001/jamainternmed.2014.7756.
- , , , et al. Loss of independence in activities of daily living in older adults hospitalized with medical illnesses: increased vulnerability with age. J Am Geriatr Soc. 2003;51(4):451–458.
- , , , et al. Prediction of recovery, dependence or death in elders who become disabled during hospitalization. J Gen Intern Med. 2013;28(2):261–268.
- , . Functional status—an important but overlooked variable in the readmissions equation. J Hosp Med. 2014;9(5):330–331.
- , , , , , . Association of impaired functional status at hospital discharge and subsequent rehospitalization. J Hosp Med. 2014;9(5):277–282.
- , , , . The under‐recognized epidemic of low mobility during hospitalization of older adults. J Am Geriatr Soc. 2009;57(9):1660–1665.
- , , , et al. Twenty‐four‐hour mobility during acute hospitalization in older medical patients. J Gerontol A Biol Sci Med Sci. 2013;68(3):331–337.
- , , , et al. Stepping towards discharge: level of ambulation in hospitalized patients. J Hosp Med. 2015;10(6):358–363.
- , , , , . Functional recovery in the elderly after major surgery: assessment of mobility recovery using wireless technology. Ann Thorac Surg. 2013;96(3):1057–1061.
- , , , et al. Mobility activity and its value as a prognostic indicator of survival in hospitalized older adults. J Am Geriatr Soc. 2013;61(4):551–557.
- . Wearables are totally failing the people who need them most. Wired. Available at: http://www.wired.com/2014/11/where‐fitness‐trackers‐fail. Published November 6, 2014. Accessed January 21, 2015.
- , , . Wearable devices as facilitators, not drivers, of health behavior change. JAMA. 2015;313(5):459–460.
- , , . Digital medical tools and sensors. JAMA. 2015;313(4):353–354.
Functional impairment, such as difficulty with activities of daily living or limited mobility,[1] is common among hospitalized patients and correlated with important outcomes: approximately 50% of hospitalized Medicare seniors have some level of impairment that correlates with higher rates of readmission,[2] long‐term care placement,[3] and even death.[4]
Lack of consistent, accurate, and reliable data on functional mobility during hospitalization poses an important barrier for programs seeking to improve functional outcomes in hospitalized patients.[5, 6] More accurate mobility data could improve current hospital practices to diagnose mobility problems, target mobility interventions, and measure interventions' effectiveness. Although wearable mobility sensors (small, wireless accelerometers placed on patients' wrists, ankles, or waists) hold promise in overcoming these barriers and improving current practice, existing data are from small samples of focused populations and have not integrated sensor data into patient care.[7, 8]
In this issue of the Journal of Hospital Medicine, Sallis and colleagues used mobility sensors to study 777 hospitalized patients.[9] This article has several strengths that make it unique among the handful of articles in this area: it is the largest to date, the first to consider patients on both medical and surgical units, and the first to correlate sensor data with clinical assessments of mobility by providers (nurses). The authors found that, regardless of length of stay, patients averaged 1100 steps during the final 24 hours of their hospitalization. Older patients had slightly fewer steps on average (982 per 24 hours), but, taken collectively, these findings led the authors to postulate that 1000 steps per day might be a good normative value for discharge readiness in terms of patient mobility.
This idea of a normative value for steps taken by inpatients prior to discharge raises several interesting questions. First, could numbers of steps become a value that hospital providers routinely use to optimize care of hospitalized patients similar to other values such as blood pressure or blood sugar? Such a threshold could be used to define strategies that target tight mobility control for patients at high risk for decline, and others might be managed with a more traditional ad lib approach. Alternatively, perhaps physicians should focus more on improvement in mobility regardless of a population‐defined threshold. In this case, the measure would be progress toward a patient‐centered or patient‐defined goal. Second, it is important to note that Sallis and colleagues found that patients whose nurses documented their estimated mobility more frequently in the medical record also had substantially higher sensor step counts. This raises the question of whether more data from sensors can assist front‐line inpatient providers to more effectively engage patients in mobilizing to avoid functional deconditioning during hospitalization. Often we tell our patients to try to get out of bed todaygo for a walk around the unit, but we are rarely specific about how far they should walk, and patients do not get feedback on their daily progress toward a specific mobility goal. Perhaps data on the number of steps from mobility sensors could be shown to both patients and providers so as to encourage patients to reach their goal, whether that is the normative 1000 steps per day or slightly more or less.
This article also has limitations, which raise important questions for future research. First, patients in this study were ambulatory and relatively healthy (85% had Charlson scores 0 or 1) at the time of admission, making it difficult to determine whether the approach used or threshold defined are valid in higher‐risk populations, such as those with preexisting functional limitations. Second, lack of clinical outcomes data is another important limitation in this study, which is shared by many, but not all, inpatient sensor studies. For example, a recent study correlated discharge location (skilled nursing facility vs home) to levels of step mobility; however, the authors were unable to determine the degree to which their step measures were simply mirroring clinical decision making.[10] Another recent study demonstrated that decreased inpatient step counts are associated with early mortality; however, more proximal outcomes such as postdischarge function were not measured.[11] Moreover, future studies will need to assess whether mobility sensors can reliably predict postdischarge function, and even be used to improve mobility or reduce functional impairment in hospital populations that include sicker patients.
Ultimately, the results by Sallis et al. are a useful step in the right direction, but much more work is needed to determine the clinical utility of mobility sensors as part of larger efforts to harness the potential of mobile health (mHealth) efforts to improve care for hospitalized patients.[12] The future of mobility sensors in healthcare is likely about how well patients and providers can use them to successfully guide and support behavior change. This will require a strong health‐adopter focus in coaching patients to use mobility sensors and their mobile, patient‐facing applications.[13] Ultimately, the goal must be to embed these mHealth approaches into larger behavior management and health system redesign so that clinical goals such as improved function after hospital discharge are met.[14]
Disclosures
Nothing to report.
- , , . Hospitalization‐associated disability: "She was probably able to ambulate, but I'm not sure." JAMA. 2011;306(16):1782–1793.
- , , , . Functional impairment and readmissions in Medicare seniors [published online ahead of print February 2, 2015]. JAMA Intern Med. doi: 10.1001/jamainternmed.2014.7756.
- , , , et al. Loss of independence in activities of daily living in older adults hospitalized with medical illnesses: increased vulnerability with age. J Am Geriatr Soc. 2003;51(4):451–458.
- , , , et al. Prediction of recovery, dependence or death in elders who become disabled during hospitalization. J Gen Intern Med. 2013;28(2):261–268.
- , . Functional status—an important but overlooked variable in the readmissions equation. J Hosp Med. 2014;9(5):330–331.
- , , , , , . Association of impaired functional status at hospital discharge and subsequent rehospitalization. J Hosp Med. 2014;9(5):277–282.
- , , , . The under‐recognized epidemic of low mobility during hospitalization of older adults. J Am Geriatr Soc. 2009;57(9):1660–1665.
- , , , et al. Twenty‐four‐hour mobility during acute hospitalization in older medical patients. J Gerontol A Biol Sci Med Sci. 2013;68(3):331–337.
- , , , et al. Stepping towards discharge: level of ambulation in hospitalized patients. J Hosp Med. 2015;10(6):358–363.
- , , , , . Functional recovery in the elderly after major surgery: assessment of mobility recovery using wireless technology. Ann Thorac Surg. 2013;96(3):1057–1061.
- , , , et al. Mobility activity and its value as a prognostic indicator of survival in hospitalized older adults. J Am Geriatr Soc. 2013;61(4):551–557.
- . Wearables are totally failing the people who need them most. Wired. Available at: http://www.wired.com/2014/11/where‐fitness‐trackers‐fail. Published November 6, 2014. Accessed January 21, 2015.
- , , . Wearable devices as facilitators, not drivers, of health behavior change. JAMA. 2015;313(5):459–460.
- , , . Digital medical tools and sensors. JAMA. 2015;313(4):353–354.