User login
Reducing HA VTE in 5 Academic Centers
Venous thromboembolism (VTE), comprised of pulmonary embolism (PE) and deep vein thrombosis (DVT), impacts hundreds of thousands of Americans annually.[1] The complications of VTE can be severe, including the post‐thrombotic syndrome, pulmonary hypertension, and complications of anticoagulation. VTE is often a complication of hospitalization, and PE is a common preventable cause of hospital mortality.[2, 3] Pharmacologic VTE prophylaxis (VTEP) in at‐risk patients is effective and endorsed by prominent guidelines.[4, 5, 6] However, VTEP is underutilized, with only 30% to 50% of eligible patients receiving the right drug, dose, and duration.[7, 8]
Public reporting and reimbursement policies reflect the magnitude of VTE as a public health concern. The Centers for Medicare and Medicaid Services (CMS) withholds incremental payment for VTE complications.[9] The rate of hospital‐associated VTE (HA‐VTE) is used by benchmarking organizations as a quality indicator.[10, 11]
The University of California (UC) has 5 major academic medical centers, located in Irvine (UCI), Los Angeles (UCLA), Sacramento (UC Davis [UCD]), San Diego (UCSD), and San Francisco (UCSF). In both 2010 and 2011, almost 700 UC patients suffered from HA‐VTE annually. Barriers to optimal VTEP included the absence of standardized VTE risk assessment, lack of consensus on appropriate VTEP options for various inpatient populations, and a lack of collaborative infrastructure. Other barriers included poor adherence to mechanical prophylaxis and suboptimal measurement of prophylaxis and HA‐VTE outcomes.
In late 2011, leaders from the 5 medical centers, supported by an internal competitive grant from the UC Office of the President and the Center for Health Quality and Innovation, formed a collaborative to address barriers, optimize VTEP in inpatients, and reduce HA‐VTE across the system. Prior efforts at UCSD illustrated single‐center improvement, with an increase in adequate VTEP from 50% to over 95%, and a nearly 40% reduction in the incidence of HA‐VTE.[12] We set out to scale this success across all 5 sites as a coordinated collaborative.
METHODS
This was a prospective, unblinded, open‐intervention study with historical controls that assessed prespecified outcomes before, during, and after institution of multiple VTEP strategies in 5 independent, but cooperating, academic hospitals. All adult medical and surgical inpatients were included; psychiatric, obstetricsgynecology, rehabilitation, observation status, and pediatric populations were excluded. The study period was July 1, 2012 through June 30, 2015. Calendar year (CY) 2011 was the baseline year for comparison; interventions were initiated in CY 2012 to CY 2014, and CY 2014 was considered the mature postintervention period.
Hospital Collaboration
Multiprofessional teams[1] were formed at each site. Monthly webinars, regular e‐mail, minutes, and a project management plan with task lists were utilized for coordinated collaboration. Software (Dropbox) was used for sharing tools, educational materials, and measurement techniques. REDCap (Research Electronic Data Capture) was used for secure data collection and analysis of outcomes.[13] Prior experience at UCSD and the Society of Hospital Medicine informed measurement and intervention bundle strategies.[1, 12, 14] Surveys of baseline VTE prevention protocols, measures, and order sets were performed at each site. Measures were standardized, whereas the intervention bundle was tailored for use at each medical center. Institutional review board approval with a waiver for individualized informed consent was obtained.
Interventions
All sites were tasked with implementing a defined bundle of mutually reinforcing interventions that constituted a comprehensive VTE prevention program. These protocols, order sets, educational programs, and interventions were not designed or implemented in an identical fashion at each hospital, but common principles were utilized.
VTE Prevention Protocol
This protocol incorporated (1) standardized VTE risk assessment, and (2) links to a menu of appropriate prophylaxis options for each level of risk that included guidance for management of patients with contraindications to pharmacologic prophylaxis. We used simple risk‐assessment models that grouped patients into 3 levels of risk (the 3‐bucket model) rather than more complicated point‐based systems. The 3‐bucket model was designed to offer detailed guidance and avoid over‐prophylaxis. Protocol, measurement, and order set tools were modified for special populations, such as orthopedic and neurosurgery populations. Operational definitions for bleeding risk, DVT risk, and exceptions to the protocol were explicit, which allowed for classification of adequate versus inadequate prophylaxis. High‐risk patients required combination prophylaxis, moderate risk anticoagulant prophylaxis, and low risk patients no prophylaxis beyond ambulation protocols (in the absence of contraindications). Acceptable contraindications to pharmacologic prophylaxis included an international normalized ratio >1.8, platelet count <50,000, active hemorrhage within the last 3 days, known bleeding disorders, hypertensive urgencies/emergencies, comfort careonly status, and leeway times around surgery or other events (24 hours for most surgeries, 48 hours for transplant surgery or major trauma, up to a week after central nervous system surgery). Impaired mobility was considered present unless the patient could ambulate independently more than once a day. More details regarding 3‐bucket risk models and explicit criteria can be reviewed in a recent Agency for Healthcare Quality and Research (AHRQ) publication.[1] The protocol was embedded into clinical decision‐support as required elements of admission, transfer, and postoperative order sets.
Educational Programs
Nurse and physician education programs were developed that stressed the importance of VTE prevention and adherence to thromboprophylaxis, including mechanical prophylaxis. The VTEP protocol was socialized in medical staff and nursing meetings. The educational programs recommended imaging only the proximal veins in patients with symptoms of leg DVT, and avoiding screening ultrasounds in asymptomatic patients. Physicians were coached on how to use the VTEP order sets. Content for educational programs was discussed and often shared among sites, but educational programs were tailored locally to fit perceived needs and available resources.
Measure‐vention
An active surveillance and feedback program called measure‐vention was developed to provide ongoing feedback to care providers regarding the appropriate use of VTEP over the duration of hospitalization. Key features of measure‐vention were regular measurement of adherence/lapses in VTEP delivery, coupled with concurrent intervention to correct any lapses, with a nurse/pharmacist calling the primary team if VTEP was suboptimal.[1, 12] Measure‐vention was utilized to monitor both appropriateness of orders and adherence with ordered prophylaxis, and was used to correct overprophylaxis as well as underprophylaxis. For example, our protocol specified that moderate VTE risk patients with a captured contraindication to anticoagulant should be on mechanical prophylaxis. An intervention would take place if mechanical prophylaxis was not ordered, or if it was ordered but not documented as being in place. Measure‐vention examples and further description are available in AHRQ publications.[1]
Outcomes
Thromboprophylaxis Rates
We planned to perform structured chart review on at least 30 noncritical care and 15 critical care adult inpatients per month at each site. Adult inpatients with a length of stay >48 hours, stratified by critical care versus noncritical care status, were assigned a numeric value by a random number generator. Patients were selected in order of random number assignment for chart review until the desired number of audits was completed. Development of the audit tools, as well as availability of personnel, led to delays in assessing prophylaxis rates by these standards until late 2012 to early 2013 at each site. A few sites had brief lapses in data collection during personnel changes. VTE risk, bleeding risk, prophylaxis ordered at the time of the audit, and adequacy of VTEP defined by a common standard were all assessed and recorded in the REDCap data repository. VTEP was considered adequate if combined pharmacologic and mechanical prophylaxis was present in the highest‐risk patients or anticoagulant prophylaxis was present in moderate patients. Prophylaxis was considered adequate for all low‐risk patients. Patients at risk for VTE with contraindications to anticoagulants were considered to be on adequate prophylaxis if they received mechanical prophylaxis or had documented contraindications to mechanical prophylaxis. The proper administration of ordered prophylaxis was scrutinized locally and targeted by education and other interventions at each site, but these data were not collated and analyzed centrally.
Identification of HA‐VTE
HA‐VTE rates were determined by administrative coding data, using International Classification of Diseases, Ninth Revision, Clinical Modification (ICD‐9‐CM) codes in a manner similar to AHRQ Patient Safety Indicator 12 identification of postoperative VTE cases.[10] Data were submitted by each hospital, then collated and analyzed using data from Vizient (formerly the University HealthSystem Consortium). The incidence of VTE was determined using specific ICD‐9‐CM hospital discharge codes: for PE: 415.11, 415.13, 415.19, 673.24; and for DVT: proximal DVT: 451.11, 451.19, 451.81, 453.41; distal DVT: 453.42; and other DVT: 453.40, 453.8. These codes have high positive predictive value for acute VTE.[15, 16] Mean age, average length of stay (ALOS), and admission severity of illness (SOI) scores were also captured from Vizient and summarized for the inpatient cohort each year.
All VTE cases were coupled with present on admission (POA) indicators. HA‐VTE cases included patients who were readmitted to the same hospital within 30 days for a new event (POA = Y, but readmitted), as well as patients who developed PE or DVT during their hospitalization (POA = N or U). Only patients hospitalized for 3 or more days were analyzed for inpatient development of VTE, as diagnosis of VTE in the first 2 days was deemed either likely present on admission or not preventable using VTEP started within 24 hours of admission. VTE outcomes were assigned in a hierarchical fashion: if both PE and DVT were present, the case was classified as PE. Distal DVT was distinguished from proximal DVT whenever possible. Cases were stratified based on whether the patient had undergone a major operation (surgery patients) or not (medical patients). This stratification was based on the Medicare Severity Diagnosis‐Related Group (MS‐DRG) coded in patient records. The DRG type for each MS‐DRG was based on the 2015 CMS‐MS‐DRG codes for major operations,[9] except that all trauma cases were considered surgical, and cases with vena cava filter placement and no other surgical procedure were considered medical. Cancer cases were identified using ICD‐9‐CM codes 140.00‐209.99 and 210.00‐239.99.
Review of HA‐VTE
Periodic review of selected HA‐VTE cases identified by administrative coding data was recommended as a best practice, potentially adding insight to contributing factors to HA‐VTE, included lapses in prophylaxis and suboptimal mobilization. The accuracy of diagnostic coding, and assessment of how HA‐VTE cases were identified (symptoms vs screening ultrasounds) could also be assessed. Examples of audit tools were shared. Every site reviewed some HA‐VTE cases, but the extent and duration of case review was left to the discretion of each site.
Statistical Analysis
Relative risk (RR) calculations with 95% confidence intervals (CI) were used to compare the proportions of patients with PE, DVT alone, and total HA‐VTE in 2014 versus 2011. The absolute risk reduction was multiplied by the population at risk in CY 2014 to arrive at estimates of cases of VTE averted in 2014 compared to 2011.
RESULTS
Robust sampling (421 to 728 patients at each site) revealed attainment of high rates of adequate VTE prophylaxis (82% to 96% at all sites, collectively 89%) by early 2014. Common measures for adequate VTEP were not finalized and collected by all sites until early 2013, so we did not capture baseline VTEP rates, and could not compare baseline to mature prophylaxis rates. Reliable administration of mechanical and anticoagulant prophylaxis was monitored and targeted by each institution, albeit not in an identical fashion at each site. Adherence to mechanical prophylaxis was reported as improved at the sites, but these data were not collated and analyzed centrally.
Population Demographics and Severity of Illness
There were 73,941 to 79,565 discharges that met the criteria (adult medicalsurgical inpatient with >2 day length of stay each year. Mean age and ALOS were unchanged or had no change of clinical significance. For example, in 2011 versus 2014, mean age was 55.7 versus 56.4 years, and ALOS was identical in both time periods at 7.4 days. Admission SOI scores also remained fairly static from 2011 to 2014 (2.27, 2.31, 2.32, 2.26, respectively), and the admission SOI was not statistically different in 2011 versus 2014 (estimated difference of 2 means 0.01, 95% CI: 0.00‐0.02).
Hospital‐Associated VTE
There were 2431 HA‐VTE events observed in 306,906 adult inpatients across CY 2011 to 2014 (Table 1). The baseline incidence of HA‐VTE was 0.90% (667 events in 73,941 hospitalizations in 2011). The incidence of HA‐VTE in the postintervention period was 0.69% (546 HA‐VTE events in 79,565 hospitalizations in 2014, P < 0.001), an overall reduction of 24%. The absolute risk for PE decreased from 0.49% to 0.39% (RR: 0.79, 95% CI: 0.68‐0.92), a reduction of 21%, and the absolute risk of leg DVT fell from 0.41% to 0.30% (RR: 0.73, 95% CI: 0.61‐0.86), a reduction of 27%. Both proximal and distal DVT were reduced significantly. Proximal DVT was much more commonly diagnosed than distal DVT. Proximal DVT incidence decreased from 0.32% to 0.25% (RR: 0.77, 95% CI: 0.64‐0.93), whereas distal DVT incidence decreased from 0.09% to 0.05% (RR: 0.58, 95% CI: 0.39‐0.86). The lower overall VTE rate in the postimplementation period compared with the baseline period corresponds to an estimated 170 fewer cases of VTE per year (89 DVT, 81 PE).
| 2011 (Baseline), No./% | 2012, No./% | 2013, No./% | 2014 (Mature), No./% | 2014 Versus 2011 Relative Risk (95% CI) | 2014 Versus 2011 Estimated Averted Events (95% CI) | |
|---|---|---|---|---|---|---|
| ||||||
| Total discharges (medical and surgical) | 73,941 | 76,100 | 77,300 | 79,565 | ||
| Total PE + leg DVT | 667/0.90% | 650/0.85% | 568/0.73% | 546/0.69% | 0.761 (0.680‐0.852) | 170 (103‐247) |
| Total PE | 363/0.49% | 359/0.47% | 340/0.44% | 309/0.39% | 0.791 (0.680‐0.920) | 81 (32‐135) |
| Total leg DVT | 304/0.41% | 291/0.38% | 228/0.29% | 237/0.3% | 0.725 (0.612‐0.858) | 89(40‐135) |
| Medical discharges | 31,219 | 32,597 | 33,805 | 34,875 | ||
| Total PE + leg DVT | 178/0.57% | 168/0.52% | 164/0.49% | 179/0.51% | 0.900 (0.732‐1.1071) | |
| PE | 110/0.35% | 94/0.29% | 106/0.31% | 104/0.30% | 0.846 (0.648‐1.106) | |
| Leg DVT | 68/0.22% | 74/0.23% | 58/0.17% | 75/0.22% | 0.987 (0.711‐1.371) | |
| Surgical discharges | 42,722 | 43,503 | 43,495 | 44,690 | ||
| Total PE + leg DVT | 489/1.14% | 482/1.11% | 404/0.93% | 367/0.82% | 0.718 (0.627‐0.821) | |
| PE | 253/0.59% | 265/0.61% | 234/0.54% | 205/0.46% | 0.775 (0.645‐0.931) | |
| Leg DVT | 236/0.55% | 217/0.50% | 180/0.41% | 162/0.36% | 0.656 (0.538‐0.801) | |
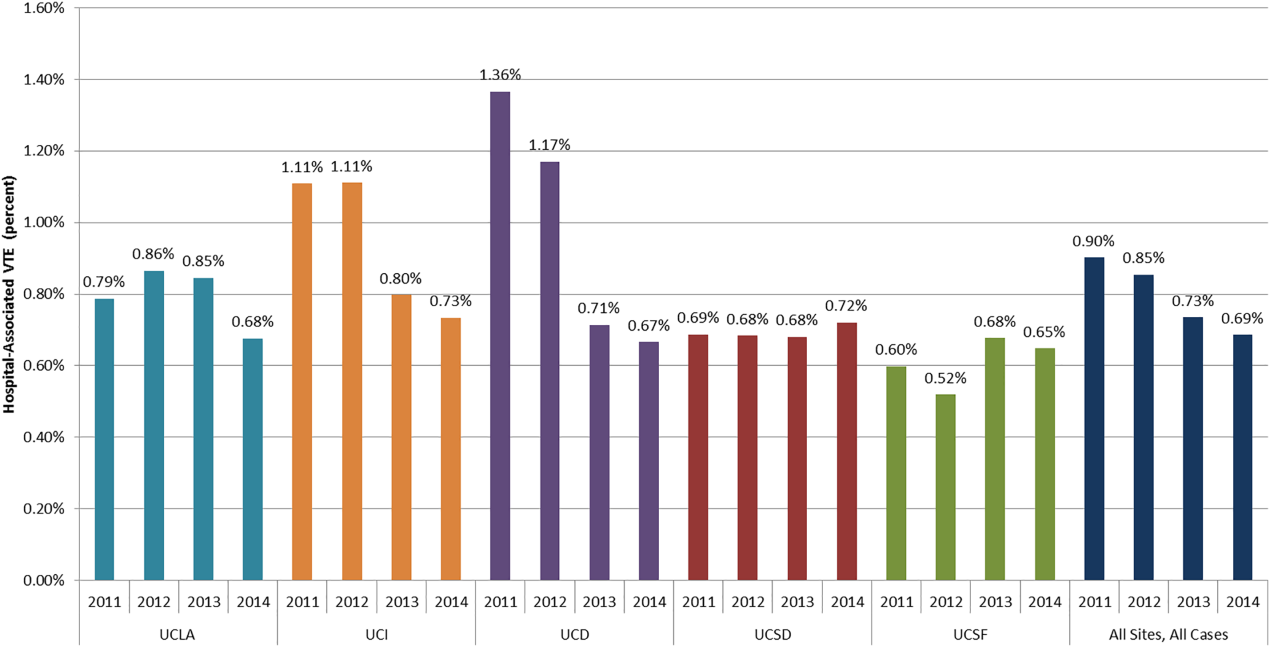
The baseline rate of HA‐VTE and degree of improvement varied between institutions (Figure 1). UCI and UCD began the study with significantly higher VTE rates, and enjoyed the largest improvements. UCLA's VTE rate decreased to a lesser extent, whereas UCSD and UCSF rates remained relatively flat or were marginally higher. In contrast to the highly variable 2011 baseline rate of HA‐VTE (0.60%1.36%), all 5 sites had HA‐VTE rates within a very narrow range (0.65%0.73%) at maturity in 2014.
Cancer Versus Noncancer Patients
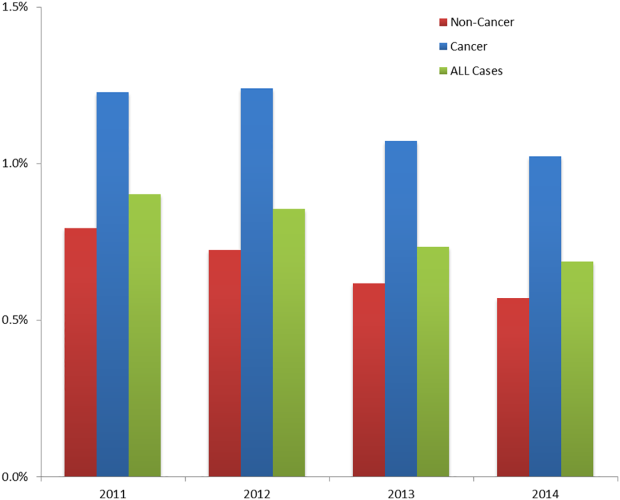
The incidence of HA‐VTE was higher in cancer patients than in noncancer patients. In 2011, 227 of 18,487 (1.23%) cancer patients developed VTE, versus 440 of 55,454 (0.79%) noncancer patients (Figure 2). After implementation of the VTE prevention initiative, the incidence of VTE in cancer patients fell by 0.21% (210 events in 20,544 patients in 2014, 1.02%), and the incidence of VTE in noncancer patients fell by 0.22% (336 events in 59,021 patients, 0.57%). The relative risk of HA‐VTE after the VTE interventions was reduced by 17% (RR: 0.83, 95% CI: 0.69‐1.00) in cancer patients and 28% (RR: 0.72, 95% CI: 0.62‐0.83) in noncancer patients.
Surgical Versus Medical Patients
The impact of the VTE prevention initiative was only significant in surgical patients, for whom the risk of HA‐VTE fell by 28% (RR: 0.72, 95% CI: 0.63‐0.82) (Table 1). Medical patients experienced a nonsignificant 10% reduction in HA‐VTE (RR: 0.90, 95% CI: 0.73‐1.11). Medical patients had a significantly lower baseline incidence of HA‐VTE (0.57%) compared with surgical patients (1.14%; relative difference: 50%, P < 0.001). This finding persisted postimplementation, with a cumulative incidence in medical patients of 0.51% versus 0.82% in surgical patients (relative difference: 31%, P < 0.001).
DISCUSSION
Our initiative, comprised of a collaborative infrastructure, a proven quality‐improvement framework, and a bundle of interventions, was associated with a 24% reduction in the risk of HA‐VTE across our 5 academic medical centers. This represents avoidance of significant clinical morbidity (an estimated 81 PEs and 89 DVTs per year) and significant cost. Assuming costs of $9250 per DVT and $13,050 per PE,[17] the estimated short‐term cost savings are almost $1.9 million per year (minus expenditures on VTEP). Further savings might be expected over a longer time horizon because of the avoidance of recurrent VTE, post‐thrombotic syndrome, and the costs and complications of long‐term anticoagulation.
We believe the highly variable degree of improvement seen across our 5 sites was due to the relatively mature VTEP efforts at the onset of this collaborative improvement effort at UCSD and UCSF. As we noted earlier, the interventional bundle and methods were derived from earlier work at UCSD that had already demonstrated published marked improvement in prophylaxis and a 40% decrease in HA‐VTE.[14] The narrow range of low HA‐VTE rates in 2014 (the mature intervention time period) suggests there may be some HA‐VTE rate beyond which further prevention efforts are less productive.
Our study has several limitations. As a longitudinal collaborative improvement effort introducing a bundle of interventions, we cannot ascribe improved outcomes to individual components in the bundle; for example, we did not record the number of measure‐vention calls or resulting prophylaxis changes. We also did not measure adverse events due to VTEP, believing benefits to be greater than risks, but some adverse events likely did occur and attenuated benefits and cost savings. Although we had rigorous measures to assess the prevalence of appropriate prophylaxis, we failed to capture the baseline rate of VTEP, which means we cannot show that improved HA‐VTE rates corresponded to improvements in VTEP rates. The bundle of interventions was not implemented uniformly. Some metrics, like adherence to mechanical prophylaxis, were monitored in a decentralized fashion, without collation or collective analysis.
Were improved VTE rates due to decreases in HA‐VTE detection? We could not detect postdischarge HA‐VTE that presented to other hospitals, but we have no reason to think the proportion of missed HA‐VTE changed over the study. We discouraged the practice of routinely extending duplex ultrasound testing below the knee, and also discouraged surveillance of asymptomatic patients with Doppler ultrasound. This raises the question of ascertainment bias. Did we have fewer HA‐VTE in 2014 because our interventions worked, or did we reduce how aggressively we looked for HA‐VTE? Higher frequencies of ultrasound testing are correlated with higher rates of DVT because of surveillance bias.[18] Although some reduction in DVT was due to changes in ultrasound practices, several factors suggest the majority of improvement resulted from our interventions. First, only 1 of our 5 sites (UCD) routinely extended ultrasound testing below the knee in the baseline period. Second, we distinguished distal DVT from proximal/unspecified DVT, and the rates of both showed significant improvement. Screening asymptomatic patients with ultrasounds for DVT was limited to a few services in special circumstances (for example, the trauma service at UCSD screened patients at highest risk who could not be prophylaxed with anticoagulation). We did not have the capability to formally track which patients were being diagnosed with screening exams versus for symptoms, but screen‐detected patients were a small minority. We did not successfully dissuade these few services from stopping this approach, but we did head off some services that were considering this strategy, and think it likely that at best, we kept screening from spreading. Third, PE was reduced by over 20%, in addition to reductions in DVT, even though several of our sites acquired computed tomography scanners more sensitive for small thrombi/emncidental PE. Finally, the aggressiveness of ultrasound testing often goes up with aggressive prevention efforts, which would have led to surveillance bias with increasedrather than decreasedrates of HA‐VTE.
Our study has a number of strengths. Our effort encompassed a large and inclusive adult inpatient population over a long period of observation, with a relatively large reduction in HA‐VTE. These reductions occurred even though the proportion of patients with cancer (our most powerful predictor of VTE risk) was 34.8% in 2014 versus 33.3% in 2011. Our metrics captured patients readmitted to the hospital within 30 days of a prior VTE‐free admission as well as patients suffering VTE during the hospital stay, with the limitation that we captured only patients readmitted back to our own institutions. Our metrics for VTEP scrutinized prophylaxis rates at different points during hospitalizations, and risk‐appropriate prophylaxis was assessed, in contrast to some common regulatory measures that monitor only whether any prophylaxis is in place on the first day of admission or transfer.[11]
Our study should be instructive in terms of focusing improvement efforts. The rate of HA‐VTE was much higher in cancer and surgical patients than in medical patients, and we only achieved a nonsignificant 10% reduction in risk among medical patients (RR: 0.90, 95% CI: 0.73‐1.11). This is consistent with literature demonstrating a more limited benefit of prophylaxis in medical inpatients.[19] Although we continue to recommend prophylaxis in high‐risk medical inpatients, efforts targeting cancer and surgical populations are likely to yield greater results.
Our collaborative used methods that are portable, sustainable, and provide an excellent platform for spread of improvement across a system. The portability of these strategies is underlined by the variable baseline performance and the different stages of electronic health record development at our unique sites. Toolkits that describe the interventions (such as order sets, educational tools, measures, measure‐vention) are freely available, and reflect established guidelines.[1] Our collaborative model is consistent with successful models published in the literature.[1, 14, 20] In these models, clinical experts distill the evidence down into key best practices, and design processes that need to occur with the lowest barriers to use. Metrics, expert advice, and toolkits are assembled centrally, while each hospital identifies local barriers to implementation, educates and engages staff, executes implementation, and continually evaluates performance, modifying interventions accordingly. Embedding clinical decision and risk‐assessment into VTE prevention modules within commonly used order sets and documentation tools helps to hard‐wire the interventions, tightly linking risk assessment to appropriate prophylaxis options. The approach to standardization allows for flexibility for special populations and special needs of unique patients, while minimizing needless variation based on the ordering providers. Program management tools and regular webinars keeps sites on track, coordinate interventions, sustain enthusiasm, and provide a venue for sharing tools and lessons learned. Multiple active interventions are utilized rather than relying on passive educational techniques or order sets alone. Active surveillance (i.e., measure‐vention) deserves special attention. Measure‐vention has demonstrated utility in inpatient glycemic control and a variety of hospital‐associated infections in addition to VTE prevention, and some systems now uses measure‐ventionists as the lynchpin for a whole host of successful improvement programs.[12, 14, 21, 22] We believe high‐quality metrics, standardized protocol‐driven order sets, and measure‐vention are the crucial elements for success.
CONCLUSIONS
Hospital systems can reduce HA‐VTE by implementing a bundle of active interventions including standardized VTEP orders with embedded risk assessment and measure‐vention. Good measurement of HA‐VTE, appropriate VTEP that exceeds minimum regulatory standards, and a robust collaborative infrastructure inform and accelerate improvement. Surgical and cancer populations are at higher risk for HA‐VTE and should be a prime focus of improvement efforts.
Disclosures
Ian H Jenkins: nothing to report. Alpesh N. Amin: nothing to report. Nasim Afsarmanesh: nothing to report. Dr. Auerbach receives honorarium as Editor‐in‐Chief of the Journal of Hospital Medicine. Dr. Khanna has licensed technology to the hospital‐based electronic messaging vendor Voalte and will benefit financially from its dissemination. This does not impact this work. Dr. Maynard acts as a consultant on an expert panel overseeing a multinational trial of extended VTE prophylaxis in high‐risk medical patients (Medically Ill Patient Assessment of Rivaroxaban Versus Placebo in Reducing Post‐Discharge Venous Thrombo‐Embolism Risk), a study funded by Johnson & Johnson. Dr. White has acted as a consultant for Janssen, Boehringer‐Ingleheim, Diiachi‐Sankyo, and Bristol Meyer Squibb, and provides expert testimony for various malpractice defense lawyers for VTE, and has a grant with the Gordon and Betty Moore Foundation regarding VTE prevention.
- . Preventing Hospital‐Associated Venous Thromboembolism: A Guide for Effective Quality Improvement. 2nd ed. Rockville, MD: Agency for Healthcare Research and Quality; October 2015. AHRQ Publication No. 16–001‐EF. Available at: http://www.ahrq.gov/professionals/quality‐patient‐safety/patient‐safety‐resources/resources/vtguide/index.html. Accessed June 1, 2016.
- , , , et al. Relative impact of risk factors for deep vein thrombosis and pulmonary embolism. Arch Intern Med. 2002;162:1245–1248.
- , , , et al. Antithrombotic therapy practices in US hospitals in an era of practice guidelines. Arch Intern Med. 2005;165:1458–1464.
- , , , et al. Prevention of VTE in nonsurgical patients. Chest. 2012;141(2 suppl):e195S–e226S.
- , , , et al. Prevention of VTE in nonorthopedic surgical patients. Chest. 2012;141(2 suppl):e227S–e277S.
- , , , et al. Prevention of VTE in orthopedic surgery patients. Chest. 2012;141(2 suppl):e278S–e325S.
- , , , et al. The outcome after treatment of venous thromboembolism is different in surgical and acutely ill medical patients. Findings from the RIETE registry. J Thromb Haemost. 2004;2:1892–1898.
- , , , . Inpatient thromboprophylaxis use in U.S. hospitals: adherence to the Seventh American College of Chest Physician's recommendations for at‐risk medical and surgical patients. J Hosp Med. 2009;4:E15–E21.
- Centers for Medicare 5(1):10–18.
- , , , et al. Research electronic data capture (REDCap)—a metadata‐driven methodology and workflow process for providing translational research informatics support. J Biomed Inform. 2009;42:377–381.
- , , , et al. Mentored implementation: building leaders and achieving results through a collaborative improvement model. 2011 John M. Eisenberg Patient Safety and Quality Award, National Level. Jt Comm J Qual Patient Saf. 2012;38(7):301–310.
- , , , et al. Predictive value of the POA indicator for hospital‐acquired venous thromboembolism. Med Care. 2013:53(4):e31–e36.
- , , , et al. Improved coding of postoperative deep vein thrombosis and pulmonary embolism in administrative data (AHRQ patient safety indicator 12) after introduction of new ICD‐9‐CM diagnosis codes. Med Care. 2015:53(5):e37–e40.
- . Economic burden of venous thromboembolism in hospitalized patients. Pharmacotherapy. 2009;29(8):943–953.
- , , , et al. Evaluation of surveillance bias and the validity of the venous thromboembolism quality measure. JAMA. 2013;310(14):1482–1489.
- , , , et al. Venous thromboembolism prophylaxis in hospitalized medical patients and those with stroke: a background review for an American College of Physicians clinical practice guideline. Ann Intern Med. 2011;155(9):602–615.
- , , . Translating evidence into practice: a model for large scale knowledge translation. BMJ. 2008; 337:a1714.
- , , , et al. Impact of a hypoglycemia reduction bundle and a systems approach to inpatient glycemic management. Endocr Pract. 2015;21(4):355–367.
- . Zero adverse events: how Dignity Health achieved a new standard. Becker's Hospital Review: Infection Control and Clinical Quality website. Available at: http://www.beckershospitalreview.com/quality/zero‐adverse‐events‐how‐dignity‐health‐achieved‐a‐new‐standard.html. Accessed April 19, 2016.
Venous thromboembolism (VTE), comprised of pulmonary embolism (PE) and deep vein thrombosis (DVT), impacts hundreds of thousands of Americans annually.[1] The complications of VTE can be severe, including the post‐thrombotic syndrome, pulmonary hypertension, and complications of anticoagulation. VTE is often a complication of hospitalization, and PE is a common preventable cause of hospital mortality.[2, 3] Pharmacologic VTE prophylaxis (VTEP) in at‐risk patients is effective and endorsed by prominent guidelines.[4, 5, 6] However, VTEP is underutilized, with only 30% to 50% of eligible patients receiving the right drug, dose, and duration.[7, 8]
Public reporting and reimbursement policies reflect the magnitude of VTE as a public health concern. The Centers for Medicare and Medicaid Services (CMS) withholds incremental payment for VTE complications.[9] The rate of hospital‐associated VTE (HA‐VTE) is used by benchmarking organizations as a quality indicator.[10, 11]
The University of California (UC) has 5 major academic medical centers, located in Irvine (UCI), Los Angeles (UCLA), Sacramento (UC Davis [UCD]), San Diego (UCSD), and San Francisco (UCSF). In both 2010 and 2011, almost 700 UC patients suffered from HA‐VTE annually. Barriers to optimal VTEP included the absence of standardized VTE risk assessment, lack of consensus on appropriate VTEP options for various inpatient populations, and a lack of collaborative infrastructure. Other barriers included poor adherence to mechanical prophylaxis and suboptimal measurement of prophylaxis and HA‐VTE outcomes.
In late 2011, leaders from the 5 medical centers, supported by an internal competitive grant from the UC Office of the President and the Center for Health Quality and Innovation, formed a collaborative to address barriers, optimize VTEP in inpatients, and reduce HA‐VTE across the system. Prior efforts at UCSD illustrated single‐center improvement, with an increase in adequate VTEP from 50% to over 95%, and a nearly 40% reduction in the incidence of HA‐VTE.[12] We set out to scale this success across all 5 sites as a coordinated collaborative.
METHODS
This was a prospective, unblinded, open‐intervention study with historical controls that assessed prespecified outcomes before, during, and after institution of multiple VTEP strategies in 5 independent, but cooperating, academic hospitals. All adult medical and surgical inpatients were included; psychiatric, obstetricsgynecology, rehabilitation, observation status, and pediatric populations were excluded. The study period was July 1, 2012 through June 30, 2015. Calendar year (CY) 2011 was the baseline year for comparison; interventions were initiated in CY 2012 to CY 2014, and CY 2014 was considered the mature postintervention period.
Hospital Collaboration
Multiprofessional teams[1] were formed at each site. Monthly webinars, regular e‐mail, minutes, and a project management plan with task lists were utilized for coordinated collaboration. Software (Dropbox) was used for sharing tools, educational materials, and measurement techniques. REDCap (Research Electronic Data Capture) was used for secure data collection and analysis of outcomes.[13] Prior experience at UCSD and the Society of Hospital Medicine informed measurement and intervention bundle strategies.[1, 12, 14] Surveys of baseline VTE prevention protocols, measures, and order sets were performed at each site. Measures were standardized, whereas the intervention bundle was tailored for use at each medical center. Institutional review board approval with a waiver for individualized informed consent was obtained.
Interventions
All sites were tasked with implementing a defined bundle of mutually reinforcing interventions that constituted a comprehensive VTE prevention program. These protocols, order sets, educational programs, and interventions were not designed or implemented in an identical fashion at each hospital, but common principles were utilized.
VTE Prevention Protocol
This protocol incorporated (1) standardized VTE risk assessment, and (2) links to a menu of appropriate prophylaxis options for each level of risk that included guidance for management of patients with contraindications to pharmacologic prophylaxis. We used simple risk‐assessment models that grouped patients into 3 levels of risk (the 3‐bucket model) rather than more complicated point‐based systems. The 3‐bucket model was designed to offer detailed guidance and avoid over‐prophylaxis. Protocol, measurement, and order set tools were modified for special populations, such as orthopedic and neurosurgery populations. Operational definitions for bleeding risk, DVT risk, and exceptions to the protocol were explicit, which allowed for classification of adequate versus inadequate prophylaxis. High‐risk patients required combination prophylaxis, moderate risk anticoagulant prophylaxis, and low risk patients no prophylaxis beyond ambulation protocols (in the absence of contraindications). Acceptable contraindications to pharmacologic prophylaxis included an international normalized ratio >1.8, platelet count <50,000, active hemorrhage within the last 3 days, known bleeding disorders, hypertensive urgencies/emergencies, comfort careonly status, and leeway times around surgery or other events (24 hours for most surgeries, 48 hours for transplant surgery or major trauma, up to a week after central nervous system surgery). Impaired mobility was considered present unless the patient could ambulate independently more than once a day. More details regarding 3‐bucket risk models and explicit criteria can be reviewed in a recent Agency for Healthcare Quality and Research (AHRQ) publication.[1] The protocol was embedded into clinical decision‐support as required elements of admission, transfer, and postoperative order sets.
Educational Programs
Nurse and physician education programs were developed that stressed the importance of VTE prevention and adherence to thromboprophylaxis, including mechanical prophylaxis. The VTEP protocol was socialized in medical staff and nursing meetings. The educational programs recommended imaging only the proximal veins in patients with symptoms of leg DVT, and avoiding screening ultrasounds in asymptomatic patients. Physicians were coached on how to use the VTEP order sets. Content for educational programs was discussed and often shared among sites, but educational programs were tailored locally to fit perceived needs and available resources.
Measure‐vention
An active surveillance and feedback program called measure‐vention was developed to provide ongoing feedback to care providers regarding the appropriate use of VTEP over the duration of hospitalization. Key features of measure‐vention were regular measurement of adherence/lapses in VTEP delivery, coupled with concurrent intervention to correct any lapses, with a nurse/pharmacist calling the primary team if VTEP was suboptimal.[1, 12] Measure‐vention was utilized to monitor both appropriateness of orders and adherence with ordered prophylaxis, and was used to correct overprophylaxis as well as underprophylaxis. For example, our protocol specified that moderate VTE risk patients with a captured contraindication to anticoagulant should be on mechanical prophylaxis. An intervention would take place if mechanical prophylaxis was not ordered, or if it was ordered but not documented as being in place. Measure‐vention examples and further description are available in AHRQ publications.[1]
Outcomes
Thromboprophylaxis Rates
We planned to perform structured chart review on at least 30 noncritical care and 15 critical care adult inpatients per month at each site. Adult inpatients with a length of stay >48 hours, stratified by critical care versus noncritical care status, were assigned a numeric value by a random number generator. Patients were selected in order of random number assignment for chart review until the desired number of audits was completed. Development of the audit tools, as well as availability of personnel, led to delays in assessing prophylaxis rates by these standards until late 2012 to early 2013 at each site. A few sites had brief lapses in data collection during personnel changes. VTE risk, bleeding risk, prophylaxis ordered at the time of the audit, and adequacy of VTEP defined by a common standard were all assessed and recorded in the REDCap data repository. VTEP was considered adequate if combined pharmacologic and mechanical prophylaxis was present in the highest‐risk patients or anticoagulant prophylaxis was present in moderate patients. Prophylaxis was considered adequate for all low‐risk patients. Patients at risk for VTE with contraindications to anticoagulants were considered to be on adequate prophylaxis if they received mechanical prophylaxis or had documented contraindications to mechanical prophylaxis. The proper administration of ordered prophylaxis was scrutinized locally and targeted by education and other interventions at each site, but these data were not collated and analyzed centrally.
Identification of HA‐VTE
HA‐VTE rates were determined by administrative coding data, using International Classification of Diseases, Ninth Revision, Clinical Modification (ICD‐9‐CM) codes in a manner similar to AHRQ Patient Safety Indicator 12 identification of postoperative VTE cases.[10] Data were submitted by each hospital, then collated and analyzed using data from Vizient (formerly the University HealthSystem Consortium). The incidence of VTE was determined using specific ICD‐9‐CM hospital discharge codes: for PE: 415.11, 415.13, 415.19, 673.24; and for DVT: proximal DVT: 451.11, 451.19, 451.81, 453.41; distal DVT: 453.42; and other DVT: 453.40, 453.8. These codes have high positive predictive value for acute VTE.[15, 16] Mean age, average length of stay (ALOS), and admission severity of illness (SOI) scores were also captured from Vizient and summarized for the inpatient cohort each year.
All VTE cases were coupled with present on admission (POA) indicators. HA‐VTE cases included patients who were readmitted to the same hospital within 30 days for a new event (POA = Y, but readmitted), as well as patients who developed PE or DVT during their hospitalization (POA = N or U). Only patients hospitalized for 3 or more days were analyzed for inpatient development of VTE, as diagnosis of VTE in the first 2 days was deemed either likely present on admission or not preventable using VTEP started within 24 hours of admission. VTE outcomes were assigned in a hierarchical fashion: if both PE and DVT were present, the case was classified as PE. Distal DVT was distinguished from proximal DVT whenever possible. Cases were stratified based on whether the patient had undergone a major operation (surgery patients) or not (medical patients). This stratification was based on the Medicare Severity Diagnosis‐Related Group (MS‐DRG) coded in patient records. The DRG type for each MS‐DRG was based on the 2015 CMS‐MS‐DRG codes for major operations,[9] except that all trauma cases were considered surgical, and cases with vena cava filter placement and no other surgical procedure were considered medical. Cancer cases were identified using ICD‐9‐CM codes 140.00‐209.99 and 210.00‐239.99.
Review of HA‐VTE
Periodic review of selected HA‐VTE cases identified by administrative coding data was recommended as a best practice, potentially adding insight to contributing factors to HA‐VTE, included lapses in prophylaxis and suboptimal mobilization. The accuracy of diagnostic coding, and assessment of how HA‐VTE cases were identified (symptoms vs screening ultrasounds) could also be assessed. Examples of audit tools were shared. Every site reviewed some HA‐VTE cases, but the extent and duration of case review was left to the discretion of each site.
Statistical Analysis
Relative risk (RR) calculations with 95% confidence intervals (CI) were used to compare the proportions of patients with PE, DVT alone, and total HA‐VTE in 2014 versus 2011. The absolute risk reduction was multiplied by the population at risk in CY 2014 to arrive at estimates of cases of VTE averted in 2014 compared to 2011.
RESULTS
Robust sampling (421 to 728 patients at each site) revealed attainment of high rates of adequate VTE prophylaxis (82% to 96% at all sites, collectively 89%) by early 2014. Common measures for adequate VTEP were not finalized and collected by all sites until early 2013, so we did not capture baseline VTEP rates, and could not compare baseline to mature prophylaxis rates. Reliable administration of mechanical and anticoagulant prophylaxis was monitored and targeted by each institution, albeit not in an identical fashion at each site. Adherence to mechanical prophylaxis was reported as improved at the sites, but these data were not collated and analyzed centrally.
Population Demographics and Severity of Illness
There were 73,941 to 79,565 discharges that met the criteria (adult medicalsurgical inpatient with >2 day length of stay each year. Mean age and ALOS were unchanged or had no change of clinical significance. For example, in 2011 versus 2014, mean age was 55.7 versus 56.4 years, and ALOS was identical in both time periods at 7.4 days. Admission SOI scores also remained fairly static from 2011 to 2014 (2.27, 2.31, 2.32, 2.26, respectively), and the admission SOI was not statistically different in 2011 versus 2014 (estimated difference of 2 means 0.01, 95% CI: 0.00‐0.02).
Hospital‐Associated VTE
There were 2431 HA‐VTE events observed in 306,906 adult inpatients across CY 2011 to 2014 (Table 1). The baseline incidence of HA‐VTE was 0.90% (667 events in 73,941 hospitalizations in 2011). The incidence of HA‐VTE in the postintervention period was 0.69% (546 HA‐VTE events in 79,565 hospitalizations in 2014, P < 0.001), an overall reduction of 24%. The absolute risk for PE decreased from 0.49% to 0.39% (RR: 0.79, 95% CI: 0.68‐0.92), a reduction of 21%, and the absolute risk of leg DVT fell from 0.41% to 0.30% (RR: 0.73, 95% CI: 0.61‐0.86), a reduction of 27%. Both proximal and distal DVT were reduced significantly. Proximal DVT was much more commonly diagnosed than distal DVT. Proximal DVT incidence decreased from 0.32% to 0.25% (RR: 0.77, 95% CI: 0.64‐0.93), whereas distal DVT incidence decreased from 0.09% to 0.05% (RR: 0.58, 95% CI: 0.39‐0.86). The lower overall VTE rate in the postimplementation period compared with the baseline period corresponds to an estimated 170 fewer cases of VTE per year (89 DVT, 81 PE).
| 2011 (Baseline), No./% | 2012, No./% | 2013, No./% | 2014 (Mature), No./% | 2014 Versus 2011 Relative Risk (95% CI) | 2014 Versus 2011 Estimated Averted Events (95% CI) | |
|---|---|---|---|---|---|---|
| ||||||
| Total discharges (medical and surgical) | 73,941 | 76,100 | 77,300 | 79,565 | ||
| Total PE + leg DVT | 667/0.90% | 650/0.85% | 568/0.73% | 546/0.69% | 0.761 (0.680‐0.852) | 170 (103‐247) |
| Total PE | 363/0.49% | 359/0.47% | 340/0.44% | 309/0.39% | 0.791 (0.680‐0.920) | 81 (32‐135) |
| Total leg DVT | 304/0.41% | 291/0.38% | 228/0.29% | 237/0.3% | 0.725 (0.612‐0.858) | 89(40‐135) |
| Medical discharges | 31,219 | 32,597 | 33,805 | 34,875 | ||
| Total PE + leg DVT | 178/0.57% | 168/0.52% | 164/0.49% | 179/0.51% | 0.900 (0.732‐1.1071) | |
| PE | 110/0.35% | 94/0.29% | 106/0.31% | 104/0.30% | 0.846 (0.648‐1.106) | |
| Leg DVT | 68/0.22% | 74/0.23% | 58/0.17% | 75/0.22% | 0.987 (0.711‐1.371) | |
| Surgical discharges | 42,722 | 43,503 | 43,495 | 44,690 | ||
| Total PE + leg DVT | 489/1.14% | 482/1.11% | 404/0.93% | 367/0.82% | 0.718 (0.627‐0.821) | |
| PE | 253/0.59% | 265/0.61% | 234/0.54% | 205/0.46% | 0.775 (0.645‐0.931) | |
| Leg DVT | 236/0.55% | 217/0.50% | 180/0.41% | 162/0.36% | 0.656 (0.538‐0.801) | |
The baseline rate of HA‐VTE and degree of improvement varied between institutions (Figure 1). UCI and UCD began the study with significantly higher VTE rates, and enjoyed the largest improvements. UCLA's VTE rate decreased to a lesser extent, whereas UCSD and UCSF rates remained relatively flat or were marginally higher. In contrast to the highly variable 2011 baseline rate of HA‐VTE (0.60%1.36%), all 5 sites had HA‐VTE rates within a very narrow range (0.65%0.73%) at maturity in 2014.
Cancer Versus Noncancer Patients
The incidence of HA‐VTE was higher in cancer patients than in noncancer patients. In 2011, 227 of 18,487 (1.23%) cancer patients developed VTE, versus 440 of 55,454 (0.79%) noncancer patients (Figure 2). After implementation of the VTE prevention initiative, the incidence of VTE in cancer patients fell by 0.21% (210 events in 20,544 patients in 2014, 1.02%), and the incidence of VTE in noncancer patients fell by 0.22% (336 events in 59,021 patients, 0.57%). The relative risk of HA‐VTE after the VTE interventions was reduced by 17% (RR: 0.83, 95% CI: 0.69‐1.00) in cancer patients and 28% (RR: 0.72, 95% CI: 0.62‐0.83) in noncancer patients.
Surgical Versus Medical Patients
The impact of the VTE prevention initiative was only significant in surgical patients, for whom the risk of HA‐VTE fell by 28% (RR: 0.72, 95% CI: 0.63‐0.82) (Table 1). Medical patients experienced a nonsignificant 10% reduction in HA‐VTE (RR: 0.90, 95% CI: 0.73‐1.11). Medical patients had a significantly lower baseline incidence of HA‐VTE (0.57%) compared with surgical patients (1.14%; relative difference: 50%, P < 0.001). This finding persisted postimplementation, with a cumulative incidence in medical patients of 0.51% versus 0.82% in surgical patients (relative difference: 31%, P < 0.001).
DISCUSSION
Our initiative, comprised of a collaborative infrastructure, a proven quality‐improvement framework, and a bundle of interventions, was associated with a 24% reduction in the risk of HA‐VTE across our 5 academic medical centers. This represents avoidance of significant clinical morbidity (an estimated 81 PEs and 89 DVTs per year) and significant cost. Assuming costs of $9250 per DVT and $13,050 per PE,[17] the estimated short‐term cost savings are almost $1.9 million per year (minus expenditures on VTEP). Further savings might be expected over a longer time horizon because of the avoidance of recurrent VTE, post‐thrombotic syndrome, and the costs and complications of long‐term anticoagulation.
We believe the highly variable degree of improvement seen across our 5 sites was due to the relatively mature VTEP efforts at the onset of this collaborative improvement effort at UCSD and UCSF. As we noted earlier, the interventional bundle and methods were derived from earlier work at UCSD that had already demonstrated published marked improvement in prophylaxis and a 40% decrease in HA‐VTE.[14] The narrow range of low HA‐VTE rates in 2014 (the mature intervention time period) suggests there may be some HA‐VTE rate beyond which further prevention efforts are less productive.
Our study has several limitations. As a longitudinal collaborative improvement effort introducing a bundle of interventions, we cannot ascribe improved outcomes to individual components in the bundle; for example, we did not record the number of measure‐vention calls or resulting prophylaxis changes. We also did not measure adverse events due to VTEP, believing benefits to be greater than risks, but some adverse events likely did occur and attenuated benefits and cost savings. Although we had rigorous measures to assess the prevalence of appropriate prophylaxis, we failed to capture the baseline rate of VTEP, which means we cannot show that improved HA‐VTE rates corresponded to improvements in VTEP rates. The bundle of interventions was not implemented uniformly. Some metrics, like adherence to mechanical prophylaxis, were monitored in a decentralized fashion, without collation or collective analysis.
Were improved VTE rates due to decreases in HA‐VTE detection? We could not detect postdischarge HA‐VTE that presented to other hospitals, but we have no reason to think the proportion of missed HA‐VTE changed over the study. We discouraged the practice of routinely extending duplex ultrasound testing below the knee, and also discouraged surveillance of asymptomatic patients with Doppler ultrasound. This raises the question of ascertainment bias. Did we have fewer HA‐VTE in 2014 because our interventions worked, or did we reduce how aggressively we looked for HA‐VTE? Higher frequencies of ultrasound testing are correlated with higher rates of DVT because of surveillance bias.[18] Although some reduction in DVT was due to changes in ultrasound practices, several factors suggest the majority of improvement resulted from our interventions. First, only 1 of our 5 sites (UCD) routinely extended ultrasound testing below the knee in the baseline period. Second, we distinguished distal DVT from proximal/unspecified DVT, and the rates of both showed significant improvement. Screening asymptomatic patients with ultrasounds for DVT was limited to a few services in special circumstances (for example, the trauma service at UCSD screened patients at highest risk who could not be prophylaxed with anticoagulation). We did not have the capability to formally track which patients were being diagnosed with screening exams versus for symptoms, but screen‐detected patients were a small minority. We did not successfully dissuade these few services from stopping this approach, but we did head off some services that were considering this strategy, and think it likely that at best, we kept screening from spreading. Third, PE was reduced by over 20%, in addition to reductions in DVT, even though several of our sites acquired computed tomography scanners more sensitive for small thrombi/emncidental PE. Finally, the aggressiveness of ultrasound testing often goes up with aggressive prevention efforts, which would have led to surveillance bias with increasedrather than decreasedrates of HA‐VTE.
Our study has a number of strengths. Our effort encompassed a large and inclusive adult inpatient population over a long period of observation, with a relatively large reduction in HA‐VTE. These reductions occurred even though the proportion of patients with cancer (our most powerful predictor of VTE risk) was 34.8% in 2014 versus 33.3% in 2011. Our metrics captured patients readmitted to the hospital within 30 days of a prior VTE‐free admission as well as patients suffering VTE during the hospital stay, with the limitation that we captured only patients readmitted back to our own institutions. Our metrics for VTEP scrutinized prophylaxis rates at different points during hospitalizations, and risk‐appropriate prophylaxis was assessed, in contrast to some common regulatory measures that monitor only whether any prophylaxis is in place on the first day of admission or transfer.[11]
Our study should be instructive in terms of focusing improvement efforts. The rate of HA‐VTE was much higher in cancer and surgical patients than in medical patients, and we only achieved a nonsignificant 10% reduction in risk among medical patients (RR: 0.90, 95% CI: 0.73‐1.11). This is consistent with literature demonstrating a more limited benefit of prophylaxis in medical inpatients.[19] Although we continue to recommend prophylaxis in high‐risk medical inpatients, efforts targeting cancer and surgical populations are likely to yield greater results.
Our collaborative used methods that are portable, sustainable, and provide an excellent platform for spread of improvement across a system. The portability of these strategies is underlined by the variable baseline performance and the different stages of electronic health record development at our unique sites. Toolkits that describe the interventions (such as order sets, educational tools, measures, measure‐vention) are freely available, and reflect established guidelines.[1] Our collaborative model is consistent with successful models published in the literature.[1, 14, 20] In these models, clinical experts distill the evidence down into key best practices, and design processes that need to occur with the lowest barriers to use. Metrics, expert advice, and toolkits are assembled centrally, while each hospital identifies local barriers to implementation, educates and engages staff, executes implementation, and continually evaluates performance, modifying interventions accordingly. Embedding clinical decision and risk‐assessment into VTE prevention modules within commonly used order sets and documentation tools helps to hard‐wire the interventions, tightly linking risk assessment to appropriate prophylaxis options. The approach to standardization allows for flexibility for special populations and special needs of unique patients, while minimizing needless variation based on the ordering providers. Program management tools and regular webinars keeps sites on track, coordinate interventions, sustain enthusiasm, and provide a venue for sharing tools and lessons learned. Multiple active interventions are utilized rather than relying on passive educational techniques or order sets alone. Active surveillance (i.e., measure‐vention) deserves special attention. Measure‐vention has demonstrated utility in inpatient glycemic control and a variety of hospital‐associated infections in addition to VTE prevention, and some systems now uses measure‐ventionists as the lynchpin for a whole host of successful improvement programs.[12, 14, 21, 22] We believe high‐quality metrics, standardized protocol‐driven order sets, and measure‐vention are the crucial elements for success.
CONCLUSIONS
Hospital systems can reduce HA‐VTE by implementing a bundle of active interventions including standardized VTEP orders with embedded risk assessment and measure‐vention. Good measurement of HA‐VTE, appropriate VTEP that exceeds minimum regulatory standards, and a robust collaborative infrastructure inform and accelerate improvement. Surgical and cancer populations are at higher risk for HA‐VTE and should be a prime focus of improvement efforts.
Disclosures
Ian H Jenkins: nothing to report. Alpesh N. Amin: nothing to report. Nasim Afsarmanesh: nothing to report. Dr. Auerbach receives honorarium as Editor‐in‐Chief of the Journal of Hospital Medicine. Dr. Khanna has licensed technology to the hospital‐based electronic messaging vendor Voalte and will benefit financially from its dissemination. This does not impact this work. Dr. Maynard acts as a consultant on an expert panel overseeing a multinational trial of extended VTE prophylaxis in high‐risk medical patients (Medically Ill Patient Assessment of Rivaroxaban Versus Placebo in Reducing Post‐Discharge Venous Thrombo‐Embolism Risk), a study funded by Johnson & Johnson. Dr. White has acted as a consultant for Janssen, Boehringer‐Ingleheim, Diiachi‐Sankyo, and Bristol Meyer Squibb, and provides expert testimony for various malpractice defense lawyers for VTE, and has a grant with the Gordon and Betty Moore Foundation regarding VTE prevention.
- . Preventing Hospital‐Associated Venous Thromboembolism: A Guide for Effective Quality Improvement. 2nd ed. Rockville, MD: Agency for Healthcare Research and Quality; October 2015. AHRQ Publication No. 16–001‐EF. Available at: http://www.ahrq.gov/professionals/quality‐patient‐safety/patient‐safety‐resources/resources/vtguide/index.html. Accessed June 1, 2016.
- , , , et al. Relative impact of risk factors for deep vein thrombosis and pulmonary embolism. Arch Intern Med. 2002;162:1245–1248.
- , , , et al. Antithrombotic therapy practices in US hospitals in an era of practice guidelines. Arch Intern Med. 2005;165:1458–1464.
- , , , et al. Prevention of VTE in nonsurgical patients. Chest. 2012;141(2 suppl):e195S–e226S.
- , , , et al. Prevention of VTE in nonorthopedic surgical patients. Chest. 2012;141(2 suppl):e227S–e277S.
- , , , et al. Prevention of VTE in orthopedic surgery patients. Chest. 2012;141(2 suppl):e278S–e325S.
- , , , et al. The outcome after treatment of venous thromboembolism is different in surgical and acutely ill medical patients. Findings from the RIETE registry. J Thromb Haemost. 2004;2:1892–1898.
- , , , . Inpatient thromboprophylaxis use in U.S. hospitals: adherence to the Seventh American College of Chest Physician's recommendations for at‐risk medical and surgical patients. J Hosp Med. 2009;4:E15–E21.
- Centers for Medicare 5(1):10–18.
- , , , et al. Research electronic data capture (REDCap)—a metadata‐driven methodology and workflow process for providing translational research informatics support. J Biomed Inform. 2009;42:377–381.
- , , , et al. Mentored implementation: building leaders and achieving results through a collaborative improvement model. 2011 John M. Eisenberg Patient Safety and Quality Award, National Level. Jt Comm J Qual Patient Saf. 2012;38(7):301–310.
- , , , et al. Predictive value of the POA indicator for hospital‐acquired venous thromboembolism. Med Care. 2013:53(4):e31–e36.
- , , , et al. Improved coding of postoperative deep vein thrombosis and pulmonary embolism in administrative data (AHRQ patient safety indicator 12) after introduction of new ICD‐9‐CM diagnosis codes. Med Care. 2015:53(5):e37–e40.
- . Economic burden of venous thromboembolism in hospitalized patients. Pharmacotherapy. 2009;29(8):943–953.
- , , , et al. Evaluation of surveillance bias and the validity of the venous thromboembolism quality measure. JAMA. 2013;310(14):1482–1489.
- , , , et al. Venous thromboembolism prophylaxis in hospitalized medical patients and those with stroke: a background review for an American College of Physicians clinical practice guideline. Ann Intern Med. 2011;155(9):602–615.
- , , . Translating evidence into practice: a model for large scale knowledge translation. BMJ. 2008; 337:a1714.
- , , , et al. Impact of a hypoglycemia reduction bundle and a systems approach to inpatient glycemic management. Endocr Pract. 2015;21(4):355–367.
- . Zero adverse events: how Dignity Health achieved a new standard. Becker's Hospital Review: Infection Control and Clinical Quality website. Available at: http://www.beckershospitalreview.com/quality/zero‐adverse‐events‐how‐dignity‐health‐achieved‐a‐new‐standard.html. Accessed April 19, 2016.
© 2016 Society of Hospital Medicine

VTE Codes in Academic Medical Centers
Pulmonary embolism (PE) and deep venous thrombosis (DVT), historically referred to together as venous thromboembolism (VTE), are common, treatable, sometimes fatal, and potentially preventable medical problems.[1] Such thromboses can both precipitate a hospitalization as well as complicate it (either during or soon after discharge). Preventing such thrombosis as a complication of medical care has become a national imperative. Landmark studies such as Prophylaxis in Medical Patients With Enoxaparin (MEDENOX)[2] and Prospective Evaluation of Dalteparin Efficacy for Prevention of VTE in Immobilized Patients Trial (PREVENT)[3] demonstrated both a high incidence of thrombosis in a hospitalized high‐risk medical population (15% and 5% in the 2 trials' placebo arms, respectively) as well as significant relative risk reduction through venous thromboembolism pharmacoprophylaxis (VTEP)63% and 45%, respectively. The Joint Commission,[4] the Society of Hospital Medicine,[5] and the American College of Chest Physicians[6, 7] have thus all strived to ensure the appropriate provision of VTEP in order to reduce the morbidity and mortality associated with thrombosis in hospitalized patients, including those on medical services.
Ideally, the global success of these efforts would be assessed by measuring the rate of hospital‐associated VTE (potentially including superficial venous thrombosis [SVT], which, like upper‐extremity deep venous thrombosis [UE‐DVT], is commonly a central venous catheter [CVC]‐associated, or peripherally inserted central catheter [PICC]‐associated, complication)thrombosis acquired and diagnosed during either the index hospitalization (hospital‐acquired, or HA‐VTE/SVT) or up to 30 days postdischarge. Unfortunately, postdischarge VTE/SVT is difficult to measure because patients developing it may not present to the original hospital, or at all (eg, if they do not seek care, are treated as outpatients, or, in the most extreme case, die at home). In this context, despite being far less comprehensive, HA‐VTE/SVT is a useful subset of hospital‐associated VTE/SVT, for several reasons. First, the Centers for Medicare & Medicaid Services (CMS) have mandated hospitals to qualify all medical diagnoses as present‐on‐admission (POA = Y) or not (POA = N) since 2008, such that all medical diagnoses coded POA = N can be considered hospital acquired.[8] Second, refinements made to the International Classification of Diseases, 9th Revision (ICD‐9) codes now allow differentiation of UE‐DVT and SVT from lower‐extremity (LE) DVT/PE, whereas the former were sometimes obscured by nonspecific coding.[9] Third, recent studies have shown that medical diagnoses administratively coded as HA‐VTE/SVT correlated well with HA‐VTE/SVT ascertained through chart review.[9, 10] Finally, previous work has estimated that approximately half of all hospital‐associated VTE are HA‐VTE and the other half are postdischarge VTE.[11] Thus, HA‐VTE, though comprising only approximately half of all hospital‐associated VTE, is often used as a surrogate for measuring the success of ongoing VTE prevention programs.[12]
Our study aimed to assess the incidence of HA‐VTE plus HA‐SVT in the era of mandatory POA coding and newer ICD‐9 codes for VTE.
METHODS
Setting and Cases
We conducted a retrospective analysis of discharges from the 83 academic medical centers belonging to the UHC (formerly, the University HealthSystem Consortium,
Patients in our analysis were age 18 years and discharged with a medical medical severity diagnostic‐related group (MS‐DRG) code, hospitalized for 48 hours, and did not have a surgical or obstetric MS‐DRG code (except when assigned a surgical MS‐DRG code solely due to insertion of an inferior vena cava filter, with no other major procedures performed). Cases excluded discharges with a principal diagnosis of acute VTE/SVT (defined here as including PE, LE‐DVT, UE‐DVT, SVT, chronic VTE, and thrombosis not otherwise specified), as coding guidelines prohibit assigning a HA‐VTE as the principal diagnosis for the index hospitalization.[14]
Hospital‐Acquired Venous Thromboembolism or Superficial Venous Thrombosis
Cases were classified as having a HA‐VTE/SVT if there was 1 VTE/SVT coded in a secondary diagnosis position (other diagnosis) with a corresponding POA indicator equal to either N (not POA) or U (documentation insufficient to clarify whether VTE was POA or not). This usage corresponds to CMS guidelines and reimbursement policies for hospital‐acquired conditions.[15] Among cases with 1 HA‐VTE (or SVT), we assigned 1 HA‐VTE diagnosis using a hierarchy based on the highest level of clinical importance: first, PE; then LE‐DVT; then UE‐DVT; then SVT; then chronic VTE; then, finally, unspecified VTE. We subsequently excluded cases with primarily chronic VTE from our analysis because these were likely miscodes (ie, it is unclear how a chronic VTE could not be POA) and there were only 30 such cases. Cases with HA‐PE or HA‐LE DVT were analyzed separately as an important subset of HA‐VTE (plus SVT), because HA‐PE/LE‐DVT is both life‐threatening and theoretically preventable with VTEP.
Severity of Illness and Other Measures of Comorbidity
For each case we used proprietary software (3M Health Information Systems, Murray UT) to classify severity of illness (SOI). The SOI scale, based on physiologic derangement and organ system loss of function,[16] has 4 levels: minor, major, severe, and extreme. Defined within specific disease groups (All Patient Refined DRGs), it is often compared across diseases as well.[17] We also assessed whether patients had a cancer diagnosis, spent time in the intensive care unit (ICU), and died in the hospital.
Central Venous Catheter Use in Patients With Upper‐Extremity Deep Venous Thrombosis or Superficial Venous Thrombosis
Because UE‐DVT and SVT are frequently associated with a CVC or PICC, we assessed central venous catheterization among patients with an UE‐DVT or SVT of the cephalic, basilic, or antecubital veins using diagnosis codes for complications related to dialysis devices, implants, and grafts.
Pharmacologic Thromboprophylaxis
Pharmacy records of the subset of HA‐VTE/SVT cases with PE or LE‐DVT were analyzed to determine if VTEP was administered on hospital day 1 or 2, as per Joint Commission performance requirements.[4] Medications that met criteria as VTEP included unfractionated heparin, 5000 IU, given 2 or 3 a day; enoxaparin, 40 mg, given daily; dalteparin, 2500 or 5000 IU, given daily; fondaparinux, 2.5 mg, given daily; and warfarin. We could not reliably determine if VTEP was used throughout the entire hospitalization, or whether mechanical prophylaxis was used at all.
Statistical Analysis
This was a descriptive analysis to determine the incidence of HA‐VTE/SVT and describe the demographic and clinical characteristics of this population. We calculated means and standard deviations (SD) for continuous variables and proportions for binary variables (including HA‐VTE/SVT incidence). All comparisons between populations were performed as either 2‐tailed t tests or 2 analyses. All analysis was conducted using SAS software, version 9.2 (SAS Institute, Inc., Cary, NC).
RESULTS
For the 18‐month period between October 1, 2009, and March 31, 2011, across 83 UHC hospitals, there were 2,525,068 cases. Among these, 12,847 (0.51%) had 1 HA‐VTE/SVT coded. As per the clinical importance hierarchy described above, 2449 (19.1%) cases had at least a PE coded; 3848 (30%) had at least a LE‐DVT (but not a PE) coded; 2893 (22.5%) had at least an UE‐DVT coded; 3248 (25.3%) had at least an SVT coded; 30 had at least a chronic VTE coded; and 379 had at least a VTE coded with no specified location. Of those with SVT, 192 (5.8%) were LE‐SVT codes, whereas the rest were SVT/thrombophlebitis of the upper extremities or not otherwise specified. There were 11,882 (92.5%) hospitalizations with a single HA‐VTE/SVT code and an additional 965 (7.5%) with multiple codes, for a total of 13,749 HA‐VTE/SVT events (see Supporting Information, Table S1, in the online version of this article for more specific data for the individual ICD‐9 codes used to specify HA‐VTE events).
Compared with those who did not develop any HA‐VTE/SVT, patients with HA‐PE/LE‐DVT were more likely to be Caucasian (65% vs 58%, P < 0.001) and were older (age 62 vs 48 years, P < 0.001) and sicker (79.9% vs 44.9% with a severe or extreme SOI, P < 0.001). They also were more likely to have cancer, have longer lengths of stay, be more likely to stay in the ICU, and die in the hospital (P < 0.001 for all comparisons; Table 1).
| Characteristic | No HA‐VTE, n = 2,512,221 | HA‐PE/LE DVT, n = 6,297a | P Valueb |
|---|---|---|---|
| |||
| Proportion of hospitalizations, % | 99.49 | 0.25 | |
| Age, y | 48.2 27.1 | 62.5 20.0 | <0.001 |
| Female sex | 1,347,219 (53.6) | 3,104 (49.3) | <0.001 |
| Race | <0.001 | ||
| Caucasian | 1,455,215 (57.9) | 3,963 (64.7) | |
| Black | 600,991 (23.9) | 1,425 (23.3) | |
| Hispanic | 206,553 (8.2) | 263 (4.3) | |
| API | 59,560 (2.4) | 88 (1.4) | |
| Other | 189,902 (7.6) | 389 (6.4) | |
| Admission SOI | <0.001 | ||
| Minor | 461,411 (18.4) | 181 (2.9) | |
| Major | 922,734 (36.7) | 1,081 (17.2) | |
| Severe | 880,542 (35.1) | 2,975 (47.2) | |
| Extreme | 247,244 (9.8) | 2,060 (32.7) | |
| Unknown | 290 (0.01) | 0 (0.0) | |
| Had an active diagnosis of cancer | 331,705 (13.2) | 2,162 (34.3) | <0.001 |
| Length of stay, d | 7.31 9.31 | 18.7 19.5 | <0.001 |
| Spent time in the ICU | 441,412 (17.6) | 3,011 (47.8) | <0.001 |
| Died in hospital | 57,954 (2.3) | 1,036 (16.5) | <0.001 |
| Received prophylaxisc | c | 3,454 (54.9) | c |
Among cases with a code for UE‐DVT (22.5% of all patients with HA‐VTE), 74% were noted to also have a code for a CVC, as did 60% of cases with a HA‐SVT of the antecubital, basilic, or cephalic veins (71% of SVT events; see Supporting Information, Table S1, in the online version of this article).
Of those with HA‐PE/LE‐DVT, 54.9% received pharmacologic prophylaxis on hospital day 1 or 2 (mostly with low‐molecular‐weight heparin or unfractionated heparin).
DISCUSSION
In this study of medical patients admitted to academic medical centers throughout the United States, we found that HA‐VTE/SVT was coded in approximately 0.51% of discharges, and the incidence of HA‐PE/LE‐DVT was 0.25%. Patients with a HA‐PE/LE‐DVT code were, in general, older and sicker than those who did not develop VTE. We further found that close to half of all HA‐VTE/SVT occurred in the upper extremity, with the majority of these occurring in patients who had CVCs. Finally, the majority of patients diagnosed with HA‐PE/LE‐DVT were started on VTEP on the first or second hospital day.
The overall incidence of HA‐VTE/SVT we discovered corresponds well to other studies, even those with disparate populations. A single‐institution study found a HA‐VTE/SVT incidence of approximately 0.6% among hospitalized patients on medical and nonmedical services.[12] The study by Barba found a rate of 0.93%,[18] whereas the study by Lederle found a rate of approximately 1%.[19] Spyropolous found an HA‐VTE incidence of 0.55%.[11] Rothberg found a lower rate of 0.25% in his risk‐stratification study, though in the pre‐POA and preupdated code era.[20] Our findings extend and provide context for, in a much larger population, the results of these prior studies, and represent the first national examination of HA‐VTE/SVT in the setting of numerous quality‐improvement and other efforts to reduce hospital‐associated VTE.
The incidence of HA‐VTE/SVT codes we observed likely underestimates the incidence of hospital‐associated VTE/SVT by a factor of approximately 4, for 2 reasons. First, although VTE/SVT codes with a POA flag set to No are truly hospital‐acquired events on chart review approximately 75% of the time, and thus overestimate HA‐VTE/SVT, 25% of POA = Yes codes are actually HA‐VTE/SVT events on chart review, and therefore lead to underestimation of HA‐VTE/SVT.[9] Because VTE/SVT codes with a POA flag set to Yes outnumber those flagged No by 3 or 4 to 1, events mis‐flagged Yes contribute a much greater number of undercounted HA‐VTE/SVT, elevating the actual HA‐VTE/SVT event rate by a factor of approximately 2. Second, HA‐VTE events do not include hospital‐associated VTE events that are diagnosed after the index hospitalization. In the Spyropolous study, 45% of hospital‐associated VTE events occurred after discharge, so translating HA‐VTE/SVT events to hospital‐associated VTE/SVT events would again involve multiplying by a factor of 2.[11] Thus, the overall incidence of hospital‐associated VTE/SVT events in our sample may have been approximately 2% (0.51% 4), and the overall incidence of hospital‐associated PE or LE‐DVT events may have been approximately 1%, though there may be significant variation around these estimates given that individual institutions were themselves quite variable in their POA flag accuracy in our study.[9] There is additionally the possibility that hospitals may have deliberately left some VTE/SVT uncoded, but in the absence of financial incentives to do so for anything other than postsurgical VTE, and in the presence of penalties from CMS for undercoding, we believe this to be unlikely, at least at present.
Despite these upward extrapolations, the estimated incidence of hospital‐associated VTE/SVT in our study may seem low compared with that reported in the MEDENOX[2] and PREVENT studies.[3] Much of this discrepancy vanishes on closer examination. In the large randomized trials, patients were uniformly and routinely assessed for LE‐DVT using vascular ultrasound; in contrast, in our population of hospitalizations patients may have only had diagnostic studies done for signs or symptoms. Clinically apparent hospital‐associated VTE is less common than all hospital‐associated VTE, as it was even in PREVENT,[3] and increased surveillance may even be partially driving increased hospital‐associated VTE/SVT at some hospitals.[21] Our findings suggest that success or failure in preventing administratively coded, clinically apparent HA LE‐VTE/PE should be judged, broadly, against numbers in the range established in our study (eg, 0.25%), not the 5% or 15% of chart‐abstracted, aggressively ascertained (and sometimes clinically silent) hospital‐associated VTE in the large randomized controlled trials. That is, 0.25% is not an achievement, but rather the average, expected value.
Almost 25% of the observed HA‐VTE/SVTs coded were UE‐DVT, with roughly 75% of these being likely related to central venous catheterization (including those peripherally inserted). An additional 1/5 were upper‐extremity SVT of the antecubital, cephalic, and basilic veins, with the majority of these (60%) also listed as catheter‐related. Such thrombosis is best prevented by decreased use of central catheters or perhaps by using smaller‐caliber catheters.[22] It is unclear if VTEP can prevent such clots, though in cancer patients at least one recent trial seems promising.[23]
We found that patients with a coded HA‐PE/LE‐DVT were remarkably different from those not developing HA‐VTE/SVT. Patients with HA‐PE or HA‐LE‐DVT were older, sicker, more likely to have cancer, significantly more likely to spend time in the ICU, and much more likely to die in the hospital; risk factors for HA‐VTE overlap significantly with risk factors for death in the hospital. A small majority (55%) of patients in the HA‐PE/LE‐DVT group had actually received VTEP on at least day 1 or 2 of hospitalization. It may be the case that the dose of VTEP was insufficient to suppress clot formation in these patients, or that HA‐PE/LE‐DVT in patients with this degree of comorbidity is difficult to prevent.
There are a number of limitations to our study. We analyzed administrative codes, which underestimate hospital‐associated VTE/SVT events as noted above. This was a descriptive study, cross‐sectional across each hospitalization, and we were unable to draw any causal inference for differences in HA‐VTE/SVT incidence that might exist between subpopulations. We estimated VTEP from medication usage in just the first 2 days of hospitalization; we could not assess mechanical prophylaxis in this dataset; and we did not have any VTEP data for the first 2 days of hospitalization on the patients who did not develop a HA‐VTE/SVT, which made it impossible to compare the 2 populations on this measure. For those who did not receive VTEP, we were unable to obtain data regarding possible contraindications to VTEP, such as ongoing gastrointestinal or intracerebral hemorrhage. Additionally, our data are based on academic hospitals only and may not generalize to nonacademic settings. Extrapolating from HA‐VTE/SVT to hospital‐associated VTE/SVT may not be possible due to heterogeneity of clotting events and perhaps variability in whether patients would return to the hospital for all of them (eg, superficial or UE VTE may not result in readmission). Finally, it is unclear whether a switch to ICD Tenth Revision (ICD‐10) codes will impact our measured baseline in the coming year. The strengths of our analysis included stratification by type of HA‐VTE/SVT and our ability to assess the incidence of HA‐VTE/SVT in a large national population, and the provision of a baseline for VTE incidenceeasily usable by any individual hospital, network, or researcher with access to administrative datagoing forward.
In conclusion, among patients hospitalized in academic medical centers, HA‐VTE/SVT was coded in approximately 0.51% of patients with a medical illness staying >2 days, with approximately half of the events due to HA‐PE/LE‐DVT. Patients who developed HA‐PE/LE‐DVT were more acutely ill than those who did not, and VTE developed despite 55% of these patients receiving VTEP on day 1 or 2. Hospitals can reasonably treat the 0.25% figure as the baseline around which to assess their own performance in preventing HA‐PE/LE‐DVT, and can measure their own performance using administrative data. Further research is needed to determine how best to achieve further reductions in HA‐VTE/SVT through risk stratification and/or through other interventions.
Disclosures
Nothing to report.
- , , , , ;American College of Chest Physicians AntithromboticTherapy and Prevention of Thrombosis Panel. Executive summary: Antithrombotic Therapy and Prevention of Thrombosis, 9th ed: American College of Chest Physicians Evidence‐Based Clinical Practice Guidelines [published corrections appear in Chest. 2012;141(4):1129 and 2012;142(6):1698]. Chest. 2012;141(2 suppl):7S–47S.
- , , , et al;Prophylaxis in Medical Patients with Enoxaparin Study Group. A comparison of enoxaparin with placebo for the prevention of venous thromboembolism in acutely ill medical patients. N Engl J Med. 1999;341(11):793–800.
- , , , , , . Randomized, placebo‐controlled trial of dalteparin for the prevention of venous thromboembolism in acutely ill medical patients. Circulation. 2004;110(7):874–879.
- The Joint Commission.Specifications Manual for National Hospital Inpatient Quality Measures. Available at: http://www.jointcommission.org/specifications_manual_for_national_hospital_inpatient_quality_measures.aspx. Accessed July 18, 2012.
- , . Preventing Hospital‐Acquired Venous Thromboembolism: A Guide for Effective Quality Improvement. Prepared by the Society of Hospital Medicine. Rockville, MD: Agency for Healthcare Research and Quality; AHRQ Publication No. 08‐0075.
- , , , et al. Prevention of venous thromboembolism: the Seventh ACCP Conference on Antithrombotic and Thrombolytic Therapy. Chest. 2004;126(3 suppl):338S–400S.
- , , , et al. Prevention of VTE in nonsurgical patients: Antithrombotic Therapy and Prevention of Thrombosis, 9th ed: American College of Chest Physicians Evidence‐Based Clinical Practice Guidelines. Chest. 2012;141(2 suppl):e195S–e226S.
- Centers for Medicare 46(6 part 1):1946–1962.
- , , , et al. Predictive and associative models to identify hospitalized medical patients at risk for VTE. Chest. 2011;140(3):706–714.
- , , , . Unintended consequences of a standard admission order set on venous thromboembolism prophylaxis and patient outcomes. J Gen Intern Med. 2012;27(3):318–324.
- United Health Consortium Website. Available at: https://www.uhc.edu. Accessed March 8, 2012.
- ICD‐9‐CM Official Guidelines for Coding and Reporting. Available at: http://www.cdc.gov/nchs/data/icd9/icdguide10.pdf. Published 2010. Accessed June 4, 2013.
- Centers for Medicare 27(5):587–612.
- Overview of Disease Severity Measures Disseminated with the Nationwide Inpatient Sample (NIS) and Kids' Inpatient Database (KID). Available at: http://www.hcup‐us.ahrq.gov/db/nation/nis/OverviewofSeveritySystems.pdf. Published December 9, 2005. Accessed June 4, 2013.
- , , , et al. Venous thromboembolism in acutely ill hospitalized medical patients. Thromb Res. 2010;126(4):276–279.
- , , , . Venous thromboembolism prophylaxis in hospitalized medical patients and those with stroke: a background review for an American College of Physicians Clinical Practice Guideline. Ann Intern Med. 2011;155(9):602–615.
- , , , , . Risk factor model to predict venous thromboembolism in hospitalized medical patients. J Hosp Med. 2011;6(4):202–209.
- , , , et al. Evaluation of surveillance bias and the validity of the venous thromboembolism quality measure. JAMA. 2013;310(14):1482–1489.
- , , , et al. Reduction of peripherally inserted central catheter‐associated DVT. Chest. 2013;143(3):627–633.
- , , , et al. Prophylaxis of catheter‐related deep vein thrombosis in cancer patients with low‐dose warfarin, low molecular weight heparin, or control: a randomized, controlled, phase III study. Cancer Chemother Pharmacol. 2013;72(1):65–73.
Pulmonary embolism (PE) and deep venous thrombosis (DVT), historically referred to together as venous thromboembolism (VTE), are common, treatable, sometimes fatal, and potentially preventable medical problems.[1] Such thromboses can both precipitate a hospitalization as well as complicate it (either during or soon after discharge). Preventing such thrombosis as a complication of medical care has become a national imperative. Landmark studies such as Prophylaxis in Medical Patients With Enoxaparin (MEDENOX)[2] and Prospective Evaluation of Dalteparin Efficacy for Prevention of VTE in Immobilized Patients Trial (PREVENT)[3] demonstrated both a high incidence of thrombosis in a hospitalized high‐risk medical population (15% and 5% in the 2 trials' placebo arms, respectively) as well as significant relative risk reduction through venous thromboembolism pharmacoprophylaxis (VTEP)63% and 45%, respectively. The Joint Commission,[4] the Society of Hospital Medicine,[5] and the American College of Chest Physicians[6, 7] have thus all strived to ensure the appropriate provision of VTEP in order to reduce the morbidity and mortality associated with thrombosis in hospitalized patients, including those on medical services.
Ideally, the global success of these efforts would be assessed by measuring the rate of hospital‐associated VTE (potentially including superficial venous thrombosis [SVT], which, like upper‐extremity deep venous thrombosis [UE‐DVT], is commonly a central venous catheter [CVC]‐associated, or peripherally inserted central catheter [PICC]‐associated, complication)thrombosis acquired and diagnosed during either the index hospitalization (hospital‐acquired, or HA‐VTE/SVT) or up to 30 days postdischarge. Unfortunately, postdischarge VTE/SVT is difficult to measure because patients developing it may not present to the original hospital, or at all (eg, if they do not seek care, are treated as outpatients, or, in the most extreme case, die at home). In this context, despite being far less comprehensive, HA‐VTE/SVT is a useful subset of hospital‐associated VTE/SVT, for several reasons. First, the Centers for Medicare & Medicaid Services (CMS) have mandated hospitals to qualify all medical diagnoses as present‐on‐admission (POA = Y) or not (POA = N) since 2008, such that all medical diagnoses coded POA = N can be considered hospital acquired.[8] Second, refinements made to the International Classification of Diseases, 9th Revision (ICD‐9) codes now allow differentiation of UE‐DVT and SVT from lower‐extremity (LE) DVT/PE, whereas the former were sometimes obscured by nonspecific coding.[9] Third, recent studies have shown that medical diagnoses administratively coded as HA‐VTE/SVT correlated well with HA‐VTE/SVT ascertained through chart review.[9, 10] Finally, previous work has estimated that approximately half of all hospital‐associated VTE are HA‐VTE and the other half are postdischarge VTE.[11] Thus, HA‐VTE, though comprising only approximately half of all hospital‐associated VTE, is often used as a surrogate for measuring the success of ongoing VTE prevention programs.[12]
Our study aimed to assess the incidence of HA‐VTE plus HA‐SVT in the era of mandatory POA coding and newer ICD‐9 codes for VTE.
METHODS
Setting and Cases
We conducted a retrospective analysis of discharges from the 83 academic medical centers belonging to the UHC (formerly, the University HealthSystem Consortium,
Patients in our analysis were age 18 years and discharged with a medical medical severity diagnostic‐related group (MS‐DRG) code, hospitalized for 48 hours, and did not have a surgical or obstetric MS‐DRG code (except when assigned a surgical MS‐DRG code solely due to insertion of an inferior vena cava filter, with no other major procedures performed). Cases excluded discharges with a principal diagnosis of acute VTE/SVT (defined here as including PE, LE‐DVT, UE‐DVT, SVT, chronic VTE, and thrombosis not otherwise specified), as coding guidelines prohibit assigning a HA‐VTE as the principal diagnosis for the index hospitalization.[14]
Hospital‐Acquired Venous Thromboembolism or Superficial Venous Thrombosis
Cases were classified as having a HA‐VTE/SVT if there was 1 VTE/SVT coded in a secondary diagnosis position (other diagnosis) with a corresponding POA indicator equal to either N (not POA) or U (documentation insufficient to clarify whether VTE was POA or not). This usage corresponds to CMS guidelines and reimbursement policies for hospital‐acquired conditions.[15] Among cases with 1 HA‐VTE (or SVT), we assigned 1 HA‐VTE diagnosis using a hierarchy based on the highest level of clinical importance: first, PE; then LE‐DVT; then UE‐DVT; then SVT; then chronic VTE; then, finally, unspecified VTE. We subsequently excluded cases with primarily chronic VTE from our analysis because these were likely miscodes (ie, it is unclear how a chronic VTE could not be POA) and there were only 30 such cases. Cases with HA‐PE or HA‐LE DVT were analyzed separately as an important subset of HA‐VTE (plus SVT), because HA‐PE/LE‐DVT is both life‐threatening and theoretically preventable with VTEP.
Severity of Illness and Other Measures of Comorbidity
For each case we used proprietary software (3M Health Information Systems, Murray UT) to classify severity of illness (SOI). The SOI scale, based on physiologic derangement and organ system loss of function,[16] has 4 levels: minor, major, severe, and extreme. Defined within specific disease groups (All Patient Refined DRGs), it is often compared across diseases as well.[17] We also assessed whether patients had a cancer diagnosis, spent time in the intensive care unit (ICU), and died in the hospital.
Central Venous Catheter Use in Patients With Upper‐Extremity Deep Venous Thrombosis or Superficial Venous Thrombosis
Because UE‐DVT and SVT are frequently associated with a CVC or PICC, we assessed central venous catheterization among patients with an UE‐DVT or SVT of the cephalic, basilic, or antecubital veins using diagnosis codes for complications related to dialysis devices, implants, and grafts.
Pharmacologic Thromboprophylaxis
Pharmacy records of the subset of HA‐VTE/SVT cases with PE or LE‐DVT were analyzed to determine if VTEP was administered on hospital day 1 or 2, as per Joint Commission performance requirements.[4] Medications that met criteria as VTEP included unfractionated heparin, 5000 IU, given 2 or 3 a day; enoxaparin, 40 mg, given daily; dalteparin, 2500 or 5000 IU, given daily; fondaparinux, 2.5 mg, given daily; and warfarin. We could not reliably determine if VTEP was used throughout the entire hospitalization, or whether mechanical prophylaxis was used at all.
Statistical Analysis
This was a descriptive analysis to determine the incidence of HA‐VTE/SVT and describe the demographic and clinical characteristics of this population. We calculated means and standard deviations (SD) for continuous variables and proportions for binary variables (including HA‐VTE/SVT incidence). All comparisons between populations were performed as either 2‐tailed t tests or 2 analyses. All analysis was conducted using SAS software, version 9.2 (SAS Institute, Inc., Cary, NC).
RESULTS
For the 18‐month period between October 1, 2009, and March 31, 2011, across 83 UHC hospitals, there were 2,525,068 cases. Among these, 12,847 (0.51%) had 1 HA‐VTE/SVT coded. As per the clinical importance hierarchy described above, 2449 (19.1%) cases had at least a PE coded; 3848 (30%) had at least a LE‐DVT (but not a PE) coded; 2893 (22.5%) had at least an UE‐DVT coded; 3248 (25.3%) had at least an SVT coded; 30 had at least a chronic VTE coded; and 379 had at least a VTE coded with no specified location. Of those with SVT, 192 (5.8%) were LE‐SVT codes, whereas the rest were SVT/thrombophlebitis of the upper extremities or not otherwise specified. There were 11,882 (92.5%) hospitalizations with a single HA‐VTE/SVT code and an additional 965 (7.5%) with multiple codes, for a total of 13,749 HA‐VTE/SVT events (see Supporting Information, Table S1, in the online version of this article for more specific data for the individual ICD‐9 codes used to specify HA‐VTE events).
Compared with those who did not develop any HA‐VTE/SVT, patients with HA‐PE/LE‐DVT were more likely to be Caucasian (65% vs 58%, P < 0.001) and were older (age 62 vs 48 years, P < 0.001) and sicker (79.9% vs 44.9% with a severe or extreme SOI, P < 0.001). They also were more likely to have cancer, have longer lengths of stay, be more likely to stay in the ICU, and die in the hospital (P < 0.001 for all comparisons; Table 1).
| Characteristic | No HA‐VTE, n = 2,512,221 | HA‐PE/LE DVT, n = 6,297a | P Valueb |
|---|---|---|---|
| |||
| Proportion of hospitalizations, % | 99.49 | 0.25 | |
| Age, y | 48.2 27.1 | 62.5 20.0 | <0.001 |
| Female sex | 1,347,219 (53.6) | 3,104 (49.3) | <0.001 |
| Race | <0.001 | ||
| Caucasian | 1,455,215 (57.9) | 3,963 (64.7) | |
| Black | 600,991 (23.9) | 1,425 (23.3) | |
| Hispanic | 206,553 (8.2) | 263 (4.3) | |
| API | 59,560 (2.4) | 88 (1.4) | |
| Other | 189,902 (7.6) | 389 (6.4) | |
| Admission SOI | <0.001 | ||
| Minor | 461,411 (18.4) | 181 (2.9) | |
| Major | 922,734 (36.7) | 1,081 (17.2) | |
| Severe | 880,542 (35.1) | 2,975 (47.2) | |
| Extreme | 247,244 (9.8) | 2,060 (32.7) | |
| Unknown | 290 (0.01) | 0 (0.0) | |
| Had an active diagnosis of cancer | 331,705 (13.2) | 2,162 (34.3) | <0.001 |
| Length of stay, d | 7.31 9.31 | 18.7 19.5 | <0.001 |
| Spent time in the ICU | 441,412 (17.6) | 3,011 (47.8) | <0.001 |
| Died in hospital | 57,954 (2.3) | 1,036 (16.5) | <0.001 |
| Received prophylaxisc | c | 3,454 (54.9) | c |
Among cases with a code for UE‐DVT (22.5% of all patients with HA‐VTE), 74% were noted to also have a code for a CVC, as did 60% of cases with a HA‐SVT of the antecubital, basilic, or cephalic veins (71% of SVT events; see Supporting Information, Table S1, in the online version of this article).
Of those with HA‐PE/LE‐DVT, 54.9% received pharmacologic prophylaxis on hospital day 1 or 2 (mostly with low‐molecular‐weight heparin or unfractionated heparin).
DISCUSSION
In this study of medical patients admitted to academic medical centers throughout the United States, we found that HA‐VTE/SVT was coded in approximately 0.51% of discharges, and the incidence of HA‐PE/LE‐DVT was 0.25%. Patients with a HA‐PE/LE‐DVT code were, in general, older and sicker than those who did not develop VTE. We further found that close to half of all HA‐VTE/SVT occurred in the upper extremity, with the majority of these occurring in patients who had CVCs. Finally, the majority of patients diagnosed with HA‐PE/LE‐DVT were started on VTEP on the first or second hospital day.
The overall incidence of HA‐VTE/SVT we discovered corresponds well to other studies, even those with disparate populations. A single‐institution study found a HA‐VTE/SVT incidence of approximately 0.6% among hospitalized patients on medical and nonmedical services.[12] The study by Barba found a rate of 0.93%,[18] whereas the study by Lederle found a rate of approximately 1%.[19] Spyropolous found an HA‐VTE incidence of 0.55%.[11] Rothberg found a lower rate of 0.25% in his risk‐stratification study, though in the pre‐POA and preupdated code era.[20] Our findings extend and provide context for, in a much larger population, the results of these prior studies, and represent the first national examination of HA‐VTE/SVT in the setting of numerous quality‐improvement and other efforts to reduce hospital‐associated VTE.
The incidence of HA‐VTE/SVT codes we observed likely underestimates the incidence of hospital‐associated VTE/SVT by a factor of approximately 4, for 2 reasons. First, although VTE/SVT codes with a POA flag set to No are truly hospital‐acquired events on chart review approximately 75% of the time, and thus overestimate HA‐VTE/SVT, 25% of POA = Yes codes are actually HA‐VTE/SVT events on chart review, and therefore lead to underestimation of HA‐VTE/SVT.[9] Because VTE/SVT codes with a POA flag set to Yes outnumber those flagged No by 3 or 4 to 1, events mis‐flagged Yes contribute a much greater number of undercounted HA‐VTE/SVT, elevating the actual HA‐VTE/SVT event rate by a factor of approximately 2. Second, HA‐VTE events do not include hospital‐associated VTE events that are diagnosed after the index hospitalization. In the Spyropolous study, 45% of hospital‐associated VTE events occurred after discharge, so translating HA‐VTE/SVT events to hospital‐associated VTE/SVT events would again involve multiplying by a factor of 2.[11] Thus, the overall incidence of hospital‐associated VTE/SVT events in our sample may have been approximately 2% (0.51% 4), and the overall incidence of hospital‐associated PE or LE‐DVT events may have been approximately 1%, though there may be significant variation around these estimates given that individual institutions were themselves quite variable in their POA flag accuracy in our study.[9] There is additionally the possibility that hospitals may have deliberately left some VTE/SVT uncoded, but in the absence of financial incentives to do so for anything other than postsurgical VTE, and in the presence of penalties from CMS for undercoding, we believe this to be unlikely, at least at present.
Despite these upward extrapolations, the estimated incidence of hospital‐associated VTE/SVT in our study may seem low compared with that reported in the MEDENOX[2] and PREVENT studies.[3] Much of this discrepancy vanishes on closer examination. In the large randomized trials, patients were uniformly and routinely assessed for LE‐DVT using vascular ultrasound; in contrast, in our population of hospitalizations patients may have only had diagnostic studies done for signs or symptoms. Clinically apparent hospital‐associated VTE is less common than all hospital‐associated VTE, as it was even in PREVENT,[3] and increased surveillance may even be partially driving increased hospital‐associated VTE/SVT at some hospitals.[21] Our findings suggest that success or failure in preventing administratively coded, clinically apparent HA LE‐VTE/PE should be judged, broadly, against numbers in the range established in our study (eg, 0.25%), not the 5% or 15% of chart‐abstracted, aggressively ascertained (and sometimes clinically silent) hospital‐associated VTE in the large randomized controlled trials. That is, 0.25% is not an achievement, but rather the average, expected value.
Almost 25% of the observed HA‐VTE/SVTs coded were UE‐DVT, with roughly 75% of these being likely related to central venous catheterization (including those peripherally inserted). An additional 1/5 were upper‐extremity SVT of the antecubital, cephalic, and basilic veins, with the majority of these (60%) also listed as catheter‐related. Such thrombosis is best prevented by decreased use of central catheters or perhaps by using smaller‐caliber catheters.[22] It is unclear if VTEP can prevent such clots, though in cancer patients at least one recent trial seems promising.[23]
We found that patients with a coded HA‐PE/LE‐DVT were remarkably different from those not developing HA‐VTE/SVT. Patients with HA‐PE or HA‐LE‐DVT were older, sicker, more likely to have cancer, significantly more likely to spend time in the ICU, and much more likely to die in the hospital; risk factors for HA‐VTE overlap significantly with risk factors for death in the hospital. A small majority (55%) of patients in the HA‐PE/LE‐DVT group had actually received VTEP on at least day 1 or 2 of hospitalization. It may be the case that the dose of VTEP was insufficient to suppress clot formation in these patients, or that HA‐PE/LE‐DVT in patients with this degree of comorbidity is difficult to prevent.
There are a number of limitations to our study. We analyzed administrative codes, which underestimate hospital‐associated VTE/SVT events as noted above. This was a descriptive study, cross‐sectional across each hospitalization, and we were unable to draw any causal inference for differences in HA‐VTE/SVT incidence that might exist between subpopulations. We estimated VTEP from medication usage in just the first 2 days of hospitalization; we could not assess mechanical prophylaxis in this dataset; and we did not have any VTEP data for the first 2 days of hospitalization on the patients who did not develop a HA‐VTE/SVT, which made it impossible to compare the 2 populations on this measure. For those who did not receive VTEP, we were unable to obtain data regarding possible contraindications to VTEP, such as ongoing gastrointestinal or intracerebral hemorrhage. Additionally, our data are based on academic hospitals only and may not generalize to nonacademic settings. Extrapolating from HA‐VTE/SVT to hospital‐associated VTE/SVT may not be possible due to heterogeneity of clotting events and perhaps variability in whether patients would return to the hospital for all of them (eg, superficial or UE VTE may not result in readmission). Finally, it is unclear whether a switch to ICD Tenth Revision (ICD‐10) codes will impact our measured baseline in the coming year. The strengths of our analysis included stratification by type of HA‐VTE/SVT and our ability to assess the incidence of HA‐VTE/SVT in a large national population, and the provision of a baseline for VTE incidenceeasily usable by any individual hospital, network, or researcher with access to administrative datagoing forward.
In conclusion, among patients hospitalized in academic medical centers, HA‐VTE/SVT was coded in approximately 0.51% of patients with a medical illness staying >2 days, with approximately half of the events due to HA‐PE/LE‐DVT. Patients who developed HA‐PE/LE‐DVT were more acutely ill than those who did not, and VTE developed despite 55% of these patients receiving VTEP on day 1 or 2. Hospitals can reasonably treat the 0.25% figure as the baseline around which to assess their own performance in preventing HA‐PE/LE‐DVT, and can measure their own performance using administrative data. Further research is needed to determine how best to achieve further reductions in HA‐VTE/SVT through risk stratification and/or through other interventions.
Disclosures
Nothing to report.
- , , , , ;American College of Chest Physicians AntithromboticTherapy and Prevention of Thrombosis Panel. Executive summary: Antithrombotic Therapy and Prevention of Thrombosis, 9th ed: American College of Chest Physicians Evidence‐Based Clinical Practice Guidelines [published corrections appear in Chest. 2012;141(4):1129 and 2012;142(6):1698]. Chest. 2012;141(2 suppl):7S–47S.
- , , , et al;Prophylaxis in Medical Patients with Enoxaparin Study Group. A comparison of enoxaparin with placebo for the prevention of venous thromboembolism in acutely ill medical patients. N Engl J Med. 1999;341(11):793–800.
- , , , , , . Randomized, placebo‐controlled trial of dalteparin for the prevention of venous thromboembolism in acutely ill medical patients. Circulation. 2004;110(7):874–879.
- The Joint Commission.Specifications Manual for National Hospital Inpatient Quality Measures. Available at: http://www.jointcommission.org/specifications_manual_for_national_hospital_inpatient_quality_measures.aspx. Accessed July 18, 2012.
- , . Preventing Hospital‐Acquired Venous Thromboembolism: A Guide for Effective Quality Improvement. Prepared by the Society of Hospital Medicine. Rockville, MD: Agency for Healthcare Research and Quality; AHRQ Publication No. 08‐0075.
- , , , et al. Prevention of venous thromboembolism: the Seventh ACCP Conference on Antithrombotic and Thrombolytic Therapy. Chest. 2004;126(3 suppl):338S–400S.
- , , , et al. Prevention of VTE in nonsurgical patients: Antithrombotic Therapy and Prevention of Thrombosis, 9th ed: American College of Chest Physicians Evidence‐Based Clinical Practice Guidelines. Chest. 2012;141(2 suppl):e195S–e226S.
- Centers for Medicare 46(6 part 1):1946–1962.
- , , , et al. Predictive and associative models to identify hospitalized medical patients at risk for VTE. Chest. 2011;140(3):706–714.
- , , , . Unintended consequences of a standard admission order set on venous thromboembolism prophylaxis and patient outcomes. J Gen Intern Med. 2012;27(3):318–324.
- United Health Consortium Website. Available at: https://www.uhc.edu. Accessed March 8, 2012.
- ICD‐9‐CM Official Guidelines for Coding and Reporting. Available at: http://www.cdc.gov/nchs/data/icd9/icdguide10.pdf. Published 2010. Accessed June 4, 2013.
- Centers for Medicare 27(5):587–612.
- Overview of Disease Severity Measures Disseminated with the Nationwide Inpatient Sample (NIS) and Kids' Inpatient Database (KID). Available at: http://www.hcup‐us.ahrq.gov/db/nation/nis/OverviewofSeveritySystems.pdf. Published December 9, 2005. Accessed June 4, 2013.
- , , , et al. Venous thromboembolism in acutely ill hospitalized medical patients. Thromb Res. 2010;126(4):276–279.
- , , , . Venous thromboembolism prophylaxis in hospitalized medical patients and those with stroke: a background review for an American College of Physicians Clinical Practice Guideline. Ann Intern Med. 2011;155(9):602–615.
- , , , , . Risk factor model to predict venous thromboembolism in hospitalized medical patients. J Hosp Med. 2011;6(4):202–209.
- , , , et al. Evaluation of surveillance bias and the validity of the venous thromboembolism quality measure. JAMA. 2013;310(14):1482–1489.
- , , , et al. Reduction of peripherally inserted central catheter‐associated DVT. Chest. 2013;143(3):627–633.
- , , , et al. Prophylaxis of catheter‐related deep vein thrombosis in cancer patients with low‐dose warfarin, low molecular weight heparin, or control: a randomized, controlled, phase III study. Cancer Chemother Pharmacol. 2013;72(1):65–73.
© 2014 Society of Hospital Medicine