User login
Frequently Admitted Patients
The national healthcare improvement paradigm is shifting toward a more comprehensive, value‐focused, and patient‐centered approach. Reducing hospital readmissions has become a focal point as a policy strategy to improve care quality while reducing cost. Section 3025 of the Affordable Care Act mandated the Centers for Medicare and Medicaid Services to make progressive reductions in Medicare payments to hospitals that have higher than expected readmission rates for 3 conditions (heart failure, acute myocardial infarction, and pneumonia), and expanding to include chronic obstructive pulmonary disease and total hip and knee arthroplasty in 2015.[1] In response, hospitals and systems are developing and implementing programs that coordinate care beyond hospital walls to reduce readmissions and healthcare costs.[2, 3] However, patients are readmitted for a variety of reasons, and programs that address the needs of some may not address the distinct needs of others. Understanding the characteristics of patients with frequent readmissions will permit the well‐informed creation of solutions specific to this population to reduce cost, free resources, and provide better care.
Although a solid body of literature already exists that describes the characteristics of patients who frequently visit the emergency department (ED),[4, 5, 6, 7, 8, 9, 10, 11, 12] it is not clear to what extent these characteristics also apply to patients with frequent hospital admissions. Frequent ED visitors have been found to be largely insured (85%) although with over‐representation of public insurance, and to be heavy users of the healthcare system overall.[6] A high disease burden associated with multiple chronic conditions has been found to predict frequent ED use.[4, 9, 11, 12] Some characteristics may vary by location; for example, alcohol abuse and psychiatric morbidity have been found to be associated with frequent ED use in New York and San Francisco, but it is not clear to what extent they are a factor in less urban areas.[4, 6, 12]
Several previous studies have investigated the characteristics of frequently admitted patients at single sites.[13, 14, 15, 16] Nguyen et al. (2013) studied patients with the highest costs and the most admissions at a large academic medical center in San Francisco.[13] High admit patients were defined as those responsible for the top decile of admissions, and were grouped into equal‐sized high‐ and low‐cost cohorts. The high‐admission/high‐cost group represented 5% of all patients, 25% of all costs, and 16% of all admissions. These patients were hospitalized primarily for medical conditions (78%) and had a high 30‐day readmission rate (47%). The high‐admission/low‐cost group accounted for 5% of all patients, 12% of all admissions, and 7% of all costs. These patients were also predominantly admitted for medical conditions (87%), with the most common admitting diagnoses representing respiratory, gastrointestinal, and cardiovascular conditions.[13]
Hwa (2012) conducted an analysis of 29 patients admitted 6 or more times in 1 year to an inpatient medical service in San Francisco.[14] These patients represented just 1% of all patients, but 13% of readmissions. Fifty‐five percent of these patients had a psychiatric diagnosis, and 52% had chronic pain. Ninety percent had a primary care physician in the hospital system, 100% were insured either privately or publicly, and 93% had housing, although for 17% housing was described as marginal.[14]
In a third study, Boonyasai et al. (2012) identified 76 patients with 82 readmissions at a Baltimore, Maryland, hospital and classified them as isolated (1 readmission per 6‐month period) or serial (more than 1 readmission per 6‐month period) readmissions.[15] Patients with serial readmissions accounted for 70% of the total. Isolated readmissions were most likely to be related to suboptimal quality of care and care coordination, whereas serial readmissions were more likely to result from disease progression, psychiatric illness, and substance abuse.[15]
All of these studies were conducted at single‐site academic medical centers serving inner city populations. We undertook this study to identify patient and hospital‐level characteristics of frequently admitted patients in a broad sample of 101 US academic medical centers to determine whether previously reported findings are generalizable, and to identify characteristics of frequently admitted patients that can inform interventions designed to meet the needs of this relatively small but resource‐intensive group of patients.
METHODS
All data were obtained from the University HealthSystem Consortium (UHC) (Chicago, IL) Clinical Data Base/Resource Manager (CDB), a large administrative database to which UHC principal members submit comprehensive administrative data files. UHC's principal members include approximately 120 US academic medical centers delivering tertiary and quaternary care, with an average of 647 acute care beds. The CDB includes primary and secondary diagnoses using International Classification of Diseases, Ninth Revision (ICD‐9)[17] codes.
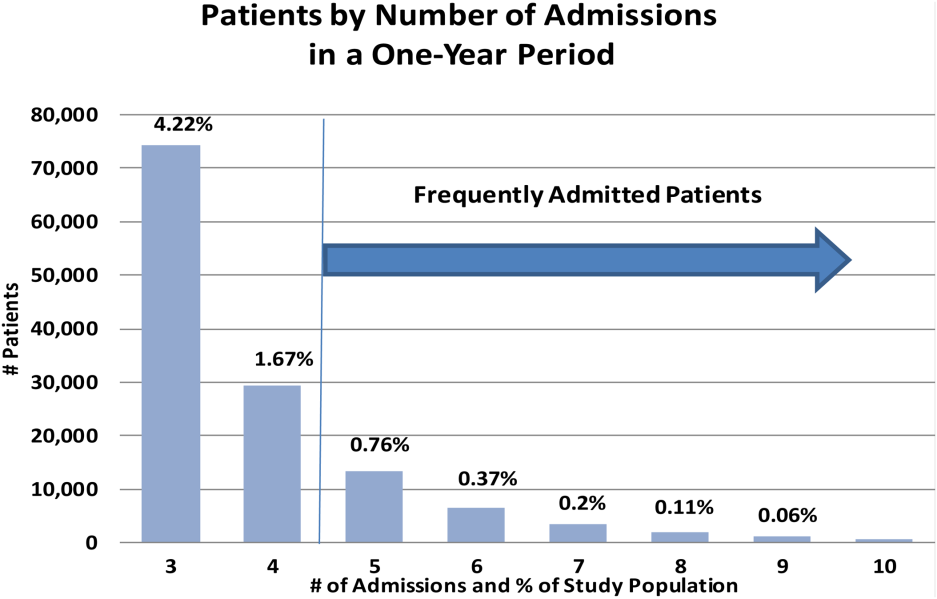
The data of 101 academic medical centers with complete datasets for the study period (October 1, 2011, to September 30, 2012) were included in this analysis. Frequently admitted patients were defined as patients admitted 5 or more times to the same facility in a 12‐month period; all admissions were included, even those more than 30 days apart. This definition was established based on a naturally occurring break in the frequency distribution (Figure 1) and our intention to focus on the unique characteristics of patients at the far right of the distribution. We excluded obstetric (MDC 14, ICD‐9)[17] admissions and pediatric (<18 years of age at index admission) patients, as well as admissions with principal diagnoses for chemotherapy (ICD‐9 diagnosis codes v5811v5812), dialysis (ICD‐9 diagnosis codes v560v568), and rehabilitation (ICD‐9 diagnosis codes v570v579), which are typically planned. The Agency for Healthcare Research and Quality (AHRQ) comorbidity software was used to identify comorbid conditions,[18, 19] and a score based on the Elixhauser comorbidity measures was calculated using a modified acuity point system.[20] For comparisons based on safety net status, we used a definition of payer mix being 25% Medicaid or uninsured.

Our analyses included patient demographics, admission source and discharge status, clinical diagnoses, procedures, and comorbidities, cost, and length of stay. Patients defined as frequently admitted were compared in aggregate to all other hospitalized patients (all other admissions).
To evaluate associations, we used [2] tests for categorical variables and t tests for continuous variables. When comparing the non‐normally distributed comorbidities of the control group to the normally distributed comorbidities of the frequently admitted patients, we performed a Kruskal‐Wallis test on the medians.
RESULTS
During a 1‐year period (October 1, 2011, to September 30, 2012), 1,758,027 patients were admitted 2,388,124 times at 101 academic medical centers. Of these, 28,291 patients had 5 or more admissions during this period, resulting in 180,185 admissions. These frequently admitted patients represented 1.6% of all patients (Figure 1) and 7.6% of all inpatient admissions. By comparison, nonfrequently admitted patients were admitted once (79%), twice (14%), 3 times (4%), or 4 times (2%).
Among hospitals, the volume and impact of frequently admitted patients varied widely. The frequently admitted patient population ranged from 64 patients (0.7% of all patients) to 785 patients (3.5%), with an average of 280 patients (1.6%). To look for differences that might explain this range, we compared hospitals in the top and bottom deciles with respect to geographic region and to safety net status, but found no significant or meaningful differences. The average number of admissions per patient was 6.4, with a range of 5 to 76. Days per patient ranged from 5 to 434 days, with an average of 42. The average patient‐day percentage (frequently admitted patient days/total patient days) was 8.4%, and ranged from 3.2% to 15.4%.
Frequently admitted patients were more likely to be younger than all other patients (71.9% under the age of 65 years, as compared with 65.3% of all other patients (P<0.001)). They were also more likely to have either Medicaid or no healthcare insurance (27.6% compared with 21.6%, P<0.001), although nearly three‐quarters had either private insurance or Medicare coverage.
Eighty‐four percent of frequently admitted patient admissions were to medical services (vs 58% of all other patients (P<0.001)). The admission status for these patients was much less likely to be elective (9.1% of frequently admitted patient admissions vs 26.6% of all other patients' admissions [P<0.001]). Frequently admitted patients were more likely to be discharged to a skilled nursing facility (9.3% vs 8.4%, [P<0.001]) or with home health services (19.7% vs 13.4% [P<0.001]).
The 10 most common primary diagnoses for patient admissions are shown in Table 1. No single primary diagnosis accounted for a large share of the admissions of these patients; the most common diagnosis, sickle cell disease with crisis, accounted for only about 4% of admissions. The 10 most common diagnoses accounted for <20% of all admissions. The remainder of the diagnoses was spread over more than 3000 diagnosis codes; only about 300 codes had more than 100 admissions each.
| Primary Diagnoses | Secondary Diagnoses | Principal Procedures | ||||||||
|---|---|---|---|---|---|---|---|---|---|---|
| Frequently Admitted Patient Admissions, N=180,185 | All Other Patient Admissions, N=2,207,939 | All Other Patient Rank | Frequently Admitted Patient Admissions, N=180,185 | All Other Patient Admissions, N=2,207,939 | All Other PatientRank | Frequently Admitted Patient Admissions, N=180,185 | All Other Patient Admissions, N=2,207,939 | |||
| ||||||||||
| Sickle cell disease with crisis | 3.97% (7,152) | 0.002% (5,887) | 63 | Hypertension NOS | 31.39% (56,556) | 40.04% (884,045) | 1 | Hemodialysis | 6.32% (11,380) | 1.08% (23,871) |
| Septicemia NOS | 2.58% (4,652) | 1.87% (41,369) | 1 | Hyperlipidemia NOS | 24.47% (44,089) | 25.94% (572,760) | 2 | Packed cell transfusion | 4.49% (8.091) | 1.57% (34,669) |
| Acute and chronic systolic heart failure | 2.06% (3,708) | 0.81% (17,802) | 12 | Congestive heart failure NOS | 22.86% (41,197) | 11.82% (260,944) | 8 | Percutaneous abdominal drainage | 2.42% (4,366) | 0.86% (18,974) |
| Acute kidney failure NOS | 2.04% (3,680) | 1.16% (25,528) | 6 | Esophageal reflux | 21.19% (38,184) | 17.32% (382,511) | 3 | Venous catheter NEC | 2.13% (3,843) | 0.89% (19,718) |
| Obstructive chronic bronchitis with exacerbation | 1.76% (3,180) | 0.68% (14,957) | 14 | Diabetes mellitus NOS uncomplicated | 20.39% (36,743) | 16.75% (369,808) | 4 | Central venous catheter placement with guidewire | 2.13% (3,834)) | 0.83% (18,307) |
| Pneumonia organism NOS | 1.72% (3,091) | 1.29% (28,468) | 4 | Tobacco use disorder | 16.98% (30,604) | 16.71% (368,880) | 5 | Continuous invasive mechanical ventilation <96 consecutive hours | 1.38% (2,480) | 0.7% (15,441) |
| Urinary tract infection NOS | 1.63% (2,939) | 0.86% (19,069) | 9 | History of tobacco use | 16.89% (30,439) | 14.77% (326,026) | 6 | Noninvasive mechanical ventilation | 1.3% (2,345) | 0.58% (12,899) |
| Acute pancreatitis | 1.23% (2,212) | 0.73% (16,168) | 13 | Coronary atherosclerosis native vessel | 16.12% (29,040) | 12.88% (284,487) | 7 | Small intestine endoscopy NEC | 1.26% (2.265) | 0.7% (15,480) |
| Acute and chronic diastolic heart failure | 1.22% (2,190) | 0.48% (10,600) | 22 | Depressive disorder | 15.42% (27,785) | 10.34% (228,347) | 10 | Heart ultrasound | 1.11% (1,997) | 1.37% (30,161) |
| Complication of kidney transplant | 1.08% (1,944) | 0.42% (9,354) | 28 | Acute kidney failure NOS | 13.8% (24,859) | 9.37%% (206,951) | 12 | Esophagogastroduodenoscopy with closed biopsy | 1.09% (1,963) | 0.8% (17,644) |
Secondary diagnoses were mainly chronic conditions, including hypertension, hyperlipidemia, esophageal reflux, and diabetes mellitus type 2 (Table 1.) Combined, congestive heart failure and diabetes mellitus accounted for 43.3% of the secondary diagnoses of admissions of frequently admitted patients, but for only 28.6% of other patients. Acute kidney failure was more common in frequently admitted patients (13.8% vs 9.4% [P<0.001]). Psychiatric disorders accounted for <1% of primary diagnoses for both frequently admitted patients and all other patients. As a secondary diagnosis, depressive disorder appeared in the top 10 for both groups, although more commonly for frequently admitted patients (15.4% vs 10.3% [P<0.001]).
The most commonly performed principal procedures are also shown in Table 1. These include hemodialysis (6.32%) and packed cell transfusion (4.49%), nonoperating room procedures associated with chronic medical conditions.
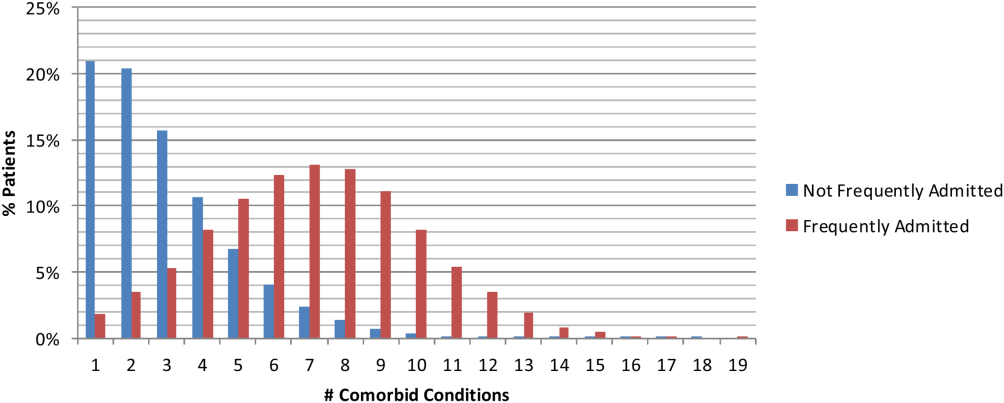
Comorbidities were compared using the AHRQ comorbidity software.[18, 19] Comorbid conditions were counted once per patient, regardless of the number of admissions in which the condition was coded. Frequently admitted patients have a significantly higher mean number of comorbidities: 7.1 compared to 2.5 for all other patients (P<0.001; Figure 2). In an additional analysis using the Elixhauser comorbidity measures to determine acuity scores, the mean scores were 13.1 for frequently admitted patients and 3.17 for all others (P<0.001). The most common comorbidities were hypertension (74%), fluid and electrolyte disorders (73%), and deficiency anemias (66%). The only behavioral health comorbidity that affected more than a quarter of frequently admitted patients was depression (40% as compared to 13% for all others).
Additionally, frequently admitted patients were significantly more likely to have comorbidities of psychosis (18% vs 5% [P<0.001]), alcohol abuse (16% vs 7% [P<0.001]), and drug abuse (20% vs 7% [P<0.001]). Among hospitals, these comorbidities ranged widely: psychosis (3% 48%); alcohol abuse (3%46%); and drug abuse (3%58%). Hospitals with the highest rates (top decile) of frequently admitted patients with alcohol and drug abuse comorbidities were more likely to be safety net hospitals than those in the lowest decile (P<0.05 for each independently), but no such difference was found regarding rates of patients with psychosis.
Although the frequently admitted patient population accounted for only 1.6% of patients, they accounted for an average of 8.4% of all bed days and 7.1% of direct cost. The average cost per day was $1746, compared to $2144 for all other patients (Table 2).
| Length of Stay, Days | Direct Cost | % Total Bed Days | Cost/Day | All Other Patients Cost/Day | Difference | |
|---|---|---|---|---|---|---|
| Minimum | 1.0 | 2.3% | 3.2% | $809 | $1,005 | $(196) |
| Maximum | 86.8 | 14.1% | 15.4% | $3,208 | $4,070 | $(862) |
| Mean | 6.7 | 7.1% | 8.4% | $1,746 | $2,144 | $(398) |
| Median | 5.5 | 7.0% | 8.3% | $1,703 | $2,112 | $(410) |
DISCUSSION
An extensive analysis of the characteristics of frequently admitted patients at 101 US academic medical centers, from October 1, 2011 to September 30, 2012, revealed that these patients comprised 1.6% of all patients, but accounted for 8% of all admissions and 7% of direct costs. Relative to all other hospitalized patients, frequently admitted patients were likely to be younger, of lower socioeconomic status, in poorer health, and more often affected by mental health or substance abuse conditions that may mediate their health behaviors. However, the prevalence of patients with psychiatric or behavior conditions varied widely among hospitals, and hospitals with the highest rates of patients with substance abuse comorbidities were more likely to be safety net hospitals. Frequently admitted patients' diagnoses and procedures suggest that their admissions were related to complex chronic diseases; more than three‐quarters were admitted to medicine services, and their average length of stay was nearly 7 days. No single primary diagnosis accounted for a predominant share of their admissions; the most common diagnosis, sickle cell disease with crisis, accounted for only about 4%. The cost of their care was lower than that of other patients, reflecting the preponderance of their admissions to medicine service lines.
In many ways, frequently admitted patients seem similar to frequent ED visitors. Their visits were driven by a high disease burden associated with multiple chronic conditions, and they were heavy users of the healthcare system overall.[4, 6] The majority of both groups were insured, although there was over‐representation of public insurance.[6] As with frequent ED users, some frequently admitted patients are affected by psychiatric morbidity and substance abuse.[4, 12]
Our results in some ways confirmed, and in some ways differed from, findings of prior studies of patients with frequent hospital admissions. Although each study performed to date has defined the population differently, comparison of findings is useful. Our population was similar to the high‐admission groups identified by Nguyen et al. (patients responsible for the top decile of admissions).[13] These patients were also predominantly admitted for medical conditions, with common admitting diagnoses representing respiratory, gastrointestinal, and cardiovascular conditions. However, the median length of stay (3 days for the high‐admission/low‐cost group and 5 days for the high‐admission/high‐cost group) was lower than that of our population (5.5 days).
Hwa, who studied 29 patients admitted 6 or more times in 1 year to an inpatient medical service in San Francisco,[14] found that 55% of frequently admitted patients had a psychiatric diagnosis, higher than our patient population. Our findings are similar to those of Boonyasai et al.[15] whose serial readmitters had admissions resulting from disease progression, psychiatric illness, and substance abuse.
Our more nationally representative analysis documented a wide range of patient volumes and clinical characteristics, including psychiatric and substance abuse comorbidities, across study hospitals. It demonstrates that different approachesand resourcesare needed to meet the needs of these varied groups of patients. Each hospital must identify, evaluate, and understand its own population of frequently admitted patients to create well‐informed solutions to prevent repeat hospitalization for these patients.
Our ability to create a distinctive picture of the population of frequently admitted patients in US academic medical centers is based on access to an expansive dataset that captures complete diagnostic and demographic information on the universe of patients admitted to our member hospitals. The availability of clinical and administrative data for the entire population of patients permits both an accurate description of patient characteristics and a standardized comparison of groups. All data conform to accepted formats and definitions; their validity is universally recognized by contributing database participants.
Limitations
There are several important limitations to our study. First, patients with 5 or more admissions in 1 year may be undercounted. The UHC Clinical Data Base/Resource Manager only captures readmissions to a single facility; admissions of any patient admitted to more than 1 hospital, even within the UHC membership, cannot be determined. This could have a particularly strong effect on our ability to detect admissions of patients with acute episodes related to psychiatric illness or substance abuse, as they may be more likely to present to multiple or specialty hospitals. Additionally, readmission rates vary among UHC‐member hospitals, based to some extent on geography and the availability of alternative settings of care.
It is possible that surveillance bias played a role in our finding that frequently admitted patients have a significantly higher mean number of comorbidities; each admission presents an opportunity to document additional comorbid conditions. Psychiatric conditions may be underdocumented in medical settings in academic medical centers, where the focus is often on acute medical conditions. Additionally, certain data elements that we believe are central to understanding the characteristics of frequently admitted patients are not part of the UHC Clinical Data Base/Resource Manager and were therefore not a part of our analysis. These highly influential upstream determinants of health include documentation of a primary care physician, housing status, and access to services at discharge.
CONCLUSION
The valuable information reported from analysis of nearly 2 million patients in the UHC Clinical Data Base/Resource Manager can be used to better understand the characteristics of frequently admitted patients. This important cohort of individuals has complex care needs that often result in hospitalization, but may be amenable to solutions that allow patients to remain in their communities. By understanding the demographic, social, and medical characteristics of these patients, hospitals can develop and implement solutions that address the needs of this small group of patients who consume a highly disproportionate share of healthcare resources.
Acknowledgements
The authors acknowledge the contributions of Samuel F. Hohmann, PhD, and Ryan Carroll, MBA, who provided expert statistical analyses and generous assistance in the completion of this article.
Disclosure: Nothing to report.
- Centers for Medicare 21(9):117–120.
- , , , . The influence of a postdischarge intervention on reducing hospital readmissions in a Medicare population. Popul Health Manag. 2013;16(5):310–316.
- , . Dispelling an urban legend: frequent emergency department users have substantial burden of disease. Health Aff (Millwood). 2013;32:2099–2108.
- , , , et al. Effectiveness of interventions targeting frequent users of emergency departments: a systematic review. Ann Emerg Med. 2011;58:41–52.
- , . Frequent users of emergency departments: the myths, the data, and the policy implications. Ann Emerg Med. 2010;20(10):1–8.
- , , , . Development and validation of a model for predicting emergency admissions over the next year. Arch Intern Med. 2008;168:1416–1422.
- , , , et al. A comparison of frequent and infrequent visitors to an urban emergency department. J Emerg Med. 2008;38:115–121.
- , . Frequent users of Massachusetts emergency departments: a statewide analysis. Ann Emerg Med. 2006;48:9–16.
- , , , et al. A descriptive study of heavy emergency department users at an academic emergency department reveals heavy users have better access to care than average users. J Emerg Nurs. 2005;31:139–144.
- , , . Predictors and outcomes of frequent emergency department users. Acad Emerg Med. 2003;10:320–328.
- , , . Epidemiologic analysis of an urban, public emergency department's frequent users. Acad Emerg Med. 2000;7:637–646.
- , , , . What's cost got to do with it? Association between hospital costs and frequency of admissions among “high users” of hospital care. J Hosp Med. 2013;8:665–671.
- . Characteristics of a frequently readmitted patient population on an inpatient medical service. Abstract presented at: Society of Hospital Medicine Annual Meeting, April 1– 4, 2012; San Diego, CA.
- , , , , . Characteristics of isolated and serial rehospitalizations suggest a need for different types of improvement strategies [abstract] J Hosp Med. 2012;7(suppl 2):513.
- , , , , . An intervention to improve care and reduce costs for high‐risk patients with frequent hospital admissions: a pilot study. BMC Health Serv Res. 2011;11:270–279.
- Centers for Disease Control and Prevention. International Classification of Diseases, Ninth Revision (ICD‐9). Available at: http://www.cdc.gov/nchs/icd/icd9.htm. Accessed February 18, 2015.
- Agency for Healthcare Research and Quality, Healthcare Cost and Utilization Project. Comorbidity software, version 3.7. Available at: http://www.hcup‐us.ahrq.gov/toolssoftware/comorbidity/comorbidity.jsp. Accessed February 18, 2015.
- , , , . Comorbidity measures for use with administrative data. Med Care. 1998;36:8–27.
- , , , , . A modification of the Elixhauser comorbidity measures into a point system for hospital death using administrative data. Med Care. 2009;47:626–633.
The national healthcare improvement paradigm is shifting toward a more comprehensive, value‐focused, and patient‐centered approach. Reducing hospital readmissions has become a focal point as a policy strategy to improve care quality while reducing cost. Section 3025 of the Affordable Care Act mandated the Centers for Medicare and Medicaid Services to make progressive reductions in Medicare payments to hospitals that have higher than expected readmission rates for 3 conditions (heart failure, acute myocardial infarction, and pneumonia), and expanding to include chronic obstructive pulmonary disease and total hip and knee arthroplasty in 2015.[1] In response, hospitals and systems are developing and implementing programs that coordinate care beyond hospital walls to reduce readmissions and healthcare costs.[2, 3] However, patients are readmitted for a variety of reasons, and programs that address the needs of some may not address the distinct needs of others. Understanding the characteristics of patients with frequent readmissions will permit the well‐informed creation of solutions specific to this population to reduce cost, free resources, and provide better care.
Although a solid body of literature already exists that describes the characteristics of patients who frequently visit the emergency department (ED),[4, 5, 6, 7, 8, 9, 10, 11, 12] it is not clear to what extent these characteristics also apply to patients with frequent hospital admissions. Frequent ED visitors have been found to be largely insured (85%) although with over‐representation of public insurance, and to be heavy users of the healthcare system overall.[6] A high disease burden associated with multiple chronic conditions has been found to predict frequent ED use.[4, 9, 11, 12] Some characteristics may vary by location; for example, alcohol abuse and psychiatric morbidity have been found to be associated with frequent ED use in New York and San Francisco, but it is not clear to what extent they are a factor in less urban areas.[4, 6, 12]
Several previous studies have investigated the characteristics of frequently admitted patients at single sites.[13, 14, 15, 16] Nguyen et al. (2013) studied patients with the highest costs and the most admissions at a large academic medical center in San Francisco.[13] High admit patients were defined as those responsible for the top decile of admissions, and were grouped into equal‐sized high‐ and low‐cost cohorts. The high‐admission/high‐cost group represented 5% of all patients, 25% of all costs, and 16% of all admissions. These patients were hospitalized primarily for medical conditions (78%) and had a high 30‐day readmission rate (47%). The high‐admission/low‐cost group accounted for 5% of all patients, 12% of all admissions, and 7% of all costs. These patients were also predominantly admitted for medical conditions (87%), with the most common admitting diagnoses representing respiratory, gastrointestinal, and cardiovascular conditions.[13]
Hwa (2012) conducted an analysis of 29 patients admitted 6 or more times in 1 year to an inpatient medical service in San Francisco.[14] These patients represented just 1% of all patients, but 13% of readmissions. Fifty‐five percent of these patients had a psychiatric diagnosis, and 52% had chronic pain. Ninety percent had a primary care physician in the hospital system, 100% were insured either privately or publicly, and 93% had housing, although for 17% housing was described as marginal.[14]
In a third study, Boonyasai et al. (2012) identified 76 patients with 82 readmissions at a Baltimore, Maryland, hospital and classified them as isolated (1 readmission per 6‐month period) or serial (more than 1 readmission per 6‐month period) readmissions.[15] Patients with serial readmissions accounted for 70% of the total. Isolated readmissions were most likely to be related to suboptimal quality of care and care coordination, whereas serial readmissions were more likely to result from disease progression, psychiatric illness, and substance abuse.[15]
All of these studies were conducted at single‐site academic medical centers serving inner city populations. We undertook this study to identify patient and hospital‐level characteristics of frequently admitted patients in a broad sample of 101 US academic medical centers to determine whether previously reported findings are generalizable, and to identify characteristics of frequently admitted patients that can inform interventions designed to meet the needs of this relatively small but resource‐intensive group of patients.
METHODS
All data were obtained from the University HealthSystem Consortium (UHC) (Chicago, IL) Clinical Data Base/Resource Manager (CDB), a large administrative database to which UHC principal members submit comprehensive administrative data files. UHC's principal members include approximately 120 US academic medical centers delivering tertiary and quaternary care, with an average of 647 acute care beds. The CDB includes primary and secondary diagnoses using International Classification of Diseases, Ninth Revision (ICD‐9)[17] codes.
The data of 101 academic medical centers with complete datasets for the study period (October 1, 2011, to September 30, 2012) were included in this analysis. Frequently admitted patients were defined as patients admitted 5 or more times to the same facility in a 12‐month period; all admissions were included, even those more than 30 days apart. This definition was established based on a naturally occurring break in the frequency distribution (Figure 1) and our intention to focus on the unique characteristics of patients at the far right of the distribution. We excluded obstetric (MDC 14, ICD‐9)[17] admissions and pediatric (<18 years of age at index admission) patients, as well as admissions with principal diagnoses for chemotherapy (ICD‐9 diagnosis codes v5811v5812), dialysis (ICD‐9 diagnosis codes v560v568), and rehabilitation (ICD‐9 diagnosis codes v570v579), which are typically planned. The Agency for Healthcare Research and Quality (AHRQ) comorbidity software was used to identify comorbid conditions,[18, 19] and a score based on the Elixhauser comorbidity measures was calculated using a modified acuity point system.[20] For comparisons based on safety net status, we used a definition of payer mix being 25% Medicaid or uninsured.
Our analyses included patient demographics, admission source and discharge status, clinical diagnoses, procedures, and comorbidities, cost, and length of stay. Patients defined as frequently admitted were compared in aggregate to all other hospitalized patients (all other admissions).
To evaluate associations, we used [2] tests for categorical variables and t tests for continuous variables. When comparing the non‐normally distributed comorbidities of the control group to the normally distributed comorbidities of the frequently admitted patients, we performed a Kruskal‐Wallis test on the medians.
RESULTS
During a 1‐year period (October 1, 2011, to September 30, 2012), 1,758,027 patients were admitted 2,388,124 times at 101 academic medical centers. Of these, 28,291 patients had 5 or more admissions during this period, resulting in 180,185 admissions. These frequently admitted patients represented 1.6% of all patients (Figure 1) and 7.6% of all inpatient admissions. By comparison, nonfrequently admitted patients were admitted once (79%), twice (14%), 3 times (4%), or 4 times (2%).
Among hospitals, the volume and impact of frequently admitted patients varied widely. The frequently admitted patient population ranged from 64 patients (0.7% of all patients) to 785 patients (3.5%), with an average of 280 patients (1.6%). To look for differences that might explain this range, we compared hospitals in the top and bottom deciles with respect to geographic region and to safety net status, but found no significant or meaningful differences. The average number of admissions per patient was 6.4, with a range of 5 to 76. Days per patient ranged from 5 to 434 days, with an average of 42. The average patient‐day percentage (frequently admitted patient days/total patient days) was 8.4%, and ranged from 3.2% to 15.4%.
Frequently admitted patients were more likely to be younger than all other patients (71.9% under the age of 65 years, as compared with 65.3% of all other patients (P<0.001)). They were also more likely to have either Medicaid or no healthcare insurance (27.6% compared with 21.6%, P<0.001), although nearly three‐quarters had either private insurance or Medicare coverage.
Eighty‐four percent of frequently admitted patient admissions were to medical services (vs 58% of all other patients (P<0.001)). The admission status for these patients was much less likely to be elective (9.1% of frequently admitted patient admissions vs 26.6% of all other patients' admissions [P<0.001]). Frequently admitted patients were more likely to be discharged to a skilled nursing facility (9.3% vs 8.4%, [P<0.001]) or with home health services (19.7% vs 13.4% [P<0.001]).
The 10 most common primary diagnoses for patient admissions are shown in Table 1. No single primary diagnosis accounted for a large share of the admissions of these patients; the most common diagnosis, sickle cell disease with crisis, accounted for only about 4% of admissions. The 10 most common diagnoses accounted for <20% of all admissions. The remainder of the diagnoses was spread over more than 3000 diagnosis codes; only about 300 codes had more than 100 admissions each.
| Primary Diagnoses | Secondary Diagnoses | Principal Procedures | ||||||||
|---|---|---|---|---|---|---|---|---|---|---|
| Frequently Admitted Patient Admissions, N=180,185 | All Other Patient Admissions, N=2,207,939 | All Other Patient Rank | Frequently Admitted Patient Admissions, N=180,185 | All Other Patient Admissions, N=2,207,939 | All Other PatientRank | Frequently Admitted Patient Admissions, N=180,185 | All Other Patient Admissions, N=2,207,939 | |||
| ||||||||||
| Sickle cell disease with crisis | 3.97% (7,152) | 0.002% (5,887) | 63 | Hypertension NOS | 31.39% (56,556) | 40.04% (884,045) | 1 | Hemodialysis | 6.32% (11,380) | 1.08% (23,871) |
| Septicemia NOS | 2.58% (4,652) | 1.87% (41,369) | 1 | Hyperlipidemia NOS | 24.47% (44,089) | 25.94% (572,760) | 2 | Packed cell transfusion | 4.49% (8.091) | 1.57% (34,669) |
| Acute and chronic systolic heart failure | 2.06% (3,708) | 0.81% (17,802) | 12 | Congestive heart failure NOS | 22.86% (41,197) | 11.82% (260,944) | 8 | Percutaneous abdominal drainage | 2.42% (4,366) | 0.86% (18,974) |
| Acute kidney failure NOS | 2.04% (3,680) | 1.16% (25,528) | 6 | Esophageal reflux | 21.19% (38,184) | 17.32% (382,511) | 3 | Venous catheter NEC | 2.13% (3,843) | 0.89% (19,718) |
| Obstructive chronic bronchitis with exacerbation | 1.76% (3,180) | 0.68% (14,957) | 14 | Diabetes mellitus NOS uncomplicated | 20.39% (36,743) | 16.75% (369,808) | 4 | Central venous catheter placement with guidewire | 2.13% (3,834)) | 0.83% (18,307) |
| Pneumonia organism NOS | 1.72% (3,091) | 1.29% (28,468) | 4 | Tobacco use disorder | 16.98% (30,604) | 16.71% (368,880) | 5 | Continuous invasive mechanical ventilation <96 consecutive hours | 1.38% (2,480) | 0.7% (15,441) |
| Urinary tract infection NOS | 1.63% (2,939) | 0.86% (19,069) | 9 | History of tobacco use | 16.89% (30,439) | 14.77% (326,026) | 6 | Noninvasive mechanical ventilation | 1.3% (2,345) | 0.58% (12,899) |
| Acute pancreatitis | 1.23% (2,212) | 0.73% (16,168) | 13 | Coronary atherosclerosis native vessel | 16.12% (29,040) | 12.88% (284,487) | 7 | Small intestine endoscopy NEC | 1.26% (2.265) | 0.7% (15,480) |
| Acute and chronic diastolic heart failure | 1.22% (2,190) | 0.48% (10,600) | 22 | Depressive disorder | 15.42% (27,785) | 10.34% (228,347) | 10 | Heart ultrasound | 1.11% (1,997) | 1.37% (30,161) |
| Complication of kidney transplant | 1.08% (1,944) | 0.42% (9,354) | 28 | Acute kidney failure NOS | 13.8% (24,859) | 9.37%% (206,951) | 12 | Esophagogastroduodenoscopy with closed biopsy | 1.09% (1,963) | 0.8% (17,644) |
Secondary diagnoses were mainly chronic conditions, including hypertension, hyperlipidemia, esophageal reflux, and diabetes mellitus type 2 (Table 1.) Combined, congestive heart failure and diabetes mellitus accounted for 43.3% of the secondary diagnoses of admissions of frequently admitted patients, but for only 28.6% of other patients. Acute kidney failure was more common in frequently admitted patients (13.8% vs 9.4% [P<0.001]). Psychiatric disorders accounted for <1% of primary diagnoses for both frequently admitted patients and all other patients. As a secondary diagnosis, depressive disorder appeared in the top 10 for both groups, although more commonly for frequently admitted patients (15.4% vs 10.3% [P<0.001]).
The most commonly performed principal procedures are also shown in Table 1. These include hemodialysis (6.32%) and packed cell transfusion (4.49%), nonoperating room procedures associated with chronic medical conditions.
Comorbidities were compared using the AHRQ comorbidity software.[18, 19] Comorbid conditions were counted once per patient, regardless of the number of admissions in which the condition was coded. Frequently admitted patients have a significantly higher mean number of comorbidities: 7.1 compared to 2.5 for all other patients (P<0.001; Figure 2). In an additional analysis using the Elixhauser comorbidity measures to determine acuity scores, the mean scores were 13.1 for frequently admitted patients and 3.17 for all others (P<0.001). The most common comorbidities were hypertension (74%), fluid and electrolyte disorders (73%), and deficiency anemias (66%). The only behavioral health comorbidity that affected more than a quarter of frequently admitted patients was depression (40% as compared to 13% for all others).
Additionally, frequently admitted patients were significantly more likely to have comorbidities of psychosis (18% vs 5% [P<0.001]), alcohol abuse (16% vs 7% [P<0.001]), and drug abuse (20% vs 7% [P<0.001]). Among hospitals, these comorbidities ranged widely: psychosis (3% 48%); alcohol abuse (3%46%); and drug abuse (3%58%). Hospitals with the highest rates (top decile) of frequently admitted patients with alcohol and drug abuse comorbidities were more likely to be safety net hospitals than those in the lowest decile (P<0.05 for each independently), but no such difference was found regarding rates of patients with psychosis.
Although the frequently admitted patient population accounted for only 1.6% of patients, they accounted for an average of 8.4% of all bed days and 7.1% of direct cost. The average cost per day was $1746, compared to $2144 for all other patients (Table 2).
| Length of Stay, Days | Direct Cost | % Total Bed Days | Cost/Day | All Other Patients Cost/Day | Difference | |
|---|---|---|---|---|---|---|
| Minimum | 1.0 | 2.3% | 3.2% | $809 | $1,005 | $(196) |
| Maximum | 86.8 | 14.1% | 15.4% | $3,208 | $4,070 | $(862) |
| Mean | 6.7 | 7.1% | 8.4% | $1,746 | $2,144 | $(398) |
| Median | 5.5 | 7.0% | 8.3% | $1,703 | $2,112 | $(410) |
DISCUSSION
An extensive analysis of the characteristics of frequently admitted patients at 101 US academic medical centers, from October 1, 2011 to September 30, 2012, revealed that these patients comprised 1.6% of all patients, but accounted for 8% of all admissions and 7% of direct costs. Relative to all other hospitalized patients, frequently admitted patients were likely to be younger, of lower socioeconomic status, in poorer health, and more often affected by mental health or substance abuse conditions that may mediate their health behaviors. However, the prevalence of patients with psychiatric or behavior conditions varied widely among hospitals, and hospitals with the highest rates of patients with substance abuse comorbidities were more likely to be safety net hospitals. Frequently admitted patients' diagnoses and procedures suggest that their admissions were related to complex chronic diseases; more than three‐quarters were admitted to medicine services, and their average length of stay was nearly 7 days. No single primary diagnosis accounted for a predominant share of their admissions; the most common diagnosis, sickle cell disease with crisis, accounted for only about 4%. The cost of their care was lower than that of other patients, reflecting the preponderance of their admissions to medicine service lines.
In many ways, frequently admitted patients seem similar to frequent ED visitors. Their visits were driven by a high disease burden associated with multiple chronic conditions, and they were heavy users of the healthcare system overall.[4, 6] The majority of both groups were insured, although there was over‐representation of public insurance.[6] As with frequent ED users, some frequently admitted patients are affected by psychiatric morbidity and substance abuse.[4, 12]
Our results in some ways confirmed, and in some ways differed from, findings of prior studies of patients with frequent hospital admissions. Although each study performed to date has defined the population differently, comparison of findings is useful. Our population was similar to the high‐admission groups identified by Nguyen et al. (patients responsible for the top decile of admissions).[13] These patients were also predominantly admitted for medical conditions, with common admitting diagnoses representing respiratory, gastrointestinal, and cardiovascular conditions. However, the median length of stay (3 days for the high‐admission/low‐cost group and 5 days for the high‐admission/high‐cost group) was lower than that of our population (5.5 days).
Hwa, who studied 29 patients admitted 6 or more times in 1 year to an inpatient medical service in San Francisco,[14] found that 55% of frequently admitted patients had a psychiatric diagnosis, higher than our patient population. Our findings are similar to those of Boonyasai et al.[15] whose serial readmitters had admissions resulting from disease progression, psychiatric illness, and substance abuse.
Our more nationally representative analysis documented a wide range of patient volumes and clinical characteristics, including psychiatric and substance abuse comorbidities, across study hospitals. It demonstrates that different approachesand resourcesare needed to meet the needs of these varied groups of patients. Each hospital must identify, evaluate, and understand its own population of frequently admitted patients to create well‐informed solutions to prevent repeat hospitalization for these patients.
Our ability to create a distinctive picture of the population of frequently admitted patients in US academic medical centers is based on access to an expansive dataset that captures complete diagnostic and demographic information on the universe of patients admitted to our member hospitals. The availability of clinical and administrative data for the entire population of patients permits both an accurate description of patient characteristics and a standardized comparison of groups. All data conform to accepted formats and definitions; their validity is universally recognized by contributing database participants.
Limitations
There are several important limitations to our study. First, patients with 5 or more admissions in 1 year may be undercounted. The UHC Clinical Data Base/Resource Manager only captures readmissions to a single facility; admissions of any patient admitted to more than 1 hospital, even within the UHC membership, cannot be determined. This could have a particularly strong effect on our ability to detect admissions of patients with acute episodes related to psychiatric illness or substance abuse, as they may be more likely to present to multiple or specialty hospitals. Additionally, readmission rates vary among UHC‐member hospitals, based to some extent on geography and the availability of alternative settings of care.
It is possible that surveillance bias played a role in our finding that frequently admitted patients have a significantly higher mean number of comorbidities; each admission presents an opportunity to document additional comorbid conditions. Psychiatric conditions may be underdocumented in medical settings in academic medical centers, where the focus is often on acute medical conditions. Additionally, certain data elements that we believe are central to understanding the characteristics of frequently admitted patients are not part of the UHC Clinical Data Base/Resource Manager and were therefore not a part of our analysis. These highly influential upstream determinants of health include documentation of a primary care physician, housing status, and access to services at discharge.
CONCLUSION
The valuable information reported from analysis of nearly 2 million patients in the UHC Clinical Data Base/Resource Manager can be used to better understand the characteristics of frequently admitted patients. This important cohort of individuals has complex care needs that often result in hospitalization, but may be amenable to solutions that allow patients to remain in their communities. By understanding the demographic, social, and medical characteristics of these patients, hospitals can develop and implement solutions that address the needs of this small group of patients who consume a highly disproportionate share of healthcare resources.
Acknowledgements
The authors acknowledge the contributions of Samuel F. Hohmann, PhD, and Ryan Carroll, MBA, who provided expert statistical analyses and generous assistance in the completion of this article.
Disclosure: Nothing to report.
- Centers for Medicare 21(9):117–120.
- , , , . The influence of a postdischarge intervention on reducing hospital readmissions in a Medicare population. Popul Health Manag. 2013;16(5):310–316.
- , . Dispelling an urban legend: frequent emergency department users have substantial burden of disease. Health Aff (Millwood). 2013;32:2099–2108.
- , , , et al. Effectiveness of interventions targeting frequent users of emergency departments: a systematic review. Ann Emerg Med. 2011;58:41–52.
- , . Frequent users of emergency departments: the myths, the data, and the policy implications. Ann Emerg Med. 2010;20(10):1–8.
- , , , . Development and validation of a model for predicting emergency admissions over the next year. Arch Intern Med. 2008;168:1416–1422.
- , , , et al. A comparison of frequent and infrequent visitors to an urban emergency department. J Emerg Med. 2008;38:115–121.
- , . Frequent users of Massachusetts emergency departments: a statewide analysis. Ann Emerg Med. 2006;48:9–16.
- , , , et al. A descriptive study of heavy emergency department users at an academic emergency department reveals heavy users have better access to care than average users. J Emerg Nurs. 2005;31:139–144.
- , , . Predictors and outcomes of frequent emergency department users. Acad Emerg Med. 2003;10:320–328.
- , , . Epidemiologic analysis of an urban, public emergency department's frequent users. Acad Emerg Med. 2000;7:637–646.
- , , , . What's cost got to do with it? Association between hospital costs and frequency of admissions among “high users” of hospital care. J Hosp Med. 2013;8:665–671.
- . Characteristics of a frequently readmitted patient population on an inpatient medical service. Abstract presented at: Society of Hospital Medicine Annual Meeting, April 1– 4, 2012; San Diego, CA.
- , , , , . Characteristics of isolated and serial rehospitalizations suggest a need for different types of improvement strategies [abstract] J Hosp Med. 2012;7(suppl 2):513.
- , , , , . An intervention to improve care and reduce costs for high‐risk patients with frequent hospital admissions: a pilot study. BMC Health Serv Res. 2011;11:270–279.
- Centers for Disease Control and Prevention. International Classification of Diseases, Ninth Revision (ICD‐9). Available at: http://www.cdc.gov/nchs/icd/icd9.htm. Accessed February 18, 2015.
- Agency for Healthcare Research and Quality, Healthcare Cost and Utilization Project. Comorbidity software, version 3.7. Available at: http://www.hcup‐us.ahrq.gov/toolssoftware/comorbidity/comorbidity.jsp. Accessed February 18, 2015.
- , , , . Comorbidity measures for use with administrative data. Med Care. 1998;36:8–27.
- , , , , . A modification of the Elixhauser comorbidity measures into a point system for hospital death using administrative data. Med Care. 2009;47:626–633.
© 2015 The Authors Journal of Hospital Medicine published by Wiley Periodicals, Inc. on behalf of Society of Hospital Medicine
VTE Codes in Academic Medical Centers
Pulmonary embolism (PE) and deep venous thrombosis (DVT), historically referred to together as venous thromboembolism (VTE), are common, treatable, sometimes fatal, and potentially preventable medical problems.[1] Such thromboses can both precipitate a hospitalization as well as complicate it (either during or soon after discharge). Preventing such thrombosis as a complication of medical care has become a national imperative. Landmark studies such as Prophylaxis in Medical Patients With Enoxaparin (MEDENOX)[2] and Prospective Evaluation of Dalteparin Efficacy for Prevention of VTE in Immobilized Patients Trial (PREVENT)[3] demonstrated both a high incidence of thrombosis in a hospitalized high‐risk medical population (15% and 5% in the 2 trials' placebo arms, respectively) as well as significant relative risk reduction through venous thromboembolism pharmacoprophylaxis (VTEP)63% and 45%, respectively. The Joint Commission,[4] the Society of Hospital Medicine,[5] and the American College of Chest Physicians[6, 7] have thus all strived to ensure the appropriate provision of VTEP in order to reduce the morbidity and mortality associated with thrombosis in hospitalized patients, including those on medical services.
Ideally, the global success of these efforts would be assessed by measuring the rate of hospital‐associated VTE (potentially including superficial venous thrombosis [SVT], which, like upper‐extremity deep venous thrombosis [UE‐DVT], is commonly a central venous catheter [CVC]‐associated, or peripherally inserted central catheter [PICC]‐associated, complication)thrombosis acquired and diagnosed during either the index hospitalization (hospital‐acquired, or HA‐VTE/SVT) or up to 30 days postdischarge. Unfortunately, postdischarge VTE/SVT is difficult to measure because patients developing it may not present to the original hospital, or at all (eg, if they do not seek care, are treated as outpatients, or, in the most extreme case, die at home). In this context, despite being far less comprehensive, HA‐VTE/SVT is a useful subset of hospital‐associated VTE/SVT, for several reasons. First, the Centers for Medicare & Medicaid Services (CMS) have mandated hospitals to qualify all medical diagnoses as present‐on‐admission (POA = Y) or not (POA = N) since 2008, such that all medical diagnoses coded POA = N can be considered hospital acquired.[8] Second, refinements made to the International Classification of Diseases, 9th Revision (ICD‐9) codes now allow differentiation of UE‐DVT and SVT from lower‐extremity (LE) DVT/PE, whereas the former were sometimes obscured by nonspecific coding.[9] Third, recent studies have shown that medical diagnoses administratively coded as HA‐VTE/SVT correlated well with HA‐VTE/SVT ascertained through chart review.[9, 10] Finally, previous work has estimated that approximately half of all hospital‐associated VTE are HA‐VTE and the other half are postdischarge VTE.[11] Thus, HA‐VTE, though comprising only approximately half of all hospital‐associated VTE, is often used as a surrogate for measuring the success of ongoing VTE prevention programs.[12]
Our study aimed to assess the incidence of HA‐VTE plus HA‐SVT in the era of mandatory POA coding and newer ICD‐9 codes for VTE.
METHODS
Setting and Cases
We conducted a retrospective analysis of discharges from the 83 academic medical centers belonging to the UHC (formerly, the University HealthSystem Consortium,
Patients in our analysis were age 18 years and discharged with a medical medical severity diagnostic‐related group (MS‐DRG) code, hospitalized for 48 hours, and did not have a surgical or obstetric MS‐DRG code (except when assigned a surgical MS‐DRG code solely due to insertion of an inferior vena cava filter, with no other major procedures performed). Cases excluded discharges with a principal diagnosis of acute VTE/SVT (defined here as including PE, LE‐DVT, UE‐DVT, SVT, chronic VTE, and thrombosis not otherwise specified), as coding guidelines prohibit assigning a HA‐VTE as the principal diagnosis for the index hospitalization.[14]
Hospital‐Acquired Venous Thromboembolism or Superficial Venous Thrombosis
Cases were classified as having a HA‐VTE/SVT if there was 1 VTE/SVT coded in a secondary diagnosis position (other diagnosis) with a corresponding POA indicator equal to either N (not POA) or U (documentation insufficient to clarify whether VTE was POA or not). This usage corresponds to CMS guidelines and reimbursement policies for hospital‐acquired conditions.[15] Among cases with 1 HA‐VTE (or SVT), we assigned 1 HA‐VTE diagnosis using a hierarchy based on the highest level of clinical importance: first, PE; then LE‐DVT; then UE‐DVT; then SVT; then chronic VTE; then, finally, unspecified VTE. We subsequently excluded cases with primarily chronic VTE from our analysis because these were likely miscodes (ie, it is unclear how a chronic VTE could not be POA) and there were only 30 such cases. Cases with HA‐PE or HA‐LE DVT were analyzed separately as an important subset of HA‐VTE (plus SVT), because HA‐PE/LE‐DVT is both life‐threatening and theoretically preventable with VTEP.
Severity of Illness and Other Measures of Comorbidity
For each case we used proprietary software (3M Health Information Systems, Murray UT) to classify severity of illness (SOI). The SOI scale, based on physiologic derangement and organ system loss of function,[16] has 4 levels: minor, major, severe, and extreme. Defined within specific disease groups (All Patient Refined DRGs), it is often compared across diseases as well.[17] We also assessed whether patients had a cancer diagnosis, spent time in the intensive care unit (ICU), and died in the hospital.
Central Venous Catheter Use in Patients With Upper‐Extremity Deep Venous Thrombosis or Superficial Venous Thrombosis
Because UE‐DVT and SVT are frequently associated with a CVC or PICC, we assessed central venous catheterization among patients with an UE‐DVT or SVT of the cephalic, basilic, or antecubital veins using diagnosis codes for complications related to dialysis devices, implants, and grafts.
Pharmacologic Thromboprophylaxis
Pharmacy records of the subset of HA‐VTE/SVT cases with PE or LE‐DVT were analyzed to determine if VTEP was administered on hospital day 1 or 2, as per Joint Commission performance requirements.[4] Medications that met criteria as VTEP included unfractionated heparin, 5000 IU, given 2 or 3 a day; enoxaparin, 40 mg, given daily; dalteparin, 2500 or 5000 IU, given daily; fondaparinux, 2.5 mg, given daily; and warfarin. We could not reliably determine if VTEP was used throughout the entire hospitalization, or whether mechanical prophylaxis was used at all.
Statistical Analysis
This was a descriptive analysis to determine the incidence of HA‐VTE/SVT and describe the demographic and clinical characteristics of this population. We calculated means and standard deviations (SD) for continuous variables and proportions for binary variables (including HA‐VTE/SVT incidence). All comparisons between populations were performed as either 2‐tailed t tests or 2 analyses. All analysis was conducted using SAS software, version 9.2 (SAS Institute, Inc., Cary, NC).
RESULTS
For the 18‐month period between October 1, 2009, and March 31, 2011, across 83 UHC hospitals, there were 2,525,068 cases. Among these, 12,847 (0.51%) had 1 HA‐VTE/SVT coded. As per the clinical importance hierarchy described above, 2449 (19.1%) cases had at least a PE coded; 3848 (30%) had at least a LE‐DVT (but not a PE) coded; 2893 (22.5%) had at least an UE‐DVT coded; 3248 (25.3%) had at least an SVT coded; 30 had at least a chronic VTE coded; and 379 had at least a VTE coded with no specified location. Of those with SVT, 192 (5.8%) were LE‐SVT codes, whereas the rest were SVT/thrombophlebitis of the upper extremities or not otherwise specified. There were 11,882 (92.5%) hospitalizations with a single HA‐VTE/SVT code and an additional 965 (7.5%) with multiple codes, for a total of 13,749 HA‐VTE/SVT events (see Supporting Information, Table S1, in the online version of this article for more specific data for the individual ICD‐9 codes used to specify HA‐VTE events).
Compared with those who did not develop any HA‐VTE/SVT, patients with HA‐PE/LE‐DVT were more likely to be Caucasian (65% vs 58%, P < 0.001) and were older (age 62 vs 48 years, P < 0.001) and sicker (79.9% vs 44.9% with a severe or extreme SOI, P < 0.001). They also were more likely to have cancer, have longer lengths of stay, be more likely to stay in the ICU, and die in the hospital (P < 0.001 for all comparisons; Table 1).
| Characteristic | No HA‐VTE, n = 2,512,221 | HA‐PE/LE DVT, n = 6,297a | P Valueb |
|---|---|---|---|
| |||
| Proportion of hospitalizations, % | 99.49 | 0.25 | |
| Age, y | 48.2 27.1 | 62.5 20.0 | <0.001 |
| Female sex | 1,347,219 (53.6) | 3,104 (49.3) | <0.001 |
| Race | <0.001 | ||
| Caucasian | 1,455,215 (57.9) | 3,963 (64.7) | |
| Black | 600,991 (23.9) | 1,425 (23.3) | |
| Hispanic | 206,553 (8.2) | 263 (4.3) | |
| API | 59,560 (2.4) | 88 (1.4) | |
| Other | 189,902 (7.6) | 389 (6.4) | |
| Admission SOI | <0.001 | ||
| Minor | 461,411 (18.4) | 181 (2.9) | |
| Major | 922,734 (36.7) | 1,081 (17.2) | |
| Severe | 880,542 (35.1) | 2,975 (47.2) | |
| Extreme | 247,244 (9.8) | 2,060 (32.7) | |
| Unknown | 290 (0.01) | 0 (0.0) | |
| Had an active diagnosis of cancer | 331,705 (13.2) | 2,162 (34.3) | <0.001 |
| Length of stay, d | 7.31 9.31 | 18.7 19.5 | <0.001 |
| Spent time in the ICU | 441,412 (17.6) | 3,011 (47.8) | <0.001 |
| Died in hospital | 57,954 (2.3) | 1,036 (16.5) | <0.001 |
| Received prophylaxisc | c | 3,454 (54.9) | c |
Among cases with a code for UE‐DVT (22.5% of all patients with HA‐VTE), 74% were noted to also have a code for a CVC, as did 60% of cases with a HA‐SVT of the antecubital, basilic, or cephalic veins (71% of SVT events; see Supporting Information, Table S1, in the online version of this article).
Of those with HA‐PE/LE‐DVT, 54.9% received pharmacologic prophylaxis on hospital day 1 or 2 (mostly with low‐molecular‐weight heparin or unfractionated heparin).
DISCUSSION
In this study of medical patients admitted to academic medical centers throughout the United States, we found that HA‐VTE/SVT was coded in approximately 0.51% of discharges, and the incidence of HA‐PE/LE‐DVT was 0.25%. Patients with a HA‐PE/LE‐DVT code were, in general, older and sicker than those who did not develop VTE. We further found that close to half of all HA‐VTE/SVT occurred in the upper extremity, with the majority of these occurring in patients who had CVCs. Finally, the majority of patients diagnosed with HA‐PE/LE‐DVT were started on VTEP on the first or second hospital day.
The overall incidence of HA‐VTE/SVT we discovered corresponds well to other studies, even those with disparate populations. A single‐institution study found a HA‐VTE/SVT incidence of approximately 0.6% among hospitalized patients on medical and nonmedical services.[12] The study by Barba found a rate of 0.93%,[18] whereas the study by Lederle found a rate of approximately 1%.[19] Spyropolous found an HA‐VTE incidence of 0.55%.[11] Rothberg found a lower rate of 0.25% in his risk‐stratification study, though in the pre‐POA and preupdated code era.[20] Our findings extend and provide context for, in a much larger population, the results of these prior studies, and represent the first national examination of HA‐VTE/SVT in the setting of numerous quality‐improvement and other efforts to reduce hospital‐associated VTE.
The incidence of HA‐VTE/SVT codes we observed likely underestimates the incidence of hospital‐associated VTE/SVT by a factor of approximately 4, for 2 reasons. First, although VTE/SVT codes with a POA flag set to No are truly hospital‐acquired events on chart review approximately 75% of the time, and thus overestimate HA‐VTE/SVT, 25% of POA = Yes codes are actually HA‐VTE/SVT events on chart review, and therefore lead to underestimation of HA‐VTE/SVT.[9] Because VTE/SVT codes with a POA flag set to Yes outnumber those flagged No by 3 or 4 to 1, events mis‐flagged Yes contribute a much greater number of undercounted HA‐VTE/SVT, elevating the actual HA‐VTE/SVT event rate by a factor of approximately 2. Second, HA‐VTE events do not include hospital‐associated VTE events that are diagnosed after the index hospitalization. In the Spyropolous study, 45% of hospital‐associated VTE events occurred after discharge, so translating HA‐VTE/SVT events to hospital‐associated VTE/SVT events would again involve multiplying by a factor of 2.[11] Thus, the overall incidence of hospital‐associated VTE/SVT events in our sample may have been approximately 2% (0.51% 4), and the overall incidence of hospital‐associated PE or LE‐DVT events may have been approximately 1%, though there may be significant variation around these estimates given that individual institutions were themselves quite variable in their POA flag accuracy in our study.[9] There is additionally the possibility that hospitals may have deliberately left some VTE/SVT uncoded, but in the absence of financial incentives to do so for anything other than postsurgical VTE, and in the presence of penalties from CMS for undercoding, we believe this to be unlikely, at least at present.
Despite these upward extrapolations, the estimated incidence of hospital‐associated VTE/SVT in our study may seem low compared with that reported in the MEDENOX[2] and PREVENT studies.[3] Much of this discrepancy vanishes on closer examination. In the large randomized trials, patients were uniformly and routinely assessed for LE‐DVT using vascular ultrasound; in contrast, in our population of hospitalizations patients may have only had diagnostic studies done for signs or symptoms. Clinically apparent hospital‐associated VTE is less common than all hospital‐associated VTE, as it was even in PREVENT,[3] and increased surveillance may even be partially driving increased hospital‐associated VTE/SVT at some hospitals.[21] Our findings suggest that success or failure in preventing administratively coded, clinically apparent HA LE‐VTE/PE should be judged, broadly, against numbers in the range established in our study (eg, 0.25%), not the 5% or 15% of chart‐abstracted, aggressively ascertained (and sometimes clinically silent) hospital‐associated VTE in the large randomized controlled trials. That is, 0.25% is not an achievement, but rather the average, expected value.
Almost 25% of the observed HA‐VTE/SVTs coded were UE‐DVT, with roughly 75% of these being likely related to central venous catheterization (including those peripherally inserted). An additional 1/5 were upper‐extremity SVT of the antecubital, cephalic, and basilic veins, with the majority of these (60%) also listed as catheter‐related. Such thrombosis is best prevented by decreased use of central catheters or perhaps by using smaller‐caliber catheters.[22] It is unclear if VTEP can prevent such clots, though in cancer patients at least one recent trial seems promising.[23]
We found that patients with a coded HA‐PE/LE‐DVT were remarkably different from those not developing HA‐VTE/SVT. Patients with HA‐PE or HA‐LE‐DVT were older, sicker, more likely to have cancer, significantly more likely to spend time in the ICU, and much more likely to die in the hospital; risk factors for HA‐VTE overlap significantly with risk factors for death in the hospital. A small majority (55%) of patients in the HA‐PE/LE‐DVT group had actually received VTEP on at least day 1 or 2 of hospitalization. It may be the case that the dose of VTEP was insufficient to suppress clot formation in these patients, or that HA‐PE/LE‐DVT in patients with this degree of comorbidity is difficult to prevent.
There are a number of limitations to our study. We analyzed administrative codes, which underestimate hospital‐associated VTE/SVT events as noted above. This was a descriptive study, cross‐sectional across each hospitalization, and we were unable to draw any causal inference for differences in HA‐VTE/SVT incidence that might exist between subpopulations. We estimated VTEP from medication usage in just the first 2 days of hospitalization; we could not assess mechanical prophylaxis in this dataset; and we did not have any VTEP data for the first 2 days of hospitalization on the patients who did not develop a HA‐VTE/SVT, which made it impossible to compare the 2 populations on this measure. For those who did not receive VTEP, we were unable to obtain data regarding possible contraindications to VTEP, such as ongoing gastrointestinal or intracerebral hemorrhage. Additionally, our data are based on academic hospitals only and may not generalize to nonacademic settings. Extrapolating from HA‐VTE/SVT to hospital‐associated VTE/SVT may not be possible due to heterogeneity of clotting events and perhaps variability in whether patients would return to the hospital for all of them (eg, superficial or UE VTE may not result in readmission). Finally, it is unclear whether a switch to ICD Tenth Revision (ICD‐10) codes will impact our measured baseline in the coming year. The strengths of our analysis included stratification by type of HA‐VTE/SVT and our ability to assess the incidence of HA‐VTE/SVT in a large national population, and the provision of a baseline for VTE incidenceeasily usable by any individual hospital, network, or researcher with access to administrative datagoing forward.
In conclusion, among patients hospitalized in academic medical centers, HA‐VTE/SVT was coded in approximately 0.51% of patients with a medical illness staying >2 days, with approximately half of the events due to HA‐PE/LE‐DVT. Patients who developed HA‐PE/LE‐DVT were more acutely ill than those who did not, and VTE developed despite 55% of these patients receiving VTEP on day 1 or 2. Hospitals can reasonably treat the 0.25% figure as the baseline around which to assess their own performance in preventing HA‐PE/LE‐DVT, and can measure their own performance using administrative data. Further research is needed to determine how best to achieve further reductions in HA‐VTE/SVT through risk stratification and/or through other interventions.
Disclosures
Nothing to report.
- , , , , ;American College of Chest Physicians AntithromboticTherapy and Prevention of Thrombosis Panel. Executive summary: Antithrombotic Therapy and Prevention of Thrombosis, 9th ed: American College of Chest Physicians Evidence‐Based Clinical Practice Guidelines [published corrections appear in Chest. 2012;141(4):1129 and 2012;142(6):1698]. Chest. 2012;141(2 suppl):7S–47S.
- , , , et al;Prophylaxis in Medical Patients with Enoxaparin Study Group. A comparison of enoxaparin with placebo for the prevention of venous thromboembolism in acutely ill medical patients. N Engl J Med. 1999;341(11):793–800.
- , , , , , . Randomized, placebo‐controlled trial of dalteparin for the prevention of venous thromboembolism in acutely ill medical patients. Circulation. 2004;110(7):874–879.
- The Joint Commission.Specifications Manual for National Hospital Inpatient Quality Measures. Available at: http://www.jointcommission.org/specifications_manual_for_national_hospital_inpatient_quality_measures.aspx. Accessed July 18, 2012.
- , . Preventing Hospital‐Acquired Venous Thromboembolism: A Guide for Effective Quality Improvement. Prepared by the Society of Hospital Medicine. Rockville, MD: Agency for Healthcare Research and Quality; AHRQ Publication No. 08‐0075.
- , , , et al. Prevention of venous thromboembolism: the Seventh ACCP Conference on Antithrombotic and Thrombolytic Therapy. Chest. 2004;126(3 suppl):338S–400S.
- , , , et al. Prevention of VTE in nonsurgical patients: Antithrombotic Therapy and Prevention of Thrombosis, 9th ed: American College of Chest Physicians Evidence‐Based Clinical Practice Guidelines. Chest. 2012;141(2 suppl):e195S–e226S.
- Centers for Medicare 46(6 part 1):1946–1962.
- , , , et al. Predictive and associative models to identify hospitalized medical patients at risk for VTE. Chest. 2011;140(3):706–714.
- , , , . Unintended consequences of a standard admission order set on venous thromboembolism prophylaxis and patient outcomes. J Gen Intern Med. 2012;27(3):318–324.
- United Health Consortium Website. Available at: https://www.uhc.edu. Accessed March 8, 2012.
- ICD‐9‐CM Official Guidelines for Coding and Reporting. Available at: http://www.cdc.gov/nchs/data/icd9/icdguide10.pdf. Published 2010. Accessed June 4, 2013.
- Centers for Medicare 27(5):587–612.
- Overview of Disease Severity Measures Disseminated with the Nationwide Inpatient Sample (NIS) and Kids' Inpatient Database (KID). Available at: http://www.hcup‐us.ahrq.gov/db/nation/nis/OverviewofSeveritySystems.pdf. Published December 9, 2005. Accessed June 4, 2013.
- , , , et al. Venous thromboembolism in acutely ill hospitalized medical patients. Thromb Res. 2010;126(4):276–279.
- , , , . Venous thromboembolism prophylaxis in hospitalized medical patients and those with stroke: a background review for an American College of Physicians Clinical Practice Guideline. Ann Intern Med. 2011;155(9):602–615.
- , , , , . Risk factor model to predict venous thromboembolism in hospitalized medical patients. J Hosp Med. 2011;6(4):202–209.
- , , , et al. Evaluation of surveillance bias and the validity of the venous thromboembolism quality measure. JAMA. 2013;310(14):1482–1489.
- , , , et al. Reduction of peripherally inserted central catheter‐associated DVT. Chest. 2013;143(3):627–633.
- , , , et al. Prophylaxis of catheter‐related deep vein thrombosis in cancer patients with low‐dose warfarin, low molecular weight heparin, or control: a randomized, controlled, phase III study. Cancer Chemother Pharmacol. 2013;72(1):65–73.
Pulmonary embolism (PE) and deep venous thrombosis (DVT), historically referred to together as venous thromboembolism (VTE), are common, treatable, sometimes fatal, and potentially preventable medical problems.[1] Such thromboses can both precipitate a hospitalization as well as complicate it (either during or soon after discharge). Preventing such thrombosis as a complication of medical care has become a national imperative. Landmark studies such as Prophylaxis in Medical Patients With Enoxaparin (MEDENOX)[2] and Prospective Evaluation of Dalteparin Efficacy for Prevention of VTE in Immobilized Patients Trial (PREVENT)[3] demonstrated both a high incidence of thrombosis in a hospitalized high‐risk medical population (15% and 5% in the 2 trials' placebo arms, respectively) as well as significant relative risk reduction through venous thromboembolism pharmacoprophylaxis (VTEP)63% and 45%, respectively. The Joint Commission,[4] the Society of Hospital Medicine,[5] and the American College of Chest Physicians[6, 7] have thus all strived to ensure the appropriate provision of VTEP in order to reduce the morbidity and mortality associated with thrombosis in hospitalized patients, including those on medical services.
Ideally, the global success of these efforts would be assessed by measuring the rate of hospital‐associated VTE (potentially including superficial venous thrombosis [SVT], which, like upper‐extremity deep venous thrombosis [UE‐DVT], is commonly a central venous catheter [CVC]‐associated, or peripherally inserted central catheter [PICC]‐associated, complication)thrombosis acquired and diagnosed during either the index hospitalization (hospital‐acquired, or HA‐VTE/SVT) or up to 30 days postdischarge. Unfortunately, postdischarge VTE/SVT is difficult to measure because patients developing it may not present to the original hospital, or at all (eg, if they do not seek care, are treated as outpatients, or, in the most extreme case, die at home). In this context, despite being far less comprehensive, HA‐VTE/SVT is a useful subset of hospital‐associated VTE/SVT, for several reasons. First, the Centers for Medicare & Medicaid Services (CMS) have mandated hospitals to qualify all medical diagnoses as present‐on‐admission (POA = Y) or not (POA = N) since 2008, such that all medical diagnoses coded POA = N can be considered hospital acquired.[8] Second, refinements made to the International Classification of Diseases, 9th Revision (ICD‐9) codes now allow differentiation of UE‐DVT and SVT from lower‐extremity (LE) DVT/PE, whereas the former were sometimes obscured by nonspecific coding.[9] Third, recent studies have shown that medical diagnoses administratively coded as HA‐VTE/SVT correlated well with HA‐VTE/SVT ascertained through chart review.[9, 10] Finally, previous work has estimated that approximately half of all hospital‐associated VTE are HA‐VTE and the other half are postdischarge VTE.[11] Thus, HA‐VTE, though comprising only approximately half of all hospital‐associated VTE, is often used as a surrogate for measuring the success of ongoing VTE prevention programs.[12]
Our study aimed to assess the incidence of HA‐VTE plus HA‐SVT in the era of mandatory POA coding and newer ICD‐9 codes for VTE.
METHODS
Setting and Cases
We conducted a retrospective analysis of discharges from the 83 academic medical centers belonging to the UHC (formerly, the University HealthSystem Consortium,
Patients in our analysis were age 18 years and discharged with a medical medical severity diagnostic‐related group (MS‐DRG) code, hospitalized for 48 hours, and did not have a surgical or obstetric MS‐DRG code (except when assigned a surgical MS‐DRG code solely due to insertion of an inferior vena cava filter, with no other major procedures performed). Cases excluded discharges with a principal diagnosis of acute VTE/SVT (defined here as including PE, LE‐DVT, UE‐DVT, SVT, chronic VTE, and thrombosis not otherwise specified), as coding guidelines prohibit assigning a HA‐VTE as the principal diagnosis for the index hospitalization.[14]
Hospital‐Acquired Venous Thromboembolism or Superficial Venous Thrombosis
Cases were classified as having a HA‐VTE/SVT if there was 1 VTE/SVT coded in a secondary diagnosis position (other diagnosis) with a corresponding POA indicator equal to either N (not POA) or U (documentation insufficient to clarify whether VTE was POA or not). This usage corresponds to CMS guidelines and reimbursement policies for hospital‐acquired conditions.[15] Among cases with 1 HA‐VTE (or SVT), we assigned 1 HA‐VTE diagnosis using a hierarchy based on the highest level of clinical importance: first, PE; then LE‐DVT; then UE‐DVT; then SVT; then chronic VTE; then, finally, unspecified VTE. We subsequently excluded cases with primarily chronic VTE from our analysis because these were likely miscodes (ie, it is unclear how a chronic VTE could not be POA) and there were only 30 such cases. Cases with HA‐PE or HA‐LE DVT were analyzed separately as an important subset of HA‐VTE (plus SVT), because HA‐PE/LE‐DVT is both life‐threatening and theoretically preventable with VTEP.
Severity of Illness and Other Measures of Comorbidity
For each case we used proprietary software (3M Health Information Systems, Murray UT) to classify severity of illness (SOI). The SOI scale, based on physiologic derangement and organ system loss of function,[16] has 4 levels: minor, major, severe, and extreme. Defined within specific disease groups (All Patient Refined DRGs), it is often compared across diseases as well.[17] We also assessed whether patients had a cancer diagnosis, spent time in the intensive care unit (ICU), and died in the hospital.
Central Venous Catheter Use in Patients With Upper‐Extremity Deep Venous Thrombosis or Superficial Venous Thrombosis
Because UE‐DVT and SVT are frequently associated with a CVC or PICC, we assessed central venous catheterization among patients with an UE‐DVT or SVT of the cephalic, basilic, or antecubital veins using diagnosis codes for complications related to dialysis devices, implants, and grafts.
Pharmacologic Thromboprophylaxis
Pharmacy records of the subset of HA‐VTE/SVT cases with PE or LE‐DVT were analyzed to determine if VTEP was administered on hospital day 1 or 2, as per Joint Commission performance requirements.[4] Medications that met criteria as VTEP included unfractionated heparin, 5000 IU, given 2 or 3 a day; enoxaparin, 40 mg, given daily; dalteparin, 2500 or 5000 IU, given daily; fondaparinux, 2.5 mg, given daily; and warfarin. We could not reliably determine if VTEP was used throughout the entire hospitalization, or whether mechanical prophylaxis was used at all.
Statistical Analysis
This was a descriptive analysis to determine the incidence of HA‐VTE/SVT and describe the demographic and clinical characteristics of this population. We calculated means and standard deviations (SD) for continuous variables and proportions for binary variables (including HA‐VTE/SVT incidence). All comparisons between populations were performed as either 2‐tailed t tests or 2 analyses. All analysis was conducted using SAS software, version 9.2 (SAS Institute, Inc., Cary, NC).
RESULTS
For the 18‐month period between October 1, 2009, and March 31, 2011, across 83 UHC hospitals, there were 2,525,068 cases. Among these, 12,847 (0.51%) had 1 HA‐VTE/SVT coded. As per the clinical importance hierarchy described above, 2449 (19.1%) cases had at least a PE coded; 3848 (30%) had at least a LE‐DVT (but not a PE) coded; 2893 (22.5%) had at least an UE‐DVT coded; 3248 (25.3%) had at least an SVT coded; 30 had at least a chronic VTE coded; and 379 had at least a VTE coded with no specified location. Of those with SVT, 192 (5.8%) were LE‐SVT codes, whereas the rest were SVT/thrombophlebitis of the upper extremities or not otherwise specified. There were 11,882 (92.5%) hospitalizations with a single HA‐VTE/SVT code and an additional 965 (7.5%) with multiple codes, for a total of 13,749 HA‐VTE/SVT events (see Supporting Information, Table S1, in the online version of this article for more specific data for the individual ICD‐9 codes used to specify HA‐VTE events).
Compared with those who did not develop any HA‐VTE/SVT, patients with HA‐PE/LE‐DVT were more likely to be Caucasian (65% vs 58%, P < 0.001) and were older (age 62 vs 48 years, P < 0.001) and sicker (79.9% vs 44.9% with a severe or extreme SOI, P < 0.001). They also were more likely to have cancer, have longer lengths of stay, be more likely to stay in the ICU, and die in the hospital (P < 0.001 for all comparisons; Table 1).
| Characteristic | No HA‐VTE, n = 2,512,221 | HA‐PE/LE DVT, n = 6,297a | P Valueb |
|---|---|---|---|
| |||
| Proportion of hospitalizations, % | 99.49 | 0.25 | |
| Age, y | 48.2 27.1 | 62.5 20.0 | <0.001 |
| Female sex | 1,347,219 (53.6) | 3,104 (49.3) | <0.001 |
| Race | <0.001 | ||
| Caucasian | 1,455,215 (57.9) | 3,963 (64.7) | |
| Black | 600,991 (23.9) | 1,425 (23.3) | |
| Hispanic | 206,553 (8.2) | 263 (4.3) | |
| API | 59,560 (2.4) | 88 (1.4) | |
| Other | 189,902 (7.6) | 389 (6.4) | |
| Admission SOI | <0.001 | ||
| Minor | 461,411 (18.4) | 181 (2.9) | |
| Major | 922,734 (36.7) | 1,081 (17.2) | |
| Severe | 880,542 (35.1) | 2,975 (47.2) | |
| Extreme | 247,244 (9.8) | 2,060 (32.7) | |
| Unknown | 290 (0.01) | 0 (0.0) | |
| Had an active diagnosis of cancer | 331,705 (13.2) | 2,162 (34.3) | <0.001 |
| Length of stay, d | 7.31 9.31 | 18.7 19.5 | <0.001 |
| Spent time in the ICU | 441,412 (17.6) | 3,011 (47.8) | <0.001 |
| Died in hospital | 57,954 (2.3) | 1,036 (16.5) | <0.001 |
| Received prophylaxisc | c | 3,454 (54.9) | c |
Among cases with a code for UE‐DVT (22.5% of all patients with HA‐VTE), 74% were noted to also have a code for a CVC, as did 60% of cases with a HA‐SVT of the antecubital, basilic, or cephalic veins (71% of SVT events; see Supporting Information, Table S1, in the online version of this article).
Of those with HA‐PE/LE‐DVT, 54.9% received pharmacologic prophylaxis on hospital day 1 or 2 (mostly with low‐molecular‐weight heparin or unfractionated heparin).
DISCUSSION
In this study of medical patients admitted to academic medical centers throughout the United States, we found that HA‐VTE/SVT was coded in approximately 0.51% of discharges, and the incidence of HA‐PE/LE‐DVT was 0.25%. Patients with a HA‐PE/LE‐DVT code were, in general, older and sicker than those who did not develop VTE. We further found that close to half of all HA‐VTE/SVT occurred in the upper extremity, with the majority of these occurring in patients who had CVCs. Finally, the majority of patients diagnosed with HA‐PE/LE‐DVT were started on VTEP on the first or second hospital day.
The overall incidence of HA‐VTE/SVT we discovered corresponds well to other studies, even those with disparate populations. A single‐institution study found a HA‐VTE/SVT incidence of approximately 0.6% among hospitalized patients on medical and nonmedical services.[12] The study by Barba found a rate of 0.93%,[18] whereas the study by Lederle found a rate of approximately 1%.[19] Spyropolous found an HA‐VTE incidence of 0.55%.[11] Rothberg found a lower rate of 0.25% in his risk‐stratification study, though in the pre‐POA and preupdated code era.[20] Our findings extend and provide context for, in a much larger population, the results of these prior studies, and represent the first national examination of HA‐VTE/SVT in the setting of numerous quality‐improvement and other efforts to reduce hospital‐associated VTE.
The incidence of HA‐VTE/SVT codes we observed likely underestimates the incidence of hospital‐associated VTE/SVT by a factor of approximately 4, for 2 reasons. First, although VTE/SVT codes with a POA flag set to No are truly hospital‐acquired events on chart review approximately 75% of the time, and thus overestimate HA‐VTE/SVT, 25% of POA = Yes codes are actually HA‐VTE/SVT events on chart review, and therefore lead to underestimation of HA‐VTE/SVT.[9] Because VTE/SVT codes with a POA flag set to Yes outnumber those flagged No by 3 or 4 to 1, events mis‐flagged Yes contribute a much greater number of undercounted HA‐VTE/SVT, elevating the actual HA‐VTE/SVT event rate by a factor of approximately 2. Second, HA‐VTE events do not include hospital‐associated VTE events that are diagnosed after the index hospitalization. In the Spyropolous study, 45% of hospital‐associated VTE events occurred after discharge, so translating HA‐VTE/SVT events to hospital‐associated VTE/SVT events would again involve multiplying by a factor of 2.[11] Thus, the overall incidence of hospital‐associated VTE/SVT events in our sample may have been approximately 2% (0.51% 4), and the overall incidence of hospital‐associated PE or LE‐DVT events may have been approximately 1%, though there may be significant variation around these estimates given that individual institutions were themselves quite variable in their POA flag accuracy in our study.[9] There is additionally the possibility that hospitals may have deliberately left some VTE/SVT uncoded, but in the absence of financial incentives to do so for anything other than postsurgical VTE, and in the presence of penalties from CMS for undercoding, we believe this to be unlikely, at least at present.
Despite these upward extrapolations, the estimated incidence of hospital‐associated VTE/SVT in our study may seem low compared with that reported in the MEDENOX[2] and PREVENT studies.[3] Much of this discrepancy vanishes on closer examination. In the large randomized trials, patients were uniformly and routinely assessed for LE‐DVT using vascular ultrasound; in contrast, in our population of hospitalizations patients may have only had diagnostic studies done for signs or symptoms. Clinically apparent hospital‐associated VTE is less common than all hospital‐associated VTE, as it was even in PREVENT,[3] and increased surveillance may even be partially driving increased hospital‐associated VTE/SVT at some hospitals.[21] Our findings suggest that success or failure in preventing administratively coded, clinically apparent HA LE‐VTE/PE should be judged, broadly, against numbers in the range established in our study (eg, 0.25%), not the 5% or 15% of chart‐abstracted, aggressively ascertained (and sometimes clinically silent) hospital‐associated VTE in the large randomized controlled trials. That is, 0.25% is not an achievement, but rather the average, expected value.
Almost 25% of the observed HA‐VTE/SVTs coded were UE‐DVT, with roughly 75% of these being likely related to central venous catheterization (including those peripherally inserted). An additional 1/5 were upper‐extremity SVT of the antecubital, cephalic, and basilic veins, with the majority of these (60%) also listed as catheter‐related. Such thrombosis is best prevented by decreased use of central catheters or perhaps by using smaller‐caliber catheters.[22] It is unclear if VTEP can prevent such clots, though in cancer patients at least one recent trial seems promising.[23]
We found that patients with a coded HA‐PE/LE‐DVT were remarkably different from those not developing HA‐VTE/SVT. Patients with HA‐PE or HA‐LE‐DVT were older, sicker, more likely to have cancer, significantly more likely to spend time in the ICU, and much more likely to die in the hospital; risk factors for HA‐VTE overlap significantly with risk factors for death in the hospital. A small majority (55%) of patients in the HA‐PE/LE‐DVT group had actually received VTEP on at least day 1 or 2 of hospitalization. It may be the case that the dose of VTEP was insufficient to suppress clot formation in these patients, or that HA‐PE/LE‐DVT in patients with this degree of comorbidity is difficult to prevent.
There are a number of limitations to our study. We analyzed administrative codes, which underestimate hospital‐associated VTE/SVT events as noted above. This was a descriptive study, cross‐sectional across each hospitalization, and we were unable to draw any causal inference for differences in HA‐VTE/SVT incidence that might exist between subpopulations. We estimated VTEP from medication usage in just the first 2 days of hospitalization; we could not assess mechanical prophylaxis in this dataset; and we did not have any VTEP data for the first 2 days of hospitalization on the patients who did not develop a HA‐VTE/SVT, which made it impossible to compare the 2 populations on this measure. For those who did not receive VTEP, we were unable to obtain data regarding possible contraindications to VTEP, such as ongoing gastrointestinal or intracerebral hemorrhage. Additionally, our data are based on academic hospitals only and may not generalize to nonacademic settings. Extrapolating from HA‐VTE/SVT to hospital‐associated VTE/SVT may not be possible due to heterogeneity of clotting events and perhaps variability in whether patients would return to the hospital for all of them (eg, superficial or UE VTE may not result in readmission). Finally, it is unclear whether a switch to ICD Tenth Revision (ICD‐10) codes will impact our measured baseline in the coming year. The strengths of our analysis included stratification by type of HA‐VTE/SVT and our ability to assess the incidence of HA‐VTE/SVT in a large national population, and the provision of a baseline for VTE incidenceeasily usable by any individual hospital, network, or researcher with access to administrative datagoing forward.
In conclusion, among patients hospitalized in academic medical centers, HA‐VTE/SVT was coded in approximately 0.51% of patients with a medical illness staying >2 days, with approximately half of the events due to HA‐PE/LE‐DVT. Patients who developed HA‐PE/LE‐DVT were more acutely ill than those who did not, and VTE developed despite 55% of these patients receiving VTEP on day 1 or 2. Hospitals can reasonably treat the 0.25% figure as the baseline around which to assess their own performance in preventing HA‐PE/LE‐DVT, and can measure their own performance using administrative data. Further research is needed to determine how best to achieve further reductions in HA‐VTE/SVT through risk stratification and/or through other interventions.
Disclosures
Nothing to report.
- , , , , ;American College of Chest Physicians AntithromboticTherapy and Prevention of Thrombosis Panel. Executive summary: Antithrombotic Therapy and Prevention of Thrombosis, 9th ed: American College of Chest Physicians Evidence‐Based Clinical Practice Guidelines [published corrections appear in Chest. 2012;141(4):1129 and 2012;142(6):1698]. Chest. 2012;141(2 suppl):7S–47S.
- , , , et al;Prophylaxis in Medical Patients with Enoxaparin Study Group. A comparison of enoxaparin with placebo for the prevention of venous thromboembolism in acutely ill medical patients. N Engl J Med. 1999;341(11):793–800.
- , , , , , . Randomized, placebo‐controlled trial of dalteparin for the prevention of venous thromboembolism in acutely ill medical patients. Circulation. 2004;110(7):874–879.
- The Joint Commission.Specifications Manual for National Hospital Inpatient Quality Measures. Available at: http://www.jointcommission.org/specifications_manual_for_national_hospital_inpatient_quality_measures.aspx. Accessed July 18, 2012.
- , . Preventing Hospital‐Acquired Venous Thromboembolism: A Guide for Effective Quality Improvement. Prepared by the Society of Hospital Medicine. Rockville, MD: Agency for Healthcare Research and Quality; AHRQ Publication No. 08‐0075.
- , , , et al. Prevention of venous thromboembolism: the Seventh ACCP Conference on Antithrombotic and Thrombolytic Therapy. Chest. 2004;126(3 suppl):338S–400S.
- , , , et al. Prevention of VTE in nonsurgical patients: Antithrombotic Therapy and Prevention of Thrombosis, 9th ed: American College of Chest Physicians Evidence‐Based Clinical Practice Guidelines. Chest. 2012;141(2 suppl):e195S–e226S.
- Centers for Medicare 46(6 part 1):1946–1962.
- , , , et al. Predictive and associative models to identify hospitalized medical patients at risk for VTE. Chest. 2011;140(3):706–714.
- , , , . Unintended consequences of a standard admission order set on venous thromboembolism prophylaxis and patient outcomes. J Gen Intern Med. 2012;27(3):318–324.
- United Health Consortium Website. Available at: https://www.uhc.edu. Accessed March 8, 2012.
- ICD‐9‐CM Official Guidelines for Coding and Reporting. Available at: http://www.cdc.gov/nchs/data/icd9/icdguide10.pdf. Published 2010. Accessed June 4, 2013.
- Centers for Medicare 27(5):587–612.
- Overview of Disease Severity Measures Disseminated with the Nationwide Inpatient Sample (NIS) and Kids' Inpatient Database (KID). Available at: http://www.hcup‐us.ahrq.gov/db/nation/nis/OverviewofSeveritySystems.pdf. Published December 9, 2005. Accessed June 4, 2013.
- , , , et al. Venous thromboembolism in acutely ill hospitalized medical patients. Thromb Res. 2010;126(4):276–279.
- , , , . Venous thromboembolism prophylaxis in hospitalized medical patients and those with stroke: a background review for an American College of Physicians Clinical Practice Guideline. Ann Intern Med. 2011;155(9):602–615.
- , , , , . Risk factor model to predict venous thromboembolism in hospitalized medical patients. J Hosp Med. 2011;6(4):202–209.
- , , , et al. Evaluation of surveillance bias and the validity of the venous thromboembolism quality measure. JAMA. 2013;310(14):1482–1489.
- , , , et al. Reduction of peripherally inserted central catheter‐associated DVT. Chest. 2013;143(3):627–633.
- , , , et al. Prophylaxis of catheter‐related deep vein thrombosis in cancer patients with low‐dose warfarin, low molecular weight heparin, or control: a randomized, controlled, phase III study. Cancer Chemother Pharmacol. 2013;72(1):65–73.
© 2014 Society of Hospital Medicine
Venous Thromboembolism After TKA
Symptomatic venous thromboembolism (VTE) is a common complication following total knee arthroplasty (TKA).17 In fact, the high incidence of thrombosis after TKA has made this operation the principal condition used to study the efficacy of new anticoagulants, and it is a principal target of quality improvement oversight and measurement.8 The Agency for Healthcare Research and Quality (AHRQ) has developed a Patient Safety Indicator (PSI‐12) to assist hospitals, payers, and other stakeholders identify patients who experienced VTE after major surgery. The Centers for Medicare * Medicaid Services has deemed that because a VTE that develops after TKA is potentially preventable, it withholds the additional payment for this complication.9
Prior the introduction of new oral anticoagulants, most guidelines from North America recommended the use of postoperative low‐molecular‐weight heparin (LMWH), fondaparinux, or warfarin for at least 10 days after TKA.2, 10 However, there is some ongoing controversy about whether pharmacological prophylaxis is necessary after total joint replacement surgery, and whether it is effective in preventing pulmonary embolism.1114 In addition, there is controversy regarding the effectiveness of mechanical prophylaxis alone as a means of preventing VTE.2, 4, 14, 15
Pharmacological thromboprophylaxis using LMWH or fondaparinux calls for using a fixed‐dose that does not depend on the patient's weight or body mass index (BMI). This stands in sharp contrast to the consistent recommendation to use weight‐based dosing of LMWH/fondaparinux in patients who have acute VTE.16 The absence of any adjustment in the dose of thromboprophylaxis based on weight may be particularly important after TKA because the majority of these patients are obese or extremely obese,1719 making the dose of LMWH/fondaparinux potentially insufficient. It is noteworthy that surgeons who perform bariatric surgery currently recommend a higher dose of LMWH, usually 40 mg of enoxaparin every 12 hours.20, 21
We conducted this case‐control study to address 3 hypotheses. First, we hypothesized that use of standard pharmacologic thromboprophylaxis drugs is associated with a lower risk of acute VTE compared with mechanical prophylaxis alone. Second, we hypothesized that among patients given LMWH/fondaparinux, excessive obesity (BMI >35) is associated with a higher risk of developing VTE. Third, based on prior studies that identified immobilization as a risk factor for VTE, we hypothesized that delayed ambulation after TKA is associated with higher risk for VTE.
METHODS
Study Design
The University of California Davis, in partnership with the University HealthSystem Consortium (UHC), conducted a retrospective case‐control study of risk factors for acute symptomatic VTE within 90 days following TKA. Fifteen volunteer hospitals nationwide agreed to abstract medical records of up to 40 sampled cases or controls. Inclusion criteria were admission between October 1, 2008 and March 31, 2010; presence of a principal International Classification of Diseases, 9th Revision, Clinical Modification (ICD‐9‐CM) procedure code of 81.54 or 81.55; and age 40 years or more. Patients with a pregnancy‐related principal diagnosis (Major Diagnostic Category 14) or inferior vena cava interruption on or before the date of the first operating room procedure were excluded.
Cases were defined as having: a) one or more secondary diagnosis codes for acute VTE, as defined by AHRQ PSI‐12, version 4.1 (415.11, 415.19, 451.11, 451.19, 451.2, 451.81, 451.9, 453.40453.42, 453.8, 453.9), coupled with a present‐on‐admission flag of no (POA = N); or b) were readmitted with a principal diagnosis of VTE (same codes) within 90 days of the date of surgery. A probability sample of VTE cases (up to a maximum of 20), and 20 eligible TKA patients who did not develop acute VTE during the index hospitalization or within 90 days of surgery, were randomly selected for abstraction. Only 1 case flagged by the PSI algorithm was excluded because VTE could not be confirmed by abstraction.
Chart Abstraction
A chart abstraction tool was constructed and personnel at each site were taught how to obtain the desired information. Data elements included age, gender, height and weight, and type of TKA (unilateral, bilateral, or revision). BMI was calculated and categorized as severely obese (World Health Organization [WHO] class II or more, BMI 35) versus not severely obese (BMI <35), and as morbidly obese (WHO class III, BMI >40) or not morbidly obese (<40). Information about use of pharmacologic (LMWH, fondaparinux, or warfarin) and mechanical thromboprophylaxis was collected and classified as follows. First, the type of prophylaxis was categorized as: (1) LMWH (enoxaparin, dalteparin)/fondaparinux with or without mechanical prophylaxis (pneumatic compression devices, graduated compression stockings, or foot pump); (2) warfarin alone, with or without mechanical prophylaxis; (3) LMWH/fondaparinux and warfarin with or without mechanical pharmacologic prophylaxis; (4) mechanical prophylaxis alone (without any pharmacological prophylaxis but with or without aspirin); and (5) aspirin only, without any other pharmacologic or mechanical prophylaxis. Second, patients who received LMWH, fondaparinux, or warfarin pharmacologic prophylaxis were further classified as receiving FDA‐approved pharmacologic prophylaxis or other prophylaxis. The criteria for FDA‐approved pharmacologic prophylaxis were receipt of the recommended dose at the recommended starting time (per package insert), either before or after surgery, and continued administration until at least the day of hospital discharge, consistent with the 2008 American College of Chest Physicians (ACCP) guidelines for prevention of VTE in orthopedic patients.2 For warfarin, FDA‐approved dosing required a starting dose of 210 mg per day beginning either preoperatively or on the evening after surgery, and given daily thereafter, targeting an international normalized ratio (INR) of 2.03.0. No patient received aspirin alone for prophylaxis. In the analysis of risk factors for VTE, the effect of FDA‐approved pharmacologic prophylaxis was compared against other pharmacologic prophylaxis or mechanical prophylaxis alone. Time of ambulation was defined as early if it occurred on or before the second postoperative day, late if it occurred after the second postoperative day, or none if the patient did not ambulate before discharge.
Outcomes
The principal outcome was validated symptomatic objectively confirmed VTE, manifested as either pulmonary embolism (PE) or lower extremity deep vein thrombosis (DVT) or both. Patients who were diagnosed with VTE on the day of surgery or the day after surgery were not included in the principal analysis, reasoning that postoperative prophylaxis started 1224 hours after surgery is unlikely to prevent early VTE events. In a secondary sensitivity analysis, the effect of including these early postoperative VTE events on the estimated risk was determined.
Statistical Analysis
For continuous variables, bivariate comparisons were made with the use of Student t test. For categorical variables, we applied the chi‐square test and estimated unadjusted odds ratios (ORs) and Cornfield's 95% confidence intervals (CIs). We specifically analyzed whether gender, age, type of TKA, race/ethnicity, primary payer, severe or morbid obesity, postoperative ambulation, personal or family history of VTE, and comorbid conditions were associated with the development of any VTE, DVT, or PE.
Multivariable models were developed using logistic regression. In addition to age and gender, other terms included receipt of FDA‐approved pharmacologic prophylaxis, degree of obesity (severe if BMI >35, morbid if BMI >40), type of TKA (unilateral vs bilateral) and early versus late versus no ambulation. A patient was considered receiving FDA‐approved pharmacologic prophylaxis if the first postoperative dose and the last postoperative dose before discharge of LMWH, fondaparinux, or warfarin were given based on the recommended time and dose. Two‐way interactions between FDA‐approved pharmacologic prophylaxis and extent of obesity were tested, as well as interactions between LMWH/fondaparinux prophylaxis and extent of obesity. We adjusted all of the point estimates and confidence intervals for the correlation of data within each hospital by using the STRATA option in SAS; statistical analyses were performed using the SAS‐PC program, SAS 9.2 (SAS Institute, Inc, Cary, NC).
RESULTS
A total of 593 TKA records were abstracted by the 15 participating hospitals. All patients underwent TKA on the day of admission or the day after admission. A total of 16 cases (12 PE and 4 DVT) were diagnosed with VTE on the day of surgery, or the day after surgery, and were deemed nonpreventable in the multivariable analysis. There were 114 additional cases with VTE (44 PE, 68 DVT, 2 both) diagnosed 2 or more days after surgery, and 463 controls that had no VTE diagnosed by the index hospital within 90 days after surgery.
In bivariate analyses (Table 1), the mean age of cases was significantly greater for controls (65.5 10.4 vs 63.5 10.4, P < 0.05). More cases underwent bilateral simultaneous TKA compared with controls (23% vs 7%, P < 0.001). The mean BMI was marginally higher among VTE cases than among controls (34.6 8.0 vs 33.3 7.1, P = 0.07). Among cases with PE, a significantly greater percentage were morbidly obese than among controls (30% vs 16%, P value = 0.01), whereas there was not a difference for the DVT cases.
| Variable | VTE n = 130 (%) | No VTE n = 463 (%) | Total N = 593 (%) | |
|---|---|---|---|---|
| ||||
| Gender | Male | 45 (34) | 175 (38) | 220 (37) |
| Female | 85 | 288 | 373 | |
| Age (y)* | Mean | 65.5 | 63.5 | 63.9 |
| Standard deviation | 10.4 | 10.4 | 10.5 | |
| LOS (d)* | Mean | 6.1 | 3.4 | 4.0 |
| Standard deviation | 4.7 | 1.5 | 2.8 | |
| Type of TKR | Primary TKR‐unilateral | 100 (76) | 425 (92) | 525 (89) |
| Primary TKR‐bilateral | 29 (23) | 35 (7) | 64 (11) | |
| Revision for mechanical problem | 1 (1) | 3 (1) | 4 (1) | |
| Race | African American | 25 (19) | 80 (17) | 105 (18) |
| Asian | 4 (3) | 8 (2) | 12 (2) | |
| White | 91 (70) | 337 (73) | 428 (72) | |
| Hispanic | 7 (5) | 28 (6) | 35 (6) | |
| Unknown/others | 5 (4) | 18 (4) | 23 (4) | |
| Primary payer | Uninsured/self‐pay | 2 (1) | 2 (<1) | 4 (1) |
| Medicaid/managed care | 11 (8) | 40 (7) | 51 (9) | |
| Medicare/managed care | 66 (52) | 220 (47) | 286 (48) | |
| Private | 44 (34) | 156 (34) | 200 (34) | |
| US/state/local government | 1 (1) | 5 (1) | 6 (1) | |
| Others/unknown | 6 (4) | 40 (8) | 46 (8) | |
| BMI | Mean | 34.6 | 33.3 | 33.6 |
| Standard deviation | 8.0 | 7.1 | 7.3 | |
| Obesity | BMI 30 | 51 (38) | 172 (37) | 223 (38) |
| 30 to 35 | 29 (22) | 122 (26) | 151 (25) | |
| 35 to 40 | 21 (18) | 95 (20) | 116 (20) | |
| >40 | 29 (22) | 74 (16) | 103 (17) | |
| Ambulation | Taking steps with or without walker (day 1 or 2 after surgery) | 62 (47) | 340 (73) | 402 (77) |
| Taking steps with or without walker (day 3 or more after surgery) | 58 (45) | 106 (23) | 164 (28) | |
| Weight bearing only or no ambulation predischarge | 10 (8) | 17 (4) | 27 (5) | |
| No. of days from surgery to taking steps | Mean | 2.0 | 1.3 | 1.45 |
| Standard deviation | 2.3 | 0.7 | 1.4 | |
| Comorbidities/risk factors | Diabetes | 30 (22) | 99 (22) | 129 (22) |
| Hypertension | 90 (70) | 313 (67) | 403 (68) | |
| History of malignancy | 9 (8) | 54 (11) | 63 (11) | |
| Current neoplasm | 4 (3) | 9 (2) | 13 (2) | |
| Documented history/risk of bleeding or hematoma | 3 (2) | 7 (2) | 10 (2) | |
| History of any other surgery | 1 (1) | 1 (<1) | 2 (<1) | |
| Baseline inability to ambulate without assistance from staff | 0 | 3 (1) | 3 (<1) | |
| Trauma, head trauma, new fractures | 0 | 0 | 0 | |
| Current use of oral contraceptive or system estrogen | 0 | 8 (2) | 8 (1) | |
| Past stroke/CVA with residual weakness | 1 (1) | 7 (2) | 8 (1) | |
| Prior history of DVT | 6 (5) | 20 (4) | 26 (4) | |
| Prior history of PE | 2 (2) | 11 (2) | 13 (2) | |
| Family history of VTE | 0 | 5 (1) | 5 (1) | |
| Known thrombophilia | 0 | 1 (<1) | 1 (<1) | |
| None of the above | 33 (25) | 96 (21) | 129 (22) | |
Fewer VTE cases began ambulation on or before the second postoperative day compared with controls (47% vs 73%, P < 0.001). There was no difference in the number or types of comorbidities between cases and controls. All patients received at least 1 type of pharmacologic or mechanical prophylaxis within the first 24 hours after TKA. Although the difference was not statistically significant, controls had marginally higher odds of receiving FDA‐approved pharmacologic prophylaxis than cases (P = 0.07; Table 2). Table 3 presents the criterion that led to 242 cases not meeting the definition of FDA‐approved pharmacologic prophylaxis definition. Administering a suboptimal dose was the most common reason. Also, about half of the patients received only mechanical prophylaxis.
| Thromboprophylaxis | Thromboembolism | |
|---|---|---|
| VTE = Yes n = 130 (%) | VTE = No n = 463 (%) | |
| ||
| Pharmacologic prophylaxis | ||
| LMWH/fondaparinux | 61 (46) | 223 (48) |
| Warfarin alone (no LMWH)* | 44 (33) | 145 (31) |
| None | 25 (19) | 95 (20) |
| Nonpharmacologic prophylaxis | ||
| Intermittent pneumatic compression or graduated compression stockings/foot pump | 27 (21) | 93 (20) |
| FDA‐approved pharmacologic prophylaxis | ||
| LWMH/fondaparinux/warfarin prophylaxis | 67 (48) | 284 (61) |
| No FDA‐approved pharmacologic prophylaxis | ||
| Suboptimal pharmacologic or mechanical prophylaxis | 63 (52) | 179 (39) |
| Prophylaxis Status | Cases and Controls Who Did Not Receive FDA‐Approved Pharmacologic Prophylaxis (N = 242) | ||
|---|---|---|---|
| |||
| Received FDA‐approved pharmacologic prophylaxis but did not meet FDA‐approved proper dose, timing, and duration | Variable | n* | |
| 118 (49%) | Wrong dose | 87 | |
| Dose not within the recommended time window | 17 | ||
| Not continued at discharge | 50 | ||
| Received no pharmacologic prophylaxis (only mechanical) | 124 (51%) | ||
In the primary multivariable analysis (Table 4), neither age, gender, nor obesity (defined as BMI >30, BMI >35, or BMI >40) was a significant predictor of VTE. Undergoing bilateral simultaneous TKA versus unilateral TKA was associated with higher risk of VTE (OR = 4.2; 95% CI: 1.909.10), whereas early ambulation on or before the second postoperative day versus later (OR = 0.30; 95% CI: 0.100.90). Receiving FDA‐approved pharmacologic prophylaxis (right dose and time described in Table 4) versus any other prophylaxis regimen was adversely associated with VTE (OR = 0.50; 95% CI: 0.300.80, P = 0.01). There was no significant effect of receipt of FDA‐approved pharmacologic prophylaxis on being diagnosed with VTE among the cases that were severely or morbidly obese (P for interaction = 0.92). In a secondary analysis, the adjusted odds of being diagnosed with VTE were not significantly different for severely (OR = 0.9; CI 0.531.5) or morbidly obese (OR = 1.5; CI 0.802.80) patients.
| Variable | Odds Ratio | P Value |
|---|---|---|
| ||
| Older age | 1.02 (0.991.05) | 0.20 |
| Female gender | 1.70 (0.92.9) | 0.90 |
| BMI over 35 (vs 35 or less) | 0.9 (0.51.6) | 0.66 |
| Bilateral TKA (vs unilateral TKA) | 4.2 (1.99.1) | 0.0004 |
| Receiving FDA‐approved pharmacologic prophylaxis* vs mechanical | 0.5 (0.30.8) | 0.01 |
| Ambulation on or before second postoperative day | 0.3 (0.10.9) | 0.005 |
In a sensitivity analysis, we did not find any significant changes in the results when the 12 cases that developed VTE on the day of, or day after, TKA were included.
DISCUSSION
Venous thromboembolism is a frequent and potentially serious complication following TKA. In population‐based studies that report the number of patients who develop symptomatic acute VTE, the incidence is approximately 2.0%2.5%.3, 2224 Thromboprophylaxis reduces the risk of developing asymptomatic VTE by more than 60%, and pharmacologic prophylaxis using LMWH, fondaparinux, or warfarin alone is recommended by the ACCP and other organizations, with use of mechanical pneumatic compression, low‐dose unfractionated heparin, or aspirin as alternative options.25 Nevertheless, because extremely obese patients are not commonly enrolled in clinical trials and because current guidelines do not recommend any adjustment in the dose of LMWH or fondaparinux based on weight, we hypothesized that LMWH/fondaparinux would be significantly less effective in severely or morbidly obese patients. We also hypothesized that pharmacologic prophylaxis would be superior to mechanical prophylaxis alone,26 and that delayed ambulation after TKA would be associated with a higher risk of developing VTE.
Two widely cited clinical guidelines that pertain to prophylaxis of venous thromboembolism after total knee arthroplasty are the ACCP guidelines2 and the American Academy of Orthopedic Surgeons (AAOS) guidelines.27 Although we acknowledge that there are differences in these and other guidelines, recommendations and quality measures,13, 28, 29 the aim of the current study was not to evaluate or compare specific guidelines. We simply classified the thromboprophylaxis regimens into logical groups, the 2 most frequent being use of LMWH/fondaparinux (mechanical) and mechanical prophylaxis alone, and then performed the case‐control analysis. We followed FDA‐approved labeling to assess whether pharmacologic therapy was provided at the proper dose in the proper time period.
A principal finding of this study was that FDA‐approved pharmacologic prophylaxis using LMWH, fondaparinux, or warfarin, was associated with significantly lower odds of developing VTE compared to all other prophylaxis regimens.
When the effect of FDA‐approved pharmacologic prophylaxis was analyzed in severely or morbidly obese patients versus less obese patients, there was no significant difference in the risk of VTE across the BMI levels that were compared. Further, among the patients whose pharmacologic prophylaxis was LMWH or fondaparinux, severe or morbid obesity was not associated with significantly higher odds of developing VTE. Although it is logical to think that heavier patients require a larger dose of LMWH or fondaparinux, the findings of this study suggest that current FDA‐approved doses of these drugs are adequate even in morbidly obese patients.
Two other findings were noteworthy. First, early mobilization with active ambulation in the first 2 days after TKA was strongly associated with lower odds of developing VTE. This finding is similar to the report by Chandrasekaran et al that sitting out of bed or walking for at least 1530 minutes twice a day on the first postoperative day after TKA significantly reduced the incidence of thromboembolic complications (OR = 0.35; 95% CI: 0.11, 1.03, P = 0.03) compared those confined to bed.22, 30 In our study, the beneficial effect of mobilization disappeared if ambulation commenced on day 3 or later after surgery. This finding emphasizes the importance of early mobilization in prevention of VTE, as has been reported after total hip arthroplasty.31
The other important finding was that bilateral simultaneous TKA was strongly associated with VTE, with over 4‐fold greater odds of developing VTE compared with unilateral TKA. This effect did not disappear when we adjusted for obesity or the time to mobilization. This finding was not unexpected and is consistent with other reports in the literature showing a higher incidence of VTE after bilateral TKA compared with unilateral TKA.3235
This study has several limitations. We were unable to ascertain postdischarge VTE unless a patient was readmitted to the same hospital. It has been reported that between 35% to 45% of postoperative VTEs occur after hospital discharge,22, 23 and some of these complications are treated at other institutions or in the outpatient arena.36 Second, it has been shown that hospital volume and hospital specialization are associated with the incidence of VTE after TKA procedures.37, 38 To minimize the risk of confounding by hospital characteristics, we conditioned our analysis on hospital and adjusted for the clustering effect of hospitals. Third, all data were collected by individuals employed by and working at the participating hospitals, with no mechanism for duplicate abstraction to ensure reliability. Fourth, only teaching hospitals participated in this study. Adherence to guidelines and use of prophylaxis may be higher at teaching hospitals than at nonteaching hospitals.39 As a result, our sample may have less variation than the general population of TKA patients, limiting our power to detect associations between thromboprophylaxis and VTE. Finally, the case‐control design has inherent limitations in detecting causal associations, largely due to its susceptibility to unmeasured confounders and incorrect ascertainment of pre‐outcome exposures. To avoid the latter problem, we excluded VTEs that were diagnosed on the date of surgery, before prophylaxis is routinely started.
Despite these limitations, our findings suggest that there may be opportunities to prevent postoperative VTE, even among high‐risk patients at teaching hospitals that have achieved 100% compliance with The Joint Commission's Surgical Care Improvement Project process measures.40, 41 Specifically, delivery of FDA‐approved pharmacologic prophylaxis (vs mechanical prophylaxis alone) and early ambulation (vs later) may further decrease the risk of postoperative VTE. These hypotheses merit further testing in randomized controlled trials or cluster‐randomized quality improvement trials. Patients should be informed of the increased risk of VTE after bilateral TKA, although this additional risk may be outweighed by a reduction in the cumulative recovery time and a lower cumulative risk of developing a prosthetic joint infection.42, 43 Finally, AHRQ's PSI‐12 appears to be a useful tool for ascertaining VTE cases and identifying potential opportunities for improvement, when the present‐on‐admission status is also available.
- , , . Frequency and timing of clinical venous thromboembolism after major joint surgery. J Bone Joint Surg Br. 2006;88(3):386–391.
- , , , et al. Prevention of venous thromboembolism: American College of Chest Physicians Evidence‐Based Clinical Practice Guidelines (8th ed). Chest. 2008;133(6 suppl):381S–453S.
- , , . Venous thromboembolism associated with hip and knee replacement over a ten‐year period: a population‐based study. J Bone Joint Surg Br. 2005;87(12):1675–1680.
- , , , , . Venous thromboembolic disease after total hip and knee arthroplasty: current perspectives in a regulated environment. Instr Course Lect. 2008;57:637–661.
- , , , , , . The incidence of venous thromboembolism before and after total knee arthroplasty using 16‐row multidetector computed tomography. J Arthroplasty. 2011;26(8):1488–1493.
- , , , , . Incidence and time course of thromboembolic outcomes following total hip or knee arthroplasty. Arch Intern Med. 1998;158(14):1525–1531.
- , . The incidence of symptomatic venous thromboembolic events in orthopaedic surgery when using routine thromboprophylaxis. Vasa. 2008;37(4):353–357.
- , , , et al. How valid is the ICD‐9‐CM based AHRQ patient safety indicator for postoperative venous thromboembolism? Med Care. 2009;47(12):1237–1243.
- Department of Health and Human Services, Centers for Medicare 17(4):359–365.
- , , , . American Association of Orthopedic Surgeons and American College of Chest Physicians guidelines for venous thromboembolism prevention in hip and knee arthroplasty differ. What are the implications for clinicians and patients? Chest. 2009;135(2):1512–1520.
- , , , et al. Incidence of prosthetic joint infections after primary knee arthroplasty. J Arthroplasty. 2010;25(1):87–92.
- . Comparison of ACCP and AAOS guidelines for VTE prophylaxis after total hip and total knee arthroplasty. Orthopedics. 2009;32(12 suppl):74–78.
- , , . How can we reduce disagreement among guidelines for venous thromboembolism prevention? J Thromb Haemost. 2010;8(4):675–677.
- , , , . Mechanical thromboprophylaxis in critically ill patients: a systematic review and meta‐analysis. Am J Crit Care. 2006;15(4):402–410; quiz/discussion, 411–412.
- , , , , , . Antithrombotic therapy for venous thromboembolic disease: American College of Chest Physicians Evidence‐Based Clinical Practice Guidelines (8th ed). Chest. 2008;133(6 suppl):454S–545S.
- , , , et al. Venous thromboembolism prophylaxis in major orthopaedic surgery: a multicenter, prospective, observational study. Acta Orthop Traumatol Turc. 2008;42(5):322–327.
- , , , . Obesity and perioperative morbidity in total hip and total knee arthroplasty patients. J Arthroplasty. 2005;20(suppl 3):46–50.
- , . Risk factors for venous thromboembolism after total hip and knee replacement surgery. Curr Opin Pulm Med. 2002;8(5):365–371.
- , , , , . Comparison of two low‐molecular‐weight heparin dosing regimens for patients undergoing laparoscopic bariatric surgery. Surg Endosc. 2008;22(11):2392–2395.
- , , , , . Anti‐Xa levels in bariatric surgery patients receiving prophylactic enoxaparin. Obes Surg. 2008;18(2):162–166.
- , , , , , . Epidemiology of venous thromboembolism after lower limb arthroplasty: the FOTO study. J Thromb Haemost. 2007;5(12):2360–2367.
- , , . Incidence of symptomatic venous thromboembolism after different elective or urgent surgical procedures. Thromb Haemost. 2003;90(3):446–455.
- . The epidemiology of venous thromboembolism. Circulation.2003;107(23 suppl 1):I4–I8.
- , , , et al. Prevention of VTE in orthopedic surgery patients: Antithrombotic Therapy and Prevention of Thrombosis, 9th ed: American College of Chest Physicians Evidence‐Based Clinical Practice Guidelines. Chest. 2012;141(2 suppl):e278S–e325S.
- , , , et al. Prevention of deep‐vein thrombosis after total knee replacement: randomised comparison between a low‐molecular‐weight heparin and mechanical prophylaxis with a foot‐pump system. J Bone Joint Surg Br. 1999;81‐B(4):654–659.
- AAOS. Pulmonary Embolism After Knee Arthroscopy: Rare but Serious. American Academy of Orthopaedic Surgeons/American Association of Orthopaedic Surgeons Web site. Available at: http://www6aaosorg/news/pemr/releases/releasecfm?releasenum=9692011.
- , , , . American Association of Orthopedic Surgeons and American College of Chest Physicians guidelines for venous thromboembolism prevention in hip and knee arthroplasty differ: what are the implications for clinicians and patients? Chest. 2009;135(2):513–520.
- Premier—A supporting partnership organization of the Surgical Care Improvement Project (SCIP). Premier Inc Web site. Available at: http://www.premierinc.com/safety/topics/scip/. Accessed April 10, 2012.
- , , , . Early mobilization after total knee replacement reduces the incidence of deep venous thrombosis. Aust N Z J Surg. 2009;79(7–8):526–529.
- , , , , . Predictors of rehospitalization for symptomatic venous thromboembolism after total hip arthroplasty. N Engl J Med. 2000;343(24):1758–1764.
- , , , , , . Bilateral total knee replacement: staging and pulmonary embolism. J Bone Joint Surg Am. 2006;88(10):2146–2151.
- , . Incidence and natural history of deep‐vein thrombosis after total knee arthroplasty. A prospective, randomised study. J Bone Joint Surg Br. 2002;84(4):566–570.
- , , , , . In‐hospital complications and mortality of unilateral, bilateral, and revision TKA: based on an estimate of 4,159,661 discharges. Clin Orthop Relat Res. 2008;466(11):2617–2627.
- , , , . Safety of simultaneous bilateral total knee arthroplasty. A meta‐analysis. J Bone Joint Surg Am. 2007;89(6):1220–1226.
- , , , . Short‐term coagulation complications following total knee arthroplasty: a comparison of patient‐reported and surgeon‐verified complication rates. J Arthroplasty. 2011 Jan 20.
- , , , , . Clinical and cost outcomes of venous thromboembolism in Medicare patients undergoing total hip replacement or total knee replacement surgery. Curr Med Res Opin. 2011;27(2):423–429.
- , , . Relation between hospital orthopaedic specialisation and outcomes in patients aged 65 and older: retrospective analysis of US Medicare data. BMJ. 2010;340:c165.
- , , , . Thromboprophylaxis rates in US medical centers: success or failure? J Thromb Haemost. 2007;5(8):1610–1616.
- . Quality and safety performance in teaching hospitals. Am Surg. 2006;72(11):1051–1054; discussion 1061–1059, 1133–1048.
- , , , , . Improving and sustaining core measure performance through effective accountability of clinical microsystems in an academic medical center. Jt Comm J Qual Patient Saf. 2010;36(9):387–398.
- , , , , . Unilateral vs bilateral total knee arthroplasty risk factors increasing morbidity. J Arthroplasty. 2011;26(5):668–673.
- , , , , . Bilateral vs unilateral total knee arthroplasty: a patient‐based comparison of pain levels and recovery of ambulatory skills. J Arthroplasty. 2006;21(5):642–649.
Symptomatic venous thromboembolism (VTE) is a common complication following total knee arthroplasty (TKA).17 In fact, the high incidence of thrombosis after TKA has made this operation the principal condition used to study the efficacy of new anticoagulants, and it is a principal target of quality improvement oversight and measurement.8 The Agency for Healthcare Research and Quality (AHRQ) has developed a Patient Safety Indicator (PSI‐12) to assist hospitals, payers, and other stakeholders identify patients who experienced VTE after major surgery. The Centers for Medicare * Medicaid Services has deemed that because a VTE that develops after TKA is potentially preventable, it withholds the additional payment for this complication.9
Prior the introduction of new oral anticoagulants, most guidelines from North America recommended the use of postoperative low‐molecular‐weight heparin (LMWH), fondaparinux, or warfarin for at least 10 days after TKA.2, 10 However, there is some ongoing controversy about whether pharmacological prophylaxis is necessary after total joint replacement surgery, and whether it is effective in preventing pulmonary embolism.1114 In addition, there is controversy regarding the effectiveness of mechanical prophylaxis alone as a means of preventing VTE.2, 4, 14, 15
Pharmacological thromboprophylaxis using LMWH or fondaparinux calls for using a fixed‐dose that does not depend on the patient's weight or body mass index (BMI). This stands in sharp contrast to the consistent recommendation to use weight‐based dosing of LMWH/fondaparinux in patients who have acute VTE.16 The absence of any adjustment in the dose of thromboprophylaxis based on weight may be particularly important after TKA because the majority of these patients are obese or extremely obese,1719 making the dose of LMWH/fondaparinux potentially insufficient. It is noteworthy that surgeons who perform bariatric surgery currently recommend a higher dose of LMWH, usually 40 mg of enoxaparin every 12 hours.20, 21
We conducted this case‐control study to address 3 hypotheses. First, we hypothesized that use of standard pharmacologic thromboprophylaxis drugs is associated with a lower risk of acute VTE compared with mechanical prophylaxis alone. Second, we hypothesized that among patients given LMWH/fondaparinux, excessive obesity (BMI >35) is associated with a higher risk of developing VTE. Third, based on prior studies that identified immobilization as a risk factor for VTE, we hypothesized that delayed ambulation after TKA is associated with higher risk for VTE.
METHODS
Study Design
The University of California Davis, in partnership with the University HealthSystem Consortium (UHC), conducted a retrospective case‐control study of risk factors for acute symptomatic VTE within 90 days following TKA. Fifteen volunteer hospitals nationwide agreed to abstract medical records of up to 40 sampled cases or controls. Inclusion criteria were admission between October 1, 2008 and March 31, 2010; presence of a principal International Classification of Diseases, 9th Revision, Clinical Modification (ICD‐9‐CM) procedure code of 81.54 or 81.55; and age 40 years or more. Patients with a pregnancy‐related principal diagnosis (Major Diagnostic Category 14) or inferior vena cava interruption on or before the date of the first operating room procedure were excluded.
Cases were defined as having: a) one or more secondary diagnosis codes for acute VTE, as defined by AHRQ PSI‐12, version 4.1 (415.11, 415.19, 451.11, 451.19, 451.2, 451.81, 451.9, 453.40453.42, 453.8, 453.9), coupled with a present‐on‐admission flag of no (POA = N); or b) were readmitted with a principal diagnosis of VTE (same codes) within 90 days of the date of surgery. A probability sample of VTE cases (up to a maximum of 20), and 20 eligible TKA patients who did not develop acute VTE during the index hospitalization or within 90 days of surgery, were randomly selected for abstraction. Only 1 case flagged by the PSI algorithm was excluded because VTE could not be confirmed by abstraction.
Chart Abstraction
A chart abstraction tool was constructed and personnel at each site were taught how to obtain the desired information. Data elements included age, gender, height and weight, and type of TKA (unilateral, bilateral, or revision). BMI was calculated and categorized as severely obese (World Health Organization [WHO] class II or more, BMI 35) versus not severely obese (BMI <35), and as morbidly obese (WHO class III, BMI >40) or not morbidly obese (<40). Information about use of pharmacologic (LMWH, fondaparinux, or warfarin) and mechanical thromboprophylaxis was collected and classified as follows. First, the type of prophylaxis was categorized as: (1) LMWH (enoxaparin, dalteparin)/fondaparinux with or without mechanical prophylaxis (pneumatic compression devices, graduated compression stockings, or foot pump); (2) warfarin alone, with or without mechanical prophylaxis; (3) LMWH/fondaparinux and warfarin with or without mechanical pharmacologic prophylaxis; (4) mechanical prophylaxis alone (without any pharmacological prophylaxis but with or without aspirin); and (5) aspirin only, without any other pharmacologic or mechanical prophylaxis. Second, patients who received LMWH, fondaparinux, or warfarin pharmacologic prophylaxis were further classified as receiving FDA‐approved pharmacologic prophylaxis or other prophylaxis. The criteria for FDA‐approved pharmacologic prophylaxis were receipt of the recommended dose at the recommended starting time (per package insert), either before or after surgery, and continued administration until at least the day of hospital discharge, consistent with the 2008 American College of Chest Physicians (ACCP) guidelines for prevention of VTE in orthopedic patients.2 For warfarin, FDA‐approved dosing required a starting dose of 210 mg per day beginning either preoperatively or on the evening after surgery, and given daily thereafter, targeting an international normalized ratio (INR) of 2.03.0. No patient received aspirin alone for prophylaxis. In the analysis of risk factors for VTE, the effect of FDA‐approved pharmacologic prophylaxis was compared against other pharmacologic prophylaxis or mechanical prophylaxis alone. Time of ambulation was defined as early if it occurred on or before the second postoperative day, late if it occurred after the second postoperative day, or none if the patient did not ambulate before discharge.
Outcomes
The principal outcome was validated symptomatic objectively confirmed VTE, manifested as either pulmonary embolism (PE) or lower extremity deep vein thrombosis (DVT) or both. Patients who were diagnosed with VTE on the day of surgery or the day after surgery were not included in the principal analysis, reasoning that postoperative prophylaxis started 1224 hours after surgery is unlikely to prevent early VTE events. In a secondary sensitivity analysis, the effect of including these early postoperative VTE events on the estimated risk was determined.
Statistical Analysis
For continuous variables, bivariate comparisons were made with the use of Student t test. For categorical variables, we applied the chi‐square test and estimated unadjusted odds ratios (ORs) and Cornfield's 95% confidence intervals (CIs). We specifically analyzed whether gender, age, type of TKA, race/ethnicity, primary payer, severe or morbid obesity, postoperative ambulation, personal or family history of VTE, and comorbid conditions were associated with the development of any VTE, DVT, or PE.
Multivariable models were developed using logistic regression. In addition to age and gender, other terms included receipt of FDA‐approved pharmacologic prophylaxis, degree of obesity (severe if BMI >35, morbid if BMI >40), type of TKA (unilateral vs bilateral) and early versus late versus no ambulation. A patient was considered receiving FDA‐approved pharmacologic prophylaxis if the first postoperative dose and the last postoperative dose before discharge of LMWH, fondaparinux, or warfarin were given based on the recommended time and dose. Two‐way interactions between FDA‐approved pharmacologic prophylaxis and extent of obesity were tested, as well as interactions between LMWH/fondaparinux prophylaxis and extent of obesity. We adjusted all of the point estimates and confidence intervals for the correlation of data within each hospital by using the STRATA option in SAS; statistical analyses were performed using the SAS‐PC program, SAS 9.2 (SAS Institute, Inc, Cary, NC).
RESULTS
A total of 593 TKA records were abstracted by the 15 participating hospitals. All patients underwent TKA on the day of admission or the day after admission. A total of 16 cases (12 PE and 4 DVT) were diagnosed with VTE on the day of surgery, or the day after surgery, and were deemed nonpreventable in the multivariable analysis. There were 114 additional cases with VTE (44 PE, 68 DVT, 2 both) diagnosed 2 or more days after surgery, and 463 controls that had no VTE diagnosed by the index hospital within 90 days after surgery.
In bivariate analyses (Table 1), the mean age of cases was significantly greater for controls (65.5 10.4 vs 63.5 10.4, P < 0.05). More cases underwent bilateral simultaneous TKA compared with controls (23% vs 7%, P < 0.001). The mean BMI was marginally higher among VTE cases than among controls (34.6 8.0 vs 33.3 7.1, P = 0.07). Among cases with PE, a significantly greater percentage were morbidly obese than among controls (30% vs 16%, P value = 0.01), whereas there was not a difference for the DVT cases.
| Variable | VTE n = 130 (%) | No VTE n = 463 (%) | Total N = 593 (%) | |
|---|---|---|---|---|
| ||||
| Gender | Male | 45 (34) | 175 (38) | 220 (37) |
| Female | 85 | 288 | 373 | |
| Age (y)* | Mean | 65.5 | 63.5 | 63.9 |
| Standard deviation | 10.4 | 10.4 | 10.5 | |
| LOS (d)* | Mean | 6.1 | 3.4 | 4.0 |
| Standard deviation | 4.7 | 1.5 | 2.8 | |
| Type of TKR | Primary TKR‐unilateral | 100 (76) | 425 (92) | 525 (89) |
| Primary TKR‐bilateral | 29 (23) | 35 (7) | 64 (11) | |
| Revision for mechanical problem | 1 (1) | 3 (1) | 4 (1) | |
| Race | African American | 25 (19) | 80 (17) | 105 (18) |
| Asian | 4 (3) | 8 (2) | 12 (2) | |
| White | 91 (70) | 337 (73) | 428 (72) | |
| Hispanic | 7 (5) | 28 (6) | 35 (6) | |
| Unknown/others | 5 (4) | 18 (4) | 23 (4) | |
| Primary payer | Uninsured/self‐pay | 2 (1) | 2 (<1) | 4 (1) |
| Medicaid/managed care | 11 (8) | 40 (7) | 51 (9) | |
| Medicare/managed care | 66 (52) | 220 (47) | 286 (48) | |
| Private | 44 (34) | 156 (34) | 200 (34) | |
| US/state/local government | 1 (1) | 5 (1) | 6 (1) | |
| Others/unknown | 6 (4) | 40 (8) | 46 (8) | |
| BMI | Mean | 34.6 | 33.3 | 33.6 |
| Standard deviation | 8.0 | 7.1 | 7.3 | |
| Obesity | BMI 30 | 51 (38) | 172 (37) | 223 (38) |
| 30 to 35 | 29 (22) | 122 (26) | 151 (25) | |
| 35 to 40 | 21 (18) | 95 (20) | 116 (20) | |
| >40 | 29 (22) | 74 (16) | 103 (17) | |
| Ambulation | Taking steps with or without walker (day 1 or 2 after surgery) | 62 (47) | 340 (73) | 402 (77) |
| Taking steps with or without walker (day 3 or more after surgery) | 58 (45) | 106 (23) | 164 (28) | |
| Weight bearing only or no ambulation predischarge | 10 (8) | 17 (4) | 27 (5) | |
| No. of days from surgery to taking steps | Mean | 2.0 | 1.3 | 1.45 |
| Standard deviation | 2.3 | 0.7 | 1.4 | |
| Comorbidities/risk factors | Diabetes | 30 (22) | 99 (22) | 129 (22) |
| Hypertension | 90 (70) | 313 (67) | 403 (68) | |
| History of malignancy | 9 (8) | 54 (11) | 63 (11) | |
| Current neoplasm | 4 (3) | 9 (2) | 13 (2) | |
| Documented history/risk of bleeding or hematoma | 3 (2) | 7 (2) | 10 (2) | |
| History of any other surgery | 1 (1) | 1 (<1) | 2 (<1) | |
| Baseline inability to ambulate without assistance from staff | 0 | 3 (1) | 3 (<1) | |
| Trauma, head trauma, new fractures | 0 | 0 | 0 | |
| Current use of oral contraceptive or system estrogen | 0 | 8 (2) | 8 (1) | |
| Past stroke/CVA with residual weakness | 1 (1) | 7 (2) | 8 (1) | |
| Prior history of DVT | 6 (5) | 20 (4) | 26 (4) | |
| Prior history of PE | 2 (2) | 11 (2) | 13 (2) | |
| Family history of VTE | 0 | 5 (1) | 5 (1) | |
| Known thrombophilia | 0 | 1 (<1) | 1 (<1) | |
| None of the above | 33 (25) | 96 (21) | 129 (22) | |
Fewer VTE cases began ambulation on or before the second postoperative day compared with controls (47% vs 73%, P < 0.001). There was no difference in the number or types of comorbidities between cases and controls. All patients received at least 1 type of pharmacologic or mechanical prophylaxis within the first 24 hours after TKA. Although the difference was not statistically significant, controls had marginally higher odds of receiving FDA‐approved pharmacologic prophylaxis than cases (P = 0.07; Table 2). Table 3 presents the criterion that led to 242 cases not meeting the definition of FDA‐approved pharmacologic prophylaxis definition. Administering a suboptimal dose was the most common reason. Also, about half of the patients received only mechanical prophylaxis.
| Thromboprophylaxis | Thromboembolism | |
|---|---|---|
| VTE = Yes n = 130 (%) | VTE = No n = 463 (%) | |
| ||
| Pharmacologic prophylaxis | ||
| LMWH/fondaparinux | 61 (46) | 223 (48) |
| Warfarin alone (no LMWH)* | 44 (33) | 145 (31) |
| None | 25 (19) | 95 (20) |
| Nonpharmacologic prophylaxis | ||
| Intermittent pneumatic compression or graduated compression stockings/foot pump | 27 (21) | 93 (20) |
| FDA‐approved pharmacologic prophylaxis | ||
| LWMH/fondaparinux/warfarin prophylaxis | 67 (48) | 284 (61) |
| No FDA‐approved pharmacologic prophylaxis | ||
| Suboptimal pharmacologic or mechanical prophylaxis | 63 (52) | 179 (39) |
| Prophylaxis Status | Cases and Controls Who Did Not Receive FDA‐Approved Pharmacologic Prophylaxis (N = 242) | ||
|---|---|---|---|
| |||
| Received FDA‐approved pharmacologic prophylaxis but did not meet FDA‐approved proper dose, timing, and duration | Variable | n* | |
| 118 (49%) | Wrong dose | 87 | |
| Dose not within the recommended time window | 17 | ||
| Not continued at discharge | 50 | ||
| Received no pharmacologic prophylaxis (only mechanical) | 124 (51%) | ||
In the primary multivariable analysis (Table 4), neither age, gender, nor obesity (defined as BMI >30, BMI >35, or BMI >40) was a significant predictor of VTE. Undergoing bilateral simultaneous TKA versus unilateral TKA was associated with higher risk of VTE (OR = 4.2; 95% CI: 1.909.10), whereas early ambulation on or before the second postoperative day versus later (OR = 0.30; 95% CI: 0.100.90). Receiving FDA‐approved pharmacologic prophylaxis (right dose and time described in Table 4) versus any other prophylaxis regimen was adversely associated with VTE (OR = 0.50; 95% CI: 0.300.80, P = 0.01). There was no significant effect of receipt of FDA‐approved pharmacologic prophylaxis on being diagnosed with VTE among the cases that were severely or morbidly obese (P for interaction = 0.92). In a secondary analysis, the adjusted odds of being diagnosed with VTE were not significantly different for severely (OR = 0.9; CI 0.531.5) or morbidly obese (OR = 1.5; CI 0.802.80) patients.
| Variable | Odds Ratio | P Value |
|---|---|---|
| ||
| Older age | 1.02 (0.991.05) | 0.20 |
| Female gender | 1.70 (0.92.9) | 0.90 |
| BMI over 35 (vs 35 or less) | 0.9 (0.51.6) | 0.66 |
| Bilateral TKA (vs unilateral TKA) | 4.2 (1.99.1) | 0.0004 |
| Receiving FDA‐approved pharmacologic prophylaxis* vs mechanical | 0.5 (0.30.8) | 0.01 |
| Ambulation on or before second postoperative day | 0.3 (0.10.9) | 0.005 |
In a sensitivity analysis, we did not find any significant changes in the results when the 12 cases that developed VTE on the day of, or day after, TKA were included.
DISCUSSION
Venous thromboembolism is a frequent and potentially serious complication following TKA. In population‐based studies that report the number of patients who develop symptomatic acute VTE, the incidence is approximately 2.0%2.5%.3, 2224 Thromboprophylaxis reduces the risk of developing asymptomatic VTE by more than 60%, and pharmacologic prophylaxis using LMWH, fondaparinux, or warfarin alone is recommended by the ACCP and other organizations, with use of mechanical pneumatic compression, low‐dose unfractionated heparin, or aspirin as alternative options.25 Nevertheless, because extremely obese patients are not commonly enrolled in clinical trials and because current guidelines do not recommend any adjustment in the dose of LMWH or fondaparinux based on weight, we hypothesized that LMWH/fondaparinux would be significantly less effective in severely or morbidly obese patients. We also hypothesized that pharmacologic prophylaxis would be superior to mechanical prophylaxis alone,26 and that delayed ambulation after TKA would be associated with a higher risk of developing VTE.
Two widely cited clinical guidelines that pertain to prophylaxis of venous thromboembolism after total knee arthroplasty are the ACCP guidelines2 and the American Academy of Orthopedic Surgeons (AAOS) guidelines.27 Although we acknowledge that there are differences in these and other guidelines, recommendations and quality measures,13, 28, 29 the aim of the current study was not to evaluate or compare specific guidelines. We simply classified the thromboprophylaxis regimens into logical groups, the 2 most frequent being use of LMWH/fondaparinux (mechanical) and mechanical prophylaxis alone, and then performed the case‐control analysis. We followed FDA‐approved labeling to assess whether pharmacologic therapy was provided at the proper dose in the proper time period.
A principal finding of this study was that FDA‐approved pharmacologic prophylaxis using LMWH, fondaparinux, or warfarin, was associated with significantly lower odds of developing VTE compared to all other prophylaxis regimens.
When the effect of FDA‐approved pharmacologic prophylaxis was analyzed in severely or morbidly obese patients versus less obese patients, there was no significant difference in the risk of VTE across the BMI levels that were compared. Further, among the patients whose pharmacologic prophylaxis was LMWH or fondaparinux, severe or morbid obesity was not associated with significantly higher odds of developing VTE. Although it is logical to think that heavier patients require a larger dose of LMWH or fondaparinux, the findings of this study suggest that current FDA‐approved doses of these drugs are adequate even in morbidly obese patients.
Two other findings were noteworthy. First, early mobilization with active ambulation in the first 2 days after TKA was strongly associated with lower odds of developing VTE. This finding is similar to the report by Chandrasekaran et al that sitting out of bed or walking for at least 1530 minutes twice a day on the first postoperative day after TKA significantly reduced the incidence of thromboembolic complications (OR = 0.35; 95% CI: 0.11, 1.03, P = 0.03) compared those confined to bed.22, 30 In our study, the beneficial effect of mobilization disappeared if ambulation commenced on day 3 or later after surgery. This finding emphasizes the importance of early mobilization in prevention of VTE, as has been reported after total hip arthroplasty.31
The other important finding was that bilateral simultaneous TKA was strongly associated with VTE, with over 4‐fold greater odds of developing VTE compared with unilateral TKA. This effect did not disappear when we adjusted for obesity or the time to mobilization. This finding was not unexpected and is consistent with other reports in the literature showing a higher incidence of VTE after bilateral TKA compared with unilateral TKA.3235
This study has several limitations. We were unable to ascertain postdischarge VTE unless a patient was readmitted to the same hospital. It has been reported that between 35% to 45% of postoperative VTEs occur after hospital discharge,22, 23 and some of these complications are treated at other institutions or in the outpatient arena.36 Second, it has been shown that hospital volume and hospital specialization are associated with the incidence of VTE after TKA procedures.37, 38 To minimize the risk of confounding by hospital characteristics, we conditioned our analysis on hospital and adjusted for the clustering effect of hospitals. Third, all data were collected by individuals employed by and working at the participating hospitals, with no mechanism for duplicate abstraction to ensure reliability. Fourth, only teaching hospitals participated in this study. Adherence to guidelines and use of prophylaxis may be higher at teaching hospitals than at nonteaching hospitals.39 As a result, our sample may have less variation than the general population of TKA patients, limiting our power to detect associations between thromboprophylaxis and VTE. Finally, the case‐control design has inherent limitations in detecting causal associations, largely due to its susceptibility to unmeasured confounders and incorrect ascertainment of pre‐outcome exposures. To avoid the latter problem, we excluded VTEs that were diagnosed on the date of surgery, before prophylaxis is routinely started.
Despite these limitations, our findings suggest that there may be opportunities to prevent postoperative VTE, even among high‐risk patients at teaching hospitals that have achieved 100% compliance with The Joint Commission's Surgical Care Improvement Project process measures.40, 41 Specifically, delivery of FDA‐approved pharmacologic prophylaxis (vs mechanical prophylaxis alone) and early ambulation (vs later) may further decrease the risk of postoperative VTE. These hypotheses merit further testing in randomized controlled trials or cluster‐randomized quality improvement trials. Patients should be informed of the increased risk of VTE after bilateral TKA, although this additional risk may be outweighed by a reduction in the cumulative recovery time and a lower cumulative risk of developing a prosthetic joint infection.42, 43 Finally, AHRQ's PSI‐12 appears to be a useful tool for ascertaining VTE cases and identifying potential opportunities for improvement, when the present‐on‐admission status is also available.
- , , . Frequency and timing of clinical venous thromboembolism after major joint surgery. J Bone Joint Surg Br. 2006;88(3):386–391.
- , , , et al. Prevention of venous thromboembolism: American College of Chest Physicians Evidence‐Based Clinical Practice Guidelines (8th ed). Chest. 2008;133(6 suppl):381S–453S.
- , , . Venous thromboembolism associated with hip and knee replacement over a ten‐year period: a population‐based study. J Bone Joint Surg Br. 2005;87(12):1675–1680.
- , , , , . Venous thromboembolic disease after total hip and knee arthroplasty: current perspectives in a regulated environment. Instr Course Lect. 2008;57:637–661.
- , , , , , . The incidence of venous thromboembolism before and after total knee arthroplasty using 16‐row multidetector computed tomography. J Arthroplasty. 2011;26(8):1488–1493.
- , , , , . Incidence and time course of thromboembolic outcomes following total hip or knee arthroplasty. Arch Intern Med. 1998;158(14):1525–1531.
- , . The incidence of symptomatic venous thromboembolic events in orthopaedic surgery when using routine thromboprophylaxis. Vasa. 2008;37(4):353–357.
- , , , et al. How valid is the ICD‐9‐CM based AHRQ patient safety indicator for postoperative venous thromboembolism? Med Care. 2009;47(12):1237–1243.
- Department of Health and Human Services, Centers for Medicare 17(4):359–365.
- , , , . American Association of Orthopedic Surgeons and American College of Chest Physicians guidelines for venous thromboembolism prevention in hip and knee arthroplasty differ. What are the implications for clinicians and patients? Chest. 2009;135(2):1512–1520.
- , , , et al. Incidence of prosthetic joint infections after primary knee arthroplasty. J Arthroplasty. 2010;25(1):87–92.
- . Comparison of ACCP and AAOS guidelines for VTE prophylaxis after total hip and total knee arthroplasty. Orthopedics. 2009;32(12 suppl):74–78.
- , , . How can we reduce disagreement among guidelines for venous thromboembolism prevention? J Thromb Haemost. 2010;8(4):675–677.
- , , , . Mechanical thromboprophylaxis in critically ill patients: a systematic review and meta‐analysis. Am J Crit Care. 2006;15(4):402–410; quiz/discussion, 411–412.
- , , , , , . Antithrombotic therapy for venous thromboembolic disease: American College of Chest Physicians Evidence‐Based Clinical Practice Guidelines (8th ed). Chest. 2008;133(6 suppl):454S–545S.
- , , , et al. Venous thromboembolism prophylaxis in major orthopaedic surgery: a multicenter, prospective, observational study. Acta Orthop Traumatol Turc. 2008;42(5):322–327.
- , , , . Obesity and perioperative morbidity in total hip and total knee arthroplasty patients. J Arthroplasty. 2005;20(suppl 3):46–50.
- , . Risk factors for venous thromboembolism after total hip and knee replacement surgery. Curr Opin Pulm Med. 2002;8(5):365–371.
- , , , , . Comparison of two low‐molecular‐weight heparin dosing regimens for patients undergoing laparoscopic bariatric surgery. Surg Endosc. 2008;22(11):2392–2395.
- , , , , . Anti‐Xa levels in bariatric surgery patients receiving prophylactic enoxaparin. Obes Surg. 2008;18(2):162–166.
- , , , , , . Epidemiology of venous thromboembolism after lower limb arthroplasty: the FOTO study. J Thromb Haemost. 2007;5(12):2360–2367.
- , , . Incidence of symptomatic venous thromboembolism after different elective or urgent surgical procedures. Thromb Haemost. 2003;90(3):446–455.
- . The epidemiology of venous thromboembolism. Circulation.2003;107(23 suppl 1):I4–I8.
- , , , et al. Prevention of VTE in orthopedic surgery patients: Antithrombotic Therapy and Prevention of Thrombosis, 9th ed: American College of Chest Physicians Evidence‐Based Clinical Practice Guidelines. Chest. 2012;141(2 suppl):e278S–e325S.
- , , , et al. Prevention of deep‐vein thrombosis after total knee replacement: randomised comparison between a low‐molecular‐weight heparin and mechanical prophylaxis with a foot‐pump system. J Bone Joint Surg Br. 1999;81‐B(4):654–659.
- AAOS. Pulmonary Embolism After Knee Arthroscopy: Rare but Serious. American Academy of Orthopaedic Surgeons/American Association of Orthopaedic Surgeons Web site. Available at: http://www6aaosorg/news/pemr/releases/releasecfm?releasenum=9692011.
- , , , . American Association of Orthopedic Surgeons and American College of Chest Physicians guidelines for venous thromboembolism prevention in hip and knee arthroplasty differ: what are the implications for clinicians and patients? Chest. 2009;135(2):513–520.
- Premier—A supporting partnership organization of the Surgical Care Improvement Project (SCIP). Premier Inc Web site. Available at: http://www.premierinc.com/safety/topics/scip/. Accessed April 10, 2012.
- , , , . Early mobilization after total knee replacement reduces the incidence of deep venous thrombosis. Aust N Z J Surg. 2009;79(7–8):526–529.
- , , , , . Predictors of rehospitalization for symptomatic venous thromboembolism after total hip arthroplasty. N Engl J Med. 2000;343(24):1758–1764.
- , , , , , . Bilateral total knee replacement: staging and pulmonary embolism. J Bone Joint Surg Am. 2006;88(10):2146–2151.
- , . Incidence and natural history of deep‐vein thrombosis after total knee arthroplasty. A prospective, randomised study. J Bone Joint Surg Br. 2002;84(4):566–570.
- , , , , . In‐hospital complications and mortality of unilateral, bilateral, and revision TKA: based on an estimate of 4,159,661 discharges. Clin Orthop Relat Res. 2008;466(11):2617–2627.
- , , , . Safety of simultaneous bilateral total knee arthroplasty. A meta‐analysis. J Bone Joint Surg Am. 2007;89(6):1220–1226.
- , , , . Short‐term coagulation complications following total knee arthroplasty: a comparison of patient‐reported and surgeon‐verified complication rates. J Arthroplasty. 2011 Jan 20.
- , , , , . Clinical and cost outcomes of venous thromboembolism in Medicare patients undergoing total hip replacement or total knee replacement surgery. Curr Med Res Opin. 2011;27(2):423–429.
- , , . Relation between hospital orthopaedic specialisation and outcomes in patients aged 65 and older: retrospective analysis of US Medicare data. BMJ. 2010;340:c165.
- , , , . Thromboprophylaxis rates in US medical centers: success or failure? J Thromb Haemost. 2007;5(8):1610–1616.
- . Quality and safety performance in teaching hospitals. Am Surg. 2006;72(11):1051–1054; discussion 1061–1059, 1133–1048.
- , , , , . Improving and sustaining core measure performance through effective accountability of clinical microsystems in an academic medical center. Jt Comm J Qual Patient Saf. 2010;36(9):387–398.
- , , , , . Unilateral vs bilateral total knee arthroplasty risk factors increasing morbidity. J Arthroplasty. 2011;26(5):668–673.
- , , , , . Bilateral vs unilateral total knee arthroplasty: a patient‐based comparison of pain levels and recovery of ambulatory skills. J Arthroplasty. 2006;21(5):642–649.
Copyright © 2012 Society of Hospital Medicine