User login
Hospitalist Value in an ACO World
The accountable care organization (ACO) concept, elucidated in 2006 as the development of partnerships between hospitals and physicians to coordinate and deliver efficient care,1 seeks to remove existing barriers to improving value.2 Some advocate this concept as a promising payment model that could successfully realign the current payment system to financially reward improvements in quality and efficiency that bend the cost curve.3,4 Hospitalists fit well with this philosophy. As the fastest growing medical specialty in the history of American medicine, from a couple of thousand hospitalists in the mid-1990s to more than 50,000, the remarkable progression of hospitalists has ostensibly been driven partially by hospitals’ efforts to improve the value equation through enhanced efficiency in inpatient care. Importantly, hospitalists probably provide care for more than half of all hospitalized Medicare beneficiaries and increasingly patients in skilled nursing facilities (ie, SNFists).5 Along with primary care physicians, hospitalists thus represent an essential group of physicians needed to transform care delivery.
RAPID GROWTH AND THE FUTURE OF ACOs
When the Affordable Care Act (ACA) established the Medicare Shared Savings Program (MSSP), ACOs leaped from being an intellectual concept1,2 into a pragmatic health system strategy.3,4 Following Medicare, various private health insurance plans and some state Medicaid programs entered into contracts with groups of healthcare providers (hospitals, physicians, or health systems) to serve as ACOs for their insured enrollees.6 Leavitt Partners’ ACO tracking database showed that the number of ACOs increased from 157 in March of 2012 to 782 in December of 2015.7
Until recently, the federal government’s commitment to having 50% of total Medicare spending via value-based payment models by 2018, coupled with endorsement from state Medicaid programs and commercial insurers, demonstrated strong support for continuation of ACOs. Unexpectedly on August 15, 2017, the Centers for Medicare & Medicaid Services (CMS) outlined a plan in its proposed rulemaking to cancel the Episode Payment Models and the Cardiac Rehabilitation incentive payment model, which were scheduled to commence on January 1, 2018. CMS also plans to scale back the mandatory Comprehensive Care for Joint Replacement (CCJR) bundled payment model from 67 selected geographic areas to 34. Although this proposed rulemaking created some equipoise in the healthcare industry regarding the future of value-based reimbursement approaches, cost containment and improved efficiency remain as major focuses of the federal government’s healthcare effort. Notably, CMS offers providers that are newly excluded from the CCJR model the opportunity to voluntarily participate in the program and is expected to increase opportunities for providers to participate in voluntary rather than large-scale mandatory episode payment model initiatives. In 2018, the agency also plans to develop new voluntary bundled payment models that will meet criteria to be considered an advanced alternative payment model for Quality Payment Program purposes.
Importantly, the value-based reimbursement movement was well underway before ACA legislation. Through ACA health reform, value-based reimbursement efforts were expanded through ACOs, bundled payments, value-based purchasing, the CMS Innovation Center and other initiatives. With health systems having an overflowing plate of activities, a wait-and-see attitude might seem reasonable at first. However, being unprepared for the inevitable shift to value-based reimbursement and reduced fee-for-service revenue places an organization at risk. A successful ACO requires system-level transformation, especially cultural and structural changes to achieve clinical integration. Being embedded in health system delivery, hospitalists can help shape a team-oriented culture and foster success in value-based payment models. This requires hospitalists to take a more active role in assessing and striking a balance between high-quality, cost-efficient care and financial risk inherent in ACO models.
WHAT HOSPITALISTS NEED TO KNOW ABOUT ACOs
The key to hospitalists fulfilling their value creation potential and becoming enablers for ACO success lies in developing a thorough understanding of the aspects of an ACO that promote efficient and effective care, while accounting for financial factors. Fundamentally, the ACO concept combines provider payment and delivery system reforms. Specifically, the definition of an ACO contains 3 factors: (1) a local healthcare organization (eg, hospital or multispecialty group of physicians) with a related set of providers that (2) can be held accountable for the cost and quality of care delivered to (3) a defined population. While the notion of accountability is not new, the locus of accountability is changed in the ACO model—emphasizing accountability at the level of actual care delivery with documentation of quality and cost outcomes. The ACO approach aims to address multiple, frequent, and recurring problems, including lack of financial incentives to improve quality and reduce cost, as well as the negative consequences of a pay-for-volume system—uncoordinated and fragmented care, overutilization of unnecessary tests and treatments, and poor patient experience all manifested as unwarranted geographic variation in practice patterns, clinical outcomes, and health spending. Participants in an ACO are rewarded financially if they can slow the growth of their patients’ healthcare costs while maintaining or improving the quality of care delivered. To succeed in this ACO world, hospitalists must assume greater prudence in the use of healthcare services while improving (or at a minimum, maintaining) patient outcomes, thus excising avoidable waste across the continuum of care.
More than half of ACOs include a hospital.8 However, whether hospital-led ACOs possess an advantage remains to be elucidated. Early reports indicated that physician-led ACOs saved more money.9,10 However, others argue that hospitals11 are better capitalized, have greater capacity for data sharing, and possess economies of scale that allow them to invest in more advanced technology, such as predictive modeling and/or simulation software. Such analytics can identify high-cost patients (ie, multiple comorbidities), super utilizers and populations lacking care, allowing ACOs to implement preventive measures to reduce unnecessary utilization. Recently released CMS MSSP 2016 performance data12 showed that nearly half (45%) of physician-only ACOs earned shared savings, whereas 23% of ACOs that include hospitals earned shared savings. However, among all the ACOs that achieved savings, ACO entities that include hospitals generated the highest amount of shared savings (eg, Advocate, Hackensack Alliance, Cleveland Clinic, and AMITA Health). Notably, hospital-led ACOs tend to have much larger beneficiary populations than physician-led ACOs, which may create a scenario of higher risk but higher potential reward.
HOW HOSPITALISTS CONTRIBUTE VALUE TO ACO SUCCESS
The emphasis on value over volume inherent in the development of ACOs occurs through employing care strategies implemented through changes in policies, and eventual structural and cultural changes. These changes require participating organizations to possess certain key competencies, including the following: 1) leadership that facilitates change; 2) organizational culture of teamwork; 3) collaborative relationships among providers; 4) information technology infrastructure for population management and care coordination; 5) infrastructure for monitoring, managing, and reporting quality; 6) ability to manage financial risk; 7) ability to receive and distribute payments or savings; and 8) resources for patient education and support.2,3,13-16 Table 1 summarizes the broad range of roles that hospitalists can serve in delivering care to ACO populations.17-19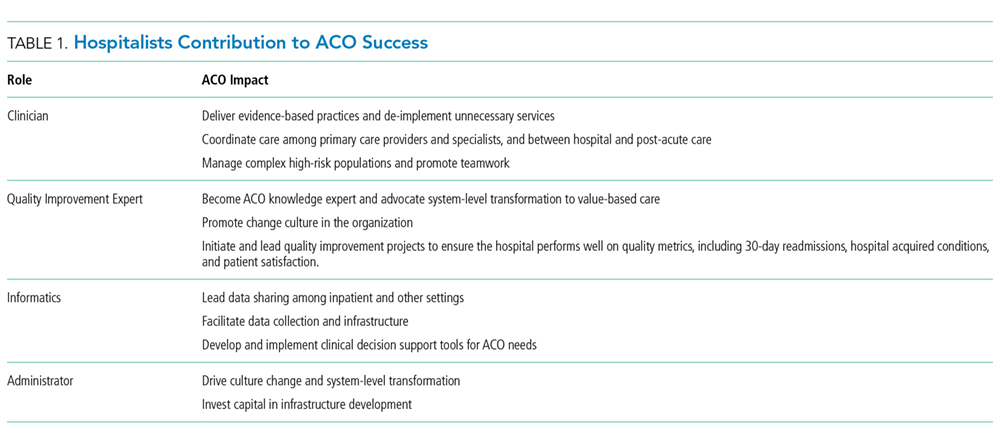
Hospitalists’ active pursuit of nonclinical training and selection for administrative positions demonstrate their proclivity to provide these competencies. In addition to full-time clinician hospitalists, who can directly influence the delivery of high-value care to patients, hospitalists serve many other roles in hospitals and each can contribute differently based on their specialized expertise. Examples include the success of the Society of Hospital Medicine’s Leadership Academy; the acknowledged expertise of hospitalists in quality improvement (QI), informatics, teamwork, patient experience, care coordination and utilization; and advancement of hospitalists to senior leadership positions (eg, CQO, CMO, CEO). Given that nearly a third of healthcare expenditures are for hospital care,20 hospitalists are in a unique position to foster ACO competencies while impacting the quality of care episodes associated with an index hospital stay.
Importantly, hospitalists cannot act as gatekeepers to restrict care. Managed care organizations and health maintenance organizations use of this approach in the 1990s to limit access to services in order to reduce costs led to unacceptable outcomes and numerous malpractice lawsuits. ACOs should aspire to deliver the most cost-effective high-quality care, and their performance should be monitored to ensure that they provide recommended services and timely access. The Medicare ACO contract holds the provider accountable for meeting 34 different quality measures (Supplemental Table 1), and hospitalists can influence outcomes for the majority. Especially through hospital and health system QI initiatives, hospitalists can directly impact and share accountability for measures ranging from care coordination to implementation of evidence-based care (eg, ACE inhibitors and beta blockers for heart failure) to patient and family caregiver experience.
Aligned with Medicare ACO quality measures, 5 high-impact target areas were identified for ACOs21: (1) Prevention and wellness; (2) Chronic conditions/care management; (3) Reduced hospitalizations; (4) Care transitions across the fragmented system; and (5) Multispecialty care coordination of complex patients. One essential element of a successful ACO is the ability to implement evidence-based medical guidelines and/or practices across the continuum of care for selected targeted initiatives. Optimizing care coordination/continuum requires team-based care, and hospitalists already routinely collaborate with nurses, social workers, case managers, pharmacists, and other stakeholders such as dieticians and physical therapists on inpatient care. Hospitalists are also experienced in facilitating communication and improving integration and coordination efficiencies among primary care providers and specialists, and between hospital care and post-acute care, as they coordinate post-hospital care and follow-up. This provides an opportunity to lead health system care coordination efforts, especially for complex and/or high-risk patients.22,23 CMS MSSP 2016 performance data12 showed that ACOs achieving shared savings had a decline in inpatient expenditures and utilization across several facility types (hospital, SNF, rehabilitation, long term). Postacute care management is critical to earning shared savings; SNF and Home Health expenditures fell by 18.3% and 9.7%, respectively, on average. We believe that hospitalists can have more influence over these cost areas by influencing treatment of hospitalized patients in a timely manner, discharge coordination, and selection of appropriate disposition locations. Hospitalists also play an integral role in ensuring the hospital performs well on quality metrics, including 30-day readmissions, hospital acquired conditions, and patient satisfaction. Examples below document the effectiveness of hospitalists in this new ACO era.
Care Transitions/Coordination
Before the Hospital Readmission Reduction Program (HRRP) delineated in the ACA, hospitalists developed Project BOOST (Better Outcomes by Optimizing Care Transitions) to improve hospital discharge care transition. The evidence-based foundation of this project led CMS to list Project BOOST as an example program that can reduce readmissions.24 Through the dissemination and mentored implementation of Project BOOST to over 200 hospitals across the United States,25 hospitalists contributed to the marked reduction in hospital readmission occurring since 2010.26 Although hospital medicine began as a practice specific to the hospital setting, hospitalists’ skills generated growing demand for them in postacute facilities. SNF residents commonly come from hospitals postdischarge and suffer from multiple comorbidities and limitations in activities of daily living. Not surprisingly, SNF residents experience high rates of rehospitalizations.27 Hospitalists can serve as a bridge between hospitals and SNFs and optimize this transition process to yield improved outcomes. Industry experts endorse this approach.28 A recent study demonstrated a significant reduction in readmissions in 1 SNF (32.3% to 16.1%, odds ratio = 0.403, P < .001), by having a hospitalist-led team follow patients discharged from the hospital.29
Chronic Conditions Management/High-Risk Patients
Interest in patients with multiple chronic comorbidities and social issues intensifies as healthcare systems focus limited resources on these high-risk patients to prevent the unnecessary use of costly services.30,31 As health systems assume financial risk for health outcomes and costs of designated patient groups, they undertake efforts to understand the population they serve. Such efforts aim to identify patients with established high utilization patterns (or those at risk for high utilization). This knowledge enables targeted actions to provide access, treatment, and preventive interventions to avoid unneeded emergency and hospital services. Hospitalists commonly care for these patients and are positioned to lead the implementation of patient risk assessment and stratification, develop patient-centered care models across care settings, and act as a liaison with primary care. For frail elderly and seriously ill patients, the integration of hospitalists into palliative care provides several opportunities for improving the quality of care at the end of life.32 As patients and their family caregivers commonly do not address goals of care until faced with a life-threatening condition in the hospital, hospitalists represent ideal primary palliative care physicians to initiate these conversations.33 A hospitalist communicating with a patient and/or their family caregiver about alleviating symptoms and clarifying patients’ preferences for care often yields decreases in ineffective healthcare utilization and better patient outcomes. The hospitalists’ ability to communicate with other providers within the hospital setting also allows them to better coordinate interdisciplinary care and prevent unnecessary and ineffective treatments and procedures.
De-Implementation/Waste Reduction
The largest inefficiencies in healthcare noted in the National Academy of Medicine report, Demanding Value from Our Health Care (2012), are failure to deliver known beneficial therapies or providing unnecessary or nonevidenced based services that do not improve outcomes, but come with associated risk and cost.34 “De-implementation” of unnecessary diagnostic tests or ineffective or even harmful treatments by hospitalists represents a significant opportunity to reduce costs while maintaining or even improving the quality of care. The Society of Hospital Medicine joined the Choosing Wisely® campaign and made 5 recommendations in adult care as an explicit starting point for eliminating waste in the hospital in 2013.35 Since then, hospitalists have participated in multiple successful efforts to address overutilization of care; some published results include the following:
- decreased frequency of unnecessary common labs through a multifaceted hospitalist QI intervention;36
- reduced length of stay and cost by appropriate use of telemetry;37 and
- reduced unnecessary radiology testing by providing physicians with individualized audit and feedback reports.38
CONCLUSION
Hundreds of ACOs now exist across the US, formed by a variety of providers including hospitals, physician groups, and integrated delivery systems. Provider groups range in size from primary care-focused physician groups with a handful of offices to large, multistate integrated delivery systems with dozens of hospitals and hundreds of office locations. Evaluations of ACO outcomes reveal mixed results.9,39-53 Admittedly, assessments attempting to compare the magnitude of savings across ACO models are difficult given the variation in size, variability in specific efforts to influence utilization, and substantial turnover among participating beneficiaries.54 Nonetheless, a newly published Office of Inspector General report55 showed that most Medicare ACOs reduced spending and improved care quality (82% of the individual quality measures) over the first 3 years of the program, and savings increased with duration of an ACO program. The report also noted that considerable time and managerial resources are required to implement changes to improve quality and lower costs. While the political terrain ostensibly supports value-based care and the need to diminish the proportion of our nation’s gross domestic product dedicated to healthcare, health systems are navigating an environment that still largely rewards volume. Hospitalists may be ideal facilitators for this transitional period as they possess the clinical experience caring for complex patients with multiple comorbidities and quality improvement skills to lead efforts in this new ACO era.
Disclosures
The authors have nothing to disclose.
1. Fisher ES, Staiger DO, Bynum JP, Gottlieb DJ. Creating accountable care organizations: the extended hospital medical staff. Health Aff(Project Hope). 2007;26(1):w44-w57. PubMed
2. Fisher ES, McClellan MB, Bertko J, et al. Fostering accountable health care: moving forward in medicare. Health Aff(Project Hope). 2009;28(2):w219-w231. PubMed
3. McClellan M, McKethan AN, Lewis JL, Roski J, Fisher ES. A national strategy to put accountable care into practice. Health Aff(Project Hope). 2010;29(5):982-990. PubMed
4. Berwick DM. Making good on ACOs’ promise--the final rule for the Medicare shared savings program. N Engl J Med. 2011;365(19):1753-1756. PubMed
5. Kuo YF, Sharma G, Freeman JL, Goodwin JS. Growth in the care of older patients by hospitalists in the United States. N Engl J Med. 2009;360(11):1102-1112. PubMed
6. Kennedy K. Health Care Providers Embracing Cost-saving Groups. USA Today, July 24, 2011.
7. Leavitt Partners. Available at http://leavittpartners.com, April 2016.
8. Colla CH, Lewis VA, Tierney E, Muhlestein DB. Hospitals Participating In ACOs Tend To Be Large And Urban, Allowing Access To Capital And Data. Health Aff(Millwood). 2016;35(3):431-439. PubMed
9. McWilliams JM, Hatfield LA, Chernew ME, Landon BE, Schwartz AL. Early Performance of Accountable Care Organizations in Medicare. N Engl J Med. 2016;374(24):2357-2366. PubMed
10. Muhlestein D, Saunders R, McClellan M. Medicare Accountable Care Organization Results For 2015: The Journey To Better Quality And Lower Costs Continues. In. Health Affairs Blog. Bethesda, MD 2016.
11. Chernew ME. New Health Care Symposium: Building An ACO---What Services Do You Need And How Are Physicians Impacted? In Health Affairs Blog. Bethesda, MD 2016.
12. Centers for Medicare & Medicaid Services. Performance Year 2016 Quality Performance and Financial Reconciliation Results for ACOs with 2012-2016 Start Dates. Available at https://strategichealthcare.net/wp-content/uploads/2017/10/CMS-Slides-on-ACOs.pdf. 2017.
13. Shortell SM, Casalino LP. Implementing qualifications criteria and technical assistance for accountable care organizations. JAMA. 2010;303(17):1747-1748. PubMed
14. Shortell SM, Casalino LP, Fisher ES. How the center for Medicare and Medicaid innovation should test accountable care organizations. Health Aff (Project Hope). 2010;29(7):1293-1298. PubMed
15. Medicare Payment Advisory Commission. Accountable Care Organizations Payment Systems October 2015. Available at http://www.medpac.gov/documents/payment-basics/accountable-care-organization-payment-systems-15.pdf?sfvrsn=0.
16. American Hospital Association. 2010 Committee on Research. AHA Research Synthesis Report: Accountable Care Organization.
17. D’Aunno T, Broffman L, Sparer M, Kumar SR. Factors That Distinguish High-Performing Accountable Care Organizations in the Medicare Shared Savings Program. Health Serv. Res. 2016. PubMed
18. Peiris D, Phipps-Taylor MC, Stachowski CA, et al. ACOs Holding Commercial Contracts Are Larger And More Efficient Than Noncommercial ACOs. Health Aff (Project Hope). 2016;35(10):1849-1856. PubMed
19. Ouayogode MH, Colla CH, Lewis VA. Determinants of success in Shared Savings Programs: An analysis of ACO and market characteristics. Healthcare (Amsterdam, Netherlands). 2017;5(1-2):53-61. PubMed
20. National Center for Health Statistics. Health, United States, 2016: With Chartbook on Long-term Trends in Health. In: Hyattsville, MD.2017. PubMed
21. Gbemudu JN. Larson BK, Van Citters AD, Kreindler SA, Nelson EC, Shortell SM, Fisher ES. Norton Healthcare: A Strong Payer–Provider Partnership for the Journey to Accountable Care. January 2012. Available at http://www.commonwealthfund.org/~/media/files/publications/case-study/2012/jan/1574_gbemudu_norton_case-study_01_12_2012.pdf.
22. O’Leary KJ, Haviley C, Slade ME, Shah HM, Lee J, Williams MV. Improving teamwork: impact of structured interdisciplinary rounds on a hospitalist unit. J Hosp Med. 2011;6(2):88-93. PubMed
23. Hansen LO, Greenwald JL, Budnitz T, et al. Project BOOST: effectiveness of a multihospital effort to reduce rehospitalization. J. Hosp. Med.. 2013;8(8):421-427. PubMed
24. Centers for Medicare and Medicaid Services. Solicitation for Applications: Community-based Care Transitions Program. Available at https://innovation.cms.gov/Files/Migrated-Medicare-Demonstration-x/CCTP-Solicitation.pdf. September 7, 2017.
25. Li J, Hinami K, Hansen LO, Maynard G, Budnitz T, Williams MV. The physician mentored implementation model: a promising quality improvement framework for health care change. Acad Med. 2015;90(3):303-310. PubMed
26. Williams MV, Li J, Hansen LO, et al. Project BOOST implementation: lessons learned. South Med J. 2014;107(7):455-465. PubMed
27. Ouslander JG, Lamb G, Perloe M, et al. Potentially avoidable hospitalizations of nursing home residents: frequency, causes, and costs: [see editorial comments by Drs. Jean F. Wyman and William R. Hazzard, pp 760-761]. J Am Geriatr Soc. 2010;58(4):627-635. PubMed
28. Pittman D. SNFs: New Turf for Hospitalists? 2013. Available at https://www.medpagetoday.com/hospitalbasedmedicine/hospitalists/39401.
29. Petigara S, Krishnamurthy M, Livert D. Necessity is the mother of invention: an innovative hospitalist-resident initiative for improving quality and reducing readmissions from skilled nursing facilities. J Community Hosp Intern Med Perspect. 2017;7(2):66-69. PubMed
30. Silow-Carroll S, Edwards J. Early Adopters of the Accountable Care Model: A Field Report on Improvements in Health Care Delivery. New York, NY: The Commonwealth Fund;March 2013.
31. Hasselman D. Super-Utilizer Summit: Common Themes from Innovative Complex Care Management Programs. Hamilton, NJ: Center for Health Care Strategies;October 2013.
32. Wald HL, Glasheen JJ, Guerrasio J, Youngwerth JM, Cumbler EU. Evaluation of a hospitalist-run acute care for the elderly service. J Hosp Med. 2011;6(6):313-321. PubMed
33. Quill TE, Abernethy AP. Generalist plus specialist palliative care--creating a more sustainable model. N Engl J Med. 2013;368(13):1173-1175. PubMed
34. O’Kane M, Buto K, Alteras T, et. al. Demanding Value from Our Health Care: Motivating Patient Action to Reduce Waste in Health Care. Institute of Medicine of the National Academies. July 2012. https://nam.edu/wp-content/uploads/2015/06/VSRT-DemandingValue.pdf. Accessed Accessed June 18, 2017.
35. Bulger J, Nickel W, Messler J, et al. Choosing wisely in adult hospital medicine: five opportunities for improved healthcare value. J Hosp Med. 2013;8(9):486-492. PubMed
36. Corson AH, Fan VS, White T, et al. A multifaceted hospitalist quality improvement intervention: Decreased frequency of common labs. J Hosp Med. 2015;10(6):390-395. PubMed
37. Svec D, Ahuja N, Evans KH, et al. Hospitalist intervention for appropriate use of telemetry reduces length of stay and cost. J Hosp Med. 2015;10(9):627-632. PubMed
38. Neeman N, Quinn K, Soni K, Mourad M, Sehgal NL. Reducing radiology use on an inpatient medical service: choosing wisely. JAMA Intern Med. 2012;172(20):1606-1608. PubMed
39. Abrams M, Nuzum R, Zezza M, Ryan J, Kiszla J, Guterman S. The Affordable Care Act’s Payment and Delivery System Reforms: A Progress Report at Five Years. Bipartisan Policy Center, May 2015. Available at http://www.commonwealthfund.org/publications/issue-briefs/2015/may/aca-payment-and-delivery-system-reforms-at-5-years.
40. Kocot SL, White R, Katikaneni P, McClellan MB. A More Complete Picture of Pioneer ACO Results. The Brookings Institution, October 13, 2014. Available at http://www.brookings.edu/blogs/up-front/posts/2014/10/09-pioneer-aco-results-mcclellan/#recent_rr/
41. Blumenthal D, Abrams M, Nuzum R. The Affordable Care Act at 5 Years. N Engl J Med. 2015;372(25):2451-2458. PubMed
42. Colla CH, Lewis VA, Kao LS, O’Malley AJ, Chang CH, Fisher ES. Association Between Medicare Accountable Care Organization Implementation and Spending Among Clinically Vulnerable Beneficiaries. JAMA Intern Med. 2016;176(8):1167-1175. PubMed
43. Epstein AM, Jha AK, Orav EJ, et al. Analysis of early accountable care organizations defines patient, structural, cost, and quality-of-care characteristics. Health Aff (Project Hope). 2014;33(1):95-102. PubMed
44. Fullerton CA, Henke RM, Crable E, Hohlbauch A, Cummings N. The Impact Of Medicare ACOs On Improving Integration And Coordination Of Physical And Behavioral Health Care. Health Aff (Project Hope). 2016;35(7):1257-1265. PubMed
45. Herrel LA, Norton EC, Hawken SR, Ye Z, Hollenbeck BK, Miller DC. Early impact of Medicare accountable care organizations on cancer surgery outcomes. Cancer. 2016;122(17):2739-2746. PubMed
46. McConnell KJ, Renfro S, Chan BK, et al. Early Performance in Medicaid Accountable Care Organizations: A Comparison of Oregon and Colorado. JAMA Intern Med. 2017;177(4):538-545. PubMed
47. Nyweide DJ, Lee W, Cuerdon TT, et al. Association of Pioneer Accountable Care Organizations vs traditional Medicare fee for service with spending, utilization, and patient experience. JAMA. 2015;313(21):2152-2161. PubMed
48. Rajkumar R, Press MJ, Conway PH. The CMS Innovation Center--a five-year self-assessment. N Engl J Med. 2015;372(21):1981-1983. PubMed
49. Rose S, Zaslavsky AM, McWilliams JM. Variation In Accountable Care Organization Spending And Sensitivity To Risk Adjustment: Implications For Benchmarking. Health affairs (Project Hope). 2016;35(3):440-448. PubMed
50. Shortell SM, Poon BY, Ramsay PP, et al. A Multilevel Analysis of Patient Engagement and Patient-Reported Outcomes in Primary Care Practices of Accountable Care Organizations. J Gen Intern Med. 2017;32(6):640-647. PubMed
51. Winblad U, Mor V, McHugh JP, Rahman M. ACO-Affiliated Hospitals Reduced Rehospitalizations From Skilled Nursing Facilities Faster Than Other Hospitals. Health Aff (Project Hope). 2017;36(1):67-73. PubMed
52. Zhang Y, Caines KJ, Powers CA. Evaluating the Effects of Pioneer Accountable Care Organizations on Medicare Part D Drug Spending and Utilization. Med Care. 2017;55(5):470-475. PubMed
53. Muhlestein D. Medicare ACOs: Mixed Initial Results and Cautious Optimism. Health Affairs Blog, February 4, 2014. Available at http://healthaffairs.org/blog/2014/02/04/medicare-acos-mixed-initial-results-and-cautious-optimism/.
54. Hsu J, Price M, Vogeli C, et al. Bending The Spending Curve By Altering Care Delivery Patterns: The Role Of Care Management Within A Pioneer ACO. Health Aff (Project Hope). 2017;36(5):876-884. PubMed
55. Medicare Shared Savings Program Accountable Care Organizations Have Shown Potential For Reducing Spending And Improving Quality. Office of Inspector General;August 2017.
The accountable care organization (ACO) concept, elucidated in 2006 as the development of partnerships between hospitals and physicians to coordinate and deliver efficient care,1 seeks to remove existing barriers to improving value.2 Some advocate this concept as a promising payment model that could successfully realign the current payment system to financially reward improvements in quality and efficiency that bend the cost curve.3,4 Hospitalists fit well with this philosophy. As the fastest growing medical specialty in the history of American medicine, from a couple of thousand hospitalists in the mid-1990s to more than 50,000, the remarkable progression of hospitalists has ostensibly been driven partially by hospitals’ efforts to improve the value equation through enhanced efficiency in inpatient care. Importantly, hospitalists probably provide care for more than half of all hospitalized Medicare beneficiaries and increasingly patients in skilled nursing facilities (ie, SNFists).5 Along with primary care physicians, hospitalists thus represent an essential group of physicians needed to transform care delivery.
RAPID GROWTH AND THE FUTURE OF ACOs
When the Affordable Care Act (ACA) established the Medicare Shared Savings Program (MSSP), ACOs leaped from being an intellectual concept1,2 into a pragmatic health system strategy.3,4 Following Medicare, various private health insurance plans and some state Medicaid programs entered into contracts with groups of healthcare providers (hospitals, physicians, or health systems) to serve as ACOs for their insured enrollees.6 Leavitt Partners’ ACO tracking database showed that the number of ACOs increased from 157 in March of 2012 to 782 in December of 2015.7
Until recently, the federal government’s commitment to having 50% of total Medicare spending via value-based payment models by 2018, coupled with endorsement from state Medicaid programs and commercial insurers, demonstrated strong support for continuation of ACOs. Unexpectedly on August 15, 2017, the Centers for Medicare & Medicaid Services (CMS) outlined a plan in its proposed rulemaking to cancel the Episode Payment Models and the Cardiac Rehabilitation incentive payment model, which were scheduled to commence on January 1, 2018. CMS also plans to scale back the mandatory Comprehensive Care for Joint Replacement (CCJR) bundled payment model from 67 selected geographic areas to 34. Although this proposed rulemaking created some equipoise in the healthcare industry regarding the future of value-based reimbursement approaches, cost containment and improved efficiency remain as major focuses of the federal government’s healthcare effort. Notably, CMS offers providers that are newly excluded from the CCJR model the opportunity to voluntarily participate in the program and is expected to increase opportunities for providers to participate in voluntary rather than large-scale mandatory episode payment model initiatives. In 2018, the agency also plans to develop new voluntary bundled payment models that will meet criteria to be considered an advanced alternative payment model for Quality Payment Program purposes.
Importantly, the value-based reimbursement movement was well underway before ACA legislation. Through ACA health reform, value-based reimbursement efforts were expanded through ACOs, bundled payments, value-based purchasing, the CMS Innovation Center and other initiatives. With health systems having an overflowing plate of activities, a wait-and-see attitude might seem reasonable at first. However, being unprepared for the inevitable shift to value-based reimbursement and reduced fee-for-service revenue places an organization at risk. A successful ACO requires system-level transformation, especially cultural and structural changes to achieve clinical integration. Being embedded in health system delivery, hospitalists can help shape a team-oriented culture and foster success in value-based payment models. This requires hospitalists to take a more active role in assessing and striking a balance between high-quality, cost-efficient care and financial risk inherent in ACO models.
WHAT HOSPITALISTS NEED TO KNOW ABOUT ACOs
The key to hospitalists fulfilling their value creation potential and becoming enablers for ACO success lies in developing a thorough understanding of the aspects of an ACO that promote efficient and effective care, while accounting for financial factors. Fundamentally, the ACO concept combines provider payment and delivery system reforms. Specifically, the definition of an ACO contains 3 factors: (1) a local healthcare organization (eg, hospital or multispecialty group of physicians) with a related set of providers that (2) can be held accountable for the cost and quality of care delivered to (3) a defined population. While the notion of accountability is not new, the locus of accountability is changed in the ACO model—emphasizing accountability at the level of actual care delivery with documentation of quality and cost outcomes. The ACO approach aims to address multiple, frequent, and recurring problems, including lack of financial incentives to improve quality and reduce cost, as well as the negative consequences of a pay-for-volume system—uncoordinated and fragmented care, overutilization of unnecessary tests and treatments, and poor patient experience all manifested as unwarranted geographic variation in practice patterns, clinical outcomes, and health spending. Participants in an ACO are rewarded financially if they can slow the growth of their patients’ healthcare costs while maintaining or improving the quality of care delivered. To succeed in this ACO world, hospitalists must assume greater prudence in the use of healthcare services while improving (or at a minimum, maintaining) patient outcomes, thus excising avoidable waste across the continuum of care.
More than half of ACOs include a hospital.8 However, whether hospital-led ACOs possess an advantage remains to be elucidated. Early reports indicated that physician-led ACOs saved more money.9,10 However, others argue that hospitals11 are better capitalized, have greater capacity for data sharing, and possess economies of scale that allow them to invest in more advanced technology, such as predictive modeling and/or simulation software. Such analytics can identify high-cost patients (ie, multiple comorbidities), super utilizers and populations lacking care, allowing ACOs to implement preventive measures to reduce unnecessary utilization. Recently released CMS MSSP 2016 performance data12 showed that nearly half (45%) of physician-only ACOs earned shared savings, whereas 23% of ACOs that include hospitals earned shared savings. However, among all the ACOs that achieved savings, ACO entities that include hospitals generated the highest amount of shared savings (eg, Advocate, Hackensack Alliance, Cleveland Clinic, and AMITA Health). Notably, hospital-led ACOs tend to have much larger beneficiary populations than physician-led ACOs, which may create a scenario of higher risk but higher potential reward.
HOW HOSPITALISTS CONTRIBUTE VALUE TO ACO SUCCESS
The emphasis on value over volume inherent in the development of ACOs occurs through employing care strategies implemented through changes in policies, and eventual structural and cultural changes. These changes require participating organizations to possess certain key competencies, including the following: 1) leadership that facilitates change; 2) organizational culture of teamwork; 3) collaborative relationships among providers; 4) information technology infrastructure for population management and care coordination; 5) infrastructure for monitoring, managing, and reporting quality; 6) ability to manage financial risk; 7) ability to receive and distribute payments or savings; and 8) resources for patient education and support.2,3,13-16 Table 1 summarizes the broad range of roles that hospitalists can serve in delivering care to ACO populations.17-19
Hospitalists’ active pursuit of nonclinical training and selection for administrative positions demonstrate their proclivity to provide these competencies. In addition to full-time clinician hospitalists, who can directly influence the delivery of high-value care to patients, hospitalists serve many other roles in hospitals and each can contribute differently based on their specialized expertise. Examples include the success of the Society of Hospital Medicine’s Leadership Academy; the acknowledged expertise of hospitalists in quality improvement (QI), informatics, teamwork, patient experience, care coordination and utilization; and advancement of hospitalists to senior leadership positions (eg, CQO, CMO, CEO). Given that nearly a third of healthcare expenditures are for hospital care,20 hospitalists are in a unique position to foster ACO competencies while impacting the quality of care episodes associated with an index hospital stay.
Importantly, hospitalists cannot act as gatekeepers to restrict care. Managed care organizations and health maintenance organizations use of this approach in the 1990s to limit access to services in order to reduce costs led to unacceptable outcomes and numerous malpractice lawsuits. ACOs should aspire to deliver the most cost-effective high-quality care, and their performance should be monitored to ensure that they provide recommended services and timely access. The Medicare ACO contract holds the provider accountable for meeting 34 different quality measures (Supplemental Table 1), and hospitalists can influence outcomes for the majority. Especially through hospital and health system QI initiatives, hospitalists can directly impact and share accountability for measures ranging from care coordination to implementation of evidence-based care (eg, ACE inhibitors and beta blockers for heart failure) to patient and family caregiver experience.
Aligned with Medicare ACO quality measures, 5 high-impact target areas were identified for ACOs21: (1) Prevention and wellness; (2) Chronic conditions/care management; (3) Reduced hospitalizations; (4) Care transitions across the fragmented system; and (5) Multispecialty care coordination of complex patients. One essential element of a successful ACO is the ability to implement evidence-based medical guidelines and/or practices across the continuum of care for selected targeted initiatives. Optimizing care coordination/continuum requires team-based care, and hospitalists already routinely collaborate with nurses, social workers, case managers, pharmacists, and other stakeholders such as dieticians and physical therapists on inpatient care. Hospitalists are also experienced in facilitating communication and improving integration and coordination efficiencies among primary care providers and specialists, and between hospital care and post-acute care, as they coordinate post-hospital care and follow-up. This provides an opportunity to lead health system care coordination efforts, especially for complex and/or high-risk patients.22,23 CMS MSSP 2016 performance data12 showed that ACOs achieving shared savings had a decline in inpatient expenditures and utilization across several facility types (hospital, SNF, rehabilitation, long term). Postacute care management is critical to earning shared savings; SNF and Home Health expenditures fell by 18.3% and 9.7%, respectively, on average. We believe that hospitalists can have more influence over these cost areas by influencing treatment of hospitalized patients in a timely manner, discharge coordination, and selection of appropriate disposition locations. Hospitalists also play an integral role in ensuring the hospital performs well on quality metrics, including 30-day readmissions, hospital acquired conditions, and patient satisfaction. Examples below document the effectiveness of hospitalists in this new ACO era.
Care Transitions/Coordination
Before the Hospital Readmission Reduction Program (HRRP) delineated in the ACA, hospitalists developed Project BOOST (Better Outcomes by Optimizing Care Transitions) to improve hospital discharge care transition. The evidence-based foundation of this project led CMS to list Project BOOST as an example program that can reduce readmissions.24 Through the dissemination and mentored implementation of Project BOOST to over 200 hospitals across the United States,25 hospitalists contributed to the marked reduction in hospital readmission occurring since 2010.26 Although hospital medicine began as a practice specific to the hospital setting, hospitalists’ skills generated growing demand for them in postacute facilities. SNF residents commonly come from hospitals postdischarge and suffer from multiple comorbidities and limitations in activities of daily living. Not surprisingly, SNF residents experience high rates of rehospitalizations.27 Hospitalists can serve as a bridge between hospitals and SNFs and optimize this transition process to yield improved outcomes. Industry experts endorse this approach.28 A recent study demonstrated a significant reduction in readmissions in 1 SNF (32.3% to 16.1%, odds ratio = 0.403, P < .001), by having a hospitalist-led team follow patients discharged from the hospital.29
Chronic Conditions Management/High-Risk Patients
Interest in patients with multiple chronic comorbidities and social issues intensifies as healthcare systems focus limited resources on these high-risk patients to prevent the unnecessary use of costly services.30,31 As health systems assume financial risk for health outcomes and costs of designated patient groups, they undertake efforts to understand the population they serve. Such efforts aim to identify patients with established high utilization patterns (or those at risk for high utilization). This knowledge enables targeted actions to provide access, treatment, and preventive interventions to avoid unneeded emergency and hospital services. Hospitalists commonly care for these patients and are positioned to lead the implementation of patient risk assessment and stratification, develop patient-centered care models across care settings, and act as a liaison with primary care. For frail elderly and seriously ill patients, the integration of hospitalists into palliative care provides several opportunities for improving the quality of care at the end of life.32 As patients and their family caregivers commonly do not address goals of care until faced with a life-threatening condition in the hospital, hospitalists represent ideal primary palliative care physicians to initiate these conversations.33 A hospitalist communicating with a patient and/or their family caregiver about alleviating symptoms and clarifying patients’ preferences for care often yields decreases in ineffective healthcare utilization and better patient outcomes. The hospitalists’ ability to communicate with other providers within the hospital setting also allows them to better coordinate interdisciplinary care and prevent unnecessary and ineffective treatments and procedures.
De-Implementation/Waste Reduction
The largest inefficiencies in healthcare noted in the National Academy of Medicine report, Demanding Value from Our Health Care (2012), are failure to deliver known beneficial therapies or providing unnecessary or nonevidenced based services that do not improve outcomes, but come with associated risk and cost.34 “De-implementation” of unnecessary diagnostic tests or ineffective or even harmful treatments by hospitalists represents a significant opportunity to reduce costs while maintaining or even improving the quality of care. The Society of Hospital Medicine joined the Choosing Wisely® campaign and made 5 recommendations in adult care as an explicit starting point for eliminating waste in the hospital in 2013.35 Since then, hospitalists have participated in multiple successful efforts to address overutilization of care; some published results include the following:
- decreased frequency of unnecessary common labs through a multifaceted hospitalist QI intervention;36
- reduced length of stay and cost by appropriate use of telemetry;37 and
- reduced unnecessary radiology testing by providing physicians with individualized audit and feedback reports.38
CONCLUSION
Hundreds of ACOs now exist across the US, formed by a variety of providers including hospitals, physician groups, and integrated delivery systems. Provider groups range in size from primary care-focused physician groups with a handful of offices to large, multistate integrated delivery systems with dozens of hospitals and hundreds of office locations. Evaluations of ACO outcomes reveal mixed results.9,39-53 Admittedly, assessments attempting to compare the magnitude of savings across ACO models are difficult given the variation in size, variability in specific efforts to influence utilization, and substantial turnover among participating beneficiaries.54 Nonetheless, a newly published Office of Inspector General report55 showed that most Medicare ACOs reduced spending and improved care quality (82% of the individual quality measures) over the first 3 years of the program, and savings increased with duration of an ACO program. The report also noted that considerable time and managerial resources are required to implement changes to improve quality and lower costs. While the political terrain ostensibly supports value-based care and the need to diminish the proportion of our nation’s gross domestic product dedicated to healthcare, health systems are navigating an environment that still largely rewards volume. Hospitalists may be ideal facilitators for this transitional period as they possess the clinical experience caring for complex patients with multiple comorbidities and quality improvement skills to lead efforts in this new ACO era.
Disclosures
The authors have nothing to disclose.
1. Fisher ES, Staiger DO, Bynum JP, Gottlieb DJ. Creating accountable care organizations: the extended hospital medical staff. Health Aff(Project Hope). 2007;26(1):w44-w57. PubMed
2. Fisher ES, McClellan MB, Bertko J, et al. Fostering accountable health care: moving forward in medicare. Health Aff(Project Hope). 2009;28(2):w219-w231. PubMed
3. McClellan M, McKethan AN, Lewis JL, Roski J, Fisher ES. A national strategy to put accountable care into practice. Health Aff(Project Hope). 2010;29(5):982-990. PubMed
4. Berwick DM. Making good on ACOs’ promise--the final rule for the Medicare shared savings program. N Engl J Med. 2011;365(19):1753-1756. PubMed
5. Kuo YF, Sharma G, Freeman JL, Goodwin JS. Growth in the care of older patients by hospitalists in the United States. N Engl J Med. 2009;360(11):1102-1112. PubMed
6. Kennedy K. Health Care Providers Embracing Cost-saving Groups. USA Today, July 24, 2011.
7. Leavitt Partners. Available at http://leavittpartners.com, April 2016.
8. Colla CH, Lewis VA, Tierney E, Muhlestein DB. Hospitals Participating In ACOs Tend To Be Large And Urban, Allowing Access To Capital And Data. Health Aff(Millwood). 2016;35(3):431-439. PubMed
9. McWilliams JM, Hatfield LA, Chernew ME, Landon BE, Schwartz AL. Early Performance of Accountable Care Organizations in Medicare. N Engl J Med. 2016;374(24):2357-2366. PubMed
10. Muhlestein D, Saunders R, McClellan M. Medicare Accountable Care Organization Results For 2015: The Journey To Better Quality And Lower Costs Continues. In. Health Affairs Blog. Bethesda, MD 2016.
11. Chernew ME. New Health Care Symposium: Building An ACO---What Services Do You Need And How Are Physicians Impacted? In Health Affairs Blog. Bethesda, MD 2016.
12. Centers for Medicare & Medicaid Services. Performance Year 2016 Quality Performance and Financial Reconciliation Results for ACOs with 2012-2016 Start Dates. Available at https://strategichealthcare.net/wp-content/uploads/2017/10/CMS-Slides-on-ACOs.pdf. 2017.
13. Shortell SM, Casalino LP. Implementing qualifications criteria and technical assistance for accountable care organizations. JAMA. 2010;303(17):1747-1748. PubMed
14. Shortell SM, Casalino LP, Fisher ES. How the center for Medicare and Medicaid innovation should test accountable care organizations. Health Aff (Project Hope). 2010;29(7):1293-1298. PubMed
15. Medicare Payment Advisory Commission. Accountable Care Organizations Payment Systems October 2015. Available at http://www.medpac.gov/documents/payment-basics/accountable-care-organization-payment-systems-15.pdf?sfvrsn=0.
16. American Hospital Association. 2010 Committee on Research. AHA Research Synthesis Report: Accountable Care Organization.
17. D’Aunno T, Broffman L, Sparer M, Kumar SR. Factors That Distinguish High-Performing Accountable Care Organizations in the Medicare Shared Savings Program. Health Serv. Res. 2016. PubMed
18. Peiris D, Phipps-Taylor MC, Stachowski CA, et al. ACOs Holding Commercial Contracts Are Larger And More Efficient Than Noncommercial ACOs. Health Aff (Project Hope). 2016;35(10):1849-1856. PubMed
19. Ouayogode MH, Colla CH, Lewis VA. Determinants of success in Shared Savings Programs: An analysis of ACO and market characteristics. Healthcare (Amsterdam, Netherlands). 2017;5(1-2):53-61. PubMed
20. National Center for Health Statistics. Health, United States, 2016: With Chartbook on Long-term Trends in Health. In: Hyattsville, MD.2017. PubMed
21. Gbemudu JN. Larson BK, Van Citters AD, Kreindler SA, Nelson EC, Shortell SM, Fisher ES. Norton Healthcare: A Strong Payer–Provider Partnership for the Journey to Accountable Care. January 2012. Available at http://www.commonwealthfund.org/~/media/files/publications/case-study/2012/jan/1574_gbemudu_norton_case-study_01_12_2012.pdf.
22. O’Leary KJ, Haviley C, Slade ME, Shah HM, Lee J, Williams MV. Improving teamwork: impact of structured interdisciplinary rounds on a hospitalist unit. J Hosp Med. 2011;6(2):88-93. PubMed
23. Hansen LO, Greenwald JL, Budnitz T, et al. Project BOOST: effectiveness of a multihospital effort to reduce rehospitalization. J. Hosp. Med.. 2013;8(8):421-427. PubMed
24. Centers for Medicare and Medicaid Services. Solicitation for Applications: Community-based Care Transitions Program. Available at https://innovation.cms.gov/Files/Migrated-Medicare-Demonstration-x/CCTP-Solicitation.pdf. September 7, 2017.
25. Li J, Hinami K, Hansen LO, Maynard G, Budnitz T, Williams MV. The physician mentored implementation model: a promising quality improvement framework for health care change. Acad Med. 2015;90(3):303-310. PubMed
26. Williams MV, Li J, Hansen LO, et al. Project BOOST implementation: lessons learned. South Med J. 2014;107(7):455-465. PubMed
27. Ouslander JG, Lamb G, Perloe M, et al. Potentially avoidable hospitalizations of nursing home residents: frequency, causes, and costs: [see editorial comments by Drs. Jean F. Wyman and William R. Hazzard, pp 760-761]. J Am Geriatr Soc. 2010;58(4):627-635. PubMed
28. Pittman D. SNFs: New Turf for Hospitalists? 2013. Available at https://www.medpagetoday.com/hospitalbasedmedicine/hospitalists/39401.
29. Petigara S, Krishnamurthy M, Livert D. Necessity is the mother of invention: an innovative hospitalist-resident initiative for improving quality and reducing readmissions from skilled nursing facilities. J Community Hosp Intern Med Perspect. 2017;7(2):66-69. PubMed
30. Silow-Carroll S, Edwards J. Early Adopters of the Accountable Care Model: A Field Report on Improvements in Health Care Delivery. New York, NY: The Commonwealth Fund;March 2013.
31. Hasselman D. Super-Utilizer Summit: Common Themes from Innovative Complex Care Management Programs. Hamilton, NJ: Center for Health Care Strategies;October 2013.
32. Wald HL, Glasheen JJ, Guerrasio J, Youngwerth JM, Cumbler EU. Evaluation of a hospitalist-run acute care for the elderly service. J Hosp Med. 2011;6(6):313-321. PubMed
33. Quill TE, Abernethy AP. Generalist plus specialist palliative care--creating a more sustainable model. N Engl J Med. 2013;368(13):1173-1175. PubMed
34. O’Kane M, Buto K, Alteras T, et. al. Demanding Value from Our Health Care: Motivating Patient Action to Reduce Waste in Health Care. Institute of Medicine of the National Academies. July 2012. https://nam.edu/wp-content/uploads/2015/06/VSRT-DemandingValue.pdf. Accessed Accessed June 18, 2017.
35. Bulger J, Nickel W, Messler J, et al. Choosing wisely in adult hospital medicine: five opportunities for improved healthcare value. J Hosp Med. 2013;8(9):486-492. PubMed
36. Corson AH, Fan VS, White T, et al. A multifaceted hospitalist quality improvement intervention: Decreased frequency of common labs. J Hosp Med. 2015;10(6):390-395. PubMed
37. Svec D, Ahuja N, Evans KH, et al. Hospitalist intervention for appropriate use of telemetry reduces length of stay and cost. J Hosp Med. 2015;10(9):627-632. PubMed
38. Neeman N, Quinn K, Soni K, Mourad M, Sehgal NL. Reducing radiology use on an inpatient medical service: choosing wisely. JAMA Intern Med. 2012;172(20):1606-1608. PubMed
39. Abrams M, Nuzum R, Zezza M, Ryan J, Kiszla J, Guterman S. The Affordable Care Act’s Payment and Delivery System Reforms: A Progress Report at Five Years. Bipartisan Policy Center, May 2015. Available at http://www.commonwealthfund.org/publications/issue-briefs/2015/may/aca-payment-and-delivery-system-reforms-at-5-years.
40. Kocot SL, White R, Katikaneni P, McClellan MB. A More Complete Picture of Pioneer ACO Results. The Brookings Institution, October 13, 2014. Available at http://www.brookings.edu/blogs/up-front/posts/2014/10/09-pioneer-aco-results-mcclellan/#recent_rr/
41. Blumenthal D, Abrams M, Nuzum R. The Affordable Care Act at 5 Years. N Engl J Med. 2015;372(25):2451-2458. PubMed
42. Colla CH, Lewis VA, Kao LS, O’Malley AJ, Chang CH, Fisher ES. Association Between Medicare Accountable Care Organization Implementation and Spending Among Clinically Vulnerable Beneficiaries. JAMA Intern Med. 2016;176(8):1167-1175. PubMed
43. Epstein AM, Jha AK, Orav EJ, et al. Analysis of early accountable care organizations defines patient, structural, cost, and quality-of-care characteristics. Health Aff (Project Hope). 2014;33(1):95-102. PubMed
44. Fullerton CA, Henke RM, Crable E, Hohlbauch A, Cummings N. The Impact Of Medicare ACOs On Improving Integration And Coordination Of Physical And Behavioral Health Care. Health Aff (Project Hope). 2016;35(7):1257-1265. PubMed
45. Herrel LA, Norton EC, Hawken SR, Ye Z, Hollenbeck BK, Miller DC. Early impact of Medicare accountable care organizations on cancer surgery outcomes. Cancer. 2016;122(17):2739-2746. PubMed
46. McConnell KJ, Renfro S, Chan BK, et al. Early Performance in Medicaid Accountable Care Organizations: A Comparison of Oregon and Colorado. JAMA Intern Med. 2017;177(4):538-545. PubMed
47. Nyweide DJ, Lee W, Cuerdon TT, et al. Association of Pioneer Accountable Care Organizations vs traditional Medicare fee for service with spending, utilization, and patient experience. JAMA. 2015;313(21):2152-2161. PubMed
48. Rajkumar R, Press MJ, Conway PH. The CMS Innovation Center--a five-year self-assessment. N Engl J Med. 2015;372(21):1981-1983. PubMed
49. Rose S, Zaslavsky AM, McWilliams JM. Variation In Accountable Care Organization Spending And Sensitivity To Risk Adjustment: Implications For Benchmarking. Health affairs (Project Hope). 2016;35(3):440-448. PubMed
50. Shortell SM, Poon BY, Ramsay PP, et al. A Multilevel Analysis of Patient Engagement and Patient-Reported Outcomes in Primary Care Practices of Accountable Care Organizations. J Gen Intern Med. 2017;32(6):640-647. PubMed
51. Winblad U, Mor V, McHugh JP, Rahman M. ACO-Affiliated Hospitals Reduced Rehospitalizations From Skilled Nursing Facilities Faster Than Other Hospitals. Health Aff (Project Hope). 2017;36(1):67-73. PubMed
52. Zhang Y, Caines KJ, Powers CA. Evaluating the Effects of Pioneer Accountable Care Organizations on Medicare Part D Drug Spending and Utilization. Med Care. 2017;55(5):470-475. PubMed
53. Muhlestein D. Medicare ACOs: Mixed Initial Results and Cautious Optimism. Health Affairs Blog, February 4, 2014. Available at http://healthaffairs.org/blog/2014/02/04/medicare-acos-mixed-initial-results-and-cautious-optimism/.
54. Hsu J, Price M, Vogeli C, et al. Bending The Spending Curve By Altering Care Delivery Patterns: The Role Of Care Management Within A Pioneer ACO. Health Aff (Project Hope). 2017;36(5):876-884. PubMed
55. Medicare Shared Savings Program Accountable Care Organizations Have Shown Potential For Reducing Spending And Improving Quality. Office of Inspector General;August 2017.
© Society of Hospital Medicine
Hospital medicine resident training tracks: Developing the hospital medicine pipeline
The field of hospital medicine (HM) is rapidly expanding in the areas of clinical medicine, administration, and quality improvement (QI).1 Emerging with this growth is a gap in the traditional internal medicine (IM) training and skills needed to be effective in HM.1,2 These skills include clinical and nonclinical aptitudes, such as process improvement, health care economics, and leadership.1-3 However, resident education on these topics must compete with other required curricular content in IM residency training.2,4 Few IM residencies offer focused HM training that emphasizes key components of successful HM careers.3,5
Within the past decade, designated HM tracks within IM residency programs have been proposed as a potential solution. Initially, calls for such tracks focused on gaps in the clinical competencies required of hospitalists.1 Tracks have since evolved to also include skills required to drive high-value care, process improvement, and scholarship. Designated HM tracks address these areas through greater breadth of curricula, additional time for reflection, participation in group projects, and active application to clinical care.4 We conducted a study to identify themes that could inform the ongoing evolution of dedicated HM tracks.
METHODS
Programs were initially identified through communication among professional networks. The phrases hospital medicine residency track and internal medicine residency hospitalist track were used in broader Google searches, as there is no database of such tracks. Searches were performed quarterly during the 2015–2016 academic year. The top 20 hits were manually filtered to identify tracks affiliated with major academic centers. IM residency program websites provided basic information for programs with tracks. We excluded tracks focused entirely on QI6 because, though a crucial part of HM, QI training alone is probably insufficient for preparing residents for success as hospitalists on residency completion. Similarly, IM residencies with stand-alone HM clinical rotations without longitudinal HM curricula were excluded.
Semistructured interviews with track directors were conducted by e-mail or telephone for all tracks except one, the details of which are published.7 We tabulated data and reviewed qualitative information to identify themes among the different tracks. As this study did not involve human participants, Institutional Review Board approval was not needed.
RESULTS
We identified 11 HM residency training programs at major academic centers across the United States: Cleveland Clinic, Stanford University, Tulane University, University of California Davis, University of California Irvine, University of Colorado, University of Kentucky, University of Minnesota, University of New Mexico, Virginia Commonwealth University, and Wake Forest University (Table 1). We reviewed the websites of about 10 other programs, but none suggested existence of a track. Additional programs contacted reported no current track.

Track Participants and Structure
HM tracks mainly target third-year residents (Table 1). Some extend into the second year of residency, and 4 have opportunities for intern involvement, including a separate match number at Colorado. Tracks accept up to 12 residents per class. Two programs, at Colorado and Virginia, are part of IM programs in which all residents belong to a track (eg, HM, primary care, research).
HM track structures vary widely and are heavily influenced by the content delivery platforms of their IM residency programs. Several HM track directors emphasized the importance of fitting into existing educational frameworks to ensure access to residents and to minimize the burden of participation. Four programs deliver the bulk of their nonclinical content in dedicated blocks; 6 others use brief recurring sessions to deliver smaller aliquots longitudinally (Table 1). The number of protected hours for content delivery ranges from 10 to more than 40 annually. All tracks use multiple content delivery modes, including didactic sessions and journal clubs. Four tracks employ panel discussions to explore career options within HM. Several also use online platforms, including discussions, readings, and modules.
Quality Improvement
The vast majority of curricula prominently feature experiential QI project involvement (Table 2). These mentored longitudinal projects allow applied delivery of content, such as QI methods and management skills. Four tracks use material from the Institute for Healthcare Improvement.8 Several also offer dedicated QI rotations that immerse residents in ongoing QI efforts.

Institutional partnerships support these initiatives at several sites. The Minnesota track is a joint venture of the university and Regions Hospital, a nonprofit community hospital. The Virginia track positions HM residents to lead university-wide interdisciplinary QI teams. For project support, the Colorado and Kentucky tracks partner with local QI resources—the Institute for Healthcare Quality, Safety, and Efficiency at Colorado and the Office of Value and Innovation in Healthcare Delivery at Kentucky.
Health Care Economics and Value
Many programs leverage the rapidly growing emphasis on health care “value” as an opportunity for synergy between IM programs and HM tracks. Examples include involving residents in efforts to improve documentation or didactic instruction on topics such as health care finance. The New Mexico and Wake Forest tracks offer elective rotations on health care economics. Several track directors mentioned successfully expanding curricula on health care value from the HM track into IM residency programs at large, providing a measurable service to the residency programs while ensuring content delivery and freeing up additional time for track activities.
Scholarship and Career Development
Most programs provide targeted career development for residents. Six tracks provide sessions on job procurement skills, such as curriculum vitae preparation and interviewing (Table 2). Many also provide content on venues for disseminating scholarly activity. The Colorado, Kentucky, New Mexico, and Tulane programs feature content on abstract and poster creation. Leadership development is addressed in several tracks through dedicated track activities or participation in discrete, outside-track events. Specifically, Colorado offers a leadership track for residents interested in hospital administration, Cleveland has a leadership journal club, Wake Forest enrolls HM residents in leadership training available through the university, and Minnesota sends residents to the Society of Hospital Medicine’s Leadership Academy (Table 2).
Clinical Rotations
Almost all tracks include a clinical rotation, typically pairing residents directly with hospitalist attendings to encourage autonomy and mentorship. Several also offer elective rotations in various disciplines within HM (Table 2). The Kentucky and Virginia tracks incorporate working with advanced practice providers into their practicums. The Cleveland, Minnesota, Tulane, and Virginia tracks offer HM rotations in community hospitals or postacute settings.
HM rotations also pair clinical experiences with didactic education on relevant topics (eg, billing and coding). The Cleveland, Minnesota, and Virginia tracks developed clinical rotations reflecting the common 7-on and 7-off schedule with nonclinical obligations, such as seminars linking specific content to clinical experiences, during nonclinical time.
DISCUSSION
Our investigation into the current state of HM training found that HM track curricula focus largely on QI, health care economics, and professional development. This focus likely developed in response to hospitalists’ increasing engagement in related endeavors. HM tracks have dynamic and variable structures, reflecting an evolving field and the need to fit into existing IM residency program structures. Similarly, the content covered in HM tracks is tightly linked to perceived opportunities within IM residency curricula. The heterogeneity of content suggests the breadth and ambiguity of necessary competencies for aspiring hospitalists. One of the 11 tracks has not had any residents enroll within the past few years—a testament to the continued effort necessary to sustain such tracks, including curricular updates and recruiting. Conversely, many programs now share track content with the larger IM residency program, suggesting HM tracks may be near the forefront of medical education in some areas.
Our study had several limitations. As we are unaware of any databases of HM tracks, we discussed tracks with professional contacts, performed Internet searches, and reviewed IM residency program websites. Our search, however, was not exhaustive; despite our best efforts, we may have missed or mischaracterized some track offerings. Nevertheless, we think that our analysis represents the first thorough compilation of HM tracks and that it will be useful to institutions seeking to create or enhance HM-specific training.
As the field continues to evolve, we are optimistic about the future of HM training. We suspect that HM residency training tracks will continue to expand. More work is needed so these tracks can adjust to the changing HM and IM residency program landscapes and supply well-trained physicians for the HM workforce.
Acknowledgment
The authors thank track directors Alpesh Amin, David Gugliotti, Rick Hilger, Karnjit Johl, Nasir Majeed, Georgia McIntosh, Charles Pizanis, and Jeff Wiese for making this study possible.
Disclosure
Nothing to report.
1. Glasheen JJ, Siegal EM, Epstein K, Kutner J, Prochazka AV. Fulfilling the promise of hospital medicine: tailoring internal medicine training to address hospitalists’ needs [published correction appears in J Gen Intern Med. 2008;23(11):1931]. J Gen Intern Med. 2008;23(7):1110-1115. PubMed
2. Arora V, Guardiano S, Donaldson D, Storch I, Hemstreet P. Closing the gap between internal medicine training and practice: recommendations from recent graduates. Am J Med. 2005;118(6):680-685. PubMed
3. Glasheen JJ, Goldenberg J, Nelson JR. Achieving hospital medicine’s promise through internal medicine residency redesign. Mt Sinai J Med. 2008;75(5):436-441. PubMed
4. Wiese J. Residency training: beginning with the end in mind. J Gen Intern Med. 2008;23(7):1122-1123. PubMed
5. Glasheen JJ, Epstein KR, Siegal E, Kutner JS, Prochazka AV. The spectrum of community-based hospitalist practice: a call to tailor internal medicine residency training. Arch Intern Med. 2007;167(7):727-728. PubMed
6. Patel N, Brennan PJ, Metlay J, Bellini L, Shannon RP, Myers JS. Building the pipeline: the creation of a residency training pathway for future physician leaders in health care quality. Acad Med. 2015;90(2):185-190. PubMed
7. Kumar A, Smeraglio A, Witteles R, et al. A resident-created hospitalist curriculum for internal medicine housestaff. J Hosp Med. 2016;11(9):646-649. PubMed
8. Institute for Healthcare Improvement website. http://www.ihi.org. Accessed December 15, 2015.
The field of hospital medicine (HM) is rapidly expanding in the areas of clinical medicine, administration, and quality improvement (QI).1 Emerging with this growth is a gap in the traditional internal medicine (IM) training and skills needed to be effective in HM.1,2 These skills include clinical and nonclinical aptitudes, such as process improvement, health care economics, and leadership.1-3 However, resident education on these topics must compete with other required curricular content in IM residency training.2,4 Few IM residencies offer focused HM training that emphasizes key components of successful HM careers.3,5
Within the past decade, designated HM tracks within IM residency programs have been proposed as a potential solution. Initially, calls for such tracks focused on gaps in the clinical competencies required of hospitalists.1 Tracks have since evolved to also include skills required to drive high-value care, process improvement, and scholarship. Designated HM tracks address these areas through greater breadth of curricula, additional time for reflection, participation in group projects, and active application to clinical care.4 We conducted a study to identify themes that could inform the ongoing evolution of dedicated HM tracks.
METHODS
Programs were initially identified through communication among professional networks. The phrases hospital medicine residency track and internal medicine residency hospitalist track were used in broader Google searches, as there is no database of such tracks. Searches were performed quarterly during the 2015–2016 academic year. The top 20 hits were manually filtered to identify tracks affiliated with major academic centers. IM residency program websites provided basic information for programs with tracks. We excluded tracks focused entirely on QI6 because, though a crucial part of HM, QI training alone is probably insufficient for preparing residents for success as hospitalists on residency completion. Similarly, IM residencies with stand-alone HM clinical rotations without longitudinal HM curricula were excluded.
Semistructured interviews with track directors were conducted by e-mail or telephone for all tracks except one, the details of which are published.7 We tabulated data and reviewed qualitative information to identify themes among the different tracks. As this study did not involve human participants, Institutional Review Board approval was not needed.
RESULTS
We identified 11 HM residency training programs at major academic centers across the United States: Cleveland Clinic, Stanford University, Tulane University, University of California Davis, University of California Irvine, University of Colorado, University of Kentucky, University of Minnesota, University of New Mexico, Virginia Commonwealth University, and Wake Forest University (Table 1). We reviewed the websites of about 10 other programs, but none suggested existence of a track. Additional programs contacted reported no current track.
Track Participants and Structure
HM tracks mainly target third-year residents (Table 1). Some extend into the second year of residency, and 4 have opportunities for intern involvement, including a separate match number at Colorado. Tracks accept up to 12 residents per class. Two programs, at Colorado and Virginia, are part of IM programs in which all residents belong to a track (eg, HM, primary care, research).
HM track structures vary widely and are heavily influenced by the content delivery platforms of their IM residency programs. Several HM track directors emphasized the importance of fitting into existing educational frameworks to ensure access to residents and to minimize the burden of participation. Four programs deliver the bulk of their nonclinical content in dedicated blocks; 6 others use brief recurring sessions to deliver smaller aliquots longitudinally (Table 1). The number of protected hours for content delivery ranges from 10 to more than 40 annually. All tracks use multiple content delivery modes, including didactic sessions and journal clubs. Four tracks employ panel discussions to explore career options within HM. Several also use online platforms, including discussions, readings, and modules.
Quality Improvement
The vast majority of curricula prominently feature experiential QI project involvement (Table 2). These mentored longitudinal projects allow applied delivery of content, such as QI methods and management skills. Four tracks use material from the Institute for Healthcare Improvement.8 Several also offer dedicated QI rotations that immerse residents in ongoing QI efforts.
Institutional partnerships support these initiatives at several sites. The Minnesota track is a joint venture of the university and Regions Hospital, a nonprofit community hospital. The Virginia track positions HM residents to lead university-wide interdisciplinary QI teams. For project support, the Colorado and Kentucky tracks partner with local QI resources—the Institute for Healthcare Quality, Safety, and Efficiency at Colorado and the Office of Value and Innovation in Healthcare Delivery at Kentucky.
Health Care Economics and Value
Many programs leverage the rapidly growing emphasis on health care “value” as an opportunity for synergy between IM programs and HM tracks. Examples include involving residents in efforts to improve documentation or didactic instruction on topics such as health care finance. The New Mexico and Wake Forest tracks offer elective rotations on health care economics. Several track directors mentioned successfully expanding curricula on health care value from the HM track into IM residency programs at large, providing a measurable service to the residency programs while ensuring content delivery and freeing up additional time for track activities.
Scholarship and Career Development
Most programs provide targeted career development for residents. Six tracks provide sessions on job procurement skills, such as curriculum vitae preparation and interviewing (Table 2). Many also provide content on venues for disseminating scholarly activity. The Colorado, Kentucky, New Mexico, and Tulane programs feature content on abstract and poster creation. Leadership development is addressed in several tracks through dedicated track activities or participation in discrete, outside-track events. Specifically, Colorado offers a leadership track for residents interested in hospital administration, Cleveland has a leadership journal club, Wake Forest enrolls HM residents in leadership training available through the university, and Minnesota sends residents to the Society of Hospital Medicine’s Leadership Academy (Table 2).
Clinical Rotations
Almost all tracks include a clinical rotation, typically pairing residents directly with hospitalist attendings to encourage autonomy and mentorship. Several also offer elective rotations in various disciplines within HM (Table 2). The Kentucky and Virginia tracks incorporate working with advanced practice providers into their practicums. The Cleveland, Minnesota, Tulane, and Virginia tracks offer HM rotations in community hospitals or postacute settings.
HM rotations also pair clinical experiences with didactic education on relevant topics (eg, billing and coding). The Cleveland, Minnesota, and Virginia tracks developed clinical rotations reflecting the common 7-on and 7-off schedule with nonclinical obligations, such as seminars linking specific content to clinical experiences, during nonclinical time.
DISCUSSION
Our investigation into the current state of HM training found that HM track curricula focus largely on QI, health care economics, and professional development. This focus likely developed in response to hospitalists’ increasing engagement in related endeavors. HM tracks have dynamic and variable structures, reflecting an evolving field and the need to fit into existing IM residency program structures. Similarly, the content covered in HM tracks is tightly linked to perceived opportunities within IM residency curricula. The heterogeneity of content suggests the breadth and ambiguity of necessary competencies for aspiring hospitalists. One of the 11 tracks has not had any residents enroll within the past few years—a testament to the continued effort necessary to sustain such tracks, including curricular updates and recruiting. Conversely, many programs now share track content with the larger IM residency program, suggesting HM tracks may be near the forefront of medical education in some areas.
Our study had several limitations. As we are unaware of any databases of HM tracks, we discussed tracks with professional contacts, performed Internet searches, and reviewed IM residency program websites. Our search, however, was not exhaustive; despite our best efforts, we may have missed or mischaracterized some track offerings. Nevertheless, we think that our analysis represents the first thorough compilation of HM tracks and that it will be useful to institutions seeking to create or enhance HM-specific training.
As the field continues to evolve, we are optimistic about the future of HM training. We suspect that HM residency training tracks will continue to expand. More work is needed so these tracks can adjust to the changing HM and IM residency program landscapes and supply well-trained physicians for the HM workforce.
Acknowledgment
The authors thank track directors Alpesh Amin, David Gugliotti, Rick Hilger, Karnjit Johl, Nasir Majeed, Georgia McIntosh, Charles Pizanis, and Jeff Wiese for making this study possible.
Disclosure
Nothing to report.
1. Glasheen JJ, Siegal EM, Epstein K, Kutner J, Prochazka AV. Fulfilling the promise of hospital medicine: tailoring internal medicine training to address hospitalists’ needs [published correction appears in J Gen Intern Med. 2008;23(11):1931]. J Gen Intern Med. 2008;23(7):1110-1115. PubMed
2. Arora V, Guardiano S, Donaldson D, Storch I, Hemstreet P. Closing the gap between internal medicine training and practice: recommendations from recent graduates. Am J Med. 2005;118(6):680-685. PubMed
3. Glasheen JJ, Goldenberg J, Nelson JR. Achieving hospital medicine’s promise through internal medicine residency redesign. Mt Sinai J Med. 2008;75(5):436-441. PubMed
4. Wiese J. Residency training: beginning with the end in mind. J Gen Intern Med. 2008;23(7):1122-1123. PubMed
5. Glasheen JJ, Epstein KR, Siegal E, Kutner JS, Prochazka AV. The spectrum of community-based hospitalist practice: a call to tailor internal medicine residency training. Arch Intern Med. 2007;167(7):727-728. PubMed
6. Patel N, Brennan PJ, Metlay J, Bellini L, Shannon RP, Myers JS. Building the pipeline: the creation of a residency training pathway for future physician leaders in health care quality. Acad Med. 2015;90(2):185-190. PubMed
7. Kumar A, Smeraglio A, Witteles R, et al. A resident-created hospitalist curriculum for internal medicine housestaff. J Hosp Med. 2016;11(9):646-649. PubMed
8. Institute for Healthcare Improvement website. http://www.ihi.org. Accessed December 15, 2015.
© 2017 Society of Hospital Medicine
Thoracentesis Referral
Internal medicine (IM) residents and hospitalist physicians commonly conduct bedside thoracenteses for both diagnostic and therapeutic purposes.[1] The American Board of Internal Medicine only requires that certification candidates understand the indications, complications, and management of thoracenteses.[2] A disconnect between clinical practice patterns and board requirements may increase patient risk because poorly trained physicians are more likely to cause complications.[3] National practice patterns show that many thoracenteses are referred to interventional radiology (IR).[4] However, research links performance of bedside procedures to reduced hospital length of stay and lower costs, without increasing risk of complications.[1, 5, 6]
Simulation‐based education offers a controlled environment where trainees improve procedural knowledge and skills without patient harm.[7] Simulation‐based mastery learning (SBML) is a rigorous form of competency‐based education that improves clinical skills and reduces iatrogenic complications and healthcare costs.[5, 6, 8] SBML also is an effective method to boost thoracentesis skills among IM residents.[9] However, there are no data to show that thoracentesis skills acquired in the simulation laboratory transfer to clinical environments and affect referral patterns.
We hypothesized that a thoracentesis SBML intervention would improve skills and increase procedural self‐confidence while reducing procedure referrals. This study aimed to (1) assess the effect of thoracentesis SBML on a cohort of IM residents' simulated skills and (2) compare traditionally trained (nonSBML‐trained) residents, SBML‐trained residents, and hospitalist physicians regarding procedure referral patterns, self‐confidence, procedure experience, and reasons for referral.
METHODS AND MATERIALS
Study Design
We surveyed physicians about thoracenteses performed on patients cared for by postgraduate year (PGY)‐2 and PGY‐3 IM residents and hospitalist physicians at Northwestern Memorial Hospital (NMH) from December 2012 to May 2015. NMH is an 896‐bed, tertiary academic medical center, located in Chicago, Illinois. A random sample of IM residents participated in a thoracentesis SBML intervention, whereas hospitalist physicians did not. We compared referral patterns, self‐confidence, procedure experience, and reasons for referral between traditionally trained residents, SBML‐trained residents, and hospitalist physicians. The Northwestern University Institutional Review Board approved this study, and all study participants provided informed consent.
At NMH, resident‐staffed services include general IM and nonintensive care subspecialty medical services. There are also 2 nonteaching floors staffed by hospitalist attending physicians without residents. Thoracenteses performed on these services can either be done at the bedside or referred to pulmonary medicine or IR. The majority of thoracenteses performed by pulmonary medicine occur at the patients' bedside, and the patients also receive a clinical consultation. IR procedures are done in the IR suite without additional clinical consultation.
Procedure
One hundred sixty residents were available for training over the study period. We randomly selected 20% of the approximately 20 PGY‐2 and PGY‐3 IM residents assigned to the NMH medicine services each month to participate in SBML thoracentesis training before their rotation. Randomly selected residents were required to undergo SBML training but were not required to participate in the study. This selection process was repeated before every rotation during the study period. This randomized wait‐list control method allowed residents to serve as controls if not initially selected for training and remain eligible for SBML training in subsequent rotations.
Intervention
The SBML intervention used a pretest/post‐test design, as described elsewhere.[9] Residents completed a clinical skills pretest on a thoracentesis simulator using a previously published 26‐item checklist.[9] Following the pretest, residents participated in 2, 1‐hour training sessions including a lecture, video, and deliberate practice on the simulator with feedback from an expert instructor. Finally, residents completed a clinical skills post‐test using the checklist within 1 week from training (but on a different day) and were required to meet or exceed an 84.3% minimum passing score (MPS). The entire training, including pre‐ and post‐tests, took approximately 3 hours to complete, and residents were given an additional 1 hour refresher training every 6 months for up to a year after original training. We compared pre‐ and post‐test checklist scores to evaluate skills improvement.
Thoracentesis Patient Identification
The NMH electronic health record (EHR) was used to identify medical service inpatients who underwent a thoracentesis during the study period. NMH clinicians must place an EHR order for procedure kits, consults, and laboratory analysis of thoracentesis fluid. We developed a real‐time query of NMH's EHR that identified all patients with electronic orders for thoracenteses and monitored this daily.
Physician Surveys
After each thoracentesis, we surveyed the PGY‐2 or PGY‐3 resident or hospitalist caring for the patient about the procedure. A research coordinator, blind to whether the resident received SBML, performed the surveys face‐to‐face on Monday to Friday during normal business hours. Residents were not considered SBML‐trained until they met or exceeded the MPS on the simulated skills checklist at post‐test. Surveys occurred on Monday for procedures performed on Friday evening through Sunday. Survey questions asked physicians about who performed the procedure, their procedural self‐confidence, and total number of thoracenteses performed in their career. For referred procedures, physicians were asked about reasons for referral including lack of confidence, work hour restrictions (residents only), and low reimbursement rates.[10] There was also an option to add other reasons.
Measurement
The thoracentesis skills checklist documented all required steps for an evidence‐based thoracentesis. Each task received equal weight (0 = done incorrectly/not done, 1 = done correctly).[9] For physician surveys, self‐confidence about performing the procedure was rated on a scale of 0 = not confident to 100 = very confident. Reasons for referral were scored on a Likert scale 1 to 5 (1 = not at all important, 5 = very important). Other reasons for referral were categorized.
Statistical Analysis
The clinical skills pre‐ and post‐test checklist scores were compared using a Wilcoxon matched pairs rank test. Physician survey data were compared between different procedure performers using the 2 test, independent t test, analysis of variance (ANOVA), or Kruskal‐Wallis test depending on data properties. Referral patterns measured by the Likert scale were averaged, and differences between physician groups were evaluated using ANOVA. Counts of other reasons for referral were compared using the 2 test. We performed all statistical analyses using IBM SPSS Statistics version 23 (IBM Corp., Armonk, NY).
RESULTS
Thoracentesis Clinical Skills
One hundred twelve (70%) residents were randomized to SBML, and all completed the protocol. Median pretest scores were 57.6% (interquartile range [IQR] 43.376.9), and final post‐test mastery scores were 96.2 (IQR 96.2100.0; P < 0.001). Twenty‐three residents (21.0%) failed to meet the MPS at initial post‐test, but met the MPS on retest after <1 hour of additional training.
Physician Surveys
The EHR query identified 474 procedures eligible for physician surveys. One hundred twenty‐two residents and 51 hospitalist physicians completed surveys for 472 procedures (99.6%); 182 patients by traditionally trained residents, 145 by SBML‐trained residents, and 145 by hospitalist physicians. As shown in Table 1, 413 (88%) of all procedures were referred to another service. Traditionally trained residents were more likely to refer to IR compared to SBML‐trained residents or hospitalist physicians. SBML‐trained residents were more likely to perform bedside procedures, whereas hospitalist physicians were most likely to refer to pulmonary medicine. SBML‐trained residents were most confident in their procedural skills, despite hospitalist physicians performing more actual procedures.
| Traditionally Trained Resident Surveys, n = 182 | SBML‐Trained Resident Surveys, n = 145 | Hospitalist Physician Surveys, n = 145 | P Value | |
|---|---|---|---|---|
| ||||
| Bedside procedures, no. (%) | 26 (14.3%) | 32 (22.1%) | 1 (0.7%) | <0.001 |
| IR procedures, no. (%) | 119 (65.4%) | 74 (51.0%) | 82 (56.6%) | 0.029 |
| Pulmonary procedures, no. (%) | 37 (20.3%) | 39 (26.9%) | 62 (42.8%) | <0.001 |
| Procedure self‐confidence, mean (SD)* | 43.6 (28.66) | 68.2 (25.17) | 55.7 (31.17) | <0.001 |
| Experience performing actual procedures, median (IQR) | 1 (13) | 2 (13.5) | 10 (425) | <0.001 |
Traditionally trained residents were most likely to rate low confidence as reasons why they referred thoracenteses (Table 2). Hospitalist physicians were more likely to cite lack of time to perform the procedure themselves. Other reasons were different across groups. SBML‐trained residents were more likely to refer because of attending preference, whereas traditionally trained residents were mostly like to refer because of high risk/technically difficult cases.
| Traditionally Trained Residents, n = 156 | SBML‐Trained Residents, n = 113 | Hospitalist Physicians, n = 144 | P Value | |
|---|---|---|---|---|
| ||||
| Lack of confidence to perform procedure, mean (SD)* | 3.46 (1.32) | 2.52 (1.45) | 2.89 (1.60) | <0.001 |
| Work hour restrictions, mean (SD) * | 2.05 (1.37) | 1.50 (1.11) | n/a | 0.001 |
| Low reimbursement, mean (SD)* | 1.02 (0.12) | 1.0 (0) | 1.22 (0.69) | <0.001 |
| Other reasons for referral, no. (%) | ||||
| Attending preference | 8 (5.1%) | 11 (9.7%) | 3 (2.1%) | 0.025 |
| Don't know how | 6 (3.8%) | 0 | 0 | 0.007 |
| Failed bedside | 0 | 2 (1.8%) | 0 | 0.07 |
| High risk/technically difficult case | 24 (15.4%) | 12 (10.6%) | 5 (3.5%) | 0.003 |
| IR or pulmonary patient | 5 (3.2%) | 2 (1.8%) | 4 (2.8%) | 0.77 |
| Other IR procedure taking place | 11 (7.1%) | 9 (8.0%) | 4 (2.8%) | 0.13 |
| Patient preference | 2 (1.3%) | 7 (6.2%) | 2 (3.5%) | 0.024 |
| Time | 9 (5.8%) | 7 (6.2%) | 29 (20.1%) | <0.001 |
DISCUSSION
This study confirms earlier research showing that thoracentesis SBML improves residents' clinical skills, but is the first to use a randomized study design.[9] Use of the mastery model in health professions education ensures that all learners are competent to provide patient care including performing invasive procedures. Such rigorous education yields downstream translational outcomes including safety profiles comparable to experts.[1, 6]
This study also shows that SBML‐trained residents displayed higher self‐confidence and performed significantly more bedside procedures than traditionally trained residents and more experienced hospitalist physicians. Although the Society of Hospital Medicine considers thoracentesis skills a core competency for hospitalist physicians,[11] we speculate that some hospitalist physicians had not performed a thoracentesis in years. A recent national survey showed that only 44% of hospitalist physicians performed at least 1 thoracentesis within the past year.[10] Research also shows a shift in medical culture to refer procedures to specialty services, such as IR, by over 900% in the past 2 decades.[4] Our results provide novel information about procedure referrals because we show that SBML provides translational outcomes by improving skills and self‐confidence that influence referral patterns. SBML‐trained residents performed almost a quarter of procedures at the bedside. Although this only represents an 8% absolute difference in bedside procedures compared to traditionally trained residents, if a large number of residents are trained using SBML this results in a meaningful number of procedures shifted to the patient bedside. According to University HealthSystem Consortium data, in US teaching hospitals, approximately 35,325 thoracenteses are performed yearly.[1] Shifting even 8% of these procedures to the bedside would result in significant clinical benefit and cost savings. Reduced referrals increase additional bedside procedures that are safe, cost‐effective, and highly satisfying to patients.[1, 12, 13] Further study is required to determine the impact on referral patterns after providing SMBL training to attending physicians.
Our study also provides information about the rationale for procedure referrals. Earlier work speculates that financial incentive, training and time may explain high procedure referral rates.[10] One report on IM residents noted an 87% IR referral rate for thoracentesis, and confirmed that both training and time were major reasons.[14] Hospitalist physicians reported lack of time as the major factor leading to procedural referrals, which is problematic because bedside procedures yield similar clinical outcomes at lower costs.[1, 12] Attending preference also prevented 11 additional bedside procedures in the SBML‐trained group. Schedule adjustments and SBML training of hospitalist physicians should be considered, because bundled payments in the Affordable Care Act may favor shifting to the higher‐value approach of bedside thoracenteses.[15]
Our study has several limitations. First, we only performed surveys at 1 institution and the results may not be generalizable. Second, we relied on an electronic query to alert us to thoracenteses. Our query may have missed procedures that were unsuccessful or did not have EHR orders entered. Third, physicians may have been surveyed more than once for different or the same patient(s), but opinions may have shifted over time. Fourth, some items such as time needed to be written in the survey and were not specifically asked. This could have resulted in under‐reporting. Finally, we did not assess the clinical outcomes of thoracenteses in this study, although earlier work shows that residents who complete SBML have safety outcomes similar to IR.[1, 6]
In summary, IM residents who complete thoracentesis SBML demonstrate improved clinical skills and are more likely to perform bedside procedures. In an era of bundled payments, rethinking current care models to promote cost‐effective care is necessary. We believe providing additional education, training, and support to hospitalist physicians to promote bedside procedures is a promising strategy that warrants further study.
Acknowledgements
The authors acknowledge Drs. Douglas Vaughan and Kevin O'Leary for their support and encouragement of this work. The authors also thank the internal medicine residents at Northwestern for their dedication to patient care.
Disclosures: This project was supported by grant R18HS021202‐01 from the Agency for Healthcare Research and Quality (AHRQ). AHRQ had no role in the preparation, review, or approval of the manuscript. Trial Registration:
- , , , , . Thoracentesis procedures at university hospitals: comparing outcomes by specialty. Jt Comm J Qual Patient Saf. 2015;42(1):34–40.
- American Board of Internal Medicine. Internal medicine policies. Available at: http://www.abim.org/certification/policies/internal‐medicine‐subspecialty‐policies/internal‐medicine.aspx. Accessed March 9, 2016.
- , , , . Pneumothorax following thoracentesis: a systematic review and meta‐analysis. Arch Intern Med. 2010;170(4):332–339.
- , , . National fluid shifts: fifteen‐year trends in paracentesis and thoracentesis procedures. J Am Coll Radiol. 2010;7(11):859–864.
- , , , et al. Cost savings of performing paracentesis procedures at the bedside after simulation‐based education. Simul Healthc. 2014;9(5):312–318.
- , , , , . Clinical outcomes after bedside and interventional radiology paracentesis procedures. Am J Med. 2013;126(4):349–356.
- , , , et al. Simulation technology for health care professional skills training and assessment. JAMA. 1999;282(9):861–866.
- , , , et al. Cost savings from reduced catheter‐related bloodstream infection after simulation‐based education for residents in a medical intensive care unit. Simul Healthc. 2010;5(2):98–102.
- , , , , . Mastery learning of thoracentesis skills by internal medicine residents using simulation technology and deliberate practice. J Hosp Med. 2008;3(1):48–54.
- , , , , . Procedures performed by hospitalist and non‐hospitalist general internists. J Gen Intern Med. 2010;25(5):448–452.
- , , , , . Core competencies in hospital medicine: development and methodology. J Hosp Med. 2006;1(suppl 1):48–56.
- , , , , , . Specialties performing paracentesis procedures at university hospitals: implications for training and certification. J Hosp Med. 2014;9(3):162–168.
- , , , , , . Are we providing patient‐centered care? Preferences about paracentesis and thoracentesis procedures. Patient Exp J. 2014;1(2):94–103. Available at: http://pxjournal.org/cgi/viewcontent.cgi?article=1024
Internal medicine (IM) residents and hospitalist physicians commonly conduct bedside thoracenteses for both diagnostic and therapeutic purposes.[1] The American Board of Internal Medicine only requires that certification candidates understand the indications, complications, and management of thoracenteses.[2] A disconnect between clinical practice patterns and board requirements may increase patient risk because poorly trained physicians are more likely to cause complications.[3] National practice patterns show that many thoracenteses are referred to interventional radiology (IR).[4] However, research links performance of bedside procedures to reduced hospital length of stay and lower costs, without increasing risk of complications.[1, 5, 6]
Simulation‐based education offers a controlled environment where trainees improve procedural knowledge and skills without patient harm.[7] Simulation‐based mastery learning (SBML) is a rigorous form of competency‐based education that improves clinical skills and reduces iatrogenic complications and healthcare costs.[5, 6, 8] SBML also is an effective method to boost thoracentesis skills among IM residents.[9] However, there are no data to show that thoracentesis skills acquired in the simulation laboratory transfer to clinical environments and affect referral patterns.
We hypothesized that a thoracentesis SBML intervention would improve skills and increase procedural self‐confidence while reducing procedure referrals. This study aimed to (1) assess the effect of thoracentesis SBML on a cohort of IM residents' simulated skills and (2) compare traditionally trained (nonSBML‐trained) residents, SBML‐trained residents, and hospitalist physicians regarding procedure referral patterns, self‐confidence, procedure experience, and reasons for referral.
METHODS AND MATERIALS
Study Design
We surveyed physicians about thoracenteses performed on patients cared for by postgraduate year (PGY)‐2 and PGY‐3 IM residents and hospitalist physicians at Northwestern Memorial Hospital (NMH) from December 2012 to May 2015. NMH is an 896‐bed, tertiary academic medical center, located in Chicago, Illinois. A random sample of IM residents participated in a thoracentesis SBML intervention, whereas hospitalist physicians did not. We compared referral patterns, self‐confidence, procedure experience, and reasons for referral between traditionally trained residents, SBML‐trained residents, and hospitalist physicians. The Northwestern University Institutional Review Board approved this study, and all study participants provided informed consent.
At NMH, resident‐staffed services include general IM and nonintensive care subspecialty medical services. There are also 2 nonteaching floors staffed by hospitalist attending physicians without residents. Thoracenteses performed on these services can either be done at the bedside or referred to pulmonary medicine or IR. The majority of thoracenteses performed by pulmonary medicine occur at the patients' bedside, and the patients also receive a clinical consultation. IR procedures are done in the IR suite without additional clinical consultation.
Procedure
One hundred sixty residents were available for training over the study period. We randomly selected 20% of the approximately 20 PGY‐2 and PGY‐3 IM residents assigned to the NMH medicine services each month to participate in SBML thoracentesis training before their rotation. Randomly selected residents were required to undergo SBML training but were not required to participate in the study. This selection process was repeated before every rotation during the study period. This randomized wait‐list control method allowed residents to serve as controls if not initially selected for training and remain eligible for SBML training in subsequent rotations.
Intervention
The SBML intervention used a pretest/post‐test design, as described elsewhere.[9] Residents completed a clinical skills pretest on a thoracentesis simulator using a previously published 26‐item checklist.[9] Following the pretest, residents participated in 2, 1‐hour training sessions including a lecture, video, and deliberate practice on the simulator with feedback from an expert instructor. Finally, residents completed a clinical skills post‐test using the checklist within 1 week from training (but on a different day) and were required to meet or exceed an 84.3% minimum passing score (MPS). The entire training, including pre‐ and post‐tests, took approximately 3 hours to complete, and residents were given an additional 1 hour refresher training every 6 months for up to a year after original training. We compared pre‐ and post‐test checklist scores to evaluate skills improvement.
Thoracentesis Patient Identification
The NMH electronic health record (EHR) was used to identify medical service inpatients who underwent a thoracentesis during the study period. NMH clinicians must place an EHR order for procedure kits, consults, and laboratory analysis of thoracentesis fluid. We developed a real‐time query of NMH's EHR that identified all patients with electronic orders for thoracenteses and monitored this daily.
Physician Surveys
After each thoracentesis, we surveyed the PGY‐2 or PGY‐3 resident or hospitalist caring for the patient about the procedure. A research coordinator, blind to whether the resident received SBML, performed the surveys face‐to‐face on Monday to Friday during normal business hours. Residents were not considered SBML‐trained until they met or exceeded the MPS on the simulated skills checklist at post‐test. Surveys occurred on Monday for procedures performed on Friday evening through Sunday. Survey questions asked physicians about who performed the procedure, their procedural self‐confidence, and total number of thoracenteses performed in their career. For referred procedures, physicians were asked about reasons for referral including lack of confidence, work hour restrictions (residents only), and low reimbursement rates.[10] There was also an option to add other reasons.
Measurement
The thoracentesis skills checklist documented all required steps for an evidence‐based thoracentesis. Each task received equal weight (0 = done incorrectly/not done, 1 = done correctly).[9] For physician surveys, self‐confidence about performing the procedure was rated on a scale of 0 = not confident to 100 = very confident. Reasons for referral were scored on a Likert scale 1 to 5 (1 = not at all important, 5 = very important). Other reasons for referral were categorized.
Statistical Analysis
The clinical skills pre‐ and post‐test checklist scores were compared using a Wilcoxon matched pairs rank test. Physician survey data were compared between different procedure performers using the 2 test, independent t test, analysis of variance (ANOVA), or Kruskal‐Wallis test depending on data properties. Referral patterns measured by the Likert scale were averaged, and differences between physician groups were evaluated using ANOVA. Counts of other reasons for referral were compared using the 2 test. We performed all statistical analyses using IBM SPSS Statistics version 23 (IBM Corp., Armonk, NY).
RESULTS
Thoracentesis Clinical Skills
One hundred twelve (70%) residents were randomized to SBML, and all completed the protocol. Median pretest scores were 57.6% (interquartile range [IQR] 43.376.9), and final post‐test mastery scores were 96.2 (IQR 96.2100.0; P < 0.001). Twenty‐three residents (21.0%) failed to meet the MPS at initial post‐test, but met the MPS on retest after <1 hour of additional training.
Physician Surveys
The EHR query identified 474 procedures eligible for physician surveys. One hundred twenty‐two residents and 51 hospitalist physicians completed surveys for 472 procedures (99.6%); 182 patients by traditionally trained residents, 145 by SBML‐trained residents, and 145 by hospitalist physicians. As shown in Table 1, 413 (88%) of all procedures were referred to another service. Traditionally trained residents were more likely to refer to IR compared to SBML‐trained residents or hospitalist physicians. SBML‐trained residents were more likely to perform bedside procedures, whereas hospitalist physicians were most likely to refer to pulmonary medicine. SBML‐trained residents were most confident in their procedural skills, despite hospitalist physicians performing more actual procedures.
| Traditionally Trained Resident Surveys, n = 182 | SBML‐Trained Resident Surveys, n = 145 | Hospitalist Physician Surveys, n = 145 | P Value | |
|---|---|---|---|---|
| ||||
| Bedside procedures, no. (%) | 26 (14.3%) | 32 (22.1%) | 1 (0.7%) | <0.001 |
| IR procedures, no. (%) | 119 (65.4%) | 74 (51.0%) | 82 (56.6%) | 0.029 |
| Pulmonary procedures, no. (%) | 37 (20.3%) | 39 (26.9%) | 62 (42.8%) | <0.001 |
| Procedure self‐confidence, mean (SD)* | 43.6 (28.66) | 68.2 (25.17) | 55.7 (31.17) | <0.001 |
| Experience performing actual procedures, median (IQR) | 1 (13) | 2 (13.5) | 10 (425) | <0.001 |
Traditionally trained residents were most likely to rate low confidence as reasons why they referred thoracenteses (Table 2). Hospitalist physicians were more likely to cite lack of time to perform the procedure themselves. Other reasons were different across groups. SBML‐trained residents were more likely to refer because of attending preference, whereas traditionally trained residents were mostly like to refer because of high risk/technically difficult cases.
| Traditionally Trained Residents, n = 156 | SBML‐Trained Residents, n = 113 | Hospitalist Physicians, n = 144 | P Value | |
|---|---|---|---|---|
| ||||
| Lack of confidence to perform procedure, mean (SD)* | 3.46 (1.32) | 2.52 (1.45) | 2.89 (1.60) | <0.001 |
| Work hour restrictions, mean (SD) * | 2.05 (1.37) | 1.50 (1.11) | n/a | 0.001 |
| Low reimbursement, mean (SD)* | 1.02 (0.12) | 1.0 (0) | 1.22 (0.69) | <0.001 |
| Other reasons for referral, no. (%) | ||||
| Attending preference | 8 (5.1%) | 11 (9.7%) | 3 (2.1%) | 0.025 |
| Don't know how | 6 (3.8%) | 0 | 0 | 0.007 |
| Failed bedside | 0 | 2 (1.8%) | 0 | 0.07 |
| High risk/technically difficult case | 24 (15.4%) | 12 (10.6%) | 5 (3.5%) | 0.003 |
| IR or pulmonary patient | 5 (3.2%) | 2 (1.8%) | 4 (2.8%) | 0.77 |
| Other IR procedure taking place | 11 (7.1%) | 9 (8.0%) | 4 (2.8%) | 0.13 |
| Patient preference | 2 (1.3%) | 7 (6.2%) | 2 (3.5%) | 0.024 |
| Time | 9 (5.8%) | 7 (6.2%) | 29 (20.1%) | <0.001 |
DISCUSSION
This study confirms earlier research showing that thoracentesis SBML improves residents' clinical skills, but is the first to use a randomized study design.[9] Use of the mastery model in health professions education ensures that all learners are competent to provide patient care including performing invasive procedures. Such rigorous education yields downstream translational outcomes including safety profiles comparable to experts.[1, 6]
This study also shows that SBML‐trained residents displayed higher self‐confidence and performed significantly more bedside procedures than traditionally trained residents and more experienced hospitalist physicians. Although the Society of Hospital Medicine considers thoracentesis skills a core competency for hospitalist physicians,[11] we speculate that some hospitalist physicians had not performed a thoracentesis in years. A recent national survey showed that only 44% of hospitalist physicians performed at least 1 thoracentesis within the past year.[10] Research also shows a shift in medical culture to refer procedures to specialty services, such as IR, by over 900% in the past 2 decades.[4] Our results provide novel information about procedure referrals because we show that SBML provides translational outcomes by improving skills and self‐confidence that influence referral patterns. SBML‐trained residents performed almost a quarter of procedures at the bedside. Although this only represents an 8% absolute difference in bedside procedures compared to traditionally trained residents, if a large number of residents are trained using SBML this results in a meaningful number of procedures shifted to the patient bedside. According to University HealthSystem Consortium data, in US teaching hospitals, approximately 35,325 thoracenteses are performed yearly.[1] Shifting even 8% of these procedures to the bedside would result in significant clinical benefit and cost savings. Reduced referrals increase additional bedside procedures that are safe, cost‐effective, and highly satisfying to patients.[1, 12, 13] Further study is required to determine the impact on referral patterns after providing SMBL training to attending physicians.
Our study also provides information about the rationale for procedure referrals. Earlier work speculates that financial incentive, training and time may explain high procedure referral rates.[10] One report on IM residents noted an 87% IR referral rate for thoracentesis, and confirmed that both training and time were major reasons.[14] Hospitalist physicians reported lack of time as the major factor leading to procedural referrals, which is problematic because bedside procedures yield similar clinical outcomes at lower costs.[1, 12] Attending preference also prevented 11 additional bedside procedures in the SBML‐trained group. Schedule adjustments and SBML training of hospitalist physicians should be considered, because bundled payments in the Affordable Care Act may favor shifting to the higher‐value approach of bedside thoracenteses.[15]
Our study has several limitations. First, we only performed surveys at 1 institution and the results may not be generalizable. Second, we relied on an electronic query to alert us to thoracenteses. Our query may have missed procedures that were unsuccessful or did not have EHR orders entered. Third, physicians may have been surveyed more than once for different or the same patient(s), but opinions may have shifted over time. Fourth, some items such as time needed to be written in the survey and were not specifically asked. This could have resulted in under‐reporting. Finally, we did not assess the clinical outcomes of thoracenteses in this study, although earlier work shows that residents who complete SBML have safety outcomes similar to IR.[1, 6]
In summary, IM residents who complete thoracentesis SBML demonstrate improved clinical skills and are more likely to perform bedside procedures. In an era of bundled payments, rethinking current care models to promote cost‐effective care is necessary. We believe providing additional education, training, and support to hospitalist physicians to promote bedside procedures is a promising strategy that warrants further study.
Acknowledgements
The authors acknowledge Drs. Douglas Vaughan and Kevin O'Leary for their support and encouragement of this work. The authors also thank the internal medicine residents at Northwestern for their dedication to patient care.
Disclosures: This project was supported by grant R18HS021202‐01 from the Agency for Healthcare Research and Quality (AHRQ). AHRQ had no role in the preparation, review, or approval of the manuscript. Trial Registration:
- , , , , . Thoracentesis procedures at university hospitals: comparing outcomes by specialty. Jt Comm J Qual Patient Saf. 2015;42(1):34–40.
- American Board of Internal Medicine. Internal medicine policies. Available at: http://www.abim.org/certification/policies/internal‐medicine‐subspecialty‐policies/internal‐medicine.aspx. Accessed March 9, 2016.
- , , , . Pneumothorax following thoracentesis: a systematic review and meta‐analysis. Arch Intern Med. 2010;170(4):332–339.
- , , . National fluid shifts: fifteen‐year trends in paracentesis and thoracentesis procedures. J Am Coll Radiol. 2010;7(11):859–864.
- , , , et al. Cost savings of performing paracentesis procedures at the bedside after simulation‐based education. Simul Healthc. 2014;9(5):312–318.
- , , , , . Clinical outcomes after bedside and interventional radiology paracentesis procedures. Am J Med. 2013;126(4):349–356.
- , , , et al. Simulation technology for health care professional skills training and assessment. JAMA. 1999;282(9):861–866.
- , , , et al. Cost savings from reduced catheter‐related bloodstream infection after simulation‐based education for residents in a medical intensive care unit. Simul Healthc. 2010;5(2):98–102.
- , , , , . Mastery learning of thoracentesis skills by internal medicine residents using simulation technology and deliberate practice. J Hosp Med. 2008;3(1):48–54.
- , , , , . Procedures performed by hospitalist and non‐hospitalist general internists. J Gen Intern Med. 2010;25(5):448–452.
- , , , , . Core competencies in hospital medicine: development and methodology. J Hosp Med. 2006;1(suppl 1):48–56.
- , , , , , . Specialties performing paracentesis procedures at university hospitals: implications for training and certification. J Hosp Med. 2014;9(3):162–168.
- , , , , , . Are we providing patient‐centered care? Preferences about paracentesis and thoracentesis procedures. Patient Exp J. 2014;1(2):94–103. Available at: http://pxjournal.org/cgi/viewcontent.cgi?article=1024
Pharmacist Impact on Transitional Care
Hospital readmissions have a significant impact on the healthcare system. Medicare data suggest a 19% all‐cause 30‐day readmission rate, of which 47% may be preventable.[1, 2] The Centers for Medicare & Medicaid Services continue to expand their criteria of disease states that will be penalized for readmissions, now reducing hospital reimbursement rates up to 3%. Pharmacists, by optimizing patient utilization of medications, can play a valuable role in contributing to preventing readmissions.[3]
Lack of acceptable transitional care is a serious problem that is consistently identified in the literature.[4] Transitional care involves 3 domains of transfer: information, education, and destination. A breakdown in any of these components can negatively impact patients and their caregivers.
Prior studies consistently demonstrated a high likelihood of adverse drug events (ADEs) and patients' lack of knowledge regarding medications postdischarge, both of which can lead to readmission. Forster and colleagues found that 19% to 23% of patients experienced an ADE within 5 weeks of discharge from an inpatient visit, 66% to 72% of which were drug related, and approximately one‐third were deemed preventable.[5, 6] One survey found that less than 60% of patients knew the indication for a new medication prescribed at discharge, whereas only 12% reported knowledge of an anticipated ADE.[7]
Pharmacists can play a large role in the information and education aspect of transitional care. Previous studies demonstrate that pharmacist involvement in the discharge process can reduce the incidence of ADEs and have a positive impact on patient satisfaction. There are conflicting data regarding the effect of comprehensive medication education and follow‐up calls by pharmacy team members on ADEs and medication errors (MEs).[3, 8, 9] Although overall pharmacist participation has shown positive patient‐related outcomes, the impact of pharmacists' involvement on readmissions has not been consistently demonstrated.[10, 11, 12, 13, 14]
Our study evaluated the impact of the pharmacy team in the transitions‐of‐care settings in a unique combination utilizing the pharmacist during medication reconciliation, discharge, and with 3 follow‐up phone call interactions postdischarge. Our study was designed to evaluate the impact of intensive pharmacist involvement during the acute care admission as well as for a 30‐day time period postdischarge on both ADEs and readmissions.
METHODS
All patients were admitted to hospitalist‐based internal medicine units at Northwestern Memorial Hospital, an 894‐bed academic medical center located in Chicago, Illinois. Patients were randomized by study investigators using a random number generator to either the usual care or intervention arms and then evaluated each day for eligibility to participate in the study. Patients remained blinded throughout the study. Patients met inclusion criteria if they were discharged to home and either discharged on greater than 3 scheduled prescription medications or discharged with at least 1 high‐risk medication. High‐risk medications were classified as anticoagulants, antiplatelets (eg, aspirin and clopidogrel), hypoglycemic agents (eg, insulin), immunosuppressants, or anti‐infectives. Patients also needed to participate in a minimum of 1 postdischarge phone call or experience an emergency department (ED) visit or readmission within 30 days of discharge to meet inclusion criteria. Exclusion criteria included: impaired cognition based on Mini‐Cog screening assessment scale, unable or unwilling to provide informed consent, lack of a personal phone number, nonEnglish speaking, subsequent elective readmission within 30 days of initial visit, more than 3 previous hospital admissions in the past 2 months, palliative care or home/skilled nursing hospice, anticipated length of survival less than 3 months, discharged within 24 hours of admission, discharged against medical advice, or discharged before medication education was conducted (Figure 1). Patients who met inclusion criteria provided informed consent, received a Mini‐Cog screening assessment, and were given the Rapid Estimate of Adult Literacy in Medicine revised (REALM‐R) assessment to evaluate health literacy. The REALM‐R is a word recognition test designed to identify patients at risk for poor health literacy skills. Patients with REALM‐R scores of 6 or less are considered to have low health literacy.[15] Patients were randomized to receive either the usual care or pharmacist‐directed medication evaluation and management as described in Table 1. Patients included in the study were contacted by phone postdischarge, with 3 attempts on consecutive days. Patients who were readmitted as an inpatient or had an ED visit were not contacted for the study after that point.
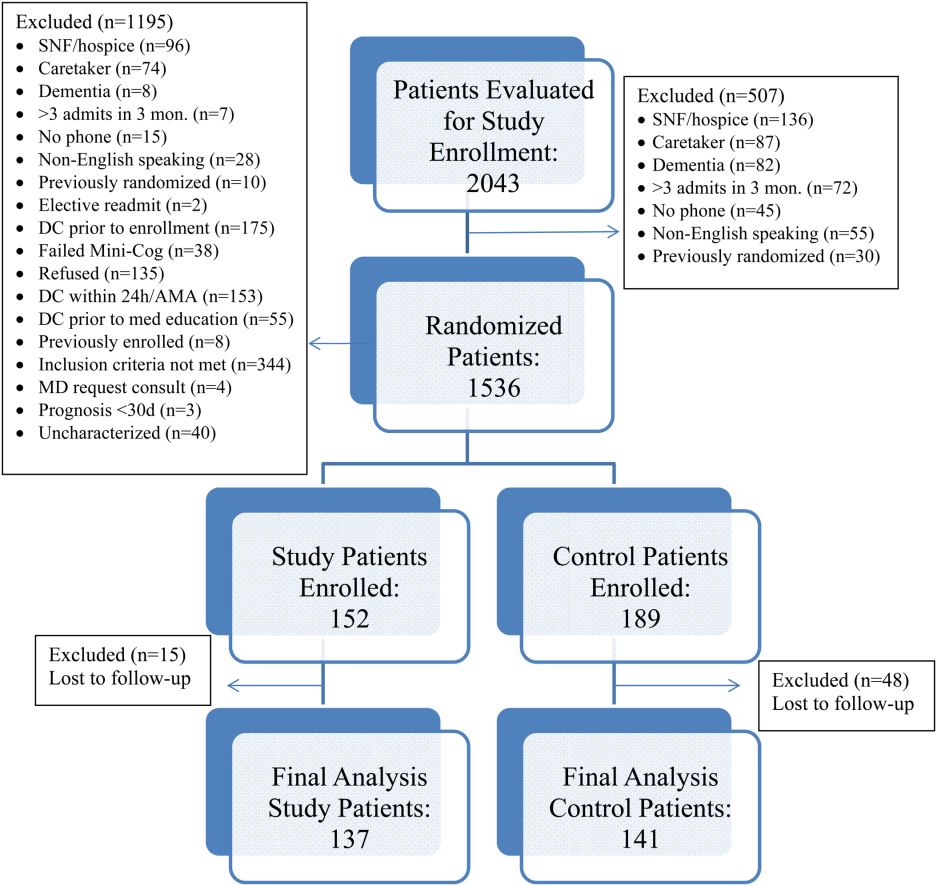
| Admission Medication Reconciliation | Hospitalist (Confirmation by Pharmacist Reviewing the History and Physical Note in Electronic Medical Record) | Performed by Pharmacy Team Member Face to Face |
|---|---|---|
| ||
| Discharge medication reconciliation | Hospitalist | Pharmacy team member |
| Discharge medication education | Hospitalist and/or nurse | Pharmacy team member |
| Individualized medication plan | No | Yes |
| Postdischarge callback day 3 | No | Yes |
| Postdischarge callback day 14 | No | Yes |
| Postdischarge callback day 30 | Yes | Yes |
| Postdischarge call assessment topic(s) | ADEs/MEs, ED visits, inpatient readmissions | ADEs/MEs, ED visits, inpatient readmissions clarify pharmacy/discharge plan, resolve medication‐related issues, identify/overcome adherence barriers |
Patients enrolled in the control group received the usual standard of care by a clinical pharmacist. This included a medication reconciliation completed from the admitting physician's patient history and physical and medication counseling provided by the physician or nursing staff at discharge. Patients were not interviewed face‐to‐face on admission and did not receive discharge counseling by a pharmacy team member. Patients were assessed daily by the pharmacist for evaluation of the pharmacotherapy plans and presence of MEs or safety‐related concerns. The control group received 1 postdischarge phone call from a pharmacist at day 30 to assess for study endpoints of ADEs, MEs, ED visit, and readmission only. The endpoints of ADEs and MEs were determined by professional judgment by the clinical pharmacist based on an algorithm similar to National Coordinating Council for Medication Error Reporting and Prevention, although a specific tool was not utilized.
The study group received face‐to‐face medication reconciliation on admission by a pharmacist or a pharmacy student. Prior to discharge, a personalized medication plan was created by the pharmacist and discussed with the physician. Medication discrepancies were addressed prior to the discharge instructions being given and discussed with the patient. Medication counseling was performed at discharge by the pharmacist or pharmacy student. Patients received 3 phone calls at 3, 14, and 30 days postdischarge. The presence of ADEs and MEs were evaluated during each phone call. The patients were asked to confirm their medication regimens including drug, indication, dose, route, and frequency. They were also asked questions regarding possible side effects, new symptoms, and any changes to their current therapy. The calls focused on clarifying the pharmacy discharge plan, resolving any unanswered questions or medication‐related issues, identifying and overcoming any barriers to adherence, and assistance with providing patients access to medications by contacting pharmacies and physicians to resolve and troubleshoot further prescription claims and clarifications. Pharmacists performed all postdischarge phone calls. Pharmacy students were able to provide face‐to‐face medication reconciliation upon admission and discharge counseling under the supervision of the pharmacist for the intervention arm.
The patient Hospital Consumer Assessment of Healthcare Providers and Systems (HCAHPS) responses to the medication domain question, Did you clearly understand the purpose for taking each of your medications at the time of discharge? were collected for the 2 designated hospitalist units for both the control and study groups. HCAHPS scores were collected at the 6 months point prior to the study initiation and throughout the 6‐month study period for the control and intervention groups. A physician and 2 pharmacists, who were blinded to the study randomization and results, assessed all Northwestern Memorial Hospital readmissions to determine if the readmissions were medication‐related or not.
This study obtained institutional review board approval from Northwestern University.
Data Collected
Data collected from all patients included demographics (age, sex), payer, reason for admission, number of medications at time of discharge, Charlson Comorbidity Index score, number of high‐risk medications prescribed at time of discharge, length of stay, REALM‐R score, ADEs, inpatient readmission or ED visit, and the reason for readmission or ED visit. Only the first occurrence was counted for patients with both an ED visit and an inpatient readmission. It was estimated that a sample size of 150 patients in each group would provide 80% power to demonstrate a 20% improvement in ADE rates in the study group. Data were analyzed utilizing Fischer exact, 2, and Student t tests, and multivariate logistic regression as appropriate. Analyses were performed using SAS version 9.4 (SAS Institute, Inc., Cary, NC).
RESULTS
Over the course of 7 months, 341 patients were enrolled in the study, 189 in the control arm and 152 in the study arm. Forty‐eight patients in the control group and 15 patients in the study group were lost to follow‐up. The final analysis included 278 patients, 141 in the control group and 137 in the study group. Patients were eligible for study inclusion if they received at least 1 phone call, which resulted in more patients being lost to follow‐up in the control arm due to fewer total phone call attempts. Demographic and disposition data for the control and study groups are shown in Table 2. Baseline characteristics between the 2 groups were similar with the exception of total medications at time of discharge. The control group had more total medications at discharge compared to the study group (7.2 vs 6.4, P=0.04). The number of high‐risk medications and the number of scheduled medications were similar between both groups. During medication reconciliation, 380 discrepancies (46.2%) were found in the study group compared to 205 (19.9%) in the control group (P<0.0001). The higher number of identified discrepancies in the study group was expected due to the fact that the pharmacist did not complete a face‐to‐face medication history in the control patients. The average length of stay, REALM‐R scores, and reason for admissions were similar between the 2 groups (Table 2).
| Study, N=137 | Control, N=141 | P Value | |
|---|---|---|---|
| |||
| Sex, male | 52 (37.95%) | 59 (41.8%) | 0.54 |
| Average age, y | 55.4 | 55.8 | 0.87 |
| Average length of stay, d | 5.4 (range, 1104) | 4.6 (range, 028) | 0.67 |
| Average REALM‐R score (range, 08) | 6.8 | 6.7 | 0.67 |
| Average total no. of medications | 6.4 | 7.2 | 0.04 |
| Average no. of scheduled medications | 5.7 | 6.2 | 0.15 |
| Average no. of high‐risk category medications | 2.2 | 2.3 | 0.64 |
| Reason for admission | |||
| Cardiovascular disease | 5 (3.4%) | 15 (8.3%) | 0.035 |
| Pneumonia | 11 (7.5%) | 8 (4.4%) | 0.48 |
| Respiratory | 11 (7.5%) | 9 (5%) | 0.65 |
| Infectious disease | 39 (26.5%) | 53 (29.3%) | 0.13 |
| Gastrointestinal | 25 (17%) | 28 (15.5%) | 0.13 |
| Endocrine | 20 (13.6%) | 34 (18.8%) | 0.76 |
| Genitourinary | 0 (0%) | 0 (0%) | 0.05 |
| Hematological | 19 (12.9%) | 20 (11%) | 1 |
| Injury | 10 (6.8%) | 14 (7.7%) | 1 |
| Neurological | 2 (1.4%) | 0 (0%) | 0.52 |
| Heart failure | 4 (2.7%) | 0 (0%) | 0.24 |
| Myocardial infarction | 0 (0%) | 0 (0%) | 0.58 |
| Mental/substance abuse | 1 (0.7%) | 0 (0%) | 1 |
A total of 55 patients (39%) in the control arm were readmitted to an inpatient hospital or had an ED visit within 30‐days postdischarge compared to 34 patients (24.8%) in the study group (P=0.001) (Table 3). Of the patients readmitted to the ED, 21 were enrolled in the control arm (14.8%) compared to only 6 patients in the study arm (4.4%) (P=0.005). Reviewers concluded that 24% of the control group readmissions were medication‐related versus 23% of the study group (P=1.0). In total, 78 out of 89 readmissions were to Northwestern Memorial Hospital. Medication‐related causes to outside institutions were not evaluated. The causes for all readmissions were not evaluated.
| Study Group, n=137 | Control Group, n=141 | P Value | |
|---|---|---|---|
| |||
| Composite inpatient readmission and ED visit | 34 (24.8%) | 55 (38.7%) | 0.001 |
| ED visits | 6 (4.4%) | 21 (14.8%) | 0.005 |
| Inpatient readmissions | 28 (20.4%) | 34 (23.9%) | 0.43 |
| Medication‐related readmissions | 8 (23.5%) | 13 (23.6%) | 1.0 |
| ADEs/MEs reported at 30‐day phone call | 11/84 patients | 18/86 patients | 0.22 |
| Days to readmission/ED visit | 7.9 (SD 12.5) | 13.2 (SD 9.61) | 0.03 |
| Preintervention: HCAHPS scores pertaining to knowledge of indication of medication question preintervention | 47% | ||
| Postintervention: HCAHPS scores pertaining to knowledge of indication of medication question postintervention | 56% | ||
A sensitivity analysis was undertaken to understand the impact of the lost to follow‐up rate in both the control and study groups. Undertaking an assumption that all 15 patients lost to follow‐up in the study group were readmitted and that 15 of 48 patients lost to follow‐up in the control group were readmitted, the intervention continued to show a significant benefit in reduction of composite ED and inpatient readmissions (35.7% study group vs 49.6% control group, P=0.022)
Multivariate logistic regression analysis that controlled for Charlson Comorbidity Index score, length of stay, total number of medications on discharge, and payer type showed an adjusted odds ratio of 0.55 (95% confidence interval [CI]: 0.32‐0.94) in the intervention cohort compared to controls for the combined endpoint of readmission and ED visit within 30‐days postdischarge. The adjusted odds ratio for 30‐day readmission alone was 0.88 (95% CI: 0.49‐1.61).
Eighteen of the 86 control patients who received a 30‐day postdischarge phone call experienced an ADE or ME compared to 11 of the 83 study patients (P=0.22). Patient satisfaction scores of both designated units as represented by the HCAHPS score in the medication knowledge domain increased from the prestudy period. Patients selected agree or strongly agree only 47% of the time at the 6‐month prestudy point compared to 56% of the time during the 6‐month study period.
DISCUSSION
Although previous studies show conflicting results regarding the impact of pharmacist interventions on readmissions, our study demonstrated a decrease in the composite measure of inpatient readmissions and ED visits. Its success stresses the need for a comprehensive approach that contains continuity of care by healthcare providers to reconcile and manage medications throughout the hospital stay, extending up to a full month postdischarge with multiple phone calls. This included (1) face‐to‐face medication reconciliation on admission, (2) development of a personalized medication plan discussed with the patient's physician, (3) addressing any medication discrepancies to the discharge instructions being given to the patient, (4) medication counseling performed at discharge, and (5) 3 postdischarge phone calls at 3, 14, and 30 days.
A study conducted in 2001 analyzed the Medicare Current Beneficiary Survey (MCBS) and found that living alone, having limited education, and lack of self‐management skills have significant associations with early readmission.[16] Approximately 80 million Americans have limited health literacy and are associated with poor health outcomes and healthcare utilization as seen in a review completed by Berkman and colleagues.[17] Because no difference was found between both groups, it would suggest health literacy did not influence or bias the study group. Additionally, no statistically different medication issues, such as total number of medications or rates of ADEs and MEs, were identified in the patients of this study. This may be explained by the small, final population size at the 30‐day period or that the impact of the pharmacist intervention did not reach the threshold that this study was powered to detect. Also, a lack of statistical significance may be due to the subjective nature of ADEs/MEs and the prevention of ADEs/MEs throughout all patients' hospitalizations from the clinical pharmacist's involvement in care, which was not collected. Although a combined endpoint collecting readmission to either the ED or rehospitalization was lower in the intervention cohort, the isolated rehospitalization endpoint was not significantly different between the 2 groups. ED utilization was markedly decreased, but we may have lacked the power to show a statistically significant decrease in rehospitalization. These results mirror those of the Project RED (Re‐Engineered Discharge) intervention.[17]
HCAHPS surveys are sent to only a small percent of randomly selected patients who are discharged from the hospital. Thus, respondents may or may not have been included in the study, indicating a possible greater impact of the intervention on individual patients than collected. Importantly, the described interventions appeared to improve patients' perception of understanding the purpose of their medications. We found that HCAHPS scores across the 2 units improved, though the intervention only impacted 16.8% of all patients discharged from these units due to the nature of the survey distribution.
The pharmacists' abilities to educate all eligible patients prior to discharge from 7:30 am to 4:00 pm each day of the week was a limitation of this study, as some patients were discharged outside of the duty hours. This may have allowed for a differential exclusion and could have led to selection bias. Another limitation is that a large number of patients were lost to follow‐up in the control group, likely because the first postdischarge contact with patients was not until the day 30 phone calls. The extensive exclusion criteria caused many patients not to be enrolled. Though the intervention arm received postdischarge phone calls at days 3 and 14, only postdischarge call‐backs at day 30 of the intervention arm were compared to the control arm, which could have led to bias in the 30‐day analysis of the intervention arm, as patients may have not reported previous issues that were resolved in earlier phone calls. Medication‐related readmissions were not statistically different between the groups, which could suggest that the difference in readmissions were not solely due to the intervention, and a decrease in healthcare utilization may be due to chance. The subjective nature of how ADEs and MEs were collected also serves as a limitation, as they were only screened for presence or absence and not classified by severity or category. This study was at a single‐center academic institution, which may limit the ability to apply the results to other institutions. Last, outcome assessments relied on participant report, including ADE and ME occurrence and presentation at outside hospitals. Future study evaluation conducted as a multicenter design while continuing to strengthen the continuity of the healthcare provider and patient relationship at each intervention would be ideal. Also, having an objective measure of ADEs and MEs with severity categorization would be beneficial.
Compared to previous literature, our study design was unique in the number of phone calls made to patients postdischarge and its prospective, randomized design. In the previously mentioned study by Walker et al., phone calls were made only at days 3 and 30.[13] Although the majority of readmissions occurred within the first 14 days of discharge, additional visits to the ED and readmissions may have been avoided by contacting patients twice within the critical 14‐day period. Another distinction of this study design was the expansion of a rather limited and peripheral pharmacist role in transitions of care to a much more integrated participation. We believe the relationship developed between patients and their pharmacy care team provided coordination and the continuity of communication regarding their care. Additionally, our study was unique through the use of pharmacy extenders via fourth‐year pharmacy students who were completing their advanced pharmacy practice rotations. Pharmacy extenders can also be certified and trained pharmacy technicians, which many hospitals utilize to perform medication reconciliations at a lower cost than pharmacists. As hospitals face increased demands to shrink budgets due to decreasing reimbursements, healthcare systems will be forced to find creative new ways to use existing resources.
In conclusion, transition of care is a high‐risk situation for many patients. A comprehensive approach by healthcare providers, including pharmacists and pharmacy extenders, may have a positive impact in reducing or preventing ADEs/MEs, inpatient admissions, and ED visits. Although our study focused directly on the impact of a pharmacy care team on transitions‐of‐care, we cannot conclude this applies strictly to pharmacists. Across the nation, the role of various disciplines of healthcare providers in admission, hospitalization, discharge, and postdischarge is not standardized and varies significantly by institution. Importantly, no mechanism currently exists to directly reimburse for such efforts, but demonstration of cost effectiveness through reduced posthospital utilization may justify this investment for accountable care organizations.[18]
- , , , , , . Medicare readmission rates show meaningful decline in 2012. Medicare Medicaid Res Rev. 2013;3(2):E1‐E11.
- , , , et al. Factors contributing to all‐cause 30‐day readmissions: a structured case series across 18 hospitals. Med Care. 2012:50(7):599–605.
- , , , et al. Role of pharmacist counseling in preventing adverse events after hospitalization. Arch Intern Med. 2006;66:565–571.
- , , . Optimizing transitions of care to reduce rehospitalizations. Cleve Clin J Med. 2014;81(5):1–9.
- , , , , . The incidence and severity of adverse events affecting patients following discharge from the hospital. Ann Intern Med. 2003;138:161–167.
- , . Adverse drug events occurring following hospital discharge. J Gen Intern Med. 2005;20:317–323.
- . What do discharged patients know about their medications? Patient Educ Couns. 2005;56:276–282.
- , , , . The impact of telephone calls to patients after hospitalization. Dis Mon. 2002;48:239–248.
- , , , et al. Effect of a pharmacist intervention on clinically important medication errors after hospital discharge: a randomized trial. Ann Intern Med. 2012;157:1–10.
- , , , et al. A reengineered hospital discharge program to decrease rehospitalization: a randomized trial. Ann Intern Med. 2009;150(3):178–187.
- , , , , . The value of inpatient pharmaceutical counselling to elderly patients prior to discharge. Br J Clin Pharmacol. 2002;54:657–664.
- , , , . Postdischarge pharmacist medication reconciliation: impact on readmission rates and financial savings. J Am Pharm Assoc (2003). 2013;53(1):78–84.
- , , , et al. Impact of pharmacist‐facilitated hospital discharge program. Arch Intern Med. 2009;169:2003–2010.
- , , , et al. Does pharmacist‐led medication review help to reduce hospital admissions and deaths in older people? A systematic review and meta‐analysis. Br J Clin Pharmacol. 2008;65(3):303–316.
- . The meaning and the measure of health literacy. J Gen Intern Med. 2006;21(8):878–883.
- , , , , , . Postdischarge environmental and socioeconomic factors and the likelihood of early hospital readmission among community‐dwelling Medicare beneficiaries. Gerontologist. 2008;48(4):495–504.
- , , , , . Low health literacy and health outcomes: an updated systematic review. Ann Intern Med. 2011;155(2):97–107.
- , , , et al. Fostering accountable health care: moving forward in Medicare. Health Affairs. 2009;28(2):219–231.
Hospital readmissions have a significant impact on the healthcare system. Medicare data suggest a 19% all‐cause 30‐day readmission rate, of which 47% may be preventable.[1, 2] The Centers for Medicare & Medicaid Services continue to expand their criteria of disease states that will be penalized for readmissions, now reducing hospital reimbursement rates up to 3%. Pharmacists, by optimizing patient utilization of medications, can play a valuable role in contributing to preventing readmissions.[3]
Lack of acceptable transitional care is a serious problem that is consistently identified in the literature.[4] Transitional care involves 3 domains of transfer: information, education, and destination. A breakdown in any of these components can negatively impact patients and their caregivers.
Prior studies consistently demonstrated a high likelihood of adverse drug events (ADEs) and patients' lack of knowledge regarding medications postdischarge, both of which can lead to readmission. Forster and colleagues found that 19% to 23% of patients experienced an ADE within 5 weeks of discharge from an inpatient visit, 66% to 72% of which were drug related, and approximately one‐third were deemed preventable.[5, 6] One survey found that less than 60% of patients knew the indication for a new medication prescribed at discharge, whereas only 12% reported knowledge of an anticipated ADE.[7]
Pharmacists can play a large role in the information and education aspect of transitional care. Previous studies demonstrate that pharmacist involvement in the discharge process can reduce the incidence of ADEs and have a positive impact on patient satisfaction. There are conflicting data regarding the effect of comprehensive medication education and follow‐up calls by pharmacy team members on ADEs and medication errors (MEs).[3, 8, 9] Although overall pharmacist participation has shown positive patient‐related outcomes, the impact of pharmacists' involvement on readmissions has not been consistently demonstrated.[10, 11, 12, 13, 14]
Our study evaluated the impact of the pharmacy team in the transitions‐of‐care settings in a unique combination utilizing the pharmacist during medication reconciliation, discharge, and with 3 follow‐up phone call interactions postdischarge. Our study was designed to evaluate the impact of intensive pharmacist involvement during the acute care admission as well as for a 30‐day time period postdischarge on both ADEs and readmissions.
METHODS
All patients were admitted to hospitalist‐based internal medicine units at Northwestern Memorial Hospital, an 894‐bed academic medical center located in Chicago, Illinois. Patients were randomized by study investigators using a random number generator to either the usual care or intervention arms and then evaluated each day for eligibility to participate in the study. Patients remained blinded throughout the study. Patients met inclusion criteria if they were discharged to home and either discharged on greater than 3 scheduled prescription medications or discharged with at least 1 high‐risk medication. High‐risk medications were classified as anticoagulants, antiplatelets (eg, aspirin and clopidogrel), hypoglycemic agents (eg, insulin), immunosuppressants, or anti‐infectives. Patients also needed to participate in a minimum of 1 postdischarge phone call or experience an emergency department (ED) visit or readmission within 30 days of discharge to meet inclusion criteria. Exclusion criteria included: impaired cognition based on Mini‐Cog screening assessment scale, unable or unwilling to provide informed consent, lack of a personal phone number, nonEnglish speaking, subsequent elective readmission within 30 days of initial visit, more than 3 previous hospital admissions in the past 2 months, palliative care or home/skilled nursing hospice, anticipated length of survival less than 3 months, discharged within 24 hours of admission, discharged against medical advice, or discharged before medication education was conducted (Figure 1). Patients who met inclusion criteria provided informed consent, received a Mini‐Cog screening assessment, and were given the Rapid Estimate of Adult Literacy in Medicine revised (REALM‐R) assessment to evaluate health literacy. The REALM‐R is a word recognition test designed to identify patients at risk for poor health literacy skills. Patients with REALM‐R scores of 6 or less are considered to have low health literacy.[15] Patients were randomized to receive either the usual care or pharmacist‐directed medication evaluation and management as described in Table 1. Patients included in the study were contacted by phone postdischarge, with 3 attempts on consecutive days. Patients who were readmitted as an inpatient or had an ED visit were not contacted for the study after that point.
| Admission Medication Reconciliation | Hospitalist (Confirmation by Pharmacist Reviewing the History and Physical Note in Electronic Medical Record) | Performed by Pharmacy Team Member Face to Face |
|---|---|---|
| ||
| Discharge medication reconciliation | Hospitalist | Pharmacy team member |
| Discharge medication education | Hospitalist and/or nurse | Pharmacy team member |
| Individualized medication plan | No | Yes |
| Postdischarge callback day 3 | No | Yes |
| Postdischarge callback day 14 | No | Yes |
| Postdischarge callback day 30 | Yes | Yes |
| Postdischarge call assessment topic(s) | ADEs/MEs, ED visits, inpatient readmissions | ADEs/MEs, ED visits, inpatient readmissions clarify pharmacy/discharge plan, resolve medication‐related issues, identify/overcome adherence barriers |
Patients enrolled in the control group received the usual standard of care by a clinical pharmacist. This included a medication reconciliation completed from the admitting physician's patient history and physical and medication counseling provided by the physician or nursing staff at discharge. Patients were not interviewed face‐to‐face on admission and did not receive discharge counseling by a pharmacy team member. Patients were assessed daily by the pharmacist for evaluation of the pharmacotherapy plans and presence of MEs or safety‐related concerns. The control group received 1 postdischarge phone call from a pharmacist at day 30 to assess for study endpoints of ADEs, MEs, ED visit, and readmission only. The endpoints of ADEs and MEs were determined by professional judgment by the clinical pharmacist based on an algorithm similar to National Coordinating Council for Medication Error Reporting and Prevention, although a specific tool was not utilized.
The study group received face‐to‐face medication reconciliation on admission by a pharmacist or a pharmacy student. Prior to discharge, a personalized medication plan was created by the pharmacist and discussed with the physician. Medication discrepancies were addressed prior to the discharge instructions being given and discussed with the patient. Medication counseling was performed at discharge by the pharmacist or pharmacy student. Patients received 3 phone calls at 3, 14, and 30 days postdischarge. The presence of ADEs and MEs were evaluated during each phone call. The patients were asked to confirm their medication regimens including drug, indication, dose, route, and frequency. They were also asked questions regarding possible side effects, new symptoms, and any changes to their current therapy. The calls focused on clarifying the pharmacy discharge plan, resolving any unanswered questions or medication‐related issues, identifying and overcoming any barriers to adherence, and assistance with providing patients access to medications by contacting pharmacies and physicians to resolve and troubleshoot further prescription claims and clarifications. Pharmacists performed all postdischarge phone calls. Pharmacy students were able to provide face‐to‐face medication reconciliation upon admission and discharge counseling under the supervision of the pharmacist for the intervention arm.
The patient Hospital Consumer Assessment of Healthcare Providers and Systems (HCAHPS) responses to the medication domain question, Did you clearly understand the purpose for taking each of your medications at the time of discharge? were collected for the 2 designated hospitalist units for both the control and study groups. HCAHPS scores were collected at the 6 months point prior to the study initiation and throughout the 6‐month study period for the control and intervention groups. A physician and 2 pharmacists, who were blinded to the study randomization and results, assessed all Northwestern Memorial Hospital readmissions to determine if the readmissions were medication‐related or not.
This study obtained institutional review board approval from Northwestern University.
Data Collected
Data collected from all patients included demographics (age, sex), payer, reason for admission, number of medications at time of discharge, Charlson Comorbidity Index score, number of high‐risk medications prescribed at time of discharge, length of stay, REALM‐R score, ADEs, inpatient readmission or ED visit, and the reason for readmission or ED visit. Only the first occurrence was counted for patients with both an ED visit and an inpatient readmission. It was estimated that a sample size of 150 patients in each group would provide 80% power to demonstrate a 20% improvement in ADE rates in the study group. Data were analyzed utilizing Fischer exact, 2, and Student t tests, and multivariate logistic regression as appropriate. Analyses were performed using SAS version 9.4 (SAS Institute, Inc., Cary, NC).
RESULTS
Over the course of 7 months, 341 patients were enrolled in the study, 189 in the control arm and 152 in the study arm. Forty‐eight patients in the control group and 15 patients in the study group were lost to follow‐up. The final analysis included 278 patients, 141 in the control group and 137 in the study group. Patients were eligible for study inclusion if they received at least 1 phone call, which resulted in more patients being lost to follow‐up in the control arm due to fewer total phone call attempts. Demographic and disposition data for the control and study groups are shown in Table 2. Baseline characteristics between the 2 groups were similar with the exception of total medications at time of discharge. The control group had more total medications at discharge compared to the study group (7.2 vs 6.4, P=0.04). The number of high‐risk medications and the number of scheduled medications were similar between both groups. During medication reconciliation, 380 discrepancies (46.2%) were found in the study group compared to 205 (19.9%) in the control group (P<0.0001). The higher number of identified discrepancies in the study group was expected due to the fact that the pharmacist did not complete a face‐to‐face medication history in the control patients. The average length of stay, REALM‐R scores, and reason for admissions were similar between the 2 groups (Table 2).
| Study, N=137 | Control, N=141 | P Value | |
|---|---|---|---|
| |||
| Sex, male | 52 (37.95%) | 59 (41.8%) | 0.54 |
| Average age, y | 55.4 | 55.8 | 0.87 |
| Average length of stay, d | 5.4 (range, 1104) | 4.6 (range, 028) | 0.67 |
| Average REALM‐R score (range, 08) | 6.8 | 6.7 | 0.67 |
| Average total no. of medications | 6.4 | 7.2 | 0.04 |
| Average no. of scheduled medications | 5.7 | 6.2 | 0.15 |
| Average no. of high‐risk category medications | 2.2 | 2.3 | 0.64 |
| Reason for admission | |||
| Cardiovascular disease | 5 (3.4%) | 15 (8.3%) | 0.035 |
| Pneumonia | 11 (7.5%) | 8 (4.4%) | 0.48 |
| Respiratory | 11 (7.5%) | 9 (5%) | 0.65 |
| Infectious disease | 39 (26.5%) | 53 (29.3%) | 0.13 |
| Gastrointestinal | 25 (17%) | 28 (15.5%) | 0.13 |
| Endocrine | 20 (13.6%) | 34 (18.8%) | 0.76 |
| Genitourinary | 0 (0%) | 0 (0%) | 0.05 |
| Hematological | 19 (12.9%) | 20 (11%) | 1 |
| Injury | 10 (6.8%) | 14 (7.7%) | 1 |
| Neurological | 2 (1.4%) | 0 (0%) | 0.52 |
| Heart failure | 4 (2.7%) | 0 (0%) | 0.24 |
| Myocardial infarction | 0 (0%) | 0 (0%) | 0.58 |
| Mental/substance abuse | 1 (0.7%) | 0 (0%) | 1 |
A total of 55 patients (39%) in the control arm were readmitted to an inpatient hospital or had an ED visit within 30‐days postdischarge compared to 34 patients (24.8%) in the study group (P=0.001) (Table 3). Of the patients readmitted to the ED, 21 were enrolled in the control arm (14.8%) compared to only 6 patients in the study arm (4.4%) (P=0.005). Reviewers concluded that 24% of the control group readmissions were medication‐related versus 23% of the study group (P=1.0). In total, 78 out of 89 readmissions were to Northwestern Memorial Hospital. Medication‐related causes to outside institutions were not evaluated. The causes for all readmissions were not evaluated.
| Study Group, n=137 | Control Group, n=141 | P Value | |
|---|---|---|---|
| |||
| Composite inpatient readmission and ED visit | 34 (24.8%) | 55 (38.7%) | 0.001 |
| ED visits | 6 (4.4%) | 21 (14.8%) | 0.005 |
| Inpatient readmissions | 28 (20.4%) | 34 (23.9%) | 0.43 |
| Medication‐related readmissions | 8 (23.5%) | 13 (23.6%) | 1.0 |
| ADEs/MEs reported at 30‐day phone call | 11/84 patients | 18/86 patients | 0.22 |
| Days to readmission/ED visit | 7.9 (SD 12.5) | 13.2 (SD 9.61) | 0.03 |
| Preintervention: HCAHPS scores pertaining to knowledge of indication of medication question preintervention | 47% | ||
| Postintervention: HCAHPS scores pertaining to knowledge of indication of medication question postintervention | 56% | ||
A sensitivity analysis was undertaken to understand the impact of the lost to follow‐up rate in both the control and study groups. Undertaking an assumption that all 15 patients lost to follow‐up in the study group were readmitted and that 15 of 48 patients lost to follow‐up in the control group were readmitted, the intervention continued to show a significant benefit in reduction of composite ED and inpatient readmissions (35.7% study group vs 49.6% control group, P=0.022)
Multivariate logistic regression analysis that controlled for Charlson Comorbidity Index score, length of stay, total number of medications on discharge, and payer type showed an adjusted odds ratio of 0.55 (95% confidence interval [CI]: 0.32‐0.94) in the intervention cohort compared to controls for the combined endpoint of readmission and ED visit within 30‐days postdischarge. The adjusted odds ratio for 30‐day readmission alone was 0.88 (95% CI: 0.49‐1.61).
Eighteen of the 86 control patients who received a 30‐day postdischarge phone call experienced an ADE or ME compared to 11 of the 83 study patients (P=0.22). Patient satisfaction scores of both designated units as represented by the HCAHPS score in the medication knowledge domain increased from the prestudy period. Patients selected agree or strongly agree only 47% of the time at the 6‐month prestudy point compared to 56% of the time during the 6‐month study period.
DISCUSSION
Although previous studies show conflicting results regarding the impact of pharmacist interventions on readmissions, our study demonstrated a decrease in the composite measure of inpatient readmissions and ED visits. Its success stresses the need for a comprehensive approach that contains continuity of care by healthcare providers to reconcile and manage medications throughout the hospital stay, extending up to a full month postdischarge with multiple phone calls. This included (1) face‐to‐face medication reconciliation on admission, (2) development of a personalized medication plan discussed with the patient's physician, (3) addressing any medication discrepancies to the discharge instructions being given to the patient, (4) medication counseling performed at discharge, and (5) 3 postdischarge phone calls at 3, 14, and 30 days.
A study conducted in 2001 analyzed the Medicare Current Beneficiary Survey (MCBS) and found that living alone, having limited education, and lack of self‐management skills have significant associations with early readmission.[16] Approximately 80 million Americans have limited health literacy and are associated with poor health outcomes and healthcare utilization as seen in a review completed by Berkman and colleagues.[17] Because no difference was found between both groups, it would suggest health literacy did not influence or bias the study group. Additionally, no statistically different medication issues, such as total number of medications or rates of ADEs and MEs, were identified in the patients of this study. This may be explained by the small, final population size at the 30‐day period or that the impact of the pharmacist intervention did not reach the threshold that this study was powered to detect. Also, a lack of statistical significance may be due to the subjective nature of ADEs/MEs and the prevention of ADEs/MEs throughout all patients' hospitalizations from the clinical pharmacist's involvement in care, which was not collected. Although a combined endpoint collecting readmission to either the ED or rehospitalization was lower in the intervention cohort, the isolated rehospitalization endpoint was not significantly different between the 2 groups. ED utilization was markedly decreased, but we may have lacked the power to show a statistically significant decrease in rehospitalization. These results mirror those of the Project RED (Re‐Engineered Discharge) intervention.[17]
HCAHPS surveys are sent to only a small percent of randomly selected patients who are discharged from the hospital. Thus, respondents may or may not have been included in the study, indicating a possible greater impact of the intervention on individual patients than collected. Importantly, the described interventions appeared to improve patients' perception of understanding the purpose of their medications. We found that HCAHPS scores across the 2 units improved, though the intervention only impacted 16.8% of all patients discharged from these units due to the nature of the survey distribution.
The pharmacists' abilities to educate all eligible patients prior to discharge from 7:30 am to 4:00 pm each day of the week was a limitation of this study, as some patients were discharged outside of the duty hours. This may have allowed for a differential exclusion and could have led to selection bias. Another limitation is that a large number of patients were lost to follow‐up in the control group, likely because the first postdischarge contact with patients was not until the day 30 phone calls. The extensive exclusion criteria caused many patients not to be enrolled. Though the intervention arm received postdischarge phone calls at days 3 and 14, only postdischarge call‐backs at day 30 of the intervention arm were compared to the control arm, which could have led to bias in the 30‐day analysis of the intervention arm, as patients may have not reported previous issues that were resolved in earlier phone calls. Medication‐related readmissions were not statistically different between the groups, which could suggest that the difference in readmissions were not solely due to the intervention, and a decrease in healthcare utilization may be due to chance. The subjective nature of how ADEs and MEs were collected also serves as a limitation, as they were only screened for presence or absence and not classified by severity or category. This study was at a single‐center academic institution, which may limit the ability to apply the results to other institutions. Last, outcome assessments relied on participant report, including ADE and ME occurrence and presentation at outside hospitals. Future study evaluation conducted as a multicenter design while continuing to strengthen the continuity of the healthcare provider and patient relationship at each intervention would be ideal. Also, having an objective measure of ADEs and MEs with severity categorization would be beneficial.
Compared to previous literature, our study design was unique in the number of phone calls made to patients postdischarge and its prospective, randomized design. In the previously mentioned study by Walker et al., phone calls were made only at days 3 and 30.[13] Although the majority of readmissions occurred within the first 14 days of discharge, additional visits to the ED and readmissions may have been avoided by contacting patients twice within the critical 14‐day period. Another distinction of this study design was the expansion of a rather limited and peripheral pharmacist role in transitions of care to a much more integrated participation. We believe the relationship developed between patients and their pharmacy care team provided coordination and the continuity of communication regarding their care. Additionally, our study was unique through the use of pharmacy extenders via fourth‐year pharmacy students who were completing their advanced pharmacy practice rotations. Pharmacy extenders can also be certified and trained pharmacy technicians, which many hospitals utilize to perform medication reconciliations at a lower cost than pharmacists. As hospitals face increased demands to shrink budgets due to decreasing reimbursements, healthcare systems will be forced to find creative new ways to use existing resources.
In conclusion, transition of care is a high‐risk situation for many patients. A comprehensive approach by healthcare providers, including pharmacists and pharmacy extenders, may have a positive impact in reducing or preventing ADEs/MEs, inpatient admissions, and ED visits. Although our study focused directly on the impact of a pharmacy care team on transitions‐of‐care, we cannot conclude this applies strictly to pharmacists. Across the nation, the role of various disciplines of healthcare providers in admission, hospitalization, discharge, and postdischarge is not standardized and varies significantly by institution. Importantly, no mechanism currently exists to directly reimburse for such efforts, but demonstration of cost effectiveness through reduced posthospital utilization may justify this investment for accountable care organizations.[18]
- , , , , , . Medicare readmission rates show meaningful decline in 2012. Medicare Medicaid Res Rev. 2013;3(2):E1‐E11.
- , , , et al. Factors contributing to all‐cause 30‐day readmissions: a structured case series across 18 hospitals. Med Care. 2012:50(7):599–605.
- , , , et al. Role of pharmacist counseling in preventing adverse events after hospitalization. Arch Intern Med. 2006;66:565–571.
- , , . Optimizing transitions of care to reduce rehospitalizations. Cleve Clin J Med. 2014;81(5):1–9.
- , , , , . The incidence and severity of adverse events affecting patients following discharge from the hospital. Ann Intern Med. 2003;138:161–167.
- , . Adverse drug events occurring following hospital discharge. J Gen Intern Med. 2005;20:317–323.
- . What do discharged patients know about their medications? Patient Educ Couns. 2005;56:276–282.
- , , , . The impact of telephone calls to patients after hospitalization. Dis Mon. 2002;48:239–248.
- , , , et al. Effect of a pharmacist intervention on clinically important medication errors after hospital discharge: a randomized trial. Ann Intern Med. 2012;157:1–10.
- , , , et al. A reengineered hospital discharge program to decrease rehospitalization: a randomized trial. Ann Intern Med. 2009;150(3):178–187.
- , , , , . The value of inpatient pharmaceutical counselling to elderly patients prior to discharge. Br J Clin Pharmacol. 2002;54:657–664.
- , , , . Postdischarge pharmacist medication reconciliation: impact on readmission rates and financial savings. J Am Pharm Assoc (2003). 2013;53(1):78–84.
- , , , et al. Impact of pharmacist‐facilitated hospital discharge program. Arch Intern Med. 2009;169:2003–2010.
- , , , et al. Does pharmacist‐led medication review help to reduce hospital admissions and deaths in older people? A systematic review and meta‐analysis. Br J Clin Pharmacol. 2008;65(3):303–316.
- . The meaning and the measure of health literacy. J Gen Intern Med. 2006;21(8):878–883.
- , , , , , . Postdischarge environmental and socioeconomic factors and the likelihood of early hospital readmission among community‐dwelling Medicare beneficiaries. Gerontologist. 2008;48(4):495–504.
- , , , , . Low health literacy and health outcomes: an updated systematic review. Ann Intern Med. 2011;155(2):97–107.
- , , , et al. Fostering accountable health care: moving forward in Medicare. Health Affairs. 2009;28(2):219–231.
© 2015 Society of Hospital Medicine

Letter to the Editor
We greatly appreciate the thoughtful points made by Dr. Kerman regarding our recently published study evaluating the association of hospitalist continuity on adverse events (AEs).[1] We agree that a 7‐on/7‐off staffing model may limit discontinuity relative to models using shorter rotations lengths. Many hospital medicine programs use a 7‐on/7‐off model to optimize continuity. Longer rotation lengths are uncommon, as they may lead to fatigue and negatively affect physician work‐life balance. Shorter rotation lengths do exist, and we acknowledge that a study in a setting with greater fragmentation may have detected an effect.
We respectfully disagree with Dr. Kerman's concern that our methods for AE detection and confirmation may have been insensitive. We did not rely on incident reports, as these systems suffer from under‐reporting and often represent only a fraction of true AEs. We used a modified version of the classic 2‐stage method to identify and confirm AEs.[2] In the first stage, we used computerized screens, based on criteria from the Harvard Medical Practice Study and Institute for Healthcare Improvement global trigger tool, to identify potential AEs.[3, 4, 5] A research nurse created narrative summaries of potential AEs. A physician researcher then reviewed the narrative summaries to confirm whether an AE was truly present. This time‐consuming method is much more sensitive and specific than other options for patient safety measurement, including administrative data analyses and incident reporting systems.[6, 7]
With respect to other outcomes that may be affected by hospitalist continuity, we recently published a separate study showing that lower inpatient physician continuity was significantly associated with modest increases in hospital costs.[8] We found no association between continuity and patient satisfaction, but were likely underpowered to detect one. Interestingly, some of the models in our study suggested a slightly reduced risk of readmission with lower continuity. We were surprised by this finding and hypothesized that countervailing forces may be at play during handoffs of care from 1 hospitalist to another. Transitions of care introduce the opportunity for critical information to be lost, but they also introduce the potential for patient reassessment. A hospitalist newly taking over care from another may not be anchored to the initial diagnostic impressions and management plan established by the first. Of course, the potential benefit of a reassessment could only occur if the new hospitalist has time to perform one. At extremely high patient volumes, this theoretical benefit is unlikely to exist.
We did not include length of stay (LOS) as an outcome because hospitalist continuity and LOS are interdependent. Although discontinuity may lead to longer LOS, longer LOS definitely increases the probability of discontinuity. Thus, we controlled for LOS in our statistical models to isolate the effect of continuity. The study by Epstein and colleagues did not take into account the interdependence between LOS and hospitalist continuity.[9] Observational studies are not ideal for determining the effect of continuity on LOS. The Combing Incentives and Continuity Leading to Efficiency (CICLE) study by Chandra and colleagues was a pre‐post evaluation of a hospitalist staffing model specifically designed to improve continuity.[10] In the CICLE model, physicians work in a 4‐day rotation. On day 1, physicians exclusively admit patients. On day 2, physicians care for patients admitted on day 1 and accept patients admitted overnight. On days 3 and 4, physicians continue to care for patients received on days 1 and 2, but receive no additional patients. The remaining patients are transitioned to the next physician entering the cycle at the end of day 4. Chandra and colleagues found a 7.5% reduction in LOS and an 8.5% reduction in charges. Interestingly, they also found a 13.5% increase in readmissions that did not achieve statistical significance (P=0.08). The CICLE study suggests continuity does affect LOS, but is limited in that it did not account for a potential preexisting trend toward lower LOS.
Dr. Kerman presents data showing that it takes longer for a physician to care for a patient who is new to him or her than for a patient who is previously known. This finding has face validity. However, as we have suggested, the extra time spent by the oncoming physician may have both advantages and disadvantages. The disadvantages include time‐consuming cognitive work for the physician and the potential for information loss affecting patient care. The potential advantage is a second physician reassessing the diagnosis and management decisions established by the first, potentially correcting errors and optimizing care.
Ultimately, more research is needed to illuminate the effect of hospitalist continuity on patient outcomes. For now, we feel that hospital medicine group leaders need not institute lengthy rotations or staffing models that prioritize continuity above all other factors, as continuity appears to have little impact on patient outcomes.
- , , , et al. The effect of hospitalist discontinuity on adverse events. J Hosp Med. 2015;10(3):147–151.
- , , , et al. Comparison of manual abstraction to data warehouse facilitated abstraction to identify hosptial adverse events. BMJ Qual Saf. 2013;22(2):130–138.
- , . IHI global trigger tool for measuring adverse events: IHI innovation series white paper. Cambridge, MA: Institute for Healthcare Improvement; 2007.
- , BA, , et al. A study of medical injury and medical malpractice. N Engl J Med. 1989;321(7):480–484.
- , , , et al. Incidence and types of adverse events and negligent care in Utah and Colorado. Med Care. 2000;38(3):261–271.
- . The elephant of patient safety: what you see depends on how you look. Jt Comm J Qual Patient Saf. 2010;36(9):399–401.
- , . Measuring errors and adverse events in health care. J Gen Intern Med. 2003;18(1):61–67.
- , , , et al. The impact of hospitalist discontinuity on hospital cost, readmissions, and patient satisfaction. J Gen Intern Med. 2014;29(7):1004–1008.
- , , , , . The impact of fragmentation of hospitalist care on length of stay. J Hosp Med. 2010;5(6):335–338.
- , , . The Creating Incentives and Continuity Leading to Efficiency staffing model: a quality improvement initiative in hospital medicine. Mayo Clin Proc. 2012;87(4):364–371.
We greatly appreciate the thoughtful points made by Dr. Kerman regarding our recently published study evaluating the association of hospitalist continuity on adverse events (AEs).[1] We agree that a 7‐on/7‐off staffing model may limit discontinuity relative to models using shorter rotations lengths. Many hospital medicine programs use a 7‐on/7‐off model to optimize continuity. Longer rotation lengths are uncommon, as they may lead to fatigue and negatively affect physician work‐life balance. Shorter rotation lengths do exist, and we acknowledge that a study in a setting with greater fragmentation may have detected an effect.
We respectfully disagree with Dr. Kerman's concern that our methods for AE detection and confirmation may have been insensitive. We did not rely on incident reports, as these systems suffer from under‐reporting and often represent only a fraction of true AEs. We used a modified version of the classic 2‐stage method to identify and confirm AEs.[2] In the first stage, we used computerized screens, based on criteria from the Harvard Medical Practice Study and Institute for Healthcare Improvement global trigger tool, to identify potential AEs.[3, 4, 5] A research nurse created narrative summaries of potential AEs. A physician researcher then reviewed the narrative summaries to confirm whether an AE was truly present. This time‐consuming method is much more sensitive and specific than other options for patient safety measurement, including administrative data analyses and incident reporting systems.[6, 7]
With respect to other outcomes that may be affected by hospitalist continuity, we recently published a separate study showing that lower inpatient physician continuity was significantly associated with modest increases in hospital costs.[8] We found no association between continuity and patient satisfaction, but were likely underpowered to detect one. Interestingly, some of the models in our study suggested a slightly reduced risk of readmission with lower continuity. We were surprised by this finding and hypothesized that countervailing forces may be at play during handoffs of care from 1 hospitalist to another. Transitions of care introduce the opportunity for critical information to be lost, but they also introduce the potential for patient reassessment. A hospitalist newly taking over care from another may not be anchored to the initial diagnostic impressions and management plan established by the first. Of course, the potential benefit of a reassessment could only occur if the new hospitalist has time to perform one. At extremely high patient volumes, this theoretical benefit is unlikely to exist.
We did not include length of stay (LOS) as an outcome because hospitalist continuity and LOS are interdependent. Although discontinuity may lead to longer LOS, longer LOS definitely increases the probability of discontinuity. Thus, we controlled for LOS in our statistical models to isolate the effect of continuity. The study by Epstein and colleagues did not take into account the interdependence between LOS and hospitalist continuity.[9] Observational studies are not ideal for determining the effect of continuity on LOS. The Combing Incentives and Continuity Leading to Efficiency (CICLE) study by Chandra and colleagues was a pre‐post evaluation of a hospitalist staffing model specifically designed to improve continuity.[10] In the CICLE model, physicians work in a 4‐day rotation. On day 1, physicians exclusively admit patients. On day 2, physicians care for patients admitted on day 1 and accept patients admitted overnight. On days 3 and 4, physicians continue to care for patients received on days 1 and 2, but receive no additional patients. The remaining patients are transitioned to the next physician entering the cycle at the end of day 4. Chandra and colleagues found a 7.5% reduction in LOS and an 8.5% reduction in charges. Interestingly, they also found a 13.5% increase in readmissions that did not achieve statistical significance (P=0.08). The CICLE study suggests continuity does affect LOS, but is limited in that it did not account for a potential preexisting trend toward lower LOS.
Dr. Kerman presents data showing that it takes longer for a physician to care for a patient who is new to him or her than for a patient who is previously known. This finding has face validity. However, as we have suggested, the extra time spent by the oncoming physician may have both advantages and disadvantages. The disadvantages include time‐consuming cognitive work for the physician and the potential for information loss affecting patient care. The potential advantage is a second physician reassessing the diagnosis and management decisions established by the first, potentially correcting errors and optimizing care.
Ultimately, more research is needed to illuminate the effect of hospitalist continuity on patient outcomes. For now, we feel that hospital medicine group leaders need not institute lengthy rotations or staffing models that prioritize continuity above all other factors, as continuity appears to have little impact on patient outcomes.
- , , , et al. The effect of hospitalist discontinuity on adverse events. J Hosp Med. 2015;10(3):147–151.
- , , , et al. Comparison of manual abstraction to data warehouse facilitated abstraction to identify hosptial adverse events. BMJ Qual Saf. 2013;22(2):130–138.
- , . IHI global trigger tool for measuring adverse events: IHI innovation series white paper. Cambridge, MA: Institute for Healthcare Improvement; 2007.
- , BA, , et al. A study of medical injury and medical malpractice. N Engl J Med. 1989;321(7):480–484.
- , , , et al. Incidence and types of adverse events and negligent care in Utah and Colorado. Med Care. 2000;38(3):261–271.
- . The elephant of patient safety: what you see depends on how you look. Jt Comm J Qual Patient Saf. 2010;36(9):399–401.
- , . Measuring errors and adverse events in health care. J Gen Intern Med. 2003;18(1):61–67.
- , , , et al. The impact of hospitalist discontinuity on hospital cost, readmissions, and patient satisfaction. J Gen Intern Med. 2014;29(7):1004–1008.
- , , , , . The impact of fragmentation of hospitalist care on length of stay. J Hosp Med. 2010;5(6):335–338.
- , , . The Creating Incentives and Continuity Leading to Efficiency staffing model: a quality improvement initiative in hospital medicine. Mayo Clin Proc. 2012;87(4):364–371.
Frequently Admitted Patients
The national healthcare improvement paradigm is shifting toward a more comprehensive, value‐focused, and patient‐centered approach. Reducing hospital readmissions has become a focal point as a policy strategy to improve care quality while reducing cost. Section 3025 of the Affordable Care Act mandated the Centers for Medicare and Medicaid Services to make progressive reductions in Medicare payments to hospitals that have higher than expected readmission rates for 3 conditions (heart failure, acute myocardial infarction, and pneumonia), and expanding to include chronic obstructive pulmonary disease and total hip and knee arthroplasty in 2015.[1] In response, hospitals and systems are developing and implementing programs that coordinate care beyond hospital walls to reduce readmissions and healthcare costs.[2, 3] However, patients are readmitted for a variety of reasons, and programs that address the needs of some may not address the distinct needs of others. Understanding the characteristics of patients with frequent readmissions will permit the well‐informed creation of solutions specific to this population to reduce cost, free resources, and provide better care.
Although a solid body of literature already exists that describes the characteristics of patients who frequently visit the emergency department (ED),[4, 5, 6, 7, 8, 9, 10, 11, 12] it is not clear to what extent these characteristics also apply to patients with frequent hospital admissions. Frequent ED visitors have been found to be largely insured (85%) although with over‐representation of public insurance, and to be heavy users of the healthcare system overall.[6] A high disease burden associated with multiple chronic conditions has been found to predict frequent ED use.[4, 9, 11, 12] Some characteristics may vary by location; for example, alcohol abuse and psychiatric morbidity have been found to be associated with frequent ED use in New York and San Francisco, but it is not clear to what extent they are a factor in less urban areas.[4, 6, 12]
Several previous studies have investigated the characteristics of frequently admitted patients at single sites.[13, 14, 15, 16] Nguyen et al. (2013) studied patients with the highest costs and the most admissions at a large academic medical center in San Francisco.[13] High admit patients were defined as those responsible for the top decile of admissions, and were grouped into equal‐sized high‐ and low‐cost cohorts. The high‐admission/high‐cost group represented 5% of all patients, 25% of all costs, and 16% of all admissions. These patients were hospitalized primarily for medical conditions (78%) and had a high 30‐day readmission rate (47%). The high‐admission/low‐cost group accounted for 5% of all patients, 12% of all admissions, and 7% of all costs. These patients were also predominantly admitted for medical conditions (87%), with the most common admitting diagnoses representing respiratory, gastrointestinal, and cardiovascular conditions.[13]
Hwa (2012) conducted an analysis of 29 patients admitted 6 or more times in 1 year to an inpatient medical service in San Francisco.[14] These patients represented just 1% of all patients, but 13% of readmissions. Fifty‐five percent of these patients had a psychiatric diagnosis, and 52% had chronic pain. Ninety percent had a primary care physician in the hospital system, 100% were insured either privately or publicly, and 93% had housing, although for 17% housing was described as marginal.[14]
In a third study, Boonyasai et al. (2012) identified 76 patients with 82 readmissions at a Baltimore, Maryland, hospital and classified them as isolated (1 readmission per 6‐month period) or serial (more than 1 readmission per 6‐month period) readmissions.[15] Patients with serial readmissions accounted for 70% of the total. Isolated readmissions were most likely to be related to suboptimal quality of care and care coordination, whereas serial readmissions were more likely to result from disease progression, psychiatric illness, and substance abuse.[15]
All of these studies were conducted at single‐site academic medical centers serving inner city populations. We undertook this study to identify patient and hospital‐level characteristics of frequently admitted patients in a broad sample of 101 US academic medical centers to determine whether previously reported findings are generalizable, and to identify characteristics of frequently admitted patients that can inform interventions designed to meet the needs of this relatively small but resource‐intensive group of patients.
METHODS
All data were obtained from the University HealthSystem Consortium (UHC) (Chicago, IL) Clinical Data Base/Resource Manager (CDB), a large administrative database to which UHC principal members submit comprehensive administrative data files. UHC's principal members include approximately 120 US academic medical centers delivering tertiary and quaternary care, with an average of 647 acute care beds. The CDB includes primary and secondary diagnoses using International Classification of Diseases, Ninth Revision (ICD‐9)[17] codes.
The data of 101 academic medical centers with complete datasets for the study period (October 1, 2011, to September 30, 2012) were included in this analysis. Frequently admitted patients were defined as patients admitted 5 or more times to the same facility in a 12‐month period; all admissions were included, even those more than 30 days apart. This definition was established based on a naturally occurring break in the frequency distribution (Figure 1) and our intention to focus on the unique characteristics of patients at the far right of the distribution. We excluded obstetric (MDC 14, ICD‐9)[17] admissions and pediatric (<18 years of age at index admission) patients, as well as admissions with principal diagnoses for chemotherapy (ICD‐9 diagnosis codes v5811v5812), dialysis (ICD‐9 diagnosis codes v560v568), and rehabilitation (ICD‐9 diagnosis codes v570v579), which are typically planned. The Agency for Healthcare Research and Quality (AHRQ) comorbidity software was used to identify comorbid conditions,[18, 19] and a score based on the Elixhauser comorbidity measures was calculated using a modified acuity point system.[20] For comparisons based on safety net status, we used a definition of payer mix being 25% Medicaid or uninsured.

Our analyses included patient demographics, admission source and discharge status, clinical diagnoses, procedures, and comorbidities, cost, and length of stay. Patients defined as frequently admitted were compared in aggregate to all other hospitalized patients (all other admissions).
To evaluate associations, we used [2] tests for categorical variables and t tests for continuous variables. When comparing the non‐normally distributed comorbidities of the control group to the normally distributed comorbidities of the frequently admitted patients, we performed a Kruskal‐Wallis test on the medians.
RESULTS
During a 1‐year period (October 1, 2011, to September 30, 2012), 1,758,027 patients were admitted 2,388,124 times at 101 academic medical centers. Of these, 28,291 patients had 5 or more admissions during this period, resulting in 180,185 admissions. These frequently admitted patients represented 1.6% of all patients (Figure 1) and 7.6% of all inpatient admissions. By comparison, nonfrequently admitted patients were admitted once (79%), twice (14%), 3 times (4%), or 4 times (2%).
Among hospitals, the volume and impact of frequently admitted patients varied widely. The frequently admitted patient population ranged from 64 patients (0.7% of all patients) to 785 patients (3.5%), with an average of 280 patients (1.6%). To look for differences that might explain this range, we compared hospitals in the top and bottom deciles with respect to geographic region and to safety net status, but found no significant or meaningful differences. The average number of admissions per patient was 6.4, with a range of 5 to 76. Days per patient ranged from 5 to 434 days, with an average of 42. The average patient‐day percentage (frequently admitted patient days/total patient days) was 8.4%, and ranged from 3.2% to 15.4%.
Frequently admitted patients were more likely to be younger than all other patients (71.9% under the age of 65 years, as compared with 65.3% of all other patients (P<0.001)). They were also more likely to have either Medicaid or no healthcare insurance (27.6% compared with 21.6%, P<0.001), although nearly three‐quarters had either private insurance or Medicare coverage.
Eighty‐four percent of frequently admitted patient admissions were to medical services (vs 58% of all other patients (P<0.001)). The admission status for these patients was much less likely to be elective (9.1% of frequently admitted patient admissions vs 26.6% of all other patients' admissions [P<0.001]). Frequently admitted patients were more likely to be discharged to a skilled nursing facility (9.3% vs 8.4%, [P<0.001]) or with home health services (19.7% vs 13.4% [P<0.001]).
The 10 most common primary diagnoses for patient admissions are shown in Table 1. No single primary diagnosis accounted for a large share of the admissions of these patients; the most common diagnosis, sickle cell disease with crisis, accounted for only about 4% of admissions. The 10 most common diagnoses accounted for <20% of all admissions. The remainder of the diagnoses was spread over more than 3000 diagnosis codes; only about 300 codes had more than 100 admissions each.
| Primary Diagnoses | Secondary Diagnoses | Principal Procedures | ||||||||
|---|---|---|---|---|---|---|---|---|---|---|
| Frequently Admitted Patient Admissions, N=180,185 | All Other Patient Admissions, N=2,207,939 | All Other Patient Rank | Frequently Admitted Patient Admissions, N=180,185 | All Other Patient Admissions, N=2,207,939 | All Other PatientRank | Frequently Admitted Patient Admissions, N=180,185 | All Other Patient Admissions, N=2,207,939 | |||
| ||||||||||
| Sickle cell disease with crisis | 3.97% (7,152) | 0.002% (5,887) | 63 | Hypertension NOS | 31.39% (56,556) | 40.04% (884,045) | 1 | Hemodialysis | 6.32% (11,380) | 1.08% (23,871) |
| Septicemia NOS | 2.58% (4,652) | 1.87% (41,369) | 1 | Hyperlipidemia NOS | 24.47% (44,089) | 25.94% (572,760) | 2 | Packed cell transfusion | 4.49% (8.091) | 1.57% (34,669) |
| Acute and chronic systolic heart failure | 2.06% (3,708) | 0.81% (17,802) | 12 | Congestive heart failure NOS | 22.86% (41,197) | 11.82% (260,944) | 8 | Percutaneous abdominal drainage | 2.42% (4,366) | 0.86% (18,974) |
| Acute kidney failure NOS | 2.04% (3,680) | 1.16% (25,528) | 6 | Esophageal reflux | 21.19% (38,184) | 17.32% (382,511) | 3 | Venous catheter NEC | 2.13% (3,843) | 0.89% (19,718) |
| Obstructive chronic bronchitis with exacerbation | 1.76% (3,180) | 0.68% (14,957) | 14 | Diabetes mellitus NOS uncomplicated | 20.39% (36,743) | 16.75% (369,808) | 4 | Central venous catheter placement with guidewire | 2.13% (3,834)) | 0.83% (18,307) |
| Pneumonia organism NOS | 1.72% (3,091) | 1.29% (28,468) | 4 | Tobacco use disorder | 16.98% (30,604) | 16.71% (368,880) | 5 | Continuous invasive mechanical ventilation <96 consecutive hours | 1.38% (2,480) | 0.7% (15,441) |
| Urinary tract infection NOS | 1.63% (2,939) | 0.86% (19,069) | 9 | History of tobacco use | 16.89% (30,439) | 14.77% (326,026) | 6 | Noninvasive mechanical ventilation | 1.3% (2,345) | 0.58% (12,899) |
| Acute pancreatitis | 1.23% (2,212) | 0.73% (16,168) | 13 | Coronary atherosclerosis native vessel | 16.12% (29,040) | 12.88% (284,487) | 7 | Small intestine endoscopy NEC | 1.26% (2.265) | 0.7% (15,480) |
| Acute and chronic diastolic heart failure | 1.22% (2,190) | 0.48% (10,600) | 22 | Depressive disorder | 15.42% (27,785) | 10.34% (228,347) | 10 | Heart ultrasound | 1.11% (1,997) | 1.37% (30,161) |
| Complication of kidney transplant | 1.08% (1,944) | 0.42% (9,354) | 28 | Acute kidney failure NOS | 13.8% (24,859) | 9.37%% (206,951) | 12 | Esophagogastroduodenoscopy with closed biopsy | 1.09% (1,963) | 0.8% (17,644) |
Secondary diagnoses were mainly chronic conditions, including hypertension, hyperlipidemia, esophageal reflux, and diabetes mellitus type 2 (Table 1.) Combined, congestive heart failure and diabetes mellitus accounted for 43.3% of the secondary diagnoses of admissions of frequently admitted patients, but for only 28.6% of other patients. Acute kidney failure was more common in frequently admitted patients (13.8% vs 9.4% [P<0.001]). Psychiatric disorders accounted for <1% of primary diagnoses for both frequently admitted patients and all other patients. As a secondary diagnosis, depressive disorder appeared in the top 10 for both groups, although more commonly for frequently admitted patients (15.4% vs 10.3% [P<0.001]).
The most commonly performed principal procedures are also shown in Table 1. These include hemodialysis (6.32%) and packed cell transfusion (4.49%), nonoperating room procedures associated with chronic medical conditions.
Comorbidities were compared using the AHRQ comorbidity software.[18, 19] Comorbid conditions were counted once per patient, regardless of the number of admissions in which the condition was coded. Frequently admitted patients have a significantly higher mean number of comorbidities: 7.1 compared to 2.5 for all other patients (P<0.001; Figure 2). In an additional analysis using the Elixhauser comorbidity measures to determine acuity scores, the mean scores were 13.1 for frequently admitted patients and 3.17 for all others (P<0.001). The most common comorbidities were hypertension (74%), fluid and electrolyte disorders (73%), and deficiency anemias (66%). The only behavioral health comorbidity that affected more than a quarter of frequently admitted patients was depression (40% as compared to 13% for all others).
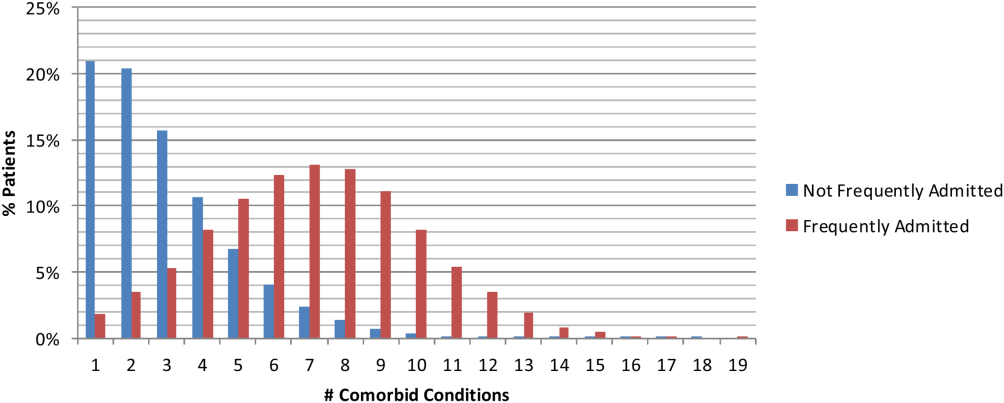
Additionally, frequently admitted patients were significantly more likely to have comorbidities of psychosis (18% vs 5% [P<0.001]), alcohol abuse (16% vs 7% [P<0.001]), and drug abuse (20% vs 7% [P<0.001]). Among hospitals, these comorbidities ranged widely: psychosis (3% 48%); alcohol abuse (3%46%); and drug abuse (3%58%). Hospitals with the highest rates (top decile) of frequently admitted patients with alcohol and drug abuse comorbidities were more likely to be safety net hospitals than those in the lowest decile (P<0.05 for each independently), but no such difference was found regarding rates of patients with psychosis.
Although the frequently admitted patient population accounted for only 1.6% of patients, they accounted for an average of 8.4% of all bed days and 7.1% of direct cost. The average cost per day was $1746, compared to $2144 for all other patients (Table 2).
| Length of Stay, Days | Direct Cost | % Total Bed Days | Cost/Day | All Other Patients Cost/Day | Difference | |
|---|---|---|---|---|---|---|
| Minimum | 1.0 | 2.3% | 3.2% | $809 | $1,005 | $(196) |
| Maximum | 86.8 | 14.1% | 15.4% | $3,208 | $4,070 | $(862) |
| Mean | 6.7 | 7.1% | 8.4% | $1,746 | $2,144 | $(398) |
| Median | 5.5 | 7.0% | 8.3% | $1,703 | $2,112 | $(410) |
DISCUSSION
An extensive analysis of the characteristics of frequently admitted patients at 101 US academic medical centers, from October 1, 2011 to September 30, 2012, revealed that these patients comprised 1.6% of all patients, but accounted for 8% of all admissions and 7% of direct costs. Relative to all other hospitalized patients, frequently admitted patients were likely to be younger, of lower socioeconomic status, in poorer health, and more often affected by mental health or substance abuse conditions that may mediate their health behaviors. However, the prevalence of patients with psychiatric or behavior conditions varied widely among hospitals, and hospitals with the highest rates of patients with substance abuse comorbidities were more likely to be safety net hospitals. Frequently admitted patients' diagnoses and procedures suggest that their admissions were related to complex chronic diseases; more than three‐quarters were admitted to medicine services, and their average length of stay was nearly 7 days. No single primary diagnosis accounted for a predominant share of their admissions; the most common diagnosis, sickle cell disease with crisis, accounted for only about 4%. The cost of their care was lower than that of other patients, reflecting the preponderance of their admissions to medicine service lines.
In many ways, frequently admitted patients seem similar to frequent ED visitors. Their visits were driven by a high disease burden associated with multiple chronic conditions, and they were heavy users of the healthcare system overall.[4, 6] The majority of both groups were insured, although there was over‐representation of public insurance.[6] As with frequent ED users, some frequently admitted patients are affected by psychiatric morbidity and substance abuse.[4, 12]
Our results in some ways confirmed, and in some ways differed from, findings of prior studies of patients with frequent hospital admissions. Although each study performed to date has defined the population differently, comparison of findings is useful. Our population was similar to the high‐admission groups identified by Nguyen et al. (patients responsible for the top decile of admissions).[13] These patients were also predominantly admitted for medical conditions, with common admitting diagnoses representing respiratory, gastrointestinal, and cardiovascular conditions. However, the median length of stay (3 days for the high‐admission/low‐cost group and 5 days for the high‐admission/high‐cost group) was lower than that of our population (5.5 days).
Hwa, who studied 29 patients admitted 6 or more times in 1 year to an inpatient medical service in San Francisco,[14] found that 55% of frequently admitted patients had a psychiatric diagnosis, higher than our patient population. Our findings are similar to those of Boonyasai et al.[15] whose serial readmitters had admissions resulting from disease progression, psychiatric illness, and substance abuse.
Our more nationally representative analysis documented a wide range of patient volumes and clinical characteristics, including psychiatric and substance abuse comorbidities, across study hospitals. It demonstrates that different approachesand resourcesare needed to meet the needs of these varied groups of patients. Each hospital must identify, evaluate, and understand its own population of frequently admitted patients to create well‐informed solutions to prevent repeat hospitalization for these patients.
Our ability to create a distinctive picture of the population of frequently admitted patients in US academic medical centers is based on access to an expansive dataset that captures complete diagnostic and demographic information on the universe of patients admitted to our member hospitals. The availability of clinical and administrative data for the entire population of patients permits both an accurate description of patient characteristics and a standardized comparison of groups. All data conform to accepted formats and definitions; their validity is universally recognized by contributing database participants.
Limitations
There are several important limitations to our study. First, patients with 5 or more admissions in 1 year may be undercounted. The UHC Clinical Data Base/Resource Manager only captures readmissions to a single facility; admissions of any patient admitted to more than 1 hospital, even within the UHC membership, cannot be determined. This could have a particularly strong effect on our ability to detect admissions of patients with acute episodes related to psychiatric illness or substance abuse, as they may be more likely to present to multiple or specialty hospitals. Additionally, readmission rates vary among UHC‐member hospitals, based to some extent on geography and the availability of alternative settings of care.
It is possible that surveillance bias played a role in our finding that frequently admitted patients have a significantly higher mean number of comorbidities; each admission presents an opportunity to document additional comorbid conditions. Psychiatric conditions may be underdocumented in medical settings in academic medical centers, where the focus is often on acute medical conditions. Additionally, certain data elements that we believe are central to understanding the characteristics of frequently admitted patients are not part of the UHC Clinical Data Base/Resource Manager and were therefore not a part of our analysis. These highly influential upstream determinants of health include documentation of a primary care physician, housing status, and access to services at discharge.
CONCLUSION
The valuable information reported from analysis of nearly 2 million patients in the UHC Clinical Data Base/Resource Manager can be used to better understand the characteristics of frequently admitted patients. This important cohort of individuals has complex care needs that often result in hospitalization, but may be amenable to solutions that allow patients to remain in their communities. By understanding the demographic, social, and medical characteristics of these patients, hospitals can develop and implement solutions that address the needs of this small group of patients who consume a highly disproportionate share of healthcare resources.
Acknowledgements
The authors acknowledge the contributions of Samuel F. Hohmann, PhD, and Ryan Carroll, MBA, who provided expert statistical analyses and generous assistance in the completion of this article.
Disclosure: Nothing to report.
- Centers for Medicare 21(9):117–120.
- , , , . The influence of a postdischarge intervention on reducing hospital readmissions in a Medicare population. Popul Health Manag. 2013;16(5):310–316.
- , . Dispelling an urban legend: frequent emergency department users have substantial burden of disease. Health Aff (Millwood). 2013;32:2099–2108.
- , , , et al. Effectiveness of interventions targeting frequent users of emergency departments: a systematic review. Ann Emerg Med. 2011;58:41–52.
- , . Frequent users of emergency departments: the myths, the data, and the policy implications. Ann Emerg Med. 2010;20(10):1–8.
- , , , . Development and validation of a model for predicting emergency admissions over the next year. Arch Intern Med. 2008;168:1416–1422.
- , , , et al. A comparison of frequent and infrequent visitors to an urban emergency department. J Emerg Med. 2008;38:115–121.
- , . Frequent users of Massachusetts emergency departments: a statewide analysis. Ann Emerg Med. 2006;48:9–16.
- , , , et al. A descriptive study of heavy emergency department users at an academic emergency department reveals heavy users have better access to care than average users. J Emerg Nurs. 2005;31:139–144.
- , , . Predictors and outcomes of frequent emergency department users. Acad Emerg Med. 2003;10:320–328.
- , , . Epidemiologic analysis of an urban, public emergency department's frequent users. Acad Emerg Med. 2000;7:637–646.
- , , , . What's cost got to do with it? Association between hospital costs and frequency of admissions among “high users” of hospital care. J Hosp Med. 2013;8:665–671.
- . Characteristics of a frequently readmitted patient population on an inpatient medical service. Abstract presented at: Society of Hospital Medicine Annual Meeting, April 1– 4, 2012; San Diego, CA.
- , , , , . Characteristics of isolated and serial rehospitalizations suggest a need for different types of improvement strategies [abstract] J Hosp Med. 2012;7(suppl 2):513.
- , , , , . An intervention to improve care and reduce costs for high‐risk patients with frequent hospital admissions: a pilot study. BMC Health Serv Res. 2011;11:270–279.
- Centers for Disease Control and Prevention. International Classification of Diseases, Ninth Revision (ICD‐9). Available at: http://www.cdc.gov/nchs/icd/icd9.htm. Accessed February 18, 2015.
- Agency for Healthcare Research and Quality, Healthcare Cost and Utilization Project. Comorbidity software, version 3.7. Available at: http://www.hcup‐us.ahrq.gov/toolssoftware/comorbidity/comorbidity.jsp. Accessed February 18, 2015.
- , , , . Comorbidity measures for use with administrative data. Med Care. 1998;36:8–27.
- , , , , . A modification of the Elixhauser comorbidity measures into a point system for hospital death using administrative data. Med Care. 2009;47:626–633.
The national healthcare improvement paradigm is shifting toward a more comprehensive, value‐focused, and patient‐centered approach. Reducing hospital readmissions has become a focal point as a policy strategy to improve care quality while reducing cost. Section 3025 of the Affordable Care Act mandated the Centers for Medicare and Medicaid Services to make progressive reductions in Medicare payments to hospitals that have higher than expected readmission rates for 3 conditions (heart failure, acute myocardial infarction, and pneumonia), and expanding to include chronic obstructive pulmonary disease and total hip and knee arthroplasty in 2015.[1] In response, hospitals and systems are developing and implementing programs that coordinate care beyond hospital walls to reduce readmissions and healthcare costs.[2, 3] However, patients are readmitted for a variety of reasons, and programs that address the needs of some may not address the distinct needs of others. Understanding the characteristics of patients with frequent readmissions will permit the well‐informed creation of solutions specific to this population to reduce cost, free resources, and provide better care.
Although a solid body of literature already exists that describes the characteristics of patients who frequently visit the emergency department (ED),[4, 5, 6, 7, 8, 9, 10, 11, 12] it is not clear to what extent these characteristics also apply to patients with frequent hospital admissions. Frequent ED visitors have been found to be largely insured (85%) although with over‐representation of public insurance, and to be heavy users of the healthcare system overall.[6] A high disease burden associated with multiple chronic conditions has been found to predict frequent ED use.[4, 9, 11, 12] Some characteristics may vary by location; for example, alcohol abuse and psychiatric morbidity have been found to be associated with frequent ED use in New York and San Francisco, but it is not clear to what extent they are a factor in less urban areas.[4, 6, 12]
Several previous studies have investigated the characteristics of frequently admitted patients at single sites.[13, 14, 15, 16] Nguyen et al. (2013) studied patients with the highest costs and the most admissions at a large academic medical center in San Francisco.[13] High admit patients were defined as those responsible for the top decile of admissions, and were grouped into equal‐sized high‐ and low‐cost cohorts. The high‐admission/high‐cost group represented 5% of all patients, 25% of all costs, and 16% of all admissions. These patients were hospitalized primarily for medical conditions (78%) and had a high 30‐day readmission rate (47%). The high‐admission/low‐cost group accounted for 5% of all patients, 12% of all admissions, and 7% of all costs. These patients were also predominantly admitted for medical conditions (87%), with the most common admitting diagnoses representing respiratory, gastrointestinal, and cardiovascular conditions.[13]
Hwa (2012) conducted an analysis of 29 patients admitted 6 or more times in 1 year to an inpatient medical service in San Francisco.[14] These patients represented just 1% of all patients, but 13% of readmissions. Fifty‐five percent of these patients had a psychiatric diagnosis, and 52% had chronic pain. Ninety percent had a primary care physician in the hospital system, 100% were insured either privately or publicly, and 93% had housing, although for 17% housing was described as marginal.[14]
In a third study, Boonyasai et al. (2012) identified 76 patients with 82 readmissions at a Baltimore, Maryland, hospital and classified them as isolated (1 readmission per 6‐month period) or serial (more than 1 readmission per 6‐month period) readmissions.[15] Patients with serial readmissions accounted for 70% of the total. Isolated readmissions were most likely to be related to suboptimal quality of care and care coordination, whereas serial readmissions were more likely to result from disease progression, psychiatric illness, and substance abuse.[15]
All of these studies were conducted at single‐site academic medical centers serving inner city populations. We undertook this study to identify patient and hospital‐level characteristics of frequently admitted patients in a broad sample of 101 US academic medical centers to determine whether previously reported findings are generalizable, and to identify characteristics of frequently admitted patients that can inform interventions designed to meet the needs of this relatively small but resource‐intensive group of patients.
METHODS
All data were obtained from the University HealthSystem Consortium (UHC) (Chicago, IL) Clinical Data Base/Resource Manager (CDB), a large administrative database to which UHC principal members submit comprehensive administrative data files. UHC's principal members include approximately 120 US academic medical centers delivering tertiary and quaternary care, with an average of 647 acute care beds. The CDB includes primary and secondary diagnoses using International Classification of Diseases, Ninth Revision (ICD‐9)[17] codes.
The data of 101 academic medical centers with complete datasets for the study period (October 1, 2011, to September 30, 2012) were included in this analysis. Frequently admitted patients were defined as patients admitted 5 or more times to the same facility in a 12‐month period; all admissions were included, even those more than 30 days apart. This definition was established based on a naturally occurring break in the frequency distribution (Figure 1) and our intention to focus on the unique characteristics of patients at the far right of the distribution. We excluded obstetric (MDC 14, ICD‐9)[17] admissions and pediatric (<18 years of age at index admission) patients, as well as admissions with principal diagnoses for chemotherapy (ICD‐9 diagnosis codes v5811v5812), dialysis (ICD‐9 diagnosis codes v560v568), and rehabilitation (ICD‐9 diagnosis codes v570v579), which are typically planned. The Agency for Healthcare Research and Quality (AHRQ) comorbidity software was used to identify comorbid conditions,[18, 19] and a score based on the Elixhauser comorbidity measures was calculated using a modified acuity point system.[20] For comparisons based on safety net status, we used a definition of payer mix being 25% Medicaid or uninsured.
Our analyses included patient demographics, admission source and discharge status, clinical diagnoses, procedures, and comorbidities, cost, and length of stay. Patients defined as frequently admitted were compared in aggregate to all other hospitalized patients (all other admissions).
To evaluate associations, we used [2] tests for categorical variables and t tests for continuous variables. When comparing the non‐normally distributed comorbidities of the control group to the normally distributed comorbidities of the frequently admitted patients, we performed a Kruskal‐Wallis test on the medians.
RESULTS
During a 1‐year period (October 1, 2011, to September 30, 2012), 1,758,027 patients were admitted 2,388,124 times at 101 academic medical centers. Of these, 28,291 patients had 5 or more admissions during this period, resulting in 180,185 admissions. These frequently admitted patients represented 1.6% of all patients (Figure 1) and 7.6% of all inpatient admissions. By comparison, nonfrequently admitted patients were admitted once (79%), twice (14%), 3 times (4%), or 4 times (2%).
Among hospitals, the volume and impact of frequently admitted patients varied widely. The frequently admitted patient population ranged from 64 patients (0.7% of all patients) to 785 patients (3.5%), with an average of 280 patients (1.6%). To look for differences that might explain this range, we compared hospitals in the top and bottom deciles with respect to geographic region and to safety net status, but found no significant or meaningful differences. The average number of admissions per patient was 6.4, with a range of 5 to 76. Days per patient ranged from 5 to 434 days, with an average of 42. The average patient‐day percentage (frequently admitted patient days/total patient days) was 8.4%, and ranged from 3.2% to 15.4%.
Frequently admitted patients were more likely to be younger than all other patients (71.9% under the age of 65 years, as compared with 65.3% of all other patients (P<0.001)). They were also more likely to have either Medicaid or no healthcare insurance (27.6% compared with 21.6%, P<0.001), although nearly three‐quarters had either private insurance or Medicare coverage.
Eighty‐four percent of frequently admitted patient admissions were to medical services (vs 58% of all other patients (P<0.001)). The admission status for these patients was much less likely to be elective (9.1% of frequently admitted patient admissions vs 26.6% of all other patients' admissions [P<0.001]). Frequently admitted patients were more likely to be discharged to a skilled nursing facility (9.3% vs 8.4%, [P<0.001]) or with home health services (19.7% vs 13.4% [P<0.001]).
The 10 most common primary diagnoses for patient admissions are shown in Table 1. No single primary diagnosis accounted for a large share of the admissions of these patients; the most common diagnosis, sickle cell disease with crisis, accounted for only about 4% of admissions. The 10 most common diagnoses accounted for <20% of all admissions. The remainder of the diagnoses was spread over more than 3000 diagnosis codes; only about 300 codes had more than 100 admissions each.
| Primary Diagnoses | Secondary Diagnoses | Principal Procedures | ||||||||
|---|---|---|---|---|---|---|---|---|---|---|
| Frequently Admitted Patient Admissions, N=180,185 | All Other Patient Admissions, N=2,207,939 | All Other Patient Rank | Frequently Admitted Patient Admissions, N=180,185 | All Other Patient Admissions, N=2,207,939 | All Other PatientRank | Frequently Admitted Patient Admissions, N=180,185 | All Other Patient Admissions, N=2,207,939 | |||
| ||||||||||
| Sickle cell disease with crisis | 3.97% (7,152) | 0.002% (5,887) | 63 | Hypertension NOS | 31.39% (56,556) | 40.04% (884,045) | 1 | Hemodialysis | 6.32% (11,380) | 1.08% (23,871) |
| Septicemia NOS | 2.58% (4,652) | 1.87% (41,369) | 1 | Hyperlipidemia NOS | 24.47% (44,089) | 25.94% (572,760) | 2 | Packed cell transfusion | 4.49% (8.091) | 1.57% (34,669) |
| Acute and chronic systolic heart failure | 2.06% (3,708) | 0.81% (17,802) | 12 | Congestive heart failure NOS | 22.86% (41,197) | 11.82% (260,944) | 8 | Percutaneous abdominal drainage | 2.42% (4,366) | 0.86% (18,974) |
| Acute kidney failure NOS | 2.04% (3,680) | 1.16% (25,528) | 6 | Esophageal reflux | 21.19% (38,184) | 17.32% (382,511) | 3 | Venous catheter NEC | 2.13% (3,843) | 0.89% (19,718) |
| Obstructive chronic bronchitis with exacerbation | 1.76% (3,180) | 0.68% (14,957) | 14 | Diabetes mellitus NOS uncomplicated | 20.39% (36,743) | 16.75% (369,808) | 4 | Central venous catheter placement with guidewire | 2.13% (3,834)) | 0.83% (18,307) |
| Pneumonia organism NOS | 1.72% (3,091) | 1.29% (28,468) | 4 | Tobacco use disorder | 16.98% (30,604) | 16.71% (368,880) | 5 | Continuous invasive mechanical ventilation <96 consecutive hours | 1.38% (2,480) | 0.7% (15,441) |
| Urinary tract infection NOS | 1.63% (2,939) | 0.86% (19,069) | 9 | History of tobacco use | 16.89% (30,439) | 14.77% (326,026) | 6 | Noninvasive mechanical ventilation | 1.3% (2,345) | 0.58% (12,899) |
| Acute pancreatitis | 1.23% (2,212) | 0.73% (16,168) | 13 | Coronary atherosclerosis native vessel | 16.12% (29,040) | 12.88% (284,487) | 7 | Small intestine endoscopy NEC | 1.26% (2.265) | 0.7% (15,480) |
| Acute and chronic diastolic heart failure | 1.22% (2,190) | 0.48% (10,600) | 22 | Depressive disorder | 15.42% (27,785) | 10.34% (228,347) | 10 | Heart ultrasound | 1.11% (1,997) | 1.37% (30,161) |
| Complication of kidney transplant | 1.08% (1,944) | 0.42% (9,354) | 28 | Acute kidney failure NOS | 13.8% (24,859) | 9.37%% (206,951) | 12 | Esophagogastroduodenoscopy with closed biopsy | 1.09% (1,963) | 0.8% (17,644) |
Secondary diagnoses were mainly chronic conditions, including hypertension, hyperlipidemia, esophageal reflux, and diabetes mellitus type 2 (Table 1.) Combined, congestive heart failure and diabetes mellitus accounted for 43.3% of the secondary diagnoses of admissions of frequently admitted patients, but for only 28.6% of other patients. Acute kidney failure was more common in frequently admitted patients (13.8% vs 9.4% [P<0.001]). Psychiatric disorders accounted for <1% of primary diagnoses for both frequently admitted patients and all other patients. As a secondary diagnosis, depressive disorder appeared in the top 10 for both groups, although more commonly for frequently admitted patients (15.4% vs 10.3% [P<0.001]).
The most commonly performed principal procedures are also shown in Table 1. These include hemodialysis (6.32%) and packed cell transfusion (4.49%), nonoperating room procedures associated with chronic medical conditions.
Comorbidities were compared using the AHRQ comorbidity software.[18, 19] Comorbid conditions were counted once per patient, regardless of the number of admissions in which the condition was coded. Frequently admitted patients have a significantly higher mean number of comorbidities: 7.1 compared to 2.5 for all other patients (P<0.001; Figure 2). In an additional analysis using the Elixhauser comorbidity measures to determine acuity scores, the mean scores were 13.1 for frequently admitted patients and 3.17 for all others (P<0.001). The most common comorbidities were hypertension (74%), fluid and electrolyte disorders (73%), and deficiency anemias (66%). The only behavioral health comorbidity that affected more than a quarter of frequently admitted patients was depression (40% as compared to 13% for all others).
Additionally, frequently admitted patients were significantly more likely to have comorbidities of psychosis (18% vs 5% [P<0.001]), alcohol abuse (16% vs 7% [P<0.001]), and drug abuse (20% vs 7% [P<0.001]). Among hospitals, these comorbidities ranged widely: psychosis (3% 48%); alcohol abuse (3%46%); and drug abuse (3%58%). Hospitals with the highest rates (top decile) of frequently admitted patients with alcohol and drug abuse comorbidities were more likely to be safety net hospitals than those in the lowest decile (P<0.05 for each independently), but no such difference was found regarding rates of patients with psychosis.
Although the frequently admitted patient population accounted for only 1.6% of patients, they accounted for an average of 8.4% of all bed days and 7.1% of direct cost. The average cost per day was $1746, compared to $2144 for all other patients (Table 2).
| Length of Stay, Days | Direct Cost | % Total Bed Days | Cost/Day | All Other Patients Cost/Day | Difference | |
|---|---|---|---|---|---|---|
| Minimum | 1.0 | 2.3% | 3.2% | $809 | $1,005 | $(196) |
| Maximum | 86.8 | 14.1% | 15.4% | $3,208 | $4,070 | $(862) |
| Mean | 6.7 | 7.1% | 8.4% | $1,746 | $2,144 | $(398) |
| Median | 5.5 | 7.0% | 8.3% | $1,703 | $2,112 | $(410) |
DISCUSSION
An extensive analysis of the characteristics of frequently admitted patients at 101 US academic medical centers, from October 1, 2011 to September 30, 2012, revealed that these patients comprised 1.6% of all patients, but accounted for 8% of all admissions and 7% of direct costs. Relative to all other hospitalized patients, frequently admitted patients were likely to be younger, of lower socioeconomic status, in poorer health, and more often affected by mental health or substance abuse conditions that may mediate their health behaviors. However, the prevalence of patients with psychiatric or behavior conditions varied widely among hospitals, and hospitals with the highest rates of patients with substance abuse comorbidities were more likely to be safety net hospitals. Frequently admitted patients' diagnoses and procedures suggest that their admissions were related to complex chronic diseases; more than three‐quarters were admitted to medicine services, and their average length of stay was nearly 7 days. No single primary diagnosis accounted for a predominant share of their admissions; the most common diagnosis, sickle cell disease with crisis, accounted for only about 4%. The cost of their care was lower than that of other patients, reflecting the preponderance of their admissions to medicine service lines.
In many ways, frequently admitted patients seem similar to frequent ED visitors. Their visits were driven by a high disease burden associated with multiple chronic conditions, and they were heavy users of the healthcare system overall.[4, 6] The majority of both groups were insured, although there was over‐representation of public insurance.[6] As with frequent ED users, some frequently admitted patients are affected by psychiatric morbidity and substance abuse.[4, 12]
Our results in some ways confirmed, and in some ways differed from, findings of prior studies of patients with frequent hospital admissions. Although each study performed to date has defined the population differently, comparison of findings is useful. Our population was similar to the high‐admission groups identified by Nguyen et al. (patients responsible for the top decile of admissions).[13] These patients were also predominantly admitted for medical conditions, with common admitting diagnoses representing respiratory, gastrointestinal, and cardiovascular conditions. However, the median length of stay (3 days for the high‐admission/low‐cost group and 5 days for the high‐admission/high‐cost group) was lower than that of our population (5.5 days).
Hwa, who studied 29 patients admitted 6 or more times in 1 year to an inpatient medical service in San Francisco,[14] found that 55% of frequently admitted patients had a psychiatric diagnosis, higher than our patient population. Our findings are similar to those of Boonyasai et al.[15] whose serial readmitters had admissions resulting from disease progression, psychiatric illness, and substance abuse.
Our more nationally representative analysis documented a wide range of patient volumes and clinical characteristics, including psychiatric and substance abuse comorbidities, across study hospitals. It demonstrates that different approachesand resourcesare needed to meet the needs of these varied groups of patients. Each hospital must identify, evaluate, and understand its own population of frequently admitted patients to create well‐informed solutions to prevent repeat hospitalization for these patients.
Our ability to create a distinctive picture of the population of frequently admitted patients in US academic medical centers is based on access to an expansive dataset that captures complete diagnostic and demographic information on the universe of patients admitted to our member hospitals. The availability of clinical and administrative data for the entire population of patients permits both an accurate description of patient characteristics and a standardized comparison of groups. All data conform to accepted formats and definitions; their validity is universally recognized by contributing database participants.
Limitations
There are several important limitations to our study. First, patients with 5 or more admissions in 1 year may be undercounted. The UHC Clinical Data Base/Resource Manager only captures readmissions to a single facility; admissions of any patient admitted to more than 1 hospital, even within the UHC membership, cannot be determined. This could have a particularly strong effect on our ability to detect admissions of patients with acute episodes related to psychiatric illness or substance abuse, as they may be more likely to present to multiple or specialty hospitals. Additionally, readmission rates vary among UHC‐member hospitals, based to some extent on geography and the availability of alternative settings of care.
It is possible that surveillance bias played a role in our finding that frequently admitted patients have a significantly higher mean number of comorbidities; each admission presents an opportunity to document additional comorbid conditions. Psychiatric conditions may be underdocumented in medical settings in academic medical centers, where the focus is often on acute medical conditions. Additionally, certain data elements that we believe are central to understanding the characteristics of frequently admitted patients are not part of the UHC Clinical Data Base/Resource Manager and were therefore not a part of our analysis. These highly influential upstream determinants of health include documentation of a primary care physician, housing status, and access to services at discharge.
CONCLUSION
The valuable information reported from analysis of nearly 2 million patients in the UHC Clinical Data Base/Resource Manager can be used to better understand the characteristics of frequently admitted patients. This important cohort of individuals has complex care needs that often result in hospitalization, but may be amenable to solutions that allow patients to remain in their communities. By understanding the demographic, social, and medical characteristics of these patients, hospitals can develop and implement solutions that address the needs of this small group of patients who consume a highly disproportionate share of healthcare resources.
Acknowledgements
The authors acknowledge the contributions of Samuel F. Hohmann, PhD, and Ryan Carroll, MBA, who provided expert statistical analyses and generous assistance in the completion of this article.
Disclosure: Nothing to report.
- Centers for Medicare 21(9):117–120.
- , , , . The influence of a postdischarge intervention on reducing hospital readmissions in a Medicare population. Popul Health Manag. 2013;16(5):310–316.
- , . Dispelling an urban legend: frequent emergency department users have substantial burden of disease. Health Aff (Millwood). 2013;32:2099–2108.
- , , , et al. Effectiveness of interventions targeting frequent users of emergency departments: a systematic review. Ann Emerg Med. 2011;58:41–52.
- , . Frequent users of emergency departments: the myths, the data, and the policy implications. Ann Emerg Med. 2010;20(10):1–8.
- , , , . Development and validation of a model for predicting emergency admissions over the next year. Arch Intern Med. 2008;168:1416–1422.
- , , , et al. A comparison of frequent and infrequent visitors to an urban emergency department. J Emerg Med. 2008;38:115–121.
- , . Frequent users of Massachusetts emergency departments: a statewide analysis. Ann Emerg Med. 2006;48:9–16.
- , , , et al. A descriptive study of heavy emergency department users at an academic emergency department reveals heavy users have better access to care than average users. J Emerg Nurs. 2005;31:139–144.
- , , . Predictors and outcomes of frequent emergency department users. Acad Emerg Med. 2003;10:320–328.
- , , . Epidemiologic analysis of an urban, public emergency department's frequent users. Acad Emerg Med. 2000;7:637–646.
- , , , . What's cost got to do with it? Association between hospital costs and frequency of admissions among “high users” of hospital care. J Hosp Med. 2013;8:665–671.
- . Characteristics of a frequently readmitted patient population on an inpatient medical service. Abstract presented at: Society of Hospital Medicine Annual Meeting, April 1– 4, 2012; San Diego, CA.
- , , , , . Characteristics of isolated and serial rehospitalizations suggest a need for different types of improvement strategies [abstract] J Hosp Med. 2012;7(suppl 2):513.
- , , , , . An intervention to improve care and reduce costs for high‐risk patients with frequent hospital admissions: a pilot study. BMC Health Serv Res. 2011;11:270–279.
- Centers for Disease Control and Prevention. International Classification of Diseases, Ninth Revision (ICD‐9). Available at: http://www.cdc.gov/nchs/icd/icd9.htm. Accessed February 18, 2015.
- Agency for Healthcare Research and Quality, Healthcare Cost and Utilization Project. Comorbidity software, version 3.7. Available at: http://www.hcup‐us.ahrq.gov/toolssoftware/comorbidity/comorbidity.jsp. Accessed February 18, 2015.
- , , , . Comorbidity measures for use with administrative data. Med Care. 1998;36:8–27.
- , , , , . A modification of the Elixhauser comorbidity measures into a point system for hospital death using administrative data. Med Care. 2009;47:626–633.
© 2015 The Authors Journal of Hospital Medicine published by Wiley Periodicals, Inc. on behalf of Society of Hospital Medicine
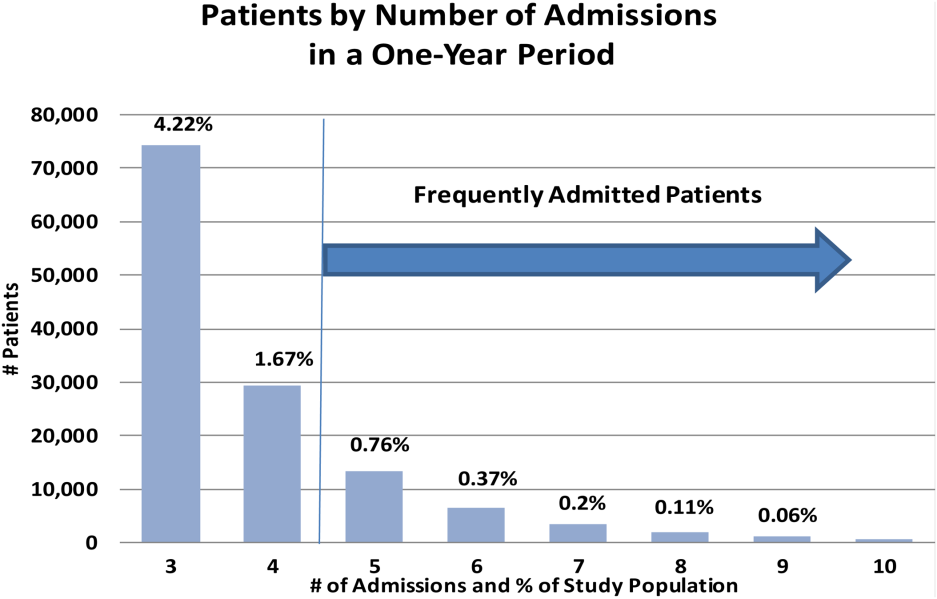
Managing Superutilizers
We have known for years that the distribution of healthcare expenditures in the United States is skewed, with a small portion of the population consuming a disproportionately high share of resources. In 2010, 1% of the population accounted for 21.4% of the $1.3 trillion spent on healthcare.[1] Growing evidence documents that most of these high‐cost patients are not receiving coordinated care, preventive care, or care in the most appropriate settings.[2] The term superutilizer describes individuals with complex physical, behavioral, and social needs who have frequent emergency department (ED) visits and multiple costly hospital admissions.[3] Not surprisingly, multiple superutilizer programs and new funding opportunities target this population attempting to reduce their healthcare costs while improving their care, as public and private insurers shift to value‐based care.[4]
Beginning in 2006, the Robert Wood Johnson Foundation supported the Camden Coalition[5] with 3 grants to develop a community‐based approach to identify high‐utilizer patients and provide them with coordinated medical and social services.[6] These programs include community‐based teams that focus on the highest utilizers in a specific geographic area and provide intensive outpatient case management. Building on these efforts, the Center for Medicare and Medicaid Innovation (CMMI) awarded 2 Health Care Innovation Awards totaling $17.2 million to target Medicaid superutilizers.[7] Through its State Innovation Models initiative, CMMI also encourages states to pilot superutilizer programs to increase care coordination and support of persons with certain risk factors such as homelessness or mental illness.[8] Additionally, the National Governors Association developed a 1‐year, multistate policy academy to develop state‐level capacity and state action plans that guide how to improve the delivery and financing of care for superutilizers.[9]
With all these ongoing activities in the setting of a paucity of research identifying the most cost‐efficient practices to manage super‐utilizers, we are glad to see the Journal of Hospital Medicine publish an evaluation of a quality‐improvement project targeting superutilizers.[10] Mercer and colleagues at Duke University Hospital show that developing an individualized care plan and integrating it into their electronic health record (EHR) reduced hospital admissions, but not ED visits. Although we applaud the reportedly individualized patient approach and recognize the effort required to refer patients to a more appropriate care setting, we believe the researchers neglected 3 important components for the intervention: (1) patient engagement in developing individualized care plans, (2) care coordination integrated with community collaboration, and (3) feedback on continuum of care relayed back to providers. The managing strategies mentioned in the article seem to have evolved exclusively from the provider's perspective, a common mistake that the Patient‐Centered Outcomes Research Institute emphasizes must be avoided. We are concerned about the lack of clarity regarding the set of management strategies focused on providing high‐quality care while limiting unnecessary admissions reported by them. We fear this strategy was imposed on patients and not developed collaboratively with them. Effective interventions for superutilizers should do more than just guide providers actions, but also connect services to the patient's needs. There should be coordination and continuous improvement of these efforts, which requires engagement of the patient and their community with feedback to the system.
Possibly most important, an individualized approach to superutilizers needs to be patient‐centeredprioritizing patient goals and preferences, selecting interventions and services guided by the needs of the individual, and emphasizing modifiable outcomes that matter to the patient. Such a patient‐centered approach goes beyond the individual patient to incorporate information about social support and family dynamics, highlighting the role of caregivers. Patients and their caregivers must be engaged or activated to ensure adherence to appropriate care and behaviors in any superutilizer programs. Additionally, individualized patient‐centered care plans should be dynamic and bidirectional to accommodate changes in health priorities that may occur over time. Such lack of patient and community engagement may explain why ED‐visit frequency was unchanged in their study.
The approach of having a Complex Care Plan Committee deserves attention as it appropriately included the right people at the academic medical center. However, why is it voluntary? Should not an important, or even essential, committee such as this be supported by the health system? Moreover, although the care plan developed by members of the committee possesses understandable aspects to be considered in a patient's care, why is this not shown to the patient for their input? Instead of being done to the patient, we recommend including patients in this process, believing such patient engagement would improve care further and likely yield sustained changes. We suggest the researchers remember the maxim nothing about me, without me.
Patients who use the most healthcare services typically have complicated social situations that directly impact their ability to improve their health and stay well.[2, 11] Addressing the social determinants of health is not a new concept; however, creating healthy communities as a core responsibility of the healthcare industry is. Contributing to the dizzying state of change in US healthcare are efforts to shift to value‐based purchasing and population health management.[12] This transformation from a fee‐for‐service hospital‐centric industry into one focused on the continuum of care requires outreach into communities where superutilizers live. Ultimately, all healthcare is local, as this is where patients receive the vast majority of their care. Improving quality and reducing costs requires healthcare providers to work together on a collaborative mission that focuses on the needs of patients and community, not just efforts to reduce utilization. Even hospitalists must forge collaborative relationships with skilled nursing facilities and patient‐centered medical homes.
Given the successes of some superutilizer programs,[3] a key issue is how to scale or disseminate such labor‐intensive highly individualized programs. Each patient has very complex and specific medical, behavioral, and social needs that require creativity and flexibility to adequately address these needs. Without question, patients and/or their caregivers should be members of the care team aiming to optimize their care. Unfortunately, our current healthcare system is not designed to address the complexity and uniqueness of each superutilizer. Nonetheless, summarizing patients history into the EHR and integrating recommendations offers an opportunity to share information as originally hoped by the transition from paper‐based records. It additionally offers an opportunity to learn from use of this information as academic medical centers aim to become learning health systems.[13] Future implementation science research in this area should assess how to scale patient‐centered approaches to care, particularly for those with chronic illness and other vulnerabilities. We must eschew efforts that solely focus on reducing utilization by patients without involving them; after all, they are the focus of healthcare.
Disclosure
Nothing to report.
- , . Differentials in the concentration in the level of health expenditures across population subgroups in the U.S, 2010. Statistical brief #421. Rockville, MD: Agency for Healthcare Research and Quality; 2013.
- , , . Preventing avoidable rehospitalizations by understanding the characteristics of “frequent fliers.” J Nurs Care Qual. 2012;27(1):77–82.
- Robert Wood Johnson Foundation. Super‐utilizer summit: common themes from innovative complex care management programs. Available at: http://www.rwjf.org/en/library/research/2013/10/super‐utilizer‐summit.html. Published October 2013; accessed March 22, 2015.
- . Setting value‐based payment goals—HHS efforts to improve U.S. health care. N Engl J Med. 2015;372(10):897–899.
- . Medical Report: The hot spotters—can we lower medical costs by giving the neediest patients better care? Available at: http://www.newyorker.com/magazine/2011/01/24/the-hot-spotters. Published January 24, 2011; accessed March 22, 2015.
- Robert Wood Johnson Foundation. A coalition creates a citywide care management system. Available at: http://www.rwjf.org/content/dam/farm/reports/program_results_reports/2014/rwjf69151. Published January 13, 2011; revised June 13, 2014; accessed March 22, 2015.
- Centers for Medicare 10(XX):XXX–XXX.
- , , , . The faces of Medicaid II: recognizing the care needs of people with multiple chronic conditions. Center for Health Care Strategies, Inc. Available at: http://www.chcs.org/resource/the-faces-of-medicaid-ii-recognizing-the-care-needs-of-people-with-multiple-chronic-conditions. Published October 2007; accessed March 22, 2015.
- . Accountable care organizations—the risk of failure and the risks of success. N Engl J Med. 2014;371(18):1750–1751.
- , , . Implementing the learning health system: from concept to action. Ann Intern Med. 2012;157(3):207–210.
We have known for years that the distribution of healthcare expenditures in the United States is skewed, with a small portion of the population consuming a disproportionately high share of resources. In 2010, 1% of the population accounted for 21.4% of the $1.3 trillion spent on healthcare.[1] Growing evidence documents that most of these high‐cost patients are not receiving coordinated care, preventive care, or care in the most appropriate settings.[2] The term superutilizer describes individuals with complex physical, behavioral, and social needs who have frequent emergency department (ED) visits and multiple costly hospital admissions.[3] Not surprisingly, multiple superutilizer programs and new funding opportunities target this population attempting to reduce their healthcare costs while improving their care, as public and private insurers shift to value‐based care.[4]
Beginning in 2006, the Robert Wood Johnson Foundation supported the Camden Coalition[5] with 3 grants to develop a community‐based approach to identify high‐utilizer patients and provide them with coordinated medical and social services.[6] These programs include community‐based teams that focus on the highest utilizers in a specific geographic area and provide intensive outpatient case management. Building on these efforts, the Center for Medicare and Medicaid Innovation (CMMI) awarded 2 Health Care Innovation Awards totaling $17.2 million to target Medicaid superutilizers.[7] Through its State Innovation Models initiative, CMMI also encourages states to pilot superutilizer programs to increase care coordination and support of persons with certain risk factors such as homelessness or mental illness.[8] Additionally, the National Governors Association developed a 1‐year, multistate policy academy to develop state‐level capacity and state action plans that guide how to improve the delivery and financing of care for superutilizers.[9]
With all these ongoing activities in the setting of a paucity of research identifying the most cost‐efficient practices to manage super‐utilizers, we are glad to see the Journal of Hospital Medicine publish an evaluation of a quality‐improvement project targeting superutilizers.[10] Mercer and colleagues at Duke University Hospital show that developing an individualized care plan and integrating it into their electronic health record (EHR) reduced hospital admissions, but not ED visits. Although we applaud the reportedly individualized patient approach and recognize the effort required to refer patients to a more appropriate care setting, we believe the researchers neglected 3 important components for the intervention: (1) patient engagement in developing individualized care plans, (2) care coordination integrated with community collaboration, and (3) feedback on continuum of care relayed back to providers. The managing strategies mentioned in the article seem to have evolved exclusively from the provider's perspective, a common mistake that the Patient‐Centered Outcomes Research Institute emphasizes must be avoided. We are concerned about the lack of clarity regarding the set of management strategies focused on providing high‐quality care while limiting unnecessary admissions reported by them. We fear this strategy was imposed on patients and not developed collaboratively with them. Effective interventions for superutilizers should do more than just guide providers actions, but also connect services to the patient's needs. There should be coordination and continuous improvement of these efforts, which requires engagement of the patient and their community with feedback to the system.
Possibly most important, an individualized approach to superutilizers needs to be patient‐centeredprioritizing patient goals and preferences, selecting interventions and services guided by the needs of the individual, and emphasizing modifiable outcomes that matter to the patient. Such a patient‐centered approach goes beyond the individual patient to incorporate information about social support and family dynamics, highlighting the role of caregivers. Patients and their caregivers must be engaged or activated to ensure adherence to appropriate care and behaviors in any superutilizer programs. Additionally, individualized patient‐centered care plans should be dynamic and bidirectional to accommodate changes in health priorities that may occur over time. Such lack of patient and community engagement may explain why ED‐visit frequency was unchanged in their study.
The approach of having a Complex Care Plan Committee deserves attention as it appropriately included the right people at the academic medical center. However, why is it voluntary? Should not an important, or even essential, committee such as this be supported by the health system? Moreover, although the care plan developed by members of the committee possesses understandable aspects to be considered in a patient's care, why is this not shown to the patient for their input? Instead of being done to the patient, we recommend including patients in this process, believing such patient engagement would improve care further and likely yield sustained changes. We suggest the researchers remember the maxim nothing about me, without me.
Patients who use the most healthcare services typically have complicated social situations that directly impact their ability to improve their health and stay well.[2, 11] Addressing the social determinants of health is not a new concept; however, creating healthy communities as a core responsibility of the healthcare industry is. Contributing to the dizzying state of change in US healthcare are efforts to shift to value‐based purchasing and population health management.[12] This transformation from a fee‐for‐service hospital‐centric industry into one focused on the continuum of care requires outreach into communities where superutilizers live. Ultimately, all healthcare is local, as this is where patients receive the vast majority of their care. Improving quality and reducing costs requires healthcare providers to work together on a collaborative mission that focuses on the needs of patients and community, not just efforts to reduce utilization. Even hospitalists must forge collaborative relationships with skilled nursing facilities and patient‐centered medical homes.
Given the successes of some superutilizer programs,[3] a key issue is how to scale or disseminate such labor‐intensive highly individualized programs. Each patient has very complex and specific medical, behavioral, and social needs that require creativity and flexibility to adequately address these needs. Without question, patients and/or their caregivers should be members of the care team aiming to optimize their care. Unfortunately, our current healthcare system is not designed to address the complexity and uniqueness of each superutilizer. Nonetheless, summarizing patients history into the EHR and integrating recommendations offers an opportunity to share information as originally hoped by the transition from paper‐based records. It additionally offers an opportunity to learn from use of this information as academic medical centers aim to become learning health systems.[13] Future implementation science research in this area should assess how to scale patient‐centered approaches to care, particularly for those with chronic illness and other vulnerabilities. We must eschew efforts that solely focus on reducing utilization by patients without involving them; after all, they are the focus of healthcare.
Disclosure
Nothing to report.
- , . Differentials in the concentration in the level of health expenditures across population subgroups in the U.S, 2010. Statistical brief #421. Rockville, MD: Agency for Healthcare Research and Quality; 2013.
- , , . Preventing avoidable rehospitalizations by understanding the characteristics of “frequent fliers.” J Nurs Care Qual. 2012;27(1):77–82.
- Robert Wood Johnson Foundation. Super‐utilizer summit: common themes from innovative complex care management programs. Available at: http://www.rwjf.org/en/library/research/2013/10/super‐utilizer‐summit.html. Published October 2013; accessed March 22, 2015.
- . Setting value‐based payment goals—HHS efforts to improve U.S. health care. N Engl J Med. 2015;372(10):897–899.
- . Medical Report: The hot spotters—can we lower medical costs by giving the neediest patients better care? Available at: http://www.newyorker.com/magazine/2011/01/24/the-hot-spotters. Published January 24, 2011; accessed March 22, 2015.
- Robert Wood Johnson Foundation. A coalition creates a citywide care management system. Available at: http://www.rwjf.org/content/dam/farm/reports/program_results_reports/2014/rwjf69151. Published January 13, 2011; revised June 13, 2014; accessed March 22, 2015.
- Centers for Medicare 10(XX):XXX–XXX.
- , , , . The faces of Medicaid II: recognizing the care needs of people with multiple chronic conditions. Center for Health Care Strategies, Inc. Available at: http://www.chcs.org/resource/the-faces-of-medicaid-ii-recognizing-the-care-needs-of-people-with-multiple-chronic-conditions. Published October 2007; accessed March 22, 2015.
- . Accountable care organizations—the risk of failure and the risks of success. N Engl J Med. 2014;371(18):1750–1751.
- , , . Implementing the learning health system: from concept to action. Ann Intern Med. 2012;157(3):207–210.
Effect of Hospitalist Discontinuity on AE
Although definitions vary, continuity of care can be thought of as the patient's experience of a continuous caring relationship with an identified healthcare professional.[1] Research in ambulatory settings has found that patients who see their primary care physician for a higher proportion of office visits have higher patient satisfaction, better hypertensive control, lower risk of hospitalization, and fewer emergency department visits.[2, 3, 4, 5] Continuity with a single hospital‐based physician is difficult to achieve because of the need to provide care 24 hours a day, 7 days a week. Key clinical information may be lost during physician‐to‐physician handoffs (eg, at admission, at the end of rotations on service) during hospitalization. Our research group recently found that lower hospital physician continuity was associated with modestly increased hospital costs, but also a trend toward lower readmissions.[6] We speculated that physicians newly taking over patient care from colleagues reassess diagnoses and treatment plans. This reassessment may identify errors missed by the previous hospital physician. Thus, discontinuity may theoretically help or hinder the provision of safe hospital care.
We sought to examine the relationship between hospital physician continuity and the incidence of adverse events (AEs). We combined data from 2 previously published studies by our research group; one investigated the relationship between hospital physician continuity and costs and 30‐day readmissions, the other assessed the impact of unit‐based interventions on AEs.[6, 7]
METHODS
Setting and Study Design
This retrospective, observational study was conducted at Northwestern Memorial Hospital, an 876‐bed tertiary care teaching hospital in Chicago, Illinois, and was approved by the institutional review board of Northwestern University. Subjects included patients admitted to an adult nonteaching hospitalist service between March 1, 2009 and December 31, 2011. Hospitalists on this service worked without resident physicians in rotations usually lasting 7 consecutive days beginning on Mondays and ending on Sundays. Hospitalists were allowed to switch portions of their schedule with one another, creating the possibility that certain rotations may have been slightly shorter or longer than 7 days. Hospitalists gave verbal sign‐out via telephone to the hospitalist taking over their service on the afternoon of the last day of their rotation. These handoffs customarily involved both hospitalists viewing the electronic health record during the discussion but were not standardized. Night hospitalists performed admissions and cross‐coverage each night from 7 pm to 7 am. Night hospitalists printed history and physicals for day hospitalists, but typically did not give verbal sign‐out on new admissions.
Acquisition of Study Population Data
We identified all patients admitted to the nonteaching hospitalist service using the Northwestern Medicine Enterprise Data Warehouse (EDW), an integrated repository of all clinical and research data sources on the campus. We excluded patients admitted under observation status, those initially admitted to other services (eg, intensive care, general surgery), those discharged from other services, and those cared for by advanced practice providers (ie, nurse practitioners and physician assistants).
Predictor Variables
We identified physicians completing the primary service history and physicals (H&P) and progress notes throughout patients' hospitalizations to calculate 2 measures of continuity: the Number of Physicians Index (NPI), and the Usual Provider of Continuity (UPC) Index.[8, 9] The NPI represented the total number of unique hospitalists completing H&Ps and/or progress notes for a patient. The UPC was calculated as the largest number of notes signed by a single hospitalist divided by the total number of hospitalist notes for a patient. For example, if Dr. John Smith wrote notes on the first 4 days of a patient's hospital stay, and Dr. Mary Jones wrote notes on the following 2 days (total stay=6 days), the NPI would be 2 and the UPC would be 0.67. Therefore, higher NPI and lower UPC designate lower continuity. Significant events occurring during the nighttime were documented in separate notes titled cross‐cover notes. These cross‐cover notes were not included in the calculation of NPI or UPC. In the rare event that 2 or more progress notes were written on the same day, we selected the one used for billing to calculate UPC and NPI.
Outcome Variables
We used AE data from a study we conducted to assess the impact of unit‐based interventions to improve teamwork and patient safety, the methods of which have been previously described.[7] Briefly, we used a 2‐stage medical record review similar to that performed in prior studies.[10, 11, 12, 13] In the first stage, we identified potential AEs using automated queries of the Northwestern Medicine EDW. These queries were based on screening criteria used in the Harvard Medical Practice Study and the Institute for Healthcare Improvement (IHI) Global Trigger Tool.[12, 13] Examples of queries included abnormal laboratory values (eg, international normalized ratio [INR] >6 after hospital day 2 and excluding patients with INR >4 on day 1), administration of rescue medications (eg, naloxone), certain types of incident reports (eg, pressure ulcer), International Classification of Diseases, Ninth Revision (ICD‐9) codes indicating hospital‐acquired conditions (eg, venous thromboembolism), and text searches of progress notes and discharge summaries using natural language processing.[14] Prior research by our group confirmed these automated screens identify a similar number of AEs as manual medical record screening.[14] For each patient with 1 or more potential AE, a research nurse performed a medical record abstraction and created a description of each potential AE.
In the second stage, 2 physician researchers independently reviewed each potential AE in a blinded fashion to determine whether or not an AE was present. An AE was defined as injury due to medical management rather than the natural history of the illness,[15] and included injuries that prolonged the hospital stay or produced disability as well as those resulting in transient disability or abnormal lab values.[16] After independent review, physician reviewers discussed discrepancies in their ratings to achieve consensus.
We tested the reliability of medical record abstractions in our prior study by conducting duplicate abstractions and consensus ratings for a randomly selected sample of 294 patients.[7] The inter‐rater reliability was good for determining the presence of AEs (=0.63).
Statistical Analyses
We calculated descriptive statistics for patient characteristics. Primary discharge diagnosis ICD‐9 codes were categorized using the Healthcare Cost and Utilization Project Clinical Classification Software.[17] We created multivariable logistic regression models with the independent variable being the measure of continuity (NPI or UPC) and the dependent variable being experiencing 1 or more AEs. Covariates included patient age, sex, race, payer, night admission, weekend admission, intensive care unit stay, Medicare Severity Diagnosis Related Group (MS‐DRG) weight, and total number of Elixhauser comorbidities.[18] The length of stay (LOS) was also included as a covariate, as longer LOS increases the probability of discontinuity and may increase the risk for AEs. Because MS‐DRG weight and LOS were highly correlated, we created several models; the first including both as continuous variables, the second including both categorized into quartiles, and a third excluding MS‐DRG weight and including LOS as a continuous variable. Our prior study assessing the impact of unit‐based interventions did not show a statistically significant difference in the pre‐ versus postintervention period, thus we did not include study period as a covariate.
RESULTS
Patient Characteristics
Our analyses included data from 474 hospitalizations. Patient characteristics are shown in Table 1. Patients were a mean 51.118.8 years of age, hospitalized for a mean 3.43.1 days, included 241 (50.8%) women, and 233 (49.2%) persons of nonwhite race. The mean and standard deviation of NPI and UPC were 2.51.0 and 0.60.2. Overall, 47 patients (9.9%) experienced 55 total AEs. AEs included 31 adverse drug events, 6 falls, 5 procedural injuries, 4 manifestations of poor glycemic control, 3 hospital‐acquired infections, 2 episodes of acute renal failure, 1 episode of delirium, 1 pressure ulcer, and 2 categorized as other.
| Characteristic | Value |
|---|---|
| |
| Mean age (SD), y | 55.1 (18.8) |
| Mean length of stay (SD), d | 3.4 (3.1) |
| Women, n (%) | 241 (50.8) |
| Nonwhite race, n (%) | 233 (49.2) |
| Payer, n (%) | |
| Private | 180 (38) |
| Medicare | 165 (34.8) |
| Medicaid | 47 (9.9) |
| Self‐pay/other | 82 (17.3) |
| Night admission, n (%) | 245 (51.7) |
| Weekend admission, n (%) | 135 (28.5) |
| Intensive care unit stay, n (%) | 18 (3.8) |
| Diagnosis, n (%) | |
| Diseases of the circulatory system | 95 (20.0) |
| Diseases of the digestive system | 65 (13.7) |
| Diseases of the respiratory system | 49 (10.3) |
| Injury and poisoning | 41 (8.7) |
| Diseases of the skin and soft tissue | 31 (6.5) |
| Symptoms, signs, and ill‐defined conditions and factors influencing health status | 28 (5.9) |
| Endocrine, nutritional, and metabolic diseases and immunity disorders | 25 (5.3) |
| Diseases of the genitourinary system | 24 (5.1) |
| Diseases of the musculoskeletal system and connective tissue | 23 (4.9) |
| Diseases of the nervous system | 23 (4.9) |
| Other | 70 (14.8) |
| Mean no. of Elixhauser comorbidities (SD) | 2.3 (1.7) |
| Mean MS‐DRG weight (SD) | 1.0 (1.0) |
| Mean NPI (SD) | 2.5 (1.0) |
| Mean UPC (SD) | 0.6 (0.2) |
Association Between Continuity and Adverse Events
In unadjusted models, each 1‐unit increase in the NPI (ie, less continuity) was significantly associated with the incidence of 1 or more AEs (odds ratio [OR]=1.75; P<0.001). However, UPC was not associated with incidence of AEs (OR=1.03; P=0.68) (Table 2). Across all adjusted models, neither NPI nor UPC was significantly associated with the incidence of AEs. The direction of the effect of discontinuity on AEs was inconsistent across models. Though all 3 adjusted models using NPI as the independent variable showed a trend toward increased odds of experiencing 1 or more AE with discontinuity, 2 of the 3 models using UPC showed trends in the opposite direction.
| NPI OR (95% CI)* | P Value | UPC OR (95% CI)* | P Value | ||
|---|---|---|---|---|---|
| |||||
| Unadjusted model | 1.75 (1.332.29) | <0.0001 | 1.03 (0.89‐1.21) | 0.68 | |
| Adjusted models | |||||
| Model 1 | MS‐DRG and LOS continuous | 1.16 (0.781.72) | 0.47 | 0.96 (0.791.14) | 0.60 |
| Model 2 | MS‐DRG and LOS in quartiles | 1.38 (0.981.94) | 0.07 | 1.05 (0.881.26) | 0.59 |
| Model 3 | MS‐DRG dropped, LOS continuous | 1.14 (0.771.70) | 0.51 | 0.95 (0.791.14) | 0.56 |
DISCUSSION
We found that hospitalist physician continuity was not associated with the incidence of AEs. Our findings are somewhat surprising because of the high value placed on continuity of care and patient safety concerns related to handoffs. Key clinical information may be lost when patient care is transitioned to a new hospitalist shortly after admission (eg, from a night hospitalist) or at the end of a rotation. Thus, it is logical to assume that discontinuity inherently increases the risk for harm. On the other hand, a physician newly taking over patient care from another may not be anchored to the initial diagnosis and treatment plan established by the first. This second look could potentially prevent missed/delayed diagnoses and optimize the plan of care.[19] These countervailing forces may explain our findings.
Several other potential explanations for our findings should be considered. First, the quality of handoffs may have been sufficient to overcome the potential for information loss. We feel this is unlikely given that little attention had been dedicated to improving the quality of patient handoffs among hospitalists in our institution. Notably, though a number of studies have evaluated resident physician handoffs, most of the work has focused on night coverage, and little is known about the quality of attending handoffs.[20] Second, access to a fully integrated electronic health record may have assisted hospitalists in complementing information received during handoffs. For example, a hospitalist about to start his or her rotation may have remotely accessed and reviewed patient medical records prior to receiving the phone handoff from the outgoing hospitalist. Third, other efforts to improve patient safety may have reduced the overall risk and provided some resilience in the system. Unit‐based interventions, including structured interdisciplinary rounds and nurse‐physician coleadership, improved teamwork climate and reduced AEs in the study hospital over time.[7]
Another factor to consider relates to the fact that hospital care is provided by teams of clinicians (eg, nurses, specialist physicians, therapists, social workers). Hospital teams are often large and have dynamic team membership. Similar to hospitalists, nurses, physician specialists, and other team members handoff care throughout the course of a patient's hospital stay. Yet, discontinuity for each professional type may occur at different times and frequencies. For example, a patient may be handed off from one hospitalist to another, yet the care continues with the same cardiologist or nurse. Future research should better characterize hospital team complexity (eg, size, relationships among members) and dynamics (eg, continuity for various professional types) and the impact of these factors on patient outcomes.
Our findings are important because hospitalist physician discontinuity is common during hospital stays. Hospital medicine groups vary in their staffing and scheduling models. Policies related to admission distribution and rotation length (consecutive days worked) systematically impact physician continuity. Few studies have evaluated the effect on continuity on hospitalized patient outcomes, and no prior research, to our knowledge, has explored the association of continuity on measures of patient safety.[6, 21, 22] Though our study might suggest that staffing models have little impact on patient safety, as previously mentioned, other team factors may influence patient outcomes.
Our study has several limitations. First, we assessed the impact of continuity on AEs in a single site. Although the 7 days on/7 days off model is the most common scheduling pattern used by adult hospital medicine groups,[23] staffing models and patient safety practices vary across hospitals, potentially limiting the generalizability of our study. Second, continuity can be defined and measured in a variety of ways. We used 2 different measures of physician continuity. As previously mentioned, assessing continuity of other clinicians may allow for a more complete understanding of the potential problems related to fragmentation of care. Third, this study excluded patients who experienced care transitions from other hospitals or other units within the hospital. Patients transferred from other hospitals are often complex, severely ill, and may be at higher risk for loss of key clinical information. Fourth, we used automated screens of an EDW to identify potential AEs. Although our prior research found that this method identified a similar number of AEs as manual medical record review screening, there was poor agreement between the 2 methods. Unfortunately, there is no gold standard to identify AEs. The EDW‐facilitated method allowed us to feasibly screen a larger number of charts, increasing statistical power, and minimized any potential bias that might occur during a manual review to identify potential AEs. Finally, we used data available from 2 prior studies and may have been underpowered to detect a significant association between continuity and AEs due to the relatively low percentage of patients experiencing an AE. In a post hoc power calculation, we estimated that we had 70% power to detect a 33% change in the proportion of patients with 1 or more AE for each 1‐unit increase in NPI, and 80% power to detect a 20% change for each 0.1‐unit decrease in UPC.
CONCLUSION
In conclusion, we found that hospitalist physician continuity was not associated with the incidence of AEs. We speculate that hospitalist continuity is only 1 of many team factors that may influence patient safety, and that prior efforts within our institution may have reduced our ability to detect an association. Future research should better characterize hospital team complexity and dynamics and the impact of these factors on patient outcomes.
Disclosures
This project was supported by a grant from the Agency for Healthcare Research and Quality and an Excellence in Academic Medicine Award, administered by Northwestern Memorial Hospital. The authors report no conflicts of interest.
- , , . What is “continuity of care”? J Health Serv Res Policy. 2006;11:248–250.
- , . Interpersonal continuity of care and care outcomes: a critical review. Ann Fam Med. 2005;3:159–166.
- , , , . The association between continuity of care and outcomes: a systematic and critical review. J Eval Clin Pract. 2010;16:947–956.
- , . Interpersonal continuity of care and patient satisfaction: a critical review. Ann Fam Med. 2004;2:445–451.
- , , , . Continuity of care in a family practice residency program. Impact on physician satisfaction. J Fam Pract. 1990;31:69–73.
- , , , et al. The impact of hospitalist discontinuity on hospital cost, readmissions, and patient satisfaction. J Gen Intern Med. 2014;29:1004–1008.
- , , , et al. Implementation of unit‐based interventions to improve teamwork and patient safety on a medical service [published online ahead of print June 11, 2014]. Am J Med Qual. doi: 10.1177/1062860614538093.
- . Measuring provider continuity in ambulatory care: an assessment of alternative approaches. Med Care. 1979;17:551–565.
- . Defining and measuring interpersonal continuity of care. Ann Fam Med. 2003;1:134–143.
- U.S. Department of Health and Human Services. Agency for Healthcare Research and Quality. Adverse events in hospitals: national incidence among medical beneficiaries. Available at: http://psnet.ahrq.gov/resource.aspx?resourceID=19811. Published November 2010. Accessed on December 15, 2014.
- , , , et al. “Global trigger tool” shows that adverse events in hospitals may be ten times greater than previously measured. Health Aff (Millwood). 2011;30:581–589.
- , , , et al. A study of medical injury and medical malpractice. N Engl J Med. 1989;321:480–484.
- , , , et al. Incidence and types of adverse events and negligent care in Utah and Colorado. Med Care. 2000;38:261–271.
- , , , et al. Comparison of traditional trigger tool to data warehouse based screening for identifying hospital adverse events. BMJ Qual Saf. 2013;22:130–138.
- , , , et al. Incidence of adverse events and negligence in hospitalized patients. Results of the Harvard Medical Practice Study I. N Engl J Med. 1991;324:370–376.
- , , . Safety of patients isolated for infection control. JAMA. 2003;290:1899–1905.
- HCUP Clinical Classification Software. Agency for Healthcare Research and Quality, Rockville, MD. http://www.hcup-us.ahrq.gov/toolssoftware/ccs/ccs.jsp. Accessed on December 15, 2014.
- , , , . Comorbidity measures for use with administrative data. Med Care. 1998;36:8–27.
- . Does continuity of care matter? No: discontinuity can improve patient care. West J Med. 2001;175:5.
- , , , , , . Hospitalist handoffs: a systematic review and task force recommendations. J Hosp Med. 2009;4:433–440.
- , , , , . The impact of fragmentation of hospitalist care on length of stay. J Hosp Med. 2010;5:335–338.
- , , . The Creating Incentives and Continuity Leading to Efficiency staffing model: a quality improvement initiative in hospital medicine. Mayo Clin Proc. 2012;87:364–371.
- Society of Hospital Medicine. 2014 state of hospital medicine report. Philadelphia, PA: Society of Hospital Medicine; 2014.
Although definitions vary, continuity of care can be thought of as the patient's experience of a continuous caring relationship with an identified healthcare professional.[1] Research in ambulatory settings has found that patients who see their primary care physician for a higher proportion of office visits have higher patient satisfaction, better hypertensive control, lower risk of hospitalization, and fewer emergency department visits.[2, 3, 4, 5] Continuity with a single hospital‐based physician is difficult to achieve because of the need to provide care 24 hours a day, 7 days a week. Key clinical information may be lost during physician‐to‐physician handoffs (eg, at admission, at the end of rotations on service) during hospitalization. Our research group recently found that lower hospital physician continuity was associated with modestly increased hospital costs, but also a trend toward lower readmissions.[6] We speculated that physicians newly taking over patient care from colleagues reassess diagnoses and treatment plans. This reassessment may identify errors missed by the previous hospital physician. Thus, discontinuity may theoretically help or hinder the provision of safe hospital care.
We sought to examine the relationship between hospital physician continuity and the incidence of adverse events (AEs). We combined data from 2 previously published studies by our research group; one investigated the relationship between hospital physician continuity and costs and 30‐day readmissions, the other assessed the impact of unit‐based interventions on AEs.[6, 7]
METHODS
Setting and Study Design
This retrospective, observational study was conducted at Northwestern Memorial Hospital, an 876‐bed tertiary care teaching hospital in Chicago, Illinois, and was approved by the institutional review board of Northwestern University. Subjects included patients admitted to an adult nonteaching hospitalist service between March 1, 2009 and December 31, 2011. Hospitalists on this service worked without resident physicians in rotations usually lasting 7 consecutive days beginning on Mondays and ending on Sundays. Hospitalists were allowed to switch portions of their schedule with one another, creating the possibility that certain rotations may have been slightly shorter or longer than 7 days. Hospitalists gave verbal sign‐out via telephone to the hospitalist taking over their service on the afternoon of the last day of their rotation. These handoffs customarily involved both hospitalists viewing the electronic health record during the discussion but were not standardized. Night hospitalists performed admissions and cross‐coverage each night from 7 pm to 7 am. Night hospitalists printed history and physicals for day hospitalists, but typically did not give verbal sign‐out on new admissions.
Acquisition of Study Population Data
We identified all patients admitted to the nonteaching hospitalist service using the Northwestern Medicine Enterprise Data Warehouse (EDW), an integrated repository of all clinical and research data sources on the campus. We excluded patients admitted under observation status, those initially admitted to other services (eg, intensive care, general surgery), those discharged from other services, and those cared for by advanced practice providers (ie, nurse practitioners and physician assistants).
Predictor Variables
We identified physicians completing the primary service history and physicals (H&P) and progress notes throughout patients' hospitalizations to calculate 2 measures of continuity: the Number of Physicians Index (NPI), and the Usual Provider of Continuity (UPC) Index.[8, 9] The NPI represented the total number of unique hospitalists completing H&Ps and/or progress notes for a patient. The UPC was calculated as the largest number of notes signed by a single hospitalist divided by the total number of hospitalist notes for a patient. For example, if Dr. John Smith wrote notes on the first 4 days of a patient's hospital stay, and Dr. Mary Jones wrote notes on the following 2 days (total stay=6 days), the NPI would be 2 and the UPC would be 0.67. Therefore, higher NPI and lower UPC designate lower continuity. Significant events occurring during the nighttime were documented in separate notes titled cross‐cover notes. These cross‐cover notes were not included in the calculation of NPI or UPC. In the rare event that 2 or more progress notes were written on the same day, we selected the one used for billing to calculate UPC and NPI.
Outcome Variables
We used AE data from a study we conducted to assess the impact of unit‐based interventions to improve teamwork and patient safety, the methods of which have been previously described.[7] Briefly, we used a 2‐stage medical record review similar to that performed in prior studies.[10, 11, 12, 13] In the first stage, we identified potential AEs using automated queries of the Northwestern Medicine EDW. These queries were based on screening criteria used in the Harvard Medical Practice Study and the Institute for Healthcare Improvement (IHI) Global Trigger Tool.[12, 13] Examples of queries included abnormal laboratory values (eg, international normalized ratio [INR] >6 after hospital day 2 and excluding patients with INR >4 on day 1), administration of rescue medications (eg, naloxone), certain types of incident reports (eg, pressure ulcer), International Classification of Diseases, Ninth Revision (ICD‐9) codes indicating hospital‐acquired conditions (eg, venous thromboembolism), and text searches of progress notes and discharge summaries using natural language processing.[14] Prior research by our group confirmed these automated screens identify a similar number of AEs as manual medical record screening.[14] For each patient with 1 or more potential AE, a research nurse performed a medical record abstraction and created a description of each potential AE.
In the second stage, 2 physician researchers independently reviewed each potential AE in a blinded fashion to determine whether or not an AE was present. An AE was defined as injury due to medical management rather than the natural history of the illness,[15] and included injuries that prolonged the hospital stay or produced disability as well as those resulting in transient disability or abnormal lab values.[16] After independent review, physician reviewers discussed discrepancies in their ratings to achieve consensus.
We tested the reliability of medical record abstractions in our prior study by conducting duplicate abstractions and consensus ratings for a randomly selected sample of 294 patients.[7] The inter‐rater reliability was good for determining the presence of AEs (=0.63).
Statistical Analyses
We calculated descriptive statistics for patient characteristics. Primary discharge diagnosis ICD‐9 codes were categorized using the Healthcare Cost and Utilization Project Clinical Classification Software.[17] We created multivariable logistic regression models with the independent variable being the measure of continuity (NPI or UPC) and the dependent variable being experiencing 1 or more AEs. Covariates included patient age, sex, race, payer, night admission, weekend admission, intensive care unit stay, Medicare Severity Diagnosis Related Group (MS‐DRG) weight, and total number of Elixhauser comorbidities.[18] The length of stay (LOS) was also included as a covariate, as longer LOS increases the probability of discontinuity and may increase the risk for AEs. Because MS‐DRG weight and LOS were highly correlated, we created several models; the first including both as continuous variables, the second including both categorized into quartiles, and a third excluding MS‐DRG weight and including LOS as a continuous variable. Our prior study assessing the impact of unit‐based interventions did not show a statistically significant difference in the pre‐ versus postintervention period, thus we did not include study period as a covariate.
RESULTS
Patient Characteristics
Our analyses included data from 474 hospitalizations. Patient characteristics are shown in Table 1. Patients were a mean 51.118.8 years of age, hospitalized for a mean 3.43.1 days, included 241 (50.8%) women, and 233 (49.2%) persons of nonwhite race. The mean and standard deviation of NPI and UPC were 2.51.0 and 0.60.2. Overall, 47 patients (9.9%) experienced 55 total AEs. AEs included 31 adverse drug events, 6 falls, 5 procedural injuries, 4 manifestations of poor glycemic control, 3 hospital‐acquired infections, 2 episodes of acute renal failure, 1 episode of delirium, 1 pressure ulcer, and 2 categorized as other.
| Characteristic | Value |
|---|---|
| |
| Mean age (SD), y | 55.1 (18.8) |
| Mean length of stay (SD), d | 3.4 (3.1) |
| Women, n (%) | 241 (50.8) |
| Nonwhite race, n (%) | 233 (49.2) |
| Payer, n (%) | |
| Private | 180 (38) |
| Medicare | 165 (34.8) |
| Medicaid | 47 (9.9) |
| Self‐pay/other | 82 (17.3) |
| Night admission, n (%) | 245 (51.7) |
| Weekend admission, n (%) | 135 (28.5) |
| Intensive care unit stay, n (%) | 18 (3.8) |
| Diagnosis, n (%) | |
| Diseases of the circulatory system | 95 (20.0) |
| Diseases of the digestive system | 65 (13.7) |
| Diseases of the respiratory system | 49 (10.3) |
| Injury and poisoning | 41 (8.7) |
| Diseases of the skin and soft tissue | 31 (6.5) |
| Symptoms, signs, and ill‐defined conditions and factors influencing health status | 28 (5.9) |
| Endocrine, nutritional, and metabolic diseases and immunity disorders | 25 (5.3) |
| Diseases of the genitourinary system | 24 (5.1) |
| Diseases of the musculoskeletal system and connective tissue | 23 (4.9) |
| Diseases of the nervous system | 23 (4.9) |
| Other | 70 (14.8) |
| Mean no. of Elixhauser comorbidities (SD) | 2.3 (1.7) |
| Mean MS‐DRG weight (SD) | 1.0 (1.0) |
| Mean NPI (SD) | 2.5 (1.0) |
| Mean UPC (SD) | 0.6 (0.2) |
Association Between Continuity and Adverse Events
In unadjusted models, each 1‐unit increase in the NPI (ie, less continuity) was significantly associated with the incidence of 1 or more AEs (odds ratio [OR]=1.75; P<0.001). However, UPC was not associated with incidence of AEs (OR=1.03; P=0.68) (Table 2). Across all adjusted models, neither NPI nor UPC was significantly associated with the incidence of AEs. The direction of the effect of discontinuity on AEs was inconsistent across models. Though all 3 adjusted models using NPI as the independent variable showed a trend toward increased odds of experiencing 1 or more AE with discontinuity, 2 of the 3 models using UPC showed trends in the opposite direction.
| NPI OR (95% CI)* | P Value | UPC OR (95% CI)* | P Value | ||
|---|---|---|---|---|---|
| |||||
| Unadjusted model | 1.75 (1.332.29) | <0.0001 | 1.03 (0.89‐1.21) | 0.68 | |
| Adjusted models | |||||
| Model 1 | MS‐DRG and LOS continuous | 1.16 (0.781.72) | 0.47 | 0.96 (0.791.14) | 0.60 |
| Model 2 | MS‐DRG and LOS in quartiles | 1.38 (0.981.94) | 0.07 | 1.05 (0.881.26) | 0.59 |
| Model 3 | MS‐DRG dropped, LOS continuous | 1.14 (0.771.70) | 0.51 | 0.95 (0.791.14) | 0.56 |
DISCUSSION
We found that hospitalist physician continuity was not associated with the incidence of AEs. Our findings are somewhat surprising because of the high value placed on continuity of care and patient safety concerns related to handoffs. Key clinical information may be lost when patient care is transitioned to a new hospitalist shortly after admission (eg, from a night hospitalist) or at the end of a rotation. Thus, it is logical to assume that discontinuity inherently increases the risk for harm. On the other hand, a physician newly taking over patient care from another may not be anchored to the initial diagnosis and treatment plan established by the first. This second look could potentially prevent missed/delayed diagnoses and optimize the plan of care.[19] These countervailing forces may explain our findings.
Several other potential explanations for our findings should be considered. First, the quality of handoffs may have been sufficient to overcome the potential for information loss. We feel this is unlikely given that little attention had been dedicated to improving the quality of patient handoffs among hospitalists in our institution. Notably, though a number of studies have evaluated resident physician handoffs, most of the work has focused on night coverage, and little is known about the quality of attending handoffs.[20] Second, access to a fully integrated electronic health record may have assisted hospitalists in complementing information received during handoffs. For example, a hospitalist about to start his or her rotation may have remotely accessed and reviewed patient medical records prior to receiving the phone handoff from the outgoing hospitalist. Third, other efforts to improve patient safety may have reduced the overall risk and provided some resilience in the system. Unit‐based interventions, including structured interdisciplinary rounds and nurse‐physician coleadership, improved teamwork climate and reduced AEs in the study hospital over time.[7]
Another factor to consider relates to the fact that hospital care is provided by teams of clinicians (eg, nurses, specialist physicians, therapists, social workers). Hospital teams are often large and have dynamic team membership. Similar to hospitalists, nurses, physician specialists, and other team members handoff care throughout the course of a patient's hospital stay. Yet, discontinuity for each professional type may occur at different times and frequencies. For example, a patient may be handed off from one hospitalist to another, yet the care continues with the same cardiologist or nurse. Future research should better characterize hospital team complexity (eg, size, relationships among members) and dynamics (eg, continuity for various professional types) and the impact of these factors on patient outcomes.
Our findings are important because hospitalist physician discontinuity is common during hospital stays. Hospital medicine groups vary in their staffing and scheduling models. Policies related to admission distribution and rotation length (consecutive days worked) systematically impact physician continuity. Few studies have evaluated the effect on continuity on hospitalized patient outcomes, and no prior research, to our knowledge, has explored the association of continuity on measures of patient safety.[6, 21, 22] Though our study might suggest that staffing models have little impact on patient safety, as previously mentioned, other team factors may influence patient outcomes.
Our study has several limitations. First, we assessed the impact of continuity on AEs in a single site. Although the 7 days on/7 days off model is the most common scheduling pattern used by adult hospital medicine groups,[23] staffing models and patient safety practices vary across hospitals, potentially limiting the generalizability of our study. Second, continuity can be defined and measured in a variety of ways. We used 2 different measures of physician continuity. As previously mentioned, assessing continuity of other clinicians may allow for a more complete understanding of the potential problems related to fragmentation of care. Third, this study excluded patients who experienced care transitions from other hospitals or other units within the hospital. Patients transferred from other hospitals are often complex, severely ill, and may be at higher risk for loss of key clinical information. Fourth, we used automated screens of an EDW to identify potential AEs. Although our prior research found that this method identified a similar number of AEs as manual medical record review screening, there was poor agreement between the 2 methods. Unfortunately, there is no gold standard to identify AEs. The EDW‐facilitated method allowed us to feasibly screen a larger number of charts, increasing statistical power, and minimized any potential bias that might occur during a manual review to identify potential AEs. Finally, we used data available from 2 prior studies and may have been underpowered to detect a significant association between continuity and AEs due to the relatively low percentage of patients experiencing an AE. In a post hoc power calculation, we estimated that we had 70% power to detect a 33% change in the proportion of patients with 1 or more AE for each 1‐unit increase in NPI, and 80% power to detect a 20% change for each 0.1‐unit decrease in UPC.
CONCLUSION
In conclusion, we found that hospitalist physician continuity was not associated with the incidence of AEs. We speculate that hospitalist continuity is only 1 of many team factors that may influence patient safety, and that prior efforts within our institution may have reduced our ability to detect an association. Future research should better characterize hospital team complexity and dynamics and the impact of these factors on patient outcomes.
Disclosures
This project was supported by a grant from the Agency for Healthcare Research and Quality and an Excellence in Academic Medicine Award, administered by Northwestern Memorial Hospital. The authors report no conflicts of interest.
- , , . What is “continuity of care”? J Health Serv Res Policy. 2006;11:248–250.
- , . Interpersonal continuity of care and care outcomes: a critical review. Ann Fam Med. 2005;3:159–166.
- , , , . The association between continuity of care and outcomes: a systematic and critical review. J Eval Clin Pract. 2010;16:947–956.
- , . Interpersonal continuity of care and patient satisfaction: a critical review. Ann Fam Med. 2004;2:445–451.
- , , , . Continuity of care in a family practice residency program. Impact on physician satisfaction. J Fam Pract. 1990;31:69–73.
- , , , et al. The impact of hospitalist discontinuity on hospital cost, readmissions, and patient satisfaction. J Gen Intern Med. 2014;29:1004–1008.
- , , , et al. Implementation of unit‐based interventions to improve teamwork and patient safety on a medical service [published online ahead of print June 11, 2014]. Am J Med Qual. doi: 10.1177/1062860614538093.
- . Measuring provider continuity in ambulatory care: an assessment of alternative approaches. Med Care. 1979;17:551–565.
- . Defining and measuring interpersonal continuity of care. Ann Fam Med. 2003;1:134–143.
- U.S. Department of Health and Human Services. Agency for Healthcare Research and Quality. Adverse events in hospitals: national incidence among medical beneficiaries. Available at: http://psnet.ahrq.gov/resource.aspx?resourceID=19811. Published November 2010. Accessed on December 15, 2014.
- , , , et al. “Global trigger tool” shows that adverse events in hospitals may be ten times greater than previously measured. Health Aff (Millwood). 2011;30:581–589.
- , , , et al. A study of medical injury and medical malpractice. N Engl J Med. 1989;321:480–484.
- , , , et al. Incidence and types of adverse events and negligent care in Utah and Colorado. Med Care. 2000;38:261–271.
- , , , et al. Comparison of traditional trigger tool to data warehouse based screening for identifying hospital adverse events. BMJ Qual Saf. 2013;22:130–138.
- , , , et al. Incidence of adverse events and negligence in hospitalized patients. Results of the Harvard Medical Practice Study I. N Engl J Med. 1991;324:370–376.
- , , . Safety of patients isolated for infection control. JAMA. 2003;290:1899–1905.
- HCUP Clinical Classification Software. Agency for Healthcare Research and Quality, Rockville, MD. http://www.hcup-us.ahrq.gov/toolssoftware/ccs/ccs.jsp. Accessed on December 15, 2014.
- , , , . Comorbidity measures for use with administrative data. Med Care. 1998;36:8–27.
- . Does continuity of care matter? No: discontinuity can improve patient care. West J Med. 2001;175:5.
- , , , , , . Hospitalist handoffs: a systematic review and task force recommendations. J Hosp Med. 2009;4:433–440.
- , , , , . The impact of fragmentation of hospitalist care on length of stay. J Hosp Med. 2010;5:335–338.
- , , . The Creating Incentives and Continuity Leading to Efficiency staffing model: a quality improvement initiative in hospital medicine. Mayo Clin Proc. 2012;87:364–371.
- Society of Hospital Medicine. 2014 state of hospital medicine report. Philadelphia, PA: Society of Hospital Medicine; 2014.
© 2014 Society of Hospital Medicine
Obesity Intervention With Follow‐up
Obesity‐related medical care remains a substantial driver in escalating healthcare costs. Not surprisingly, healthcare costs for obese patients are 40% higher annually than those for normal‐weight individuals.[1] In 2002, the morbidity attributable to obesity was calculated to equal, if not exceed, that associated with smoking.[2] Though inpatient outcomes appear similar for obese individuals, nearly all obesity‐related comorbidities can lead to hospitalization, and obesity has been linked to early mortality.[3, 4, 5] As obesity‐related costs continue to grow, so does the need to intervene in this at‐risk patient population.[3, 4, 5] Though significant efforts have focused on obesity interventions in the outpatient setting, a paucity of data exists on how best to address obesity during inpatient hospitalization.
Hospitalization itself has often been described as a teachable moment, a time during which a life event leads to increased receptivity to behavior change.[6, 7, 8] The positive effects of inpatient smoking cessation efforts are well recognized. Such initiatives typically include an inpatient counseling session, followed by supportive contact postdischarge.[9, 10] Features common to successful outpatient weight loss interventions include ongoing patient contact of variable duration, frequent self‐weighing, diet modifications, and increased activity.[11, 12, 13, 14, 15] To date, little is known about the effectiveness of such programs in the inpatient setting, though research has shown that obese inpatients are receptive to weight loss initiatives.[16] Accomplishing even modest weight reductions in such patients has the potential to lead to significant health and cost benefits.[1, 17, 18, 19]
In this study we sought to determine whether inpatient weight loss counseling with post discharge phone follow‐up would result in significant weight loss at 6 months when compared to controls. Secondary end points included weight change from baseline and changes in waist‐to‐hip ratios (WHRs). To our knowledge, this is the first randomized trial designed to evaluate the effect of an inpatient obesity intervention with postdischarge follow‐up in a general medicine population.
METHODS
Setting/Participants
We conducted a prospective, randomized controlled trial from January 2011 to May 2012 at a single, large (854‐bed), academic medical center in Chicago, Illinois. Eligible subjects were those with a body mass index (BMI; calculated as weight in kilograms divided by height in meters squared) between 30 and 50 kg/m2, ages 18 to 65 years old, admitted to an internal medicine service. Exclusion criteria included the presence of acute medical conditions known to affect weight, Charlson comorbidity index >3, moderate to severe major depression, prolonged steroid use (>2 weeks), initiation of medications known to affect weight (eg, diuretics), non‐English speaking, and precontemplation stage of change. Upon enrollment, subjects were randomly assigned to either the control or intervention group. A computer‐generated block randomization scheme was used to generate group assignments. Study research assistants sequentially assigned enrolled patients according to the computer‐generated randomization scheme. Group assignment was only revealed to each study participant after enrollment was complete. Figure 1 summarizes subject recruitment, randomization, and follow‐up. Informed written consent was obtained from all participants. Study participants, physicians, and investigators were unblinded. Study subjects were informed that they were participating in an obesity study as outlined on the study consent form. Study protocols and procedures were approved by the institutional review board at Northwestern University.

Interventions
After enrollment, all subjects had body weight measured on a calibrated study scale in light clothing or hospital gown without shoes. Waist circumference (narrowest circumference between the ribs and iliac crest) and hip circumference (maximum circumference of the hips) were measured to the nearest 0.1 cm. Measurements were taken in triplicate and averaged. WHR was calculated as waist circumference divided by hip circumference. All participants completed a demographic questionnaire and rated their level of agreement with 6 statements relating to weight perceptions and weight loss using a Likert scale from 1 (strongly disagree) to 10 (strongly agree).
Participants in the control group were not provided with any specific instructions regarding weight loss, diet, or exercise prior to discharge. Intervention group subjects were asked to view a 13‐minute weight loss education video (addressed specific caloric intake goals for weight loss, portion sizes), undergo a 25‐minute personalized counseling session with a certified health educator or study physician, and to set 3 specific lifestyle goals prior to discharge (weight loss, dietary, and fitness). A personal weight loss goal of 10% baseline body weight was set for intervention subjects based on obesity treatment guidelines suggesting subjects could safely lose 1 to 2 lb per week over the course of the study.[20] Clinically significant weight loss was defined as weight loss of 5% or more from baseline body weight based on literature illustrating health benefits with this amount of weight loss.[17, 18, 19]
All study subjects received a phone call schedule and weight‐tracking sheet prior to discharge, with calls scheduled at weeks 1, 2, 3, 4, 8, 12, 16, 20, and 24. Phone calls for both groups were used to obtain weight and identify changes in medications or health condition and were conducted by a certified health educator or study physician. No problem solving, motivational support, or other specific instruction was provided to the control group, whereas phone calls for intervention subjects utilized motivational interviewing and problem‐solving techniques.
Study subjects were asked to return for an in‐person follow‐up visit at 6 months. Weight was reassessed with subjects in light clothing and without shoes on the same calibrated study scale by a certified health educator. Follow‐up WHRs were also collected.
Outcomes
The primary outcome of the study was the difference in mean weight change (change in kilograms from baseline) between control and intervention groups at 6 months. Secondary outcome measures included intragroup weight change from baseline and changes in WHR.
Measured weights were obtained for subjects who returned for 6‐month follow‐up. For those unable or unwilling to return at 6 months, measured weights were obtained from the electronic health record (EHR) and self‐reported weights requested for use in imputed weight calculations. Imputation weights for missing weight values were prioritized as follows: (1) in‐person 6‐month follow‐up weight used if available, (2) inpatient or outpatient EHR obtained weight used if in‐person weight unavailable, and (3) if neither an in‐person or EHR weight was available, a self‐reported weight was used.[21] For intention‐to‐treat analysis, baseline weight was carried forward for subjects lacking follow‐up data after enrollment, historically considered a conservative strategy in weight loss trials.[22, 23]
Statistical Analysis
Baseline patient characteristics were compared using 2 tests for categorical variables and 2‐sample t tests for continuous variables. The primary study outcome of weight change over time for each group was assessed for all study participants using an intention‐to‐treat analysis. Separate as‐treated analyses were also performed utilizing imputed weights for those who failed to follow‐up at 6 months and for study completers who had a measured study weight documented at 6 months.
Three analyzable datasets were computed: intention‐to‐treat (using all participants randomized to the study), as‐treated analysis with imputed weights, and as treated analysis with measured 6‐month study weights only. Intent‐to‐treat analysis provides the unbiased comparisons among the treatment groups. To avoid dilution of treatment effect, as‐treated analyses with imputed weights (including measured weights at 6‐month follow‐up obtained from other sources [eg, clinic visit]) and with measured study weights (completers only) were performed.
Weight change over time was analyzed with a longitudinal covariance pattern model, using an unstructured variance‐covariance matrix. Specifically, weight was modeled at all time points (baseline and weeks 1, 2, 3, 4, 8, 12, 16, 20, and 24) using a priori contrasts and treating baseline as the reference cell to assess weight change, relative to baseline, at the 4 postbaseline time points.[24] Group effects on these a priori time contrasts were included to test for weight change differences between groups, and we specifically tested whether the group effect on weight change was equal or varied across the postbaseline time points.
We aimed to obtain a sample size of 176 subjects (88 in each group) in order to achieve 80% power to detect a 5‐kg weight loss in the intervention group after 6 months (at most standard deviation [SD]=15) and a 5‐kg difference in weight loss between groups (SD=10), assuming an of 0.05 using 2‐tailed testing and an attrition rate of 20%.
RESULTS
Over a period of 18 months we were able to recruit 176 subjects. We found no significant differences in baseline characteristics between groups (Table 1). Sixteen subjects developed exclusionary conditions after enrollment and were subsequently excluded from as‐treated data analyses. Follow‐up weight data for as‐treated analysis were available for 139 study subjects through the use of in‐person (n=83), EHR (n=41), and self‐reported (n=15) weights.
| Intervention, N=88 | Control, N=88 | |
|---|---|---|
| ||
| Age, y, mean (SD) | 48.9 (10.5) | 48.7 (10.3) |
| Female, % | 67.1 | 62.5 |
| Race/ethnicity, % | ||
| African American | 50.0 | 41.4 |
| Caucasian | 36.4 | 46.5 |
| Other | 13.6 | 11.6 |
| Education level, % | ||
| High school | 11.4 | 11.5 |
| College | 68.2 | 64.4 |
| Graduate level | 20.5 | 24.1 |
| Annual income, % | ||
| <$50,000 | 43.0 | 45.2 |
| $50,000$100,000 | 45.4 | 33.3 |
| >$100,000 | 11.6 | 21.4 |
| BMI, mean (SD), kg/m2 | 38.0 (5.1) | 37.5 (4.9) |
| BMI category, % | ||
| 3034.9 | 34.1 | 34.1 |
| 3539.9 | 28.4 | 37.5 |
| 40 | 37.5 | 28.4 |
| Waist‐hip ratio, mean (SD)a | 0.95 (0.08) | 0.96 (0.08) |
| Length of stay, d, median (interquartile range) | 2.0 (1.13.0) | 2.2 (1.33.3) |
| Diabetes, % | 27.3 | 25.0 |
| Admit diagnosis, % | ||
| Cardiovascular | 34.1 | 25.0 |
| Gastrointestinal | 15.9 | 18.2 |
| Pulmonary | 10.2 | 5.7 |
| Infectious | 11.4 | 13.6 |
| Endocrine | 3.4 | 2.3 |
| Other | 25.0 | 35.2 |
Change in Weight Loss and WHR
For the 176 participants included in the intent‐to‐treat analysis, mean weight loss for the intervention group and control groups was 1.08 kg (SD=4.33) and 1.35 kg (SD=3.64) at 6 months, respectively. We found no significant difference in weight loss between groups at 6 months (P=0.26), though there was statistically significant weight loss from baseline noted in both groups (P=0.02 and P=0.0008, respectively) (Table 2).
| Characteristic | Intervention Group | Control Group | P Valuea |
|---|---|---|---|
| |||
| Intent‐to‐treat analysis (all participants), kg (SD) | |||
| No. | 88 | 88 | |
| Baseline | 107.7 (16.7) | 105.1 (17.4) | 0.23 |
| 6‐month follow‐up | 106.6 (16.1) | 103.8 (17.1) | 0.16 |
| Weight change | 1.08 (4.33) | 1.35 (3.64) | 0.26 |
| As treated analysis with imputed weights, kg (SD) | |||
| No. | 69 | 70 | |
| Baseline | 108.9 (16.7) | 104.0 (16.2) | 0.08 |
| 6‐month follow‐up | 106.1 (17.2) | 102.4 (15.9) | 0.18 |
| Weight change | 2.88 (5.77) | 1.69 (5.09) | 0.12 |
| As treated analysis with measured 6‐month weights (completers), kg (SD) | |||
| No. | 41 | 42 | |
| Baseline | 109.8 (16.2) | 107.0 (18.0) | 0.47 |
| 6‐month follow‐up | 107.4 (15.0) | 104.2 (17.7) | 0.37 |
| Weight change | 2.32 (6.16) | 2.83 (4.88) | 0.68 |
Of 139 participants in the as‐treated analysis utilizing imputed weights, weight loss for the intervention group and control groups was 2.88 kg (SD=5.77) and 1.69 kg (SD=5.09). There was statistically significant weight loss at the 6‐month follow‐up from baseline in both groups (P=0.006, P=0.004, respectively). However, there were neither statistically nor clinically significant differences between the 2 groups (1.19 kg, P=0.12). Finally, for the 83 completers in the as‐treated analysis with measured study weights only, weight loss for the intervention group and control group was 2.32 kg (SD=6.16) and 2.83 kg (SD=4.88), respectively. Though we again noted statistically significant weight loss at the 6‐month follow‐up from baseline in both groups (P=0.02, P=0.0005, respectively), we found neither statistically nor clinically significant differences in weight loss between the 2 groups (0.51 kg, P=0.68). Figure 2 illustrates weight change over time for the intervention and control subjects who returned for in‐person follow‐up at 6 months.
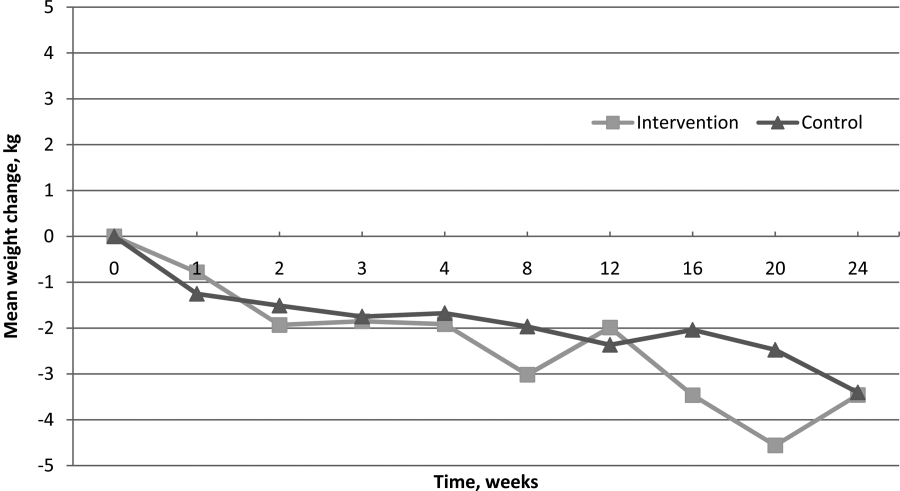
For WHRs, we found no difference in WHR change between groups at 6 months (0.04 vs 0.04, P=0.59). However, among those who completed the study, there was a statistically significant decrease in WHR from baseline within both groups, decreasing 0.040.06 (P=0.006) in the intervention group and 0.040.04 (P<0.001) among controls.
Weight Perceptions
Only 34% of participants accurately perceived their weight and correctly identified themselves as either obese or morbidly obese. Nearly half of the study participants (47%) classified themselves as overweight rather than obese, though all met criteria for obesity. We found weight perception was most accurate among Caucasians (48%) and least accurate among African Americans (24%) and morbidly obese individuals (26%). Nearly all subjects felt weight loss was important (99%), and most assumed weight had contributed to their hospitalization (64%).
DISCUSSION
We hypothesized that intervention group subjects would lose more weight than those assigned to control given that they received weight loss interventions previously shown to be effective.[13, 25, 26, 27] However, intention‐to‐treat analysis showed no difference in weight loss between intervention and control subjects at 6 months. Interestingly, as‐treated analyses did suggest that subjects in both study arms lost a modest amount of weight over the duration of the study. Though modest weight reductions have been shown to give rise to health benefits, neither group met our prespecified goal for clinically significant weight loss (5% of baseline body weight).[18, 19] There were also no differences in WHRs noted between the intervention and control groups. The modest reductions in WHRs from baseline in both groups are of uncertain clinical significance but of interest given the well‐established graded relationship between WHR and risk of cardiovascular disease.[28, 29, 30, 31]
Though the control group subjects received no specific instruction regarding weight loss, we suspect that the influences of study enrollment, discussion of obesity while an inpatient, regular phone contacts, and weight tracking may have been sufficient to affect weight behaviors. Certainly, this exceeds usual care for hospitalized patients suffering from obesity. Though it is possible that all of obese patients lose weight over the 6‐month period following hospitalization, we feel this is unlikely. The exclusion of subjects with an elevated Charlson comorbidity index lessened the likelihood of weight loss due to chronic disease, and without intervention, obese individuals tend to gain rather than lose weight over time.[32] Nonetheless, the lack of significant weight loss between groups suggests that the specific weight loss instruction provided to the intervention group did not promote more weight loss than the general education and regular phone calls provided to controls.
Our findings related to weight perception were similar to those established in prior studies. Individuals frequently misperceive their weight and weight perceptions are least accurate among severely obese individuals and nonwhites.[16, 33, 34] Contrary to prior studies, we found that the majority of participants felt their weight negatively impacted their health, and most thought their hospitalization was weight‐related.[35] Interestingly, research suggests that weight‐related perception of health risk correlates with the likelihood of making a weight loss attempt, another factor that may have influenced the behavior of study participants.[35]
This study has several limitations. It was conducted and based on practices at a single institution, thus limiting generalizability. Additionally, the percentage of subjects who returned for 6‐month follow‐up was lower than desired at 50%. However, high attrition rates commonly plague obesity trials, and we are unaware of any existing studies documenting expected attrition rates among obese inpatients.[23, 36, 37, 38] To help address this, we used imputed weights in our as‐treated analysis to obtain follow‐up weight values on 79% of subjects. Further, the intentional exclusion of subjects in the precontemplation stage of change likely resulted in selection of a more motivated patient population. However, this was done assuming that most inpatient obesity interventions would primarily target patients interested in losing weight. Finally, the lack of a usual care group that more accurately reflects the experience of most hospitalized obese patientsno regular postdischarge interactionsdoes limit interpretation of the modest weight loss noted in both study groups.
In conclusion, an inpatient obesity intervention with post‐discharge follow‐up did not result in intervention subjects losing more weight than controls over a 6‐month period. However, the finding of modest weight loss among both groups is of interest and may warrant further investigation. It remains unclear whether this is a naturally occurring phenomenon or whether other factors influence behavior change in this patient population. Additional studies will be needed to clarify the impact of hospitalization, obesity recognition, perception of health risk, weight tracking, and follow‐up on weight behaviors. Given the proven benefits of even modest weight reductions, encouraging any amount of weight loss in these at‐risk individuals would appear to be a step in the right direction. We have yet to determine whether inpatient obesity interventions represent a lost opportunity.
- , , , . The impact of weight loss among seniors on Medicare spending. Health Econ Rev. 2013;3(1):7.
- . The effects of obesity, smoking, and drinking on medical problems and costs. Health Aff (Millwood). 2002;21(2):245–253.
- , , , , , . The incidence of co‐morbidities related to obesity and overweight: a systematic review and meta‐analysis. BMC Public Health. 2009;9:88.
- , , , , , . The impact of obesity on US mortality levels: the importance of age and cohort factors in population estimates. Am J Public Health. 2013;103(10):1895–1901.
- , , , . Assessment of excess mortality in obesity. Am J Epidemiol. 1998;147(1):42–48.
- , , . Importance of in‐hospital initiation of evidence‐based medical therapies for heart failure‐a review. Am J Cardiol. 2004;94(9):1155–1160.
- . In‐hospital initiation of statins: taking advantage of the “teachable moment”. Cleve Clin J Med. 2003;70(6):502, 504–506.
- , , . Understanding the potential of teachable moments: the case of smoking cessation. Health Educ Res. 2003;18(2):156–170.
- , , . Smoking cessation interventions for hospitalized smokers: a systematic review. Arch Intern Med. 2008;168(18):1950–1960.
- , . Smoking cessation initiated during hospital stay for patients with coronary artery disease: a randomized controlled trial. CMAJ. 2009;180(13):1297–1303.
- , , , , , . Phone and e‐mail counselling are effective for weight management in an overweight working population: a randomized controlled trial. BMC Public Health. 2009;9:6.
- , . Weighing the evidence: benefits of regular weight monitoring for weight control. J Nutr Educ Behav. 2005;37(6):319–322.
- , , , et al. Comparative effectiveness of weight‐loss interventions in clinical practice. N Engl J Med. 2011;365(21):1959–1968.
- , , , et al. Weight‐loss outcomes: a systematic review and meta‐analysis of weight‐loss clinical trials with a minimum 1‐year follow‐up. J Am Diet Assoc. 2007;107(10):1755–1767.
- , , . Self‐monitoring in weight loss: a systematic review of the literature. J Am Diet Assoc. 2011;111(1):92–102.
- , , , . Willingness for weight loss intervention among overweight and obese inpatients. South Med J. 2011;104(6):397–400.
- , , , et al. Benefits of modest weight loss in improving cardiovascular risk factors in overweight and obese individuals with type 2 diabetes. Diabetes Care. 2011;34(7):1481–1486.
- , , . The beneficial effects of modest weight loss on cardiovascular risk factors. Int J Obes Relat Metab Disord. 1997;21(suppl 1):S5–S9.
- . Beneficial health effects of modest weight loss. Int J Obes Relat Metab Disord. 1992;16(6):397–415.
- Clinical guidelines on the identification, evaluation, and treatment of overweight and obesity in adults—the evidence report. National Institutes of Health. Obes Res. 1998;6(suppl 2):51S–209S.
- , , , et al. Validity of clinical body weight measures as substitutes for missing data in a randomized trial. Obes Res Clin Pract. 2008;2(4):277–281.
- , , . Advances in analysis of longitudinal data. Ann Rev Clin Psychol. 2010;6:79–107.
- , , , et al. Missing data in randomized clinical trials for weight loss: scope of the problem, state of the field, and performance of statistical methods. PloS One. 2009;4(8):e6624.
- , . Longitudinal Data Analysis. Hoboken, NJ: Wiley‐Interscience; 2006.
- , , , . Comparison of methods for delivering a lifestyle modification program for obese patients: a randomized trial. Ann Intern Med. 2009;150(4):255–262.
- . Clinical practice. Nonsurgical management of obesity in adults. N Engl J Med. 2008;358(18):1941–1950.
- , , . A meta‐analysis of the past 25 years of weight loss research using diet, exercise or diet plus exercise intervention. Int J Obes Relat Metab Disord. 1997;21(10):941–947.
- , , , et al. Body fat distribution and risk of coronary heart disease in men and women in the European Prospective Investigation Into Cancer and Nutrition in Norfolk cohort: a population‐based prospective study. Circulation. 2007;116(25):2933–2943.
- , , , et al. The association of differing measures of overweight and obesity with prevalent atherosclerosis: the Dallas Heart Study. J Am Coll Cardiol. 2007;50(8):752–759.
- , , , et al. Obesity and the risk of myocardial infarction in 27,000 participants from 52 countries: a case‐control study. Lancet. 2005;366(9497):1640–1649.
- , , , . Waist circumference and waist‐to‐hip ratio as predictors of cardiovascular events: meta‐regression analysis of prospective studies. Eur Heart J. 2007;28(7):850–856.
- , , , . Obesity and the environment: where do we go from here? Science. 2003;299(5608):853–855.
- , . Self‐perception of weight appropriateness in the United States. Am J Prev Med. 2003;24(4):332–339.
- , , , et al. Differences in weight perception among blacks and whites. J Womens Health (Larchmt). 2011;20(12):1805–1811.
- , , , , . Perceived health risk of excess body weight among overweight and obese men and women: differences by sex. Prev Med. 2008;47(1):46–52.
- , , . Obesity research—limitations of methods, measurements, and medications. JAMA. 2006;295(7):826–828.
- . Interpreting incomplete data in studies of diet and weight loss. N Engl J Med. 2003;348(21):2136–2137.
- , , , . Predictors of attrition in a large clinic‐based weight‐loss program. Obes Res. 2003;11(7):888–894.
Obesity‐related medical care remains a substantial driver in escalating healthcare costs. Not surprisingly, healthcare costs for obese patients are 40% higher annually than those for normal‐weight individuals.[1] In 2002, the morbidity attributable to obesity was calculated to equal, if not exceed, that associated with smoking.[2] Though inpatient outcomes appear similar for obese individuals, nearly all obesity‐related comorbidities can lead to hospitalization, and obesity has been linked to early mortality.[3, 4, 5] As obesity‐related costs continue to grow, so does the need to intervene in this at‐risk patient population.[3, 4, 5] Though significant efforts have focused on obesity interventions in the outpatient setting, a paucity of data exists on how best to address obesity during inpatient hospitalization.
Hospitalization itself has often been described as a teachable moment, a time during which a life event leads to increased receptivity to behavior change.[6, 7, 8] The positive effects of inpatient smoking cessation efforts are well recognized. Such initiatives typically include an inpatient counseling session, followed by supportive contact postdischarge.[9, 10] Features common to successful outpatient weight loss interventions include ongoing patient contact of variable duration, frequent self‐weighing, diet modifications, and increased activity.[11, 12, 13, 14, 15] To date, little is known about the effectiveness of such programs in the inpatient setting, though research has shown that obese inpatients are receptive to weight loss initiatives.[16] Accomplishing even modest weight reductions in such patients has the potential to lead to significant health and cost benefits.[1, 17, 18, 19]
In this study we sought to determine whether inpatient weight loss counseling with post discharge phone follow‐up would result in significant weight loss at 6 months when compared to controls. Secondary end points included weight change from baseline and changes in waist‐to‐hip ratios (WHRs). To our knowledge, this is the first randomized trial designed to evaluate the effect of an inpatient obesity intervention with postdischarge follow‐up in a general medicine population.
METHODS
Setting/Participants
We conducted a prospective, randomized controlled trial from January 2011 to May 2012 at a single, large (854‐bed), academic medical center in Chicago, Illinois. Eligible subjects were those with a body mass index (BMI; calculated as weight in kilograms divided by height in meters squared) between 30 and 50 kg/m2, ages 18 to 65 years old, admitted to an internal medicine service. Exclusion criteria included the presence of acute medical conditions known to affect weight, Charlson comorbidity index >3, moderate to severe major depression, prolonged steroid use (>2 weeks), initiation of medications known to affect weight (eg, diuretics), non‐English speaking, and precontemplation stage of change. Upon enrollment, subjects were randomly assigned to either the control or intervention group. A computer‐generated block randomization scheme was used to generate group assignments. Study research assistants sequentially assigned enrolled patients according to the computer‐generated randomization scheme. Group assignment was only revealed to each study participant after enrollment was complete. Figure 1 summarizes subject recruitment, randomization, and follow‐up. Informed written consent was obtained from all participants. Study participants, physicians, and investigators were unblinded. Study subjects were informed that they were participating in an obesity study as outlined on the study consent form. Study protocols and procedures were approved by the institutional review board at Northwestern University.
Interventions
After enrollment, all subjects had body weight measured on a calibrated study scale in light clothing or hospital gown without shoes. Waist circumference (narrowest circumference between the ribs and iliac crest) and hip circumference (maximum circumference of the hips) were measured to the nearest 0.1 cm. Measurements were taken in triplicate and averaged. WHR was calculated as waist circumference divided by hip circumference. All participants completed a demographic questionnaire and rated their level of agreement with 6 statements relating to weight perceptions and weight loss using a Likert scale from 1 (strongly disagree) to 10 (strongly agree).
Participants in the control group were not provided with any specific instructions regarding weight loss, diet, or exercise prior to discharge. Intervention group subjects were asked to view a 13‐minute weight loss education video (addressed specific caloric intake goals for weight loss, portion sizes), undergo a 25‐minute personalized counseling session with a certified health educator or study physician, and to set 3 specific lifestyle goals prior to discharge (weight loss, dietary, and fitness). A personal weight loss goal of 10% baseline body weight was set for intervention subjects based on obesity treatment guidelines suggesting subjects could safely lose 1 to 2 lb per week over the course of the study.[20] Clinically significant weight loss was defined as weight loss of 5% or more from baseline body weight based on literature illustrating health benefits with this amount of weight loss.[17, 18, 19]
All study subjects received a phone call schedule and weight‐tracking sheet prior to discharge, with calls scheduled at weeks 1, 2, 3, 4, 8, 12, 16, 20, and 24. Phone calls for both groups were used to obtain weight and identify changes in medications or health condition and were conducted by a certified health educator or study physician. No problem solving, motivational support, or other specific instruction was provided to the control group, whereas phone calls for intervention subjects utilized motivational interviewing and problem‐solving techniques.
Study subjects were asked to return for an in‐person follow‐up visit at 6 months. Weight was reassessed with subjects in light clothing and without shoes on the same calibrated study scale by a certified health educator. Follow‐up WHRs were also collected.
Outcomes
The primary outcome of the study was the difference in mean weight change (change in kilograms from baseline) between control and intervention groups at 6 months. Secondary outcome measures included intragroup weight change from baseline and changes in WHR.
Measured weights were obtained for subjects who returned for 6‐month follow‐up. For those unable or unwilling to return at 6 months, measured weights were obtained from the electronic health record (EHR) and self‐reported weights requested for use in imputed weight calculations. Imputation weights for missing weight values were prioritized as follows: (1) in‐person 6‐month follow‐up weight used if available, (2) inpatient or outpatient EHR obtained weight used if in‐person weight unavailable, and (3) if neither an in‐person or EHR weight was available, a self‐reported weight was used.[21] For intention‐to‐treat analysis, baseline weight was carried forward for subjects lacking follow‐up data after enrollment, historically considered a conservative strategy in weight loss trials.[22, 23]
Statistical Analysis
Baseline patient characteristics were compared using 2 tests for categorical variables and 2‐sample t tests for continuous variables. The primary study outcome of weight change over time for each group was assessed for all study participants using an intention‐to‐treat analysis. Separate as‐treated analyses were also performed utilizing imputed weights for those who failed to follow‐up at 6 months and for study completers who had a measured study weight documented at 6 months.
Three analyzable datasets were computed: intention‐to‐treat (using all participants randomized to the study), as‐treated analysis with imputed weights, and as treated analysis with measured 6‐month study weights only. Intent‐to‐treat analysis provides the unbiased comparisons among the treatment groups. To avoid dilution of treatment effect, as‐treated analyses with imputed weights (including measured weights at 6‐month follow‐up obtained from other sources [eg, clinic visit]) and with measured study weights (completers only) were performed.
Weight change over time was analyzed with a longitudinal covariance pattern model, using an unstructured variance‐covariance matrix. Specifically, weight was modeled at all time points (baseline and weeks 1, 2, 3, 4, 8, 12, 16, 20, and 24) using a priori contrasts and treating baseline as the reference cell to assess weight change, relative to baseline, at the 4 postbaseline time points.[24] Group effects on these a priori time contrasts were included to test for weight change differences between groups, and we specifically tested whether the group effect on weight change was equal or varied across the postbaseline time points.
We aimed to obtain a sample size of 176 subjects (88 in each group) in order to achieve 80% power to detect a 5‐kg weight loss in the intervention group after 6 months (at most standard deviation [SD]=15) and a 5‐kg difference in weight loss between groups (SD=10), assuming an of 0.05 using 2‐tailed testing and an attrition rate of 20%.
RESULTS
Over a period of 18 months we were able to recruit 176 subjects. We found no significant differences in baseline characteristics between groups (Table 1). Sixteen subjects developed exclusionary conditions after enrollment and were subsequently excluded from as‐treated data analyses. Follow‐up weight data for as‐treated analysis were available for 139 study subjects through the use of in‐person (n=83), EHR (n=41), and self‐reported (n=15) weights.
| Intervention, N=88 | Control, N=88 | |
|---|---|---|
| ||
| Age, y, mean (SD) | 48.9 (10.5) | 48.7 (10.3) |
| Female, % | 67.1 | 62.5 |
| Race/ethnicity, % | ||
| African American | 50.0 | 41.4 |
| Caucasian | 36.4 | 46.5 |
| Other | 13.6 | 11.6 |
| Education level, % | ||
| High school | 11.4 | 11.5 |
| College | 68.2 | 64.4 |
| Graduate level | 20.5 | 24.1 |
| Annual income, % | ||
| <$50,000 | 43.0 | 45.2 |
| $50,000$100,000 | 45.4 | 33.3 |
| >$100,000 | 11.6 | 21.4 |
| BMI, mean (SD), kg/m2 | 38.0 (5.1) | 37.5 (4.9) |
| BMI category, % | ||
| 3034.9 | 34.1 | 34.1 |
| 3539.9 | 28.4 | 37.5 |
| 40 | 37.5 | 28.4 |
| Waist‐hip ratio, mean (SD)a | 0.95 (0.08) | 0.96 (0.08) |
| Length of stay, d, median (interquartile range) | 2.0 (1.13.0) | 2.2 (1.33.3) |
| Diabetes, % | 27.3 | 25.0 |
| Admit diagnosis, % | ||
| Cardiovascular | 34.1 | 25.0 |
| Gastrointestinal | 15.9 | 18.2 |
| Pulmonary | 10.2 | 5.7 |
| Infectious | 11.4 | 13.6 |
| Endocrine | 3.4 | 2.3 |
| Other | 25.0 | 35.2 |
Change in Weight Loss and WHR
For the 176 participants included in the intent‐to‐treat analysis, mean weight loss for the intervention group and control groups was 1.08 kg (SD=4.33) and 1.35 kg (SD=3.64) at 6 months, respectively. We found no significant difference in weight loss between groups at 6 months (P=0.26), though there was statistically significant weight loss from baseline noted in both groups (P=0.02 and P=0.0008, respectively) (Table 2).
| Characteristic | Intervention Group | Control Group | P Valuea |
|---|---|---|---|
| |||
| Intent‐to‐treat analysis (all participants), kg (SD) | |||
| No. | 88 | 88 | |
| Baseline | 107.7 (16.7) | 105.1 (17.4) | 0.23 |
| 6‐month follow‐up | 106.6 (16.1) | 103.8 (17.1) | 0.16 |
| Weight change | 1.08 (4.33) | 1.35 (3.64) | 0.26 |
| As treated analysis with imputed weights, kg (SD) | |||
| No. | 69 | 70 | |
| Baseline | 108.9 (16.7) | 104.0 (16.2) | 0.08 |
| 6‐month follow‐up | 106.1 (17.2) | 102.4 (15.9) | 0.18 |
| Weight change | 2.88 (5.77) | 1.69 (5.09) | 0.12 |
| As treated analysis with measured 6‐month weights (completers), kg (SD) | |||
| No. | 41 | 42 | |
| Baseline | 109.8 (16.2) | 107.0 (18.0) | 0.47 |
| 6‐month follow‐up | 107.4 (15.0) | 104.2 (17.7) | 0.37 |
| Weight change | 2.32 (6.16) | 2.83 (4.88) | 0.68 |
Of 139 participants in the as‐treated analysis utilizing imputed weights, weight loss for the intervention group and control groups was 2.88 kg (SD=5.77) and 1.69 kg (SD=5.09). There was statistically significant weight loss at the 6‐month follow‐up from baseline in both groups (P=0.006, P=0.004, respectively). However, there were neither statistically nor clinically significant differences between the 2 groups (1.19 kg, P=0.12). Finally, for the 83 completers in the as‐treated analysis with measured study weights only, weight loss for the intervention group and control group was 2.32 kg (SD=6.16) and 2.83 kg (SD=4.88), respectively. Though we again noted statistically significant weight loss at the 6‐month follow‐up from baseline in both groups (P=0.02, P=0.0005, respectively), we found neither statistically nor clinically significant differences in weight loss between the 2 groups (0.51 kg, P=0.68). Figure 2 illustrates weight change over time for the intervention and control subjects who returned for in‐person follow‐up at 6 months.
For WHRs, we found no difference in WHR change between groups at 6 months (0.04 vs 0.04, P=0.59). However, among those who completed the study, there was a statistically significant decrease in WHR from baseline within both groups, decreasing 0.040.06 (P=0.006) in the intervention group and 0.040.04 (P<0.001) among controls.
Weight Perceptions
Only 34% of participants accurately perceived their weight and correctly identified themselves as either obese or morbidly obese. Nearly half of the study participants (47%) classified themselves as overweight rather than obese, though all met criteria for obesity. We found weight perception was most accurate among Caucasians (48%) and least accurate among African Americans (24%) and morbidly obese individuals (26%). Nearly all subjects felt weight loss was important (99%), and most assumed weight had contributed to their hospitalization (64%).
DISCUSSION
We hypothesized that intervention group subjects would lose more weight than those assigned to control given that they received weight loss interventions previously shown to be effective.[13, 25, 26, 27] However, intention‐to‐treat analysis showed no difference in weight loss between intervention and control subjects at 6 months. Interestingly, as‐treated analyses did suggest that subjects in both study arms lost a modest amount of weight over the duration of the study. Though modest weight reductions have been shown to give rise to health benefits, neither group met our prespecified goal for clinically significant weight loss (5% of baseline body weight).[18, 19] There were also no differences in WHRs noted between the intervention and control groups. The modest reductions in WHRs from baseline in both groups are of uncertain clinical significance but of interest given the well‐established graded relationship between WHR and risk of cardiovascular disease.[28, 29, 30, 31]
Though the control group subjects received no specific instruction regarding weight loss, we suspect that the influences of study enrollment, discussion of obesity while an inpatient, regular phone contacts, and weight tracking may have been sufficient to affect weight behaviors. Certainly, this exceeds usual care for hospitalized patients suffering from obesity. Though it is possible that all of obese patients lose weight over the 6‐month period following hospitalization, we feel this is unlikely. The exclusion of subjects with an elevated Charlson comorbidity index lessened the likelihood of weight loss due to chronic disease, and without intervention, obese individuals tend to gain rather than lose weight over time.[32] Nonetheless, the lack of significant weight loss between groups suggests that the specific weight loss instruction provided to the intervention group did not promote more weight loss than the general education and regular phone calls provided to controls.
Our findings related to weight perception were similar to those established in prior studies. Individuals frequently misperceive their weight and weight perceptions are least accurate among severely obese individuals and nonwhites.[16, 33, 34] Contrary to prior studies, we found that the majority of participants felt their weight negatively impacted their health, and most thought their hospitalization was weight‐related.[35] Interestingly, research suggests that weight‐related perception of health risk correlates with the likelihood of making a weight loss attempt, another factor that may have influenced the behavior of study participants.[35]
This study has several limitations. It was conducted and based on practices at a single institution, thus limiting generalizability. Additionally, the percentage of subjects who returned for 6‐month follow‐up was lower than desired at 50%. However, high attrition rates commonly plague obesity trials, and we are unaware of any existing studies documenting expected attrition rates among obese inpatients.[23, 36, 37, 38] To help address this, we used imputed weights in our as‐treated analysis to obtain follow‐up weight values on 79% of subjects. Further, the intentional exclusion of subjects in the precontemplation stage of change likely resulted in selection of a more motivated patient population. However, this was done assuming that most inpatient obesity interventions would primarily target patients interested in losing weight. Finally, the lack of a usual care group that more accurately reflects the experience of most hospitalized obese patientsno regular postdischarge interactionsdoes limit interpretation of the modest weight loss noted in both study groups.
In conclusion, an inpatient obesity intervention with post‐discharge follow‐up did not result in intervention subjects losing more weight than controls over a 6‐month period. However, the finding of modest weight loss among both groups is of interest and may warrant further investigation. It remains unclear whether this is a naturally occurring phenomenon or whether other factors influence behavior change in this patient population. Additional studies will be needed to clarify the impact of hospitalization, obesity recognition, perception of health risk, weight tracking, and follow‐up on weight behaviors. Given the proven benefits of even modest weight reductions, encouraging any amount of weight loss in these at‐risk individuals would appear to be a step in the right direction. We have yet to determine whether inpatient obesity interventions represent a lost opportunity.
- , , , . The impact of weight loss among seniors on Medicare spending. Health Econ Rev. 2013;3(1):7.
- . The effects of obesity, smoking, and drinking on medical problems and costs. Health Aff (Millwood). 2002;21(2):245–253.
- , , , , , . The incidence of co‐morbidities related to obesity and overweight: a systematic review and meta‐analysis. BMC Public Health. 2009;9:88.
- , , , , , . The impact of obesity on US mortality levels: the importance of age and cohort factors in population estimates. Am J Public Health. 2013;103(10):1895–1901.
- , , , . Assessment of excess mortality in obesity. Am J Epidemiol. 1998;147(1):42–48.
- , , . Importance of in‐hospital initiation of evidence‐based medical therapies for heart failure‐a review. Am J Cardiol. 2004;94(9):1155–1160.
- . In‐hospital initiation of statins: taking advantage of the “teachable moment”. Cleve Clin J Med. 2003;70(6):502, 504–506.
- , , . Understanding the potential of teachable moments: the case of smoking cessation. Health Educ Res. 2003;18(2):156–170.
- , , . Smoking cessation interventions for hospitalized smokers: a systematic review. Arch Intern Med. 2008;168(18):1950–1960.
- , . Smoking cessation initiated during hospital stay for patients with coronary artery disease: a randomized controlled trial. CMAJ. 2009;180(13):1297–1303.
- , , , , , . Phone and e‐mail counselling are effective for weight management in an overweight working population: a randomized controlled trial. BMC Public Health. 2009;9:6.
- , . Weighing the evidence: benefits of regular weight monitoring for weight control. J Nutr Educ Behav. 2005;37(6):319–322.
- , , , et al. Comparative effectiveness of weight‐loss interventions in clinical practice. N Engl J Med. 2011;365(21):1959–1968.
- , , , et al. Weight‐loss outcomes: a systematic review and meta‐analysis of weight‐loss clinical trials with a minimum 1‐year follow‐up. J Am Diet Assoc. 2007;107(10):1755–1767.
- , , . Self‐monitoring in weight loss: a systematic review of the literature. J Am Diet Assoc. 2011;111(1):92–102.
- , , , . Willingness for weight loss intervention among overweight and obese inpatients. South Med J. 2011;104(6):397–400.
- , , , et al. Benefits of modest weight loss in improving cardiovascular risk factors in overweight and obese individuals with type 2 diabetes. Diabetes Care. 2011;34(7):1481–1486.
- , , . The beneficial effects of modest weight loss on cardiovascular risk factors. Int J Obes Relat Metab Disord. 1997;21(suppl 1):S5–S9.
- . Beneficial health effects of modest weight loss. Int J Obes Relat Metab Disord. 1992;16(6):397–415.
- Clinical guidelines on the identification, evaluation, and treatment of overweight and obesity in adults—the evidence report. National Institutes of Health. Obes Res. 1998;6(suppl 2):51S–209S.
- , , , et al. Validity of clinical body weight measures as substitutes for missing data in a randomized trial. Obes Res Clin Pract. 2008;2(4):277–281.
- , , . Advances in analysis of longitudinal data. Ann Rev Clin Psychol. 2010;6:79–107.
- , , , et al. Missing data in randomized clinical trials for weight loss: scope of the problem, state of the field, and performance of statistical methods. PloS One. 2009;4(8):e6624.
- , . Longitudinal Data Analysis. Hoboken, NJ: Wiley‐Interscience; 2006.
- , , , . Comparison of methods for delivering a lifestyle modification program for obese patients: a randomized trial. Ann Intern Med. 2009;150(4):255–262.
- . Clinical practice. Nonsurgical management of obesity in adults. N Engl J Med. 2008;358(18):1941–1950.
- , , . A meta‐analysis of the past 25 years of weight loss research using diet, exercise or diet plus exercise intervention. Int J Obes Relat Metab Disord. 1997;21(10):941–947.
- , , , et al. Body fat distribution and risk of coronary heart disease in men and women in the European Prospective Investigation Into Cancer and Nutrition in Norfolk cohort: a population‐based prospective study. Circulation. 2007;116(25):2933–2943.
- , , , et al. The association of differing measures of overweight and obesity with prevalent atherosclerosis: the Dallas Heart Study. J Am Coll Cardiol. 2007;50(8):752–759.
- , , , et al. Obesity and the risk of myocardial infarction in 27,000 participants from 52 countries: a case‐control study. Lancet. 2005;366(9497):1640–1649.
- , , , . Waist circumference and waist‐to‐hip ratio as predictors of cardiovascular events: meta‐regression analysis of prospective studies. Eur Heart J. 2007;28(7):850–856.
- , , , . Obesity and the environment: where do we go from here? Science. 2003;299(5608):853–855.
- , . Self‐perception of weight appropriateness in the United States. Am J Prev Med. 2003;24(4):332–339.
- , , , et al. Differences in weight perception among blacks and whites. J Womens Health (Larchmt). 2011;20(12):1805–1811.
- , , , , . Perceived health risk of excess body weight among overweight and obese men and women: differences by sex. Prev Med. 2008;47(1):46–52.
- , , . Obesity research—limitations of methods, measurements, and medications. JAMA. 2006;295(7):826–828.
- . Interpreting incomplete data in studies of diet and weight loss. N Engl J Med. 2003;348(21):2136–2137.
- , , , . Predictors of attrition in a large clinic‐based weight‐loss program. Obes Res. 2003;11(7):888–894.
© 2014 Society of Hospital Medicine
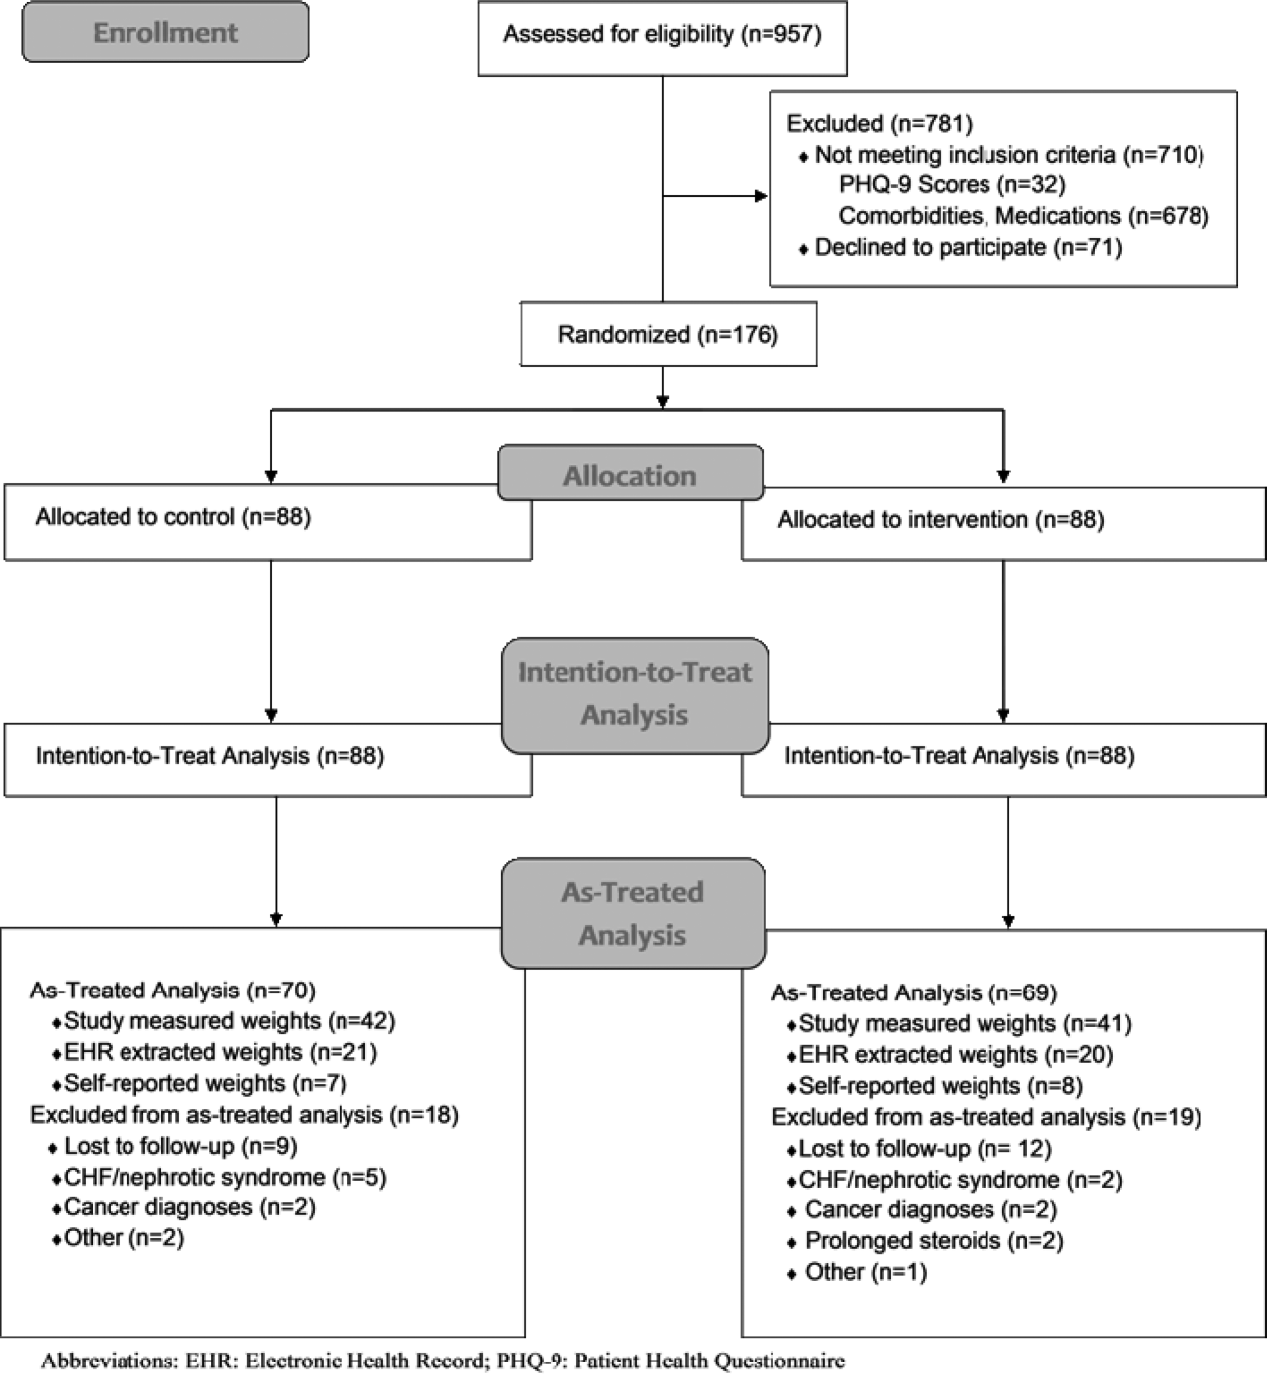
Optimizing transitions of care to reduce rehospitalizations
You have spent several days checking on a patient hospitalized for an acute exacerbation of heart failure. You have straightened out her medications and diet and discussed a plan for follow-up with the patient and a family member, and now she is being wheeled out the door. What happens to her next?
Too often, not your desired plan. If she is going home, maybe she understands what she needs to do, maybe not. Maybe she will get your prescriptions filled and take the medications as directed, maybe not. If she is going to a nursing home, maybe the physician covering the nursing home will get your plan, maybe not. There is a good chance she will be back in the emergency room soon, all because of a poor transition of care.
Transitions of care are changes in the level, location, or providers of care as patients move within the health care system. These can be critical junctures in patients’ lives, and if poorly executed can result in many adverse effects—including rehospitalization.1
Although high rehospitalization rates gained national attention in 2009 after a analysis of Medicare data,2 health care providers have known about the lack of coordinated care transitions for more than 50 years.3 Despite some progress, improving care transitions remains a national challenge. As the health system evolves from a fee-for-service financial model to payment-for-value,4 it is especially important that health care providers improve care for patients by optimizing care transitions.
In this article, we summarize the factors contributing to poor care transitions, highlight programs that improve them, and discuss strategies for successful transitions.
TRANSITION PROBLEMS ARE COMMON
Transitions of care occur when patients move to short-term and long-term acute care hospitals, skilled nursing facilities, primary and specialty care offices, community health centers, rehabilitation facilities, home health agencies, hospice, and their own homes.5 Problems can arise at any of these transitions, but the risk is especially high when patients leave the hospital to receive care in another setting or at home.
In the past decade, one in five Medicare patients was rehospitalized within 30 days of discharge from the hospital,2 and up to 25% were rehospitalized after being discharged to a skilled nursing facility.6 Some diagnoses (eg, sickle cell anemia, gangrene) and procedures (eg, kidney transplantation, ileostomy) are associated with readmission rates of nearly one in three.7,8
The desire of policymakers to “bend the cost curve” of health care has led to efforts to enhance care coordination by improving transitions between care venues. Through the Patient Protection and Affordable Care Act, a number of federal initiatives are promoting strategies to improve care transitions and prevent readmissions after hospital discharge.
The Hospital Readmission Reduction Program9 drives much of this effort. In fiscal year 2013 (beginning October 1, 2012), more than 2,000 hospitals incurred financial penalties of up to 1% of total Medicare diagnosis-related group payments (about $280 million the first year) for excess readmissions.10 The penalty’s maximum rose to 2% in fiscal year 2014 and could increase to 3% in 2015. The total penalty for 2014 is projected to be $227 million, with 2,225 hospitals affected.11
The Centers for Medicare and Medicaid Innovation has committed hundreds of millions of dollars to Community-based Care Transitions Programs12 and more than $200 million to Hospital Engagement Networks13 to carry out the goals of the Partnership for Patients,14 aiming to reduce rehospitalizations and other adverse events.
At first, despite these efforts, readmission rates did not appear to change substantially.15 However, the Centers for Medicare and Medicaid Services reported that hospital readmission rates for Medicare fee-for-service beneficiaries declined in 2012 to 18.4%,16 although some believe that the reduction is related to an increase in the number of patients admitted for observation in recent years.17
TRANSITIONS ARE OFTEN POORLY COORDINATED
Although some readmissions are unavoidable—resulting from the inevitable progression of disease or worsening of chronic conditions18—they may also result from a fumbled transition between care settings. Our current system of care transition has serious deficiencies that endanger patients. Areas that need improvement include communication between providers, patient education about medications and treatments, monitoring of medication adherence and complications, follow-up of pending tests and procedures after discharge, and outpatient follow-up soon after discharge.19–21
Traditional health care does not have dependable mechanisms for coordinating care across settings; we are all ensconced in “silos” that generally keep the focus within individual venues.22 Lack of coordination blurs the lines of responsibility for patients in the period between discharge from one location and admission to another, leaving them confused about whom to contact for care, especially if symptoms worsen.23,24
Gaps in coordination are not surprising, given the complexity of the US health care system and the often remarkable number of physicians caring for an individual patient.5 Medicare beneficiaries see an average of two primary care physicians and five specialists during a 2-year period; patients with chronic conditions may see up to 16 physicians in 1 year.25 Coordinating care between so many providers in different settings, combined with possible patient factors such as disadvantaged socioeconomic status, lack of caregiver support, and inadequate health literacy, provides many opportunities for failures.
Research has identified several root causes behind most failed care transitions:
Poor provider communication
Multiple studies associate adverse events after discharge with a lack of timely communication between hospital and outpatient providers.26 One study estimated that 80% of serious medical errors involve miscommunication during the hand-off between medical providers.27 Discharge summaries often lack important information such as test results, hospital course, discharge medications, patient counseling, and follow-up plans. Most adverse drug events after hospital discharge result directly from breakdown in communication between hospital staff and patients or primary care physicians.28 Approximately 40% of patients have test results pending at the time of discharge and 10% of these require some action; yet outpatient physicians and patients are often unaware of them.21
Ineffective patient and caregiver education
The Institute of Medicine report, Crossing the Quality Chasm: A New Health System for the 21st Century,29 noted that patients leaving one setting for another receive little information on how to care for themselves, when to resume activities, what medication side effects to watch out for, and how to get answers to questions. Of particular concern is that patients and caregivers are sometimes omitted from transition planning and often must suddenly assume new self-care responsibilities upon going home that hospital staff managed before discharge. Too often, patients are discharged with inadequate understanding of their medical condition, self-care plan,23,24 and who should manage their care.30
Up to 36% of adults in the United States have inadequate health literacy (defined as the inability to understand basic health information needed to make appropriate decisions), hindering patient education efforts.31–33 Even if they understand, patients and their caregivers must be engaged or “activated” (ie, able and willing to manage one’s health) if we expect them to adhere to appropriate care and behaviors. A review found direct correlations between patient activation and healthy behavior, better health outcomes (eg, achieving normal hemoglobin A1c and cholesterol levels), and better care experiences.34 This review also noted that multiple studies have documented improved activation scores as a result of specific interventions.
No follow-up with primary care providers
The risk of hospital readmission is significantly lower for patients with chronic obstructive pulmonary disease or heart failure who receive follow-up within 7 days of discharge.35–38 Of Medicare beneficiaries readmitted to the hospital within 30 days of discharge in 2003–2004, half had no contact with an outpatient physician in the interval between their discharge and their readmission,2 and one in three adult patients discharged from a hospital to the community does not see a physician within 30 days of discharge.39 The dearth of primary care providers in many communities can make follow-up care difficult to coordinate.
Failure to address chronic conditions
Analyses of national data sets reveal that patients are commonly rehospitalized for conditions unrelated to their initial hospitalization. According to the Center for Studying Health System Change, more than a quarter of readmissions in the 30 days after discharge are for conditions unrelated to those identified in the index admission, the proportion rising to more than one-third at 1 year.39 Among Medicare beneficiaries readmitted within 30 days of discharge, the proportion readmitted for the same condition was just 35% after hospitalization for heart failure, 10% after hospitalization for acute myocardial infarction, and 22% after hospitalization for pneumonia.40
Lack of community support
Multiple social and environmental factors contribute to adverse postdischarge events.41–43 For socioeconomically disadvantaged patients, care-transition issues are compounded by insufficient access to outpatient care, lack of social support, and lack of transportation. Some studies indicate that between 40% to 50% of readmissions are linked to social problems and inadequate access to community resources.44–47 Psychosocial issues such as limited health literacy, poor self-management skills, inadequate social support, and living alone are associated with adverse outcomes, including readmission and death.48,49 Such factors may help explain high levels of “no-shows” to outpatient follow-up visits.
NATIONAL MODELS OF BEST PRACTICES
Efforts to reduce readmissions have traditionally focused on hospitals, but experts now recognize that multiple factors influence readmissions and must be comprehensively addressed. Several evidence-based models seek to improve patient outcomes with interventions aimed at care transitions:
Project BOOST
Project BOOST (Better Outcomes by Optimizing Safe Transitions)50 is a national initiative developed by the Society of Hospital Medicine to standardize and optimize the care of patients discharged from hospital to home. The program includes evidence-based clinical interventions that can easily be adopted by any hospital. Interventions are aimed at:
- Identifying patients at high risk on admission
- Targeting risk-specific situations
- Improving information flow between inpatient and outpatient providers
- Improving patient and caregiver education by using the teach-back method
- Achieving timely follow-up after discharge.
The program includes a year of technical support provided by a physician mentor.
Preliminary results from pilot sites showed a 14% reduction in 30-day readmission rates in units using BOOST compared with control units in the same hospital.51 Mentored implementation was recognized by the Joint Commission and the National Quality Forum with the 2011 John M. Eisenberg Award for Innovation in Patient Safety and Quality.52
Project RED
Project RED (Re-Engineered Discharge)53 evolved from efforts by Dr. Brian Jack and colleagues to re-engineer the hospital workflow process to improve patient safety and reduce rehospitalization rates at Boston Medical Center. The intervention has 12 mutually reinforcing components aimed at improving the discharge process.
In a randomized controlled trial, Project RED led to a 30% decrease in emergency department visits and readmissions within 30 days of discharge from a general medical service of an urban academic medical center.54 This study excluded patients admitted from a skilled nursing facility or discharged to one, but a recent study demonstrated that Project RED also led to a lower rate of hospital admission within 30 days of discharge from a skilled nursing facility.55
The STAAR initiative
The STAAR initiative (State Action on Avoidable Re-hospitalizations)56 was launched in 2009 by the Institute for Healthcare Improvement with the goal of reducing avoidable readmissions in the states of Massachusetts, Michigan, and Washington. Hospital teams focus on improving:
- Assessment of needs after hospital discharge
- Teaching and learning
- Real-time hand-off communication
- Timely follow-up after hospital discharge.
As yet, no published studies other than case reports show a benefit from STAAR.57
The Care Transitions Program
The Care Transitions Program,58 under the leadership of Dr. Eric Coleman, aims to empower patients and caregivers, who meet with a “transition coach.” The program provides assistance with medication reconciliation and self-management, a patient-centered record owned and maintained by the patient to facilitate cross-site information transfer, timely outpatient follow-up with primary or specialty care, a list of red flags to indicate a worsening condition, and instructions on proper responses.
A randomized controlled trial of the program demonstrated a reduction in hospital readmissions at 30, 90, and 180 days, and lower hospital costs at 90 and 180 days.59 This approach also proved effective in a real-world setting.60
The Transitional Care Model
Developed by Dr. Mary Naylor and colleagues, the Transitional Care Model61 also aims at patient and family empowerment, focusing on patients’ stated goals and priorities and ensuring patient engagement. In the program, a transitional care nurse has the job of enhancing patient and caregiver understanding, facilitating patient self-management, and overseeing medication management and transitional care.
A randomized controlled trial demonstrated improved outcomes after hospital discharge for elderly patients with complex medical illnesses, with overall reductions in medical costs through preventing or delaying rehospitalization.62 A subsequent real-world study validated this approach.63
The Bridge Model
The Illinois Transitional Care Consortium’s Bridge Model64 is for older patients discharged home after hospitalization. It is led by social workers (“bridge care coordinators”) who address barriers to implementing the discharge plan, coordinate resources, and intervene at three points: before discharge, 2 days after discharge, and 30 days after discharge.
An initial study showed no impact on the 30-day rehospitalization rate,65 but larger studies are under way with a modified version.
Guided Care
Developed at the Johns Hopkins Bloomberg School of Public Health, Guided Care66 involves nurses who work in partnership with physicians and others in primary care to provide patient-centered, cost-effective care to patients with multiple chronic conditions. Nurses conduct in-home assessments, facilitate care planning, promote patient self-management, monitor conditions, coordinate the efforts of all care professionals, and facilitate access to community resources.
A cluster-randomized controlled trial found that this program had mixed results, reducing the use of home health care but having little effect on the use of other health services in the short run. However, in the subgroup of patients covered by Kaiser-Permanente, those who were randomized to the program accrued, on average, 52% fewer skilled nursing facility days, 47% fewer skilled nursing facility admissions, 49% fewer hospital readmissions, and 17% fewer emergency department visits.67
The GRACE model
The GRACE model (Geriatric Resources for Assessment and Care of Elders)68 was developed to improve the quality of geriatric care, reduce excess health care use, and prevent long-term nursing home placement. Each patient is assigned a support team consisting of a nurse practitioner and a social worker who make home visits, coordinate health care and community services, and develop an individualized care plan.
In one study,69 GRACE reduced hospital admission rates for participants at high risk of hospitalization by 12% in the first year of the program and 44% in the second year. GRACE participants also reported higher quality of life compared with the control group.69
INTERACT tools
Led by Dr. Joseph Ouslander, INTERACT (Interventions to Reduce Acute Care Transfers)70 is a quality-improvement initiative for skilled nursing facilities, designed to facilitate the early identification, evaluation, documentation, and communication of changes in the status of residents. Visitors to its website can download a set of tools and strategies to help them manage conditions before they become serious enough to require a hospital transfer. The tools assist in promoting important communication among providers and enhancing advance-care planning.
A 6-month study in 25 nursing homes showed a 17% reduction in self-reported hospital admissions with this program compared with the same period the previous year.71
Additional home-based care interventions
Additional innovations are under way in home-based care.
The Home Health Quality Improvement National Campaign is a patient-centered movement to improve the quality of care received by patients residing at home.72 Through its Best Practices Intervention Packages, it offers evidence-based educational tools, resources, and interventions for reducing avoidable hospitalizations, improving medication management, and coordinating transitional care.
The Center for Medicare and Medicaid Innovation Independence at Home Demonstration73 is testing whether home-based comprehensive primary care can improve care and reduce hospitalizations for Medicare beneficiaries with multiple chronic conditions.
NO SINGLE INTERVENTION: MULTIPLE STRATEGIES NEEDED
A 2011 review found no single intervention that regularly reduced the 30-day risk of re-hospitalization.74 However, other studies have shown that multifaceted interventions can reduce 30-day readmission rates. Randomized controlled trials in short-stay, acute care hospitals indicate that improvement in the following areas can directly reduce hospital readmission rates:
- Comprehensive planning and risk assessment throughout hospitalization
- Quality of care during the initial admission
- Communication with patients, their caregivers, and their clinicians
- Patient education
- Predischarge assessment
- Coordination of care after discharge.
In randomized trials, successful programs reduced the 30-day readmission rates by 20% to 40%,54,62,75–79 and a 2011 meta-analysis of randomized clinical trials found evidence that interventions associated with discharge planning helped to reduce readmission rates.80
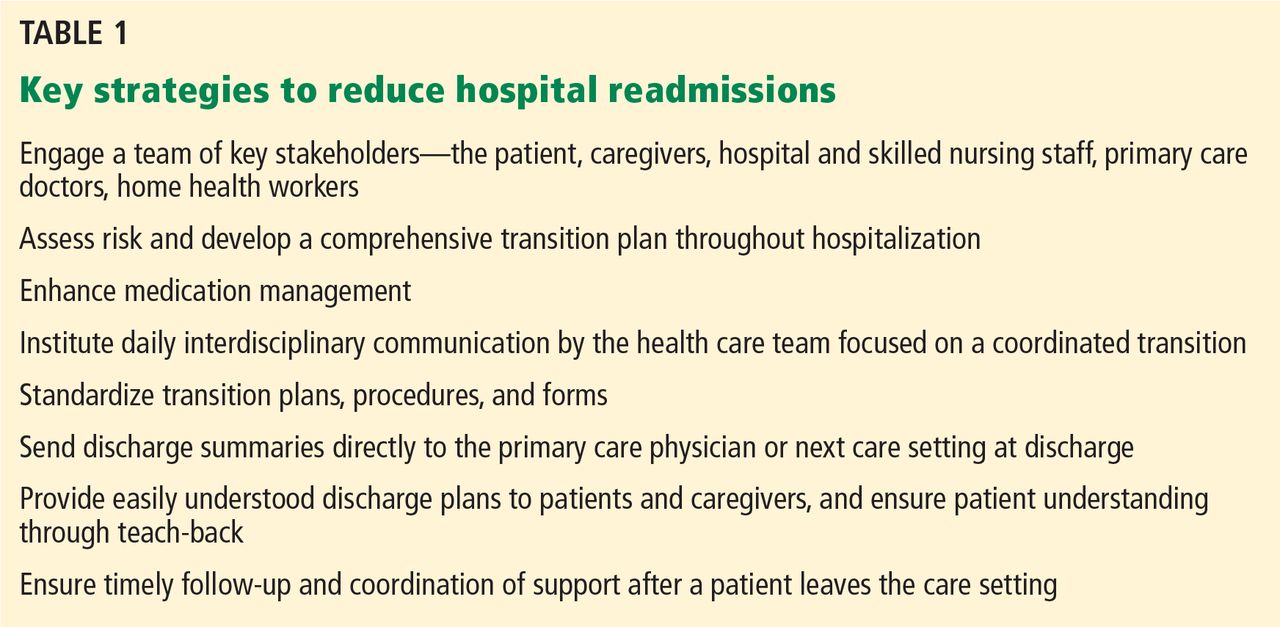
Methods developed by the national care transition models described above can help hospitals optimize patient transitions (Table 1). Although every model has its unique attributes, they have several strategies in common:
Engage a team of key stakeholders that may include patients and caregivers, hospital staff (physicians, nurses, case managers, social workers, and pharmacists), community physicians (primary care, medical homes, and specialists), advance practice providers (physician assistants and nurse practitioners), and postacute care facilities and services (skilled nursing facilities, home health agencies, assisted living residences, hospice, and rehabilitation facilities).
Develop a comprehensive transition plan throughout hospitalization that includes attention to factors that may affect self-care, such as health literacy, chronic conditions, medications, and social support.
Enhance medication reconciliation and management. Obtain the best possible medication history on admission, and ensure that patients understand changes in their medications, how to take each medicine correctly, and important side effects.
Institute daily interdisciplinary communication and care coordination by everyone on the health care team with an emphasis on the care plan, discharge planning, and safety issues.81
Standardize transition plans, procedures and forms. All discharging physicians should use a standard discharge summary template that includes pertinent diagnoses, active issues, a reconciled medication list with changes highlighted, results from important tests and consultations, pending test results, planned follow-up and required services, warning signs of a worsening condition, and actions needed if a problem arises.
Always send discharge summaries directly to the patient’s primary care physician or next care setting at the time of discharge.
Give the patient a discharge plan that is easy to understand. Enhance patient and family education using health literacy standards82 and interactive methods such as teach-back,83 in which patients demonstrate comprehension and skills required for self-care immediately after being taught. Such tools actively teach patients and caregivers to follow a care plan, including managing medications.
Follow up and coordinate support in a timely manner after a patient leaves the care setting. Follow-up visits should be arranged before discharge. Within 1 to 3 days after discharge, the patient should be called or visited by a case manager, social worker, nurse, or other health care provider.
CHALLENGES TO IMPROVING TRANSITIONS
Although several models demonstrated significant reductions of hospital readmissions in trials, challenges remain. Studies do not identify which features of the models are necessary or sufficient, or how applicable they are to different hospital and patient characteristics. A 2012 analysis84 of a program designed to reduce readmissions in three states identified key obstacles to successfully improving care transitions:
Collaborative relationships across settings are critical, but very difficult to achieve. It takes time to develop the relationships and trust among providers, and little incentive exists for skilled nursing facilities and physicians outside the hospital to engage in the process.
Infrastructure is lacking, as is experience to implement quality improvements.
We lack proof that models work on a large scale. Confusion exists about which readmissions are preventable and which are not. More evidence is needed to help guide hospitals’ efforts to improve transitions of care and reduce readmissions.
- Coleman EA. Falling through the cracks: challenges and opportunities for improving transitional care for persons with continuous complex care needs. J Am Geriatr Soc 2003; 51:549–555.
- Jencks SF, Williams MV, Coleman EA. Rehospitalizations among patients in the Medicare fee-for-service program. N Engl J Med 2009; 360:1418–1428.
- Rosenthal JM, Miller DB. Providers have failed to work for continuity. Hospitals 1979; 53:79–83.
- Gabow P, Halvorson G, Kaplan G. Marshaling leadership for high-value health care: an Institute of Medicine discussion paper. JAMA 2012; 308:239–240.
- Bonner A, Schneider CD, Weissman JS. Massachusetts State Quality Improvement Institute. Massachusetts Strategic Plan for Care Transitions. Massachusetts Executive Office of Health and Human Services, 2010. http://www.patientcarelink.org/uploadDocs/1/Strategic-Plan-for-Care-Transitions_2-11-2010-(2).pdf. Accessed April 7, 2014.
- Mor V, Intrator O, Feng Z, Grabowski DC. The revolving door of rehospitalization from skilled nursing facilities. Health Aff (Millwood) 2010; 29:57–64.
- Elixhauser A (AHRQ), Steiner C (AHRQ). Readmissions to US Hospitals by Diagnosis, 2010. HCUP Statistical Brief #153. April 2013. Agency for Healthcare Research and Quality, Rockville, MD. http://www.hcup-us.ahrq.gov/reports/statbriefs/sb153.pdf. Accessed April 7, 2014.
- Weiss AJ (Truven Health Analytics), Elixhauser A (AHRQ), Steiner C (AHRQ). Readmissions to US Hospitals by Procedure, 2010. HCUP Statistical Brief #154. April 2013. Agency for Healthcare Research and Quality, Rockville, MD. http://www.hcup-us.ahrq.gov/reports/statbriefs/sb154.pdf. Accessed April 7, 2014.
- Centers for Medicare & Medicaid Services (CMS). Readmissions Reduction Program. http://www.cms.gov/Medicare/Medicare-Fee-for-Service-Payment/AcuteInpatientPPS/Readmissions-Reduction-Program.html. Accessed April 7, 2014.
- Kaiser Health News (KHN); Rau J. Medicare To Penalize 2,217 Hospitals For Excess Readmissions. http://www.kaiserhealthnews.org/Stories/2012/August/13/medicare-hospitals-readmissions-penalties.aspx. Accessed April 7, 2014.
- Kaiser Health News (KHN); Rau J. Armed With Bigger Fines, Medicare To Punish 2,225 Hospitals For Excess Readmissions. http://www.kaiserhealthnews.org/Stories/2013/August/02/readmission-penalties-medicare-hospitals-year-two.aspx. Accessed April 7, 2014.
- Centers for Medicare & Medicaid Services (CMS). Community-based Care Transitions Program. http://innovation.cms.gov/initiatives/CCTP/. Accessed April 7, 2014.
- Centers for Medicare & Medicaid Services (CMS). Hospital Engagement Networks (HENs). http://partnershipforpatients.cms.gov/about-the-partnership/hospital-engagement-networks/thehospitalengagementnetworks.html. Accessed April 7, 2014.
- Centers for Medicare & Medicaid Services (CMS). About the Partnership for Patients. http://partnershipforpatients.cms.gov/about-the-partnership/about-thepartnershipforpatients.html. Accessed April 7, 2014.
- Jha AK, Joynt KE, Orav EJ, Epstein AM. The long-term effect of premier pay for performance on patient outcomes. N Engl J Med 2012; 366:1606–615.
- Gerhardt G, Yemane A, Hickman P, Oelschlaeger A, Rollins E, Brennan N; Centers for Medicare & Medicaid Services (CMS). Medicare Readmission Rates Showed Meaningful Decline in 2012. http://www.cms.gov/mmrr/Briefs/B2013/mmrr-2013-003-02-b01.html. Accessed April 7, 2014.
- Office of Inspector General; US Department of Health and Human Services. Hospitals’ Use of Observation Stays and Short Inpatient Stays for Medicare Beneficiaries. Report (OEI-02-12-00040). http://oig.hhs.gov/oei/reports/oei-02-12-00040.asp. Accessed April 7, 2014.
- van Walraven C, Bennett C, Jennings A, Austin PC, Forster AJ. Proportion of hospital readmissions deemed avoidable: a systematic review. CMAJ 2011; 183:E391–E402.
- Forster AJ, Murff HJ, Peterson JF, Gandhi TK, Bates DW. The incidence and severity of adverse events affecting patients after discharge from the hospital. Ann Intern Med 2003; 138:161–167.
- Moore C, McGinn T, Halm E. Tying up loose ends: discharging patients with unresolved medical issues. Arch Intern Med 2007; 167:1305–1311.
- Roy CL, Poon EG, Karson AS, et al. Patient safety concerns arising from test results that return after hospital discharge. Ann Intern Med 2005; 143:121–128.
- Coleman EA, Fox PD; HMO Workgroup on Care Management. Managing patient care transitions: a report of the HMO Care Management Workgroup. Health-plan 2004; 45:36–39.
- Coleman EA, Berenson RA. Lost in transition: challenges and opportunities for improving the quality of transitional care. Ann Intern Med 2004; 141:533–536.
- Snow V, Beck D, Budnitz T, et al; American College of Physicians; Society of General Internal Medicine; Society of Hospital Medicine; American Geriatrics Society; American College of Emergency Physicians; Society of Academic Emergency Medicine. Transitions of Care Consensus Policy Statement American College of Physicians-Society of General Internal Medicine-Society of Hospital Medicine-American Geriatrics Society-American College of Emergency Physicians-Society of Academic Emergency Medicine. J Gen Intern Med 2009; 24:971–976.
- Pham HH, Schrag D, O’Malley AS, Wu B, Bach PB. Care patterns in Medicare and their implications for pay for performance. N Engl J Med 2007; 356:1130–1139.
- Kripalani S, LeFevre F, Phillips CO, Williams MV, Basaviah P, Baker DW. Deficits in communication and information transfer between hospital-based and primary care physicians: implications for patient safety and continuity of care. JAMA 2007; 297:831–841.
- Solet DJ, Norvell JM, Rutan GH, Frankel RM. Lost in translation: challenges and opportunities in physician-to-physician communication during patient handoffs. Acad Med 2005; 80:1094–1099.
- Kripalani S, Jackson AT, Schnipper JL, Coleman EA. Promoting effective transitions of care at hospital discharge: a review of key issues for hospitalists. J Hosp Med 2007; 2:314–323.
- National Research Council. Crossing the Quality Chasm: A New Health System for the 21st Century. Washington, DC: The National Academies Press, 2001.
- O’Leary KJ, Kulkarni N, Landler MP, et al. Hospitalized patients’ understanding of their plan of care. Mayo Clin Proc 2010; 85:47–52.
- Coleman EA, Chugh A, Williams MV, et al. Understanding and execution of discharge instructions. Am J Med Qual 2013; 28:383–391.
- Berkman ND, Sheridan SL, Donahue KE, Halpern DJ, Crotty K. Low health literacy and health outcomes: an updated systematic review. Ann Intern Med 2011; 155:97–107.
- Kutner M, Greenberg E, Jin Y, Paulsen C. The Health Literacy of America’s Adults: Results From the 2003 National Assessment of Adult Literacy (NCES 2006–483). US Department of Education. Washington, DC: National Center for Education Statistics, 2006. http://nces.ed.gov/pubs2006/2006483.pdf. Accessed April 7, 2014.
- Hibbard JH, Greene J. What the evidence shows about patient activation: better health outcomes and care experiences; fewer data on costs. Health Aff (Millwood) 2013; 32:207–214.
- Lin CY, Barnato AE, Degenholtz HB. Physician follow-up visits after acute care hospitalization for elderly Medicare beneficiaries discharged to noninstitutional settings. J Am Geriatr Soc 2011; 59:1947–1954.
- Sharma G, Kuo YF, Freeman JL, Zhang DD, Goodwin JS. Outpatient follow-up visit and 30-day emergency department visit and readmission in patients hospitalized for chronic obstructive pulmonary disease. Arch Intern Med 2010; 170:1664–1670.
- Hernandez AF, Greiner MA, Fonarow GC, et al. Relationship between early physician follow-up and 30-day readmission among Medicare beneficiaries hospitalized for heart failure. JAMA 2010; 303:1716–1722.
- van Walraven C, Taljaard M, Etchells E, et al. The independent association of provider and information continuity on outcomes after hospital discharge: implications for hospitalists. J Hosp Med 2010; 5:398–405.
- Sommers A, Cunningham PJ. Physician Visits After Hospital Discharge: Implications for Reducing Readmissions. Research Brief No. 6. National Institute for Health Care Reform (NIHCR), 2011. www.nihcr.org/Reducing_Readmissions.html. Accessed April 7, 2014.
- Dharmarajan K, Hsieh AF, Lin Z, et al. Diagnoses and timing of 30-day readmissions after hospitalization for heart failure, acute myocardial infarction, or pneumonia. JAMA 2013; 309:355–363.
- Calvillo-King L, Arnold D, Eubank KJ, et al. Impact of social factors on risk of readmission or mortality in pneumonia and heart failure: systematic review. J Gen Intern Med 2013; 28:269–282.
- Coventry PA, Gemmell I, Todd CJ. Psychosocial risk factors for hospital readmission in COPD patients on early discharge services: a cohort study. BMC Pulm Med 2011; 11:49.
- Weissman JS, Stern RS, Epstein AM. The impact of patient socioeconomic status and other social factors on readmission: a prospective study in four Massachusetts hospitals. Inquiry 1994; 31:163–172.
- Proctor EK, Morrow-Howell N, Li H, Dore P. Adequacy of home care and hospital readmission for elderly congestive heart failure patients. Health Soc Work 2000; 25:87–96.
- Kansagara D, Ramsay RS, Labby D, Saha S. Post-discharge intervention in vulnerable, chronically ill patients. J Hosp Med 2012; 7:124–130.
- Englander H, Kansagara D. Planning and designing the care transitions innovation (C-Train) for uninsured and Medicaid patients. J Hosp Med 2012; 7:524–529.
- Brown R, Peikes D, Chen A, Schore J. 15-site randomized trial of coordinated care in Medicare FFS. Health Care Financ Rev 2008; 30:5–25.
- Arbaje AI, Wolff JL, Yu Q, Powe NR, Anderson GF, Boult C. Post-discharge environmental and socioeconomic factors and the likelihood of early hospital readmission among community-dwelling Medicare beneficiaries. Gerontologist 2008; 48:495–504.
- Peek CJ, Baird MA, Coleman E. Primary care for patient complexity, not only disease. Fam Syst Health 2009; 27:287–302.
- Society of Hospital Medicine. Project BOOST: Better Outcomes by Optimizing Safe Transitions. www.hospitalmedicine.org/BOOST. Accessed April 7, 2014.
- Hansen LO, Greenwald JL, Budnitz T, et al. Project BOOST: effectiveness of a multihospital effort to reduce rehospitalization. J Hosp Med. 2013; 8:421–427.
- Maynard GA, Budnitz TL, Nickel WK, et al. 2011 John M. Eisenberg Patient Safety and Quality Awards. Mentored implementation: building leaders and achieving results through a collaborative improvement model. Innovation in patient safety and quality at the national level. Jt Comm J Qual Patient Saf 2012; 38:301–310.
- Boston University Medical Center. Project RED: Re-Engineered Discharge. www.bu.edu/fammed/projectred/. Accessed April 7, 2014.
- Jack BW, Chetty VK, Anthony D, et al. A reengineered hospital discharge program to decrease rehospitalization: a randomized trial. Ann Intern Med 2009; 150:178–187.
- Berkowitz RE, Fang Z, Helfand BK, Jones RN, Schreiber R, Paasche-Orlow MK. Project ReEngineered Discharge (RED) lowers hospital readmissions of patients discharged from a skilled nursing facility. J Am Med Dir Assoc 2013; 14:736–740.
- Institute for Healthcare Improvement. STAAR: STate Action on Avoidable Re-hospitalizations. www.ihi.org/offerings/Initiatives/STAAR/Pages/default.aspx. Accessed April 7, 2014.
- Boutwell AE, Johnson MB, Rutherford P, et al. An early look at a four-state initiative to reduce avoidable hospital readmissions. Health Aff (Millwood) 2011; 30:1272–1280.
- University of Colorado Denver. The Care Transitions Program. www.caretransitions.org/. Accessed April 7, 2014.
- Coleman EA, Parry C, Chalmers S, Min SJ. The care transitions intervention: results of a randomized controlled trial. Arch Intern Med 2006; 166:1822–1828.
- Voss R, Gardner R, Baier R, Butterfield K, Lehrman S, Gravenstein S. The care transitions intervention: translating from efficacy to effectiveness. Arch Intern Med 2011; 171:1232–1237.
- Penn Nursing Science. Transitional Care Model. www.transitional-care.info/. Accessed April 7, 2014.
- Naylor M, Brooten D, Jones R, Lavizzo-Mourey R, Mezey M, Pauly M. Comprehensive discharge planning for the hospitalized elderly. A randomized clinical trial. Ann Intern Med 1994; 120:999–1006.
- Stauffer BD, Fullerton C, Fleming N, et al. Effectiveness and cost of a transitional care program for heart failure: a prospective study with concurrent controls. Arch Intern Med 2011; 171:1238–1243.
- The Illinois Transitional Care Consortium. The Bridge Model. www.transitionalcare.org/the-bridge-model. Accessed April 7, 2014.
- Altfeld SJ, Shier GE, Rooney M, et al. Effects of an enhanced discharge planning intervention for hospitalized older adults: a randomized trial. Gerontologist 2013; 53:430–440.
- Johns Hopkins Bloomberg School of Public Health. Guided Care. www.guidedcare.org. Accessed April 7, 2014.
- Boult C, Reider L, Leff B, et al. The effect of guided care teams on the use of health services: results from a cluster-randomized controlled trial. Arch Intern Med 2011; 171:460–466.
- Counsell SR, Callahan CM, Buttar AB, Clark DO, Frank KI. Geriatric Resources for Assessment and Care of Elders (GRACE): a new model of primary care for low-income seniors. J Am Geriatr Soc 2006; 54:1136–1141.
- Bielaszka-DuVernay C. The ‘GRACE’ model: in-home assessments lead to better care for dual eligibles. Health Aff (Millwood) 2011; 30:431–434.
- Florida Atlantic University. INTERACT: Interventions to Reduce Acute Care Transfers. http://interact2.net/. Accessed April 7, 2014.
- Ouslander JG, Lamb G, Tappen R, et al. Interventions to reduce hospitalizations from nursing homes: evaluation of the INTERACT II collaborative quality improvement project. J Am Geriatr Soc 2011; 59:745–753.
- West Virginia Medical Institute. HHQI-BPIPs (Home Health Quality Improvement - Best Practices Intervention Packages). www.home-healthquality.org/Education/BPIPS.aspx. Accessed April 7, 2014.
- Centers for Medicare & Medicaid Services (CMS). Independence at Home Demonstration. http://innovation.cms.gov/initiatives/Independence-at-Home/. Accessed April 7, 2014.
- Hansen LO, Young RS, Hinami K, Leung A, Williams MV. Interventions to reduce 30-day rehospitalization: a systematic review. Ann Intern Med 2011; 155:520–528.
- Naylor MD, Brooten D, Campbell R, et al. Comprehensive discharge planning and home follow-up of hospitalized elders: a randomized clinical trial. JAMA 1999; 281:613–620.
- Koehler BE, Richter KM, Youngblood L, et al. Reduction of 30-day postdischarge hospital readmission or emergency department (ED) visit rates in high-risk elderly medical patients through delivery of a targeted care bundle. J Hosp Med 2009; 4:211–218.
- Garåsen H, Windspoll R, Johnsen R. Intermediate care at a community hospital as an alternative to prolonged general hospital care for elderly patients: a randomised controlled trial. BMC Public Health 2007; 7:68.
- Courtney M, Edwards H, Chang A, Parker A, Finlayson K, Hamilton K. Fewer emergency readmissions and better quality of life for older adults at risk of hospital readmission: a randomized controlled trial to determine the effectiveness of a 24-week exercise and telephone follow-up program. J Am Geriatr Soc 2009; 57:395–402.
- Coleman EA, Smith JD, Frank JC, Min SJ, Parry C, Kramer AM. Preparing patients and caregivers to participate in care delivered across settings: the Care Transitions Intervention. J Am Geriatr Soc 2004; 52:1817–1825.
- Naylor MD, Aiken LH, Kurtzman ET, Olds DM, Hirschman KB. The care span: the importance of transitional care in achieving health reform. Health Aff (Millwood) 2011; 30:746–754.
- O’Leary KJ, Buck R, Fligiel HM, et al. Structured interdisciplinary rounds in a medical teaching unit: improving patient safety. Arch Intern Med 2011; 171:678–684.
- Agency for Healthcare Research and Quality (AHRQ). Health Literacy Universal Precautions Toolkit. www.ahrq.gov/legacy/qual/literacy/. Accessed April 7, 2014.
- Schillinger D, Piette J, Grumbach K, et al. Closing the loop: physician communication with diabetic patients who have low health literacy. Arch Intern Med 2003; 163:83–90.
- Mittler JN, O’Hora JL, Harvey JB, Press MJ, Volpp KG, Scanlon DP. Turning readmission reduction policies into results: some lessons from a multistate initiative to reduce readmissions. Popul Health Manag 2013; 16:255–260.
You have spent several days checking on a patient hospitalized for an acute exacerbation of heart failure. You have straightened out her medications and diet and discussed a plan for follow-up with the patient and a family member, and now she is being wheeled out the door. What happens to her next?
Too often, not your desired plan. If she is going home, maybe she understands what she needs to do, maybe not. Maybe she will get your prescriptions filled and take the medications as directed, maybe not. If she is going to a nursing home, maybe the physician covering the nursing home will get your plan, maybe not. There is a good chance she will be back in the emergency room soon, all because of a poor transition of care.
Transitions of care are changes in the level, location, or providers of care as patients move within the health care system. These can be critical junctures in patients’ lives, and if poorly executed can result in many adverse effects—including rehospitalization.1
Although high rehospitalization rates gained national attention in 2009 after a analysis of Medicare data,2 health care providers have known about the lack of coordinated care transitions for more than 50 years.3 Despite some progress, improving care transitions remains a national challenge. As the health system evolves from a fee-for-service financial model to payment-for-value,4 it is especially important that health care providers improve care for patients by optimizing care transitions.
In this article, we summarize the factors contributing to poor care transitions, highlight programs that improve them, and discuss strategies for successful transitions.
TRANSITION PROBLEMS ARE COMMON
Transitions of care occur when patients move to short-term and long-term acute care hospitals, skilled nursing facilities, primary and specialty care offices, community health centers, rehabilitation facilities, home health agencies, hospice, and their own homes.5 Problems can arise at any of these transitions, but the risk is especially high when patients leave the hospital to receive care in another setting or at home.
In the past decade, one in five Medicare patients was rehospitalized within 30 days of discharge from the hospital,2 and up to 25% were rehospitalized after being discharged to a skilled nursing facility.6 Some diagnoses (eg, sickle cell anemia, gangrene) and procedures (eg, kidney transplantation, ileostomy) are associated with readmission rates of nearly one in three.7,8
The desire of policymakers to “bend the cost curve” of health care has led to efforts to enhance care coordination by improving transitions between care venues. Through the Patient Protection and Affordable Care Act, a number of federal initiatives are promoting strategies to improve care transitions and prevent readmissions after hospital discharge.
The Hospital Readmission Reduction Program9 drives much of this effort. In fiscal year 2013 (beginning October 1, 2012), more than 2,000 hospitals incurred financial penalties of up to 1% of total Medicare diagnosis-related group payments (about $280 million the first year) for excess readmissions.10 The penalty’s maximum rose to 2% in fiscal year 2014 and could increase to 3% in 2015. The total penalty for 2014 is projected to be $227 million, with 2,225 hospitals affected.11
The Centers for Medicare and Medicaid Innovation has committed hundreds of millions of dollars to Community-based Care Transitions Programs12 and more than $200 million to Hospital Engagement Networks13 to carry out the goals of the Partnership for Patients,14 aiming to reduce rehospitalizations and other adverse events.
At first, despite these efforts, readmission rates did not appear to change substantially.15 However, the Centers for Medicare and Medicaid Services reported that hospital readmission rates for Medicare fee-for-service beneficiaries declined in 2012 to 18.4%,16 although some believe that the reduction is related to an increase in the number of patients admitted for observation in recent years.17
TRANSITIONS ARE OFTEN POORLY COORDINATED
Although some readmissions are unavoidable—resulting from the inevitable progression of disease or worsening of chronic conditions18—they may also result from a fumbled transition between care settings. Our current system of care transition has serious deficiencies that endanger patients. Areas that need improvement include communication between providers, patient education about medications and treatments, monitoring of medication adherence and complications, follow-up of pending tests and procedures after discharge, and outpatient follow-up soon after discharge.19–21
Traditional health care does not have dependable mechanisms for coordinating care across settings; we are all ensconced in “silos” that generally keep the focus within individual venues.22 Lack of coordination blurs the lines of responsibility for patients in the period between discharge from one location and admission to another, leaving them confused about whom to contact for care, especially if symptoms worsen.23,24
Gaps in coordination are not surprising, given the complexity of the US health care system and the often remarkable number of physicians caring for an individual patient.5 Medicare beneficiaries see an average of two primary care physicians and five specialists during a 2-year period; patients with chronic conditions may see up to 16 physicians in 1 year.25 Coordinating care between so many providers in different settings, combined with possible patient factors such as disadvantaged socioeconomic status, lack of caregiver support, and inadequate health literacy, provides many opportunities for failures.
Research has identified several root causes behind most failed care transitions:
Poor provider communication
Multiple studies associate adverse events after discharge with a lack of timely communication between hospital and outpatient providers.26 One study estimated that 80% of serious medical errors involve miscommunication during the hand-off between medical providers.27 Discharge summaries often lack important information such as test results, hospital course, discharge medications, patient counseling, and follow-up plans. Most adverse drug events after hospital discharge result directly from breakdown in communication between hospital staff and patients or primary care physicians.28 Approximately 40% of patients have test results pending at the time of discharge and 10% of these require some action; yet outpatient physicians and patients are often unaware of them.21
Ineffective patient and caregiver education
The Institute of Medicine report, Crossing the Quality Chasm: A New Health System for the 21st Century,29 noted that patients leaving one setting for another receive little information on how to care for themselves, when to resume activities, what medication side effects to watch out for, and how to get answers to questions. Of particular concern is that patients and caregivers are sometimes omitted from transition planning and often must suddenly assume new self-care responsibilities upon going home that hospital staff managed before discharge. Too often, patients are discharged with inadequate understanding of their medical condition, self-care plan,23,24 and who should manage their care.30
Up to 36% of adults in the United States have inadequate health literacy (defined as the inability to understand basic health information needed to make appropriate decisions), hindering patient education efforts.31–33 Even if they understand, patients and their caregivers must be engaged or “activated” (ie, able and willing to manage one’s health) if we expect them to adhere to appropriate care and behaviors. A review found direct correlations between patient activation and healthy behavior, better health outcomes (eg, achieving normal hemoglobin A1c and cholesterol levels), and better care experiences.34 This review also noted that multiple studies have documented improved activation scores as a result of specific interventions.
No follow-up with primary care providers
The risk of hospital readmission is significantly lower for patients with chronic obstructive pulmonary disease or heart failure who receive follow-up within 7 days of discharge.35–38 Of Medicare beneficiaries readmitted to the hospital within 30 days of discharge in 2003–2004, half had no contact with an outpatient physician in the interval between their discharge and their readmission,2 and one in three adult patients discharged from a hospital to the community does not see a physician within 30 days of discharge.39 The dearth of primary care providers in many communities can make follow-up care difficult to coordinate.
Failure to address chronic conditions
Analyses of national data sets reveal that patients are commonly rehospitalized for conditions unrelated to their initial hospitalization. According to the Center for Studying Health System Change, more than a quarter of readmissions in the 30 days after discharge are for conditions unrelated to those identified in the index admission, the proportion rising to more than one-third at 1 year.39 Among Medicare beneficiaries readmitted within 30 days of discharge, the proportion readmitted for the same condition was just 35% after hospitalization for heart failure, 10% after hospitalization for acute myocardial infarction, and 22% after hospitalization for pneumonia.40
Lack of community support
Multiple social and environmental factors contribute to adverse postdischarge events.41–43 For socioeconomically disadvantaged patients, care-transition issues are compounded by insufficient access to outpatient care, lack of social support, and lack of transportation. Some studies indicate that between 40% to 50% of readmissions are linked to social problems and inadequate access to community resources.44–47 Psychosocial issues such as limited health literacy, poor self-management skills, inadequate social support, and living alone are associated with adverse outcomes, including readmission and death.48,49 Such factors may help explain high levels of “no-shows” to outpatient follow-up visits.
NATIONAL MODELS OF BEST PRACTICES
Efforts to reduce readmissions have traditionally focused on hospitals, but experts now recognize that multiple factors influence readmissions and must be comprehensively addressed. Several evidence-based models seek to improve patient outcomes with interventions aimed at care transitions:
Project BOOST
Project BOOST (Better Outcomes by Optimizing Safe Transitions)50 is a national initiative developed by the Society of Hospital Medicine to standardize and optimize the care of patients discharged from hospital to home. The program includes evidence-based clinical interventions that can easily be adopted by any hospital. Interventions are aimed at:
- Identifying patients at high risk on admission
- Targeting risk-specific situations
- Improving information flow between inpatient and outpatient providers
- Improving patient and caregiver education by using the teach-back method
- Achieving timely follow-up after discharge.
The program includes a year of technical support provided by a physician mentor.
Preliminary results from pilot sites showed a 14% reduction in 30-day readmission rates in units using BOOST compared with control units in the same hospital.51 Mentored implementation was recognized by the Joint Commission and the National Quality Forum with the 2011 John M. Eisenberg Award for Innovation in Patient Safety and Quality.52
Project RED
Project RED (Re-Engineered Discharge)53 evolved from efforts by Dr. Brian Jack and colleagues to re-engineer the hospital workflow process to improve patient safety and reduce rehospitalization rates at Boston Medical Center. The intervention has 12 mutually reinforcing components aimed at improving the discharge process.
In a randomized controlled trial, Project RED led to a 30% decrease in emergency department visits and readmissions within 30 days of discharge from a general medical service of an urban academic medical center.54 This study excluded patients admitted from a skilled nursing facility or discharged to one, but a recent study demonstrated that Project RED also led to a lower rate of hospital admission within 30 days of discharge from a skilled nursing facility.55
The STAAR initiative
The STAAR initiative (State Action on Avoidable Re-hospitalizations)56 was launched in 2009 by the Institute for Healthcare Improvement with the goal of reducing avoidable readmissions in the states of Massachusetts, Michigan, and Washington. Hospital teams focus on improving:
- Assessment of needs after hospital discharge
- Teaching and learning
- Real-time hand-off communication
- Timely follow-up after hospital discharge.
As yet, no published studies other than case reports show a benefit from STAAR.57
The Care Transitions Program
The Care Transitions Program,58 under the leadership of Dr. Eric Coleman, aims to empower patients and caregivers, who meet with a “transition coach.” The program provides assistance with medication reconciliation and self-management, a patient-centered record owned and maintained by the patient to facilitate cross-site information transfer, timely outpatient follow-up with primary or specialty care, a list of red flags to indicate a worsening condition, and instructions on proper responses.
A randomized controlled trial of the program demonstrated a reduction in hospital readmissions at 30, 90, and 180 days, and lower hospital costs at 90 and 180 days.59 This approach also proved effective in a real-world setting.60
The Transitional Care Model
Developed by Dr. Mary Naylor and colleagues, the Transitional Care Model61 also aims at patient and family empowerment, focusing on patients’ stated goals and priorities and ensuring patient engagement. In the program, a transitional care nurse has the job of enhancing patient and caregiver understanding, facilitating patient self-management, and overseeing medication management and transitional care.
A randomized controlled trial demonstrated improved outcomes after hospital discharge for elderly patients with complex medical illnesses, with overall reductions in medical costs through preventing or delaying rehospitalization.62 A subsequent real-world study validated this approach.63
The Bridge Model
The Illinois Transitional Care Consortium’s Bridge Model64 is for older patients discharged home after hospitalization. It is led by social workers (“bridge care coordinators”) who address barriers to implementing the discharge plan, coordinate resources, and intervene at three points: before discharge, 2 days after discharge, and 30 days after discharge.
An initial study showed no impact on the 30-day rehospitalization rate,65 but larger studies are under way with a modified version.
Guided Care
Developed at the Johns Hopkins Bloomberg School of Public Health, Guided Care66 involves nurses who work in partnership with physicians and others in primary care to provide patient-centered, cost-effective care to patients with multiple chronic conditions. Nurses conduct in-home assessments, facilitate care planning, promote patient self-management, monitor conditions, coordinate the efforts of all care professionals, and facilitate access to community resources.
A cluster-randomized controlled trial found that this program had mixed results, reducing the use of home health care but having little effect on the use of other health services in the short run. However, in the subgroup of patients covered by Kaiser-Permanente, those who were randomized to the program accrued, on average, 52% fewer skilled nursing facility days, 47% fewer skilled nursing facility admissions, 49% fewer hospital readmissions, and 17% fewer emergency department visits.67
The GRACE model
The GRACE model (Geriatric Resources for Assessment and Care of Elders)68 was developed to improve the quality of geriatric care, reduce excess health care use, and prevent long-term nursing home placement. Each patient is assigned a support team consisting of a nurse practitioner and a social worker who make home visits, coordinate health care and community services, and develop an individualized care plan.
In one study,69 GRACE reduced hospital admission rates for participants at high risk of hospitalization by 12% in the first year of the program and 44% in the second year. GRACE participants also reported higher quality of life compared with the control group.69
INTERACT tools
Led by Dr. Joseph Ouslander, INTERACT (Interventions to Reduce Acute Care Transfers)70 is a quality-improvement initiative for skilled nursing facilities, designed to facilitate the early identification, evaluation, documentation, and communication of changes in the status of residents. Visitors to its website can download a set of tools and strategies to help them manage conditions before they become serious enough to require a hospital transfer. The tools assist in promoting important communication among providers and enhancing advance-care planning.
A 6-month study in 25 nursing homes showed a 17% reduction in self-reported hospital admissions with this program compared with the same period the previous year.71
Additional home-based care interventions
Additional innovations are under way in home-based care.
The Home Health Quality Improvement National Campaign is a patient-centered movement to improve the quality of care received by patients residing at home.72 Through its Best Practices Intervention Packages, it offers evidence-based educational tools, resources, and interventions for reducing avoidable hospitalizations, improving medication management, and coordinating transitional care.
The Center for Medicare and Medicaid Innovation Independence at Home Demonstration73 is testing whether home-based comprehensive primary care can improve care and reduce hospitalizations for Medicare beneficiaries with multiple chronic conditions.
NO SINGLE INTERVENTION: MULTIPLE STRATEGIES NEEDED
A 2011 review found no single intervention that regularly reduced the 30-day risk of re-hospitalization.74 However, other studies have shown that multifaceted interventions can reduce 30-day readmission rates. Randomized controlled trials in short-stay, acute care hospitals indicate that improvement in the following areas can directly reduce hospital readmission rates:
- Comprehensive planning and risk assessment throughout hospitalization
- Quality of care during the initial admission
- Communication with patients, their caregivers, and their clinicians
- Patient education
- Predischarge assessment
- Coordination of care after discharge.
In randomized trials, successful programs reduced the 30-day readmission rates by 20% to 40%,54,62,75–79 and a 2011 meta-analysis of randomized clinical trials found evidence that interventions associated with discharge planning helped to reduce readmission rates.80
Methods developed by the national care transition models described above can help hospitals optimize patient transitions (Table 1). Although every model has its unique attributes, they have several strategies in common:
Engage a team of key stakeholders that may include patients and caregivers, hospital staff (physicians, nurses, case managers, social workers, and pharmacists), community physicians (primary care, medical homes, and specialists), advance practice providers (physician assistants and nurse practitioners), and postacute care facilities and services (skilled nursing facilities, home health agencies, assisted living residences, hospice, and rehabilitation facilities).
Develop a comprehensive transition plan throughout hospitalization that includes attention to factors that may affect self-care, such as health literacy, chronic conditions, medications, and social support.
Enhance medication reconciliation and management. Obtain the best possible medication history on admission, and ensure that patients understand changes in their medications, how to take each medicine correctly, and important side effects.
Institute daily interdisciplinary communication and care coordination by everyone on the health care team with an emphasis on the care plan, discharge planning, and safety issues.81
Standardize transition plans, procedures and forms. All discharging physicians should use a standard discharge summary template that includes pertinent diagnoses, active issues, a reconciled medication list with changes highlighted, results from important tests and consultations, pending test results, planned follow-up and required services, warning signs of a worsening condition, and actions needed if a problem arises.
Always send discharge summaries directly to the patient’s primary care physician or next care setting at the time of discharge.
Give the patient a discharge plan that is easy to understand. Enhance patient and family education using health literacy standards82 and interactive methods such as teach-back,83 in which patients demonstrate comprehension and skills required for self-care immediately after being taught. Such tools actively teach patients and caregivers to follow a care plan, including managing medications.
Follow up and coordinate support in a timely manner after a patient leaves the care setting. Follow-up visits should be arranged before discharge. Within 1 to 3 days after discharge, the patient should be called or visited by a case manager, social worker, nurse, or other health care provider.
CHALLENGES TO IMPROVING TRANSITIONS
Although several models demonstrated significant reductions of hospital readmissions in trials, challenges remain. Studies do not identify which features of the models are necessary or sufficient, or how applicable they are to different hospital and patient characteristics. A 2012 analysis84 of a program designed to reduce readmissions in three states identified key obstacles to successfully improving care transitions:
Collaborative relationships across settings are critical, but very difficult to achieve. It takes time to develop the relationships and trust among providers, and little incentive exists for skilled nursing facilities and physicians outside the hospital to engage in the process.
Infrastructure is lacking, as is experience to implement quality improvements.
We lack proof that models work on a large scale. Confusion exists about which readmissions are preventable and which are not. More evidence is needed to help guide hospitals’ efforts to improve transitions of care and reduce readmissions.
- Coleman EA. Falling through the cracks: challenges and opportunities for improving transitional care for persons with continuous complex care needs. J Am Geriatr Soc 2003; 51:549–555.
- Jencks SF, Williams MV, Coleman EA. Rehospitalizations among patients in the Medicare fee-for-service program. N Engl J Med 2009; 360:1418–1428.
- Rosenthal JM, Miller DB. Providers have failed to work for continuity. Hospitals 1979; 53:79–83.
- Gabow P, Halvorson G, Kaplan G. Marshaling leadership for high-value health care: an Institute of Medicine discussion paper. JAMA 2012; 308:239–240.
- Bonner A, Schneider CD, Weissman JS. Massachusetts State Quality Improvement Institute. Massachusetts Strategic Plan for Care Transitions. Massachusetts Executive Office of Health and Human Services, 2010. http://www.patientcarelink.org/uploadDocs/1/Strategic-Plan-for-Care-Transitions_2-11-2010-(2).pdf. Accessed April 7, 2014.
- Mor V, Intrator O, Feng Z, Grabowski DC. The revolving door of rehospitalization from skilled nursing facilities. Health Aff (Millwood) 2010; 29:57–64.
- Elixhauser A (AHRQ), Steiner C (AHRQ). Readmissions to US Hospitals by Diagnosis, 2010. HCUP Statistical Brief #153. April 2013. Agency for Healthcare Research and Quality, Rockville, MD. http://www.hcup-us.ahrq.gov/reports/statbriefs/sb153.pdf. Accessed April 7, 2014.
- Weiss AJ (Truven Health Analytics), Elixhauser A (AHRQ), Steiner C (AHRQ). Readmissions to US Hospitals by Procedure, 2010. HCUP Statistical Brief #154. April 2013. Agency for Healthcare Research and Quality, Rockville, MD. http://www.hcup-us.ahrq.gov/reports/statbriefs/sb154.pdf. Accessed April 7, 2014.
- Centers for Medicare & Medicaid Services (CMS). Readmissions Reduction Program. http://www.cms.gov/Medicare/Medicare-Fee-for-Service-Payment/AcuteInpatientPPS/Readmissions-Reduction-Program.html. Accessed April 7, 2014.
- Kaiser Health News (KHN); Rau J. Medicare To Penalize 2,217 Hospitals For Excess Readmissions. http://www.kaiserhealthnews.org/Stories/2012/August/13/medicare-hospitals-readmissions-penalties.aspx. Accessed April 7, 2014.
- Kaiser Health News (KHN); Rau J. Armed With Bigger Fines, Medicare To Punish 2,225 Hospitals For Excess Readmissions. http://www.kaiserhealthnews.org/Stories/2013/August/02/readmission-penalties-medicare-hospitals-year-two.aspx. Accessed April 7, 2014.
- Centers for Medicare & Medicaid Services (CMS). Community-based Care Transitions Program. http://innovation.cms.gov/initiatives/CCTP/. Accessed April 7, 2014.
- Centers for Medicare & Medicaid Services (CMS). Hospital Engagement Networks (HENs). http://partnershipforpatients.cms.gov/about-the-partnership/hospital-engagement-networks/thehospitalengagementnetworks.html. Accessed April 7, 2014.
- Centers for Medicare & Medicaid Services (CMS). About the Partnership for Patients. http://partnershipforpatients.cms.gov/about-the-partnership/about-thepartnershipforpatients.html. Accessed April 7, 2014.
- Jha AK, Joynt KE, Orav EJ, Epstein AM. The long-term effect of premier pay for performance on patient outcomes. N Engl J Med 2012; 366:1606–615.
- Gerhardt G, Yemane A, Hickman P, Oelschlaeger A, Rollins E, Brennan N; Centers for Medicare & Medicaid Services (CMS). Medicare Readmission Rates Showed Meaningful Decline in 2012. http://www.cms.gov/mmrr/Briefs/B2013/mmrr-2013-003-02-b01.html. Accessed April 7, 2014.
- Office of Inspector General; US Department of Health and Human Services. Hospitals’ Use of Observation Stays and Short Inpatient Stays for Medicare Beneficiaries. Report (OEI-02-12-00040). http://oig.hhs.gov/oei/reports/oei-02-12-00040.asp. Accessed April 7, 2014.
- van Walraven C, Bennett C, Jennings A, Austin PC, Forster AJ. Proportion of hospital readmissions deemed avoidable: a systematic review. CMAJ 2011; 183:E391–E402.
- Forster AJ, Murff HJ, Peterson JF, Gandhi TK, Bates DW. The incidence and severity of adverse events affecting patients after discharge from the hospital. Ann Intern Med 2003; 138:161–167.
- Moore C, McGinn T, Halm E. Tying up loose ends: discharging patients with unresolved medical issues. Arch Intern Med 2007; 167:1305–1311.
- Roy CL, Poon EG, Karson AS, et al. Patient safety concerns arising from test results that return after hospital discharge. Ann Intern Med 2005; 143:121–128.
- Coleman EA, Fox PD; HMO Workgroup on Care Management. Managing patient care transitions: a report of the HMO Care Management Workgroup. Health-plan 2004; 45:36–39.
- Coleman EA, Berenson RA. Lost in transition: challenges and opportunities for improving the quality of transitional care. Ann Intern Med 2004; 141:533–536.
- Snow V, Beck D, Budnitz T, et al; American College of Physicians; Society of General Internal Medicine; Society of Hospital Medicine; American Geriatrics Society; American College of Emergency Physicians; Society of Academic Emergency Medicine. Transitions of Care Consensus Policy Statement American College of Physicians-Society of General Internal Medicine-Society of Hospital Medicine-American Geriatrics Society-American College of Emergency Physicians-Society of Academic Emergency Medicine. J Gen Intern Med 2009; 24:971–976.
- Pham HH, Schrag D, O’Malley AS, Wu B, Bach PB. Care patterns in Medicare and their implications for pay for performance. N Engl J Med 2007; 356:1130–1139.
- Kripalani S, LeFevre F, Phillips CO, Williams MV, Basaviah P, Baker DW. Deficits in communication and information transfer between hospital-based and primary care physicians: implications for patient safety and continuity of care. JAMA 2007; 297:831–841.
- Solet DJ, Norvell JM, Rutan GH, Frankel RM. Lost in translation: challenges and opportunities in physician-to-physician communication during patient handoffs. Acad Med 2005; 80:1094–1099.
- Kripalani S, Jackson AT, Schnipper JL, Coleman EA. Promoting effective transitions of care at hospital discharge: a review of key issues for hospitalists. J Hosp Med 2007; 2:314–323.
- National Research Council. Crossing the Quality Chasm: A New Health System for the 21st Century. Washington, DC: The National Academies Press, 2001.
- O’Leary KJ, Kulkarni N, Landler MP, et al. Hospitalized patients’ understanding of their plan of care. Mayo Clin Proc 2010; 85:47–52.
- Coleman EA, Chugh A, Williams MV, et al. Understanding and execution of discharge instructions. Am J Med Qual 2013; 28:383–391.
- Berkman ND, Sheridan SL, Donahue KE, Halpern DJ, Crotty K. Low health literacy and health outcomes: an updated systematic review. Ann Intern Med 2011; 155:97–107.
- Kutner M, Greenberg E, Jin Y, Paulsen C. The Health Literacy of America’s Adults: Results From the 2003 National Assessment of Adult Literacy (NCES 2006–483). US Department of Education. Washington, DC: National Center for Education Statistics, 2006. http://nces.ed.gov/pubs2006/2006483.pdf. Accessed April 7, 2014.
- Hibbard JH, Greene J. What the evidence shows about patient activation: better health outcomes and care experiences; fewer data on costs. Health Aff (Millwood) 2013; 32:207–214.
- Lin CY, Barnato AE, Degenholtz HB. Physician follow-up visits after acute care hospitalization for elderly Medicare beneficiaries discharged to noninstitutional settings. J Am Geriatr Soc 2011; 59:1947–1954.
- Sharma G, Kuo YF, Freeman JL, Zhang DD, Goodwin JS. Outpatient follow-up visit and 30-day emergency department visit and readmission in patients hospitalized for chronic obstructive pulmonary disease. Arch Intern Med 2010; 170:1664–1670.
- Hernandez AF, Greiner MA, Fonarow GC, et al. Relationship between early physician follow-up and 30-day readmission among Medicare beneficiaries hospitalized for heart failure. JAMA 2010; 303:1716–1722.
- van Walraven C, Taljaard M, Etchells E, et al. The independent association of provider and information continuity on outcomes after hospital discharge: implications for hospitalists. J Hosp Med 2010; 5:398–405.
- Sommers A, Cunningham PJ. Physician Visits After Hospital Discharge: Implications for Reducing Readmissions. Research Brief No. 6. National Institute for Health Care Reform (NIHCR), 2011. www.nihcr.org/Reducing_Readmissions.html. Accessed April 7, 2014.
- Dharmarajan K, Hsieh AF, Lin Z, et al. Diagnoses and timing of 30-day readmissions after hospitalization for heart failure, acute myocardial infarction, or pneumonia. JAMA 2013; 309:355–363.
- Calvillo-King L, Arnold D, Eubank KJ, et al. Impact of social factors on risk of readmission or mortality in pneumonia and heart failure: systematic review. J Gen Intern Med 2013; 28:269–282.
- Coventry PA, Gemmell I, Todd CJ. Psychosocial risk factors for hospital readmission in COPD patients on early discharge services: a cohort study. BMC Pulm Med 2011; 11:49.
- Weissman JS, Stern RS, Epstein AM. The impact of patient socioeconomic status and other social factors on readmission: a prospective study in four Massachusetts hospitals. Inquiry 1994; 31:163–172.
- Proctor EK, Morrow-Howell N, Li H, Dore P. Adequacy of home care and hospital readmission for elderly congestive heart failure patients. Health Soc Work 2000; 25:87–96.
- Kansagara D, Ramsay RS, Labby D, Saha S. Post-discharge intervention in vulnerable, chronically ill patients. J Hosp Med 2012; 7:124–130.
- Englander H, Kansagara D. Planning and designing the care transitions innovation (C-Train) for uninsured and Medicaid patients. J Hosp Med 2012; 7:524–529.
- Brown R, Peikes D, Chen A, Schore J. 15-site randomized trial of coordinated care in Medicare FFS. Health Care Financ Rev 2008; 30:5–25.
- Arbaje AI, Wolff JL, Yu Q, Powe NR, Anderson GF, Boult C. Post-discharge environmental and socioeconomic factors and the likelihood of early hospital readmission among community-dwelling Medicare beneficiaries. Gerontologist 2008; 48:495–504.
- Peek CJ, Baird MA, Coleman E. Primary care for patient complexity, not only disease. Fam Syst Health 2009; 27:287–302.
- Society of Hospital Medicine. Project BOOST: Better Outcomes by Optimizing Safe Transitions. www.hospitalmedicine.org/BOOST. Accessed April 7, 2014.
- Hansen LO, Greenwald JL, Budnitz T, et al. Project BOOST: effectiveness of a multihospital effort to reduce rehospitalization. J Hosp Med. 2013; 8:421–427.
- Maynard GA, Budnitz TL, Nickel WK, et al. 2011 John M. Eisenberg Patient Safety and Quality Awards. Mentored implementation: building leaders and achieving results through a collaborative improvement model. Innovation in patient safety and quality at the national level. Jt Comm J Qual Patient Saf 2012; 38:301–310.
- Boston University Medical Center. Project RED: Re-Engineered Discharge. www.bu.edu/fammed/projectred/. Accessed April 7, 2014.
- Jack BW, Chetty VK, Anthony D, et al. A reengineered hospital discharge program to decrease rehospitalization: a randomized trial. Ann Intern Med 2009; 150:178–187.
- Berkowitz RE, Fang Z, Helfand BK, Jones RN, Schreiber R, Paasche-Orlow MK. Project ReEngineered Discharge (RED) lowers hospital readmissions of patients discharged from a skilled nursing facility. J Am Med Dir Assoc 2013; 14:736–740.
- Institute for Healthcare Improvement. STAAR: STate Action on Avoidable Re-hospitalizations. www.ihi.org/offerings/Initiatives/STAAR/Pages/default.aspx. Accessed April 7, 2014.
- Boutwell AE, Johnson MB, Rutherford P, et al. An early look at a four-state initiative to reduce avoidable hospital readmissions. Health Aff (Millwood) 2011; 30:1272–1280.
- University of Colorado Denver. The Care Transitions Program. www.caretransitions.org/. Accessed April 7, 2014.
- Coleman EA, Parry C, Chalmers S, Min SJ. The care transitions intervention: results of a randomized controlled trial. Arch Intern Med 2006; 166:1822–1828.
- Voss R, Gardner R, Baier R, Butterfield K, Lehrman S, Gravenstein S. The care transitions intervention: translating from efficacy to effectiveness. Arch Intern Med 2011; 171:1232–1237.
- Penn Nursing Science. Transitional Care Model. www.transitional-care.info/. Accessed April 7, 2014.
- Naylor M, Brooten D, Jones R, Lavizzo-Mourey R, Mezey M, Pauly M. Comprehensive discharge planning for the hospitalized elderly. A randomized clinical trial. Ann Intern Med 1994; 120:999–1006.
- Stauffer BD, Fullerton C, Fleming N, et al. Effectiveness and cost of a transitional care program for heart failure: a prospective study with concurrent controls. Arch Intern Med 2011; 171:1238–1243.
- The Illinois Transitional Care Consortium. The Bridge Model. www.transitionalcare.org/the-bridge-model. Accessed April 7, 2014.
- Altfeld SJ, Shier GE, Rooney M, et al. Effects of an enhanced discharge planning intervention for hospitalized older adults: a randomized trial. Gerontologist 2013; 53:430–440.
- Johns Hopkins Bloomberg School of Public Health. Guided Care. www.guidedcare.org. Accessed April 7, 2014.
- Boult C, Reider L, Leff B, et al. The effect of guided care teams on the use of health services: results from a cluster-randomized controlled trial. Arch Intern Med 2011; 171:460–466.
- Counsell SR, Callahan CM, Buttar AB, Clark DO, Frank KI. Geriatric Resources for Assessment and Care of Elders (GRACE): a new model of primary care for low-income seniors. J Am Geriatr Soc 2006; 54:1136–1141.
- Bielaszka-DuVernay C. The ‘GRACE’ model: in-home assessments lead to better care for dual eligibles. Health Aff (Millwood) 2011; 30:431–434.
- Florida Atlantic University. INTERACT: Interventions to Reduce Acute Care Transfers. http://interact2.net/. Accessed April 7, 2014.
- Ouslander JG, Lamb G, Tappen R, et al. Interventions to reduce hospitalizations from nursing homes: evaluation of the INTERACT II collaborative quality improvement project. J Am Geriatr Soc 2011; 59:745–753.
- West Virginia Medical Institute. HHQI-BPIPs (Home Health Quality Improvement - Best Practices Intervention Packages). www.home-healthquality.org/Education/BPIPS.aspx. Accessed April 7, 2014.
- Centers for Medicare & Medicaid Services (CMS). Independence at Home Demonstration. http://innovation.cms.gov/initiatives/Independence-at-Home/. Accessed April 7, 2014.
- Hansen LO, Young RS, Hinami K, Leung A, Williams MV. Interventions to reduce 30-day rehospitalization: a systematic review. Ann Intern Med 2011; 155:520–528.
- Naylor MD, Brooten D, Campbell R, et al. Comprehensive discharge planning and home follow-up of hospitalized elders: a randomized clinical trial. JAMA 1999; 281:613–620.
- Koehler BE, Richter KM, Youngblood L, et al. Reduction of 30-day postdischarge hospital readmission or emergency department (ED) visit rates in high-risk elderly medical patients through delivery of a targeted care bundle. J Hosp Med 2009; 4:211–218.
- Garåsen H, Windspoll R, Johnsen R. Intermediate care at a community hospital as an alternative to prolonged general hospital care for elderly patients: a randomised controlled trial. BMC Public Health 2007; 7:68.
- Courtney M, Edwards H, Chang A, Parker A, Finlayson K, Hamilton K. Fewer emergency readmissions and better quality of life for older adults at risk of hospital readmission: a randomized controlled trial to determine the effectiveness of a 24-week exercise and telephone follow-up program. J Am Geriatr Soc 2009; 57:395–402.
- Coleman EA, Smith JD, Frank JC, Min SJ, Parry C, Kramer AM. Preparing patients and caregivers to participate in care delivered across settings: the Care Transitions Intervention. J Am Geriatr Soc 2004; 52:1817–1825.
- Naylor MD, Aiken LH, Kurtzman ET, Olds DM, Hirschman KB. The care span: the importance of transitional care in achieving health reform. Health Aff (Millwood) 2011; 30:746–754.
- O’Leary KJ, Buck R, Fligiel HM, et al. Structured interdisciplinary rounds in a medical teaching unit: improving patient safety. Arch Intern Med 2011; 171:678–684.
- Agency for Healthcare Research and Quality (AHRQ). Health Literacy Universal Precautions Toolkit. www.ahrq.gov/legacy/qual/literacy/. Accessed April 7, 2014.
- Schillinger D, Piette J, Grumbach K, et al. Closing the loop: physician communication with diabetic patients who have low health literacy. Arch Intern Med 2003; 163:83–90.
- Mittler JN, O’Hora JL, Harvey JB, Press MJ, Volpp KG, Scanlon DP. Turning readmission reduction policies into results: some lessons from a multistate initiative to reduce readmissions. Popul Health Manag 2013; 16:255–260.
KEY POINTS
- Traditional health care delivery models typically do not have mechanisms in place for coordinating care across settings, such as when a patient goes from the hospital to a skilled nursing facility or to home.
- Transitions can fail, leading to hospital readmission, because of ineffective patient and caregiver education, discharge summaries that are incomplete or not communicated to the patient and the next care setting, lack of follow-up with primary care providers, and poor patient social support.
- A number of programs are trying to improve transitions of care, with some showing reductions in hospital readmission rates and emergency department visits.
- Successful programs use multiple interventions simultaneously, including improved communication among health care providers, better patient and caregiver education, and coordination of social and health care services.