User login
Frequently Admitted Patients
The national healthcare improvement paradigm is shifting toward a more comprehensive, value‐focused, and patient‐centered approach. Reducing hospital readmissions has become a focal point as a policy strategy to improve care quality while reducing cost. Section 3025 of the Affordable Care Act mandated the Centers for Medicare and Medicaid Services to make progressive reductions in Medicare payments to hospitals that have higher than expected readmission rates for 3 conditions (heart failure, acute myocardial infarction, and pneumonia), and expanding to include chronic obstructive pulmonary disease and total hip and knee arthroplasty in 2015.[1] In response, hospitals and systems are developing and implementing programs that coordinate care beyond hospital walls to reduce readmissions and healthcare costs.[2, 3] However, patients are readmitted for a variety of reasons, and programs that address the needs of some may not address the distinct needs of others. Understanding the characteristics of patients with frequent readmissions will permit the well‐informed creation of solutions specific to this population to reduce cost, free resources, and provide better care.
Although a solid body of literature already exists that describes the characteristics of patients who frequently visit the emergency department (ED),[4, 5, 6, 7, 8, 9, 10, 11, 12] it is not clear to what extent these characteristics also apply to patients with frequent hospital admissions. Frequent ED visitors have been found to be largely insured (85%) although with over‐representation of public insurance, and to be heavy users of the healthcare system overall.[6] A high disease burden associated with multiple chronic conditions has been found to predict frequent ED use.[4, 9, 11, 12] Some characteristics may vary by location; for example, alcohol abuse and psychiatric morbidity have been found to be associated with frequent ED use in New York and San Francisco, but it is not clear to what extent they are a factor in less urban areas.[4, 6, 12]
Several previous studies have investigated the characteristics of frequently admitted patients at single sites.[13, 14, 15, 16] Nguyen et al. (2013) studied patients with the highest costs and the most admissions at a large academic medical center in San Francisco.[13] High admit patients were defined as those responsible for the top decile of admissions, and were grouped into equal‐sized high‐ and low‐cost cohorts. The high‐admission/high‐cost group represented 5% of all patients, 25% of all costs, and 16% of all admissions. These patients were hospitalized primarily for medical conditions (78%) and had a high 30‐day readmission rate (47%). The high‐admission/low‐cost group accounted for 5% of all patients, 12% of all admissions, and 7% of all costs. These patients were also predominantly admitted for medical conditions (87%), with the most common admitting diagnoses representing respiratory, gastrointestinal, and cardiovascular conditions.[13]
Hwa (2012) conducted an analysis of 29 patients admitted 6 or more times in 1 year to an inpatient medical service in San Francisco.[14] These patients represented just 1% of all patients, but 13% of readmissions. Fifty‐five percent of these patients had a psychiatric diagnosis, and 52% had chronic pain. Ninety percent had a primary care physician in the hospital system, 100% were insured either privately or publicly, and 93% had housing, although for 17% housing was described as marginal.[14]
In a third study, Boonyasai et al. (2012) identified 76 patients with 82 readmissions at a Baltimore, Maryland, hospital and classified them as isolated (1 readmission per 6‐month period) or serial (more than 1 readmission per 6‐month period) readmissions.[15] Patients with serial readmissions accounted for 70% of the total. Isolated readmissions were most likely to be related to suboptimal quality of care and care coordination, whereas serial readmissions were more likely to result from disease progression, psychiatric illness, and substance abuse.[15]
All of these studies were conducted at single‐site academic medical centers serving inner city populations. We undertook this study to identify patient and hospital‐level characteristics of frequently admitted patients in a broad sample of 101 US academic medical centers to determine whether previously reported findings are generalizable, and to identify characteristics of frequently admitted patients that can inform interventions designed to meet the needs of this relatively small but resource‐intensive group of patients.
METHODS
All data were obtained from the University HealthSystem Consortium (UHC) (Chicago, IL) Clinical Data Base/Resource Manager (CDB), a large administrative database to which UHC principal members submit comprehensive administrative data files. UHC's principal members include approximately 120 US academic medical centers delivering tertiary and quaternary care, with an average of 647 acute care beds. The CDB includes primary and secondary diagnoses using International Classification of Diseases, Ninth Revision (ICD‐9)[17] codes.
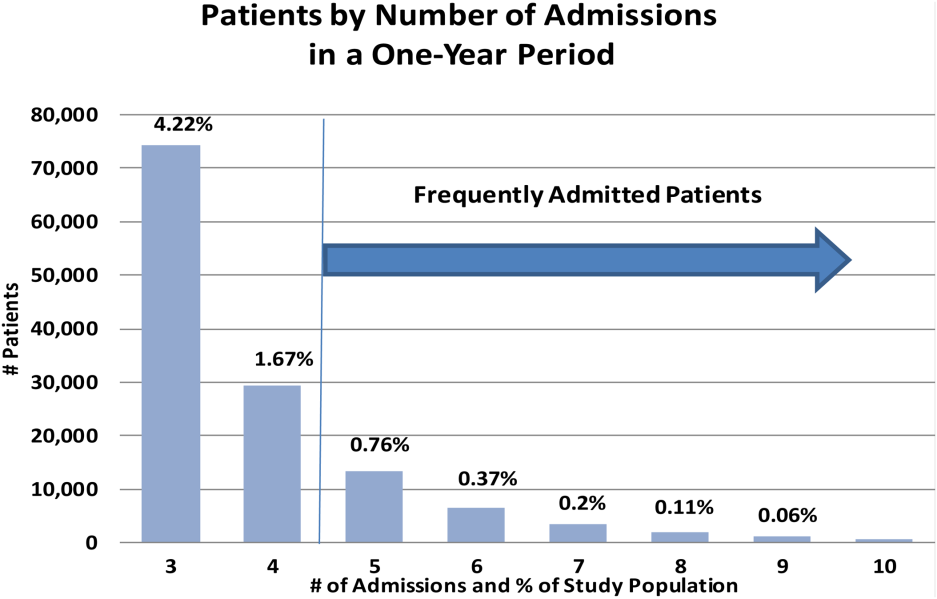
The data of 101 academic medical centers with complete datasets for the study period (October 1, 2011, to September 30, 2012) were included in this analysis. Frequently admitted patients were defined as patients admitted 5 or more times to the same facility in a 12‐month period; all admissions were included, even those more than 30 days apart. This definition was established based on a naturally occurring break in the frequency distribution (Figure 1) and our intention to focus on the unique characteristics of patients at the far right of the distribution. We excluded obstetric (MDC 14, ICD‐9)[17] admissions and pediatric (<18 years of age at index admission) patients, as well as admissions with principal diagnoses for chemotherapy (ICD‐9 diagnosis codes v5811v5812), dialysis (ICD‐9 diagnosis codes v560v568), and rehabilitation (ICD‐9 diagnosis codes v570v579), which are typically planned. The Agency for Healthcare Research and Quality (AHRQ) comorbidity software was used to identify comorbid conditions,[18, 19] and a score based on the Elixhauser comorbidity measures was calculated using a modified acuity point system.[20] For comparisons based on safety net status, we used a definition of payer mix being 25% Medicaid or uninsured.

Our analyses included patient demographics, admission source and discharge status, clinical diagnoses, procedures, and comorbidities, cost, and length of stay. Patients defined as frequently admitted were compared in aggregate to all other hospitalized patients (all other admissions).
To evaluate associations, we used [2] tests for categorical variables and t tests for continuous variables. When comparing the non‐normally distributed comorbidities of the control group to the normally distributed comorbidities of the frequently admitted patients, we performed a Kruskal‐Wallis test on the medians.
RESULTS
During a 1‐year period (October 1, 2011, to September 30, 2012), 1,758,027 patients were admitted 2,388,124 times at 101 academic medical centers. Of these, 28,291 patients had 5 or more admissions during this period, resulting in 180,185 admissions. These frequently admitted patients represented 1.6% of all patients (Figure 1) and 7.6% of all inpatient admissions. By comparison, nonfrequently admitted patients were admitted once (79%), twice (14%), 3 times (4%), or 4 times (2%).
Among hospitals, the volume and impact of frequently admitted patients varied widely. The frequently admitted patient population ranged from 64 patients (0.7% of all patients) to 785 patients (3.5%), with an average of 280 patients (1.6%). To look for differences that might explain this range, we compared hospitals in the top and bottom deciles with respect to geographic region and to safety net status, but found no significant or meaningful differences. The average number of admissions per patient was 6.4, with a range of 5 to 76. Days per patient ranged from 5 to 434 days, with an average of 42. The average patient‐day percentage (frequently admitted patient days/total patient days) was 8.4%, and ranged from 3.2% to 15.4%.
Frequently admitted patients were more likely to be younger than all other patients (71.9% under the age of 65 years, as compared with 65.3% of all other patients (P<0.001)). They were also more likely to have either Medicaid or no healthcare insurance (27.6% compared with 21.6%, P<0.001), although nearly three‐quarters had either private insurance or Medicare coverage.
Eighty‐four percent of frequently admitted patient admissions were to medical services (vs 58% of all other patients (P<0.001)). The admission status for these patients was much less likely to be elective (9.1% of frequently admitted patient admissions vs 26.6% of all other patients' admissions [P<0.001]). Frequently admitted patients were more likely to be discharged to a skilled nursing facility (9.3% vs 8.4%, [P<0.001]) or with home health services (19.7% vs 13.4% [P<0.001]).
The 10 most common primary diagnoses for patient admissions are shown in Table 1. No single primary diagnosis accounted for a large share of the admissions of these patients; the most common diagnosis, sickle cell disease with crisis, accounted for only about 4% of admissions. The 10 most common diagnoses accounted for <20% of all admissions. The remainder of the diagnoses was spread over more than 3000 diagnosis codes; only about 300 codes had more than 100 admissions each.
| Primary Diagnoses | Secondary Diagnoses | Principal Procedures | ||||||||
|---|---|---|---|---|---|---|---|---|---|---|
| Frequently Admitted Patient Admissions, N=180,185 | All Other Patient Admissions, N=2,207,939 | All Other Patient Rank | Frequently Admitted Patient Admissions, N=180,185 | All Other Patient Admissions, N=2,207,939 | All Other PatientRank | Frequently Admitted Patient Admissions, N=180,185 | All Other Patient Admissions, N=2,207,939 | |||
| ||||||||||
| Sickle cell disease with crisis | 3.97% (7,152) | 0.002% (5,887) | 63 | Hypertension NOS | 31.39% (56,556) | 40.04% (884,045) | 1 | Hemodialysis | 6.32% (11,380) | 1.08% (23,871) |
| Septicemia NOS | 2.58% (4,652) | 1.87% (41,369) | 1 | Hyperlipidemia NOS | 24.47% (44,089) | 25.94% (572,760) | 2 | Packed cell transfusion | 4.49% (8.091) | 1.57% (34,669) |
| Acute and chronic systolic heart failure | 2.06% (3,708) | 0.81% (17,802) | 12 | Congestive heart failure NOS | 22.86% (41,197) | 11.82% (260,944) | 8 | Percutaneous abdominal drainage | 2.42% (4,366) | 0.86% (18,974) |
| Acute kidney failure NOS | 2.04% (3,680) | 1.16% (25,528) | 6 | Esophageal reflux | 21.19% (38,184) | 17.32% (382,511) | 3 | Venous catheter NEC | 2.13% (3,843) | 0.89% (19,718) |
| Obstructive chronic bronchitis with exacerbation | 1.76% (3,180) | 0.68% (14,957) | 14 | Diabetes mellitus NOS uncomplicated | 20.39% (36,743) | 16.75% (369,808) | 4 | Central venous catheter placement with guidewire | 2.13% (3,834)) | 0.83% (18,307) |
| Pneumonia organism NOS | 1.72% (3,091) | 1.29% (28,468) | 4 | Tobacco use disorder | 16.98% (30,604) | 16.71% (368,880) | 5 | Continuous invasive mechanical ventilation <96 consecutive hours | 1.38% (2,480) | 0.7% (15,441) |
| Urinary tract infection NOS | 1.63% (2,939) | 0.86% (19,069) | 9 | History of tobacco use | 16.89% (30,439) | 14.77% (326,026) | 6 | Noninvasive mechanical ventilation | 1.3% (2,345) | 0.58% (12,899) |
| Acute pancreatitis | 1.23% (2,212) | 0.73% (16,168) | 13 | Coronary atherosclerosis native vessel | 16.12% (29,040) | 12.88% (284,487) | 7 | Small intestine endoscopy NEC | 1.26% (2.265) | 0.7% (15,480) |
| Acute and chronic diastolic heart failure | 1.22% (2,190) | 0.48% (10,600) | 22 | Depressive disorder | 15.42% (27,785) | 10.34% (228,347) | 10 | Heart ultrasound | 1.11% (1,997) | 1.37% (30,161) |
| Complication of kidney transplant | 1.08% (1,944) | 0.42% (9,354) | 28 | Acute kidney failure NOS | 13.8% (24,859) | 9.37%% (206,951) | 12 | Esophagogastroduodenoscopy with closed biopsy | 1.09% (1,963) | 0.8% (17,644) |
Secondary diagnoses were mainly chronic conditions, including hypertension, hyperlipidemia, esophageal reflux, and diabetes mellitus type 2 (Table 1.) Combined, congestive heart failure and diabetes mellitus accounted for 43.3% of the secondary diagnoses of admissions of frequently admitted patients, but for only 28.6% of other patients. Acute kidney failure was more common in frequently admitted patients (13.8% vs 9.4% [P<0.001]). Psychiatric disorders accounted for <1% of primary diagnoses for both frequently admitted patients and all other patients. As a secondary diagnosis, depressive disorder appeared in the top 10 for both groups, although more commonly for frequently admitted patients (15.4% vs 10.3% [P<0.001]).
The most commonly performed principal procedures are also shown in Table 1. These include hemodialysis (6.32%) and packed cell transfusion (4.49%), nonoperating room procedures associated with chronic medical conditions.
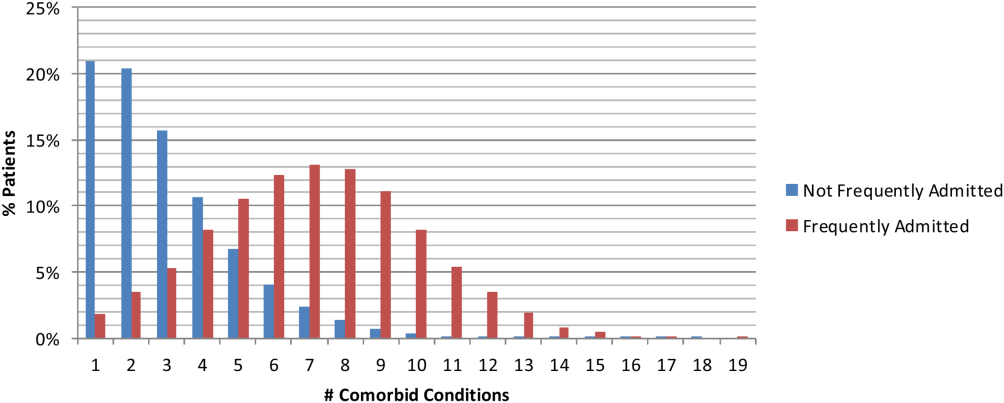
Comorbidities were compared using the AHRQ comorbidity software.[18, 19] Comorbid conditions were counted once per patient, regardless of the number of admissions in which the condition was coded. Frequently admitted patients have a significantly higher mean number of comorbidities: 7.1 compared to 2.5 for all other patients (P<0.001; Figure 2). In an additional analysis using the Elixhauser comorbidity measures to determine acuity scores, the mean scores were 13.1 for frequently admitted patients and 3.17 for all others (P<0.001). The most common comorbidities were hypertension (74%), fluid and electrolyte disorders (73%), and deficiency anemias (66%). The only behavioral health comorbidity that affected more than a quarter of frequently admitted patients was depression (40% as compared to 13% for all others).
Additionally, frequently admitted patients were significantly more likely to have comorbidities of psychosis (18% vs 5% [P<0.001]), alcohol abuse (16% vs 7% [P<0.001]), and drug abuse (20% vs 7% [P<0.001]). Among hospitals, these comorbidities ranged widely: psychosis (3% 48%); alcohol abuse (3%46%); and drug abuse (3%58%). Hospitals with the highest rates (top decile) of frequently admitted patients with alcohol and drug abuse comorbidities were more likely to be safety net hospitals than those in the lowest decile (P<0.05 for each independently), but no such difference was found regarding rates of patients with psychosis.
Although the frequently admitted patient population accounted for only 1.6% of patients, they accounted for an average of 8.4% of all bed days and 7.1% of direct cost. The average cost per day was $1746, compared to $2144 for all other patients (Table 2).
| Length of Stay, Days | Direct Cost | % Total Bed Days | Cost/Day | All Other Patients Cost/Day | Difference | |
|---|---|---|---|---|---|---|
| Minimum | 1.0 | 2.3% | 3.2% | $809 | $1,005 | $(196) |
| Maximum | 86.8 | 14.1% | 15.4% | $3,208 | $4,070 | $(862) |
| Mean | 6.7 | 7.1% | 8.4% | $1,746 | $2,144 | $(398) |
| Median | 5.5 | 7.0% | 8.3% | $1,703 | $2,112 | $(410) |
DISCUSSION
An extensive analysis of the characteristics of frequently admitted patients at 101 US academic medical centers, from October 1, 2011 to September 30, 2012, revealed that these patients comprised 1.6% of all patients, but accounted for 8% of all admissions and 7% of direct costs. Relative to all other hospitalized patients, frequently admitted patients were likely to be younger, of lower socioeconomic status, in poorer health, and more often affected by mental health or substance abuse conditions that may mediate their health behaviors. However, the prevalence of patients with psychiatric or behavior conditions varied widely among hospitals, and hospitals with the highest rates of patients with substance abuse comorbidities were more likely to be safety net hospitals. Frequently admitted patients' diagnoses and procedures suggest that their admissions were related to complex chronic diseases; more than three‐quarters were admitted to medicine services, and their average length of stay was nearly 7 days. No single primary diagnosis accounted for a predominant share of their admissions; the most common diagnosis, sickle cell disease with crisis, accounted for only about 4%. The cost of their care was lower than that of other patients, reflecting the preponderance of their admissions to medicine service lines.
In many ways, frequently admitted patients seem similar to frequent ED visitors. Their visits were driven by a high disease burden associated with multiple chronic conditions, and they were heavy users of the healthcare system overall.[4, 6] The majority of both groups were insured, although there was over‐representation of public insurance.[6] As with frequent ED users, some frequently admitted patients are affected by psychiatric morbidity and substance abuse.[4, 12]
Our results in some ways confirmed, and in some ways differed from, findings of prior studies of patients with frequent hospital admissions. Although each study performed to date has defined the population differently, comparison of findings is useful. Our population was similar to the high‐admission groups identified by Nguyen et al. (patients responsible for the top decile of admissions).[13] These patients were also predominantly admitted for medical conditions, with common admitting diagnoses representing respiratory, gastrointestinal, and cardiovascular conditions. However, the median length of stay (3 days for the high‐admission/low‐cost group and 5 days for the high‐admission/high‐cost group) was lower than that of our population (5.5 days).
Hwa, who studied 29 patients admitted 6 or more times in 1 year to an inpatient medical service in San Francisco,[14] found that 55% of frequently admitted patients had a psychiatric diagnosis, higher than our patient population. Our findings are similar to those of Boonyasai et al.[15] whose serial readmitters had admissions resulting from disease progression, psychiatric illness, and substance abuse.
Our more nationally representative analysis documented a wide range of patient volumes and clinical characteristics, including psychiatric and substance abuse comorbidities, across study hospitals. It demonstrates that different approachesand resourcesare needed to meet the needs of these varied groups of patients. Each hospital must identify, evaluate, and understand its own population of frequently admitted patients to create well‐informed solutions to prevent repeat hospitalization for these patients.
Our ability to create a distinctive picture of the population of frequently admitted patients in US academic medical centers is based on access to an expansive dataset that captures complete diagnostic and demographic information on the universe of patients admitted to our member hospitals. The availability of clinical and administrative data for the entire population of patients permits both an accurate description of patient characteristics and a standardized comparison of groups. All data conform to accepted formats and definitions; their validity is universally recognized by contributing database participants.
Limitations
There are several important limitations to our study. First, patients with 5 or more admissions in 1 year may be undercounted. The UHC Clinical Data Base/Resource Manager only captures readmissions to a single facility; admissions of any patient admitted to more than 1 hospital, even within the UHC membership, cannot be determined. This could have a particularly strong effect on our ability to detect admissions of patients with acute episodes related to psychiatric illness or substance abuse, as they may be more likely to present to multiple or specialty hospitals. Additionally, readmission rates vary among UHC‐member hospitals, based to some extent on geography and the availability of alternative settings of care.
It is possible that surveillance bias played a role in our finding that frequently admitted patients have a significantly higher mean number of comorbidities; each admission presents an opportunity to document additional comorbid conditions. Psychiatric conditions may be underdocumented in medical settings in academic medical centers, where the focus is often on acute medical conditions. Additionally, certain data elements that we believe are central to understanding the characteristics of frequently admitted patients are not part of the UHC Clinical Data Base/Resource Manager and were therefore not a part of our analysis. These highly influential upstream determinants of health include documentation of a primary care physician, housing status, and access to services at discharge.
CONCLUSION
The valuable information reported from analysis of nearly 2 million patients in the UHC Clinical Data Base/Resource Manager can be used to better understand the characteristics of frequently admitted patients. This important cohort of individuals has complex care needs that often result in hospitalization, but may be amenable to solutions that allow patients to remain in their communities. By understanding the demographic, social, and medical characteristics of these patients, hospitals can develop and implement solutions that address the needs of this small group of patients who consume a highly disproportionate share of healthcare resources.
Acknowledgements
The authors acknowledge the contributions of Samuel F. Hohmann, PhD, and Ryan Carroll, MBA, who provided expert statistical analyses and generous assistance in the completion of this article.
Disclosure: Nothing to report.
- Centers for Medicare 21(9):117–120.
- , , , . The influence of a postdischarge intervention on reducing hospital readmissions in a Medicare population. Popul Health Manag. 2013;16(5):310–316.
- , . Dispelling an urban legend: frequent emergency department users have substantial burden of disease. Health Aff (Millwood). 2013;32:2099–2108.
- , , , et al. Effectiveness of interventions targeting frequent users of emergency departments: a systematic review. Ann Emerg Med. 2011;58:41–52.
- , . Frequent users of emergency departments: the myths, the data, and the policy implications. Ann Emerg Med. 2010;20(10):1–8.
- , , , . Development and validation of a model for predicting emergency admissions over the next year. Arch Intern Med. 2008;168:1416–1422.
- , , , et al. A comparison of frequent and infrequent visitors to an urban emergency department. J Emerg Med. 2008;38:115–121.
- , . Frequent users of Massachusetts emergency departments: a statewide analysis. Ann Emerg Med. 2006;48:9–16.
- , , , et al. A descriptive study of heavy emergency department users at an academic emergency department reveals heavy users have better access to care than average users. J Emerg Nurs. 2005;31:139–144.
- , , . Predictors and outcomes of frequent emergency department users. Acad Emerg Med. 2003;10:320–328.
- , , . Epidemiologic analysis of an urban, public emergency department's frequent users. Acad Emerg Med. 2000;7:637–646.
- , , , . What's cost got to do with it? Association between hospital costs and frequency of admissions among “high users” of hospital care. J Hosp Med. 2013;8:665–671.
- . Characteristics of a frequently readmitted patient population on an inpatient medical service. Abstract presented at: Society of Hospital Medicine Annual Meeting, April 1– 4, 2012; San Diego, CA.
- , , , , . Characteristics of isolated and serial rehospitalizations suggest a need for different types of improvement strategies [abstract] J Hosp Med. 2012;7(suppl 2):513.
- , , , , . An intervention to improve care and reduce costs for high‐risk patients with frequent hospital admissions: a pilot study. BMC Health Serv Res. 2011;11:270–279.
- Centers for Disease Control and Prevention. International Classification of Diseases, Ninth Revision (ICD‐9). Available at: http://www.cdc.gov/nchs/icd/icd9.htm. Accessed February 18, 2015.
- Agency for Healthcare Research and Quality, Healthcare Cost and Utilization Project. Comorbidity software, version 3.7. Available at: http://www.hcup‐us.ahrq.gov/toolssoftware/comorbidity/comorbidity.jsp. Accessed February 18, 2015.
- , , , . Comorbidity measures for use with administrative data. Med Care. 1998;36:8–27.
- , , , , . A modification of the Elixhauser comorbidity measures into a point system for hospital death using administrative data. Med Care. 2009;47:626–633.
The national healthcare improvement paradigm is shifting toward a more comprehensive, value‐focused, and patient‐centered approach. Reducing hospital readmissions has become a focal point as a policy strategy to improve care quality while reducing cost. Section 3025 of the Affordable Care Act mandated the Centers for Medicare and Medicaid Services to make progressive reductions in Medicare payments to hospitals that have higher than expected readmission rates for 3 conditions (heart failure, acute myocardial infarction, and pneumonia), and expanding to include chronic obstructive pulmonary disease and total hip and knee arthroplasty in 2015.[1] In response, hospitals and systems are developing and implementing programs that coordinate care beyond hospital walls to reduce readmissions and healthcare costs.[2, 3] However, patients are readmitted for a variety of reasons, and programs that address the needs of some may not address the distinct needs of others. Understanding the characteristics of patients with frequent readmissions will permit the well‐informed creation of solutions specific to this population to reduce cost, free resources, and provide better care.
Although a solid body of literature already exists that describes the characteristics of patients who frequently visit the emergency department (ED),[4, 5, 6, 7, 8, 9, 10, 11, 12] it is not clear to what extent these characteristics also apply to patients with frequent hospital admissions. Frequent ED visitors have been found to be largely insured (85%) although with over‐representation of public insurance, and to be heavy users of the healthcare system overall.[6] A high disease burden associated with multiple chronic conditions has been found to predict frequent ED use.[4, 9, 11, 12] Some characteristics may vary by location; for example, alcohol abuse and psychiatric morbidity have been found to be associated with frequent ED use in New York and San Francisco, but it is not clear to what extent they are a factor in less urban areas.[4, 6, 12]
Several previous studies have investigated the characteristics of frequently admitted patients at single sites.[13, 14, 15, 16] Nguyen et al. (2013) studied patients with the highest costs and the most admissions at a large academic medical center in San Francisco.[13] High admit patients were defined as those responsible for the top decile of admissions, and were grouped into equal‐sized high‐ and low‐cost cohorts. The high‐admission/high‐cost group represented 5% of all patients, 25% of all costs, and 16% of all admissions. These patients were hospitalized primarily for medical conditions (78%) and had a high 30‐day readmission rate (47%). The high‐admission/low‐cost group accounted for 5% of all patients, 12% of all admissions, and 7% of all costs. These patients were also predominantly admitted for medical conditions (87%), with the most common admitting diagnoses representing respiratory, gastrointestinal, and cardiovascular conditions.[13]
Hwa (2012) conducted an analysis of 29 patients admitted 6 or more times in 1 year to an inpatient medical service in San Francisco.[14] These patients represented just 1% of all patients, but 13% of readmissions. Fifty‐five percent of these patients had a psychiatric diagnosis, and 52% had chronic pain. Ninety percent had a primary care physician in the hospital system, 100% were insured either privately or publicly, and 93% had housing, although for 17% housing was described as marginal.[14]
In a third study, Boonyasai et al. (2012) identified 76 patients with 82 readmissions at a Baltimore, Maryland, hospital and classified them as isolated (1 readmission per 6‐month period) or serial (more than 1 readmission per 6‐month period) readmissions.[15] Patients with serial readmissions accounted for 70% of the total. Isolated readmissions were most likely to be related to suboptimal quality of care and care coordination, whereas serial readmissions were more likely to result from disease progression, psychiatric illness, and substance abuse.[15]
All of these studies were conducted at single‐site academic medical centers serving inner city populations. We undertook this study to identify patient and hospital‐level characteristics of frequently admitted patients in a broad sample of 101 US academic medical centers to determine whether previously reported findings are generalizable, and to identify characteristics of frequently admitted patients that can inform interventions designed to meet the needs of this relatively small but resource‐intensive group of patients.
METHODS
All data were obtained from the University HealthSystem Consortium (UHC) (Chicago, IL) Clinical Data Base/Resource Manager (CDB), a large administrative database to which UHC principal members submit comprehensive administrative data files. UHC's principal members include approximately 120 US academic medical centers delivering tertiary and quaternary care, with an average of 647 acute care beds. The CDB includes primary and secondary diagnoses using International Classification of Diseases, Ninth Revision (ICD‐9)[17] codes.
The data of 101 academic medical centers with complete datasets for the study period (October 1, 2011, to September 30, 2012) were included in this analysis. Frequently admitted patients were defined as patients admitted 5 or more times to the same facility in a 12‐month period; all admissions were included, even those more than 30 days apart. This definition was established based on a naturally occurring break in the frequency distribution (Figure 1) and our intention to focus on the unique characteristics of patients at the far right of the distribution. We excluded obstetric (MDC 14, ICD‐9)[17] admissions and pediatric (<18 years of age at index admission) patients, as well as admissions with principal diagnoses for chemotherapy (ICD‐9 diagnosis codes v5811v5812), dialysis (ICD‐9 diagnosis codes v560v568), and rehabilitation (ICD‐9 diagnosis codes v570v579), which are typically planned. The Agency for Healthcare Research and Quality (AHRQ) comorbidity software was used to identify comorbid conditions,[18, 19] and a score based on the Elixhauser comorbidity measures was calculated using a modified acuity point system.[20] For comparisons based on safety net status, we used a definition of payer mix being 25% Medicaid or uninsured.
Our analyses included patient demographics, admission source and discharge status, clinical diagnoses, procedures, and comorbidities, cost, and length of stay. Patients defined as frequently admitted were compared in aggregate to all other hospitalized patients (all other admissions).
To evaluate associations, we used [2] tests for categorical variables and t tests for continuous variables. When comparing the non‐normally distributed comorbidities of the control group to the normally distributed comorbidities of the frequently admitted patients, we performed a Kruskal‐Wallis test on the medians.
RESULTS
During a 1‐year period (October 1, 2011, to September 30, 2012), 1,758,027 patients were admitted 2,388,124 times at 101 academic medical centers. Of these, 28,291 patients had 5 or more admissions during this period, resulting in 180,185 admissions. These frequently admitted patients represented 1.6% of all patients (Figure 1) and 7.6% of all inpatient admissions. By comparison, nonfrequently admitted patients were admitted once (79%), twice (14%), 3 times (4%), or 4 times (2%).
Among hospitals, the volume and impact of frequently admitted patients varied widely. The frequently admitted patient population ranged from 64 patients (0.7% of all patients) to 785 patients (3.5%), with an average of 280 patients (1.6%). To look for differences that might explain this range, we compared hospitals in the top and bottom deciles with respect to geographic region and to safety net status, but found no significant or meaningful differences. The average number of admissions per patient was 6.4, with a range of 5 to 76. Days per patient ranged from 5 to 434 days, with an average of 42. The average patient‐day percentage (frequently admitted patient days/total patient days) was 8.4%, and ranged from 3.2% to 15.4%.
Frequently admitted patients were more likely to be younger than all other patients (71.9% under the age of 65 years, as compared with 65.3% of all other patients (P<0.001)). They were also more likely to have either Medicaid or no healthcare insurance (27.6% compared with 21.6%, P<0.001), although nearly three‐quarters had either private insurance or Medicare coverage.
Eighty‐four percent of frequently admitted patient admissions were to medical services (vs 58% of all other patients (P<0.001)). The admission status for these patients was much less likely to be elective (9.1% of frequently admitted patient admissions vs 26.6% of all other patients' admissions [P<0.001]). Frequently admitted patients were more likely to be discharged to a skilled nursing facility (9.3% vs 8.4%, [P<0.001]) or with home health services (19.7% vs 13.4% [P<0.001]).
The 10 most common primary diagnoses for patient admissions are shown in Table 1. No single primary diagnosis accounted for a large share of the admissions of these patients; the most common diagnosis, sickle cell disease with crisis, accounted for only about 4% of admissions. The 10 most common diagnoses accounted for <20% of all admissions. The remainder of the diagnoses was spread over more than 3000 diagnosis codes; only about 300 codes had more than 100 admissions each.
| Primary Diagnoses | Secondary Diagnoses | Principal Procedures | ||||||||
|---|---|---|---|---|---|---|---|---|---|---|
| Frequently Admitted Patient Admissions, N=180,185 | All Other Patient Admissions, N=2,207,939 | All Other Patient Rank | Frequently Admitted Patient Admissions, N=180,185 | All Other Patient Admissions, N=2,207,939 | All Other PatientRank | Frequently Admitted Patient Admissions, N=180,185 | All Other Patient Admissions, N=2,207,939 | |||
| ||||||||||
| Sickle cell disease with crisis | 3.97% (7,152) | 0.002% (5,887) | 63 | Hypertension NOS | 31.39% (56,556) | 40.04% (884,045) | 1 | Hemodialysis | 6.32% (11,380) | 1.08% (23,871) |
| Septicemia NOS | 2.58% (4,652) | 1.87% (41,369) | 1 | Hyperlipidemia NOS | 24.47% (44,089) | 25.94% (572,760) | 2 | Packed cell transfusion | 4.49% (8.091) | 1.57% (34,669) |
| Acute and chronic systolic heart failure | 2.06% (3,708) | 0.81% (17,802) | 12 | Congestive heart failure NOS | 22.86% (41,197) | 11.82% (260,944) | 8 | Percutaneous abdominal drainage | 2.42% (4,366) | 0.86% (18,974) |
| Acute kidney failure NOS | 2.04% (3,680) | 1.16% (25,528) | 6 | Esophageal reflux | 21.19% (38,184) | 17.32% (382,511) | 3 | Venous catheter NEC | 2.13% (3,843) | 0.89% (19,718) |
| Obstructive chronic bronchitis with exacerbation | 1.76% (3,180) | 0.68% (14,957) | 14 | Diabetes mellitus NOS uncomplicated | 20.39% (36,743) | 16.75% (369,808) | 4 | Central venous catheter placement with guidewire | 2.13% (3,834)) | 0.83% (18,307) |
| Pneumonia organism NOS | 1.72% (3,091) | 1.29% (28,468) | 4 | Tobacco use disorder | 16.98% (30,604) | 16.71% (368,880) | 5 | Continuous invasive mechanical ventilation <96 consecutive hours | 1.38% (2,480) | 0.7% (15,441) |
| Urinary tract infection NOS | 1.63% (2,939) | 0.86% (19,069) | 9 | History of tobacco use | 16.89% (30,439) | 14.77% (326,026) | 6 | Noninvasive mechanical ventilation | 1.3% (2,345) | 0.58% (12,899) |
| Acute pancreatitis | 1.23% (2,212) | 0.73% (16,168) | 13 | Coronary atherosclerosis native vessel | 16.12% (29,040) | 12.88% (284,487) | 7 | Small intestine endoscopy NEC | 1.26% (2.265) | 0.7% (15,480) |
| Acute and chronic diastolic heart failure | 1.22% (2,190) | 0.48% (10,600) | 22 | Depressive disorder | 15.42% (27,785) | 10.34% (228,347) | 10 | Heart ultrasound | 1.11% (1,997) | 1.37% (30,161) |
| Complication of kidney transplant | 1.08% (1,944) | 0.42% (9,354) | 28 | Acute kidney failure NOS | 13.8% (24,859) | 9.37%% (206,951) | 12 | Esophagogastroduodenoscopy with closed biopsy | 1.09% (1,963) | 0.8% (17,644) |
Secondary diagnoses were mainly chronic conditions, including hypertension, hyperlipidemia, esophageal reflux, and diabetes mellitus type 2 (Table 1.) Combined, congestive heart failure and diabetes mellitus accounted for 43.3% of the secondary diagnoses of admissions of frequently admitted patients, but for only 28.6% of other patients. Acute kidney failure was more common in frequently admitted patients (13.8% vs 9.4% [P<0.001]). Psychiatric disorders accounted for <1% of primary diagnoses for both frequently admitted patients and all other patients. As a secondary diagnosis, depressive disorder appeared in the top 10 for both groups, although more commonly for frequently admitted patients (15.4% vs 10.3% [P<0.001]).
The most commonly performed principal procedures are also shown in Table 1. These include hemodialysis (6.32%) and packed cell transfusion (4.49%), nonoperating room procedures associated with chronic medical conditions.
Comorbidities were compared using the AHRQ comorbidity software.[18, 19] Comorbid conditions were counted once per patient, regardless of the number of admissions in which the condition was coded. Frequently admitted patients have a significantly higher mean number of comorbidities: 7.1 compared to 2.5 for all other patients (P<0.001; Figure 2). In an additional analysis using the Elixhauser comorbidity measures to determine acuity scores, the mean scores were 13.1 for frequently admitted patients and 3.17 for all others (P<0.001). The most common comorbidities were hypertension (74%), fluid and electrolyte disorders (73%), and deficiency anemias (66%). The only behavioral health comorbidity that affected more than a quarter of frequently admitted patients was depression (40% as compared to 13% for all others).
Additionally, frequently admitted patients were significantly more likely to have comorbidities of psychosis (18% vs 5% [P<0.001]), alcohol abuse (16% vs 7% [P<0.001]), and drug abuse (20% vs 7% [P<0.001]). Among hospitals, these comorbidities ranged widely: psychosis (3% 48%); alcohol abuse (3%46%); and drug abuse (3%58%). Hospitals with the highest rates (top decile) of frequently admitted patients with alcohol and drug abuse comorbidities were more likely to be safety net hospitals than those in the lowest decile (P<0.05 for each independently), but no such difference was found regarding rates of patients with psychosis.
Although the frequently admitted patient population accounted for only 1.6% of patients, they accounted for an average of 8.4% of all bed days and 7.1% of direct cost. The average cost per day was $1746, compared to $2144 for all other patients (Table 2).
| Length of Stay, Days | Direct Cost | % Total Bed Days | Cost/Day | All Other Patients Cost/Day | Difference | |
|---|---|---|---|---|---|---|
| Minimum | 1.0 | 2.3% | 3.2% | $809 | $1,005 | $(196) |
| Maximum | 86.8 | 14.1% | 15.4% | $3,208 | $4,070 | $(862) |
| Mean | 6.7 | 7.1% | 8.4% | $1,746 | $2,144 | $(398) |
| Median | 5.5 | 7.0% | 8.3% | $1,703 | $2,112 | $(410) |
DISCUSSION
An extensive analysis of the characteristics of frequently admitted patients at 101 US academic medical centers, from October 1, 2011 to September 30, 2012, revealed that these patients comprised 1.6% of all patients, but accounted for 8% of all admissions and 7% of direct costs. Relative to all other hospitalized patients, frequently admitted patients were likely to be younger, of lower socioeconomic status, in poorer health, and more often affected by mental health or substance abuse conditions that may mediate their health behaviors. However, the prevalence of patients with psychiatric or behavior conditions varied widely among hospitals, and hospitals with the highest rates of patients with substance abuse comorbidities were more likely to be safety net hospitals. Frequently admitted patients' diagnoses and procedures suggest that their admissions were related to complex chronic diseases; more than three‐quarters were admitted to medicine services, and their average length of stay was nearly 7 days. No single primary diagnosis accounted for a predominant share of their admissions; the most common diagnosis, sickle cell disease with crisis, accounted for only about 4%. The cost of their care was lower than that of other patients, reflecting the preponderance of their admissions to medicine service lines.
In many ways, frequently admitted patients seem similar to frequent ED visitors. Their visits were driven by a high disease burden associated with multiple chronic conditions, and they were heavy users of the healthcare system overall.[4, 6] The majority of both groups were insured, although there was over‐representation of public insurance.[6] As with frequent ED users, some frequently admitted patients are affected by psychiatric morbidity and substance abuse.[4, 12]
Our results in some ways confirmed, and in some ways differed from, findings of prior studies of patients with frequent hospital admissions. Although each study performed to date has defined the population differently, comparison of findings is useful. Our population was similar to the high‐admission groups identified by Nguyen et al. (patients responsible for the top decile of admissions).[13] These patients were also predominantly admitted for medical conditions, with common admitting diagnoses representing respiratory, gastrointestinal, and cardiovascular conditions. However, the median length of stay (3 days for the high‐admission/low‐cost group and 5 days for the high‐admission/high‐cost group) was lower than that of our population (5.5 days).
Hwa, who studied 29 patients admitted 6 or more times in 1 year to an inpatient medical service in San Francisco,[14] found that 55% of frequently admitted patients had a psychiatric diagnosis, higher than our patient population. Our findings are similar to those of Boonyasai et al.[15] whose serial readmitters had admissions resulting from disease progression, psychiatric illness, and substance abuse.
Our more nationally representative analysis documented a wide range of patient volumes and clinical characteristics, including psychiatric and substance abuse comorbidities, across study hospitals. It demonstrates that different approachesand resourcesare needed to meet the needs of these varied groups of patients. Each hospital must identify, evaluate, and understand its own population of frequently admitted patients to create well‐informed solutions to prevent repeat hospitalization for these patients.
Our ability to create a distinctive picture of the population of frequently admitted patients in US academic medical centers is based on access to an expansive dataset that captures complete diagnostic and demographic information on the universe of patients admitted to our member hospitals. The availability of clinical and administrative data for the entire population of patients permits both an accurate description of patient characteristics and a standardized comparison of groups. All data conform to accepted formats and definitions; their validity is universally recognized by contributing database participants.
Limitations
There are several important limitations to our study. First, patients with 5 or more admissions in 1 year may be undercounted. The UHC Clinical Data Base/Resource Manager only captures readmissions to a single facility; admissions of any patient admitted to more than 1 hospital, even within the UHC membership, cannot be determined. This could have a particularly strong effect on our ability to detect admissions of patients with acute episodes related to psychiatric illness or substance abuse, as they may be more likely to present to multiple or specialty hospitals. Additionally, readmission rates vary among UHC‐member hospitals, based to some extent on geography and the availability of alternative settings of care.
It is possible that surveillance bias played a role in our finding that frequently admitted patients have a significantly higher mean number of comorbidities; each admission presents an opportunity to document additional comorbid conditions. Psychiatric conditions may be underdocumented in medical settings in academic medical centers, where the focus is often on acute medical conditions. Additionally, certain data elements that we believe are central to understanding the characteristics of frequently admitted patients are not part of the UHC Clinical Data Base/Resource Manager and were therefore not a part of our analysis. These highly influential upstream determinants of health include documentation of a primary care physician, housing status, and access to services at discharge.
CONCLUSION
The valuable information reported from analysis of nearly 2 million patients in the UHC Clinical Data Base/Resource Manager can be used to better understand the characteristics of frequently admitted patients. This important cohort of individuals has complex care needs that often result in hospitalization, but may be amenable to solutions that allow patients to remain in their communities. By understanding the demographic, social, and medical characteristics of these patients, hospitals can develop and implement solutions that address the needs of this small group of patients who consume a highly disproportionate share of healthcare resources.
Acknowledgements
The authors acknowledge the contributions of Samuel F. Hohmann, PhD, and Ryan Carroll, MBA, who provided expert statistical analyses and generous assistance in the completion of this article.
Disclosure: Nothing to report.
- Centers for Medicare 21(9):117–120.
- , , , . The influence of a postdischarge intervention on reducing hospital readmissions in a Medicare population. Popul Health Manag. 2013;16(5):310–316.
- , . Dispelling an urban legend: frequent emergency department users have substantial burden of disease. Health Aff (Millwood). 2013;32:2099–2108.
- , , , et al. Effectiveness of interventions targeting frequent users of emergency departments: a systematic review. Ann Emerg Med. 2011;58:41–52.
- , . Frequent users of emergency departments: the myths, the data, and the policy implications. Ann Emerg Med. 2010;20(10):1–8.
- , , , . Development and validation of a model for predicting emergency admissions over the next year. Arch Intern Med. 2008;168:1416–1422.
- , , , et al. A comparison of frequent and infrequent visitors to an urban emergency department. J Emerg Med. 2008;38:115–121.
- , . Frequent users of Massachusetts emergency departments: a statewide analysis. Ann Emerg Med. 2006;48:9–16.
- , , , et al. A descriptive study of heavy emergency department users at an academic emergency department reveals heavy users have better access to care than average users. J Emerg Nurs. 2005;31:139–144.
- , , . Predictors and outcomes of frequent emergency department users. Acad Emerg Med. 2003;10:320–328.
- , , . Epidemiologic analysis of an urban, public emergency department's frequent users. Acad Emerg Med. 2000;7:637–646.
- , , , . What's cost got to do with it? Association between hospital costs and frequency of admissions among “high users” of hospital care. J Hosp Med. 2013;8:665–671.
- . Characteristics of a frequently readmitted patient population on an inpatient medical service. Abstract presented at: Society of Hospital Medicine Annual Meeting, April 1– 4, 2012; San Diego, CA.
- , , , , . Characteristics of isolated and serial rehospitalizations suggest a need for different types of improvement strategies [abstract] J Hosp Med. 2012;7(suppl 2):513.
- , , , , . An intervention to improve care and reduce costs for high‐risk patients with frequent hospital admissions: a pilot study. BMC Health Serv Res. 2011;11:270–279.
- Centers for Disease Control and Prevention. International Classification of Diseases, Ninth Revision (ICD‐9). Available at: http://www.cdc.gov/nchs/icd/icd9.htm. Accessed February 18, 2015.
- Agency for Healthcare Research and Quality, Healthcare Cost and Utilization Project. Comorbidity software, version 3.7. Available at: http://www.hcup‐us.ahrq.gov/toolssoftware/comorbidity/comorbidity.jsp. Accessed February 18, 2015.
- , , , . Comorbidity measures for use with administrative data. Med Care. 1998;36:8–27.
- , , , , . A modification of the Elixhauser comorbidity measures into a point system for hospital death using administrative data. Med Care. 2009;47:626–633.
© 2015 The Authors Journal of Hospital Medicine published by Wiley Periodicals, Inc. on behalf of Society of Hospital Medicine