User login
Utilizing Telesimulation for Advanced Skills Training in Consultation and Handoff Communication: A Post-COVID-19 GME Bootcamp Experience
Events requiring communication among and within teams are vulnerable points in patient care in hospital medicine, with communication failures representing important contributors to adverse events.1-4 Consultations and handoffs are exceptionally common inpatient practices, yet training in these practices is variable across educational and practice domains.5,6 Advanced inpatient communication-skills training requires an effective, feasible, and scalable format. Simulation-based bootcamps can effectively support clinical skills training, often in procedural domains, and have been increasingly utilized for communication skills.7,8 We previously described the development and implementation of an in-person bootcamp for training and feedback in consultation and handoff communication.5,8
As hospitalist leaders grapple with how to systematically support and assess essential clinical skills, the COVID-19 pandemic has presented another impetus to rethink current processes. The rapid shift to virtual activities met immediate needs of the pandemic, but also inspired creativity in applying new methodologies to improve teaching strategies and implementation long-term.9,10 One such strategy, telesimulation, offers a way to continue simulation-based training limited by the need for physical distancing.10 Furthermore, recent calls to study the efficacy of virtual bootcamp structures have acknowledged potential benefits, even outside of the pandemic.11
The primary objective of this feasibility study was to convert our previously described consultation and handoff bootcamp to a telesimulation bootcamp (TBC), preserving rigorous performance evaluation and opportunities for skills-based feedback. We additionally compared evaluation between virtual and in-person formats to understand the utility of telesimulation for bootcamp-based clinical education moving forward.
METHODS
Setting and Participants
The TBC occurred in June 2020 during the University of Chicago institution-wide graduate medical education (GME) orientation; 130 interns entering 13 residency programs participated. The comparison group was 128 interns who underwent the traditional University of Chicago GME orientation “Advanced Communication Skills Bootcamp” (ACSBC) in 2019.5,8
Program Description
To develop TBC, we adapted observed structured clinical experiences (OSCEs) created for ACSBC. Until 2020, ACSBC included three in-person OSCEs: (1) requesting a consultation; (2) conducting handoffs; and (3) acquiring informed consent. COVID-19 necessitated conversion of ACSBC to virtual in June 2020. For this, we selected the consultation and handoff OSCEs, as these skills require near-universal and immediate application in clinical practice. Additionally, they required only trained facilitators (TFs), whereas informed consent required standardized patients. Hospitalist and emergency medicine faculty were recruited as TFs; 7 of 12 TFs were hospitalists. Each OSCE had two parts: an asynchronous, mandatory training module and a clinical simulation. For TBC, we adapted the simulations, previously separate experiences, into a 20-minute combined handoff/consultation telesimulation using the Zoom® video platform. Interns were paired with one TF who served as both standardized consultant (for one mock case) and handoff receiver (for three mock cases, including the consultation case). TFs rated intern performance and provided feedback.
TBC occurred on June 17 and 18, 2020. Interns were emailed asynchronous modules on June 1, and mock cases and instructions on June 12. When TBC began, GME staff proctors oriented interns in the Zoom® platform. Proctors placed TFs into private breakout rooms into which interns rotated through 20-minute timeslots. Faculty received copies of all TBC materials for review (Appendix 1) and underwent Zoom®-based training 1 to 2 weeks prior.
We evaluated TBC using several methods: (1) consultation and handoff skills performance measured by two validated checklists5,8; (2) survey of intern self-reported preparedness to practice consultations and handoffs; and (3) survey of intern satisfaction. Surveys were administered both immediately post bootcamp (Appendix 2) and 8 weeks into internship (Appendix 3). Skills performance checklists were a 12-item consultation checklist5 and 6-item handoff checklist.8 The handoff checklist was modified to remove activities impossible to assess virtually (ie, orienting sign-outs in a shared space) and to add a three-level rating scale of “outstanding,” “satisfactory,” and “needs improvement.” This was done based on feedback from ACSBC to allow more nuanced feedback for interns. A rating of “outstanding” was used to define successful completion of the item (Appendix 1). Interns rated preparedness and satisfaction on 5-point Likert-type items. All measures were compared to the 2019 in-person ACSBC cohort.
Data Analysis
Stata 16.1 (StataCorp LP) was used for analysis. We dichotomized preparedness and satisfaction scores, defining ratings of “4” or “5” as “prepared” or “satisfied.” As previously described,5 we created a composite score averaging both checklist scores for each intern. We normalized this score by rater to a z score (mean, 0; SD, 1) to account for rater differences. “Poor” and “outstanding” performances were defined as z scores below and above 1 SD, respectively. Fisher’s exact test was used to compare proportions, and Pearson correlation test to correlate z scores. The University of Chicago Institutional Review Board granted exemption.
RESULTS
All 130 entering interns participated in TBC. Internal medicine (IM) was the largest specialty (n = 37), followed by pediatrics (n = 22), emergency medicine (EM) (n = 16), and anesthesiology (n = 12). The remaining 9 programs ranged from 2 to 10 interns per program. The 128 interns in ACSBC were similar, including 40 IM, 23 pediatrics, 14 EM, and 12 anesthesia interns, with 2 to 10 interns in remaining programs.
TBC skills performance evaluations were compared to ACSBC (Table 1). The TBC intern cohort’s consultation performance was the same or better than the ACSBC intern cohort’s. For handoffs, TBC interns completed significantly fewer checklist items compared to ACSBC. Performance in each exercise was moderately correlated (r = 0.39, P < .05). For z scores, 14 TBC interns (10.8%) had “outstanding” and 15 (11.6%) had “poor” performances, compared to ACSBC interns with 7 (5.5%) “outstanding” and 10 (7.81%) “poor” performances (P = .15).

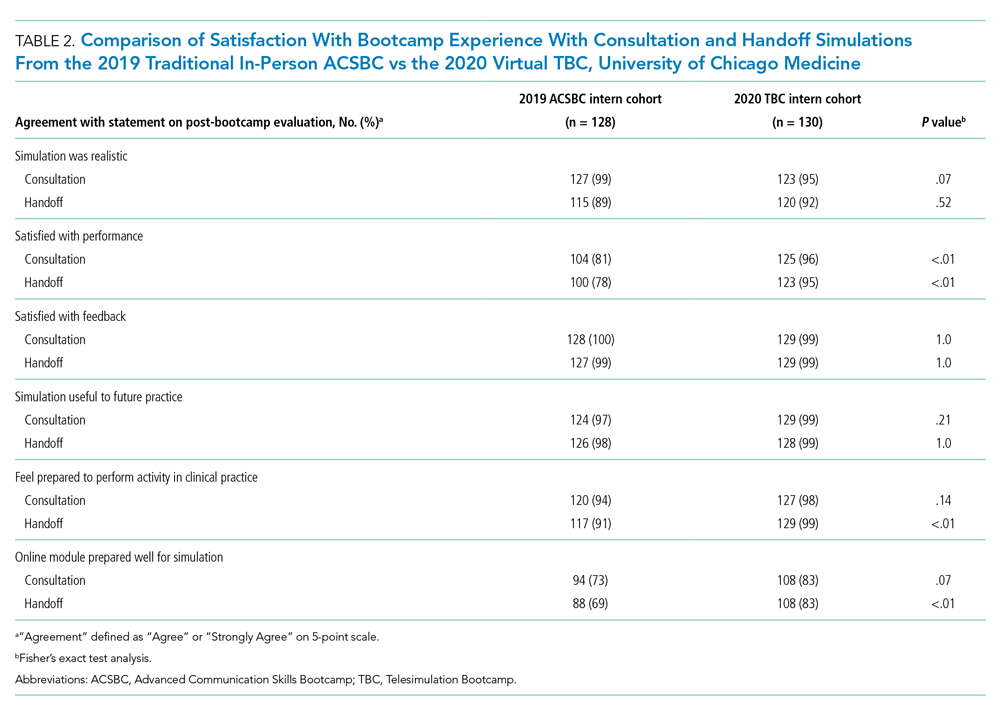
All 130 interns (100%) completed the immediate post-TBC survey. Overall, TBC satisfaction was comparable to ACSBC, and significantly improved for satisfaction with performance (Table 2). Compared to ACSBC, TBC interns felt more prepared for simulation and handoff clinical practice. Nearly all interns would recommend TBC (99% vs 96% of ACSBC interns, P = 0.28), and 99% felt the software used for the simulation ran smoothly.
The 8-week post-TBC survey had a response rate of 88% (115/130); 69% of interns reported conducting more effective handoffs due to TBC, and 79% felt confident in handoff skills. Similarly, 73% felt more effective at calling consultations, and 75% reported retained knowledge of consultation frameworks taught during TBC. Additionally, 71% of interns reported that TBC helped identify areas for self-directed improvement. There were no significant differences in 8-week postsurvey ratings between ACSBC and TBC.
DISCUSSION
In converting the advanced communication skills bootcamp from an in-person to a virtual format, telesimulation was well-received by interns and rated similarly to in-person bootcamp in most respects. Nearly all interns agreed the experience was realistic, provided useful feedback, and prepared them for clinical practice. Although we shifted to virtual out of necessity, our results demonstrate a high-quality, streamlined bootcamp experience that was less labor-intensive for interns, staff, and faculty. Telesimulation may represent an effective strategy beyond the COVID-19 pandemic to increase ease of administration and scale the use of bootcamps in supporting advanced clinical skill training for hospital-based practice.
TBC interns felt better prepared for simulation and more satisfied with their performance than ACSBC interns, potentially due to the revised format. The mock cases were adapted and consolidated for TBC, such that the handoff and consultation simulations shared a common case, whereas previously they were separate. Thus, intern preparation for TBC required familiarity with fewer overall cases. Ultimately, TBC maintained the quality of training but required review of less information.
In comparing performance, TBC interns were rated as well or better during consultation simulation compared to ASCBC, but handoffs were rated lower. This was likely due to the change in the handoff checklist from a dichotomous to a three-level rating scale. This change was made after receiving feedback from ACSBC TFs that a rating scale allowing for more nuance was needed to provide adequate feedback to interns. Although we defined handoff item completion for TBC interns as being rated “outstanding,” if the top two rankings, “outstanding” and “satisfactory,” are dichotomized to reflect completion, TBC handoff performance is equivalent or better than ACSBC. TF recruitment additionally differed between TBC and ACSBC cohorts. In ACSBC, resident physicians served as handoff TFs, whereas only faculty were recruited for TBC. Faculty were primarily clinically active hospitalists, whose expertise in handoffs may resulted in more stringent performance ratings, contributing to differences seen.
Hospitalist groups require clinicians to be immediately proficient in essential communication skills like consultation and handoffs, potentially requiring just-in-time training and feedback for large cohorts.12 Bootcamps can meet this need but require participation and time investment by many faculty members, staff, and administrators.5,8 Combining TBC into one virtual handoff/consultation simulation required recruitment and training of 50% fewer TFs and reduced administrative burden. ACSBC consultation simulations were high-fidelity but resource-heavy, requiring reliable two-way telephones with reliable connections and separate spaces for simulation and feedback.5 Conversely, TBC only required consultations to be “called” via audio-only Zoom® discussion, then both individuals turned on cameras for feedback. The slight decrease in perceived fidelity was certainly outweighed by ease of administration. TBC’s more efficient and less labor-intensive format is an appealing strategy for hospitalist groups looking to train up clinicians, including those operating across multiple or geographically distant sites.
Our study has limitations. It occurred with one group of learners at a single site with consistent consultation and handoff communication practices, which may not be the case elsewhere. Our comparison group was a separate cohort, and groups were not randomized; thus, differences seen may reflect inherent dissimilarities in these groups. Changes to the handoff checklist rating scale between 2019 and 2020 additionally may limit the direct comparison of handoff performance between cohorts. While overall fewer resources were required, TBC implementation did require time and institutional support, along with full virtual platform capability without user or time limitations. Our preparedness outcomes were self-reported without direct measurement of clinical performance, which is an area for future work.
We describe a feasible implementation of an adapted telesimulation communication bootcamp, with comparison to a previous in-person cohort’s skills performance and satisfaction. While COVID-19 has made the future of in-person training activities uncertain, it also served as a catalyst for educational innovation that may be sustained beyond the pandemic. Although developed out of necessity, the telesimulation communication bootcamp was effective and well-received. Telesimulation represents an opportunity for hospital medicine groups to implement advanced communication skills training and assessment in a more efficient, flexible, and potentially preferable way, even after the pandemic ends.
Acknowledgments
The authors thank the staff at the University of Chicago Office of Graduate Medical Education and the UChicago Medicine Simulation Center.
1. Sutcliffe KM, Lewton E, Rosenthal MM. Communication failures: an insidious contributor to medical mishaps. Acad Med. 2004;79(2):186-194. https://doi.org/ 10.1097/00001888-200402000-00019
2. Inadequate hand-off communication. Sentinel Event Alert. 2017;(58):1-6.
3. Horwitz LI, Meredith T, Schuur JD, Shah NR, Kulkarni RG, Jenq JY. Dropping the baton: a qualitative analysis of failures during the transition from emergency department to inpatient care. Ann Emerg Med. 2009;53(6):701-710. https://doi.org/ 10.1016/j.annemergmed.2008.05.007
4. Jagsi R, Kitch BT, Weinstein DF, Campbell EG, Hutter M, Weissman JS. Residents report on adverse events and their causes. Arch Intern Med. 2005;165(22):2607-2613. https://doi.org/10.1001/archinte.165.22.2607
5. Martin SK, Carter K, Hellerman N, et al. The consultation observed simulated clinical experience: training, assessment, and feedback for incoming interns on requesting consultations. Acad Med. 2018; 93(12):1814-1820. https://doi.org/10.1097/ACM.0000000000002337
6. Lopez MA, Campbell J. Developing a communication curriculum for primary and consulting services. Med Educ Online. 2020;25(1):1794341. https://doi.org/10.1080/10872981.2020
7. Cohen, ER, Barsuk JH, Moazed F, et al. Making July safer: simulation-based mastery learning during intern bootcamp. Acad Med. 2013;88(2):233-239. https://doi.org/10.1097/ACM.0b013e31827bfc0a
8. Gaffney S, Farnan JM, Hirsch K, McGinty M, Arora VM. The Modified, Multi-patient Observed Simulated Handoff Experience (M-OSHE): assessment and feedback for entering residents on handoff performance. J Gen Intern Med. 2016;31(4):438-441. https://doi.org/10.1007/s11606-016-3591-8.
9. Woolliscroft, J. Innovation in response to the COVID-19 pandemic crisis. Acad Med. 2020;95(8):1140-1142. https://doi.org/10.1097/ACM.0000000000003402.
10. Anderson ML, Turbow S, Willgerodt MA, Ruhnke G. Education in a crisis: the opportunity of our lives. J Hosp. Med 2020;5;287-291. https://doi.org/10.12788/jhm.3431
11. Farr DE, Zeh HJ, Abdelfattah KR. Virtual bootcamps—an emerging solution to the undergraduate medical education-graduate medical education transition. JAMA Surg. 2021;156(3):282-283. https://doi.org/10.1001/jamasurg.2020.6162
12. Hepps JH, Yu CE, Calaman S. Simulation in medical education for the hospitalist: moving beyond the mock code. Pediatr Clin North Am. 2019;66(4):855-866. https://doi.org/10.1016/j.pcl.2019.03.014
Events requiring communication among and within teams are vulnerable points in patient care in hospital medicine, with communication failures representing important contributors to adverse events.1-4 Consultations and handoffs are exceptionally common inpatient practices, yet training in these practices is variable across educational and practice domains.5,6 Advanced inpatient communication-skills training requires an effective, feasible, and scalable format. Simulation-based bootcamps can effectively support clinical skills training, often in procedural domains, and have been increasingly utilized for communication skills.7,8 We previously described the development and implementation of an in-person bootcamp for training and feedback in consultation and handoff communication.5,8
As hospitalist leaders grapple with how to systematically support and assess essential clinical skills, the COVID-19 pandemic has presented another impetus to rethink current processes. The rapid shift to virtual activities met immediate needs of the pandemic, but also inspired creativity in applying new methodologies to improve teaching strategies and implementation long-term.9,10 One such strategy, telesimulation, offers a way to continue simulation-based training limited by the need for physical distancing.10 Furthermore, recent calls to study the efficacy of virtual bootcamp structures have acknowledged potential benefits, even outside of the pandemic.11
The primary objective of this feasibility study was to convert our previously described consultation and handoff bootcamp to a telesimulation bootcamp (TBC), preserving rigorous performance evaluation and opportunities for skills-based feedback. We additionally compared evaluation between virtual and in-person formats to understand the utility of telesimulation for bootcamp-based clinical education moving forward.
METHODS
Setting and Participants
The TBC occurred in June 2020 during the University of Chicago institution-wide graduate medical education (GME) orientation; 130 interns entering 13 residency programs participated. The comparison group was 128 interns who underwent the traditional University of Chicago GME orientation “Advanced Communication Skills Bootcamp” (ACSBC) in 2019.5,8
Program Description
To develop TBC, we adapted observed structured clinical experiences (OSCEs) created for ACSBC. Until 2020, ACSBC included three in-person OSCEs: (1) requesting a consultation; (2) conducting handoffs; and (3) acquiring informed consent. COVID-19 necessitated conversion of ACSBC to virtual in June 2020. For this, we selected the consultation and handoff OSCEs, as these skills require near-universal and immediate application in clinical practice. Additionally, they required only trained facilitators (TFs), whereas informed consent required standardized patients. Hospitalist and emergency medicine faculty were recruited as TFs; 7 of 12 TFs were hospitalists. Each OSCE had two parts: an asynchronous, mandatory training module and a clinical simulation. For TBC, we adapted the simulations, previously separate experiences, into a 20-minute combined handoff/consultation telesimulation using the Zoom® video platform. Interns were paired with one TF who served as both standardized consultant (for one mock case) and handoff receiver (for three mock cases, including the consultation case). TFs rated intern performance and provided feedback.
TBC occurred on June 17 and 18, 2020. Interns were emailed asynchronous modules on June 1, and mock cases and instructions on June 12. When TBC began, GME staff proctors oriented interns in the Zoom® platform. Proctors placed TFs into private breakout rooms into which interns rotated through 20-minute timeslots. Faculty received copies of all TBC materials for review (Appendix 1) and underwent Zoom®-based training 1 to 2 weeks prior.
We evaluated TBC using several methods: (1) consultation and handoff skills performance measured by two validated checklists5,8; (2) survey of intern self-reported preparedness to practice consultations and handoffs; and (3) survey of intern satisfaction. Surveys were administered both immediately post bootcamp (Appendix 2) and 8 weeks into internship (Appendix 3). Skills performance checklists were a 12-item consultation checklist5 and 6-item handoff checklist.8 The handoff checklist was modified to remove activities impossible to assess virtually (ie, orienting sign-outs in a shared space) and to add a three-level rating scale of “outstanding,” “satisfactory,” and “needs improvement.” This was done based on feedback from ACSBC to allow more nuanced feedback for interns. A rating of “outstanding” was used to define successful completion of the item (Appendix 1). Interns rated preparedness and satisfaction on 5-point Likert-type items. All measures were compared to the 2019 in-person ACSBC cohort.
Data Analysis
Stata 16.1 (StataCorp LP) was used for analysis. We dichotomized preparedness and satisfaction scores, defining ratings of “4” or “5” as “prepared” or “satisfied.” As previously described,5 we created a composite score averaging both checklist scores for each intern. We normalized this score by rater to a z score (mean, 0; SD, 1) to account for rater differences. “Poor” and “outstanding” performances were defined as z scores below and above 1 SD, respectively. Fisher’s exact test was used to compare proportions, and Pearson correlation test to correlate z scores. The University of Chicago Institutional Review Board granted exemption.
RESULTS
All 130 entering interns participated in TBC. Internal medicine (IM) was the largest specialty (n = 37), followed by pediatrics (n = 22), emergency medicine (EM) (n = 16), and anesthesiology (n = 12). The remaining 9 programs ranged from 2 to 10 interns per program. The 128 interns in ACSBC were similar, including 40 IM, 23 pediatrics, 14 EM, and 12 anesthesia interns, with 2 to 10 interns in remaining programs.
TBC skills performance evaluations were compared to ACSBC (Table 1). The TBC intern cohort’s consultation performance was the same or better than the ACSBC intern cohort’s. For handoffs, TBC interns completed significantly fewer checklist items compared to ACSBC. Performance in each exercise was moderately correlated (r = 0.39, P < .05). For z scores, 14 TBC interns (10.8%) had “outstanding” and 15 (11.6%) had “poor” performances, compared to ACSBC interns with 7 (5.5%) “outstanding” and 10 (7.81%) “poor” performances (P = .15).
All 130 interns (100%) completed the immediate post-TBC survey. Overall, TBC satisfaction was comparable to ACSBC, and significantly improved for satisfaction with performance (Table 2). Compared to ACSBC, TBC interns felt more prepared for simulation and handoff clinical practice. Nearly all interns would recommend TBC (99% vs 96% of ACSBC interns, P = 0.28), and 99% felt the software used for the simulation ran smoothly.
The 8-week post-TBC survey had a response rate of 88% (115/130); 69% of interns reported conducting more effective handoffs due to TBC, and 79% felt confident in handoff skills. Similarly, 73% felt more effective at calling consultations, and 75% reported retained knowledge of consultation frameworks taught during TBC. Additionally, 71% of interns reported that TBC helped identify areas for self-directed improvement. There were no significant differences in 8-week postsurvey ratings between ACSBC and TBC.
DISCUSSION
In converting the advanced communication skills bootcamp from an in-person to a virtual format, telesimulation was well-received by interns and rated similarly to in-person bootcamp in most respects. Nearly all interns agreed the experience was realistic, provided useful feedback, and prepared them for clinical practice. Although we shifted to virtual out of necessity, our results demonstrate a high-quality, streamlined bootcamp experience that was less labor-intensive for interns, staff, and faculty. Telesimulation may represent an effective strategy beyond the COVID-19 pandemic to increase ease of administration and scale the use of bootcamps in supporting advanced clinical skill training for hospital-based practice.
TBC interns felt better prepared for simulation and more satisfied with their performance than ACSBC interns, potentially due to the revised format. The mock cases were adapted and consolidated for TBC, such that the handoff and consultation simulations shared a common case, whereas previously they were separate. Thus, intern preparation for TBC required familiarity with fewer overall cases. Ultimately, TBC maintained the quality of training but required review of less information.
In comparing performance, TBC interns were rated as well or better during consultation simulation compared to ASCBC, but handoffs were rated lower. This was likely due to the change in the handoff checklist from a dichotomous to a three-level rating scale. This change was made after receiving feedback from ACSBC TFs that a rating scale allowing for more nuance was needed to provide adequate feedback to interns. Although we defined handoff item completion for TBC interns as being rated “outstanding,” if the top two rankings, “outstanding” and “satisfactory,” are dichotomized to reflect completion, TBC handoff performance is equivalent or better than ACSBC. TF recruitment additionally differed between TBC and ACSBC cohorts. In ACSBC, resident physicians served as handoff TFs, whereas only faculty were recruited for TBC. Faculty were primarily clinically active hospitalists, whose expertise in handoffs may resulted in more stringent performance ratings, contributing to differences seen.
Hospitalist groups require clinicians to be immediately proficient in essential communication skills like consultation and handoffs, potentially requiring just-in-time training and feedback for large cohorts.12 Bootcamps can meet this need but require participation and time investment by many faculty members, staff, and administrators.5,8 Combining TBC into one virtual handoff/consultation simulation required recruitment and training of 50% fewer TFs and reduced administrative burden. ACSBC consultation simulations were high-fidelity but resource-heavy, requiring reliable two-way telephones with reliable connections and separate spaces for simulation and feedback.5 Conversely, TBC only required consultations to be “called” via audio-only Zoom® discussion, then both individuals turned on cameras for feedback. The slight decrease in perceived fidelity was certainly outweighed by ease of administration. TBC’s more efficient and less labor-intensive format is an appealing strategy for hospitalist groups looking to train up clinicians, including those operating across multiple or geographically distant sites.
Our study has limitations. It occurred with one group of learners at a single site with consistent consultation and handoff communication practices, which may not be the case elsewhere. Our comparison group was a separate cohort, and groups were not randomized; thus, differences seen may reflect inherent dissimilarities in these groups. Changes to the handoff checklist rating scale between 2019 and 2020 additionally may limit the direct comparison of handoff performance between cohorts. While overall fewer resources were required, TBC implementation did require time and institutional support, along with full virtual platform capability without user or time limitations. Our preparedness outcomes were self-reported without direct measurement of clinical performance, which is an area for future work.
We describe a feasible implementation of an adapted telesimulation communication bootcamp, with comparison to a previous in-person cohort’s skills performance and satisfaction. While COVID-19 has made the future of in-person training activities uncertain, it also served as a catalyst for educational innovation that may be sustained beyond the pandemic. Although developed out of necessity, the telesimulation communication bootcamp was effective and well-received. Telesimulation represents an opportunity for hospital medicine groups to implement advanced communication skills training and assessment in a more efficient, flexible, and potentially preferable way, even after the pandemic ends.
Acknowledgments
The authors thank the staff at the University of Chicago Office of Graduate Medical Education and the UChicago Medicine Simulation Center.
1. Sutcliffe KM, Lewton E, Rosenthal MM. Communication failures: an insidious contributor to medical mishaps. Acad Med. 2004;79(2):186-194. https://doi.org/ 10.1097/00001888-200402000-00019
2. Inadequate hand-off communication. Sentinel Event Alert. 2017;(58):1-6.
3. Horwitz LI, Meredith T, Schuur JD, Shah NR, Kulkarni RG, Jenq JY. Dropping the baton: a qualitative analysis of failures during the transition from emergency department to inpatient care. Ann Emerg Med. 2009;53(6):701-710. https://doi.org/ 10.1016/j.annemergmed.2008.05.007
4. Jagsi R, Kitch BT, Weinstein DF, Campbell EG, Hutter M, Weissman JS. Residents report on adverse events and their causes. Arch Intern Med. 2005;165(22):2607-2613. https://doi.org/10.1001/archinte.165.22.2607
5. Martin SK, Carter K, Hellerman N, et al. The consultation observed simulated clinical experience: training, assessment, and feedback for incoming interns on requesting consultations. Acad Med. 2018; 93(12):1814-1820. https://doi.org/10.1097/ACM.0000000000002337
6. Lopez MA, Campbell J. Developing a communication curriculum for primary and consulting services. Med Educ Online. 2020;25(1):1794341. https://doi.org/10.1080/10872981.2020
7. Cohen, ER, Barsuk JH, Moazed F, et al. Making July safer: simulation-based mastery learning during intern bootcamp. Acad Med. 2013;88(2):233-239. https://doi.org/10.1097/ACM.0b013e31827bfc0a
8. Gaffney S, Farnan JM, Hirsch K, McGinty M, Arora VM. The Modified, Multi-patient Observed Simulated Handoff Experience (M-OSHE): assessment and feedback for entering residents on handoff performance. J Gen Intern Med. 2016;31(4):438-441. https://doi.org/10.1007/s11606-016-3591-8.
9. Woolliscroft, J. Innovation in response to the COVID-19 pandemic crisis. Acad Med. 2020;95(8):1140-1142. https://doi.org/10.1097/ACM.0000000000003402.
10. Anderson ML, Turbow S, Willgerodt MA, Ruhnke G. Education in a crisis: the opportunity of our lives. J Hosp. Med 2020;5;287-291. https://doi.org/10.12788/jhm.3431
11. Farr DE, Zeh HJ, Abdelfattah KR. Virtual bootcamps—an emerging solution to the undergraduate medical education-graduate medical education transition. JAMA Surg. 2021;156(3):282-283. https://doi.org/10.1001/jamasurg.2020.6162
12. Hepps JH, Yu CE, Calaman S. Simulation in medical education for the hospitalist: moving beyond the mock code. Pediatr Clin North Am. 2019;66(4):855-866. https://doi.org/10.1016/j.pcl.2019.03.014
© 2021 Society of Hospital Medicine
The Alarm Burden of Excess Continuous Pulse Oximetry Monitoring Among Patients With Bronchiolitis
Practice guidelines discourage continuous pulse oximetry (SpO2) monitoring of patients with bronchiolitis who are not receiving supplemental oxygen.1,2 Overuse of SpO2 monitoring in this patient population has been associated with increased length of stay, unnecessary oxygen therapy, and excess hospital costs, without measurable patient benefit.3-5 In spite of this evidence base and expert guidance, nearly half of the more than 100,000 infants admitted for bronchiolitis each year receive excess SpO2 monitoring.6,7
Bronchiolitis guidelines suggest that guideline-discordant SpO2 monitoring may result in excess alarms, which disrupt families’ sleep and engender alarm fatigue among staff.1 Pediatric nurses receive up to 155 alarms per monitored patient per day.8,9 Frequent alarms are associated with slower nurse response times10,11 and increased nurse subjective workload.12
Methods
Cohort
We retrospectively evaluated SpO2 monitoring patterns and alarm rates of children 0 to 24 months old admitted to a general pediatrics service at a tertiary care children’s hospital. We included patients who had a discharge diagnosis of bronchiolitis (International Classification of Diseases, Tenth Revision codes J45x, T17.2x, T17.3x, T17.4x, T17.5x, T17.8x, T17.9x, A37xx, J04x, J05x, J05.1x, J69.0x, J69.1x, J69.8x) between November 24, 2019, and January 21, 2020, the period of time during which alarm data and monitor data were concurrently available for analysis. In order to conservatively assure applicability of clinical practice guidelines, we excluded patients with discharge diagnoses that included other respiratory conditions (eg, reactive airway disease), patients with complex chronic conditions (CCC) as defined by the CCC version 2 classification system,13 and patients with intensive care unit (ICU) stays during the admission.
Time
Flowsheet data detailing nursing respiratory assessments were extracted from the electronic health record (EHR) database (Clarity, Epic Systems). Using previously validated methodology,14 we identified minutes during which patients received supplemental oxygen or high-flow nasal cannula (supplemental oxygen) based on the documented fraction of inspired oxygen (FiO2), flow rate, and support devices. We then identified the final discontinuation of respiratory support during the hospital admission, and censored the 60 minutes after final discontinuation of supplemental oxygen based upon recent monitoring guidelines.2 Minutes up to an hour after supplemental oxygen discontinuation were classified as receiving supplemental oxygen and not included in our analysis. Only minutes between the end of the censored period and hospital discharge were used in the analysis. For patients who never received respiratory support during the admission, we censored the first 60 minutes of the admission and analyzed the remainder of their stay.
SpO2 Monitoring
We used device-integrated, physiologic-monitor, vital sign data sent each minute from the General Electric monitor network to the EHR to identify minutes during which patients were connected to physiologic monitors and transmitting signals from SpO2 sensors. We extracted minute-level SpO2 data from the hospital clinical data warehouse (CDW). Minutes in which SpO2 data were present were classified as “monitored,” an approach previously validated using in-person observation.14
To categorize time as “not receiving supplemental oxygen and continuously monitored (guideline-discordant monitoring),” or “not receiving supplemental oxygen and not continuously monitored (guideline-concordant intermittent measurement),” we evaluated the percent of minutes within an hour during which the patient received SpO2 monitoring and applied an a priori conservative rule. Hours during which ≥90% of minutes had SpO2 monitoring data were classified as “continuously monitored.” Hours during which ≤10% of minutes had SpO2 monitoring data were classified as “intermittently measured.” Hours during which 11% to 89% of minutes included monitor data were excluded from further analysis. The number of continuously monitored hours was tabulated for each patient. The median number of continuously monitored hours was computed; results were stratified by prior receipt of respiratory support.
Alarm Counts
Minute-level monitor alarm counts (the absolute number of abnormal vital signs that triggered a monitor to alarm) were extracted from the CDW. Alarm counts were tabulated for each patient hour. For each patient, the alarm rate (total number of alarms divided by time) was computed for continuously monitored and intermittently measured time. Results were stratified by prior receipt of respiratory support.
The study was reviewed by the institutional review board and determined to meet exemption criteria.
Results
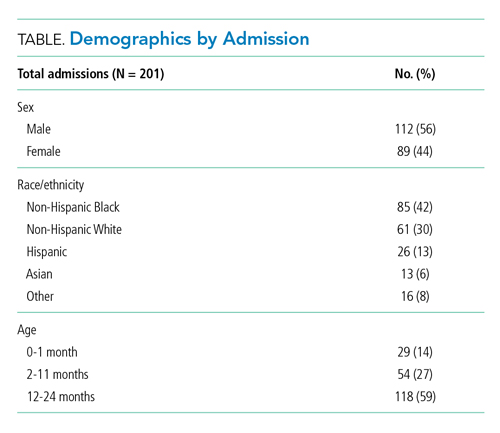
Our cohort included 201 admissions by 197 unique patients (Table). We evaluated 4402 hours that occurred ≥60 minutes following final discontinuation of supplemental oxygen, the time period during which guidelines discourage routine use of continuous SpO2 monitoring. This represented a median of 19 hours (interquartile range [IQR], 14-25) per admission. We excluded 474 hours (11%) that could not be classified as either continuously or intermittently measured.
During time ≥60 minutes following discontinuation of supplemental oxygen, our cohort experienced 1537 hours of guideline-discordant continuous monitoring, a median of 6 hours (IQR, 3-12) per admission. Patients experienced a median of 12 hours (IQR, 5-17) of intermittent measurement. Among patients who received supplemental oxygen, 91% experienced guideline-discordant continuous SpO2 monitoring, as compared to 68% of patients who did not receive supplemental oxygen. Among those who received guideline-discordant continuous SpO2 monitoring, the duration of this monitoring did not differ significantly between those who had received supplemental oxygen during the admission and those who had not.
During classifiable time ≥60 minutes following discontinuation of supplemental oxygen, our cohort experienced 14,371 alarms; 77% (11,101) of these alarms were generated during periods of guideline-discordant continuous monitoring. The median hourly alarm rate during these periods of guideline-discordant continuous monitoring was 6.7 alarms per hour (IQR, 2.1-12.3), representing a median of 35 (IQR, 10-81) additional alarms per patient. During periods of guideline-concordant intermittent measurement, the median hourly alarm rate was 0.5 (IQR, 0.1-0.8), with a median of 5 (IQR, 1-13) alarms per patient.
Those who received supplemental oxygen earlier in the admission had higher alarm rates during continuously monitored time (7.3 per hour [IQR, 2.7-12.7]) than patients who had not received supplemental oxygen (3.3 per hour [IQR, 0.6-11.8]), likely reflecting clinical differences between these patient populations. The most frequent alarm type among continuously monitored patients who had previously received supplemental oxygen was “SpO2 low.”
Discussion
Across 4402 patient hours, guideline-discordant continuous SpO2 monitoring of patients with bronchiolitis resulted in 11,101 alarms, at a rate of approximately 1 additional alarm every 9 minutes. Patients in our cohort received a median of 6 hours of guideline-discordant monitoring, which imposes a significant alarm burden that is potentially modifiable using targeted reduction strategies.15
Transient, self-resolved hypoxemia is a common feature of bronchiolitis and likely of little clinical consequence.16 Therefore, this rate of hypoxemia alarms is not unexpected. Though we evaluated only the period of time following final discontinuation of respiratory support, this finding is in keeping with the literature associating excess physiologic monitoring of patients with bronchiolitis with unnecessary oxygen therapy and increased length of stay,3-5 largely because clinicians may feel compelled to respond to hypoxemia alarms with either supplemental oxygen or longer monitoring.
Our findings must be contextualized in light of the limitations of our approach. We did not evaluate nurse workload associated with guideline-discordant continuous SpO2 monitoring. Prior work conducted by our lab has demonstrated that when nurses experience more than 40 alarms within a 2-hour period, their measured subjective workload increases to a degree associated with missing important tasks, threatening the quality and safety of the care they deliver.12,17 Given that nurses care for multiple patients, it is likely that the excess alarms introduced by guideline-discordant continuous monitoring contribute to increased nurse workload and alarm fatigue.
Similarly, we could not evaluate whether the alarms nurses experienced were actionable. Although our lab has previously reported that ≥99% of alarms occurring on non-ICU pediatric wards are nonactionable,10,11 it is possible that some of the alarms during guideline-discordant monitoring periods required action. However, it is unlikely that any life-sustaining actions were taken because (1) we only evaluated time >60 minutes after final discontinuation of supplemental oxygen, so by definition none of these alarms required treatment with supplemental oxygen, and (2) none of the patients we included received ICU care during their admission.
The avoidable alarm burden identified in our analysis suggests that eliminating continuous SpO2 monitoring overuse in bronchiolitis will likely reduce nurses’ workload and alarm fatigue in hospital settings that care for children with bronchiolitis.
1. Ralston SL, Lieberthal AS, Meissner HC, et al. Clinical practice guideline: the diagnosis, management, and prevention of bronchiolitis. Pediatrics. 2014;134(5):e1474-e1502. https://doi.org/10.1542/peds.2014-2742
2. Schondelmeyer AC, Dewan ML, Brady PW, et al. Cardiorespiratory and pulse oximetry monitoring in hospitalized children: a Delphi process. Pediatrics. 2020;146(2):e20193336. https://doi.org/10.1542/peds.2019-3336
3. Cunningham S, Rodriguez A, Boyd KA, McIntosh E, Lewis SC, BIDS Collaborators Group. Bronchiolitis of Infancy Discharge Study (BIDS): A multicentre, parallel-group, double-blind, randomised controlled, equivalence trial with economic evaluation. Health Technol Assess. 2015;19(71):i-xxiii, 1-172. https://doi.org/10.3310/hta19710
4. McCulloh R, Koster M, Ralston S, et al. Use of intermittent vs continuous pulse oximetry for nonhypoxemic infants and young children hospitalized for bronchiolitis: a randomized clinical trial. JAMA Pediatr. 2015;169(10):898-904. https://doi.org/10.1001/jamapediatrics.2015.1746
5. Schuh S, Freedman S, Coates A, et al. Effect of oximetry on hospitalization in bronchiolitis: a randomized clinical trial. JAMA. 2014;312(7):712-718. https://doi.org/10.1001/jama.2014.8637
6. Fujiogi M, Goto T, Yasunaga H, et al. Trends in bronchiolitis hospitalizations in the United States: 2000–2016. Pediatrics. 2019;144(6):e20192614. https://doi.org/10.1542/peds.2019-2614
7. Bonafide CP, Xiao R, Brady PW, et al. Prevalence of continuous pulse oximetry monitoring in hospitalized children with bronchiolitis not requiring supplemental oxygen. JAMA. 2020;323(15):1467-1477. https://doi.org/10.1001/jama.2020.2998
8. Schondelmeyer AC, Brady PW, Goel VV, et al. Physiologic monitor alarm rates at 5 children’s hospitals. J Hosp Med. 2018;13(6):396-398. https://doi.org/10.12788/jhm.2918
9. Schondelmeyer AC, Bonafide CP, Goel VV, et al. The frequency of physiologic monitor alarms in a children’s hospital. J Hosp Med. 2016;11(11):796-798. https://doi.org/10.1002/jhm.2612
10. Bonafide CP, Lin R, Zander M, et al. Association between exposure to nonactionable physiologic monitor alarms and response time in a children’s hospital. J Hosp Med. 2015;10(6):345-351. https://doi.org/10.1002/jhm.2331
11. Bonafide CP, Localio AR, Holmes JH, et al. Video analysis of factors associated with response time to physiologic monitor alarms in a children’s hospital. JAMA Pediatr. 2017;171(6):524-531. https://doi.org/10.1001/jamapediatrics.2016.5123
12. Rasooly IR, Kern-Goldberger AS, Xiao R, et al. Physiologic monitor alarm burden and nurses’ subjective workload in a children’s hospital. Hosp Pediatr. 2021;11(7):703-710. https://doi.org/10.1542/hpeds.2020-003509
13. Feudtner C, Feinstein JA, Zhong W, Hall M, Dai D. Pediatric complex chronic conditions classification system version 2: updated for ICD-10 and complex medical technology dependence and transplantation. BMC Pediatr. 2014;14:199. https://doi.org/10.1186/1471-2431-14-199
14. Kern-Goldberger AS, Rasooly IR, Luo B, et al. EHR-integrated monitor data to measure pulse oximetry use in bronchiolitis. Hosp Pediatr. 2021;11(10):1073-1082. https://doi.org/10.1542/hpeds.2021-005894
15. Schondelmeyer AC, Bettencourt AP, Xiao R, et al. Evaluation of an educational outreach and audit and feedback program to reduce continuous pulse oximetry use in hospitalized infants with stable bronchiolitis. JAMA Netw Open. 2021;4(9):e2122826. https://doi.org/10.1001/jamanetworkopen.2021.22826
16. Principi T, Coates AL, Parkin PC, Stephens D, DaSilva Z, Schuh S. Effect of oxygen desaturations on subsequent medical visits in infants discharged from the emergency department with bronchiolitis. JAMA Pediatr. 2016;170(6):602-608. https://doi.org/10.1001/jamapediatrics.2016.0114
17. Tubbs-Cooley HL, Mara CA, Carle AC, Mark BA, Pickler RH. Association of nurse workload with missed nursing care in the neonatal intensive care unit. JAMA Pediatr. 2019;173(1):44-51. https://doi.org/10.1001/jamapediatrics.2018.3619
Practice guidelines discourage continuous pulse oximetry (SpO2) monitoring of patients with bronchiolitis who are not receiving supplemental oxygen.1,2 Overuse of SpO2 monitoring in this patient population has been associated with increased length of stay, unnecessary oxygen therapy, and excess hospital costs, without measurable patient benefit.3-5 In spite of this evidence base and expert guidance, nearly half of the more than 100,000 infants admitted for bronchiolitis each year receive excess SpO2 monitoring.6,7
Bronchiolitis guidelines suggest that guideline-discordant SpO2 monitoring may result in excess alarms, which disrupt families’ sleep and engender alarm fatigue among staff.1 Pediatric nurses receive up to 155 alarms per monitored patient per day.8,9 Frequent alarms are associated with slower nurse response times10,11 and increased nurse subjective workload.12
Methods
Cohort
We retrospectively evaluated SpO2 monitoring patterns and alarm rates of children 0 to 24 months old admitted to a general pediatrics service at a tertiary care children’s hospital. We included patients who had a discharge diagnosis of bronchiolitis (International Classification of Diseases, Tenth Revision codes J45x, T17.2x, T17.3x, T17.4x, T17.5x, T17.8x, T17.9x, A37xx, J04x, J05x, J05.1x, J69.0x, J69.1x, J69.8x) between November 24, 2019, and January 21, 2020, the period of time during which alarm data and monitor data were concurrently available for analysis. In order to conservatively assure applicability of clinical practice guidelines, we excluded patients with discharge diagnoses that included other respiratory conditions (eg, reactive airway disease), patients with complex chronic conditions (CCC) as defined by the CCC version 2 classification system,13 and patients with intensive care unit (ICU) stays during the admission.
Time
Flowsheet data detailing nursing respiratory assessments were extracted from the electronic health record (EHR) database (Clarity, Epic Systems). Using previously validated methodology,14 we identified minutes during which patients received supplemental oxygen or high-flow nasal cannula (supplemental oxygen) based on the documented fraction of inspired oxygen (FiO2), flow rate, and support devices. We then identified the final discontinuation of respiratory support during the hospital admission, and censored the 60 minutes after final discontinuation of supplemental oxygen based upon recent monitoring guidelines.2 Minutes up to an hour after supplemental oxygen discontinuation were classified as receiving supplemental oxygen and not included in our analysis. Only minutes between the end of the censored period and hospital discharge were used in the analysis. For patients who never received respiratory support during the admission, we censored the first 60 minutes of the admission and analyzed the remainder of their stay.
SpO2 Monitoring
We used device-integrated, physiologic-monitor, vital sign data sent each minute from the General Electric monitor network to the EHR to identify minutes during which patients were connected to physiologic monitors and transmitting signals from SpO2 sensors. We extracted minute-level SpO2 data from the hospital clinical data warehouse (CDW). Minutes in which SpO2 data were present were classified as “monitored,” an approach previously validated using in-person observation.14
To categorize time as “not receiving supplemental oxygen and continuously monitored (guideline-discordant monitoring),” or “not receiving supplemental oxygen and not continuously monitored (guideline-concordant intermittent measurement),” we evaluated the percent of minutes within an hour during which the patient received SpO2 monitoring and applied an a priori conservative rule. Hours during which ≥90% of minutes had SpO2 monitoring data were classified as “continuously monitored.” Hours during which ≤10% of minutes had SpO2 monitoring data were classified as “intermittently measured.” Hours during which 11% to 89% of minutes included monitor data were excluded from further analysis. The number of continuously monitored hours was tabulated for each patient. The median number of continuously monitored hours was computed; results were stratified by prior receipt of respiratory support.
Alarm Counts
Minute-level monitor alarm counts (the absolute number of abnormal vital signs that triggered a monitor to alarm) were extracted from the CDW. Alarm counts were tabulated for each patient hour. For each patient, the alarm rate (total number of alarms divided by time) was computed for continuously monitored and intermittently measured time. Results were stratified by prior receipt of respiratory support.
The study was reviewed by the institutional review board and determined to meet exemption criteria.
Results
Our cohort included 201 admissions by 197 unique patients (Table). We evaluated 4402 hours that occurred ≥60 minutes following final discontinuation of supplemental oxygen, the time period during which guidelines discourage routine use of continuous SpO2 monitoring. This represented a median of 19 hours (interquartile range [IQR], 14-25) per admission. We excluded 474 hours (11%) that could not be classified as either continuously or intermittently measured.
During time ≥60 minutes following discontinuation of supplemental oxygen, our cohort experienced 1537 hours of guideline-discordant continuous monitoring, a median of 6 hours (IQR, 3-12) per admission. Patients experienced a median of 12 hours (IQR, 5-17) of intermittent measurement. Among patients who received supplemental oxygen, 91% experienced guideline-discordant continuous SpO2 monitoring, as compared to 68% of patients who did not receive supplemental oxygen. Among those who received guideline-discordant continuous SpO2 monitoring, the duration of this monitoring did not differ significantly between those who had received supplemental oxygen during the admission and those who had not.
During classifiable time ≥60 minutes following discontinuation of supplemental oxygen, our cohort experienced 14,371 alarms; 77% (11,101) of these alarms were generated during periods of guideline-discordant continuous monitoring. The median hourly alarm rate during these periods of guideline-discordant continuous monitoring was 6.7 alarms per hour (IQR, 2.1-12.3), representing a median of 35 (IQR, 10-81) additional alarms per patient. During periods of guideline-concordant intermittent measurement, the median hourly alarm rate was 0.5 (IQR, 0.1-0.8), with a median of 5 (IQR, 1-13) alarms per patient.
Those who received supplemental oxygen earlier in the admission had higher alarm rates during continuously monitored time (7.3 per hour [IQR, 2.7-12.7]) than patients who had not received supplemental oxygen (3.3 per hour [IQR, 0.6-11.8]), likely reflecting clinical differences between these patient populations. The most frequent alarm type among continuously monitored patients who had previously received supplemental oxygen was “SpO2 low.”
Discussion
Across 4402 patient hours, guideline-discordant continuous SpO2 monitoring of patients with bronchiolitis resulted in 11,101 alarms, at a rate of approximately 1 additional alarm every 9 minutes. Patients in our cohort received a median of 6 hours of guideline-discordant monitoring, which imposes a significant alarm burden that is potentially modifiable using targeted reduction strategies.15
Transient, self-resolved hypoxemia is a common feature of bronchiolitis and likely of little clinical consequence.16 Therefore, this rate of hypoxemia alarms is not unexpected. Though we evaluated only the period of time following final discontinuation of respiratory support, this finding is in keeping with the literature associating excess physiologic monitoring of patients with bronchiolitis with unnecessary oxygen therapy and increased length of stay,3-5 largely because clinicians may feel compelled to respond to hypoxemia alarms with either supplemental oxygen or longer monitoring.
Our findings must be contextualized in light of the limitations of our approach. We did not evaluate nurse workload associated with guideline-discordant continuous SpO2 monitoring. Prior work conducted by our lab has demonstrated that when nurses experience more than 40 alarms within a 2-hour period, their measured subjective workload increases to a degree associated with missing important tasks, threatening the quality and safety of the care they deliver.12,17 Given that nurses care for multiple patients, it is likely that the excess alarms introduced by guideline-discordant continuous monitoring contribute to increased nurse workload and alarm fatigue.
Similarly, we could not evaluate whether the alarms nurses experienced were actionable. Although our lab has previously reported that ≥99% of alarms occurring on non-ICU pediatric wards are nonactionable,10,11 it is possible that some of the alarms during guideline-discordant monitoring periods required action. However, it is unlikely that any life-sustaining actions were taken because (1) we only evaluated time >60 minutes after final discontinuation of supplemental oxygen, so by definition none of these alarms required treatment with supplemental oxygen, and (2) none of the patients we included received ICU care during their admission.
The avoidable alarm burden identified in our analysis suggests that eliminating continuous SpO2 monitoring overuse in bronchiolitis will likely reduce nurses’ workload and alarm fatigue in hospital settings that care for children with bronchiolitis.
1. Ralston SL, Lieberthal AS, Meissner HC, et al. Clinical practice guideline: the diagnosis, management, and prevention of bronchiolitis. Pediatrics. 2014;134(5):e1474-e1502. https://doi.org/10.1542/peds.2014-2742
2. Schondelmeyer AC, Dewan ML, Brady PW, et al. Cardiorespiratory and pulse oximetry monitoring in hospitalized children: a Delphi process. Pediatrics. 2020;146(2):e20193336. https://doi.org/10.1542/peds.2019-3336
3. Cunningham S, Rodriguez A, Boyd KA, McIntosh E, Lewis SC, BIDS Collaborators Group. Bronchiolitis of Infancy Discharge Study (BIDS): A multicentre, parallel-group, double-blind, randomised controlled, equivalence trial with economic evaluation. Health Technol Assess. 2015;19(71):i-xxiii, 1-172. https://doi.org/10.3310/hta19710
4. McCulloh R, Koster M, Ralston S, et al. Use of intermittent vs continuous pulse oximetry for nonhypoxemic infants and young children hospitalized for bronchiolitis: a randomized clinical trial. JAMA Pediatr. 2015;169(10):898-904. https://doi.org/10.1001/jamapediatrics.2015.1746
5. Schuh S, Freedman S, Coates A, et al. Effect of oximetry on hospitalization in bronchiolitis: a randomized clinical trial. JAMA. 2014;312(7):712-718. https://doi.org/10.1001/jama.2014.8637
6. Fujiogi M, Goto T, Yasunaga H, et al. Trends in bronchiolitis hospitalizations in the United States: 2000–2016. Pediatrics. 2019;144(6):e20192614. https://doi.org/10.1542/peds.2019-2614
7. Bonafide CP, Xiao R, Brady PW, et al. Prevalence of continuous pulse oximetry monitoring in hospitalized children with bronchiolitis not requiring supplemental oxygen. JAMA. 2020;323(15):1467-1477. https://doi.org/10.1001/jama.2020.2998
8. Schondelmeyer AC, Brady PW, Goel VV, et al. Physiologic monitor alarm rates at 5 children’s hospitals. J Hosp Med. 2018;13(6):396-398. https://doi.org/10.12788/jhm.2918
9. Schondelmeyer AC, Bonafide CP, Goel VV, et al. The frequency of physiologic monitor alarms in a children’s hospital. J Hosp Med. 2016;11(11):796-798. https://doi.org/10.1002/jhm.2612
10. Bonafide CP, Lin R, Zander M, et al. Association between exposure to nonactionable physiologic monitor alarms and response time in a children’s hospital. J Hosp Med. 2015;10(6):345-351. https://doi.org/10.1002/jhm.2331
11. Bonafide CP, Localio AR, Holmes JH, et al. Video analysis of factors associated with response time to physiologic monitor alarms in a children’s hospital. JAMA Pediatr. 2017;171(6):524-531. https://doi.org/10.1001/jamapediatrics.2016.5123
12. Rasooly IR, Kern-Goldberger AS, Xiao R, et al. Physiologic monitor alarm burden and nurses’ subjective workload in a children’s hospital. Hosp Pediatr. 2021;11(7):703-710. https://doi.org/10.1542/hpeds.2020-003509
13. Feudtner C, Feinstein JA, Zhong W, Hall M, Dai D. Pediatric complex chronic conditions classification system version 2: updated for ICD-10 and complex medical technology dependence and transplantation. BMC Pediatr. 2014;14:199. https://doi.org/10.1186/1471-2431-14-199
14. Kern-Goldberger AS, Rasooly IR, Luo B, et al. EHR-integrated monitor data to measure pulse oximetry use in bronchiolitis. Hosp Pediatr. 2021;11(10):1073-1082. https://doi.org/10.1542/hpeds.2021-005894
15. Schondelmeyer AC, Bettencourt AP, Xiao R, et al. Evaluation of an educational outreach and audit and feedback program to reduce continuous pulse oximetry use in hospitalized infants with stable bronchiolitis. JAMA Netw Open. 2021;4(9):e2122826. https://doi.org/10.1001/jamanetworkopen.2021.22826
16. Principi T, Coates AL, Parkin PC, Stephens D, DaSilva Z, Schuh S. Effect of oxygen desaturations on subsequent medical visits in infants discharged from the emergency department with bronchiolitis. JAMA Pediatr. 2016;170(6):602-608. https://doi.org/10.1001/jamapediatrics.2016.0114
17. Tubbs-Cooley HL, Mara CA, Carle AC, Mark BA, Pickler RH. Association of nurse workload with missed nursing care in the neonatal intensive care unit. JAMA Pediatr. 2019;173(1):44-51. https://doi.org/10.1001/jamapediatrics.2018.3619
© 2021 Society of Hospital Medicine
Initiation of Long-Acting Opioids Following Hospital Discharge Among Medicare Beneficiaries
Transition out of the hospital is a vulnerable time for older adults. Medications, particularly opioids, are a common cause of adverse events during this transitionary period.1,2 For hospitalized patients with acute noncancer pain that necessitates opioid treatment, guidelines recommend using short-acting, rather than long-acting, opioids.3,4 Long-acting opioids have a longer duration of action but also have a significantly elevated risk of unintentional overdose and morbidity compared to short-acting opioids, even when total daily dosing is identical.5,6 This risk is highest in the first 2 weeks following initial prescription.7,8
Despite the recent decrease in overall prescription of opioids,9 a small but significant proportion continue to be prescribed as long-acting formulations.10-12 We sought to understand the incidence of, and patient characteristics associated with, long-acting opioid initiation following hospital discharge among opioid-naïve older adults.
METHODS
We examined the 20% random sample of US Medicare beneficiaries ≥65 years old who were hospitalized in 2016 and continuously enrolled in Parts A, B, and D for 1 year prior and 1 month following discharge, excluding beneficiaries with cancer or hospice care, those transferred from or discharged to a care facility, and those who had filled a prescription for an opioid within 90 days prior to hospitalization. We identified beneficiaries with a Part D claim for an opioid, excluding methadone and buprenorphine, within 7 days of discharge. We compared beneficiaries with at least one claim for a long-acting opioid (including extended-release formulations) within 7 days of hospital discharge to those with short-acting opioid claims only.
We used a multivariable, generalized estimating equation to determine patient-level factors independently associated with prescription of any long-acting opioids. We selected characteristics that we hypothesized to be associated with new opioid prescription, based on clinical experience and previous literature, including sociodemographics, patient clinical characteristics such as a modified Elixhauser index (a composite index of nearly 30 comorbidities, excluding cancer),13 substance use-related factors, co-prescribed medications, and hospitalization-related factors. The latter included being hospitalized for a medical vs surgical reason, defined based on diagnosis-related group (DRG), primary diagnosis, and primary procedure, grouped using the Agency for Healthcare Research and Quality Clinical Classification System14 (Table 1).
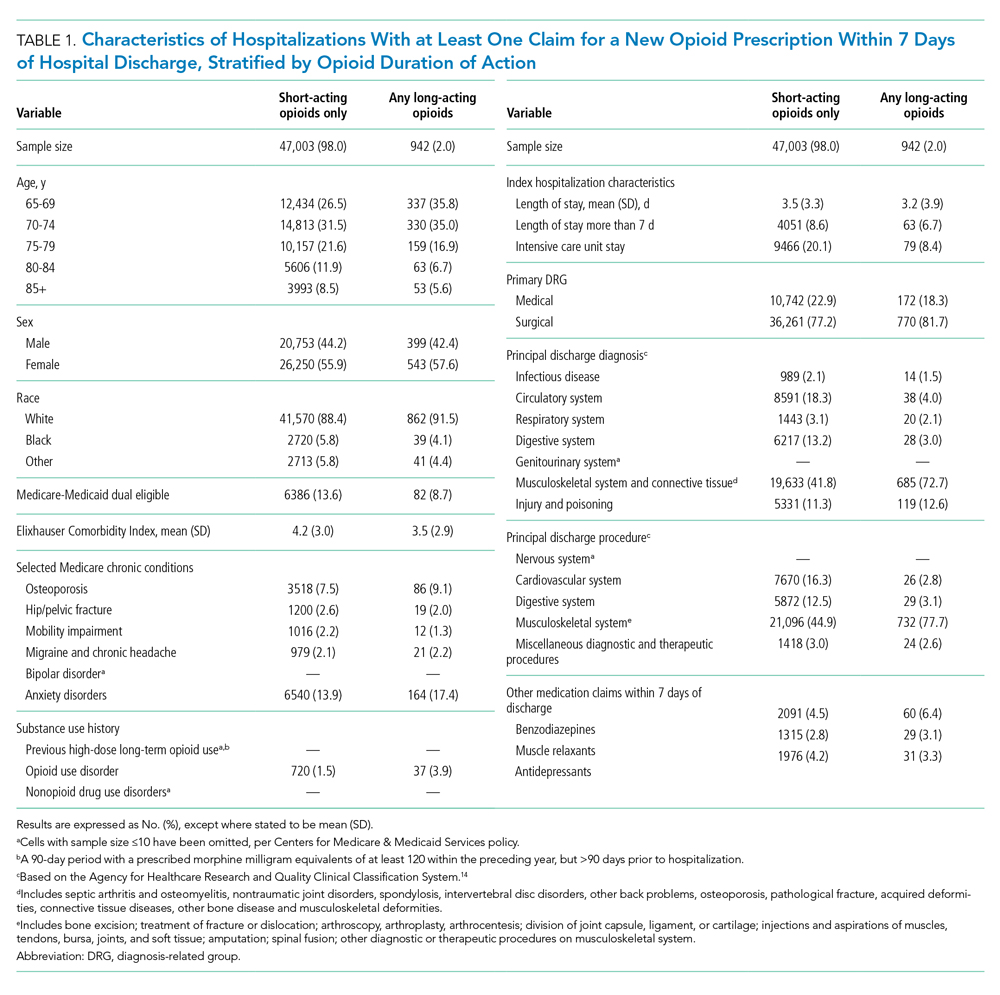
We conducted a sensitivity analysis, excluding beneficiaries with high-dose long-term opioid use in the year before hospitalization.
RESULTS
Of 258,193 hospitalizations meeting eligibility criteria, 47,945 (18.6%) had an opioid claim within 7 days of discharge and comprised our analytic cohort (see the Appendix Figure for the study consort diagram), including 47,003 (18.2%) with short-acting opioids only and 942 (0.4%) with at least one claim for long-acting opioids, of whom 817 received both short- and long-acting opioids (Table 1).
Beneficiaries with long-acting opioid claims were more likely to be younger (ages 65-69 and 70-74 years) and White than those with claims for short-acting opioids only. They had a lower mean number of Elixhauser comorbidities but a higher prevalence of mental health conditions, including anxiety disorders and opioid use disorder, as well as a higher prevalence of previous high-dose long-term opioid use (occurring more than 90 days prior to hospitalization). They were more likely to have been hospitalized for a procedural rather than a medical reason, with 770 of the 942 (81.7%) beneficiaries receiving long-acting opioids having been hospitalized for a procedural reason (based on DRG). They were also more likely to have benzodiazepine co-prescription.
Factors independently associated with receipt of long-acting opioids compared to short-acting opioids only included younger age, having been admitted for a musculoskeletal problem, and presence of known risk factors for opioid-related adverse events, including anxiety disorders, opioid use disorder, prior long-term high-dose opioid use, and benzodiazepine co-prescription (Table 2). After excluding 33 beneficiaries with previous high-dose long-term opioid use in the year before hospitalization, associations were unchanged (Appendix Table).
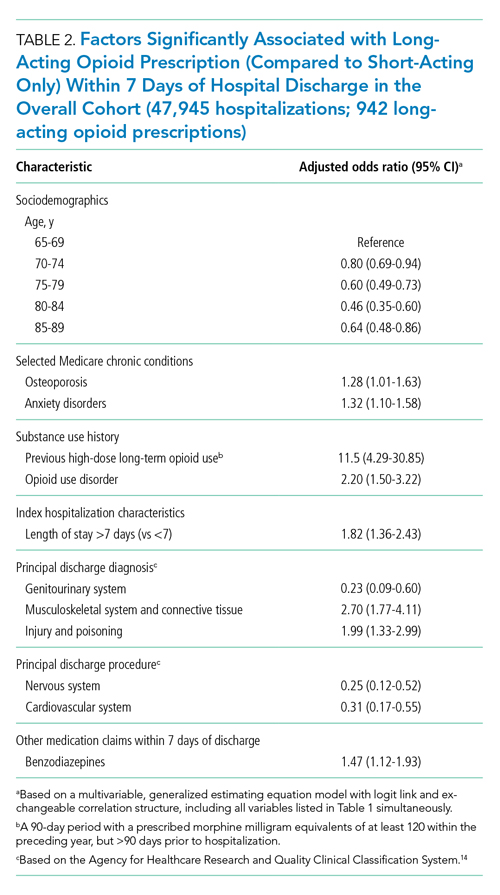
DISCUSSION
Among a nationally representative sample of opioid-naïve Medicare beneficiaries without cancer, almost 20% filled a new opioid prescription within 7 days of hospital discharge. While prescription of long-acting opioids was uncommon, 81.7% who were prescribed a long-acting opioid had a procedural reason for hospitalization, raising concern since postoperative pain is typically acute and limited. Beneficiaries started on long-acting opioids more frequently had risk factors for opioid-related adverse events, including history of opioid use disorder and benzodiazepine co-prescription. With nearly three-quarters of patients with a long-acting opioid claim having been hospitalized for musculoskeletal disorders or orthopedic procedures, this population represents a key target for quality improvement interventions.
This is the first analysis describing the incidence and factors associated with long-acting opioid receipt shortly after hospital discharge among Medicare beneficiaries. Given that our data predate the publication of the Society of Hospital Medicine’s consensus statement on safe opioid prescribing in hospitalized patients,3 it is possible that there have been changes to prescribing patterns since 2016 that we are unable to characterize with our data. We are also limited by an inability to determine the appropriateness of any individual long-acting opioid prescription, though previous research has shown that long-acting opioids are frequently inappropriately initiated in older adults.15 Finally, our findings may not be generalizable to non-Medicare populations.
While long-acting opioid initiation following hospitalization is uncommon, these medications are most often prescribed to individuals with pain that is typically of limited duration and those at high risk for harm. Our findings highlight potential targets for systems-based solutions to improve guideline-concordant prescribing of long-acting opioids.
1. Tsilimingras D, Schnipper J, Duke A, et al. Post-discharge adverse events among urban and rural patients of an urban community hospital: a prospective cohort study. J Gen Intern Med. 2015;30(8):1164-1171. https://doi.org/10.1007/s11606-015-3260-3
2. Forster AJ, Murff HJ, Peterson JF, Gandhi TK, Bates DW. The incidence and severity of adverse events affecting patients after discharge from the hospital. Ann Intern Med. 2003;138(3):161-167. https://doi.org/10.7326/0003-4819-138-3-200302040-00007
3. Herzig SJ, Mosher HJ, Calcaterra SL, Jena AB, Nuckols TK. Improving the safety of opioid use for acute noncancer pain in hospitalized adults: a consensus statement from the Society of Hospital Medicine. J Hosp Med. 2018;13(4):263-271. https://doi.org/10.12788/jhm.2980
4. Herzig SJ, Calcaterra SL, Mosher HJ, et al. Safe opioid prescribing for acute noncancer pain in hospitalized adults: a systematic review of existing guidelines. J Hosp Med. 2018;13(4):256-262. https://doi.org/10.12788/jhm.2979
5. Barnett ML, Olenski AR, Thygeson NM, et al. A health plan’s formulary led to reduced use of extended-release opioids but did not lower overall opioid use. Health Aff (Millwood). 2018;37(9):1509-1516. https://doi.org/10.1377/hlthaff.2018.0391
6. Carey CM, Jena AB, Barnett ML. Patterns of potential opioid misuse and subsequent adverse outcomes in Medicare, 2008 to 2012. Ann Intern Med. 2018;168(12):837-845. https://doi.org/10.7326/M17-3065
7. Miller M, Barber CW, Leatherman S, et al. Prescription opioid duration of action and the risk of unintentional overdose among patients receiving opioid therapy. JAMA Intern Med. 2015;175(4):608-615. https://doi.org/10.1001/jamainternmed.2014.8071
8. Ray WA, Chung CP, Murray KT, Hall K, Stein CM. Prescription of long-acting opioids and mortality in patients with chronic noncancer pain. JAMA. 2016;315(22):2415-2423. https://doi.org/10.1001/jama.2016.7789
9. Zhu W, Chernew ME, Sherry TB, Maestas N. Initial opioid prescriptions among U.S. commercially insured patients, 2012-2017. N Engl J Med. 2019;380(11):1043-1052. https://doi.org/10.1056/NEJMsa1807069
10. Starner I, Gleason P. Short-acting, long-acting, and abuse-deterrent opioid utilization patterns among 15 million commercially insured members. Presented at: Academy of Managed Care Pharmacy (AMCP) Nexus; October 3-6, 2016; National Harbor, MD.
11. Young JC, Lund JL, Dasgupta N, Jonsson Funk M. Opioid tolerance and clinically recognized opioid poisoning among patients prescribed extended-release long-acting opioids. Pharmacoepidemiol Drug Saf. 2019;28(1):39-47. https://doi.org/10.1002/pds.4572
12. Hwang CS, Kang EM, Ding Y, et al. Patterns of immediate-release and extended-release opioid analgesic use in the management of chronic pain, 2003-2014. JAMA Netw Open. 2018;1(2):e180216. https://doi.org/10.1001/jamanetworkopen.2018.0216
13. Elixhauser A, Steiner C, Harris DR, Coffey RM. Comorbidity measures for use with administrative data. Med Care. 1998;36(1):8-27. https://doi.org/10.1097/00005650-199801000-00004
14. Agency for Healthcare Research and Quality. Clinical Classifications Software (CCS) for ICD-10-CM/PCS. Healthcare Cost and Utilization Project (HCUP). October 2018. www.hcup-us.ahrq.gov/toolssoftware/ccs10/ccs10.jsp
15. Willy ME, Graham DJ, Racoosin JA, et al. Candidate metrics for evaluating the impact of prescriber education on the safe use of extended-release/long-acting (ER/LA) opioid analgesics. Pain Med. 2014;15(9):1558-1568. https://doi.org/10.1111/pme.12459
Transition out of the hospital is a vulnerable time for older adults. Medications, particularly opioids, are a common cause of adverse events during this transitionary period.1,2 For hospitalized patients with acute noncancer pain that necessitates opioid treatment, guidelines recommend using short-acting, rather than long-acting, opioids.3,4 Long-acting opioids have a longer duration of action but also have a significantly elevated risk of unintentional overdose and morbidity compared to short-acting opioids, even when total daily dosing is identical.5,6 This risk is highest in the first 2 weeks following initial prescription.7,8
Despite the recent decrease in overall prescription of opioids,9 a small but significant proportion continue to be prescribed as long-acting formulations.10-12 We sought to understand the incidence of, and patient characteristics associated with, long-acting opioid initiation following hospital discharge among opioid-naïve older adults.
METHODS
We examined the 20% random sample of US Medicare beneficiaries ≥65 years old who were hospitalized in 2016 and continuously enrolled in Parts A, B, and D for 1 year prior and 1 month following discharge, excluding beneficiaries with cancer or hospice care, those transferred from or discharged to a care facility, and those who had filled a prescription for an opioid within 90 days prior to hospitalization. We identified beneficiaries with a Part D claim for an opioid, excluding methadone and buprenorphine, within 7 days of discharge. We compared beneficiaries with at least one claim for a long-acting opioid (including extended-release formulations) within 7 days of hospital discharge to those with short-acting opioid claims only.
We used a multivariable, generalized estimating equation to determine patient-level factors independently associated with prescription of any long-acting opioids. We selected characteristics that we hypothesized to be associated with new opioid prescription, based on clinical experience and previous literature, including sociodemographics, patient clinical characteristics such as a modified Elixhauser index (a composite index of nearly 30 comorbidities, excluding cancer),13 substance use-related factors, co-prescribed medications, and hospitalization-related factors. The latter included being hospitalized for a medical vs surgical reason, defined based on diagnosis-related group (DRG), primary diagnosis, and primary procedure, grouped using the Agency for Healthcare Research and Quality Clinical Classification System14 (Table 1).
We conducted a sensitivity analysis, excluding beneficiaries with high-dose long-term opioid use in the year before hospitalization.
RESULTS
Of 258,193 hospitalizations meeting eligibility criteria, 47,945 (18.6%) had an opioid claim within 7 days of discharge and comprised our analytic cohort (see the Appendix Figure for the study consort diagram), including 47,003 (18.2%) with short-acting opioids only and 942 (0.4%) with at least one claim for long-acting opioids, of whom 817 received both short- and long-acting opioids (Table 1).
Beneficiaries with long-acting opioid claims were more likely to be younger (ages 65-69 and 70-74 years) and White than those with claims for short-acting opioids only. They had a lower mean number of Elixhauser comorbidities but a higher prevalence of mental health conditions, including anxiety disorders and opioid use disorder, as well as a higher prevalence of previous high-dose long-term opioid use (occurring more than 90 days prior to hospitalization). They were more likely to have been hospitalized for a procedural rather than a medical reason, with 770 of the 942 (81.7%) beneficiaries receiving long-acting opioids having been hospitalized for a procedural reason (based on DRG). They were also more likely to have benzodiazepine co-prescription.
Factors independently associated with receipt of long-acting opioids compared to short-acting opioids only included younger age, having been admitted for a musculoskeletal problem, and presence of known risk factors for opioid-related adverse events, including anxiety disorders, opioid use disorder, prior long-term high-dose opioid use, and benzodiazepine co-prescription (Table 2). After excluding 33 beneficiaries with previous high-dose long-term opioid use in the year before hospitalization, associations were unchanged (Appendix Table).
DISCUSSION
Among a nationally representative sample of opioid-naïve Medicare beneficiaries without cancer, almost 20% filled a new opioid prescription within 7 days of hospital discharge. While prescription of long-acting opioids was uncommon, 81.7% who were prescribed a long-acting opioid had a procedural reason for hospitalization, raising concern since postoperative pain is typically acute and limited. Beneficiaries started on long-acting opioids more frequently had risk factors for opioid-related adverse events, including history of opioid use disorder and benzodiazepine co-prescription. With nearly three-quarters of patients with a long-acting opioid claim having been hospitalized for musculoskeletal disorders or orthopedic procedures, this population represents a key target for quality improvement interventions.
This is the first analysis describing the incidence and factors associated with long-acting opioid receipt shortly after hospital discharge among Medicare beneficiaries. Given that our data predate the publication of the Society of Hospital Medicine’s consensus statement on safe opioid prescribing in hospitalized patients,3 it is possible that there have been changes to prescribing patterns since 2016 that we are unable to characterize with our data. We are also limited by an inability to determine the appropriateness of any individual long-acting opioid prescription, though previous research has shown that long-acting opioids are frequently inappropriately initiated in older adults.15 Finally, our findings may not be generalizable to non-Medicare populations.
While long-acting opioid initiation following hospitalization is uncommon, these medications are most often prescribed to individuals with pain that is typically of limited duration and those at high risk for harm. Our findings highlight potential targets for systems-based solutions to improve guideline-concordant prescribing of long-acting opioids.
1. Tsilimingras D, Schnipper J, Duke A, et al. Post-discharge adverse events among urban and rural patients of an urban community hospital: a prospective cohort study. J Gen Intern Med. 2015;30(8):1164-1171. https://doi.org/10.1007/s11606-015-3260-3
2. Forster AJ, Murff HJ, Peterson JF, Gandhi TK, Bates DW. The incidence and severity of adverse events affecting patients after discharge from the hospital. Ann Intern Med. 2003;138(3):161-167. https://doi.org/10.7326/0003-4819-138-3-200302040-00007
3. Herzig SJ, Mosher HJ, Calcaterra SL, Jena AB, Nuckols TK. Improving the safety of opioid use for acute noncancer pain in hospitalized adults: a consensus statement from the Society of Hospital Medicine. J Hosp Med. 2018;13(4):263-271. https://doi.org/10.12788/jhm.2980
4. Herzig SJ, Calcaterra SL, Mosher HJ, et al. Safe opioid prescribing for acute noncancer pain in hospitalized adults: a systematic review of existing guidelines. J Hosp Med. 2018;13(4):256-262. https://doi.org/10.12788/jhm.2979
5. Barnett ML, Olenski AR, Thygeson NM, et al. A health plan’s formulary led to reduced use of extended-release opioids but did not lower overall opioid use. Health Aff (Millwood). 2018;37(9):1509-1516. https://doi.org/10.1377/hlthaff.2018.0391
6. Carey CM, Jena AB, Barnett ML. Patterns of potential opioid misuse and subsequent adverse outcomes in Medicare, 2008 to 2012. Ann Intern Med. 2018;168(12):837-845. https://doi.org/10.7326/M17-3065
7. Miller M, Barber CW, Leatherman S, et al. Prescription opioid duration of action and the risk of unintentional overdose among patients receiving opioid therapy. JAMA Intern Med. 2015;175(4):608-615. https://doi.org/10.1001/jamainternmed.2014.8071
8. Ray WA, Chung CP, Murray KT, Hall K, Stein CM. Prescription of long-acting opioids and mortality in patients with chronic noncancer pain. JAMA. 2016;315(22):2415-2423. https://doi.org/10.1001/jama.2016.7789
9. Zhu W, Chernew ME, Sherry TB, Maestas N. Initial opioid prescriptions among U.S. commercially insured patients, 2012-2017. N Engl J Med. 2019;380(11):1043-1052. https://doi.org/10.1056/NEJMsa1807069
10. Starner I, Gleason P. Short-acting, long-acting, and abuse-deterrent opioid utilization patterns among 15 million commercially insured members. Presented at: Academy of Managed Care Pharmacy (AMCP) Nexus; October 3-6, 2016; National Harbor, MD.
11. Young JC, Lund JL, Dasgupta N, Jonsson Funk M. Opioid tolerance and clinically recognized opioid poisoning among patients prescribed extended-release long-acting opioids. Pharmacoepidemiol Drug Saf. 2019;28(1):39-47. https://doi.org/10.1002/pds.4572
12. Hwang CS, Kang EM, Ding Y, et al. Patterns of immediate-release and extended-release opioid analgesic use in the management of chronic pain, 2003-2014. JAMA Netw Open. 2018;1(2):e180216. https://doi.org/10.1001/jamanetworkopen.2018.0216
13. Elixhauser A, Steiner C, Harris DR, Coffey RM. Comorbidity measures for use with administrative data. Med Care. 1998;36(1):8-27. https://doi.org/10.1097/00005650-199801000-00004
14. Agency for Healthcare Research and Quality. Clinical Classifications Software (CCS) for ICD-10-CM/PCS. Healthcare Cost and Utilization Project (HCUP). October 2018. www.hcup-us.ahrq.gov/toolssoftware/ccs10/ccs10.jsp
15. Willy ME, Graham DJ, Racoosin JA, et al. Candidate metrics for evaluating the impact of prescriber education on the safe use of extended-release/long-acting (ER/LA) opioid analgesics. Pain Med. 2014;15(9):1558-1568. https://doi.org/10.1111/pme.12459
© 2021 Society of Hospital Medicine
Deficits in Identification of Goals and Goal-Concordant Care After Sepsis Hospitalization
Identifying and supporting patients’ care goals through shared decision-making was named the highest priority in the Improving Hospital Outcomes through Patient Engagement (i-HOPE) study.1 Ensuring that seriously ill patients’ goals for their future care are understood and honored is particularly important for patients hospitalized with conditions known to be associated with high near-term mortality or functional disability, such as sepsis. It is increasingly recognized that a hospital admission for sepsis is associated with poor outcomes, including high rates of readmission and postdischarge mortality,2-5 yet little is known about the assessment, status, and stability of patient care goals after discharge for sepsis. Using a cohort of high-risk sepsis survivors enrolled in a clinical trial, we aimed to determine how frequently care goals were documented, describe patterns in care goals, and evaluate how frequently care goals changed over 90 days after sepsis discharge. We also used expert reviewers to assess care delivered in the 90 days after hospitalization and determine the proportion of patients who received goal-concordant care.6,7
METHODS
Design, Setting, Participants
We conducted a secondary analysis using data from the Improving Morbidity During Post-Acute Care Transitions for Sepsis (IMPACTS) study,8 a pragmatic randomized trial evaluating the effectiveness of a multicomponent transition program to reduce mortality and rehospitalization after sepsis among patients enrolled from three hospitals between January 2019 and March 2020 (NCT03865602). The study intervention emphasized preference-sensitive care for patients but did not specifically require documentation of care goals in the electronic health record (EHR).
Data Collection
Clinical and outcomes data were collected from the EHR and enterprise data warehouse. We included data collected as part of routine care at IMPACTS trial enrollment (ie, age at admission, gender, race, marital status, coexisting conditions) and during index hospitalization (ie, organ failures, hospital length of stay, discharge disposition). The Charlson Comorbidity Index score was calculated from diagnosis codes captured during both inpatient and outpatient healthcare encounters in the 12 months prior to trial enrollment. The Centers for Disease Control and Prevention Adult Sepsis Event definitions9 were applied to measure organ failures.
Two palliative care physicians, three internal medicine physicians, and one critical care clinician retrospectively reviewed the EHR of study patients to: (1) identify whether patient care goals were documented in a standardized care alignment tool at discharge or in the subsequent 90 days; (2) categorize each patient’s care goals as focused on longevity, function, or comfort6 using either standardized documentation or unstructured information from the EHR; and (3) determine whether care goals changed over the first 90 days after discharge. Reviewers also classified care received over the 90-day postdischarge period as focused on longevity, function, or comfort. A random sample of 75 cases was selected for double review by a palliative care reviewer to assess interrater agreement in these assessments. Reviewers indicated whether the goal changed and, if so, what the new goal was. The data collection form is provided in the Appendix. The study was approved by the Atrium Health Institutional Review Board.
Outcomes
The primary outcome was the proportion of cases with care goals documented in the standardized care alignment tool, an EHR-embedded tool prompting questions about goals for future health states, including choices among longevity-, function-, and comfort-focused goals. A secondary outcome was the proportion of cases for which a goal could be determined using all information available in the EHR, such as family meeting notes, discharge summaries, and inpatient or outpatient visit notes. We also measured the proportion of patients who received goal-concordant care, defined as agreement between reviewers’ categorizations of patients’ goals and the primary focus of the care delivered, using a well-defined approach.6 In this approach, reviewers first categorized the care delivered during the 90 days after hospital discharge as focused on longevity, function, or comfort using clinical documentation in each patient’s medical record. To enhance transparency of this decision process, reviewers indicated which specific treatments (eg, new medications, hospital admission, hospice enrollment) supported their categorization. Reviewers then separately categorized the patient’s primary goal over the same period. Reviewer training emphasized that classifications of goals and care delivered should be independent. Patients were considered to have received goal-concordant care if the category of care delivered matched the category of the primary care goal. For patients with changing goals, care delivered was compared with the most recent documented goal.
Analyses
We characterized distributions of care goals and care delivered and reported rates of goal-concordant care overall and by care goals. We calculated weighted kappa statistics to assess interrater reliability. We conducted a multivariable logistic regression analysis in the full cohort to evaluate the association of standardized care goal documentation in the EHR with the dependent outcome of goal-concordant care, adjusting for other risk factors (ie, gender, race, marital status, coexisting chronic conditions, organ failures, and hospital length of stay).
RESULTS
")
Characterization of Sepsis Survivors’ Goals
The Figure shows patterns of goal documentation and goal-concordant care in the study cohort. Care goals for sepsis survivors were documented in the standardized EHR care alignment tool at discharge for 130 (19%) patients. When reviewers used all information available in the EHR to categorize goals (73% interrater agreement; interrater reliability by weighted κ, 0.71; 95% CI, 0.58-0.83), reviewers were able to categorize patients’ goals in 269 (40%) cases. Among those categorized, goals were classified as prioritizing longevity in 95 (35%), function in 141 (52%), and comfort in 33 (12%) cases.

Goals changed over the 90-day observation period for 41 (6%) patients. Of patients whose goals changed, 15 (37%) initially had a goal focused on longevity, 24 (59%) had a goal focused on function, and 2 (5%) had a goal focused on comfort. Of goals that changed, the most frequent new goal was comfort, which was documented in 33 (80%) patients.
Characterization of Goal-Concordant Care
Interrater reliability was moderate for reviewer-based determination of care delivered (73% interrater agreement; weighted κ, 0.60; 95% CI, 0.43-0.78). Reviewers categorized care delivered as focused on longevity in 374 (55%), function in 290 (43%), and comfort in 13 (2%) patients, with <1% unable to be determined. Care elements most frequently cited for longevity-focused classification included intensive care unit (ICU) stay (39%) and new medications for nonsymptom benefit (29%). Care elements most frequently cited for function-focused classification included new medications for nonsymptom benefit (50%) and new medication for symptom benefit (41%). Care elements most frequently cited for comfort-focused classification included hospice enrollment (50%) and new medications for symptom benefit (48%). The rate of goal-concordant care was 68% among those with care goals determined and 27% when cases with unknown goals were classified as not concordant. Concordance was highest among those with longevity-focused (72%) and function-focused (73%) care goals compared with comfort-focused (39%) care goals (P < .01). Adjusting for other potential risk factors, completion of the standardized EHR care alignment tool was associated with higher odds of receiving goal-concordant care (OR, 3.6; 95% CI, 2.4-5.5).
DISCUSSION
Our study identified deficits in the current delivery of goal-concordant care in the first 90 days after sepsis hospitalization. First, goals were only documented in the standardized EHR care alignment tool in one-fifth of cases. Otherwise, information about goals, values, and treatment preferences of sepsis patients was documented idiosyncratically in progress notes, which may not be apparent to clinicians involved in patients’ future care. Lack of clinician attention to documenting the goals of sepsis patients post discharge may reflect suboptimal awareness of the lasting health consequences of sepsis, including persistently elevated risk of mortality up to 2 years following the index hospitalization.2-5 Second, even when goals could be classified by reviewers, the focus of care delivered did not match patients’ goals in nearly one-third of cases.
Our findings inspire several considerations for postsepsis care during hospitalization or in the peridischarge period. First, efforts should focus on increasing assessment and documentation of sepsis survivors’ goals—this might begin with enhanced education about the lasting health consequences after sepsis and communication skills training. Importantly, sepsis survivors’ goals were relatively stable over 90 days after discharge, suggesting that hospitalization for sepsis represents an important opportunity to assess and document patients’ goals. Improving documentation of care goals explicitly in a standardized EHR tool may be an important target for quality-improvement initiatives, as this practice was associated with higher odds of receiving goal-concordant care in our cohort. Second, our findings that one-third of patients received care that was not consistent with their goals is worrisome. Concordance was lowest among comfort-focused care goals, suggesting that some of the high rates of healthcare utilization after sepsis may be unwanted.10-12 For example, ICU stay and new medication for nonsymptom benefit were commonly cited as indications of longevity-focused care among patients with comfort-focused goals. Thus, improving the alignment between sepsis survivors’ goals and subsequent care received is an important target from both a patient-centered and value perspective. Consistent with the recommendations of the i-HOPE study,1 future interventions designed to improve posthospitalization care of sepsis patients should aim to capture goal-concordant care as a patient-centered outcome, if possible.
Our examination of goals and goal-concordant care after sepsis hospitalization advances the goal of enhancing understanding of survivorship in this population.4 Strengths of this study include the large, real-world sample and use of expert palliative care physicians conducting granular EHR review to assess goal-concordant care. Our utilization of this methodology to evaluate goal-concordant care provides information to refine efforts toward developing reliable measures of this important outcome—for example, interrater reliability was similar among reviewers in our study compared with studies assessing goal-concordant care using similar methodology.13
Limitations include potential generalizability challenges for goal and goal-concordant care assessments in other health systems with different EHR platforms or local documentation practices, although deficits in EHR documentation of care goals have been reported in other settings.14,15 We double-reviewed a sample of cases to evaluate interrater reliability, but double-review of all cases with a discussion and adjudication approach may have increased the number of goals that could ultimately be classified. However, this might overestimate the number of goals that are identifiable in real-world practice by a treating clinician. Finally, reviewers may have been challenged to select one goal when two or more competing goals existed. Future refinements of goal-concordant care measurement will need to define methods for handling tradeoffs and prioritization associated with competing goals.
CONCLUSION
The hospitalization and peridischarge periods represent an important opportunity to address deficits in the documentation of goals and provision of goal-concordant care for sepsis survivors. Doing so may improve patient-centered care and reduce the high rates of healthcare utilization after sepsis.
1. Harrison JD, Archuleta M, Avitia E, et al. Developing a patient- and family-centered research agenda for hospital medicine: the Improving Hospital Outcomes through Patient Engagement (i-HOPE) study. J Hosp Med. 2020;15(6):331-337. https://doi.org/10.12788/jhm.3386
2. Courtright KR, Jordan L, Murtaugh CM, et al. Risk factors for long-term mortality and patterns of end-of-life care among Medicare sepsis survivors discharged to home health care. JAMA Netw Open. 2020 ;3(2):e200038. https://doi.org/10.1001/jamanetworkopen.2020.0038
3. Prescott HC, Angus DC. Enhancing recovery from sepsis: a review. JAMA. 2018;319(1):62-75. https://doi.org/10.1001/jama.2017.17687
4. Prescott HC, Iwashyna TJ, Blackwood B, et al. Understanding and enhancing sepsis survivorship. Priorities for research and practice. Am J Respir Crit Care Med. 2019;200(8):972-981. https://doi.org/10.1164/rccm.201812-2383CP
5. Prescott HC, Osterholzer JJ, Langa KM, Angus DC, Iwashyna TJ. Late mortality after sepsis: propensity matched cohort study. BMJ. 2016;353:i2375. https://doi.org/10.1136/bmj.i2375
6. Halpern SD. Goal-concordant care - searching for the Holy Grail. N Engl J Med. 2019;381(17):1603-1606. https://doi.org/10.1056/NEJMp1908153
7. Ernecoff NC, Wessell KL, Bennett AV, Hanson LC. Measuring goal-concordant care in palliative care research. J Pain Symptom Manage. 2021;62(3):e305-e314. https://doi.org/10.1016/j.jpainsymman.2021.02.030
8. Kowalkowski M, Chou SH, McWilliams A, et al. Structured, proactive care coordination versus usual care for Improving Morbidity during Post-Acute Care Transitions for Sepsis (IMPACTS): a pragmatic, randomized controlled trial. Trials. 2019;20(1):660. https://doi.org/10.1186/s13063-019-3792-7
9. Centers for Disease Control and Prevention. Hospital Toolkit for Adult Sepsis Surveillance. March 2018. Accessed September 20, 2021. https://www.cdc.gov/sepsis/pdfs/Sepsis-Surveillance-Toolkit-Mar-2018_508.pdf
10. Liu V, Lei X, Prescott HC, Kipnis P, Iwashyna TJ, Escobar GJ. Hospital readmission and healthcare utilization following sepsis in community settings. J Hosp Med. 2014;9(8):502-507. https://doi.org/10.1002/jhm.2197
11. DeMerle KM, Vincent BM, Iwashyna TJ, Prescott HC. Increased healthcare facility use in veterans surviving sepsis hospitalization. J Crit Care. 2017;42:59-64. https://doi.org/10.1016/j.jcrc.2017.06.026
12. Shankar-Hari M, Saha R, Wilson J, et al. Rate and risk factors for rehospitalisation in sepsis survivors: systematic review and meta-analysis. Intensive Care Med. 2020;46(4):619-636. https://doi.org/10.1007/s00134-019-05908-3
13. Turnbull AE, Sahetya SK, Colantuoni E, Kweku J, Nikooie R, Curtis JR. Inter-rater agreement of intensivists evaluating the goal concordance of preference-sensitive ICU interventions. J Pain Symptom Manage. 2018;56(3):406-413.e3. https://doi.org/10.1016/j.jpainsymman.2018.06.003
14. Wilson CJ, Newman J, Tapper S, et al. Multiple locations of advance care planning documentation in an electronic health record: are they easy to find? J Palliat Med. 2013;16(9):1089-1094. https://doi.org/10.1089/jpm.2012.0472
15. Buck K, Detering KM, Pollard A, et al. Concordance between self-reported completion of advance care planning documentation and availability of documentation in Australian health and residential aged care services. J Pain Symptom Manage. 2019;58(2):264-274. https://.doi.org/10.1016/j.jpainsymman.2019.04.026
Identifying and supporting patients’ care goals through shared decision-making was named the highest priority in the Improving Hospital Outcomes through Patient Engagement (i-HOPE) study.1 Ensuring that seriously ill patients’ goals for their future care are understood and honored is particularly important for patients hospitalized with conditions known to be associated with high near-term mortality or functional disability, such as sepsis. It is increasingly recognized that a hospital admission for sepsis is associated with poor outcomes, including high rates of readmission and postdischarge mortality,2-5 yet little is known about the assessment, status, and stability of patient care goals after discharge for sepsis. Using a cohort of high-risk sepsis survivors enrolled in a clinical trial, we aimed to determine how frequently care goals were documented, describe patterns in care goals, and evaluate how frequently care goals changed over 90 days after sepsis discharge. We also used expert reviewers to assess care delivered in the 90 days after hospitalization and determine the proportion of patients who received goal-concordant care.6,7
METHODS
Design, Setting, Participants
We conducted a secondary analysis using data from the Improving Morbidity During Post-Acute Care Transitions for Sepsis (IMPACTS) study,8 a pragmatic randomized trial evaluating the effectiveness of a multicomponent transition program to reduce mortality and rehospitalization after sepsis among patients enrolled from three hospitals between January 2019 and March 2020 (NCT03865602). The study intervention emphasized preference-sensitive care for patients but did not specifically require documentation of care goals in the electronic health record (EHR).
Data Collection
Clinical and outcomes data were collected from the EHR and enterprise data warehouse. We included data collected as part of routine care at IMPACTS trial enrollment (ie, age at admission, gender, race, marital status, coexisting conditions) and during index hospitalization (ie, organ failures, hospital length of stay, discharge disposition). The Charlson Comorbidity Index score was calculated from diagnosis codes captured during both inpatient and outpatient healthcare encounters in the 12 months prior to trial enrollment. The Centers for Disease Control and Prevention Adult Sepsis Event definitions9 were applied to measure organ failures.
Two palliative care physicians, three internal medicine physicians, and one critical care clinician retrospectively reviewed the EHR of study patients to: (1) identify whether patient care goals were documented in a standardized care alignment tool at discharge or in the subsequent 90 days; (2) categorize each patient’s care goals as focused on longevity, function, or comfort6 using either standardized documentation or unstructured information from the EHR; and (3) determine whether care goals changed over the first 90 days after discharge. Reviewers also classified care received over the 90-day postdischarge period as focused on longevity, function, or comfort. A random sample of 75 cases was selected for double review by a palliative care reviewer to assess interrater agreement in these assessments. Reviewers indicated whether the goal changed and, if so, what the new goal was. The data collection form is provided in the Appendix. The study was approved by the Atrium Health Institutional Review Board.
Outcomes
The primary outcome was the proportion of cases with care goals documented in the standardized care alignment tool, an EHR-embedded tool prompting questions about goals for future health states, including choices among longevity-, function-, and comfort-focused goals. A secondary outcome was the proportion of cases for which a goal could be determined using all information available in the EHR, such as family meeting notes, discharge summaries, and inpatient or outpatient visit notes. We also measured the proportion of patients who received goal-concordant care, defined as agreement between reviewers’ categorizations of patients’ goals and the primary focus of the care delivered, using a well-defined approach.6 In this approach, reviewers first categorized the care delivered during the 90 days after hospital discharge as focused on longevity, function, or comfort using clinical documentation in each patient’s medical record. To enhance transparency of this decision process, reviewers indicated which specific treatments (eg, new medications, hospital admission, hospice enrollment) supported their categorization. Reviewers then separately categorized the patient’s primary goal over the same period. Reviewer training emphasized that classifications of goals and care delivered should be independent. Patients were considered to have received goal-concordant care if the category of care delivered matched the category of the primary care goal. For patients with changing goals, care delivered was compared with the most recent documented goal.
Analyses
We characterized distributions of care goals and care delivered and reported rates of goal-concordant care overall and by care goals. We calculated weighted kappa statistics to assess interrater reliability. We conducted a multivariable logistic regression analysis in the full cohort to evaluate the association of standardized care goal documentation in the EHR with the dependent outcome of goal-concordant care, adjusting for other risk factors (ie, gender, race, marital status, coexisting chronic conditions, organ failures, and hospital length of stay).
RESULTS
Characterization of Sepsis Survivors’ Goals
The Figure shows patterns of goal documentation and goal-concordant care in the study cohort. Care goals for sepsis survivors were documented in the standardized EHR care alignment tool at discharge for 130 (19%) patients. When reviewers used all information available in the EHR to categorize goals (73% interrater agreement; interrater reliability by weighted κ, 0.71; 95% CI, 0.58-0.83), reviewers were able to categorize patients’ goals in 269 (40%) cases. Among those categorized, goals were classified as prioritizing longevity in 95 (35%), function in 141 (52%), and comfort in 33 (12%) cases.
Goals changed over the 90-day observation period for 41 (6%) patients. Of patients whose goals changed, 15 (37%) initially had a goal focused on longevity, 24 (59%) had a goal focused on function, and 2 (5%) had a goal focused on comfort. Of goals that changed, the most frequent new goal was comfort, which was documented in 33 (80%) patients.
Characterization of Goal-Concordant Care
Interrater reliability was moderate for reviewer-based determination of care delivered (73% interrater agreement; weighted κ, 0.60; 95% CI, 0.43-0.78). Reviewers categorized care delivered as focused on longevity in 374 (55%), function in 290 (43%), and comfort in 13 (2%) patients, with <1% unable to be determined. Care elements most frequently cited for longevity-focused classification included intensive care unit (ICU) stay (39%) and new medications for nonsymptom benefit (29%). Care elements most frequently cited for function-focused classification included new medications for nonsymptom benefit (50%) and new medication for symptom benefit (41%). Care elements most frequently cited for comfort-focused classification included hospice enrollment (50%) and new medications for symptom benefit (48%). The rate of goal-concordant care was 68% among those with care goals determined and 27% when cases with unknown goals were classified as not concordant. Concordance was highest among those with longevity-focused (72%) and function-focused (73%) care goals compared with comfort-focused (39%) care goals (P < .01). Adjusting for other potential risk factors, completion of the standardized EHR care alignment tool was associated with higher odds of receiving goal-concordant care (OR, 3.6; 95% CI, 2.4-5.5).
DISCUSSION
Our study identified deficits in the current delivery of goal-concordant care in the first 90 days after sepsis hospitalization. First, goals were only documented in the standardized EHR care alignment tool in one-fifth of cases. Otherwise, information about goals, values, and treatment preferences of sepsis patients was documented idiosyncratically in progress notes, which may not be apparent to clinicians involved in patients’ future care. Lack of clinician attention to documenting the goals of sepsis patients post discharge may reflect suboptimal awareness of the lasting health consequences of sepsis, including persistently elevated risk of mortality up to 2 years following the index hospitalization.2-5 Second, even when goals could be classified by reviewers, the focus of care delivered did not match patients’ goals in nearly one-third of cases.
Our findings inspire several considerations for postsepsis care during hospitalization or in the peridischarge period. First, efforts should focus on increasing assessment and documentation of sepsis survivors’ goals—this might begin with enhanced education about the lasting health consequences after sepsis and communication skills training. Importantly, sepsis survivors’ goals were relatively stable over 90 days after discharge, suggesting that hospitalization for sepsis represents an important opportunity to assess and document patients’ goals. Improving documentation of care goals explicitly in a standardized EHR tool may be an important target for quality-improvement initiatives, as this practice was associated with higher odds of receiving goal-concordant care in our cohort. Second, our findings that one-third of patients received care that was not consistent with their goals is worrisome. Concordance was lowest among comfort-focused care goals, suggesting that some of the high rates of healthcare utilization after sepsis may be unwanted.10-12 For example, ICU stay and new medication for nonsymptom benefit were commonly cited as indications of longevity-focused care among patients with comfort-focused goals. Thus, improving the alignment between sepsis survivors’ goals and subsequent care received is an important target from both a patient-centered and value perspective. Consistent with the recommendations of the i-HOPE study,1 future interventions designed to improve posthospitalization care of sepsis patients should aim to capture goal-concordant care as a patient-centered outcome, if possible.
Our examination of goals and goal-concordant care after sepsis hospitalization advances the goal of enhancing understanding of survivorship in this population.4 Strengths of this study include the large, real-world sample and use of expert palliative care physicians conducting granular EHR review to assess goal-concordant care. Our utilization of this methodology to evaluate goal-concordant care provides information to refine efforts toward developing reliable measures of this important outcome—for example, interrater reliability was similar among reviewers in our study compared with studies assessing goal-concordant care using similar methodology.13
Limitations include potential generalizability challenges for goal and goal-concordant care assessments in other health systems with different EHR platforms or local documentation practices, although deficits in EHR documentation of care goals have been reported in other settings.14,15 We double-reviewed a sample of cases to evaluate interrater reliability, but double-review of all cases with a discussion and adjudication approach may have increased the number of goals that could ultimately be classified. However, this might overestimate the number of goals that are identifiable in real-world practice by a treating clinician. Finally, reviewers may have been challenged to select one goal when two or more competing goals existed. Future refinements of goal-concordant care measurement will need to define methods for handling tradeoffs and prioritization associated with competing goals.
CONCLUSION
The hospitalization and peridischarge periods represent an important opportunity to address deficits in the documentation of goals and provision of goal-concordant care for sepsis survivors. Doing so may improve patient-centered care and reduce the high rates of healthcare utilization after sepsis.
1. Harrison JD, Archuleta M, Avitia E, et al. Developing a patient- and family-centered research agenda for hospital medicine: the Improving Hospital Outcomes through Patient Engagement (i-HOPE) study. J Hosp Med. 2020;15(6):331-337. https://doi.org/10.12788/jhm.3386
2. Courtright KR, Jordan L, Murtaugh CM, et al. Risk factors for long-term mortality and patterns of end-of-life care among Medicare sepsis survivors discharged to home health care. JAMA Netw Open. 2020 ;3(2):e200038. https://doi.org/10.1001/jamanetworkopen.2020.0038
3. Prescott HC, Angus DC. Enhancing recovery from sepsis: a review. JAMA. 2018;319(1):62-75. https://doi.org/10.1001/jama.2017.17687
4. Prescott HC, Iwashyna TJ, Blackwood B, et al. Understanding and enhancing sepsis survivorship. Priorities for research and practice. Am J Respir Crit Care Med. 2019;200(8):972-981. https://doi.org/10.1164/rccm.201812-2383CP
5. Prescott HC, Osterholzer JJ, Langa KM, Angus DC, Iwashyna TJ. Late mortality after sepsis: propensity matched cohort study. BMJ. 2016;353:i2375. https://doi.org/10.1136/bmj.i2375
6. Halpern SD. Goal-concordant care - searching for the Holy Grail. N Engl J Med. 2019;381(17):1603-1606. https://doi.org/10.1056/NEJMp1908153
7. Ernecoff NC, Wessell KL, Bennett AV, Hanson LC. Measuring goal-concordant care in palliative care research. J Pain Symptom Manage. 2021;62(3):e305-e314. https://doi.org/10.1016/j.jpainsymman.2021.02.030
8. Kowalkowski M, Chou SH, McWilliams A, et al. Structured, proactive care coordination versus usual care for Improving Morbidity during Post-Acute Care Transitions for Sepsis (IMPACTS): a pragmatic, randomized controlled trial. Trials. 2019;20(1):660. https://doi.org/10.1186/s13063-019-3792-7
9. Centers for Disease Control and Prevention. Hospital Toolkit for Adult Sepsis Surveillance. March 2018. Accessed September 20, 2021. https://www.cdc.gov/sepsis/pdfs/Sepsis-Surveillance-Toolkit-Mar-2018_508.pdf
10. Liu V, Lei X, Prescott HC, Kipnis P, Iwashyna TJ, Escobar GJ. Hospital readmission and healthcare utilization following sepsis in community settings. J Hosp Med. 2014;9(8):502-507. https://doi.org/10.1002/jhm.2197
11. DeMerle KM, Vincent BM, Iwashyna TJ, Prescott HC. Increased healthcare facility use in veterans surviving sepsis hospitalization. J Crit Care. 2017;42:59-64. https://doi.org/10.1016/j.jcrc.2017.06.026
12. Shankar-Hari M, Saha R, Wilson J, et al. Rate and risk factors for rehospitalisation in sepsis survivors: systematic review and meta-analysis. Intensive Care Med. 2020;46(4):619-636. https://doi.org/10.1007/s00134-019-05908-3
13. Turnbull AE, Sahetya SK, Colantuoni E, Kweku J, Nikooie R, Curtis JR. Inter-rater agreement of intensivists evaluating the goal concordance of preference-sensitive ICU interventions. J Pain Symptom Manage. 2018;56(3):406-413.e3. https://doi.org/10.1016/j.jpainsymman.2018.06.003
14. Wilson CJ, Newman J, Tapper S, et al. Multiple locations of advance care planning documentation in an electronic health record: are they easy to find? J Palliat Med. 2013;16(9):1089-1094. https://doi.org/10.1089/jpm.2012.0472
15. Buck K, Detering KM, Pollard A, et al. Concordance between self-reported completion of advance care planning documentation and availability of documentation in Australian health and residential aged care services. J Pain Symptom Manage. 2019;58(2):264-274. https://.doi.org/10.1016/j.jpainsymman.2019.04.026
© 2021 Society of Hospital Medicine
Defining Potential Overutilization of Physical Therapy Consults on Hospital Medicine Services
During hospitalization, patients spend 87% to 100% of their time in bed.1 This prolonged immobilization is a key contributor to the development of hospital-associated disability (HAD), defined as a new loss of ability to complete one or more activities of daily living (ADLs) without assistance after hospital discharge. HAD can lead to readmissions, institutionalization, and death and occurs in approximately one-third of all hospitalized patients.2,3 The most effective way to prevent HAD is by mobilizing patients early and throughout their hospitalization.4 Typically, physical therapists are the primary team members responsible for mobilizing patients, but they are a constrained resource in most inpatient settings.
The Activity Measure-Post Acute Care Inpatient Mobility Short Form (AM-PAC IMSF) is a validated tool for measuring physical function.5 The AM-PAC score has been used to predict discharge destination within 48 hours of admission6 and as a guide to allocate inpatient therapy referrals on a medical and a neurosurgical service.7,8 To date, however, no studies have used AM-PAC scores to evaluate overutilization of physical therapy consults on direct care hospital medicine services. In this study, we aimed to assess the potential overutilization of physical therapy consults on direct care hospital medicine services using validated AM-PAC score cutoffs.
METHODS
Study Design and Setting
We analyzed a retrospective cohort of admissions from September 30, 2018, through September 29, 2019, on all direct care hospital medicine services at the University of Chicago Medical Center (UC), Illinois. These services included general medicine, oncology, transplant (renal, lung, and liver), cardiology, and cirrhotic populations at the medical-surgical and telemetry level of care. All patients were hospitalized for longer than 48 hours. Patients who left against medical advice; died; were discharged to hospice, another hospital, or an inpatient psychiatric facility; or received no physical therapy referral during admission were excluded. For the remaining patients, we obtained age, sex, admission and discharge dates, admission and discharge AM-PAC scores, and discharge disposition.
Mobility Measure
At UC, the inpatient mobility protocol requires nursing staff to assess and document AM-PAC mobility scores for each patient at the time of admission and every nursing shift thereafter. They utilize the original version of the AM-PAC “6-Clicks” Basic Mobility score, which includes three questions assessing difficulty with mobility and three questions assessing help needed with mobility activities. It has high interrater reliability, with an intraclass correlation coefficient of 0.85.9
Outcomes and Predictors
The primary outcome was “potential overutilization.” Secondary outcomes were discharge disposition and change in mobility. Our predictors included admission AM-PAC score, age, and sex. Based on previous studies that validated an AM-PAC score of 42.9 (raw score, 17) as a cutoff for predicting discharge to home,6 we defined physical therapy consults as “potentially inappropriate” in patients with admission AM-PAC scores >43.63 (raw score, 18) who were discharged to home. Likewise, in the UC mobility protocol, nursing staff independently mobilize patients with AM-PAC scores >18, another rationale to use this cutoff for defining physical therapy consult inappropriateness. “Discharge to home” was defined as going home with no additional needs or services, going home with outpatient physical therapy, or going home with home health physical therapy services, since none of these require inpatient physical therapy assessment for the order to be placed. Discharge to long-term acute care, skilled nursing facility, subacute rehabilitation facility, or acute rehabilitation facility were considered “discharge to post–acute care.” Loss of mobility was calculated as: discharge AM-PAC − admission AM-PAC, termed delta AM-PAC.
Statistical Analysis
Descriptive statistics were used to summarize age (mean and SD) and age categorized as <65 years or ≥65 years, sex (male or female), admission AM-PAC score (mean and SD) and categorization (≤43.63 or >43.63), discharge AM-PAC score (mean and SD), and discharge destination (home vs post–acute care). Chi-square analysis was used to test for associations between admission AM-PAC score and delta AM-PAC. Two-sample t-test was used to test for difference in mean delta AM-PAC between admission AM-PAC groups. Multivariable logistic regression was used to test for independent associations between age, sex, and admission AM-PAC score and odds of being discharged to home, controlling for length of stay. P values of <.05 were considered statistically significant for all tests. Analyses were performed using Stata statistical software, release 16 (StataCorp LLC).
RESULTS
During the 1-year study period, 3592 admissions with physical therapy consults occurred on the direct care hospital medicine services (58% of all admissions). Mean age was 66.3 years (SD, 15.4 years), and 48% of patients were female. The mean admission AM-PAC score was 43.9 (SD, 11.1), and the mean discharge AM-PAC score was 46.8 (SD, 10.8). In our sample, 38% of physical therapy consults were for patients with an AM-PAC score >43.63 who were discharged to home and were therefore deemed “potential overutilization.” Of those, 40% were for patients who were 65 years or younger (18% of all physical therapy consults) (Table 1).
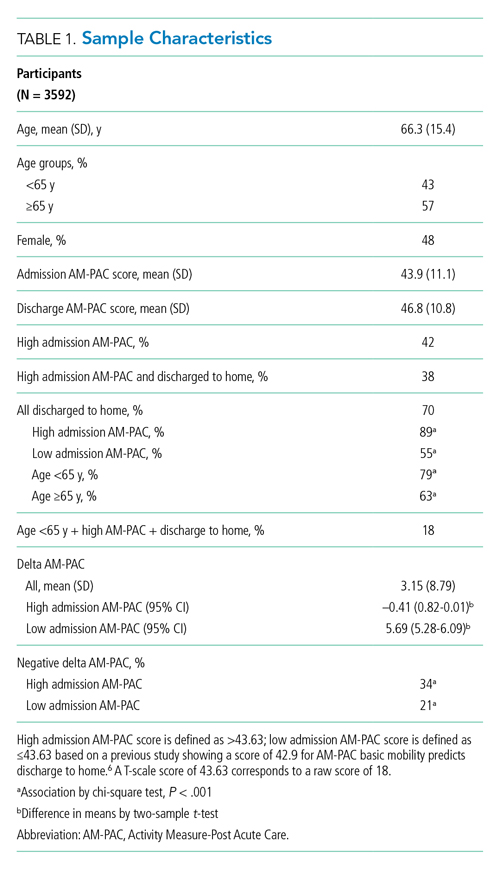
A higher proportion of patients with AM-PAC scores >43.63 were discharged to home compared with those with AM-PAC scores ≤43.63 (89% vs 55%; χ2 [1, N = 3099], 396.5; P < .001). More patients younger than 65 years were discharged to home compared with those 65 years and older (79% vs 63%; χ2 [1, N = 3099], 113.6; P < .001). Additionally, for all patients younger than 65 years, those with AM-PAC score >43.63 were discharged to home more frequently than those with AM-PAC ≤43.63 (92% vs 66%, χ2 [1, N = 1,354], 134.4; P < .001). For 11% (n = 147) of the high-mobility group, the patient was not discharged home but was sent to post–acute care. Reviewing these patient charts showed the reasons for discharge to post–acute care were predominantly personal or social needs (eg, homelessness, need for 24-hour supervision with no family support, patient request) or medical needs (eg, intravenous antibiotics or new tubes, lines, drains, or medications requiring extra nursing support or management). Only 16% of patients in this group (n = 23) experienced deconditioning necessitating physical therapy consult during hospitalization, per their record.
Compared with patients with admission AM-PAC score >43.63, patients with admission AM-PAC ≤43.63 had significantly different changes in mobility as measured by mean delta AM-PAC score (delta AM-PAC, –0.41 for AM-PAC >43.63 vs +5.69 for AM-PAC ≤43.63; t (3097) = –20.3; P < .001) (Table 1).
In multivariate logistic regression, AM-PAC >43.63 (OR, 5.38; 95% CI, 4.36-2.89; P < .001) and age younger than 65 years (OR, 2.40; 95% CI, 1.99-2.90; P < .001) were associated with increased odds of discharge to home (Table 2).
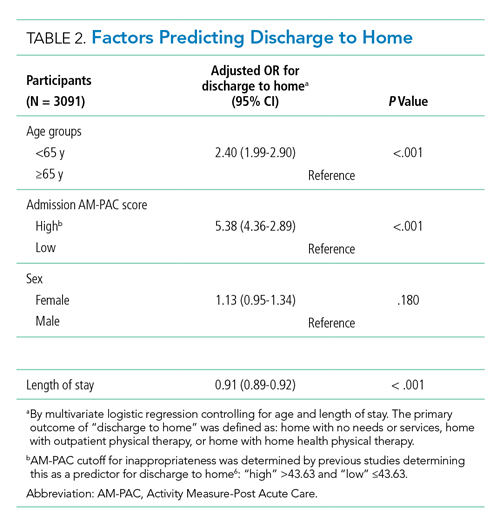
DISCUSSION
In this study, we found that physical therapists may be unnecessarily consulted on direct care hospitalist services as much as 38% of the time based on AM-PAC score. We also demonstrated that patients admitted with high mobility by AM-PAC score are more than five times as likely to be discharged to home. When admitted with high AM-PAC scores, patients had virtually no change in mobility during hospitalization, whereas patients with low AM-PAC scores gained mobility during hospitalization, underscoring the benefit of physical therapy referrals for this group.
Given resource scarcity and cost, achieving optimal physical therapy utilization is an important goal for healthcare systems.10 Appropriate allocation of physical therapy has the potential to improve outcomes from the patient to the payor level. While it may be necessary to consult physical therapy for reasons other than mobility later in the hospitalization, identifying patients who will benefit from skilled physical therapy at the time of admission can help prevent disability and institutionalization and shorten length of stay.5,6 Likewise, decreasing physical therapy referrals for low-risk patients can increase the amount of time spent rehabilitating at-risk patients.
There are limitations of our study worth considering. First, our analyses did not consider whether physical therapy contributed to patients’ ability to return home after discharge. However, in our hospital, patients with AM-PAC >43.63 who cannot safely ambulate independently do progressive mobility with nursing staff. Our physical therapy leadership has also observed that the vast majority of highly mobile patients who are referred for physical therapy ultimately receive no treatment. Second, we did not consider discharge diagnosis, but our patient populations present with a wide variety of conditions, and it is impossible to predict their discharge diagnosis. By not including discharge diagnosis, we assess how AM-PAC performs on admission regardless of the medical condition for which someone is treated. Our hospital treats a high proportion of African American and a low proportion of White, Hispanic, and Asian American patients, limiting the generalizability of our findings. Although the AM-PAC “6-Clicks” score has been shown to have high interrater reliability among physical therapists, our AM-PAC scores are assessed and documented by our nursing staff, which might decrease accuracy. However, one single-center study noted an intraclass correlation coefficient of 0.96 between nurses and physical therapists for the AM-PAC “6-Clicks.”11Despite these limitations, this study underscores the need to be more judicious in the decision to refer a patient for inpatient physical therapy, especially at the time of admission, and demonstrates the utility of using standardized mobility assessment to help in that decision-making process.
1. Fazio S, Stocking J, Kuhn B, et al. How much do hospitalized adults move? A systematic review and meta-analysis. Appl Nurs Res. 2020;51:151189. https://doi.org/10.1016/j.apnr.2019.151189
2. Brown CJ, Redden DT, Flood KL, Allman RM. The underrecognized epidemic of low mobility during hospitalization of older adults. J Am Geriatr Soc. 2009;57(9):1660-1665. https://doi.org/10.1111/j.1532-5415.2009.02393.x
3. Brown C.J, Friedkin RJ, Inouye SK. Prevalence and outcomes of low mobility in hospitalized older patients. J Am Geriatr Soc. 2004;52:1263-1270. https://doi.org/10.1111/j.1532-5415.2004.52354.x
4. Zisberg A, Shadmi E, Gur-Yaish N, Tonkikh O, Sinoff G. Hospital-associated functional decline: the role of hospitalization processes beyond individual risk factors. J Am Geriatr Soc. 2015;63:55-62. https://doi.org/10.1111/jgs.13193
5. Jette DU, Stilphen M, Ranganathan VK, Passek SD, Frost FS, Jette AM. Validity of the AM-PAC “6-Clicks” inpatient daily activity and basic mobility short forms. Phys Ther. 2014;94(3):379-391. https://doi.org/10.2522/ptj.20130199
6. Jette DU, Stilphen M, Ranganathan VK, Passek SD, Frost FS, Jette AM. AM-PAC “6-Clicks” functional assessment scores predict acute care hospital discharge destination. Phys Ther. 2014;94(9):1252-1261. https://doi.org/10.2522/ptj.20130359
7. Probasco JC, Lavezza A, Cassell A, et al. Choosing wisely together: physical and occupational therapy consultation for acute neurology inpatients. Neurohospitalist. 2018;8(2):53-59. https://doi.org/10.1177/1941874417729981
8. Young DL, Colantuoni E, Friedman LA, et al. Prediction of disposition within 48 hours of hospital admission using patient mobility scores. J Hosp Med. 2020;15(9);540-543. https://doi.org/10.12788/jhm.3332
9. Jette DU, Stilphen M, Ranganathan VK, Passek S, Frost FS, Jette AM. Interrater reliability of AM-PAC “6-Clicks” basic mobility and daily activity short forms. Phys Ther. 2015;95(5):758-766. https://doi.org/10.2522/ptj.20140174
10. Juneau A, Bolduc A, Nguyen P, et al. Feasibility of implementing an exercise program in a geriatric assessment unit: the SPRINT program. Can Geriatr J. 2018;21(3):284-289. https://doi.org/10.5770/cgj.21.311
11. Hoyer EH, Young DL, Klein LM, et al. Toward a common language for measuring patient mobility in the hospital: reliability and construct validity of interprofessional mobility measures. Phys Ther. 2018;98(2):133-142. https://doi.org/10.1093/ptj/pzx110
During hospitalization, patients spend 87% to 100% of their time in bed.1 This prolonged immobilization is a key contributor to the development of hospital-associated disability (HAD), defined as a new loss of ability to complete one or more activities of daily living (ADLs) without assistance after hospital discharge. HAD can lead to readmissions, institutionalization, and death and occurs in approximately one-third of all hospitalized patients.2,3 The most effective way to prevent HAD is by mobilizing patients early and throughout their hospitalization.4 Typically, physical therapists are the primary team members responsible for mobilizing patients, but they are a constrained resource in most inpatient settings.
The Activity Measure-Post Acute Care Inpatient Mobility Short Form (AM-PAC IMSF) is a validated tool for measuring physical function.5 The AM-PAC score has been used to predict discharge destination within 48 hours of admission6 and as a guide to allocate inpatient therapy referrals on a medical and a neurosurgical service.7,8 To date, however, no studies have used AM-PAC scores to evaluate overutilization of physical therapy consults on direct care hospital medicine services. In this study, we aimed to assess the potential overutilization of physical therapy consults on direct care hospital medicine services using validated AM-PAC score cutoffs.
METHODS
Study Design and Setting
We analyzed a retrospective cohort of admissions from September 30, 2018, through September 29, 2019, on all direct care hospital medicine services at the University of Chicago Medical Center (UC), Illinois. These services included general medicine, oncology, transplant (renal, lung, and liver), cardiology, and cirrhotic populations at the medical-surgical and telemetry level of care. All patients were hospitalized for longer than 48 hours. Patients who left against medical advice; died; were discharged to hospice, another hospital, or an inpatient psychiatric facility; or received no physical therapy referral during admission were excluded. For the remaining patients, we obtained age, sex, admission and discharge dates, admission and discharge AM-PAC scores, and discharge disposition.
Mobility Measure
At UC, the inpatient mobility protocol requires nursing staff to assess and document AM-PAC mobility scores for each patient at the time of admission and every nursing shift thereafter. They utilize the original version of the AM-PAC “6-Clicks” Basic Mobility score, which includes three questions assessing difficulty with mobility and three questions assessing help needed with mobility activities. It has high interrater reliability, with an intraclass correlation coefficient of 0.85.9
Outcomes and Predictors
The primary outcome was “potential overutilization.” Secondary outcomes were discharge disposition and change in mobility. Our predictors included admission AM-PAC score, age, and sex. Based on previous studies that validated an AM-PAC score of 42.9 (raw score, 17) as a cutoff for predicting discharge to home,6 we defined physical therapy consults as “potentially inappropriate” in patients with admission AM-PAC scores >43.63 (raw score, 18) who were discharged to home. Likewise, in the UC mobility protocol, nursing staff independently mobilize patients with AM-PAC scores >18, another rationale to use this cutoff for defining physical therapy consult inappropriateness. “Discharge to home” was defined as going home with no additional needs or services, going home with outpatient physical therapy, or going home with home health physical therapy services, since none of these require inpatient physical therapy assessment for the order to be placed. Discharge to long-term acute care, skilled nursing facility, subacute rehabilitation facility, or acute rehabilitation facility were considered “discharge to post–acute care.” Loss of mobility was calculated as: discharge AM-PAC − admission AM-PAC, termed delta AM-PAC.
Statistical Analysis
Descriptive statistics were used to summarize age (mean and SD) and age categorized as <65 years or ≥65 years, sex (male or female), admission AM-PAC score (mean and SD) and categorization (≤43.63 or >43.63), discharge AM-PAC score (mean and SD), and discharge destination (home vs post–acute care). Chi-square analysis was used to test for associations between admission AM-PAC score and delta AM-PAC. Two-sample t-test was used to test for difference in mean delta AM-PAC between admission AM-PAC groups. Multivariable logistic regression was used to test for independent associations between age, sex, and admission AM-PAC score and odds of being discharged to home, controlling for length of stay. P values of <.05 were considered statistically significant for all tests. Analyses were performed using Stata statistical software, release 16 (StataCorp LLC).
RESULTS
During the 1-year study period, 3592 admissions with physical therapy consults occurred on the direct care hospital medicine services (58% of all admissions). Mean age was 66.3 years (SD, 15.4 years), and 48% of patients were female. The mean admission AM-PAC score was 43.9 (SD, 11.1), and the mean discharge AM-PAC score was 46.8 (SD, 10.8). In our sample, 38% of physical therapy consults were for patients with an AM-PAC score >43.63 who were discharged to home and were therefore deemed “potential overutilization.” Of those, 40% were for patients who were 65 years or younger (18% of all physical therapy consults) (Table 1).
A higher proportion of patients with AM-PAC scores >43.63 were discharged to home compared with those with AM-PAC scores ≤43.63 (89% vs 55%; χ2 [1, N = 3099], 396.5; P < .001). More patients younger than 65 years were discharged to home compared with those 65 years and older (79% vs 63%; χ2 [1, N = 3099], 113.6; P < .001). Additionally, for all patients younger than 65 years, those with AM-PAC score >43.63 were discharged to home more frequently than those with AM-PAC ≤43.63 (92% vs 66%, χ2 [1, N = 1,354], 134.4; P < .001). For 11% (n = 147) of the high-mobility group, the patient was not discharged home but was sent to post–acute care. Reviewing these patient charts showed the reasons for discharge to post–acute care were predominantly personal or social needs (eg, homelessness, need for 24-hour supervision with no family support, patient request) or medical needs (eg, intravenous antibiotics or new tubes, lines, drains, or medications requiring extra nursing support or management). Only 16% of patients in this group (n = 23) experienced deconditioning necessitating physical therapy consult during hospitalization, per their record.
Compared with patients with admission AM-PAC score >43.63, patients with admission AM-PAC ≤43.63 had significantly different changes in mobility as measured by mean delta AM-PAC score (delta AM-PAC, –0.41 for AM-PAC >43.63 vs +5.69 for AM-PAC ≤43.63; t (3097) = –20.3; P < .001) (Table 1).
In multivariate logistic regression, AM-PAC >43.63 (OR, 5.38; 95% CI, 4.36-2.89; P < .001) and age younger than 65 years (OR, 2.40; 95% CI, 1.99-2.90; P < .001) were associated with increased odds of discharge to home (Table 2).
DISCUSSION
In this study, we found that physical therapists may be unnecessarily consulted on direct care hospitalist services as much as 38% of the time based on AM-PAC score. We also demonstrated that patients admitted with high mobility by AM-PAC score are more than five times as likely to be discharged to home. When admitted with high AM-PAC scores, patients had virtually no change in mobility during hospitalization, whereas patients with low AM-PAC scores gained mobility during hospitalization, underscoring the benefit of physical therapy referrals for this group.
Given resource scarcity and cost, achieving optimal physical therapy utilization is an important goal for healthcare systems.10 Appropriate allocation of physical therapy has the potential to improve outcomes from the patient to the payor level. While it may be necessary to consult physical therapy for reasons other than mobility later in the hospitalization, identifying patients who will benefit from skilled physical therapy at the time of admission can help prevent disability and institutionalization and shorten length of stay.5,6 Likewise, decreasing physical therapy referrals for low-risk patients can increase the amount of time spent rehabilitating at-risk patients.
There are limitations of our study worth considering. First, our analyses did not consider whether physical therapy contributed to patients’ ability to return home after discharge. However, in our hospital, patients with AM-PAC >43.63 who cannot safely ambulate independently do progressive mobility with nursing staff. Our physical therapy leadership has also observed that the vast majority of highly mobile patients who are referred for physical therapy ultimately receive no treatment. Second, we did not consider discharge diagnosis, but our patient populations present with a wide variety of conditions, and it is impossible to predict their discharge diagnosis. By not including discharge diagnosis, we assess how AM-PAC performs on admission regardless of the medical condition for which someone is treated. Our hospital treats a high proportion of African American and a low proportion of White, Hispanic, and Asian American patients, limiting the generalizability of our findings. Although the AM-PAC “6-Clicks” score has been shown to have high interrater reliability among physical therapists, our AM-PAC scores are assessed and documented by our nursing staff, which might decrease accuracy. However, one single-center study noted an intraclass correlation coefficient of 0.96 between nurses and physical therapists for the AM-PAC “6-Clicks.”11Despite these limitations, this study underscores the need to be more judicious in the decision to refer a patient for inpatient physical therapy, especially at the time of admission, and demonstrates the utility of using standardized mobility assessment to help in that decision-making process.
1. Fazio S, Stocking J, Kuhn B, et al. How much do hospitalized adults move? A systematic review and meta-analysis. Appl Nurs Res. 2020;51:151189. https://doi.org/10.1016/j.apnr.2019.151189
2. Brown CJ, Redden DT, Flood KL, Allman RM. The underrecognized epidemic of low mobility during hospitalization of older adults. J Am Geriatr Soc. 2009;57(9):1660-1665. https://doi.org/10.1111/j.1532-5415.2009.02393.x
3. Brown C.J, Friedkin RJ, Inouye SK. Prevalence and outcomes of low mobility in hospitalized older patients. J Am Geriatr Soc. 2004;52:1263-1270. https://doi.org/10.1111/j.1532-5415.2004.52354.x
4. Zisberg A, Shadmi E, Gur-Yaish N, Tonkikh O, Sinoff G. Hospital-associated functional decline: the role of hospitalization processes beyond individual risk factors. J Am Geriatr Soc. 2015;63:55-62. https://doi.org/10.1111/jgs.13193
5. Jette DU, Stilphen M, Ranganathan VK, Passek SD, Frost FS, Jette AM. Validity of the AM-PAC “6-Clicks” inpatient daily activity and basic mobility short forms. Phys Ther. 2014;94(3):379-391. https://doi.org/10.2522/ptj.20130199
6. Jette DU, Stilphen M, Ranganathan VK, Passek SD, Frost FS, Jette AM. AM-PAC “6-Clicks” functional assessment scores predict acute care hospital discharge destination. Phys Ther. 2014;94(9):1252-1261. https://doi.org/10.2522/ptj.20130359
7. Probasco JC, Lavezza A, Cassell A, et al. Choosing wisely together: physical and occupational therapy consultation for acute neurology inpatients. Neurohospitalist. 2018;8(2):53-59. https://doi.org/10.1177/1941874417729981
8. Young DL, Colantuoni E, Friedman LA, et al. Prediction of disposition within 48 hours of hospital admission using patient mobility scores. J Hosp Med. 2020;15(9);540-543. https://doi.org/10.12788/jhm.3332
9. Jette DU, Stilphen M, Ranganathan VK, Passek S, Frost FS, Jette AM. Interrater reliability of AM-PAC “6-Clicks” basic mobility and daily activity short forms. Phys Ther. 2015;95(5):758-766. https://doi.org/10.2522/ptj.20140174
10. Juneau A, Bolduc A, Nguyen P, et al. Feasibility of implementing an exercise program in a geriatric assessment unit: the SPRINT program. Can Geriatr J. 2018;21(3):284-289. https://doi.org/10.5770/cgj.21.311
11. Hoyer EH, Young DL, Klein LM, et al. Toward a common language for measuring patient mobility in the hospital: reliability and construct validity of interprofessional mobility measures. Phys Ther. 2018;98(2):133-142. https://doi.org/10.1093/ptj/pzx110
© 2021 Society of Hospital Medicine
Objective Measures of Physical Distancing in the Hospital During the COVID-19 Pandemic
The COVID-19 pandemic dramatically altered how healthcare providers care for hospitalized patients. Many hospitals provided physical-distancing guidance to minimize viral transmission and preserve personal protective equipment. This guidance informed clinician behavior on rounds and in workspaces.1 One study reported that clinicians maintained distance from patients by grouping medical interventions, utilizing telemedicine for rounding and consultations, and implementing respiratory isolation units (RIUs) to cohort patients with COVID-19.2
Although physical distancing is recommended during inpatient care, no study to date has used objective measures to quantify the degree to which clinical practice was influenced. We aimed to objectively quantify changes in 24-hour patient room–entries before and during the COVID-19 pandemic using data from existing heat sensors to assess differences in physical distancing in RIUs and general medicine units.
METHODS
Study Design
A single-institution study was conducted at the University of Chicago Medicine, Illinois. Room entries were compared between a general medicine unit that transitioned to an RIU (unit A/RIU) and four general medicine units (unit B) using 24-hour patient room–entry data. Unit A was commissioned as an RIU to care exclusively for patients with confirmed COVID-19 on March 25, 2020, and decommissioned on June 23, 2020. Unit B cared for patients under investigation (PUIs) for COVID-19 and patients admitted for other reasons. PUIs were transferred to the RIU if positive for COVID-19. Hospital visitor restrictions were implemented on March 14, 2020, and lifted on June 29, 2020. The University of Chicago Institutional Review Board granted this project an exempt determination.
Data Collection
From January 1, 2020, to August 10, 2020, room-entry data were collected using the PURELL SMARTLINK hand-hygiene system (GOJO Industries, Inc.). This hand-hygiene compliance system tracks unit-level sanitizer dispenses and total room entries and exits via body heat sensors. Similar to our prior studies, this study extracted heat-sensor data to monitor room entries.3,4
Data Analysis
Objective 24-hour room-entry data were analyzed for all units. Rooms with less than two daily entries were assumed to be unoccupied and excluded from the analysis. Hospital-wide physical-distancing guidance published on March 10, 2020, was used to delineate “prepandemic” and “pandemic” periods. Each department adopted these recommendations (eg, physical distancing, conducting prerounds virtually, limiting the number of people seeing patients, using iPads for virtual patient visits) as appropriate.
Interrupted time series analyses were used to examine room-entry changes before and during the pandemic. The segmented function in R 4.0.2 (R Core Team) was used to create a model and estimate final fitting parameters, uncertainties, and data breakpoints using a bootstrap restarting algorithm.5 The Davies test was used to determine statistical significance of breakpoints, which was defined as P < .05.
RESULTS
We examined data from January 1, 2020, to August 10, 2020, from 3283 patients who collectively experienced 655,615 room entries. Unit A/RIU cared for 395 patients during the prepandemic period and 542 patients during the pandemic period. Compared with patients from the prepandemic period, patients during the pandemic period were more likely to be Black (73.7% vs 77.9%) and less likely to be White (17.0% vs 8.7%) (P = .002); were less likely to have respiratory (19.8% vs 8.0%, P < .001) or gastrointestinal (12.4% vs 6.5%, P = .008) primary diagnoses; and had a higher mean case-mix index (1.74 vs 2.38, P < .001) (Table).
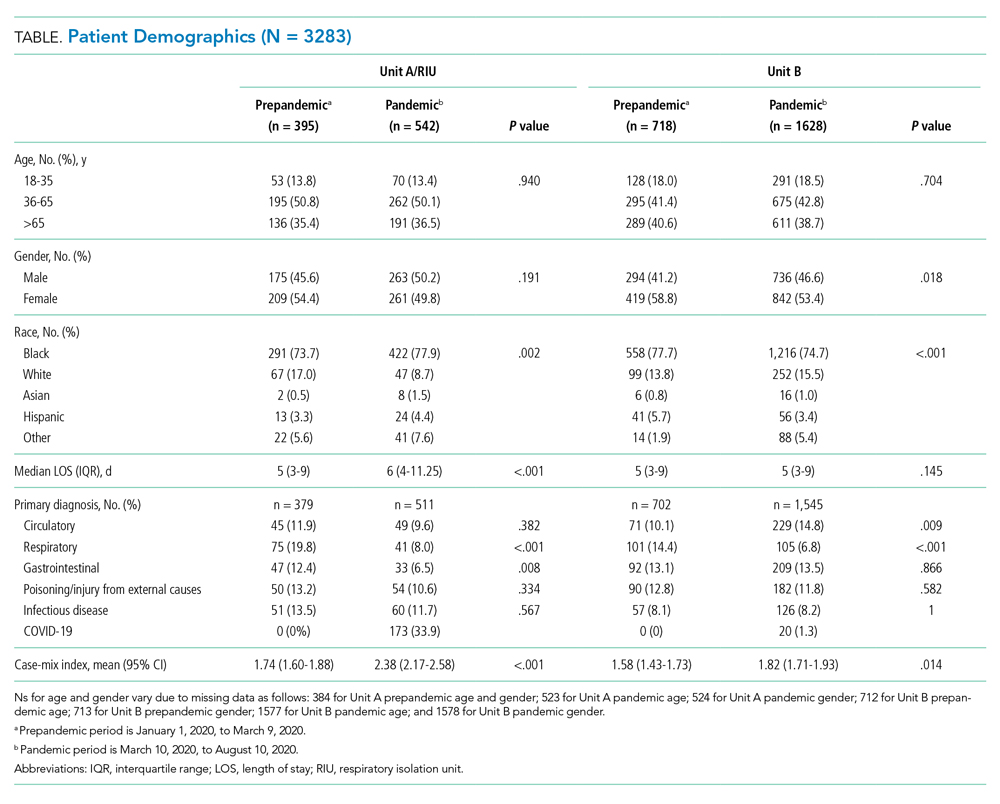
Unit B had 718 patients during the prepandemic period and 1628 patients during the pandemic period. Compared with patients from the prepandemic period, patients during the pandemic period were less likely to be female (58.8% vs 53.4%, P = .018); less likely to be Black (77.7% vs 74.7%) and Hispanic (5.7% vs 3.4%) (P < .001); more likely to have circulatory (10.1% vs 14.8%, P = .009) primary diagnoses; less likely to have respiratory (14.4% vs 6.8%, P < .001) primary diagnoses; and had a higher mean case-mix index (1.58 vs 1.82, P = .014) (Table).
During the prepandemic period, unit A/RIU averaged 27 occupied rooms per day. These rooms averaged 85.0 entries per room per day, with no statistically significant change over time. During the pandemic period, this unit averaged 24 daily occupied rooms, and these rooms averaged 44.4 entries per room per day. At the start of the pandemic, daily entries per room decreased by 51.9 (95% CI, 51.1-52.7). This equated to a 60.6% reduction from baseline (95% CI, 59.6%-61.5%; P < .001), with the lowest average occurring after RIU conversion on March 25, 2020 (letter F in Figure, A). Entries remained constant through the end of statewide stay-at-home orders (letter G in Figure, A) until RIU decommission on June 23, 2020 (letter H in Figure, A). Entries then increased by an average of 0.150 entries per room per day (95% CI, 0.097-0.202; P < .001), reaching 52.5 daily entries on August 10, 2020. This equated to 61.3% of prepandemic levels (95% CI, 61.3%-61.6%; P < .001) (Figure, A).
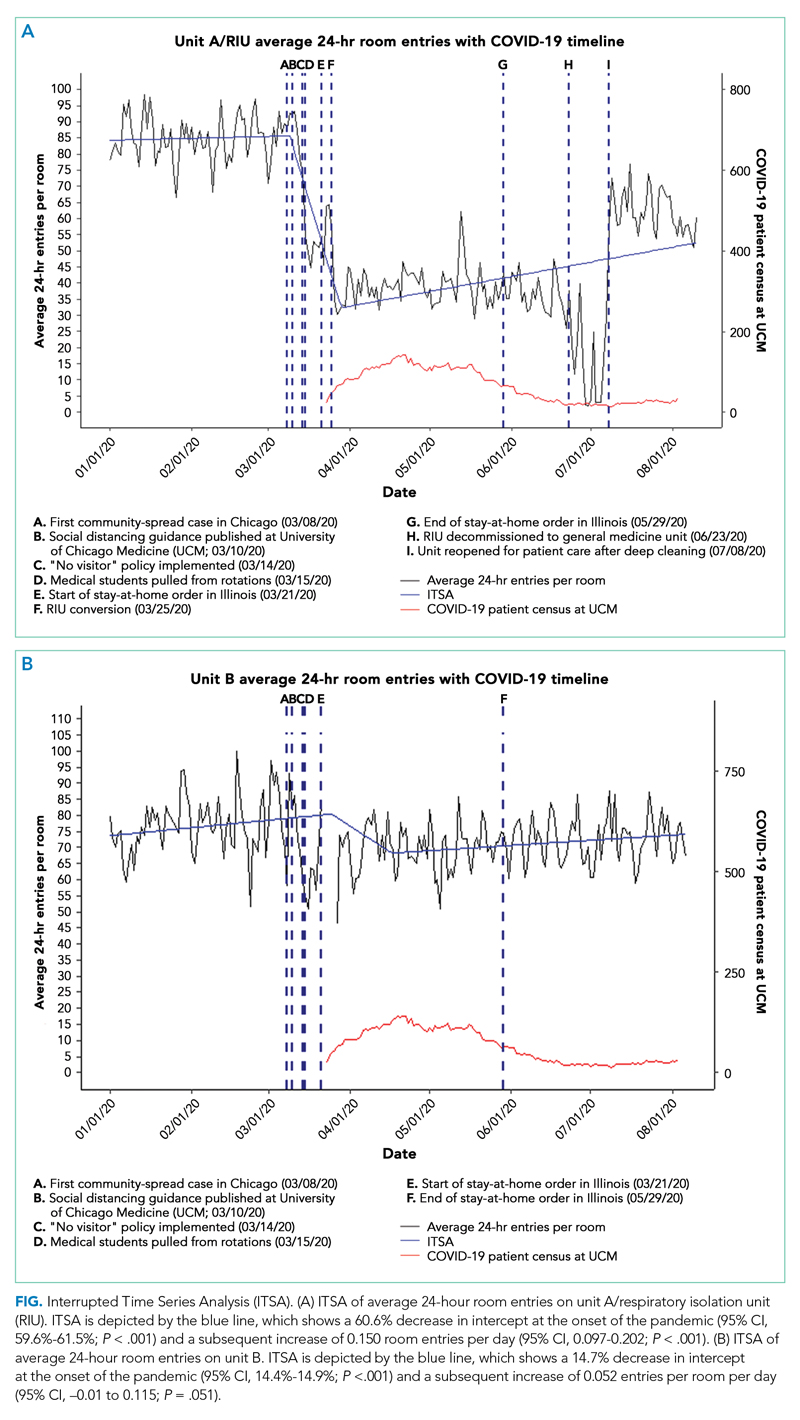
During the prepandemic period, Unit B averaged 63 daily occupied rooms, and these rooms averaged 76.9 entries per room per day, with no statistically significant change over time. During the pandemic period, these units averaged 64 daily occupied rooms, and these rooms averaged 72.4 entries per room per day. Briefly, at the start of the pandemic, daily entries per room decreased by 11.8 (95% CI, 11.6-12), equating to a 14.7% reduction from baseline (95% CI, 14.4%-14.9%; P < .001). Entries then increased by an average of 0.052 entries per room per day (95% CI, –0.01 to 0.115; P = .051), stabilizing in early August 2020 at an average of 74.1 daily entries. This equated to 92.2% of prepandemic levels (95% CI, 92%-92.3%; P < .001) (Figure, B).
Unit A/RIU experienced significantly greater average daily room entries during the prepandemic period (P < .001) and significantly fewer average daily room entries during the pandemic period (P < .001) than unit B. Although unit A and unit B cared for similar patient populations prior to the pandemic, unit B was located in a different building from the resident work room. This likely resulted in batched visits to patients, leading to fewer total room entries per day.
DISCUSSION
This is the first study to measure 24-hour patient room– entries as an objective proxy for physical distancing during the pandemic. Unit A/RIU saw an initial 60.6% decrease in room entries. In contrast, unit B, which cared for PUIs, saw a brief 14.7% decrease in room entries before returning to baseline. In all units, room entries increased over time, although this increase was greater in unit B.
Despite the institutional recommendation of physical distancing, only unit A/RIU saw a large and sustained decrease in room entries. The presence of patients with COVID-19 within this unit likely reminded clinicians of the ongoing need to physically distance. Clinicians may have been fearful of contracting COVID-19 and therefore more stringently followed physical-distancing guidance.
Changes in unit A/RIU room entries tracked with RIU conversion and decommission timeline (letters F and H in Figure, A, respectively) rather than statewide stay-at-home orders (letters E and G in Figure, A). Caring for patients with COVID-19 within the unit might have influenced clinician physical distancing more than state policy. Correspondingly, as the number of hospitalized patients with COVID-19 decreased, room entries trended toward baseline. The difficulty of sustaining behavioral changes has been demonstrated in healthcare settings, including at our own institution.6-8 This gradual extinction in physical distancing could be due to several factors, such as fewer patients with COVID-19 or staff fatigue. Physical distancing may have been more extreme and suboptimal for care at the beginning of the pandemic owing to uncertainty or fear.
This work has implications for how to monitor physical distancing in healthcare facilities. Our study shows that behaviors can change rapidly, but sustaining change is difficult. This suggests the need for regular reinforcement of physical distancing with all staff. Additionally, cohorting patients on RIUs may result in greater physical distancing. It also highlights that PUIs serve as less of a cue to promote physical distancing, possibly due to increased confidence in and availability of COVID-19 tests and/or precautions fatigue.9 Objective room-entry monitoring systems, such as the one used in this study, can provide hospital leaders with crucial real-time feedback to monitor physical distancing practices and determine when and where re-education may be needed.
This study was conducted at a single urban, academic medical center, limiting its generalizability. Many other hospital policies implemented at the beginning of the pandemic may have influenced our results. We are unable to examine the type of clinician entering each room and for how long as well as entries in workrooms and breakrooms. Clinicians were not given real-time or retrospective feedback on room entries during the pandemic period. These data would be important to understand staff responses to physical distancing. Finally, while clinicians responded differently as the pandemic progressed and depending on which unit they were in, the ideal degree of physical distancing remains unknown. Although minimizing patient contact limits nosocomial viral spread, too little contact can also cause harm.
Conclusion
At the onset of the COVID-19 pandemic, 24-hour patient room–entries fell significantly in all units before increasing. This decrease was more pronounced in unit A/RIU. As the pandemic continues, hospitals could consider utilizing novel room-entry monitoring systems to guide physical-distancing implementation and staff education.
Acknowledgment
The authors thank Vera Chu for her support with data requests.
1. Auerbach A, O’Leary KJ, Greysen SR, et al. Hospital ward adaptation during the COVID-19 pandemic: a national survey of academic medical centers. J Hosp Med. 2020;15(8):483-488. https://doi.org/10.12788/jhm.3476
2. Arora VM, Chivu M, Schram A, Meltzer D. Implementing physical distancing in the hospital: a key strategy to prevent nosocomial transmission of COVID-19. J Hosp Med. 2020;15(5):290-291. https://doi.org/10.12788/jhm.3434
3. Erondu AI, Orlov NM, Peirce LB, et al. Characterizing pediatric inpatient sleep duration and disruptions. Sleep Med. 2019;57:87-91. https://doi.org/10.1016/j.sleep.2019.01.030
4. Arora VM, Machado N, Anderson SL, et al. Effectiveness of SIESTA on objective and subjective metrics of nighttime hospital sleep disruptors. J Hosp Med. 2019;14(1):38-41. https://doi.org/10.12788/jhm.3091
5. Muggeo VMR. Segmented: an R package to fit regression models with broken-line relationships. R News. 2008;8:20-25.
6. Cook DJ, Arora VM, Chamberlain M, et al. Improving hospitalized children’s sleep by reducing excessive overnight blood pressure monitoring. Pediatrics. 2020;146(3):e20192217. https://doi.org/10.1542/peds.2019-2217
7. Bernstein M, Hou JK, Weizman AV, et al. Quality improvement primer series: how to sustain a quality improvement effort. Clin Gastroenterol Hepatol. 2016;14(10):1371-1375. https://doi.org/10.1016/j.cgh.2016.05.019
8. Makhni S, Umscheid CA, Soo J, et al. Hand hygiene compliance rate during the COVID-19 pandemic. JAMA Intern Med. 2021;181(7):1006-1008. https://doi.org/10.1001/jamainternmed.2021.1429
9. Ruhnke GW. COVID-19 diagnostic testing and the psychology of precautions fatigue. Cleve Clin J Med. 2020;88(1):19-21. https://doi.org/10.3949/ccjm.88a.20086
The COVID-19 pandemic dramatically altered how healthcare providers care for hospitalized patients. Many hospitals provided physical-distancing guidance to minimize viral transmission and preserve personal protective equipment. This guidance informed clinician behavior on rounds and in workspaces.1 One study reported that clinicians maintained distance from patients by grouping medical interventions, utilizing telemedicine for rounding and consultations, and implementing respiratory isolation units (RIUs) to cohort patients with COVID-19.2
Although physical distancing is recommended during inpatient care, no study to date has used objective measures to quantify the degree to which clinical practice was influenced. We aimed to objectively quantify changes in 24-hour patient room–entries before and during the COVID-19 pandemic using data from existing heat sensors to assess differences in physical distancing in RIUs and general medicine units.
METHODS
Study Design
A single-institution study was conducted at the University of Chicago Medicine, Illinois. Room entries were compared between a general medicine unit that transitioned to an RIU (unit A/RIU) and four general medicine units (unit B) using 24-hour patient room–entry data. Unit A was commissioned as an RIU to care exclusively for patients with confirmed COVID-19 on March 25, 2020, and decommissioned on June 23, 2020. Unit B cared for patients under investigation (PUIs) for COVID-19 and patients admitted for other reasons. PUIs were transferred to the RIU if positive for COVID-19. Hospital visitor restrictions were implemented on March 14, 2020, and lifted on June 29, 2020. The University of Chicago Institutional Review Board granted this project an exempt determination.
Data Collection
From January 1, 2020, to August 10, 2020, room-entry data were collected using the PURELL SMARTLINK hand-hygiene system (GOJO Industries, Inc.). This hand-hygiene compliance system tracks unit-level sanitizer dispenses and total room entries and exits via body heat sensors. Similar to our prior studies, this study extracted heat-sensor data to monitor room entries.3,4
Data Analysis
Objective 24-hour room-entry data were analyzed for all units. Rooms with less than two daily entries were assumed to be unoccupied and excluded from the analysis. Hospital-wide physical-distancing guidance published on March 10, 2020, was used to delineate “prepandemic” and “pandemic” periods. Each department adopted these recommendations (eg, physical distancing, conducting prerounds virtually, limiting the number of people seeing patients, using iPads for virtual patient visits) as appropriate.
Interrupted time series analyses were used to examine room-entry changes before and during the pandemic. The segmented function in R 4.0.2 (R Core Team) was used to create a model and estimate final fitting parameters, uncertainties, and data breakpoints using a bootstrap restarting algorithm.5 The Davies test was used to determine statistical significance of breakpoints, which was defined as P < .05.
RESULTS
We examined data from January 1, 2020, to August 10, 2020, from 3283 patients who collectively experienced 655,615 room entries. Unit A/RIU cared for 395 patients during the prepandemic period and 542 patients during the pandemic period. Compared with patients from the prepandemic period, patients during the pandemic period were more likely to be Black (73.7% vs 77.9%) and less likely to be White (17.0% vs 8.7%) (P = .002); were less likely to have respiratory (19.8% vs 8.0%, P < .001) or gastrointestinal (12.4% vs 6.5%, P = .008) primary diagnoses; and had a higher mean case-mix index (1.74 vs 2.38, P < .001) (Table).
Unit B had 718 patients during the prepandemic period and 1628 patients during the pandemic period. Compared with patients from the prepandemic period, patients during the pandemic period were less likely to be female (58.8% vs 53.4%, P = .018); less likely to be Black (77.7% vs 74.7%) and Hispanic (5.7% vs 3.4%) (P < .001); more likely to have circulatory (10.1% vs 14.8%, P = .009) primary diagnoses; less likely to have respiratory (14.4% vs 6.8%, P < .001) primary diagnoses; and had a higher mean case-mix index (1.58 vs 1.82, P = .014) (Table).
During the prepandemic period, unit A/RIU averaged 27 occupied rooms per day. These rooms averaged 85.0 entries per room per day, with no statistically significant change over time. During the pandemic period, this unit averaged 24 daily occupied rooms, and these rooms averaged 44.4 entries per room per day. At the start of the pandemic, daily entries per room decreased by 51.9 (95% CI, 51.1-52.7). This equated to a 60.6% reduction from baseline (95% CI, 59.6%-61.5%; P < .001), with the lowest average occurring after RIU conversion on March 25, 2020 (letter F in Figure, A). Entries remained constant through the end of statewide stay-at-home orders (letter G in Figure, A) until RIU decommission on June 23, 2020 (letter H in Figure, A). Entries then increased by an average of 0.150 entries per room per day (95% CI, 0.097-0.202; P < .001), reaching 52.5 daily entries on August 10, 2020. This equated to 61.3% of prepandemic levels (95% CI, 61.3%-61.6%; P < .001) (Figure, A).
During the prepandemic period, Unit B averaged 63 daily occupied rooms, and these rooms averaged 76.9 entries per room per day, with no statistically significant change over time. During the pandemic period, these units averaged 64 daily occupied rooms, and these rooms averaged 72.4 entries per room per day. Briefly, at the start of the pandemic, daily entries per room decreased by 11.8 (95% CI, 11.6-12), equating to a 14.7% reduction from baseline (95% CI, 14.4%-14.9%; P < .001). Entries then increased by an average of 0.052 entries per room per day (95% CI, –0.01 to 0.115; P = .051), stabilizing in early August 2020 at an average of 74.1 daily entries. This equated to 92.2% of prepandemic levels (95% CI, 92%-92.3%; P < .001) (Figure, B).
Unit A/RIU experienced significantly greater average daily room entries during the prepandemic period (P < .001) and significantly fewer average daily room entries during the pandemic period (P < .001) than unit B. Although unit A and unit B cared for similar patient populations prior to the pandemic, unit B was located in a different building from the resident work room. This likely resulted in batched visits to patients, leading to fewer total room entries per day.
DISCUSSION
This is the first study to measure 24-hour patient room– entries as an objective proxy for physical distancing during the pandemic. Unit A/RIU saw an initial 60.6% decrease in room entries. In contrast, unit B, which cared for PUIs, saw a brief 14.7% decrease in room entries before returning to baseline. In all units, room entries increased over time, although this increase was greater in unit B.
Despite the institutional recommendation of physical distancing, only unit A/RIU saw a large and sustained decrease in room entries. The presence of patients with COVID-19 within this unit likely reminded clinicians of the ongoing need to physically distance. Clinicians may have been fearful of contracting COVID-19 and therefore more stringently followed physical-distancing guidance.
Changes in unit A/RIU room entries tracked with RIU conversion and decommission timeline (letters F and H in Figure, A, respectively) rather than statewide stay-at-home orders (letters E and G in Figure, A). Caring for patients with COVID-19 within the unit might have influenced clinician physical distancing more than state policy. Correspondingly, as the number of hospitalized patients with COVID-19 decreased, room entries trended toward baseline. The difficulty of sustaining behavioral changes has been demonstrated in healthcare settings, including at our own institution.6-8 This gradual extinction in physical distancing could be due to several factors, such as fewer patients with COVID-19 or staff fatigue. Physical distancing may have been more extreme and suboptimal for care at the beginning of the pandemic owing to uncertainty or fear.
This work has implications for how to monitor physical distancing in healthcare facilities. Our study shows that behaviors can change rapidly, but sustaining change is difficult. This suggests the need for regular reinforcement of physical distancing with all staff. Additionally, cohorting patients on RIUs may result in greater physical distancing. It also highlights that PUIs serve as less of a cue to promote physical distancing, possibly due to increased confidence in and availability of COVID-19 tests and/or precautions fatigue.9 Objective room-entry monitoring systems, such as the one used in this study, can provide hospital leaders with crucial real-time feedback to monitor physical distancing practices and determine when and where re-education may be needed.
This study was conducted at a single urban, academic medical center, limiting its generalizability. Many other hospital policies implemented at the beginning of the pandemic may have influenced our results. We are unable to examine the type of clinician entering each room and for how long as well as entries in workrooms and breakrooms. Clinicians were not given real-time or retrospective feedback on room entries during the pandemic period. These data would be important to understand staff responses to physical distancing. Finally, while clinicians responded differently as the pandemic progressed and depending on which unit they were in, the ideal degree of physical distancing remains unknown. Although minimizing patient contact limits nosocomial viral spread, too little contact can also cause harm.
Conclusion
At the onset of the COVID-19 pandemic, 24-hour patient room–entries fell significantly in all units before increasing. This decrease was more pronounced in unit A/RIU. As the pandemic continues, hospitals could consider utilizing novel room-entry monitoring systems to guide physical-distancing implementation and staff education.
Acknowledgment
The authors thank Vera Chu for her support with data requests.
1. Auerbach A, O’Leary KJ, Greysen SR, et al. Hospital ward adaptation during the COVID-19 pandemic: a national survey of academic medical centers. J Hosp Med. 2020;15(8):483-488. https://doi.org/10.12788/jhm.3476
2. Arora VM, Chivu M, Schram A, Meltzer D. Implementing physical distancing in the hospital: a key strategy to prevent nosocomial transmission of COVID-19. J Hosp Med. 2020;15(5):290-291. https://doi.org/10.12788/jhm.3434
3. Erondu AI, Orlov NM, Peirce LB, et al. Characterizing pediatric inpatient sleep duration and disruptions. Sleep Med. 2019;57:87-91. https://doi.org/10.1016/j.sleep.2019.01.030
4. Arora VM, Machado N, Anderson SL, et al. Effectiveness of SIESTA on objective and subjective metrics of nighttime hospital sleep disruptors. J Hosp Med. 2019;14(1):38-41. https://doi.org/10.12788/jhm.3091
5. Muggeo VMR. Segmented: an R package to fit regression models with broken-line relationships. R News. 2008;8:20-25.
6. Cook DJ, Arora VM, Chamberlain M, et al. Improving hospitalized children’s sleep by reducing excessive overnight blood pressure monitoring. Pediatrics. 2020;146(3):e20192217. https://doi.org/10.1542/peds.2019-2217
7. Bernstein M, Hou JK, Weizman AV, et al. Quality improvement primer series: how to sustain a quality improvement effort. Clin Gastroenterol Hepatol. 2016;14(10):1371-1375. https://doi.org/10.1016/j.cgh.2016.05.019
8. Makhni S, Umscheid CA, Soo J, et al. Hand hygiene compliance rate during the COVID-19 pandemic. JAMA Intern Med. 2021;181(7):1006-1008. https://doi.org/10.1001/jamainternmed.2021.1429
9. Ruhnke GW. COVID-19 diagnostic testing and the psychology of precautions fatigue. Cleve Clin J Med. 2020;88(1):19-21. https://doi.org/10.3949/ccjm.88a.20086
© 2021 Society of Hospital Medicine
Incidentally Detected SARS-COV-2 Among Hospitalized Patients in Los Angeles County, August to October 2020
Many of the 85 hospitals in Los Angeles County (LAC) routinely test patients for SARS-CoV-2, the virus that causes COVID-19, upon admission to the hospital.1 However, not all SARS-CoV-2 detections represent acute COVID-19 for at least two reasons. First, the SARS-CoV-2 real-time polymerase chain reaction (RT-PCR) assay can report a false-positive result.2 Second, approximately 40% to 45% of persons with SARS-CoV-2 infection are asymptomatic, and RT-PCR tests can remain positive more than 2 months after an individual recovers from COVID-19; thus, SARS-CoV-2 detected on admission might represent shedding of nonviable virus from a prior unrecognized or undiagnosed infection.1,3
Public health policymakers closely monitor the rate of COVID-19 hospitalizations because it informs decisions to impose or relax COVID-19 control measures. However, the percentage of hospitalizations misclassified as COVID-19–associated because of incidentally detected SARS-CoV-2 (ie, COVID-19 was not a primary or contributing cause of hospitalization) is unknown. Therefore, we sought to determine the percentage of hospitalizations in LAC classified as having COVID-19 that might have had incidental SARS-CoV-2 detection.
METHODS
The state of California requires healthcare providers to report all COVID-19 cases and clinical laboratories to report all SARS-CoV-2 diagnostic test results. Hospitals in LAC are mandated to report daily lists of all persons hospitalized with suspected or confirmed COVID-19 to the LAC Department of Public Health (DPH) COVID-19 Hospital Electronic Surveillance System (CHESS).4 Hospitals provide daily data to CHESS containing information about patients in their facilities with COVID-19. We conducted a cross-sectional retrospective study by selecting a random set of medical records from CHESS for review.
We began regularly and systematically reviewing medical records of patients in CHESS discharged after August 1, 2020, as part of LAC DPH surveillance to characterize persons experiencing severe COVID-19, defined as illness requiring hospitalization. For severe COVID-19 surveillance, we randomly selected 45 discharged patients per week from CHESS in August 2020 and 50 discharged patients per week between September and October 2020. To ensure that the sample represented the overall age distribution of patients in CHESS, we ordered patients by birth date and selected every k record, where k represented the interval between patients needed to meet the target for the week. Before random sample selection, several free text fields from the CHESS dataset were queried to identify and remove patients who were not LAC residents, were seen in the emergency department but not admitted, were hospitalized for <1 day, were discharged from a non-acute care hospital, or if the hospital-reported patient did not have a positive SARS-CoV-2 test. We then requested full medical records for these patients from the respective hospitals. After we received the medical records, a team of four nurses independently reviewed the medical charts and excluded patients who did not meet the above listed exclusion criteria; patients were excluded at two points—during the automated query and again by manual review.
In addition, severe COVID-19 surveillance was intended to characterize primary admissions for COVID-19, defined as having a documented positive SARS-CoV-2 result within 10 days of symptom onset or hospital admission and no prior hospitalization for COVID-19. The date of the first positive result was validated by locating the positive SARS-COV-2 result in the patient’s medical record and/or the LAC COVID surveillance database; the patient was excluded from analysis if a positive SARS-CoV-2 result could not be found. Excluded discharges were not replaced by a new randomly selected patient. Instead, we oversampled the number of weekly charts to request with a goal of having 40 to 45 charts per week that met inclusion criteria for abstraction.
For this analysis, we examined medical records abstracted for discharges occurring between August 1 and October 31, 2020. We categorized hospitalizations into one of the following: (1) “likely COVID-19–associated” if the patient had
Descriptive statistics and all analyses were conducted using SAS version 9.4 (SAS Institute). Confidence limits (CL) were calculated using the proc freq CL option in SAS. Chi-square analysis was conducted to determine whether trends in hospitalization categories changed over time. Statistical significance was set at P < .05.
RESULTS
Of the 13,813 hospital discharges reported to CHESS from August to October 2020, 3,182 (23%) records were not eligible for inclusion in the random selection sample for the following reasons: 1,765 (13%) patients reported by hospitals did not have a positive COVID-19 test, 734 (5%) discharges were for non-LAC residents, 636 (5%) patients had a length of hospital stay <1 day, and 47 (<1%) discharges were from a non-acute care hospital. From the 10,631 discharges in CHESS meeting preliminary inclusion criteria from August 1 to October 31, 2020, we randomly selected 618 discharges for medical record review. Of the 618 discharges, 504 (85%) medical records were available for review as of November 30, 2020. After review of the 504 medical records, an additional 158 were excluded because 83 (13%) had a first documented positive SARS-CoV-2 test that was >10 days from hospital admission or symptom onset, 34 (6%) were previously hospitalized for COVID-19, 29 (5%) had an emergency department visit only, 6 (1%) were discharged from a non-acute care hospital, and 6 (1%) were non-LAC residents. We reviewed medical records for 346 (56%) of the 618 hospitalizations that met our inclusion criteria.
The demographic characteristics of patients included in our sample were similar to those of the overall patient population in CHESS (Table 1). Most patients in our final study population were male (54%), older than 50 years (66%), and Hispanic (60%); the median length of hospital stay for survivors was 5 days (first quartile–third quartile: 3 to 8 days).

Our analysis indicates that 71% (95% CL, 66%-75%) of hospital discharges were “likely COVID-19-associated”; 12% (CL, 9%-16%) were “not COVID-19–associated” and, therefore, had incidentally detected SARS-CoV-2; and 17% were “potentially COVID-19–associated” (CL, 13%-21%). The percentage of hospitalizations classified as “likely,” “potentially,” and “not COVID-19–associated” did not change from month-to-month during the study period (P = .81). Full-term delivery was the most common reason for hospitalization among patients with incidentally detected SARS-CoV-2 (Table 2).

DISCUSSION
The primary public health objective of the COVID-19 pandemic response has been to prevent overwhelming the healthcare system by slowing disease transmission. LAC DPH closely monitors the daily number of hospitalized COVID-19 patients, defined as hospitalization of a person with an associated positive SARS-CoV-2 result. However, increasing community transmission of SARS-CoV-2 can complicate interpretation of hospitalization data because it is likely that some patients with incidentally detected, nonviable virus will be misclassified as having COVID-19. Overestimating the burden of COVID-19–associated hospitalizations may lead public health policymakers to impose more restrictive control measures or remove restrictions more slowly. Results from this study can inform policymakers about the potential magnitude of overestimating COVID-19–associated hospitalizations.
Our results indicate that SARS-CoV-2 detection might be incidental (ie, “not COVID-19–associated”) in approximately one of eight persons hospitalized with COVID-19 in LAC. We likely underestimated the percentage of hospitalizations with incidental SARS-CoV-2 detection because our definition of “not COVID-19–associated” hospitalizations was intended to be specific for identifying patients who had no clear reason for SARS-CoV-2 testing except a presumed hospital policy of testing on admission or preoperatively. In addition, several patients classified as having a “potentially COVID-19–associated” hospitalization also had a primary reason for admission that currently does not have a clear link to COVID-19 (eg, Bell’s palsy and pelvic inflammatory disease). Although our sample size was relatively small, it was representative of all potential COVID-19 hospitalizations in LAC over a 3-month period.
CONCLUSION
Detection of SARS-CoV-2 in a person with a clinical presentation that is not compatible with COVID-19 can complicate initial clinical management because it is unclear if the result represents presymptomatic or asymptomatic infection, prolonged shedding of nonviable virus, or a false-positive result. Considering the consequences of missing a true infection, such as transmission to other staff or patients, healthcare providers are obligated to treat the test result as a real infection. Therefore, our results are not applicable to patient-level clinical management decisions, but highlight the need for policymakers and emergency preparedness personnel to consider that hospital-reported data might overestimate the burden of COVID-19 hospitalizations when making decisions that rely on hospitalization data as a metric. Additional research is needed to develop methods for correcting hospitalization data to account for patients in whom incidentally detected SARS-CoV-2 was not a direct or contributing cause of hospitalization. Adjusting COVID-19–associated hospitalization rates to account for incidental SARS-CoV-2 detection could allow for optimal resource planning by public health policymakers.
1. Liotti, FM, Menchinelli, G, Marchetti, S, et al. Assessment of SARS-CoV-2 RNA test results among patients who recovered from COVID-19 with prior negative results. JAMA Intern Med. 2021;181(5):702-704. https://doi.org/10.1001/jamainternmed.2020.7570
2. Centers for Disease Control and Prevention and Infectious Disease Society of America. RT-PCR Testing. Accessed April 19, 2021. https://www.idsociety.org/covid-19-real-time-learning-network/diagnostics/RT-pcr-testing
3. Oran DP, Topol EJ. Prevalence of asymptomatic SARS-CoV-2 infection: a narrative review. Ann Intern Med. 2020;173(5):362-367. https://doi.org/10.7326/M20-3012
4 Los Angeles County Department of Public Health. Daily reporting of hospitalized COVID-19 positive inpatients: updated data submission requirements and guide for acute care facilities in Los Angeles County. Accessed on December 10, 2020. http://publichealth.lacounty.gov/acd/docs/HospCOVIDReportingGuide.pdf
Many of the 85 hospitals in Los Angeles County (LAC) routinely test patients for SARS-CoV-2, the virus that causes COVID-19, upon admission to the hospital.1 However, not all SARS-CoV-2 detections represent acute COVID-19 for at least two reasons. First, the SARS-CoV-2 real-time polymerase chain reaction (RT-PCR) assay can report a false-positive result.2 Second, approximately 40% to 45% of persons with SARS-CoV-2 infection are asymptomatic, and RT-PCR tests can remain positive more than 2 months after an individual recovers from COVID-19; thus, SARS-CoV-2 detected on admission might represent shedding of nonviable virus from a prior unrecognized or undiagnosed infection.1,3
Public health policymakers closely monitor the rate of COVID-19 hospitalizations because it informs decisions to impose or relax COVID-19 control measures. However, the percentage of hospitalizations misclassified as COVID-19–associated because of incidentally detected SARS-CoV-2 (ie, COVID-19 was not a primary or contributing cause of hospitalization) is unknown. Therefore, we sought to determine the percentage of hospitalizations in LAC classified as having COVID-19 that might have had incidental SARS-CoV-2 detection.
METHODS
The state of California requires healthcare providers to report all COVID-19 cases and clinical laboratories to report all SARS-CoV-2 diagnostic test results. Hospitals in LAC are mandated to report daily lists of all persons hospitalized with suspected or confirmed COVID-19 to the LAC Department of Public Health (DPH) COVID-19 Hospital Electronic Surveillance System (CHESS).4 Hospitals provide daily data to CHESS containing information about patients in their facilities with COVID-19. We conducted a cross-sectional retrospective study by selecting a random set of medical records from CHESS for review.
We began regularly and systematically reviewing medical records of patients in CHESS discharged after August 1, 2020, as part of LAC DPH surveillance to characterize persons experiencing severe COVID-19, defined as illness requiring hospitalization. For severe COVID-19 surveillance, we randomly selected 45 discharged patients per week from CHESS in August 2020 and 50 discharged patients per week between September and October 2020. To ensure that the sample represented the overall age distribution of patients in CHESS, we ordered patients by birth date and selected every k record, where k represented the interval between patients needed to meet the target for the week. Before random sample selection, several free text fields from the CHESS dataset were queried to identify and remove patients who were not LAC residents, were seen in the emergency department but not admitted, were hospitalized for <1 day, were discharged from a non-acute care hospital, or if the hospital-reported patient did not have a positive SARS-CoV-2 test. We then requested full medical records for these patients from the respective hospitals. After we received the medical records, a team of four nurses independently reviewed the medical charts and excluded patients who did not meet the above listed exclusion criteria; patients were excluded at two points—during the automated query and again by manual review.
In addition, severe COVID-19 surveillance was intended to characterize primary admissions for COVID-19, defined as having a documented positive SARS-CoV-2 result within 10 days of symptom onset or hospital admission and no prior hospitalization for COVID-19. The date of the first positive result was validated by locating the positive SARS-COV-2 result in the patient’s medical record and/or the LAC COVID surveillance database; the patient was excluded from analysis if a positive SARS-CoV-2 result could not be found. Excluded discharges were not replaced by a new randomly selected patient. Instead, we oversampled the number of weekly charts to request with a goal of having 40 to 45 charts per week that met inclusion criteria for abstraction.
For this analysis, we examined medical records abstracted for discharges occurring between August 1 and October 31, 2020. We categorized hospitalizations into one of the following: (1) “likely COVID-19–associated” if the patient had
Descriptive statistics and all analyses were conducted using SAS version 9.4 (SAS Institute). Confidence limits (CL) were calculated using the proc freq CL option in SAS. Chi-square analysis was conducted to determine whether trends in hospitalization categories changed over time. Statistical significance was set at P < .05.
RESULTS
Of the 13,813 hospital discharges reported to CHESS from August to October 2020, 3,182 (23%) records were not eligible for inclusion in the random selection sample for the following reasons: 1,765 (13%) patients reported by hospitals did not have a positive COVID-19 test, 734 (5%) discharges were for non-LAC residents, 636 (5%) patients had a length of hospital stay <1 day, and 47 (<1%) discharges were from a non-acute care hospital. From the 10,631 discharges in CHESS meeting preliminary inclusion criteria from August 1 to October 31, 2020, we randomly selected 618 discharges for medical record review. Of the 618 discharges, 504 (85%) medical records were available for review as of November 30, 2020. After review of the 504 medical records, an additional 158 were excluded because 83 (13%) had a first documented positive SARS-CoV-2 test that was >10 days from hospital admission or symptom onset, 34 (6%) were previously hospitalized for COVID-19, 29 (5%) had an emergency department visit only, 6 (1%) were discharged from a non-acute care hospital, and 6 (1%) were non-LAC residents. We reviewed medical records for 346 (56%) of the 618 hospitalizations that met our inclusion criteria.
The demographic characteristics of patients included in our sample were similar to those of the overall patient population in CHESS (Table 1). Most patients in our final study population were male (54%), older than 50 years (66%), and Hispanic (60%); the median length of hospital stay for survivors was 5 days (first quartile–third quartile: 3 to 8 days).
Our analysis indicates that 71% (95% CL, 66%-75%) of hospital discharges were “likely COVID-19-associated”; 12% (CL, 9%-16%) were “not COVID-19–associated” and, therefore, had incidentally detected SARS-CoV-2; and 17% were “potentially COVID-19–associated” (CL, 13%-21%). The percentage of hospitalizations classified as “likely,” “potentially,” and “not COVID-19–associated” did not change from month-to-month during the study period (P = .81). Full-term delivery was the most common reason for hospitalization among patients with incidentally detected SARS-CoV-2 (Table 2).
DISCUSSION
The primary public health objective of the COVID-19 pandemic response has been to prevent overwhelming the healthcare system by slowing disease transmission. LAC DPH closely monitors the daily number of hospitalized COVID-19 patients, defined as hospitalization of a person with an associated positive SARS-CoV-2 result. However, increasing community transmission of SARS-CoV-2 can complicate interpretation of hospitalization data because it is likely that some patients with incidentally detected, nonviable virus will be misclassified as having COVID-19. Overestimating the burden of COVID-19–associated hospitalizations may lead public health policymakers to impose more restrictive control measures or remove restrictions more slowly. Results from this study can inform policymakers about the potential magnitude of overestimating COVID-19–associated hospitalizations.
Our results indicate that SARS-CoV-2 detection might be incidental (ie, “not COVID-19–associated”) in approximately one of eight persons hospitalized with COVID-19 in LAC. We likely underestimated the percentage of hospitalizations with incidental SARS-CoV-2 detection because our definition of “not COVID-19–associated” hospitalizations was intended to be specific for identifying patients who had no clear reason for SARS-CoV-2 testing except a presumed hospital policy of testing on admission or preoperatively. In addition, several patients classified as having a “potentially COVID-19–associated” hospitalization also had a primary reason for admission that currently does not have a clear link to COVID-19 (eg, Bell’s palsy and pelvic inflammatory disease). Although our sample size was relatively small, it was representative of all potential COVID-19 hospitalizations in LAC over a 3-month period.
CONCLUSION
Detection of SARS-CoV-2 in a person with a clinical presentation that is not compatible with COVID-19 can complicate initial clinical management because it is unclear if the result represents presymptomatic or asymptomatic infection, prolonged shedding of nonviable virus, or a false-positive result. Considering the consequences of missing a true infection, such as transmission to other staff or patients, healthcare providers are obligated to treat the test result as a real infection. Therefore, our results are not applicable to patient-level clinical management decisions, but highlight the need for policymakers and emergency preparedness personnel to consider that hospital-reported data might overestimate the burden of COVID-19 hospitalizations when making decisions that rely on hospitalization data as a metric. Additional research is needed to develop methods for correcting hospitalization data to account for patients in whom incidentally detected SARS-CoV-2 was not a direct or contributing cause of hospitalization. Adjusting COVID-19–associated hospitalization rates to account for incidental SARS-CoV-2 detection could allow for optimal resource planning by public health policymakers.
1. Liotti, FM, Menchinelli, G, Marchetti, S, et al. Assessment of SARS-CoV-2 RNA test results among patients who recovered from COVID-19 with prior negative results. JAMA Intern Med. 2021;181(5):702-704. https://doi.org/10.1001/jamainternmed.2020.7570
2. Centers for Disease Control and Prevention and Infectious Disease Society of America. RT-PCR Testing. Accessed April 19, 2021. https://www.idsociety.org/covid-19-real-time-learning-network/diagnostics/RT-pcr-testing
3. Oran DP, Topol EJ. Prevalence of asymptomatic SARS-CoV-2 infection: a narrative review. Ann Intern Med. 2020;173(5):362-367. https://doi.org/10.7326/M20-3012
4 Los Angeles County Department of Public Health. Daily reporting of hospitalized COVID-19 positive inpatients: updated data submission requirements and guide for acute care facilities in Los Angeles County. Accessed on December 10, 2020. http://publichealth.lacounty.gov/acd/docs/HospCOVIDReportingGuide.pdf
© 2021 Society of Hospital Medicine
Pediatric Conditions Requiring Minimal Intervention or Observation After Interfacility Transfer
Regionalization of pediatric acute care is increasing across the United States, with rates of interfacility transfer for general medical conditions in children similar to those of high-risk conditions in adults.1 The inability for children to receive definitive care (ie, care provided to conclusively manage a patient’s condition without requiring an interfacility transfer) within their local community has implications on public health as well as family function and financial burden.1,2 Previous studies demonstrated that 30% to 80% of interfacility transfers are potentially unnecessary,3-6 as indicated by a high proportion of short lengths of stay after transfer.
To highlight conditions that referring hospitals may prioritize for pediatric capacity building, we aimed to identify the most common medical diagnoses among pediatric transfer patients that did not require advanced evaluation or intervention and that had high rates of discharge within 1 day of interfacility transfer.
METHODS
We conducted a retrospective, cross-sectional, descriptive study using the Pediatric Health Information System (PHIS) database, which contains administrative data from 48 geographically diverse US children’s hospitals.
We included children <18 years old who were transferred to a participating PHIS hospital in 2019, including emergency department (ED), observation, and inpatient encounters. We identified patients through the source-of-admission code labeled as “transfer.”
For each diagnosis, we determined the number of transfers and frequency of rapid discharge, defined as either discharge from the ED without admission or admission and discharge within 1 day from a general inpatient unit. As discharge times are not reliably available in PHIS, all patients discharged on the day of transfer or the following calendar day were identified as rapid discharge. Medical complexity was determined through applying the Pediatric Medical Complexity Algorithm (PMCA).8
For descriptive statistics, we calculated means for normally distributed variables, medians for continuous variables with nonnormal distributions, and percentages for binary variables. Comparisons were made using t-tests and chi-square tests.
This study was approved by the Seattle Children’s Institutional Review Board.
RESULTS
We identified 286,905 transfers into participating PHIS hospitals in 2019. Of these, 89,519 (31.2%) were excluded (Appendix Table 2), leaving 197,386 (68.6%) transfers. Patients discharged within 1 day were more likely to have public or unknown insurance (65.1% vs 61.5%, P < 0.01), to have no co-occurring chronic conditions (60.2% vs 28.5%, P < 0.01), and to reside within the Northeast (35.0% vs 11.0%, P < 0.01) (Appendix Table 3).
The most common medical diagnoses among these transfers included acute bronchiolitis (4.3% of all interfacility transfers, n = 8,425), chemotherapy (4.0%, n = 7,819), and asthma (3.3%, n = 6,430) (Appendix Table 4); 45.9% of bronchiolitis, 15.0% of chemotherapy, and 67.4% of asthma transfers were rapidly discharged.
The Table shows the medical conditions among transfers that most frequently experienced rapid discharge (primary surgical diagnoses are presented in Appendix Table 5). 
DISCUSSION
We have identified medical conditions that not only had high rates of rapid discharge after transfer, but also received minimal intervention from the accepting institution. Although bronchiolitis and chemotherapy were the most common conditions for which patients were transferred, the range of severity varied widely, with more than 50% of bronchiolitis and 85% of chemotherapy transfers requiring hospitalization for longer than 1 day
Identifying conditions as potential targets to reduce the number of interfacility transfers requires balancing a hospital’s capacity (or lack thereof) for pediatric admissions, perceived risk of decompensation, referring provider discomfort, and parental preference.9-11
The rapid upscale of telehealth may provide a unique opportunity to support the provision of pediatric care within local communities.12,13
Building infrastructure to prevent interfacility transfers may improve healthcare access for children in rural areas proportionately more than children in urban areas. Children in rural communities experience significantly higher rates of interfacility transfers than children in urban areas.14 This increases financial burden and causes additional distress and inconvenience for families.15 With constraints in staffing capacity, equipment, and finances, identifying a subset of medical conditions is a critical initial step to inform the design of targeted interventions to support pediatric healthcare delivery in local communities and avoid costly transfers, although it is not the wholesale solution. Additional utilization of tools such as informed shared decision-making resources and implementation of pediatric-specific protocols likely represent additional necessary steps.
Our study has several limitations. Because we used administrative data, there is a risk of misclassifying diagnoses. We attempted to mitigate this by using a standard ICD-10-based, pediatric-specific grouper.
CONCLUSION
Our exploration of pediatric interfacility transfers that experienced rapid discharge with minimal intervention provides a building block to support the provision of definitive pediatric care in non-pediatric hospitals and represents a step towards addressing limited access to care in general hospitals.
1. França UL, McManus ML. Availability of definitive hospital care for children. JAMA Pediatr. 2017;171(9):e171096. https://doi.org/10.1001/jamapediatrics.2017.1096
2. Mumford V, Baysari MT, Kalinin D, et al. Measuring the financial and productivity burden of paediatric hospitalisation on the wider family network. J Paediatr Child Health. 2018;54(9):987-996. https://doi.org/10.1111/jpc.13923
3. Richard KR, Glisson KL, Shah N, et al. Predictors of potentially unnecessary transfers to pediatric emergency departments. Hosp Pediatr. 2020;10(5):424-429. https://doi.org/10.1542/hpeds.2019-0307
4. Gattu RK, Teshome G, Cai L, Wright C, Lichenstein R. Interhospital pediatric patient transfers-factors influencing rapid disposition after transfer. Pediatr Emerg Care. 2014;30(1):26-30. https://doi.org/10.1097/PEC.0000000000000061
5. Li J, Monuteaux MC, Bachur RG. Interfacility transfers of noncritically ill children to academic pediatric emergency departments. Pediatrics. 2012;130(1):83-92. https://doi.org/10.1542/peds.2011-1819
6. Rosenthal JL, Lieng MK, Marcin JP, Romano PS. Profiling pediatric potentially avoidable transfers using procedure and diagnosis codes. Pediatr Emerg Care. 2019 Mar 19;10.1097/PEC.0000000000001777. https://doi.org/10.1097/PEC.0000000000001777
7. Pediatric clinical classification system (PECCS) codes. Children’s Hospital Association. December 11, 2020. Accessed June 3, 2021. https://www.childrenshospitals.org/Research-and-Data/Pediatric-Data-and-Trends/2020/Pediatric-Clinical-Classification-System-PECCS
8. Simon TD, Haaland W, Hawley K, Lambka K, Mangione-Smith R. Development and validation of the pediatric medical complexity algorithm (PMCA) version 3.0. Acad Pediatr. 2018;18(5):577-580. https://doi.org/10.1016/j.acap.2018.02.010
9. Rosenthal JL, Okumura MJ, Hernandez L, Li ST, Rehm RS. Interfacility transfers to general pediatric floors: a qualitative study exploring the role of communication. Acad Pediatr. 2016;16(7):692-699. https://doi.org/10.1016/j.acap.2016.04.003
10. Rosenthal JL, Li ST, Hernandez L, Alvarez M, Rehm RS, Okumura MJ. Familial caregiver and physician perceptions of the family-physician interactions during interfacility transfers. Hosp Pediatr. 2017;7(6):344-351. https://doi.org/10.1542/hpeds.2017-0017
11. Peebles ER, Miller MR, Lynch TP, Tijssen JA. Factors associated with discharge home after transfer to a pediatric emergency department. Pediatr Emerg Care. 2018;34(9):650-655. https://doi.org/10.1097/PEC.0000000000001098
12. Labarbera JM, Ellenby MS, Bouressa P, Burrell J, Flori HR, Marcin JP. The impact of telemedicine intensivist support and a pediatric hospitalist program on a community hospital. Telemed J E Health. 2013;19(10):760-766. https://doi.org/10.1089/tmj.2012.0303
13. Haynes SC, Dharmar M, Hill BC, et al. The impact of telemedicine on transfer rates of newborns at rural community hospitals. Acad Pediatr. 2020;20(5):636-641. https://doi.org/10.1016/j.acap.2020.02.013
14. Michelson KA, Hudgins JD, Lyons TW, Monuteaux MC, Bachur RG, Finkelstein JA. Trends in capability of hospitals to provide definitive acute care for children: 2008 to 2016. Pediatrics. 2020;145(1). https://doi.org/10.1542/peds.2019-2203
15. Mohr NM, Harland KK, Shane DM, Miller SL, Torner JC. Potentially avoidable pediatric interfacility transfer is a costly burden for rural families: a cohort study. Acad Emerg Med. 2016;23(8):885-894. https://doi.org/10.1111/acem.12972
Regionalization of pediatric acute care is increasing across the United States, with rates of interfacility transfer for general medical conditions in children similar to those of high-risk conditions in adults.1 The inability for children to receive definitive care (ie, care provided to conclusively manage a patient’s condition without requiring an interfacility transfer) within their local community has implications on public health as well as family function and financial burden.1,2 Previous studies demonstrated that 30% to 80% of interfacility transfers are potentially unnecessary,3-6 as indicated by a high proportion of short lengths of stay after transfer.
To highlight conditions that referring hospitals may prioritize for pediatric capacity building, we aimed to identify the most common medical diagnoses among pediatric transfer patients that did not require advanced evaluation or intervention and that had high rates of discharge within 1 day of interfacility transfer.
METHODS
We conducted a retrospective, cross-sectional, descriptive study using the Pediatric Health Information System (PHIS) database, which contains administrative data from 48 geographically diverse US children’s hospitals.
We included children <18 years old who were transferred to a participating PHIS hospital in 2019, including emergency department (ED), observation, and inpatient encounters. We identified patients through the source-of-admission code labeled as “transfer.”
For each diagnosis, we determined the number of transfers and frequency of rapid discharge, defined as either discharge from the ED without admission or admission and discharge within 1 day from a general inpatient unit. As discharge times are not reliably available in PHIS, all patients discharged on the day of transfer or the following calendar day were identified as rapid discharge. Medical complexity was determined through applying the Pediatric Medical Complexity Algorithm (PMCA).8
For descriptive statistics, we calculated means for normally distributed variables, medians for continuous variables with nonnormal distributions, and percentages for binary variables. Comparisons were made using t-tests and chi-square tests.
This study was approved by the Seattle Children’s Institutional Review Board.
RESULTS
We identified 286,905 transfers into participating PHIS hospitals in 2019. Of these, 89,519 (31.2%) were excluded (Appendix Table 2), leaving 197,386 (68.6%) transfers. Patients discharged within 1 day were more likely to have public or unknown insurance (65.1% vs 61.5%, P < 0.01), to have no co-occurring chronic conditions (60.2% vs 28.5%, P < 0.01), and to reside within the Northeast (35.0% vs 11.0%, P < 0.01) (Appendix Table 3).
The most common medical diagnoses among these transfers included acute bronchiolitis (4.3% of all interfacility transfers, n = 8,425), chemotherapy (4.0%, n = 7,819), and asthma (3.3%, n = 6,430) (Appendix Table 4); 45.9% of bronchiolitis, 15.0% of chemotherapy, and 67.4% of asthma transfers were rapidly discharged.
The Table shows the medical conditions among transfers that most frequently experienced rapid discharge (primary surgical diagnoses are presented in Appendix Table 5).
DISCUSSION
We have identified medical conditions that not only had high rates of rapid discharge after transfer, but also received minimal intervention from the accepting institution. Although bronchiolitis and chemotherapy were the most common conditions for which patients were transferred, the range of severity varied widely, with more than 50% of bronchiolitis and 85% of chemotherapy transfers requiring hospitalization for longer than 1 day
Identifying conditions as potential targets to reduce the number of interfacility transfers requires balancing a hospital’s capacity (or lack thereof) for pediatric admissions, perceived risk of decompensation, referring provider discomfort, and parental preference.9-11
The rapid upscale of telehealth may provide a unique opportunity to support the provision of pediatric care within local communities.12,13
Building infrastructure to prevent interfacility transfers may improve healthcare access for children in rural areas proportionately more than children in urban areas. Children in rural communities experience significantly higher rates of interfacility transfers than children in urban areas.14 This increases financial burden and causes additional distress and inconvenience for families.15 With constraints in staffing capacity, equipment, and finances, identifying a subset of medical conditions is a critical initial step to inform the design of targeted interventions to support pediatric healthcare delivery in local communities and avoid costly transfers, although it is not the wholesale solution. Additional utilization of tools such as informed shared decision-making resources and implementation of pediatric-specific protocols likely represent additional necessary steps.
Our study has several limitations. Because we used administrative data, there is a risk of misclassifying diagnoses. We attempted to mitigate this by using a standard ICD-10-based, pediatric-specific grouper.
CONCLUSION
Our exploration of pediatric interfacility transfers that experienced rapid discharge with minimal intervention provides a building block to support the provision of definitive pediatric care in non-pediatric hospitals and represents a step towards addressing limited access to care in general hospitals.
1. França UL, McManus ML. Availability of definitive hospital care for children. JAMA Pediatr. 2017;171(9):e171096. https://doi.org/10.1001/jamapediatrics.2017.1096
2. Mumford V, Baysari MT, Kalinin D, et al. Measuring the financial and productivity burden of paediatric hospitalisation on the wider family network. J Paediatr Child Health. 2018;54(9):987-996. https://doi.org/10.1111/jpc.13923
3. Richard KR, Glisson KL, Shah N, et al. Predictors of potentially unnecessary transfers to pediatric emergency departments. Hosp Pediatr. 2020;10(5):424-429. https://doi.org/10.1542/hpeds.2019-0307
4. Gattu RK, Teshome G, Cai L, Wright C, Lichenstein R. Interhospital pediatric patient transfers-factors influencing rapid disposition after transfer. Pediatr Emerg Care. 2014;30(1):26-30. https://doi.org/10.1097/PEC.0000000000000061
5. Li J, Monuteaux MC, Bachur RG. Interfacility transfers of noncritically ill children to academic pediatric emergency departments. Pediatrics. 2012;130(1):83-92. https://doi.org/10.1542/peds.2011-1819
6. Rosenthal JL, Lieng MK, Marcin JP, Romano PS. Profiling pediatric potentially avoidable transfers using procedure and diagnosis codes. Pediatr Emerg Care. 2019 Mar 19;10.1097/PEC.0000000000001777. https://doi.org/10.1097/PEC.0000000000001777
7. Pediatric clinical classification system (PECCS) codes. Children’s Hospital Association. December 11, 2020. Accessed June 3, 2021. https://www.childrenshospitals.org/Research-and-Data/Pediatric-Data-and-Trends/2020/Pediatric-Clinical-Classification-System-PECCS
8. Simon TD, Haaland W, Hawley K, Lambka K, Mangione-Smith R. Development and validation of the pediatric medical complexity algorithm (PMCA) version 3.0. Acad Pediatr. 2018;18(5):577-580. https://doi.org/10.1016/j.acap.2018.02.010
9. Rosenthal JL, Okumura MJ, Hernandez L, Li ST, Rehm RS. Interfacility transfers to general pediatric floors: a qualitative study exploring the role of communication. Acad Pediatr. 2016;16(7):692-699. https://doi.org/10.1016/j.acap.2016.04.003
10. Rosenthal JL, Li ST, Hernandez L, Alvarez M, Rehm RS, Okumura MJ. Familial caregiver and physician perceptions of the family-physician interactions during interfacility transfers. Hosp Pediatr. 2017;7(6):344-351. https://doi.org/10.1542/hpeds.2017-0017
11. Peebles ER, Miller MR, Lynch TP, Tijssen JA. Factors associated with discharge home after transfer to a pediatric emergency department. Pediatr Emerg Care. 2018;34(9):650-655. https://doi.org/10.1097/PEC.0000000000001098
12. Labarbera JM, Ellenby MS, Bouressa P, Burrell J, Flori HR, Marcin JP. The impact of telemedicine intensivist support and a pediatric hospitalist program on a community hospital. Telemed J E Health. 2013;19(10):760-766. https://doi.org/10.1089/tmj.2012.0303
13. Haynes SC, Dharmar M, Hill BC, et al. The impact of telemedicine on transfer rates of newborns at rural community hospitals. Acad Pediatr. 2020;20(5):636-641. https://doi.org/10.1016/j.acap.2020.02.013
14. Michelson KA, Hudgins JD, Lyons TW, Monuteaux MC, Bachur RG, Finkelstein JA. Trends in capability of hospitals to provide definitive acute care for children: 2008 to 2016. Pediatrics. 2020;145(1). https://doi.org/10.1542/peds.2019-2203
15. Mohr NM, Harland KK, Shane DM, Miller SL, Torner JC. Potentially avoidable pediatric interfacility transfer is a costly burden for rural families: a cohort study. Acad Emerg Med. 2016;23(8):885-894. https://doi.org/10.1111/acem.12972
© 2021 Society of Hospital Medicine
The Hospital Readmissions Reduction Program and Observation Hospitalizations
The Hospital Readmissions Reduction Program (HRRP) was designed to improve quality and safety for traditional Medicare beneficiaries.1 Since 2012, the program has reduced payments to institutions with excess inpatient rehospitalizations within 30 days of an index inpatient stay for targeted medical conditions. Observation hospitalizations, billed as outpatient and covered under Medicare Part B, are not counted as index or 30-day rehospitalizations under HRRP methods. Historically, observation occurred almost exclusively in observation units. Now, observation hospitalizations commonly occur on hospital wards, even in intensive care units, and are often clinically indistinguishable from inpatient hospitalizations billed under Medicare Part A.2 The Centers for Medicare & Medicaid Services (CMS) state that beneficiaries expected to need 2 or more midnights of hospital care should generally be considered inpatients, yet observation hospitalizations commonly exceed 2 midnights.3,4
The increasing use of observation hospitalizations5,6 raises questions about its impact on HRRP measurements. While observation hospitalizations have been studied as part of 30-day follow-up (numerator) to index inpatient hospitalizations,5,6 little is known about how observation hospitalizations impact rates when they are factored in as both index stays (denominator) and in the 30-day rehospitalization rate (numerator).2,7 We analyzed the complete combinations of observation and inpatient hospitalizations, including observation as index hospitalization, rehospitalization, or both, to determine HRRP impact.
METHODS
Study Cohort
Medicare fee-for-service standard claim files for all beneficiaries (100% population file version) were used to examine qualifying index inpatient and observation hospitalizations between January 1, 2014, and November 30, 2014, as well as 30-day inpatient and observation rehospitalizations. We used CMS’s 30-day methodology, including previously described standard exclusions (Appendix Figure),8 except for the aforementioned inclusion of observation hospitalizations. Observation hospitalizations were identified using established methods,3,9,10 excluding those observation encounters coded with revenue center code 0761 only3,10 in order to be most conservative in identifying observation hospitalizations (Appendix Figure). These methods assign hospitalization type (observation or inpatient) based on the final (billed) status. The terms hospitalization and rehospitalization refer to both inpatient and observation encounters. The University of Wisconsin Health Sciences Institutional Review Board approved this study.
Hospital Readmissions Reduction Program
Index HRRP admissions for congestive heart failure, chronic obstructive pulmonary disease, myocardial infarction, and pneumonia were examined as a prespecified subgroup.1,11 Coronary artery bypass grafting, total hip replacement, and total knee replacement were excluded in this analysis, as no crosswalk exists between International Classification of Diseases, Ninth Revision codes and Current Procedural Terminology codes for these surgical conditions.11
Analysis
Analyses were conducted at the encounter level, consistent with CMS methods.8 Descriptive statistics were used to summarize index and 30-day outcomes.
RESULTS
Of 8,859,534 index hospitalizations for any reason or diagnosis, 1,597,837 (18%) were observation and 7,261,697 (82%) were inpatient. Including all hospitalizations, 23% (390,249/1,689,609) of rehospitalizations were excluded from readmission measurement by virtue of the index hospitalization and/or 30-day rehospitalization being observation (Table 1 and Table 2).

For the subgroup of HRRP conditions, 418,923 (11%) and 3,387,849 (89%) of 3,806,772 index hospitalizations were observation and inpatient, respectively. Including HRRP conditions only, 18% (155,553/876,033) of rehospitalizations were excluded from HRRP reporting owing to observation hospitalization as index, 30-day outcome, or both. Of 188,430 index/30-day pairs containing observation, 34% (63,740) were observation/inpatient, 53% (100,343) were inpatient/observation, and 13% (24,347) were observation/observation (Table 1 and Table 2).
DISCUSSION
By ignoring observation hospitalizations in 30-day HRRP quality metrics, nearly one of five potential rehospitalizations is missed. Observation hospitalizations commonly occur as either the index event or 30-day outcome, so accurately determining 30-day HRRP rates must include observation in both positions. Given hospital variability in observation use,3,7 these findings are critically important to accurately understand rehospitalization risk and indicate that HRRP may not be fulfilling its intended purpose.
Including all hospitalizations for any diagnosis, we found that observation and inpatient hospitalizations commonly occur within 30 days of each other. Nearly one in four hospitalization/rehospitalization pairs include observation as index, 30-day rehospitalization, or both. Although not directly related to HRRP metrics, these data demonstrate the growing importance and presence of outpatient (observation) hospitalizations in the Medicare program.
Our study adds to the evolving body of literature investigating quality measures under a two-tiered hospital system where inpatient hospitalizations are counted and observation hospitalizations are not. Figueroa and colleagues12 found that improvements in avoidable admission rates for patients with ambulatory care–sensitive conditions were largely attributable to a shift from counted inpatient to uncounted observation hospitalizations. In other words, hospitalizations were still occurring, but were not being tallied due to outpatient (observation) classification. Zuckerman et al5 and the Medicare Payment Advisory Commission (MedPAC)6 concluded that readmissions improvements recognized by the HRRP were not explained by a shift to more observation hospitalizations following an index inpatient hospitalization; however, both studies included observation hospitalizations as part of 30-day rehospitalization (numerator) only, not also as part of index hospitalizations (denominator). Our study confirms the importance of including observation hospitalizations in both the index (denominator) and 30-day (numerator) rehospitalization positions to determine the full impact of observation hospitalizations on Medicare’s HRRP metrics.
Our study has limitations. We focused on nonsurgical HRRP conditions, which may have impacted our findings. Additionally, some authors have suggested including emergency department (ED) visits in rehospitalization studies.7 Although ED visits occur at hospitals, they are not hospitalizations; we excluded them as a first step. Had we included ED visits, encounters excluded from HRRP measurements would have increased, suggesting that our findings, while sizeable, are likely conservative. Additionally, we could not determine the merits or medical necessity of hospitalizations (inpatient or outpatient observation), but this is an inherent limitation in a large claims dataset like this one. Finally, we only included a single year of data in this analysis, and it is possible that additional years of data would show different trends. However, we have no reason to believe the study year to be an aberrant year; if anything, observation rates have increased since 2014,6 again pointing out that while our findings are sizable, they are likely conservative. Future research could include additional years of data to confirm even greater proportions of rehospitalizations exempt from HRRP over time due to observation hospitalizations as index and/or 30-day events.
Outpatient observation hospitalizations can occur anywhere in the hospital and are often clinically similar to inpatient hospitalizations, yet observation hospitalizations are essentially invisible under inpatient quality metrics. Requiring the HRRP to include observation hospitalizations is the most obvious solution, but this could require major regulatory and legislative change11,13—change that would fix a metric but fail to address broad policy concerns inherent in the two-tiered observation and inpatient billing distinction. Instead, CMS and Congress might consider this an opportunity to address the oxymoron of “outpatient hospitalizations” by engaging in comprehensive observation reform.
1. Centers for Medicare & Medicaid Services. Hospital Readmissions Reduction Program (HRRP). Accessed March 12, 2021. https://www.cms.gov/Medicare/Medicare-Fee-for-Service-Payment/AcuteInpatientPPS/Readmissions-Reduction-Program
2. Sabbatini AK, Wright B. Excluding observation stays from readmission rates—what quality measures are missing. N Engl J Med. 2018;378(22):2062-2065. https://doi.org/10.1056/NEJMp1800732
3. Sheehy AM, Powell WR, Kaiksow FA, et al. Thirty-day re-observation, chronic re-observation, and neighborhood disadvantage. Mayo Clin Proc. 2020;95(12):2644-2654. https://doi.org/10.1016/j.mayocp.2020.06.059
4. US Department of Health and Human Services. Office of Inspector General. Vulnerabilities remain under Medicare’s 2-midnight hospital policy. December 19, 2016. Accessed February 11, 2021. https://oig.hhs.gov/oei/reports/oei-02-15-00020.asp
5. Zuckerman RB, Sheingold SH, Orav EJ, Ruhter J, Epstein AM. Readmissions, observation and the Hospital Readmissions Reduction Program. N Engl J Med. 2016;374(16):1543-1551. https://doi.org/10.1056/NEJMsa1513024
6. Medicare Payment Advisory Commission. Mandated report: the effects of the Hospital Readmissions Reduction Program. In: Report to the Congress: Medicare and the Health Care Delivery System. 2018;3-31. Accessed March 17, 2021. Available at: http://www.medpac.gov/docs/default-source/reports/jun18_medpacreporttocongress_rev_nov2019_note_sec.pdf?sfvrsn=0
7. Wadhera RK, Yeh RW, Maddox KEJ. The Hospital Readmissions Reduction Program—time for a reboot. N Engl J Med. 2019;380(24):2289-2291. https://doi.org/10.1056/NEJMp1901225
8. National Quality Forum. Measure #1789: Hospital-wide all-cause unplanned readmission measure. Accessed January 30, 2021. https://www.qualityforum.org/ProjectDescription.aspx?projectID=73619
9. Sheehy AM, Shi F, Kind AJH. Identifying observation stays in Medicare data: policy implications of a definition. J Hosp Med. 2019;14(2):96-100. https://doi.org/10.12788/jhm.3038
10. Powell WR, Kaiksow FA, Kind AJH, Sheehy AM. What is an observation stay? Evaluating the use of hospital observation stays in Medicare. J Am Geriatr Soc. 2020;68(7):1568-1572. https://doi.org/10.1111/jgs.16441
11. Centers for Medicare & Medicaid Services. Hospital Readmissions Reduction Program (HRRP) Archives. Accessed February 10, 2021. https://www.cms.gov/Medicare/Medicare-Fee-for-Service-Payment/AcuteInpatientPPS/HRRP-Archives
12. Figueroa JF, Burke LG, Zheng J, Orav EJ, Jha AK. Trends in hospitalization vs observation stay for ambulatory care-sensitive conditions. JAMA Intern Med. 2019;179(12): 1714-1716. https://doi.org/10.1001/jamainternmed.2019.3177
13. Public Law 111-148, Patient Protection and Affordable Care Act, 111th Congress. March 23, 2010. Accessed March 12, 2021.https://www.congress.gov/111/plaws/publ148/PLAW-111publ148.pdf
The Hospital Readmissions Reduction Program (HRRP) was designed to improve quality and safety for traditional Medicare beneficiaries.1 Since 2012, the program has reduced payments to institutions with excess inpatient rehospitalizations within 30 days of an index inpatient stay for targeted medical conditions. Observation hospitalizations, billed as outpatient and covered under Medicare Part B, are not counted as index or 30-day rehospitalizations under HRRP methods. Historically, observation occurred almost exclusively in observation units. Now, observation hospitalizations commonly occur on hospital wards, even in intensive care units, and are often clinically indistinguishable from inpatient hospitalizations billed under Medicare Part A.2 The Centers for Medicare & Medicaid Services (CMS) state that beneficiaries expected to need 2 or more midnights of hospital care should generally be considered inpatients, yet observation hospitalizations commonly exceed 2 midnights.3,4
The increasing use of observation hospitalizations5,6 raises questions about its impact on HRRP measurements. While observation hospitalizations have been studied as part of 30-day follow-up (numerator) to index inpatient hospitalizations,5,6 little is known about how observation hospitalizations impact rates when they are factored in as both index stays (denominator) and in the 30-day rehospitalization rate (numerator).2,7 We analyzed the complete combinations of observation and inpatient hospitalizations, including observation as index hospitalization, rehospitalization, or both, to determine HRRP impact.
METHODS
Study Cohort
Medicare fee-for-service standard claim files for all beneficiaries (100% population file version) were used to examine qualifying index inpatient and observation hospitalizations between January 1, 2014, and November 30, 2014, as well as 30-day inpatient and observation rehospitalizations. We used CMS’s 30-day methodology, including previously described standard exclusions (Appendix Figure),8 except for the aforementioned inclusion of observation hospitalizations. Observation hospitalizations were identified using established methods,3,9,10 excluding those observation encounters coded with revenue center code 0761 only3,10 in order to be most conservative in identifying observation hospitalizations (Appendix Figure). These methods assign hospitalization type (observation or inpatient) based on the final (billed) status. The terms hospitalization and rehospitalization refer to both inpatient and observation encounters. The University of Wisconsin Health Sciences Institutional Review Board approved this study.
Hospital Readmissions Reduction Program
Index HRRP admissions for congestive heart failure, chronic obstructive pulmonary disease, myocardial infarction, and pneumonia were examined as a prespecified subgroup.1,11 Coronary artery bypass grafting, total hip replacement, and total knee replacement were excluded in this analysis, as no crosswalk exists between International Classification of Diseases, Ninth Revision codes and Current Procedural Terminology codes for these surgical conditions.11
Analysis
Analyses were conducted at the encounter level, consistent with CMS methods.8 Descriptive statistics were used to summarize index and 30-day outcomes.
RESULTS
Of 8,859,534 index hospitalizations for any reason or diagnosis, 1,597,837 (18%) were observation and 7,261,697 (82%) were inpatient. Including all hospitalizations, 23% (390,249/1,689,609) of rehospitalizations were excluded from readmission measurement by virtue of the index hospitalization and/or 30-day rehospitalization being observation (Table 1 and Table 2).
For the subgroup of HRRP conditions, 418,923 (11%) and 3,387,849 (89%) of 3,806,772 index hospitalizations were observation and inpatient, respectively. Including HRRP conditions only, 18% (155,553/876,033) of rehospitalizations were excluded from HRRP reporting owing to observation hospitalization as index, 30-day outcome, or both. Of 188,430 index/30-day pairs containing observation, 34% (63,740) were observation/inpatient, 53% (100,343) were inpatient/observation, and 13% (24,347) were observation/observation (Table 1 and Table 2).
DISCUSSION
By ignoring observation hospitalizations in 30-day HRRP quality metrics, nearly one of five potential rehospitalizations is missed. Observation hospitalizations commonly occur as either the index event or 30-day outcome, so accurately determining 30-day HRRP rates must include observation in both positions. Given hospital variability in observation use,3,7 these findings are critically important to accurately understand rehospitalization risk and indicate that HRRP may not be fulfilling its intended purpose.
Including all hospitalizations for any diagnosis, we found that observation and inpatient hospitalizations commonly occur within 30 days of each other. Nearly one in four hospitalization/rehospitalization pairs include observation as index, 30-day rehospitalization, or both. Although not directly related to HRRP metrics, these data demonstrate the growing importance and presence of outpatient (observation) hospitalizations in the Medicare program.
Our study adds to the evolving body of literature investigating quality measures under a two-tiered hospital system where inpatient hospitalizations are counted and observation hospitalizations are not. Figueroa and colleagues12 found that improvements in avoidable admission rates for patients with ambulatory care–sensitive conditions were largely attributable to a shift from counted inpatient to uncounted observation hospitalizations. In other words, hospitalizations were still occurring, but were not being tallied due to outpatient (observation) classification. Zuckerman et al5 and the Medicare Payment Advisory Commission (MedPAC)6 concluded that readmissions improvements recognized by the HRRP were not explained by a shift to more observation hospitalizations following an index inpatient hospitalization; however, both studies included observation hospitalizations as part of 30-day rehospitalization (numerator) only, not also as part of index hospitalizations (denominator). Our study confirms the importance of including observation hospitalizations in both the index (denominator) and 30-day (numerator) rehospitalization positions to determine the full impact of observation hospitalizations on Medicare’s HRRP metrics.
Our study has limitations. We focused on nonsurgical HRRP conditions, which may have impacted our findings. Additionally, some authors have suggested including emergency department (ED) visits in rehospitalization studies.7 Although ED visits occur at hospitals, they are not hospitalizations; we excluded them as a first step. Had we included ED visits, encounters excluded from HRRP measurements would have increased, suggesting that our findings, while sizeable, are likely conservative. Additionally, we could not determine the merits or medical necessity of hospitalizations (inpatient or outpatient observation), but this is an inherent limitation in a large claims dataset like this one. Finally, we only included a single year of data in this analysis, and it is possible that additional years of data would show different trends. However, we have no reason to believe the study year to be an aberrant year; if anything, observation rates have increased since 2014,6 again pointing out that while our findings are sizable, they are likely conservative. Future research could include additional years of data to confirm even greater proportions of rehospitalizations exempt from HRRP over time due to observation hospitalizations as index and/or 30-day events.
Outpatient observation hospitalizations can occur anywhere in the hospital and are often clinically similar to inpatient hospitalizations, yet observation hospitalizations are essentially invisible under inpatient quality metrics. Requiring the HRRP to include observation hospitalizations is the most obvious solution, but this could require major regulatory and legislative change11,13—change that would fix a metric but fail to address broad policy concerns inherent in the two-tiered observation and inpatient billing distinction. Instead, CMS and Congress might consider this an opportunity to address the oxymoron of “outpatient hospitalizations” by engaging in comprehensive observation reform.
1. Centers for Medicare & Medicaid Services. Hospital Readmissions Reduction Program (HRRP). Accessed March 12, 2021. https://www.cms.gov/Medicare/Medicare-Fee-for-Service-Payment/AcuteInpatientPPS/Readmissions-Reduction-Program
2. Sabbatini AK, Wright B. Excluding observation stays from readmission rates—what quality measures are missing. N Engl J Med. 2018;378(22):2062-2065. https://doi.org/10.1056/NEJMp1800732
3. Sheehy AM, Powell WR, Kaiksow FA, et al. Thirty-day re-observation, chronic re-observation, and neighborhood disadvantage. Mayo Clin Proc. 2020;95(12):2644-2654. https://doi.org/10.1016/j.mayocp.2020.06.059
4. US Department of Health and Human Services. Office of Inspector General. Vulnerabilities remain under Medicare’s 2-midnight hospital policy. December 19, 2016. Accessed February 11, 2021. https://oig.hhs.gov/oei/reports/oei-02-15-00020.asp
5. Zuckerman RB, Sheingold SH, Orav EJ, Ruhter J, Epstein AM. Readmissions, observation and the Hospital Readmissions Reduction Program. N Engl J Med. 2016;374(16):1543-1551. https://doi.org/10.1056/NEJMsa1513024
6. Medicare Payment Advisory Commission. Mandated report: the effects of the Hospital Readmissions Reduction Program. In: Report to the Congress: Medicare and the Health Care Delivery System. 2018;3-31. Accessed March 17, 2021. Available at: http://www.medpac.gov/docs/default-source/reports/jun18_medpacreporttocongress_rev_nov2019_note_sec.pdf?sfvrsn=0
7. Wadhera RK, Yeh RW, Maddox KEJ. The Hospital Readmissions Reduction Program—time for a reboot. N Engl J Med. 2019;380(24):2289-2291. https://doi.org/10.1056/NEJMp1901225
8. National Quality Forum. Measure #1789: Hospital-wide all-cause unplanned readmission measure. Accessed January 30, 2021. https://www.qualityforum.org/ProjectDescription.aspx?projectID=73619
9. Sheehy AM, Shi F, Kind AJH. Identifying observation stays in Medicare data: policy implications of a definition. J Hosp Med. 2019;14(2):96-100. https://doi.org/10.12788/jhm.3038
10. Powell WR, Kaiksow FA, Kind AJH, Sheehy AM. What is an observation stay? Evaluating the use of hospital observation stays in Medicare. J Am Geriatr Soc. 2020;68(7):1568-1572. https://doi.org/10.1111/jgs.16441
11. Centers for Medicare & Medicaid Services. Hospital Readmissions Reduction Program (HRRP) Archives. Accessed February 10, 2021. https://www.cms.gov/Medicare/Medicare-Fee-for-Service-Payment/AcuteInpatientPPS/HRRP-Archives
12. Figueroa JF, Burke LG, Zheng J, Orav EJ, Jha AK. Trends in hospitalization vs observation stay for ambulatory care-sensitive conditions. JAMA Intern Med. 2019;179(12): 1714-1716. https://doi.org/10.1001/jamainternmed.2019.3177
13. Public Law 111-148, Patient Protection and Affordable Care Act, 111th Congress. March 23, 2010. Accessed March 12, 2021.https://www.congress.gov/111/plaws/publ148/PLAW-111publ148.pdf
© 2021 Society of Hospital Medicine