User login
Obesity Intervention With Follow‐up
Obesity‐related medical care remains a substantial driver in escalating healthcare costs. Not surprisingly, healthcare costs for obese patients are 40% higher annually than those for normal‐weight individuals.[1] In 2002, the morbidity attributable to obesity was calculated to equal, if not exceed, that associated with smoking.[2] Though inpatient outcomes appear similar for obese individuals, nearly all obesity‐related comorbidities can lead to hospitalization, and obesity has been linked to early mortality.[3, 4, 5] As obesity‐related costs continue to grow, so does the need to intervene in this at‐risk patient population.[3, 4, 5] Though significant efforts have focused on obesity interventions in the outpatient setting, a paucity of data exists on how best to address obesity during inpatient hospitalization.
Hospitalization itself has often been described as a teachable moment, a time during which a life event leads to increased receptivity to behavior change.[6, 7, 8] The positive effects of inpatient smoking cessation efforts are well recognized. Such initiatives typically include an inpatient counseling session, followed by supportive contact postdischarge.[9, 10] Features common to successful outpatient weight loss interventions include ongoing patient contact of variable duration, frequent self‐weighing, diet modifications, and increased activity.[11, 12, 13, 14, 15] To date, little is known about the effectiveness of such programs in the inpatient setting, though research has shown that obese inpatients are receptive to weight loss initiatives.[16] Accomplishing even modest weight reductions in such patients has the potential to lead to significant health and cost benefits.[1, 17, 18, 19]
In this study we sought to determine whether inpatient weight loss counseling with post discharge phone follow‐up would result in significant weight loss at 6 months when compared to controls. Secondary end points included weight change from baseline and changes in waist‐to‐hip ratios (WHRs). To our knowledge, this is the first randomized trial designed to evaluate the effect of an inpatient obesity intervention with postdischarge follow‐up in a general medicine population.
METHODS
Setting/Participants
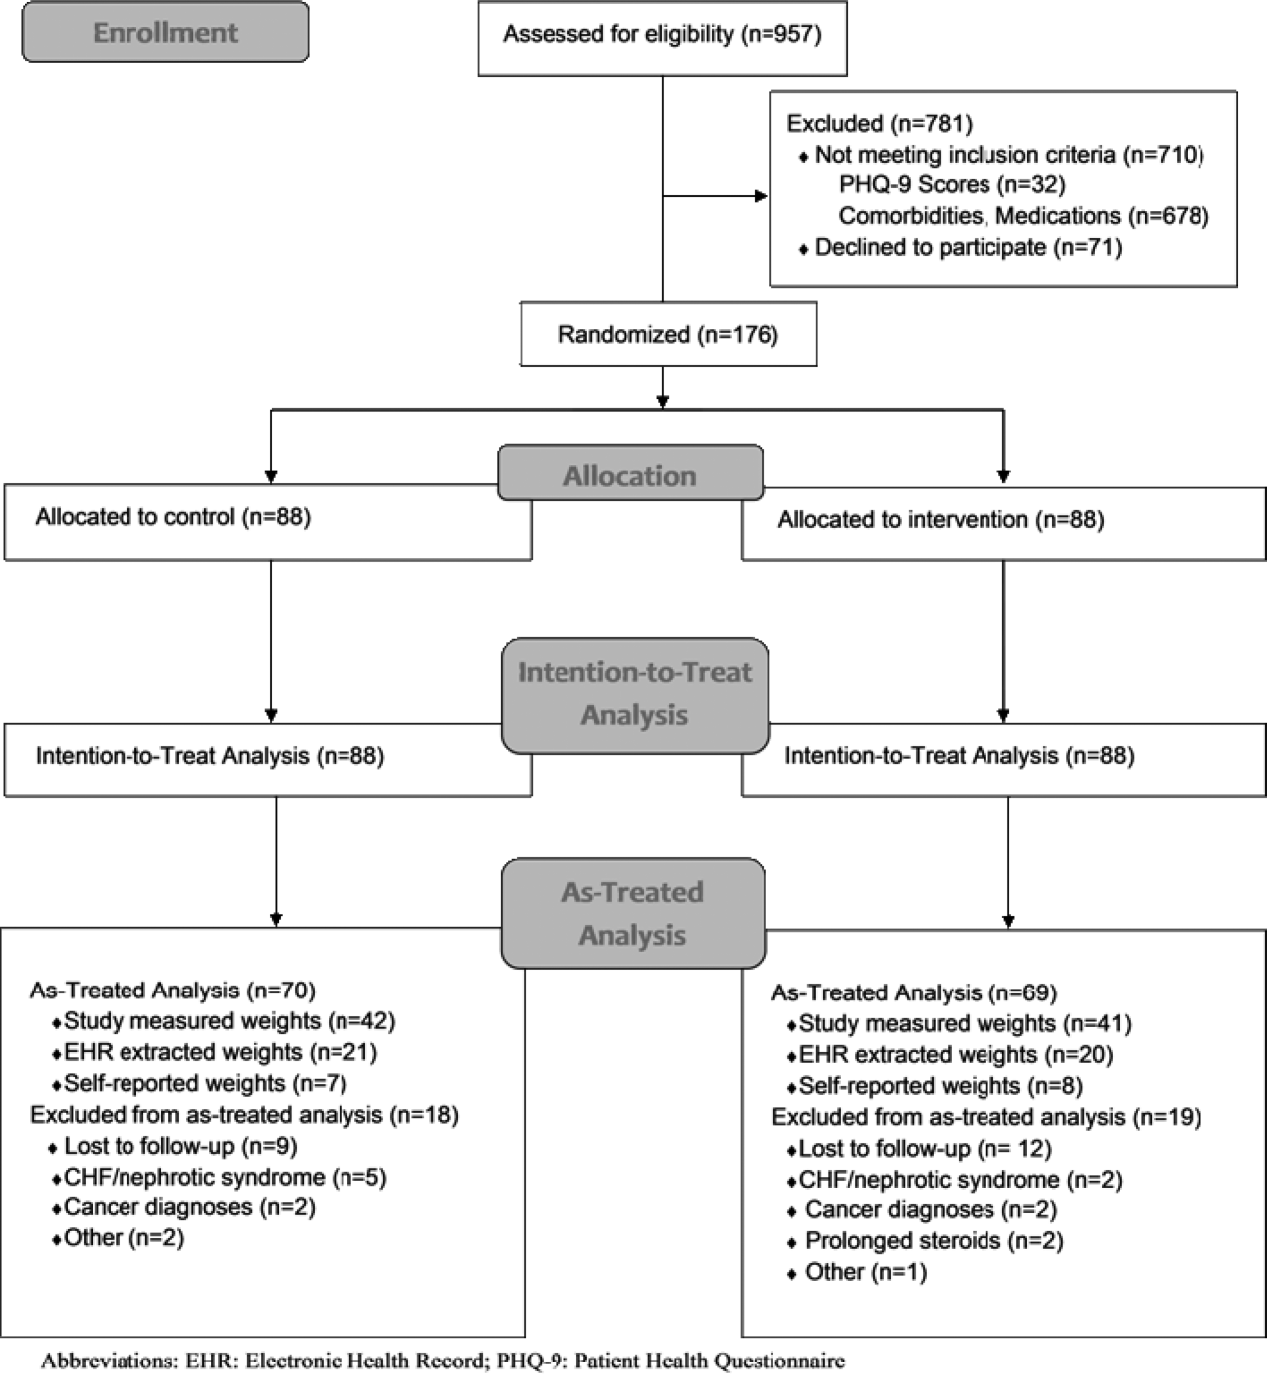
We conducted a prospective, randomized controlled trial from January 2011 to May 2012 at a single, large (854‐bed), academic medical center in Chicago, Illinois. Eligible subjects were those with a body mass index (BMI; calculated as weight in kilograms divided by height in meters squared) between 30 and 50 kg/m2, ages 18 to 65 years old, admitted to an internal medicine service. Exclusion criteria included the presence of acute medical conditions known to affect weight, Charlson comorbidity index >3, moderate to severe major depression, prolonged steroid use (>2 weeks), initiation of medications known to affect weight (eg, diuretics), non‐English speaking, and precontemplation stage of change. Upon enrollment, subjects were randomly assigned to either the control or intervention group. A computer‐generated block randomization scheme was used to generate group assignments. Study research assistants sequentially assigned enrolled patients according to the computer‐generated randomization scheme. Group assignment was only revealed to each study participant after enrollment was complete. Figure 1 summarizes subject recruitment, randomization, and follow‐up. Informed written consent was obtained from all participants. Study participants, physicians, and investigators were unblinded. Study subjects were informed that they were participating in an obesity study as outlined on the study consent form. Study protocols and procedures were approved by the institutional review board at Northwestern University.

Interventions
After enrollment, all subjects had body weight measured on a calibrated study scale in light clothing or hospital gown without shoes. Waist circumference (narrowest circumference between the ribs and iliac crest) and hip circumference (maximum circumference of the hips) were measured to the nearest 0.1 cm. Measurements were taken in triplicate and averaged. WHR was calculated as waist circumference divided by hip circumference. All participants completed a demographic questionnaire and rated their level of agreement with 6 statements relating to weight perceptions and weight loss using a Likert scale from 1 (strongly disagree) to 10 (strongly agree).
Participants in the control group were not provided with any specific instructions regarding weight loss, diet, or exercise prior to discharge. Intervention group subjects were asked to view a 13‐minute weight loss education video (addressed specific caloric intake goals for weight loss, portion sizes), undergo a 25‐minute personalized counseling session with a certified health educator or study physician, and to set 3 specific lifestyle goals prior to discharge (weight loss, dietary, and fitness). A personal weight loss goal of 10% baseline body weight was set for intervention subjects based on obesity treatment guidelines suggesting subjects could safely lose 1 to 2 lb per week over the course of the study.[20] Clinically significant weight loss was defined as weight loss of 5% or more from baseline body weight based on literature illustrating health benefits with this amount of weight loss.[17, 18, 19]
All study subjects received a phone call schedule and weight‐tracking sheet prior to discharge, with calls scheduled at weeks 1, 2, 3, 4, 8, 12, 16, 20, and 24. Phone calls for both groups were used to obtain weight and identify changes in medications or health condition and were conducted by a certified health educator or study physician. No problem solving, motivational support, or other specific instruction was provided to the control group, whereas phone calls for intervention subjects utilized motivational interviewing and problem‐solving techniques.
Study subjects were asked to return for an in‐person follow‐up visit at 6 months. Weight was reassessed with subjects in light clothing and without shoes on the same calibrated study scale by a certified health educator. Follow‐up WHRs were also collected.
Outcomes
The primary outcome of the study was the difference in mean weight change (change in kilograms from baseline) between control and intervention groups at 6 months. Secondary outcome measures included intragroup weight change from baseline and changes in WHR.
Measured weights were obtained for subjects who returned for 6‐month follow‐up. For those unable or unwilling to return at 6 months, measured weights were obtained from the electronic health record (EHR) and self‐reported weights requested for use in imputed weight calculations. Imputation weights for missing weight values were prioritized as follows: (1) in‐person 6‐month follow‐up weight used if available, (2) inpatient or outpatient EHR obtained weight used if in‐person weight unavailable, and (3) if neither an in‐person or EHR weight was available, a self‐reported weight was used.[21] For intention‐to‐treat analysis, baseline weight was carried forward for subjects lacking follow‐up data after enrollment, historically considered a conservative strategy in weight loss trials.[22, 23]
Statistical Analysis
Baseline patient characteristics were compared using 2 tests for categorical variables and 2‐sample t tests for continuous variables. The primary study outcome of weight change over time for each group was assessed for all study participants using an intention‐to‐treat analysis. Separate as‐treated analyses were also performed utilizing imputed weights for those who failed to follow‐up at 6 months and for study completers who had a measured study weight documented at 6 months.
Three analyzable datasets were computed: intention‐to‐treat (using all participants randomized to the study), as‐treated analysis with imputed weights, and as treated analysis with measured 6‐month study weights only. Intent‐to‐treat analysis provides the unbiased comparisons among the treatment groups. To avoid dilution of treatment effect, as‐treated analyses with imputed weights (including measured weights at 6‐month follow‐up obtained from other sources [eg, clinic visit]) and with measured study weights (completers only) were performed.
Weight change over time was analyzed with a longitudinal covariance pattern model, using an unstructured variance‐covariance matrix. Specifically, weight was modeled at all time points (baseline and weeks 1, 2, 3, 4, 8, 12, 16, 20, and 24) using a priori contrasts and treating baseline as the reference cell to assess weight change, relative to baseline, at the 4 postbaseline time points.[24] Group effects on these a priori time contrasts were included to test for weight change differences between groups, and we specifically tested whether the group effect on weight change was equal or varied across the postbaseline time points.
We aimed to obtain a sample size of 176 subjects (88 in each group) in order to achieve 80% power to detect a 5‐kg weight loss in the intervention group after 6 months (at most standard deviation [SD]=15) and a 5‐kg difference in weight loss between groups (SD=10), assuming an of 0.05 using 2‐tailed testing and an attrition rate of 20%.
RESULTS
Over a period of 18 months we were able to recruit 176 subjects. We found no significant differences in baseline characteristics between groups (Table 1). Sixteen subjects developed exclusionary conditions after enrollment and were subsequently excluded from as‐treated data analyses. Follow‐up weight data for as‐treated analysis were available for 139 study subjects through the use of in‐person (n=83), EHR (n=41), and self‐reported (n=15) weights.
| Intervention, N=88 | Control, N=88 | |
|---|---|---|
| ||
| Age, y, mean (SD) | 48.9 (10.5) | 48.7 (10.3) |
| Female, % | 67.1 | 62.5 |
| Race/ethnicity, % | ||
| African American | 50.0 | 41.4 |
| Caucasian | 36.4 | 46.5 |
| Other | 13.6 | 11.6 |
| Education level, % | ||
| High school | 11.4 | 11.5 |
| College | 68.2 | 64.4 |
| Graduate level | 20.5 | 24.1 |
| Annual income, % | ||
| <$50,000 | 43.0 | 45.2 |
| $50,000$100,000 | 45.4 | 33.3 |
| >$100,000 | 11.6 | 21.4 |
| BMI, mean (SD), kg/m2 | 38.0 (5.1) | 37.5 (4.9) |
| BMI category, % | ||
| 3034.9 | 34.1 | 34.1 |
| 3539.9 | 28.4 | 37.5 |
| 40 | 37.5 | 28.4 |
| Waist‐hip ratio, mean (SD)a | 0.95 (0.08) | 0.96 (0.08) |
| Length of stay, d, median (interquartile range) | 2.0 (1.13.0) | 2.2 (1.33.3) |
| Diabetes, % | 27.3 | 25.0 |
| Admit diagnosis, % | ||
| Cardiovascular | 34.1 | 25.0 |
| Gastrointestinal | 15.9 | 18.2 |
| Pulmonary | 10.2 | 5.7 |
| Infectious | 11.4 | 13.6 |
| Endocrine | 3.4 | 2.3 |
| Other | 25.0 | 35.2 |
Change in Weight Loss and WHR
For the 176 participants included in the intent‐to‐treat analysis, mean weight loss for the intervention group and control groups was 1.08 kg (SD=4.33) and 1.35 kg (SD=3.64) at 6 months, respectively. We found no significant difference in weight loss between groups at 6 months (P=0.26), though there was statistically significant weight loss from baseline noted in both groups (P=0.02 and P=0.0008, respectively) (Table 2).
| Characteristic | Intervention Group | Control Group | P Valuea |
|---|---|---|---|
| |||
| Intent‐to‐treat analysis (all participants), kg (SD) | |||
| No. | 88 | 88 | |
| Baseline | 107.7 (16.7) | 105.1 (17.4) | 0.23 |
| 6‐month follow‐up | 106.6 (16.1) | 103.8 (17.1) | 0.16 |
| Weight change | 1.08 (4.33) | 1.35 (3.64) | 0.26 |
| As treated analysis with imputed weights, kg (SD) | |||
| No. | 69 | 70 | |
| Baseline | 108.9 (16.7) | 104.0 (16.2) | 0.08 |
| 6‐month follow‐up | 106.1 (17.2) | 102.4 (15.9) | 0.18 |
| Weight change | 2.88 (5.77) | 1.69 (5.09) | 0.12 |
| As treated analysis with measured 6‐month weights (completers), kg (SD) | |||
| No. | 41 | 42 | |
| Baseline | 109.8 (16.2) | 107.0 (18.0) | 0.47 |
| 6‐month follow‐up | 107.4 (15.0) | 104.2 (17.7) | 0.37 |
| Weight change | 2.32 (6.16) | 2.83 (4.88) | 0.68 |
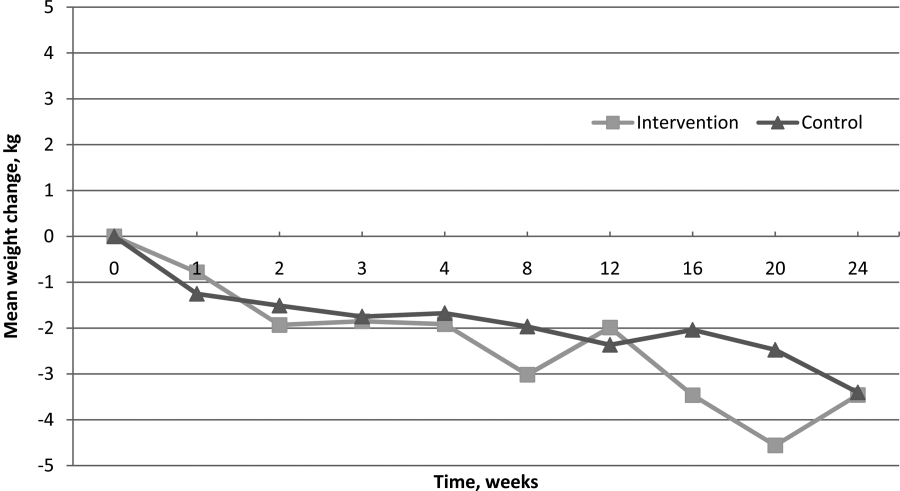
Of 139 participants in the as‐treated analysis utilizing imputed weights, weight loss for the intervention group and control groups was 2.88 kg (SD=5.77) and 1.69 kg (SD=5.09). There was statistically significant weight loss at the 6‐month follow‐up from baseline in both groups (P=0.006, P=0.004, respectively). However, there were neither statistically nor clinically significant differences between the 2 groups (1.19 kg, P=0.12). Finally, for the 83 completers in the as‐treated analysis with measured study weights only, weight loss for the intervention group and control group was 2.32 kg (SD=6.16) and 2.83 kg (SD=4.88), respectively. Though we again noted statistically significant weight loss at the 6‐month follow‐up from baseline in both groups (P=0.02, P=0.0005, respectively), we found neither statistically nor clinically significant differences in weight loss between the 2 groups (0.51 kg, P=0.68). Figure 2 illustrates weight change over time for the intervention and control subjects who returned for in‐person follow‐up at 6 months.
For WHRs, we found no difference in WHR change between groups at 6 months (0.04 vs 0.04, P=0.59). However, among those who completed the study, there was a statistically significant decrease in WHR from baseline within both groups, decreasing 0.040.06 (P=0.006) in the intervention group and 0.040.04 (P<0.001) among controls.
Weight Perceptions
Only 34% of participants accurately perceived their weight and correctly identified themselves as either obese or morbidly obese. Nearly half of the study participants (47%) classified themselves as overweight rather than obese, though all met criteria for obesity. We found weight perception was most accurate among Caucasians (48%) and least accurate among African Americans (24%) and morbidly obese individuals (26%). Nearly all subjects felt weight loss was important (99%), and most assumed weight had contributed to their hospitalization (64%).
DISCUSSION
We hypothesized that intervention group subjects would lose more weight than those assigned to control given that they received weight loss interventions previously shown to be effective.[13, 25, 26, 27] However, intention‐to‐treat analysis showed no difference in weight loss between intervention and control subjects at 6 months. Interestingly, as‐treated analyses did suggest that subjects in both study arms lost a modest amount of weight over the duration of the study. Though modest weight reductions have been shown to give rise to health benefits, neither group met our prespecified goal for clinically significant weight loss (5% of baseline body weight).[18, 19] There were also no differences in WHRs noted between the intervention and control groups. The modest reductions in WHRs from baseline in both groups are of uncertain clinical significance but of interest given the well‐established graded relationship between WHR and risk of cardiovascular disease.[28, 29, 30, 31]
Though the control group subjects received no specific instruction regarding weight loss, we suspect that the influences of study enrollment, discussion of obesity while an inpatient, regular phone contacts, and weight tracking may have been sufficient to affect weight behaviors. Certainly, this exceeds usual care for hospitalized patients suffering from obesity. Though it is possible that all of obese patients lose weight over the 6‐month period following hospitalization, we feel this is unlikely. The exclusion of subjects with an elevated Charlson comorbidity index lessened the likelihood of weight loss due to chronic disease, and without intervention, obese individuals tend to gain rather than lose weight over time.[32] Nonetheless, the lack of significant weight loss between groups suggests that the specific weight loss instruction provided to the intervention group did not promote more weight loss than the general education and regular phone calls provided to controls.
Our findings related to weight perception were similar to those established in prior studies. Individuals frequently misperceive their weight and weight perceptions are least accurate among severely obese individuals and nonwhites.[16, 33, 34] Contrary to prior studies, we found that the majority of participants felt their weight negatively impacted their health, and most thought their hospitalization was weight‐related.[35] Interestingly, research suggests that weight‐related perception of health risk correlates with the likelihood of making a weight loss attempt, another factor that may have influenced the behavior of study participants.[35]
This study has several limitations. It was conducted and based on practices at a single institution, thus limiting generalizability. Additionally, the percentage of subjects who returned for 6‐month follow‐up was lower than desired at 50%. However, high attrition rates commonly plague obesity trials, and we are unaware of any existing studies documenting expected attrition rates among obese inpatients.[23, 36, 37, 38] To help address this, we used imputed weights in our as‐treated analysis to obtain follow‐up weight values on 79% of subjects. Further, the intentional exclusion of subjects in the precontemplation stage of change likely resulted in selection of a more motivated patient population. However, this was done assuming that most inpatient obesity interventions would primarily target patients interested in losing weight. Finally, the lack of a usual care group that more accurately reflects the experience of most hospitalized obese patientsno regular postdischarge interactionsdoes limit interpretation of the modest weight loss noted in both study groups.
In conclusion, an inpatient obesity intervention with post‐discharge follow‐up did not result in intervention subjects losing more weight than controls over a 6‐month period. However, the finding of modest weight loss among both groups is of interest and may warrant further investigation. It remains unclear whether this is a naturally occurring phenomenon or whether other factors influence behavior change in this patient population. Additional studies will be needed to clarify the impact of hospitalization, obesity recognition, perception of health risk, weight tracking, and follow‐up on weight behaviors. Given the proven benefits of even modest weight reductions, encouraging any amount of weight loss in these at‐risk individuals would appear to be a step in the right direction. We have yet to determine whether inpatient obesity interventions represent a lost opportunity.
- , , , . The impact of weight loss among seniors on Medicare spending. Health Econ Rev. 2013;3(1):7.
- . The effects of obesity, smoking, and drinking on medical problems and costs. Health Aff (Millwood). 2002;21(2):245–253.
- , , , , , . The incidence of co‐morbidities related to obesity and overweight: a systematic review and meta‐analysis. BMC Public Health. 2009;9:88.
- , , , , , . The impact of obesity on US mortality levels: the importance of age and cohort factors in population estimates. Am J Public Health. 2013;103(10):1895–1901.
- , , , . Assessment of excess mortality in obesity. Am J Epidemiol. 1998;147(1):42–48.
- , , . Importance of in‐hospital initiation of evidence‐based medical therapies for heart failure‐a review. Am J Cardiol. 2004;94(9):1155–1160.
- . In‐hospital initiation of statins: taking advantage of the “teachable moment”. Cleve Clin J Med. 2003;70(6):502, 504–506.
- , , . Understanding the potential of teachable moments: the case of smoking cessation. Health Educ Res. 2003;18(2):156–170.
- , , . Smoking cessation interventions for hospitalized smokers: a systematic review. Arch Intern Med. 2008;168(18):1950–1960.
- , . Smoking cessation initiated during hospital stay for patients with coronary artery disease: a randomized controlled trial. CMAJ. 2009;180(13):1297–1303.
- , , , , , . Phone and e‐mail counselling are effective for weight management in an overweight working population: a randomized controlled trial. BMC Public Health. 2009;9:6.
- , . Weighing the evidence: benefits of regular weight monitoring for weight control. J Nutr Educ Behav. 2005;37(6):319–322.
- , , , et al. Comparative effectiveness of weight‐loss interventions in clinical practice. N Engl J Med. 2011;365(21):1959–1968.
- , , , et al. Weight‐loss outcomes: a systematic review and meta‐analysis of weight‐loss clinical trials with a minimum 1‐year follow‐up. J Am Diet Assoc. 2007;107(10):1755–1767.
- , , . Self‐monitoring in weight loss: a systematic review of the literature. J Am Diet Assoc. 2011;111(1):92–102.
- , , , . Willingness for weight loss intervention among overweight and obese inpatients. South Med J. 2011;104(6):397–400.
- , , , et al. Benefits of modest weight loss in improving cardiovascular risk factors in overweight and obese individuals with type 2 diabetes. Diabetes Care. 2011;34(7):1481–1486.
- , , . The beneficial effects of modest weight loss on cardiovascular risk factors. Int J Obes Relat Metab Disord. 1997;21(suppl 1):S5–S9.
- . Beneficial health effects of modest weight loss. Int J Obes Relat Metab Disord. 1992;16(6):397–415.
- Clinical guidelines on the identification, evaluation, and treatment of overweight and obesity in adults—the evidence report. National Institutes of Health. Obes Res. 1998;6(suppl 2):51S–209S.
- , , , et al. Validity of clinical body weight measures as substitutes for missing data in a randomized trial. Obes Res Clin Pract. 2008;2(4):277–281.
- , , . Advances in analysis of longitudinal data. Ann Rev Clin Psychol. 2010;6:79–107.
- , , , et al. Missing data in randomized clinical trials for weight loss: scope of the problem, state of the field, and performance of statistical methods. PloS One. 2009;4(8):e6624.
- , . Longitudinal Data Analysis. Hoboken, NJ: Wiley‐Interscience; 2006.
- , , , . Comparison of methods for delivering a lifestyle modification program for obese patients: a randomized trial. Ann Intern Med. 2009;150(4):255–262.
- . Clinical practice. Nonsurgical management of obesity in adults. N Engl J Med. 2008;358(18):1941–1950.
- , , . A meta‐analysis of the past 25 years of weight loss research using diet, exercise or diet plus exercise intervention. Int J Obes Relat Metab Disord. 1997;21(10):941–947.
- , , , et al. Body fat distribution and risk of coronary heart disease in men and women in the European Prospective Investigation Into Cancer and Nutrition in Norfolk cohort: a population‐based prospective study. Circulation. 2007;116(25):2933–2943.
- , , , et al. The association of differing measures of overweight and obesity with prevalent atherosclerosis: the Dallas Heart Study. J Am Coll Cardiol. 2007;50(8):752–759.
- , , , et al. Obesity and the risk of myocardial infarction in 27,000 participants from 52 countries: a case‐control study. Lancet. 2005;366(9497):1640–1649.
- , , , . Waist circumference and waist‐to‐hip ratio as predictors of cardiovascular events: meta‐regression analysis of prospective studies. Eur Heart J. 2007;28(7):850–856.
- , , , . Obesity and the environment: where do we go from here? Science. 2003;299(5608):853–855.
- , . Self‐perception of weight appropriateness in the United States. Am J Prev Med. 2003;24(4):332–339.
- , , , et al. Differences in weight perception among blacks and whites. J Womens Health (Larchmt). 2011;20(12):1805–1811.
- , , , , . Perceived health risk of excess body weight among overweight and obese men and women: differences by sex. Prev Med. 2008;47(1):46–52.
- , , . Obesity research—limitations of methods, measurements, and medications. JAMA. 2006;295(7):826–828.
- . Interpreting incomplete data in studies of diet and weight loss. N Engl J Med. 2003;348(21):2136–2137.
- , , , . Predictors of attrition in a large clinic‐based weight‐loss program. Obes Res. 2003;11(7):888–894.
Obesity‐related medical care remains a substantial driver in escalating healthcare costs. Not surprisingly, healthcare costs for obese patients are 40% higher annually than those for normal‐weight individuals.[1] In 2002, the morbidity attributable to obesity was calculated to equal, if not exceed, that associated with smoking.[2] Though inpatient outcomes appear similar for obese individuals, nearly all obesity‐related comorbidities can lead to hospitalization, and obesity has been linked to early mortality.[3, 4, 5] As obesity‐related costs continue to grow, so does the need to intervene in this at‐risk patient population.[3, 4, 5] Though significant efforts have focused on obesity interventions in the outpatient setting, a paucity of data exists on how best to address obesity during inpatient hospitalization.
Hospitalization itself has often been described as a teachable moment, a time during which a life event leads to increased receptivity to behavior change.[6, 7, 8] The positive effects of inpatient smoking cessation efforts are well recognized. Such initiatives typically include an inpatient counseling session, followed by supportive contact postdischarge.[9, 10] Features common to successful outpatient weight loss interventions include ongoing patient contact of variable duration, frequent self‐weighing, diet modifications, and increased activity.[11, 12, 13, 14, 15] To date, little is known about the effectiveness of such programs in the inpatient setting, though research has shown that obese inpatients are receptive to weight loss initiatives.[16] Accomplishing even modest weight reductions in such patients has the potential to lead to significant health and cost benefits.[1, 17, 18, 19]
In this study we sought to determine whether inpatient weight loss counseling with post discharge phone follow‐up would result in significant weight loss at 6 months when compared to controls. Secondary end points included weight change from baseline and changes in waist‐to‐hip ratios (WHRs). To our knowledge, this is the first randomized trial designed to evaluate the effect of an inpatient obesity intervention with postdischarge follow‐up in a general medicine population.
METHODS
Setting/Participants
We conducted a prospective, randomized controlled trial from January 2011 to May 2012 at a single, large (854‐bed), academic medical center in Chicago, Illinois. Eligible subjects were those with a body mass index (BMI; calculated as weight in kilograms divided by height in meters squared) between 30 and 50 kg/m2, ages 18 to 65 years old, admitted to an internal medicine service. Exclusion criteria included the presence of acute medical conditions known to affect weight, Charlson comorbidity index >3, moderate to severe major depression, prolonged steroid use (>2 weeks), initiation of medications known to affect weight (eg, diuretics), non‐English speaking, and precontemplation stage of change. Upon enrollment, subjects were randomly assigned to either the control or intervention group. A computer‐generated block randomization scheme was used to generate group assignments. Study research assistants sequentially assigned enrolled patients according to the computer‐generated randomization scheme. Group assignment was only revealed to each study participant after enrollment was complete. Figure 1 summarizes subject recruitment, randomization, and follow‐up. Informed written consent was obtained from all participants. Study participants, physicians, and investigators were unblinded. Study subjects were informed that they were participating in an obesity study as outlined on the study consent form. Study protocols and procedures were approved by the institutional review board at Northwestern University.
Interventions
After enrollment, all subjects had body weight measured on a calibrated study scale in light clothing or hospital gown without shoes. Waist circumference (narrowest circumference between the ribs and iliac crest) and hip circumference (maximum circumference of the hips) were measured to the nearest 0.1 cm. Measurements were taken in triplicate and averaged. WHR was calculated as waist circumference divided by hip circumference. All participants completed a demographic questionnaire and rated their level of agreement with 6 statements relating to weight perceptions and weight loss using a Likert scale from 1 (strongly disagree) to 10 (strongly agree).
Participants in the control group were not provided with any specific instructions regarding weight loss, diet, or exercise prior to discharge. Intervention group subjects were asked to view a 13‐minute weight loss education video (addressed specific caloric intake goals for weight loss, portion sizes), undergo a 25‐minute personalized counseling session with a certified health educator or study physician, and to set 3 specific lifestyle goals prior to discharge (weight loss, dietary, and fitness). A personal weight loss goal of 10% baseline body weight was set for intervention subjects based on obesity treatment guidelines suggesting subjects could safely lose 1 to 2 lb per week over the course of the study.[20] Clinically significant weight loss was defined as weight loss of 5% or more from baseline body weight based on literature illustrating health benefits with this amount of weight loss.[17, 18, 19]
All study subjects received a phone call schedule and weight‐tracking sheet prior to discharge, with calls scheduled at weeks 1, 2, 3, 4, 8, 12, 16, 20, and 24. Phone calls for both groups were used to obtain weight and identify changes in medications or health condition and were conducted by a certified health educator or study physician. No problem solving, motivational support, or other specific instruction was provided to the control group, whereas phone calls for intervention subjects utilized motivational interviewing and problem‐solving techniques.
Study subjects were asked to return for an in‐person follow‐up visit at 6 months. Weight was reassessed with subjects in light clothing and without shoes on the same calibrated study scale by a certified health educator. Follow‐up WHRs were also collected.
Outcomes
The primary outcome of the study was the difference in mean weight change (change in kilograms from baseline) between control and intervention groups at 6 months. Secondary outcome measures included intragroup weight change from baseline and changes in WHR.
Measured weights were obtained for subjects who returned for 6‐month follow‐up. For those unable or unwilling to return at 6 months, measured weights were obtained from the electronic health record (EHR) and self‐reported weights requested for use in imputed weight calculations. Imputation weights for missing weight values were prioritized as follows: (1) in‐person 6‐month follow‐up weight used if available, (2) inpatient or outpatient EHR obtained weight used if in‐person weight unavailable, and (3) if neither an in‐person or EHR weight was available, a self‐reported weight was used.[21] For intention‐to‐treat analysis, baseline weight was carried forward for subjects lacking follow‐up data after enrollment, historically considered a conservative strategy in weight loss trials.[22, 23]
Statistical Analysis
Baseline patient characteristics were compared using 2 tests for categorical variables and 2‐sample t tests for continuous variables. The primary study outcome of weight change over time for each group was assessed for all study participants using an intention‐to‐treat analysis. Separate as‐treated analyses were also performed utilizing imputed weights for those who failed to follow‐up at 6 months and for study completers who had a measured study weight documented at 6 months.
Three analyzable datasets were computed: intention‐to‐treat (using all participants randomized to the study), as‐treated analysis with imputed weights, and as treated analysis with measured 6‐month study weights only. Intent‐to‐treat analysis provides the unbiased comparisons among the treatment groups. To avoid dilution of treatment effect, as‐treated analyses with imputed weights (including measured weights at 6‐month follow‐up obtained from other sources [eg, clinic visit]) and with measured study weights (completers only) were performed.
Weight change over time was analyzed with a longitudinal covariance pattern model, using an unstructured variance‐covariance matrix. Specifically, weight was modeled at all time points (baseline and weeks 1, 2, 3, 4, 8, 12, 16, 20, and 24) using a priori contrasts and treating baseline as the reference cell to assess weight change, relative to baseline, at the 4 postbaseline time points.[24] Group effects on these a priori time contrasts were included to test for weight change differences between groups, and we specifically tested whether the group effect on weight change was equal or varied across the postbaseline time points.
We aimed to obtain a sample size of 176 subjects (88 in each group) in order to achieve 80% power to detect a 5‐kg weight loss in the intervention group after 6 months (at most standard deviation [SD]=15) and a 5‐kg difference in weight loss between groups (SD=10), assuming an of 0.05 using 2‐tailed testing and an attrition rate of 20%.
RESULTS
Over a period of 18 months we were able to recruit 176 subjects. We found no significant differences in baseline characteristics between groups (Table 1). Sixteen subjects developed exclusionary conditions after enrollment and were subsequently excluded from as‐treated data analyses. Follow‐up weight data for as‐treated analysis were available for 139 study subjects through the use of in‐person (n=83), EHR (n=41), and self‐reported (n=15) weights.
| Intervention, N=88 | Control, N=88 | |
|---|---|---|
| ||
| Age, y, mean (SD) | 48.9 (10.5) | 48.7 (10.3) |
| Female, % | 67.1 | 62.5 |
| Race/ethnicity, % | ||
| African American | 50.0 | 41.4 |
| Caucasian | 36.4 | 46.5 |
| Other | 13.6 | 11.6 |
| Education level, % | ||
| High school | 11.4 | 11.5 |
| College | 68.2 | 64.4 |
| Graduate level | 20.5 | 24.1 |
| Annual income, % | ||
| <$50,000 | 43.0 | 45.2 |
| $50,000$100,000 | 45.4 | 33.3 |
| >$100,000 | 11.6 | 21.4 |
| BMI, mean (SD), kg/m2 | 38.0 (5.1) | 37.5 (4.9) |
| BMI category, % | ||
| 3034.9 | 34.1 | 34.1 |
| 3539.9 | 28.4 | 37.5 |
| 40 | 37.5 | 28.4 |
| Waist‐hip ratio, mean (SD)a | 0.95 (0.08) | 0.96 (0.08) |
| Length of stay, d, median (interquartile range) | 2.0 (1.13.0) | 2.2 (1.33.3) |
| Diabetes, % | 27.3 | 25.0 |
| Admit diagnosis, % | ||
| Cardiovascular | 34.1 | 25.0 |
| Gastrointestinal | 15.9 | 18.2 |
| Pulmonary | 10.2 | 5.7 |
| Infectious | 11.4 | 13.6 |
| Endocrine | 3.4 | 2.3 |
| Other | 25.0 | 35.2 |
Change in Weight Loss and WHR
For the 176 participants included in the intent‐to‐treat analysis, mean weight loss for the intervention group and control groups was 1.08 kg (SD=4.33) and 1.35 kg (SD=3.64) at 6 months, respectively. We found no significant difference in weight loss between groups at 6 months (P=0.26), though there was statistically significant weight loss from baseline noted in both groups (P=0.02 and P=0.0008, respectively) (Table 2).
| Characteristic | Intervention Group | Control Group | P Valuea |
|---|---|---|---|
| |||
| Intent‐to‐treat analysis (all participants), kg (SD) | |||
| No. | 88 | 88 | |
| Baseline | 107.7 (16.7) | 105.1 (17.4) | 0.23 |
| 6‐month follow‐up | 106.6 (16.1) | 103.8 (17.1) | 0.16 |
| Weight change | 1.08 (4.33) | 1.35 (3.64) | 0.26 |
| As treated analysis with imputed weights, kg (SD) | |||
| No. | 69 | 70 | |
| Baseline | 108.9 (16.7) | 104.0 (16.2) | 0.08 |
| 6‐month follow‐up | 106.1 (17.2) | 102.4 (15.9) | 0.18 |
| Weight change | 2.88 (5.77) | 1.69 (5.09) | 0.12 |
| As treated analysis with measured 6‐month weights (completers), kg (SD) | |||
| No. | 41 | 42 | |
| Baseline | 109.8 (16.2) | 107.0 (18.0) | 0.47 |
| 6‐month follow‐up | 107.4 (15.0) | 104.2 (17.7) | 0.37 |
| Weight change | 2.32 (6.16) | 2.83 (4.88) | 0.68 |
Of 139 participants in the as‐treated analysis utilizing imputed weights, weight loss for the intervention group and control groups was 2.88 kg (SD=5.77) and 1.69 kg (SD=5.09). There was statistically significant weight loss at the 6‐month follow‐up from baseline in both groups (P=0.006, P=0.004, respectively). However, there were neither statistically nor clinically significant differences between the 2 groups (1.19 kg, P=0.12). Finally, for the 83 completers in the as‐treated analysis with measured study weights only, weight loss for the intervention group and control group was 2.32 kg (SD=6.16) and 2.83 kg (SD=4.88), respectively. Though we again noted statistically significant weight loss at the 6‐month follow‐up from baseline in both groups (P=0.02, P=0.0005, respectively), we found neither statistically nor clinically significant differences in weight loss between the 2 groups (0.51 kg, P=0.68). Figure 2 illustrates weight change over time for the intervention and control subjects who returned for in‐person follow‐up at 6 months.
For WHRs, we found no difference in WHR change between groups at 6 months (0.04 vs 0.04, P=0.59). However, among those who completed the study, there was a statistically significant decrease in WHR from baseline within both groups, decreasing 0.040.06 (P=0.006) in the intervention group and 0.040.04 (P<0.001) among controls.
Weight Perceptions
Only 34% of participants accurately perceived their weight and correctly identified themselves as either obese or morbidly obese. Nearly half of the study participants (47%) classified themselves as overweight rather than obese, though all met criteria for obesity. We found weight perception was most accurate among Caucasians (48%) and least accurate among African Americans (24%) and morbidly obese individuals (26%). Nearly all subjects felt weight loss was important (99%), and most assumed weight had contributed to their hospitalization (64%).
DISCUSSION
We hypothesized that intervention group subjects would lose more weight than those assigned to control given that they received weight loss interventions previously shown to be effective.[13, 25, 26, 27] However, intention‐to‐treat analysis showed no difference in weight loss between intervention and control subjects at 6 months. Interestingly, as‐treated analyses did suggest that subjects in both study arms lost a modest amount of weight over the duration of the study. Though modest weight reductions have been shown to give rise to health benefits, neither group met our prespecified goal for clinically significant weight loss (5% of baseline body weight).[18, 19] There were also no differences in WHRs noted between the intervention and control groups. The modest reductions in WHRs from baseline in both groups are of uncertain clinical significance but of interest given the well‐established graded relationship between WHR and risk of cardiovascular disease.[28, 29, 30, 31]
Though the control group subjects received no specific instruction regarding weight loss, we suspect that the influences of study enrollment, discussion of obesity while an inpatient, regular phone contacts, and weight tracking may have been sufficient to affect weight behaviors. Certainly, this exceeds usual care for hospitalized patients suffering from obesity. Though it is possible that all of obese patients lose weight over the 6‐month period following hospitalization, we feel this is unlikely. The exclusion of subjects with an elevated Charlson comorbidity index lessened the likelihood of weight loss due to chronic disease, and without intervention, obese individuals tend to gain rather than lose weight over time.[32] Nonetheless, the lack of significant weight loss between groups suggests that the specific weight loss instruction provided to the intervention group did not promote more weight loss than the general education and regular phone calls provided to controls.
Our findings related to weight perception were similar to those established in prior studies. Individuals frequently misperceive their weight and weight perceptions are least accurate among severely obese individuals and nonwhites.[16, 33, 34] Contrary to prior studies, we found that the majority of participants felt their weight negatively impacted their health, and most thought their hospitalization was weight‐related.[35] Interestingly, research suggests that weight‐related perception of health risk correlates with the likelihood of making a weight loss attempt, another factor that may have influenced the behavior of study participants.[35]
This study has several limitations. It was conducted and based on practices at a single institution, thus limiting generalizability. Additionally, the percentage of subjects who returned for 6‐month follow‐up was lower than desired at 50%. However, high attrition rates commonly plague obesity trials, and we are unaware of any existing studies documenting expected attrition rates among obese inpatients.[23, 36, 37, 38] To help address this, we used imputed weights in our as‐treated analysis to obtain follow‐up weight values on 79% of subjects. Further, the intentional exclusion of subjects in the precontemplation stage of change likely resulted in selection of a more motivated patient population. However, this was done assuming that most inpatient obesity interventions would primarily target patients interested in losing weight. Finally, the lack of a usual care group that more accurately reflects the experience of most hospitalized obese patientsno regular postdischarge interactionsdoes limit interpretation of the modest weight loss noted in both study groups.
In conclusion, an inpatient obesity intervention with post‐discharge follow‐up did not result in intervention subjects losing more weight than controls over a 6‐month period. However, the finding of modest weight loss among both groups is of interest and may warrant further investigation. It remains unclear whether this is a naturally occurring phenomenon or whether other factors influence behavior change in this patient population. Additional studies will be needed to clarify the impact of hospitalization, obesity recognition, perception of health risk, weight tracking, and follow‐up on weight behaviors. Given the proven benefits of even modest weight reductions, encouraging any amount of weight loss in these at‐risk individuals would appear to be a step in the right direction. We have yet to determine whether inpatient obesity interventions represent a lost opportunity.
- , , , . The impact of weight loss among seniors on Medicare spending. Health Econ Rev. 2013;3(1):7.
- . The effects of obesity, smoking, and drinking on medical problems and costs. Health Aff (Millwood). 2002;21(2):245–253.
- , , , , , . The incidence of co‐morbidities related to obesity and overweight: a systematic review and meta‐analysis. BMC Public Health. 2009;9:88.
- , , , , , . The impact of obesity on US mortality levels: the importance of age and cohort factors in population estimates. Am J Public Health. 2013;103(10):1895–1901.
- , , , . Assessment of excess mortality in obesity. Am J Epidemiol. 1998;147(1):42–48.
- , , . Importance of in‐hospital initiation of evidence‐based medical therapies for heart failure‐a review. Am J Cardiol. 2004;94(9):1155–1160.
- . In‐hospital initiation of statins: taking advantage of the “teachable moment”. Cleve Clin J Med. 2003;70(6):502, 504–506.
- , , . Understanding the potential of teachable moments: the case of smoking cessation. Health Educ Res. 2003;18(2):156–170.
- , , . Smoking cessation interventions for hospitalized smokers: a systematic review. Arch Intern Med. 2008;168(18):1950–1960.
- , . Smoking cessation initiated during hospital stay for patients with coronary artery disease: a randomized controlled trial. CMAJ. 2009;180(13):1297–1303.
- , , , , , . Phone and e‐mail counselling are effective for weight management in an overweight working population: a randomized controlled trial. BMC Public Health. 2009;9:6.
- , . Weighing the evidence: benefits of regular weight monitoring for weight control. J Nutr Educ Behav. 2005;37(6):319–322.
- , , , et al. Comparative effectiveness of weight‐loss interventions in clinical practice. N Engl J Med. 2011;365(21):1959–1968.
- , , , et al. Weight‐loss outcomes: a systematic review and meta‐analysis of weight‐loss clinical trials with a minimum 1‐year follow‐up. J Am Diet Assoc. 2007;107(10):1755–1767.
- , , . Self‐monitoring in weight loss: a systematic review of the literature. J Am Diet Assoc. 2011;111(1):92–102.
- , , , . Willingness for weight loss intervention among overweight and obese inpatients. South Med J. 2011;104(6):397–400.
- , , , et al. Benefits of modest weight loss in improving cardiovascular risk factors in overweight and obese individuals with type 2 diabetes. Diabetes Care. 2011;34(7):1481–1486.
- , , . The beneficial effects of modest weight loss on cardiovascular risk factors. Int J Obes Relat Metab Disord. 1997;21(suppl 1):S5–S9.
- . Beneficial health effects of modest weight loss. Int J Obes Relat Metab Disord. 1992;16(6):397–415.
- Clinical guidelines on the identification, evaluation, and treatment of overweight and obesity in adults—the evidence report. National Institutes of Health. Obes Res. 1998;6(suppl 2):51S–209S.
- , , , et al. Validity of clinical body weight measures as substitutes for missing data in a randomized trial. Obes Res Clin Pract. 2008;2(4):277–281.
- , , . Advances in analysis of longitudinal data. Ann Rev Clin Psychol. 2010;6:79–107.
- , , , et al. Missing data in randomized clinical trials for weight loss: scope of the problem, state of the field, and performance of statistical methods. PloS One. 2009;4(8):e6624.
- , . Longitudinal Data Analysis. Hoboken, NJ: Wiley‐Interscience; 2006.
- , , , . Comparison of methods for delivering a lifestyle modification program for obese patients: a randomized trial. Ann Intern Med. 2009;150(4):255–262.
- . Clinical practice. Nonsurgical management of obesity in adults. N Engl J Med. 2008;358(18):1941–1950.
- , , . A meta‐analysis of the past 25 years of weight loss research using diet, exercise or diet plus exercise intervention. Int J Obes Relat Metab Disord. 1997;21(10):941–947.
- , , , et al. Body fat distribution and risk of coronary heart disease in men and women in the European Prospective Investigation Into Cancer and Nutrition in Norfolk cohort: a population‐based prospective study. Circulation. 2007;116(25):2933–2943.
- , , , et al. The association of differing measures of overweight and obesity with prevalent atherosclerosis: the Dallas Heart Study. J Am Coll Cardiol. 2007;50(8):752–759.
- , , , et al. Obesity and the risk of myocardial infarction in 27,000 participants from 52 countries: a case‐control study. Lancet. 2005;366(9497):1640–1649.
- , , , . Waist circumference and waist‐to‐hip ratio as predictors of cardiovascular events: meta‐regression analysis of prospective studies. Eur Heart J. 2007;28(7):850–856.
- , , , . Obesity and the environment: where do we go from here? Science. 2003;299(5608):853–855.
- , . Self‐perception of weight appropriateness in the United States. Am J Prev Med. 2003;24(4):332–339.
- , , , et al. Differences in weight perception among blacks and whites. J Womens Health (Larchmt). 2011;20(12):1805–1811.
- , , , , . Perceived health risk of excess body weight among overweight and obese men and women: differences by sex. Prev Med. 2008;47(1):46–52.
- , , . Obesity research—limitations of methods, measurements, and medications. JAMA. 2006;295(7):826–828.
- . Interpreting incomplete data in studies of diet and weight loss. N Engl J Med. 2003;348(21):2136–2137.
- , , , . Predictors of attrition in a large clinic‐based weight‐loss program. Obes Res. 2003;11(7):888–894.
© 2014 Society of Hospital Medicine
Assessing Hospitalist Communication
Effective communication between patients and physicians improves a number of important outcomes including patient adherence to treatment,1‐3 quality of the medical history4 and clinical outcomes.1, 5, 6 Recognizing the importance of physician communication skills, the American Board of Medical Specialties, American Council for Graduate Medical Education and The Joint Commission all identify communication as a core competency for physicians.7‐9 For hospitalists and their patients, building a therapeutic partnership is challenged by the lack of a preexisting relationship and potential lack of patient history information, particularly psychosocial history.10 Other factors that complicate the relationships between hospitalists and their patients include acuity of illness, limited time course, and absence of or lack of input from patients' primary physicians.11
As a rapidly increasing percentage of hospitalized patients are cared for by hospitalists,12, 13 communication skills need to be directly assessed and addressed. As of 2006, at least 37% of all Medicare claims for inpatient evaluation and management services by general internists were attributed to hospitalists, and more than half of hospitalized Medicare patients are seen by hospitalists.14 Yet, a search of the MEDLINE database for articles published between 1965 and September 2009, querying hospitalist AND patient AND communication within the article title and abstract, yielded only 2 studies assessing hospitalist‐patient communication. A 1998 study15 compared patient‐reported communication problems with hospitalists versus continuity physicians involved with hospital care, and found that patients whose continuity physicians remained involved with care during the hospitalization were less likely to report communication problems than those patients who were cared for by a hospitalist alone. A 2004 study16 utilized chart documentation to compare the end‐of‐life care and communication provided by continuity physicians and hospitalists. Hospitalists were found to document end‐of‐life care discussions more often than continuity physicians, and were more likely to be present for these meetings, which may suggest improved end‐of‐life care. Neither of these hospitalist‐patient communication studies directly assessed patient perceptions of communication with hospitalists.
We undertook this study to explore patient perceptions of communication with hospitalists using the Communication Assessment Tool (CAT), a psychometrically validated instrument for patient assessment of physician communication skills.17 The CAT was initially field tested in outpatient offices, omitting the inpatient experience. A 2008 study18 successfully adapted the CAT tool for use in assessing emergency department (ED) teams. Given the importance of physician‐patient communication when patients are sickest and most vulnerable in the hospital setting, we sought to establish a baseline assessment of patient perceptions of communication with hospitalists in our group. Second, we compared results of our CAT implementation with published results examining communication in other physician groups.
Methods
Between September 2008 and August 2009 we performed a cross‐sectional study of patients admitted to the hospital medicine service at an urban, academic medical center with 873 beds. This busy service was responsible for 10,225 admissions in 2008. Patients of age 18 years or older and cared for by a hospitalist or teaching team led by a hospitalist were eligible to participate. Exclusion criteria included patient confusion, physiological instability, non‐English speaking, patient unable to communicate, or patient in isolation status. Interviews were conducted in the patient's private room with no other staff present.
Patient perception of communication with hospitalists was measured with the CAT.17 This 15‐item survey is written at a fourth grade reading level, and measures responses along a 5‐point scale (1 = poor, 2 = fair, 3 = good, 4 = very good, 5 = excellent). The CAT was originally field tested with a convenience sample of 38 physicians from various regions within the US, across 6 specialties (Dermatology, Family Medicine, Neurosurgery, Ophthalmology, Orthopedic Surgery, and Physical Medicine & Rehabilitation). Each physician's office recruited 25 patients to complete the CAT through a phone or Internet‐based system.
The 14 core items of the CAT, which focus on communication with the individual physician, were used in this study. The 15th item, The doctor's staff treated me with respect, was dropped as it does not reflect the inpatient setting. Results for each physician are reported as the percentage of excellent responses. This dichotomized scoring is consistent with the development study, where analysis with Andrich's rating scale model19, 20 indicated that excellent scores correspond to a yes response while poor through very good scores correspond to a no response. This method of reporting scores as a percentage of excellent responses was found to be more useful for summarizing physician scores than reporting mean scores, which are highly skewed towards positive performance.17
Interviews were conducted by trained research assistants during hospitalists' weekday shifts. Hospitalists were not told which patients would be recruited, but were aware that patients on the service were being interviewed to assess communication. A list of patient names, room numbers, dates of admission, and assigned hospitalists was obtained daily from the electronic medical record system. Patients were approached on the second or third day of the hospital admission, and only if they had been assigned to the same hospitalist for at least 2 consecutive days. After explaining the study to patients and receiving verbal consent, researchers verified that the patient recognized the hospitalist, providing a photo if necessary. Patients who were not confident of their hospitalist's identity were excluded.
The 14 core items of the CAT survey were read aloud to the patient, who was provided with a copy of the instrument's scale and asked to respond with a number or word description (1 = poor to 5 = excellent). Patients were allowed to skip any questions they did not wish to answer. At the conclusion of the survey, patients were asked if they had any further comments to add. Patient demographics as well as hospitalist service (general or teaching) and unit were recorded. Most interviews were completed in less than 5 minutes. Based on the recommendations of the original development and validation of the CAT,17 we collected 20 patient surveys for each hospitalist. For CAT items that the patients skipped, we did not impute values; rather the percentage of excellent responses was calculated based on the number of questions the patient answered. To examine basic psychometric characteristics, we assessed scale reliability and performed a factor analysis using the principal components method of extraction with Varimax rotation.
This project was determined exempt by the Northwestern University Institutional Review Board.
Results
We identified 1,137 patients as potentially eligible for the study. Figure 1 shows a flowchart of patient exclusion. Of note, 107 patients consenting to participate (13% overall) were unable to identify their hospitalist by name or photo. More specifically, 70 teaching service patients (25% of 275 eligible patients) were unable to identify their hospitalist, compared to 37 patients on general service (7% of 553 eligible patients); (z = 7.58, P < 0.001). Another 21 (3%) declined to participate because they had not talked enough with their doctor to render an assessment.
We analyzed 700 patient surveys (20 patients for each of 35 hospitalists; 62% of patients identified). Patient and hospitalist characteristics are presented in Table 1. The proportion of excellent ratings for each hospitalist ranged from 38.5% to 73.5% with an average of 59.1% excellent (standard deviation [SD] = 9.5). See Figure 2 for the distribution of hospitalist scores. For the group as a whole, highest ratings on individual CAT items were for treating the patient with respect (66% excellent), letting the patient talk without interruptions (66%), and talking in terms the patient can understand (64%). Lowest ratings were for involving the patient in decisions as much as he or she wanted (53%), encouraging the patient to ask questions (53%), and greeting the patient in a way that made him or her feel comfortable (55%). Table 2 contains a full ranking of individual item scores.
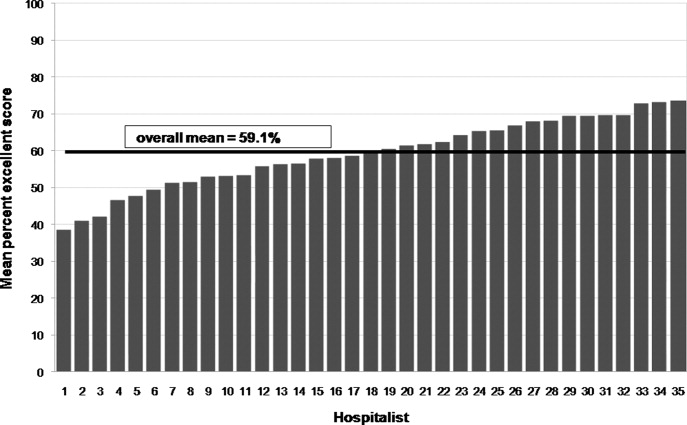
| Characteristics | |
|---|---|
| Patients (n =700), n (%) | |
| Sex, female | 378 (54) |
| Age, years | |
| 44 and younger | 189 (27) |
| 45‐64 | 266 (38) |
| 65 and older | 245 (35) |
| Race | |
| Caucasian | 357 (51) |
| African American | 266 (38) |
| Hispanic | 49 (7) |
| Other | 28 (4) |
| Hospitalists (n = 35), n (%) | |
| Sex, female | 18 (51) |
| Age, years | |
| Range | 3039 |
| Mean (SD) | 33 (2.4) |
| Race | |
| Caucasian | 14 (40) |
| South Asian | 11 (31) |
| Asian | 7 (20) |
| African American | 3 (9) |
| Non‐native English speaker | 5 (14) |
| Foreign medical graduate | 3 (9) |
| Communication Assessment Tool Item | Percent Excellent Scores |
|---|---|
| 1. Greeted me in a way that made me feel comfortable | 54.9 |
| 2. Treated me with respect | 66.3 |
| 3. Showed interest in my ideas about my health | 58.2 |
| 4. Understood my main health concerns | 57.4 |
| 5. Paid attention to me (looked at me, listened carefully) | 64.1 |
| 6. Let me talk without interruptions | 66.3 |
| 7. Gave me as much information as I wanted | 56.0 |
| 8. Talked in terms I could understand | 64.2 |
| 9. Checked to be sure I understood everything | 57.1 |
| 10. Encouraged me to ask questions | 53.2 |
| 11. Involved me in decisions as much as I wanted | 52.9 |
| 12. Discussed next steps including any follow‐up plans | 58.2 |
| 13. Showed care and concern | 63.8 |
| 14. Spent the right amount of time with me | 57.0 |
Overall scale reliability proved to be high (Cronbach's alpha = 0.97) in this sample. The factor analysis showed that scores for each of the 14 items load onto 1 factor. These results are consistent with the high reliability and single‐factor loading found in Makoul's original scale reliability and validity testing.17
The ad hoc comments made by patients at the conclusion of the CAT survey were categorized as positive or negative. Although many positive comments were made, they tended to be general in nature (eg, She is a great doctor). Negative comments were more explicit. A total of 110 patients (16%) made specific negative comments, which fell into 7 general domains: lack of information (35 comments), not enough time spent with the patient (27 comments), poor listening to the patient (24 comments), ineffective care delivery (7 comments), issues of care, concern, and respect (6 comments), ineffective communication with other staff (5 comments), and unclear role of physician (3 comments). Three patient comments were not related to these domains.
Patient age, race or gender did not correlate with CAT results. Hospitalist factors of age, race, gender, years of experience also were not associated with differences in ratings. However, race concordance between the patient and hospitalist was associated with improved CAT ratings. Patients of the same race as their hospitalist rated the hospitalist's communication significantly higher (M = 64.9%, SD = 39.1) than did patients who were of a different race than their hospitalist (M = 57.3%, SD = 40.3), P < 0.05. Gender concordance was not associated with improved CAT ratings. No score differences were found between patients cared for by a hospitalist on teaching service and direct care, and there were no differences between nursing units.
Discussion
To the best of our knowledge, this is the first study to explicitly measure patient perceptions of communication with hospitalists. The results yielded a wide distribution of scores for physicians within a single, large hospital medicine group. Comparing their own scores to those of peers may allow low‐scoring hospitalists to grasp the potential for improving their communication with patients. Our reliability testing matched the results of the original development study,17 indicating very high overall scale reliability. This suggests that the CAT could be streamlined by dropping some of the survey items. However we agree with Makoul et al.17 that it is best to keep the full set as it provides specific information for physicians without placing undue burden on patients (ie, the CAT takes only 1‐2 min to complete). Individual item scores for each of the 14 CAT items highlight specific communication tasks where intervention may be targeted for individual hospitalists and the group as a whole. It may be feasible to utilize CAT results as an individual report card for physicians. While program leaders should be aware that implementation of the CAT requires standardized data collection, it may be possible to build this into existing structures such as the discharge process.
Interestingly, many patients could not recognize the hospitalist caring for them by name or photo. More than 1 in 10 patients (107 of 828; 13%) were unable to identify their hospitalist. This was more than 3 times as common on the teaching service, where the hospitalist is accompanied by house staff and the intern or resident is the primary physician for patient contact, compared to the service on which hospitalists directly take care of patients without residents. It is also troubling that another 3% of patients (21 of 828) stated they hadn't talked enough with their hospitalist to answer basic communication questions, when approached 2 or 3 days into the relationship. It may be telling that Greeted me in a way that made me feel comfortable was one of the lowest‐rated survey items. Hospitalists should recognize that patients, in addition to facing their own physical and emotional stressors, see many hospital staff members throughout the day; all of whom may be strangers to them. Thus it becomes vital for hospitalists to not only establish an initial rapport with the patient, but to reintroduce themselves each time they enter the room.
An examination of the ad hoc negative comments made by survey respondents reinforces and extends findings related to the CAT items, particularly about those areas of communication valued by patients. The majority of comments fell into categories of failing to give enough information (eg, Sometimes I was left confused when the doctor was ready to leave), not spending enough time with the patient (eg, He was just in and out), and not listening to the patient's own ideas (eg, When giving my history, she cut me off at some points when I had more to say). The information and time categories may directly relate to scores on the CAT items Gave me as much information as I wanted and Spent the right amount of time with me, which are among the lowest‐scoring items. Listening to the patient may reflect broader issues of considering the patient's own experience, questions, concerns and goals.
In this study, patient‐physician race concordance was associated with CAT ratings. Patients who were of the same race as their hospitalist rated the hospitalist higher compared to patients who were of a different race than their hospitalist. This effect is consistent with previous research describing higher patient ratings of communication and care when the patient and physician are of the same race or ethnicity.21
A number of factors limit interpretation of the results of this study. The data were collected at a single site, thus limiting generalizability to other hospitalist practice environments. We used a retrospective, patient assessment of hospitalist communication which may have inherent biases different from a study using direct researcher observation or recording of patient‐hospitalist interactions to assess communication. This methodology allowed us to examine the patient's own perceptions and expectations of communication, but certainly leaves room for selection bias in recruitment and recall bias. Patients were interviewed on the second or third day of their admission. This controlled the length of exposure to the hospitalist, but the course of treatment might vary considerably; at the time of interview, some patients may not yet have had a clear diagnosis and plan while others may have been ready for discharge. Future work should examine how stage of evaluation and management might affect patients' perception of communication with hospitalists. Severity of condition is another factor that may affect patients' ratings, and was not examined in this study.
When compared to physicians from the CAT development study's field test, this study sample of hospitalists scored much lower, 59.1% excellent vs. 76.3% (P < 0.001). A number of factors may account for some of these differences. The majority of patients in the original field test had multiple interactions with their physician, and rated their health status as good or very good. In contrast, hospitalized patients usually lack previous exposure to the hospitalist, and likely have poorer health status. Also, physicians in the original field test volunteered to participate, and patients completed the CAT survey through the Internet or phone response system, rather than through a face‐to‐face interview by trained research assistants. Another key difference is that field‐test patients answered the CAT within 1 day of their outpatient visit, while in this study patients were interviewed in the midst of their hospital admission and prior to completion of their hospital course. Finally, patients commonly choose their outpatient physician and can select someone else if dissatisfied with their communication skills, while hospitalized patients are assigned hospitalists based on availability. Thus, given this potential selection bias, outpatients could be expected to rate their personal physician higher.
Another possibility is that hospitalists are on average less skilled in patient communication than outpatient physicians. Given the transient nature of the inpatient relationship, hospitalists may not value developing rapport with patients, and may not make this a goal of patient care or seek extensive training in communication skills. In future research, evaluating hospitalists' training in and attitudes towards patient communication could be paired with communication assessment results.
Although it is beyond the scope of this study to assess precisely how these environmental and survey implementation factors may affect CAT summary scores, their importance is evident. Another hospital‐based implementation of the CAT tool, an evaluation of ED teams,18 utilized face‐to‐face interviews with trained research assistants. The study yielded results similar to our findings: the average percent excellent score for ED teams was 62.3%, vs. 58.2% percent excellent for our hospitalist group. Taken together, these study comparisons between the original field‐test, our hospitalist implementation, and the ED team implementation support the argument that factors of setting (inpatient vs. outpatient), mode of survey administration (face‐to‐face interview vs. self‐administration through phone or Internet), and shorter duration or course of patient‐physician interaction may be important considerations when implementing the CAT tool to assess physician communication skills, or attempting to set standards of minimally acceptable or desired scoring.
More work must be done to establish norms and/or minimally acceptable scores for hospitalists. Numerous factors of specialty, practice setting, survey implementation, patient variables, and even the expertise of who is setting the communication standards22 may strongly influence comparisons between physician groups, even within a single institution. Organizations seeking to establish norms or minimally acceptable scores for physician‐patient communication should be aware of these factors. As the original development study points out, standard‐setting studies could establish specialty‐specific and country‐specific norms as well as norms or standards for level‐of‐training (eg, medical students versus attending physicians).17
Conclusion
The previously validated CAT instrument appears to have reliable test characteristics and can be used to gauge patient perceptions of hospitalist communication skills. Comparative scores between physicians of different specialties and settings should be interpreted cautiously as there may be confounding variables. Within our single institution, comparative scores between hospitalists, along with an examination of the hospitalist's individual item scores, may offer useful feedback for efforts aimed at enhancing communication. Many hospitalists in this study may benefit from targeted training to improve patient communication skills, particularly in the areas of encouraging questions and involving patients in decision making. Future qualitative research in the context of hospital medicine could identify specific communication techniques used by highly‐rated physicians, with the goal of developing tools for targeted improvement and determining impact on outcomes.
Acknowledgements
The authors thank Christie Edwards, Rachel Grayer and Caitlin Lawes for assistance with data collection, and Jie Peng for help with the analysis.
- ,,.Is the quality of the patient‐provider relationship associated with better adherence and health outcomes for patients with HIV?J Gen Intern Med.2006;21(6):661–665.
- ,,,,.Does physician communication influence older patients' diabetes self‐management and glycemic control? Results from the Health and Retirement Study (HRS).J Gerontol A Biol Sci Med Sci.2007;62(12):1435–1442.
- ,.Physician communication and patient adherence to treatment: a meta‐analysis.Med Care.2009;47(8):826–834.
- ,.The effect of physician behavior on the collection of data.Ann Intern Med.1984;101(5):692–696.
- ,,,,.Does physician‐patient communication that aims at empowering patients improve clinical outcome? A case study.Patient Educ Couns.2006;61(2):299–306.
- .Effective physician‐patient communication and health outcomes: a review.CMAJ.1995;152(9):1423–1433.
- .Evaluation of clinical competencies: basic certification, subspecialty certification, and recertification.Am J Phys Med Rehabil.2000;79(5):478–480.
- ,,,,.General competencies and accreditation in graduate medical education.Health Aff (Millwood).2002;21(5):103–111.
- Joint Commission on Accreditation of Healthcare Organizations. The Joint Commission Standards supporting effective communication, cultural competence, and patient‐centered care.2009:44.
- .Rapport and the hospitalist.Am J Med.2001;111(9B):31S–35S.
- ,.The emerging role of “hospitalists” in the American health care system.N Engl J Med.1996;335(7):514–517.
- ,,,.Hospitalists and the practice of inpatient medicine: results of a survey of the National Association of Inpatient Physicians.Ann Intern Med.1999;130(4 Pt 2):343–349.
- ,,,.The status of hospital medicine groups in the United States.J Hosp Med.2006;1:75–80.
- ,,,.Growth in the care of older patients by hospitalists in the United States.N Engl J Med.2009;360(11):1102–1112.
- ,,,,.Communication problems for patients hospitalized with chest pain.J Gen Intern Med.1998;13(12):836–838.
- ,.End‐of‐life care in a voluntary hospitalist model: effects on communication, processes of care, and patient symptoms.Am J Med.2004;116(10):669–675.
- ,,.Measuring patient views of physician communication skills: development and testing of the Communication Assessment Tool.Patient Educ Couns.2007;67(3):333–342.
- ,,, et al.Patient perspectives on communication with the medical team: pilot study using the Communication Assessment Tool‐Team (CAT‐T).Patient Educ Couns.2008;73(2):220–223.
- .Understanding resistance to the data‐model relationship in Rasch's paradigm: a reflection for the next generation.J Appl Meas.2002;3(3):325–359.
- ,.Conditional pairwise estimation in the Rasch model for ordered response categories using principal components.J Appl Meas.2003;4(3):205–221.
- ,,,,,.Patient‐centered communication, ratings of care, and concordance of patient and physician race.Ann Intern Med.2003;139(11):907–915.
- ,,,.The impact of judge selection on standard setting for a patient survey of physician communication skills.Acad Med.2008;83(10 Suppl):S17–S20.
Effective communication between patients and physicians improves a number of important outcomes including patient adherence to treatment,1‐3 quality of the medical history4 and clinical outcomes.1, 5, 6 Recognizing the importance of physician communication skills, the American Board of Medical Specialties, American Council for Graduate Medical Education and The Joint Commission all identify communication as a core competency for physicians.7‐9 For hospitalists and their patients, building a therapeutic partnership is challenged by the lack of a preexisting relationship and potential lack of patient history information, particularly psychosocial history.10 Other factors that complicate the relationships between hospitalists and their patients include acuity of illness, limited time course, and absence of or lack of input from patients' primary physicians.11
As a rapidly increasing percentage of hospitalized patients are cared for by hospitalists,12, 13 communication skills need to be directly assessed and addressed. As of 2006, at least 37% of all Medicare claims for inpatient evaluation and management services by general internists were attributed to hospitalists, and more than half of hospitalized Medicare patients are seen by hospitalists.14 Yet, a search of the MEDLINE database for articles published between 1965 and September 2009, querying hospitalist AND patient AND communication within the article title and abstract, yielded only 2 studies assessing hospitalist‐patient communication. A 1998 study15 compared patient‐reported communication problems with hospitalists versus continuity physicians involved with hospital care, and found that patients whose continuity physicians remained involved with care during the hospitalization were less likely to report communication problems than those patients who were cared for by a hospitalist alone. A 2004 study16 utilized chart documentation to compare the end‐of‐life care and communication provided by continuity physicians and hospitalists. Hospitalists were found to document end‐of‐life care discussions more often than continuity physicians, and were more likely to be present for these meetings, which may suggest improved end‐of‐life care. Neither of these hospitalist‐patient communication studies directly assessed patient perceptions of communication with hospitalists.
We undertook this study to explore patient perceptions of communication with hospitalists using the Communication Assessment Tool (CAT), a psychometrically validated instrument for patient assessment of physician communication skills.17 The CAT was initially field tested in outpatient offices, omitting the inpatient experience. A 2008 study18 successfully adapted the CAT tool for use in assessing emergency department (ED) teams. Given the importance of physician‐patient communication when patients are sickest and most vulnerable in the hospital setting, we sought to establish a baseline assessment of patient perceptions of communication with hospitalists in our group. Second, we compared results of our CAT implementation with published results examining communication in other physician groups.
Methods
Between September 2008 and August 2009 we performed a cross‐sectional study of patients admitted to the hospital medicine service at an urban, academic medical center with 873 beds. This busy service was responsible for 10,225 admissions in 2008. Patients of age 18 years or older and cared for by a hospitalist or teaching team led by a hospitalist were eligible to participate. Exclusion criteria included patient confusion, physiological instability, non‐English speaking, patient unable to communicate, or patient in isolation status. Interviews were conducted in the patient's private room with no other staff present.
Patient perception of communication with hospitalists was measured with the CAT.17 This 15‐item survey is written at a fourth grade reading level, and measures responses along a 5‐point scale (1 = poor, 2 = fair, 3 = good, 4 = very good, 5 = excellent). The CAT was originally field tested with a convenience sample of 38 physicians from various regions within the US, across 6 specialties (Dermatology, Family Medicine, Neurosurgery, Ophthalmology, Orthopedic Surgery, and Physical Medicine & Rehabilitation). Each physician's office recruited 25 patients to complete the CAT through a phone or Internet‐based system.
The 14 core items of the CAT, which focus on communication with the individual physician, were used in this study. The 15th item, The doctor's staff treated me with respect, was dropped as it does not reflect the inpatient setting. Results for each physician are reported as the percentage of excellent responses. This dichotomized scoring is consistent with the development study, where analysis with Andrich's rating scale model19, 20 indicated that excellent scores correspond to a yes response while poor through very good scores correspond to a no response. This method of reporting scores as a percentage of excellent responses was found to be more useful for summarizing physician scores than reporting mean scores, which are highly skewed towards positive performance.17
Interviews were conducted by trained research assistants during hospitalists' weekday shifts. Hospitalists were not told which patients would be recruited, but were aware that patients on the service were being interviewed to assess communication. A list of patient names, room numbers, dates of admission, and assigned hospitalists was obtained daily from the electronic medical record system. Patients were approached on the second or third day of the hospital admission, and only if they had been assigned to the same hospitalist for at least 2 consecutive days. After explaining the study to patients and receiving verbal consent, researchers verified that the patient recognized the hospitalist, providing a photo if necessary. Patients who were not confident of their hospitalist's identity were excluded.
The 14 core items of the CAT survey were read aloud to the patient, who was provided with a copy of the instrument's scale and asked to respond with a number or word description (1 = poor to 5 = excellent). Patients were allowed to skip any questions they did not wish to answer. At the conclusion of the survey, patients were asked if they had any further comments to add. Patient demographics as well as hospitalist service (general or teaching) and unit were recorded. Most interviews were completed in less than 5 minutes. Based on the recommendations of the original development and validation of the CAT,17 we collected 20 patient surveys for each hospitalist. For CAT items that the patients skipped, we did not impute values; rather the percentage of excellent responses was calculated based on the number of questions the patient answered. To examine basic psychometric characteristics, we assessed scale reliability and performed a factor analysis using the principal components method of extraction with Varimax rotation.
This project was determined exempt by the Northwestern University Institutional Review Board.
Results
We identified 1,137 patients as potentially eligible for the study. Figure 1 shows a flowchart of patient exclusion. Of note, 107 patients consenting to participate (13% overall) were unable to identify their hospitalist by name or photo. More specifically, 70 teaching service patients (25% of 275 eligible patients) were unable to identify their hospitalist, compared to 37 patients on general service (7% of 553 eligible patients); (z = 7.58, P < 0.001). Another 21 (3%) declined to participate because they had not talked enough with their doctor to render an assessment.
We analyzed 700 patient surveys (20 patients for each of 35 hospitalists; 62% of patients identified). Patient and hospitalist characteristics are presented in Table 1. The proportion of excellent ratings for each hospitalist ranged from 38.5% to 73.5% with an average of 59.1% excellent (standard deviation [SD] = 9.5). See Figure 2 for the distribution of hospitalist scores. For the group as a whole, highest ratings on individual CAT items were for treating the patient with respect (66% excellent), letting the patient talk without interruptions (66%), and talking in terms the patient can understand (64%). Lowest ratings were for involving the patient in decisions as much as he or she wanted (53%), encouraging the patient to ask questions (53%), and greeting the patient in a way that made him or her feel comfortable (55%). Table 2 contains a full ranking of individual item scores.
| Characteristics | |
|---|---|
| Patients (n =700), n (%) | |
| Sex, female | 378 (54) |
| Age, years | |
| 44 and younger | 189 (27) |
| 45‐64 | 266 (38) |
| 65 and older | 245 (35) |
| Race | |
| Caucasian | 357 (51) |
| African American | 266 (38) |
| Hispanic | 49 (7) |
| Other | 28 (4) |
| Hospitalists (n = 35), n (%) | |
| Sex, female | 18 (51) |
| Age, years | |
| Range | 3039 |
| Mean (SD) | 33 (2.4) |
| Race | |
| Caucasian | 14 (40) |
| South Asian | 11 (31) |
| Asian | 7 (20) |
| African American | 3 (9) |
| Non‐native English speaker | 5 (14) |
| Foreign medical graduate | 3 (9) |
| Communication Assessment Tool Item | Percent Excellent Scores |
|---|---|
| 1. Greeted me in a way that made me feel comfortable | 54.9 |
| 2. Treated me with respect | 66.3 |
| 3. Showed interest in my ideas about my health | 58.2 |
| 4. Understood my main health concerns | 57.4 |
| 5. Paid attention to me (looked at me, listened carefully) | 64.1 |
| 6. Let me talk without interruptions | 66.3 |
| 7. Gave me as much information as I wanted | 56.0 |
| 8. Talked in terms I could understand | 64.2 |
| 9. Checked to be sure I understood everything | 57.1 |
| 10. Encouraged me to ask questions | 53.2 |
| 11. Involved me in decisions as much as I wanted | 52.9 |
| 12. Discussed next steps including any follow‐up plans | 58.2 |
| 13. Showed care and concern | 63.8 |
| 14. Spent the right amount of time with me | 57.0 |
Overall scale reliability proved to be high (Cronbach's alpha = 0.97) in this sample. The factor analysis showed that scores for each of the 14 items load onto 1 factor. These results are consistent with the high reliability and single‐factor loading found in Makoul's original scale reliability and validity testing.17
The ad hoc comments made by patients at the conclusion of the CAT survey were categorized as positive or negative. Although many positive comments were made, they tended to be general in nature (eg, She is a great doctor). Negative comments were more explicit. A total of 110 patients (16%) made specific negative comments, which fell into 7 general domains: lack of information (35 comments), not enough time spent with the patient (27 comments), poor listening to the patient (24 comments), ineffective care delivery (7 comments), issues of care, concern, and respect (6 comments), ineffective communication with other staff (5 comments), and unclear role of physician (3 comments). Three patient comments were not related to these domains.
Patient age, race or gender did not correlate with CAT results. Hospitalist factors of age, race, gender, years of experience also were not associated with differences in ratings. However, race concordance between the patient and hospitalist was associated with improved CAT ratings. Patients of the same race as their hospitalist rated the hospitalist's communication significantly higher (M = 64.9%, SD = 39.1) than did patients who were of a different race than their hospitalist (M = 57.3%, SD = 40.3), P < 0.05. Gender concordance was not associated with improved CAT ratings. No score differences were found between patients cared for by a hospitalist on teaching service and direct care, and there were no differences between nursing units.
Discussion
To the best of our knowledge, this is the first study to explicitly measure patient perceptions of communication with hospitalists. The results yielded a wide distribution of scores for physicians within a single, large hospital medicine group. Comparing their own scores to those of peers may allow low‐scoring hospitalists to grasp the potential for improving their communication with patients. Our reliability testing matched the results of the original development study,17 indicating very high overall scale reliability. This suggests that the CAT could be streamlined by dropping some of the survey items. However we agree with Makoul et al.17 that it is best to keep the full set as it provides specific information for physicians without placing undue burden on patients (ie, the CAT takes only 1‐2 min to complete). Individual item scores for each of the 14 CAT items highlight specific communication tasks where intervention may be targeted for individual hospitalists and the group as a whole. It may be feasible to utilize CAT results as an individual report card for physicians. While program leaders should be aware that implementation of the CAT requires standardized data collection, it may be possible to build this into existing structures such as the discharge process.
Interestingly, many patients could not recognize the hospitalist caring for them by name or photo. More than 1 in 10 patients (107 of 828; 13%) were unable to identify their hospitalist. This was more than 3 times as common on the teaching service, where the hospitalist is accompanied by house staff and the intern or resident is the primary physician for patient contact, compared to the service on which hospitalists directly take care of patients without residents. It is also troubling that another 3% of patients (21 of 828) stated they hadn't talked enough with their hospitalist to answer basic communication questions, when approached 2 or 3 days into the relationship. It may be telling that Greeted me in a way that made me feel comfortable was one of the lowest‐rated survey items. Hospitalists should recognize that patients, in addition to facing their own physical and emotional stressors, see many hospital staff members throughout the day; all of whom may be strangers to them. Thus it becomes vital for hospitalists to not only establish an initial rapport with the patient, but to reintroduce themselves each time they enter the room.
An examination of the ad hoc negative comments made by survey respondents reinforces and extends findings related to the CAT items, particularly about those areas of communication valued by patients. The majority of comments fell into categories of failing to give enough information (eg, Sometimes I was left confused when the doctor was ready to leave), not spending enough time with the patient (eg, He was just in and out), and not listening to the patient's own ideas (eg, When giving my history, she cut me off at some points when I had more to say). The information and time categories may directly relate to scores on the CAT items Gave me as much information as I wanted and Spent the right amount of time with me, which are among the lowest‐scoring items. Listening to the patient may reflect broader issues of considering the patient's own experience, questions, concerns and goals.
In this study, patient‐physician race concordance was associated with CAT ratings. Patients who were of the same race as their hospitalist rated the hospitalist higher compared to patients who were of a different race than their hospitalist. This effect is consistent with previous research describing higher patient ratings of communication and care when the patient and physician are of the same race or ethnicity.21
A number of factors limit interpretation of the results of this study. The data were collected at a single site, thus limiting generalizability to other hospitalist practice environments. We used a retrospective, patient assessment of hospitalist communication which may have inherent biases different from a study using direct researcher observation or recording of patient‐hospitalist interactions to assess communication. This methodology allowed us to examine the patient's own perceptions and expectations of communication, but certainly leaves room for selection bias in recruitment and recall bias. Patients were interviewed on the second or third day of their admission. This controlled the length of exposure to the hospitalist, but the course of treatment might vary considerably; at the time of interview, some patients may not yet have had a clear diagnosis and plan while others may have been ready for discharge. Future work should examine how stage of evaluation and management might affect patients' perception of communication with hospitalists. Severity of condition is another factor that may affect patients' ratings, and was not examined in this study.
When compared to physicians from the CAT development study's field test, this study sample of hospitalists scored much lower, 59.1% excellent vs. 76.3% (P < 0.001). A number of factors may account for some of these differences. The majority of patients in the original field test had multiple interactions with their physician, and rated their health status as good or very good. In contrast, hospitalized patients usually lack previous exposure to the hospitalist, and likely have poorer health status. Also, physicians in the original field test volunteered to participate, and patients completed the CAT survey through the Internet or phone response system, rather than through a face‐to‐face interview by trained research assistants. Another key difference is that field‐test patients answered the CAT within 1 day of their outpatient visit, while in this study patients were interviewed in the midst of their hospital admission and prior to completion of their hospital course. Finally, patients commonly choose their outpatient physician and can select someone else if dissatisfied with their communication skills, while hospitalized patients are assigned hospitalists based on availability. Thus, given this potential selection bias, outpatients could be expected to rate their personal physician higher.
Another possibility is that hospitalists are on average less skilled in patient communication than outpatient physicians. Given the transient nature of the inpatient relationship, hospitalists may not value developing rapport with patients, and may not make this a goal of patient care or seek extensive training in communication skills. In future research, evaluating hospitalists' training in and attitudes towards patient communication could be paired with communication assessment results.
Although it is beyond the scope of this study to assess precisely how these environmental and survey implementation factors may affect CAT summary scores, their importance is evident. Another hospital‐based implementation of the CAT tool, an evaluation of ED teams,18 utilized face‐to‐face interviews with trained research assistants. The study yielded results similar to our findings: the average percent excellent score for ED teams was 62.3%, vs. 58.2% percent excellent for our hospitalist group. Taken together, these study comparisons between the original field‐test, our hospitalist implementation, and the ED team implementation support the argument that factors of setting (inpatient vs. outpatient), mode of survey administration (face‐to‐face interview vs. self‐administration through phone or Internet), and shorter duration or course of patient‐physician interaction may be important considerations when implementing the CAT tool to assess physician communication skills, or attempting to set standards of minimally acceptable or desired scoring.
More work must be done to establish norms and/or minimally acceptable scores for hospitalists. Numerous factors of specialty, practice setting, survey implementation, patient variables, and even the expertise of who is setting the communication standards22 may strongly influence comparisons between physician groups, even within a single institution. Organizations seeking to establish norms or minimally acceptable scores for physician‐patient communication should be aware of these factors. As the original development study points out, standard‐setting studies could establish specialty‐specific and country‐specific norms as well as norms or standards for level‐of‐training (eg, medical students versus attending physicians).17
Conclusion
The previously validated CAT instrument appears to have reliable test characteristics and can be used to gauge patient perceptions of hospitalist communication skills. Comparative scores between physicians of different specialties and settings should be interpreted cautiously as there may be confounding variables. Within our single institution, comparative scores between hospitalists, along with an examination of the hospitalist's individual item scores, may offer useful feedback for efforts aimed at enhancing communication. Many hospitalists in this study may benefit from targeted training to improve patient communication skills, particularly in the areas of encouraging questions and involving patients in decision making. Future qualitative research in the context of hospital medicine could identify specific communication techniques used by highly‐rated physicians, with the goal of developing tools for targeted improvement and determining impact on outcomes.
Acknowledgements
The authors thank Christie Edwards, Rachel Grayer and Caitlin Lawes for assistance with data collection, and Jie Peng for help with the analysis.
- ,,.Is the quality of the patient‐provider relationship associated with better adherence and health outcomes for patients with HIV?J Gen Intern Med.2006;21(6):661–665.
- ,,,,.Does physician communication influence older patients' diabetes self‐management and glycemic control? Results from the Health and Retirement Study (HRS).J Gerontol A Biol Sci Med Sci.2007;62(12):1435–1442.
- ,.Physician communication and patient adherence to treatment: a meta‐analysis.Med Care.2009;47(8):826–834.
- ,.The effect of physician behavior on the collection of data.Ann Intern Med.1984;101(5):692–696.
- ,,,,.Does physician‐patient communication that aims at empowering patients improve clinical outcome? A case study.Patient Educ Couns.2006;61(2):299–306.
- .Effective physician‐patient communication and health outcomes: a review.CMAJ.1995;152(9):1423–1433.
- .Evaluation of clinical competencies: basic certification, subspecialty certification, and recertification.Am J Phys Med Rehabil.2000;79(5):478–480.
- ,,,,.General competencies and accreditation in graduate medical education.Health Aff (Millwood).2002;21(5):103–111.
- Joint Commission on Accreditation of Healthcare Organizations. The Joint Commission Standards supporting effective communication, cultural competence, and patient‐centered care.2009:44.
- .Rapport and the hospitalist.Am J Med.2001;111(9B):31S–35S.
- ,.The emerging role of “hospitalists” in the American health care system.N Engl J Med.1996;335(7):514–517.
- ,,,.Hospitalists and the practice of inpatient medicine: results of a survey of the National Association of Inpatient Physicians.Ann Intern Med.1999;130(4 Pt 2):343–349.
- ,,,.The status of hospital medicine groups in the United States.J Hosp Med.2006;1:75–80.
- ,,,.Growth in the care of older patients by hospitalists in the United States.N Engl J Med.2009;360(11):1102–1112.
- ,,,,.Communication problems for patients hospitalized with chest pain.J Gen Intern Med.1998;13(12):836–838.
- ,.End‐of‐life care in a voluntary hospitalist model: effects on communication, processes of care, and patient symptoms.Am J Med.2004;116(10):669–675.
- ,,.Measuring patient views of physician communication skills: development and testing of the Communication Assessment Tool.Patient Educ Couns.2007;67(3):333–342.
- ,,, et al.Patient perspectives on communication with the medical team: pilot study using the Communication Assessment Tool‐Team (CAT‐T).Patient Educ Couns.2008;73(2):220–223.
- .Understanding resistance to the data‐model relationship in Rasch's paradigm: a reflection for the next generation.J Appl Meas.2002;3(3):325–359.
- ,.Conditional pairwise estimation in the Rasch model for ordered response categories using principal components.J Appl Meas.2003;4(3):205–221.
- ,,,,,.Patient‐centered communication, ratings of care, and concordance of patient and physician race.Ann Intern Med.2003;139(11):907–915.
- ,,,.The impact of judge selection on standard setting for a patient survey of physician communication skills.Acad Med.2008;83(10 Suppl):S17–S20.
Copyright © 2010 Society of Hospital Medicine

Continuing Medical Education Program in
If you wish to receive credit for this activity, which begins on the next page, please refer to the website: www. blackwellpublishing.com/cme.
Accreditation and Designation Statement
Blackwell Futura Media Services designates this educational activity for a 1 AMA PRA Category 1 Credit. Physicians should only claim credit commensurate with the extent of their participation in the activity.
Blackwell Futura Media Services is accredited by the Accreditation Council for Continuing Medical Education to provide continuing medical education for physicians.
Educational Objectives
Continuous participation in the Journal of Hospital Medicine CME program will enable learners to be better able to:
-
Interpret clinical guidelines and their applications for higher quality and more efficient care for all hospitalized patients.
-
Describe the standard of care for common illnesses and conditions treated in the hospital; such as pneumonia, COPD exacerbation, acute coronary syndrome, HF exacerbation, glycemic control, venous thromboembolic disease, stroke, etc.
-
Discuss evidence‐based recommendations involving transitions of care, including the hospital discharge process.
-
Gain insights into the roles of hospitalists as medical educators, researchers, medical ethicists, palliative care providers, and hospital‐based geriatricians.
-
Incorporate best practices for hospitalist administration, including quality improvement, patient safety, practice management, leadership, and demonstrating hospitalist value.
-
Identify evidence‐based best practices and trends for both adult and pediatric hospital medicine.
Instructions on Receiving Credit
For information on applicability and acceptance of continuing medical education credit for this activity, please consult your professional licensing board.
This activity is designed to be completed within the time designated on the title page; physicians should claim only those credits that reflect the time actually spent in the activity. To successfully earn credit, participants must complete the activity during the valid credit period that is noted on the title page.
Follow these steps to earn credit:
-
Log on to www.blackwellpublishing.com/cme.
-
Read the target audience, learning objectives, and author disclosures.
-
Read the article in print or online format.
-
Reflect on the article.
-
Access the CME Exam, and choose the best answer to each question.
-
Complete the required evaluation component of the activity.