User login
Assessing Hospitalist Communication
Effective communication between patients and physicians improves a number of important outcomes including patient adherence to treatment,1‐3 quality of the medical history4 and clinical outcomes.1, 5, 6 Recognizing the importance of physician communication skills, the American Board of Medical Specialties, American Council for Graduate Medical Education and The Joint Commission all identify communication as a core competency for physicians.7‐9 For hospitalists and their patients, building a therapeutic partnership is challenged by the lack of a preexisting relationship and potential lack of patient history information, particularly psychosocial history.10 Other factors that complicate the relationships between hospitalists and their patients include acuity of illness, limited time course, and absence of or lack of input from patients' primary physicians.11
As a rapidly increasing percentage of hospitalized patients are cared for by hospitalists,12, 13 communication skills need to be directly assessed and addressed. As of 2006, at least 37% of all Medicare claims for inpatient evaluation and management services by general internists were attributed to hospitalists, and more than half of hospitalized Medicare patients are seen by hospitalists.14 Yet, a search of the MEDLINE database for articles published between 1965 and September 2009, querying hospitalist AND patient AND communication within the article title and abstract, yielded only 2 studies assessing hospitalist‐patient communication. A 1998 study15 compared patient‐reported communication problems with hospitalists versus continuity physicians involved with hospital care, and found that patients whose continuity physicians remained involved with care during the hospitalization were less likely to report communication problems than those patients who were cared for by a hospitalist alone. A 2004 study16 utilized chart documentation to compare the end‐of‐life care and communication provided by continuity physicians and hospitalists. Hospitalists were found to document end‐of‐life care discussions more often than continuity physicians, and were more likely to be present for these meetings, which may suggest improved end‐of‐life care. Neither of these hospitalist‐patient communication studies directly assessed patient perceptions of communication with hospitalists.
We undertook this study to explore patient perceptions of communication with hospitalists using the Communication Assessment Tool (CAT), a psychometrically validated instrument for patient assessment of physician communication skills.17 The CAT was initially field tested in outpatient offices, omitting the inpatient experience. A 2008 study18 successfully adapted the CAT tool for use in assessing emergency department (ED) teams. Given the importance of physician‐patient communication when patients are sickest and most vulnerable in the hospital setting, we sought to establish a baseline assessment of patient perceptions of communication with hospitalists in our group. Second, we compared results of our CAT implementation with published results examining communication in other physician groups.
Methods
Between September 2008 and August 2009 we performed a cross‐sectional study of patients admitted to the hospital medicine service at an urban, academic medical center with 873 beds. This busy service was responsible for 10,225 admissions in 2008. Patients of age 18 years or older and cared for by a hospitalist or teaching team led by a hospitalist were eligible to participate. Exclusion criteria included patient confusion, physiological instability, non‐English speaking, patient unable to communicate, or patient in isolation status. Interviews were conducted in the patient's private room with no other staff present.
Patient perception of communication with hospitalists was measured with the CAT.17 This 15‐item survey is written at a fourth grade reading level, and measures responses along a 5‐point scale (1 = poor, 2 = fair, 3 = good, 4 = very good, 5 = excellent). The CAT was originally field tested with a convenience sample of 38 physicians from various regions within the US, across 6 specialties (Dermatology, Family Medicine, Neurosurgery, Ophthalmology, Orthopedic Surgery, and Physical Medicine & Rehabilitation). Each physician's office recruited 25 patients to complete the CAT through a phone or Internet‐based system.
The 14 core items of the CAT, which focus on communication with the individual physician, were used in this study. The 15th item, The doctor's staff treated me with respect, was dropped as it does not reflect the inpatient setting. Results for each physician are reported as the percentage of excellent responses. This dichotomized scoring is consistent with the development study, where analysis with Andrich's rating scale model19, 20 indicated that excellent scores correspond to a yes response while poor through very good scores correspond to a no response. This method of reporting scores as a percentage of excellent responses was found to be more useful for summarizing physician scores than reporting mean scores, which are highly skewed towards positive performance.17
Interviews were conducted by trained research assistants during hospitalists' weekday shifts. Hospitalists were not told which patients would be recruited, but were aware that patients on the service were being interviewed to assess communication. A list of patient names, room numbers, dates of admission, and assigned hospitalists was obtained daily from the electronic medical record system. Patients were approached on the second or third day of the hospital admission, and only if they had been assigned to the same hospitalist for at least 2 consecutive days. After explaining the study to patients and receiving verbal consent, researchers verified that the patient recognized the hospitalist, providing a photo if necessary. Patients who were not confident of their hospitalist's identity were excluded.
The 14 core items of the CAT survey were read aloud to the patient, who was provided with a copy of the instrument's scale and asked to respond with a number or word description (1 = poor to 5 = excellent). Patients were allowed to skip any questions they did not wish to answer. At the conclusion of the survey, patients were asked if they had any further comments to add. Patient demographics as well as hospitalist service (general or teaching) and unit were recorded. Most interviews were completed in less than 5 minutes. Based on the recommendations of the original development and validation of the CAT,17 we collected 20 patient surveys for each hospitalist. For CAT items that the patients skipped, we did not impute values; rather the percentage of excellent responses was calculated based on the number of questions the patient answered. To examine basic psychometric characteristics, we assessed scale reliability and performed a factor analysis using the principal components method of extraction with Varimax rotation.
This project was determined exempt by the Northwestern University Institutional Review Board.
Results
We identified 1,137 patients as potentially eligible for the study. Figure 1 shows a flowchart of patient exclusion. Of note, 107 patients consenting to participate (13% overall) were unable to identify their hospitalist by name or photo. More specifically, 70 teaching service patients (25% of 275 eligible patients) were unable to identify their hospitalist, compared to 37 patients on general service (7% of 553 eligible patients); (z = 7.58, P < 0.001). Another 21 (3%) declined to participate because they had not talked enough with their doctor to render an assessment.
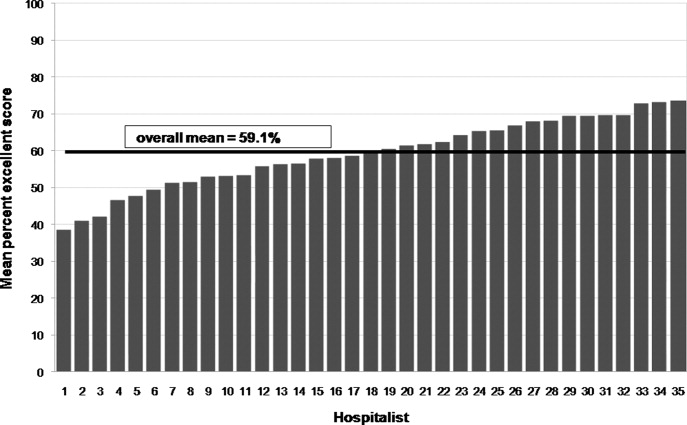
We analyzed 700 patient surveys (20 patients for each of 35 hospitalists; 62% of patients identified). Patient and hospitalist characteristics are presented in Table 1. The proportion of excellent ratings for each hospitalist ranged from 38.5% to 73.5% with an average of 59.1% excellent (standard deviation [SD] = 9.5). See Figure 2 for the distribution of hospitalist scores. For the group as a whole, highest ratings on individual CAT items were for treating the patient with respect (66% excellent), letting the patient talk without interruptions (66%), and talking in terms the patient can understand (64%). Lowest ratings were for involving the patient in decisions as much as he or she wanted (53%), encouraging the patient to ask questions (53%), and greeting the patient in a way that made him or her feel comfortable (55%). Table 2 contains a full ranking of individual item scores.
| Characteristics | |
|---|---|
| Patients (n =700), n (%) | |
| Sex, female | 378 (54) |
| Age, years | |
| 44 and younger | 189 (27) |
| 45‐64 | 266 (38) |
| 65 and older | 245 (35) |
| Race | |
| Caucasian | 357 (51) |
| African American | 266 (38) |
| Hispanic | 49 (7) |
| Other | 28 (4) |
| Hospitalists (n = 35), n (%) | |
| Sex, female | 18 (51) |
| Age, years | |
| Range | 3039 |
| Mean (SD) | 33 (2.4) |
| Race | |
| Caucasian | 14 (40) |
| South Asian | 11 (31) |
| Asian | 7 (20) |
| African American | 3 (9) |
| Non‐native English speaker | 5 (14) |
| Foreign medical graduate | 3 (9) |
| Communication Assessment Tool Item | Percent Excellent Scores |
|---|---|
| 1. Greeted me in a way that made me feel comfortable | 54.9 |
| 2. Treated me with respect | 66.3 |
| 3. Showed interest in my ideas about my health | 58.2 |
| 4. Understood my main health concerns | 57.4 |
| 5. Paid attention to me (looked at me, listened carefully) | 64.1 |
| 6. Let me talk without interruptions | 66.3 |
| 7. Gave me as much information as I wanted | 56.0 |
| 8. Talked in terms I could understand | 64.2 |
| 9. Checked to be sure I understood everything | 57.1 |
| 10. Encouraged me to ask questions | 53.2 |
| 11. Involved me in decisions as much as I wanted | 52.9 |
| 12. Discussed next steps including any follow‐up plans | 58.2 |
| 13. Showed care and concern | 63.8 |
| 14. Spent the right amount of time with me | 57.0 |
Overall scale reliability proved to be high (Cronbach's alpha = 0.97) in this sample. The factor analysis showed that scores for each of the 14 items load onto 1 factor. These results are consistent with the high reliability and single‐factor loading found in Makoul's original scale reliability and validity testing.17
The ad hoc comments made by patients at the conclusion of the CAT survey were categorized as positive or negative. Although many positive comments were made, they tended to be general in nature (eg, She is a great doctor). Negative comments were more explicit. A total of 110 patients (16%) made specific negative comments, which fell into 7 general domains: lack of information (35 comments), not enough time spent with the patient (27 comments), poor listening to the patient (24 comments), ineffective care delivery (7 comments), issues of care, concern, and respect (6 comments), ineffective communication with other staff (5 comments), and unclear role of physician (3 comments). Three patient comments were not related to these domains.
Patient age, race or gender did not correlate with CAT results. Hospitalist factors of age, race, gender, years of experience also were not associated with differences in ratings. However, race concordance between the patient and hospitalist was associated with improved CAT ratings. Patients of the same race as their hospitalist rated the hospitalist's communication significantly higher (M = 64.9%, SD = 39.1) than did patients who were of a different race than their hospitalist (M = 57.3%, SD = 40.3), P < 0.05. Gender concordance was not associated with improved CAT ratings. No score differences were found between patients cared for by a hospitalist on teaching service and direct care, and there were no differences between nursing units.
Discussion
To the best of our knowledge, this is the first study to explicitly measure patient perceptions of communication with hospitalists. The results yielded a wide distribution of scores for physicians within a single, large hospital medicine group. Comparing their own scores to those of peers may allow low‐scoring hospitalists to grasp the potential for improving their communication with patients. Our reliability testing matched the results of the original development study,17 indicating very high overall scale reliability. This suggests that the CAT could be streamlined by dropping some of the survey items. However we agree with Makoul et al.17 that it is best to keep the full set as it provides specific information for physicians without placing undue burden on patients (ie, the CAT takes only 1‐2 min to complete). Individual item scores for each of the 14 CAT items highlight specific communication tasks where intervention may be targeted for individual hospitalists and the group as a whole. It may be feasible to utilize CAT results as an individual report card for physicians. While program leaders should be aware that implementation of the CAT requires standardized data collection, it may be possible to build this into existing structures such as the discharge process.
Interestingly, many patients could not recognize the hospitalist caring for them by name or photo. More than 1 in 10 patients (107 of 828; 13%) were unable to identify their hospitalist. This was more than 3 times as common on the teaching service, where the hospitalist is accompanied by house staff and the intern or resident is the primary physician for patient contact, compared to the service on which hospitalists directly take care of patients without residents. It is also troubling that another 3% of patients (21 of 828) stated they hadn't talked enough with their hospitalist to answer basic communication questions, when approached 2 or 3 days into the relationship. It may be telling that Greeted me in a way that made me feel comfortable was one of the lowest‐rated survey items. Hospitalists should recognize that patients, in addition to facing their own physical and emotional stressors, see many hospital staff members throughout the day; all of whom may be strangers to them. Thus it becomes vital for hospitalists to not only establish an initial rapport with the patient, but to reintroduce themselves each time they enter the room.
An examination of the ad hoc negative comments made by survey respondents reinforces and extends findings related to the CAT items, particularly about those areas of communication valued by patients. The majority of comments fell into categories of failing to give enough information (eg, Sometimes I was left confused when the doctor was ready to leave), not spending enough time with the patient (eg, He was just in and out), and not listening to the patient's own ideas (eg, When giving my history, she cut me off at some points when I had more to say). The information and time categories may directly relate to scores on the CAT items Gave me as much information as I wanted and Spent the right amount of time with me, which are among the lowest‐scoring items. Listening to the patient may reflect broader issues of considering the patient's own experience, questions, concerns and goals.
In this study, patient‐physician race concordance was associated with CAT ratings. Patients who were of the same race as their hospitalist rated the hospitalist higher compared to patients who were of a different race than their hospitalist. This effect is consistent with previous research describing higher patient ratings of communication and care when the patient and physician are of the same race or ethnicity.21
A number of factors limit interpretation of the results of this study. The data were collected at a single site, thus limiting generalizability to other hospitalist practice environments. We used a retrospective, patient assessment of hospitalist communication which may have inherent biases different from a study using direct researcher observation or recording of patient‐hospitalist interactions to assess communication. This methodology allowed us to examine the patient's own perceptions and expectations of communication, but certainly leaves room for selection bias in recruitment and recall bias. Patients were interviewed on the second or third day of their admission. This controlled the length of exposure to the hospitalist, but the course of treatment might vary considerably; at the time of interview, some patients may not yet have had a clear diagnosis and plan while others may have been ready for discharge. Future work should examine how stage of evaluation and management might affect patients' perception of communication with hospitalists. Severity of condition is another factor that may affect patients' ratings, and was not examined in this study.
When compared to physicians from the CAT development study's field test, this study sample of hospitalists scored much lower, 59.1% excellent vs. 76.3% (P < 0.001). A number of factors may account for some of these differences. The majority of patients in the original field test had multiple interactions with their physician, and rated their health status as good or very good. In contrast, hospitalized patients usually lack previous exposure to the hospitalist, and likely have poorer health status. Also, physicians in the original field test volunteered to participate, and patients completed the CAT survey through the Internet or phone response system, rather than through a face‐to‐face interview by trained research assistants. Another key difference is that field‐test patients answered the CAT within 1 day of their outpatient visit, while in this study patients were interviewed in the midst of their hospital admission and prior to completion of their hospital course. Finally, patients commonly choose their outpatient physician and can select someone else if dissatisfied with their communication skills, while hospitalized patients are assigned hospitalists based on availability. Thus, given this potential selection bias, outpatients could be expected to rate their personal physician higher.
Another possibility is that hospitalists are on average less skilled in patient communication than outpatient physicians. Given the transient nature of the inpatient relationship, hospitalists may not value developing rapport with patients, and may not make this a goal of patient care or seek extensive training in communication skills. In future research, evaluating hospitalists' training in and attitudes towards patient communication could be paired with communication assessment results.
Although it is beyond the scope of this study to assess precisely how these environmental and survey implementation factors may affect CAT summary scores, their importance is evident. Another hospital‐based implementation of the CAT tool, an evaluation of ED teams,18 utilized face‐to‐face interviews with trained research assistants. The study yielded results similar to our findings: the average percent excellent score for ED teams was 62.3%, vs. 58.2% percent excellent for our hospitalist group. Taken together, these study comparisons between the original field‐test, our hospitalist implementation, and the ED team implementation support the argument that factors of setting (inpatient vs. outpatient), mode of survey administration (face‐to‐face interview vs. self‐administration through phone or Internet), and shorter duration or course of patient‐physician interaction may be important considerations when implementing the CAT tool to assess physician communication skills, or attempting to set standards of minimally acceptable or desired scoring.
More work must be done to establish norms and/or minimally acceptable scores for hospitalists. Numerous factors of specialty, practice setting, survey implementation, patient variables, and even the expertise of who is setting the communication standards22 may strongly influence comparisons between physician groups, even within a single institution. Organizations seeking to establish norms or minimally acceptable scores for physician‐patient communication should be aware of these factors. As the original development study points out, standard‐setting studies could establish specialty‐specific and country‐specific norms as well as norms or standards for level‐of‐training (eg, medical students versus attending physicians).17
Conclusion
The previously validated CAT instrument appears to have reliable test characteristics and can be used to gauge patient perceptions of hospitalist communication skills. Comparative scores between physicians of different specialties and settings should be interpreted cautiously as there may be confounding variables. Within our single institution, comparative scores between hospitalists, along with an examination of the hospitalist's individual item scores, may offer useful feedback for efforts aimed at enhancing communication. Many hospitalists in this study may benefit from targeted training to improve patient communication skills, particularly in the areas of encouraging questions and involving patients in decision making. Future qualitative research in the context of hospital medicine could identify specific communication techniques used by highly‐rated physicians, with the goal of developing tools for targeted improvement and determining impact on outcomes.
Acknowledgements
The authors thank Christie Edwards, Rachel Grayer and Caitlin Lawes for assistance with data collection, and Jie Peng for help with the analysis.
- ,,.Is the quality of the patient‐provider relationship associated with better adherence and health outcomes for patients with HIV?J Gen Intern Med.2006;21(6):661–665.
- ,,,,.Does physician communication influence older patients' diabetes self‐management and glycemic control? Results from the Health and Retirement Study (HRS).J Gerontol A Biol Sci Med Sci.2007;62(12):1435–1442.
- ,.Physician communication and patient adherence to treatment: a meta‐analysis.Med Care.2009;47(8):826–834.
- ,.The effect of physician behavior on the collection of data.Ann Intern Med.1984;101(5):692–696.
- ,,,,.Does physician‐patient communication that aims at empowering patients improve clinical outcome? A case study.Patient Educ Couns.2006;61(2):299–306.
- .Effective physician‐patient communication and health outcomes: a review.CMAJ.1995;152(9):1423–1433.
- .Evaluation of clinical competencies: basic certification, subspecialty certification, and recertification.Am J Phys Med Rehabil.2000;79(5):478–480.
- ,,,,.General competencies and accreditation in graduate medical education.Health Aff (Millwood).2002;21(5):103–111.
- Joint Commission on Accreditation of Healthcare Organizations. The Joint Commission Standards supporting effective communication, cultural competence, and patient‐centered care.2009:44.
- .Rapport and the hospitalist.Am J Med.2001;111(9B):31S–35S.
- ,.The emerging role of “hospitalists” in the American health care system.N Engl J Med.1996;335(7):514–517.
- ,,,.Hospitalists and the practice of inpatient medicine: results of a survey of the National Association of Inpatient Physicians.Ann Intern Med.1999;130(4 Pt 2):343–349.
- ,,,.The status of hospital medicine groups in the United States.J Hosp Med.2006;1:75–80.
- ,,,.Growth in the care of older patients by hospitalists in the United States.N Engl J Med.2009;360(11):1102–1112.
- ,,,,.Communication problems for patients hospitalized with chest pain.J Gen Intern Med.1998;13(12):836–838.
- ,.End‐of‐life care in a voluntary hospitalist model: effects on communication, processes of care, and patient symptoms.Am J Med.2004;116(10):669–675.
- ,,.Measuring patient views of physician communication skills: development and testing of the Communication Assessment Tool.Patient Educ Couns.2007;67(3):333–342.
- ,,, et al.Patient perspectives on communication with the medical team: pilot study using the Communication Assessment Tool‐Team (CAT‐T).Patient Educ Couns.2008;73(2):220–223.
- .Understanding resistance to the data‐model relationship in Rasch's paradigm: a reflection for the next generation.J Appl Meas.2002;3(3):325–359.
- ,.Conditional pairwise estimation in the Rasch model for ordered response categories using principal components.J Appl Meas.2003;4(3):205–221.
- ,,,,,.Patient‐centered communication, ratings of care, and concordance of patient and physician race.Ann Intern Med.2003;139(11):907–915.
- ,,,.The impact of judge selection on standard setting for a patient survey of physician communication skills.Acad Med.2008;83(10 Suppl):S17–S20.
Effective communication between patients and physicians improves a number of important outcomes including patient adherence to treatment,1‐3 quality of the medical history4 and clinical outcomes.1, 5, 6 Recognizing the importance of physician communication skills, the American Board of Medical Specialties, American Council for Graduate Medical Education and The Joint Commission all identify communication as a core competency for physicians.7‐9 For hospitalists and their patients, building a therapeutic partnership is challenged by the lack of a preexisting relationship and potential lack of patient history information, particularly psychosocial history.10 Other factors that complicate the relationships between hospitalists and their patients include acuity of illness, limited time course, and absence of or lack of input from patients' primary physicians.11
As a rapidly increasing percentage of hospitalized patients are cared for by hospitalists,12, 13 communication skills need to be directly assessed and addressed. As of 2006, at least 37% of all Medicare claims for inpatient evaluation and management services by general internists were attributed to hospitalists, and more than half of hospitalized Medicare patients are seen by hospitalists.14 Yet, a search of the MEDLINE database for articles published between 1965 and September 2009, querying hospitalist AND patient AND communication within the article title and abstract, yielded only 2 studies assessing hospitalist‐patient communication. A 1998 study15 compared patient‐reported communication problems with hospitalists versus continuity physicians involved with hospital care, and found that patients whose continuity physicians remained involved with care during the hospitalization were less likely to report communication problems than those patients who were cared for by a hospitalist alone. A 2004 study16 utilized chart documentation to compare the end‐of‐life care and communication provided by continuity physicians and hospitalists. Hospitalists were found to document end‐of‐life care discussions more often than continuity physicians, and were more likely to be present for these meetings, which may suggest improved end‐of‐life care. Neither of these hospitalist‐patient communication studies directly assessed patient perceptions of communication with hospitalists.
We undertook this study to explore patient perceptions of communication with hospitalists using the Communication Assessment Tool (CAT), a psychometrically validated instrument for patient assessment of physician communication skills.17 The CAT was initially field tested in outpatient offices, omitting the inpatient experience. A 2008 study18 successfully adapted the CAT tool for use in assessing emergency department (ED) teams. Given the importance of physician‐patient communication when patients are sickest and most vulnerable in the hospital setting, we sought to establish a baseline assessment of patient perceptions of communication with hospitalists in our group. Second, we compared results of our CAT implementation with published results examining communication in other physician groups.
Methods
Between September 2008 and August 2009 we performed a cross‐sectional study of patients admitted to the hospital medicine service at an urban, academic medical center with 873 beds. This busy service was responsible for 10,225 admissions in 2008. Patients of age 18 years or older and cared for by a hospitalist or teaching team led by a hospitalist were eligible to participate. Exclusion criteria included patient confusion, physiological instability, non‐English speaking, patient unable to communicate, or patient in isolation status. Interviews were conducted in the patient's private room with no other staff present.
Patient perception of communication with hospitalists was measured with the CAT.17 This 15‐item survey is written at a fourth grade reading level, and measures responses along a 5‐point scale (1 = poor, 2 = fair, 3 = good, 4 = very good, 5 = excellent). The CAT was originally field tested with a convenience sample of 38 physicians from various regions within the US, across 6 specialties (Dermatology, Family Medicine, Neurosurgery, Ophthalmology, Orthopedic Surgery, and Physical Medicine & Rehabilitation). Each physician's office recruited 25 patients to complete the CAT through a phone or Internet‐based system.
The 14 core items of the CAT, which focus on communication with the individual physician, were used in this study. The 15th item, The doctor's staff treated me with respect, was dropped as it does not reflect the inpatient setting. Results for each physician are reported as the percentage of excellent responses. This dichotomized scoring is consistent with the development study, where analysis with Andrich's rating scale model19, 20 indicated that excellent scores correspond to a yes response while poor through very good scores correspond to a no response. This method of reporting scores as a percentage of excellent responses was found to be more useful for summarizing physician scores than reporting mean scores, which are highly skewed towards positive performance.17
Interviews were conducted by trained research assistants during hospitalists' weekday shifts. Hospitalists were not told which patients would be recruited, but were aware that patients on the service were being interviewed to assess communication. A list of patient names, room numbers, dates of admission, and assigned hospitalists was obtained daily from the electronic medical record system. Patients were approached on the second or third day of the hospital admission, and only if they had been assigned to the same hospitalist for at least 2 consecutive days. After explaining the study to patients and receiving verbal consent, researchers verified that the patient recognized the hospitalist, providing a photo if necessary. Patients who were not confident of their hospitalist's identity were excluded.
The 14 core items of the CAT survey were read aloud to the patient, who was provided with a copy of the instrument's scale and asked to respond with a number or word description (1 = poor to 5 = excellent). Patients were allowed to skip any questions they did not wish to answer. At the conclusion of the survey, patients were asked if they had any further comments to add. Patient demographics as well as hospitalist service (general or teaching) and unit were recorded. Most interviews were completed in less than 5 minutes. Based on the recommendations of the original development and validation of the CAT,17 we collected 20 patient surveys for each hospitalist. For CAT items that the patients skipped, we did not impute values; rather the percentage of excellent responses was calculated based on the number of questions the patient answered. To examine basic psychometric characteristics, we assessed scale reliability and performed a factor analysis using the principal components method of extraction with Varimax rotation.
This project was determined exempt by the Northwestern University Institutional Review Board.
Results
We identified 1,137 patients as potentially eligible for the study. Figure 1 shows a flowchart of patient exclusion. Of note, 107 patients consenting to participate (13% overall) were unable to identify their hospitalist by name or photo. More specifically, 70 teaching service patients (25% of 275 eligible patients) were unable to identify their hospitalist, compared to 37 patients on general service (7% of 553 eligible patients); (z = 7.58, P < 0.001). Another 21 (3%) declined to participate because they had not talked enough with their doctor to render an assessment.
We analyzed 700 patient surveys (20 patients for each of 35 hospitalists; 62% of patients identified). Patient and hospitalist characteristics are presented in Table 1. The proportion of excellent ratings for each hospitalist ranged from 38.5% to 73.5% with an average of 59.1% excellent (standard deviation [SD] = 9.5). See Figure 2 for the distribution of hospitalist scores. For the group as a whole, highest ratings on individual CAT items were for treating the patient with respect (66% excellent), letting the patient talk without interruptions (66%), and talking in terms the patient can understand (64%). Lowest ratings were for involving the patient in decisions as much as he or she wanted (53%), encouraging the patient to ask questions (53%), and greeting the patient in a way that made him or her feel comfortable (55%). Table 2 contains a full ranking of individual item scores.
| Characteristics | |
|---|---|
| Patients (n =700), n (%) | |
| Sex, female | 378 (54) |
| Age, years | |
| 44 and younger | 189 (27) |
| 45‐64 | 266 (38) |
| 65 and older | 245 (35) |
| Race | |
| Caucasian | 357 (51) |
| African American | 266 (38) |
| Hispanic | 49 (7) |
| Other | 28 (4) |
| Hospitalists (n = 35), n (%) | |
| Sex, female | 18 (51) |
| Age, years | |
| Range | 3039 |
| Mean (SD) | 33 (2.4) |
| Race | |
| Caucasian | 14 (40) |
| South Asian | 11 (31) |
| Asian | 7 (20) |
| African American | 3 (9) |
| Non‐native English speaker | 5 (14) |
| Foreign medical graduate | 3 (9) |
| Communication Assessment Tool Item | Percent Excellent Scores |
|---|---|
| 1. Greeted me in a way that made me feel comfortable | 54.9 |
| 2. Treated me with respect | 66.3 |
| 3. Showed interest in my ideas about my health | 58.2 |
| 4. Understood my main health concerns | 57.4 |
| 5. Paid attention to me (looked at me, listened carefully) | 64.1 |
| 6. Let me talk without interruptions | 66.3 |
| 7. Gave me as much information as I wanted | 56.0 |
| 8. Talked in terms I could understand | 64.2 |
| 9. Checked to be sure I understood everything | 57.1 |
| 10. Encouraged me to ask questions | 53.2 |
| 11. Involved me in decisions as much as I wanted | 52.9 |
| 12. Discussed next steps including any follow‐up plans | 58.2 |
| 13. Showed care and concern | 63.8 |
| 14. Spent the right amount of time with me | 57.0 |
Overall scale reliability proved to be high (Cronbach's alpha = 0.97) in this sample. The factor analysis showed that scores for each of the 14 items load onto 1 factor. These results are consistent with the high reliability and single‐factor loading found in Makoul's original scale reliability and validity testing.17
The ad hoc comments made by patients at the conclusion of the CAT survey were categorized as positive or negative. Although many positive comments were made, they tended to be general in nature (eg, She is a great doctor). Negative comments were more explicit. A total of 110 patients (16%) made specific negative comments, which fell into 7 general domains: lack of information (35 comments), not enough time spent with the patient (27 comments), poor listening to the patient (24 comments), ineffective care delivery (7 comments), issues of care, concern, and respect (6 comments), ineffective communication with other staff (5 comments), and unclear role of physician (3 comments). Three patient comments were not related to these domains.
Patient age, race or gender did not correlate with CAT results. Hospitalist factors of age, race, gender, years of experience also were not associated with differences in ratings. However, race concordance between the patient and hospitalist was associated with improved CAT ratings. Patients of the same race as their hospitalist rated the hospitalist's communication significantly higher (M = 64.9%, SD = 39.1) than did patients who were of a different race than their hospitalist (M = 57.3%, SD = 40.3), P < 0.05. Gender concordance was not associated with improved CAT ratings. No score differences were found between patients cared for by a hospitalist on teaching service and direct care, and there were no differences between nursing units.
Discussion
To the best of our knowledge, this is the first study to explicitly measure patient perceptions of communication with hospitalists. The results yielded a wide distribution of scores for physicians within a single, large hospital medicine group. Comparing their own scores to those of peers may allow low‐scoring hospitalists to grasp the potential for improving their communication with patients. Our reliability testing matched the results of the original development study,17 indicating very high overall scale reliability. This suggests that the CAT could be streamlined by dropping some of the survey items. However we agree with Makoul et al.17 that it is best to keep the full set as it provides specific information for physicians without placing undue burden on patients (ie, the CAT takes only 1‐2 min to complete). Individual item scores for each of the 14 CAT items highlight specific communication tasks where intervention may be targeted for individual hospitalists and the group as a whole. It may be feasible to utilize CAT results as an individual report card for physicians. While program leaders should be aware that implementation of the CAT requires standardized data collection, it may be possible to build this into existing structures such as the discharge process.
Interestingly, many patients could not recognize the hospitalist caring for them by name or photo. More than 1 in 10 patients (107 of 828; 13%) were unable to identify their hospitalist. This was more than 3 times as common on the teaching service, where the hospitalist is accompanied by house staff and the intern or resident is the primary physician for patient contact, compared to the service on which hospitalists directly take care of patients without residents. It is also troubling that another 3% of patients (21 of 828) stated they hadn't talked enough with their hospitalist to answer basic communication questions, when approached 2 or 3 days into the relationship. It may be telling that Greeted me in a way that made me feel comfortable was one of the lowest‐rated survey items. Hospitalists should recognize that patients, in addition to facing their own physical and emotional stressors, see many hospital staff members throughout the day; all of whom may be strangers to them. Thus it becomes vital for hospitalists to not only establish an initial rapport with the patient, but to reintroduce themselves each time they enter the room.
An examination of the ad hoc negative comments made by survey respondents reinforces and extends findings related to the CAT items, particularly about those areas of communication valued by patients. The majority of comments fell into categories of failing to give enough information (eg, Sometimes I was left confused when the doctor was ready to leave), not spending enough time with the patient (eg, He was just in and out), and not listening to the patient's own ideas (eg, When giving my history, she cut me off at some points when I had more to say). The information and time categories may directly relate to scores on the CAT items Gave me as much information as I wanted and Spent the right amount of time with me, which are among the lowest‐scoring items. Listening to the patient may reflect broader issues of considering the patient's own experience, questions, concerns and goals.
In this study, patient‐physician race concordance was associated with CAT ratings. Patients who were of the same race as their hospitalist rated the hospitalist higher compared to patients who were of a different race than their hospitalist. This effect is consistent with previous research describing higher patient ratings of communication and care when the patient and physician are of the same race or ethnicity.21
A number of factors limit interpretation of the results of this study. The data were collected at a single site, thus limiting generalizability to other hospitalist practice environments. We used a retrospective, patient assessment of hospitalist communication which may have inherent biases different from a study using direct researcher observation or recording of patient‐hospitalist interactions to assess communication. This methodology allowed us to examine the patient's own perceptions and expectations of communication, but certainly leaves room for selection bias in recruitment and recall bias. Patients were interviewed on the second or third day of their admission. This controlled the length of exposure to the hospitalist, but the course of treatment might vary considerably; at the time of interview, some patients may not yet have had a clear diagnosis and plan while others may have been ready for discharge. Future work should examine how stage of evaluation and management might affect patients' perception of communication with hospitalists. Severity of condition is another factor that may affect patients' ratings, and was not examined in this study.
When compared to physicians from the CAT development study's field test, this study sample of hospitalists scored much lower, 59.1% excellent vs. 76.3% (P < 0.001). A number of factors may account for some of these differences. The majority of patients in the original field test had multiple interactions with their physician, and rated their health status as good or very good. In contrast, hospitalized patients usually lack previous exposure to the hospitalist, and likely have poorer health status. Also, physicians in the original field test volunteered to participate, and patients completed the CAT survey through the Internet or phone response system, rather than through a face‐to‐face interview by trained research assistants. Another key difference is that field‐test patients answered the CAT within 1 day of their outpatient visit, while in this study patients were interviewed in the midst of their hospital admission and prior to completion of their hospital course. Finally, patients commonly choose their outpatient physician and can select someone else if dissatisfied with their communication skills, while hospitalized patients are assigned hospitalists based on availability. Thus, given this potential selection bias, outpatients could be expected to rate their personal physician higher.
Another possibility is that hospitalists are on average less skilled in patient communication than outpatient physicians. Given the transient nature of the inpatient relationship, hospitalists may not value developing rapport with patients, and may not make this a goal of patient care or seek extensive training in communication skills. In future research, evaluating hospitalists' training in and attitudes towards patient communication could be paired with communication assessment results.
Although it is beyond the scope of this study to assess precisely how these environmental and survey implementation factors may affect CAT summary scores, their importance is evident. Another hospital‐based implementation of the CAT tool, an evaluation of ED teams,18 utilized face‐to‐face interviews with trained research assistants. The study yielded results similar to our findings: the average percent excellent score for ED teams was 62.3%, vs. 58.2% percent excellent for our hospitalist group. Taken together, these study comparisons between the original field‐test, our hospitalist implementation, and the ED team implementation support the argument that factors of setting (inpatient vs. outpatient), mode of survey administration (face‐to‐face interview vs. self‐administration through phone or Internet), and shorter duration or course of patient‐physician interaction may be important considerations when implementing the CAT tool to assess physician communication skills, or attempting to set standards of minimally acceptable or desired scoring.
More work must be done to establish norms and/or minimally acceptable scores for hospitalists. Numerous factors of specialty, practice setting, survey implementation, patient variables, and even the expertise of who is setting the communication standards22 may strongly influence comparisons between physician groups, even within a single institution. Organizations seeking to establish norms or minimally acceptable scores for physician‐patient communication should be aware of these factors. As the original development study points out, standard‐setting studies could establish specialty‐specific and country‐specific norms as well as norms or standards for level‐of‐training (eg, medical students versus attending physicians).17
Conclusion
The previously validated CAT instrument appears to have reliable test characteristics and can be used to gauge patient perceptions of hospitalist communication skills. Comparative scores between physicians of different specialties and settings should be interpreted cautiously as there may be confounding variables. Within our single institution, comparative scores between hospitalists, along with an examination of the hospitalist's individual item scores, may offer useful feedback for efforts aimed at enhancing communication. Many hospitalists in this study may benefit from targeted training to improve patient communication skills, particularly in the areas of encouraging questions and involving patients in decision making. Future qualitative research in the context of hospital medicine could identify specific communication techniques used by highly‐rated physicians, with the goal of developing tools for targeted improvement and determining impact on outcomes.
Acknowledgements
The authors thank Christie Edwards, Rachel Grayer and Caitlin Lawes for assistance with data collection, and Jie Peng for help with the analysis.
- ,,.Is the quality of the patient‐provider relationship associated with better adherence and health outcomes for patients with HIV?J Gen Intern Med.2006;21(6):661–665.
- ,,,,.Does physician communication influence older patients' diabetes self‐management and glycemic control? Results from the Health and Retirement Study (HRS).J Gerontol A Biol Sci Med Sci.2007;62(12):1435–1442.
- ,.Physician communication and patient adherence to treatment: a meta‐analysis.Med Care.2009;47(8):826–834.
- ,.The effect of physician behavior on the collection of data.Ann Intern Med.1984;101(5):692–696.
- ,,,,.Does physician‐patient communication that aims at empowering patients improve clinical outcome? A case study.Patient Educ Couns.2006;61(2):299–306.
- .Effective physician‐patient communication and health outcomes: a review.CMAJ.1995;152(9):1423–1433.
- .Evaluation of clinical competencies: basic certification, subspecialty certification, and recertification.Am J Phys Med Rehabil.2000;79(5):478–480.
- ,,,,.General competencies and accreditation in graduate medical education.Health Aff (Millwood).2002;21(5):103–111.
- Joint Commission on Accreditation of Healthcare Organizations. The Joint Commission Standards supporting effective communication, cultural competence, and patient‐centered care.2009:44.
- .Rapport and the hospitalist.Am J Med.2001;111(9B):31S–35S.
- ,.The emerging role of “hospitalists” in the American health care system.N Engl J Med.1996;335(7):514–517.
- ,,,.Hospitalists and the practice of inpatient medicine: results of a survey of the National Association of Inpatient Physicians.Ann Intern Med.1999;130(4 Pt 2):343–349.
- ,,,.The status of hospital medicine groups in the United States.J Hosp Med.2006;1:75–80.
- ,,,.Growth in the care of older patients by hospitalists in the United States.N Engl J Med.2009;360(11):1102–1112.
- ,,,,.Communication problems for patients hospitalized with chest pain.J Gen Intern Med.1998;13(12):836–838.
- ,.End‐of‐life care in a voluntary hospitalist model: effects on communication, processes of care, and patient symptoms.Am J Med.2004;116(10):669–675.
- ,,.Measuring patient views of physician communication skills: development and testing of the Communication Assessment Tool.Patient Educ Couns.2007;67(3):333–342.
- ,,, et al.Patient perspectives on communication with the medical team: pilot study using the Communication Assessment Tool‐Team (CAT‐T).Patient Educ Couns.2008;73(2):220–223.
- .Understanding resistance to the data‐model relationship in Rasch's paradigm: a reflection for the next generation.J Appl Meas.2002;3(3):325–359.
- ,.Conditional pairwise estimation in the Rasch model for ordered response categories using principal components.J Appl Meas.2003;4(3):205–221.
- ,,,,,.Patient‐centered communication, ratings of care, and concordance of patient and physician race.Ann Intern Med.2003;139(11):907–915.
- ,,,.The impact of judge selection on standard setting for a patient survey of physician communication skills.Acad Med.2008;83(10 Suppl):S17–S20.
Copyright © 2010 Society of Hospital Medicine

Continuing Medical Education Program in
If you wish to receive credit for this activity, which begins on the next page, please refer to the website: www. blackwellpublishing.com/cme.
Accreditation and Designation Statement
Blackwell Futura Media Services designates this educational activity for a 1 AMA PRA Category 1 Credit. Physicians should only claim credit commensurate with the extent of their participation in the activity.
Blackwell Futura Media Services is accredited by the Accreditation Council for Continuing Medical Education to provide continuing medical education for physicians.
Educational Objectives
Continuous participation in the Journal of Hospital Medicine CME program will enable learners to be better able to:
-
Interpret clinical guidelines and their applications for higher quality and more efficient care for all hospitalized patients.
-
Describe the standard of care for common illnesses and conditions treated in the hospital; such as pneumonia, COPD exacerbation, acute coronary syndrome, HF exacerbation, glycemic control, venous thromboembolic disease, stroke, etc.
-
Discuss evidence‐based recommendations involving transitions of care, including the hospital discharge process.
-
Gain insights into the roles of hospitalists as medical educators, researchers, medical ethicists, palliative care providers, and hospital‐based geriatricians.
-
Incorporate best practices for hospitalist administration, including quality improvement, patient safety, practice management, leadership, and demonstrating hospitalist value.
-
Identify evidence‐based best practices and trends for both adult and pediatric hospital medicine.
Instructions on Receiving Credit
For information on applicability and acceptance of continuing medical education credit for this activity, please consult your professional licensing board.
This activity is designed to be completed within the time designated on the title page; physicians should claim only those credits that reflect the time actually spent in the activity. To successfully earn credit, participants must complete the activity during the valid credit period that is noted on the title page.
Follow these steps to earn credit:
-
Log on to www.blackwellpublishing.com/cme.
-
Read the target audience, learning objectives, and author disclosures.
-
Read the article in print or online format.
-
Reflect on the article.
-
Access the CME Exam, and choose the best answer to each question.
-
Complete the required evaluation component of the activity.
Hospitalist Time Motion Study
Hospital Medicine represents the fastest‐growing specialty in the history of medicine in the United States, with approximately 28,000 hospitalists now working in over half of American hospitals.1 Hospitalists increasingly fill the gap between demand for care of hospitalized patients and the deficit of physicians previously availableprimary care physicians in community hospitals and residents in teaching hospitals.2, 3 This growth has also been driven by hospitalists' ability to increase clinical efficiency. Research consistently demonstrates a reduction in overall costs and length of stay with the use of hospitalists.47 Additionally, many teaching hospitals have implemented nonteaching hospitalist services in an effort to comply with the Accreditation Council for Graduate Medicine Education (ACGME) program requirements regarding resident duty hours.8 Given the potential for improved clinical efficiency and the need to comply with revised ACGME program requirements, the Hospital Medicine Service at Northwestern Memorial Hospital (NMH) was established in 2003. Today, this service cares for more than half of hospitalized medical patients at NMH.
Although extensive research documents that implementation of a hospitalist program improves the efficiency of hospital care delivery,4, 6 there is little data to explain how hospitalists achieve this level of efficiency or how efficiency might be increased further. Several authors have suggested potential explanations for hospitalists' efficiency gains, but none has yet received strong empirical validation.5, 7 The only previously published study to directly observe more than a small portion of the activities of hospitalists was conducted at NMH in 2006.9 O'Leary et al. used time‐motion methodology to study ten hospitalists for 75 hours total. They found that hospitalists spend a large amount of time on communication when compared to nonhospitalist physicians. However, the study only reported partial information about how and with whom this communications was performed. Similarly, the authors reported that documentation occupied about a quarter of hospitalists' time, but did not report more detailed information about what was being documented and how. Additionally, they noted that hospitalists spent 21% of their time multitasking, but did not report what types of activities were performed during these episodes. Finally, at the time of that study hospitalists at NMH saw about 40% fewer patients per day than they do now. Increasing the number of patients each physician sees in a day is an obvious way to increase productivity, but it is unclear how this affects hospitalist workflow and time spent in various clinical activities.
Another important trend in hospital care delivery is the implementation of electronic medical records (EMR).10 NMH was just transitioning to a fully integrated EMR and computerized physician order entry (CPOE) system when the previous time‐motion study was performed. Now that the system is in place, a significant proportion of hospitalists' time has shifted from using a paper‐based record to sitting in front of a computer. However, we do not know exactly how hospitalists interact with the EMR and how this alters workflow; an increasingly important issue as hospitals across the U.S. implement EMRs at the behest of the federal government and aiming to improve patient safety.11
To better understand the workflow of hospitalists and validate the findings of the O'Leary study in a larger sample of hospitalists, we undertook this study seeking to collect data continuously for complete shifts, rather than sampling just a few hours at a time. We hypothesized that this would reduce observer effects and provide us with a more complete and accurate assessment of a day in the life of a hospitalist.
Methods
Study Site
The study was conducted at NMH, an 897‐bed tertiary care teaching hospital in Chicago, IL, and was approved by the Institutional Review Board of Northwestern University. Patients are admitted to the Hospital Medicine Service from the Emergency Department or directly from physicians' offices based on bed availability in a quasi‐randomized fashion. Hospitalists included in the study cared for patients without the assistance of housestaff physicians and worked 7 consecutive days while on service, usually followed by 7 consecutive days off service. During weeks on service, hospitalist shifts started at 7 AM and ended between 5 PM and 7 PM.
Data Collection Tool Development
To facilitate collection of detailed information sought for this study, we developed an electronic data collection tool. A systematic review of the medical literature on time studies performed by our research group indicated a lack of methodological standardization and dissimilar activity categorizations across studies.12 We attempted to develop a standardized method and data collection instrument for future studies, and first created a data dictionary consisting of a list of hospitalist activities and their descriptions. The initial components were drawn from prior time‐motion studies9, 13, 14 and input from experienced hospitalists (KJO and MVW). The activity list was then refined after a preliminary observation period in which five hospitalists were followed for a total of 6 shifts. Observers noted the specific activities being performed by the hospitalists and asked for explanations and clarification when necessary. In order for an activity to be included in the final list, the activity had to be easily observable and identifiable without subjective interpretation from the observer. The preliminary observation period ended once we were satisfied that no new activities were emerging.
The compiled list of activities was then broken down into related groups and separated into additional subcategories to increase the specificity of data collection. The final list of activities was reviewed by several experienced hospitalists to ensure completeness. The data dictionary was then loaded onto a Palm Pilot Tx using WorkStudy+ Plus software. The final activity list consisted of 8 main categories, 32 secondary categories, and 53 tertiary categories (See Appendix). To facilitate comparisons with prior studies, we followed the convention of including the categories of direct and indirect patient care. We defined direct patient care as those activities involving face‐to‐face interaction between the hospitalist and the patient. The more general indirect care category encompassed other categories of activity relevant to the patient's care but not performed in the presence of the patient (ie, professional communication, interaction with the EMR, and other patient related activities like searching for medical knowledge on the Internet or reading telemetry monitors).
Pilot Testing
We trained 6 observers in the use of the data collection tool. Each observer practiced shadowing for more than 20 hours with the tool before collecting study data. During this pilot testing phase we optimized the layout of the tool to facilitate rapid documentation of hospitalist activities and multitasking. Interobserver reliability was confirmed by having 2 observers shadow the same hospitalist for a three hour time period. In all cases, the observers obtained an average interclass correlation coefficient of at least 0.95 with a 95% confidence interval of .85 to 1.0 prior to collecting study data.
Study Design
Data collection occurred between July and September of 2008. A total of 24 hospitalists were observed, each for 2 complete weekday shifts starting at 7 AM and ending between 5 PM and 7 PM. Of note, we only observed hospitalists who were directly caring for patients and not part of a teaching service. Each hospitalist was contacted about the project at least a week prior to any observations and informed consent was obtained. A single observer shadowed a single hospitalist continuously, trading off with a new observer every 3 hours to avoid fatigue. To minimize any observation effect our data collectors were instructed not to initiate and to minimize conversation with the hospitalists. At the end of the hospitalist's shift the following data were tallied: the number of patients in the hospitalist's care at the beginning of the day, the number of patients discharged during the day, and the number of admissions. Patient load was determined by adding the number of admissions to the number of patients at the beginning of the day.
Data Analysis
Minutes were tallied for each of the categories and subcategories. Data is reported as percentages of total duration of observed activities (ie, including multitasking) unless otherwise specified. To explore the effect of patient volume on hospitalist workflow we performed t‐tests comparing the number of minutes hospitalists spent per patient in various activities on days with below average patient volume as compared to those with above average volume. Additionally, we performed a Wilcoxon two‐samples test to check for a difference in length of shift between these 2 groups.
Results
A total of 24 hospitalists were shadowed for a total of approximately 494 hours. For 43 of these hours a hospitalist was observed performing 2 tasks simultaneously, bringing the total duration of observed activities to 537 hours with multitasking. The hospitalists were a mean 34 1.1 years of age and 12 (50%) were female. Twenty (83%) had completed residency 2 or more years prior to the study, 2 (8%) had a year of hospitalist experience since residency, and the remaining 2 (8%) had just completed residency. Sixteen (67%) hospitalists were Asian or Pacific Islanders, 6 (25%) were White, and 2 (8%) were Black. The hospitalists cared for an average of 13.2 0.6 patients per shift and an average shift lasted 10 hours and 19 minutes 52 minutes.
Table 1 lists the mean percentage of time hospitalists spent on the various activities. Subjects spent the most time (34.1%) interacting with the EMR. Communication and direct care were the next most frequent activities at 25.9% and 17.4% of each shift respectively, followed by professional development (6.5%), travel (6.2%), personal time (5.6%), other indirect care (3.9%), and waiting (0.4%). The 3 subcategories included in indirect care time accounted for about 64% of all recorded activities.
| Main Category | % Total Observed Activities | (95% CI)* | Subcategory | % Main Category | (95% CI)* |
|---|---|---|---|---|---|
| |||||
| EMR* | 34.1 | (32.435.9) | |||
| Writing | 58.4 | (55.761.0) | |||
| Orders | 20.2 | (18.521.9) | |||
| Reading/reviewing | 19.4 | (17.321.5) | |||
| Other | 2.1 | (1.82.5) | |||
| Communication* | 25.9 | (24.427.4) | |||
| Outgoing call | 36.9 | (33.640.2) | |||
| Face to face | 28.1 | (25.231.0) | |||
| Incoming call | 14.4 | (12.616.3) | |||
| Sending page | 8.6 | (7.79.4) | |||
| Rounds | 3.8 | (1.85.8) | |||
| Receiving page | 3.4 | (2.94.0) | |||
| E‐mail | 2.9 | (1.83.9) | |||
| Reviewing page | 1.8 | (1.32.3) | |||
| Fax | 0.1 | (0.00.2) | |||
| Direct care | 17.4 | (15.918.9) | |||
| Professional Development | 6.5 | (4.48.5) | |||
| Travel | 6.2 | (5.66.7) | |||
| Personal | 5.7 | (4.17.2) | |||
| Other indirect care* | 3.9 | (3.44.4) | |||
| Wait | 0.4 | (0.20.5) | |||
Of the nearly 4 hours (233 minutes) per shift hospitalists spent using the EMR, the majority (58.4%) was spent documenting (See Table 1). Placing orders and reading/reviewing notes were nearly equal at 20.2% and 19.4% respectively, and other EMR activities took 2.1% of EMR time. Over half of the time (54.1%) hospitalists spent documenting in the EMR system was dedicated to progress notes. The remainder of effort was expended on writing histories and physicals (15.3%), discharge instructions (14.7%), discharge summaries (7.9%), sign‐outs (6.8%), and performing medication reconciliation (1.4%). Of the time spent reading and reviewing documents on the EMR, most was spent reviewing lab results (45.4%) or notes from the current admission (40.4%). Reviewing imaging studies occupied 8.1%, and notes from past encounters accounted for 6.2% of this category's time.
Various modes of communication were used during the nearly three hours (176 minutes) per shift dedicated to communication. Phone calls took up approximately half of the hospitalists' communication time, with 36.8% spent on outgoing calls and 14.2% incoming calls. Face‐to‐face communication was the next most common mode, accounting for 28.2% of the total. Time spent sending pages (8.8%), receiving pages (3.4%), and reviewing pages (1.8%) consumed 14% of all communication time. E‐mail and fax were used sparingly, at 3.1% and 0.1% of communication time, respectively. Finally, meetings involving other hospital staff (interdisciplinary rounds) occupied 3.4% of communication time.
The amount of time hospitalists spent communicating with specific types of individuals is shown in Table 2. Hospitalists spent the most time communicating with other physicians (44.5%) and nurses (18.1%). They spent less time communicating with people from the remaining categories; utilization staff (5.7%), patients' family members (5.6%), case managers (4.2%), primary care physicians (3.4%), ancillary staff (3.1%), and pharmacists (0.6%). Communication with other individuals that did not fit in the above categories accounted for 8.8%, and 5.3% of communication could not be clearly categorized, generally because the hospitalist was communicating by phone or text page and ascertaining with whom would have required significant interruption.
| Subcategory | % Main Category | (95% CI)* |
|---|---|---|
| ||
| Inpatient physician | 44.5 | (41.747.2) |
| Nursing staff | 18.0 | (16.019.9) |
| Other | 8.5 | (6.810.2) |
| Family | 5.8 | (4.07.7) |
| Utilization staff | 5.8 | (4.67.0) |
| Uncategorized | 5.7 | (3.77.6) |
| PCC | 4.0 | (2.35.7) |
| PCP | 3.6 | (2.74.5) |
| Ancillary staff | 2.9 | (2.23.7) |
| Pharmacy | 1.4 | (0.82.0) |
We found that 16% of all recorded activities occurred when another activity was also ongoing. This means that hospitalists were performing more than one activity for approximately 54 minutes per day, or about 9% of the average 10.3‐hour shift. Instances of multitasking occurred frequently, but were usually brief; the hospitalists performed 2 activities simultaneously an average of 75 times per day, but 79% of these occurrences lasted less than 1 minute. Of the 86 hours of multitasking activities recorded, 41% was communication time and another 41% was EMR use. This means that a second activity was being performed during 19% of the time hospitalists spent using the EMR and 26% of the time they spent communicating. Of the time spent on critical documentation activities like writing prescriptions and orders, 24% was recorded during a multitasking event.
The amount of time hospitalists spent per patient on days with above average patient volume as compared to those with below average patient volume is shown in Table 3. Hospitalists with above average patient numbers spent about 3 minutes less per patient interacting with the EMR (a 17% reduction; P < 0.01), and about 2 minutes less per patient communicating (a 14% reduction; P < 0.01). The average length of shift increased by 12 minutes on days when patient volume was above average; P < 0.05.
| Subcategory | Minutes: Below Average Census | (95% CI)* | Minutes: Above Average Census | (95% CI)* | Pr > |t| |
|---|---|---|---|---|---|
| |||||
| EMR | 19.12 | (17.5020.75) | 15.83 | (14.1717.49) | <.001 |
| Communication | 14.28 | (12.8615.71) | 12.21 | (11.0713.36) | 0.002 |
| Direct care | 9.30 | (8.1810.42) | 8.59 | (7.279.91) | 0.293 |
| Professional development | 4.09 | (2.365.81) | 2.57 | (1.263.89) | 0.026 |
| Personal | 3.52 | (2.394.65) | 2.05 | (1.292.82) | 0.032 |
| Travel | 3.32 | (2.863.79) | 2.93 | (2.643.22) | 0.566 |
| Other indirect care | 2.37 | (1.902.84) | 1.65 | (1.321.98) | 0.292 |
| Wait | 0.25 | (0.080.41) | 0.14 | (0.040.25) | 0.881 |
Discussion
To our knowledge, this study represents the largest time‐motion evaluation of hospitalist activities ever undertaken, and provides the most detailed assessment of hospitalists' activities when caring for patients without residents or medical students. We confirmed that hospitalists spend the majority of their time (64%) undertaking care activities away from the patient's bedside, and are involved in direct patient care contact only 17% of their time, averaging about 9 minutes per patient. The hospitalists spent about a quarter (26%) of their time communicating with others. Compared to other physicians, this is an unusually large amount of time. For example, Hollingsworth et al.15 found that emergency medicine physicians spent just half as much (13%) of their time on communication with other providers and staff. This may reflect hospitalists' central role in the coordination of consulting specialists. The other significant portion of hospitalists' effort focuses on documentation in the electronic medical record, with 22% of their time required for CPOE and note writing, and overall a third of their time (34.1%) committed to interacting with the EMR.
In many respects, our results confirm the findings of O'Leary et al.'s previous work. While this current study more precisely identified how hospitalists spend their time, the general proportions of times were similar. Both studies found that indirect care activities occupied about two‐thirds of hospitalists' time (64% in this study and 69% in the previous study). We also documented similar portions of total time for direct patient care (17% vs. 18%) and communication (26% vs. 24%). Interestingly, with complete implementation of the EMR system, the percentage of time spent on documentation appeared to decrease. O'Leary et al. reported that documentation accounted for 26% of hospitalists' time, while the equivalent activities (writing in the EMR or paper prescriptions) accounted for only 21% in the current study. Unfortunately, the significance of this finding is difficult to determine given the concurrent changes in patient volumes and the varying extent of EMR implementation during the earlier study.
Over half of hospitalists' communication time is spent either making or receiving phone calls. This suggests that efforts to facilitate communication (eg, use of mobile phone systems and voicemail) might enhance efficiency. Additionally, we found that nearly half of our hospitalists' communication was with other physicians. Not surprisingly, our study confirmed that an important part of hospitalists' work involves organizing and collaborating with a variety of specialists to provide optimal care for their patients.
Hospitalists spent a great deal of time multitasking. We found that multitasking time accounted for nearly 1 of every 10 minutes during the day. The most common combination of activities involved communication that occurred during a period of EMR use. These interruptions could have serious consequences should physicians lose track of what they are doing while ordering procedures or prescribing medications.
We documented a smaller portion of multitasking time than O'Leary's earlier study. This could be due to differences in how multitasking was defined or recorded in the 2 studies. Our electronic data collection tool allowed us to capture rapid task switching and multitasking to the second, rather than to the minute, as was done with the stopwatch and paper form used in the previous study. This precision was important, especially considering that nearly 80% of the recorded instances of multitasking lasted less than 1 minute.
Our data also suggests that patient census has significant effects on certain parts of hospitalist workflow. Patient volume for our subjects ranged from 10 to 19 patients per shift, with a mean of 13.2 patients. The amount of time our hospitalists spent with each patient did not differ significantly between above and below average census days. However, EMR time per patient was significantly reduced on above average census days. Anecdotally, several of our hospitalists suggested that on high census days they put off less time‐sensitive documentation activities like discharge summaries until after they leave the hospital and complete the work from home or on the following day. Thus, our study likely underestimates the total additional effort on high volume days, but unfortunately we had no direct way of quantifying work performed outside of the hospital or on subsequent days. Communication time was also significantly reduced when patient volumes were above average, suggesting that hospitalists had less time to confer with consultants or answer the questions of nurses and patient family members.
Several factors limit the interpretation and application of our findings. First, our study was conducted at a single urban, academic hospital, which may limit its applicability for hospitalists working at community hospitals. Given that more than 90% of hospital care in the U.S. occurs in the community hospital setting, research to confirm these findings in such hospitals is needed.16 Nonclinical research assistants collected all of the data, so the results may be limited by the accuracy of their interpretations. However, our extensive training and documentation of their accuracy serves as a strength of the study. Finally, we focused exclusively on daytime, weekday activities of hospitalists. Notably, 3 hospitalists work through the night at our facility, and 24‐hour coverage by hospitalists is increasingly common across the U.S. We expect weekend and night shift workflow to be somewhat different from standard day shifts due to the decreased availability of other medical providers for testing, consults, and procedures. Future research should focus on potential differences in activities on nights and weekends compared to weekdays.
This extensive, comprehensive analysis of hospitalist activities and workflow provides a foundation for future research and confirms much of O'Leary et al.'s original study. O'Leary's simpler approach of observing smaller blocks of time rather than full shifts proved effective; the two methodologies produced markedly similar results. The current study also offers some insight into matters of efficiency. We found that hospitalists with higher patient loads cut down on EMR and communication time. We also confirmed that hospitalists spend the largest portion of their time interacting with the EMR. A more efficient EMR system could therefore be especially helpful in providing more time for direct patient care and the communication necessary to coordinate care. Given that most hospitals provide financial support for hospital medicine programs (an average of $95,000 per hospitalist full‐time equivalent (FTE)1), hospital administrators have a keen interest in understanding how hospitalists might be more efficient. For example, if hospitalists could evaluate and manage two additional patients each day by exchanging time focused on medical record documentation for direct care activities, the cost of a hospitalist drops substantively. By understanding current hospitalist activities, efforts at redesigning their workflow can be more successful at addressing issues related to scheduling, communication, and compensation, thus improving the overall model of practice as well as the quality of patient care.17
Acknowledgements
We thank Caitlin Lawes and Stephen Williams for help with data collection, and all the hospitalists who participated in this study.
- Society of Hospital Medicine. About SHM.2008; http://www.hospitalmedicine.org/AM/Template.cfm?Section=About_SHM. Accessed April 2010.
- , .The evolution and future of hospital medicine.Mt Sinai J Med.2008;75(5):418–423.
- , , .Rehospitalizations among patients in the Fee‐for‐Service Medicare Program.N Engl J Med.2009;360(14):1418–1428.
- , , , , , .Outcomes of care by hospitalists, general internists, and family physicians.[see comment].N Engl J Med.2007;357(25):2589–2600.
- , .The hospitalist movement 5 years later.JAMA.2002;287:487–494.
- , .The impact of hospitalists on the cost and quality of inpatient care in the United States: a research synthesis.Med Care Res Rev.2005;62:379–406.
- .Hospitalists and the hospital medicine system of care are good for patient care.Arch Intern Med.2008;168(12):1254–1256; discussion 1259–1260.
- , .Hospitalists in teaching hospitals: opportunities but not without danger.J Gen Intern Med.2004;19:392–393.
- , , .How hospitalists spend their time: insights on efficiency and safety.J Hosp Med.2006;1(2):88–93.
- , , , et al.Use of electronic health records in U.S. hospitals.N Engl J Med.2009;360.
- .Electronic medical records at a crossroads: impetus for change or missed opportunity?JAMA.2009;302(10):1109–1111.
- , , , , .Systematic review of time studies evaluating physicians in the hospital setting.J Hosp Med.2010;5(6):000–000.
- , , , .All in a day's work: an observational study to quantify how and with whom doctors on hospital wards spend their time.Med J Aust.2008;188(9):506–509.
- , , , .Emergency department workplace interruptions: are emergency physicians “interrupt‐driven” and “multitasking”?Acad Emerg Med.2000;7:1239–1243.
- , , , , .How do physicians and nurses spend their time in the emergency department?Ann Emerg Med.1998;31(1):87–91.
- , , , , .The ecology of medical care revisited.N Engl J Med.2001;344(26):2021–2025.
- , .Organizing a hospitalist program: an overview of fundamental concepts.Med Clin North Am.2002;86(4):887–909.
Hospital Medicine represents the fastest‐growing specialty in the history of medicine in the United States, with approximately 28,000 hospitalists now working in over half of American hospitals.1 Hospitalists increasingly fill the gap between demand for care of hospitalized patients and the deficit of physicians previously availableprimary care physicians in community hospitals and residents in teaching hospitals.2, 3 This growth has also been driven by hospitalists' ability to increase clinical efficiency. Research consistently demonstrates a reduction in overall costs and length of stay with the use of hospitalists.47 Additionally, many teaching hospitals have implemented nonteaching hospitalist services in an effort to comply with the Accreditation Council for Graduate Medicine Education (ACGME) program requirements regarding resident duty hours.8 Given the potential for improved clinical efficiency and the need to comply with revised ACGME program requirements, the Hospital Medicine Service at Northwestern Memorial Hospital (NMH) was established in 2003. Today, this service cares for more than half of hospitalized medical patients at NMH.
Although extensive research documents that implementation of a hospitalist program improves the efficiency of hospital care delivery,4, 6 there is little data to explain how hospitalists achieve this level of efficiency or how efficiency might be increased further. Several authors have suggested potential explanations for hospitalists' efficiency gains, but none has yet received strong empirical validation.5, 7 The only previously published study to directly observe more than a small portion of the activities of hospitalists was conducted at NMH in 2006.9 O'Leary et al. used time‐motion methodology to study ten hospitalists for 75 hours total. They found that hospitalists spend a large amount of time on communication when compared to nonhospitalist physicians. However, the study only reported partial information about how and with whom this communications was performed. Similarly, the authors reported that documentation occupied about a quarter of hospitalists' time, but did not report more detailed information about what was being documented and how. Additionally, they noted that hospitalists spent 21% of their time multitasking, but did not report what types of activities were performed during these episodes. Finally, at the time of that study hospitalists at NMH saw about 40% fewer patients per day than they do now. Increasing the number of patients each physician sees in a day is an obvious way to increase productivity, but it is unclear how this affects hospitalist workflow and time spent in various clinical activities.
Another important trend in hospital care delivery is the implementation of electronic medical records (EMR).10 NMH was just transitioning to a fully integrated EMR and computerized physician order entry (CPOE) system when the previous time‐motion study was performed. Now that the system is in place, a significant proportion of hospitalists' time has shifted from using a paper‐based record to sitting in front of a computer. However, we do not know exactly how hospitalists interact with the EMR and how this alters workflow; an increasingly important issue as hospitals across the U.S. implement EMRs at the behest of the federal government and aiming to improve patient safety.11
To better understand the workflow of hospitalists and validate the findings of the O'Leary study in a larger sample of hospitalists, we undertook this study seeking to collect data continuously for complete shifts, rather than sampling just a few hours at a time. We hypothesized that this would reduce observer effects and provide us with a more complete and accurate assessment of a day in the life of a hospitalist.
Methods
Study Site
The study was conducted at NMH, an 897‐bed tertiary care teaching hospital in Chicago, IL, and was approved by the Institutional Review Board of Northwestern University. Patients are admitted to the Hospital Medicine Service from the Emergency Department or directly from physicians' offices based on bed availability in a quasi‐randomized fashion. Hospitalists included in the study cared for patients without the assistance of housestaff physicians and worked 7 consecutive days while on service, usually followed by 7 consecutive days off service. During weeks on service, hospitalist shifts started at 7 AM and ended between 5 PM and 7 PM.
Data Collection Tool Development
To facilitate collection of detailed information sought for this study, we developed an electronic data collection tool. A systematic review of the medical literature on time studies performed by our research group indicated a lack of methodological standardization and dissimilar activity categorizations across studies.12 We attempted to develop a standardized method and data collection instrument for future studies, and first created a data dictionary consisting of a list of hospitalist activities and their descriptions. The initial components were drawn from prior time‐motion studies9, 13, 14 and input from experienced hospitalists (KJO and MVW). The activity list was then refined after a preliminary observation period in which five hospitalists were followed for a total of 6 shifts. Observers noted the specific activities being performed by the hospitalists and asked for explanations and clarification when necessary. In order for an activity to be included in the final list, the activity had to be easily observable and identifiable without subjective interpretation from the observer. The preliminary observation period ended once we were satisfied that no new activities were emerging.
The compiled list of activities was then broken down into related groups and separated into additional subcategories to increase the specificity of data collection. The final list of activities was reviewed by several experienced hospitalists to ensure completeness. The data dictionary was then loaded onto a Palm Pilot Tx using WorkStudy+ Plus software. The final activity list consisted of 8 main categories, 32 secondary categories, and 53 tertiary categories (See Appendix). To facilitate comparisons with prior studies, we followed the convention of including the categories of direct and indirect patient care. We defined direct patient care as those activities involving face‐to‐face interaction between the hospitalist and the patient. The more general indirect care category encompassed other categories of activity relevant to the patient's care but not performed in the presence of the patient (ie, professional communication, interaction with the EMR, and other patient related activities like searching for medical knowledge on the Internet or reading telemetry monitors).
Pilot Testing
We trained 6 observers in the use of the data collection tool. Each observer practiced shadowing for more than 20 hours with the tool before collecting study data. During this pilot testing phase we optimized the layout of the tool to facilitate rapid documentation of hospitalist activities and multitasking. Interobserver reliability was confirmed by having 2 observers shadow the same hospitalist for a three hour time period. In all cases, the observers obtained an average interclass correlation coefficient of at least 0.95 with a 95% confidence interval of .85 to 1.0 prior to collecting study data.
Study Design
Data collection occurred between July and September of 2008. A total of 24 hospitalists were observed, each for 2 complete weekday shifts starting at 7 AM and ending between 5 PM and 7 PM. Of note, we only observed hospitalists who were directly caring for patients and not part of a teaching service. Each hospitalist was contacted about the project at least a week prior to any observations and informed consent was obtained. A single observer shadowed a single hospitalist continuously, trading off with a new observer every 3 hours to avoid fatigue. To minimize any observation effect our data collectors were instructed not to initiate and to minimize conversation with the hospitalists. At the end of the hospitalist's shift the following data were tallied: the number of patients in the hospitalist's care at the beginning of the day, the number of patients discharged during the day, and the number of admissions. Patient load was determined by adding the number of admissions to the number of patients at the beginning of the day.
Data Analysis
Minutes were tallied for each of the categories and subcategories. Data is reported as percentages of total duration of observed activities (ie, including multitasking) unless otherwise specified. To explore the effect of patient volume on hospitalist workflow we performed t‐tests comparing the number of minutes hospitalists spent per patient in various activities on days with below average patient volume as compared to those with above average volume. Additionally, we performed a Wilcoxon two‐samples test to check for a difference in length of shift between these 2 groups.
Results
A total of 24 hospitalists were shadowed for a total of approximately 494 hours. For 43 of these hours a hospitalist was observed performing 2 tasks simultaneously, bringing the total duration of observed activities to 537 hours with multitasking. The hospitalists were a mean 34 1.1 years of age and 12 (50%) were female. Twenty (83%) had completed residency 2 or more years prior to the study, 2 (8%) had a year of hospitalist experience since residency, and the remaining 2 (8%) had just completed residency. Sixteen (67%) hospitalists were Asian or Pacific Islanders, 6 (25%) were White, and 2 (8%) were Black. The hospitalists cared for an average of 13.2 0.6 patients per shift and an average shift lasted 10 hours and 19 minutes 52 minutes.
Table 1 lists the mean percentage of time hospitalists spent on the various activities. Subjects spent the most time (34.1%) interacting with the EMR. Communication and direct care were the next most frequent activities at 25.9% and 17.4% of each shift respectively, followed by professional development (6.5%), travel (6.2%), personal time (5.6%), other indirect care (3.9%), and waiting (0.4%). The 3 subcategories included in indirect care time accounted for about 64% of all recorded activities.
| Main Category | % Total Observed Activities | (95% CI)* | Subcategory | % Main Category | (95% CI)* |
|---|---|---|---|---|---|
| |||||
| EMR* | 34.1 | (32.435.9) | |||
| Writing | 58.4 | (55.761.0) | |||
| Orders | 20.2 | (18.521.9) | |||
| Reading/reviewing | 19.4 | (17.321.5) | |||
| Other | 2.1 | (1.82.5) | |||
| Communication* | 25.9 | (24.427.4) | |||
| Outgoing call | 36.9 | (33.640.2) | |||
| Face to face | 28.1 | (25.231.0) | |||
| Incoming call | 14.4 | (12.616.3) | |||
| Sending page | 8.6 | (7.79.4) | |||
| Rounds | 3.8 | (1.85.8) | |||
| Receiving page | 3.4 | (2.94.0) | |||
| E‐mail | 2.9 | (1.83.9) | |||
| Reviewing page | 1.8 | (1.32.3) | |||
| Fax | 0.1 | (0.00.2) | |||
| Direct care | 17.4 | (15.918.9) | |||
| Professional Development | 6.5 | (4.48.5) | |||
| Travel | 6.2 | (5.66.7) | |||
| Personal | 5.7 | (4.17.2) | |||
| Other indirect care* | 3.9 | (3.44.4) | |||
| Wait | 0.4 | (0.20.5) | |||
Of the nearly 4 hours (233 minutes) per shift hospitalists spent using the EMR, the majority (58.4%) was spent documenting (See Table 1). Placing orders and reading/reviewing notes were nearly equal at 20.2% and 19.4% respectively, and other EMR activities took 2.1% of EMR time. Over half of the time (54.1%) hospitalists spent documenting in the EMR system was dedicated to progress notes. The remainder of effort was expended on writing histories and physicals (15.3%), discharge instructions (14.7%), discharge summaries (7.9%), sign‐outs (6.8%), and performing medication reconciliation (1.4%). Of the time spent reading and reviewing documents on the EMR, most was spent reviewing lab results (45.4%) or notes from the current admission (40.4%). Reviewing imaging studies occupied 8.1%, and notes from past encounters accounted for 6.2% of this category's time.
Various modes of communication were used during the nearly three hours (176 minutes) per shift dedicated to communication. Phone calls took up approximately half of the hospitalists' communication time, with 36.8% spent on outgoing calls and 14.2% incoming calls. Face‐to‐face communication was the next most common mode, accounting for 28.2% of the total. Time spent sending pages (8.8%), receiving pages (3.4%), and reviewing pages (1.8%) consumed 14% of all communication time. E‐mail and fax were used sparingly, at 3.1% and 0.1% of communication time, respectively. Finally, meetings involving other hospital staff (interdisciplinary rounds) occupied 3.4% of communication time.
The amount of time hospitalists spent communicating with specific types of individuals is shown in Table 2. Hospitalists spent the most time communicating with other physicians (44.5%) and nurses (18.1%). They spent less time communicating with people from the remaining categories; utilization staff (5.7%), patients' family members (5.6%), case managers (4.2%), primary care physicians (3.4%), ancillary staff (3.1%), and pharmacists (0.6%). Communication with other individuals that did not fit in the above categories accounted for 8.8%, and 5.3% of communication could not be clearly categorized, generally because the hospitalist was communicating by phone or text page and ascertaining with whom would have required significant interruption.
| Subcategory | % Main Category | (95% CI)* |
|---|---|---|
| ||
| Inpatient physician | 44.5 | (41.747.2) |
| Nursing staff | 18.0 | (16.019.9) |
| Other | 8.5 | (6.810.2) |
| Family | 5.8 | (4.07.7) |
| Utilization staff | 5.8 | (4.67.0) |
| Uncategorized | 5.7 | (3.77.6) |
| PCC | 4.0 | (2.35.7) |
| PCP | 3.6 | (2.74.5) |
| Ancillary staff | 2.9 | (2.23.7) |
| Pharmacy | 1.4 | (0.82.0) |
We found that 16% of all recorded activities occurred when another activity was also ongoing. This means that hospitalists were performing more than one activity for approximately 54 minutes per day, or about 9% of the average 10.3‐hour shift. Instances of multitasking occurred frequently, but were usually brief; the hospitalists performed 2 activities simultaneously an average of 75 times per day, but 79% of these occurrences lasted less than 1 minute. Of the 86 hours of multitasking activities recorded, 41% was communication time and another 41% was EMR use. This means that a second activity was being performed during 19% of the time hospitalists spent using the EMR and 26% of the time they spent communicating. Of the time spent on critical documentation activities like writing prescriptions and orders, 24% was recorded during a multitasking event.
The amount of time hospitalists spent per patient on days with above average patient volume as compared to those with below average patient volume is shown in Table 3. Hospitalists with above average patient numbers spent about 3 minutes less per patient interacting with the EMR (a 17% reduction; P < 0.01), and about 2 minutes less per patient communicating (a 14% reduction; P < 0.01). The average length of shift increased by 12 minutes on days when patient volume was above average; P < 0.05.
| Subcategory | Minutes: Below Average Census | (95% CI)* | Minutes: Above Average Census | (95% CI)* | Pr > |t| |
|---|---|---|---|---|---|
| |||||
| EMR | 19.12 | (17.5020.75) | 15.83 | (14.1717.49) | <.001 |
| Communication | 14.28 | (12.8615.71) | 12.21 | (11.0713.36) | 0.002 |
| Direct care | 9.30 | (8.1810.42) | 8.59 | (7.279.91) | 0.293 |
| Professional development | 4.09 | (2.365.81) | 2.57 | (1.263.89) | 0.026 |
| Personal | 3.52 | (2.394.65) | 2.05 | (1.292.82) | 0.032 |
| Travel | 3.32 | (2.863.79) | 2.93 | (2.643.22) | 0.566 |
| Other indirect care | 2.37 | (1.902.84) | 1.65 | (1.321.98) | 0.292 |
| Wait | 0.25 | (0.080.41) | 0.14 | (0.040.25) | 0.881 |
Discussion
To our knowledge, this study represents the largest time‐motion evaluation of hospitalist activities ever undertaken, and provides the most detailed assessment of hospitalists' activities when caring for patients without residents or medical students. We confirmed that hospitalists spend the majority of their time (64%) undertaking care activities away from the patient's bedside, and are involved in direct patient care contact only 17% of their time, averaging about 9 minutes per patient. The hospitalists spent about a quarter (26%) of their time communicating with others. Compared to other physicians, this is an unusually large amount of time. For example, Hollingsworth et al.15 found that emergency medicine physicians spent just half as much (13%) of their time on communication with other providers and staff. This may reflect hospitalists' central role in the coordination of consulting specialists. The other significant portion of hospitalists' effort focuses on documentation in the electronic medical record, with 22% of their time required for CPOE and note writing, and overall a third of their time (34.1%) committed to interacting with the EMR.
In many respects, our results confirm the findings of O'Leary et al.'s previous work. While this current study more precisely identified how hospitalists spend their time, the general proportions of times were similar. Both studies found that indirect care activities occupied about two‐thirds of hospitalists' time (64% in this study and 69% in the previous study). We also documented similar portions of total time for direct patient care (17% vs. 18%) and communication (26% vs. 24%). Interestingly, with complete implementation of the EMR system, the percentage of time spent on documentation appeared to decrease. O'Leary et al. reported that documentation accounted for 26% of hospitalists' time, while the equivalent activities (writing in the EMR or paper prescriptions) accounted for only 21% in the current study. Unfortunately, the significance of this finding is difficult to determine given the concurrent changes in patient volumes and the varying extent of EMR implementation during the earlier study.
Over half of hospitalists' communication time is spent either making or receiving phone calls. This suggests that efforts to facilitate communication (eg, use of mobile phone systems and voicemail) might enhance efficiency. Additionally, we found that nearly half of our hospitalists' communication was with other physicians. Not surprisingly, our study confirmed that an important part of hospitalists' work involves organizing and collaborating with a variety of specialists to provide optimal care for their patients.
Hospitalists spent a great deal of time multitasking. We found that multitasking time accounted for nearly 1 of every 10 minutes during the day. The most common combination of activities involved communication that occurred during a period of EMR use. These interruptions could have serious consequences should physicians lose track of what they are doing while ordering procedures or prescribing medications.
We documented a smaller portion of multitasking time than O'Leary's earlier study. This could be due to differences in how multitasking was defined or recorded in the 2 studies. Our electronic data collection tool allowed us to capture rapid task switching and multitasking to the second, rather than to the minute, as was done with the stopwatch and paper form used in the previous study. This precision was important, especially considering that nearly 80% of the recorded instances of multitasking lasted less than 1 minute.
Our data also suggests that patient census has significant effects on certain parts of hospitalist workflow. Patient volume for our subjects ranged from 10 to 19 patients per shift, with a mean of 13.2 patients. The amount of time our hospitalists spent with each patient did not differ significantly between above and below average census days. However, EMR time per patient was significantly reduced on above average census days. Anecdotally, several of our hospitalists suggested that on high census days they put off less time‐sensitive documentation activities like discharge summaries until after they leave the hospital and complete the work from home or on the following day. Thus, our study likely underestimates the total additional effort on high volume days, but unfortunately we had no direct way of quantifying work performed outside of the hospital or on subsequent days. Communication time was also significantly reduced when patient volumes were above average, suggesting that hospitalists had less time to confer with consultants or answer the questions of nurses and patient family members.
Several factors limit the interpretation and application of our findings. First, our study was conducted at a single urban, academic hospital, which may limit its applicability for hospitalists working at community hospitals. Given that more than 90% of hospital care in the U.S. occurs in the community hospital setting, research to confirm these findings in such hospitals is needed.16 Nonclinical research assistants collected all of the data, so the results may be limited by the accuracy of their interpretations. However, our extensive training and documentation of their accuracy serves as a strength of the study. Finally, we focused exclusively on daytime, weekday activities of hospitalists. Notably, 3 hospitalists work through the night at our facility, and 24‐hour coverage by hospitalists is increasingly common across the U.S. We expect weekend and night shift workflow to be somewhat different from standard day shifts due to the decreased availability of other medical providers for testing, consults, and procedures. Future research should focus on potential differences in activities on nights and weekends compared to weekdays.
This extensive, comprehensive analysis of hospitalist activities and workflow provides a foundation for future research and confirms much of O'Leary et al.'s original study. O'Leary's simpler approach of observing smaller blocks of time rather than full shifts proved effective; the two methodologies produced markedly similar results. The current study also offers some insight into matters of efficiency. We found that hospitalists with higher patient loads cut down on EMR and communication time. We also confirmed that hospitalists spend the largest portion of their time interacting with the EMR. A more efficient EMR system could therefore be especially helpful in providing more time for direct patient care and the communication necessary to coordinate care. Given that most hospitals provide financial support for hospital medicine programs (an average of $95,000 per hospitalist full‐time equivalent (FTE)1), hospital administrators have a keen interest in understanding how hospitalists might be more efficient. For example, if hospitalists could evaluate and manage two additional patients each day by exchanging time focused on medical record documentation for direct care activities, the cost of a hospitalist drops substantively. By understanding current hospitalist activities, efforts at redesigning their workflow can be more successful at addressing issues related to scheduling, communication, and compensation, thus improving the overall model of practice as well as the quality of patient care.17
Acknowledgements
We thank Caitlin Lawes and Stephen Williams for help with data collection, and all the hospitalists who participated in this study.
- Society of Hospital Medicine. About SHM.2008; http://www.hospitalmedicine.org/AM/Template.cfm?Section=About_SHM. Accessed April 2010.
- , .The evolution and future of hospital medicine.Mt Sinai J Med.2008;75(5):418–423.
- , , .Rehospitalizations among patients in the Fee‐for‐Service Medicare Program.N Engl J Med.2009;360(14):1418–1428.
- , , , , , .Outcomes of care by hospitalists, general internists, and family physicians.[see comment].N Engl J Med.2007;357(25):2589–2600.
- , .The hospitalist movement 5 years later.JAMA.2002;287:487–494.
- , .The impact of hospitalists on the cost and quality of inpatient care in the United States: a research synthesis.Med Care Res Rev.2005;62:379–406.
- .Hospitalists and the hospital medicine system of care are good for patient care.Arch Intern Med.2008;168(12):1254–1256; discussion 1259–1260.
- , .Hospitalists in teaching hospitals: opportunities but not without danger.J Gen Intern Med.2004;19:392–393.
- , , .How hospitalists spend their time: insights on efficiency and safety.J Hosp Med.2006;1(2):88–93.
- , , , et al.Use of electronic health records in U.S. hospitals.N Engl J Med.2009;360.
- .Electronic medical records at a crossroads: impetus for change or missed opportunity?JAMA.2009;302(10):1109–1111.
- , , , , .Systematic review of time studies evaluating physicians in the hospital setting.J Hosp Med.2010;5(6):000–000.
- , , , .All in a day's work: an observational study to quantify how and with whom doctors on hospital wards spend their time.Med J Aust.2008;188(9):506–509.
- , , , .Emergency department workplace interruptions: are emergency physicians “interrupt‐driven” and “multitasking”?Acad Emerg Med.2000;7:1239–1243.
- , , , , .How do physicians and nurses spend their time in the emergency department?Ann Emerg Med.1998;31(1):87–91.
- , , , , .The ecology of medical care revisited.N Engl J Med.2001;344(26):2021–2025.
- , .Organizing a hospitalist program: an overview of fundamental concepts.Med Clin North Am.2002;86(4):887–909.
Copyright © 2010 Society of Hospital Medicine
Time Studies of Hospital Physicians
Time‐motion studies, introduced by Frederick W. Taylor in the 1880s,1 have been widely implemented across the business world; a Google search of time‐motion study returns approximately 32 million results. Such studies continuously document how workers spend their time and then use this information to identify and eliminate inefficient practices. Work‐sampling is a similar methodology introduced by L.H.C. Tippett in 1935.2 Work‐sampling utilizes a trained observer to document activities at predetermined or random intervals of time. Given a large enough number of observations, this method can be comparable to the continuous observation method used in time‐motion studies.3
Healthcare has begun to utilize these time‐study methodologies to evaluate the activities of physicians and nurses. Researchers have successfully used time‐study methodology in the emergency department, intensive care unit, and ambulatory and surgical settings in the U.S. and around the world to better understand physician activities and to design and assess interventions to improve efficiency.49 Hospitals are also eager to enhance efficiency in the inpatient setting given the current economic environment. Hospitalizations account for over a third of healthcare costs in the United States, making them an attractive target for cost‐cutting measures.10 Acknowledging that healthcare expenditures cannot continue to rise,11 insurers, particularly the Centers for Medicare and Medicaid Services (CMS), increasingly seek to reduce payments to hospitals.12 Compounding these pressures, a major supply of relatively inexpensive labor shrank with the decision by the Accreditation Council for Graduate Medicine Education (ACGME) to restrict the number of hours residents are allowed to work. Efficiency concerns gain new urgency as hospitals scramble to cover their patient loads with reduced physician availability.13
We undertook a systematic review of time‐motion and work‐sampling studies performed in the hospital setting to better understand the available literature describing the activities of physicians caring for hospitalized patients. An additional goal of this review was to determine the extent of available time‐flow literature describing the activity of hospitalists. The hospitalist movement provided one viable solution to the gap between demand for hospital patient care and the reduced supply of available physicianstypically primary care physicians in community hospitals and residents in teaching hospitals.14 Hospital medicine is the fastest‐growing specialty in the history of American medicine.15 More than half of American hospitals now have hospital medicine programs with a total of greater than 25,000 hospitalists in the U.S.15 This popularity has been driven by hospitalists' ability to increase efficiency through decreasing overall cost and length of stay for patients without increasing readmission rates or reducing primary care physician satisfaction.1619 However, exactly how hospitalists accomplish this increase in efficiency is still the subject of debate. One time‐motion study provides a glimpse into the activities of hospitalists at an academic urban hospital,20 but may not be applicable to many other hospitals.
Methods
Data Sources
With assistance from a medical librarian, we searched for English‐language articles published between 1965 and June 2009 using the MEDLINE (
Study Selection
We selected articles that met the following criteria: (1) explicit use of time‐motion methodology or work‐sampling performed via direct observation; (2) study populations including physicians, medical residents, or interns; (3) performance sites on an inpatient hospital ward (ie, not outpatient within the hospital, emergency room (ER), or operating room (OR)); and (4) observation of at least half of a shift. Titles and abstracts of the retrieved citations were first reviewed to identify studies that could potentially meet our criteria. Full‐text versions of the selected articles were then retrieved and analyzed by at least 2 of 4 authors (V.F., K.E., D.M., and M.T.) to determine the final list of articles. Articles that failed to provide sufficient information for one or more criteria were excluded.
Data Extraction
Each article was independently reviewed by at least 2 of 3 authors (V.F., D.M., and M.T.) using a standardized data abstraction form. The form included the following categories: sample population, sample size, hospital type, data collection tool type, time‐motion/observation duration, key categories of activity, and key results. If an article included additional data beyond the scope of this review (eg, data from surgical residents in the OR as well as internal medicine residents) only the qualifying portion of the study was included. Disagreements were resolved through discussion and consensus. Data were then compiled into tables.
Results
Our database search yielded 4270 potential articles. We then reviewed the title and abstract of each of these articles to identify studies that evaluated physicians, were performed on a hospital ward, and explicitly used time‐motion or direct‐observation work‐sampling methodology. For articles lacking an abstract but having a relevant title, we obtained the full text to determine eligibility for additional review. Sixty‐eight articles from this original search were selected for full‐text review. Ten of these articles met the selection criteria. Most of the articles excluded in this step were either conducted in an outpatient OR or ER setting, or used self‐report data instead of direct‐observation data. A secondary search using the reference lists of all obtained articles as well as consultation with experts in the field yielded 11 additional articles of interest. Three of these 11 articles were found to meet our criteria, bringing the total to 13 articles for review (Fig. 1).
These 13 articles included several types of physicians in their samples. Eleven included interns,2131 7 included residents,2123, 2628, 31 and 4 included attending physicians20, 23, 26, 32 (Table 1). Six articles included more than 1 type of subject.2123, 26, 28, 31 The main focus of these articles also varied. Nine of the 13 studies were designed to simply describe how residents, physicians and nurses spend their time.20, 2227, 29, 31 Three studies were primarily concerned with comparing groups from different intern programs, residency rotations, hospital types, or shifts.28, 30, 32 The remaining study attempted to quantify the amount of time physicians spent on tasks that could be performed by non‐physician staff.21 Only 2 articles evaluated hospitalists,20, 32 and we found no articles studying hospitalists in a community, non‐teaching setting. The studies were performed as early as 1961 and as recently as 2009. Just 5 of the 13 articles were published within the last 10 years. 0
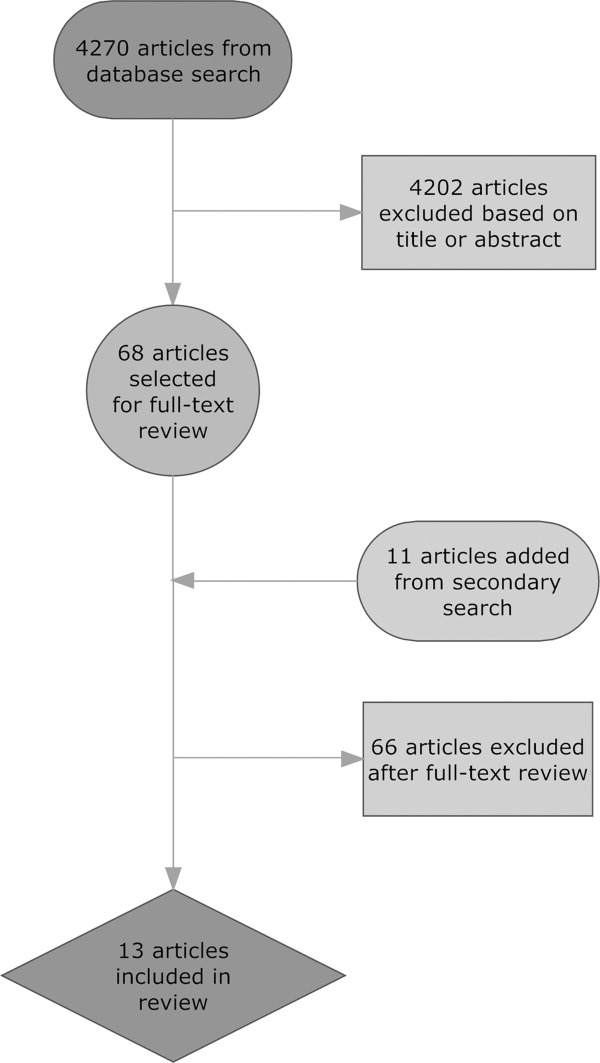
| Reference (Year) | Type of Hospital | Data Collection Tool | Direct/Indirect Care Estimates | Key Activities Reported and Percentage of Time Spent on Each, and Other Results |
|---|---|---|---|---|
| ||||
| Ammenwerth and Spotl (2009) | Academic | Work sampling: paper and stopwatch | Direct care 27.5%; indirect care 62.8% | Documentation tasks 26.6%; direct care 27.5%; communication 36.2%; other tasks 9.7%. Approximately 16% of documentation time was administrative documentation. |
| Arthurson et al. (1976) | Academic | Paper and stopwatch | Direct care 40.8%; indirect care 45.5% | Medical intern: patient care 40.8%; clerical 25.5%; telephone 10%; professional discussion 10.5%; transit/waiting 6.5%, personal 7% |
| Gabow et al. (2006) | Academic | Paper and stopwatch with pedometer | Direct care 19.5%; indirect care: 32% | Attend to/assess patient 17%; charting 9.5%; consult with MD/nurse 9.5%; downtime 6.5%; educational activity 2.5%; family interaction 0.5%; paging/phone 3.5%; procedure 1.5%; review films/laboratory results 9%; rounds 15.5%; sleep 21.5%; travel 3.5% |
| Gillanders et al. (1971) | Academic | Paper and stopwatch | Direct care 19%; indirect care 42.5% | Individual interaction 14.5%; nonverbal communication 20.5%; procedures 10.0%; laboratory work 3.5%; interpersonal communication 18.5%; rounds 9%; direction and supervision 0.5%; nonmedical talk 2%; education 8.5%; ancillary activities 5.5%; personal 7% |
| Knickman et al. (1992) | Academic | Paper and stopwatch | Direct care 8.5%; indirect care 37.7% | Education 20.7%; information gathering 13.7%; personal 13.3%; testing 12%; consulting 12%; documenting 9.8%; transit 8.2%; procedures 5.4%; interacting with patients 3.1%; administration 1.8%. 46.7% of residents' time was spent on tasks that required a physician. |
| Lurie et al. (1989) | Academic | Paper and stopwatch | Direct care 17.4%; indirect care 39.3% | Procedures 3%; patient evaluation 20%; communication 27%; basic 40%; miscellaneous 10%. On average, doctors were interrupted 9 minutes into an H&P, got 230 minutes of sleep per night, and slept 59 minutes before being woken up by some interruption. |
| Magnusson et al. (1998) | Academic | Paper and stopwatch | Could not be determined | Clinical 54%; education 28%; personal 18%. The 3 specialties did not differ significantly in time spent on these categories except for education time: emergency 24%; internal 28%; surgery 18%. |
| Malkenson (unpublished data) | 1 Community; 1 Academic | Paper and stopwatch | Academic: direct care 19%; indirect care 56%. Community: direct care 25%; indirect care 55%. | Direct patient care (25% community, 19% academic); indirect patient care (55% community, 56% academic); personal time (4% community, 6% academic); travel time (10% community, 10% academic); other activities (10% community, 13% academic) |
| Nerenz et al. (1990) | Academic | Work sampling: paper and stopwatch | Direct care 18.9%; indirect care could not be determined | Interns averaged 21 pages over 30 hours of observation, and slept an average of 2.5 hours with 2 interruptions. Attending physicians interacted with the interns for an average of 139 minutes per shift. |
| O'Leary et al. (2006) | Academic | Paper and stopwatch | Direct care 18%; indirect care 69% | Indirect patient care occupied 69% of hospitalists' time. Indirect care included: documentation 37%; communication 35%; reviewing results 21%; orders 7%. Direct care occupied 18%, and included: history and physical 18%; follow‐up visits 53%; family meetings 13%; discharge instructions 16%. Remaining time was spent on personal activities 4%; professional development 3%; education 3%; travel 3%. |
| Parenti et al. (1993) | Academic | Paper and stopwatch | Interns: direct care 39%; indirect care 51%. Residents: direct care 40%; indirect care 47%. | Interns: procedures 4%; patient evaluation 35%; communication 42%; basics 11%; miscellaneous 8%. Residents: procedures 2%; patient evaluation 38%; communication 35%; basics 12%; miscellaneous 13%. |
| Payson et al. (1961) | Academic | Paper and stopwatch | Could not be determined | Communication with staff took up the largest amount of time. Remaining time was evenly distributed between the categories of personal activities, ancillary duties, patient and relative contact, and intravenous therapy. Overall percentages of time were not reported. |
| Westbrook et al. (2008) | Academic | PDA | Attending physicians: direct care 18.0%; indirect care 63.5%. Residents: direct care 16.0%; indirect care 66.7%. Interns: direct care 11%; indirect care 85%. | Communication 33%; social activities 17%; indirect care 17%; direct care 15%; documentation 9%; medication tasks 7%; supervision or education 7%; transit 6%; discharge summary 5%; administrative tasks 2%; answering pager 0.8% |
Methodological quality also varied. Of the 11 time‐motion studies, the total amount of time subjects were observed in the studies ranged from 48 to 720 hours, with a mean of 254 hours. The number of subjects observed varied between 1 and 35, with a mean of 12 subjects. Average time observed per subject ranged from 8 hours to 113.5 hours, with a median of 26 hours. Six of the 11 studies observed subjects continuously for an entire shift.22, 25, 2831 Four studies covered an entire shift over the course of several days, using shorter observation periods.20, 21, 26, 27 One study observed subjects for only part of a shift.32 Ten of the time‐flow articles reported collecting data with a stopwatch and paper‐and‐pencil form2022, 25, 2732 and 1 used a handheld computer system.26 Two studies utilized work‐sampling techniques, both using paper‐and‐pencil forms to collect data during a full shift. Ammenwerth and Spotl23 studied 8 physicians for a total of 40 hours, collecting 5500 observation points. Nerenz et al.24 studied 11 interns for a total of approximately 330 hours, and collected 7858 observations. Both of these studies collected sufficiently large samples to satisfy the power requirements described by Sittig.3
Study sites were relatively uniform. Only one study evaluated physicians at both a teaching community hospital and an academic hospital.32 The remaining 12 observed physicians only in academic hospitals. Two studies were conducted in Australia,25, 26 1 in Austria,23 and the remaining 10 were conducted in the United States.
To provide a rough estimate of the amount of time physicians spend on direct care activities at the patients' bedside vs. indirect care activities, we attempted to calculate these figures for each article using a common definition. For the sake of consistency and to allow us to include as many studies as possible, we used the broadest definition of indirect care found among the articles, which included activities such as professional communication, medication review, documentation, and reviewing test results. Three articles did not provide enough information to calculate these values.24, 27, 29
All 10 articles that did provide sufficient information found that indirect care activities consumed the greater portion of time. Indirect care occupied an average of 50% of physicians' time, ranging from 32% to 69%. Direct care, on the other hand, accounted for an average of 23% of physicians' time, and ranged from 8.5% to 41%. Three articles that included data specific to attending physicians or hospitalists demonstrated an even larger disparity between direct and indirect care.20, 26, 32 In these articles, physicians spent an average of 19% of their time on direct care and 64% on indirect care, suggesting that senior physicians in the academic setting spend less time with patients and more time on care activities away from patients.
Four studies recorded various forms of interruptions of work flow.20, 24, 26, 31 Lurie et al.31 found that interns and residents were interrupted approximately 9 minutes into the performance of every history and physical (H&P). Westbrook et al.26 found that residents were interrupted on average every 21 minutes regardless of the task being performed. Nerenz et al.24 reported that interns received an average of 21 pages over the course of a 30 hour shift. They also noted that, on average, 12 of these pages were merely transient distractions, but 9 pages required some action on the part of the intern.24 Finally, O'leary et al.20 found that hospitalists received an average of 3.5 pages an hour and that 7% of their day was spent returning pages. Two articles recorded events of multitasking. Westbrook et al.26 found that 20% of physicians' time was spent performing more than one activity. Similarly, O'Leary et al.20 reported that 21% of hospitalists' time was spent multitasking. Neither study reported the types of activity performed during multitasking.
One article considered the amount of time physicians spend performing tasks that could be performed by non‐physician staff. Knickman et al.21 reported that in the traditional physician‐centered model of care, approximately 19% of a resident's time is spent on tasks that could be performed by non‐physician staff. They suggested that switching to a mid‐level provider model of care could significantly reduce the impact of resident work hour restrictions.21
Parenti and Lurie28 examined internal medicine residents on both day and night shifts.31 These authors concluded that residents on the night shift have an easier time because they see fewer patients and have more down time than residents on day shifts.28 Additionally, Lurie et al. found that residents got an average of 230 minutes (3.8 hours) of sleep per night and slept, on average, 59 minutes before being awakened by an interruption.31 However, these studies preceded work hour regulations.
Discussion
This systematic review of time studies set in the hospital, the first of which we are aware, revealed a sizable number (13) of articles evaluating physicians. However, the studies almost exclusively focused on academic hospitals (92%) and the majority (69%) analyzed only the activities of physicians in training. The studies were diverse in their methodology, subject populations, and, not surprisingly, their results. Even those studies designed simply to document the activities of physicians in the hospital report widely varying findings. For example, the percentage of time physicians spent on direct‐care activities varied from 8.5% to 41%, while indirect‐care time varied from 32% to 69%. These results likely reflect the heterogeneity of the hospital environment and differences among hospitals, as well as variations in the design and quality of the studies.
Despite this variability, a few observations appear consistent. Physicians perform many tasks that may be readily accomplished by less costly staff. This could partly explain why far more time is spent on activities indirectly related to a patient's care (eg, documentation and coordinating tests), instead of directly interacting with hospitalized patients. Additionally, physicians caring for hospitalized patients experience multiple interruptions and must regularly multitask. Unfortunately, very little research in the hospital setting has evaluated the impact of these interruptions on work efficiency, medical errors, or adverse events.
With the intense national interest in improving the value of healthcare by both enhancing quality and reducing costs, further efforts to optimize the efficiency of hospitalists will be needed.33 As hospitals and hospitalists aim to enhance the efficiency of care delivery to hospitalized patients, and also are increasingly asked to expend time to optimize the hospital discharge process to reduce readmissions,34, 35 time‐motion and work‐sampling studies can provide guidance.
One of the principal difficulties in aggregating data from time studies is the variety of approaches used to analyze activities. Lack of standardization in the approach to assessing physician activities (eg, use of a stopwatch with paper documentation vs. computer) and dissimilar categorizations inhibit efforts to summarize the findings across studies. Categories of activity were generally selected with the specific goals of the study in mind, instead of utilizing a readily available standardized approach. Moreover, the lack of detailed definitions of categories and sub‐categories, along with data for each, produces a significant barrier to comparison. Based on this review of available literature and our own experience conducting time‐motion evaluation of hospitalists, we propose the basic activity categorization in Table 2. Future researchers would be able to more readily compare their findings to other time‐motion studies by utilizing such a standardized approach to categorizing physician activities. Adding custom sub‐categories within this basic set would allow researchers to explore more specific time‐flow questions while maintaining comparability of most data. Electronic data collection tools (eg, handheld or tablet computers) could also facilitate the collection of more detailed and accurate data to increase study reliability.
| Primary | Secondary | Tertiary |
|---|---|---|
| Direct patient care | Daily rounds | Evaluation |
| Education | ||
| Admission history and physical | ||
| Consultation history and physical | ||
| Discharge | Evaluation | |
| Education | ||
| Procedures | ||
| Indirect care | Reviewing test results | |
| Documentation | Orders | |
| History and physical | ||
| Progress notes | ||
| Discharge paperwork | ||
| Communication | Paging | |
| Patient relatives | ||
| Other physicians | ||
| Nurse | ||
| Ancillary staff | ||
| Other | Education | |
| Transit/travel | ||
| Personal (eg, eating, restroom) | ||
| Miscellaneous |
Our systematic review is limited in its scope, as we focused only on the activities of physicians working in the hospital. Our exclusion criteria also eliminated several more focused time studies that evaluated only one small part of a physician's workflow, such as Amusan et al.'s36 evaluation of EMR and CPOE implementation during morning rounds. The available literature itself is also lacking in several important ways. Much of the literature is now limited by its age. The constant advance of medical technology, changes in work hour regulations, and new reimbursement structures have all affected physician workflow, and likely contributed to the variability of time study findings. Additionally, the available literature focuses almost exclusively on academic hospitals and teaching services. All but 1 of the studies collected data exclusively in academic hospitals, despite the fact that more than 90% of hospital care delivery in the U.S. occurs in a non‐academic hospital setting.20, 37 Just 1 study evaluated the activity of hospitalists directly caring for patients without assistance from residents.20 The significantly different workforce composition in community hospitals could mean that most findings are not relevant to the vast majority of U.S. hospitals. For example, the studies documenting that physicians in training (ie, residents) perform many activities that could be performed by a non‐physician are likely not applicable to the community hospital setting. Thus, additional research is needed to better understand how hospitalists can deliver care more efficiently, particularly in the community hospital setting and in the current technological and structural environment of healthcare.
This systematic review of the literature provides insight into published studies attempting to evaluate physician activities in the hospital through time‐motion and work‐sampling studies. Published research to date appears extremely variable in quality, limiting our ability to draw firm conclusions. However, it appears that hospital‐based physicians spend most of their time not interacting with patients, and non‐physician staff could readily complete a sizable portion of their tasks. Given the necessity for multitasking by hospitalists, better documentation of its frequency and impact is needed, as well as information about the types of tasks performed while multitasking, which has yet to be reported. Additionally, the effect of interruptions (including, but not limited to paging) needs further evaluation.
When properly performed, time‐study methodology represents a powerful approach to understanding the activities of hospitalists and how we might reengineer hospital care delivery to be more efficient. Efforts to standardize healthcare delivery and integrate health information technology could benefit dramatically from detailed information regarding physician activities and empirical testing of quality improvement initiatives. Future research using time‐motion or work‐sampling methodology should be careful to define and report categories of activity with enough detail that comparisons with other studies are possible.
Acknowledgements
The authors acknowledge the assistance of Linda O'Dwyer, MA MSLIS, research librarian at the Northwestern University Feinberg School of Medicine for her assistance with the search of the medical literature.
- .Motion and Time Study: Design and Measurement of Work.6th ed.New York:Wiley;1968.
- .Statistical methods in textile research. Uses of the binomial and poissant distributions.J Textile Inst Trans.1935;26:51–55.
- .Work‐sampling: a statistical approach to evaluation of the effect of computers on work patterns in the healthcare industry.Proc Annu Symp Comput Appl Med Care.1992:537–541.
- , , , , , .Time motion study in a pediatric emergency department before and after computer physician order entry.Ann Emerg Med.2009;53(4):462–468, e461.
- , , , .A “time‐and‐motion” study of endoscopic practice: strategies to enhance efficiency.Gastrointest Endosc.2008;68(6):1043–1050.
- , , , , , .Workflow in intensive care unit remote monitoring: A time‐and‐motion study.Crit Care Med.2007;35(9):2057–2063.
- , , , et al.Workflow analysis of medical staff in surgical wards based on time‐motion study data.Jpn Hosp.2008(27):75–80.
- , , , , , .General and visceral surgery practice in German hospitals: a real‐time work analysis on surgeons' work flow.Langenbecks Arch Surg.2010;395(1):81–87.
- , , , et al.Electronic health records in specialty care: a time‐motion study.J Am Med Inform Assoc.2007;14(5):609–615.
- , , , .National health spending in 2007: slower drug spending contributes to lowest rate of overall growth since 1998.Health Aff (Millwood).2009;28(1):246–261.
- , .The challenge of rising health care costs–a view from the Congressional Budget Office.N Engl J Med.2007;357(18):1793–1795.
- .Nonpayment for performance? Medicare's new reimbursement rule.N Engl J Med.2007;357(16):1573–1575.
- , .Hospitalists in teaching hospitals: opportunities but not without danger.J Gen Intern Med.2004;19:392–393.
- .The future of hospital medicine: evolution or revolution?Am J Med.2004;117:446–450.
- , .The evolution and future of hospital medicine.Mt Sinai J Med.2008;75(5):418–423.
- , , , , , .Outcomes of care by hospitalists, general internists, and family physicians.[see comment].N Engl J Med.2007;357(25):2589–2600.
- , .The hospitalist movement 5 years later.JAMA.2002;287:487–494.
- , .The impact of hospitalists on the cost and quality of inpatient care in the United States: a research synthesis.Med Care Res Rev.2005;62:379–406.
- .Hospitalists and the hospital medicine system of care are good for patient care.Arch Intern Med.2008;168(12):1254–1256; discussion 1259–1260.
- , , .How hospitalists spend their time: insights on efficiency and safety.J Hosp Med.2006;1(2):88–93.
- , , , , .The potential for using non‐physicians to compensate for the reduced availability of residents.Acad Med.1992;67(7):429–438.
- , , , , , .Observations of residents' work activities for 24 consecutive hours: Implications for workflow redesign.Acad Med.2006;81(8):766–775.
- , .The time needed for clinical documentation versus direct patient care. A work‐sampling analysis of physicians' activities.Methods Inf Med.2009;48(1):84–91.
- , , , et al.The on‐call experience of interns in internal medicine. Medical Education Task Force of Henry Ford Hospital.Arch Intern Med.1990;150(11):2294–2297.
- , , .What does the intern do?Med J Aust.1976;1(3):63–65.
- , , , .All in a day's work: an observational study to quantify how and with whom doctors on hospital wards spend their time.Med J Aust.2008;188(9):506–509.
- , , , .Resident educational time study: a tale of three specialties.Acad Emerg Med.1998;5(7):718–725.
- , .Are things different in the light of day? A time study of internal medicine house staff days.Am J Med.1993;94(6):654–658.
- , , .Time study of an internship on a university medical service.N Engl J Med.1961;264:439–443.
- , .Time study comparisons of 3 intern programs.J Med Educ.1971;46(2):142–149.
- , , , , .How do house officers spend their nights? A time study of internal medicine house staff on call.N Engl J Med.1989;320(25):1673–1677.
- .The Effect of a Non‐teaching Hospitalist Service in an Academic Hospital Setting: A Comparative Time‐motion and Clinical Outcomes Study. Unpublished Manuscript. Vol2006.
- .A strategy for health care reform—toward a value‐based system.N Engl J Med.2009;361(2):109–112.
- , , .Rehospitalizations among patients in the fee‐for‐service medicare program.N Engl J Med.2009;360(14):1418–1428.
- , .BOOSTing the hospital discharge.J Hosp Med.2009;4(4):209–210.
- , , , .A time‐motion study to evaluate the impact of EMR and CPOE implementation on physician efficiency.J Healthc Inf Manag.2008;22(4):31–37.
- , , , , .The ecology of medical care revisited.N Engl J Med.2001;344(26):2021–2025.
Time‐motion studies, introduced by Frederick W. Taylor in the 1880s,1 have been widely implemented across the business world; a Google search of time‐motion study returns approximately 32 million results. Such studies continuously document how workers spend their time and then use this information to identify and eliminate inefficient practices. Work‐sampling is a similar methodology introduced by L.H.C. Tippett in 1935.2 Work‐sampling utilizes a trained observer to document activities at predetermined or random intervals of time. Given a large enough number of observations, this method can be comparable to the continuous observation method used in time‐motion studies.3
Healthcare has begun to utilize these time‐study methodologies to evaluate the activities of physicians and nurses. Researchers have successfully used time‐study methodology in the emergency department, intensive care unit, and ambulatory and surgical settings in the U.S. and around the world to better understand physician activities and to design and assess interventions to improve efficiency.49 Hospitals are also eager to enhance efficiency in the inpatient setting given the current economic environment. Hospitalizations account for over a third of healthcare costs in the United States, making them an attractive target for cost‐cutting measures.10 Acknowledging that healthcare expenditures cannot continue to rise,11 insurers, particularly the Centers for Medicare and Medicaid Services (CMS), increasingly seek to reduce payments to hospitals.12 Compounding these pressures, a major supply of relatively inexpensive labor shrank with the decision by the Accreditation Council for Graduate Medicine Education (ACGME) to restrict the number of hours residents are allowed to work. Efficiency concerns gain new urgency as hospitals scramble to cover their patient loads with reduced physician availability.13
We undertook a systematic review of time‐motion and work‐sampling studies performed in the hospital setting to better understand the available literature describing the activities of physicians caring for hospitalized patients. An additional goal of this review was to determine the extent of available time‐flow literature describing the activity of hospitalists. The hospitalist movement provided one viable solution to the gap between demand for hospital patient care and the reduced supply of available physicianstypically primary care physicians in community hospitals and residents in teaching hospitals.14 Hospital medicine is the fastest‐growing specialty in the history of American medicine.15 More than half of American hospitals now have hospital medicine programs with a total of greater than 25,000 hospitalists in the U.S.15 This popularity has been driven by hospitalists' ability to increase efficiency through decreasing overall cost and length of stay for patients without increasing readmission rates or reducing primary care physician satisfaction.1619 However, exactly how hospitalists accomplish this increase in efficiency is still the subject of debate. One time‐motion study provides a glimpse into the activities of hospitalists at an academic urban hospital,20 but may not be applicable to many other hospitals.
Methods
Data Sources
With assistance from a medical librarian, we searched for English‐language articles published between 1965 and June 2009 using the MEDLINE (
Study Selection
We selected articles that met the following criteria: (1) explicit use of time‐motion methodology or work‐sampling performed via direct observation; (2) study populations including physicians, medical residents, or interns; (3) performance sites on an inpatient hospital ward (ie, not outpatient within the hospital, emergency room (ER), or operating room (OR)); and (4) observation of at least half of a shift. Titles and abstracts of the retrieved citations were first reviewed to identify studies that could potentially meet our criteria. Full‐text versions of the selected articles were then retrieved and analyzed by at least 2 of 4 authors (V.F., K.E., D.M., and M.T.) to determine the final list of articles. Articles that failed to provide sufficient information for one or more criteria were excluded.
Data Extraction
Each article was independently reviewed by at least 2 of 3 authors (V.F., D.M., and M.T.) using a standardized data abstraction form. The form included the following categories: sample population, sample size, hospital type, data collection tool type, time‐motion/observation duration, key categories of activity, and key results. If an article included additional data beyond the scope of this review (eg, data from surgical residents in the OR as well as internal medicine residents) only the qualifying portion of the study was included. Disagreements were resolved through discussion and consensus. Data were then compiled into tables.
Results
Our database search yielded 4270 potential articles. We then reviewed the title and abstract of each of these articles to identify studies that evaluated physicians, were performed on a hospital ward, and explicitly used time‐motion or direct‐observation work‐sampling methodology. For articles lacking an abstract but having a relevant title, we obtained the full text to determine eligibility for additional review. Sixty‐eight articles from this original search were selected for full‐text review. Ten of these articles met the selection criteria. Most of the articles excluded in this step were either conducted in an outpatient OR or ER setting, or used self‐report data instead of direct‐observation data. A secondary search using the reference lists of all obtained articles as well as consultation with experts in the field yielded 11 additional articles of interest. Three of these 11 articles were found to meet our criteria, bringing the total to 13 articles for review (Fig. 1).
These 13 articles included several types of physicians in their samples. Eleven included interns,2131 7 included residents,2123, 2628, 31 and 4 included attending physicians20, 23, 26, 32 (Table 1). Six articles included more than 1 type of subject.2123, 26, 28, 31 The main focus of these articles also varied. Nine of the 13 studies were designed to simply describe how residents, physicians and nurses spend their time.20, 2227, 29, 31 Three studies were primarily concerned with comparing groups from different intern programs, residency rotations, hospital types, or shifts.28, 30, 32 The remaining study attempted to quantify the amount of time physicians spent on tasks that could be performed by non‐physician staff.21 Only 2 articles evaluated hospitalists,20, 32 and we found no articles studying hospitalists in a community, non‐teaching setting. The studies were performed as early as 1961 and as recently as 2009. Just 5 of the 13 articles were published within the last 10 years. 0
| Reference (Year) | Type of Hospital | Data Collection Tool | Direct/Indirect Care Estimates | Key Activities Reported and Percentage of Time Spent on Each, and Other Results |
|---|---|---|---|---|
| ||||
| Ammenwerth and Spotl (2009) | Academic | Work sampling: paper and stopwatch | Direct care 27.5%; indirect care 62.8% | Documentation tasks 26.6%; direct care 27.5%; communication 36.2%; other tasks 9.7%. Approximately 16% of documentation time was administrative documentation. |
| Arthurson et al. (1976) | Academic | Paper and stopwatch | Direct care 40.8%; indirect care 45.5% | Medical intern: patient care 40.8%; clerical 25.5%; telephone 10%; professional discussion 10.5%; transit/waiting 6.5%, personal 7% |
| Gabow et al. (2006) | Academic | Paper and stopwatch with pedometer | Direct care 19.5%; indirect care: 32% | Attend to/assess patient 17%; charting 9.5%; consult with MD/nurse 9.5%; downtime 6.5%; educational activity 2.5%; family interaction 0.5%; paging/phone 3.5%; procedure 1.5%; review films/laboratory results 9%; rounds 15.5%; sleep 21.5%; travel 3.5% |
| Gillanders et al. (1971) | Academic | Paper and stopwatch | Direct care 19%; indirect care 42.5% | Individual interaction 14.5%; nonverbal communication 20.5%; procedures 10.0%; laboratory work 3.5%; interpersonal communication 18.5%; rounds 9%; direction and supervision 0.5%; nonmedical talk 2%; education 8.5%; ancillary activities 5.5%; personal 7% |
| Knickman et al. (1992) | Academic | Paper and stopwatch | Direct care 8.5%; indirect care 37.7% | Education 20.7%; information gathering 13.7%; personal 13.3%; testing 12%; consulting 12%; documenting 9.8%; transit 8.2%; procedures 5.4%; interacting with patients 3.1%; administration 1.8%. 46.7% of residents' time was spent on tasks that required a physician. |
| Lurie et al. (1989) | Academic | Paper and stopwatch | Direct care 17.4%; indirect care 39.3% | Procedures 3%; patient evaluation 20%; communication 27%; basic 40%; miscellaneous 10%. On average, doctors were interrupted 9 minutes into an H&P, got 230 minutes of sleep per night, and slept 59 minutes before being woken up by some interruption. |
| Magnusson et al. (1998) | Academic | Paper and stopwatch | Could not be determined | Clinical 54%; education 28%; personal 18%. The 3 specialties did not differ significantly in time spent on these categories except for education time: emergency 24%; internal 28%; surgery 18%. |
| Malkenson (unpublished data) | 1 Community; 1 Academic | Paper and stopwatch | Academic: direct care 19%; indirect care 56%. Community: direct care 25%; indirect care 55%. | Direct patient care (25% community, 19% academic); indirect patient care (55% community, 56% academic); personal time (4% community, 6% academic); travel time (10% community, 10% academic); other activities (10% community, 13% academic) |
| Nerenz et al. (1990) | Academic | Work sampling: paper and stopwatch | Direct care 18.9%; indirect care could not be determined | Interns averaged 21 pages over 30 hours of observation, and slept an average of 2.5 hours with 2 interruptions. Attending physicians interacted with the interns for an average of 139 minutes per shift. |
| O'Leary et al. (2006) | Academic | Paper and stopwatch | Direct care 18%; indirect care 69% | Indirect patient care occupied 69% of hospitalists' time. Indirect care included: documentation 37%; communication 35%; reviewing results 21%; orders 7%. Direct care occupied 18%, and included: history and physical 18%; follow‐up visits 53%; family meetings 13%; discharge instructions 16%. Remaining time was spent on personal activities 4%; professional development 3%; education 3%; travel 3%. |
| Parenti et al. (1993) | Academic | Paper and stopwatch | Interns: direct care 39%; indirect care 51%. Residents: direct care 40%; indirect care 47%. | Interns: procedures 4%; patient evaluation 35%; communication 42%; basics 11%; miscellaneous 8%. Residents: procedures 2%; patient evaluation 38%; communication 35%; basics 12%; miscellaneous 13%. |
| Payson et al. (1961) | Academic | Paper and stopwatch | Could not be determined | Communication with staff took up the largest amount of time. Remaining time was evenly distributed between the categories of personal activities, ancillary duties, patient and relative contact, and intravenous therapy. Overall percentages of time were not reported. |
| Westbrook et al. (2008) | Academic | PDA | Attending physicians: direct care 18.0%; indirect care 63.5%. Residents: direct care 16.0%; indirect care 66.7%. Interns: direct care 11%; indirect care 85%. | Communication 33%; social activities 17%; indirect care 17%; direct care 15%; documentation 9%; medication tasks 7%; supervision or education 7%; transit 6%; discharge summary 5%; administrative tasks 2%; answering pager 0.8% |
Methodological quality also varied. Of the 11 time‐motion studies, the total amount of time subjects were observed in the studies ranged from 48 to 720 hours, with a mean of 254 hours. The number of subjects observed varied between 1 and 35, with a mean of 12 subjects. Average time observed per subject ranged from 8 hours to 113.5 hours, with a median of 26 hours. Six of the 11 studies observed subjects continuously for an entire shift.22, 25, 2831 Four studies covered an entire shift over the course of several days, using shorter observation periods.20, 21, 26, 27 One study observed subjects for only part of a shift.32 Ten of the time‐flow articles reported collecting data with a stopwatch and paper‐and‐pencil form2022, 25, 2732 and 1 used a handheld computer system.26 Two studies utilized work‐sampling techniques, both using paper‐and‐pencil forms to collect data during a full shift. Ammenwerth and Spotl23 studied 8 physicians for a total of 40 hours, collecting 5500 observation points. Nerenz et al.24 studied 11 interns for a total of approximately 330 hours, and collected 7858 observations. Both of these studies collected sufficiently large samples to satisfy the power requirements described by Sittig.3
Study sites were relatively uniform. Only one study evaluated physicians at both a teaching community hospital and an academic hospital.32 The remaining 12 observed physicians only in academic hospitals. Two studies were conducted in Australia,25, 26 1 in Austria,23 and the remaining 10 were conducted in the United States.
To provide a rough estimate of the amount of time physicians spend on direct care activities at the patients' bedside vs. indirect care activities, we attempted to calculate these figures for each article using a common definition. For the sake of consistency and to allow us to include as many studies as possible, we used the broadest definition of indirect care found among the articles, which included activities such as professional communication, medication review, documentation, and reviewing test results. Three articles did not provide enough information to calculate these values.24, 27, 29
All 10 articles that did provide sufficient information found that indirect care activities consumed the greater portion of time. Indirect care occupied an average of 50% of physicians' time, ranging from 32% to 69%. Direct care, on the other hand, accounted for an average of 23% of physicians' time, and ranged from 8.5% to 41%. Three articles that included data specific to attending physicians or hospitalists demonstrated an even larger disparity between direct and indirect care.20, 26, 32 In these articles, physicians spent an average of 19% of their time on direct care and 64% on indirect care, suggesting that senior physicians in the academic setting spend less time with patients and more time on care activities away from patients.
Four studies recorded various forms of interruptions of work flow.20, 24, 26, 31 Lurie et al.31 found that interns and residents were interrupted approximately 9 minutes into the performance of every history and physical (H&P). Westbrook et al.26 found that residents were interrupted on average every 21 minutes regardless of the task being performed. Nerenz et al.24 reported that interns received an average of 21 pages over the course of a 30 hour shift. They also noted that, on average, 12 of these pages were merely transient distractions, but 9 pages required some action on the part of the intern.24 Finally, O'leary et al.20 found that hospitalists received an average of 3.5 pages an hour and that 7% of their day was spent returning pages. Two articles recorded events of multitasking. Westbrook et al.26 found that 20% of physicians' time was spent performing more than one activity. Similarly, O'Leary et al.20 reported that 21% of hospitalists' time was spent multitasking. Neither study reported the types of activity performed during multitasking.
One article considered the amount of time physicians spend performing tasks that could be performed by non‐physician staff. Knickman et al.21 reported that in the traditional physician‐centered model of care, approximately 19% of a resident's time is spent on tasks that could be performed by non‐physician staff. They suggested that switching to a mid‐level provider model of care could significantly reduce the impact of resident work hour restrictions.21
Parenti and Lurie28 examined internal medicine residents on both day and night shifts.31 These authors concluded that residents on the night shift have an easier time because they see fewer patients and have more down time than residents on day shifts.28 Additionally, Lurie et al. found that residents got an average of 230 minutes (3.8 hours) of sleep per night and slept, on average, 59 minutes before being awakened by an interruption.31 However, these studies preceded work hour regulations.
Discussion
This systematic review of time studies set in the hospital, the first of which we are aware, revealed a sizable number (13) of articles evaluating physicians. However, the studies almost exclusively focused on academic hospitals (92%) and the majority (69%) analyzed only the activities of physicians in training. The studies were diverse in their methodology, subject populations, and, not surprisingly, their results. Even those studies designed simply to document the activities of physicians in the hospital report widely varying findings. For example, the percentage of time physicians spent on direct‐care activities varied from 8.5% to 41%, while indirect‐care time varied from 32% to 69%. These results likely reflect the heterogeneity of the hospital environment and differences among hospitals, as well as variations in the design and quality of the studies.
Despite this variability, a few observations appear consistent. Physicians perform many tasks that may be readily accomplished by less costly staff. This could partly explain why far more time is spent on activities indirectly related to a patient's care (eg, documentation and coordinating tests), instead of directly interacting with hospitalized patients. Additionally, physicians caring for hospitalized patients experience multiple interruptions and must regularly multitask. Unfortunately, very little research in the hospital setting has evaluated the impact of these interruptions on work efficiency, medical errors, or adverse events.
With the intense national interest in improving the value of healthcare by both enhancing quality and reducing costs, further efforts to optimize the efficiency of hospitalists will be needed.33 As hospitals and hospitalists aim to enhance the efficiency of care delivery to hospitalized patients, and also are increasingly asked to expend time to optimize the hospital discharge process to reduce readmissions,34, 35 time‐motion and work‐sampling studies can provide guidance.
One of the principal difficulties in aggregating data from time studies is the variety of approaches used to analyze activities. Lack of standardization in the approach to assessing physician activities (eg, use of a stopwatch with paper documentation vs. computer) and dissimilar categorizations inhibit efforts to summarize the findings across studies. Categories of activity were generally selected with the specific goals of the study in mind, instead of utilizing a readily available standardized approach. Moreover, the lack of detailed definitions of categories and sub‐categories, along with data for each, produces a significant barrier to comparison. Based on this review of available literature and our own experience conducting time‐motion evaluation of hospitalists, we propose the basic activity categorization in Table 2. Future researchers would be able to more readily compare their findings to other time‐motion studies by utilizing such a standardized approach to categorizing physician activities. Adding custom sub‐categories within this basic set would allow researchers to explore more specific time‐flow questions while maintaining comparability of most data. Electronic data collection tools (eg, handheld or tablet computers) could also facilitate the collection of more detailed and accurate data to increase study reliability.
| Primary | Secondary | Tertiary |
|---|---|---|
| Direct patient care | Daily rounds | Evaluation |
| Education | ||
| Admission history and physical | ||
| Consultation history and physical | ||
| Discharge | Evaluation | |
| Education | ||
| Procedures | ||
| Indirect care | Reviewing test results | |
| Documentation | Orders | |
| History and physical | ||
| Progress notes | ||
| Discharge paperwork | ||
| Communication | Paging | |
| Patient relatives | ||
| Other physicians | ||
| Nurse | ||
| Ancillary staff | ||
| Other | Education | |
| Transit/travel | ||
| Personal (eg, eating, restroom) | ||
| Miscellaneous |
Our systematic review is limited in its scope, as we focused only on the activities of physicians working in the hospital. Our exclusion criteria also eliminated several more focused time studies that evaluated only one small part of a physician's workflow, such as Amusan et al.'s36 evaluation of EMR and CPOE implementation during morning rounds. The available literature itself is also lacking in several important ways. Much of the literature is now limited by its age. The constant advance of medical technology, changes in work hour regulations, and new reimbursement structures have all affected physician workflow, and likely contributed to the variability of time study findings. Additionally, the available literature focuses almost exclusively on academic hospitals and teaching services. All but 1 of the studies collected data exclusively in academic hospitals, despite the fact that more than 90% of hospital care delivery in the U.S. occurs in a non‐academic hospital setting.20, 37 Just 1 study evaluated the activity of hospitalists directly caring for patients without assistance from residents.20 The significantly different workforce composition in community hospitals could mean that most findings are not relevant to the vast majority of U.S. hospitals. For example, the studies documenting that physicians in training (ie, residents) perform many activities that could be performed by a non‐physician are likely not applicable to the community hospital setting. Thus, additional research is needed to better understand how hospitalists can deliver care more efficiently, particularly in the community hospital setting and in the current technological and structural environment of healthcare.
This systematic review of the literature provides insight into published studies attempting to evaluate physician activities in the hospital through time‐motion and work‐sampling studies. Published research to date appears extremely variable in quality, limiting our ability to draw firm conclusions. However, it appears that hospital‐based physicians spend most of their time not interacting with patients, and non‐physician staff could readily complete a sizable portion of their tasks. Given the necessity for multitasking by hospitalists, better documentation of its frequency and impact is needed, as well as information about the types of tasks performed while multitasking, which has yet to be reported. Additionally, the effect of interruptions (including, but not limited to paging) needs further evaluation.
When properly performed, time‐study methodology represents a powerful approach to understanding the activities of hospitalists and how we might reengineer hospital care delivery to be more efficient. Efforts to standardize healthcare delivery and integrate health information technology could benefit dramatically from detailed information regarding physician activities and empirical testing of quality improvement initiatives. Future research using time‐motion or work‐sampling methodology should be careful to define and report categories of activity with enough detail that comparisons with other studies are possible.
Acknowledgements
The authors acknowledge the assistance of Linda O'Dwyer, MA MSLIS, research librarian at the Northwestern University Feinberg School of Medicine for her assistance with the search of the medical literature.
- .Motion and Time Study: Design and Measurement of Work.6th ed.New York:Wiley;1968.
- .Statistical methods in textile research. Uses of the binomial and poissant distributions.J Textile Inst Trans.1935;26:51–55.
- .Work‐sampling: a statistical approach to evaluation of the effect of computers on work patterns in the healthcare industry.Proc Annu Symp Comput Appl Med Care.1992:537–541.
- , , , , , .Time motion study in a pediatric emergency department before and after computer physician order entry.Ann Emerg Med.2009;53(4):462–468, e461.
- , , , .A “time‐and‐motion” study of endoscopic practice: strategies to enhance efficiency.Gastrointest Endosc.2008;68(6):1043–1050.
- , , , , , .Workflow in intensive care unit remote monitoring: A time‐and‐motion study.Crit Care Med.2007;35(9):2057–2063.
- , , , et al.Workflow analysis of medical staff in surgical wards based on time‐motion study data.Jpn Hosp.2008(27):75–80.
- , , , , , .General and visceral surgery practice in German hospitals: a real‐time work analysis on surgeons' work flow.Langenbecks Arch Surg.2010;395(1):81–87.
- , , , et al.Electronic health records in specialty care: a time‐motion study.J Am Med Inform Assoc.2007;14(5):609–615.
- , , , .National health spending in 2007: slower drug spending contributes to lowest rate of overall growth since 1998.Health Aff (Millwood).2009;28(1):246–261.
- , .The challenge of rising health care costs–a view from the Congressional Budget Office.N Engl J Med.2007;357(18):1793–1795.
- .Nonpayment for performance? Medicare's new reimbursement rule.N Engl J Med.2007;357(16):1573–1575.
- , .Hospitalists in teaching hospitals: opportunities but not without danger.J Gen Intern Med.2004;19:392–393.
- .The future of hospital medicine: evolution or revolution?Am J Med.2004;117:446–450.
- , .The evolution and future of hospital medicine.Mt Sinai J Med.2008;75(5):418–423.
- , , , , , .Outcomes of care by hospitalists, general internists, and family physicians.[see comment].N Engl J Med.2007;357(25):2589–2600.
- , .The hospitalist movement 5 years later.JAMA.2002;287:487–494.
- , .The impact of hospitalists on the cost and quality of inpatient care in the United States: a research synthesis.Med Care Res Rev.2005;62:379–406.
- .Hospitalists and the hospital medicine system of care are good for patient care.Arch Intern Med.2008;168(12):1254–1256; discussion 1259–1260.
- , , .How hospitalists spend their time: insights on efficiency and safety.J Hosp Med.2006;1(2):88–93.
- , , , , .The potential for using non‐physicians to compensate for the reduced availability of residents.Acad Med.1992;67(7):429–438.
- , , , , , .Observations of residents' work activities for 24 consecutive hours: Implications for workflow redesign.Acad Med.2006;81(8):766–775.
- , .The time needed for clinical documentation versus direct patient care. A work‐sampling analysis of physicians' activities.Methods Inf Med.2009;48(1):84–91.
- , , , et al.The on‐call experience of interns in internal medicine. Medical Education Task Force of Henry Ford Hospital.Arch Intern Med.1990;150(11):2294–2297.
- , , .What does the intern do?Med J Aust.1976;1(3):63–65.
- , , , .All in a day's work: an observational study to quantify how and with whom doctors on hospital wards spend their time.Med J Aust.2008;188(9):506–509.
- , , , .Resident educational time study: a tale of three specialties.Acad Emerg Med.1998;5(7):718–725.
- , .Are things different in the light of day? A time study of internal medicine house staff days.Am J Med.1993;94(6):654–658.
- , , .Time study of an internship on a university medical service.N Engl J Med.1961;264:439–443.
- , .Time study comparisons of 3 intern programs.J Med Educ.1971;46(2):142–149.
- , , , , .How do house officers spend their nights? A time study of internal medicine house staff on call.N Engl J Med.1989;320(25):1673–1677.
- .The Effect of a Non‐teaching Hospitalist Service in an Academic Hospital Setting: A Comparative Time‐motion and Clinical Outcomes Study. Unpublished Manuscript. Vol2006.
- .A strategy for health care reform—toward a value‐based system.N Engl J Med.2009;361(2):109–112.
- , , .Rehospitalizations among patients in the fee‐for‐service medicare program.N Engl J Med.2009;360(14):1418–1428.
- , .BOOSTing the hospital discharge.J Hosp Med.2009;4(4):209–210.
- , , , .A time‐motion study to evaluate the impact of EMR and CPOE implementation on physician efficiency.J Healthc Inf Manag.2008;22(4):31–37.
- , , , , .The ecology of medical care revisited.N Engl J Med.2001;344(26):2021–2025.
