User login
Appropriate Reconciliation of Cardiovascular Medications After Elective Surgery and Postdischarge Acute Hospital and Ambulatory Visits
Medication reconciliation at hospital discharge is a critical component of the posthospital transition of care.1 Effective reconciliation involves a clear process for documenting a current medication list, identifying and resolving discrepancies, and then documenting decisions and instructions around which medications should be continued, modified, or stopped.2 Existing studies3-5 suggest that medication discrepancies are common during hospital discharge transitions of care and lead to preventable adverse drug events, patient disability, and increased healthcare utilization following hospital discharge, including physician office visits, emergency department (ED) visits, and hospitalizations.6-8
While the majority of studies of medication discrepancies have been conducted in general medical patients, few have examined how gaps in discharge medication reconciliation might affect surgical patients.9,10 Two prior studies9,10 suggest that medication discrepancies may occur more frequently for surgical patients, compared with medical patients, particularly discrepancies in reordering home medications postoperatively, raising patient safety concerns for more than 50 million patients hospitalized for surgery each year.11 In particular, little is known about the appropriate discharge reconciliation of chronic cardiovascular medications, such as beta-blockers, renin-angiotensin system inhibitors, and statins in surgical patients, despite perioperative practice guidelines recommending continuation or rapid reinitiation of these medications after noncardiac surgery.12 Problems with chronic cardiovascular medications have been implicated as major contributors to ED visits and hospitalizations for adverse drug events,13,14 further highlighting the importance of safe and appropriate management of these medications.
To better understand the current state and impact of postoperative discharge medication reconciliation of chronic cardiovascular medications in surgical patients, we examined (1) the appropriate discharge reconciliation of 4 cardiovascular medication classes, and (2) the associations between the appropriate discharge reconciliation of these medication classes and postdischarge acute hospital and ambulatory visits in patients hospitalized for elective noncardiac surgery at an academic medical center.
METHODS
Study Design and Patient Selection
We performed a retrospective analysis of data collected as part of a cohort study of hospitalized surgical patients admitted between January 2007 and December 2011. The original study was designed to assess the impact of a social marketing intervention on guideline-appropriate perioperative beta-blocker use in surgical patients. The study was conducted at 1 academic medical center that had 2 campuses with full noncardiac operative facilities and a 600-bed total capacity. Both sites had preoperative clinics, and patients were recruited by review of preoperative clinic records. Institutional review boards responsible for all sites approved the study.
For this analysis, we included adults (age >18 years) undergoing elective noncardiac surgery, who were expected to remain hospitalized for at least 1 day and were taking antiplatelet agents (aspirin, aspirin-dipyridamole, or clopidogrel), beta-blockers, renin-angiotensin system inhibitors (angiotensin-converting-enzyme inhibitors or angiotensin-receptor blockers), or statin lipid-lowering agents.
Data Collection
Data Sources. We collected data from a structured review of medical records as well as from discharge abstract information obtained from administrative data systems. Data regarding patient demographics (age, sex, and race/ethnicity), medical history, preoperative cardiovascular medications, surgical procedure and service, and attending surgeon were obtained from a medical record review of comprehensive preoperative clinic evaluations. Data regarding complications during hospitalization were obtained from medical record review and administrative data (Supplement for International Classification of Diseases, Ninth Revision codes).15 Research assistants abstracting data were trained by using a comprehensive reference manual providing specific criteria for classifying chart abstraction data. Research assistants also were directly observed during initial chart abstractions and underwent random chart validation audits by a senior investigator to ensure consistency. Any discrepancies in coding were resolved by consensus among senior investigators.
Definition of Key Predictor: Appropriate Reconciliation. We abstracted discharge medication lists from the electronic medical record. We defined the appropriate reconciliation of cardiovascular medications at discharge as documentation in discharge instructions, medication reconciliation tools, or discharge summaries that a preadmission cardiovascular medication was being continued at discharge, or, if the medication was not continued, documentation of a new contraindication to the medication or complication precluding its use during hospitalization. Medication continuity was considered appropriate if it was continued at discharge irrespective of changes in dosage. By using this measure for individual medications, we also assessed appropriate reconciliation as an “all-or-none” complete versus incomplete measure (appropriate reconciliation of all preoperative cardiovascular medication classes the patient was taking).16
Definition of Outcomes. Our coprimary outcomes were acute hospital visits (ED visits or hospitalizations) and unplanned ambulatory visits (primary care or surgical) at 30 days after surgery. Postoperative ambulatory visits that were not planned prior to surgery were defined as unplanned. Outcomes were ascertained by patient reports during follow-up telephone questionnaires administered by trained research staff and verified by medical record review.
Definition of Covariates. Using these data, we calculated a Revised Cardiac Risk Index (RCRI) score,17 which estimates the risk of perioperative cardiac complications in patients undergoing surgery. Through chart abstraction data supplemented by diagnosis codes from administrative data, we also constructed variables indicating occurrences of postoperative complications anytime during hospitalization that might pose contraindications to continuation of the 4 cardiovascular medication classes studied. For example, if a chart indicated that the patient had an acute rise in creatinine (elevation of baseline creatinine by 50% or absolute rise of 1 mg/dL in patients with baseline creatinine greater than 3 mg/dL) during hospitalization and a preoperative renin-angiotensin system inhibitor was not prescribed at discharge, we would have considered discontinuation appropriate. Other complications we abstracted were hypotension (systolic blood pressure less than 90 mmHg) for beta-blockers and renin-angiotensin system inhibitors, bradycardia (heart rate less than 50 bpm) for beta-blockers, acute kidney injury (defined above) and hyperkalemia for renin-angiotensin system inhibitors, and bleeding (any site) for antiplatelet agents.
Statistical Analysis
We used χ2 and Kruskal-Wallis tests to compare baseline patient characteristics. To assess associations between appropriate medication reconciliation and patient outcomes, we used multilevel mixed-effects logistic regression to account for the clustering of patients by the attending surgeon. We adjusted for baseline patient demographics, surgical service, the number of baseline cardiovascular medications, and individual RCRI criteria. We constructed separate models for all-or-none appropriate reconciliation and for each individual medication class.
As a sensitivity analysis, we constructed similar models by using a simplified definition of appropriate reconciliation based entirely on medication continuity (continued or not continued at discharge) without taking potential contraindications during hospitalization into account. For complete versus incomplete reconciliation, we also constructed models with an interaction term between the number of baseline cardiovascular medications and appropriate medication reconciliation to test the hypothesis that inappropriate reconciliation would be more likely with an increasing number of preoperative cardiovascular medications. Because this interaction term was not statistically significant, we did not include it in the final models for ease of reporting and interpretability. We performed all statistical analyses using Stata 14 (StataCorp, LLC, College Station, Texas), and used 2-sided statistical tests and a P value of less than .05 to define statistical significance.
RESULTS
Patient Characteristics
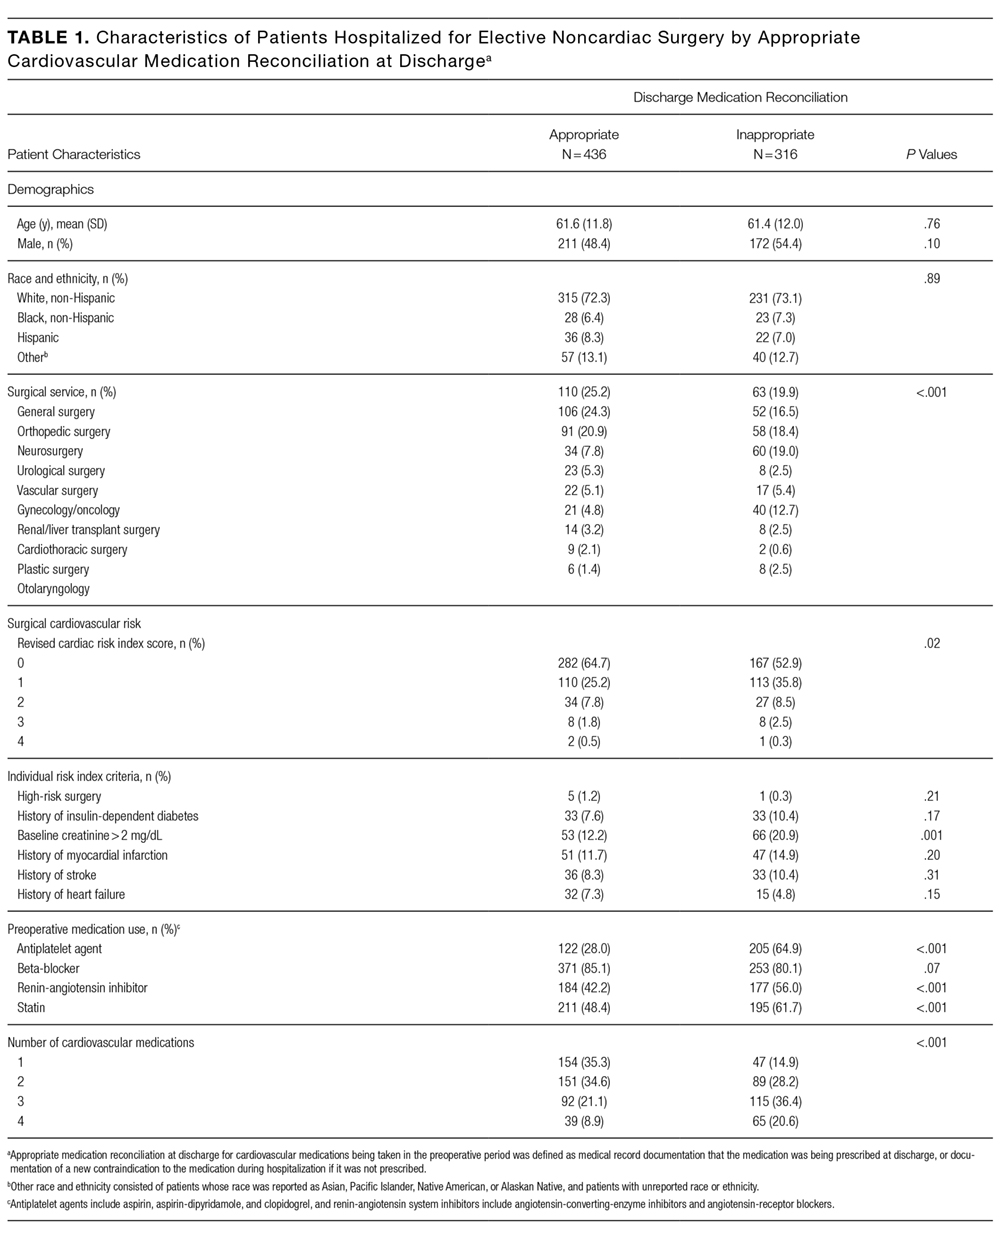
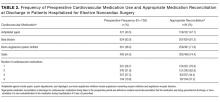
A total of 849 patients were enrolled, of which 752 (88.6%) were taking at least 1 of the specified cardiovascular medications in the preoperative period. Their mean age was 61.5; 50.9% were male, 72.6% were non-Hispanic white, and 89.4% had RCRI scores of 0 or 1 (Table 1). The majority (63.8%) were undergoing general surgery, orthopedic surgery, or neurosurgery procedures. In the preoperative period, 327 (43.5%) patients were taking antiplatelet agents, 624 (83.0%) were taking beta-blockers, 361 (48.0%) were taking renin-angiotensin system inhibitors, and 406 (54.0%) were taking statins (Table 2). Among patients taking antiplatelet agents, 271 (82.9%) were taking aspirin alone, 21 (6.4%) were taking clopidogrel alone, and 35 (10.7%) were taking dual antiplatelet therapy with aspirin and clopidogrel. Nearly three-quarters of the patients (551, 73.3%) were taking medications from 2 or more classes, and the proportion of patients with inappropriate reconciliation increased with the number of preoperative cardiovascular medications.
Patients with and without appropriate reconciliation of all preoperative cardiovascular medications were similar in age, sex, and race/ethnicity (Table 1). Patients with inappropriate reconciliation of at least 1 medication were more likely to be on the urology and renal/liver transplant surgical services, have higher RCRI scores, and be taking antiplatelet agents, statins, renin-angiotensin system inhibitors, and 3 or more cardiovascular medications in the preoperative period.
Appropriate Medication Reconciliation
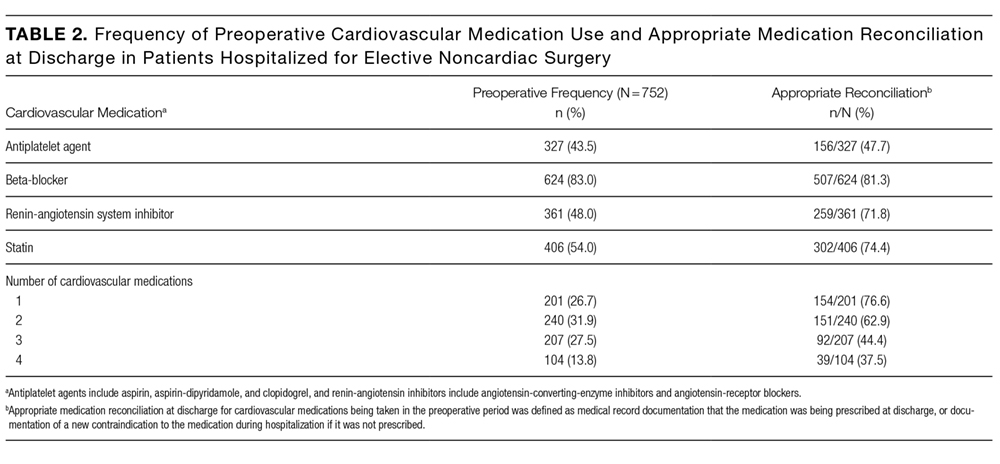
Four hundred thirty-six patients (58.0%) had their baseline cardiovascular medications appropriately reconciled. Among all patients with appropriately reconciled medications, 1 (0.2%) had beta-blockers discontinued due to a documented episode of hypotension; 17 (3.9%) had renin-angiotensin system inhibitors discontinued due to episodes of acute kidney injury, hypotension, or hyperkalemia; and 1 (0.2%) had antiplatelet agents discontinued due to bleeding. For individual medications, appropriate reconciliation between the preoperative and discharge periods occurred for 156 of the 327 patients on antiplatelet agents (47.7%), 507 of the 624 patients on beta-blockers (81.3%), 259 of the 361 patients on renin-angiotensin system inhibitors (71.8%), and 302 of the 406 patients on statins (74.4%; Table 2).
Associations Between Medication Reconciliation and Outcomes
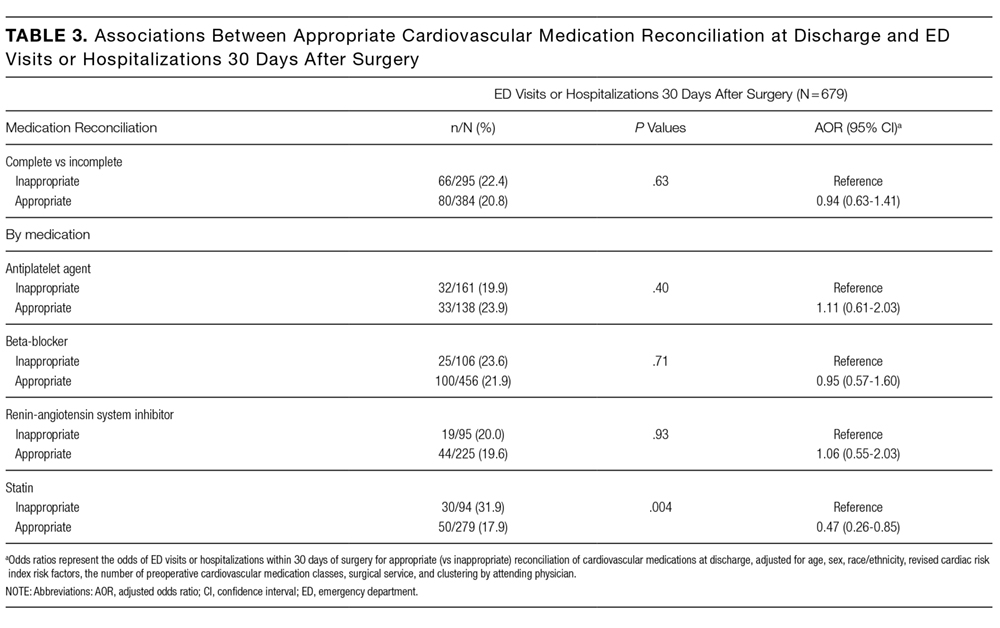
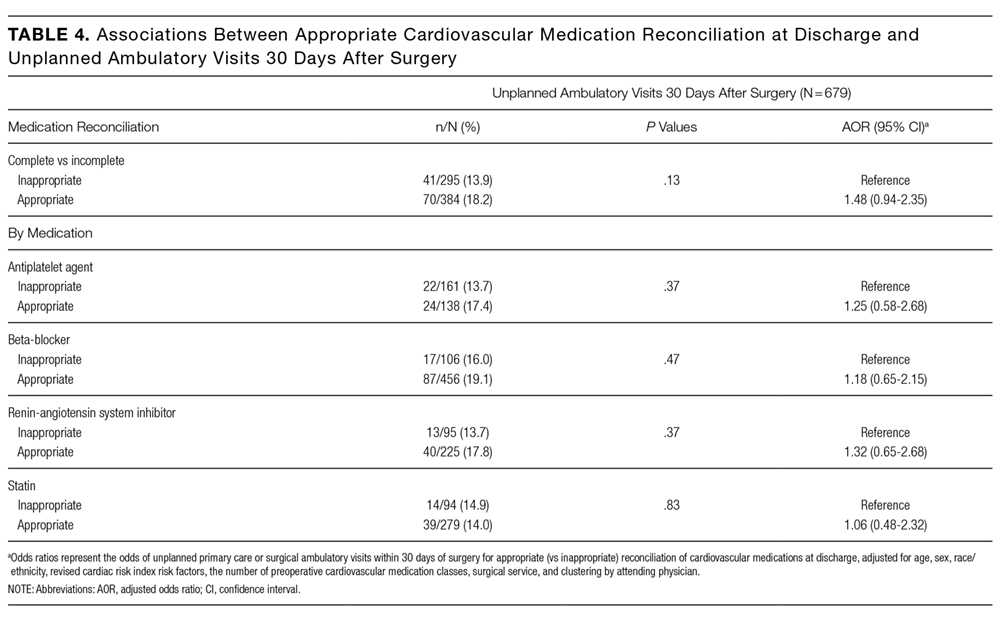
Thirty-day outcome data on acute hospital visits were available for 679 (90.3%) patients. Of these, 146 (21.5%) were seen in the ED or were hospitalized, and 111 (16.3%) were seen for an unplanned primary care or surgical outpatient visit at 30 days after surgery. Patients with incomplete outcome data were more likely to have complete medication reconciliation compared with those with complete outcome data (71.2% vs 56.6%, P = 0.02). As shown in Table 3, the proportion of patients with 30-day acute hospital visits was nonstatistically significantly lower in patients with complete medication reconciliation (20.8% vs 22.4%, P = 0.63) and the appropriate reconciliation of beta-blockers (21.9% vs 23.6%, P = 0.71) and renin-angiotensin system inhibitors (19.6% vs 20.0%, P = 0.93), and nonsignificantly higher with the appropriate reconciliation of antiplatelet agents (23.9% vs 19.9%, P = 0.40). Acute hospital visits were statistically significantly lower with the appropriate reconciliation of statins (17.9% vs 31.9%, P = 0.004).
Sensitivity Analysis
Overall, 430 (57.2%) patients had complete cardiovascular medication continuity without considering potential contraindications during hospitalization. Associations between medication continuity and acute hospital and ambulatory visits were similar to the primary analyses.
DISCUSSION
In this study of 752 patients hospitalized for elective noncardiac surgery, we found significant gaps in the appropriate reconciliation of commonly prescribed cardiovascular medications, with inappropriate discontinuation ranging from 18.8% to 52.3% for individual medications. Unplanned postdischarge healthcare utilization was high, with acute hospital visits documented in 21.5% of patients and unplanned ambulatory visits in 16.3% at 30 days after surgery. However, medication reconciliation gaps were not consistently associated with ED visits, hospitalizations, or unplanned ambulatory visits.
Our finding of large gaps in postoperative medication reconciliation is consistent with existing studies of medication reconciliation in surgical patients.9,10,18 One study found medication discrepancies in 40.2% of postoperative patients receiving usual care and discrepancies judged to have the potential to cause harm (such as the omission of beta-blockers) in 29.9%.9 Consistent with our findings, this study also found that most postoperative medication discrepancies were omissions in reordering home medications, though at a rate somewhat higher than those seen in medical patients at discharge.5 While hospitalization by itself increases the risk of unintentional discontinuation of chronic medications,3 our results, along with existing literature, suggest that the risk for omission of chronic medications is unacceptably high.
We also found significant variation in reconciliation among cardiovascular medications, with appropriate reconciliation occurring least frequently for antiplatelet agents and most frequently for beta-blockers. The low rates of appropriate reconciliation for antiplatelet agents may be attributable to deliberate withholding of antiplatelet therapy in the postoperative period based on clinical assessments of surgical bleeding risk in the absence of active bleeding. Perioperative management of antiplatelet agents for noncardiac surgery remains an unclear and controversial topic, which may also contribute to the variation noted.19 Conversely, beta-blockers demonstrated high rates of preoperative use (over 80% of patients) and appropriate reconciliation. Both findings are likely attributable in part to the timing of the study, which began prior to the publication of the Perioperative Ischemic Evaluation trial, which more definitively demonstrated the potential harms of perioperative beta-blocker therapy.20
Despite a high proportion of patients with discontinuous medications at discharge, we found no associations between the appropriate reconciliation of beta-blockers, renin-angiotensin system inhibitors, and antiplatelet agents and acute hospital or ambulatory visits in the first 30 days after discharge. One explanation for this discrepancy is that, although we focused on cardiovascular medications commonly implicated in acute hospital visits, the vast majority of patients in our study had low perioperative cardiovascular risk as assessed by the RCRI. Previous studies have demonstrated that the benefit of perioperative beta-blocker therapy is predominantly in patients with moderate to high perioperative cardiovascular risk.21,22 It is possible that the detrimental effects of the discontinuation of chronic cardiovascular medications are more prominent in populations at a higher risk of perioperative cardiovascular complications or that complications will occur later than 30 days after discharge. Similarly, while the benefits of continuation of renin-angiotensin system inhibitors are less clear,23 few patients in our cohort had a history of congestive heart failure (6.3%) or coronary artery disease (13.0%), 2 conditions in which the impact of perioperative discontinuation of renin-angiotensin inhibitor or beta-blocker therapy would likely be more pronounced.24,25 An additional explanation for the lack of associations is that, while multiple studies have demonstrated that medication errors are common, the proportion of errors with the potential for harm is much lower, and the proportion that causes actual harm is lower still.5,26,27 Thus, while we likely captured high-severity medication errors leading to acute hospital or unplanned ambulatory visits, we would not have captured medication errors with lower severity clinical consequences that did not result in medical encounters.
We did find an association between the continuation of statin therapy and reduced ED visits and hospitalizations. This finding is supported by previous studies of patients undergoing noncardiac surgery, including 1 demonstrating an association between immediate postoperative statin therapy and reduced in-hospital mortality28 and another study demonstrating an association between postoperative statin therapy and reductions in a composite endpoint of 30-day mortality, atrial fibrillation, and nonfatal myocardial infarction.29 Alternatively, this finding could reflect the effects of unaddressed confounding by factors contributing to statin discontinuation and poor health outcomes leading to acute hospital visits, such as acute elevations in liver enzymes.
Our study has important implications for patients undergoing elective noncardiac surgery and the healthcare providers caring for them. First, inappropriate omissions of chronic cardiovascular medications at discharge are common; clinicians should increase their general awareness and focus on appropriately reconciling these medications, for even if our results do not connect medication discontinuity to readmissions or unexpected clinical encounters, their impact on patients’ understanding of their medications remains a potential concern. Second, the overall high rates of unplanned postdischarge healthcare utilization in this study highlight the need for close postdischarge monitoring of patients undergoing elective surgical procedures and for further research to identify preventable etiologies of postdischarge healthcare utilization in this population. Third, further study is needed to identify specific patient populations and medication classes, in which appropriate reconciliation is associated with patient outcomes that may benefit from more intensive discharge medication reconciliation interventions.
Our study has limitations. First, the majority of patients in this single-center study were at low risk of perioperative cardiovascular events, and our results may not be generalizable to higher-risk patients undergoing elective surgery. Second, discharge reconciliation was based on documentation of medication reconciliation and not on patient-reported medication adherence. In addition, the ability to judge the accuracy of discharge medication reconciliation is in part dependent on the accuracy of the admission medication reconciliation. Thus, although we used preoperative medication regimens documented during preadmission visits to comprehensive preoperative clinics for comparison, discrepancies in these preoperative regimens could have affected our analysis of appropriate discharge reconciliation. Third, inadequate documentation of clinical reasons for discontinuing medications may have led to residual confounding by indication in our observational study. Finally, the outcomes available to us may have been relatively insensitive to other adverse effects of medication discontinuity, such as patient symptoms (eg, angina severity), patient awareness of medications, or work placed on primary care physicians needing to “clean up” erroneous medication lists.
In conclusion, gaps in appropriate discharge reconciliation of chronic cardiovascular medications were common but not consistently associated with postdischarge acute hospital or unplanned ambulatory visits in a relatively low-risk cohort of patients undergoing elective surgery. While appropriate medication reconciliation should always be a priority, further study is needed to identify medication reconciliation approaches associated with postdischarge healthcare utilization and other patient outcomes.
Disclosure
Dr. Lee reports receiving grant support from the Health Resources and Services Administration (T32HP19025). Dr. Vittinghoff reports receiving grant support from the Agency for Healthcare Research and Quality. Dr. Auerbach and Dr. Fleischmann report receiving grant support from the National Institutes of Health. Dr. Auerbach also reports receiving honorarium as Editor-in-Chief of the Journal of Hospital Medicine. Dr. Corbett reports receiving grant and travel support from Simon Fraser University. The remaining authors have no disclosures to report.
1. The Joint Commission. National Patient Safety Goals. 2016; https://www.jointcommission.org/standards_information/npsgs.aspx. Accessed June 21, 2016.
2. Institute for Healthcare Improvement. Medication Reconciliation to Prevent Adverse Drug Events. 2016; http://www.ihi.org/topics/ADEsMedicationReconciliation/Pages/default.aspx. Accessed June 24, 2016.
3. Bell CM, Brener SS, Gunraj N, et al. Association of ICU or hospital admission with unintentional discontinuation of medications for chronic diseases. JAMA. 2011;306(8):840-847. PubMed
4. Coleman EA, Smith JD, Raha D, Min SJ. Posthospital medication discrepancies: prevalence and contributing factors. Arch Intern Med. 2005;165(16):1842-1847. PubMed
5. Wong JD, Bajcar JM, Wong GG, et al. Medication reconciliation at hospital discharge: evaluating discrepancies. Ann Pharmacother. 2008;42(10):1373-1379. PubMed
6. Forster AJ, Clark HD, Menard A, et al. Adverse events among medical patients after discharge from hospital. CMAJ. 2004;170(3):345-349. PubMed
7. Forster AJ, Murff HJ, Peterson JF, Gandhi TK, Bates DW. The incidence and severity of adverse events affecting patients after discharge from the hospital. Ann Intern Med. 2003;138(3):161-167. PubMed
8. Forster AJ, Murff HJ, Peterson JF, Gandhi TK, Bates DW. Adverse drug events occurring following hospital discharge. JGIM. 2005;20(4):317-323. PubMed
9. Kwan Y, Fernandes OA, Nagge JJ, et al. Pharmacist medication assessments in a surgical preadmission clinic. Arch Intern Med. 2007;167(10):1034-1040. PubMed
10. Unroe KT, Pfeiffenberger T, Riegelhaupt S, Jastrzembski J, Lokhnygina Y, Colon-Emeric C. Inpatient Medication Reconciliation at Admission and Discharge: A Retrospective Cohort Study of Age and Other Risk Factors for Medication Discrepancies. Am J Geriatr Pharmacother. 2010;8(2):115-126. PubMed
11. CDC - National Center for Health Statistics. Fast Stats: Inpatient Surgery. http://www.cdc.gov/nchs/fastats/inpatient-surgery.htm. Accessed on June 24, 2016.
12. Fleisher LA, Fleischmann KE, Auerbach AD, et al. 2014 ACC/AHA guideline on perioperative cardiovascular evaluation and management of patients undergoing noncardiac surgery: a report of the American College of Cardiology/American Heart Association Task Force on Practice Guidelines. Circulation. 2014;130(24):e278-e333. PubMed
13. Budnitz DS, Lovegrove MC, Shehab N, Richards CL. Emergency hospitalizations for adverse drug events in older Americans. N Engl J Med. 2011;365(21):2002-2012. PubMed
14. Budnitz DS, Pollock DA, Weidenbach KN, Mendelsohn AB, Schroeder TJ, Annest JL. National surveillance of emergency department visits for outpatient adverse drug events. JAMA. 2006;296(15):1858-1866. PubMed
15. Bozic KJ, Maselli J, Pekow PS, Lindenauer PK, Vail TP, Auerbach AD. The influence of procedure volumes and standardization of care on quality and efficiency in total joint replacement surgery. J Bone Joint Surg Am. 2010;92(16):2643-2652. PubMed
16. Nolan T, Berwick DM. All-or-none measurement raises the bar on performance. JAMA. 2006;295(10):1168-1170. PubMed
17. Lee TH, Marcantonio ER, Mangione CM, et al. Derivation and prospective validation of a simple index for prediction of cardiac risk of major noncardiac surgery. Circulation. 1999;100(10):1043-1049. PubMed
18. Gonzalez-Garcia L, Salmeron-Garcia A, Garcia-Lirola MA, Moya-Roldan S, Belda-Rustarazo S, Cabeza-Barrera J. Medication reconciliation at admission to surgical departments. J Eval Clin Pract. 2016;22(1):20-25. PubMed
19. Devereaux PJ, Mrkobrada M, Sessler DI, et al. Aspirin in patients undergoing noncardiac surgery. N Engl J Med. 2014;370(16):1494-1503. PubMed
20. Devereaux PJ, Yang H, Yusuf S, et al. Effects of extended-release metoprolol succinate in patients undergoing non-cardiac surgery (POISE trial): a randomised controlled trial. Lancet. 2008;371(9627):1839-1847. PubMed
21. Lindenauer PK, Pekow P, Wang K, Mamidi DK, Gutierrez B, Benjamin EM. Perioperative beta-blocker therapy and mortality after major noncardiac surgery. N Engl J Med. 2005;353(4):349-361. PubMed
22. London MJ, Hur K, Schwartz GG, Henderson WG. Association of perioperative beta-blockade with mortality and cardiovascular morbidity following major noncardiac surgery. JAMA. 2013;309(16):1704-1713. PubMed
23. Rosenman DJ, McDonald FS, Ebbert JO, Erwin PJ, LaBella M, Montori VM. Clinical consequences of withholding versus administering renin-angiotensin-aldosterone system antagonists in the preoperative period. J Hosp Med. 2008;3(4):319-325. PubMed
24. Andersson C, Merie C, Jorgensen M, et al. Association of beta-blocker therapy with risks of adverse cardiovascular events and deaths in patients with ischemic heart disease undergoing noncardiac surgery: a Danish nationwide cohort study. JAMA Intern Med. 2014;174(3):336-344. PubMed
25. Yancy CW, Jessup M, Bozkurt B, et al. 2013 ACCF/AHA Guideline for the Management of Heart Failure A Report of the American College of Cardiology Foundation/American Heart Association Task Force on Practice Guidelines. Circulation. 2013;128(16):E240-E327. PubMed
26. Kwan JL, Lo L, Sampson M, Shojania KG. Medication reconciliation during transitions of care as a patient safety strategy: a systematic review. Ann Intern Med. 2013;158(5 Pt 2):397-403. PubMed
27. Tam VC, Knowles SR, Cornish PL, Fine N, Marchesano R, Etchells EE. Frequency, type and clinical importance of medication history errors at admission to hospital: a systematic review. CMAJ. 2005;173(5):510-515. PubMed
28. Lindenauer PK, Pekow P, Wang K, Gutierrez B, Benjamin EM. Lipid-lowering therapy and in-hospital mortality following major noncardiac surgery. JAMA. 2004;291(17):2092-2099. PubMed
29. Raju MG, Pachika A, Punnam SR, et al. Statin Therapy in the Reduction of Cardiovascular Events in Patients Undergoing Intermediate-Risk Noncardiac, Nonvascular Surgery. Clin Cardiol. 2013;36(8):456-461. PubMed
Medication reconciliation at hospital discharge is a critical component of the posthospital transition of care.1 Effective reconciliation involves a clear process for documenting a current medication list, identifying and resolving discrepancies, and then documenting decisions and instructions around which medications should be continued, modified, or stopped.2 Existing studies3-5 suggest that medication discrepancies are common during hospital discharge transitions of care and lead to preventable adverse drug events, patient disability, and increased healthcare utilization following hospital discharge, including physician office visits, emergency department (ED) visits, and hospitalizations.6-8
While the majority of studies of medication discrepancies have been conducted in general medical patients, few have examined how gaps in discharge medication reconciliation might affect surgical patients.9,10 Two prior studies9,10 suggest that medication discrepancies may occur more frequently for surgical patients, compared with medical patients, particularly discrepancies in reordering home medications postoperatively, raising patient safety concerns for more than 50 million patients hospitalized for surgery each year.11 In particular, little is known about the appropriate discharge reconciliation of chronic cardiovascular medications, such as beta-blockers, renin-angiotensin system inhibitors, and statins in surgical patients, despite perioperative practice guidelines recommending continuation or rapid reinitiation of these medications after noncardiac surgery.12 Problems with chronic cardiovascular medications have been implicated as major contributors to ED visits and hospitalizations for adverse drug events,13,14 further highlighting the importance of safe and appropriate management of these medications.
To better understand the current state and impact of postoperative discharge medication reconciliation of chronic cardiovascular medications in surgical patients, we examined (1) the appropriate discharge reconciliation of 4 cardiovascular medication classes, and (2) the associations between the appropriate discharge reconciliation of these medication classes and postdischarge acute hospital and ambulatory visits in patients hospitalized for elective noncardiac surgery at an academic medical center.
METHODS
Study Design and Patient Selection
We performed a retrospective analysis of data collected as part of a cohort study of hospitalized surgical patients admitted between January 2007 and December 2011. The original study was designed to assess the impact of a social marketing intervention on guideline-appropriate perioperative beta-blocker use in surgical patients. The study was conducted at 1 academic medical center that had 2 campuses with full noncardiac operative facilities and a 600-bed total capacity. Both sites had preoperative clinics, and patients were recruited by review of preoperative clinic records. Institutional review boards responsible for all sites approved the study.
For this analysis, we included adults (age >18 years) undergoing elective noncardiac surgery, who were expected to remain hospitalized for at least 1 day and were taking antiplatelet agents (aspirin, aspirin-dipyridamole, or clopidogrel), beta-blockers, renin-angiotensin system inhibitors (angiotensin-converting-enzyme inhibitors or angiotensin-receptor blockers), or statin lipid-lowering agents.
Data Collection
Data Sources. We collected data from a structured review of medical records as well as from discharge abstract information obtained from administrative data systems. Data regarding patient demographics (age, sex, and race/ethnicity), medical history, preoperative cardiovascular medications, surgical procedure and service, and attending surgeon were obtained from a medical record review of comprehensive preoperative clinic evaluations. Data regarding complications during hospitalization were obtained from medical record review and administrative data (Supplement for International Classification of Diseases, Ninth Revision codes).15 Research assistants abstracting data were trained by using a comprehensive reference manual providing specific criteria for classifying chart abstraction data. Research assistants also were directly observed during initial chart abstractions and underwent random chart validation audits by a senior investigator to ensure consistency. Any discrepancies in coding were resolved by consensus among senior investigators.
Definition of Key Predictor: Appropriate Reconciliation. We abstracted discharge medication lists from the electronic medical record. We defined the appropriate reconciliation of cardiovascular medications at discharge as documentation in discharge instructions, medication reconciliation tools, or discharge summaries that a preadmission cardiovascular medication was being continued at discharge, or, if the medication was not continued, documentation of a new contraindication to the medication or complication precluding its use during hospitalization. Medication continuity was considered appropriate if it was continued at discharge irrespective of changes in dosage. By using this measure for individual medications, we also assessed appropriate reconciliation as an “all-or-none” complete versus incomplete measure (appropriate reconciliation of all preoperative cardiovascular medication classes the patient was taking).16
Definition of Outcomes. Our coprimary outcomes were acute hospital visits (ED visits or hospitalizations) and unplanned ambulatory visits (primary care or surgical) at 30 days after surgery. Postoperative ambulatory visits that were not planned prior to surgery were defined as unplanned. Outcomes were ascertained by patient reports during follow-up telephone questionnaires administered by trained research staff and verified by medical record review.
Definition of Covariates. Using these data, we calculated a Revised Cardiac Risk Index (RCRI) score,17 which estimates the risk of perioperative cardiac complications in patients undergoing surgery. Through chart abstraction data supplemented by diagnosis codes from administrative data, we also constructed variables indicating occurrences of postoperative complications anytime during hospitalization that might pose contraindications to continuation of the 4 cardiovascular medication classes studied. For example, if a chart indicated that the patient had an acute rise in creatinine (elevation of baseline creatinine by 50% or absolute rise of 1 mg/dL in patients with baseline creatinine greater than 3 mg/dL) during hospitalization and a preoperative renin-angiotensin system inhibitor was not prescribed at discharge, we would have considered discontinuation appropriate. Other complications we abstracted were hypotension (systolic blood pressure less than 90 mmHg) for beta-blockers and renin-angiotensin system inhibitors, bradycardia (heart rate less than 50 bpm) for beta-blockers, acute kidney injury (defined above) and hyperkalemia for renin-angiotensin system inhibitors, and bleeding (any site) for antiplatelet agents.
Statistical Analysis
We used χ2 and Kruskal-Wallis tests to compare baseline patient characteristics. To assess associations between appropriate medication reconciliation and patient outcomes, we used multilevel mixed-effects logistic regression to account for the clustering of patients by the attending surgeon. We adjusted for baseline patient demographics, surgical service, the number of baseline cardiovascular medications, and individual RCRI criteria. We constructed separate models for all-or-none appropriate reconciliation and for each individual medication class.
As a sensitivity analysis, we constructed similar models by using a simplified definition of appropriate reconciliation based entirely on medication continuity (continued or not continued at discharge) without taking potential contraindications during hospitalization into account. For complete versus incomplete reconciliation, we also constructed models with an interaction term between the number of baseline cardiovascular medications and appropriate medication reconciliation to test the hypothesis that inappropriate reconciliation would be more likely with an increasing number of preoperative cardiovascular medications. Because this interaction term was not statistically significant, we did not include it in the final models for ease of reporting and interpretability. We performed all statistical analyses using Stata 14 (StataCorp, LLC, College Station, Texas), and used 2-sided statistical tests and a P value of less than .05 to define statistical significance.
RESULTS
Patient Characteristics
A total of 849 patients were enrolled, of which 752 (88.6%) were taking at least 1 of the specified cardiovascular medications in the preoperative period. Their mean age was 61.5; 50.9% were male, 72.6% were non-Hispanic white, and 89.4% had RCRI scores of 0 or 1 (Table 1). The majority (63.8%) were undergoing general surgery, orthopedic surgery, or neurosurgery procedures. In the preoperative period, 327 (43.5%) patients were taking antiplatelet agents, 624 (83.0%) were taking beta-blockers, 361 (48.0%) were taking renin-angiotensin system inhibitors, and 406 (54.0%) were taking statins (Table 2). Among patients taking antiplatelet agents, 271 (82.9%) were taking aspirin alone, 21 (6.4%) were taking clopidogrel alone, and 35 (10.7%) were taking dual antiplatelet therapy with aspirin and clopidogrel. Nearly three-quarters of the patients (551, 73.3%) were taking medications from 2 or more classes, and the proportion of patients with inappropriate reconciliation increased with the number of preoperative cardiovascular medications.
Patients with and without appropriate reconciliation of all preoperative cardiovascular medications were similar in age, sex, and race/ethnicity (Table 1). Patients with inappropriate reconciliation of at least 1 medication were more likely to be on the urology and renal/liver transplant surgical services, have higher RCRI scores, and be taking antiplatelet agents, statins, renin-angiotensin system inhibitors, and 3 or more cardiovascular medications in the preoperative period.
Appropriate Medication Reconciliation
Four hundred thirty-six patients (58.0%) had their baseline cardiovascular medications appropriately reconciled. Among all patients with appropriately reconciled medications, 1 (0.2%) had beta-blockers discontinued due to a documented episode of hypotension; 17 (3.9%) had renin-angiotensin system inhibitors discontinued due to episodes of acute kidney injury, hypotension, or hyperkalemia; and 1 (0.2%) had antiplatelet agents discontinued due to bleeding. For individual medications, appropriate reconciliation between the preoperative and discharge periods occurred for 156 of the 327 patients on antiplatelet agents (47.7%), 507 of the 624 patients on beta-blockers (81.3%), 259 of the 361 patients on renin-angiotensin system inhibitors (71.8%), and 302 of the 406 patients on statins (74.4%; Table 2).
Associations Between Medication Reconciliation and Outcomes
Thirty-day outcome data on acute hospital visits were available for 679 (90.3%) patients. Of these, 146 (21.5%) were seen in the ED or were hospitalized, and 111 (16.3%) were seen for an unplanned primary care or surgical outpatient visit at 30 days after surgery. Patients with incomplete outcome data were more likely to have complete medication reconciliation compared with those with complete outcome data (71.2% vs 56.6%, P = 0.02). As shown in Table 3, the proportion of patients with 30-day acute hospital visits was nonstatistically significantly lower in patients with complete medication reconciliation (20.8% vs 22.4%, P = 0.63) and the appropriate reconciliation of beta-blockers (21.9% vs 23.6%, P = 0.71) and renin-angiotensin system inhibitors (19.6% vs 20.0%, P = 0.93), and nonsignificantly higher with the appropriate reconciliation of antiplatelet agents (23.9% vs 19.9%, P = 0.40). Acute hospital visits were statistically significantly lower with the appropriate reconciliation of statins (17.9% vs 31.9%, P = 0.004).
Sensitivity Analysis
Overall, 430 (57.2%) patients had complete cardiovascular medication continuity without considering potential contraindications during hospitalization. Associations between medication continuity and acute hospital and ambulatory visits were similar to the primary analyses.
DISCUSSION
In this study of 752 patients hospitalized for elective noncardiac surgery, we found significant gaps in the appropriate reconciliation of commonly prescribed cardiovascular medications, with inappropriate discontinuation ranging from 18.8% to 52.3% for individual medications. Unplanned postdischarge healthcare utilization was high, with acute hospital visits documented in 21.5% of patients and unplanned ambulatory visits in 16.3% at 30 days after surgery. However, medication reconciliation gaps were not consistently associated with ED visits, hospitalizations, or unplanned ambulatory visits.
Our finding of large gaps in postoperative medication reconciliation is consistent with existing studies of medication reconciliation in surgical patients.9,10,18 One study found medication discrepancies in 40.2% of postoperative patients receiving usual care and discrepancies judged to have the potential to cause harm (such as the omission of beta-blockers) in 29.9%.9 Consistent with our findings, this study also found that most postoperative medication discrepancies were omissions in reordering home medications, though at a rate somewhat higher than those seen in medical patients at discharge.5 While hospitalization by itself increases the risk of unintentional discontinuation of chronic medications,3 our results, along with existing literature, suggest that the risk for omission of chronic medications is unacceptably high.
We also found significant variation in reconciliation among cardiovascular medications, with appropriate reconciliation occurring least frequently for antiplatelet agents and most frequently for beta-blockers. The low rates of appropriate reconciliation for antiplatelet agents may be attributable to deliberate withholding of antiplatelet therapy in the postoperative period based on clinical assessments of surgical bleeding risk in the absence of active bleeding. Perioperative management of antiplatelet agents for noncardiac surgery remains an unclear and controversial topic, which may also contribute to the variation noted.19 Conversely, beta-blockers demonstrated high rates of preoperative use (over 80% of patients) and appropriate reconciliation. Both findings are likely attributable in part to the timing of the study, which began prior to the publication of the Perioperative Ischemic Evaluation trial, which more definitively demonstrated the potential harms of perioperative beta-blocker therapy.20
Despite a high proportion of patients with discontinuous medications at discharge, we found no associations between the appropriate reconciliation of beta-blockers, renin-angiotensin system inhibitors, and antiplatelet agents and acute hospital or ambulatory visits in the first 30 days after discharge. One explanation for this discrepancy is that, although we focused on cardiovascular medications commonly implicated in acute hospital visits, the vast majority of patients in our study had low perioperative cardiovascular risk as assessed by the RCRI. Previous studies have demonstrated that the benefit of perioperative beta-blocker therapy is predominantly in patients with moderate to high perioperative cardiovascular risk.21,22 It is possible that the detrimental effects of the discontinuation of chronic cardiovascular medications are more prominent in populations at a higher risk of perioperative cardiovascular complications or that complications will occur later than 30 days after discharge. Similarly, while the benefits of continuation of renin-angiotensin system inhibitors are less clear,23 few patients in our cohort had a history of congestive heart failure (6.3%) or coronary artery disease (13.0%), 2 conditions in which the impact of perioperative discontinuation of renin-angiotensin inhibitor or beta-blocker therapy would likely be more pronounced.24,25 An additional explanation for the lack of associations is that, while multiple studies have demonstrated that medication errors are common, the proportion of errors with the potential for harm is much lower, and the proportion that causes actual harm is lower still.5,26,27 Thus, while we likely captured high-severity medication errors leading to acute hospital or unplanned ambulatory visits, we would not have captured medication errors with lower severity clinical consequences that did not result in medical encounters.
We did find an association between the continuation of statin therapy and reduced ED visits and hospitalizations. This finding is supported by previous studies of patients undergoing noncardiac surgery, including 1 demonstrating an association between immediate postoperative statin therapy and reduced in-hospital mortality28 and another study demonstrating an association between postoperative statin therapy and reductions in a composite endpoint of 30-day mortality, atrial fibrillation, and nonfatal myocardial infarction.29 Alternatively, this finding could reflect the effects of unaddressed confounding by factors contributing to statin discontinuation and poor health outcomes leading to acute hospital visits, such as acute elevations in liver enzymes.
Our study has important implications for patients undergoing elective noncardiac surgery and the healthcare providers caring for them. First, inappropriate omissions of chronic cardiovascular medications at discharge are common; clinicians should increase their general awareness and focus on appropriately reconciling these medications, for even if our results do not connect medication discontinuity to readmissions or unexpected clinical encounters, their impact on patients’ understanding of their medications remains a potential concern. Second, the overall high rates of unplanned postdischarge healthcare utilization in this study highlight the need for close postdischarge monitoring of patients undergoing elective surgical procedures and for further research to identify preventable etiologies of postdischarge healthcare utilization in this population. Third, further study is needed to identify specific patient populations and medication classes, in which appropriate reconciliation is associated with patient outcomes that may benefit from more intensive discharge medication reconciliation interventions.
Our study has limitations. First, the majority of patients in this single-center study were at low risk of perioperative cardiovascular events, and our results may not be generalizable to higher-risk patients undergoing elective surgery. Second, discharge reconciliation was based on documentation of medication reconciliation and not on patient-reported medication adherence. In addition, the ability to judge the accuracy of discharge medication reconciliation is in part dependent on the accuracy of the admission medication reconciliation. Thus, although we used preoperative medication regimens documented during preadmission visits to comprehensive preoperative clinics for comparison, discrepancies in these preoperative regimens could have affected our analysis of appropriate discharge reconciliation. Third, inadequate documentation of clinical reasons for discontinuing medications may have led to residual confounding by indication in our observational study. Finally, the outcomes available to us may have been relatively insensitive to other adverse effects of medication discontinuity, such as patient symptoms (eg, angina severity), patient awareness of medications, or work placed on primary care physicians needing to “clean up” erroneous medication lists.
In conclusion, gaps in appropriate discharge reconciliation of chronic cardiovascular medications were common but not consistently associated with postdischarge acute hospital or unplanned ambulatory visits in a relatively low-risk cohort of patients undergoing elective surgery. While appropriate medication reconciliation should always be a priority, further study is needed to identify medication reconciliation approaches associated with postdischarge healthcare utilization and other patient outcomes.
Disclosure
Dr. Lee reports receiving grant support from the Health Resources and Services Administration (T32HP19025). Dr. Vittinghoff reports receiving grant support from the Agency for Healthcare Research and Quality. Dr. Auerbach and Dr. Fleischmann report receiving grant support from the National Institutes of Health. Dr. Auerbach also reports receiving honorarium as Editor-in-Chief of the Journal of Hospital Medicine. Dr. Corbett reports receiving grant and travel support from Simon Fraser University. The remaining authors have no disclosures to report.
1. The Joint Commission. National Patient Safety Goals. 2016; https://www.jointcommission.org/standards_information/npsgs.aspx. Accessed June 21, 2016.
2. Institute for Healthcare Improvement. Medication Reconciliation to Prevent Adverse Drug Events. 2016; http://www.ihi.org/topics/ADEsMedicationReconciliation/Pages/default.aspx. Accessed June 24, 2016.
3. Bell CM, Brener SS, Gunraj N, et al. Association of ICU or hospital admission with unintentional discontinuation of medications for chronic diseases. JAMA. 2011;306(8):840-847. PubMed
4. Coleman EA, Smith JD, Raha D, Min SJ. Posthospital medication discrepancies: prevalence and contributing factors. Arch Intern Med. 2005;165(16):1842-1847. PubMed
5. Wong JD, Bajcar JM, Wong GG, et al. Medication reconciliation at hospital discharge: evaluating discrepancies. Ann Pharmacother. 2008;42(10):1373-1379. PubMed
6. Forster AJ, Clark HD, Menard A, et al. Adverse events among medical patients after discharge from hospital. CMAJ. 2004;170(3):345-349. PubMed
7. Forster AJ, Murff HJ, Peterson JF, Gandhi TK, Bates DW. The incidence and severity of adverse events affecting patients after discharge from the hospital. Ann Intern Med. 2003;138(3):161-167. PubMed
8. Forster AJ, Murff HJ, Peterson JF, Gandhi TK, Bates DW. Adverse drug events occurring following hospital discharge. JGIM. 2005;20(4):317-323. PubMed
9. Kwan Y, Fernandes OA, Nagge JJ, et al. Pharmacist medication assessments in a surgical preadmission clinic. Arch Intern Med. 2007;167(10):1034-1040. PubMed
10. Unroe KT, Pfeiffenberger T, Riegelhaupt S, Jastrzembski J, Lokhnygina Y, Colon-Emeric C. Inpatient Medication Reconciliation at Admission and Discharge: A Retrospective Cohort Study of Age and Other Risk Factors for Medication Discrepancies. Am J Geriatr Pharmacother. 2010;8(2):115-126. PubMed
11. CDC - National Center for Health Statistics. Fast Stats: Inpatient Surgery. http://www.cdc.gov/nchs/fastats/inpatient-surgery.htm. Accessed on June 24, 2016.
12. Fleisher LA, Fleischmann KE, Auerbach AD, et al. 2014 ACC/AHA guideline on perioperative cardiovascular evaluation and management of patients undergoing noncardiac surgery: a report of the American College of Cardiology/American Heart Association Task Force on Practice Guidelines. Circulation. 2014;130(24):e278-e333. PubMed
13. Budnitz DS, Lovegrove MC, Shehab N, Richards CL. Emergency hospitalizations for adverse drug events in older Americans. N Engl J Med. 2011;365(21):2002-2012. PubMed
14. Budnitz DS, Pollock DA, Weidenbach KN, Mendelsohn AB, Schroeder TJ, Annest JL. National surveillance of emergency department visits for outpatient adverse drug events. JAMA. 2006;296(15):1858-1866. PubMed
15. Bozic KJ, Maselli J, Pekow PS, Lindenauer PK, Vail TP, Auerbach AD. The influence of procedure volumes and standardization of care on quality and efficiency in total joint replacement surgery. J Bone Joint Surg Am. 2010;92(16):2643-2652. PubMed
16. Nolan T, Berwick DM. All-or-none measurement raises the bar on performance. JAMA. 2006;295(10):1168-1170. PubMed
17. Lee TH, Marcantonio ER, Mangione CM, et al. Derivation and prospective validation of a simple index for prediction of cardiac risk of major noncardiac surgery. Circulation. 1999;100(10):1043-1049. PubMed
18. Gonzalez-Garcia L, Salmeron-Garcia A, Garcia-Lirola MA, Moya-Roldan S, Belda-Rustarazo S, Cabeza-Barrera J. Medication reconciliation at admission to surgical departments. J Eval Clin Pract. 2016;22(1):20-25. PubMed
19. Devereaux PJ, Mrkobrada M, Sessler DI, et al. Aspirin in patients undergoing noncardiac surgery. N Engl J Med. 2014;370(16):1494-1503. PubMed
20. Devereaux PJ, Yang H, Yusuf S, et al. Effects of extended-release metoprolol succinate in patients undergoing non-cardiac surgery (POISE trial): a randomised controlled trial. Lancet. 2008;371(9627):1839-1847. PubMed
21. Lindenauer PK, Pekow P, Wang K, Mamidi DK, Gutierrez B, Benjamin EM. Perioperative beta-blocker therapy and mortality after major noncardiac surgery. N Engl J Med. 2005;353(4):349-361. PubMed
22. London MJ, Hur K, Schwartz GG, Henderson WG. Association of perioperative beta-blockade with mortality and cardiovascular morbidity following major noncardiac surgery. JAMA. 2013;309(16):1704-1713. PubMed
23. Rosenman DJ, McDonald FS, Ebbert JO, Erwin PJ, LaBella M, Montori VM. Clinical consequences of withholding versus administering renin-angiotensin-aldosterone system antagonists in the preoperative period. J Hosp Med. 2008;3(4):319-325. PubMed
24. Andersson C, Merie C, Jorgensen M, et al. Association of beta-blocker therapy with risks of adverse cardiovascular events and deaths in patients with ischemic heart disease undergoing noncardiac surgery: a Danish nationwide cohort study. JAMA Intern Med. 2014;174(3):336-344. PubMed
25. Yancy CW, Jessup M, Bozkurt B, et al. 2013 ACCF/AHA Guideline for the Management of Heart Failure A Report of the American College of Cardiology Foundation/American Heart Association Task Force on Practice Guidelines. Circulation. 2013;128(16):E240-E327. PubMed
26. Kwan JL, Lo L, Sampson M, Shojania KG. Medication reconciliation during transitions of care as a patient safety strategy: a systematic review. Ann Intern Med. 2013;158(5 Pt 2):397-403. PubMed
27. Tam VC, Knowles SR, Cornish PL, Fine N, Marchesano R, Etchells EE. Frequency, type and clinical importance of medication history errors at admission to hospital: a systematic review. CMAJ. 2005;173(5):510-515. PubMed
28. Lindenauer PK, Pekow P, Wang K, Gutierrez B, Benjamin EM. Lipid-lowering therapy and in-hospital mortality following major noncardiac surgery. JAMA. 2004;291(17):2092-2099. PubMed
29. Raju MG, Pachika A, Punnam SR, et al. Statin Therapy in the Reduction of Cardiovascular Events in Patients Undergoing Intermediate-Risk Noncardiac, Nonvascular Surgery. Clin Cardiol. 2013;36(8):456-461. PubMed
© 2017 Society of Hospital Medicine
Medication Reconciliation Perspectives
Medication reconciliation, when performed well, effectively identifies discrepancies and reduces medication errors in the hospital setting.[1, 2, 3] This process involves 4 major steps: (1) obtain and document a comprehensive medication history on admission, (2) compare the medication history to medication orders in the hospital and identify and resolve discrepancies, (3) provide the patient with a written list of discharge medications, and (4) educate the patient about their discharge medication regimen.[4, 5, 6]
However, medication reconciliation has been challenging to implement given difficulties with accurate medication information, patients' ability to communicate or remember, and clinician's not having enough time, motivation, or clear roles.[5, 7, 8, 9, 10, 11] Lack of role clarity is generally a barrier to quality improvement; therefore, we studied the perceptions of physicians, nurses, and pharmacists about their roles and responsibilities in completing inpatient medication reconciliation.
METHODS
We independently surveyed attending and resident physicians, nurses, and pharmacists at the University of California San Francisco (UCSF) Medical Center via email who were actively caring for hospitalized patients in April 2010. We collected data on demographics, roles on specific tasks in the medication reconciliation process from admission through discharge, and attitudes and barriers toward medication reconciliation and health information technology systems. Responses to questions used a 4‐point Likert scale. We calculated frequencies and proportions, and used the Fisher exact test to evaluate differences in role agreement for specific medication reconciliation tasks.
RESULTS
Of 256 active clinicians, 78 completed the survey (30.5% overall response rate) providing care in various hospital services (medicine, surgery, cardiology, neurology, pediatrics, obstetrics/gynecology). We received responses from 7 attending physicians (16% response rate), 14 resident physicians (19% response rate), 35 nurses (43% response rate), and 22 pharmacists (43% response rate). Most clinicians worked more than 5 years at UCSF, except residents (14 years).
Overall agreement was poor to fair on whose primary role it was for specific medication reconciliation tasks from admission through discharge (Table 1). Clinicians mainly agreed that it was a physician's responsibility to decide which medications should be continued or discontinued on admission and discharge, although agreement between attending and resident physicians varied. Fisher exact test revealed significant differences in agreement among attending and resident physicians, nurses, and pharmacists to obtain and document a medication history on admission (P=0.001), provide a list of the discharge medications (P<0.001), or educate patients on the postdischarge medication regimen (P<0.001). For these tasks, the physician, nurse, pharmacist or a combination of these clinicians (multiple category) were each identified to be responsible.
| Response to who is responsible | |||||
|---|---|---|---|---|---|
| Clinician | Attending | Resident | Nurse | Pharmacist | Multiple* |
| |||||
| A. On admission, obtaining and documenting the patient's medication history (P=0.001) | |||||
| Attending | 1 (14%) | 6 (86%) | 0 | 0 | 0 |
| Resident | 0 | 14 (100%) | 0 | 0 | 0 |
| Nurse | 6 (17%) | 20 (57%) | 5 (14%) | 2 (6%) | 2 (6%) |
| Pharmacist | 1 (5%) | 9 (41%) | 0 | 10 (45%) | 2 (9%) |
| B. On admission, deciding which medications will be continued or discontinued (P=0.027) | |||||
| Attending | 6 (86%) | 1 (14%) | 0 | 0 | 0 |
| Resident | 3 (21%) | 11 (79%) | 0 | 0 | 0 |
| Nurse | 12 (34%) | 22 (63%) | 0 | 0 | 1 (3%) |
| Pharmacist | 4 (18%) | 15 (68%) | 0 | 2 (9%) | 1 (5%) |
| C. On discharge, deciding which medications will be continued or discontinued (P=0.123) | |||||
| Attending | 6 (86%) | 1 (14%) | 0 | 0 | 0 |
| Resident | 5 (36%) | 9 (64%) | 0 | 0 | 0 |
| Nurse | 10 (29%) | 15 (43%) | 1 (3%) | 1 (3%) | 8 (23%) |
| Pharmacist | 5 (23%) | 12 (55%) | 1 (5%) | 0 | 4 (18%) |
| D. On discharge, providing a list of the discharge medications to the patient (P<0.001) | |||||
| Attending | 1 (14%) | 6 (86%) | 0 | 0 | 0 |
| Resident | 0 | 13 (93%) | 0 | 1 (7%) | 0 |
| Nurse | 2 (6%) | 22 (63%) | 3 (11%) | 6 (17%) | 2 (6%) |
| Pharmacist | 0 | 4 (18%) | 2 (9%) | 14 (64%) | 2 (9%) |
| E. On discharge, educating the patient on the postdischarge medication regimen (P<0.001) | |||||
| Attending | 1 (14%) | 4 (57%) | 1 (14%) | 1 (14%) | 0 |
| Resident | 0 | 4 (29%) | 8 (57%) | 2 (14%) | 0 |
| Nurse | 0 | 2 (6%) | 23 (66%) | 8 (23%) | 2 (6%) |
| Pharmacist | 0 | 0 | 3 (14%) | 14 (64%) | 5 (23%) |
Most clinicians believed that maintaining a patient's list of medications improves patient care (94%100% agreement). However, when asked whether clinicians other than yourself should be responsible for an accurate medication list, most nurses (73%) and pharmacists (52%) agreed with this statement compared to resident (50%) and attending physicians (29%). Most clinicians agreed that information technology systems for reconciling medications were complicated, and that patients who do not know their medications, accessing outside medical records, working with inaccurate lists, or nonEnglish‐speaking patients are barriers to reconciliation.
DISCUSSION
We found fair agreement among clinicians that physicians were responsible for reconciling medications on admission and discharge. However, attending and resident physicians each believed it was their primary responsibility, respectively, suggesting the need for better communication between each other. We found poor agreement among clinicians about whose primary role it was to perform the other main steps of medication reconciliation including obtaining and documenting a medication history, and providing a medication list and educating the patient at discharge. For these tasks, there was more confusion among physicians, nurses, and pharmacists. Our findings highlight the need for better role clarity and good communication among team members, particularly at discharge.
Nearly all clinicians agreed that updating patients' medication lists improves patient care. However, most nurses and pharmacists preferred that physicians be responsible for updating information and reconciling medications. They also noted a number of patient‐related and information system barriers to effective reconciliation as others have identified.[7, 8, 9, 10, 11] Although standardizing medication information reporting and implementing technology that can integrate medical records to create, update, and share information between patients and providers can help streamline the medication reconciliation process,[4, 5, 7, 8, 12] these procedures are unlikely to be effective unless good interprofessional communication, role clarity, and clinician understanding of how the system works are in place.
When this study was conducted, our institution's policy required that medication reconciliation be completed, but no specific roles or standard work documents existed. Since then, we have clarified the role of the physician to be responsible for completing medication reconciliation with ancillary help from nurses, pharmacists, and other clinicians, particularly when obtaining a medication history and preparing the patient for discharge. This role clarity has led to focused training and standard work guide documents as guidance to clinicians in different hospital settings about expectations and how to complete medication reconciliation. Clearly, no single reconciliation workflow process will meet the needs of all hospitals. However, it is crucial that interprofessional teams are established with clearly defined roles and responsibilities, and how these roles and responsibilities may change in various situations or services.[8]
Our study had several limitations. We surveyed 1 academic medical center, thus limiting the generalizability of our findings to other organizations or settings. Our small sample size and low response rate could be susceptible to selection bias. However, our findings are similar to other studies.[7, 10, 11] Finally, we included clinicians practicing on various services throughout our hospital, and the local medication reconciliation process could have contributed to the poor agreement. Nonetheless, differences in perceived roles and attitudes for completing medication reconciliation were observed.
In conclusion, lack of agreement among clinicians about their specific roles and responsibilities in the medication reconciliation process exists, and this may result in incomplete reconciliation, inefficiency, duplication of work, and possibly more confusion about a patient's medication regimen. Clinically meaningful and efficient medication reconciliation requires interprofessional teamwork with clear roles and responsibilities, good communication and better information reporting, and tracking systems to successfully combine the steps of medication reconciliation and ensure patient safety.[8, 12]
Disclosures: Funded by research grant NHLBI R01 HL086473 to Dr. Auerbach, and through UCSF‐ CTSI grant number KL2 RR024130 to Dr. Lee from the National Center for Research Resources, the National Center for Advancing Translational Sciences, and the Office of the Director, National Institutes of Health. The contents of this publication are solely the responsibility of the authors and do not necessarily represent the official views of the National Institutes of Health. Dr. Lee had full access to all study data and takes responsibility for data integrity and data analysis accuracy. The authors report no conflicts of interest.
- , , , et al. Medication reconciliation: a practical tool to reduce the risk of medication errors. J Crit Care. 2003;18(4):201–205.
- , , , . Hospital‐based medication reconciliation practices: a systematic review. Arch Intern Med. 2012;172(14):1057–1069.
- , , , et al. Results of the Medications at Transitions and Clinical Handoffs (MATCH) study: an analysis of medication reconciliation errors and risk factors at hospital admission. J Gen Intern Med. 2010;25(5):441–447.
- Institute for Healthcare Improvement. How‐to Guide: Prevent Adverse Drug Events (Medication Reconciliation). Available at: www.ihi.org/knowledge/Pages/Tools/HowtoGuidePreventAdverseDrugEvents.aspx. Accessed March 22, 2014.
- The Joint Commission. National patient safety goals effective January 1, 2014. Hospital Accreditation Program. Available at: http://www.jointcommission.org/assets/1/6/HAP_NPSG_Chapter_2014.pdf. Accessed March 22, 2014.
- Agency for Healthcare Research and Quality. Introduction: medications at transitions and clinical handoffs (MATCH) toolkit for medication reconciliation. Available at: http://www.ahrq.gov/professionals/quality‐patient‐safety/patient‐safety‐resources/resources/match/matchintro.html. Updated August 2012. Accessed March 22, 2014.
- , , , , . Results of a medication reconciliation survey from the 2006 Society of Hospital Medicine national meeting. J Hosp Med. 2008;3(6):465–472.
- , , , et al. Making inpatient medication reconciliation patient centered, clinically relevant and implementable: a consensus statement on key principles and necessary first steps. J Hosp Med. 2010;5(8):477–485.
- , , , , . How reliable are patient‐completed medication reconciliation forms compared with pharmacy lists? Am J Emerg Med. 2012;30(7):1048–1054.
- , , , , . Medication reconciliation: barriers and facilitators from the perspectives of resident physicians and pharmacists. J Hosp Med. 2011;6(6):329–337.
- , , , . Medication reconciliation: a qualitative analysis of clinicians' perceptions. Res Social Adm Pharm. 2013;9(4):419–430.
- , . Improving care transitions: optimizing medication reconciliation. J Am Pharm Assoc (2003). 2012;52(4):e43–e52.
Medication reconciliation, when performed well, effectively identifies discrepancies and reduces medication errors in the hospital setting.[1, 2, 3] This process involves 4 major steps: (1) obtain and document a comprehensive medication history on admission, (2) compare the medication history to medication orders in the hospital and identify and resolve discrepancies, (3) provide the patient with a written list of discharge medications, and (4) educate the patient about their discharge medication regimen.[4, 5, 6]
However, medication reconciliation has been challenging to implement given difficulties with accurate medication information, patients' ability to communicate or remember, and clinician's not having enough time, motivation, or clear roles.[5, 7, 8, 9, 10, 11] Lack of role clarity is generally a barrier to quality improvement; therefore, we studied the perceptions of physicians, nurses, and pharmacists about their roles and responsibilities in completing inpatient medication reconciliation.
METHODS
We independently surveyed attending and resident physicians, nurses, and pharmacists at the University of California San Francisco (UCSF) Medical Center via email who were actively caring for hospitalized patients in April 2010. We collected data on demographics, roles on specific tasks in the medication reconciliation process from admission through discharge, and attitudes and barriers toward medication reconciliation and health information technology systems. Responses to questions used a 4‐point Likert scale. We calculated frequencies and proportions, and used the Fisher exact test to evaluate differences in role agreement for specific medication reconciliation tasks.
RESULTS
Of 256 active clinicians, 78 completed the survey (30.5% overall response rate) providing care in various hospital services (medicine, surgery, cardiology, neurology, pediatrics, obstetrics/gynecology). We received responses from 7 attending physicians (16% response rate), 14 resident physicians (19% response rate), 35 nurses (43% response rate), and 22 pharmacists (43% response rate). Most clinicians worked more than 5 years at UCSF, except residents (14 years).
Overall agreement was poor to fair on whose primary role it was for specific medication reconciliation tasks from admission through discharge (Table 1). Clinicians mainly agreed that it was a physician's responsibility to decide which medications should be continued or discontinued on admission and discharge, although agreement between attending and resident physicians varied. Fisher exact test revealed significant differences in agreement among attending and resident physicians, nurses, and pharmacists to obtain and document a medication history on admission (P=0.001), provide a list of the discharge medications (P<0.001), or educate patients on the postdischarge medication regimen (P<0.001). For these tasks, the physician, nurse, pharmacist or a combination of these clinicians (multiple category) were each identified to be responsible.
| Response to who is responsible | |||||
|---|---|---|---|---|---|
| Clinician | Attending | Resident | Nurse | Pharmacist | Multiple* |
| |||||
| A. On admission, obtaining and documenting the patient's medication history (P=0.001) | |||||
| Attending | 1 (14%) | 6 (86%) | 0 | 0 | 0 |
| Resident | 0 | 14 (100%) | 0 | 0 | 0 |
| Nurse | 6 (17%) | 20 (57%) | 5 (14%) | 2 (6%) | 2 (6%) |
| Pharmacist | 1 (5%) | 9 (41%) | 0 | 10 (45%) | 2 (9%) |
| B. On admission, deciding which medications will be continued or discontinued (P=0.027) | |||||
| Attending | 6 (86%) | 1 (14%) | 0 | 0 | 0 |
| Resident | 3 (21%) | 11 (79%) | 0 | 0 | 0 |
| Nurse | 12 (34%) | 22 (63%) | 0 | 0 | 1 (3%) |
| Pharmacist | 4 (18%) | 15 (68%) | 0 | 2 (9%) | 1 (5%) |
| C. On discharge, deciding which medications will be continued or discontinued (P=0.123) | |||||
| Attending | 6 (86%) | 1 (14%) | 0 | 0 | 0 |
| Resident | 5 (36%) | 9 (64%) | 0 | 0 | 0 |
| Nurse | 10 (29%) | 15 (43%) | 1 (3%) | 1 (3%) | 8 (23%) |
| Pharmacist | 5 (23%) | 12 (55%) | 1 (5%) | 0 | 4 (18%) |
| D. On discharge, providing a list of the discharge medications to the patient (P<0.001) | |||||
| Attending | 1 (14%) | 6 (86%) | 0 | 0 | 0 |
| Resident | 0 | 13 (93%) | 0 | 1 (7%) | 0 |
| Nurse | 2 (6%) | 22 (63%) | 3 (11%) | 6 (17%) | 2 (6%) |
| Pharmacist | 0 | 4 (18%) | 2 (9%) | 14 (64%) | 2 (9%) |
| E. On discharge, educating the patient on the postdischarge medication regimen (P<0.001) | |||||
| Attending | 1 (14%) | 4 (57%) | 1 (14%) | 1 (14%) | 0 |
| Resident | 0 | 4 (29%) | 8 (57%) | 2 (14%) | 0 |
| Nurse | 0 | 2 (6%) | 23 (66%) | 8 (23%) | 2 (6%) |
| Pharmacist | 0 | 0 | 3 (14%) | 14 (64%) | 5 (23%) |
Most clinicians believed that maintaining a patient's list of medications improves patient care (94%100% agreement). However, when asked whether clinicians other than yourself should be responsible for an accurate medication list, most nurses (73%) and pharmacists (52%) agreed with this statement compared to resident (50%) and attending physicians (29%). Most clinicians agreed that information technology systems for reconciling medications were complicated, and that patients who do not know their medications, accessing outside medical records, working with inaccurate lists, or nonEnglish‐speaking patients are barriers to reconciliation.
DISCUSSION
We found fair agreement among clinicians that physicians were responsible for reconciling medications on admission and discharge. However, attending and resident physicians each believed it was their primary responsibility, respectively, suggesting the need for better communication between each other. We found poor agreement among clinicians about whose primary role it was to perform the other main steps of medication reconciliation including obtaining and documenting a medication history, and providing a medication list and educating the patient at discharge. For these tasks, there was more confusion among physicians, nurses, and pharmacists. Our findings highlight the need for better role clarity and good communication among team members, particularly at discharge.
Nearly all clinicians agreed that updating patients' medication lists improves patient care. However, most nurses and pharmacists preferred that physicians be responsible for updating information and reconciling medications. They also noted a number of patient‐related and information system barriers to effective reconciliation as others have identified.[7, 8, 9, 10, 11] Although standardizing medication information reporting and implementing technology that can integrate medical records to create, update, and share information between patients and providers can help streamline the medication reconciliation process,[4, 5, 7, 8, 12] these procedures are unlikely to be effective unless good interprofessional communication, role clarity, and clinician understanding of how the system works are in place.
When this study was conducted, our institution's policy required that medication reconciliation be completed, but no specific roles or standard work documents existed. Since then, we have clarified the role of the physician to be responsible for completing medication reconciliation with ancillary help from nurses, pharmacists, and other clinicians, particularly when obtaining a medication history and preparing the patient for discharge. This role clarity has led to focused training and standard work guide documents as guidance to clinicians in different hospital settings about expectations and how to complete medication reconciliation. Clearly, no single reconciliation workflow process will meet the needs of all hospitals. However, it is crucial that interprofessional teams are established with clearly defined roles and responsibilities, and how these roles and responsibilities may change in various situations or services.[8]
Our study had several limitations. We surveyed 1 academic medical center, thus limiting the generalizability of our findings to other organizations or settings. Our small sample size and low response rate could be susceptible to selection bias. However, our findings are similar to other studies.[7, 10, 11] Finally, we included clinicians practicing on various services throughout our hospital, and the local medication reconciliation process could have contributed to the poor agreement. Nonetheless, differences in perceived roles and attitudes for completing medication reconciliation were observed.
In conclusion, lack of agreement among clinicians about their specific roles and responsibilities in the medication reconciliation process exists, and this may result in incomplete reconciliation, inefficiency, duplication of work, and possibly more confusion about a patient's medication regimen. Clinically meaningful and efficient medication reconciliation requires interprofessional teamwork with clear roles and responsibilities, good communication and better information reporting, and tracking systems to successfully combine the steps of medication reconciliation and ensure patient safety.[8, 12]
Disclosures: Funded by research grant NHLBI R01 HL086473 to Dr. Auerbach, and through UCSF‐ CTSI grant number KL2 RR024130 to Dr. Lee from the National Center for Research Resources, the National Center for Advancing Translational Sciences, and the Office of the Director, National Institutes of Health. The contents of this publication are solely the responsibility of the authors and do not necessarily represent the official views of the National Institutes of Health. Dr. Lee had full access to all study data and takes responsibility for data integrity and data analysis accuracy. The authors report no conflicts of interest.
- , , , et al. Medication reconciliation: a practical tool to reduce the risk of medication errors. J Crit Care. 2003;18(4):201–205.
- , , , . Hospital‐based medication reconciliation practices: a systematic review. Arch Intern Med. 2012;172(14):1057–1069.
- , , , et al. Results of the Medications at Transitions and Clinical Handoffs (MATCH) study: an analysis of medication reconciliation errors and risk factors at hospital admission. J Gen Intern Med. 2010;25(5):441–447.
- Institute for Healthcare Improvement. How‐to Guide: Prevent Adverse Drug Events (Medication Reconciliation). Available at: www.ihi.org/knowledge/Pages/Tools/HowtoGuidePreventAdverseDrugEvents.aspx. Accessed March 22, 2014.
- The Joint Commission. National patient safety goals effective January 1, 2014. Hospital Accreditation Program. Available at: http://www.jointcommission.org/assets/1/6/HAP_NPSG_Chapter_2014.pdf. Accessed March 22, 2014.
- Agency for Healthcare Research and Quality. Introduction: medications at transitions and clinical handoffs (MATCH) toolkit for medication reconciliation. Available at: http://www.ahrq.gov/professionals/quality‐patient‐safety/patient‐safety‐resources/resources/match/matchintro.html. Updated August 2012. Accessed March 22, 2014.
- , , , , . Results of a medication reconciliation survey from the 2006 Society of Hospital Medicine national meeting. J Hosp Med. 2008;3(6):465–472.
- , , , et al. Making inpatient medication reconciliation patient centered, clinically relevant and implementable: a consensus statement on key principles and necessary first steps. J Hosp Med. 2010;5(8):477–485.
- , , , , . How reliable are patient‐completed medication reconciliation forms compared with pharmacy lists? Am J Emerg Med. 2012;30(7):1048–1054.
- , , , , . Medication reconciliation: barriers and facilitators from the perspectives of resident physicians and pharmacists. J Hosp Med. 2011;6(6):329–337.
- , , , . Medication reconciliation: a qualitative analysis of clinicians' perceptions. Res Social Adm Pharm. 2013;9(4):419–430.
- , . Improving care transitions: optimizing medication reconciliation. J Am Pharm Assoc (2003). 2012;52(4):e43–e52.
Proactive Rounding by RRT
Rapid response teams (RRT) have been promoted by numerous patient safety organizations to reduce preventable in‐hospital deaths.14 Initial studies of RRTs were promising,57 but recent literature,811 including systematic reviews and meta‐analyses, has called these findings into question. Nevertheless, RRTs remain popular in academic and community hospitals worldwide, and many have expanded their roles beyond solely responding to the deteriorating patient.12
Some RRTs, for example, proactively round on seriously ill ward patients and patients recently discharged from the intensive care unit (ICU) in an effort to prevent transitions to higher levels of care. Priestley and colleagues demonstrated that institution of such a team, referred to as a critical care outreach team (CCOT), decreased in‐hospital mortality while possibly increasing hospital length of stay (LOS).13 Three additional single‐center studies from the United Kingdom, where CCOTs are common, specifically examined proactive rounding by CCOTs on the ICU readmission rate: 2 observed no improvement,14, 15 while the third, limited by a small sample size, demonstrated a modest reduction in ICU readmissions.16
We sought to determine the impact of proactive rounding by an RRT on patients discharged from intensive care on the ICU readmission rate, ICU LOS, and in‐hospital mortality of patients discharged from the ICU. We hypothesized that proactive rounding by an RRT would decrease the ICU readmission rate, ICU LOS, and the in‐hospital mortality of patients discharged from the ICU.
MATERIALS AND METHODS
Site and Subjects
We carried out a retrospective, observational study of adult patients discharged from the ICU at University of California San Francisco (UCSF) Medical Center between January 2006 and June 2009. UCSF is a 790‐bed quaternary care academic hospital that admits approximately 17,000 patients annually and has 5 adult ICUs, with 62 beds and 3500 to 4000 ICU admissions annually. Our study was approved by the UCSF Medical Center Committee on Human Research; need for informed consent was waived.
Description of the RRT Before June 1, 2007
Throughout the study, the goal of the RRT was unchanged: to assess, triage, and institute early treatment in patients who experienced an acute decline in their clinical status. From November 2005 to October 2006, the RRT was staffed by an attending hospitalist and medicine resident during daytime, and by a critical care fellow at nighttime and on weekends. The RRT could be activated by any concerned staff member in response to a set of predetermined vital sign abnormalities, decreased urine output, or altered mental status, or simply if the staff member was concerned about the patient's clinical status. Despite extensive educational efforts, utilization of the team was low (2.7 calls per 1000 admissions) and, accordingly, it was discontinued in October 2006. After this time, staff would contact the primary team caring for the patient, should concerns regarding the patient's condition arise.
Description of the RRT After June 1, 2007
In an effort to expand its scope and utility, the RRT was reinstated on June 1, 2007 with a new composition and increased responsibilities. After this date, physician roles were eliminated, and the team composition changed to a dedicated critical care nurse and respiratory therapist, available 24 hours a day. Criteria for calling the team remained unchanged. In addition to responding to acute deteriorations in patients' clinical courses, the RRT began to proactively assess all patients within 12 hours of discharge from the ICU and would continue to round on these patients daily until it was felt that they were clinically stable. During these rounds, the RRT would provide consultation expertise to the bedside nurse and contact the patient's clinicians if concern existed about a patient's clinical trajectory; decisions to transfer a patient back to the ICU ultimately rested with the patient's primary team. During this time period, the RRT received an average of 110.6 calls per 1000 admissions.
Data Sources
Data collected included: demographics, clinical information (all patient refined [APR] severity of illness, APR risk of mortality, and the presence of 29 comorbidities), whether there was a readmission to the ICU, the total ICU LOS, and the vital status at the time of hospital discharge.
Outcomes
Outcomes included: readmission to the ICU, defined as 2 noncontiguous ICU stays during a single hospitalization; ICU LOS, defined as the total number of ICU days accrued during hospitalization; and in‐hospital mortality of patients discharged from the ICU.
Adjustment Variables
Patient age, gender, race, and ethnicity were available from administrative data. We used admission diagnosis code data to classify comorbidities using the method of Elixhauser et al.17
Statistical Analysis
For each of the 3 study outcomes, we assessed the effects of the intervention using multivariable models adjusting for patient‐ and service‐level factors, including a gamma model for ICU LOS and logistic models for ICU readmission and in‐hospital mortality of patients discharged from the ICU. We first compared unadjusted outcome levels before and after implementation. We then used an interrupted time series (ITS) framework to assess the effects of the intervention in terms of 5 measures: 1) the secular trend in the mean of the outcome before the intervention; 2) the change in the mean at the start of the implementation, or immediate effects; 3) the secular trend in the mean after implementation; 4) the change in secular trend, reflecting cumulative intervention effects; and 5) the net effect of the intervention, estimated as the adjusted difference between the fitted mean at the end of the postintervention period and the expected mean if the preintervention trend had continued without interruption or change.
Secondary Analyses
Given the heterogeneity of the RRT in the preintervention period, we assessed potential changes in trend at October 2006, the month in which the RRT was discontinued. We also examined changes in trend midway through the postimplementation period to evaluate for increased efficacy of the RRT with time.
Selection of Covariates
Age, race, and admitting service were included in both the prepost and ITS models by default for face validity. Additional covariates were selected for each outcome using backwards deletion with a retention criterion of P < 0.05, based on models that allowed the outcome rate to vary freely month to month. Because these data were obtained from administrative billing datasets, and the presence of comorbidities could not be definitively linked with time points during hospitalization, only those comorbidities that were likely present prior at ICU discharge were included. For similar reasons, APR severity of illness and risk of mortality scores, which were calculated from billing diagnoses at the end of hospitalization, were excluded from the models.
RESULTS
Patient Characteristics
During the study period, 11,687 patients were admitted to the ICU; 10,288 were discharged from the ICU alive and included in the analysis. In the 17 months prior to the introduction of proactive rounding by the RRT, 4902 (41.9%) patients were admitted, and during the 25 months afterwards, 6785 (58.1%) patients. Patients admitted in the 2 time periods were similar, although there were clinically small but statistically significant differences in race, APR severity of illness, APR risk of mortality, and certain comorbidities between the 2 groups (Table 1).
| Pre‐RRT (n = 4305) N (%) | Post‐RRT (n = 5983) N (%) | P Value | |
|---|---|---|---|
| |||
| Age, mean (y [SD]) | 57.7 [16.6] | 57.9 [16.5] | 0.50 |
| Female gender | 2,005 (46.6) | 2,824 (47.2) | 0.53 |
| Race | 0.0013 | ||
| White | 2,538 (59.0) | 3,520 (58.8) | |
| Black | 327 (7.6) | 436 (7.3) | |
| Asian | 642 (14.9) | 842 (14.1) | |
| Other | 719 (16.7) | 1,121 (18.7) | |
| Unknown | 79 (1.8) | 64 (1.1) | |
| Ethnicity | 0.87 | ||
| Hispanic | 480 (11.2) | 677 (11.3%) | |
| Non‐Hispanic | 3,547 (82.4) | 4,907 (82.0%) | |
| Unknown | 278 (6.5) | 399 (6.7) | |
| Insurance | 0.50 | ||
| Medicare | 1,788 (41.5) | 2,415 (40.4) | |
| Medicaid/Medi‐Cal | 699 (16.2) | 968 (16.2) | |
| Private | 1,642 (38.1) | 2,329 (38.9) | |
| Other | 176 (4.1) | 271 (4.5) | |
| Admission source | 0.41 | ||
| ED | 1,621 (37.7) | 2,244 (37.5) | |
| Outside hospital | 652 (15.2) | 855 (14.3) | |
| Direct admit | 2,032 (47.2) | 2,884 (48.2) | |
| Major surgery | 0.99 | ||
| Yes | 3,107 (72.2) | 4,319 (72.2) | |
| APR severity of illness | 0.0001 | ||
| Mild | 622 (14.5) | 828 (13.8) | |
| Moderate | 1,328 (30.9) | 1,626 (27.2) | |
| Major | 1,292 (30.0) | 1,908 (31.9) | |
| Extreme | 1,063 (24.7) | 1,621 (27.1) | |
| APR risk of mortality | 0.0109 | ||
| Mild | 1,422 (33.0) | 1,821 (30.4) | |
| Moderate | 1,074 (25.0) | 1,467 (24.5) | |
| Major | 947 (22.0) | 1,437 (24.0) | |
| Extreme | 862 (20.0) | 1,258 (21.0) | |
| Admitting service | 0.11 | ||
| Adult general surgery | 190 (4.4) | 260 (4.4) | |
| Cardiology | 347 (8.1) | 424 (7.1) | |
| Cardiothoracic surgery | 671 (15.6) | 930 (15.5) | |
| Kidney transplant surgery | 105 (2.4) | 112 (1.9) | |
| Liver transplant surgery | 298 (6.9) | 379 (6.3) | |
| Medicine | 683 (15.9) | 958 (16.0) | |
| Neurology | 420 (9.8) | 609 (10.2) | |
| Neurosurgery | 1,345 (31.2) | 1,995 (33.3) | |
| Vascular surgery | 246 (5.7) | 316 (5.3) | |
| Comorbidities | |||
| Hypertension | 2,054 (47.7) | 2,886 (48.2) | 0.60 |
| Fluid and electrolyte disorders | 998 (23.2) | 1,723 (28.8) | <0.0001 |
| Diabetes | 708 (16.5) | 880 (14.7) | 0.02 |
| Chronic obstructive pulmonary disease | 632 (14.7) | 849 (14.2) | 0.48 |
| Iron deficiency anemia | 582 (13.5) | 929 (15.5) | 0.005 |
| Renal failure | 541 (12.6) | 744 (12.4) | 0.84 |
| Coagulopathy | 418 (9.7) | 712 (11.9) | 0.0005 |
| Liver disease | 400 (9.3) | 553 (9.2) | 0.93 |
| Hypothyroidism | 330 (7.7) | 500 (8.4) | 0.20 |
| Depression | 306 (7.1) | 508 (8.5) | 0.01 |
| Peripheral vascular disease | 304 (7.1) | 422 (7.1) | 0.99 |
| Congestive heart failure | 263 (6.1) | 360 (6.0) | 0.85 |
| Weight loss | 236 (5.5) | 425 (7.1) | 0.0009 |
| Paralysis | 225 (5.2) | 328 (5.5) | 0.57 |
| Neurological disorders | 229 (5.3) | 276 (4.6) | 0.10 |
| Valvular disease | 210 (4.9) | 329 (5.5) | 0.16 |
| Drug abuse | 198 (4.6) | 268 (4.5) | 0.77 |
| Metastatic cancer | 198 (4.6) | 296 (5.0) | 0.42 |
| Obesity | 201 (4.7) | 306 (5.1) | 0.30 |
| Alcohol abuse | 178 (4.1) | 216 (3.6) | 0.17 |
| Diabetes with complications | 175 (4.1) | 218 (3.6) | 0.27 |
| Solid tumor without metastasis | 146 (3.4) | 245 (4.1) | 0.07 |
| Psychoses | 115 (2.7) | 183 (3.1) | 0.25 |
| Rheumatoid arthritis/collagen vascular disease | 96 (2.2) | 166 (2.8) | 0.08 |
| Pulmonary circulation disease | 83 (1.9) | 181 (3.0) | 0.0005 |
| Outcomes | |||
| Readmission to ICU | 288 (6.7) | 433 (7.3) | 0.24 |
| ICU length of stay, mean [SD] | 5.1 [9.7] | 4.9 [8.3] | 0.24 |
| In‐hospital mortality of patients discharged from the ICU | 260 (6.0) | 326 (5.5) | 0.24 |
ICU Readmission Rate
Introduction of proactive rounding by the RRT was not associated with unadjusted differences in the ICU readmission rate (6.7% preintervention vs 7.3% postintervention, P = 0.24; Table 1). In the adjusted ITS model, the intervention had no net effect on the odds of ICU readmission (adjusted odds ratio [AOR] for net intervention effect 0.98, 95% confidence interval [CI] 0.42, 2.28), with similar secular trends both preintervention (AOR 1.00 per year, 95% CI 0.97, 1.03), and afterwards (AOR 0.99 per year, 95% CI 0.98, 01.00), and a nonsignificant increase at implementation (Table 2). Figure 1 uses solid lines to show the fitted readmission rates, a hatched line to show the projection of the preintervention secular trend into the postintervention period, and circles to represent adjusted monthly means. The lack of a net intervention effect is indicated by the convergence of the solid and hatched lines 24 months postintervention.

| Outcome: Summary Effect Measure | Value (95% CI) | P Value |
|---|---|---|
| ||
| ICU readmission rateadjusted odds ratio | ||
| Pre‐RRT trend | 1.00 (0.97, 1.03) | 0.98 |
| Change at RRT implementation | 1.24 (0.94, 1.63) | 0.13 |
| Post‐RRT trend | 0.98 (0.97, 1.00) | 0.06 |
| Change in trend | 0.98 (0.96, 1.02) | 0.39 |
| Net intervention effect | 0.92 (0.40, 2.12) | 0.85 |
| ICU average length of stayadjusted ratio of means | ||
| Trend at 9 mo pre‐RRT | 0.98 (0.96, 1.00) | 0.05 |
| Trend at 3 mo pre‐RRT | 1.02 (0.99, 1.04) | 0.19 |
| Change in trend at 3 mo pre‐RRT | 1.03 (1.00, 1.07) | 0.07 |
| Change at RRT implementation | 0.92 (0.80, 1.06) | 0.27 |
| Post‐RRT trend | 1.00 (0.99, 1.00) | 0.35 |
| Change in trend at RRT implementation | 0.98 (0.96, 1.01) | 0.14 |
| Net intervention effect | 0.60 (0.31, 1.18) | 0.14 |
| In‐hospital mortality of patients discharged from the ICUadjusted odds ratio | ||
| Pre‐RRT trend | 1.02 (0.99, 1.06) | 0.15 |
| Change at RRT implementation | 0.74 (0.51, 1.08) | 0.12 |
| Post‐RRT trend | 1.00 (0.98, 1.01) | 0.68 |
| Change in trend | 0.97 (0.94, 1.01) | 0.14 |
| Net intervention effect | 0.39 (0.14, 1.10) | 0.08 |
ICU Average LOS
Introduction of proactive rounding by the RRT was not associated with unadjusted differences in ICU average LOS (5.1 days preintervention vs 4.9 days postintervention, P = 0.24; Table 1). Trends in ICU LOS may have changed in October 2006 (P = 0.07), decreasing in the first half of the study period (adjusted rate ratio [ARR] 0.98 per year, 95% CI 0.961.00), but did not change significantly thereafter. As with the ICU readmission rate, neither the change in estimated secular trend after implementation (ARR 0.98, 95% CI 0.961.01), nor the net effect of the intervention (ARR 0.62, 95% CI 0.321.22) was statistically significant (Table 2); these results are depicted graphically in Figure 2.
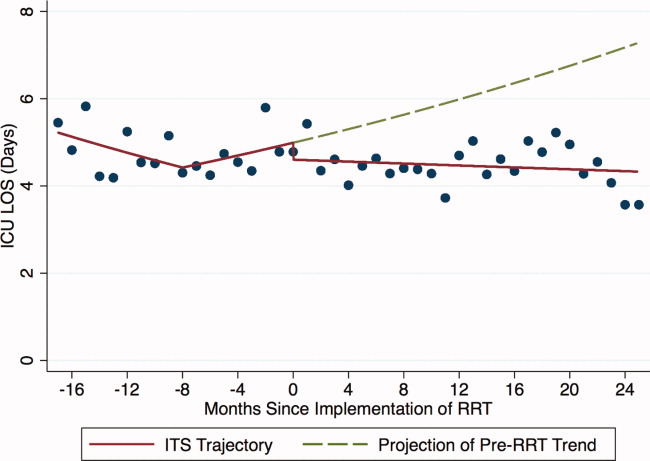
In‐Hospital Mortality of Patients Discharged From the ICU
Introduction of proactive rounding by the RRT was not associated with unadjusted differences in the mortality of patients discharged from the ICU (6.0% preintervention vs 5.5% postintervention, P = 0.24; Table 1). Similarly, in the adjusted ITS model, the intervention had no statistically significant net effect on the mortality outcome (Table 2 and Figure 3).
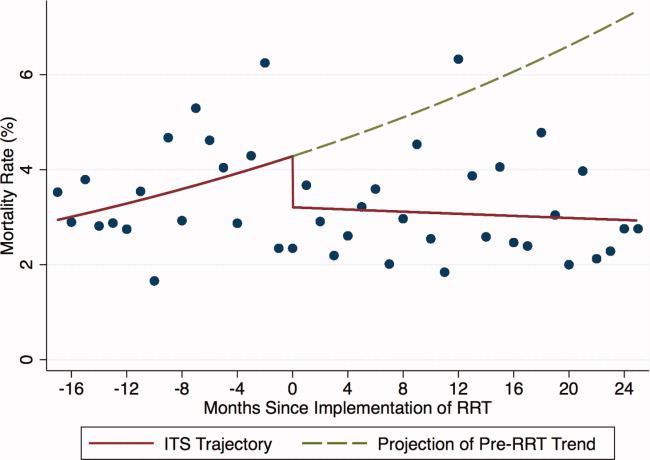
Secondary Analyses
Apart from weak evidence for a change in trend in ICU LOS in October 2006, no other changes in trend were found within the preintervention or postintervention periods (data not shown). This suggests that the heterogeneity of the preintervention RRT had no significant impact on the 3 outcomes examined, and that the RRT intervention failed to gain efficacy with time in the postintervention period. Additionally, we saw no outcome benefit in sensitivity analyses among all ICU patients or in service‐defined analyses (eg, surgical services), where ability to control for illness severity was improved.
DISCUSSION
In this single center study, introduction of an RRT that proactively rounded on patients discharged from the ICU did not reduce the ICU readmission rate, ICU LOS, or mortality of patients discharged from the ICU, after accounting for secular trends using robust ITS methods and adjusting for patient level factors.
Our study is consistent with 2 smaller studies that assessed the impact of proactive rounding by a CCOT on ICU readmission rate. Leary and Ridley14 found that proactively rounding by a CCOT did not reduce ICU readmissions or shorten the ICU LOS, although this study was limited by a surprisingly low ICU readmission rate and short ICU LOS prior to the intervention. Another study15 also observed no change in the ICU readmission rate following introduction of a proactively rounding CCOT but noted small reductions in both ICU and hospital mortality. The sole study showing an effect16 observed a lower ICU readmission rate and increased survival to hospital discharge (after excluding do not resuscitate [DNR] patients) with implementation of a CCOT, although some of their findings may be explained by their CCOT's use of palliative care services, a function not featured in our model.
Our study adds to the meta‐analyses and systematic reviews810 that have questioned the hypothesis that a trained and proactive team of caregivers should be able to prevent patients from returning to the ICU. Perhaps one reason why this is not true is that proactive rounding by RRTs may have minimal effect in systems where step‐down beds are readily available. At UCSF, nearly every patient transferred out of the ICU is triaged to a step‐down unit, where telemetry and pulse oximetry are continuously monitored. Despite this, however, our institution's 2 step‐down units generate more calls to our RRT than any other units in the hospital.
We were surprised to see that proactive rounding failed to shorten ICU LOS, hypothesizing that clinicians would be more comfortable discharging patients from the ICU knowing that the RRT would be closely monitoring them afterwards. Although we have no data to support this hypothesis, increased use of the RRT may have also increased step‐down bed use, as patients on the general medicalsurgical floors were transferred to a higher level of care upon recommendation of the RRT, thereby delaying transfers out of the ICU. Moreover, the opening of an additional 16‐bed ICU in October 2008 might have encouraged clinicians to transfer patients back to the ICU simply because beds were more easily accessible than before.
Introduction of proactive rounding by the RRT was also not associated with differences in the mortality rate of patients discharged from the ICU. This finding conflicts with the results of Garcea et al,15 Ball et al,16 and Priestley et al13, all of which found that implementation of a CCOT led to small but statistically significant reductions in in‐hospital mortality. All 3 of these studies, however, examined smaller patient populations (1380, 470, and 2903 patients, respectively), and both the Priestley and Ball studies13, 16 had significantly shorter periods of data collection (24 months and 32 weeks, respectively). Our results are based on models with confidence intervals and P values that account for variability in all 3 underlying effect estimates but assume a linear extrapolation of the preintervention trend. This approach allowed us to flexibly deal with changes related to the intervention, while relying on our large sample size to define time trends not dealt with adequately (or at all) in previous research.
The lack of improvement in outcomes cannot be attributed to immaturity of the RRT or failure of the clinical staff to use the RRT adequately. A prespecified secondary data analysis midway through the postintervention time period demonstrated that the RRT failed to gain efficacy with time with respect to all 3 outcomes. The postintervention RRT was also utilized far more frequently than its predecessor (110.6 vs 2.7 calls per 1000 admissions, respectively), and this degree of RRT utilization far surpasses the dose considered to be indicative of a mature RRT system.12
Our study has several limitations. First, we relied on administrative rather than chart‐collected data to determine the reason for ICU admission, and the APR severity of illness and risk of mortality scores. It seems unlikely, however, that coding deficiencies or biases affected the preintervention and postintervention patient populations differently. Even though we adjusted for all available measures, it is possible that we were not able to account for time trends in all potential confounders. Second, we did not have detailed clinical information on reasons for ICU readmission and whether readmissions occurred before or after the RRT proactively rounded on the patient. Therefore, potential readmissions to the ICU that might have been planned or which would have happened regardless of the presence of the RRT, such as for antibiotic desensitization, could not be accounted for. Third, introduction of proactive rounding by the RRT in June 2007 was accompanied by a change in the RRT's composition, from a physician‐led model to a nurse‐led model. Therefore, inherent differences in the way that physicians and nurses might assess and triage patients could not have been adjusted for. Lastly, this was a retrospective study conducted at a single academic medical center with a specific RRT model, and our results may not be directly applicable to nonteaching settings or to different RRT models.
Our findings raise further questions about the benefits of RRTs as they assume additional roles, such as proactive rounding on patients recently discharged from the ICU. The failure of our RRT to reduce the ICU readmission rate, the ICU average LOS, and the mortality of patients discharged from the ICU raises concerns that the benefits of our RRT are not commensurate with its cost. While defining the degree of impact and underlying mechanisms are worthy of prospective study, hospitals seeking to improve their RRT models should consider how to develop systems that achieve the RRT's promise in measurable ways.
Acknowledgements
The authors acknowledge Heather Leicester, MSPH, Senior Performance Improvement Analyst for Patient Safety and Quality Services at the University of California San Francisco for her work in data acquisition.
Disclosures: Dr Vittinghoff received salary support from an NIH grant during the time of this work for statistical consulting. He receives textbook royalties from Springer Verlag. Dr Auerbach was supported by 5K24HL098372‐02 from the National Heart Lung and Blood Institute during the period of this study although not specifically for this study; they had no role in the design or conduct of the study; the collection, analysis, or interpretation of the data; or the preparation, review, or approval of the manuscript. The other authors have no financial conflicts of interest.
- , , , . The 100,000 lives campaign: setting a goal and a deadline for improving health care quality. JAMA. 2006;295(3):324–327.
- Clinical Governance Unit, Quality and Safety Branch, Rural and Regional Health and Aged Care Services Division Safer Systems, Department of Human Services, State Government of Victoria. Safer Systems—Saving Lives Campaign. Available at: http://www.health.vic.gov.au/sssl. Accessed April 5, 2012.
- Canadian Patient Safety Institute. Safer Healthcare Now! Campaign. Available at: http://www.saferhealthcarenow.ca. Accessed April 5, 2012.
- , . The growth of rapid response systems. Jt Comm J Qual Patient Saf. 2008;34:489–495.
- , , , . The medical emergency team. Anaesth Intensive Care. 1995;23(2):183–186.
- , , , et al. Rates of in‐hospital arrests, deaths, and intensive care admission: the effect of a medical emergency team. Med J Aust. 2000;173:236–240.
- , , , , . The patient‐at‐risk team: identifying and managing seriously ill ward patients. Anaesthesia. 1999;54:853–860.
- , , , , . Effects of rapid response systems on clinical outcomes: systemic review and meta‐analysis. J Hosp Med. 2007;2:422–432.
- , , , , . Rapid response teams: a systemic review and meta‐analysis. Arch Intern Med. 2010;170(1):18–26.
- , , , , , . Rapid response systems: a systematic review. Crit Care Med. 2007;35(5):1238–1243.
- , , , et al. Introduction of the medical emergency team (MET) system: a cluster‐randomised controlled trial. Lancet. 2005;365:2091–2097.
- , , . Rapid response teams. N Engl J Med. 2011;365:139–146.
- , , , et al. Introducing critical care outreach: a ward‐randomised trial of phased introduction in a general hospital. Intensive Care Med. 2004;30(7):1398–1404.
- , . Impact of an outreach team on re‐admissions to a critical care unit. Anaesthesia. 2003;58:328–332.
- , , , , . Impact of a critical care outreach team on critical care readmissions and mortality. Acta Anaesthesiol Scand. 2004;48:1096–1100.
- , , . Effect of the critical care outreach team on patient survival to discharge from hospital and readmission to critical care: non‐randomised population based study. BMJ. 2003;327:1014–1017.
- , , , . Comorbidity measures for use with administrative data. Med Care. 1998;36(1):8–27.
Rapid response teams (RRT) have been promoted by numerous patient safety organizations to reduce preventable in‐hospital deaths.14 Initial studies of RRTs were promising,57 but recent literature,811 including systematic reviews and meta‐analyses, has called these findings into question. Nevertheless, RRTs remain popular in academic and community hospitals worldwide, and many have expanded their roles beyond solely responding to the deteriorating patient.12
Some RRTs, for example, proactively round on seriously ill ward patients and patients recently discharged from the intensive care unit (ICU) in an effort to prevent transitions to higher levels of care. Priestley and colleagues demonstrated that institution of such a team, referred to as a critical care outreach team (CCOT), decreased in‐hospital mortality while possibly increasing hospital length of stay (LOS).13 Three additional single‐center studies from the United Kingdom, where CCOTs are common, specifically examined proactive rounding by CCOTs on the ICU readmission rate: 2 observed no improvement,14, 15 while the third, limited by a small sample size, demonstrated a modest reduction in ICU readmissions.16
We sought to determine the impact of proactive rounding by an RRT on patients discharged from intensive care on the ICU readmission rate, ICU LOS, and in‐hospital mortality of patients discharged from the ICU. We hypothesized that proactive rounding by an RRT would decrease the ICU readmission rate, ICU LOS, and the in‐hospital mortality of patients discharged from the ICU.
MATERIALS AND METHODS
Site and Subjects
We carried out a retrospective, observational study of adult patients discharged from the ICU at University of California San Francisco (UCSF) Medical Center between January 2006 and June 2009. UCSF is a 790‐bed quaternary care academic hospital that admits approximately 17,000 patients annually and has 5 adult ICUs, with 62 beds and 3500 to 4000 ICU admissions annually. Our study was approved by the UCSF Medical Center Committee on Human Research; need for informed consent was waived.
Description of the RRT Before June 1, 2007
Throughout the study, the goal of the RRT was unchanged: to assess, triage, and institute early treatment in patients who experienced an acute decline in their clinical status. From November 2005 to October 2006, the RRT was staffed by an attending hospitalist and medicine resident during daytime, and by a critical care fellow at nighttime and on weekends. The RRT could be activated by any concerned staff member in response to a set of predetermined vital sign abnormalities, decreased urine output, or altered mental status, or simply if the staff member was concerned about the patient's clinical status. Despite extensive educational efforts, utilization of the team was low (2.7 calls per 1000 admissions) and, accordingly, it was discontinued in October 2006. After this time, staff would contact the primary team caring for the patient, should concerns regarding the patient's condition arise.
Description of the RRT After June 1, 2007
In an effort to expand its scope and utility, the RRT was reinstated on June 1, 2007 with a new composition and increased responsibilities. After this date, physician roles were eliminated, and the team composition changed to a dedicated critical care nurse and respiratory therapist, available 24 hours a day. Criteria for calling the team remained unchanged. In addition to responding to acute deteriorations in patients' clinical courses, the RRT began to proactively assess all patients within 12 hours of discharge from the ICU and would continue to round on these patients daily until it was felt that they were clinically stable. During these rounds, the RRT would provide consultation expertise to the bedside nurse and contact the patient's clinicians if concern existed about a patient's clinical trajectory; decisions to transfer a patient back to the ICU ultimately rested with the patient's primary team. During this time period, the RRT received an average of 110.6 calls per 1000 admissions.
Data Sources
Data collected included: demographics, clinical information (all patient refined [APR] severity of illness, APR risk of mortality, and the presence of 29 comorbidities), whether there was a readmission to the ICU, the total ICU LOS, and the vital status at the time of hospital discharge.
Outcomes
Outcomes included: readmission to the ICU, defined as 2 noncontiguous ICU stays during a single hospitalization; ICU LOS, defined as the total number of ICU days accrued during hospitalization; and in‐hospital mortality of patients discharged from the ICU.
Adjustment Variables
Patient age, gender, race, and ethnicity were available from administrative data. We used admission diagnosis code data to classify comorbidities using the method of Elixhauser et al.17
Statistical Analysis
For each of the 3 study outcomes, we assessed the effects of the intervention using multivariable models adjusting for patient‐ and service‐level factors, including a gamma model for ICU LOS and logistic models for ICU readmission and in‐hospital mortality of patients discharged from the ICU. We first compared unadjusted outcome levels before and after implementation. We then used an interrupted time series (ITS) framework to assess the effects of the intervention in terms of 5 measures: 1) the secular trend in the mean of the outcome before the intervention; 2) the change in the mean at the start of the implementation, or immediate effects; 3) the secular trend in the mean after implementation; 4) the change in secular trend, reflecting cumulative intervention effects; and 5) the net effect of the intervention, estimated as the adjusted difference between the fitted mean at the end of the postintervention period and the expected mean if the preintervention trend had continued without interruption or change.
Secondary Analyses
Given the heterogeneity of the RRT in the preintervention period, we assessed potential changes in trend at October 2006, the month in which the RRT was discontinued. We also examined changes in trend midway through the postimplementation period to evaluate for increased efficacy of the RRT with time.
Selection of Covariates
Age, race, and admitting service were included in both the prepost and ITS models by default for face validity. Additional covariates were selected for each outcome using backwards deletion with a retention criterion of P < 0.05, based on models that allowed the outcome rate to vary freely month to month. Because these data were obtained from administrative billing datasets, and the presence of comorbidities could not be definitively linked with time points during hospitalization, only those comorbidities that were likely present prior at ICU discharge were included. For similar reasons, APR severity of illness and risk of mortality scores, which were calculated from billing diagnoses at the end of hospitalization, were excluded from the models.
RESULTS
Patient Characteristics
During the study period, 11,687 patients were admitted to the ICU; 10,288 were discharged from the ICU alive and included in the analysis. In the 17 months prior to the introduction of proactive rounding by the RRT, 4902 (41.9%) patients were admitted, and during the 25 months afterwards, 6785 (58.1%) patients. Patients admitted in the 2 time periods were similar, although there were clinically small but statistically significant differences in race, APR severity of illness, APR risk of mortality, and certain comorbidities between the 2 groups (Table 1).
| Pre‐RRT (n = 4305) N (%) | Post‐RRT (n = 5983) N (%) | P Value | |
|---|---|---|---|
| |||
| Age, mean (y [SD]) | 57.7 [16.6] | 57.9 [16.5] | 0.50 |
| Female gender | 2,005 (46.6) | 2,824 (47.2) | 0.53 |
| Race | 0.0013 | ||
| White | 2,538 (59.0) | 3,520 (58.8) | |
| Black | 327 (7.6) | 436 (7.3) | |
| Asian | 642 (14.9) | 842 (14.1) | |
| Other | 719 (16.7) | 1,121 (18.7) | |
| Unknown | 79 (1.8) | 64 (1.1) | |
| Ethnicity | 0.87 | ||
| Hispanic | 480 (11.2) | 677 (11.3%) | |
| Non‐Hispanic | 3,547 (82.4) | 4,907 (82.0%) | |
| Unknown | 278 (6.5) | 399 (6.7) | |
| Insurance | 0.50 | ||
| Medicare | 1,788 (41.5) | 2,415 (40.4) | |
| Medicaid/Medi‐Cal | 699 (16.2) | 968 (16.2) | |
| Private | 1,642 (38.1) | 2,329 (38.9) | |
| Other | 176 (4.1) | 271 (4.5) | |
| Admission source | 0.41 | ||
| ED | 1,621 (37.7) | 2,244 (37.5) | |
| Outside hospital | 652 (15.2) | 855 (14.3) | |
| Direct admit | 2,032 (47.2) | 2,884 (48.2) | |
| Major surgery | 0.99 | ||
| Yes | 3,107 (72.2) | 4,319 (72.2) | |
| APR severity of illness | 0.0001 | ||
| Mild | 622 (14.5) | 828 (13.8) | |
| Moderate | 1,328 (30.9) | 1,626 (27.2) | |
| Major | 1,292 (30.0) | 1,908 (31.9) | |
| Extreme | 1,063 (24.7) | 1,621 (27.1) | |
| APR risk of mortality | 0.0109 | ||
| Mild | 1,422 (33.0) | 1,821 (30.4) | |
| Moderate | 1,074 (25.0) | 1,467 (24.5) | |
| Major | 947 (22.0) | 1,437 (24.0) | |
| Extreme | 862 (20.0) | 1,258 (21.0) | |
| Admitting service | 0.11 | ||
| Adult general surgery | 190 (4.4) | 260 (4.4) | |
| Cardiology | 347 (8.1) | 424 (7.1) | |
| Cardiothoracic surgery | 671 (15.6) | 930 (15.5) | |
| Kidney transplant surgery | 105 (2.4) | 112 (1.9) | |
| Liver transplant surgery | 298 (6.9) | 379 (6.3) | |
| Medicine | 683 (15.9) | 958 (16.0) | |
| Neurology | 420 (9.8) | 609 (10.2) | |
| Neurosurgery | 1,345 (31.2) | 1,995 (33.3) | |
| Vascular surgery | 246 (5.7) | 316 (5.3) | |
| Comorbidities | |||
| Hypertension | 2,054 (47.7) | 2,886 (48.2) | 0.60 |
| Fluid and electrolyte disorders | 998 (23.2) | 1,723 (28.8) | <0.0001 |
| Diabetes | 708 (16.5) | 880 (14.7) | 0.02 |
| Chronic obstructive pulmonary disease | 632 (14.7) | 849 (14.2) | 0.48 |
| Iron deficiency anemia | 582 (13.5) | 929 (15.5) | 0.005 |
| Renal failure | 541 (12.6) | 744 (12.4) | 0.84 |
| Coagulopathy | 418 (9.7) | 712 (11.9) | 0.0005 |
| Liver disease | 400 (9.3) | 553 (9.2) | 0.93 |
| Hypothyroidism | 330 (7.7) | 500 (8.4) | 0.20 |
| Depression | 306 (7.1) | 508 (8.5) | 0.01 |
| Peripheral vascular disease | 304 (7.1) | 422 (7.1) | 0.99 |
| Congestive heart failure | 263 (6.1) | 360 (6.0) | 0.85 |
| Weight loss | 236 (5.5) | 425 (7.1) | 0.0009 |
| Paralysis | 225 (5.2) | 328 (5.5) | 0.57 |
| Neurological disorders | 229 (5.3) | 276 (4.6) | 0.10 |
| Valvular disease | 210 (4.9) | 329 (5.5) | 0.16 |
| Drug abuse | 198 (4.6) | 268 (4.5) | 0.77 |
| Metastatic cancer | 198 (4.6) | 296 (5.0) | 0.42 |
| Obesity | 201 (4.7) | 306 (5.1) | 0.30 |
| Alcohol abuse | 178 (4.1) | 216 (3.6) | 0.17 |
| Diabetes with complications | 175 (4.1) | 218 (3.6) | 0.27 |
| Solid tumor without metastasis | 146 (3.4) | 245 (4.1) | 0.07 |
| Psychoses | 115 (2.7) | 183 (3.1) | 0.25 |
| Rheumatoid arthritis/collagen vascular disease | 96 (2.2) | 166 (2.8) | 0.08 |
| Pulmonary circulation disease | 83 (1.9) | 181 (3.0) | 0.0005 |
| Outcomes | |||
| Readmission to ICU | 288 (6.7) | 433 (7.3) | 0.24 |
| ICU length of stay, mean [SD] | 5.1 [9.7] | 4.9 [8.3] | 0.24 |
| In‐hospital mortality of patients discharged from the ICU | 260 (6.0) | 326 (5.5) | 0.24 |
ICU Readmission Rate
Introduction of proactive rounding by the RRT was not associated with unadjusted differences in the ICU readmission rate (6.7% preintervention vs 7.3% postintervention, P = 0.24; Table 1). In the adjusted ITS model, the intervention had no net effect on the odds of ICU readmission (adjusted odds ratio [AOR] for net intervention effect 0.98, 95% confidence interval [CI] 0.42, 2.28), with similar secular trends both preintervention (AOR 1.00 per year, 95% CI 0.97, 1.03), and afterwards (AOR 0.99 per year, 95% CI 0.98, 01.00), and a nonsignificant increase at implementation (Table 2). Figure 1 uses solid lines to show the fitted readmission rates, a hatched line to show the projection of the preintervention secular trend into the postintervention period, and circles to represent adjusted monthly means. The lack of a net intervention effect is indicated by the convergence of the solid and hatched lines 24 months postintervention.
| Outcome: Summary Effect Measure | Value (95% CI) | P Value |
|---|---|---|
| ||
| ICU readmission rateadjusted odds ratio | ||
| Pre‐RRT trend | 1.00 (0.97, 1.03) | 0.98 |
| Change at RRT implementation | 1.24 (0.94, 1.63) | 0.13 |
| Post‐RRT trend | 0.98 (0.97, 1.00) | 0.06 |
| Change in trend | 0.98 (0.96, 1.02) | 0.39 |
| Net intervention effect | 0.92 (0.40, 2.12) | 0.85 |
| ICU average length of stayadjusted ratio of means | ||
| Trend at 9 mo pre‐RRT | 0.98 (0.96, 1.00) | 0.05 |
| Trend at 3 mo pre‐RRT | 1.02 (0.99, 1.04) | 0.19 |
| Change in trend at 3 mo pre‐RRT | 1.03 (1.00, 1.07) | 0.07 |
| Change at RRT implementation | 0.92 (0.80, 1.06) | 0.27 |
| Post‐RRT trend | 1.00 (0.99, 1.00) | 0.35 |
| Change in trend at RRT implementation | 0.98 (0.96, 1.01) | 0.14 |
| Net intervention effect | 0.60 (0.31, 1.18) | 0.14 |
| In‐hospital mortality of patients discharged from the ICUadjusted odds ratio | ||
| Pre‐RRT trend | 1.02 (0.99, 1.06) | 0.15 |
| Change at RRT implementation | 0.74 (0.51, 1.08) | 0.12 |
| Post‐RRT trend | 1.00 (0.98, 1.01) | 0.68 |
| Change in trend | 0.97 (0.94, 1.01) | 0.14 |
| Net intervention effect | 0.39 (0.14, 1.10) | 0.08 |
ICU Average LOS
Introduction of proactive rounding by the RRT was not associated with unadjusted differences in ICU average LOS (5.1 days preintervention vs 4.9 days postintervention, P = 0.24; Table 1). Trends in ICU LOS may have changed in October 2006 (P = 0.07), decreasing in the first half of the study period (adjusted rate ratio [ARR] 0.98 per year, 95% CI 0.961.00), but did not change significantly thereafter. As with the ICU readmission rate, neither the change in estimated secular trend after implementation (ARR 0.98, 95% CI 0.961.01), nor the net effect of the intervention (ARR 0.62, 95% CI 0.321.22) was statistically significant (Table 2); these results are depicted graphically in Figure 2.
In‐Hospital Mortality of Patients Discharged From the ICU
Introduction of proactive rounding by the RRT was not associated with unadjusted differences in the mortality of patients discharged from the ICU (6.0% preintervention vs 5.5% postintervention, P = 0.24; Table 1). Similarly, in the adjusted ITS model, the intervention had no statistically significant net effect on the mortality outcome (Table 2 and Figure 3).
Secondary Analyses
Apart from weak evidence for a change in trend in ICU LOS in October 2006, no other changes in trend were found within the preintervention or postintervention periods (data not shown). This suggests that the heterogeneity of the preintervention RRT had no significant impact on the 3 outcomes examined, and that the RRT intervention failed to gain efficacy with time in the postintervention period. Additionally, we saw no outcome benefit in sensitivity analyses among all ICU patients or in service‐defined analyses (eg, surgical services), where ability to control for illness severity was improved.
DISCUSSION
In this single center study, introduction of an RRT that proactively rounded on patients discharged from the ICU did not reduce the ICU readmission rate, ICU LOS, or mortality of patients discharged from the ICU, after accounting for secular trends using robust ITS methods and adjusting for patient level factors.
Our study is consistent with 2 smaller studies that assessed the impact of proactive rounding by a CCOT on ICU readmission rate. Leary and Ridley14 found that proactively rounding by a CCOT did not reduce ICU readmissions or shorten the ICU LOS, although this study was limited by a surprisingly low ICU readmission rate and short ICU LOS prior to the intervention. Another study15 also observed no change in the ICU readmission rate following introduction of a proactively rounding CCOT but noted small reductions in both ICU and hospital mortality. The sole study showing an effect16 observed a lower ICU readmission rate and increased survival to hospital discharge (after excluding do not resuscitate [DNR] patients) with implementation of a CCOT, although some of their findings may be explained by their CCOT's use of palliative care services, a function not featured in our model.
Our study adds to the meta‐analyses and systematic reviews810 that have questioned the hypothesis that a trained and proactive team of caregivers should be able to prevent patients from returning to the ICU. Perhaps one reason why this is not true is that proactive rounding by RRTs may have minimal effect in systems where step‐down beds are readily available. At UCSF, nearly every patient transferred out of the ICU is triaged to a step‐down unit, where telemetry and pulse oximetry are continuously monitored. Despite this, however, our institution's 2 step‐down units generate more calls to our RRT than any other units in the hospital.
We were surprised to see that proactive rounding failed to shorten ICU LOS, hypothesizing that clinicians would be more comfortable discharging patients from the ICU knowing that the RRT would be closely monitoring them afterwards. Although we have no data to support this hypothesis, increased use of the RRT may have also increased step‐down bed use, as patients on the general medicalsurgical floors were transferred to a higher level of care upon recommendation of the RRT, thereby delaying transfers out of the ICU. Moreover, the opening of an additional 16‐bed ICU in October 2008 might have encouraged clinicians to transfer patients back to the ICU simply because beds were more easily accessible than before.
Introduction of proactive rounding by the RRT was also not associated with differences in the mortality rate of patients discharged from the ICU. This finding conflicts with the results of Garcea et al,15 Ball et al,16 and Priestley et al13, all of which found that implementation of a CCOT led to small but statistically significant reductions in in‐hospital mortality. All 3 of these studies, however, examined smaller patient populations (1380, 470, and 2903 patients, respectively), and both the Priestley and Ball studies13, 16 had significantly shorter periods of data collection (24 months and 32 weeks, respectively). Our results are based on models with confidence intervals and P values that account for variability in all 3 underlying effect estimates but assume a linear extrapolation of the preintervention trend. This approach allowed us to flexibly deal with changes related to the intervention, while relying on our large sample size to define time trends not dealt with adequately (or at all) in previous research.
The lack of improvement in outcomes cannot be attributed to immaturity of the RRT or failure of the clinical staff to use the RRT adequately. A prespecified secondary data analysis midway through the postintervention time period demonstrated that the RRT failed to gain efficacy with time with respect to all 3 outcomes. The postintervention RRT was also utilized far more frequently than its predecessor (110.6 vs 2.7 calls per 1000 admissions, respectively), and this degree of RRT utilization far surpasses the dose considered to be indicative of a mature RRT system.12
Our study has several limitations. First, we relied on administrative rather than chart‐collected data to determine the reason for ICU admission, and the APR severity of illness and risk of mortality scores. It seems unlikely, however, that coding deficiencies or biases affected the preintervention and postintervention patient populations differently. Even though we adjusted for all available measures, it is possible that we were not able to account for time trends in all potential confounders. Second, we did not have detailed clinical information on reasons for ICU readmission and whether readmissions occurred before or after the RRT proactively rounded on the patient. Therefore, potential readmissions to the ICU that might have been planned or which would have happened regardless of the presence of the RRT, such as for antibiotic desensitization, could not be accounted for. Third, introduction of proactive rounding by the RRT in June 2007 was accompanied by a change in the RRT's composition, from a physician‐led model to a nurse‐led model. Therefore, inherent differences in the way that physicians and nurses might assess and triage patients could not have been adjusted for. Lastly, this was a retrospective study conducted at a single academic medical center with a specific RRT model, and our results may not be directly applicable to nonteaching settings or to different RRT models.
Our findings raise further questions about the benefits of RRTs as they assume additional roles, such as proactive rounding on patients recently discharged from the ICU. The failure of our RRT to reduce the ICU readmission rate, the ICU average LOS, and the mortality of patients discharged from the ICU raises concerns that the benefits of our RRT are not commensurate with its cost. While defining the degree of impact and underlying mechanisms are worthy of prospective study, hospitals seeking to improve their RRT models should consider how to develop systems that achieve the RRT's promise in measurable ways.
Acknowledgements
The authors acknowledge Heather Leicester, MSPH, Senior Performance Improvement Analyst for Patient Safety and Quality Services at the University of California San Francisco for her work in data acquisition.
Disclosures: Dr Vittinghoff received salary support from an NIH grant during the time of this work for statistical consulting. He receives textbook royalties from Springer Verlag. Dr Auerbach was supported by 5K24HL098372‐02 from the National Heart Lung and Blood Institute during the period of this study although not specifically for this study; they had no role in the design or conduct of the study; the collection, analysis, or interpretation of the data; or the preparation, review, or approval of the manuscript. The other authors have no financial conflicts of interest.
- , , , . The 100,000 lives campaign: setting a goal and a deadline for improving health care quality. JAMA. 2006;295(3):324–327.
- Clinical Governance Unit, Quality and Safety Branch, Rural and Regional Health and Aged Care Services Division Safer Systems, Department of Human Services, State Government of Victoria. Safer Systems—Saving Lives Campaign. Available at: http://www.health.vic.gov.au/sssl. Accessed April 5, 2012.
- Canadian Patient Safety Institute. Safer Healthcare Now! Campaign. Available at: http://www.saferhealthcarenow.ca. Accessed April 5, 2012.
- , . The growth of rapid response systems. Jt Comm J Qual Patient Saf. 2008;34:489–495.
- , , , . The medical emergency team. Anaesth Intensive Care. 1995;23(2):183–186.
- , , , et al. Rates of in‐hospital arrests, deaths, and intensive care admission: the effect of a medical emergency team. Med J Aust. 2000;173:236–240.
- , , , , . The patient‐at‐risk team: identifying and managing seriously ill ward patients. Anaesthesia. 1999;54:853–860.
- , , , , . Effects of rapid response systems on clinical outcomes: systemic review and meta‐analysis. J Hosp Med. 2007;2:422–432.
- , , , , . Rapid response teams: a systemic review and meta‐analysis. Arch Intern Med. 2010;170(1):18–26.
- , , , , , . Rapid response systems: a systematic review. Crit Care Med. 2007;35(5):1238–1243.
- , , , et al. Introduction of the medical emergency team (MET) system: a cluster‐randomised controlled trial. Lancet. 2005;365:2091–2097.
- , , . Rapid response teams. N Engl J Med. 2011;365:139–146.
- , , , et al. Introducing critical care outreach: a ward‐randomised trial of phased introduction in a general hospital. Intensive Care Med. 2004;30(7):1398–1404.
- , . Impact of an outreach team on re‐admissions to a critical care unit. Anaesthesia. 2003;58:328–332.
- , , , , . Impact of a critical care outreach team on critical care readmissions and mortality. Acta Anaesthesiol Scand. 2004;48:1096–1100.
- , , . Effect of the critical care outreach team on patient survival to discharge from hospital and readmission to critical care: non‐randomised population based study. BMJ. 2003;327:1014–1017.
- , , , . Comorbidity measures for use with administrative data. Med Care. 1998;36(1):8–27.
Copyright © 2012 Society of Hospital Medicine
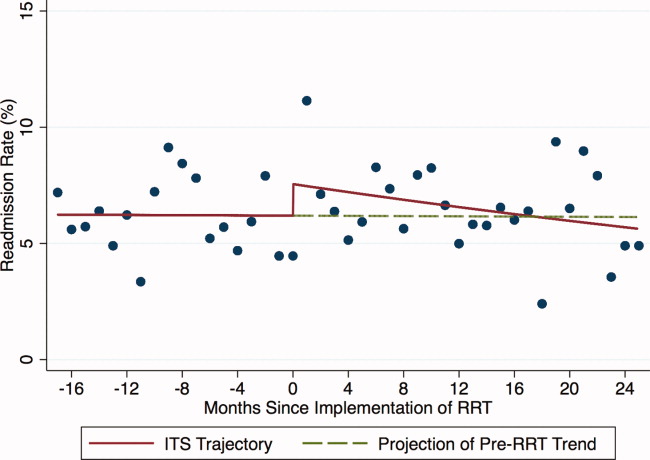
Accuracy of GoogleTranslate™
The population of patients in the US with limited English proficiency (LEP)those who speak English less than very well1is substantial and continues to grow.1, 2 Patients with LEP are at risk for lower quality health care overall than their English‐speaking counterparts.38 Professional in‐person interpreters greatly improve spoken communication and quality of care for these patients,4, 9 but their assistance is typically based on the clinical encounter. Particularly if interpreting by phone, interpreters are unlikely to be able to help with materials such as discharge instructions or information sheets meant for family members. Professional written translations of patient educational material help to bridge this gap, allowing clinicians to convey detailed written instructions to patients. However, professional translations must be prepared well in advance of any encounter and can only be used for easily anticipated problems.
The need to translate less common, patient‐specific instructions arises spontaneously in clinical practice, and formally prepared written translations are not useful in these situations. Online translation tools such as GoogleTranslate (available at
We conducted a pilot evaluation of an online translation tool as it relates to detailed, complex patient educational material. Our primary goal was to compare the accuracy of a Spanish translation generated by the online tool to that done by a professional agency. Our secondary goals were: 1) to assess whether sentence word length or complexity mediated the accuracy of GT; and 2) to lay the foundation for a more comprehensive study of the accuracy of online translation tools, with respect to patient educational material.
Methods
Translation Tool and Language Choice
We selected Google Translate (GT) since it is one of the more commonly used online translation tools and because Google is the most widely used search engine in the United States.13 GT uses statistical translation methodology to convert text, documents, and websites between languages; statistical translation involves the following three steps. First, the translation program recognizes a sentence to translate. Second, it compares the words and phrases within that sentence to the billions of words in its library (drawn from bilingual professionally translated documents, such as United Nations proceedings). Third, it uses this comparison to generate a translation combining the words and phrases deemed most equivalent between the source sentence and the target language. If there are multiple sentences, the program recognizes and translates each independently. As the body of bilingual work grows, the program learns and refines its rules automatically.14 In contrast, in rule‐based translation, a program would use manually prespecified rules regarding word choice and grammar to generate a translation.15 We assessed GT's accuracy translating from English to Spanish because Spanish is the predominant non‐English language spoken in the US.1
Document Selection and Preparation
We selected the instruction manual regarding warfarin use prepared by the Agency for Healthcare Research and Quality (AHRQ) for this accuracy evaluation. We selected this manual,16 written at a 6th grade reading level, because a professional Spanish translation was available (completed by ASET International Service, LLC, before and independently of this study), and because patient educational material regarding warfarin has been associated with fewer bleeding events.17 We downloaded the English document on October 19, 2009 and used the GT website to translate it en bloc. We then copied the resulting Spanish output into a text file. The English document and the professional Spanish translation (downloaded the same day) were both converted into text files in the same manner.
Grading Methodology
We scored the translation chosen using both manual and automated evaluation techniques. These techniques are widely used in the machine translation literature and are explained below.
Manual Evaluation: Evaluators, Domains, Scoring
We recruited three nonclinician, bilingual, nativeSpanish‐speaking research assistants as evaluators. The evaluators were all college educated with a Bachelor's degree or higher and were of Mexican, Nicaraguan, and Guatemalan ancestry. Each evaluator received a brief orientation regarding the project, as well as an explanation of the scores, and then proceeded to the blinded evaluation independently.
We asked evaluators to score sentences on Likert scales along five primary domains: fluency, adequacy, meaning, severity, and preference. Fluency and adequacy are well accepted components of machine translation evaluation,18 with fluency being an assessment of grammar and readability ranging from 5 (Perfect fluency; like reading a newspaper) to 1 (No fluency; no appreciable grammar, not understandable) and adequacy being an assessment of information preservation ranging from 5 (100% of information conveyed from the original) to 1 (0% of information conveyed from the original). Given that a sentence can be highly adequate but drastically change the connotation and intent of the sentence (eg, a sentence that contains 75% of the correct words but changes a sentence from take this medication twice a day to take this medication once every two days), we asked evaluators to assess meaning, a measure of connotation and intent maintenance, with scores ranging from 5 (Same meaning as original) to 1 (Totally different meaning from the original).19 Evaluators also assessed severity, a new measure of potential harm if a given sentence was assessed as having errors of any kind, ranging from 5 (Error, no effect on patient care) to 1 (Error, dangerous to patient) with an additional option of N/A (Sentence basically accurate). Finally, evaluators rated a blinded preference (also a new measure) for either of two translated sentences, ranging from Strongly prefer translation #1 to Strongly prefer translation #2. The order of the sentences was random (eg, sometimes the professional translation was first and sometimes the GT translation was). We subsequently converted this to preference for the professional translation, ranging from 5 (Strongly prefer the professional translation) to 1 (Strongly prefer the GT translation) in order to standardize the responses (Figures 1 and 2).

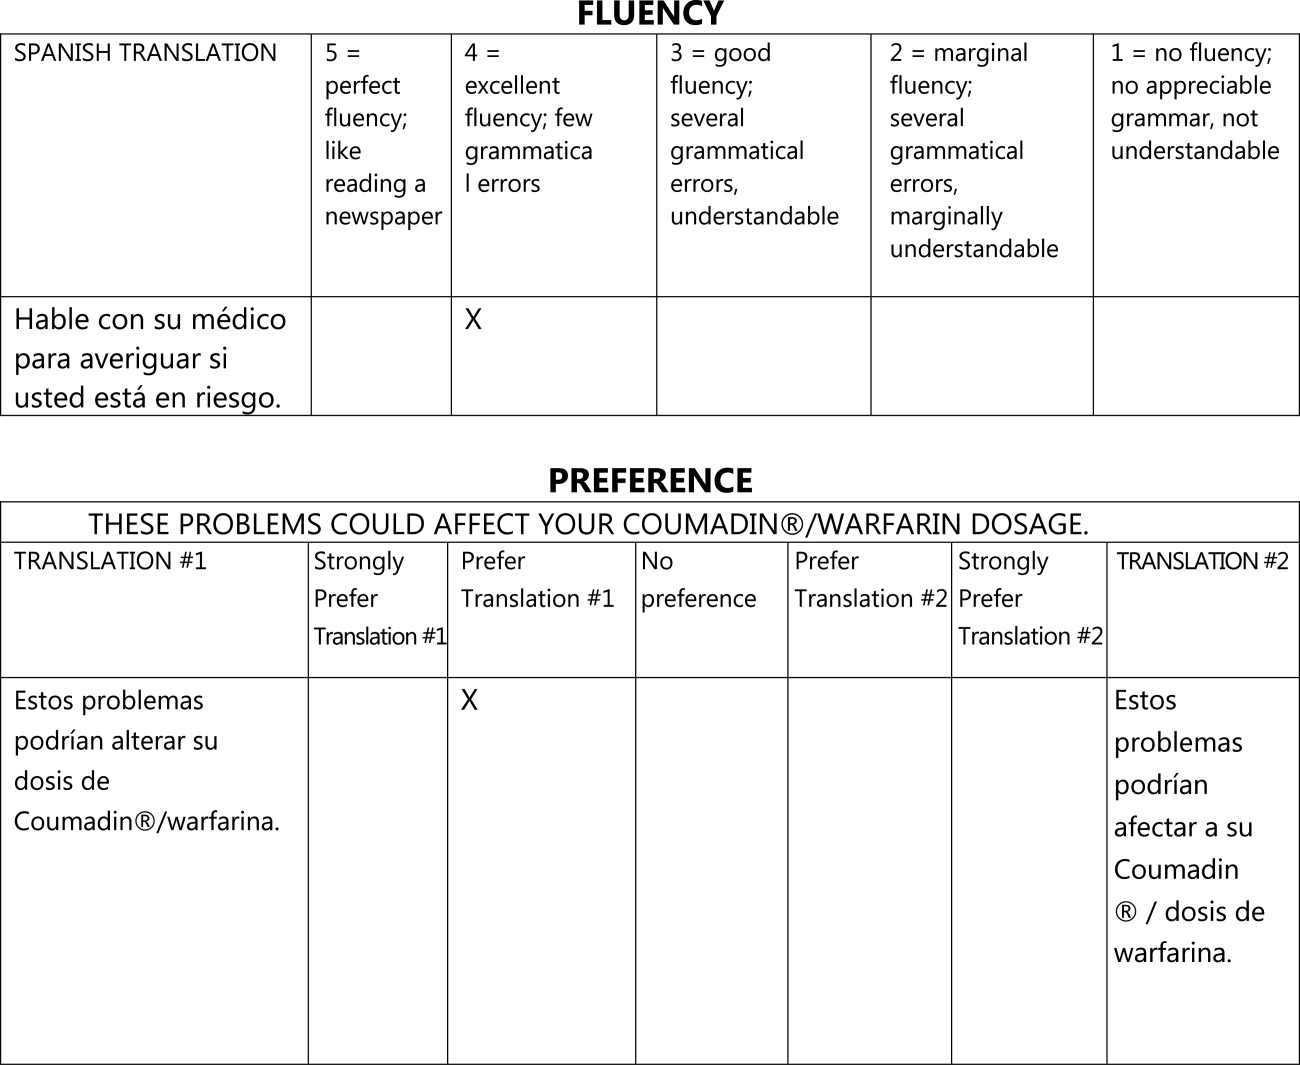
The overall flow of the study is given in Figure 3. Each evaluator initially scored 20 sentences translated by GT and 10 sentences translated professionally along the first four domains. All 30 of these sentences were randomly selected from the original, 263‐sentence pamphlet. For fluency, evaluators had access only to the translated sentence to be scored; for adequacy, meaning, and severity, they had access to both the translated sentence and the original English sentence. Ten of the 30 sentences were further selected randomly for scoring on the preference domain. For these 10 sentences, evaluators compared the GT and professional translations of the same sentence (with the original English sentence available as a reference) and indicated a preference, for any reason, for one translation or the other. Evaluators were blinded to the technique of translation (GT or professional) for all scored sentences and domains. We chose twice as many sentences from the GT preparations for the first four domains to maximize measurements for the translation technology we were evaluating, with the smaller number of professional translations serving as controls.
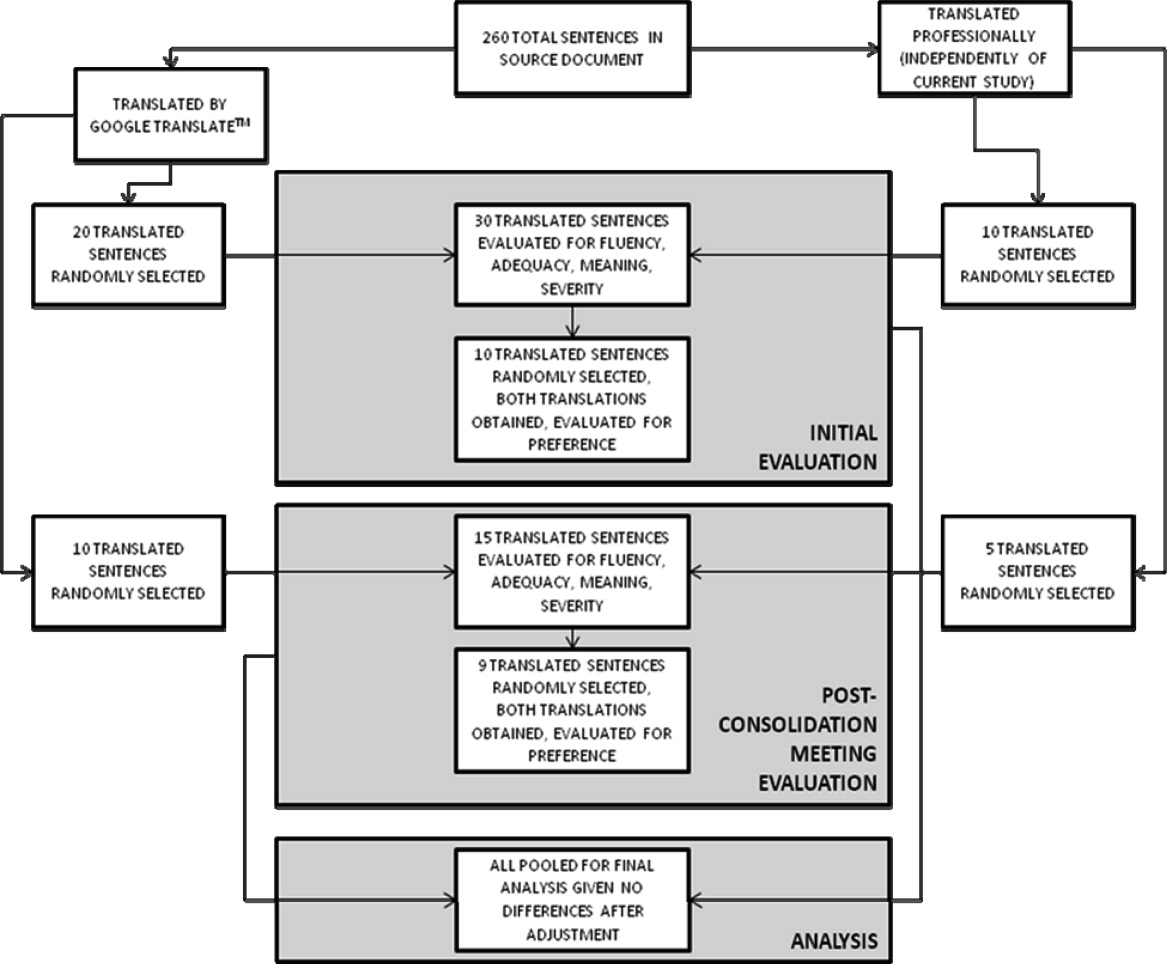
After scoring the first 30 sentences, evaluators met with one of the authors (R.R.K.) to discuss and consolidate their approach to scoring. They then scored an additional 10 GT‐translated sentences and 5 professionally translated sentences for the first four domains, and 9 of these 15 sentences for preference, to see if the meeting changed their scoring approach. These sentences were selected randomly from the original, 263‐sentence pamphlet, excluding the 30 evaluated in the previous step.
Automated Machine Translation Evaluation
Machine translation researchers have developed automated measures allowing the rapid and inexpensive scoring and rescoring of translations. These automated measures supplement more time‐ and resource‐intensive manual evaluations. The automated measures are based upon how well the translation compares to one or, ideally, multiple professionally prepared reference translations. They correlate well with human judgments on the domains above, especially when multiple reference translations are used (increasing the number of reference translations increases the variability allowed for words and phrases in the machine translation, improving the likelihood that differences in score are related to differences in quality rather than differences in translator preference).20 For this study, we used Metric for Evaluation of Translation with Explicit Ordering (METEOR), a machine translation evaluation system that allows additional flexibility for the machine translation in terms of grading individual sentences and being sensitive to synonyms, word stemming, and word order.21 We obtained a METEOR score for each of the GT‐translated sentences using the professional translation as our reference, and assessed correlation between this automated measure and the manual evaluations for the GT sentences, with the aim of assessing the feasibility of using METEOR in future work on patient educational material translation.
Outcomes and Statistical Analysis
We compared the scores assigned to GT‐translated sentences for each of the five manually scored domains as compared to the scores of the professionally translated sentences, as well as the impact of word count and sentence complexity on the scores achieved specifically by the GT‐translated sentences, using clustered linear regression to account for the fact that each of the 45 sentences were scored by each of the three evaluators. Sentences were classified as simple if they contained one or fewer clauses and complex if they contained more than one clause.22 We also assessed interrater reliability for the manual scoring system using intraclass correlation coefficients and repeatability. Repeatability is an estimate of the maximum difference, with 95% confidence, between scores assigned to the same sentence on the same domain by two different evaluators;23 lower scores indicate greater agreement between evaluators. Since we did not have clinical data or a gold standard, we used repeatability to estimate the value above which a difference between two scores might be clinically significant and not simply due to interrater variability.24 Finally, we assessed the correlation of the manual scores with those calculated by the METEOR automated evaluation tool using Pearson correlation coefficients. All analyses were conducted using Stata 11 (College Station, TX).
Results
Sentence Description
A total of 45 sentences were evaluated by the bilingual research assistants. The initial 30 sentences and the subsequent, post‐consolidation meeting 15 sentences were scored similarly in all outcomes, after adjustment for word length and complexity, so we pooled all 45 sentences (as well as the 19 total sentence pairs scored for preference) for the final analysis. Average sentence lengths were 14.2 words, 15.5 words, and 16.6 words for the English source text, professionally translated sentences, and GT‐translated sentences, respectively. Thirty‐three percent of the English source sentences were simple and 67% were complex.
Manual Evaluation Scores
Sentences translated by GT received worse scores on fluency as compared to the professional translations (3.4 vs 4.7, P < 0.0001). Comparisons for adequacy and meaning were not statistically significantly different. GT‐translated sentences contained more errors of any severity as compared to the professional translations (39% vs 22%, P = 0.05), but a similar number of serious, clinically impactful errors (severity scores of 3, 2, or 1; 4% vs 2%, P = 0.61). However, one GT‐translated sentence was considered erroneous with a severity level of 1 (Error, dangerous to patient). This particular sentence was 25 words long and complex in structure in the original English document; all three evaluators considered the GT translation nonsensical (La hemorragia mayor, llame a su mdico, o ir a la emergencia de un hospital habitacin si usted tiene cualquiera de los siguientes: Red N, oscuro, caf o cola de orina de color.) Evaluators had no overall preference for the professional translation (3.2, 95% confidence interval = 2.7 to 3.7, with 3 indicating no preference; P = 0.36) (Table 1).
| GoogleTranslate Translation | Professional Translation | P Value | |
|---|---|---|---|
| |||
| Fluency* | 3.4 | 4.7 | <0.0001 |
| Adequacy* | 4.5 | 4.8 | 0.19 |
| Meaning* | 4.2 | 4.5 | 0.29 |
| Severity | |||
| Any error | 39% | 22% | 0.05 |
| Serious error | 4% | 2% | 0.61 |
| Preference* | 3.2 | 0.36 | |
Mediation of Scores by Sentence Length or Complexity
We found that sentence length was not associated with scores for fluency, adequacy, meaning, severity, or preference (P > 0.30 in each case). Complexity, however, was significantly associated with preference: evaluators' preferred the professional translation for complex English sentences while being more ambivalent about simple English sentences (3.6 vs 2.6, P = 0.03).
Interrater Reliability and Repeatability
We assessed the interrater reliability for each domain using intraclass correlation coefficients and repeatability. For fluency, the intraclass correlation was best at 0.70; for adequacy, it was 0.58; for meaning, 0.42; for severity, 0.48; and for preference, 0.37. The repeatability scores were 1.4 for fluency, 0.6 for adequacy, 2.2 for meaning, 1.2 for severity, and 3.8 for preference, indicating that two evaluators might give a sentence almost the same score (at most, 1 point apart from one another) for adequacy, but might have opposite preferences regarding which translation of a sentence was superior.
Correlation with METEOR
Correlation between the first four domains and the METEOR scores were less than in prior studies.21 Fluency correlated best with METEOR at 0.53; adequacy correlated least with METEOR at 0.29. The remaining scores were in‐between. All correlations were statistically significant at P < 0.01 (Table 2).
| Correlation with METEOR | P value | |
|---|---|---|
| ||
| Fluency | 0.53 | <0.0001 |
| Adequacy | 0.29 | 0.006 |
| Meaning | 0.33 | 0.002 |
| Severity | 0.39 | 0.002 |
Discussion
In this preliminary study comparing the accuracy of GT to professional translation for patient educational material, we found that GT was inferior to the professional translation in grammatical fluency but generally preserved the content and sense of the original text. Out of 30 GT sentences assessed, there was one substantially erroneous translation that was considered potentially dangerous. Evaluators preferred the professionally translated sentences for complex sentences, but when the English source sentence was simplecontaining a single clausethis preference disappeared.
Like Sharif and Tse,12 we found that for information not arranged in sentences, automated translation sometimes produced nonsensical sentences. In our study, these resulted from an English sentence fragment followed by a bulleted list; in their study, the nonsensical translations resulted from pharmacy labels. The difference in frequency of these errors between our studies may have resulted partly from the translation tool evaluated (GT vs programs used by pharmacies in the Bronx), but may have also been due to our use of machine translation for complete sentencesthe purpose for which it is optimally designed. The hypothesis that machine translations of clinical information are most understandable when used for simple, complete sentences concurs with the methodology used by these tools and requires further study.
GT has the potential to be very useful to clinicians, particularly for those instances when the communication required is both spontaneous and routine or noncritical. For example, in the inpatient setting, patients could communicate diet and other nonclinical requests, as well as ask or answer simple, short questions when the interpreter is not available. In such situations, the low cost and ease of using online translations and machine translation more generally may help to circumvent the tendency of clinicians to get by with inadequate language skills or to avoid communication altogether.25 If used wisely, GT and other online tools could supplement the use of standardized translations and professional interpreters in helping clinicians to overcome language barriers and linguistic inertia, though this will require further assessment.
Ours is a pilot study, and while it suggests a more promising way to use online translation tools, significant further evaluation is required regarding accuracy and applicability prior to widespread use of any machine translation tools for patient care. The document we utilized for evaluation was a professionally translated patient educational brochure provided to individuals starting a complex medication. As online translation tools would most likely not be used in this setting, but rather for spontaneous and less critical patient‐specific instructions, further testing of GT as applied to such scenarios should be considered. Second, we only evaluated GT for English translated into Spanish; its usefulness in other languages will need to be evaluated. It also remains to be seen how easily GT translations will be understood by patients, who may have variable medical understanding and educational attainment as compared to our evaluators. Finally, in this evaluation, we only assessed automated written translation, not automated spoken translation services such as those now available on cellular phones and other mobile devices.11 The latter are based upon translation software with an additional speech recognition interface. These applications may prove to be even more useful than online translation, but the speech recognition component will add an additional layer of potential error and these applications will need to be evaluated on their own merits.
The domains chosen for this study had only moderate interrater reliability as assessed by intraclass correlation and repeatability, with meaning and preference scoring particularly poorly. The latter domains in particular will require more thorough assessment before routine use in online translation assessment. The variability in all domains may have resulted partly from the choice of nonclinicians of different ancestral backgrounds as evaluators. However, this variability is likely better representative of the wide range of patient backgrounds. Because our evaluators were not professional translators, we asked a professional interpreter to grade all sentences to assess the quality of their evaluation. While the interpreter noted slightly fewer errors among the professionally translated sentences (13% vs 22%) and slightly more errors among the GT‐translated sentences (50% vs 39%), and preferred the professional translation slightly more (3.8 vs 3.2), his scores for all of the other measures were almost identical, increasing our confidence in our primary findings (Appendix A). Additionally, since statistical translation is conducted sentence by sentence, in our study evaluators only scored translations at the sentence level. The accuracy of GT for whole paragraphs or entire documents will need to be assessed separately. The correlation between METEOR and the manual evaluation scores was less than in prior studies; while inexpensive to assess, METEOR will have to be recalibrated in optimal circumstanceswith several reference translations available rather than just onebefore it can be used to supplement the assessment of new languages, new materials, other translation technologies, and improvements in a given technology over time for patient educational material.
In summary, GT scored worse in grammar but similarly in content and sense to the professional translation, committing one critical error in translating a complex, fragmented sentence as nonsense. We believe that, with further study and judicious use, GT has the potential to substantially improve clinicians' communication with patients with limited English proficiency in the area of brief spontaneous patient‐specific information, supplementing well the role that professional spoken interpretation and standardized written translations already play.
- ,.Language use and English‐speaking ability: 2000. In:Census 2000 Brief.Washington, DC:US Census Bureau;2003. p. 2. http://www.census.gov/prod/2003pubs/c2kbr‐29.pdf.
- ,,,,.The need for more research on language barriers in health care: a proposed research agenda.Milbank Q.2006;84(1):111–133.
- ,,,.Language proficiency and adverse events in US hospitals: a pilot study.Int J Qual Health Care.2007;19(2):60–67.
- .The impact of medical interpreter services on the quality of health care: a systematic review.Med Care Res Rev.2005;62(3):255–299.
- ,,, et al.Errors in medical interpretation and their potential clinical consequences in pediatric encounters.Pediatrics.2003;111(1):6–14.
- ,,, et al.The effect of English language proficiency on length of stay and in‐hospital mortality.J Gen Intern Med.2004;19(3):221–228.
- ,,,.Influence of language barriers on outcomes of hospital care for general medicine inpatients.J Hosp Med.2010;5(5):276–282.
- ,.Hospitals, language, and culture: a snapshot of the nation. In:Los Angeles, CA:The California Endowment, the Joint Commission;2007. p.51–52. http://www.jointcommission.org/assets/1/6/hlc_paper.pdf.
- ,,,.Do professional interpreters improve clinical care for patients with limited English proficiency? A systematic review of the literature.Health Serv Res.2007;42(2):727–754.
- .Google's Computing Power Refines Translation Tool.New York Times; March 9,2010. Accessed March 24, 2010. http://www.nytimes.com/2010/03/09/technology/09translate.html?_r=1.
- , Translator. New York Times; March 20,2010. Accessed March 24, 2010. http://www.nytimes.com/2010/03/21/opinion/21bellos.html.
- ,.Accuracy of computer‐generated, Spanish‐language medicine labels.Pediatrics.2010;125(5):960–965.
- .Nielsen NetRatings Search Engine Ratings.SearchEngineWatch; August 22,2006. Accessed March 24, 2010. http://searchenginewatch.com/2156451.
- Google.Google Translate Help;2010. Accessed March 24, 2010. http://translate.google.com/support/?hl=en.
- ,.Chapter 4: Basic strategies. In:An Introduction to Machine Translation;1992. Accessed April 22, 2010. http://www.hutchinsweb.me.uk/IntroMT‐4.pdf
- .Your Guide to Coumadin®/Warfarin Therapy.Agency for Healthcare Research and Quality; August 21,2008. Accessed October 19, 2009. http://www.ahrq.gov/consumer/btpills.htm.
- ,,, et al.Patient reported receipt of medication instructions for warfarin is associated with reduced risk of serious bleeding events.J Gen Intern Med.2008;23(10):1589–1594.
- ,,.The ARPA MT evaluation methodologies: evolution, lessons, and future approaches. In: Proceedings of AMTA, 1994, Columbia, MD; October1994.
- ,.Overview of the IWSLT 2005 evaluation campaign. In: Proceedings of IWSLT 2005, Pittsburgh, PA; October2005.
- ,,,.BLEU: a method for automatic evaluation of machine translation. In: ACL‐2002: 40th Annual Meeting of the Association for Computational Linguistics.2002:311–318.
- ,.METEOR: an automatic metric for MT evaluation with high levels of correlation with human judgments. In: Proceedings of the Second Workshop on Statistical Machine Translation at ACL, Prague, Czech Republic; June2007.
- .The Structure of a Sentence.Ottawa:The Writing Centre, University of Ottawa;2007.
- ,.Statistical methods for assessing agreement between two methods of clinical measurement.Lancet.1986;1(8476):307–310.
- .Measurement, reproducibility, and validity. In:Epidemiologic Methods 203.San Francisco:Department of Biostatistics and Epidemiology, University of California;2009.
- ,,,,.Getting by: underuse of interpreters by resident physicians.J Gen Intern Med.2009;24(2):256–262.
The population of patients in the US with limited English proficiency (LEP)those who speak English less than very well1is substantial and continues to grow.1, 2 Patients with LEP are at risk for lower quality health care overall than their English‐speaking counterparts.38 Professional in‐person interpreters greatly improve spoken communication and quality of care for these patients,4, 9 but their assistance is typically based on the clinical encounter. Particularly if interpreting by phone, interpreters are unlikely to be able to help with materials such as discharge instructions or information sheets meant for family members. Professional written translations of patient educational material help to bridge this gap, allowing clinicians to convey detailed written instructions to patients. However, professional translations must be prepared well in advance of any encounter and can only be used for easily anticipated problems.
The need to translate less common, patient‐specific instructions arises spontaneously in clinical practice, and formally prepared written translations are not useful in these situations. Online translation tools such as GoogleTranslate (available at
We conducted a pilot evaluation of an online translation tool as it relates to detailed, complex patient educational material. Our primary goal was to compare the accuracy of a Spanish translation generated by the online tool to that done by a professional agency. Our secondary goals were: 1) to assess whether sentence word length or complexity mediated the accuracy of GT; and 2) to lay the foundation for a more comprehensive study of the accuracy of online translation tools, with respect to patient educational material.
Methods
Translation Tool and Language Choice
We selected Google Translate (GT) since it is one of the more commonly used online translation tools and because Google is the most widely used search engine in the United States.13 GT uses statistical translation methodology to convert text, documents, and websites between languages; statistical translation involves the following three steps. First, the translation program recognizes a sentence to translate. Second, it compares the words and phrases within that sentence to the billions of words in its library (drawn from bilingual professionally translated documents, such as United Nations proceedings). Third, it uses this comparison to generate a translation combining the words and phrases deemed most equivalent between the source sentence and the target language. If there are multiple sentences, the program recognizes and translates each independently. As the body of bilingual work grows, the program learns and refines its rules automatically.14 In contrast, in rule‐based translation, a program would use manually prespecified rules regarding word choice and grammar to generate a translation.15 We assessed GT's accuracy translating from English to Spanish because Spanish is the predominant non‐English language spoken in the US.1
Document Selection and Preparation
We selected the instruction manual regarding warfarin use prepared by the Agency for Healthcare Research and Quality (AHRQ) for this accuracy evaluation. We selected this manual,16 written at a 6th grade reading level, because a professional Spanish translation was available (completed by ASET International Service, LLC, before and independently of this study), and because patient educational material regarding warfarin has been associated with fewer bleeding events.17 We downloaded the English document on October 19, 2009 and used the GT website to translate it en bloc. We then copied the resulting Spanish output into a text file. The English document and the professional Spanish translation (downloaded the same day) were both converted into text files in the same manner.
Grading Methodology
We scored the translation chosen using both manual and automated evaluation techniques. These techniques are widely used in the machine translation literature and are explained below.
Manual Evaluation: Evaluators, Domains, Scoring
We recruited three nonclinician, bilingual, nativeSpanish‐speaking research assistants as evaluators. The evaluators were all college educated with a Bachelor's degree or higher and were of Mexican, Nicaraguan, and Guatemalan ancestry. Each evaluator received a brief orientation regarding the project, as well as an explanation of the scores, and then proceeded to the blinded evaluation independently.
We asked evaluators to score sentences on Likert scales along five primary domains: fluency, adequacy, meaning, severity, and preference. Fluency and adequacy are well accepted components of machine translation evaluation,18 with fluency being an assessment of grammar and readability ranging from 5 (Perfect fluency; like reading a newspaper) to 1 (No fluency; no appreciable grammar, not understandable) and adequacy being an assessment of information preservation ranging from 5 (100% of information conveyed from the original) to 1 (0% of information conveyed from the original). Given that a sentence can be highly adequate but drastically change the connotation and intent of the sentence (eg, a sentence that contains 75% of the correct words but changes a sentence from take this medication twice a day to take this medication once every two days), we asked evaluators to assess meaning, a measure of connotation and intent maintenance, with scores ranging from 5 (Same meaning as original) to 1 (Totally different meaning from the original).19 Evaluators also assessed severity, a new measure of potential harm if a given sentence was assessed as having errors of any kind, ranging from 5 (Error, no effect on patient care) to 1 (Error, dangerous to patient) with an additional option of N/A (Sentence basically accurate). Finally, evaluators rated a blinded preference (also a new measure) for either of two translated sentences, ranging from Strongly prefer translation #1 to Strongly prefer translation #2. The order of the sentences was random (eg, sometimes the professional translation was first and sometimes the GT translation was). We subsequently converted this to preference for the professional translation, ranging from 5 (Strongly prefer the professional translation) to 1 (Strongly prefer the GT translation) in order to standardize the responses (Figures 1 and 2).
The overall flow of the study is given in Figure 3. Each evaluator initially scored 20 sentences translated by GT and 10 sentences translated professionally along the first four domains. All 30 of these sentences were randomly selected from the original, 263‐sentence pamphlet. For fluency, evaluators had access only to the translated sentence to be scored; for adequacy, meaning, and severity, they had access to both the translated sentence and the original English sentence. Ten of the 30 sentences were further selected randomly for scoring on the preference domain. For these 10 sentences, evaluators compared the GT and professional translations of the same sentence (with the original English sentence available as a reference) and indicated a preference, for any reason, for one translation or the other. Evaluators were blinded to the technique of translation (GT or professional) for all scored sentences and domains. We chose twice as many sentences from the GT preparations for the first four domains to maximize measurements for the translation technology we were evaluating, with the smaller number of professional translations serving as controls.
After scoring the first 30 sentences, evaluators met with one of the authors (R.R.K.) to discuss and consolidate their approach to scoring. They then scored an additional 10 GT‐translated sentences and 5 professionally translated sentences for the first four domains, and 9 of these 15 sentences for preference, to see if the meeting changed their scoring approach. These sentences were selected randomly from the original, 263‐sentence pamphlet, excluding the 30 evaluated in the previous step.
Automated Machine Translation Evaluation
Machine translation researchers have developed automated measures allowing the rapid and inexpensive scoring and rescoring of translations. These automated measures supplement more time‐ and resource‐intensive manual evaluations. The automated measures are based upon how well the translation compares to one or, ideally, multiple professionally prepared reference translations. They correlate well with human judgments on the domains above, especially when multiple reference translations are used (increasing the number of reference translations increases the variability allowed for words and phrases in the machine translation, improving the likelihood that differences in score are related to differences in quality rather than differences in translator preference).20 For this study, we used Metric for Evaluation of Translation with Explicit Ordering (METEOR), a machine translation evaluation system that allows additional flexibility for the machine translation in terms of grading individual sentences and being sensitive to synonyms, word stemming, and word order.21 We obtained a METEOR score for each of the GT‐translated sentences using the professional translation as our reference, and assessed correlation between this automated measure and the manual evaluations for the GT sentences, with the aim of assessing the feasibility of using METEOR in future work on patient educational material translation.
Outcomes and Statistical Analysis
We compared the scores assigned to GT‐translated sentences for each of the five manually scored domains as compared to the scores of the professionally translated sentences, as well as the impact of word count and sentence complexity on the scores achieved specifically by the GT‐translated sentences, using clustered linear regression to account for the fact that each of the 45 sentences were scored by each of the three evaluators. Sentences were classified as simple if they contained one or fewer clauses and complex if they contained more than one clause.22 We also assessed interrater reliability for the manual scoring system using intraclass correlation coefficients and repeatability. Repeatability is an estimate of the maximum difference, with 95% confidence, between scores assigned to the same sentence on the same domain by two different evaluators;23 lower scores indicate greater agreement between evaluators. Since we did not have clinical data or a gold standard, we used repeatability to estimate the value above which a difference between two scores might be clinically significant and not simply due to interrater variability.24 Finally, we assessed the correlation of the manual scores with those calculated by the METEOR automated evaluation tool using Pearson correlation coefficients. All analyses were conducted using Stata 11 (College Station, TX).
Results
Sentence Description
A total of 45 sentences were evaluated by the bilingual research assistants. The initial 30 sentences and the subsequent, post‐consolidation meeting 15 sentences were scored similarly in all outcomes, after adjustment for word length and complexity, so we pooled all 45 sentences (as well as the 19 total sentence pairs scored for preference) for the final analysis. Average sentence lengths were 14.2 words, 15.5 words, and 16.6 words for the English source text, professionally translated sentences, and GT‐translated sentences, respectively. Thirty‐three percent of the English source sentences were simple and 67% were complex.
Manual Evaluation Scores
Sentences translated by GT received worse scores on fluency as compared to the professional translations (3.4 vs 4.7, P < 0.0001). Comparisons for adequacy and meaning were not statistically significantly different. GT‐translated sentences contained more errors of any severity as compared to the professional translations (39% vs 22%, P = 0.05), but a similar number of serious, clinically impactful errors (severity scores of 3, 2, or 1; 4% vs 2%, P = 0.61). However, one GT‐translated sentence was considered erroneous with a severity level of 1 (Error, dangerous to patient). This particular sentence was 25 words long and complex in structure in the original English document; all three evaluators considered the GT translation nonsensical (La hemorragia mayor, llame a su mdico, o ir a la emergencia de un hospital habitacin si usted tiene cualquiera de los siguientes: Red N, oscuro, caf o cola de orina de color.) Evaluators had no overall preference for the professional translation (3.2, 95% confidence interval = 2.7 to 3.7, with 3 indicating no preference; P = 0.36) (Table 1).
| GoogleTranslate Translation | Professional Translation | P Value | |
|---|---|---|---|
| |||
| Fluency* | 3.4 | 4.7 | <0.0001 |
| Adequacy* | 4.5 | 4.8 | 0.19 |
| Meaning* | 4.2 | 4.5 | 0.29 |
| Severity | |||
| Any error | 39% | 22% | 0.05 |
| Serious error | 4% | 2% | 0.61 |
| Preference* | 3.2 | 0.36 | |
Mediation of Scores by Sentence Length or Complexity
We found that sentence length was not associated with scores for fluency, adequacy, meaning, severity, or preference (P > 0.30 in each case). Complexity, however, was significantly associated with preference: evaluators' preferred the professional translation for complex English sentences while being more ambivalent about simple English sentences (3.6 vs 2.6, P = 0.03).
Interrater Reliability and Repeatability
We assessed the interrater reliability for each domain using intraclass correlation coefficients and repeatability. For fluency, the intraclass correlation was best at 0.70; for adequacy, it was 0.58; for meaning, 0.42; for severity, 0.48; and for preference, 0.37. The repeatability scores were 1.4 for fluency, 0.6 for adequacy, 2.2 for meaning, 1.2 for severity, and 3.8 for preference, indicating that two evaluators might give a sentence almost the same score (at most, 1 point apart from one another) for adequacy, but might have opposite preferences regarding which translation of a sentence was superior.
Correlation with METEOR
Correlation between the first four domains and the METEOR scores were less than in prior studies.21 Fluency correlated best with METEOR at 0.53; adequacy correlated least with METEOR at 0.29. The remaining scores were in‐between. All correlations were statistically significant at P < 0.01 (Table 2).
| Correlation with METEOR | P value | |
|---|---|---|
| ||
| Fluency | 0.53 | <0.0001 |
| Adequacy | 0.29 | 0.006 |
| Meaning | 0.33 | 0.002 |
| Severity | 0.39 | 0.002 |
Discussion
In this preliminary study comparing the accuracy of GT to professional translation for patient educational material, we found that GT was inferior to the professional translation in grammatical fluency but generally preserved the content and sense of the original text. Out of 30 GT sentences assessed, there was one substantially erroneous translation that was considered potentially dangerous. Evaluators preferred the professionally translated sentences for complex sentences, but when the English source sentence was simplecontaining a single clausethis preference disappeared.
Like Sharif and Tse,12 we found that for information not arranged in sentences, automated translation sometimes produced nonsensical sentences. In our study, these resulted from an English sentence fragment followed by a bulleted list; in their study, the nonsensical translations resulted from pharmacy labels. The difference in frequency of these errors between our studies may have resulted partly from the translation tool evaluated (GT vs programs used by pharmacies in the Bronx), but may have also been due to our use of machine translation for complete sentencesthe purpose for which it is optimally designed. The hypothesis that machine translations of clinical information are most understandable when used for simple, complete sentences concurs with the methodology used by these tools and requires further study.
GT has the potential to be very useful to clinicians, particularly for those instances when the communication required is both spontaneous and routine or noncritical. For example, in the inpatient setting, patients could communicate diet and other nonclinical requests, as well as ask or answer simple, short questions when the interpreter is not available. In such situations, the low cost and ease of using online translations and machine translation more generally may help to circumvent the tendency of clinicians to get by with inadequate language skills or to avoid communication altogether.25 If used wisely, GT and other online tools could supplement the use of standardized translations and professional interpreters in helping clinicians to overcome language barriers and linguistic inertia, though this will require further assessment.
Ours is a pilot study, and while it suggests a more promising way to use online translation tools, significant further evaluation is required regarding accuracy and applicability prior to widespread use of any machine translation tools for patient care. The document we utilized for evaluation was a professionally translated patient educational brochure provided to individuals starting a complex medication. As online translation tools would most likely not be used in this setting, but rather for spontaneous and less critical patient‐specific instructions, further testing of GT as applied to such scenarios should be considered. Second, we only evaluated GT for English translated into Spanish; its usefulness in other languages will need to be evaluated. It also remains to be seen how easily GT translations will be understood by patients, who may have variable medical understanding and educational attainment as compared to our evaluators. Finally, in this evaluation, we only assessed automated written translation, not automated spoken translation services such as those now available on cellular phones and other mobile devices.11 The latter are based upon translation software with an additional speech recognition interface. These applications may prove to be even more useful than online translation, but the speech recognition component will add an additional layer of potential error and these applications will need to be evaluated on their own merits.
The domains chosen for this study had only moderate interrater reliability as assessed by intraclass correlation and repeatability, with meaning and preference scoring particularly poorly. The latter domains in particular will require more thorough assessment before routine use in online translation assessment. The variability in all domains may have resulted partly from the choice of nonclinicians of different ancestral backgrounds as evaluators. However, this variability is likely better representative of the wide range of patient backgrounds. Because our evaluators were not professional translators, we asked a professional interpreter to grade all sentences to assess the quality of their evaluation. While the interpreter noted slightly fewer errors among the professionally translated sentences (13% vs 22%) and slightly more errors among the GT‐translated sentences (50% vs 39%), and preferred the professional translation slightly more (3.8 vs 3.2), his scores for all of the other measures were almost identical, increasing our confidence in our primary findings (Appendix A). Additionally, since statistical translation is conducted sentence by sentence, in our study evaluators only scored translations at the sentence level. The accuracy of GT for whole paragraphs or entire documents will need to be assessed separately. The correlation between METEOR and the manual evaluation scores was less than in prior studies; while inexpensive to assess, METEOR will have to be recalibrated in optimal circumstanceswith several reference translations available rather than just onebefore it can be used to supplement the assessment of new languages, new materials, other translation technologies, and improvements in a given technology over time for patient educational material.
In summary, GT scored worse in grammar but similarly in content and sense to the professional translation, committing one critical error in translating a complex, fragmented sentence as nonsense. We believe that, with further study and judicious use, GT has the potential to substantially improve clinicians' communication with patients with limited English proficiency in the area of brief spontaneous patient‐specific information, supplementing well the role that professional spoken interpretation and standardized written translations already play.
- ,.Language use and English‐speaking ability: 2000. In:Census 2000 Brief.Washington, DC:US Census Bureau;2003. p. 2. http://www.census.gov/prod/2003pubs/c2kbr‐29.pdf.
- ,,,,.The need for more research on language barriers in health care: a proposed research agenda.Milbank Q.2006;84(1):111–133.
- ,,,.Language proficiency and adverse events in US hospitals: a pilot study.Int J Qual Health Care.2007;19(2):60–67.
- .The impact of medical interpreter services on the quality of health care: a systematic review.Med Care Res Rev.2005;62(3):255–299.
- ,,, et al.Errors in medical interpretation and their potential clinical consequences in pediatric encounters.Pediatrics.2003;111(1):6–14.
- ,,, et al.The effect of English language proficiency on length of stay and in‐hospital mortality.J Gen Intern Med.2004;19(3):221–228.
- ,,,.Influence of language barriers on outcomes of hospital care for general medicine inpatients.J Hosp Med.2010;5(5):276–282.
- ,.Hospitals, language, and culture: a snapshot of the nation. In:Los Angeles, CA:The California Endowment, the Joint Commission;2007. p.51–52. http://www.jointcommission.org/assets/1/6/hlc_paper.pdf.
- ,,,.Do professional interpreters improve clinical care for patients with limited English proficiency? A systematic review of the literature.Health Serv Res.2007;42(2):727–754.
- .Google's Computing Power Refines Translation Tool.New York Times; March 9,2010. Accessed March 24, 2010. http://www.nytimes.com/2010/03/09/technology/09translate.html?_r=1.
- , Translator. New York Times; March 20,2010. Accessed March 24, 2010. http://www.nytimes.com/2010/03/21/opinion/21bellos.html.
- ,.Accuracy of computer‐generated, Spanish‐language medicine labels.Pediatrics.2010;125(5):960–965.
- .Nielsen NetRatings Search Engine Ratings.SearchEngineWatch; August 22,2006. Accessed March 24, 2010. http://searchenginewatch.com/2156451.
- Google.Google Translate Help;2010. Accessed March 24, 2010. http://translate.google.com/support/?hl=en.
- ,.Chapter 4: Basic strategies. In:An Introduction to Machine Translation;1992. Accessed April 22, 2010. http://www.hutchinsweb.me.uk/IntroMT‐4.pdf
- .Your Guide to Coumadin®/Warfarin Therapy.Agency for Healthcare Research and Quality; August 21,2008. Accessed October 19, 2009. http://www.ahrq.gov/consumer/btpills.htm.
- ,,, et al.Patient reported receipt of medication instructions for warfarin is associated with reduced risk of serious bleeding events.J Gen Intern Med.2008;23(10):1589–1594.
- ,,.The ARPA MT evaluation methodologies: evolution, lessons, and future approaches. In: Proceedings of AMTA, 1994, Columbia, MD; October1994.
- ,.Overview of the IWSLT 2005 evaluation campaign. In: Proceedings of IWSLT 2005, Pittsburgh, PA; October2005.
- ,,,.BLEU: a method for automatic evaluation of machine translation. In: ACL‐2002: 40th Annual Meeting of the Association for Computational Linguistics.2002:311–318.
- ,.METEOR: an automatic metric for MT evaluation with high levels of correlation with human judgments. In: Proceedings of the Second Workshop on Statistical Machine Translation at ACL, Prague, Czech Republic; June2007.
- .The Structure of a Sentence.Ottawa:The Writing Centre, University of Ottawa;2007.
- ,.Statistical methods for assessing agreement between two methods of clinical measurement.Lancet.1986;1(8476):307–310.
- .Measurement, reproducibility, and validity. In:Epidemiologic Methods 203.San Francisco:Department of Biostatistics and Epidemiology, University of California;2009.
- ,,,,.Getting by: underuse of interpreters by resident physicians.J Gen Intern Med.2009;24(2):256–262.
Copyright © 2011 Society of Hospital Medicine