User login
Rapid response teams (RRT) have been promoted by numerous patient safety organizations to reduce preventable in‐hospital deaths.14 Initial studies of RRTs were promising,57 but recent literature,811 including systematic reviews and meta‐analyses, has called these findings into question. Nevertheless, RRTs remain popular in academic and community hospitals worldwide, and many have expanded their roles beyond solely responding to the deteriorating patient.12
Some RRTs, for example, proactively round on seriously ill ward patients and patients recently discharged from the intensive care unit (ICU) in an effort to prevent transitions to higher levels of care. Priestley and colleagues demonstrated that institution of such a team, referred to as a critical care outreach team (CCOT), decreased in‐hospital mortality while possibly increasing hospital length of stay (LOS).13 Three additional single‐center studies from the United Kingdom, where CCOTs are common, specifically examined proactive rounding by CCOTs on the ICU readmission rate: 2 observed no improvement,14, 15 while the third, limited by a small sample size, demonstrated a modest reduction in ICU readmissions.16
We sought to determine the impact of proactive rounding by an RRT on patients discharged from intensive care on the ICU readmission rate, ICU LOS, and in‐hospital mortality of patients discharged from the ICU. We hypothesized that proactive rounding by an RRT would decrease the ICU readmission rate, ICU LOS, and the in‐hospital mortality of patients discharged from the ICU.
MATERIALS AND METHODS
Site and Subjects
We carried out a retrospective, observational study of adult patients discharged from the ICU at University of California San Francisco (UCSF) Medical Center between January 2006 and June 2009. UCSF is a 790‐bed quaternary care academic hospital that admits approximately 17,000 patients annually and has 5 adult ICUs, with 62 beds and 3500 to 4000 ICU admissions annually. Our study was approved by the UCSF Medical Center Committee on Human Research; need for informed consent was waived.
Description of the RRT Before June 1, 2007
Throughout the study, the goal of the RRT was unchanged: to assess, triage, and institute early treatment in patients who experienced an acute decline in their clinical status. From November 2005 to October 2006, the RRT was staffed by an attending hospitalist and medicine resident during daytime, and by a critical care fellow at nighttime and on weekends. The RRT could be activated by any concerned staff member in response to a set of predetermined vital sign abnormalities, decreased urine output, or altered mental status, or simply if the staff member was concerned about the patient's clinical status. Despite extensive educational efforts, utilization of the team was low (2.7 calls per 1000 admissions) and, accordingly, it was discontinued in October 2006. After this time, staff would contact the primary team caring for the patient, should concerns regarding the patient's condition arise.
Description of the RRT After June 1, 2007
In an effort to expand its scope and utility, the RRT was reinstated on June 1, 2007 with a new composition and increased responsibilities. After this date, physician roles were eliminated, and the team composition changed to a dedicated critical care nurse and respiratory therapist, available 24 hours a day. Criteria for calling the team remained unchanged. In addition to responding to acute deteriorations in patients' clinical courses, the RRT began to proactively assess all patients within 12 hours of discharge from the ICU and would continue to round on these patients daily until it was felt that they were clinically stable. During these rounds, the RRT would provide consultation expertise to the bedside nurse and contact the patient's clinicians if concern existed about a patient's clinical trajectory; decisions to transfer a patient back to the ICU ultimately rested with the patient's primary team. During this time period, the RRT received an average of 110.6 calls per 1000 admissions.
Data Sources
Data collected included: demographics, clinical information (all patient refined [APR] severity of illness, APR risk of mortality, and the presence of 29 comorbidities), whether there was a readmission to the ICU, the total ICU LOS, and the vital status at the time of hospital discharge.
Outcomes
Outcomes included: readmission to the ICU, defined as 2 noncontiguous ICU stays during a single hospitalization; ICU LOS, defined as the total number of ICU days accrued during hospitalization; and in‐hospital mortality of patients discharged from the ICU.
Adjustment Variables
Patient age, gender, race, and ethnicity were available from administrative data. We used admission diagnosis code data to classify comorbidities using the method of Elixhauser et al.17
Statistical Analysis
For each of the 3 study outcomes, we assessed the effects of the intervention using multivariable models adjusting for patient‐ and service‐level factors, including a gamma model for ICU LOS and logistic models for ICU readmission and in‐hospital mortality of patients discharged from the ICU. We first compared unadjusted outcome levels before and after implementation. We then used an interrupted time series (ITS) framework to assess the effects of the intervention in terms of 5 measures: 1) the secular trend in the mean of the outcome before the intervention; 2) the change in the mean at the start of the implementation, or immediate effects; 3) the secular trend in the mean after implementation; 4) the change in secular trend, reflecting cumulative intervention effects; and 5) the net effect of the intervention, estimated as the adjusted difference between the fitted mean at the end of the postintervention period and the expected mean if the preintervention trend had continued without interruption or change.
Secondary Analyses
Given the heterogeneity of the RRT in the preintervention period, we assessed potential changes in trend at October 2006, the month in which the RRT was discontinued. We also examined changes in trend midway through the postimplementation period to evaluate for increased efficacy of the RRT with time.
Selection of Covariates
Age, race, and admitting service were included in both the prepost and ITS models by default for face validity. Additional covariates were selected for each outcome using backwards deletion with a retention criterion of P < 0.05, based on models that allowed the outcome rate to vary freely month to month. Because these data were obtained from administrative billing datasets, and the presence of comorbidities could not be definitively linked with time points during hospitalization, only those comorbidities that were likely present prior at ICU discharge were included. For similar reasons, APR severity of illness and risk of mortality scores, which were calculated from billing diagnoses at the end of hospitalization, were excluded from the models.
RESULTS
Patient Characteristics
During the study period, 11,687 patients were admitted to the ICU; 10,288 were discharged from the ICU alive and included in the analysis. In the 17 months prior to the introduction of proactive rounding by the RRT, 4902 (41.9%) patients were admitted, and during the 25 months afterwards, 6785 (58.1%) patients. Patients admitted in the 2 time periods were similar, although there were clinically small but statistically significant differences in race, APR severity of illness, APR risk of mortality, and certain comorbidities between the 2 groups (Table 1).
| Pre‐RRT (n = 4305) N (%) | Post‐RRT (n = 5983) N (%) | P Value | |
|---|---|---|---|
| |||
| Age, mean (y [SD]) | 57.7 [16.6] | 57.9 [16.5] | 0.50 |
| Female gender | 2,005 (46.6) | 2,824 (47.2) | 0.53 |
| Race | 0.0013 | ||
| White | 2,538 (59.0) | 3,520 (58.8) | |
| Black | 327 (7.6) | 436 (7.3) | |
| Asian | 642 (14.9) | 842 (14.1) | |
| Other | 719 (16.7) | 1,121 (18.7) | |
| Unknown | 79 (1.8) | 64 (1.1) | |
| Ethnicity | 0.87 | ||
| Hispanic | 480 (11.2) | 677 (11.3%) | |
| Non‐Hispanic | 3,547 (82.4) | 4,907 (82.0%) | |
| Unknown | 278 (6.5) | 399 (6.7) | |
| Insurance | 0.50 | ||
| Medicare | 1,788 (41.5) | 2,415 (40.4) | |
| Medicaid/Medi‐Cal | 699 (16.2) | 968 (16.2) | |
| Private | 1,642 (38.1) | 2,329 (38.9) | |
| Other | 176 (4.1) | 271 (4.5) | |
| Admission source | 0.41 | ||
| ED | 1,621 (37.7) | 2,244 (37.5) | |
| Outside hospital | 652 (15.2) | 855 (14.3) | |
| Direct admit | 2,032 (47.2) | 2,884 (48.2) | |
| Major surgery | 0.99 | ||
| Yes | 3,107 (72.2) | 4,319 (72.2) | |
| APR severity of illness | 0.0001 | ||
| Mild | 622 (14.5) | 828 (13.8) | |
| Moderate | 1,328 (30.9) | 1,626 (27.2) | |
| Major | 1,292 (30.0) | 1,908 (31.9) | |
| Extreme | 1,063 (24.7) | 1,621 (27.1) | |
| APR risk of mortality | 0.0109 | ||
| Mild | 1,422 (33.0) | 1,821 (30.4) | |
| Moderate | 1,074 (25.0) | 1,467 (24.5) | |
| Major | 947 (22.0) | 1,437 (24.0) | |
| Extreme | 862 (20.0) | 1,258 (21.0) | |
| Admitting service | 0.11 | ||
| Adult general surgery | 190 (4.4) | 260 (4.4) | |
| Cardiology | 347 (8.1) | 424 (7.1) | |
| Cardiothoracic surgery | 671 (15.6) | 930 (15.5) | |
| Kidney transplant surgery | 105 (2.4) | 112 (1.9) | |
| Liver transplant surgery | 298 (6.9) | 379 (6.3) | |
| Medicine | 683 (15.9) | 958 (16.0) | |
| Neurology | 420 (9.8) | 609 (10.2) | |
| Neurosurgery | 1,345 (31.2) | 1,995 (33.3) | |
| Vascular surgery | 246 (5.7) | 316 (5.3) | |
| Comorbidities | |||
| Hypertension | 2,054 (47.7) | 2,886 (48.2) | 0.60 |
| Fluid and electrolyte disorders | 998 (23.2) | 1,723 (28.8) | <0.0001 |
| Diabetes | 708 (16.5) | 880 (14.7) | 0.02 |
| Chronic obstructive pulmonary disease | 632 (14.7) | 849 (14.2) | 0.48 |
| Iron deficiency anemia | 582 (13.5) | 929 (15.5) | 0.005 |
| Renal failure | 541 (12.6) | 744 (12.4) | 0.84 |
| Coagulopathy | 418 (9.7) | 712 (11.9) | 0.0005 |
| Liver disease | 400 (9.3) | 553 (9.2) | 0.93 |
| Hypothyroidism | 330 (7.7) | 500 (8.4) | 0.20 |
| Depression | 306 (7.1) | 508 (8.5) | 0.01 |
| Peripheral vascular disease | 304 (7.1) | 422 (7.1) | 0.99 |
| Congestive heart failure | 263 (6.1) | 360 (6.0) | 0.85 |
| Weight loss | 236 (5.5) | 425 (7.1) | 0.0009 |
| Paralysis | 225 (5.2) | 328 (5.5) | 0.57 |
| Neurological disorders | 229 (5.3) | 276 (4.6) | 0.10 |
| Valvular disease | 210 (4.9) | 329 (5.5) | 0.16 |
| Drug abuse | 198 (4.6) | 268 (4.5) | 0.77 |
| Metastatic cancer | 198 (4.6) | 296 (5.0) | 0.42 |
| Obesity | 201 (4.7) | 306 (5.1) | 0.30 |
| Alcohol abuse | 178 (4.1) | 216 (3.6) | 0.17 |
| Diabetes with complications | 175 (4.1) | 218 (3.6) | 0.27 |
| Solid tumor without metastasis | 146 (3.4) | 245 (4.1) | 0.07 |
| Psychoses | 115 (2.7) | 183 (3.1) | 0.25 |
| Rheumatoid arthritis/collagen vascular disease | 96 (2.2) | 166 (2.8) | 0.08 |
| Pulmonary circulation disease | 83 (1.9) | 181 (3.0) | 0.0005 |
| Outcomes | |||
| Readmission to ICU | 288 (6.7) | 433 (7.3) | 0.24 |
| ICU length of stay, mean [SD] | 5.1 [9.7] | 4.9 [8.3] | 0.24 |
| In‐hospital mortality of patients discharged from the ICU | 260 (6.0) | 326 (5.5) | 0.24 |
ICU Readmission Rate
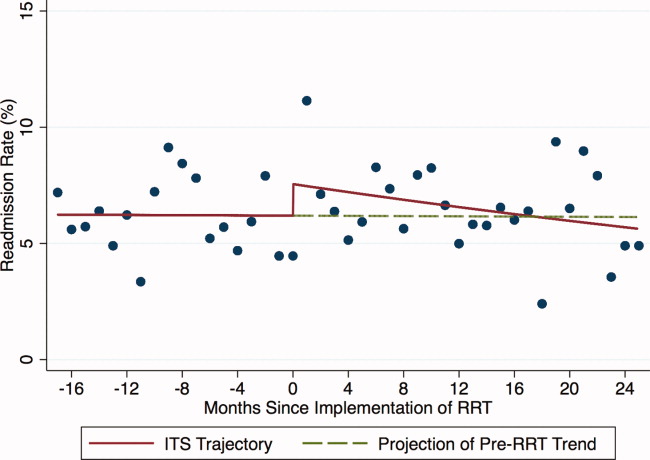
Introduction of proactive rounding by the RRT was not associated with unadjusted differences in the ICU readmission rate (6.7% preintervention vs 7.3% postintervention, P = 0.24; Table 1). In the adjusted ITS model, the intervention had no net effect on the odds of ICU readmission (adjusted odds ratio [AOR] for net intervention effect 0.98, 95% confidence interval [CI] 0.42, 2.28), with similar secular trends both preintervention (AOR 1.00 per year, 95% CI 0.97, 1.03), and afterwards (AOR 0.99 per year, 95% CI 0.98, 01.00), and a nonsignificant increase at implementation (Table 2). Figure 1 uses solid lines to show the fitted readmission rates, a hatched line to show the projection of the preintervention secular trend into the postintervention period, and circles to represent adjusted monthly means. The lack of a net intervention effect is indicated by the convergence of the solid and hatched lines 24 months postintervention.

| Outcome: Summary Effect Measure | Value (95% CI) | P Value |
|---|---|---|
| ||
| ICU readmission rateadjusted odds ratio | ||
| Pre‐RRT trend | 1.00 (0.97, 1.03) | 0.98 |
| Change at RRT implementation | 1.24 (0.94, 1.63) | 0.13 |
| Post‐RRT trend | 0.98 (0.97, 1.00) | 0.06 |
| Change in trend | 0.98 (0.96, 1.02) | 0.39 |
| Net intervention effect | 0.92 (0.40, 2.12) | 0.85 |
| ICU average length of stayadjusted ratio of means | ||
| Trend at 9 mo pre‐RRT | 0.98 (0.96, 1.00) | 0.05 |
| Trend at 3 mo pre‐RRT | 1.02 (0.99, 1.04) | 0.19 |
| Change in trend at 3 mo pre‐RRT | 1.03 (1.00, 1.07) | 0.07 |
| Change at RRT implementation | 0.92 (0.80, 1.06) | 0.27 |
| Post‐RRT trend | 1.00 (0.99, 1.00) | 0.35 |
| Change in trend at RRT implementation | 0.98 (0.96, 1.01) | 0.14 |
| Net intervention effect | 0.60 (0.31, 1.18) | 0.14 |
| In‐hospital mortality of patients discharged from the ICUadjusted odds ratio | ||
| Pre‐RRT trend | 1.02 (0.99, 1.06) | 0.15 |
| Change at RRT implementation | 0.74 (0.51, 1.08) | 0.12 |
| Post‐RRT trend | 1.00 (0.98, 1.01) | 0.68 |
| Change in trend | 0.97 (0.94, 1.01) | 0.14 |
| Net intervention effect | 0.39 (0.14, 1.10) | 0.08 |
ICU Average LOS
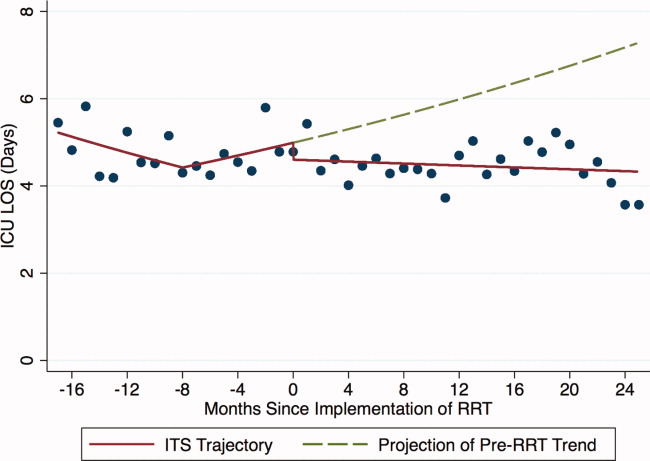
Introduction of proactive rounding by the RRT was not associated with unadjusted differences in ICU average LOS (5.1 days preintervention vs 4.9 days postintervention, P = 0.24; Table 1). Trends in ICU LOS may have changed in October 2006 (P = 0.07), decreasing in the first half of the study period (adjusted rate ratio [ARR] 0.98 per year, 95% CI 0.961.00), but did not change significantly thereafter. As with the ICU readmission rate, neither the change in estimated secular trend after implementation (ARR 0.98, 95% CI 0.961.01), nor the net effect of the intervention (ARR 0.62, 95% CI 0.321.22) was statistically significant (Table 2); these results are depicted graphically in Figure 2.
In‐Hospital Mortality of Patients Discharged From the ICU
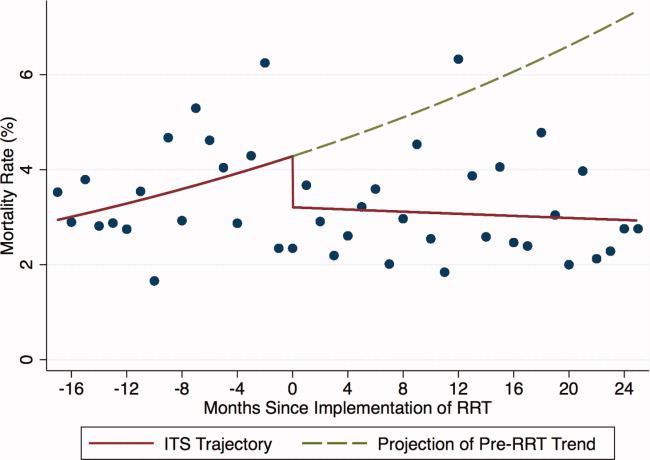
Introduction of proactive rounding by the RRT was not associated with unadjusted differences in the mortality of patients discharged from the ICU (6.0% preintervention vs 5.5% postintervention, P = 0.24; Table 1). Similarly, in the adjusted ITS model, the intervention had no statistically significant net effect on the mortality outcome (Table 2 and Figure 3).
Secondary Analyses
Apart from weak evidence for a change in trend in ICU LOS in October 2006, no other changes in trend were found within the preintervention or postintervention periods (data not shown). This suggests that the heterogeneity of the preintervention RRT had no significant impact on the 3 outcomes examined, and that the RRT intervention failed to gain efficacy with time in the postintervention period. Additionally, we saw no outcome benefit in sensitivity analyses among all ICU patients or in service‐defined analyses (eg, surgical services), where ability to control for illness severity was improved.
DISCUSSION
In this single center study, introduction of an RRT that proactively rounded on patients discharged from the ICU did not reduce the ICU readmission rate, ICU LOS, or mortality of patients discharged from the ICU, after accounting for secular trends using robust ITS methods and adjusting for patient level factors.
Our study is consistent with 2 smaller studies that assessed the impact of proactive rounding by a CCOT on ICU readmission rate. Leary and Ridley14 found that proactively rounding by a CCOT did not reduce ICU readmissions or shorten the ICU LOS, although this study was limited by a surprisingly low ICU readmission rate and short ICU LOS prior to the intervention. Another study15 also observed no change in the ICU readmission rate following introduction of a proactively rounding CCOT but noted small reductions in both ICU and hospital mortality. The sole study showing an effect16 observed a lower ICU readmission rate and increased survival to hospital discharge (after excluding do not resuscitate [DNR] patients) with implementation of a CCOT, although some of their findings may be explained by their CCOT's use of palliative care services, a function not featured in our model.
Our study adds to the meta‐analyses and systematic reviews810 that have questioned the hypothesis that a trained and proactive team of caregivers should be able to prevent patients from returning to the ICU. Perhaps one reason why this is not true is that proactive rounding by RRTs may have minimal effect in systems where step‐down beds are readily available. At UCSF, nearly every patient transferred out of the ICU is triaged to a step‐down unit, where telemetry and pulse oximetry are continuously monitored. Despite this, however, our institution's 2 step‐down units generate more calls to our RRT than any other units in the hospital.
We were surprised to see that proactive rounding failed to shorten ICU LOS, hypothesizing that clinicians would be more comfortable discharging patients from the ICU knowing that the RRT would be closely monitoring them afterwards. Although we have no data to support this hypothesis, increased use of the RRT may have also increased step‐down bed use, as patients on the general medicalsurgical floors were transferred to a higher level of care upon recommendation of the RRT, thereby delaying transfers out of the ICU. Moreover, the opening of an additional 16‐bed ICU in October 2008 might have encouraged clinicians to transfer patients back to the ICU simply because beds were more easily accessible than before.
Introduction of proactive rounding by the RRT was also not associated with differences in the mortality rate of patients discharged from the ICU. This finding conflicts with the results of Garcea et al,15 Ball et al,16 and Priestley et al13, all of which found that implementation of a CCOT led to small but statistically significant reductions in in‐hospital mortality. All 3 of these studies, however, examined smaller patient populations (1380, 470, and 2903 patients, respectively), and both the Priestley and Ball studies13, 16 had significantly shorter periods of data collection (24 months and 32 weeks, respectively). Our results are based on models with confidence intervals and P values that account for variability in all 3 underlying effect estimates but assume a linear extrapolation of the preintervention trend. This approach allowed us to flexibly deal with changes related to the intervention, while relying on our large sample size to define time trends not dealt with adequately (or at all) in previous research.
The lack of improvement in outcomes cannot be attributed to immaturity of the RRT or failure of the clinical staff to use the RRT adequately. A prespecified secondary data analysis midway through the postintervention time period demonstrated that the RRT failed to gain efficacy with time with respect to all 3 outcomes. The postintervention RRT was also utilized far more frequently than its predecessor (110.6 vs 2.7 calls per 1000 admissions, respectively), and this degree of RRT utilization far surpasses the dose considered to be indicative of a mature RRT system.12
Our study has several limitations. First, we relied on administrative rather than chart‐collected data to determine the reason for ICU admission, and the APR severity of illness and risk of mortality scores. It seems unlikely, however, that coding deficiencies or biases affected the preintervention and postintervention patient populations differently. Even though we adjusted for all available measures, it is possible that we were not able to account for time trends in all potential confounders. Second, we did not have detailed clinical information on reasons for ICU readmission and whether readmissions occurred before or after the RRT proactively rounded on the patient. Therefore, potential readmissions to the ICU that might have been planned or which would have happened regardless of the presence of the RRT, such as for antibiotic desensitization, could not be accounted for. Third, introduction of proactive rounding by the RRT in June 2007 was accompanied by a change in the RRT's composition, from a physician‐led model to a nurse‐led model. Therefore, inherent differences in the way that physicians and nurses might assess and triage patients could not have been adjusted for. Lastly, this was a retrospective study conducted at a single academic medical center with a specific RRT model, and our results may not be directly applicable to nonteaching settings or to different RRT models.
Our findings raise further questions about the benefits of RRTs as they assume additional roles, such as proactive rounding on patients recently discharged from the ICU. The failure of our RRT to reduce the ICU readmission rate, the ICU average LOS, and the mortality of patients discharged from the ICU raises concerns that the benefits of our RRT are not commensurate with its cost. While defining the degree of impact and underlying mechanisms are worthy of prospective study, hospitals seeking to improve their RRT models should consider how to develop systems that achieve the RRT's promise in measurable ways.
Acknowledgements
The authors acknowledge Heather Leicester, MSPH, Senior Performance Improvement Analyst for Patient Safety and Quality Services at the University of California San Francisco for her work in data acquisition.
Disclosures: Dr Vittinghoff received salary support from an NIH grant during the time of this work for statistical consulting. He receives textbook royalties from Springer Verlag. Dr Auerbach was supported by 5K24HL098372‐02 from the National Heart Lung and Blood Institute during the period of this study although not specifically for this study; they had no role in the design or conduct of the study; the collection, analysis, or interpretation of the data; or the preparation, review, or approval of the manuscript. The other authors have no financial conflicts of interest.
- , , , . The 100,000 lives campaign: setting a goal and a deadline for improving health care quality. JAMA. 2006;295(3):324–327.
- Clinical Governance Unit, Quality and Safety Branch, Rural and Regional Health and Aged Care Services Division Safer Systems, Department of Human Services, State Government of Victoria. Safer Systems—Saving Lives Campaign. Available at: http://www.health.vic.gov.au/sssl. Accessed April 5, 2012.
- Canadian Patient Safety Institute. Safer Healthcare Now! Campaign. Available at: http://www.saferhealthcarenow.ca. Accessed April 5, 2012.
- , . The growth of rapid response systems. Jt Comm J Qual Patient Saf. 2008;34:489–495.
- , , , . The medical emergency team. Anaesth Intensive Care. 1995;23(2):183–186.
- , , , et al. Rates of in‐hospital arrests, deaths, and intensive care admission: the effect of a medical emergency team. Med J Aust. 2000;173:236–240.
- , , , , . The patient‐at‐risk team: identifying and managing seriously ill ward patients. Anaesthesia. 1999;54:853–860.
- , , , , . Effects of rapid response systems on clinical outcomes: systemic review and meta‐analysis. J Hosp Med. 2007;2:422–432.
- , , , , . Rapid response teams: a systemic review and meta‐analysis. Arch Intern Med. 2010;170(1):18–26.
- , , , , , . Rapid response systems: a systematic review. Crit Care Med. 2007;35(5):1238–1243.
- , , , et al. Introduction of the medical emergency team (MET) system: a cluster‐randomised controlled trial. Lancet. 2005;365:2091–2097.
- , , . Rapid response teams. N Engl J Med. 2011;365:139–146.
- , , , et al. Introducing critical care outreach: a ward‐randomised trial of phased introduction in a general hospital. Intensive Care Med. 2004;30(7):1398–1404.
- , . Impact of an outreach team on re‐admissions to a critical care unit. Anaesthesia. 2003;58:328–332.
- , , , , . Impact of a critical care outreach team on critical care readmissions and mortality. Acta Anaesthesiol Scand. 2004;48:1096–1100.
- , , . Effect of the critical care outreach team on patient survival to discharge from hospital and readmission to critical care: non‐randomised population based study. BMJ. 2003;327:1014–1017.
- , , , . Comorbidity measures for use with administrative data. Med Care. 1998;36(1):8–27.
Rapid response teams (RRT) have been promoted by numerous patient safety organizations to reduce preventable in‐hospital deaths.14 Initial studies of RRTs were promising,57 but recent literature,811 including systematic reviews and meta‐analyses, has called these findings into question. Nevertheless, RRTs remain popular in academic and community hospitals worldwide, and many have expanded their roles beyond solely responding to the deteriorating patient.12
Some RRTs, for example, proactively round on seriously ill ward patients and patients recently discharged from the intensive care unit (ICU) in an effort to prevent transitions to higher levels of care. Priestley and colleagues demonstrated that institution of such a team, referred to as a critical care outreach team (CCOT), decreased in‐hospital mortality while possibly increasing hospital length of stay (LOS).13 Three additional single‐center studies from the United Kingdom, where CCOTs are common, specifically examined proactive rounding by CCOTs on the ICU readmission rate: 2 observed no improvement,14, 15 while the third, limited by a small sample size, demonstrated a modest reduction in ICU readmissions.16
We sought to determine the impact of proactive rounding by an RRT on patients discharged from intensive care on the ICU readmission rate, ICU LOS, and in‐hospital mortality of patients discharged from the ICU. We hypothesized that proactive rounding by an RRT would decrease the ICU readmission rate, ICU LOS, and the in‐hospital mortality of patients discharged from the ICU.
MATERIALS AND METHODS
Site and Subjects
We carried out a retrospective, observational study of adult patients discharged from the ICU at University of California San Francisco (UCSF) Medical Center between January 2006 and June 2009. UCSF is a 790‐bed quaternary care academic hospital that admits approximately 17,000 patients annually and has 5 adult ICUs, with 62 beds and 3500 to 4000 ICU admissions annually. Our study was approved by the UCSF Medical Center Committee on Human Research; need for informed consent was waived.
Description of the RRT Before June 1, 2007
Throughout the study, the goal of the RRT was unchanged: to assess, triage, and institute early treatment in patients who experienced an acute decline in their clinical status. From November 2005 to October 2006, the RRT was staffed by an attending hospitalist and medicine resident during daytime, and by a critical care fellow at nighttime and on weekends. The RRT could be activated by any concerned staff member in response to a set of predetermined vital sign abnormalities, decreased urine output, or altered mental status, or simply if the staff member was concerned about the patient's clinical status. Despite extensive educational efforts, utilization of the team was low (2.7 calls per 1000 admissions) and, accordingly, it was discontinued in October 2006. After this time, staff would contact the primary team caring for the patient, should concerns regarding the patient's condition arise.
Description of the RRT After June 1, 2007
In an effort to expand its scope and utility, the RRT was reinstated on June 1, 2007 with a new composition and increased responsibilities. After this date, physician roles were eliminated, and the team composition changed to a dedicated critical care nurse and respiratory therapist, available 24 hours a day. Criteria for calling the team remained unchanged. In addition to responding to acute deteriorations in patients' clinical courses, the RRT began to proactively assess all patients within 12 hours of discharge from the ICU and would continue to round on these patients daily until it was felt that they were clinically stable. During these rounds, the RRT would provide consultation expertise to the bedside nurse and contact the patient's clinicians if concern existed about a patient's clinical trajectory; decisions to transfer a patient back to the ICU ultimately rested with the patient's primary team. During this time period, the RRT received an average of 110.6 calls per 1000 admissions.
Data Sources
Data collected included: demographics, clinical information (all patient refined [APR] severity of illness, APR risk of mortality, and the presence of 29 comorbidities), whether there was a readmission to the ICU, the total ICU LOS, and the vital status at the time of hospital discharge.
Outcomes
Outcomes included: readmission to the ICU, defined as 2 noncontiguous ICU stays during a single hospitalization; ICU LOS, defined as the total number of ICU days accrued during hospitalization; and in‐hospital mortality of patients discharged from the ICU.
Adjustment Variables
Patient age, gender, race, and ethnicity were available from administrative data. We used admission diagnosis code data to classify comorbidities using the method of Elixhauser et al.17
Statistical Analysis
For each of the 3 study outcomes, we assessed the effects of the intervention using multivariable models adjusting for patient‐ and service‐level factors, including a gamma model for ICU LOS and logistic models for ICU readmission and in‐hospital mortality of patients discharged from the ICU. We first compared unadjusted outcome levels before and after implementation. We then used an interrupted time series (ITS) framework to assess the effects of the intervention in terms of 5 measures: 1) the secular trend in the mean of the outcome before the intervention; 2) the change in the mean at the start of the implementation, or immediate effects; 3) the secular trend in the mean after implementation; 4) the change in secular trend, reflecting cumulative intervention effects; and 5) the net effect of the intervention, estimated as the adjusted difference between the fitted mean at the end of the postintervention period and the expected mean if the preintervention trend had continued without interruption or change.
Secondary Analyses
Given the heterogeneity of the RRT in the preintervention period, we assessed potential changes in trend at October 2006, the month in which the RRT was discontinued. We also examined changes in trend midway through the postimplementation period to evaluate for increased efficacy of the RRT with time.
Selection of Covariates
Age, race, and admitting service were included in both the prepost and ITS models by default for face validity. Additional covariates were selected for each outcome using backwards deletion with a retention criterion of P < 0.05, based on models that allowed the outcome rate to vary freely month to month. Because these data were obtained from administrative billing datasets, and the presence of comorbidities could not be definitively linked with time points during hospitalization, only those comorbidities that were likely present prior at ICU discharge were included. For similar reasons, APR severity of illness and risk of mortality scores, which were calculated from billing diagnoses at the end of hospitalization, were excluded from the models.
RESULTS
Patient Characteristics
During the study period, 11,687 patients were admitted to the ICU; 10,288 were discharged from the ICU alive and included in the analysis. In the 17 months prior to the introduction of proactive rounding by the RRT, 4902 (41.9%) patients were admitted, and during the 25 months afterwards, 6785 (58.1%) patients. Patients admitted in the 2 time periods were similar, although there were clinically small but statistically significant differences in race, APR severity of illness, APR risk of mortality, and certain comorbidities between the 2 groups (Table 1).
| Pre‐RRT (n = 4305) N (%) | Post‐RRT (n = 5983) N (%) | P Value | |
|---|---|---|---|
| |||
| Age, mean (y [SD]) | 57.7 [16.6] | 57.9 [16.5] | 0.50 |
| Female gender | 2,005 (46.6) | 2,824 (47.2) | 0.53 |
| Race | 0.0013 | ||
| White | 2,538 (59.0) | 3,520 (58.8) | |
| Black | 327 (7.6) | 436 (7.3) | |
| Asian | 642 (14.9) | 842 (14.1) | |
| Other | 719 (16.7) | 1,121 (18.7) | |
| Unknown | 79 (1.8) | 64 (1.1) | |
| Ethnicity | 0.87 | ||
| Hispanic | 480 (11.2) | 677 (11.3%) | |
| Non‐Hispanic | 3,547 (82.4) | 4,907 (82.0%) | |
| Unknown | 278 (6.5) | 399 (6.7) | |
| Insurance | 0.50 | ||
| Medicare | 1,788 (41.5) | 2,415 (40.4) | |
| Medicaid/Medi‐Cal | 699 (16.2) | 968 (16.2) | |
| Private | 1,642 (38.1) | 2,329 (38.9) | |
| Other | 176 (4.1) | 271 (4.5) | |
| Admission source | 0.41 | ||
| ED | 1,621 (37.7) | 2,244 (37.5) | |
| Outside hospital | 652 (15.2) | 855 (14.3) | |
| Direct admit | 2,032 (47.2) | 2,884 (48.2) | |
| Major surgery | 0.99 | ||
| Yes | 3,107 (72.2) | 4,319 (72.2) | |
| APR severity of illness | 0.0001 | ||
| Mild | 622 (14.5) | 828 (13.8) | |
| Moderate | 1,328 (30.9) | 1,626 (27.2) | |
| Major | 1,292 (30.0) | 1,908 (31.9) | |
| Extreme | 1,063 (24.7) | 1,621 (27.1) | |
| APR risk of mortality | 0.0109 | ||
| Mild | 1,422 (33.0) | 1,821 (30.4) | |
| Moderate | 1,074 (25.0) | 1,467 (24.5) | |
| Major | 947 (22.0) | 1,437 (24.0) | |
| Extreme | 862 (20.0) | 1,258 (21.0) | |
| Admitting service | 0.11 | ||
| Adult general surgery | 190 (4.4) | 260 (4.4) | |
| Cardiology | 347 (8.1) | 424 (7.1) | |
| Cardiothoracic surgery | 671 (15.6) | 930 (15.5) | |
| Kidney transplant surgery | 105 (2.4) | 112 (1.9) | |
| Liver transplant surgery | 298 (6.9) | 379 (6.3) | |
| Medicine | 683 (15.9) | 958 (16.0) | |
| Neurology | 420 (9.8) | 609 (10.2) | |
| Neurosurgery | 1,345 (31.2) | 1,995 (33.3) | |
| Vascular surgery | 246 (5.7) | 316 (5.3) | |
| Comorbidities | |||
| Hypertension | 2,054 (47.7) | 2,886 (48.2) | 0.60 |
| Fluid and electrolyte disorders | 998 (23.2) | 1,723 (28.8) | <0.0001 |
| Diabetes | 708 (16.5) | 880 (14.7) | 0.02 |
| Chronic obstructive pulmonary disease | 632 (14.7) | 849 (14.2) | 0.48 |
| Iron deficiency anemia | 582 (13.5) | 929 (15.5) | 0.005 |
| Renal failure | 541 (12.6) | 744 (12.4) | 0.84 |
| Coagulopathy | 418 (9.7) | 712 (11.9) | 0.0005 |
| Liver disease | 400 (9.3) | 553 (9.2) | 0.93 |
| Hypothyroidism | 330 (7.7) | 500 (8.4) | 0.20 |
| Depression | 306 (7.1) | 508 (8.5) | 0.01 |
| Peripheral vascular disease | 304 (7.1) | 422 (7.1) | 0.99 |
| Congestive heart failure | 263 (6.1) | 360 (6.0) | 0.85 |
| Weight loss | 236 (5.5) | 425 (7.1) | 0.0009 |
| Paralysis | 225 (5.2) | 328 (5.5) | 0.57 |
| Neurological disorders | 229 (5.3) | 276 (4.6) | 0.10 |
| Valvular disease | 210 (4.9) | 329 (5.5) | 0.16 |
| Drug abuse | 198 (4.6) | 268 (4.5) | 0.77 |
| Metastatic cancer | 198 (4.6) | 296 (5.0) | 0.42 |
| Obesity | 201 (4.7) | 306 (5.1) | 0.30 |
| Alcohol abuse | 178 (4.1) | 216 (3.6) | 0.17 |
| Diabetes with complications | 175 (4.1) | 218 (3.6) | 0.27 |
| Solid tumor without metastasis | 146 (3.4) | 245 (4.1) | 0.07 |
| Psychoses | 115 (2.7) | 183 (3.1) | 0.25 |
| Rheumatoid arthritis/collagen vascular disease | 96 (2.2) | 166 (2.8) | 0.08 |
| Pulmonary circulation disease | 83 (1.9) | 181 (3.0) | 0.0005 |
| Outcomes | |||
| Readmission to ICU | 288 (6.7) | 433 (7.3) | 0.24 |
| ICU length of stay, mean [SD] | 5.1 [9.7] | 4.9 [8.3] | 0.24 |
| In‐hospital mortality of patients discharged from the ICU | 260 (6.0) | 326 (5.5) | 0.24 |
ICU Readmission Rate
Introduction of proactive rounding by the RRT was not associated with unadjusted differences in the ICU readmission rate (6.7% preintervention vs 7.3% postintervention, P = 0.24; Table 1). In the adjusted ITS model, the intervention had no net effect on the odds of ICU readmission (adjusted odds ratio [AOR] for net intervention effect 0.98, 95% confidence interval [CI] 0.42, 2.28), with similar secular trends both preintervention (AOR 1.00 per year, 95% CI 0.97, 1.03), and afterwards (AOR 0.99 per year, 95% CI 0.98, 01.00), and a nonsignificant increase at implementation (Table 2). Figure 1 uses solid lines to show the fitted readmission rates, a hatched line to show the projection of the preintervention secular trend into the postintervention period, and circles to represent adjusted monthly means. The lack of a net intervention effect is indicated by the convergence of the solid and hatched lines 24 months postintervention.
| Outcome: Summary Effect Measure | Value (95% CI) | P Value |
|---|---|---|
| ||
| ICU readmission rateadjusted odds ratio | ||
| Pre‐RRT trend | 1.00 (0.97, 1.03) | 0.98 |
| Change at RRT implementation | 1.24 (0.94, 1.63) | 0.13 |
| Post‐RRT trend | 0.98 (0.97, 1.00) | 0.06 |
| Change in trend | 0.98 (0.96, 1.02) | 0.39 |
| Net intervention effect | 0.92 (0.40, 2.12) | 0.85 |
| ICU average length of stayadjusted ratio of means | ||
| Trend at 9 mo pre‐RRT | 0.98 (0.96, 1.00) | 0.05 |
| Trend at 3 mo pre‐RRT | 1.02 (0.99, 1.04) | 0.19 |
| Change in trend at 3 mo pre‐RRT | 1.03 (1.00, 1.07) | 0.07 |
| Change at RRT implementation | 0.92 (0.80, 1.06) | 0.27 |
| Post‐RRT trend | 1.00 (0.99, 1.00) | 0.35 |
| Change in trend at RRT implementation | 0.98 (0.96, 1.01) | 0.14 |
| Net intervention effect | 0.60 (0.31, 1.18) | 0.14 |
| In‐hospital mortality of patients discharged from the ICUadjusted odds ratio | ||
| Pre‐RRT trend | 1.02 (0.99, 1.06) | 0.15 |
| Change at RRT implementation | 0.74 (0.51, 1.08) | 0.12 |
| Post‐RRT trend | 1.00 (0.98, 1.01) | 0.68 |
| Change in trend | 0.97 (0.94, 1.01) | 0.14 |
| Net intervention effect | 0.39 (0.14, 1.10) | 0.08 |
ICU Average LOS
Introduction of proactive rounding by the RRT was not associated with unadjusted differences in ICU average LOS (5.1 days preintervention vs 4.9 days postintervention, P = 0.24; Table 1). Trends in ICU LOS may have changed in October 2006 (P = 0.07), decreasing in the first half of the study period (adjusted rate ratio [ARR] 0.98 per year, 95% CI 0.961.00), but did not change significantly thereafter. As with the ICU readmission rate, neither the change in estimated secular trend after implementation (ARR 0.98, 95% CI 0.961.01), nor the net effect of the intervention (ARR 0.62, 95% CI 0.321.22) was statistically significant (Table 2); these results are depicted graphically in Figure 2.
In‐Hospital Mortality of Patients Discharged From the ICU
Introduction of proactive rounding by the RRT was not associated with unadjusted differences in the mortality of patients discharged from the ICU (6.0% preintervention vs 5.5% postintervention, P = 0.24; Table 1). Similarly, in the adjusted ITS model, the intervention had no statistically significant net effect on the mortality outcome (Table 2 and Figure 3).
Secondary Analyses
Apart from weak evidence for a change in trend in ICU LOS in October 2006, no other changes in trend were found within the preintervention or postintervention periods (data not shown). This suggests that the heterogeneity of the preintervention RRT had no significant impact on the 3 outcomes examined, and that the RRT intervention failed to gain efficacy with time in the postintervention period. Additionally, we saw no outcome benefit in sensitivity analyses among all ICU patients or in service‐defined analyses (eg, surgical services), where ability to control for illness severity was improved.
DISCUSSION
In this single center study, introduction of an RRT that proactively rounded on patients discharged from the ICU did not reduce the ICU readmission rate, ICU LOS, or mortality of patients discharged from the ICU, after accounting for secular trends using robust ITS methods and adjusting for patient level factors.
Our study is consistent with 2 smaller studies that assessed the impact of proactive rounding by a CCOT on ICU readmission rate. Leary and Ridley14 found that proactively rounding by a CCOT did not reduce ICU readmissions or shorten the ICU LOS, although this study was limited by a surprisingly low ICU readmission rate and short ICU LOS prior to the intervention. Another study15 also observed no change in the ICU readmission rate following introduction of a proactively rounding CCOT but noted small reductions in both ICU and hospital mortality. The sole study showing an effect16 observed a lower ICU readmission rate and increased survival to hospital discharge (after excluding do not resuscitate [DNR] patients) with implementation of a CCOT, although some of their findings may be explained by their CCOT's use of palliative care services, a function not featured in our model.
Our study adds to the meta‐analyses and systematic reviews810 that have questioned the hypothesis that a trained and proactive team of caregivers should be able to prevent patients from returning to the ICU. Perhaps one reason why this is not true is that proactive rounding by RRTs may have minimal effect in systems where step‐down beds are readily available. At UCSF, nearly every patient transferred out of the ICU is triaged to a step‐down unit, where telemetry and pulse oximetry are continuously monitored. Despite this, however, our institution's 2 step‐down units generate more calls to our RRT than any other units in the hospital.
We were surprised to see that proactive rounding failed to shorten ICU LOS, hypothesizing that clinicians would be more comfortable discharging patients from the ICU knowing that the RRT would be closely monitoring them afterwards. Although we have no data to support this hypothesis, increased use of the RRT may have also increased step‐down bed use, as patients on the general medicalsurgical floors were transferred to a higher level of care upon recommendation of the RRT, thereby delaying transfers out of the ICU. Moreover, the opening of an additional 16‐bed ICU in October 2008 might have encouraged clinicians to transfer patients back to the ICU simply because beds were more easily accessible than before.
Introduction of proactive rounding by the RRT was also not associated with differences in the mortality rate of patients discharged from the ICU. This finding conflicts with the results of Garcea et al,15 Ball et al,16 and Priestley et al13, all of which found that implementation of a CCOT led to small but statistically significant reductions in in‐hospital mortality. All 3 of these studies, however, examined smaller patient populations (1380, 470, and 2903 patients, respectively), and both the Priestley and Ball studies13, 16 had significantly shorter periods of data collection (24 months and 32 weeks, respectively). Our results are based on models with confidence intervals and P values that account for variability in all 3 underlying effect estimates but assume a linear extrapolation of the preintervention trend. This approach allowed us to flexibly deal with changes related to the intervention, while relying on our large sample size to define time trends not dealt with adequately (or at all) in previous research.
The lack of improvement in outcomes cannot be attributed to immaturity of the RRT or failure of the clinical staff to use the RRT adequately. A prespecified secondary data analysis midway through the postintervention time period demonstrated that the RRT failed to gain efficacy with time with respect to all 3 outcomes. The postintervention RRT was also utilized far more frequently than its predecessor (110.6 vs 2.7 calls per 1000 admissions, respectively), and this degree of RRT utilization far surpasses the dose considered to be indicative of a mature RRT system.12
Our study has several limitations. First, we relied on administrative rather than chart‐collected data to determine the reason for ICU admission, and the APR severity of illness and risk of mortality scores. It seems unlikely, however, that coding deficiencies or biases affected the preintervention and postintervention patient populations differently. Even though we adjusted for all available measures, it is possible that we were not able to account for time trends in all potential confounders. Second, we did not have detailed clinical information on reasons for ICU readmission and whether readmissions occurred before or after the RRT proactively rounded on the patient. Therefore, potential readmissions to the ICU that might have been planned or which would have happened regardless of the presence of the RRT, such as for antibiotic desensitization, could not be accounted for. Third, introduction of proactive rounding by the RRT in June 2007 was accompanied by a change in the RRT's composition, from a physician‐led model to a nurse‐led model. Therefore, inherent differences in the way that physicians and nurses might assess and triage patients could not have been adjusted for. Lastly, this was a retrospective study conducted at a single academic medical center with a specific RRT model, and our results may not be directly applicable to nonteaching settings or to different RRT models.
Our findings raise further questions about the benefits of RRTs as they assume additional roles, such as proactive rounding on patients recently discharged from the ICU. The failure of our RRT to reduce the ICU readmission rate, the ICU average LOS, and the mortality of patients discharged from the ICU raises concerns that the benefits of our RRT are not commensurate with its cost. While defining the degree of impact and underlying mechanisms are worthy of prospective study, hospitals seeking to improve their RRT models should consider how to develop systems that achieve the RRT's promise in measurable ways.
Acknowledgements
The authors acknowledge Heather Leicester, MSPH, Senior Performance Improvement Analyst for Patient Safety and Quality Services at the University of California San Francisco for her work in data acquisition.
Disclosures: Dr Vittinghoff received salary support from an NIH grant during the time of this work for statistical consulting. He receives textbook royalties from Springer Verlag. Dr Auerbach was supported by 5K24HL098372‐02 from the National Heart Lung and Blood Institute during the period of this study although not specifically for this study; they had no role in the design or conduct of the study; the collection, analysis, or interpretation of the data; or the preparation, review, or approval of the manuscript. The other authors have no financial conflicts of interest.
- , , , . The 100,000 lives campaign: setting a goal and a deadline for improving health care quality. JAMA. 2006;295(3):324–327.
- Clinical Governance Unit, Quality and Safety Branch, Rural and Regional Health and Aged Care Services Division Safer Systems, Department of Human Services, State Government of Victoria. Safer Systems—Saving Lives Campaign. Available at: http://www.health.vic.gov.au/sssl. Accessed April 5, 2012.
- Canadian Patient Safety Institute. Safer Healthcare Now! Campaign. Available at: http://www.saferhealthcarenow.ca. Accessed April 5, 2012.
- , . The growth of rapid response systems. Jt Comm J Qual Patient Saf. 2008;34:489–495.
- , , , . The medical emergency team. Anaesth Intensive Care. 1995;23(2):183–186.
- , , , et al. Rates of in‐hospital arrests, deaths, and intensive care admission: the effect of a medical emergency team. Med J Aust. 2000;173:236–240.
- , , , , . The patient‐at‐risk team: identifying and managing seriously ill ward patients. Anaesthesia. 1999;54:853–860.
- , , , , . Effects of rapid response systems on clinical outcomes: systemic review and meta‐analysis. J Hosp Med. 2007;2:422–432.
- , , , , . Rapid response teams: a systemic review and meta‐analysis. Arch Intern Med. 2010;170(1):18–26.
- , , , , , . Rapid response systems: a systematic review. Crit Care Med. 2007;35(5):1238–1243.
- , , , et al. Introduction of the medical emergency team (MET) system: a cluster‐randomised controlled trial. Lancet. 2005;365:2091–2097.
- , , . Rapid response teams. N Engl J Med. 2011;365:139–146.
- , , , et al. Introducing critical care outreach: a ward‐randomised trial of phased introduction in a general hospital. Intensive Care Med. 2004;30(7):1398–1404.
- , . Impact of an outreach team on re‐admissions to a critical care unit. Anaesthesia. 2003;58:328–332.
- , , , , . Impact of a critical care outreach team on critical care readmissions and mortality. Acta Anaesthesiol Scand. 2004;48:1096–1100.
- , , . Effect of the critical care outreach team on patient survival to discharge from hospital and readmission to critical care: non‐randomised population based study. BMJ. 2003;327:1014–1017.
- , , , . Comorbidity measures for use with administrative data. Med Care. 1998;36(1):8–27.
Copyright © 2012 Society of Hospital Medicine