User login
Electronic Order Volume as a Meaningful Component in Estimating Patient Complexity and Resident Physician Workload
Resident physician workload has traditionally been measured by patient census.1,2 However, census and other volume-based metrics such as daily admissions may not accurately reflect workload due to variation in patient complexity. Relative value units (RVUs) are another commonly used marker of workload, but the validity of this metric relies on accurate coding, usually done by the attending physician, and is less directly related to resident physician workload. Because much of hospital-based medicine is mediated through the electronic health record (EHR), which can capture differences in patient complexity,3 electronic records could be harnessed to more comprehensively describe residents’ work. Current government estimates indicate that several hundred companies offer certified EHRs, thanks in large part to the Health Information Technology for Economic and Clinical Health (HITECH) Act of 2009, which aimed to promote adoption and meaningful use of health information technology.4, 5 These systems can collect important data about the usage and operating patterns of physicians, which may provide an insight into workload.6-8
Accurately measuring workload is important because of the direct link that has been drawn between physician workload and quality metrics. In a study of attending hospitalists, higher workload, as measured by patient census and RVUs, was associated with longer lengths of stay and higher costs of hospitalization.9 Another study among medical residents found that as daily admissions increased, length of stay, cost, and inpatient mortality appeared to rise.10 Although these studies used only volume-based workload metrics, the implication that high workload may negatively impact patient care hints at a possible trade-off between the two that should inform discussions of physician productivity.
In the current study, we examine whether data obtained from the EHR, particularly electronic order volume, could provide valuable information, in addition to patient volume, about resident physician workload. We first tested the feasibility and validity of using electronic order volume as an important component of clinical workload by examining the relationship between electronic order volume and well-established factors that are likely to increase the workload of residents, including patient level of care and severity of illness. Then, using order volume as a marker for workload, we sought to describe whether higher order volumes were associated with two discharge-related quality metrics, completion of a high-quality after-visit summary and timely discharge summary, postulating that quality metrics may suffer when residents are busier.
METHODS
Study Design and Setting
We performed a single-center retrospective cohort study of patients admitted to the internal medicine service at the University of California, San Francisco (UCSF) Medical Center between May 1, 2015 and July 31, 2016. UCSF is a 600-bed academic medical center, and the inpatient internal medicine teaching service manages an average daily census of 80-90 patients. Medicine teams care for patients on the general acute-care wards, the step-down units (for patients with higher acuity of care), and also patients in the intensive care unit (ICU). ICU patients are comanaged by general medicine teams and intensive care teams; internal medicine teams enter all electronic orders for ICU patients, except for orders for respiratory care or sedating medications. The inpatient internal medicine teaching service comprises eight teams each supervised by an attending physician, a senior resident (in the second or third year of residency training), two interns, and a third- and/or fourth-year medical student. Residents place all clinical orders and complete all clinical documentation through the EHR (Epic Systems, Verona, Wisconsin).11 Typically, the bulk of the orders and documentation, including discharge documentation, is performed by interns; however, the degree of senior resident involvement in these tasks is variable and team-dependent. In addition to the eight resident teams, there are also four attending hospitalist-only internal medicine teams, who manage a service of ~30-40 patients.
Study Population
Our study population comprised all hospitalized adults admitted to the eight resident-run teams on the internal medicine teaching service. Patients cared for by hospitalist-only teams were not included in this analysis. Because the focus of our study was on hospitalizations, individual patients may have been included multiple times over the course of the study. Hospitalizations were excluded if they did not have complete Medicare Severity-Diagnosis Related Group (MS-DRG) data,12 since this was used as our severity of illness marker. This occurred either because patients were not discharged by the end of the study period or because they had a length of stay of less than one day, because this metric was not assigned to these short-stay (observation) patients.
Data Collection
All electronic orders placed during the study period were obtained by extracting data from Epic’s Clarity database. Our EHR allows for the use of order sets; each order in these sets was counted individually, so that an order set with several orders would not be identified as one order. We identified the time and date that the order was placed, the ordering physician, the identity of the patient for which the order was placed, and the location of the patient when the order was placed, to determine the level of care (ICU, step-down, or general medicine unit). To track the composite volume of orders placed by resident teams, we matched each ordering physician to his or her corresponding resident team using our physician scheduling database, Amion (Spiral Software). We obtained team census by tabulating the total number of patients that a single resident team placed orders on over the course of a given calendar day. From billing data, we identified the MS-DRG weight that was assigned at the end of each hospitalization. Finally, we collected data on adherence to two discharge-related quality metrics to determine whether increased order volume was associated with decreased rates of adherence to these metrics. Using departmental patient-level quality improvement data, we determined whether each metric was met on discharge at the patient level. We also extracted patient-level demographic data, including age, sex, and insurance status, from this departmental quality improvement database.
Discharge Quality Outcome Metrics
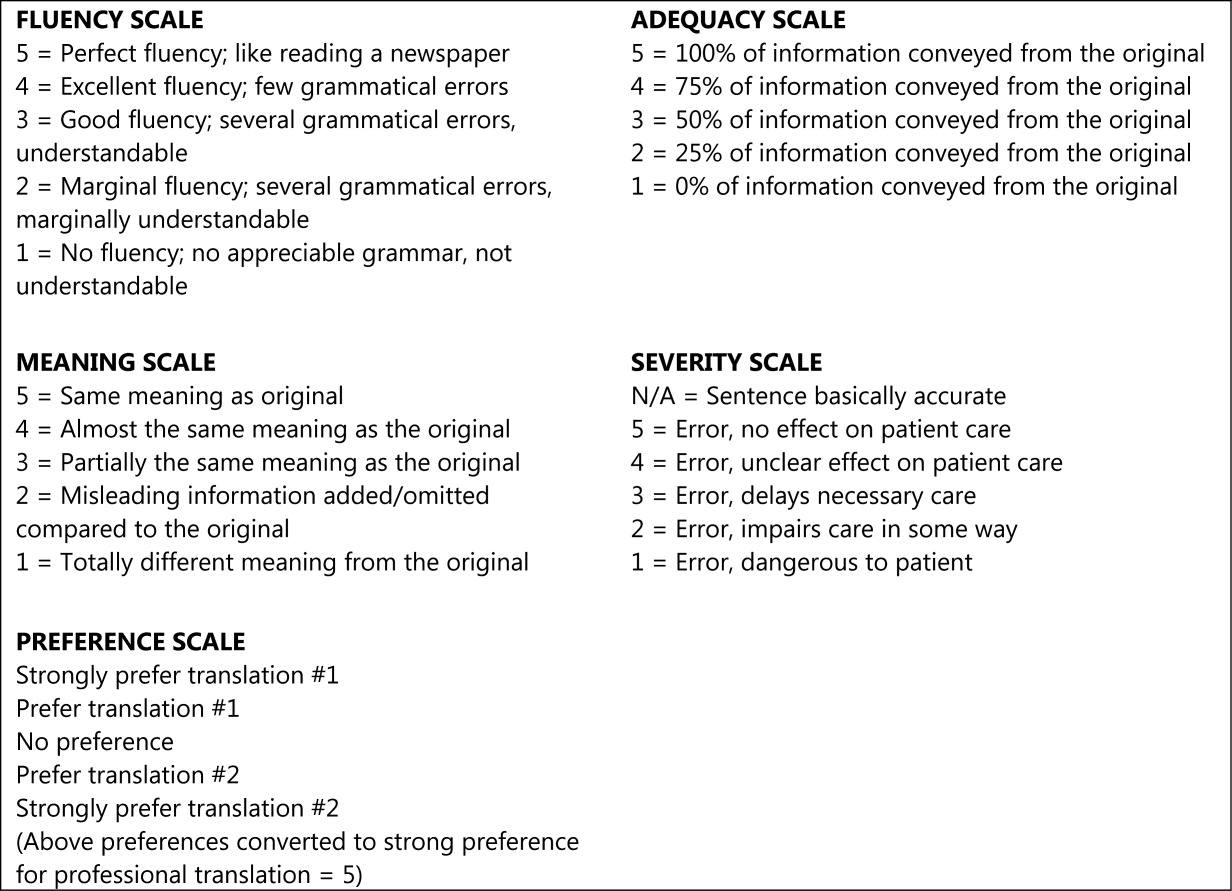
We hypothesized that as the total daily electronic orders of a resident team increased, the rate of completion of two discharge-related quality metrics would decline due to the greater time constraints placed on the teams. The first metric we used was the completion of a high-quality after-visit summary (AVS), which has been described by the Centers for Medicare and Medicaid Services as part of its Meaningful Use Initiative.13 It was selected by the residents in our program as a particularly high-priority quality metric. Our institution specifically defines a “high-quality” AVS as including the following three components: a principal hospital problem, patient instructions, and follow-up information. The second discharge-related quality metric was the completion of a timely discharge summary, another measure recognized as a critical component in high-quality care.14 To be considered timely, the discharge summary had to be filed no later than 24 hours after the discharge order was entered into the EHR. This metric was more recently tracked by the internal medicine department and was not selected by the residents as a high-priority metric.
Statistical Analysis
To examine how the order volume per day changed throughout each sequential day of hospital admission, mean orders per hospital day with 95% CIs were plotted. We performed an aggregate analysis of all orders placed for each patient per day across three different levels of care (ICU, step-down, and general medicine). For each day of the study period, we summed all orders for all patients according to their location and divided by the number of total patients in each location to identify the average number of orders written for an ICU, step-down, and general medicine patient that day. We then calculated the mean daily orders for an ICU, step-down, and general medicine patient over the entire study period. We used ANOVA to test for statistically significant differences between the mean daily orders between these locations.
To examine the relationship between severity of illness and order volume, we performed an unadjusted patient-level analysis of orders per patient in the first three days of each hospitalization and stratified the data by the MS-DRG payment weight, which we divided into four quartiles. For each quartile, we calculated the mean number of orders placed in the first three days of admission and used ANOVA to test for statistically significant differences. We restricted the orders to the first three days of hospitalization instead of calculating mean orders per day of hospitalization because we postulated that the majority of orders were entered in these first few days and that with increasing length of stay (which we expected to occur with higher MS-DRG weight), the order volume becomes highly variable, which would tend to skew the mean orders per day.
We used multivariable logistic regression to determine whether the volume of electronic orders on the day of a given patient’s discharge, and also on the day before a given patient’s discharge, was a significant predictor of receiving a high-quality AVS. We adjusted for team census on the day of discharge, MS-DRG weight, age, sex, and insurance status. We then conducted a separate analysis of the association between electronic order volume and likelihood of completing a timely discharge summary among patients where discharge summary data were available. Logistic regression for each case was performed independently, so that team orders on the day prior to a patient’s discharge were not included in the model for the relationship between team orders on the day of a patient’s discharge and the discharge-related quality metric of interest, and vice versa, since including both in the model would be potentially disruptive given that orders on the day before and day of a patient’s discharge are likely correlated.
We also performed a subanalysis in which we restricted orders to only those placed during the daytime hours (7
IRB Approval
The study was approved by the UCSF Institutional Review Board and was granted a waiver of informed consent.
RESULTS
Population
We identified 7,296 eligible hospitalizations during the study period. After removing hospitalizations according to our exclusion criteria (Figure 1), there were 5,032 hospitalizations that were used in the analysis for which a total of 929,153 orders were written. The vast majority of patients received at least one order per day; fewer than 1% of encounter-days had zero associated orders. The top 10 discharge diagnoses identified in the cohort are listed in Appendix Table 1. A breakdown of orders by order type, across the entire cohort, is displayed in Appendix Table 2. The mean number of orders per patient per day of hospitalization is plotted in the Appendix Figure, which indicates that the number of orders is highest on the day of admission, decreases significantly after the first few days, and becomes increasingly variable with longer lengths of stay.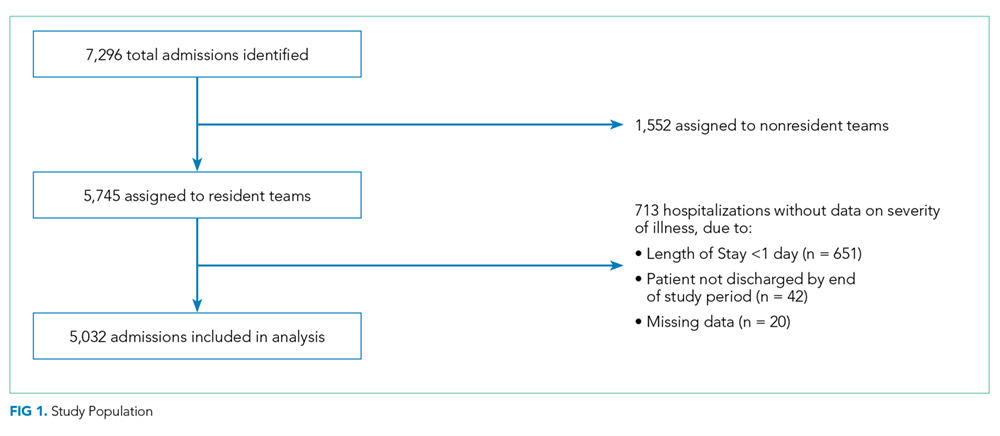
Patient Level of Care and Severity of Illness Metrics
Patients at a higher level of care had, on average, more orders entered per day. The mean order frequency was 40 orders per day for an ICU patient (standard deviation [SD] 13, range 13-134), 24 for a step-down patient (SD 6, range 11-48), and 19 for a general medicine unit patient (SD 3, range 10-31). The difference in mean daily orders was statistically significant (P < .001, Figure 2a).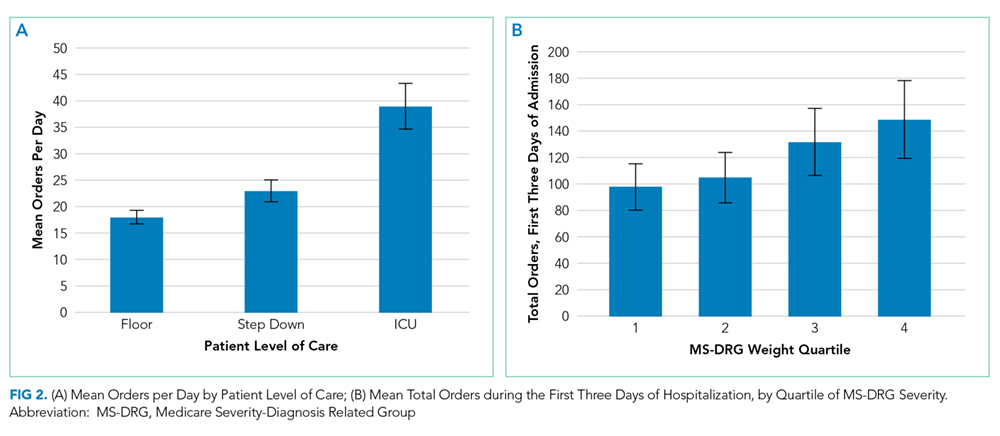
Orders also correlated with increasing severity of illness. Patients in the lowest quartile of MS-DRG weight received, on average, 98 orders in the first three days of hospitalization (SD 35, range 2-349), those in the second quartile received 105 orders (SD 38, range 10-380), those in the third quartile received 132 orders (SD 51, range 17-436), and those in the fourth and highest quartile received 149 orders (SD 59, range 32-482). Comparisons between each of these severity of illness categories were significant (P < .001, Figure 2b).
Discharge-Related Quality Metrics
The median number of orders per internal medicine team per day was 343 (IQR 261- 446). Of the 5,032 total discharged patients, 3,657 (73%) received a high-quality AVS on discharge. After controlling for team census, severity of illness, and demographic factors, there was no statistically significant association between total orders on the day of discharge and odds of receiving a high-quality AVS (OR 1.01; 95% CI 0.96-1.06), or between team orders placed the day prior to discharge and odds of receiving a high-quality AVS (OR 0.99; 95% CI 0.95-1.04; Table 1). When we restricted our analysis to orders placed during daytime hours (7 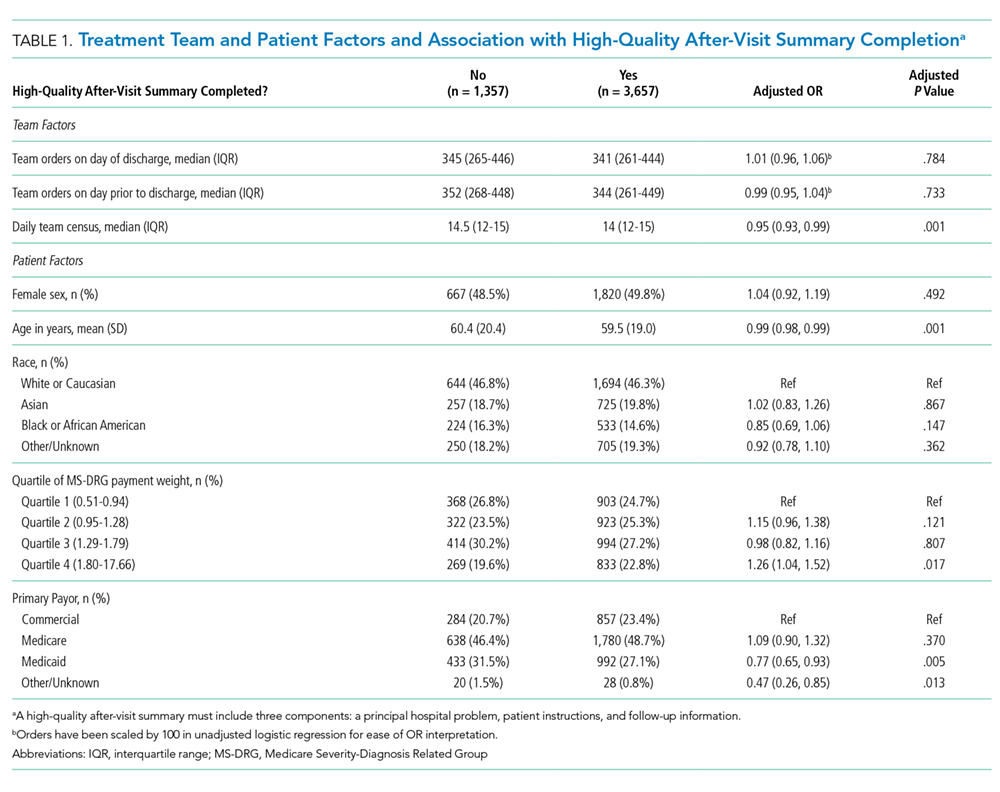
There were 3,835 patients for whom data on timing of discharge summary were available. Of these, 3,455 (91.2%) had a discharge summary completed within 24 hours. After controlling for team census, severity of illness, and demographic factors, there was no statistically significant association between total orders placed by the team on a patient’s day of discharge and odds of receiving a timely discharge summary (OR 0.96; 95% CI 0.88-1.05). However, patients were 12% less likely to receive a timely discharge summary for every 100 extra orders the team placed on the day prior to discharge (OR 0.88, 95% CI 0.82-0.95). Patients who received a timely discharge summary were cared for by teams who placed a median of 345 orders the day prior to their discharge, whereas those that did not receive a timely discharge summary were cared for by teams who placed a significantly higher number of orders (375) on the day prior to discharge (Table 2). When we restricted our analysis to only daytime orders, there were no significant changes in the findings (OR 1.00; 95% CI 0.88-1.14 for orders on the day of discharge; OR 0.84; 95% CI 0.75-0.95 for orders on the day prior to discharge).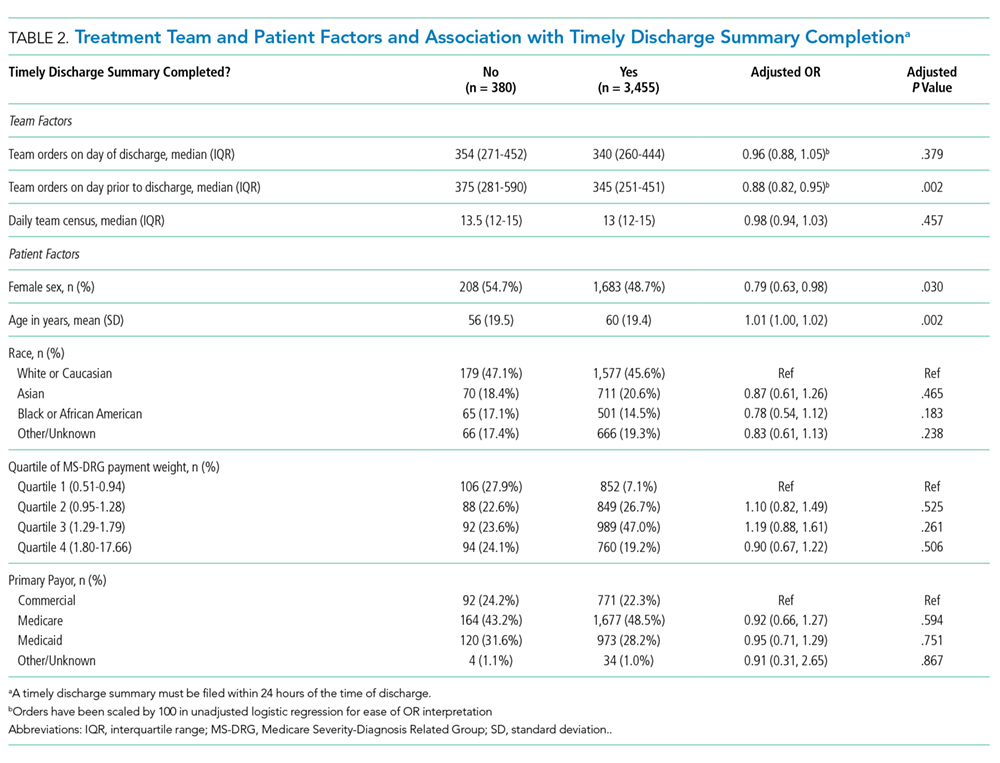
DISCUSSION
We found that electronic order volume may be a marker for patient complexity, which encompasses both level of care and severity of illness, and could be a marker of resident physician workload that harnesses readily available data from an EHR. Recent time-motion studies of internal medicine residents indicate that the majority of trainees’ time is spent on computers, engaged in indirect patient care activities such as reading electronic charts, entering electronic orders, and writing computerized notes.15-18 Capturing these tasks through metrics such as electronic order volume, as we did in this study, can provide valuable insights into resident physician workflow.
We found that ICU patients received more than twice as many orders per day than did general acute care-level patients. Furthermore, we found that patients whose hospitalizations fell into the highest MS-DRG weight quartile received approximately 50% more orders during the first three days of admission compared to that of patients whose hospitalizations fell into the lowest quartile. This strong association indicates that electronic order volume could provide meaningful additional information, in concert with other factors such as census, to describe resident physician workload.
We did not find that our workload measure was significantly associated with high-quality AVS completion. There are several possible explanations for this finding. First, adherence to this quality metric may be independent of workload, possibly because it is highly prioritized by residents at our institution. Second, adherence may only be impacted at levels of workload greater than what was experienced by the residents in our study. Finally, electronic order volume may not encompass enough of total workload to be reliably representative of resident work. However, the tight correlation between electronic order volume with severity of illness and level of care, in conjunction with the finding that patients were less likely to receive a timely discharge summary when workload was high on the day prior to a patient’s discharge, suggests that electronic order volume does indeed encompass a meaningful component of workload, and that with higher workload, adherence to some quality metrics may decline. We found that patients who received a timely discharge summary were discharged by teams who entered 30 fewer orders on the day before discharge compared with patients who did not receive a timely discharge summary. In addition to being statistically significant, it is also likely that this difference is clinically significant, although a determination of clinical significance is outside the scope of this study. Further exploration into the relationship between order volume and other quality metrics that are perhaps more sensitive to workload would be interesting.
The primary strength of our study is in how it demonstrates that EHRs can be harnessed to provide additional insights into clinical workload in a quantifiable and automated manner. Although there are a wide range of EHRs currently in use across the country, the capability to track electronic orders is common and could therefore be used broadly across institutions, with tailoring and standardization specific to each site. This technique is similar to that used by prior investigators who characterized the workload of pediatric residents by orders entered and notes written in the electronic medical record.19 However, our study is unique, in that we explored the relationship between electronic order volume and patient-level severity metrics as well as discharge-related quality metrics.
Our study is limited by several factors. When conceptualizing resident workload, several other elements that contribute to a sense of “busyness” may be independent of electronic orders and were not measured in our study.20 These include communication factors (such as language discordance, discussion with consulting services, and difficult end-of-life discussions), environmental factors (such as geographic localization), resident physician team factors (such as competing clinical or educational responsibilities), timing (in terms of day of week as well as time of year, since residents in July likely feel “busier” than residents in May), and ultimate discharge destination for patients (those going to a skilled nursing facility may require discharge documentation more urgently). Additionally, we chose to focus on the workload of resident teams, as represented by team orders, as opposed to individual work, which may be more directly correlated to our outcomes of interest, completion of a high-quality AVS, and timely discharge summary, which are usually performed by individuals.
Furthermore, we did not measure the relationship between our objective measure of workload and clinical endpoints. Instead, we chose to focus on process measures because they are less likely to be confounded by clinical factors independent of physician workload.21 Future studies should also consider obtaining direct resident-level measures of “busyness” or burnout, or other resident-centered endpoints, such as whether residents left the hospital at times consistent with duty hour regulations or whether they were able to attend educational conferences.
These limitations pose opportunities for further efforts to more comprehensively characterize clinical workload. Additional research is needed to understand and quantify the impact of patient, physician, and environmental factors that are not reflected by electronic order volume. Furthermore, an exploration of other electronic surrogates for clinical workload, such as paging volume and other EHR-derived data points, could also prove valuable in further describing the clinical workload. Future studies should also examine whether there is a relationship between these novel markers of workload and further outcomes, including both process measures and clinical endpoints.
CONCLUSIONS
Electronic order volume may provide valuable additional information for estimating the workload of resident physicians caring for hospitalized patients. Further investigation to determine whether the statistically significant differences identified in this study are clinically significant, how the technique used in this work may be applied to different EHRs, an examination of other EHR-derived metrics that may represent workload, and an exploration of additional patient-centered outcomes may be warranted.
Disclosures
Rajkomar reports personal fees from Google LLC, outside the submitted work. Dr. Khanna reports that during the conduct of the study, his salary, and the development of CareWeb (a communication platform that includes a smartphone-based paging application in use in several inpatient clinical units at University of California, San Francisco [UCSF] Medical Center) were supported by funding from the Center for Digital Health Innovation at UCSF. The CareWeb software has been licensed by Voalte.
Disclaimer
The views expressed in the submitted article are of the authors and not an official position of the institution.
1. Lurie JD, Wachter RM. Hospitalist staffing requirements. Eff Clin Pract. 1999;2(3):126-30. PubMed
2. Wachter RM. Hospitalist workload: The search for the magic number. JAMA Intern Med. 2014;174(5):794-795. doi: 10.1001/jamainternmed.2014.18. PubMed
3. Adler-Milstein J, DesRoches CM, Kralovec P, et al. Electronic health record adoption in US hospitals: progress continues, but challenges persist. Health Aff (Millwood). 2015;34(12):2174-2180. doi: 10.1377/hlthaff.2015.0992. PubMed
4. The Office of the National Coordinator for Health Information Technology, Health IT Dashboard. [cited 2018 April 4]. https://dashboard.healthit.gov/quickstats/quickstats.php Accessed June 28, 2018.
5. Index for Excerpts from the American Recovery and Reinvestment Act of 2009. Health Information Technology (HITECH) Act 2009. p. 112-164.
6. van der Sijs H, Aarts J, Vulto A, Berg M. Overriding of drug safety alerts in computerized physician order entry. J Am Med Inform Assoc. 2006;13(2):138-147. doi: 10.1197/jamia.M1809. PubMed
7. Ancker JS, Kern LM1, Edwards A, et al. How is the electronic health record being used? Use of EHR data to assess physician-level variability in technology use. J Am Med Inform Assoc. 2014;21(6):1001-1008. doi: 10.1136/amiajnl-2013-002627. PubMed
8. Hendey GW, Barth BE, Soliz T. Overnight and postcall errors in medication orders. Acad Emerg Med. 2005;12(7):629-634. doi: 10.1197/j.aem.2005.02.009. PubMed
9. Elliott DJ, Young RS2, Brice J3, Aguiar R4, Kolm P. Effect of hospitalist workload on the quality and efficiency of care. JAMA Intern Med. 2014;174(5):786-793. doi: 10.1001/jamainternmed.2014.300. PubMed
10. Ong M, Bostrom A, Vidyarthi A, McCulloch C, Auerbach A. House staff team workload and organization effects on patient outcomes in an academic general internal medicine inpatient service. Arch Intern Med. 2007;167(1):47-52. doi: 10.1001/archinte.167.1.47. PubMed
11. Epic Systems. [cited 2017 March 28]; Available from: http://www.epic.com/. Accessed June 28, 2018.
12. MS-DRG Classifications and software. https://www.cms.gov/Medicare/Medicare-Fee-for-Service-Payment/AcuteInpatientPPS/MS-DRG-Classifications-and-Software.html. Accessed June 28, 2018.
13. Hummel J, Evans P. Providing Clinical Summaries to Patients after Each Office Visit: A Technical Guide. [cited 2017 March 27]. https://www.healthit.gov/sites/default/files/measure-tools/avs-tech-guide.pdf. Accessed June 28, 2018.
14. Haycock M, Stuttaford L, Ruscombe-King O, Barker Z, Callaghan K, Davis T. Improving the percentage of electronic discharge summaries completed within 24 hours of discharge. BMJ Qual Improv Rep. 2014;3(1) pii: u205963.w2604. doi: 10.1136/bmjquality.u205963.w2604. PubMed
15. Block L, Habicht R, Wu AW, et al. In the wake of the 2003 and 2011 duty hours regulations, how do internal medicine interns spend their time? J Gen Intern Med. 2013;28(8):1042-1047. doi: 10.1007/s11606-013-2376-6. PubMed
16. Wenger N, Méan M, Castioni J, Marques-Vidal P, Waeber G, Garnier A. Allocation of internal medicine resident time in a Swiss hospital: a time and motion study of day and evening shifts. Ann Intern Med. 2017;166(8):579-586. doi: 10.7326/M16-2238. PubMed
17. Mamykina L, Vawdrey DK, Hripcsak G. How do residents spend their shift time? A time and motion study with a particular focus on the use of computers. Acad Med. 2016;91(6):827-832. doi: 10.1097/ACM.0000000000001148. PubMed
18. Fletcher KE, Visotcky AM, Slagle JM, Tarima S, Weinger MB, Schapira MM. The composition of intern work while on call. J Gen Intern Med. 2012;27(11):1432-1437. doi: 10.1007/s11606-012-2120-7. PubMed
19. Was A, Blankenburg R, Park KT. Pediatric resident workload intensity and variability. Pediatrics 2016;138(1):e20154371. doi: 10.1542/peds.2015-4371. PubMed
20. Michtalik HJ, Pronovost PJ, Marsteller JA, Spetz J, Brotman DJ. Developing a model for attending physician workload and outcomes. JAMA Intern Med. 2013;173(11):1026-1028. doi: 10.1001/jamainternmed.2013.405. PubMed
21. Mant J. Process versus outcome indicators in the assessment of quality of health care. Int J Qual Health Care. 2001;13(6):475-480. doi: 10.1093/intqhc/13.6.475. PubMed
Resident physician workload has traditionally been measured by patient census.1,2 However, census and other volume-based metrics such as daily admissions may not accurately reflect workload due to variation in patient complexity. Relative value units (RVUs) are another commonly used marker of workload, but the validity of this metric relies on accurate coding, usually done by the attending physician, and is less directly related to resident physician workload. Because much of hospital-based medicine is mediated through the electronic health record (EHR), which can capture differences in patient complexity,3 electronic records could be harnessed to more comprehensively describe residents’ work. Current government estimates indicate that several hundred companies offer certified EHRs, thanks in large part to the Health Information Technology for Economic and Clinical Health (HITECH) Act of 2009, which aimed to promote adoption and meaningful use of health information technology.4, 5 These systems can collect important data about the usage and operating patterns of physicians, which may provide an insight into workload.6-8
Accurately measuring workload is important because of the direct link that has been drawn between physician workload and quality metrics. In a study of attending hospitalists, higher workload, as measured by patient census and RVUs, was associated with longer lengths of stay and higher costs of hospitalization.9 Another study among medical residents found that as daily admissions increased, length of stay, cost, and inpatient mortality appeared to rise.10 Although these studies used only volume-based workload metrics, the implication that high workload may negatively impact patient care hints at a possible trade-off between the two that should inform discussions of physician productivity.
In the current study, we examine whether data obtained from the EHR, particularly electronic order volume, could provide valuable information, in addition to patient volume, about resident physician workload. We first tested the feasibility and validity of using electronic order volume as an important component of clinical workload by examining the relationship between electronic order volume and well-established factors that are likely to increase the workload of residents, including patient level of care and severity of illness. Then, using order volume as a marker for workload, we sought to describe whether higher order volumes were associated with two discharge-related quality metrics, completion of a high-quality after-visit summary and timely discharge summary, postulating that quality metrics may suffer when residents are busier.
METHODS
Study Design and Setting
We performed a single-center retrospective cohort study of patients admitted to the internal medicine service at the University of California, San Francisco (UCSF) Medical Center between May 1, 2015 and July 31, 2016. UCSF is a 600-bed academic medical center, and the inpatient internal medicine teaching service manages an average daily census of 80-90 patients. Medicine teams care for patients on the general acute-care wards, the step-down units (for patients with higher acuity of care), and also patients in the intensive care unit (ICU). ICU patients are comanaged by general medicine teams and intensive care teams; internal medicine teams enter all electronic orders for ICU patients, except for orders for respiratory care or sedating medications. The inpatient internal medicine teaching service comprises eight teams each supervised by an attending physician, a senior resident (in the second or third year of residency training), two interns, and a third- and/or fourth-year medical student. Residents place all clinical orders and complete all clinical documentation through the EHR (Epic Systems, Verona, Wisconsin).11 Typically, the bulk of the orders and documentation, including discharge documentation, is performed by interns; however, the degree of senior resident involvement in these tasks is variable and team-dependent. In addition to the eight resident teams, there are also four attending hospitalist-only internal medicine teams, who manage a service of ~30-40 patients.
Study Population
Our study population comprised all hospitalized adults admitted to the eight resident-run teams on the internal medicine teaching service. Patients cared for by hospitalist-only teams were not included in this analysis. Because the focus of our study was on hospitalizations, individual patients may have been included multiple times over the course of the study. Hospitalizations were excluded if they did not have complete Medicare Severity-Diagnosis Related Group (MS-DRG) data,12 since this was used as our severity of illness marker. This occurred either because patients were not discharged by the end of the study period or because they had a length of stay of less than one day, because this metric was not assigned to these short-stay (observation) patients.
Data Collection
All electronic orders placed during the study period were obtained by extracting data from Epic’s Clarity database. Our EHR allows for the use of order sets; each order in these sets was counted individually, so that an order set with several orders would not be identified as one order. We identified the time and date that the order was placed, the ordering physician, the identity of the patient for which the order was placed, and the location of the patient when the order was placed, to determine the level of care (ICU, step-down, or general medicine unit). To track the composite volume of orders placed by resident teams, we matched each ordering physician to his or her corresponding resident team using our physician scheduling database, Amion (Spiral Software). We obtained team census by tabulating the total number of patients that a single resident team placed orders on over the course of a given calendar day. From billing data, we identified the MS-DRG weight that was assigned at the end of each hospitalization. Finally, we collected data on adherence to two discharge-related quality metrics to determine whether increased order volume was associated with decreased rates of adherence to these metrics. Using departmental patient-level quality improvement data, we determined whether each metric was met on discharge at the patient level. We also extracted patient-level demographic data, including age, sex, and insurance status, from this departmental quality improvement database.
Discharge Quality Outcome Metrics
We hypothesized that as the total daily electronic orders of a resident team increased, the rate of completion of two discharge-related quality metrics would decline due to the greater time constraints placed on the teams. The first metric we used was the completion of a high-quality after-visit summary (AVS), which has been described by the Centers for Medicare and Medicaid Services as part of its Meaningful Use Initiative.13 It was selected by the residents in our program as a particularly high-priority quality metric. Our institution specifically defines a “high-quality” AVS as including the following three components: a principal hospital problem, patient instructions, and follow-up information. The second discharge-related quality metric was the completion of a timely discharge summary, another measure recognized as a critical component in high-quality care.14 To be considered timely, the discharge summary had to be filed no later than 24 hours after the discharge order was entered into the EHR. This metric was more recently tracked by the internal medicine department and was not selected by the residents as a high-priority metric.
Statistical Analysis
To examine how the order volume per day changed throughout each sequential day of hospital admission, mean orders per hospital day with 95% CIs were plotted. We performed an aggregate analysis of all orders placed for each patient per day across three different levels of care (ICU, step-down, and general medicine). For each day of the study period, we summed all orders for all patients according to their location and divided by the number of total patients in each location to identify the average number of orders written for an ICU, step-down, and general medicine patient that day. We then calculated the mean daily orders for an ICU, step-down, and general medicine patient over the entire study period. We used ANOVA to test for statistically significant differences between the mean daily orders between these locations.
To examine the relationship between severity of illness and order volume, we performed an unadjusted patient-level analysis of orders per patient in the first three days of each hospitalization and stratified the data by the MS-DRG payment weight, which we divided into four quartiles. For each quartile, we calculated the mean number of orders placed in the first three days of admission and used ANOVA to test for statistically significant differences. We restricted the orders to the first three days of hospitalization instead of calculating mean orders per day of hospitalization because we postulated that the majority of orders were entered in these first few days and that with increasing length of stay (which we expected to occur with higher MS-DRG weight), the order volume becomes highly variable, which would tend to skew the mean orders per day.
We used multivariable logistic regression to determine whether the volume of electronic orders on the day of a given patient’s discharge, and also on the day before a given patient’s discharge, was a significant predictor of receiving a high-quality AVS. We adjusted for team census on the day of discharge, MS-DRG weight, age, sex, and insurance status. We then conducted a separate analysis of the association between electronic order volume and likelihood of completing a timely discharge summary among patients where discharge summary data were available. Logistic regression for each case was performed independently, so that team orders on the day prior to a patient’s discharge were not included in the model for the relationship between team orders on the day of a patient’s discharge and the discharge-related quality metric of interest, and vice versa, since including both in the model would be potentially disruptive given that orders on the day before and day of a patient’s discharge are likely correlated.
We also performed a subanalysis in which we restricted orders to only those placed during the daytime hours (7
IRB Approval
The study was approved by the UCSF Institutional Review Board and was granted a waiver of informed consent.
RESULTS
Population
We identified 7,296 eligible hospitalizations during the study period. After removing hospitalizations according to our exclusion criteria (Figure 1), there were 5,032 hospitalizations that were used in the analysis for which a total of 929,153 orders were written. The vast majority of patients received at least one order per day; fewer than 1% of encounter-days had zero associated orders. The top 10 discharge diagnoses identified in the cohort are listed in Appendix Table 1. A breakdown of orders by order type, across the entire cohort, is displayed in Appendix Table 2. The mean number of orders per patient per day of hospitalization is plotted in the Appendix Figure, which indicates that the number of orders is highest on the day of admission, decreases significantly after the first few days, and becomes increasingly variable with longer lengths of stay.
Patient Level of Care and Severity of Illness Metrics
Patients at a higher level of care had, on average, more orders entered per day. The mean order frequency was 40 orders per day for an ICU patient (standard deviation [SD] 13, range 13-134), 24 for a step-down patient (SD 6, range 11-48), and 19 for a general medicine unit patient (SD 3, range 10-31). The difference in mean daily orders was statistically significant (P < .001, Figure 2a).
Orders also correlated with increasing severity of illness. Patients in the lowest quartile of MS-DRG weight received, on average, 98 orders in the first three days of hospitalization (SD 35, range 2-349), those in the second quartile received 105 orders (SD 38, range 10-380), those in the third quartile received 132 orders (SD 51, range 17-436), and those in the fourth and highest quartile received 149 orders (SD 59, range 32-482). Comparisons between each of these severity of illness categories were significant (P < .001, Figure 2b).
Discharge-Related Quality Metrics
The median number of orders per internal medicine team per day was 343 (IQR 261- 446). Of the 5,032 total discharged patients, 3,657 (73%) received a high-quality AVS on discharge. After controlling for team census, severity of illness, and demographic factors, there was no statistically significant association between total orders on the day of discharge and odds of receiving a high-quality AVS (OR 1.01; 95% CI 0.96-1.06), or between team orders placed the day prior to discharge and odds of receiving a high-quality AVS (OR 0.99; 95% CI 0.95-1.04; Table 1). When we restricted our analysis to orders placed during daytime hours (7
There were 3,835 patients for whom data on timing of discharge summary were available. Of these, 3,455 (91.2%) had a discharge summary completed within 24 hours. After controlling for team census, severity of illness, and demographic factors, there was no statistically significant association between total orders placed by the team on a patient’s day of discharge and odds of receiving a timely discharge summary (OR 0.96; 95% CI 0.88-1.05). However, patients were 12% less likely to receive a timely discharge summary for every 100 extra orders the team placed on the day prior to discharge (OR 0.88, 95% CI 0.82-0.95). Patients who received a timely discharge summary were cared for by teams who placed a median of 345 orders the day prior to their discharge, whereas those that did not receive a timely discharge summary were cared for by teams who placed a significantly higher number of orders (375) on the day prior to discharge (Table 2). When we restricted our analysis to only daytime orders, there were no significant changes in the findings (OR 1.00; 95% CI 0.88-1.14 for orders on the day of discharge; OR 0.84; 95% CI 0.75-0.95 for orders on the day prior to discharge).
DISCUSSION
We found that electronic order volume may be a marker for patient complexity, which encompasses both level of care and severity of illness, and could be a marker of resident physician workload that harnesses readily available data from an EHR. Recent time-motion studies of internal medicine residents indicate that the majority of trainees’ time is spent on computers, engaged in indirect patient care activities such as reading electronic charts, entering electronic orders, and writing computerized notes.15-18 Capturing these tasks through metrics such as electronic order volume, as we did in this study, can provide valuable insights into resident physician workflow.
We found that ICU patients received more than twice as many orders per day than did general acute care-level patients. Furthermore, we found that patients whose hospitalizations fell into the highest MS-DRG weight quartile received approximately 50% more orders during the first three days of admission compared to that of patients whose hospitalizations fell into the lowest quartile. This strong association indicates that electronic order volume could provide meaningful additional information, in concert with other factors such as census, to describe resident physician workload.
We did not find that our workload measure was significantly associated with high-quality AVS completion. There are several possible explanations for this finding. First, adherence to this quality metric may be independent of workload, possibly because it is highly prioritized by residents at our institution. Second, adherence may only be impacted at levels of workload greater than what was experienced by the residents in our study. Finally, electronic order volume may not encompass enough of total workload to be reliably representative of resident work. However, the tight correlation between electronic order volume with severity of illness and level of care, in conjunction with the finding that patients were less likely to receive a timely discharge summary when workload was high on the day prior to a patient’s discharge, suggests that electronic order volume does indeed encompass a meaningful component of workload, and that with higher workload, adherence to some quality metrics may decline. We found that patients who received a timely discharge summary were discharged by teams who entered 30 fewer orders on the day before discharge compared with patients who did not receive a timely discharge summary. In addition to being statistically significant, it is also likely that this difference is clinically significant, although a determination of clinical significance is outside the scope of this study. Further exploration into the relationship between order volume and other quality metrics that are perhaps more sensitive to workload would be interesting.
The primary strength of our study is in how it demonstrates that EHRs can be harnessed to provide additional insights into clinical workload in a quantifiable and automated manner. Although there are a wide range of EHRs currently in use across the country, the capability to track electronic orders is common and could therefore be used broadly across institutions, with tailoring and standardization specific to each site. This technique is similar to that used by prior investigators who characterized the workload of pediatric residents by orders entered and notes written in the electronic medical record.19 However, our study is unique, in that we explored the relationship between electronic order volume and patient-level severity metrics as well as discharge-related quality metrics.
Our study is limited by several factors. When conceptualizing resident workload, several other elements that contribute to a sense of “busyness” may be independent of electronic orders and were not measured in our study.20 These include communication factors (such as language discordance, discussion with consulting services, and difficult end-of-life discussions), environmental factors (such as geographic localization), resident physician team factors (such as competing clinical or educational responsibilities), timing (in terms of day of week as well as time of year, since residents in July likely feel “busier” than residents in May), and ultimate discharge destination for patients (those going to a skilled nursing facility may require discharge documentation more urgently). Additionally, we chose to focus on the workload of resident teams, as represented by team orders, as opposed to individual work, which may be more directly correlated to our outcomes of interest, completion of a high-quality AVS, and timely discharge summary, which are usually performed by individuals.
Furthermore, we did not measure the relationship between our objective measure of workload and clinical endpoints. Instead, we chose to focus on process measures because they are less likely to be confounded by clinical factors independent of physician workload.21 Future studies should also consider obtaining direct resident-level measures of “busyness” or burnout, or other resident-centered endpoints, such as whether residents left the hospital at times consistent with duty hour regulations or whether they were able to attend educational conferences.
These limitations pose opportunities for further efforts to more comprehensively characterize clinical workload. Additional research is needed to understand and quantify the impact of patient, physician, and environmental factors that are not reflected by electronic order volume. Furthermore, an exploration of other electronic surrogates for clinical workload, such as paging volume and other EHR-derived data points, could also prove valuable in further describing the clinical workload. Future studies should also examine whether there is a relationship between these novel markers of workload and further outcomes, including both process measures and clinical endpoints.
CONCLUSIONS
Electronic order volume may provide valuable additional information for estimating the workload of resident physicians caring for hospitalized patients. Further investigation to determine whether the statistically significant differences identified in this study are clinically significant, how the technique used in this work may be applied to different EHRs, an examination of other EHR-derived metrics that may represent workload, and an exploration of additional patient-centered outcomes may be warranted.
Disclosures
Rajkomar reports personal fees from Google LLC, outside the submitted work. Dr. Khanna reports that during the conduct of the study, his salary, and the development of CareWeb (a communication platform that includes a smartphone-based paging application in use in several inpatient clinical units at University of California, San Francisco [UCSF] Medical Center) were supported by funding from the Center for Digital Health Innovation at UCSF. The CareWeb software has been licensed by Voalte.
Disclaimer
The views expressed in the submitted article are of the authors and not an official position of the institution.
1. Lurie JD, Wachter RM. Hospitalist staffing requirements. Eff Clin Pract. 1999;2(3):126-30. PubMed
2. Wachter RM. Hospitalist workload: The search for the magic number. JAMA Intern Med. 2014;174(5):794-795. doi: 10.1001/jamainternmed.2014.18. PubMed
3. Adler-Milstein J, DesRoches CM, Kralovec P, et al. Electronic health record adoption in US hospitals: progress continues, but challenges persist. Health Aff (Millwood). 2015;34(12):2174-2180. doi: 10.1377/hlthaff.2015.0992. PubMed
4. The Office of the National Coordinator for Health Information Technology, Health IT Dashboard. [cited 2018 April 4]. https://dashboard.healthit.gov/quickstats/quickstats.php Accessed June 28, 2018.
5. Index for Excerpts from the American Recovery and Reinvestment Act of 2009. Health Information Technology (HITECH) Act 2009. p. 112-164.
6. van der Sijs H, Aarts J, Vulto A, Berg M. Overriding of drug safety alerts in computerized physician order entry. J Am Med Inform Assoc. 2006;13(2):138-147. doi: 10.1197/jamia.M1809. PubMed
7. Ancker JS, Kern LM1, Edwards A, et al. How is the electronic health record being used? Use of EHR data to assess physician-level variability in technology use. J Am Med Inform Assoc. 2014;21(6):1001-1008. doi: 10.1136/amiajnl-2013-002627. PubMed
8. Hendey GW, Barth BE, Soliz T. Overnight and postcall errors in medication orders. Acad Emerg Med. 2005;12(7):629-634. doi: 10.1197/j.aem.2005.02.009. PubMed
9. Elliott DJ, Young RS2, Brice J3, Aguiar R4, Kolm P. Effect of hospitalist workload on the quality and efficiency of care. JAMA Intern Med. 2014;174(5):786-793. doi: 10.1001/jamainternmed.2014.300. PubMed
10. Ong M, Bostrom A, Vidyarthi A, McCulloch C, Auerbach A. House staff team workload and organization effects on patient outcomes in an academic general internal medicine inpatient service. Arch Intern Med. 2007;167(1):47-52. doi: 10.1001/archinte.167.1.47. PubMed
11. Epic Systems. [cited 2017 March 28]; Available from: http://www.epic.com/. Accessed June 28, 2018.
12. MS-DRG Classifications and software. https://www.cms.gov/Medicare/Medicare-Fee-for-Service-Payment/AcuteInpatientPPS/MS-DRG-Classifications-and-Software.html. Accessed June 28, 2018.
13. Hummel J, Evans P. Providing Clinical Summaries to Patients after Each Office Visit: A Technical Guide. [cited 2017 March 27]. https://www.healthit.gov/sites/default/files/measure-tools/avs-tech-guide.pdf. Accessed June 28, 2018.
14. Haycock M, Stuttaford L, Ruscombe-King O, Barker Z, Callaghan K, Davis T. Improving the percentage of electronic discharge summaries completed within 24 hours of discharge. BMJ Qual Improv Rep. 2014;3(1) pii: u205963.w2604. doi: 10.1136/bmjquality.u205963.w2604. PubMed
15. Block L, Habicht R, Wu AW, et al. In the wake of the 2003 and 2011 duty hours regulations, how do internal medicine interns spend their time? J Gen Intern Med. 2013;28(8):1042-1047. doi: 10.1007/s11606-013-2376-6. PubMed
16. Wenger N, Méan M, Castioni J, Marques-Vidal P, Waeber G, Garnier A. Allocation of internal medicine resident time in a Swiss hospital: a time and motion study of day and evening shifts. Ann Intern Med. 2017;166(8):579-586. doi: 10.7326/M16-2238. PubMed
17. Mamykina L, Vawdrey DK, Hripcsak G. How do residents spend their shift time? A time and motion study with a particular focus on the use of computers. Acad Med. 2016;91(6):827-832. doi: 10.1097/ACM.0000000000001148. PubMed
18. Fletcher KE, Visotcky AM, Slagle JM, Tarima S, Weinger MB, Schapira MM. The composition of intern work while on call. J Gen Intern Med. 2012;27(11):1432-1437. doi: 10.1007/s11606-012-2120-7. PubMed
19. Was A, Blankenburg R, Park KT. Pediatric resident workload intensity and variability. Pediatrics 2016;138(1):e20154371. doi: 10.1542/peds.2015-4371. PubMed
20. Michtalik HJ, Pronovost PJ, Marsteller JA, Spetz J, Brotman DJ. Developing a model for attending physician workload and outcomes. JAMA Intern Med. 2013;173(11):1026-1028. doi: 10.1001/jamainternmed.2013.405. PubMed
21. Mant J. Process versus outcome indicators in the assessment of quality of health care. Int J Qual Health Care. 2001;13(6):475-480. doi: 10.1093/intqhc/13.6.475. PubMed
Accuracy of GoogleTranslate™
The population of patients in the US with limited English proficiency (LEP)those who speak English less than very well1is substantial and continues to grow.1, 2 Patients with LEP are at risk for lower quality health care overall than their English‐speaking counterparts.38 Professional in‐person interpreters greatly improve spoken communication and quality of care for these patients,4, 9 but their assistance is typically based on the clinical encounter. Particularly if interpreting by phone, interpreters are unlikely to be able to help with materials such as discharge instructions or information sheets meant for family members. Professional written translations of patient educational material help to bridge this gap, allowing clinicians to convey detailed written instructions to patients. However, professional translations must be prepared well in advance of any encounter and can only be used for easily anticipated problems.
The need to translate less common, patient‐specific instructions arises spontaneously in clinical practice, and formally prepared written translations are not useful in these situations. Online translation tools such as GoogleTranslate (available at
We conducted a pilot evaluation of an online translation tool as it relates to detailed, complex patient educational material. Our primary goal was to compare the accuracy of a Spanish translation generated by the online tool to that done by a professional agency. Our secondary goals were: 1) to assess whether sentence word length or complexity mediated the accuracy of GT; and 2) to lay the foundation for a more comprehensive study of the accuracy of online translation tools, with respect to patient educational material.
Methods
Translation Tool and Language Choice
We selected Google Translate (GT) since it is one of the more commonly used online translation tools and because Google is the most widely used search engine in the United States.13 GT uses statistical translation methodology to convert text, documents, and websites between languages; statistical translation involves the following three steps. First, the translation program recognizes a sentence to translate. Second, it compares the words and phrases within that sentence to the billions of words in its library (drawn from bilingual professionally translated documents, such as United Nations proceedings). Third, it uses this comparison to generate a translation combining the words and phrases deemed most equivalent between the source sentence and the target language. If there are multiple sentences, the program recognizes and translates each independently. As the body of bilingual work grows, the program learns and refines its rules automatically.14 In contrast, in rule‐based translation, a program would use manually prespecified rules regarding word choice and grammar to generate a translation.15 We assessed GT's accuracy translating from English to Spanish because Spanish is the predominant non‐English language spoken in the US.1
Document Selection and Preparation
We selected the instruction manual regarding warfarin use prepared by the Agency for Healthcare Research and Quality (AHRQ) for this accuracy evaluation. We selected this manual,16 written at a 6th grade reading level, because a professional Spanish translation was available (completed by ASET International Service, LLC, before and independently of this study), and because patient educational material regarding warfarin has been associated with fewer bleeding events.17 We downloaded the English document on October 19, 2009 and used the GT website to translate it en bloc. We then copied the resulting Spanish output into a text file. The English document and the professional Spanish translation (downloaded the same day) were both converted into text files in the same manner.
Grading Methodology
We scored the translation chosen using both manual and automated evaluation techniques. These techniques are widely used in the machine translation literature and are explained below.
Manual Evaluation: Evaluators, Domains, Scoring
We recruited three nonclinician, bilingual, nativeSpanish‐speaking research assistants as evaluators. The evaluators were all college educated with a Bachelor's degree or higher and were of Mexican, Nicaraguan, and Guatemalan ancestry. Each evaluator received a brief orientation regarding the project, as well as an explanation of the scores, and then proceeded to the blinded evaluation independently.
We asked evaluators to score sentences on Likert scales along five primary domains: fluency, adequacy, meaning, severity, and preference. Fluency and adequacy are well accepted components of machine translation evaluation,18 with fluency being an assessment of grammar and readability ranging from 5 (Perfect fluency; like reading a newspaper) to 1 (No fluency; no appreciable grammar, not understandable) and adequacy being an assessment of information preservation ranging from 5 (100% of information conveyed from the original) to 1 (0% of information conveyed from the original). Given that a sentence can be highly adequate but drastically change the connotation and intent of the sentence (eg, a sentence that contains 75% of the correct words but changes a sentence from take this medication twice a day to take this medication once every two days), we asked evaluators to assess meaning, a measure of connotation and intent maintenance, with scores ranging from 5 (Same meaning as original) to 1 (Totally different meaning from the original).19 Evaluators also assessed severity, a new measure of potential harm if a given sentence was assessed as having errors of any kind, ranging from 5 (Error, no effect on patient care) to 1 (Error, dangerous to patient) with an additional option of N/A (Sentence basically accurate). Finally, evaluators rated a blinded preference (also a new measure) for either of two translated sentences, ranging from Strongly prefer translation #1 to Strongly prefer translation #2. The order of the sentences was random (eg, sometimes the professional translation was first and sometimes the GT translation was). We subsequently converted this to preference for the professional translation, ranging from 5 (Strongly prefer the professional translation) to 1 (Strongly prefer the GT translation) in order to standardize the responses (Figures 1 and 2).

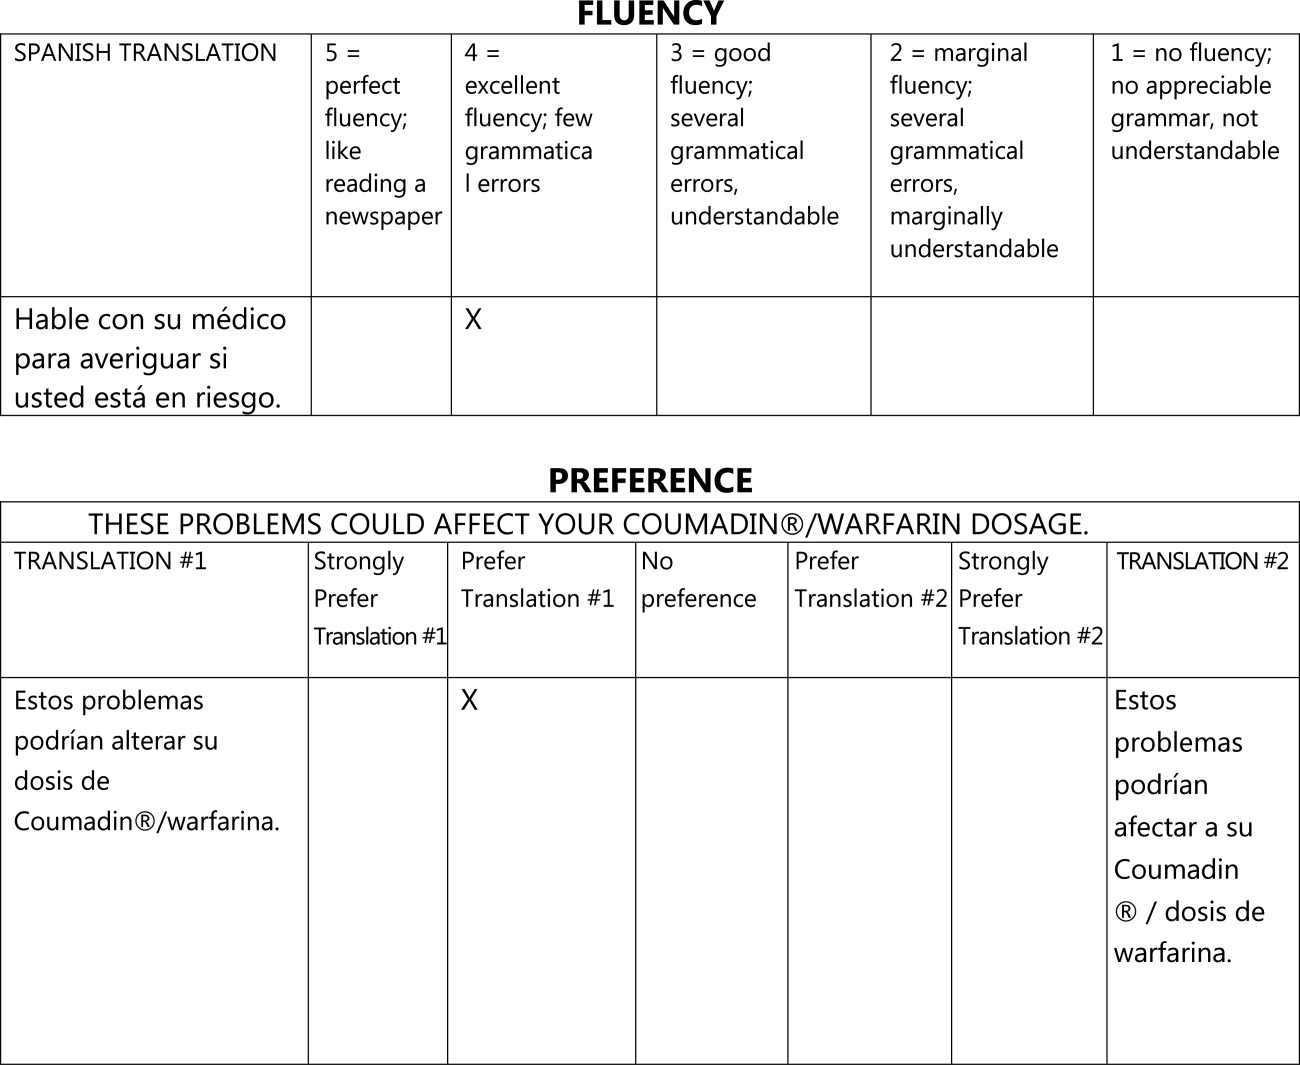
The overall flow of the study is given in Figure 3. Each evaluator initially scored 20 sentences translated by GT and 10 sentences translated professionally along the first four domains. All 30 of these sentences were randomly selected from the original, 263‐sentence pamphlet. For fluency, evaluators had access only to the translated sentence to be scored; for adequacy, meaning, and severity, they had access to both the translated sentence and the original English sentence. Ten of the 30 sentences were further selected randomly for scoring on the preference domain. For these 10 sentences, evaluators compared the GT and professional translations of the same sentence (with the original English sentence available as a reference) and indicated a preference, for any reason, for one translation or the other. Evaluators were blinded to the technique of translation (GT or professional) for all scored sentences and domains. We chose twice as many sentences from the GT preparations for the first four domains to maximize measurements for the translation technology we were evaluating, with the smaller number of professional translations serving as controls.
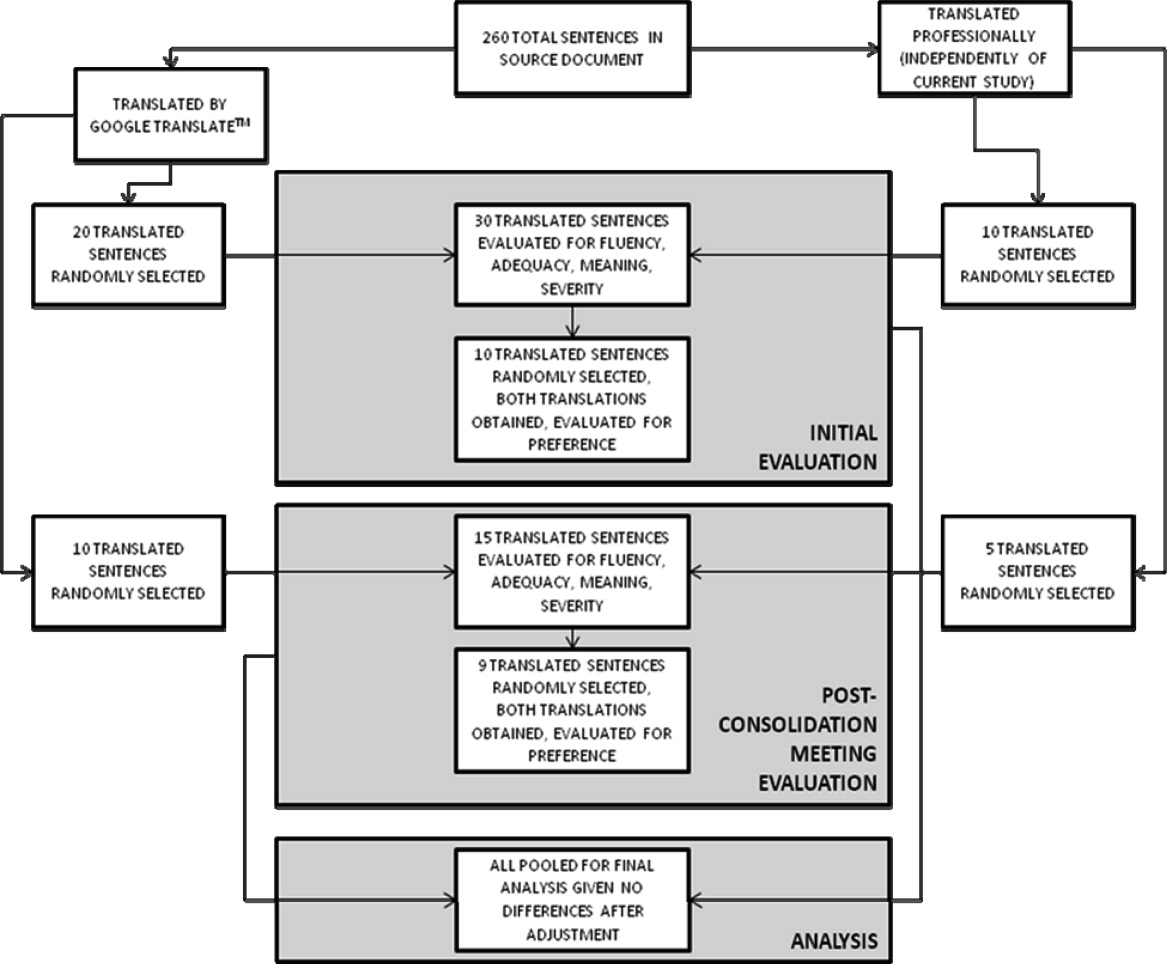
After scoring the first 30 sentences, evaluators met with one of the authors (R.R.K.) to discuss and consolidate their approach to scoring. They then scored an additional 10 GT‐translated sentences and 5 professionally translated sentences for the first four domains, and 9 of these 15 sentences for preference, to see if the meeting changed their scoring approach. These sentences were selected randomly from the original, 263‐sentence pamphlet, excluding the 30 evaluated in the previous step.
Automated Machine Translation Evaluation
Machine translation researchers have developed automated measures allowing the rapid and inexpensive scoring and rescoring of translations. These automated measures supplement more time‐ and resource‐intensive manual evaluations. The automated measures are based upon how well the translation compares to one or, ideally, multiple professionally prepared reference translations. They correlate well with human judgments on the domains above, especially when multiple reference translations are used (increasing the number of reference translations increases the variability allowed for words and phrases in the machine translation, improving the likelihood that differences in score are related to differences in quality rather than differences in translator preference).20 For this study, we used Metric for Evaluation of Translation with Explicit Ordering (METEOR), a machine translation evaluation system that allows additional flexibility for the machine translation in terms of grading individual sentences and being sensitive to synonyms, word stemming, and word order.21 We obtained a METEOR score for each of the GT‐translated sentences using the professional translation as our reference, and assessed correlation between this automated measure and the manual evaluations for the GT sentences, with the aim of assessing the feasibility of using METEOR in future work on patient educational material translation.
Outcomes and Statistical Analysis
We compared the scores assigned to GT‐translated sentences for each of the five manually scored domains as compared to the scores of the professionally translated sentences, as well as the impact of word count and sentence complexity on the scores achieved specifically by the GT‐translated sentences, using clustered linear regression to account for the fact that each of the 45 sentences were scored by each of the three evaluators. Sentences were classified as simple if they contained one or fewer clauses and complex if they contained more than one clause.22 We also assessed interrater reliability for the manual scoring system using intraclass correlation coefficients and repeatability. Repeatability is an estimate of the maximum difference, with 95% confidence, between scores assigned to the same sentence on the same domain by two different evaluators;23 lower scores indicate greater agreement between evaluators. Since we did not have clinical data or a gold standard, we used repeatability to estimate the value above which a difference between two scores might be clinically significant and not simply due to interrater variability.24 Finally, we assessed the correlation of the manual scores with those calculated by the METEOR automated evaluation tool using Pearson correlation coefficients. All analyses were conducted using Stata 11 (College Station, TX).
Results
Sentence Description
A total of 45 sentences were evaluated by the bilingual research assistants. The initial 30 sentences and the subsequent, post‐consolidation meeting 15 sentences were scored similarly in all outcomes, after adjustment for word length and complexity, so we pooled all 45 sentences (as well as the 19 total sentence pairs scored for preference) for the final analysis. Average sentence lengths were 14.2 words, 15.5 words, and 16.6 words for the English source text, professionally translated sentences, and GT‐translated sentences, respectively. Thirty‐three percent of the English source sentences were simple and 67% were complex.
Manual Evaluation Scores
Sentences translated by GT received worse scores on fluency as compared to the professional translations (3.4 vs 4.7, P < 0.0001). Comparisons for adequacy and meaning were not statistically significantly different. GT‐translated sentences contained more errors of any severity as compared to the professional translations (39% vs 22%, P = 0.05), but a similar number of serious, clinically impactful errors (severity scores of 3, 2, or 1; 4% vs 2%, P = 0.61). However, one GT‐translated sentence was considered erroneous with a severity level of 1 (Error, dangerous to patient). This particular sentence was 25 words long and complex in structure in the original English document; all three evaluators considered the GT translation nonsensical (La hemorragia mayor, llame a su mdico, o ir a la emergencia de un hospital habitacin si usted tiene cualquiera de los siguientes: Red N, oscuro, caf o cola de orina de color.) Evaluators had no overall preference for the professional translation (3.2, 95% confidence interval = 2.7 to 3.7, with 3 indicating no preference; P = 0.36) (Table 1).
| GoogleTranslate Translation | Professional Translation | P Value | |
|---|---|---|---|
| |||
| Fluency* | 3.4 | 4.7 | <0.0001 |
| Adequacy* | 4.5 | 4.8 | 0.19 |
| Meaning* | 4.2 | 4.5 | 0.29 |
| Severity | |||
| Any error | 39% | 22% | 0.05 |
| Serious error | 4% | 2% | 0.61 |
| Preference* | 3.2 | 0.36 | |
Mediation of Scores by Sentence Length or Complexity
We found that sentence length was not associated with scores for fluency, adequacy, meaning, severity, or preference (P > 0.30 in each case). Complexity, however, was significantly associated with preference: evaluators' preferred the professional translation for complex English sentences while being more ambivalent about simple English sentences (3.6 vs 2.6, P = 0.03).
Interrater Reliability and Repeatability
We assessed the interrater reliability for each domain using intraclass correlation coefficients and repeatability. For fluency, the intraclass correlation was best at 0.70; for adequacy, it was 0.58; for meaning, 0.42; for severity, 0.48; and for preference, 0.37. The repeatability scores were 1.4 for fluency, 0.6 for adequacy, 2.2 for meaning, 1.2 for severity, and 3.8 for preference, indicating that two evaluators might give a sentence almost the same score (at most, 1 point apart from one another) for adequacy, but might have opposite preferences regarding which translation of a sentence was superior.
Correlation with METEOR
Correlation between the first four domains and the METEOR scores were less than in prior studies.21 Fluency correlated best with METEOR at 0.53; adequacy correlated least with METEOR at 0.29. The remaining scores were in‐between. All correlations were statistically significant at P < 0.01 (Table 2).
| Correlation with METEOR | P value | |
|---|---|---|
| ||
| Fluency | 0.53 | <0.0001 |
| Adequacy | 0.29 | 0.006 |
| Meaning | 0.33 | 0.002 |
| Severity | 0.39 | 0.002 |
Discussion
In this preliminary study comparing the accuracy of GT to professional translation for patient educational material, we found that GT was inferior to the professional translation in grammatical fluency but generally preserved the content and sense of the original text. Out of 30 GT sentences assessed, there was one substantially erroneous translation that was considered potentially dangerous. Evaluators preferred the professionally translated sentences for complex sentences, but when the English source sentence was simplecontaining a single clausethis preference disappeared.
Like Sharif and Tse,12 we found that for information not arranged in sentences, automated translation sometimes produced nonsensical sentences. In our study, these resulted from an English sentence fragment followed by a bulleted list; in their study, the nonsensical translations resulted from pharmacy labels. The difference in frequency of these errors between our studies may have resulted partly from the translation tool evaluated (GT vs programs used by pharmacies in the Bronx), but may have also been due to our use of machine translation for complete sentencesthe purpose for which it is optimally designed. The hypothesis that machine translations of clinical information are most understandable when used for simple, complete sentences concurs with the methodology used by these tools and requires further study.
GT has the potential to be very useful to clinicians, particularly for those instances when the communication required is both spontaneous and routine or noncritical. For example, in the inpatient setting, patients could communicate diet and other nonclinical requests, as well as ask or answer simple, short questions when the interpreter is not available. In such situations, the low cost and ease of using online translations and machine translation more generally may help to circumvent the tendency of clinicians to get by with inadequate language skills or to avoid communication altogether.25 If used wisely, GT and other online tools could supplement the use of standardized translations and professional interpreters in helping clinicians to overcome language barriers and linguistic inertia, though this will require further assessment.
Ours is a pilot study, and while it suggests a more promising way to use online translation tools, significant further evaluation is required regarding accuracy and applicability prior to widespread use of any machine translation tools for patient care. The document we utilized for evaluation was a professionally translated patient educational brochure provided to individuals starting a complex medication. As online translation tools would most likely not be used in this setting, but rather for spontaneous and less critical patient‐specific instructions, further testing of GT as applied to such scenarios should be considered. Second, we only evaluated GT for English translated into Spanish; its usefulness in other languages will need to be evaluated. It also remains to be seen how easily GT translations will be understood by patients, who may have variable medical understanding and educational attainment as compared to our evaluators. Finally, in this evaluation, we only assessed automated written translation, not automated spoken translation services such as those now available on cellular phones and other mobile devices.11 The latter are based upon translation software with an additional speech recognition interface. These applications may prove to be even more useful than online translation, but the speech recognition component will add an additional layer of potential error and these applications will need to be evaluated on their own merits.
The domains chosen for this study had only moderate interrater reliability as assessed by intraclass correlation and repeatability, with meaning and preference scoring particularly poorly. The latter domains in particular will require more thorough assessment before routine use in online translation assessment. The variability in all domains may have resulted partly from the choice of nonclinicians of different ancestral backgrounds as evaluators. However, this variability is likely better representative of the wide range of patient backgrounds. Because our evaluators were not professional translators, we asked a professional interpreter to grade all sentences to assess the quality of their evaluation. While the interpreter noted slightly fewer errors among the professionally translated sentences (13% vs 22%) and slightly more errors among the GT‐translated sentences (50% vs 39%), and preferred the professional translation slightly more (3.8 vs 3.2), his scores for all of the other measures were almost identical, increasing our confidence in our primary findings (Appendix A). Additionally, since statistical translation is conducted sentence by sentence, in our study evaluators only scored translations at the sentence level. The accuracy of GT for whole paragraphs or entire documents will need to be assessed separately. The correlation between METEOR and the manual evaluation scores was less than in prior studies; while inexpensive to assess, METEOR will have to be recalibrated in optimal circumstanceswith several reference translations available rather than just onebefore it can be used to supplement the assessment of new languages, new materials, other translation technologies, and improvements in a given technology over time for patient educational material.
In summary, GT scored worse in grammar but similarly in content and sense to the professional translation, committing one critical error in translating a complex, fragmented sentence as nonsense. We believe that, with further study and judicious use, GT has the potential to substantially improve clinicians' communication with patients with limited English proficiency in the area of brief spontaneous patient‐specific information, supplementing well the role that professional spoken interpretation and standardized written translations already play.
- ,.Language use and English‐speaking ability: 2000. In:Census 2000 Brief.Washington, DC:US Census Bureau;2003. p. 2. http://www.census.gov/prod/2003pubs/c2kbr‐29.pdf.
- ,,,,.The need for more research on language barriers in health care: a proposed research agenda.Milbank Q.2006;84(1):111–133.
- ,,,.Language proficiency and adverse events in US hospitals: a pilot study.Int J Qual Health Care.2007;19(2):60–67.
- .The impact of medical interpreter services on the quality of health care: a systematic review.Med Care Res Rev.2005;62(3):255–299.
- ,,, et al.Errors in medical interpretation and their potential clinical consequences in pediatric encounters.Pediatrics.2003;111(1):6–14.
- ,,, et al.The effect of English language proficiency on length of stay and in‐hospital mortality.J Gen Intern Med.2004;19(3):221–228.
- ,,,.Influence of language barriers on outcomes of hospital care for general medicine inpatients.J Hosp Med.2010;5(5):276–282.
- ,.Hospitals, language, and culture: a snapshot of the nation. In:Los Angeles, CA:The California Endowment, the Joint Commission;2007. p.51–52. http://www.jointcommission.org/assets/1/6/hlc_paper.pdf.
- ,,,.Do professional interpreters improve clinical care for patients with limited English proficiency? A systematic review of the literature.Health Serv Res.2007;42(2):727–754.
- .Google's Computing Power Refines Translation Tool.New York Times; March 9,2010. Accessed March 24, 2010. http://www.nytimes.com/2010/03/09/technology/09translate.html?_r=1.
- , Translator. New York Times; March 20,2010. Accessed March 24, 2010. http://www.nytimes.com/2010/03/21/opinion/21bellos.html.
- ,.Accuracy of computer‐generated, Spanish‐language medicine labels.Pediatrics.2010;125(5):960–965.
- .Nielsen NetRatings Search Engine Ratings.SearchEngineWatch; August 22,2006. Accessed March 24, 2010. http://searchenginewatch.com/2156451.
- Google.Google Translate Help;2010. Accessed March 24, 2010. http://translate.google.com/support/?hl=en.
- ,.Chapter 4: Basic strategies. In:An Introduction to Machine Translation;1992. Accessed April 22, 2010. http://www.hutchinsweb.me.uk/IntroMT‐4.pdf
- .Your Guide to Coumadin®/Warfarin Therapy.Agency for Healthcare Research and Quality; August 21,2008. Accessed October 19, 2009. http://www.ahrq.gov/consumer/btpills.htm.
- ,,, et al.Patient reported receipt of medication instructions for warfarin is associated with reduced risk of serious bleeding events.J Gen Intern Med.2008;23(10):1589–1594.
- ,,.The ARPA MT evaluation methodologies: evolution, lessons, and future approaches. In: Proceedings of AMTA, 1994, Columbia, MD; October1994.
- ,.Overview of the IWSLT 2005 evaluation campaign. In: Proceedings of IWSLT 2005, Pittsburgh, PA; October2005.
- ,,,.BLEU: a method for automatic evaluation of machine translation. In: ACL‐2002: 40th Annual Meeting of the Association for Computational Linguistics.2002:311–318.
- ,.METEOR: an automatic metric for MT evaluation with high levels of correlation with human judgments. In: Proceedings of the Second Workshop on Statistical Machine Translation at ACL, Prague, Czech Republic; June2007.
- .The Structure of a Sentence.Ottawa:The Writing Centre, University of Ottawa;2007.
- ,.Statistical methods for assessing agreement between two methods of clinical measurement.Lancet.1986;1(8476):307–310.
- .Measurement, reproducibility, and validity. In:Epidemiologic Methods 203.San Francisco:Department of Biostatistics and Epidemiology, University of California;2009.
- ,,,,.Getting by: underuse of interpreters by resident physicians.J Gen Intern Med.2009;24(2):256–262.
The population of patients in the US with limited English proficiency (LEP)those who speak English less than very well1is substantial and continues to grow.1, 2 Patients with LEP are at risk for lower quality health care overall than their English‐speaking counterparts.38 Professional in‐person interpreters greatly improve spoken communication and quality of care for these patients,4, 9 but their assistance is typically based on the clinical encounter. Particularly if interpreting by phone, interpreters are unlikely to be able to help with materials such as discharge instructions or information sheets meant for family members. Professional written translations of patient educational material help to bridge this gap, allowing clinicians to convey detailed written instructions to patients. However, professional translations must be prepared well in advance of any encounter and can only be used for easily anticipated problems.
The need to translate less common, patient‐specific instructions arises spontaneously in clinical practice, and formally prepared written translations are not useful in these situations. Online translation tools such as GoogleTranslate (available at
We conducted a pilot evaluation of an online translation tool as it relates to detailed, complex patient educational material. Our primary goal was to compare the accuracy of a Spanish translation generated by the online tool to that done by a professional agency. Our secondary goals were: 1) to assess whether sentence word length or complexity mediated the accuracy of GT; and 2) to lay the foundation for a more comprehensive study of the accuracy of online translation tools, with respect to patient educational material.
Methods
Translation Tool and Language Choice
We selected Google Translate (GT) since it is one of the more commonly used online translation tools and because Google is the most widely used search engine in the United States.13 GT uses statistical translation methodology to convert text, documents, and websites between languages; statistical translation involves the following three steps. First, the translation program recognizes a sentence to translate. Second, it compares the words and phrases within that sentence to the billions of words in its library (drawn from bilingual professionally translated documents, such as United Nations proceedings). Third, it uses this comparison to generate a translation combining the words and phrases deemed most equivalent between the source sentence and the target language. If there are multiple sentences, the program recognizes and translates each independently. As the body of bilingual work grows, the program learns and refines its rules automatically.14 In contrast, in rule‐based translation, a program would use manually prespecified rules regarding word choice and grammar to generate a translation.15 We assessed GT's accuracy translating from English to Spanish because Spanish is the predominant non‐English language spoken in the US.1
Document Selection and Preparation
We selected the instruction manual regarding warfarin use prepared by the Agency for Healthcare Research and Quality (AHRQ) for this accuracy evaluation. We selected this manual,16 written at a 6th grade reading level, because a professional Spanish translation was available (completed by ASET International Service, LLC, before and independently of this study), and because patient educational material regarding warfarin has been associated with fewer bleeding events.17 We downloaded the English document on October 19, 2009 and used the GT website to translate it en bloc. We then copied the resulting Spanish output into a text file. The English document and the professional Spanish translation (downloaded the same day) were both converted into text files in the same manner.
Grading Methodology
We scored the translation chosen using both manual and automated evaluation techniques. These techniques are widely used in the machine translation literature and are explained below.
Manual Evaluation: Evaluators, Domains, Scoring
We recruited three nonclinician, bilingual, nativeSpanish‐speaking research assistants as evaluators. The evaluators were all college educated with a Bachelor's degree or higher and were of Mexican, Nicaraguan, and Guatemalan ancestry. Each evaluator received a brief orientation regarding the project, as well as an explanation of the scores, and then proceeded to the blinded evaluation independently.
We asked evaluators to score sentences on Likert scales along five primary domains: fluency, adequacy, meaning, severity, and preference. Fluency and adequacy are well accepted components of machine translation evaluation,18 with fluency being an assessment of grammar and readability ranging from 5 (Perfect fluency; like reading a newspaper) to 1 (No fluency; no appreciable grammar, not understandable) and adequacy being an assessment of information preservation ranging from 5 (100% of information conveyed from the original) to 1 (0% of information conveyed from the original). Given that a sentence can be highly adequate but drastically change the connotation and intent of the sentence (eg, a sentence that contains 75% of the correct words but changes a sentence from take this medication twice a day to take this medication once every two days), we asked evaluators to assess meaning, a measure of connotation and intent maintenance, with scores ranging from 5 (Same meaning as original) to 1 (Totally different meaning from the original).19 Evaluators also assessed severity, a new measure of potential harm if a given sentence was assessed as having errors of any kind, ranging from 5 (Error, no effect on patient care) to 1 (Error, dangerous to patient) with an additional option of N/A (Sentence basically accurate). Finally, evaluators rated a blinded preference (also a new measure) for either of two translated sentences, ranging from Strongly prefer translation #1 to Strongly prefer translation #2. The order of the sentences was random (eg, sometimes the professional translation was first and sometimes the GT translation was). We subsequently converted this to preference for the professional translation, ranging from 5 (Strongly prefer the professional translation) to 1 (Strongly prefer the GT translation) in order to standardize the responses (Figures 1 and 2).
The overall flow of the study is given in Figure 3. Each evaluator initially scored 20 sentences translated by GT and 10 sentences translated professionally along the first four domains. All 30 of these sentences were randomly selected from the original, 263‐sentence pamphlet. For fluency, evaluators had access only to the translated sentence to be scored; for adequacy, meaning, and severity, they had access to both the translated sentence and the original English sentence. Ten of the 30 sentences were further selected randomly for scoring on the preference domain. For these 10 sentences, evaluators compared the GT and professional translations of the same sentence (with the original English sentence available as a reference) and indicated a preference, for any reason, for one translation or the other. Evaluators were blinded to the technique of translation (GT or professional) for all scored sentences and domains. We chose twice as many sentences from the GT preparations for the first four domains to maximize measurements for the translation technology we were evaluating, with the smaller number of professional translations serving as controls.
After scoring the first 30 sentences, evaluators met with one of the authors (R.R.K.) to discuss and consolidate their approach to scoring. They then scored an additional 10 GT‐translated sentences and 5 professionally translated sentences for the first four domains, and 9 of these 15 sentences for preference, to see if the meeting changed their scoring approach. These sentences were selected randomly from the original, 263‐sentence pamphlet, excluding the 30 evaluated in the previous step.
Automated Machine Translation Evaluation
Machine translation researchers have developed automated measures allowing the rapid and inexpensive scoring and rescoring of translations. These automated measures supplement more time‐ and resource‐intensive manual evaluations. The automated measures are based upon how well the translation compares to one or, ideally, multiple professionally prepared reference translations. They correlate well with human judgments on the domains above, especially when multiple reference translations are used (increasing the number of reference translations increases the variability allowed for words and phrases in the machine translation, improving the likelihood that differences in score are related to differences in quality rather than differences in translator preference).20 For this study, we used Metric for Evaluation of Translation with Explicit Ordering (METEOR), a machine translation evaluation system that allows additional flexibility for the machine translation in terms of grading individual sentences and being sensitive to synonyms, word stemming, and word order.21 We obtained a METEOR score for each of the GT‐translated sentences using the professional translation as our reference, and assessed correlation between this automated measure and the manual evaluations for the GT sentences, with the aim of assessing the feasibility of using METEOR in future work on patient educational material translation.
Outcomes and Statistical Analysis
We compared the scores assigned to GT‐translated sentences for each of the five manually scored domains as compared to the scores of the professionally translated sentences, as well as the impact of word count and sentence complexity on the scores achieved specifically by the GT‐translated sentences, using clustered linear regression to account for the fact that each of the 45 sentences were scored by each of the three evaluators. Sentences were classified as simple if they contained one or fewer clauses and complex if they contained more than one clause.22 We also assessed interrater reliability for the manual scoring system using intraclass correlation coefficients and repeatability. Repeatability is an estimate of the maximum difference, with 95% confidence, between scores assigned to the same sentence on the same domain by two different evaluators;23 lower scores indicate greater agreement between evaluators. Since we did not have clinical data or a gold standard, we used repeatability to estimate the value above which a difference between two scores might be clinically significant and not simply due to interrater variability.24 Finally, we assessed the correlation of the manual scores with those calculated by the METEOR automated evaluation tool using Pearson correlation coefficients. All analyses were conducted using Stata 11 (College Station, TX).
Results
Sentence Description
A total of 45 sentences were evaluated by the bilingual research assistants. The initial 30 sentences and the subsequent, post‐consolidation meeting 15 sentences were scored similarly in all outcomes, after adjustment for word length and complexity, so we pooled all 45 sentences (as well as the 19 total sentence pairs scored for preference) for the final analysis. Average sentence lengths were 14.2 words, 15.5 words, and 16.6 words for the English source text, professionally translated sentences, and GT‐translated sentences, respectively. Thirty‐three percent of the English source sentences were simple and 67% were complex.
Manual Evaluation Scores
Sentences translated by GT received worse scores on fluency as compared to the professional translations (3.4 vs 4.7, P < 0.0001). Comparisons for adequacy and meaning were not statistically significantly different. GT‐translated sentences contained more errors of any severity as compared to the professional translations (39% vs 22%, P = 0.05), but a similar number of serious, clinically impactful errors (severity scores of 3, 2, or 1; 4% vs 2%, P = 0.61). However, one GT‐translated sentence was considered erroneous with a severity level of 1 (Error, dangerous to patient). This particular sentence was 25 words long and complex in structure in the original English document; all three evaluators considered the GT translation nonsensical (La hemorragia mayor, llame a su mdico, o ir a la emergencia de un hospital habitacin si usted tiene cualquiera de los siguientes: Red N, oscuro, caf o cola de orina de color.) Evaluators had no overall preference for the professional translation (3.2, 95% confidence interval = 2.7 to 3.7, with 3 indicating no preference; P = 0.36) (Table 1).
| GoogleTranslate Translation | Professional Translation | P Value | |
|---|---|---|---|
| |||
| Fluency* | 3.4 | 4.7 | <0.0001 |
| Adequacy* | 4.5 | 4.8 | 0.19 |
| Meaning* | 4.2 | 4.5 | 0.29 |
| Severity | |||
| Any error | 39% | 22% | 0.05 |
| Serious error | 4% | 2% | 0.61 |
| Preference* | 3.2 | 0.36 | |
Mediation of Scores by Sentence Length or Complexity
We found that sentence length was not associated with scores for fluency, adequacy, meaning, severity, or preference (P > 0.30 in each case). Complexity, however, was significantly associated with preference: evaluators' preferred the professional translation for complex English sentences while being more ambivalent about simple English sentences (3.6 vs 2.6, P = 0.03).
Interrater Reliability and Repeatability
We assessed the interrater reliability for each domain using intraclass correlation coefficients and repeatability. For fluency, the intraclass correlation was best at 0.70; for adequacy, it was 0.58; for meaning, 0.42; for severity, 0.48; and for preference, 0.37. The repeatability scores were 1.4 for fluency, 0.6 for adequacy, 2.2 for meaning, 1.2 for severity, and 3.8 for preference, indicating that two evaluators might give a sentence almost the same score (at most, 1 point apart from one another) for adequacy, but might have opposite preferences regarding which translation of a sentence was superior.
Correlation with METEOR
Correlation between the first four domains and the METEOR scores were less than in prior studies.21 Fluency correlated best with METEOR at 0.53; adequacy correlated least with METEOR at 0.29. The remaining scores were in‐between. All correlations were statistically significant at P < 0.01 (Table 2).
| Correlation with METEOR | P value | |
|---|---|---|
| ||
| Fluency | 0.53 | <0.0001 |
| Adequacy | 0.29 | 0.006 |
| Meaning | 0.33 | 0.002 |
| Severity | 0.39 | 0.002 |
Discussion
In this preliminary study comparing the accuracy of GT to professional translation for patient educational material, we found that GT was inferior to the professional translation in grammatical fluency but generally preserved the content and sense of the original text. Out of 30 GT sentences assessed, there was one substantially erroneous translation that was considered potentially dangerous. Evaluators preferred the professionally translated sentences for complex sentences, but when the English source sentence was simplecontaining a single clausethis preference disappeared.
Like Sharif and Tse,12 we found that for information not arranged in sentences, automated translation sometimes produced nonsensical sentences. In our study, these resulted from an English sentence fragment followed by a bulleted list; in their study, the nonsensical translations resulted from pharmacy labels. The difference in frequency of these errors between our studies may have resulted partly from the translation tool evaluated (GT vs programs used by pharmacies in the Bronx), but may have also been due to our use of machine translation for complete sentencesthe purpose for which it is optimally designed. The hypothesis that machine translations of clinical information are most understandable when used for simple, complete sentences concurs with the methodology used by these tools and requires further study.
GT has the potential to be very useful to clinicians, particularly for those instances when the communication required is both spontaneous and routine or noncritical. For example, in the inpatient setting, patients could communicate diet and other nonclinical requests, as well as ask or answer simple, short questions when the interpreter is not available. In such situations, the low cost and ease of using online translations and machine translation more generally may help to circumvent the tendency of clinicians to get by with inadequate language skills or to avoid communication altogether.25 If used wisely, GT and other online tools could supplement the use of standardized translations and professional interpreters in helping clinicians to overcome language barriers and linguistic inertia, though this will require further assessment.
Ours is a pilot study, and while it suggests a more promising way to use online translation tools, significant further evaluation is required regarding accuracy and applicability prior to widespread use of any machine translation tools for patient care. The document we utilized for evaluation was a professionally translated patient educational brochure provided to individuals starting a complex medication. As online translation tools would most likely not be used in this setting, but rather for spontaneous and less critical patient‐specific instructions, further testing of GT as applied to such scenarios should be considered. Second, we only evaluated GT for English translated into Spanish; its usefulness in other languages will need to be evaluated. It also remains to be seen how easily GT translations will be understood by patients, who may have variable medical understanding and educational attainment as compared to our evaluators. Finally, in this evaluation, we only assessed automated written translation, not automated spoken translation services such as those now available on cellular phones and other mobile devices.11 The latter are based upon translation software with an additional speech recognition interface. These applications may prove to be even more useful than online translation, but the speech recognition component will add an additional layer of potential error and these applications will need to be evaluated on their own merits.
The domains chosen for this study had only moderate interrater reliability as assessed by intraclass correlation and repeatability, with meaning and preference scoring particularly poorly. The latter domains in particular will require more thorough assessment before routine use in online translation assessment. The variability in all domains may have resulted partly from the choice of nonclinicians of different ancestral backgrounds as evaluators. However, this variability is likely better representative of the wide range of patient backgrounds. Because our evaluators were not professional translators, we asked a professional interpreter to grade all sentences to assess the quality of their evaluation. While the interpreter noted slightly fewer errors among the professionally translated sentences (13% vs 22%) and slightly more errors among the GT‐translated sentences (50% vs 39%), and preferred the professional translation slightly more (3.8 vs 3.2), his scores for all of the other measures were almost identical, increasing our confidence in our primary findings (Appendix A). Additionally, since statistical translation is conducted sentence by sentence, in our study evaluators only scored translations at the sentence level. The accuracy of GT for whole paragraphs or entire documents will need to be assessed separately. The correlation between METEOR and the manual evaluation scores was less than in prior studies; while inexpensive to assess, METEOR will have to be recalibrated in optimal circumstanceswith several reference translations available rather than just onebefore it can be used to supplement the assessment of new languages, new materials, other translation technologies, and improvements in a given technology over time for patient educational material.
In summary, GT scored worse in grammar but similarly in content and sense to the professional translation, committing one critical error in translating a complex, fragmented sentence as nonsense. We believe that, with further study and judicious use, GT has the potential to substantially improve clinicians' communication with patients with limited English proficiency in the area of brief spontaneous patient‐specific information, supplementing well the role that professional spoken interpretation and standardized written translations already play.
- ,.Language use and English‐speaking ability: 2000. In:Census 2000 Brief.Washington, DC:US Census Bureau;2003. p. 2. http://www.census.gov/prod/2003pubs/c2kbr‐29.pdf.
- ,,,,.The need for more research on language barriers in health care: a proposed research agenda.Milbank Q.2006;84(1):111–133.
- ,,,.Language proficiency and adverse events in US hospitals: a pilot study.Int J Qual Health Care.2007;19(2):60–67.
- .The impact of medical interpreter services on the quality of health care: a systematic review.Med Care Res Rev.2005;62(3):255–299.
- ,,, et al.Errors in medical interpretation and their potential clinical consequences in pediatric encounters.Pediatrics.2003;111(1):6–14.
- ,,, et al.The effect of English language proficiency on length of stay and in‐hospital mortality.J Gen Intern Med.2004;19(3):221–228.
- ,,,.Influence of language barriers on outcomes of hospital care for general medicine inpatients.J Hosp Med.2010;5(5):276–282.
- ,.Hospitals, language, and culture: a snapshot of the nation. In:Los Angeles, CA:The California Endowment, the Joint Commission;2007. p.51–52. http://www.jointcommission.org/assets/1/6/hlc_paper.pdf.
- ,,,.Do professional interpreters improve clinical care for patients with limited English proficiency? A systematic review of the literature.Health Serv Res.2007;42(2):727–754.
- .Google's Computing Power Refines Translation Tool.New York Times; March 9,2010. Accessed March 24, 2010. http://www.nytimes.com/2010/03/09/technology/09translate.html?_r=1.
- , Translator. New York Times; March 20,2010. Accessed March 24, 2010. http://www.nytimes.com/2010/03/21/opinion/21bellos.html.
- ,.Accuracy of computer‐generated, Spanish‐language medicine labels.Pediatrics.2010;125(5):960–965.
- .Nielsen NetRatings Search Engine Ratings.SearchEngineWatch; August 22,2006. Accessed March 24, 2010. http://searchenginewatch.com/2156451.
- Google.Google Translate Help;2010. Accessed March 24, 2010. http://translate.google.com/support/?hl=en.
- ,.Chapter 4: Basic strategies. In:An Introduction to Machine Translation;1992. Accessed April 22, 2010. http://www.hutchinsweb.me.uk/IntroMT‐4.pdf
- .Your Guide to Coumadin®/Warfarin Therapy.Agency for Healthcare Research and Quality; August 21,2008. Accessed October 19, 2009. http://www.ahrq.gov/consumer/btpills.htm.
- ,,, et al.Patient reported receipt of medication instructions for warfarin is associated with reduced risk of serious bleeding events.J Gen Intern Med.2008;23(10):1589–1594.
- ,,.The ARPA MT evaluation methodologies: evolution, lessons, and future approaches. In: Proceedings of AMTA, 1994, Columbia, MD; October1994.
- ,.Overview of the IWSLT 2005 evaluation campaign. In: Proceedings of IWSLT 2005, Pittsburgh, PA; October2005.
- ,,,.BLEU: a method for automatic evaluation of machine translation. In: ACL‐2002: 40th Annual Meeting of the Association for Computational Linguistics.2002:311–318.
- ,.METEOR: an automatic metric for MT evaluation with high levels of correlation with human judgments. In: Proceedings of the Second Workshop on Statistical Machine Translation at ACL, Prague, Czech Republic; June2007.
- .The Structure of a Sentence.Ottawa:The Writing Centre, University of Ottawa;2007.
- ,.Statistical methods for assessing agreement between two methods of clinical measurement.Lancet.1986;1(8476):307–310.
- .Measurement, reproducibility, and validity. In:Epidemiologic Methods 203.San Francisco:Department of Biostatistics and Epidemiology, University of California;2009.
- ,,,,.Getting by: underuse of interpreters by resident physicians.J Gen Intern Med.2009;24(2):256–262.
Copyright © 2011 Society of Hospital Medicine