User login
Electronic Order Volume as a Meaningful Component in Estimating Patient Complexity and Resident Physician Workload
Resident physician workload has traditionally been measured by patient census.1,2 However, census and other volume-based metrics such as daily admissions may not accurately reflect workload due to variation in patient complexity. Relative value units (RVUs) are another commonly used marker of workload, but the validity of this metric relies on accurate coding, usually done by the attending physician, and is less directly related to resident physician workload. Because much of hospital-based medicine is mediated through the electronic health record (EHR), which can capture differences in patient complexity,3 electronic records could be harnessed to more comprehensively describe residents’ work. Current government estimates indicate that several hundred companies offer certified EHRs, thanks in large part to the Health Information Technology for Economic and Clinical Health (HITECH) Act of 2009, which aimed to promote adoption and meaningful use of health information technology.4, 5 These systems can collect important data about the usage and operating patterns of physicians, which may provide an insight into workload.6-8
Accurately measuring workload is important because of the direct link that has been drawn between physician workload and quality metrics. In a study of attending hospitalists, higher workload, as measured by patient census and RVUs, was associated with longer lengths of stay and higher costs of hospitalization.9 Another study among medical residents found that as daily admissions increased, length of stay, cost, and inpatient mortality appeared to rise.10 Although these studies used only volume-based workload metrics, the implication that high workload may negatively impact patient care hints at a possible trade-off between the two that should inform discussions of physician productivity.
In the current study, we examine whether data obtained from the EHR, particularly electronic order volume, could provide valuable information, in addition to patient volume, about resident physician workload. We first tested the feasibility and validity of using electronic order volume as an important component of clinical workload by examining the relationship between electronic order volume and well-established factors that are likely to increase the workload of residents, including patient level of care and severity of illness. Then, using order volume as a marker for workload, we sought to describe whether higher order volumes were associated with two discharge-related quality metrics, completion of a high-quality after-visit summary and timely discharge summary, postulating that quality metrics may suffer when residents are busier.
METHODS
Study Design and Setting
We performed a single-center retrospective cohort study of patients admitted to the internal medicine service at the University of California, San Francisco (UCSF) Medical Center between May 1, 2015 and July 31, 2016. UCSF is a 600-bed academic medical center, and the inpatient internal medicine teaching service manages an average daily census of 80-90 patients. Medicine teams care for patients on the general acute-care wards, the step-down units (for patients with higher acuity of care), and also patients in the intensive care unit (ICU). ICU patients are comanaged by general medicine teams and intensive care teams; internal medicine teams enter all electronic orders for ICU patients, except for orders for respiratory care or sedating medications. The inpatient internal medicine teaching service comprises eight teams each supervised by an attending physician, a senior resident (in the second or third year of residency training), two interns, and a third- and/or fourth-year medical student. Residents place all clinical orders and complete all clinical documentation through the EHR (Epic Systems, Verona, Wisconsin).11 Typically, the bulk of the orders and documentation, including discharge documentation, is performed by interns; however, the degree of senior resident involvement in these tasks is variable and team-dependent. In addition to the eight resident teams, there are also four attending hospitalist-only internal medicine teams, who manage a service of ~30-40 patients.
Study Population
Our study population comprised all hospitalized adults admitted to the eight resident-run teams on the internal medicine teaching service. Patients cared for by hospitalist-only teams were not included in this analysis. Because the focus of our study was on hospitalizations, individual patients may have been included multiple times over the course of the study. Hospitalizations were excluded if they did not have complete Medicare Severity-Diagnosis Related Group (MS-DRG) data,12 since this was used as our severity of illness marker. This occurred either because patients were not discharged by the end of the study period or because they had a length of stay of less than one day, because this metric was not assigned to these short-stay (observation) patients.
Data Collection
All electronic orders placed during the study period were obtained by extracting data from Epic’s Clarity database. Our EHR allows for the use of order sets; each order in these sets was counted individually, so that an order set with several orders would not be identified as one order. We identified the time and date that the order was placed, the ordering physician, the identity of the patient for which the order was placed, and the location of the patient when the order was placed, to determine the level of care (ICU, step-down, or general medicine unit). To track the composite volume of orders placed by resident teams, we matched each ordering physician to his or her corresponding resident team using our physician scheduling database, Amion (Spiral Software). We obtained team census by tabulating the total number of patients that a single resident team placed orders on over the course of a given calendar day. From billing data, we identified the MS-DRG weight that was assigned at the end of each hospitalization. Finally, we collected data on adherence to two discharge-related quality metrics to determine whether increased order volume was associated with decreased rates of adherence to these metrics. Using departmental patient-level quality improvement data, we determined whether each metric was met on discharge at the patient level. We also extracted patient-level demographic data, including age, sex, and insurance status, from this departmental quality improvement database.
Discharge Quality Outcome Metrics
We hypothesized that as the total daily electronic orders of a resident team increased, the rate of completion of two discharge-related quality metrics would decline due to the greater time constraints placed on the teams. The first metric we used was the completion of a high-quality after-visit summary (AVS), which has been described by the Centers for Medicare and Medicaid Services as part of its Meaningful Use Initiative.13 It was selected by the residents in our program as a particularly high-priority quality metric. Our institution specifically defines a “high-quality” AVS as including the following three components: a principal hospital problem, patient instructions, and follow-up information. The second discharge-related quality metric was the completion of a timely discharge summary, another measure recognized as a critical component in high-quality care.14 To be considered timely, the discharge summary had to be filed no later than 24 hours after the discharge order was entered into the EHR. This metric was more recently tracked by the internal medicine department and was not selected by the residents as a high-priority metric.
Statistical Analysis
To examine how the order volume per day changed throughout each sequential day of hospital admission, mean orders per hospital day with 95% CIs were plotted. We performed an aggregate analysis of all orders placed for each patient per day across three different levels of care (ICU, step-down, and general medicine). For each day of the study period, we summed all orders for all patients according to their location and divided by the number of total patients in each location to identify the average number of orders written for an ICU, step-down, and general medicine patient that day. We then calculated the mean daily orders for an ICU, step-down, and general medicine patient over the entire study period. We used ANOVA to test for statistically significant differences between the mean daily orders between these locations.
To examine the relationship between severity of illness and order volume, we performed an unadjusted patient-level analysis of orders per patient in the first three days of each hospitalization and stratified the data by the MS-DRG payment weight, which we divided into four quartiles. For each quartile, we calculated the mean number of orders placed in the first three days of admission and used ANOVA to test for statistically significant differences. We restricted the orders to the first three days of hospitalization instead of calculating mean orders per day of hospitalization because we postulated that the majority of orders were entered in these first few days and that with increasing length of stay (which we expected to occur with higher MS-DRG weight), the order volume becomes highly variable, which would tend to skew the mean orders per day.
We used multivariable logistic regression to determine whether the volume of electronic orders on the day of a given patient’s discharge, and also on the day before a given patient’s discharge, was a significant predictor of receiving a high-quality AVS. We adjusted for team census on the day of discharge, MS-DRG weight, age, sex, and insurance status. We then conducted a separate analysis of the association between electronic order volume and likelihood of completing a timely discharge summary among patients where discharge summary data were available. Logistic regression for each case was performed independently, so that team orders on the day prior to a patient’s discharge were not included in the model for the relationship between team orders on the day of a patient’s discharge and the discharge-related quality metric of interest, and vice versa, since including both in the model would be potentially disruptive given that orders on the day before and day of a patient’s discharge are likely correlated.
We also performed a subanalysis in which we restricted orders to only those placed during the daytime hours (7
IRB Approval
The study was approved by the UCSF Institutional Review Board and was granted a waiver of informed consent.
RESULTS
Population
We identified 7,296 eligible hospitalizations during the study period. After removing hospitalizations according to our exclusion criteria (Figure 1), there were 5,032 hospitalizations that were used in the analysis for which a total of 929,153 orders were written. The vast majority of patients received at least one order per day; fewer than 1% of encounter-days had zero associated orders. The top 10 discharge diagnoses identified in the cohort are listed in Appendix Table 1. A breakdown of orders by order type, across the entire cohort, is displayed in Appendix Table 2. The mean number of orders per patient per day of hospitalization is plotted in the Appendix Figure, which indicates that the number of orders is highest on the day of admission, decreases significantly after the first few days, and becomes increasingly variable with longer lengths of stay.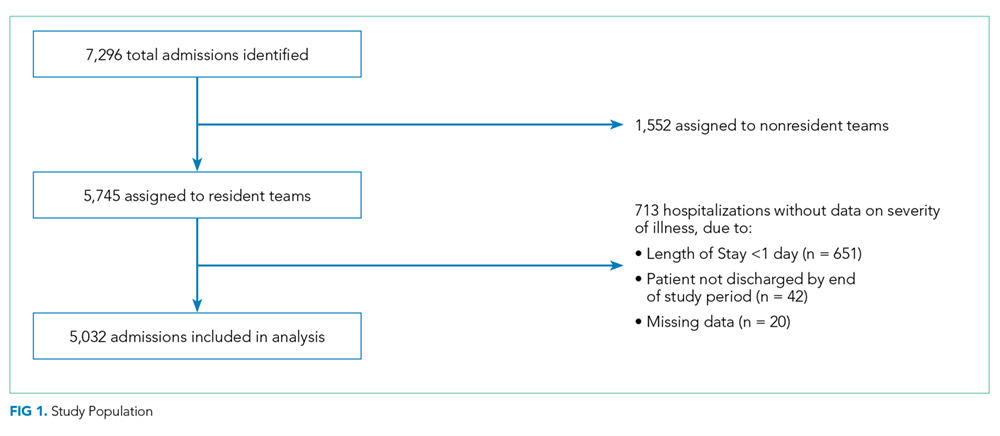
Patient Level of Care and Severity of Illness Metrics
Patients at a higher level of care had, on average, more orders entered per day. The mean order frequency was 40 orders per day for an ICU patient (standard deviation [SD] 13, range 13-134), 24 for a step-down patient (SD 6, range 11-48), and 19 for a general medicine unit patient (SD 3, range 10-31). The difference in mean daily orders was statistically significant (P < .001, Figure 2a).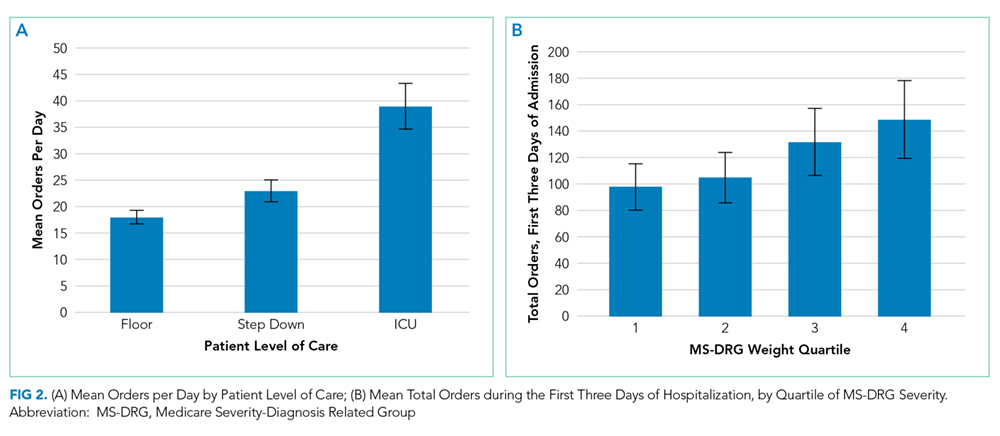
Orders also correlated with increasing severity of illness. Patients in the lowest quartile of MS-DRG weight received, on average, 98 orders in the first three days of hospitalization (SD 35, range 2-349), those in the second quartile received 105 orders (SD 38, range 10-380), those in the third quartile received 132 orders (SD 51, range 17-436), and those in the fourth and highest quartile received 149 orders (SD 59, range 32-482). Comparisons between each of these severity of illness categories were significant (P < .001, Figure 2b).
Discharge-Related Quality Metrics
The median number of orders per internal medicine team per day was 343 (IQR 261- 446). Of the 5,032 total discharged patients, 3,657 (73%) received a high-quality AVS on discharge. After controlling for team census, severity of illness, and demographic factors, there was no statistically significant association between total orders on the day of discharge and odds of receiving a high-quality AVS (OR 1.01; 95% CI 0.96-1.06), or between team orders placed the day prior to discharge and odds of receiving a high-quality AVS (OR 0.99; 95% CI 0.95-1.04; Table 1). When we restricted our analysis to orders placed during daytime hours (7 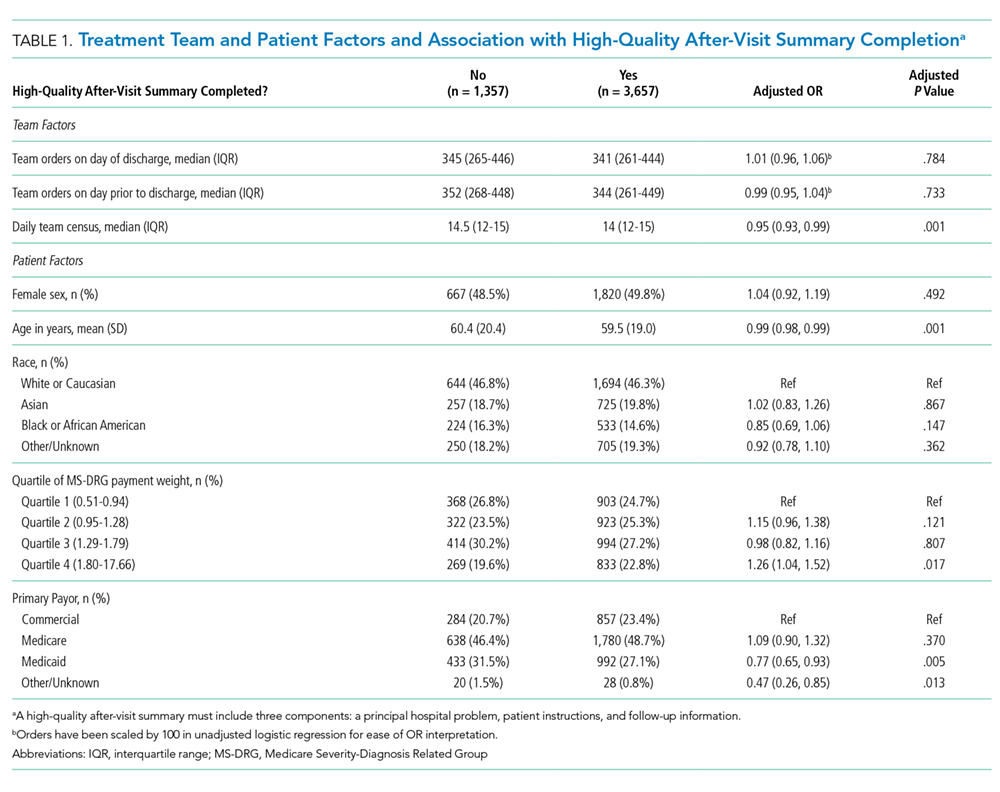
There were 3,835 patients for whom data on timing of discharge summary were available. Of these, 3,455 (91.2%) had a discharge summary completed within 24 hours. After controlling for team census, severity of illness, and demographic factors, there was no statistically significant association between total orders placed by the team on a patient’s day of discharge and odds of receiving a timely discharge summary (OR 0.96; 95% CI 0.88-1.05). However, patients were 12% less likely to receive a timely discharge summary for every 100 extra orders the team placed on the day prior to discharge (OR 0.88, 95% CI 0.82-0.95). Patients who received a timely discharge summary were cared for by teams who placed a median of 345 orders the day prior to their discharge, whereas those that did not receive a timely discharge summary were cared for by teams who placed a significantly higher number of orders (375) on the day prior to discharge (Table 2). When we restricted our analysis to only daytime orders, there were no significant changes in the findings (OR 1.00; 95% CI 0.88-1.14 for orders on the day of discharge; OR 0.84; 95% CI 0.75-0.95 for orders on the day prior to discharge).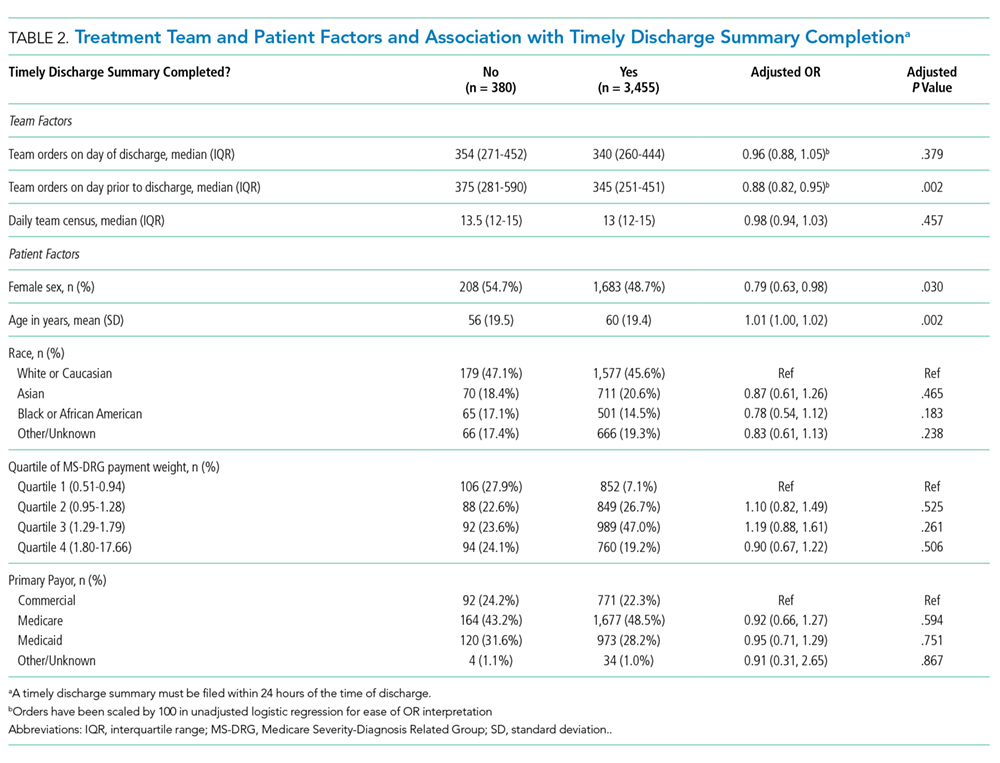
DISCUSSION
We found that electronic order volume may be a marker for patient complexity, which encompasses both level of care and severity of illness, and could be a marker of resident physician workload that harnesses readily available data from an EHR. Recent time-motion studies of internal medicine residents indicate that the majority of trainees’ time is spent on computers, engaged in indirect patient care activities such as reading electronic charts, entering electronic orders, and writing computerized notes.15-18 Capturing these tasks through metrics such as electronic order volume, as we did in this study, can provide valuable insights into resident physician workflow.
We found that ICU patients received more than twice as many orders per day than did general acute care-level patients. Furthermore, we found that patients whose hospitalizations fell into the highest MS-DRG weight quartile received approximately 50% more orders during the first three days of admission compared to that of patients whose hospitalizations fell into the lowest quartile. This strong association indicates that electronic order volume could provide meaningful additional information, in concert with other factors such as census, to describe resident physician workload.
We did not find that our workload measure was significantly associated with high-quality AVS completion. There are several possible explanations for this finding. First, adherence to this quality metric may be independent of workload, possibly because it is highly prioritized by residents at our institution. Second, adherence may only be impacted at levels of workload greater than what was experienced by the residents in our study. Finally, electronic order volume may not encompass enough of total workload to be reliably representative of resident work. However, the tight correlation between electronic order volume with severity of illness and level of care, in conjunction with the finding that patients were less likely to receive a timely discharge summary when workload was high on the day prior to a patient’s discharge, suggests that electronic order volume does indeed encompass a meaningful component of workload, and that with higher workload, adherence to some quality metrics may decline. We found that patients who received a timely discharge summary were discharged by teams who entered 30 fewer orders on the day before discharge compared with patients who did not receive a timely discharge summary. In addition to being statistically significant, it is also likely that this difference is clinically significant, although a determination of clinical significance is outside the scope of this study. Further exploration into the relationship between order volume and other quality metrics that are perhaps more sensitive to workload would be interesting.
The primary strength of our study is in how it demonstrates that EHRs can be harnessed to provide additional insights into clinical workload in a quantifiable and automated manner. Although there are a wide range of EHRs currently in use across the country, the capability to track electronic orders is common and could therefore be used broadly across institutions, with tailoring and standardization specific to each site. This technique is similar to that used by prior investigators who characterized the workload of pediatric residents by orders entered and notes written in the electronic medical record.19 However, our study is unique, in that we explored the relationship between electronic order volume and patient-level severity metrics as well as discharge-related quality metrics.
Our study is limited by several factors. When conceptualizing resident workload, several other elements that contribute to a sense of “busyness” may be independent of electronic orders and were not measured in our study.20 These include communication factors (such as language discordance, discussion with consulting services, and difficult end-of-life discussions), environmental factors (such as geographic localization), resident physician team factors (such as competing clinical or educational responsibilities), timing (in terms of day of week as well as time of year, since residents in July likely feel “busier” than residents in May), and ultimate discharge destination for patients (those going to a skilled nursing facility may require discharge documentation more urgently). Additionally, we chose to focus on the workload of resident teams, as represented by team orders, as opposed to individual work, which may be more directly correlated to our outcomes of interest, completion of a high-quality AVS, and timely discharge summary, which are usually performed by individuals.
Furthermore, we did not measure the relationship between our objective measure of workload and clinical endpoints. Instead, we chose to focus on process measures because they are less likely to be confounded by clinical factors independent of physician workload.21 Future studies should also consider obtaining direct resident-level measures of “busyness” or burnout, or other resident-centered endpoints, such as whether residents left the hospital at times consistent with duty hour regulations or whether they were able to attend educational conferences.
These limitations pose opportunities for further efforts to more comprehensively characterize clinical workload. Additional research is needed to understand and quantify the impact of patient, physician, and environmental factors that are not reflected by electronic order volume. Furthermore, an exploration of other electronic surrogates for clinical workload, such as paging volume and other EHR-derived data points, could also prove valuable in further describing the clinical workload. Future studies should also examine whether there is a relationship between these novel markers of workload and further outcomes, including both process measures and clinical endpoints.
CONCLUSIONS
Electronic order volume may provide valuable additional information for estimating the workload of resident physicians caring for hospitalized patients. Further investigation to determine whether the statistically significant differences identified in this study are clinically significant, how the technique used in this work may be applied to different EHRs, an examination of other EHR-derived metrics that may represent workload, and an exploration of additional patient-centered outcomes may be warranted.
Disclosures
Rajkomar reports personal fees from Google LLC, outside the submitted work. Dr. Khanna reports that during the conduct of the study, his salary, and the development of CareWeb (a communication platform that includes a smartphone-based paging application in use in several inpatient clinical units at University of California, San Francisco [UCSF] Medical Center) were supported by funding from the Center for Digital Health Innovation at UCSF. The CareWeb software has been licensed by Voalte.
Disclaimer
The views expressed in the submitted article are of the authors and not an official position of the institution.
1. Lurie JD, Wachter RM. Hospitalist staffing requirements. Eff Clin Pract. 1999;2(3):126-30. PubMed
2. Wachter RM. Hospitalist workload: The search for the magic number. JAMA Intern Med. 2014;174(5):794-795. doi: 10.1001/jamainternmed.2014.18. PubMed
3. Adler-Milstein J, DesRoches CM, Kralovec P, et al. Electronic health record adoption in US hospitals: progress continues, but challenges persist. Health Aff (Millwood). 2015;34(12):2174-2180. doi: 10.1377/hlthaff.2015.0992. PubMed
4. The Office of the National Coordinator for Health Information Technology, Health IT Dashboard. [cited 2018 April 4]. https://dashboard.healthit.gov/quickstats/quickstats.php Accessed June 28, 2018.
5. Index for Excerpts from the American Recovery and Reinvestment Act of 2009. Health Information Technology (HITECH) Act 2009. p. 112-164.
6. van der Sijs H, Aarts J, Vulto A, Berg M. Overriding of drug safety alerts in computerized physician order entry. J Am Med Inform Assoc. 2006;13(2):138-147. doi: 10.1197/jamia.M1809. PubMed
7. Ancker JS, Kern LM1, Edwards A, et al. How is the electronic health record being used? Use of EHR data to assess physician-level variability in technology use. J Am Med Inform Assoc. 2014;21(6):1001-1008. doi: 10.1136/amiajnl-2013-002627. PubMed
8. Hendey GW, Barth BE, Soliz T. Overnight and postcall errors in medication orders. Acad Emerg Med. 2005;12(7):629-634. doi: 10.1197/j.aem.2005.02.009. PubMed
9. Elliott DJ, Young RS2, Brice J3, Aguiar R4, Kolm P. Effect of hospitalist workload on the quality and efficiency of care. JAMA Intern Med. 2014;174(5):786-793. doi: 10.1001/jamainternmed.2014.300. PubMed
10. Ong M, Bostrom A, Vidyarthi A, McCulloch C, Auerbach A. House staff team workload and organization effects on patient outcomes in an academic general internal medicine inpatient service. Arch Intern Med. 2007;167(1):47-52. doi: 10.1001/archinte.167.1.47. PubMed
11. Epic Systems. [cited 2017 March 28]; Available from: http://www.epic.com/. Accessed June 28, 2018.
12. MS-DRG Classifications and software. https://www.cms.gov/Medicare/Medicare-Fee-for-Service-Payment/AcuteInpatientPPS/MS-DRG-Classifications-and-Software.html. Accessed June 28, 2018.
13. Hummel J, Evans P. Providing Clinical Summaries to Patients after Each Office Visit: A Technical Guide. [cited 2017 March 27]. https://www.healthit.gov/sites/default/files/measure-tools/avs-tech-guide.pdf. Accessed June 28, 2018.
14. Haycock M, Stuttaford L, Ruscombe-King O, Barker Z, Callaghan K, Davis T. Improving the percentage of electronic discharge summaries completed within 24 hours of discharge. BMJ Qual Improv Rep. 2014;3(1) pii: u205963.w2604. doi: 10.1136/bmjquality.u205963.w2604. PubMed
15. Block L, Habicht R, Wu AW, et al. In the wake of the 2003 and 2011 duty hours regulations, how do internal medicine interns spend their time? J Gen Intern Med. 2013;28(8):1042-1047. doi: 10.1007/s11606-013-2376-6. PubMed
16. Wenger N, Méan M, Castioni J, Marques-Vidal P, Waeber G, Garnier A. Allocation of internal medicine resident time in a Swiss hospital: a time and motion study of day and evening shifts. Ann Intern Med. 2017;166(8):579-586. doi: 10.7326/M16-2238. PubMed
17. Mamykina L, Vawdrey DK, Hripcsak G. How do residents spend their shift time? A time and motion study with a particular focus on the use of computers. Acad Med. 2016;91(6):827-832. doi: 10.1097/ACM.0000000000001148. PubMed
18. Fletcher KE, Visotcky AM, Slagle JM, Tarima S, Weinger MB, Schapira MM. The composition of intern work while on call. J Gen Intern Med. 2012;27(11):1432-1437. doi: 10.1007/s11606-012-2120-7. PubMed
19. Was A, Blankenburg R, Park KT. Pediatric resident workload intensity and variability. Pediatrics 2016;138(1):e20154371. doi: 10.1542/peds.2015-4371. PubMed
20. Michtalik HJ, Pronovost PJ, Marsteller JA, Spetz J, Brotman DJ. Developing a model for attending physician workload and outcomes. JAMA Intern Med. 2013;173(11):1026-1028. doi: 10.1001/jamainternmed.2013.405. PubMed
21. Mant J. Process versus outcome indicators in the assessment of quality of health care. Int J Qual Health Care. 2001;13(6):475-480. doi: 10.1093/intqhc/13.6.475. PubMed
Resident physician workload has traditionally been measured by patient census.1,2 However, census and other volume-based metrics such as daily admissions may not accurately reflect workload due to variation in patient complexity. Relative value units (RVUs) are another commonly used marker of workload, but the validity of this metric relies on accurate coding, usually done by the attending physician, and is less directly related to resident physician workload. Because much of hospital-based medicine is mediated through the electronic health record (EHR), which can capture differences in patient complexity,3 electronic records could be harnessed to more comprehensively describe residents’ work. Current government estimates indicate that several hundred companies offer certified EHRs, thanks in large part to the Health Information Technology for Economic and Clinical Health (HITECH) Act of 2009, which aimed to promote adoption and meaningful use of health information technology.4, 5 These systems can collect important data about the usage and operating patterns of physicians, which may provide an insight into workload.6-8
Accurately measuring workload is important because of the direct link that has been drawn between physician workload and quality metrics. In a study of attending hospitalists, higher workload, as measured by patient census and RVUs, was associated with longer lengths of stay and higher costs of hospitalization.9 Another study among medical residents found that as daily admissions increased, length of stay, cost, and inpatient mortality appeared to rise.10 Although these studies used only volume-based workload metrics, the implication that high workload may negatively impact patient care hints at a possible trade-off between the two that should inform discussions of physician productivity.
In the current study, we examine whether data obtained from the EHR, particularly electronic order volume, could provide valuable information, in addition to patient volume, about resident physician workload. We first tested the feasibility and validity of using electronic order volume as an important component of clinical workload by examining the relationship between electronic order volume and well-established factors that are likely to increase the workload of residents, including patient level of care and severity of illness. Then, using order volume as a marker for workload, we sought to describe whether higher order volumes were associated with two discharge-related quality metrics, completion of a high-quality after-visit summary and timely discharge summary, postulating that quality metrics may suffer when residents are busier.
METHODS
Study Design and Setting
We performed a single-center retrospective cohort study of patients admitted to the internal medicine service at the University of California, San Francisco (UCSF) Medical Center between May 1, 2015 and July 31, 2016. UCSF is a 600-bed academic medical center, and the inpatient internal medicine teaching service manages an average daily census of 80-90 patients. Medicine teams care for patients on the general acute-care wards, the step-down units (for patients with higher acuity of care), and also patients in the intensive care unit (ICU). ICU patients are comanaged by general medicine teams and intensive care teams; internal medicine teams enter all electronic orders for ICU patients, except for orders for respiratory care or sedating medications. The inpatient internal medicine teaching service comprises eight teams each supervised by an attending physician, a senior resident (in the second or third year of residency training), two interns, and a third- and/or fourth-year medical student. Residents place all clinical orders and complete all clinical documentation through the EHR (Epic Systems, Verona, Wisconsin).11 Typically, the bulk of the orders and documentation, including discharge documentation, is performed by interns; however, the degree of senior resident involvement in these tasks is variable and team-dependent. In addition to the eight resident teams, there are also four attending hospitalist-only internal medicine teams, who manage a service of ~30-40 patients.
Study Population
Our study population comprised all hospitalized adults admitted to the eight resident-run teams on the internal medicine teaching service. Patients cared for by hospitalist-only teams were not included in this analysis. Because the focus of our study was on hospitalizations, individual patients may have been included multiple times over the course of the study. Hospitalizations were excluded if they did not have complete Medicare Severity-Diagnosis Related Group (MS-DRG) data,12 since this was used as our severity of illness marker. This occurred either because patients were not discharged by the end of the study period or because they had a length of stay of less than one day, because this metric was not assigned to these short-stay (observation) patients.
Data Collection
All electronic orders placed during the study period were obtained by extracting data from Epic’s Clarity database. Our EHR allows for the use of order sets; each order in these sets was counted individually, so that an order set with several orders would not be identified as one order. We identified the time and date that the order was placed, the ordering physician, the identity of the patient for which the order was placed, and the location of the patient when the order was placed, to determine the level of care (ICU, step-down, or general medicine unit). To track the composite volume of orders placed by resident teams, we matched each ordering physician to his or her corresponding resident team using our physician scheduling database, Amion (Spiral Software). We obtained team census by tabulating the total number of patients that a single resident team placed orders on over the course of a given calendar day. From billing data, we identified the MS-DRG weight that was assigned at the end of each hospitalization. Finally, we collected data on adherence to two discharge-related quality metrics to determine whether increased order volume was associated with decreased rates of adherence to these metrics. Using departmental patient-level quality improvement data, we determined whether each metric was met on discharge at the patient level. We also extracted patient-level demographic data, including age, sex, and insurance status, from this departmental quality improvement database.
Discharge Quality Outcome Metrics
We hypothesized that as the total daily electronic orders of a resident team increased, the rate of completion of two discharge-related quality metrics would decline due to the greater time constraints placed on the teams. The first metric we used was the completion of a high-quality after-visit summary (AVS), which has been described by the Centers for Medicare and Medicaid Services as part of its Meaningful Use Initiative.13 It was selected by the residents in our program as a particularly high-priority quality metric. Our institution specifically defines a “high-quality” AVS as including the following three components: a principal hospital problem, patient instructions, and follow-up information. The second discharge-related quality metric was the completion of a timely discharge summary, another measure recognized as a critical component in high-quality care.14 To be considered timely, the discharge summary had to be filed no later than 24 hours after the discharge order was entered into the EHR. This metric was more recently tracked by the internal medicine department and was not selected by the residents as a high-priority metric.
Statistical Analysis
To examine how the order volume per day changed throughout each sequential day of hospital admission, mean orders per hospital day with 95% CIs were plotted. We performed an aggregate analysis of all orders placed for each patient per day across three different levels of care (ICU, step-down, and general medicine). For each day of the study period, we summed all orders for all patients according to their location and divided by the number of total patients in each location to identify the average number of orders written for an ICU, step-down, and general medicine patient that day. We then calculated the mean daily orders for an ICU, step-down, and general medicine patient over the entire study period. We used ANOVA to test for statistically significant differences between the mean daily orders between these locations.
To examine the relationship between severity of illness and order volume, we performed an unadjusted patient-level analysis of orders per patient in the first three days of each hospitalization and stratified the data by the MS-DRG payment weight, which we divided into four quartiles. For each quartile, we calculated the mean number of orders placed in the first three days of admission and used ANOVA to test for statistically significant differences. We restricted the orders to the first three days of hospitalization instead of calculating mean orders per day of hospitalization because we postulated that the majority of orders were entered in these first few days and that with increasing length of stay (which we expected to occur with higher MS-DRG weight), the order volume becomes highly variable, which would tend to skew the mean orders per day.
We used multivariable logistic regression to determine whether the volume of electronic orders on the day of a given patient’s discharge, and also on the day before a given patient’s discharge, was a significant predictor of receiving a high-quality AVS. We adjusted for team census on the day of discharge, MS-DRG weight, age, sex, and insurance status. We then conducted a separate analysis of the association between electronic order volume and likelihood of completing a timely discharge summary among patients where discharge summary data were available. Logistic regression for each case was performed independently, so that team orders on the day prior to a patient’s discharge were not included in the model for the relationship between team orders on the day of a patient’s discharge and the discharge-related quality metric of interest, and vice versa, since including both in the model would be potentially disruptive given that orders on the day before and day of a patient’s discharge are likely correlated.
We also performed a subanalysis in which we restricted orders to only those placed during the daytime hours (7
IRB Approval
The study was approved by the UCSF Institutional Review Board and was granted a waiver of informed consent.
RESULTS
Population
We identified 7,296 eligible hospitalizations during the study period. After removing hospitalizations according to our exclusion criteria (Figure 1), there were 5,032 hospitalizations that were used in the analysis for which a total of 929,153 orders were written. The vast majority of patients received at least one order per day; fewer than 1% of encounter-days had zero associated orders. The top 10 discharge diagnoses identified in the cohort are listed in Appendix Table 1. A breakdown of orders by order type, across the entire cohort, is displayed in Appendix Table 2. The mean number of orders per patient per day of hospitalization is plotted in the Appendix Figure, which indicates that the number of orders is highest on the day of admission, decreases significantly after the first few days, and becomes increasingly variable with longer lengths of stay.
Patient Level of Care and Severity of Illness Metrics
Patients at a higher level of care had, on average, more orders entered per day. The mean order frequency was 40 orders per day for an ICU patient (standard deviation [SD] 13, range 13-134), 24 for a step-down patient (SD 6, range 11-48), and 19 for a general medicine unit patient (SD 3, range 10-31). The difference in mean daily orders was statistically significant (P < .001, Figure 2a).
Orders also correlated with increasing severity of illness. Patients in the lowest quartile of MS-DRG weight received, on average, 98 orders in the first three days of hospitalization (SD 35, range 2-349), those in the second quartile received 105 orders (SD 38, range 10-380), those in the third quartile received 132 orders (SD 51, range 17-436), and those in the fourth and highest quartile received 149 orders (SD 59, range 32-482). Comparisons between each of these severity of illness categories were significant (P < .001, Figure 2b).
Discharge-Related Quality Metrics
The median number of orders per internal medicine team per day was 343 (IQR 261- 446). Of the 5,032 total discharged patients, 3,657 (73%) received a high-quality AVS on discharge. After controlling for team census, severity of illness, and demographic factors, there was no statistically significant association between total orders on the day of discharge and odds of receiving a high-quality AVS (OR 1.01; 95% CI 0.96-1.06), or between team orders placed the day prior to discharge and odds of receiving a high-quality AVS (OR 0.99; 95% CI 0.95-1.04; Table 1). When we restricted our analysis to orders placed during daytime hours (7
There were 3,835 patients for whom data on timing of discharge summary were available. Of these, 3,455 (91.2%) had a discharge summary completed within 24 hours. After controlling for team census, severity of illness, and demographic factors, there was no statistically significant association between total orders placed by the team on a patient’s day of discharge and odds of receiving a timely discharge summary (OR 0.96; 95% CI 0.88-1.05). However, patients were 12% less likely to receive a timely discharge summary for every 100 extra orders the team placed on the day prior to discharge (OR 0.88, 95% CI 0.82-0.95). Patients who received a timely discharge summary were cared for by teams who placed a median of 345 orders the day prior to their discharge, whereas those that did not receive a timely discharge summary were cared for by teams who placed a significantly higher number of orders (375) on the day prior to discharge (Table 2). When we restricted our analysis to only daytime orders, there were no significant changes in the findings (OR 1.00; 95% CI 0.88-1.14 for orders on the day of discharge; OR 0.84; 95% CI 0.75-0.95 for orders on the day prior to discharge).
DISCUSSION
We found that electronic order volume may be a marker for patient complexity, which encompasses both level of care and severity of illness, and could be a marker of resident physician workload that harnesses readily available data from an EHR. Recent time-motion studies of internal medicine residents indicate that the majority of trainees’ time is spent on computers, engaged in indirect patient care activities such as reading electronic charts, entering electronic orders, and writing computerized notes.15-18 Capturing these tasks through metrics such as electronic order volume, as we did in this study, can provide valuable insights into resident physician workflow.
We found that ICU patients received more than twice as many orders per day than did general acute care-level patients. Furthermore, we found that patients whose hospitalizations fell into the highest MS-DRG weight quartile received approximately 50% more orders during the first three days of admission compared to that of patients whose hospitalizations fell into the lowest quartile. This strong association indicates that electronic order volume could provide meaningful additional information, in concert with other factors such as census, to describe resident physician workload.
We did not find that our workload measure was significantly associated with high-quality AVS completion. There are several possible explanations for this finding. First, adherence to this quality metric may be independent of workload, possibly because it is highly prioritized by residents at our institution. Second, adherence may only be impacted at levels of workload greater than what was experienced by the residents in our study. Finally, electronic order volume may not encompass enough of total workload to be reliably representative of resident work. However, the tight correlation between electronic order volume with severity of illness and level of care, in conjunction with the finding that patients were less likely to receive a timely discharge summary when workload was high on the day prior to a patient’s discharge, suggests that electronic order volume does indeed encompass a meaningful component of workload, and that with higher workload, adherence to some quality metrics may decline. We found that patients who received a timely discharge summary were discharged by teams who entered 30 fewer orders on the day before discharge compared with patients who did not receive a timely discharge summary. In addition to being statistically significant, it is also likely that this difference is clinically significant, although a determination of clinical significance is outside the scope of this study. Further exploration into the relationship between order volume and other quality metrics that are perhaps more sensitive to workload would be interesting.
The primary strength of our study is in how it demonstrates that EHRs can be harnessed to provide additional insights into clinical workload in a quantifiable and automated manner. Although there are a wide range of EHRs currently in use across the country, the capability to track electronic orders is common and could therefore be used broadly across institutions, with tailoring and standardization specific to each site. This technique is similar to that used by prior investigators who characterized the workload of pediatric residents by orders entered and notes written in the electronic medical record.19 However, our study is unique, in that we explored the relationship between electronic order volume and patient-level severity metrics as well as discharge-related quality metrics.
Our study is limited by several factors. When conceptualizing resident workload, several other elements that contribute to a sense of “busyness” may be independent of electronic orders and were not measured in our study.20 These include communication factors (such as language discordance, discussion with consulting services, and difficult end-of-life discussions), environmental factors (such as geographic localization), resident physician team factors (such as competing clinical or educational responsibilities), timing (in terms of day of week as well as time of year, since residents in July likely feel “busier” than residents in May), and ultimate discharge destination for patients (those going to a skilled nursing facility may require discharge documentation more urgently). Additionally, we chose to focus on the workload of resident teams, as represented by team orders, as opposed to individual work, which may be more directly correlated to our outcomes of interest, completion of a high-quality AVS, and timely discharge summary, which are usually performed by individuals.
Furthermore, we did not measure the relationship between our objective measure of workload and clinical endpoints. Instead, we chose to focus on process measures because they are less likely to be confounded by clinical factors independent of physician workload.21 Future studies should also consider obtaining direct resident-level measures of “busyness” or burnout, or other resident-centered endpoints, such as whether residents left the hospital at times consistent with duty hour regulations or whether they were able to attend educational conferences.
These limitations pose opportunities for further efforts to more comprehensively characterize clinical workload. Additional research is needed to understand and quantify the impact of patient, physician, and environmental factors that are not reflected by electronic order volume. Furthermore, an exploration of other electronic surrogates for clinical workload, such as paging volume and other EHR-derived data points, could also prove valuable in further describing the clinical workload. Future studies should also examine whether there is a relationship between these novel markers of workload and further outcomes, including both process measures and clinical endpoints.
CONCLUSIONS
Electronic order volume may provide valuable additional information for estimating the workload of resident physicians caring for hospitalized patients. Further investigation to determine whether the statistically significant differences identified in this study are clinically significant, how the technique used in this work may be applied to different EHRs, an examination of other EHR-derived metrics that may represent workload, and an exploration of additional patient-centered outcomes may be warranted.
Disclosures
Rajkomar reports personal fees from Google LLC, outside the submitted work. Dr. Khanna reports that during the conduct of the study, his salary, and the development of CareWeb (a communication platform that includes a smartphone-based paging application in use in several inpatient clinical units at University of California, San Francisco [UCSF] Medical Center) were supported by funding from the Center for Digital Health Innovation at UCSF. The CareWeb software has been licensed by Voalte.
Disclaimer
The views expressed in the submitted article are of the authors and not an official position of the institution.
1. Lurie JD, Wachter RM. Hospitalist staffing requirements. Eff Clin Pract. 1999;2(3):126-30. PubMed
2. Wachter RM. Hospitalist workload: The search for the magic number. JAMA Intern Med. 2014;174(5):794-795. doi: 10.1001/jamainternmed.2014.18. PubMed
3. Adler-Milstein J, DesRoches CM, Kralovec P, et al. Electronic health record adoption in US hospitals: progress continues, but challenges persist. Health Aff (Millwood). 2015;34(12):2174-2180. doi: 10.1377/hlthaff.2015.0992. PubMed
4. The Office of the National Coordinator for Health Information Technology, Health IT Dashboard. [cited 2018 April 4]. https://dashboard.healthit.gov/quickstats/quickstats.php Accessed June 28, 2018.
5. Index for Excerpts from the American Recovery and Reinvestment Act of 2009. Health Information Technology (HITECH) Act 2009. p. 112-164.
6. van der Sijs H, Aarts J, Vulto A, Berg M. Overriding of drug safety alerts in computerized physician order entry. J Am Med Inform Assoc. 2006;13(2):138-147. doi: 10.1197/jamia.M1809. PubMed
7. Ancker JS, Kern LM1, Edwards A, et al. How is the electronic health record being used? Use of EHR data to assess physician-level variability in technology use. J Am Med Inform Assoc. 2014;21(6):1001-1008. doi: 10.1136/amiajnl-2013-002627. PubMed
8. Hendey GW, Barth BE, Soliz T. Overnight and postcall errors in medication orders. Acad Emerg Med. 2005;12(7):629-634. doi: 10.1197/j.aem.2005.02.009. PubMed
9. Elliott DJ, Young RS2, Brice J3, Aguiar R4, Kolm P. Effect of hospitalist workload on the quality and efficiency of care. JAMA Intern Med. 2014;174(5):786-793. doi: 10.1001/jamainternmed.2014.300. PubMed
10. Ong M, Bostrom A, Vidyarthi A, McCulloch C, Auerbach A. House staff team workload and organization effects on patient outcomes in an academic general internal medicine inpatient service. Arch Intern Med. 2007;167(1):47-52. doi: 10.1001/archinte.167.1.47. PubMed
11. Epic Systems. [cited 2017 March 28]; Available from: http://www.epic.com/. Accessed June 28, 2018.
12. MS-DRG Classifications and software. https://www.cms.gov/Medicare/Medicare-Fee-for-Service-Payment/AcuteInpatientPPS/MS-DRG-Classifications-and-Software.html. Accessed June 28, 2018.
13. Hummel J, Evans P. Providing Clinical Summaries to Patients after Each Office Visit: A Technical Guide. [cited 2017 March 27]. https://www.healthit.gov/sites/default/files/measure-tools/avs-tech-guide.pdf. Accessed June 28, 2018.
14. Haycock M, Stuttaford L, Ruscombe-King O, Barker Z, Callaghan K, Davis T. Improving the percentage of electronic discharge summaries completed within 24 hours of discharge. BMJ Qual Improv Rep. 2014;3(1) pii: u205963.w2604. doi: 10.1136/bmjquality.u205963.w2604. PubMed
15. Block L, Habicht R, Wu AW, et al. In the wake of the 2003 and 2011 duty hours regulations, how do internal medicine interns spend their time? J Gen Intern Med. 2013;28(8):1042-1047. doi: 10.1007/s11606-013-2376-6. PubMed
16. Wenger N, Méan M, Castioni J, Marques-Vidal P, Waeber G, Garnier A. Allocation of internal medicine resident time in a Swiss hospital: a time and motion study of day and evening shifts. Ann Intern Med. 2017;166(8):579-586. doi: 10.7326/M16-2238. PubMed
17. Mamykina L, Vawdrey DK, Hripcsak G. How do residents spend their shift time? A time and motion study with a particular focus on the use of computers. Acad Med. 2016;91(6):827-832. doi: 10.1097/ACM.0000000000001148. PubMed
18. Fletcher KE, Visotcky AM, Slagle JM, Tarima S, Weinger MB, Schapira MM. The composition of intern work while on call. J Gen Intern Med. 2012;27(11):1432-1437. doi: 10.1007/s11606-012-2120-7. PubMed
19. Was A, Blankenburg R, Park KT. Pediatric resident workload intensity and variability. Pediatrics 2016;138(1):e20154371. doi: 10.1542/peds.2015-4371. PubMed
20. Michtalik HJ, Pronovost PJ, Marsteller JA, Spetz J, Brotman DJ. Developing a model for attending physician workload and outcomes. JAMA Intern Med. 2013;173(11):1026-1028. doi: 10.1001/jamainternmed.2013.405. PubMed
21. Mant J. Process versus outcome indicators in the assessment of quality of health care. Int J Qual Health Care. 2001;13(6):475-480. doi: 10.1093/intqhc/13.6.475. PubMed