User login
Reducing Unnecessary Treatment of Asymptomatic Elevated Blood Pressure with Intravenous Medications on the General Internal Medicine Wards: A Quality Improvement Initiative
Elevated blood pressure (BP) is common among hospitalized adults, with prevalence estimates between 50% and 70%.1 Many factors can cause or exacerbate BP elevations in the setting of acute illness, such as pain, anxiety, medication withdrawal, and volume status, among others.2 While there are clear evidence-based recommendations for treating hypertension (HTN) in the ambulatory setting,3 guidelines for the management of elevated BP in the hospital are lacking.4,5
Hypertensive crises are generally recognized as warranting rapid reduction in BP;6-8 however, these represent the minority of cases.9,10 Far more common in the hospital are patients with asymptomatic elevated BP, a population for which there is no high-quality evidence and no guidelines supporting the use of intravenous (IV) antihypertensives.11,12 Treatment with such medications has been associated with highly variable clinical responses13-15 and may result in adverse events, such as hypotension.10
To date, only a small number of studies have investigated the treatment of asymptomatic elevated BP among hospitalized adults.10,13-15 These have suggested that IV antihypertensives are utilized frequently in this setting, often for only modestly elevated BPs; however, the studies have tended to be small, not racially diverse, and limited to noncritically ill patients. Furthermore, while it is generally accepted that reducing the use of IV antihypertensives among asymptomatic patients would have no adverse impact, to our knowledge there have been no published studies which have instituted such an initiative while measuring balancing outcomes.
The purpose of this study was to further the existing literature by defining the prevalence and effects of IV antihypertensive medication utilization among a medically complex, multiracial population of asymptomatic medical inpatients using a large electronic dataset and to evaluate the impact of a division-wide, two-tiered quality improvement (QI) initiative on the rates of IV antihypertensive utilization and patient outcomes.
METHODS
Setting
The study was conducted at the University of California, San Francisco (UCSF), an 800-bed tertiary care, academic medical center. It was approved by the UCSF Institutional Review Board. General medicine patients at UCSF are distributed between teaching and direct-care (hospitalist) services. The intensive care unit (ICU) is “open,” meaning the medicine service acts as the primary team for all nonsurgical ICU patients. This study included all adult general medicine patients admitted to UCSF Medical Center between January 1, 2017 and March 1, 2018, including those in the ICU.
Study Population and Data Collection
The UCSF Medical Center uses the electronic health record (EHR) Epic (Epic 2017, Epic Systems Corporation, Verona, Wisconsin) for all clinical care. We obtained computerized EHR data from Clarity, the relational database that stores Epic’s inpatient data in thousands of tables, including orders, medications, laboratory and radiology results, vital signs, patient demographics, and notes. We identified all adult patients hospitalized on the general medicine service with ≥1 episode of elevated BP (>160/90 mm Hg) at any point during their hospitalization who were not on a vasopressor medication at the time of the vital sign recording.
We further identified all instances in which either IV labetalol or hydralazine were administered to these patients. These two agents were chosen because they are the only IV antihypertensives used commonly at our institution for the treatment of asymptomatic elevated BP among internal medicine patients. Only those orders placed by a general medicine provider or reconciled by a general medicine provider upon transfer from another service were included. For each medication administration timestamp, we collected vital signs before and after the administration, along with the ordering provider and the clinical indication that was documented in the electronic order. To determine if a medication was administered with concern for end-organ injury, we also extracted orders that could serve as a proxy for the provider’s clinical assessment—namely electrocardiograms, serum troponins, chest x-rays, and computerized tomography scans of the head—which were placed in the one hour preceding or 15 minutes following administration of an IV antihypertensive medication.
To assess for comorbid conditions, including a preexisting diagnosis of HTN, we collected International Classification of Diseases (ICD)-9/10 diagnosis codes. Further, we also extracted All Patient Refined Diagnosis-Related Group (APR-DRG) weights, which are a standardized measure of illness severity based on relative resource consumption during hospitalization.16,17
Patients were categorized as having either “symptomatic” or “asymptomatic” elevated BP. We defined symptomatic elevated BP as having received treatment with an IV medication with provider concern for end-organ injury, as defined above. We further identified all patients in which tight BP control may be clinically indicated on the basis of the presence of any of the following ICD-9/10 diagnosis codes at the time of hospital discharge: myocardial infarction, ischemic stroke, intracranial hemorrhage, subarachnoid hemorrhage, subdural hematoma, aortic dissection, hypertensive emergency, or hypertensive encephalopathy. All patients with symptomatic elevated BP or any of the above ICD-9/10 diagnoses were excluded from the analysis, since administration of IV antihypertensive medications would plausibly be warranted in these clinical scenarios.
The encounter numbers from the dataset were used to link to patient demographic data, which included age, sex, race, ethnicity, primary language, and insurance status. Finally, we identified all instances of rapid response calls, ICU transfers, and code blues (cardiopulmonary arrests) for each patient in the dataset.
Blood Pressure Measurements
BP data were collected from invasive BP (IBP) monitoring devices and noninvasive BP cuffs. For patients with BP measurements recorded concomitantly from both IBP (ie, arterial lines) in addition to noninvasive BP cuffs, the arterial line reading was favored. All systolic BP (SBP) readings >240 mm Hg from arterial lines were excluded, as this has previously been described as the upper physiologic limit for IBP readings.18
Primary Outcome
The primary outcome for the study was the proportion of patients treated with IV antihypertensive medications (labetalol or hydralazine). Using aggregate data, we calculated the number of patients who were treated at least once with an IV antihypertensive in a given month (numerator), divided by the number of patients with ≥1 episode of asymptomatic elevated BP that month (denominator). The denominator was considered to be the population of patients “at risk” of being treated with IV antihypertensive medications. For patients with multiple admissions during the study period, each admission was considered separately. These results are displayed in the upper portion of the run chart (Figure).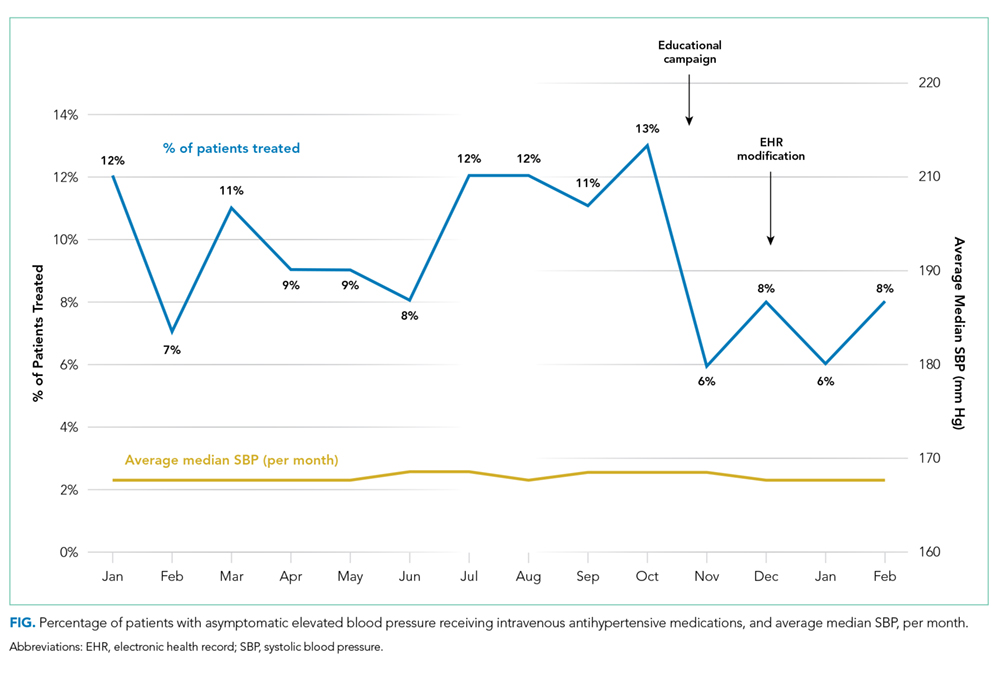
Secondary Outcomes
To investigate blood pressure trends over time, we analyzed BP in three ways. First, we analyzed the median SBP for the entire population. Second, to determine clinical responses to IV antihypertensive medications among patients receiving treatment, we calculated the population medians for the pretreatment SBP, the change in SBP from pretreatment baseline, and the posttreatment SBP. Third, we calculated the average median SBP on a monthly basis for the duration of the study. This was achieved by calculating the median value of all SBPs for an individual patient, then averaging across all patients in a given month. The average monthly median SBPs are displayed in the lower portion of the Figure.
To investigate whether the intervention was associated with negative patient outcomes, the proportions of several balancing outcomes were compared between pre- and postintervention periods, including ICU transfers, rapid response calls, and code blues (cardiopulmonary arrests).
Development and Implementation of an Intervention to Reduce Excessive IV Antihypertensive Use
After establishing the baseline prevalence of IV antihypertensive medication use at our institution, we developed a QI initiative with the goal of reducing IV antihypertensive medication utilization by the general medicine service for the treatment of asymptomatic patients. We hypothesized that potential contributors to overutilization might include lack of education, provider/nursing discomfort, and a system designed to mandate provider notification for even modestly elevated BPs. The QI initiative, which took place between October 2017 and December 2017, was designed to address these potential contributors and was comprised of a division-wide, two-tiered, bundled intervention. Our choice of a two-tiered approach was based on the fact that successful culture change is challenging, along with the existing evidence that multifaceted QI interventions are more often successful than single-tiered approaches.19
The first tier of the initiative included an educational campaign referred to colloquially as “NoIVForHighBP,” which targeted residents, hospitalists, and nursing staff. The campaign consisted of a series of presentations, best practice updates, handouts, and posters displayed prominently in shared workspaces. The educational content focused on alternative approaches to the management of asymptomatic elevated BP in the hospital, such as identification and treatment of pain, anxiety, volume overload, or other contributing factors (see supplemental materials). These educational outreaches occurred periodically between October 4, 2017 and November 20, 2017, with the bulk of the educational efforts taking place during November. Therefore, November 1, 2017 was designated the start date for the intervention period.
The second tier of the intervention included the liberalization of the EHR BP notification parameters on the standard inpatient admission order set from >160/90 mm Hg to >180/90 mm Hg. This change took effect on 12/6/2017. The decision to modify the BP notification parameters was based on the hypothesis that mandatory notifications for modestly elevated BPs may prompt providers to reflexively order IV antihypertensive medications, especially during times of cross-coverage or high clinical workload.
Statistical Analysis
All statistical analyses were performed using Stata software version 15 (StataCorp. 2017. Stata Statistical Software: Release 15. College Station, Texas: StataCorp LLC). Baseline patient characteristics were compared using nonparametric tests of significance. Population median SBPs were compared between pre- and postintervention periods using Mood’s Median Test, which was selected because the data were distributed nonnormally, and variances between samples were unequal.
Among patients treated with IV antihypertensive medications, we compared the proportion of pretreatment SBPs falling into each of three specified ranges (SBP <180 mm Hg, SBP 180-199 mm Hg, and SBP >200 mm Hg) between baseline and intervention periods using chi-squared tests.
Using aggregate data, we compared the unadjusted proportion of patients treated with IV antihypertensive medications between pre- and postintervention periods using a chi-squared test. Next, using patient-level data, a logistic regression analysis was performed to examine the association between receipt of IV antihypertensive medications and time (dichotomized between pre- and postintervention periods) while adjusting for age, sex, race, ethnicity, primary language, insurance status, preexisting HTN, length of stay, and APR-DRG weight.
Rates of balancing outcomes were compared using chi-squared tests. A logistic regression analysis using patient-level data was also performed to investigate the association between each of these outcomes and the intervention period (pre vs post) while adjusting for age, sex, race, ethnicity, primary language, insurance status, preexisting HTN, length of stay, and APR-DRG weight.
RESULTS
Baseline Period
We identified 2,306 patients with ≥1 episode of asymptomatic elevated BP during the 10-month preintervention period. Patients on average experienced 9 episodes of elevated BP per hospitalization, representing 21,207 potential opportunities for treatment. Baseline characteristics are summarized in Table 1. In general, this represents an older population that was medically complex and multiracial.
Of these patients, 251 (11%) received IV hydralazine and/or labetalol at least once during their hospitalization, with a total of 597 doses administered. Among those treated, a median of 2 doses were given per patient (IQR: 1-4), 64% of which were hydralazine. The majority (380 [64%]) were ordered on an “as needed” basis, while 217 (36%) were administered as a one-time dose. Three-quarters of all doses were ordered by the teaching service (456 [76%]), with the remaining 24% ordered by the direct-care (hospitalist) service.
During the baseline period among patients receiving IV antihypertensive medications, the median SBP of the population prior to treatment was 187 mm Hg (IQR 177-199; Table 2). Treatment was initiated in 30% of patients for an SBP <180 mm Hg and in 75% for an SBP <200 mm Hg. The median time to follow-up BP check was 34 minutes (IQR 15-58). The median decrement in SBP was 20 mm Hg (IQR 5-37); however, the response to treatment was highly variable, with 2% of patients experiencing no change and 14% experiencing an increase in SBP. Seventy-nine patients (14%) had a decrement in SBP >25% following treatment.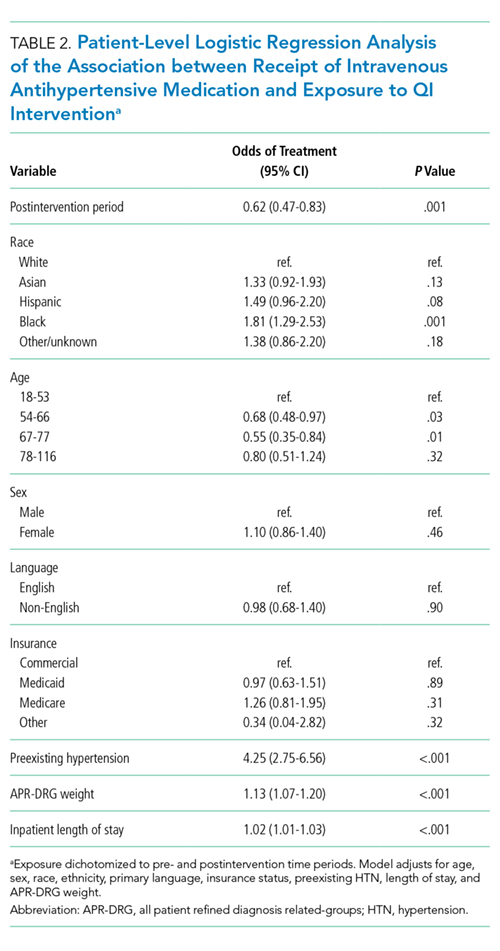
Description of Quality Improvement Results
Following the QI initiative, a total of 934 patients experienced 9,743 episodes of asymptomatic elevated blood pressure over a 4-month period (November 1, 2017 to February 28, 2018). As shown in Table 1, patients in the postintervention period had a slightly higher median age (67 [IQR 55-80] vs 69 [IQR 57-83]; P = .01), a higher median APR-DRG weight (1.34 [IQR 0.99-1.77] vs 1.48 [1.00-1.82]; P < .001), and a longer median length of stay (4.6 [2.8-8.0] days vs 5.1 [2.9-9.2] days; P = .004). There was also a higher proportion of nonEnglish speakers, fewer Black patients, and a lower proportion of preexisting HTN, in the postintervention period.
Of the 934 patients with ≥1 episode of asymptomatic elevated BP, 70 (7%) were treated with IV antihypertensive medications, with a total of 196 doses administered. The proportion of patients treated per month during the postintervention period ranged from 6% to 8%, which was the lowest of the entire study period and below the baseline average of 10% (Figure).
In a patient-level logistic regression pre-post analysis adjusting for age, sex, race, ethnicity, primary language, insurance status, preexisting HTN, length of stay, and APR-DRG weight, patients admitted to the general medicine service during the postintervention period had 38% lower odds of receiving IV antihypertensive medications than those admitted during the baseline period (OR = 0.62; 95% CI 0.47-0.83; P = .001). In this adjusted model, the following factors were independently associated with increased odds of receiving treatment: APR-DRG weight (OR 1.13; 95% CI 1.07-1.20; P < .001), Black race (OR 1.81; 95% CI 1.29-2.53; P = .001), length of stay (OR 1.02; 95% CI 1.01-1.03; P < .001), and preexisting HTN (OR 4.25; 95% CI 2.75-6.56; P < .001). Older age was associated with lower odds of treatment (Table 2).
Among patients who received treatment, there were no differences between pre- and postintervention periods in the proportion of pretreatment SBP <180 mm Hg (29% vs 32%; P = .40), 180-199 mm Hg (47% vs 40%; P = .10), or >200 mm Hg (25% vs 28%; P = .31; Table 3).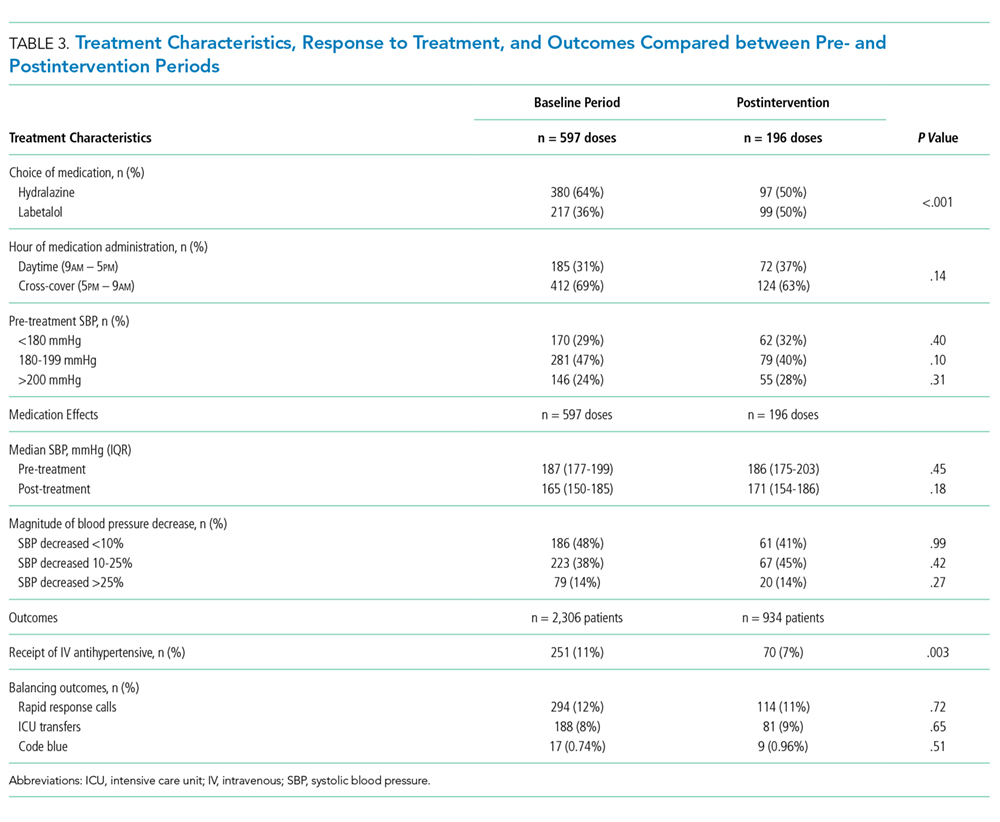
Population-level median SBP was similar between pre- and postintervention periods (167 mm Hg vs 168 mm Hg, P = .78), as were unadjusted rates of rapid response calls, ICU transfers, and code blues (Table 3). After adjustment for baseline characteristics and illness severity at the patient level, the odds of rapid response calls (OR 0.84; 95% CI 0.65-1.10; P = .21) and ICU transfers (OR 1.01; 95% CI 0.75-1.38; P = .93) did not differ between pre- and postintervention periods. A regression model was not fit for cardiopulmonary arrests due to the low absolute number of events.
CONCLUSIONS
Our results suggest that treatment of asymptomatic elevated BP using IV antihypertensive medications is common practice at our institution. We found that treatment is often initiated for only modestly elevated BPs and that the clinical response to these medications is highly variable. In the baseline period, one in seven patients experienced a decrement in BP >25% following treatment, which could potentially cause harm.11 There is no evidence, neither are there any consensus guidelines, to support the rapid reduction of BP among asymptomatic patients, making this a potential valuable opportunity for reducing unnecessary treatment, minimizing waste, and avoiding harm.
While there are a few previously published studies with similar results, we add to the existing literature by studying a larger population of more than 3,000 total patients, which was uniquely multiracial, including a high proportion of non-English speakers. Furthermore, our cohort included patients in the ICU, which is reflected in the higher-than-average APR-DRG weights. Despite being critically ill, these patients arguably still do not warrant aggressive treatment of elevated BP when asymptomatic. By excluding symptomatic BP elevations using surrogate markers for end-organ damage in addition to discharge diagnosis codes indicative of conditions in which tight BP control may be warranted, we were able to study a more critically ill patient population. We were also able to describe which baseline patient characteristics convey higher adjusted odds of receiving treatment, such as preexisting HTN, younger age, illness severity, and black race.
Perhaps most significantly, our study is the first to demonstrate an effective QI intervention aimed at reducing unnecessary utilization of IV antihypertensives. We found that this can feasibly be accomplished through a combination of educational efforts and systems changes, which could easily be replicated at other institutions. While the absolute reduction in the number of patients receiving treatment was modest, if these findings were to be widely accepted and resulted in a wide-spread change in culture, there would be a potential for greater impact.
Despite the reduction in the proportion of patients receiving IV antihypertensive medications, we found no change in the median SBP compared with the baseline period, which seems to support that the intervention was well tolerated. We also found no difference in the number of ICU transfers, rapid response calls, and cardiopulmonary arrests between groups. While these findings are both reassuring, it is impossible to draw definitive conclusions about safety given the small absolute number of patients having received treatment in each group. Fortunately, current guidelines and literature support the safety of such an intervention, as there is no existing evidence to suggest that failing to rapidly lower BP among asymptomatic patients is potentially harmful.11
There are several limitations to our study. First, by utilizing a large electronic dataset, the quality of our analyses was reliant on the accuracy of the recorded EHR data. Second, in the absence of a controlled trial or control group, we cannot say definitively that our QI initiative was the direct cause of the improved rates of IV antihypertensive utilization, though the effect did persist after adjusting for baseline characteristics in patient-level models. Third, our follow-up period was relatively short, with fewer than half as many patients as in the preintervention period. This is an important limitation, since the impact of QI interventions often diminishes over time. We plan to continually monitor IV antihypertensive use, feed those data back to our group, and revitalize educational efforts should rates begin to rise. Fourth, we were unable to directly measure which patients had true end-organ injury and instead used orders placed around the time of medication administration as a surrogate marker. While this is an imperfect measure, we feel that in cases where a provider was concerned enough to even test for end-organ injury, the use of IV antihypertensives was likely justified and was therefore appropriately excluded from the analysis. Lastly, we were limited in our ability to describe associations with true clinical outcomes, such as stroke or myocardial infarction, which could theoretically be propagated by either the use or the avoidance of IV antihypertensive medications. Fortunately, based on clinical guidelines and existing evidence, there is no reason to believe that reducing IV antihypertensive use would result in increased rates of these outcomes.
Our study reaffirms the fact that overutilization of IV antihypertensive medications among asymptomatic hospitalized patients is pervasive across hospital systems. This represents a potential target for a concerted change in culture, which we have demonstrated can be feasibly accomplished through education and systems changes.
Disclosures
Dr. Auerbach has current or pending grants from the CDC, PCORI, and FDA that are unrelated to this research manuscript. He also receives royalties from UpToDate, and received an honorarium for being editor of JHM. Dr. Jacobs received a $1,000 Resident/Fellow Travel Grant from the Society of Hospital Medicine to support the cost of travel to SHM, where he presented this research as a poster in 2018. Dr. Prasad receives money from EpiExcellence, LLC for consultation, which is unrelated to this research manuscript. All other authors have nothing to disclose.
1. Axon RN, Cousineau L, Egan BM. Prevalence and management of hypertension in the inpatient setting: A systematic review. J Hosp Med. 2011;6(7):417-422. doi: 10.1002/jhm.804. PubMed
2. Herzog E, Frankenberger O, Aziz E, et al. A novel pathway for the management of ypertension for hospitalized patients. Crit Pathw Cardiol. 2007;6(4):150-160. doi: 10.1097/HPC.0b013e318160c3a7. PubMed
3. James PA, Oparil S, Carter BL, et al. 2014 evidence-based guideline for the management of high blood pressure in adults: report from the panel members appointed to the eighth Joint National Committee (JNC 8). JAMA. 2014;311(5):507-520. doi: 10.1001/jama.2013.284427. PubMed
4. Weder AB. Treating acute hypertension in the hospital: A lacuna in the guidelines [editorial]. Hypertension. 2011;57(1):18-20. PubMed
5. Axon RN, Turner M, Buckley R. An update on inpatient hypertension management. Curr Cardiol Rep. 2015;17(11):94. doi: 10.1007/s11886-015-0648-y. PubMed
6. Marik PE, Rivera R. Hypertensive emergencies: an update. Curr Opin Crit Care. 2011;17(6):569-580. doi:10.1097/MCC.0b013e32834cd31d. PubMed
7. Cherney D, Straus S. Management of patients with hypertensive urgencies and emergencies: a systematic review of the literature. J Gen Intern Med. 2002;17(12):937-945. doi: 10.1046/j.1525-1497.2002.20389.x. PubMed
8. Padilla Ramos A, Varon J. Current and newer agents for hypertensive emergencies. Curr Hypertens Rep. 2014;16(7):450. doi: 10.1007/s11906-014-0450-z. PubMed
9. Whitworth JA, World Health Organization, International Society of Hypertension Writing Group. 2003 World Health Organization (WHO)/International Society of Hypertension (ISH) statement on management of hypertension. J Hypertens. 2003;21(11):1983-1992. doi: 10.1097/01.hjh.0000084751.37215.d2. PubMed
10. Campbell P, Baker WL, Bendel SD, White WB. Intravenous hydralazine for blood pressure management in the hospitalized patient: its use is often unjustified. J Am Soc Hypertens. 2011;5(6):473-477. doi: 10.1016/j.jash.2011.07.002. PubMed
11. Chobanian AV, Bakris GL, Black HR, et al. The Seventh Report of the Joint National Committee on Prevention, Detection, Evaluation, and Treatment of High Blood Pressure: the JNC 7 report. JAMA. 2003;289(19):2560-2572. doi: 10.1001/jama.289.19.2560. PubMed
12. Gauer R. Severe asymptomatic hypertension: Evaluation and treatment. Am Fam Physician. 2017;95(8):492-500. PubMed
13. Lipari M, Moser LR, Petrovitch EA, Farber M, Flack JM. As-needed intravenous antihypertensive therapy and blood pressure control: Antihypertensive Therapy and BP Control. J Hosp Med. 2016;11(3):193-198. doi: 10.1002/jhm.2510. PubMed
14. Gaynor MF, Wright GC, Vondracek S. Retrospective review of the use of as-needed hydralazine and labetalol for the treatment of acute hypertension in hospitalized medicine patients. Ther Adv Cardiovasc Dis. 2017;12(1):7-15. doi: 10.1177/1753944717746613. PubMed
15. Weder AB, Erickson S. Treatment of hypertension in the inpatient setting: Use of intravenous labetalol and hydralazine. J Clin Hypertens. 2010;12(1):29-33. doi: 10.1111/j.1751-7176.2009.00196.x. PubMed
16. Averill RF, Goldfield N, Hughes, JS, et al. All Patient Refined Diagnosis Related Groups (APR-DRGs) Version 20.0: Methodology Overview. Clinical Research and Documentation Departments of 3M Health Information Systems, Wallingford, Connecticut and Murray, Utah, 2003. https://www.hcup-us.ahrq.gov/. Accessed February 19, 2018.
17. Iezzoni LI, Ash AS, Shwartz M, Daley J, Hughes JS, Mackiernan YD. Predicting who dies depends on how severity is measured: Implications for evaluating patient outcomes. Ann Intern Med. 1995;123(10):763-770. PubMed
18. Romagnoli S, Ricci Z, Quattrone D, et al. Accuracy of invasive arterial pressure monitoring in cardiovascular patients: an observational study. Crit Care. 2014;18(6):644. doi: 10.1186/s13054-014-0644-4. PubMed
19. Shojania K, Grimshaw JM. Evidence-based quality improvement: The state of the science. Health Aff (Millwood). 2005;24(1):138-150. doi: 10.1377/hlthaff.24.1.138. PubMed
Elevated blood pressure (BP) is common among hospitalized adults, with prevalence estimates between 50% and 70%.1 Many factors can cause or exacerbate BP elevations in the setting of acute illness, such as pain, anxiety, medication withdrawal, and volume status, among others.2 While there are clear evidence-based recommendations for treating hypertension (HTN) in the ambulatory setting,3 guidelines for the management of elevated BP in the hospital are lacking.4,5
Hypertensive crises are generally recognized as warranting rapid reduction in BP;6-8 however, these represent the minority of cases.9,10 Far more common in the hospital are patients with asymptomatic elevated BP, a population for which there is no high-quality evidence and no guidelines supporting the use of intravenous (IV) antihypertensives.11,12 Treatment with such medications has been associated with highly variable clinical responses13-15 and may result in adverse events, such as hypotension.10
To date, only a small number of studies have investigated the treatment of asymptomatic elevated BP among hospitalized adults.10,13-15 These have suggested that IV antihypertensives are utilized frequently in this setting, often for only modestly elevated BPs; however, the studies have tended to be small, not racially diverse, and limited to noncritically ill patients. Furthermore, while it is generally accepted that reducing the use of IV antihypertensives among asymptomatic patients would have no adverse impact, to our knowledge there have been no published studies which have instituted such an initiative while measuring balancing outcomes.
The purpose of this study was to further the existing literature by defining the prevalence and effects of IV antihypertensive medication utilization among a medically complex, multiracial population of asymptomatic medical inpatients using a large electronic dataset and to evaluate the impact of a division-wide, two-tiered quality improvement (QI) initiative on the rates of IV antihypertensive utilization and patient outcomes.
METHODS
Setting
The study was conducted at the University of California, San Francisco (UCSF), an 800-bed tertiary care, academic medical center. It was approved by the UCSF Institutional Review Board. General medicine patients at UCSF are distributed between teaching and direct-care (hospitalist) services. The intensive care unit (ICU) is “open,” meaning the medicine service acts as the primary team for all nonsurgical ICU patients. This study included all adult general medicine patients admitted to UCSF Medical Center between January 1, 2017 and March 1, 2018, including those in the ICU.
Study Population and Data Collection
The UCSF Medical Center uses the electronic health record (EHR) Epic (Epic 2017, Epic Systems Corporation, Verona, Wisconsin) for all clinical care. We obtained computerized EHR data from Clarity, the relational database that stores Epic’s inpatient data in thousands of tables, including orders, medications, laboratory and radiology results, vital signs, patient demographics, and notes. We identified all adult patients hospitalized on the general medicine service with ≥1 episode of elevated BP (>160/90 mm Hg) at any point during their hospitalization who were not on a vasopressor medication at the time of the vital sign recording.
We further identified all instances in which either IV labetalol or hydralazine were administered to these patients. These two agents were chosen because they are the only IV antihypertensives used commonly at our institution for the treatment of asymptomatic elevated BP among internal medicine patients. Only those orders placed by a general medicine provider or reconciled by a general medicine provider upon transfer from another service were included. For each medication administration timestamp, we collected vital signs before and after the administration, along with the ordering provider and the clinical indication that was documented in the electronic order. To determine if a medication was administered with concern for end-organ injury, we also extracted orders that could serve as a proxy for the provider’s clinical assessment—namely electrocardiograms, serum troponins, chest x-rays, and computerized tomography scans of the head—which were placed in the one hour preceding or 15 minutes following administration of an IV antihypertensive medication.
To assess for comorbid conditions, including a preexisting diagnosis of HTN, we collected International Classification of Diseases (ICD)-9/10 diagnosis codes. Further, we also extracted All Patient Refined Diagnosis-Related Group (APR-DRG) weights, which are a standardized measure of illness severity based on relative resource consumption during hospitalization.16,17
Patients were categorized as having either “symptomatic” or “asymptomatic” elevated BP. We defined symptomatic elevated BP as having received treatment with an IV medication with provider concern for end-organ injury, as defined above. We further identified all patients in which tight BP control may be clinically indicated on the basis of the presence of any of the following ICD-9/10 diagnosis codes at the time of hospital discharge: myocardial infarction, ischemic stroke, intracranial hemorrhage, subarachnoid hemorrhage, subdural hematoma, aortic dissection, hypertensive emergency, or hypertensive encephalopathy. All patients with symptomatic elevated BP or any of the above ICD-9/10 diagnoses were excluded from the analysis, since administration of IV antihypertensive medications would plausibly be warranted in these clinical scenarios.
The encounter numbers from the dataset were used to link to patient demographic data, which included age, sex, race, ethnicity, primary language, and insurance status. Finally, we identified all instances of rapid response calls, ICU transfers, and code blues (cardiopulmonary arrests) for each patient in the dataset.
Blood Pressure Measurements
BP data were collected from invasive BP (IBP) monitoring devices and noninvasive BP cuffs. For patients with BP measurements recorded concomitantly from both IBP (ie, arterial lines) in addition to noninvasive BP cuffs, the arterial line reading was favored. All systolic BP (SBP) readings >240 mm Hg from arterial lines were excluded, as this has previously been described as the upper physiologic limit for IBP readings.18
Primary Outcome
The primary outcome for the study was the proportion of patients treated with IV antihypertensive medications (labetalol or hydralazine). Using aggregate data, we calculated the number of patients who were treated at least once with an IV antihypertensive in a given month (numerator), divided by the number of patients with ≥1 episode of asymptomatic elevated BP that month (denominator). The denominator was considered to be the population of patients “at risk” of being treated with IV antihypertensive medications. For patients with multiple admissions during the study period, each admission was considered separately. These results are displayed in the upper portion of the run chart (Figure).
Secondary Outcomes
To investigate blood pressure trends over time, we analyzed BP in three ways. First, we analyzed the median SBP for the entire population. Second, to determine clinical responses to IV antihypertensive medications among patients receiving treatment, we calculated the population medians for the pretreatment SBP, the change in SBP from pretreatment baseline, and the posttreatment SBP. Third, we calculated the average median SBP on a monthly basis for the duration of the study. This was achieved by calculating the median value of all SBPs for an individual patient, then averaging across all patients in a given month. The average monthly median SBPs are displayed in the lower portion of the Figure.
To investigate whether the intervention was associated with negative patient outcomes, the proportions of several balancing outcomes were compared between pre- and postintervention periods, including ICU transfers, rapid response calls, and code blues (cardiopulmonary arrests).
Development and Implementation of an Intervention to Reduce Excessive IV Antihypertensive Use
After establishing the baseline prevalence of IV antihypertensive medication use at our institution, we developed a QI initiative with the goal of reducing IV antihypertensive medication utilization by the general medicine service for the treatment of asymptomatic patients. We hypothesized that potential contributors to overutilization might include lack of education, provider/nursing discomfort, and a system designed to mandate provider notification for even modestly elevated BPs. The QI initiative, which took place between October 2017 and December 2017, was designed to address these potential contributors and was comprised of a division-wide, two-tiered, bundled intervention. Our choice of a two-tiered approach was based on the fact that successful culture change is challenging, along with the existing evidence that multifaceted QI interventions are more often successful than single-tiered approaches.19
The first tier of the initiative included an educational campaign referred to colloquially as “NoIVForHighBP,” which targeted residents, hospitalists, and nursing staff. The campaign consisted of a series of presentations, best practice updates, handouts, and posters displayed prominently in shared workspaces. The educational content focused on alternative approaches to the management of asymptomatic elevated BP in the hospital, such as identification and treatment of pain, anxiety, volume overload, or other contributing factors (see supplemental materials). These educational outreaches occurred periodically between October 4, 2017 and November 20, 2017, with the bulk of the educational efforts taking place during November. Therefore, November 1, 2017 was designated the start date for the intervention period.
The second tier of the intervention included the liberalization of the EHR BP notification parameters on the standard inpatient admission order set from >160/90 mm Hg to >180/90 mm Hg. This change took effect on 12/6/2017. The decision to modify the BP notification parameters was based on the hypothesis that mandatory notifications for modestly elevated BPs may prompt providers to reflexively order IV antihypertensive medications, especially during times of cross-coverage or high clinical workload.
Statistical Analysis
All statistical analyses were performed using Stata software version 15 (StataCorp. 2017. Stata Statistical Software: Release 15. College Station, Texas: StataCorp LLC). Baseline patient characteristics were compared using nonparametric tests of significance. Population median SBPs were compared between pre- and postintervention periods using Mood’s Median Test, which was selected because the data were distributed nonnormally, and variances between samples were unequal.
Among patients treated with IV antihypertensive medications, we compared the proportion of pretreatment SBPs falling into each of three specified ranges (SBP <180 mm Hg, SBP 180-199 mm Hg, and SBP >200 mm Hg) between baseline and intervention periods using chi-squared tests.
Using aggregate data, we compared the unadjusted proportion of patients treated with IV antihypertensive medications between pre- and postintervention periods using a chi-squared test. Next, using patient-level data, a logistic regression analysis was performed to examine the association between receipt of IV antihypertensive medications and time (dichotomized between pre- and postintervention periods) while adjusting for age, sex, race, ethnicity, primary language, insurance status, preexisting HTN, length of stay, and APR-DRG weight.
Rates of balancing outcomes were compared using chi-squared tests. A logistic regression analysis using patient-level data was also performed to investigate the association between each of these outcomes and the intervention period (pre vs post) while adjusting for age, sex, race, ethnicity, primary language, insurance status, preexisting HTN, length of stay, and APR-DRG weight.
RESULTS
Baseline Period
We identified 2,306 patients with ≥1 episode of asymptomatic elevated BP during the 10-month preintervention period. Patients on average experienced 9 episodes of elevated BP per hospitalization, representing 21,207 potential opportunities for treatment. Baseline characteristics are summarized in Table 1. In general, this represents an older population that was medically complex and multiracial.
Of these patients, 251 (11%) received IV hydralazine and/or labetalol at least once during their hospitalization, with a total of 597 doses administered. Among those treated, a median of 2 doses were given per patient (IQR: 1-4), 64% of which were hydralazine. The majority (380 [64%]) were ordered on an “as needed” basis, while 217 (36%) were administered as a one-time dose. Three-quarters of all doses were ordered by the teaching service (456 [76%]), with the remaining 24% ordered by the direct-care (hospitalist) service.
During the baseline period among patients receiving IV antihypertensive medications, the median SBP of the population prior to treatment was 187 mm Hg (IQR 177-199; Table 2). Treatment was initiated in 30% of patients for an SBP <180 mm Hg and in 75% for an SBP <200 mm Hg. The median time to follow-up BP check was 34 minutes (IQR 15-58). The median decrement in SBP was 20 mm Hg (IQR 5-37); however, the response to treatment was highly variable, with 2% of patients experiencing no change and 14% experiencing an increase in SBP. Seventy-nine patients (14%) had a decrement in SBP >25% following treatment.
Description of Quality Improvement Results
Following the QI initiative, a total of 934 patients experienced 9,743 episodes of asymptomatic elevated blood pressure over a 4-month period (November 1, 2017 to February 28, 2018). As shown in Table 1, patients in the postintervention period had a slightly higher median age (67 [IQR 55-80] vs 69 [IQR 57-83]; P = .01), a higher median APR-DRG weight (1.34 [IQR 0.99-1.77] vs 1.48 [1.00-1.82]; P < .001), and a longer median length of stay (4.6 [2.8-8.0] days vs 5.1 [2.9-9.2] days; P = .004). There was also a higher proportion of nonEnglish speakers, fewer Black patients, and a lower proportion of preexisting HTN, in the postintervention period.
Of the 934 patients with ≥1 episode of asymptomatic elevated BP, 70 (7%) were treated with IV antihypertensive medications, with a total of 196 doses administered. The proportion of patients treated per month during the postintervention period ranged from 6% to 8%, which was the lowest of the entire study period and below the baseline average of 10% (Figure).
In a patient-level logistic regression pre-post analysis adjusting for age, sex, race, ethnicity, primary language, insurance status, preexisting HTN, length of stay, and APR-DRG weight, patients admitted to the general medicine service during the postintervention period had 38% lower odds of receiving IV antihypertensive medications than those admitted during the baseline period (OR = 0.62; 95% CI 0.47-0.83; P = .001). In this adjusted model, the following factors were independently associated with increased odds of receiving treatment: APR-DRG weight (OR 1.13; 95% CI 1.07-1.20; P < .001), Black race (OR 1.81; 95% CI 1.29-2.53; P = .001), length of stay (OR 1.02; 95% CI 1.01-1.03; P < .001), and preexisting HTN (OR 4.25; 95% CI 2.75-6.56; P < .001). Older age was associated with lower odds of treatment (Table 2).
Among patients who received treatment, there were no differences between pre- and postintervention periods in the proportion of pretreatment SBP <180 mm Hg (29% vs 32%; P = .40), 180-199 mm Hg (47% vs 40%; P = .10), or >200 mm Hg (25% vs 28%; P = .31; Table 3).
Population-level median SBP was similar between pre- and postintervention periods (167 mm Hg vs 168 mm Hg, P = .78), as were unadjusted rates of rapid response calls, ICU transfers, and code blues (Table 3). After adjustment for baseline characteristics and illness severity at the patient level, the odds of rapid response calls (OR 0.84; 95% CI 0.65-1.10; P = .21) and ICU transfers (OR 1.01; 95% CI 0.75-1.38; P = .93) did not differ between pre- and postintervention periods. A regression model was not fit for cardiopulmonary arrests due to the low absolute number of events.
CONCLUSIONS
Our results suggest that treatment of asymptomatic elevated BP using IV antihypertensive medications is common practice at our institution. We found that treatment is often initiated for only modestly elevated BPs and that the clinical response to these medications is highly variable. In the baseline period, one in seven patients experienced a decrement in BP >25% following treatment, which could potentially cause harm.11 There is no evidence, neither are there any consensus guidelines, to support the rapid reduction of BP among asymptomatic patients, making this a potential valuable opportunity for reducing unnecessary treatment, minimizing waste, and avoiding harm.
While there are a few previously published studies with similar results, we add to the existing literature by studying a larger population of more than 3,000 total patients, which was uniquely multiracial, including a high proportion of non-English speakers. Furthermore, our cohort included patients in the ICU, which is reflected in the higher-than-average APR-DRG weights. Despite being critically ill, these patients arguably still do not warrant aggressive treatment of elevated BP when asymptomatic. By excluding symptomatic BP elevations using surrogate markers for end-organ damage in addition to discharge diagnosis codes indicative of conditions in which tight BP control may be warranted, we were able to study a more critically ill patient population. We were also able to describe which baseline patient characteristics convey higher adjusted odds of receiving treatment, such as preexisting HTN, younger age, illness severity, and black race.
Perhaps most significantly, our study is the first to demonstrate an effective QI intervention aimed at reducing unnecessary utilization of IV antihypertensives. We found that this can feasibly be accomplished through a combination of educational efforts and systems changes, which could easily be replicated at other institutions. While the absolute reduction in the number of patients receiving treatment was modest, if these findings were to be widely accepted and resulted in a wide-spread change in culture, there would be a potential for greater impact.
Despite the reduction in the proportion of patients receiving IV antihypertensive medications, we found no change in the median SBP compared with the baseline period, which seems to support that the intervention was well tolerated. We also found no difference in the number of ICU transfers, rapid response calls, and cardiopulmonary arrests between groups. While these findings are both reassuring, it is impossible to draw definitive conclusions about safety given the small absolute number of patients having received treatment in each group. Fortunately, current guidelines and literature support the safety of such an intervention, as there is no existing evidence to suggest that failing to rapidly lower BP among asymptomatic patients is potentially harmful.11
There are several limitations to our study. First, by utilizing a large electronic dataset, the quality of our analyses was reliant on the accuracy of the recorded EHR data. Second, in the absence of a controlled trial or control group, we cannot say definitively that our QI initiative was the direct cause of the improved rates of IV antihypertensive utilization, though the effect did persist after adjusting for baseline characteristics in patient-level models. Third, our follow-up period was relatively short, with fewer than half as many patients as in the preintervention period. This is an important limitation, since the impact of QI interventions often diminishes over time. We plan to continually monitor IV antihypertensive use, feed those data back to our group, and revitalize educational efforts should rates begin to rise. Fourth, we were unable to directly measure which patients had true end-organ injury and instead used orders placed around the time of medication administration as a surrogate marker. While this is an imperfect measure, we feel that in cases where a provider was concerned enough to even test for end-organ injury, the use of IV antihypertensives was likely justified and was therefore appropriately excluded from the analysis. Lastly, we were limited in our ability to describe associations with true clinical outcomes, such as stroke or myocardial infarction, which could theoretically be propagated by either the use or the avoidance of IV antihypertensive medications. Fortunately, based on clinical guidelines and existing evidence, there is no reason to believe that reducing IV antihypertensive use would result in increased rates of these outcomes.
Our study reaffirms the fact that overutilization of IV antihypertensive medications among asymptomatic hospitalized patients is pervasive across hospital systems. This represents a potential target for a concerted change in culture, which we have demonstrated can be feasibly accomplished through education and systems changes.
Disclosures
Dr. Auerbach has current or pending grants from the CDC, PCORI, and FDA that are unrelated to this research manuscript. He also receives royalties from UpToDate, and received an honorarium for being editor of JHM. Dr. Jacobs received a $1,000 Resident/Fellow Travel Grant from the Society of Hospital Medicine to support the cost of travel to SHM, where he presented this research as a poster in 2018. Dr. Prasad receives money from EpiExcellence, LLC for consultation, which is unrelated to this research manuscript. All other authors have nothing to disclose.
1. Axon RN, Cousineau L, Egan BM. Prevalence and management of hypertension in the inpatient setting: A systematic review. J Hosp Med. 2011;6(7):417-422. doi: 10.1002/jhm.804. PubMed
2. Herzog E, Frankenberger O, Aziz E, et al. A novel pathway for the management of ypertension for hospitalized patients. Crit Pathw Cardiol. 2007;6(4):150-160. doi: 10.1097/HPC.0b013e318160c3a7. PubMed
3. James PA, Oparil S, Carter BL, et al. 2014 evidence-based guideline for the management of high blood pressure in adults: report from the panel members appointed to the eighth Joint National Committee (JNC 8). JAMA. 2014;311(5):507-520. doi: 10.1001/jama.2013.284427. PubMed
4. Weder AB. Treating acute hypertension in the hospital: A lacuna in the guidelines [editorial]. Hypertension. 2011;57(1):18-20. PubMed
5. Axon RN, Turner M, Buckley R. An update on inpatient hypertension management. Curr Cardiol Rep. 2015;17(11):94. doi: 10.1007/s11886-015-0648-y. PubMed
6. Marik PE, Rivera R. Hypertensive emergencies: an update. Curr Opin Crit Care. 2011;17(6):569-580. doi:10.1097/MCC.0b013e32834cd31d. PubMed
7. Cherney D, Straus S. Management of patients with hypertensive urgencies and emergencies: a systematic review of the literature. J Gen Intern Med. 2002;17(12):937-945. doi: 10.1046/j.1525-1497.2002.20389.x. PubMed
8. Padilla Ramos A, Varon J. Current and newer agents for hypertensive emergencies. Curr Hypertens Rep. 2014;16(7):450. doi: 10.1007/s11906-014-0450-z. PubMed
9. Whitworth JA, World Health Organization, International Society of Hypertension Writing Group. 2003 World Health Organization (WHO)/International Society of Hypertension (ISH) statement on management of hypertension. J Hypertens. 2003;21(11):1983-1992. doi: 10.1097/01.hjh.0000084751.37215.d2. PubMed
10. Campbell P, Baker WL, Bendel SD, White WB. Intravenous hydralazine for blood pressure management in the hospitalized patient: its use is often unjustified. J Am Soc Hypertens. 2011;5(6):473-477. doi: 10.1016/j.jash.2011.07.002. PubMed
11. Chobanian AV, Bakris GL, Black HR, et al. The Seventh Report of the Joint National Committee on Prevention, Detection, Evaluation, and Treatment of High Blood Pressure: the JNC 7 report. JAMA. 2003;289(19):2560-2572. doi: 10.1001/jama.289.19.2560. PubMed
12. Gauer R. Severe asymptomatic hypertension: Evaluation and treatment. Am Fam Physician. 2017;95(8):492-500. PubMed
13. Lipari M, Moser LR, Petrovitch EA, Farber M, Flack JM. As-needed intravenous antihypertensive therapy and blood pressure control: Antihypertensive Therapy and BP Control. J Hosp Med. 2016;11(3):193-198. doi: 10.1002/jhm.2510. PubMed
14. Gaynor MF, Wright GC, Vondracek S. Retrospective review of the use of as-needed hydralazine and labetalol for the treatment of acute hypertension in hospitalized medicine patients. Ther Adv Cardiovasc Dis. 2017;12(1):7-15. doi: 10.1177/1753944717746613. PubMed
15. Weder AB, Erickson S. Treatment of hypertension in the inpatient setting: Use of intravenous labetalol and hydralazine. J Clin Hypertens. 2010;12(1):29-33. doi: 10.1111/j.1751-7176.2009.00196.x. PubMed
16. Averill RF, Goldfield N, Hughes, JS, et al. All Patient Refined Diagnosis Related Groups (APR-DRGs) Version 20.0: Methodology Overview. Clinical Research and Documentation Departments of 3M Health Information Systems, Wallingford, Connecticut and Murray, Utah, 2003. https://www.hcup-us.ahrq.gov/. Accessed February 19, 2018.
17. Iezzoni LI, Ash AS, Shwartz M, Daley J, Hughes JS, Mackiernan YD. Predicting who dies depends on how severity is measured: Implications for evaluating patient outcomes. Ann Intern Med. 1995;123(10):763-770. PubMed
18. Romagnoli S, Ricci Z, Quattrone D, et al. Accuracy of invasive arterial pressure monitoring in cardiovascular patients: an observational study. Crit Care. 2014;18(6):644. doi: 10.1186/s13054-014-0644-4. PubMed
19. Shojania K, Grimshaw JM. Evidence-based quality improvement: The state of the science. Health Aff (Millwood). 2005;24(1):138-150. doi: 10.1377/hlthaff.24.1.138. PubMed
© 2019 Society of Hospital Medicine
Electronic Order Volume as a Meaningful Component in Estimating Patient Complexity and Resident Physician Workload
Resident physician workload has traditionally been measured by patient census.1,2 However, census and other volume-based metrics such as daily admissions may not accurately reflect workload due to variation in patient complexity. Relative value units (RVUs) are another commonly used marker of workload, but the validity of this metric relies on accurate coding, usually done by the attending physician, and is less directly related to resident physician workload. Because much of hospital-based medicine is mediated through the electronic health record (EHR), which can capture differences in patient complexity,3 electronic records could be harnessed to more comprehensively describe residents’ work. Current government estimates indicate that several hundred companies offer certified EHRs, thanks in large part to the Health Information Technology for Economic and Clinical Health (HITECH) Act of 2009, which aimed to promote adoption and meaningful use of health information technology.4, 5 These systems can collect important data about the usage and operating patterns of physicians, which may provide an insight into workload.6-8
Accurately measuring workload is important because of the direct link that has been drawn between physician workload and quality metrics. In a study of attending hospitalists, higher workload, as measured by patient census and RVUs, was associated with longer lengths of stay and higher costs of hospitalization.9 Another study among medical residents found that as daily admissions increased, length of stay, cost, and inpatient mortality appeared to rise.10 Although these studies used only volume-based workload metrics, the implication that high workload may negatively impact patient care hints at a possible trade-off between the two that should inform discussions of physician productivity.
In the current study, we examine whether data obtained from the EHR, particularly electronic order volume, could provide valuable information, in addition to patient volume, about resident physician workload. We first tested the feasibility and validity of using electronic order volume as an important component of clinical workload by examining the relationship between electronic order volume and well-established factors that are likely to increase the workload of residents, including patient level of care and severity of illness. Then, using order volume as a marker for workload, we sought to describe whether higher order volumes were associated with two discharge-related quality metrics, completion of a high-quality after-visit summary and timely discharge summary, postulating that quality metrics may suffer when residents are busier.
METHODS
Study Design and Setting
We performed a single-center retrospective cohort study of patients admitted to the internal medicine service at the University of California, San Francisco (UCSF) Medical Center between May 1, 2015 and July 31, 2016. UCSF is a 600-bed academic medical center, and the inpatient internal medicine teaching service manages an average daily census of 80-90 patients. Medicine teams care for patients on the general acute-care wards, the step-down units (for patients with higher acuity of care), and also patients in the intensive care unit (ICU). ICU patients are comanaged by general medicine teams and intensive care teams; internal medicine teams enter all electronic orders for ICU patients, except for orders for respiratory care or sedating medications. The inpatient internal medicine teaching service comprises eight teams each supervised by an attending physician, a senior resident (in the second or third year of residency training), two interns, and a third- and/or fourth-year medical student. Residents place all clinical orders and complete all clinical documentation through the EHR (Epic Systems, Verona, Wisconsin).11 Typically, the bulk of the orders and documentation, including discharge documentation, is performed by interns; however, the degree of senior resident involvement in these tasks is variable and team-dependent. In addition to the eight resident teams, there are also four attending hospitalist-only internal medicine teams, who manage a service of ~30-40 patients.
Study Population
Our study population comprised all hospitalized adults admitted to the eight resident-run teams on the internal medicine teaching service. Patients cared for by hospitalist-only teams were not included in this analysis. Because the focus of our study was on hospitalizations, individual patients may have been included multiple times over the course of the study. Hospitalizations were excluded if they did not have complete Medicare Severity-Diagnosis Related Group (MS-DRG) data,12 since this was used as our severity of illness marker. This occurred either because patients were not discharged by the end of the study period or because they had a length of stay of less than one day, because this metric was not assigned to these short-stay (observation) patients.
Data Collection
All electronic orders placed during the study period were obtained by extracting data from Epic’s Clarity database. Our EHR allows for the use of order sets; each order in these sets was counted individually, so that an order set with several orders would not be identified as one order. We identified the time and date that the order was placed, the ordering physician, the identity of the patient for which the order was placed, and the location of the patient when the order was placed, to determine the level of care (ICU, step-down, or general medicine unit). To track the composite volume of orders placed by resident teams, we matched each ordering physician to his or her corresponding resident team using our physician scheduling database, Amion (Spiral Software). We obtained team census by tabulating the total number of patients that a single resident team placed orders on over the course of a given calendar day. From billing data, we identified the MS-DRG weight that was assigned at the end of each hospitalization. Finally, we collected data on adherence to two discharge-related quality metrics to determine whether increased order volume was associated with decreased rates of adherence to these metrics. Using departmental patient-level quality improvement data, we determined whether each metric was met on discharge at the patient level. We also extracted patient-level demographic data, including age, sex, and insurance status, from this departmental quality improvement database.
Discharge Quality Outcome Metrics
We hypothesized that as the total daily electronic orders of a resident team increased, the rate of completion of two discharge-related quality metrics would decline due to the greater time constraints placed on the teams. The first metric we used was the completion of a high-quality after-visit summary (AVS), which has been described by the Centers for Medicare and Medicaid Services as part of its Meaningful Use Initiative.13 It was selected by the residents in our program as a particularly high-priority quality metric. Our institution specifically defines a “high-quality” AVS as including the following three components: a principal hospital problem, patient instructions, and follow-up information. The second discharge-related quality metric was the completion of a timely discharge summary, another measure recognized as a critical component in high-quality care.14 To be considered timely, the discharge summary had to be filed no later than 24 hours after the discharge order was entered into the EHR. This metric was more recently tracked by the internal medicine department and was not selected by the residents as a high-priority metric.
Statistical Analysis
To examine how the order volume per day changed throughout each sequential day of hospital admission, mean orders per hospital day with 95% CIs were plotted. We performed an aggregate analysis of all orders placed for each patient per day across three different levels of care (ICU, step-down, and general medicine). For each day of the study period, we summed all orders for all patients according to their location and divided by the number of total patients in each location to identify the average number of orders written for an ICU, step-down, and general medicine patient that day. We then calculated the mean daily orders for an ICU, step-down, and general medicine patient over the entire study period. We used ANOVA to test for statistically significant differences between the mean daily orders between these locations.
To examine the relationship between severity of illness and order volume, we performed an unadjusted patient-level analysis of orders per patient in the first three days of each hospitalization and stratified the data by the MS-DRG payment weight, which we divided into four quartiles. For each quartile, we calculated the mean number of orders placed in the first three days of admission and used ANOVA to test for statistically significant differences. We restricted the orders to the first three days of hospitalization instead of calculating mean orders per day of hospitalization because we postulated that the majority of orders were entered in these first few days and that with increasing length of stay (which we expected to occur with higher MS-DRG weight), the order volume becomes highly variable, which would tend to skew the mean orders per day.
We used multivariable logistic regression to determine whether the volume of electronic orders on the day of a given patient’s discharge, and also on the day before a given patient’s discharge, was a significant predictor of receiving a high-quality AVS. We adjusted for team census on the day of discharge, MS-DRG weight, age, sex, and insurance status. We then conducted a separate analysis of the association between electronic order volume and likelihood of completing a timely discharge summary among patients where discharge summary data were available. Logistic regression for each case was performed independently, so that team orders on the day prior to a patient’s discharge were not included in the model for the relationship between team orders on the day of a patient’s discharge and the discharge-related quality metric of interest, and vice versa, since including both in the model would be potentially disruptive given that orders on the day before and day of a patient’s discharge are likely correlated.
We also performed a subanalysis in which we restricted orders to only those placed during the daytime hours (7
IRB Approval
The study was approved by the UCSF Institutional Review Board and was granted a waiver of informed consent.
RESULTS
Population
We identified 7,296 eligible hospitalizations during the study period. After removing hospitalizations according to our exclusion criteria (Figure 1), there were 5,032 hospitalizations that were used in the analysis for which a total of 929,153 orders were written. The vast majority of patients received at least one order per day; fewer than 1% of encounter-days had zero associated orders. The top 10 discharge diagnoses identified in the cohort are listed in Appendix Table 1. A breakdown of orders by order type, across the entire cohort, is displayed in Appendix Table 2. The mean number of orders per patient per day of hospitalization is plotted in the Appendix Figure, which indicates that the number of orders is highest on the day of admission, decreases significantly after the first few days, and becomes increasingly variable with longer lengths of stay.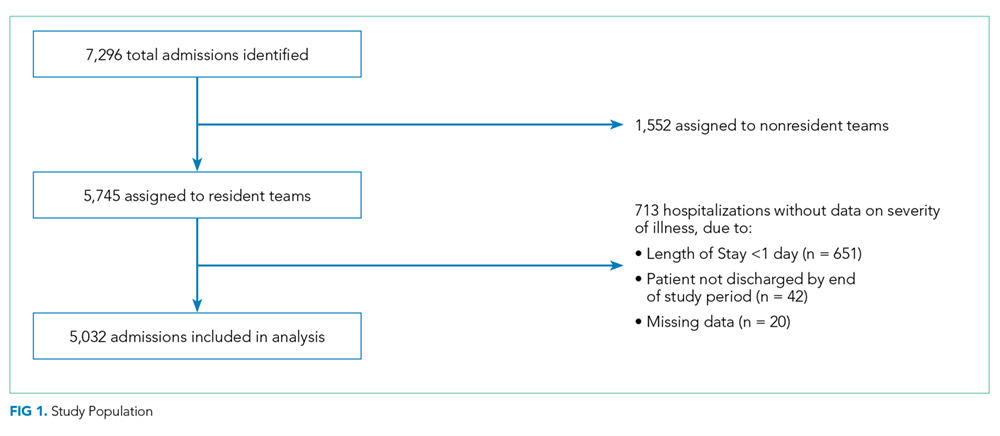
Patient Level of Care and Severity of Illness Metrics
Patients at a higher level of care had, on average, more orders entered per day. The mean order frequency was 40 orders per day for an ICU patient (standard deviation [SD] 13, range 13-134), 24 for a step-down patient (SD 6, range 11-48), and 19 for a general medicine unit patient (SD 3, range 10-31). The difference in mean daily orders was statistically significant (P < .001, Figure 2a).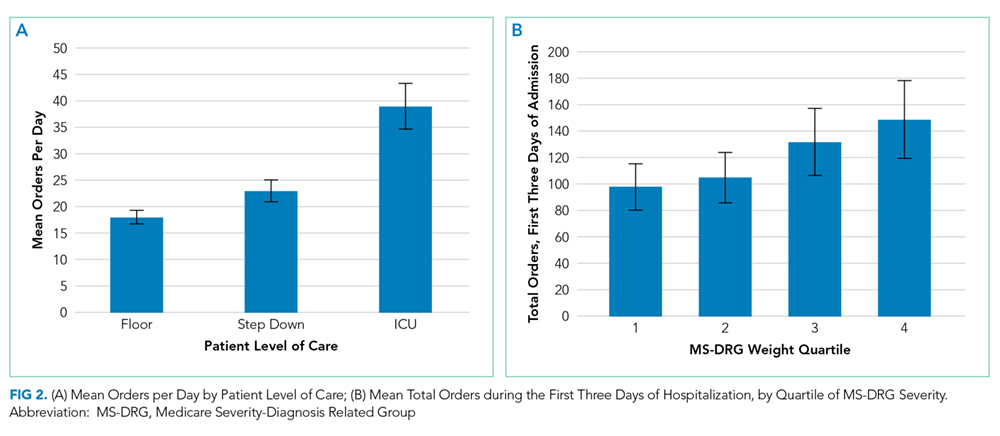
Orders also correlated with increasing severity of illness. Patients in the lowest quartile of MS-DRG weight received, on average, 98 orders in the first three days of hospitalization (SD 35, range 2-349), those in the second quartile received 105 orders (SD 38, range 10-380), those in the third quartile received 132 orders (SD 51, range 17-436), and those in the fourth and highest quartile received 149 orders (SD 59, range 32-482). Comparisons between each of these severity of illness categories were significant (P < .001, Figure 2b).
Discharge-Related Quality Metrics
The median number of orders per internal medicine team per day was 343 (IQR 261- 446). Of the 5,032 total discharged patients, 3,657 (73%) received a high-quality AVS on discharge. After controlling for team census, severity of illness, and demographic factors, there was no statistically significant association between total orders on the day of discharge and odds of receiving a high-quality AVS (OR 1.01; 95% CI 0.96-1.06), or between team orders placed the day prior to discharge and odds of receiving a high-quality AVS (OR 0.99; 95% CI 0.95-1.04; Table 1). When we restricted our analysis to orders placed during daytime hours (7 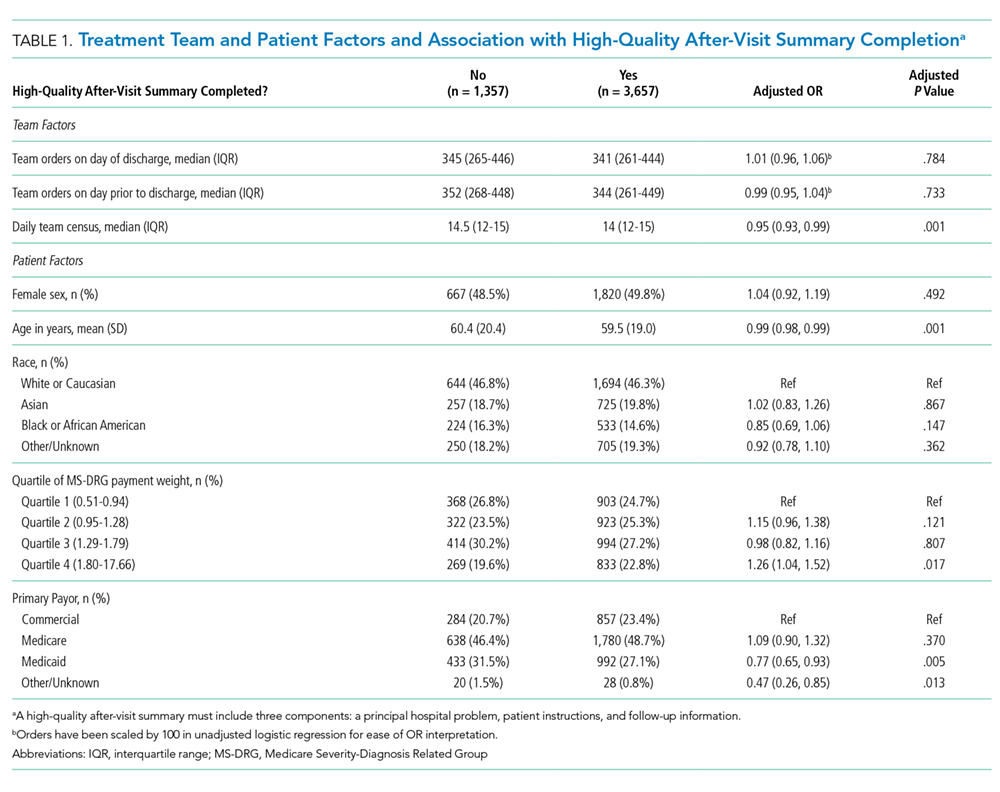
There were 3,835 patients for whom data on timing of discharge summary were available. Of these, 3,455 (91.2%) had a discharge summary completed within 24 hours. After controlling for team census, severity of illness, and demographic factors, there was no statistically significant association between total orders placed by the team on a patient’s day of discharge and odds of receiving a timely discharge summary (OR 0.96; 95% CI 0.88-1.05). However, patients were 12% less likely to receive a timely discharge summary for every 100 extra orders the team placed on the day prior to discharge (OR 0.88, 95% CI 0.82-0.95). Patients who received a timely discharge summary were cared for by teams who placed a median of 345 orders the day prior to their discharge, whereas those that did not receive a timely discharge summary were cared for by teams who placed a significantly higher number of orders (375) on the day prior to discharge (Table 2). When we restricted our analysis to only daytime orders, there were no significant changes in the findings (OR 1.00; 95% CI 0.88-1.14 for orders on the day of discharge; OR 0.84; 95% CI 0.75-0.95 for orders on the day prior to discharge).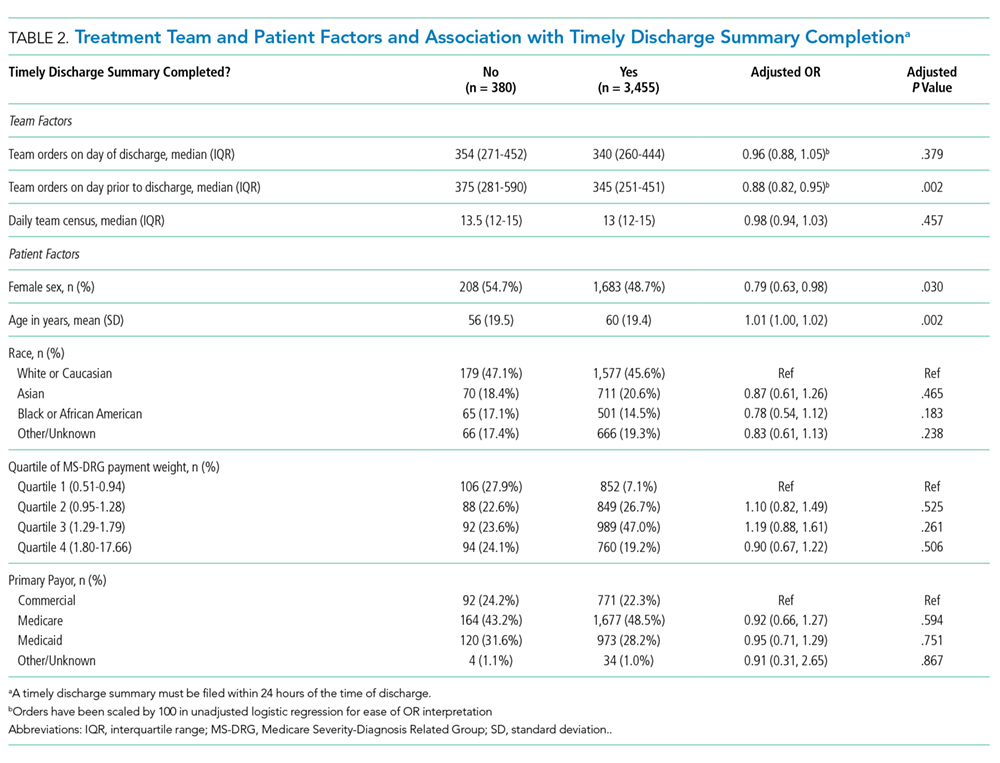
DISCUSSION
We found that electronic order volume may be a marker for patient complexity, which encompasses both level of care and severity of illness, and could be a marker of resident physician workload that harnesses readily available data from an EHR. Recent time-motion studies of internal medicine residents indicate that the majority of trainees’ time is spent on computers, engaged in indirect patient care activities such as reading electronic charts, entering electronic orders, and writing computerized notes.15-18 Capturing these tasks through metrics such as electronic order volume, as we did in this study, can provide valuable insights into resident physician workflow.
We found that ICU patients received more than twice as many orders per day than did general acute care-level patients. Furthermore, we found that patients whose hospitalizations fell into the highest MS-DRG weight quartile received approximately 50% more orders during the first three days of admission compared to that of patients whose hospitalizations fell into the lowest quartile. This strong association indicates that electronic order volume could provide meaningful additional information, in concert with other factors such as census, to describe resident physician workload.
We did not find that our workload measure was significantly associated with high-quality AVS completion. There are several possible explanations for this finding. First, adherence to this quality metric may be independent of workload, possibly because it is highly prioritized by residents at our institution. Second, adherence may only be impacted at levels of workload greater than what was experienced by the residents in our study. Finally, electronic order volume may not encompass enough of total workload to be reliably representative of resident work. However, the tight correlation between electronic order volume with severity of illness and level of care, in conjunction with the finding that patients were less likely to receive a timely discharge summary when workload was high on the day prior to a patient’s discharge, suggests that electronic order volume does indeed encompass a meaningful component of workload, and that with higher workload, adherence to some quality metrics may decline. We found that patients who received a timely discharge summary were discharged by teams who entered 30 fewer orders on the day before discharge compared with patients who did not receive a timely discharge summary. In addition to being statistically significant, it is also likely that this difference is clinically significant, although a determination of clinical significance is outside the scope of this study. Further exploration into the relationship between order volume and other quality metrics that are perhaps more sensitive to workload would be interesting.
The primary strength of our study is in how it demonstrates that EHRs can be harnessed to provide additional insights into clinical workload in a quantifiable and automated manner. Although there are a wide range of EHRs currently in use across the country, the capability to track electronic orders is common and could therefore be used broadly across institutions, with tailoring and standardization specific to each site. This technique is similar to that used by prior investigators who characterized the workload of pediatric residents by orders entered and notes written in the electronic medical record.19 However, our study is unique, in that we explored the relationship between electronic order volume and patient-level severity metrics as well as discharge-related quality metrics.
Our study is limited by several factors. When conceptualizing resident workload, several other elements that contribute to a sense of “busyness” may be independent of electronic orders and were not measured in our study.20 These include communication factors (such as language discordance, discussion with consulting services, and difficult end-of-life discussions), environmental factors (such as geographic localization), resident physician team factors (such as competing clinical or educational responsibilities), timing (in terms of day of week as well as time of year, since residents in July likely feel “busier” than residents in May), and ultimate discharge destination for patients (those going to a skilled nursing facility may require discharge documentation more urgently). Additionally, we chose to focus on the workload of resident teams, as represented by team orders, as opposed to individual work, which may be more directly correlated to our outcomes of interest, completion of a high-quality AVS, and timely discharge summary, which are usually performed by individuals.
Furthermore, we did not measure the relationship between our objective measure of workload and clinical endpoints. Instead, we chose to focus on process measures because they are less likely to be confounded by clinical factors independent of physician workload.21 Future studies should also consider obtaining direct resident-level measures of “busyness” or burnout, or other resident-centered endpoints, such as whether residents left the hospital at times consistent with duty hour regulations or whether they were able to attend educational conferences.
These limitations pose opportunities for further efforts to more comprehensively characterize clinical workload. Additional research is needed to understand and quantify the impact of patient, physician, and environmental factors that are not reflected by electronic order volume. Furthermore, an exploration of other electronic surrogates for clinical workload, such as paging volume and other EHR-derived data points, could also prove valuable in further describing the clinical workload. Future studies should also examine whether there is a relationship between these novel markers of workload and further outcomes, including both process measures and clinical endpoints.
CONCLUSIONS
Electronic order volume may provide valuable additional information for estimating the workload of resident physicians caring for hospitalized patients. Further investigation to determine whether the statistically significant differences identified in this study are clinically significant, how the technique used in this work may be applied to different EHRs, an examination of other EHR-derived metrics that may represent workload, and an exploration of additional patient-centered outcomes may be warranted.
Disclosures
Rajkomar reports personal fees from Google LLC, outside the submitted work. Dr. Khanna reports that during the conduct of the study, his salary, and the development of CareWeb (a communication platform that includes a smartphone-based paging application in use in several inpatient clinical units at University of California, San Francisco [UCSF] Medical Center) were supported by funding from the Center for Digital Health Innovation at UCSF. The CareWeb software has been licensed by Voalte.
Disclaimer
The views expressed in the submitted article are of the authors and not an official position of the institution.
1. Lurie JD, Wachter RM. Hospitalist staffing requirements. Eff Clin Pract. 1999;2(3):126-30. PubMed
2. Wachter RM. Hospitalist workload: The search for the magic number. JAMA Intern Med. 2014;174(5):794-795. doi: 10.1001/jamainternmed.2014.18. PubMed
3. Adler-Milstein J, DesRoches CM, Kralovec P, et al. Electronic health record adoption in US hospitals: progress continues, but challenges persist. Health Aff (Millwood). 2015;34(12):2174-2180. doi: 10.1377/hlthaff.2015.0992. PubMed
4. The Office of the National Coordinator for Health Information Technology, Health IT Dashboard. [cited 2018 April 4]. https://dashboard.healthit.gov/quickstats/quickstats.php Accessed June 28, 2018.
5. Index for Excerpts from the American Recovery and Reinvestment Act of 2009. Health Information Technology (HITECH) Act 2009. p. 112-164.
6. van der Sijs H, Aarts J, Vulto A, Berg M. Overriding of drug safety alerts in computerized physician order entry. J Am Med Inform Assoc. 2006;13(2):138-147. doi: 10.1197/jamia.M1809. PubMed
7. Ancker JS, Kern LM1, Edwards A, et al. How is the electronic health record being used? Use of EHR data to assess physician-level variability in technology use. J Am Med Inform Assoc. 2014;21(6):1001-1008. doi: 10.1136/amiajnl-2013-002627. PubMed
8. Hendey GW, Barth BE, Soliz T. Overnight and postcall errors in medication orders. Acad Emerg Med. 2005;12(7):629-634. doi: 10.1197/j.aem.2005.02.009. PubMed
9. Elliott DJ, Young RS2, Brice J3, Aguiar R4, Kolm P. Effect of hospitalist workload on the quality and efficiency of care. JAMA Intern Med. 2014;174(5):786-793. doi: 10.1001/jamainternmed.2014.300. PubMed
10. Ong M, Bostrom A, Vidyarthi A, McCulloch C, Auerbach A. House staff team workload and organization effects on patient outcomes in an academic general internal medicine inpatient service. Arch Intern Med. 2007;167(1):47-52. doi: 10.1001/archinte.167.1.47. PubMed
11. Epic Systems. [cited 2017 March 28]; Available from: http://www.epic.com/. Accessed June 28, 2018.
12. MS-DRG Classifications and software. https://www.cms.gov/Medicare/Medicare-Fee-for-Service-Payment/AcuteInpatientPPS/MS-DRG-Classifications-and-Software.html. Accessed June 28, 2018.
13. Hummel J, Evans P. Providing Clinical Summaries to Patients after Each Office Visit: A Technical Guide. [cited 2017 March 27]. https://www.healthit.gov/sites/default/files/measure-tools/avs-tech-guide.pdf. Accessed June 28, 2018.
14. Haycock M, Stuttaford L, Ruscombe-King O, Barker Z, Callaghan K, Davis T. Improving the percentage of electronic discharge summaries completed within 24 hours of discharge. BMJ Qual Improv Rep. 2014;3(1) pii: u205963.w2604. doi: 10.1136/bmjquality.u205963.w2604. PubMed
15. Block L, Habicht R, Wu AW, et al. In the wake of the 2003 and 2011 duty hours regulations, how do internal medicine interns spend their time? J Gen Intern Med. 2013;28(8):1042-1047. doi: 10.1007/s11606-013-2376-6. PubMed
16. Wenger N, Méan M, Castioni J, Marques-Vidal P, Waeber G, Garnier A. Allocation of internal medicine resident time in a Swiss hospital: a time and motion study of day and evening shifts. Ann Intern Med. 2017;166(8):579-586. doi: 10.7326/M16-2238. PubMed
17. Mamykina L, Vawdrey DK, Hripcsak G. How do residents spend their shift time? A time and motion study with a particular focus on the use of computers. Acad Med. 2016;91(6):827-832. doi: 10.1097/ACM.0000000000001148. PubMed
18. Fletcher KE, Visotcky AM, Slagle JM, Tarima S, Weinger MB, Schapira MM. The composition of intern work while on call. J Gen Intern Med. 2012;27(11):1432-1437. doi: 10.1007/s11606-012-2120-7. PubMed
19. Was A, Blankenburg R, Park KT. Pediatric resident workload intensity and variability. Pediatrics 2016;138(1):e20154371. doi: 10.1542/peds.2015-4371. PubMed
20. Michtalik HJ, Pronovost PJ, Marsteller JA, Spetz J, Brotman DJ. Developing a model for attending physician workload and outcomes. JAMA Intern Med. 2013;173(11):1026-1028. doi: 10.1001/jamainternmed.2013.405. PubMed
21. Mant J. Process versus outcome indicators in the assessment of quality of health care. Int J Qual Health Care. 2001;13(6):475-480. doi: 10.1093/intqhc/13.6.475. PubMed
Resident physician workload has traditionally been measured by patient census.1,2 However, census and other volume-based metrics such as daily admissions may not accurately reflect workload due to variation in patient complexity. Relative value units (RVUs) are another commonly used marker of workload, but the validity of this metric relies on accurate coding, usually done by the attending physician, and is less directly related to resident physician workload. Because much of hospital-based medicine is mediated through the electronic health record (EHR), which can capture differences in patient complexity,3 electronic records could be harnessed to more comprehensively describe residents’ work. Current government estimates indicate that several hundred companies offer certified EHRs, thanks in large part to the Health Information Technology for Economic and Clinical Health (HITECH) Act of 2009, which aimed to promote adoption and meaningful use of health information technology.4, 5 These systems can collect important data about the usage and operating patterns of physicians, which may provide an insight into workload.6-8
Accurately measuring workload is important because of the direct link that has been drawn between physician workload and quality metrics. In a study of attending hospitalists, higher workload, as measured by patient census and RVUs, was associated with longer lengths of stay and higher costs of hospitalization.9 Another study among medical residents found that as daily admissions increased, length of stay, cost, and inpatient mortality appeared to rise.10 Although these studies used only volume-based workload metrics, the implication that high workload may negatively impact patient care hints at a possible trade-off between the two that should inform discussions of physician productivity.
In the current study, we examine whether data obtained from the EHR, particularly electronic order volume, could provide valuable information, in addition to patient volume, about resident physician workload. We first tested the feasibility and validity of using electronic order volume as an important component of clinical workload by examining the relationship between electronic order volume and well-established factors that are likely to increase the workload of residents, including patient level of care and severity of illness. Then, using order volume as a marker for workload, we sought to describe whether higher order volumes were associated with two discharge-related quality metrics, completion of a high-quality after-visit summary and timely discharge summary, postulating that quality metrics may suffer when residents are busier.
METHODS
Study Design and Setting
We performed a single-center retrospective cohort study of patients admitted to the internal medicine service at the University of California, San Francisco (UCSF) Medical Center between May 1, 2015 and July 31, 2016. UCSF is a 600-bed academic medical center, and the inpatient internal medicine teaching service manages an average daily census of 80-90 patients. Medicine teams care for patients on the general acute-care wards, the step-down units (for patients with higher acuity of care), and also patients in the intensive care unit (ICU). ICU patients are comanaged by general medicine teams and intensive care teams; internal medicine teams enter all electronic orders for ICU patients, except for orders for respiratory care or sedating medications. The inpatient internal medicine teaching service comprises eight teams each supervised by an attending physician, a senior resident (in the second or third year of residency training), two interns, and a third- and/or fourth-year medical student. Residents place all clinical orders and complete all clinical documentation through the EHR (Epic Systems, Verona, Wisconsin).11 Typically, the bulk of the orders and documentation, including discharge documentation, is performed by interns; however, the degree of senior resident involvement in these tasks is variable and team-dependent. In addition to the eight resident teams, there are also four attending hospitalist-only internal medicine teams, who manage a service of ~30-40 patients.
Study Population
Our study population comprised all hospitalized adults admitted to the eight resident-run teams on the internal medicine teaching service. Patients cared for by hospitalist-only teams were not included in this analysis. Because the focus of our study was on hospitalizations, individual patients may have been included multiple times over the course of the study. Hospitalizations were excluded if they did not have complete Medicare Severity-Diagnosis Related Group (MS-DRG) data,12 since this was used as our severity of illness marker. This occurred either because patients were not discharged by the end of the study period or because they had a length of stay of less than one day, because this metric was not assigned to these short-stay (observation) patients.
Data Collection
All electronic orders placed during the study period were obtained by extracting data from Epic’s Clarity database. Our EHR allows for the use of order sets; each order in these sets was counted individually, so that an order set with several orders would not be identified as one order. We identified the time and date that the order was placed, the ordering physician, the identity of the patient for which the order was placed, and the location of the patient when the order was placed, to determine the level of care (ICU, step-down, or general medicine unit). To track the composite volume of orders placed by resident teams, we matched each ordering physician to his or her corresponding resident team using our physician scheduling database, Amion (Spiral Software). We obtained team census by tabulating the total number of patients that a single resident team placed orders on over the course of a given calendar day. From billing data, we identified the MS-DRG weight that was assigned at the end of each hospitalization. Finally, we collected data on adherence to two discharge-related quality metrics to determine whether increased order volume was associated with decreased rates of adherence to these metrics. Using departmental patient-level quality improvement data, we determined whether each metric was met on discharge at the patient level. We also extracted patient-level demographic data, including age, sex, and insurance status, from this departmental quality improvement database.
Discharge Quality Outcome Metrics
We hypothesized that as the total daily electronic orders of a resident team increased, the rate of completion of two discharge-related quality metrics would decline due to the greater time constraints placed on the teams. The first metric we used was the completion of a high-quality after-visit summary (AVS), which has been described by the Centers for Medicare and Medicaid Services as part of its Meaningful Use Initiative.13 It was selected by the residents in our program as a particularly high-priority quality metric. Our institution specifically defines a “high-quality” AVS as including the following three components: a principal hospital problem, patient instructions, and follow-up information. The second discharge-related quality metric was the completion of a timely discharge summary, another measure recognized as a critical component in high-quality care.14 To be considered timely, the discharge summary had to be filed no later than 24 hours after the discharge order was entered into the EHR. This metric was more recently tracked by the internal medicine department and was not selected by the residents as a high-priority metric.
Statistical Analysis
To examine how the order volume per day changed throughout each sequential day of hospital admission, mean orders per hospital day with 95% CIs were plotted. We performed an aggregate analysis of all orders placed for each patient per day across three different levels of care (ICU, step-down, and general medicine). For each day of the study period, we summed all orders for all patients according to their location and divided by the number of total patients in each location to identify the average number of orders written for an ICU, step-down, and general medicine patient that day. We then calculated the mean daily orders for an ICU, step-down, and general medicine patient over the entire study period. We used ANOVA to test for statistically significant differences between the mean daily orders between these locations.
To examine the relationship between severity of illness and order volume, we performed an unadjusted patient-level analysis of orders per patient in the first three days of each hospitalization and stratified the data by the MS-DRG payment weight, which we divided into four quartiles. For each quartile, we calculated the mean number of orders placed in the first three days of admission and used ANOVA to test for statistically significant differences. We restricted the orders to the first three days of hospitalization instead of calculating mean orders per day of hospitalization because we postulated that the majority of orders were entered in these first few days and that with increasing length of stay (which we expected to occur with higher MS-DRG weight), the order volume becomes highly variable, which would tend to skew the mean orders per day.
We used multivariable logistic regression to determine whether the volume of electronic orders on the day of a given patient’s discharge, and also on the day before a given patient’s discharge, was a significant predictor of receiving a high-quality AVS. We adjusted for team census on the day of discharge, MS-DRG weight, age, sex, and insurance status. We then conducted a separate analysis of the association between electronic order volume and likelihood of completing a timely discharge summary among patients where discharge summary data were available. Logistic regression for each case was performed independently, so that team orders on the day prior to a patient’s discharge were not included in the model for the relationship between team orders on the day of a patient’s discharge and the discharge-related quality metric of interest, and vice versa, since including both in the model would be potentially disruptive given that orders on the day before and day of a patient’s discharge are likely correlated.
We also performed a subanalysis in which we restricted orders to only those placed during the daytime hours (7
IRB Approval
The study was approved by the UCSF Institutional Review Board and was granted a waiver of informed consent.
RESULTS
Population
We identified 7,296 eligible hospitalizations during the study period. After removing hospitalizations according to our exclusion criteria (Figure 1), there were 5,032 hospitalizations that were used in the analysis for which a total of 929,153 orders were written. The vast majority of patients received at least one order per day; fewer than 1% of encounter-days had zero associated orders. The top 10 discharge diagnoses identified in the cohort are listed in Appendix Table 1. A breakdown of orders by order type, across the entire cohort, is displayed in Appendix Table 2. The mean number of orders per patient per day of hospitalization is plotted in the Appendix Figure, which indicates that the number of orders is highest on the day of admission, decreases significantly after the first few days, and becomes increasingly variable with longer lengths of stay.
Patient Level of Care and Severity of Illness Metrics
Patients at a higher level of care had, on average, more orders entered per day. The mean order frequency was 40 orders per day for an ICU patient (standard deviation [SD] 13, range 13-134), 24 for a step-down patient (SD 6, range 11-48), and 19 for a general medicine unit patient (SD 3, range 10-31). The difference in mean daily orders was statistically significant (P < .001, Figure 2a).
Orders also correlated with increasing severity of illness. Patients in the lowest quartile of MS-DRG weight received, on average, 98 orders in the first three days of hospitalization (SD 35, range 2-349), those in the second quartile received 105 orders (SD 38, range 10-380), those in the third quartile received 132 orders (SD 51, range 17-436), and those in the fourth and highest quartile received 149 orders (SD 59, range 32-482). Comparisons between each of these severity of illness categories were significant (P < .001, Figure 2b).
Discharge-Related Quality Metrics
The median number of orders per internal medicine team per day was 343 (IQR 261- 446). Of the 5,032 total discharged patients, 3,657 (73%) received a high-quality AVS on discharge. After controlling for team census, severity of illness, and demographic factors, there was no statistically significant association between total orders on the day of discharge and odds of receiving a high-quality AVS (OR 1.01; 95% CI 0.96-1.06), or between team orders placed the day prior to discharge and odds of receiving a high-quality AVS (OR 0.99; 95% CI 0.95-1.04; Table 1). When we restricted our analysis to orders placed during daytime hours (7
There were 3,835 patients for whom data on timing of discharge summary were available. Of these, 3,455 (91.2%) had a discharge summary completed within 24 hours. After controlling for team census, severity of illness, and demographic factors, there was no statistically significant association between total orders placed by the team on a patient’s day of discharge and odds of receiving a timely discharge summary (OR 0.96; 95% CI 0.88-1.05). However, patients were 12% less likely to receive a timely discharge summary for every 100 extra orders the team placed on the day prior to discharge (OR 0.88, 95% CI 0.82-0.95). Patients who received a timely discharge summary were cared for by teams who placed a median of 345 orders the day prior to their discharge, whereas those that did not receive a timely discharge summary were cared for by teams who placed a significantly higher number of orders (375) on the day prior to discharge (Table 2). When we restricted our analysis to only daytime orders, there were no significant changes in the findings (OR 1.00; 95% CI 0.88-1.14 for orders on the day of discharge; OR 0.84; 95% CI 0.75-0.95 for orders on the day prior to discharge).
DISCUSSION
We found that electronic order volume may be a marker for patient complexity, which encompasses both level of care and severity of illness, and could be a marker of resident physician workload that harnesses readily available data from an EHR. Recent time-motion studies of internal medicine residents indicate that the majority of trainees’ time is spent on computers, engaged in indirect patient care activities such as reading electronic charts, entering electronic orders, and writing computerized notes.15-18 Capturing these tasks through metrics such as electronic order volume, as we did in this study, can provide valuable insights into resident physician workflow.
We found that ICU patients received more than twice as many orders per day than did general acute care-level patients. Furthermore, we found that patients whose hospitalizations fell into the highest MS-DRG weight quartile received approximately 50% more orders during the first three days of admission compared to that of patients whose hospitalizations fell into the lowest quartile. This strong association indicates that electronic order volume could provide meaningful additional information, in concert with other factors such as census, to describe resident physician workload.
We did not find that our workload measure was significantly associated with high-quality AVS completion. There are several possible explanations for this finding. First, adherence to this quality metric may be independent of workload, possibly because it is highly prioritized by residents at our institution. Second, adherence may only be impacted at levels of workload greater than what was experienced by the residents in our study. Finally, electronic order volume may not encompass enough of total workload to be reliably representative of resident work. However, the tight correlation between electronic order volume with severity of illness and level of care, in conjunction with the finding that patients were less likely to receive a timely discharge summary when workload was high on the day prior to a patient’s discharge, suggests that electronic order volume does indeed encompass a meaningful component of workload, and that with higher workload, adherence to some quality metrics may decline. We found that patients who received a timely discharge summary were discharged by teams who entered 30 fewer orders on the day before discharge compared with patients who did not receive a timely discharge summary. In addition to being statistically significant, it is also likely that this difference is clinically significant, although a determination of clinical significance is outside the scope of this study. Further exploration into the relationship between order volume and other quality metrics that are perhaps more sensitive to workload would be interesting.
The primary strength of our study is in how it demonstrates that EHRs can be harnessed to provide additional insights into clinical workload in a quantifiable and automated manner. Although there are a wide range of EHRs currently in use across the country, the capability to track electronic orders is common and could therefore be used broadly across institutions, with tailoring and standardization specific to each site. This technique is similar to that used by prior investigators who characterized the workload of pediatric residents by orders entered and notes written in the electronic medical record.19 However, our study is unique, in that we explored the relationship between electronic order volume and patient-level severity metrics as well as discharge-related quality metrics.
Our study is limited by several factors. When conceptualizing resident workload, several other elements that contribute to a sense of “busyness” may be independent of electronic orders and were not measured in our study.20 These include communication factors (such as language discordance, discussion with consulting services, and difficult end-of-life discussions), environmental factors (such as geographic localization), resident physician team factors (such as competing clinical or educational responsibilities), timing (in terms of day of week as well as time of year, since residents in July likely feel “busier” than residents in May), and ultimate discharge destination for patients (those going to a skilled nursing facility may require discharge documentation more urgently). Additionally, we chose to focus on the workload of resident teams, as represented by team orders, as opposed to individual work, which may be more directly correlated to our outcomes of interest, completion of a high-quality AVS, and timely discharge summary, which are usually performed by individuals.
Furthermore, we did not measure the relationship between our objective measure of workload and clinical endpoints. Instead, we chose to focus on process measures because they are less likely to be confounded by clinical factors independent of physician workload.21 Future studies should also consider obtaining direct resident-level measures of “busyness” or burnout, or other resident-centered endpoints, such as whether residents left the hospital at times consistent with duty hour regulations or whether they were able to attend educational conferences.
These limitations pose opportunities for further efforts to more comprehensively characterize clinical workload. Additional research is needed to understand and quantify the impact of patient, physician, and environmental factors that are not reflected by electronic order volume. Furthermore, an exploration of other electronic surrogates for clinical workload, such as paging volume and other EHR-derived data points, could also prove valuable in further describing the clinical workload. Future studies should also examine whether there is a relationship between these novel markers of workload and further outcomes, including both process measures and clinical endpoints.
CONCLUSIONS
Electronic order volume may provide valuable additional information for estimating the workload of resident physicians caring for hospitalized patients. Further investigation to determine whether the statistically significant differences identified in this study are clinically significant, how the technique used in this work may be applied to different EHRs, an examination of other EHR-derived metrics that may represent workload, and an exploration of additional patient-centered outcomes may be warranted.
Disclosures
Rajkomar reports personal fees from Google LLC, outside the submitted work. Dr. Khanna reports that during the conduct of the study, his salary, and the development of CareWeb (a communication platform that includes a smartphone-based paging application in use in several inpatient clinical units at University of California, San Francisco [UCSF] Medical Center) were supported by funding from the Center for Digital Health Innovation at UCSF. The CareWeb software has been licensed by Voalte.
Disclaimer
The views expressed in the submitted article are of the authors and not an official position of the institution.
1. Lurie JD, Wachter RM. Hospitalist staffing requirements. Eff Clin Pract. 1999;2(3):126-30. PubMed
2. Wachter RM. Hospitalist workload: The search for the magic number. JAMA Intern Med. 2014;174(5):794-795. doi: 10.1001/jamainternmed.2014.18. PubMed
3. Adler-Milstein J, DesRoches CM, Kralovec P, et al. Electronic health record adoption in US hospitals: progress continues, but challenges persist. Health Aff (Millwood). 2015;34(12):2174-2180. doi: 10.1377/hlthaff.2015.0992. PubMed
4. The Office of the National Coordinator for Health Information Technology, Health IT Dashboard. [cited 2018 April 4]. https://dashboard.healthit.gov/quickstats/quickstats.php Accessed June 28, 2018.
5. Index for Excerpts from the American Recovery and Reinvestment Act of 2009. Health Information Technology (HITECH) Act 2009. p. 112-164.
6. van der Sijs H, Aarts J, Vulto A, Berg M. Overriding of drug safety alerts in computerized physician order entry. J Am Med Inform Assoc. 2006;13(2):138-147. doi: 10.1197/jamia.M1809. PubMed
7. Ancker JS, Kern LM1, Edwards A, et al. How is the electronic health record being used? Use of EHR data to assess physician-level variability in technology use. J Am Med Inform Assoc. 2014;21(6):1001-1008. doi: 10.1136/amiajnl-2013-002627. PubMed
8. Hendey GW, Barth BE, Soliz T. Overnight and postcall errors in medication orders. Acad Emerg Med. 2005;12(7):629-634. doi: 10.1197/j.aem.2005.02.009. PubMed
9. Elliott DJ, Young RS2, Brice J3, Aguiar R4, Kolm P. Effect of hospitalist workload on the quality and efficiency of care. JAMA Intern Med. 2014;174(5):786-793. doi: 10.1001/jamainternmed.2014.300. PubMed
10. Ong M, Bostrom A, Vidyarthi A, McCulloch C, Auerbach A. House staff team workload and organization effects on patient outcomes in an academic general internal medicine inpatient service. Arch Intern Med. 2007;167(1):47-52. doi: 10.1001/archinte.167.1.47. PubMed
11. Epic Systems. [cited 2017 March 28]; Available from: http://www.epic.com/. Accessed June 28, 2018.
12. MS-DRG Classifications and software. https://www.cms.gov/Medicare/Medicare-Fee-for-Service-Payment/AcuteInpatientPPS/MS-DRG-Classifications-and-Software.html. Accessed June 28, 2018.
13. Hummel J, Evans P. Providing Clinical Summaries to Patients after Each Office Visit: A Technical Guide. [cited 2017 March 27]. https://www.healthit.gov/sites/default/files/measure-tools/avs-tech-guide.pdf. Accessed June 28, 2018.
14. Haycock M, Stuttaford L, Ruscombe-King O, Barker Z, Callaghan K, Davis T. Improving the percentage of electronic discharge summaries completed within 24 hours of discharge. BMJ Qual Improv Rep. 2014;3(1) pii: u205963.w2604. doi: 10.1136/bmjquality.u205963.w2604. PubMed
15. Block L, Habicht R, Wu AW, et al. In the wake of the 2003 and 2011 duty hours regulations, how do internal medicine interns spend their time? J Gen Intern Med. 2013;28(8):1042-1047. doi: 10.1007/s11606-013-2376-6. PubMed
16. Wenger N, Méan M, Castioni J, Marques-Vidal P, Waeber G, Garnier A. Allocation of internal medicine resident time in a Swiss hospital: a time and motion study of day and evening shifts. Ann Intern Med. 2017;166(8):579-586. doi: 10.7326/M16-2238. PubMed
17. Mamykina L, Vawdrey DK, Hripcsak G. How do residents spend their shift time? A time and motion study with a particular focus on the use of computers. Acad Med. 2016;91(6):827-832. doi: 10.1097/ACM.0000000000001148. PubMed
18. Fletcher KE, Visotcky AM, Slagle JM, Tarima S, Weinger MB, Schapira MM. The composition of intern work while on call. J Gen Intern Med. 2012;27(11):1432-1437. doi: 10.1007/s11606-012-2120-7. PubMed
19. Was A, Blankenburg R, Park KT. Pediatric resident workload intensity and variability. Pediatrics 2016;138(1):e20154371. doi: 10.1542/peds.2015-4371. PubMed
20. Michtalik HJ, Pronovost PJ, Marsteller JA, Spetz J, Brotman DJ. Developing a model for attending physician workload and outcomes. JAMA Intern Med. 2013;173(11):1026-1028. doi: 10.1001/jamainternmed.2013.405. PubMed
21. Mant J. Process versus outcome indicators in the assessment of quality of health care. Int J Qual Health Care. 2001;13(6):475-480. doi: 10.1093/intqhc/13.6.475. PubMed
It all just clicks: Development of an inpatient e-consult program
Electronic consultation (e-consult) in the outpatient setting allows subspecialists to provide assessment and recommendations for patients without in-person visits.1 An e-consult is an asynchronous communication that uses the electronic medical record (EMR) and typically involves an electronic order from a requesting provider and an electronic note from a consulting provider. The initial motivation for developing this consultation modality was to improve access to subspecialty care for patients in the primary care setting, and findings of studies at several sites support this claim.1-4 In addition, e-consult may also reduce cost because converting unnecessary face-to-face encounters into e-consults reduces patients’ travel costs and healthcare organizations’ expensive subspecialty clinic time.3,5 Moreover, instead of addressing less complex clinical questions in informal, undocumented face-to-face or telephone “curbside” consultations with specialists, providers can instead ask for e-consults and thereby ensure thorough chart review and proper documentation.6
Use of e-consults in the inpatient setting is relatively novel.7 In addition to having the advantages already mentioned, e-consults are faster than in-person bedside consultations and may be beneficial in the fast-moving inpatient care setting. Finally, healthcare systems with multiple hospital sites may not have the capacity to physically locate subspecialists at each site, which makes e-consults attractive for avoiding unnecessary travel time.
In this article, we describe how we developed an inpatient e-consult protocol for a new, remote hospital within our healthcare system and explore data on safety and physician attitudes after e-consult implementation.
METHODS
The Institutional Review Board of the University of California San Francisco (UCSF) approved this study.
Setting
In February 2015, UCSF opened a new hospital in the Mission Bay neighborhood of San Francisco, 4 miles from the existing hospital. The new hospital is home to several adult inpatient services: urology, otolaryngology, colorectal surgery, obstetrics, and gynecologic surgery. A hospitalist is on-site 24 hours a day to provide consultation for these services around issues that relate to internal medicine. A hospitalist who requires subspecialty expertise to answer a clinical question can request a consultation by in-person visit, video telemedicine, or e-consult, each of which is available 24/7. Almost all of the medicine subspecialists work on the existing campus, not in Mission Bay.
Protocol Development and Implementation
The protocol for the e-consult program was developed over several months by an interdisciplinary group that included 3 hospitalists, 1 obstetrician, 1 project manager, and 1 informaticist. The group outlined the process for requesting and completing an e-consult (Figure), designed a note template for consultants to use for EMR documentation, conducted outreach with subspecialty groups to discuss the protocol, and developed an EMR report to track e-consult use and content over time. As our medical center does not bill payers for inpatient e-consults, e-consult note tracking is used to provide reimbursement internally, from the medical center to the respective departments of the consultants. Reimbursement is made at a set rate per e-consult note, with the rate set to approximate the reimbursement of a low-acuity in-person consult on the main campus.

The workflow of an e-consult is as follows: (1) Whe
Evaluation
Each month, we tracked e-consult use using an EMR report built as part of the implementation of the program. For the first four months of implementation, every patient who received an e-consult also had a manual chart review of the period around the e-consult, performed by a hospitalist, in order to audit for any potential safety issues. These issues included, for example, an e-consult performed for a patient whose complexity or severity of illness was felt to be too great to defer an in-person visit, or a patient who received e-consult recommendations that were significantly retracted in a follow-up in-person note.
Eight months after the program started, we assessed experience by electronically surveying the 9 hospitalists and 11 consultants who had requested or performed at least 2 e-consults.8 Survey items were measured on a 5-point Likert scale: strongly disagree to strongly agree. The items, which related to ease of calling for a consultation, quality of e-consults, impact on clinical care, safety concerns, and satisfaction, were inspired by themes identified in a systematic review of the literature on e-consults in the outpatient setting.2 We sent 2 reminders to responders. Data were summarized using descriptive statistics. Analysis was performed in SPSS version 22.0 (IBM).
RESULTS
There were 143 initial subspecialty consultations by e-consult between program launch in February 2015 and manuscript preparation in February 2016, an average of 11 e-consults per month. There were 313 total e-consult notes (these included both initial and follow-up e-consult notes). By comparison, 240 initial in-person consultations occurred during the same period, and there were 435 total in-person consultation notes (46% new or initial notes, 54% follow-up notes). The top 5 subspecialties by volume of e-consults were infectious disease (35%), hematology (20%), endocrinology (14%), nephrology (13%), and cardiology (8%). For reference, e-consults are also available from psychiatry, neurology, oncology, gastroenterology, pulmonology, and rheumatology. Percentage of consultations performed during daytime hours (defined as 8 a.m. to 5 p.m.) was 92% for e-consults and 96% for in-person consultations.
There were no e-consult–related patient safety issues reported through the medical center’s incident reporting system during the study period. There were also no patient safety issues identified in the manual audits of 80 charts during the first 4 months of the program.
Seven (78%) of 9 hospitalists and 7 (64%) of 11 consultants completed the survey. Both groups agreed that e-consults were easy to use and efficient (Table). All hospitalists were satisfied with the quality of e-consult recommendations, but only 3 (43%) of the 7 consultants agreed they could provide high-quality consultation by e-consult. In their comments, 2 consultants expressed concerns. One concern was about missing crucial information by performing only a chart review, and the other was about being tempted to perform an e-consult simply because it is expedient.

DISCUSSION
Although use of e-consults in the outpatient setting is relatively commonplace, our program represents a novel use of e-consults in safely and efficiently providing subspecialty consultation to inpatients at a remote hospital.
For hospitalists, an e-consult system offers numerous benefits. Clinical questions beyond an internists’ scope of practice come up often, and simple questions might traditionally result in an informal curbside consult. While a curbside consult provides answers faster than an in-person visit, it creates risks for the requesting hospitalists: the consultants only know what they are told, whether the information is incomplete or erroneous; their opinions are given without documentation or compensation, which reduces a sense of accountability; and the lack of documentation does not allow their advice to persist in the chart as a reference for future providers.9 Our e-consult program solves these problems by requiring that consultants perform chart review and provide documentation as well as obligating the medical center to pay a small compensation to consultants for their time. We hope this lowers the bar to requesting consultation for remote sites, where the alternative would be burdensome travel time to do an in-person visit.
In our study, hospitalists were universally pleased with the quality of e-consult recommendations, but only 43% of consultants agreed. These findings correlate with the literature on e-consults in the outpatient setting.2 Unfortunately, our survey comments did not shed further light on this sentiment. In the outpatient literature, consultants were most concerned with having a clear clinical question, facing the liability of providing recommendations without performing an examination, and receiving appropriate compensation for answering e-consults.
The generalizability of our program findings is limited most significantly by the particular arrangement of our clinical services: Our remote site is home to a select group of adult inpatient services, a hospitalist is available on-site for these services 24 hours a day, and the distance to the remote site can be overcome with modest effort should a patient require an in-person visit in the initial or follow-up period. The generalizability of our safety findings is limited by the use of a single reviewer for chart auditing.
Given the rise of accountable care organizations and the prevalence of hospital mergers in the healthcare landscape, we believe that healthcare systems that operate remote sites under constrained budgets could look to e-consults to more cost-effectively extend subspecialty expertise across the inpatient enterprise. With improvements in health information exchange, it may also become feasible for consultants to offer e-consults to hospitals outside a medical center’s network. Our study showed that inpatient e-consult programs can be developed and implemented, that they appear not to pose any significant safety issues, and that they can facilitate delivery of timely clinical care.
Acknowledgment
The authors thank Raphaela Levy-Moore for creating and implementing the e-consult note template for our electronic medical record.
Disclosure
Nothing to report.
1. Chen AH, Murphy EJ, Yee HF Jr. eReferral—a new model for integrated care. N Engl J Med. 2013;368(26):2450-2453. PubMed
2. Vimalananda VG, Gupte G, Seraj SM, et al. Electronic consultations (e-consults) to improve access to specialty care: a systematic review and narrative synthesis. J Telemed Telecare. 2015;21(6):323-330. PubMed
3. Kirsh S, Carey E, Aron DC, et al. Impact of a national specialty e-consultation implementation project on access. Am J Manag Care. 2015;21(12):e648-e654. PubMed
4. Bergman J, Neuhausen K, Chamie K, et al. Building a medical neighborhood in the safety net: an innovative technology improves hematuria workups. Urology. 2013;82(6):1277-1282. PubMed
5. Wasfy JH, Rao SK, Chittle MD, Gallen KM, Isselbacher EM, Ferris TG. Initial results of a cardiac e-consult pilot program. J Am Coll Cardiol. 2014;64(24):2706-2707. PubMed
6. Perley CM. Physician use of the curbside consultation to address information needs: report on a collective case study. J Med Libr Assoc. 2006;94(2):137-144. PubMed
7. Gupte G, Vimalananda V, Simon SR, DeVito K, Clark J, Orlander JD. Disruptive innovation: implementation of electronic consultations in a Veterans Affairs health care system. JMIR Med Inform. 2016;4(1):e6. PubMed
8. REDCap. Vanderbilt University website. http://www.project-redcap.org. 2015. Accessed March 3, 2016.
9. Burden M, Sarcone E, Keniston A, et al. Prospective comparison of curbside versus formal consultations. J Hosp Med. 2013;8(1):31-35. PubMed
Electronic consultation (e-consult) in the outpatient setting allows subspecialists to provide assessment and recommendations for patients without in-person visits.1 An e-consult is an asynchronous communication that uses the electronic medical record (EMR) and typically involves an electronic order from a requesting provider and an electronic note from a consulting provider. The initial motivation for developing this consultation modality was to improve access to subspecialty care for patients in the primary care setting, and findings of studies at several sites support this claim.1-4 In addition, e-consult may also reduce cost because converting unnecessary face-to-face encounters into e-consults reduces patients’ travel costs and healthcare organizations’ expensive subspecialty clinic time.3,5 Moreover, instead of addressing less complex clinical questions in informal, undocumented face-to-face or telephone “curbside” consultations with specialists, providers can instead ask for e-consults and thereby ensure thorough chart review and proper documentation.6
Use of e-consults in the inpatient setting is relatively novel.7 In addition to having the advantages already mentioned, e-consults are faster than in-person bedside consultations and may be beneficial in the fast-moving inpatient care setting. Finally, healthcare systems with multiple hospital sites may not have the capacity to physically locate subspecialists at each site, which makes e-consults attractive for avoiding unnecessary travel time.
In this article, we describe how we developed an inpatient e-consult protocol for a new, remote hospital within our healthcare system and explore data on safety and physician attitudes after e-consult implementation.
METHODS
The Institutional Review Board of the University of California San Francisco (UCSF) approved this study.
Setting
In February 2015, UCSF opened a new hospital in the Mission Bay neighborhood of San Francisco, 4 miles from the existing hospital. The new hospital is home to several adult inpatient services: urology, otolaryngology, colorectal surgery, obstetrics, and gynecologic surgery. A hospitalist is on-site 24 hours a day to provide consultation for these services around issues that relate to internal medicine. A hospitalist who requires subspecialty expertise to answer a clinical question can request a consultation by in-person visit, video telemedicine, or e-consult, each of which is available 24/7. Almost all of the medicine subspecialists work on the existing campus, not in Mission Bay.
Protocol Development and Implementation
The protocol for the e-consult program was developed over several months by an interdisciplinary group that included 3 hospitalists, 1 obstetrician, 1 project manager, and 1 informaticist. The group outlined the process for requesting and completing an e-consult (Figure), designed a note template for consultants to use for EMR documentation, conducted outreach with subspecialty groups to discuss the protocol, and developed an EMR report to track e-consult use and content over time. As our medical center does not bill payers for inpatient e-consults, e-consult note tracking is used to provide reimbursement internally, from the medical center to the respective departments of the consultants. Reimbursement is made at a set rate per e-consult note, with the rate set to approximate the reimbursement of a low-acuity in-person consult on the main campus.
The workflow of an e-consult is as follows: (1) Whe
Evaluation
Each month, we tracked e-consult use using an EMR report built as part of the implementation of the program. For the first four months of implementation, every patient who received an e-consult also had a manual chart review of the period around the e-consult, performed by a hospitalist, in order to audit for any potential safety issues. These issues included, for example, an e-consult performed for a patient whose complexity or severity of illness was felt to be too great to defer an in-person visit, or a patient who received e-consult recommendations that were significantly retracted in a follow-up in-person note.
Eight months after the program started, we assessed experience by electronically surveying the 9 hospitalists and 11 consultants who had requested or performed at least 2 e-consults.8 Survey items were measured on a 5-point Likert scale: strongly disagree to strongly agree. The items, which related to ease of calling for a consultation, quality of e-consults, impact on clinical care, safety concerns, and satisfaction, were inspired by themes identified in a systematic review of the literature on e-consults in the outpatient setting.2 We sent 2 reminders to responders. Data were summarized using descriptive statistics. Analysis was performed in SPSS version 22.0 (IBM).
RESULTS
There were 143 initial subspecialty consultations by e-consult between program launch in February 2015 and manuscript preparation in February 2016, an average of 11 e-consults per month. There were 313 total e-consult notes (these included both initial and follow-up e-consult notes). By comparison, 240 initial in-person consultations occurred during the same period, and there were 435 total in-person consultation notes (46% new or initial notes, 54% follow-up notes). The top 5 subspecialties by volume of e-consults were infectious disease (35%), hematology (20%), endocrinology (14%), nephrology (13%), and cardiology (8%). For reference, e-consults are also available from psychiatry, neurology, oncology, gastroenterology, pulmonology, and rheumatology. Percentage of consultations performed during daytime hours (defined as 8 a.m. to 5 p.m.) was 92% for e-consults and 96% for in-person consultations.
There were no e-consult–related patient safety issues reported through the medical center’s incident reporting system during the study period. There were also no patient safety issues identified in the manual audits of 80 charts during the first 4 months of the program.
Seven (78%) of 9 hospitalists and 7 (64%) of 11 consultants completed the survey. Both groups agreed that e-consults were easy to use and efficient (Table). All hospitalists were satisfied with the quality of e-consult recommendations, but only 3 (43%) of the 7 consultants agreed they could provide high-quality consultation by e-consult. In their comments, 2 consultants expressed concerns. One concern was about missing crucial information by performing only a chart review, and the other was about being tempted to perform an e-consult simply because it is expedient.
DISCUSSION
Although use of e-consults in the outpatient setting is relatively commonplace, our program represents a novel use of e-consults in safely and efficiently providing subspecialty consultation to inpatients at a remote hospital.
For hospitalists, an e-consult system offers numerous benefits. Clinical questions beyond an internists’ scope of practice come up often, and simple questions might traditionally result in an informal curbside consult. While a curbside consult provides answers faster than an in-person visit, it creates risks for the requesting hospitalists: the consultants only know what they are told, whether the information is incomplete or erroneous; their opinions are given without documentation or compensation, which reduces a sense of accountability; and the lack of documentation does not allow their advice to persist in the chart as a reference for future providers.9 Our e-consult program solves these problems by requiring that consultants perform chart review and provide documentation as well as obligating the medical center to pay a small compensation to consultants for their time. We hope this lowers the bar to requesting consultation for remote sites, where the alternative would be burdensome travel time to do an in-person visit.
In our study, hospitalists were universally pleased with the quality of e-consult recommendations, but only 43% of consultants agreed. These findings correlate with the literature on e-consults in the outpatient setting.2 Unfortunately, our survey comments did not shed further light on this sentiment. In the outpatient literature, consultants were most concerned with having a clear clinical question, facing the liability of providing recommendations without performing an examination, and receiving appropriate compensation for answering e-consults.
The generalizability of our program findings is limited most significantly by the particular arrangement of our clinical services: Our remote site is home to a select group of adult inpatient services, a hospitalist is available on-site for these services 24 hours a day, and the distance to the remote site can be overcome with modest effort should a patient require an in-person visit in the initial or follow-up period. The generalizability of our safety findings is limited by the use of a single reviewer for chart auditing.
Given the rise of accountable care organizations and the prevalence of hospital mergers in the healthcare landscape, we believe that healthcare systems that operate remote sites under constrained budgets could look to e-consults to more cost-effectively extend subspecialty expertise across the inpatient enterprise. With improvements in health information exchange, it may also become feasible for consultants to offer e-consults to hospitals outside a medical center’s network. Our study showed that inpatient e-consult programs can be developed and implemented, that they appear not to pose any significant safety issues, and that they can facilitate delivery of timely clinical care.
Acknowledgment
The authors thank Raphaela Levy-Moore for creating and implementing the e-consult note template for our electronic medical record.
Disclosure
Nothing to report.
1. Chen AH, Murphy EJ, Yee HF Jr. eReferral—a new model for integrated care. N Engl J Med. 2013;368(26):2450-2453. PubMed
2. Vimalananda VG, Gupte G, Seraj SM, et al. Electronic consultations (e-consults) to improve access to specialty care: a systematic review and narrative synthesis. J Telemed Telecare. 2015;21(6):323-330. PubMed
3. Kirsh S, Carey E, Aron DC, et al. Impact of a national specialty e-consultation implementation project on access. Am J Manag Care. 2015;21(12):e648-e654. PubMed
4. Bergman J, Neuhausen K, Chamie K, et al. Building a medical neighborhood in the safety net: an innovative technology improves hematuria workups. Urology. 2013;82(6):1277-1282. PubMed
5. Wasfy JH, Rao SK, Chittle MD, Gallen KM, Isselbacher EM, Ferris TG. Initial results of a cardiac e-consult pilot program. J Am Coll Cardiol. 2014;64(24):2706-2707. PubMed
6. Perley CM. Physician use of the curbside consultation to address information needs: report on a collective case study. J Med Libr Assoc. 2006;94(2):137-144. PubMed
7. Gupte G, Vimalananda V, Simon SR, DeVito K, Clark J, Orlander JD. Disruptive innovation: implementation of electronic consultations in a Veterans Affairs health care system. JMIR Med Inform. 2016;4(1):e6. PubMed
8. REDCap. Vanderbilt University website. http://www.project-redcap.org. 2015. Accessed March 3, 2016.
9. Burden M, Sarcone E, Keniston A, et al. Prospective comparison of curbside versus formal consultations. J Hosp Med. 2013;8(1):31-35. PubMed
© 2017 Society of Hospital Medicine
Standardized attending rounds to improve the patient experience: A pragmatic cluster randomized controlled trial
Patient experience has recently received heightened attention given evidence supporting an association between patient experience and quality of care,1 and the coupling of patient satisfaction to reimbursement rates for Medicare patients.2 Patient experience is often assessed through surveys of patient satisfaction, which correlates with patient perceptions of nurse and physician communication.3 Teaching hospitals introduce variables that may impact communication, including the involvement of multiple levels of care providers and competing patient care vs. educational priorities. Patients admitted to teaching services express decreased satisfaction with coordination and overall care compared with patients on nonteaching services.4
Clinical supervision of trainees on teaching services is primarily achieved through attending rounds (AR), where patients’ clinical presentations and management are discussed with an attending physician. Poor communication during AR may negatively affect the patient experience through inefficient care coordination among the inter-professional care team or through implementation of interventions without patients’ knowledge or input.5-11 Although patient engagement in rounds has been associated with higher patient satisfaction with rounds,12-19 AR and case presentations often occur at a distance from the patient’s bedside.20,21 Furthermore, AR vary in the time allotted per patient and the extent of participation of nurses and other allied health professionals. Standardized bedside rounding processes have been shown to improve efficiency, decrease daily resident work hours,22 and improve nurse-physician teamwork.23
Despite these benefits, recent prospective studies of bedside AR interventions have not improved patient satisfaction with rounds. One involved the implementation of interprofessional patient-centered bedside rounds on a nonteaching service,24 while the other evaluated the impact of integrating athletic principles into multidisciplinary work rounds.25 Work at our institution had sought to develop AR practice recommendations to foster an optimal patient experience, while maintaining provider workflow efficiency, facilitating interdisciplinary communication, and advancing trainee education.26 Using these AR recommendations, we conducted a prospective randomized controlled trial to evaluate the impact of implementing a standardized bedside AR model on patient satisfaction with rounds. We also assessed attending physician and trainee satisfaction with rounds, and perceived and actual AR duration.
METHODS
Setting and Participants
This trial was conducted on the internal medicine teaching service of the University of California San Francisco Medical Center from September 3, 2013 to November 27, 2013. The service is comprised of 8 teams, with a total average daily census of 80 to 90 patients. Teams are comprised of an attending physician, a senior resident (in the second or third year of residency training), 2 interns, and a third- and/or fourth-year medical student.
This trial, which was approved by the University of California, San Francisco Committee on Human Research (UCSF CHR) and was registered with ClinicalTrials.gov (NCT01931553), was classified under Quality Improvement and did not require informed consent of patients or providers.
Intervention Description
We conducted a cluster randomized trial to evaluate the impact of a bundled set of 5 AR practice recommendations, adapted from published work,26 on patient experience, as well as on attending and trainee satisfaction: 1) huddling to establish the rounding schedule and priorities; 2) conducting bedside rounds; 3) integrating bedside nurses; 4) completing real-time order entry using bedside computers; 5) updating the whiteboard in each patient’s room with care plan information.
At the beginning of each month, study investigators (Nader Najafi and Bradley Monash) led a 1.5-hour workshop to train attending physicians and trainees allocated to the intervention arm on the recommended AR practices. Participants also received informational handouts to be referenced during AR. Attending physicians and trainees randomized to the control arm continued usual rounding practices. Control teams were notified that there would be observers on rounds but were not informed of the study aims.
Randomization and Team Assignments
The medicine service was divided into 2 arms, each comprised of 4 teams. Using a coin flip, Cluster 1 (Teams A, B, C and D) was randomized to the intervention, and Cluster 2 (Teams E, F, G and H) was randomized to the control. This design was pragmatically chosen to ensure that 1 team from each arm would admit patients daily. Allocation concealment of attending physicians and trainees was not possible given the nature of the intervention. Patients were blinded to study arm allocation.
MEASURES AND OUTCOMES
Adherence to Practice Recommendations
Thirty premedical students served as volunteer AR auditors. Each auditor received orientation and training in data collection techniques during a single 2-hour workshop. The auditors, blinded to study arm allocation, independently observed morning AR during weekdays and recorded the completion of the following elements as a dichotomous (yes/no) outcome: pre-rounds huddle, participation of nurse in AR, real-time order entry, and whiteboard use. They recorded the duration of AR per day for each team (minutes) and the rounding model for each patient rounding encounter during AR (bedside, hallway, or card flip).23 Bedside rounds were defined as presentation and discussion of the patient care plan in the presence of the patient. Hallway rounds were defined as presentation and discussion of the patient care plan partially outside the patient’s room and partially in the presence of the patient. Card-flip rounds were defined as presentation and discussion of the patient care plan entirely outside of the patient’s room without the team seeing the patient together. Two auditors simultaneously observed a random subset of patient-rounding encounters to evaluate inter-rater reliability, and the concordance between auditor observations was good (Pearson correlation = 0.66).27
Patient-Related Outcomes
The primary outcome was patient satisfaction with AR, assessed using a survey adapted from published work.12,14,28,29 Patients were approached to complete the questionnaire after they had experienced at least 1 AR. Patients were excluded if they were non-English-speaking, unavailable (eg, off the unit for testing or treatment), in isolation, or had impaired mental status. For patients admitted multiple times during the study period, only the first questionnaire was used. Survey questions included patient involvement in decision-making, quality of communication between patient and medicine team, and the perception that the medicine team cared about the patient. Patients were asked to state their level of agreement with each item on a 5-point Likert scale. We obtained data on patient demographics from administrative datasets.
Healthcare Provider Outcomes
Attending physicians and trainees on service for at least 7 consecutive days were sent an electronic survey, adapted from published work.25,30 Questions assessed satisfaction with AR, perceived value of bedside rounds, and extent of patient and nursing involvement.Level of agreement with each item was captured on a continuous scale; 0 = strongly disagree to 100 = strongly agree, or from 0 (far too little) to 100 (far too much), with 50 equating to “about right.” Attending physicians and trainees were also asked to estimate the average duration of AR (in minutes).
Statistical Analyses
Analyses were blinded to study arm allocation and followed intention-to-treat principles. One attending physician crossed over from intervention to control arm; patient surveys associated with this attending (n = 4) were excluded to avoid contamination. No trainees crossed over.
Demographic and clinical characteristics of patients who completed the survey are reported (Appendix). To compare patient satisfaction scores, we used a random-effects regression model to account for correlation among responses within teams within randomized clusters, defining teams by attending physician. As this correlation was negligible and not statistically significant, we did not adjust ordinary linear regression models for clustering. Given observed differences in patient characteristics, we adjusted for a number of covariates (eg, age, gender, insurance payer, race, marital status, trial group arm).
We conducted simple linear regression for attending and trainee satisfaction comparisons between arms, adjusting only for trainee type (eg, resident, intern, and medical student).
We compared the frequency with which intervention and control teams adhered to the 5 recommended AR practices using chi-square tests. We used independent Student’s t tests to compare total duration of AR by teams within each arm, as well as mean time spent per patient.
This trial had a fixed number of arms (n = 2), each of fixed size (n = 600), based on the average monthly inpatient census on the medicine service. This fixed sample size, with 80% power and α = 0.05, will be able to detect a 0.16 difference in patient satisfaction scores between groups.
All analyses were conducted using SAS® v 9.4 (SAS Institute, Inc., Cary, NC).
RESULTS
We observed 241 AR involving 1855 patient rounding encounters in the intervention arm and 264 AR involving 1903 patient rounding encounters in the control arm (response rates shown in Figure 1). 

Patient Satisfaction and Clinical Outcomes
Five hundred ninety-five patients were allocated to the intervention arm and 605 were allocated to the control arm (Figure 1). Mean age, gender, race, marital status, primary language, and insurance provider did not differ between intervention and control arms (Table 1). 
Patients in the intervention arm reported significantly higher satisfaction with AR and felt more cared for by their medicine team (Table 2). 
Actual and Perceived Duration of Attending Rounds
The intervention shortened the total duration of AR by 8 minutes on average (143 vs. 151 minutes, P = 0.052) and the time spent per patient by 4 minutes on average (19 vs. 23 minutes, P < 0.001). Despite this, trainees in the intervention arm perceived AR to last longer (mean estimated time: 167 min vs. 152 min, P < 0.001).
Healthcare Provider Outcomes
We observed 79 attending physicians and trainees in the intervention arm and 78 in the control arm, with survey response rates shown in Figure 1. Attending physicians in the intervention and the control arms reported high levels of satisfaction with the quality of AR (Table 2). Attending physicians in the intervention arm were more likely to report an appropriate level of patient involvement and nurse involvement.
Although trainees in the intervention and control arms reported high levels of satisfaction with the quality of AR, trainees in the intervention arm reported lower satisfaction with AR compared with control arm trainees (Table 2). Trainees in the intervention arm reported that AR involved less autonomy, efficiency, and teaching. Trainees in the intervention arm also scored patient involvement more towards the “far too much” end of the scale compared with “about right” in the control arm. However, trainees in the intervention arm perceived nurse involvement closer to “about right,” as opposed to “far too little” in the control arm.
CONCLUSION/DISCUSSION
Training internal medicine teams to adhere to 5 recommended AR practices increased patient satisfaction with AR and the perception that patients were more cared for by their medicine team. Despite the intervention potentially shortening the duration of AR, attending physicians and trainees perceived AR to last longer, and trainee satisfaction with AR decreased.
Teams in the intervention arm adhered to all recommended rounding practices at higher rates than the control teams. Although intervention teams rounded at the bedside 53% of the time, they were encouraged to bedside round only on patients who desired to participate in rounds, were not altered, and for whom the clinical discussion was not too sensitive to occur at the bedside. Of the recommended rounding behaviors, the lowest adherence was seen with whiteboard use.
A major component of the intervention was to move the clinical presentation to the patient’s bedside. Most patients prefer being included in rounds and partaking in trainee education.12-19,28,29,31-33 Patients may also perceive that more time is spent with them during bedside case presentations,14,28 and exposure to providers conferring on their care may enhance patient confidence in the care being delivered.12 Although a recent study of patient-centered bedside rounding on a nonteaching service did not result in increased patient satisfaction,24 teaching services may offer more opportunities for improvement in care coordination and communication.4
Other aspects of the intervention may have contributed to increased patient satisfaction with AR. The pre-rounds huddle may have helped teams prioritize which patients required more time or would benefit most from bedside rounds. The involvement of nurses in AR may have bolstered communication and team dynamics, enhancing the patient’s perception of interprofessional collaboration. Real-time order entry might have led to more efficient implementation of the care plan, and whiteboard use may have helped to keep patients abreast of the care plan.
Patients in the intervention arm felt more cared for by their medicine teams but did not report improvements in communication or in shared decision-making. Prior work highlights that limited patient engagement, activation, and shared decision-making may occur during AR.24,34 Patient-physician communication during AR is challenged by time pressures and competing priorities, including the “need” for trainees to demonstrate their medical knowledge and clinical skills. Efforts that encourage bedside rounding should include communication training with respect to patient engagement and shared decision-making.
Attending physicians reported positive attitudes toward bedside rounding, consistent with prior studies.13,21,31 However, trainees in the intervention arm expressed decreased satisfaction with AR, estimating that AR took longer and reporting too much patient involvement. Prior studies reflect similar bedside-rounding concerns, including perceived workflow inefficiencies, infringement on teaching opportunities, and time constraints.12,20,35 Trainees are under intense time pressures to complete their work, attend educational conferences, and leave the hospital to attend afternoon clinic or to comply with duty-hour restrictions. Trainees value succinctness,12,35,36 so the perception that intervention AR lasted longer likely contributed to trainee dissatisfaction.
Reduced trainee satisfaction with intervention AR may have also stemmed from the perception of decreased autonomy and less teaching, both valued by trainees.20,35,36 The intervention itself reduced trainee autonomy because usual practice at our hospital involves residents deciding where and how to round. Attending physician presence at the bedside during rounds may have further infringed on trainee autonomy if the patient looked to the attending for answers, or if the attending was seen as the AR leader. Attending physicians may mitigate the risk of compromising trainee autonomy by allowing the trainee to speak first, ensuring the trainee is positioned closer to, and at eye level with, the patient, and redirecting patient questions to the trainee as appropriate. Optimizing trainee experience with bedside AR requires preparation and training of attending physicians, who may feel inadequately prepared to lead bedside rounds and conduct bedside teaching.37 Faculty must learn how to preserve team efficiency, create a safe, nonpunitive bedside environment that fosters the trainee-patient relationship, and ensure rounds remain educational.36,38,39
The intervention reduced the average time spent on AR and time spent per patient. Studies examining the relationship between bedside rounding and duration of rounds have yielded mixed results: some have demonstrated no effect of bedside rounds on rounding time,28,40 while others report longer rounding times.37 The pre-rounds huddle and real-time order writing may have enhanced workflow efficiency.
Our study has several limitations. These results reflect the experience of a single large academic medical center and may not be generalizable to other settings. Although overall patient response to the survey was low and may not be representative of the entire patient population, response rates in the intervention and control arms were equivalent. Non-English speaking patients may have preferences that were not reflected in our survey results, and we did not otherwise quantify individual reasons for survey noncompletion. The presence of auditors on AR may have introduced observer bias. There may have been crossover effect; however, observed prevalence of individual practices remained low in the control arm. The 1.5-hour workshop may have inadequately equipped trainees with the complex skills required to lead and participate in bedside rounding, and more training, experience, and feedback may have yielded different results. For instance, residents with more exposure to bedside rounding express greater appreciation of its role in education and patient care.20 While adherence to some of the recommended practices remained low, we did not employ a full range of change-management techniques. Instead, we opted for a “low intensity” intervention (eg, single workshop, handouts) that relied on voluntary adoption by medicine teams and that we hoped other institutions could reproduce. Finally, we did not assess the relative impact of individual rounding behaviors on the measured outcomes.
In conclusion, training medicine teams to adhere to a standardized bedside AR model increased patient satisfaction with rounds. Concomitant trainee dissatisfaction may require further experience and training of attending physicians and trainees to ensure successful adoption.
Acknowledgements
We would like to thank all patients, providers, and trainees who participated in this study. We would also like to acknowledge the following volunteer auditors who observed teams daily: Arianna Abundo, Elahhe Afkhamnejad, Yolanda Banuelos, Laila Fozoun, Soe Yupar Khin, Tam Thien Le, Wing Sum Li, Yaqiao Li, Mengyao Liu, Tzyy-Harn Lo, Shynh-Herng Lo, David Lowe, Danoush Paborji, Sa Nan Park, Urmila Powale, Redha Fouad Qabazard, Monique Quiroz, John-Luke Marcelo Rivera, Manfred Roy Luna Salvador, Tobias Gowen Squier-Roper, Flora Yan Ting, Francesca Natasha T. Tizon, Emily Claire Trautner, Stephen Weiner, Alice Wilson, Kimberly Woo, Bingling J Wu, Johnny Wu, Brenda Yee. Statistical expertise was provided by Joan Hilton from the UCSF Clinical and Translational Science Institute (CTSI), which is supported by the National Center for Advancing Translational Sciences, National Institutes of Health, through UCSF-CTSI Grant Number UL1 TR000004. Its contents are solely the responsibility of the authors and do not necessarily represent the official views of the NIH. Thanks also to Oralia Schatzman, Andrea Mazzini, and Erika Huie for their administrative support, and John Hillman for data-related support. Special thanks to Kirsten Kangelaris and Andrew Auerbach for their valuable feedback throughout, and to Maria Novelero and Robert Wachter for their divisional support of this project.
Disclosure
The authors report no financial conflicts of interest.
1. Doyle C, Lennox L, Bell D. A systematic review of evidence on the links between patient experience and clinical safety and effectiveness. BMJ Open. 2013;3(1):1-18. PubMed
2. Hospital Consumer Assessment of Healthcare Providers and Systems (HCAHPS) Fact Sheet. August 2013. Centers for Medicare and Medicaid Services (CMS). Baltimore, MD.http://www.hcahpsonline.org/files/August_2013_HCAHPS_Fact_Sheet3.pdf. Accessed December 1, 2015.
3. Boulding W, Glickman SW, Manary MP, Schulman KA, Staelin R. Relationship between patient satisfaction with inpatient care and hospital readmission within 30 days. Am J Manag Care. 2011;17:41-48. PubMed
4. Wray CM, Flores A, Padula WV, Prochaska MT, Meltzer DO, Arora VM. Measuring patient experiences on hospitalist and teaching services: Patient responses to a 30-day postdischarge questionnaire. J Hosp Med. 2016;11(2):99-104. PubMed
5. Bharwani AM, Harris GC, Southwick FS. Perspective: A business school view of medical interprofessional rounds: transforming rounding groups into rounding teams. Acad Med. 2012;87(12):1768-1771. PubMed
6. Chand DV. Observational study using the tools of lean six sigma to improve the efficiency of the resident rounding process. J Grad Med Educ. 2011;3(2):144-150. PubMed
7. Stickrath C, Noble M, Prochazka A, et al. Attending rounds in the current era: what is and is not happening. JAMA Intern Med. 2013;173(12):1084-1089. PubMed
8. Weber H, Stöckli M, Nübling M, Langewitz WA. Communication during ward rounds in internal medicine. An analysis of patient-nurse-physician interactions using RIAS. Patient Educ Couns. 2007;67(3):343-348. PubMed
9. McMahon GT, Katz JT, Thorndike ME, Levy BD, Loscalzo J. Evaluation of a redesign initiative in an internal-medicine residency. N Engl J Med. 2010;362(14):1304-1311. PubMed
10. Amoss J. Attending rounds: where do we go from here?: comment on “Attending rounds in the current era”. JAMA Intern Med. 2013;173(12):1089-1090. PubMed
11. Curley C, McEachern JE, Speroff T. A firm trial of interdisciplinary rounds on the inpatient medical wards: an intervention designed using continuous quality improvement. Med Care. 1998;36(suppl 8):AS4-A12. PubMed
12. Wang-Cheng RM, Barnas GP, Sigmann P, Riendl PA, Young MJ. Bedside case presentations: why patients like them but learners don’t. J Gen Intern Med. 1989;4(4):284-287. PubMed
13. Chauke, HL, Pattinson RC. Ward rounds—bedside or conference room? S Afr Med J. 2006;96(5):398-400. PubMed
14. Lehmann LS, Brancati FL, Chen MC, Roter D, Dobs AS. The effect of bedside case presentations on patients’ perceptions of their medical care. N Engl J Med. 1997;336(16):336, 1150-1155. PubMed
15. Simons RJ, Baily RG, Zelis R, Zwillich CW. The physiologic and psychological effects of the bedside presentation. N Engl J Med. 1989;321(18):1273-1275. PubMed
16. Wise TN, Feldheim D, Mann LS, Boyle E, Rustgi VK. Patients’ reactions to house staff work rounds. Psychosomatics. 1985;26(8):669-672. PubMed
17. Linfors EW, Neelon FA. Sounding Boards. The case of bedside rounds. N Engl J Med. 1980;303(21):1230-1233. PubMed
18. Nair BR, Coughlan JL, Hensley MJ. Student and patient perspectives on bedside teaching. Med Educ. 1997;31(5):341-346. PubMed
19. Romano J. Patients’ attitudes and behavior in ward round teaching. JAMA. 1941;117(9):664-667.
20. Gonzalo JD, Masters PA, Simons RJ, Chuang CH. Attending rounds and bedside case presentations: medical student and medicine resident experiences and attitudes. Teach Learn Med. 2009;21(2):105-110. PubMed
21. Shoeb M, Khanna R, Fang M, et al. Internal medicine rounding practices and the Accreditation Council for Graduate Medical Education core competencies. J Hosp Med. 2014;9(4):239-243. PubMed
22. Calderon AS, Blackmore CC, Williams BL, et al. Transforming ward rounds through rounding-in-flow. J Grad Med Educ. 2014;6(4):750-755. PubMed
23. Henkin S, Chon TY, Christopherson ML, Halvorsen AJ, Worden LM, Ratelle JT. Improving nurse-physician teamwork through interprofessional bedside rounding. J Multidiscip Healthc. 2016;9:201-205. PubMed
24. O’Leary KJ, Killarney A, Hansen LO, et al. Effect of patient-centred bedside rounds on hospitalised patients’ decision control, activation and satisfaction with care. BMJ Qual Saf. 2016;25:921-928. PubMed
25. Southwick F, Lewis M, Treloar D, et al. Applying athletic principles to medical rounds to improve teaching and patient care. Acad Med. 2014;89(7):1018-1023. PubMed
26. Najafi N, Monash B, Mourad M, et al. Improving attending rounds: Qualitative reflections from multidisciplinary providers. Hosp Pract (1995). 2015;43(3):186-190. PubMed
27. Altman DG. Practical Statistics For Medical Research. Boca Raton, FL: Chapman & Hall/CRC; 2006.
28. Gonzalo JD, Chuang CH, Huang G, Smith C. The return of bedside rounds: an educational intervention. J Gen Intern Med. 2010;25(8):792-798. PubMed
29. Fletcher KE, Rankey DS, Stern DT. Bedside interactions from the other side of the bedrail. J Gen Intern Med. 2005;20(1):58-61. PubMed
30. Gatorounds: Applying Championship Athletic Principles to Healthcare. University of Florida Health. http://gatorounds.med.ufl.edu/surveys/. Accessed March 1, 2013.
31. Gonzalo JD, Heist BS, Duffy BL, et al. The value of bedside rounds: a multicenter qualitative study. Teach Learn Med. 2013;25(4):326-333. PubMed
32. Rogers HD, Carline JD, Paauw DS. Examination room presentations in general internal medicine clinic: patients’ and students’ perceptions. Acad Med. 2003;78(9):945-949. PubMed
33. Fletcher KE, Furney SL, Stern DT. Patients speak: what’s really important about bedside interactions with physician teams. Teach Learn Med. 2007;19(2):120-127. PubMed
34. Satterfield JM, Bereknyei S, Hilton JF, et al. The prevalence of social and behavioral topics and related educational opportunities during attending rounds. Acad Med. 2014; 89(11):1548-1557. PubMed
35. Kroenke K, Simmons JO, Copley JB, Smith C. Attending rounds: a survey of physician attitudes. J Gen Intern Med. 1990;5(3):229-233. PubMed
36. Castiglioni A, Shewchuk RM, Willett LL, Heudebert GR, Centor RM. A pilot study using nominal group technique to assess residents’ perceptions of successful attending rounds. J Gen Intern Med. 2008;23(7):1060-1065. PubMed
37. Crumlish CM, Yialamas MA, McMahon GT. Quantification of bedside teaching by an academic hospitalist group. J Hosp Med. 2009;4(5):304-307. PubMed
38. Gonzalo JD, Wolpaw DR, Lehman E, Chuang CH. Patient-centered interprofessional collaborative care: factors associated with bedside interprofessional rounds. J Gen Intern Med. 2014;29(7):1040-1047. PubMed
39. Roy B, Castiglioni A, Kraemer RR, et al. Using cognitive mapping to define key domains for successful attending rounds. J Gen Intern Med. 2012;27(11):1492-1498. PubMed
40. Bhansali P, Birch S, Campbell JK, et al. A time-motion study of inpatient rounds using a family-centered rounds model. Hosp Pediatr. 2013;3(1):31-38. PubMed
Patient experience has recently received heightened attention given evidence supporting an association between patient experience and quality of care,1 and the coupling of patient satisfaction to reimbursement rates for Medicare patients.2 Patient experience is often assessed through surveys of patient satisfaction, which correlates with patient perceptions of nurse and physician communication.3 Teaching hospitals introduce variables that may impact communication, including the involvement of multiple levels of care providers and competing patient care vs. educational priorities. Patients admitted to teaching services express decreased satisfaction with coordination and overall care compared with patients on nonteaching services.4
Clinical supervision of trainees on teaching services is primarily achieved through attending rounds (AR), where patients’ clinical presentations and management are discussed with an attending physician. Poor communication during AR may negatively affect the patient experience through inefficient care coordination among the inter-professional care team or through implementation of interventions without patients’ knowledge or input.5-11 Although patient engagement in rounds has been associated with higher patient satisfaction with rounds,12-19 AR and case presentations often occur at a distance from the patient’s bedside.20,21 Furthermore, AR vary in the time allotted per patient and the extent of participation of nurses and other allied health professionals. Standardized bedside rounding processes have been shown to improve efficiency, decrease daily resident work hours,22 and improve nurse-physician teamwork.23
Despite these benefits, recent prospective studies of bedside AR interventions have not improved patient satisfaction with rounds. One involved the implementation of interprofessional patient-centered bedside rounds on a nonteaching service,24 while the other evaluated the impact of integrating athletic principles into multidisciplinary work rounds.25 Work at our institution had sought to develop AR practice recommendations to foster an optimal patient experience, while maintaining provider workflow efficiency, facilitating interdisciplinary communication, and advancing trainee education.26 Using these AR recommendations, we conducted a prospective randomized controlled trial to evaluate the impact of implementing a standardized bedside AR model on patient satisfaction with rounds. We also assessed attending physician and trainee satisfaction with rounds, and perceived and actual AR duration.
METHODS
Setting and Participants
This trial was conducted on the internal medicine teaching service of the University of California San Francisco Medical Center from September 3, 2013 to November 27, 2013. The service is comprised of 8 teams, with a total average daily census of 80 to 90 patients. Teams are comprised of an attending physician, a senior resident (in the second or third year of residency training), 2 interns, and a third- and/or fourth-year medical student.
This trial, which was approved by the University of California, San Francisco Committee on Human Research (UCSF CHR) and was registered with ClinicalTrials.gov (NCT01931553), was classified under Quality Improvement and did not require informed consent of patients or providers.
Intervention Description
We conducted a cluster randomized trial to evaluate the impact of a bundled set of 5 AR practice recommendations, adapted from published work,26 on patient experience, as well as on attending and trainee satisfaction: 1) huddling to establish the rounding schedule and priorities; 2) conducting bedside rounds; 3) integrating bedside nurses; 4) completing real-time order entry using bedside computers; 5) updating the whiteboard in each patient’s room with care plan information.
At the beginning of each month, study investigators (Nader Najafi and Bradley Monash) led a 1.5-hour workshop to train attending physicians and trainees allocated to the intervention arm on the recommended AR practices. Participants also received informational handouts to be referenced during AR. Attending physicians and trainees randomized to the control arm continued usual rounding practices. Control teams were notified that there would be observers on rounds but were not informed of the study aims.
Randomization and Team Assignments
The medicine service was divided into 2 arms, each comprised of 4 teams. Using a coin flip, Cluster 1 (Teams A, B, C and D) was randomized to the intervention, and Cluster 2 (Teams E, F, G and H) was randomized to the control. This design was pragmatically chosen to ensure that 1 team from each arm would admit patients daily. Allocation concealment of attending physicians and trainees was not possible given the nature of the intervention. Patients were blinded to study arm allocation.
MEASURES AND OUTCOMES
Adherence to Practice Recommendations
Thirty premedical students served as volunteer AR auditors. Each auditor received orientation and training in data collection techniques during a single 2-hour workshop. The auditors, blinded to study arm allocation, independently observed morning AR during weekdays and recorded the completion of the following elements as a dichotomous (yes/no) outcome: pre-rounds huddle, participation of nurse in AR, real-time order entry, and whiteboard use. They recorded the duration of AR per day for each team (minutes) and the rounding model for each patient rounding encounter during AR (bedside, hallway, or card flip).23 Bedside rounds were defined as presentation and discussion of the patient care plan in the presence of the patient. Hallway rounds were defined as presentation and discussion of the patient care plan partially outside the patient’s room and partially in the presence of the patient. Card-flip rounds were defined as presentation and discussion of the patient care plan entirely outside of the patient’s room without the team seeing the patient together. Two auditors simultaneously observed a random subset of patient-rounding encounters to evaluate inter-rater reliability, and the concordance between auditor observations was good (Pearson correlation = 0.66).27
Patient-Related Outcomes
The primary outcome was patient satisfaction with AR, assessed using a survey adapted from published work.12,14,28,29 Patients were approached to complete the questionnaire after they had experienced at least 1 AR. Patients were excluded if they were non-English-speaking, unavailable (eg, off the unit for testing or treatment), in isolation, or had impaired mental status. For patients admitted multiple times during the study period, only the first questionnaire was used. Survey questions included patient involvement in decision-making, quality of communication between patient and medicine team, and the perception that the medicine team cared about the patient. Patients were asked to state their level of agreement with each item on a 5-point Likert scale. We obtained data on patient demographics from administrative datasets.
Healthcare Provider Outcomes
Attending physicians and trainees on service for at least 7 consecutive days were sent an electronic survey, adapted from published work.25,30 Questions assessed satisfaction with AR, perceived value of bedside rounds, and extent of patient and nursing involvement.Level of agreement with each item was captured on a continuous scale; 0 = strongly disagree to 100 = strongly agree, or from 0 (far too little) to 100 (far too much), with 50 equating to “about right.” Attending physicians and trainees were also asked to estimate the average duration of AR (in minutes).
Statistical Analyses
Analyses were blinded to study arm allocation and followed intention-to-treat principles. One attending physician crossed over from intervention to control arm; patient surveys associated with this attending (n = 4) were excluded to avoid contamination. No trainees crossed over.
Demographic and clinical characteristics of patients who completed the survey are reported (Appendix). To compare patient satisfaction scores, we used a random-effects regression model to account for correlation among responses within teams within randomized clusters, defining teams by attending physician. As this correlation was negligible and not statistically significant, we did not adjust ordinary linear regression models for clustering. Given observed differences in patient characteristics, we adjusted for a number of covariates (eg, age, gender, insurance payer, race, marital status, trial group arm).
We conducted simple linear regression for attending and trainee satisfaction comparisons between arms, adjusting only for trainee type (eg, resident, intern, and medical student).
We compared the frequency with which intervention and control teams adhered to the 5 recommended AR practices using chi-square tests. We used independent Student’s t tests to compare total duration of AR by teams within each arm, as well as mean time spent per patient.
This trial had a fixed number of arms (n = 2), each of fixed size (n = 600), based on the average monthly inpatient census on the medicine service. This fixed sample size, with 80% power and α = 0.05, will be able to detect a 0.16 difference in patient satisfaction scores between groups.
All analyses were conducted using SAS® v 9.4 (SAS Institute, Inc., Cary, NC).
RESULTS
We observed 241 AR involving 1855 patient rounding encounters in the intervention arm and 264 AR involving 1903 patient rounding encounters in the control arm (response rates shown in Figure 1).
Patient Satisfaction and Clinical Outcomes
Five hundred ninety-five patients were allocated to the intervention arm and 605 were allocated to the control arm (Figure 1). Mean age, gender, race, marital status, primary language, and insurance provider did not differ between intervention and control arms (Table 1).
Patients in the intervention arm reported significantly higher satisfaction with AR and felt more cared for by their medicine team (Table 2).
Actual and Perceived Duration of Attending Rounds
The intervention shortened the total duration of AR by 8 minutes on average (143 vs. 151 minutes, P = 0.052) and the time spent per patient by 4 minutes on average (19 vs. 23 minutes, P < 0.001). Despite this, trainees in the intervention arm perceived AR to last longer (mean estimated time: 167 min vs. 152 min, P < 0.001).
Healthcare Provider Outcomes
We observed 79 attending physicians and trainees in the intervention arm and 78 in the control arm, with survey response rates shown in Figure 1. Attending physicians in the intervention and the control arms reported high levels of satisfaction with the quality of AR (Table 2). Attending physicians in the intervention arm were more likely to report an appropriate level of patient involvement and nurse involvement.
Although trainees in the intervention and control arms reported high levels of satisfaction with the quality of AR, trainees in the intervention arm reported lower satisfaction with AR compared with control arm trainees (Table 2). Trainees in the intervention arm reported that AR involved less autonomy, efficiency, and teaching. Trainees in the intervention arm also scored patient involvement more towards the “far too much” end of the scale compared with “about right” in the control arm. However, trainees in the intervention arm perceived nurse involvement closer to “about right,” as opposed to “far too little” in the control arm.
CONCLUSION/DISCUSSION
Training internal medicine teams to adhere to 5 recommended AR practices increased patient satisfaction with AR and the perception that patients were more cared for by their medicine team. Despite the intervention potentially shortening the duration of AR, attending physicians and trainees perceived AR to last longer, and trainee satisfaction with AR decreased.
Teams in the intervention arm adhered to all recommended rounding practices at higher rates than the control teams. Although intervention teams rounded at the bedside 53% of the time, they were encouraged to bedside round only on patients who desired to participate in rounds, were not altered, and for whom the clinical discussion was not too sensitive to occur at the bedside. Of the recommended rounding behaviors, the lowest adherence was seen with whiteboard use.
A major component of the intervention was to move the clinical presentation to the patient’s bedside. Most patients prefer being included in rounds and partaking in trainee education.12-19,28,29,31-33 Patients may also perceive that more time is spent with them during bedside case presentations,14,28 and exposure to providers conferring on their care may enhance patient confidence in the care being delivered.12 Although a recent study of patient-centered bedside rounding on a nonteaching service did not result in increased patient satisfaction,24 teaching services may offer more opportunities for improvement in care coordination and communication.4
Other aspects of the intervention may have contributed to increased patient satisfaction with AR. The pre-rounds huddle may have helped teams prioritize which patients required more time or would benefit most from bedside rounds. The involvement of nurses in AR may have bolstered communication and team dynamics, enhancing the patient’s perception of interprofessional collaboration. Real-time order entry might have led to more efficient implementation of the care plan, and whiteboard use may have helped to keep patients abreast of the care plan.
Patients in the intervention arm felt more cared for by their medicine teams but did not report improvements in communication or in shared decision-making. Prior work highlights that limited patient engagement, activation, and shared decision-making may occur during AR.24,34 Patient-physician communication during AR is challenged by time pressures and competing priorities, including the “need” for trainees to demonstrate their medical knowledge and clinical skills. Efforts that encourage bedside rounding should include communication training with respect to patient engagement and shared decision-making.
Attending physicians reported positive attitudes toward bedside rounding, consistent with prior studies.13,21,31 However, trainees in the intervention arm expressed decreased satisfaction with AR, estimating that AR took longer and reporting too much patient involvement. Prior studies reflect similar bedside-rounding concerns, including perceived workflow inefficiencies, infringement on teaching opportunities, and time constraints.12,20,35 Trainees are under intense time pressures to complete their work, attend educational conferences, and leave the hospital to attend afternoon clinic or to comply with duty-hour restrictions. Trainees value succinctness,12,35,36 so the perception that intervention AR lasted longer likely contributed to trainee dissatisfaction.
Reduced trainee satisfaction with intervention AR may have also stemmed from the perception of decreased autonomy and less teaching, both valued by trainees.20,35,36 The intervention itself reduced trainee autonomy because usual practice at our hospital involves residents deciding where and how to round. Attending physician presence at the bedside during rounds may have further infringed on trainee autonomy if the patient looked to the attending for answers, or if the attending was seen as the AR leader. Attending physicians may mitigate the risk of compromising trainee autonomy by allowing the trainee to speak first, ensuring the trainee is positioned closer to, and at eye level with, the patient, and redirecting patient questions to the trainee as appropriate. Optimizing trainee experience with bedside AR requires preparation and training of attending physicians, who may feel inadequately prepared to lead bedside rounds and conduct bedside teaching.37 Faculty must learn how to preserve team efficiency, create a safe, nonpunitive bedside environment that fosters the trainee-patient relationship, and ensure rounds remain educational.36,38,39
The intervention reduced the average time spent on AR and time spent per patient. Studies examining the relationship between bedside rounding and duration of rounds have yielded mixed results: some have demonstrated no effect of bedside rounds on rounding time,28,40 while others report longer rounding times.37 The pre-rounds huddle and real-time order writing may have enhanced workflow efficiency.
Our study has several limitations. These results reflect the experience of a single large academic medical center and may not be generalizable to other settings. Although overall patient response to the survey was low and may not be representative of the entire patient population, response rates in the intervention and control arms were equivalent. Non-English speaking patients may have preferences that were not reflected in our survey results, and we did not otherwise quantify individual reasons for survey noncompletion. The presence of auditors on AR may have introduced observer bias. There may have been crossover effect; however, observed prevalence of individual practices remained low in the control arm. The 1.5-hour workshop may have inadequately equipped trainees with the complex skills required to lead and participate in bedside rounding, and more training, experience, and feedback may have yielded different results. For instance, residents with more exposure to bedside rounding express greater appreciation of its role in education and patient care.20 While adherence to some of the recommended practices remained low, we did not employ a full range of change-management techniques. Instead, we opted for a “low intensity” intervention (eg, single workshop, handouts) that relied on voluntary adoption by medicine teams and that we hoped other institutions could reproduce. Finally, we did not assess the relative impact of individual rounding behaviors on the measured outcomes.
In conclusion, training medicine teams to adhere to a standardized bedside AR model increased patient satisfaction with rounds. Concomitant trainee dissatisfaction may require further experience and training of attending physicians and trainees to ensure successful adoption.
Acknowledgements
We would like to thank all patients, providers, and trainees who participated in this study. We would also like to acknowledge the following volunteer auditors who observed teams daily: Arianna Abundo, Elahhe Afkhamnejad, Yolanda Banuelos, Laila Fozoun, Soe Yupar Khin, Tam Thien Le, Wing Sum Li, Yaqiao Li, Mengyao Liu, Tzyy-Harn Lo, Shynh-Herng Lo, David Lowe, Danoush Paborji, Sa Nan Park, Urmila Powale, Redha Fouad Qabazard, Monique Quiroz, John-Luke Marcelo Rivera, Manfred Roy Luna Salvador, Tobias Gowen Squier-Roper, Flora Yan Ting, Francesca Natasha T. Tizon, Emily Claire Trautner, Stephen Weiner, Alice Wilson, Kimberly Woo, Bingling J Wu, Johnny Wu, Brenda Yee. Statistical expertise was provided by Joan Hilton from the UCSF Clinical and Translational Science Institute (CTSI), which is supported by the National Center for Advancing Translational Sciences, National Institutes of Health, through UCSF-CTSI Grant Number UL1 TR000004. Its contents are solely the responsibility of the authors and do not necessarily represent the official views of the NIH. Thanks also to Oralia Schatzman, Andrea Mazzini, and Erika Huie for their administrative support, and John Hillman for data-related support. Special thanks to Kirsten Kangelaris and Andrew Auerbach for their valuable feedback throughout, and to Maria Novelero and Robert Wachter for their divisional support of this project.
Disclosure
The authors report no financial conflicts of interest.
1. Doyle C, Lennox L, Bell D. A systematic review of evidence on the links between patient experience and clinical safety and effectiveness. BMJ Open. 2013;3(1):1-18. PubMed
2. Hospital Consumer Assessment of Healthcare Providers and Systems (HCAHPS) Fact Sheet. August 2013. Centers for Medicare and Medicaid Services (CMS). Baltimore, MD.http://www.hcahpsonline.org/files/August_2013_HCAHPS_Fact_Sheet3.pdf. Accessed December 1, 2015.
3. Boulding W, Glickman SW, Manary MP, Schulman KA, Staelin R. Relationship between patient satisfaction with inpatient care and hospital readmission within 30 days. Am J Manag Care. 2011;17:41-48. PubMed
4. Wray CM, Flores A, Padula WV, Prochaska MT, Meltzer DO, Arora VM. Measuring patient experiences on hospitalist and teaching services: Patient responses to a 30-day postdischarge questionnaire. J Hosp Med. 2016;11(2):99-104. PubMed
5. Bharwani AM, Harris GC, Southwick FS. Perspective: A business school view of medical interprofessional rounds: transforming rounding groups into rounding teams. Acad Med. 2012;87(12):1768-1771. PubMed
6. Chand DV. Observational study using the tools of lean six sigma to improve the efficiency of the resident rounding process. J Grad Med Educ. 2011;3(2):144-150. PubMed
7. Stickrath C, Noble M, Prochazka A, et al. Attending rounds in the current era: what is and is not happening. JAMA Intern Med. 2013;173(12):1084-1089. PubMed
8. Weber H, Stöckli M, Nübling M, Langewitz WA. Communication during ward rounds in internal medicine. An analysis of patient-nurse-physician interactions using RIAS. Patient Educ Couns. 2007;67(3):343-348. PubMed
9. McMahon GT, Katz JT, Thorndike ME, Levy BD, Loscalzo J. Evaluation of a redesign initiative in an internal-medicine residency. N Engl J Med. 2010;362(14):1304-1311. PubMed
10. Amoss J. Attending rounds: where do we go from here?: comment on “Attending rounds in the current era”. JAMA Intern Med. 2013;173(12):1089-1090. PubMed
11. Curley C, McEachern JE, Speroff T. A firm trial of interdisciplinary rounds on the inpatient medical wards: an intervention designed using continuous quality improvement. Med Care. 1998;36(suppl 8):AS4-A12. PubMed
12. Wang-Cheng RM, Barnas GP, Sigmann P, Riendl PA, Young MJ. Bedside case presentations: why patients like them but learners don’t. J Gen Intern Med. 1989;4(4):284-287. PubMed
13. Chauke, HL, Pattinson RC. Ward rounds—bedside or conference room? S Afr Med J. 2006;96(5):398-400. PubMed
14. Lehmann LS, Brancati FL, Chen MC, Roter D, Dobs AS. The effect of bedside case presentations on patients’ perceptions of their medical care. N Engl J Med. 1997;336(16):336, 1150-1155. PubMed
15. Simons RJ, Baily RG, Zelis R, Zwillich CW. The physiologic and psychological effects of the bedside presentation. N Engl J Med. 1989;321(18):1273-1275. PubMed
16. Wise TN, Feldheim D, Mann LS, Boyle E, Rustgi VK. Patients’ reactions to house staff work rounds. Psychosomatics. 1985;26(8):669-672. PubMed
17. Linfors EW, Neelon FA. Sounding Boards. The case of bedside rounds. N Engl J Med. 1980;303(21):1230-1233. PubMed
18. Nair BR, Coughlan JL, Hensley MJ. Student and patient perspectives on bedside teaching. Med Educ. 1997;31(5):341-346. PubMed
19. Romano J. Patients’ attitudes and behavior in ward round teaching. JAMA. 1941;117(9):664-667.
20. Gonzalo JD, Masters PA, Simons RJ, Chuang CH. Attending rounds and bedside case presentations: medical student and medicine resident experiences and attitudes. Teach Learn Med. 2009;21(2):105-110. PubMed
21. Shoeb M, Khanna R, Fang M, et al. Internal medicine rounding practices and the Accreditation Council for Graduate Medical Education core competencies. J Hosp Med. 2014;9(4):239-243. PubMed
22. Calderon AS, Blackmore CC, Williams BL, et al. Transforming ward rounds through rounding-in-flow. J Grad Med Educ. 2014;6(4):750-755. PubMed
23. Henkin S, Chon TY, Christopherson ML, Halvorsen AJ, Worden LM, Ratelle JT. Improving nurse-physician teamwork through interprofessional bedside rounding. J Multidiscip Healthc. 2016;9:201-205. PubMed
24. O’Leary KJ, Killarney A, Hansen LO, et al. Effect of patient-centred bedside rounds on hospitalised patients’ decision control, activation and satisfaction with care. BMJ Qual Saf. 2016;25:921-928. PubMed
25. Southwick F, Lewis M, Treloar D, et al. Applying athletic principles to medical rounds to improve teaching and patient care. Acad Med. 2014;89(7):1018-1023. PubMed
26. Najafi N, Monash B, Mourad M, et al. Improving attending rounds: Qualitative reflections from multidisciplinary providers. Hosp Pract (1995). 2015;43(3):186-190. PubMed
27. Altman DG. Practical Statistics For Medical Research. Boca Raton, FL: Chapman & Hall/CRC; 2006.
28. Gonzalo JD, Chuang CH, Huang G, Smith C. The return of bedside rounds: an educational intervention. J Gen Intern Med. 2010;25(8):792-798. PubMed
29. Fletcher KE, Rankey DS, Stern DT. Bedside interactions from the other side of the bedrail. J Gen Intern Med. 2005;20(1):58-61. PubMed
30. Gatorounds: Applying Championship Athletic Principles to Healthcare. University of Florida Health. http://gatorounds.med.ufl.edu/surveys/. Accessed March 1, 2013.
31. Gonzalo JD, Heist BS, Duffy BL, et al. The value of bedside rounds: a multicenter qualitative study. Teach Learn Med. 2013;25(4):326-333. PubMed
32. Rogers HD, Carline JD, Paauw DS. Examination room presentations in general internal medicine clinic: patients’ and students’ perceptions. Acad Med. 2003;78(9):945-949. PubMed
33. Fletcher KE, Furney SL, Stern DT. Patients speak: what’s really important about bedside interactions with physician teams. Teach Learn Med. 2007;19(2):120-127. PubMed
34. Satterfield JM, Bereknyei S, Hilton JF, et al. The prevalence of social and behavioral topics and related educational opportunities during attending rounds. Acad Med. 2014; 89(11):1548-1557. PubMed
35. Kroenke K, Simmons JO, Copley JB, Smith C. Attending rounds: a survey of physician attitudes. J Gen Intern Med. 1990;5(3):229-233. PubMed
36. Castiglioni A, Shewchuk RM, Willett LL, Heudebert GR, Centor RM. A pilot study using nominal group technique to assess residents’ perceptions of successful attending rounds. J Gen Intern Med. 2008;23(7):1060-1065. PubMed
37. Crumlish CM, Yialamas MA, McMahon GT. Quantification of bedside teaching by an academic hospitalist group. J Hosp Med. 2009;4(5):304-307. PubMed
38. Gonzalo JD, Wolpaw DR, Lehman E, Chuang CH. Patient-centered interprofessional collaborative care: factors associated with bedside interprofessional rounds. J Gen Intern Med. 2014;29(7):1040-1047. PubMed
39. Roy B, Castiglioni A, Kraemer RR, et al. Using cognitive mapping to define key domains for successful attending rounds. J Gen Intern Med. 2012;27(11):1492-1498. PubMed
40. Bhansali P, Birch S, Campbell JK, et al. A time-motion study of inpatient rounds using a family-centered rounds model. Hosp Pediatr. 2013;3(1):31-38. PubMed
© 2017 Society of Hospital Medicine