User login
Electronic Order Volume as a Meaningful Component in Estimating Patient Complexity and Resident Physician Workload
Resident physician workload has traditionally been measured by patient census.1,2 However, census and other volume-based metrics such as daily admissions may not accurately reflect workload due to variation in patient complexity. Relative value units (RVUs) are another commonly used marker of workload, but the validity of this metric relies on accurate coding, usually done by the attending physician, and is less directly related to resident physician workload. Because much of hospital-based medicine is mediated through the electronic health record (EHR), which can capture differences in patient complexity,3 electronic records could be harnessed to more comprehensively describe residents’ work. Current government estimates indicate that several hundred companies offer certified EHRs, thanks in large part to the Health Information Technology for Economic and Clinical Health (HITECH) Act of 2009, which aimed to promote adoption and meaningful use of health information technology.4, 5 These systems can collect important data about the usage and operating patterns of physicians, which may provide an insight into workload.6-8
Accurately measuring workload is important because of the direct link that has been drawn between physician workload and quality metrics. In a study of attending hospitalists, higher workload, as measured by patient census and RVUs, was associated with longer lengths of stay and higher costs of hospitalization.9 Another study among medical residents found that as daily admissions increased, length of stay, cost, and inpatient mortality appeared to rise.10 Although these studies used only volume-based workload metrics, the implication that high workload may negatively impact patient care hints at a possible trade-off between the two that should inform discussions of physician productivity.
In the current study, we examine whether data obtained from the EHR, particularly electronic order volume, could provide valuable information, in addition to patient volume, about resident physician workload. We first tested the feasibility and validity of using electronic order volume as an important component of clinical workload by examining the relationship between electronic order volume and well-established factors that are likely to increase the workload of residents, including patient level of care and severity of illness. Then, using order volume as a marker for workload, we sought to describe whether higher order volumes were associated with two discharge-related quality metrics, completion of a high-quality after-visit summary and timely discharge summary, postulating that quality metrics may suffer when residents are busier.
METHODS
Study Design and Setting
We performed a single-center retrospective cohort study of patients admitted to the internal medicine service at the University of California, San Francisco (UCSF) Medical Center between May 1, 2015 and July 31, 2016. UCSF is a 600-bed academic medical center, and the inpatient internal medicine teaching service manages an average daily census of 80-90 patients. Medicine teams care for patients on the general acute-care wards, the step-down units (for patients with higher acuity of care), and also patients in the intensive care unit (ICU). ICU patients are comanaged by general medicine teams and intensive care teams; internal medicine teams enter all electronic orders for ICU patients, except for orders for respiratory care or sedating medications. The inpatient internal medicine teaching service comprises eight teams each supervised by an attending physician, a senior resident (in the second or third year of residency training), two interns, and a third- and/or fourth-year medical student. Residents place all clinical orders and complete all clinical documentation through the EHR (Epic Systems, Verona, Wisconsin).11 Typically, the bulk of the orders and documentation, including discharge documentation, is performed by interns; however, the degree of senior resident involvement in these tasks is variable and team-dependent. In addition to the eight resident teams, there are also four attending hospitalist-only internal medicine teams, who manage a service of ~30-40 patients.
Study Population
Our study population comprised all hospitalized adults admitted to the eight resident-run teams on the internal medicine teaching service. Patients cared for by hospitalist-only teams were not included in this analysis. Because the focus of our study was on hospitalizations, individual patients may have been included multiple times over the course of the study. Hospitalizations were excluded if they did not have complete Medicare Severity-Diagnosis Related Group (MS-DRG) data,12 since this was used as our severity of illness marker. This occurred either because patients were not discharged by the end of the study period or because they had a length of stay of less than one day, because this metric was not assigned to these short-stay (observation) patients.
Data Collection
All electronic orders placed during the study period were obtained by extracting data from Epic’s Clarity database. Our EHR allows for the use of order sets; each order in these sets was counted individually, so that an order set with several orders would not be identified as one order. We identified the time and date that the order was placed, the ordering physician, the identity of the patient for which the order was placed, and the location of the patient when the order was placed, to determine the level of care (ICU, step-down, or general medicine unit). To track the composite volume of orders placed by resident teams, we matched each ordering physician to his or her corresponding resident team using our physician scheduling database, Amion (Spiral Software). We obtained team census by tabulating the total number of patients that a single resident team placed orders on over the course of a given calendar day. From billing data, we identified the MS-DRG weight that was assigned at the end of each hospitalization. Finally, we collected data on adherence to two discharge-related quality metrics to determine whether increased order volume was associated with decreased rates of adherence to these metrics. Using departmental patient-level quality improvement data, we determined whether each metric was met on discharge at the patient level. We also extracted patient-level demographic data, including age, sex, and insurance status, from this departmental quality improvement database.
Discharge Quality Outcome Metrics
We hypothesized that as the total daily electronic orders of a resident team increased, the rate of completion of two discharge-related quality metrics would decline due to the greater time constraints placed on the teams. The first metric we used was the completion of a high-quality after-visit summary (AVS), which has been described by the Centers for Medicare and Medicaid Services as part of its Meaningful Use Initiative.13 It was selected by the residents in our program as a particularly high-priority quality metric. Our institution specifically defines a “high-quality” AVS as including the following three components: a principal hospital problem, patient instructions, and follow-up information. The second discharge-related quality metric was the completion of a timely discharge summary, another measure recognized as a critical component in high-quality care.14 To be considered timely, the discharge summary had to be filed no later than 24 hours after the discharge order was entered into the EHR. This metric was more recently tracked by the internal medicine department and was not selected by the residents as a high-priority metric.
Statistical Analysis
To examine how the order volume per day changed throughout each sequential day of hospital admission, mean orders per hospital day with 95% CIs were plotted. We performed an aggregate analysis of all orders placed for each patient per day across three different levels of care (ICU, step-down, and general medicine). For each day of the study period, we summed all orders for all patients according to their location and divided by the number of total patients in each location to identify the average number of orders written for an ICU, step-down, and general medicine patient that day. We then calculated the mean daily orders for an ICU, step-down, and general medicine patient over the entire study period. We used ANOVA to test for statistically significant differences between the mean daily orders between these locations.
To examine the relationship between severity of illness and order volume, we performed an unadjusted patient-level analysis of orders per patient in the first three days of each hospitalization and stratified the data by the MS-DRG payment weight, which we divided into four quartiles. For each quartile, we calculated the mean number of orders placed in the first three days of admission and used ANOVA to test for statistically significant differences. We restricted the orders to the first three days of hospitalization instead of calculating mean orders per day of hospitalization because we postulated that the majority of orders were entered in these first few days and that with increasing length of stay (which we expected to occur with higher MS-DRG weight), the order volume becomes highly variable, which would tend to skew the mean orders per day.
We used multivariable logistic regression to determine whether the volume of electronic orders on the day of a given patient’s discharge, and also on the day before a given patient’s discharge, was a significant predictor of receiving a high-quality AVS. We adjusted for team census on the day of discharge, MS-DRG weight, age, sex, and insurance status. We then conducted a separate analysis of the association between electronic order volume and likelihood of completing a timely discharge summary among patients where discharge summary data were available. Logistic regression for each case was performed independently, so that team orders on the day prior to a patient’s discharge were not included in the model for the relationship between team orders on the day of a patient’s discharge and the discharge-related quality metric of interest, and vice versa, since including both in the model would be potentially disruptive given that orders on the day before and day of a patient’s discharge are likely correlated.
We also performed a subanalysis in which we restricted orders to only those placed during the daytime hours (7
IRB Approval
The study was approved by the UCSF Institutional Review Board and was granted a waiver of informed consent.
RESULTS
Population
We identified 7,296 eligible hospitalizations during the study period. After removing hospitalizations according to our exclusion criteria (Figure 1), there were 5,032 hospitalizations that were used in the analysis for which a total of 929,153 orders were written. The vast majority of patients received at least one order per day; fewer than 1% of encounter-days had zero associated orders. The top 10 discharge diagnoses identified in the cohort are listed in Appendix Table 1. A breakdown of orders by order type, across the entire cohort, is displayed in Appendix Table 2. The mean number of orders per patient per day of hospitalization is plotted in the Appendix Figure, which indicates that the number of orders is highest on the day of admission, decreases significantly after the first few days, and becomes increasingly variable with longer lengths of stay.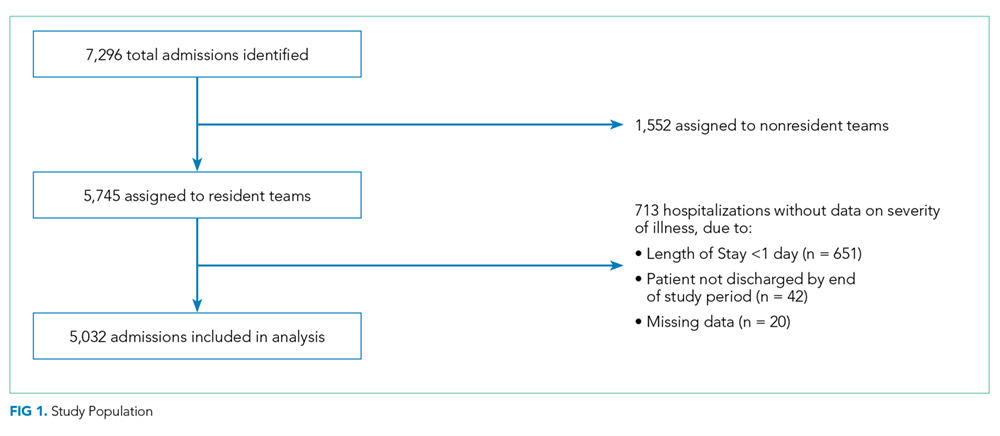
Patient Level of Care and Severity of Illness Metrics
Patients at a higher level of care had, on average, more orders entered per day. The mean order frequency was 40 orders per day for an ICU patient (standard deviation [SD] 13, range 13-134), 24 for a step-down patient (SD 6, range 11-48), and 19 for a general medicine unit patient (SD 3, range 10-31). The difference in mean daily orders was statistically significant (P < .001, Figure 2a).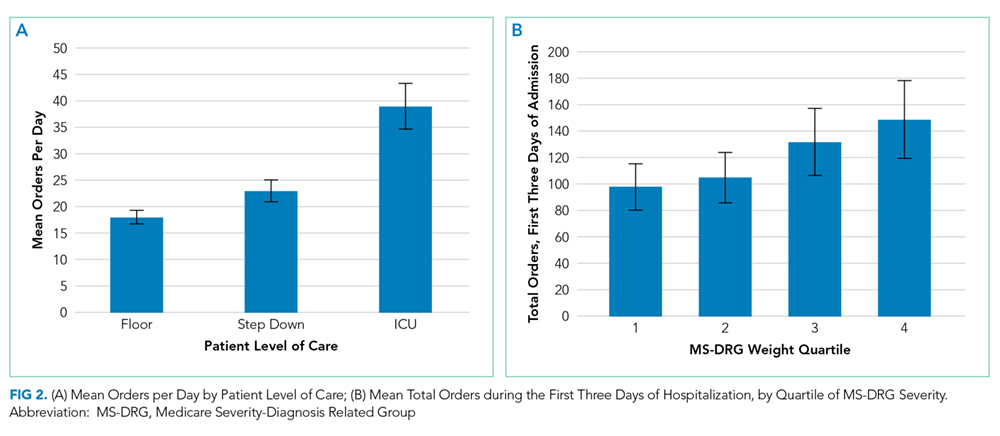
Orders also correlated with increasing severity of illness. Patients in the lowest quartile of MS-DRG weight received, on average, 98 orders in the first three days of hospitalization (SD 35, range 2-349), those in the second quartile received 105 orders (SD 38, range 10-380), those in the third quartile received 132 orders (SD 51, range 17-436), and those in the fourth and highest quartile received 149 orders (SD 59, range 32-482). Comparisons between each of these severity of illness categories were significant (P < .001, Figure 2b).
Discharge-Related Quality Metrics
The median number of orders per internal medicine team per day was 343 (IQR 261- 446). Of the 5,032 total discharged patients, 3,657 (73%) received a high-quality AVS on discharge. After controlling for team census, severity of illness, and demographic factors, there was no statistically significant association between total orders on the day of discharge and odds of receiving a high-quality AVS (OR 1.01; 95% CI 0.96-1.06), or between team orders placed the day prior to discharge and odds of receiving a high-quality AVS (OR 0.99; 95% CI 0.95-1.04; Table 1). When we restricted our analysis to orders placed during daytime hours (7 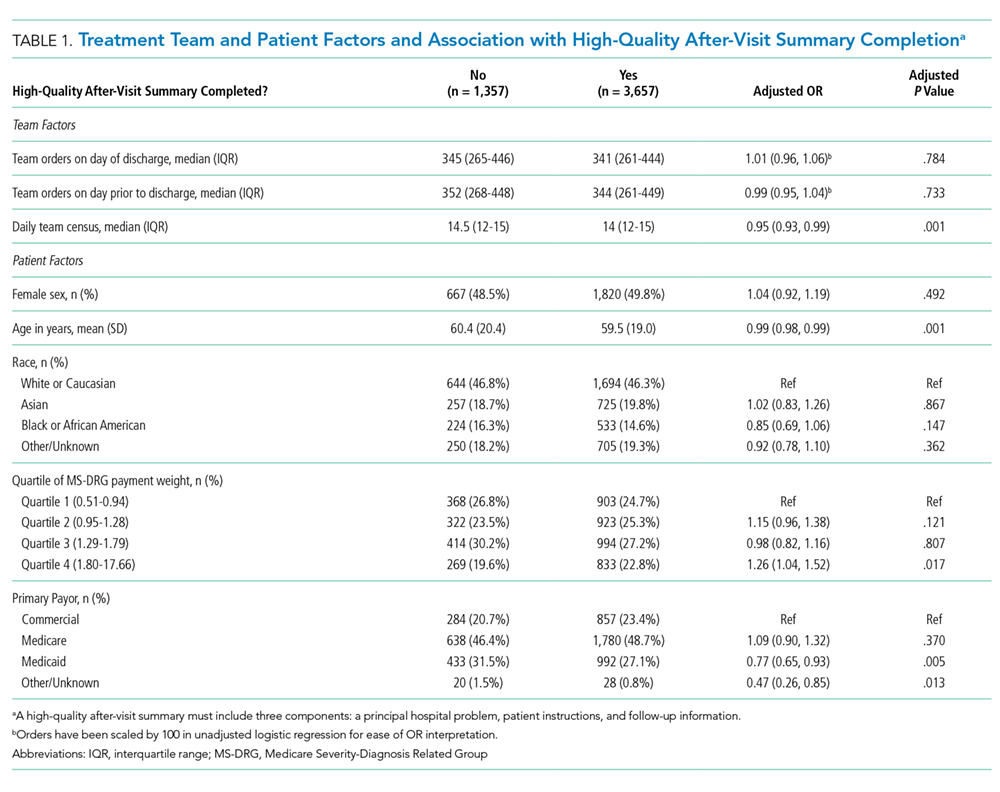
There were 3,835 patients for whom data on timing of discharge summary were available. Of these, 3,455 (91.2%) had a discharge summary completed within 24 hours. After controlling for team census, severity of illness, and demographic factors, there was no statistically significant association between total orders placed by the team on a patient’s day of discharge and odds of receiving a timely discharge summary (OR 0.96; 95% CI 0.88-1.05). However, patients were 12% less likely to receive a timely discharge summary for every 100 extra orders the team placed on the day prior to discharge (OR 0.88, 95% CI 0.82-0.95). Patients who received a timely discharge summary were cared for by teams who placed a median of 345 orders the day prior to their discharge, whereas those that did not receive a timely discharge summary were cared for by teams who placed a significantly higher number of orders (375) on the day prior to discharge (Table 2). When we restricted our analysis to only daytime orders, there were no significant changes in the findings (OR 1.00; 95% CI 0.88-1.14 for orders on the day of discharge; OR 0.84; 95% CI 0.75-0.95 for orders on the day prior to discharge).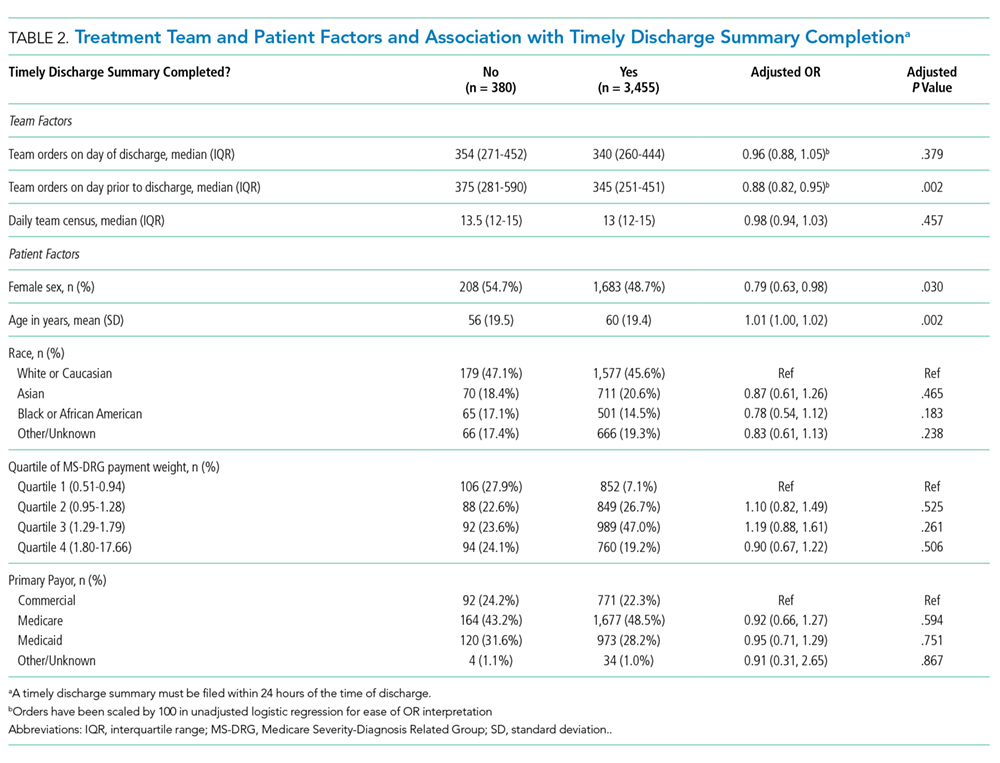
DISCUSSION
We found that electronic order volume may be a marker for patient complexity, which encompasses both level of care and severity of illness, and could be a marker of resident physician workload that harnesses readily available data from an EHR. Recent time-motion studies of internal medicine residents indicate that the majority of trainees’ time is spent on computers, engaged in indirect patient care activities such as reading electronic charts, entering electronic orders, and writing computerized notes.15-18 Capturing these tasks through metrics such as electronic order volume, as we did in this study, can provide valuable insights into resident physician workflow.
We found that ICU patients received more than twice as many orders per day than did general acute care-level patients. Furthermore, we found that patients whose hospitalizations fell into the highest MS-DRG weight quartile received approximately 50% more orders during the first three days of admission compared to that of patients whose hospitalizations fell into the lowest quartile. This strong association indicates that electronic order volume could provide meaningful additional information, in concert with other factors such as census, to describe resident physician workload.
We did not find that our workload measure was significantly associated with high-quality AVS completion. There are several possible explanations for this finding. First, adherence to this quality metric may be independent of workload, possibly because it is highly prioritized by residents at our institution. Second, adherence may only be impacted at levels of workload greater than what was experienced by the residents in our study. Finally, electronic order volume may not encompass enough of total workload to be reliably representative of resident work. However, the tight correlation between electronic order volume with severity of illness and level of care, in conjunction with the finding that patients were less likely to receive a timely discharge summary when workload was high on the day prior to a patient’s discharge, suggests that electronic order volume does indeed encompass a meaningful component of workload, and that with higher workload, adherence to some quality metrics may decline. We found that patients who received a timely discharge summary were discharged by teams who entered 30 fewer orders on the day before discharge compared with patients who did not receive a timely discharge summary. In addition to being statistically significant, it is also likely that this difference is clinically significant, although a determination of clinical significance is outside the scope of this study. Further exploration into the relationship between order volume and other quality metrics that are perhaps more sensitive to workload would be interesting.
The primary strength of our study is in how it demonstrates that EHRs can be harnessed to provide additional insights into clinical workload in a quantifiable and automated manner. Although there are a wide range of EHRs currently in use across the country, the capability to track electronic orders is common and could therefore be used broadly across institutions, with tailoring and standardization specific to each site. This technique is similar to that used by prior investigators who characterized the workload of pediatric residents by orders entered and notes written in the electronic medical record.19 However, our study is unique, in that we explored the relationship between electronic order volume and patient-level severity metrics as well as discharge-related quality metrics.
Our study is limited by several factors. When conceptualizing resident workload, several other elements that contribute to a sense of “busyness” may be independent of electronic orders and were not measured in our study.20 These include communication factors (such as language discordance, discussion with consulting services, and difficult end-of-life discussions), environmental factors (such as geographic localization), resident physician team factors (such as competing clinical or educational responsibilities), timing (in terms of day of week as well as time of year, since residents in July likely feel “busier” than residents in May), and ultimate discharge destination for patients (those going to a skilled nursing facility may require discharge documentation more urgently). Additionally, we chose to focus on the workload of resident teams, as represented by team orders, as opposed to individual work, which may be more directly correlated to our outcomes of interest, completion of a high-quality AVS, and timely discharge summary, which are usually performed by individuals.
Furthermore, we did not measure the relationship between our objective measure of workload and clinical endpoints. Instead, we chose to focus on process measures because they are less likely to be confounded by clinical factors independent of physician workload.21 Future studies should also consider obtaining direct resident-level measures of “busyness” or burnout, or other resident-centered endpoints, such as whether residents left the hospital at times consistent with duty hour regulations or whether they were able to attend educational conferences.
These limitations pose opportunities for further efforts to more comprehensively characterize clinical workload. Additional research is needed to understand and quantify the impact of patient, physician, and environmental factors that are not reflected by electronic order volume. Furthermore, an exploration of other electronic surrogates for clinical workload, such as paging volume and other EHR-derived data points, could also prove valuable in further describing the clinical workload. Future studies should also examine whether there is a relationship between these novel markers of workload and further outcomes, including both process measures and clinical endpoints.
CONCLUSIONS
Electronic order volume may provide valuable additional information for estimating the workload of resident physicians caring for hospitalized patients. Further investigation to determine whether the statistically significant differences identified in this study are clinically significant, how the technique used in this work may be applied to different EHRs, an examination of other EHR-derived metrics that may represent workload, and an exploration of additional patient-centered outcomes may be warranted.
Disclosures
Rajkomar reports personal fees from Google LLC, outside the submitted work. Dr. Khanna reports that during the conduct of the study, his salary, and the development of CareWeb (a communication platform that includes a smartphone-based paging application in use in several inpatient clinical units at University of California, San Francisco [UCSF] Medical Center) were supported by funding from the Center for Digital Health Innovation at UCSF. The CareWeb software has been licensed by Voalte.
Disclaimer
The views expressed in the submitted article are of the authors and not an official position of the institution.
1. Lurie JD, Wachter RM. Hospitalist staffing requirements. Eff Clin Pract. 1999;2(3):126-30. PubMed
2. Wachter RM. Hospitalist workload: The search for the magic number. JAMA Intern Med. 2014;174(5):794-795. doi: 10.1001/jamainternmed.2014.18. PubMed
3. Adler-Milstein J, DesRoches CM, Kralovec P, et al. Electronic health record adoption in US hospitals: progress continues, but challenges persist. Health Aff (Millwood). 2015;34(12):2174-2180. doi: 10.1377/hlthaff.2015.0992. PubMed
4. The Office of the National Coordinator for Health Information Technology, Health IT Dashboard. [cited 2018 April 4]. https://dashboard.healthit.gov/quickstats/quickstats.php Accessed June 28, 2018.
5. Index for Excerpts from the American Recovery and Reinvestment Act of 2009. Health Information Technology (HITECH) Act 2009. p. 112-164.
6. van der Sijs H, Aarts J, Vulto A, Berg M. Overriding of drug safety alerts in computerized physician order entry. J Am Med Inform Assoc. 2006;13(2):138-147. doi: 10.1197/jamia.M1809. PubMed
7. Ancker JS, Kern LM1, Edwards A, et al. How is the electronic health record being used? Use of EHR data to assess physician-level variability in technology use. J Am Med Inform Assoc. 2014;21(6):1001-1008. doi: 10.1136/amiajnl-2013-002627. PubMed
8. Hendey GW, Barth BE, Soliz T. Overnight and postcall errors in medication orders. Acad Emerg Med. 2005;12(7):629-634. doi: 10.1197/j.aem.2005.02.009. PubMed
9. Elliott DJ, Young RS2, Brice J3, Aguiar R4, Kolm P. Effect of hospitalist workload on the quality and efficiency of care. JAMA Intern Med. 2014;174(5):786-793. doi: 10.1001/jamainternmed.2014.300. PubMed
10. Ong M, Bostrom A, Vidyarthi A, McCulloch C, Auerbach A. House staff team workload and organization effects on patient outcomes in an academic general internal medicine inpatient service. Arch Intern Med. 2007;167(1):47-52. doi: 10.1001/archinte.167.1.47. PubMed
11. Epic Systems. [cited 2017 March 28]; Available from: http://www.epic.com/. Accessed June 28, 2018.
12. MS-DRG Classifications and software. https://www.cms.gov/Medicare/Medicare-Fee-for-Service-Payment/AcuteInpatientPPS/MS-DRG-Classifications-and-Software.html. Accessed June 28, 2018.
13. Hummel J, Evans P. Providing Clinical Summaries to Patients after Each Office Visit: A Technical Guide. [cited 2017 March 27]. https://www.healthit.gov/sites/default/files/measure-tools/avs-tech-guide.pdf. Accessed June 28, 2018.
14. Haycock M, Stuttaford L, Ruscombe-King O, Barker Z, Callaghan K, Davis T. Improving the percentage of electronic discharge summaries completed within 24 hours of discharge. BMJ Qual Improv Rep. 2014;3(1) pii: u205963.w2604. doi: 10.1136/bmjquality.u205963.w2604. PubMed
15. Block L, Habicht R, Wu AW, et al. In the wake of the 2003 and 2011 duty hours regulations, how do internal medicine interns spend their time? J Gen Intern Med. 2013;28(8):1042-1047. doi: 10.1007/s11606-013-2376-6. PubMed
16. Wenger N, Méan M, Castioni J, Marques-Vidal P, Waeber G, Garnier A. Allocation of internal medicine resident time in a Swiss hospital: a time and motion study of day and evening shifts. Ann Intern Med. 2017;166(8):579-586. doi: 10.7326/M16-2238. PubMed
17. Mamykina L, Vawdrey DK, Hripcsak G. How do residents spend their shift time? A time and motion study with a particular focus on the use of computers. Acad Med. 2016;91(6):827-832. doi: 10.1097/ACM.0000000000001148. PubMed
18. Fletcher KE, Visotcky AM, Slagle JM, Tarima S, Weinger MB, Schapira MM. The composition of intern work while on call. J Gen Intern Med. 2012;27(11):1432-1437. doi: 10.1007/s11606-012-2120-7. PubMed
19. Was A, Blankenburg R, Park KT. Pediatric resident workload intensity and variability. Pediatrics 2016;138(1):e20154371. doi: 10.1542/peds.2015-4371. PubMed
20. Michtalik HJ, Pronovost PJ, Marsteller JA, Spetz J, Brotman DJ. Developing a model for attending physician workload and outcomes. JAMA Intern Med. 2013;173(11):1026-1028. doi: 10.1001/jamainternmed.2013.405. PubMed
21. Mant J. Process versus outcome indicators in the assessment of quality of health care. Int J Qual Health Care. 2001;13(6):475-480. doi: 10.1093/intqhc/13.6.475. PubMed
Resident physician workload has traditionally been measured by patient census.1,2 However, census and other volume-based metrics such as daily admissions may not accurately reflect workload due to variation in patient complexity. Relative value units (RVUs) are another commonly used marker of workload, but the validity of this metric relies on accurate coding, usually done by the attending physician, and is less directly related to resident physician workload. Because much of hospital-based medicine is mediated through the electronic health record (EHR), which can capture differences in patient complexity,3 electronic records could be harnessed to more comprehensively describe residents’ work. Current government estimates indicate that several hundred companies offer certified EHRs, thanks in large part to the Health Information Technology for Economic and Clinical Health (HITECH) Act of 2009, which aimed to promote adoption and meaningful use of health information technology.4, 5 These systems can collect important data about the usage and operating patterns of physicians, which may provide an insight into workload.6-8
Accurately measuring workload is important because of the direct link that has been drawn between physician workload and quality metrics. In a study of attending hospitalists, higher workload, as measured by patient census and RVUs, was associated with longer lengths of stay and higher costs of hospitalization.9 Another study among medical residents found that as daily admissions increased, length of stay, cost, and inpatient mortality appeared to rise.10 Although these studies used only volume-based workload metrics, the implication that high workload may negatively impact patient care hints at a possible trade-off between the two that should inform discussions of physician productivity.
In the current study, we examine whether data obtained from the EHR, particularly electronic order volume, could provide valuable information, in addition to patient volume, about resident physician workload. We first tested the feasibility and validity of using electronic order volume as an important component of clinical workload by examining the relationship between electronic order volume and well-established factors that are likely to increase the workload of residents, including patient level of care and severity of illness. Then, using order volume as a marker for workload, we sought to describe whether higher order volumes were associated with two discharge-related quality metrics, completion of a high-quality after-visit summary and timely discharge summary, postulating that quality metrics may suffer when residents are busier.
METHODS
Study Design and Setting
We performed a single-center retrospective cohort study of patients admitted to the internal medicine service at the University of California, San Francisco (UCSF) Medical Center between May 1, 2015 and July 31, 2016. UCSF is a 600-bed academic medical center, and the inpatient internal medicine teaching service manages an average daily census of 80-90 patients. Medicine teams care for patients on the general acute-care wards, the step-down units (for patients with higher acuity of care), and also patients in the intensive care unit (ICU). ICU patients are comanaged by general medicine teams and intensive care teams; internal medicine teams enter all electronic orders for ICU patients, except for orders for respiratory care or sedating medications. The inpatient internal medicine teaching service comprises eight teams each supervised by an attending physician, a senior resident (in the second or third year of residency training), two interns, and a third- and/or fourth-year medical student. Residents place all clinical orders and complete all clinical documentation through the EHR (Epic Systems, Verona, Wisconsin).11 Typically, the bulk of the orders and documentation, including discharge documentation, is performed by interns; however, the degree of senior resident involvement in these tasks is variable and team-dependent. In addition to the eight resident teams, there are also four attending hospitalist-only internal medicine teams, who manage a service of ~30-40 patients.
Study Population
Our study population comprised all hospitalized adults admitted to the eight resident-run teams on the internal medicine teaching service. Patients cared for by hospitalist-only teams were not included in this analysis. Because the focus of our study was on hospitalizations, individual patients may have been included multiple times over the course of the study. Hospitalizations were excluded if they did not have complete Medicare Severity-Diagnosis Related Group (MS-DRG) data,12 since this was used as our severity of illness marker. This occurred either because patients were not discharged by the end of the study period or because they had a length of stay of less than one day, because this metric was not assigned to these short-stay (observation) patients.
Data Collection
All electronic orders placed during the study period were obtained by extracting data from Epic’s Clarity database. Our EHR allows for the use of order sets; each order in these sets was counted individually, so that an order set with several orders would not be identified as one order. We identified the time and date that the order was placed, the ordering physician, the identity of the patient for which the order was placed, and the location of the patient when the order was placed, to determine the level of care (ICU, step-down, or general medicine unit). To track the composite volume of orders placed by resident teams, we matched each ordering physician to his or her corresponding resident team using our physician scheduling database, Amion (Spiral Software). We obtained team census by tabulating the total number of patients that a single resident team placed orders on over the course of a given calendar day. From billing data, we identified the MS-DRG weight that was assigned at the end of each hospitalization. Finally, we collected data on adherence to two discharge-related quality metrics to determine whether increased order volume was associated with decreased rates of adherence to these metrics. Using departmental patient-level quality improvement data, we determined whether each metric was met on discharge at the patient level. We also extracted patient-level demographic data, including age, sex, and insurance status, from this departmental quality improvement database.
Discharge Quality Outcome Metrics
We hypothesized that as the total daily electronic orders of a resident team increased, the rate of completion of two discharge-related quality metrics would decline due to the greater time constraints placed on the teams. The first metric we used was the completion of a high-quality after-visit summary (AVS), which has been described by the Centers for Medicare and Medicaid Services as part of its Meaningful Use Initiative.13 It was selected by the residents in our program as a particularly high-priority quality metric. Our institution specifically defines a “high-quality” AVS as including the following three components: a principal hospital problem, patient instructions, and follow-up information. The second discharge-related quality metric was the completion of a timely discharge summary, another measure recognized as a critical component in high-quality care.14 To be considered timely, the discharge summary had to be filed no later than 24 hours after the discharge order was entered into the EHR. This metric was more recently tracked by the internal medicine department and was not selected by the residents as a high-priority metric.
Statistical Analysis
To examine how the order volume per day changed throughout each sequential day of hospital admission, mean orders per hospital day with 95% CIs were plotted. We performed an aggregate analysis of all orders placed for each patient per day across three different levels of care (ICU, step-down, and general medicine). For each day of the study period, we summed all orders for all patients according to their location and divided by the number of total patients in each location to identify the average number of orders written for an ICU, step-down, and general medicine patient that day. We then calculated the mean daily orders for an ICU, step-down, and general medicine patient over the entire study period. We used ANOVA to test for statistically significant differences between the mean daily orders between these locations.
To examine the relationship between severity of illness and order volume, we performed an unadjusted patient-level analysis of orders per patient in the first three days of each hospitalization and stratified the data by the MS-DRG payment weight, which we divided into four quartiles. For each quartile, we calculated the mean number of orders placed in the first three days of admission and used ANOVA to test for statistically significant differences. We restricted the orders to the first three days of hospitalization instead of calculating mean orders per day of hospitalization because we postulated that the majority of orders were entered in these first few days and that with increasing length of stay (which we expected to occur with higher MS-DRG weight), the order volume becomes highly variable, which would tend to skew the mean orders per day.
We used multivariable logistic regression to determine whether the volume of electronic orders on the day of a given patient’s discharge, and also on the day before a given patient’s discharge, was a significant predictor of receiving a high-quality AVS. We adjusted for team census on the day of discharge, MS-DRG weight, age, sex, and insurance status. We then conducted a separate analysis of the association between electronic order volume and likelihood of completing a timely discharge summary among patients where discharge summary data were available. Logistic regression for each case was performed independently, so that team orders on the day prior to a patient’s discharge were not included in the model for the relationship between team orders on the day of a patient’s discharge and the discharge-related quality metric of interest, and vice versa, since including both in the model would be potentially disruptive given that orders on the day before and day of a patient’s discharge are likely correlated.
We also performed a subanalysis in which we restricted orders to only those placed during the daytime hours (7
IRB Approval
The study was approved by the UCSF Institutional Review Board and was granted a waiver of informed consent.
RESULTS
Population
We identified 7,296 eligible hospitalizations during the study period. After removing hospitalizations according to our exclusion criteria (Figure 1), there were 5,032 hospitalizations that were used in the analysis for which a total of 929,153 orders were written. The vast majority of patients received at least one order per day; fewer than 1% of encounter-days had zero associated orders. The top 10 discharge diagnoses identified in the cohort are listed in Appendix Table 1. A breakdown of orders by order type, across the entire cohort, is displayed in Appendix Table 2. The mean number of orders per patient per day of hospitalization is plotted in the Appendix Figure, which indicates that the number of orders is highest on the day of admission, decreases significantly after the first few days, and becomes increasingly variable with longer lengths of stay.
Patient Level of Care and Severity of Illness Metrics
Patients at a higher level of care had, on average, more orders entered per day. The mean order frequency was 40 orders per day for an ICU patient (standard deviation [SD] 13, range 13-134), 24 for a step-down patient (SD 6, range 11-48), and 19 for a general medicine unit patient (SD 3, range 10-31). The difference in mean daily orders was statistically significant (P < .001, Figure 2a).
Orders also correlated with increasing severity of illness. Patients in the lowest quartile of MS-DRG weight received, on average, 98 orders in the first three days of hospitalization (SD 35, range 2-349), those in the second quartile received 105 orders (SD 38, range 10-380), those in the third quartile received 132 orders (SD 51, range 17-436), and those in the fourth and highest quartile received 149 orders (SD 59, range 32-482). Comparisons between each of these severity of illness categories were significant (P < .001, Figure 2b).
Discharge-Related Quality Metrics
The median number of orders per internal medicine team per day was 343 (IQR 261- 446). Of the 5,032 total discharged patients, 3,657 (73%) received a high-quality AVS on discharge. After controlling for team census, severity of illness, and demographic factors, there was no statistically significant association between total orders on the day of discharge and odds of receiving a high-quality AVS (OR 1.01; 95% CI 0.96-1.06), or between team orders placed the day prior to discharge and odds of receiving a high-quality AVS (OR 0.99; 95% CI 0.95-1.04; Table 1). When we restricted our analysis to orders placed during daytime hours (7
There were 3,835 patients for whom data on timing of discharge summary were available. Of these, 3,455 (91.2%) had a discharge summary completed within 24 hours. After controlling for team census, severity of illness, and demographic factors, there was no statistically significant association between total orders placed by the team on a patient’s day of discharge and odds of receiving a timely discharge summary (OR 0.96; 95% CI 0.88-1.05). However, patients were 12% less likely to receive a timely discharge summary for every 100 extra orders the team placed on the day prior to discharge (OR 0.88, 95% CI 0.82-0.95). Patients who received a timely discharge summary were cared for by teams who placed a median of 345 orders the day prior to their discharge, whereas those that did not receive a timely discharge summary were cared for by teams who placed a significantly higher number of orders (375) on the day prior to discharge (Table 2). When we restricted our analysis to only daytime orders, there were no significant changes in the findings (OR 1.00; 95% CI 0.88-1.14 for orders on the day of discharge; OR 0.84; 95% CI 0.75-0.95 for orders on the day prior to discharge).
DISCUSSION
We found that electronic order volume may be a marker for patient complexity, which encompasses both level of care and severity of illness, and could be a marker of resident physician workload that harnesses readily available data from an EHR. Recent time-motion studies of internal medicine residents indicate that the majority of trainees’ time is spent on computers, engaged in indirect patient care activities such as reading electronic charts, entering electronic orders, and writing computerized notes.15-18 Capturing these tasks through metrics such as electronic order volume, as we did in this study, can provide valuable insights into resident physician workflow.
We found that ICU patients received more than twice as many orders per day than did general acute care-level patients. Furthermore, we found that patients whose hospitalizations fell into the highest MS-DRG weight quartile received approximately 50% more orders during the first three days of admission compared to that of patients whose hospitalizations fell into the lowest quartile. This strong association indicates that electronic order volume could provide meaningful additional information, in concert with other factors such as census, to describe resident physician workload.
We did not find that our workload measure was significantly associated with high-quality AVS completion. There are several possible explanations for this finding. First, adherence to this quality metric may be independent of workload, possibly because it is highly prioritized by residents at our institution. Second, adherence may only be impacted at levels of workload greater than what was experienced by the residents in our study. Finally, electronic order volume may not encompass enough of total workload to be reliably representative of resident work. However, the tight correlation between electronic order volume with severity of illness and level of care, in conjunction with the finding that patients were less likely to receive a timely discharge summary when workload was high on the day prior to a patient’s discharge, suggests that electronic order volume does indeed encompass a meaningful component of workload, and that with higher workload, adherence to some quality metrics may decline. We found that patients who received a timely discharge summary were discharged by teams who entered 30 fewer orders on the day before discharge compared with patients who did not receive a timely discharge summary. In addition to being statistically significant, it is also likely that this difference is clinically significant, although a determination of clinical significance is outside the scope of this study. Further exploration into the relationship between order volume and other quality metrics that are perhaps more sensitive to workload would be interesting.
The primary strength of our study is in how it demonstrates that EHRs can be harnessed to provide additional insights into clinical workload in a quantifiable and automated manner. Although there are a wide range of EHRs currently in use across the country, the capability to track electronic orders is common and could therefore be used broadly across institutions, with tailoring and standardization specific to each site. This technique is similar to that used by prior investigators who characterized the workload of pediatric residents by orders entered and notes written in the electronic medical record.19 However, our study is unique, in that we explored the relationship between electronic order volume and patient-level severity metrics as well as discharge-related quality metrics.
Our study is limited by several factors. When conceptualizing resident workload, several other elements that contribute to a sense of “busyness” may be independent of electronic orders and were not measured in our study.20 These include communication factors (such as language discordance, discussion with consulting services, and difficult end-of-life discussions), environmental factors (such as geographic localization), resident physician team factors (such as competing clinical or educational responsibilities), timing (in terms of day of week as well as time of year, since residents in July likely feel “busier” than residents in May), and ultimate discharge destination for patients (those going to a skilled nursing facility may require discharge documentation more urgently). Additionally, we chose to focus on the workload of resident teams, as represented by team orders, as opposed to individual work, which may be more directly correlated to our outcomes of interest, completion of a high-quality AVS, and timely discharge summary, which are usually performed by individuals.
Furthermore, we did not measure the relationship between our objective measure of workload and clinical endpoints. Instead, we chose to focus on process measures because they are less likely to be confounded by clinical factors independent of physician workload.21 Future studies should also consider obtaining direct resident-level measures of “busyness” or burnout, or other resident-centered endpoints, such as whether residents left the hospital at times consistent with duty hour regulations or whether they were able to attend educational conferences.
These limitations pose opportunities for further efforts to more comprehensively characterize clinical workload. Additional research is needed to understand and quantify the impact of patient, physician, and environmental factors that are not reflected by electronic order volume. Furthermore, an exploration of other electronic surrogates for clinical workload, such as paging volume and other EHR-derived data points, could also prove valuable in further describing the clinical workload. Future studies should also examine whether there is a relationship between these novel markers of workload and further outcomes, including both process measures and clinical endpoints.
CONCLUSIONS
Electronic order volume may provide valuable additional information for estimating the workload of resident physicians caring for hospitalized patients. Further investigation to determine whether the statistically significant differences identified in this study are clinically significant, how the technique used in this work may be applied to different EHRs, an examination of other EHR-derived metrics that may represent workload, and an exploration of additional patient-centered outcomes may be warranted.
Disclosures
Rajkomar reports personal fees from Google LLC, outside the submitted work. Dr. Khanna reports that during the conduct of the study, his salary, and the development of CareWeb (a communication platform that includes a smartphone-based paging application in use in several inpatient clinical units at University of California, San Francisco [UCSF] Medical Center) were supported by funding from the Center for Digital Health Innovation at UCSF. The CareWeb software has been licensed by Voalte.
Disclaimer
The views expressed in the submitted article are of the authors and not an official position of the institution.
1. Lurie JD, Wachter RM. Hospitalist staffing requirements. Eff Clin Pract. 1999;2(3):126-30. PubMed
2. Wachter RM. Hospitalist workload: The search for the magic number. JAMA Intern Med. 2014;174(5):794-795. doi: 10.1001/jamainternmed.2014.18. PubMed
3. Adler-Milstein J, DesRoches CM, Kralovec P, et al. Electronic health record adoption in US hospitals: progress continues, but challenges persist. Health Aff (Millwood). 2015;34(12):2174-2180. doi: 10.1377/hlthaff.2015.0992. PubMed
4. The Office of the National Coordinator for Health Information Technology, Health IT Dashboard. [cited 2018 April 4]. https://dashboard.healthit.gov/quickstats/quickstats.php Accessed June 28, 2018.
5. Index for Excerpts from the American Recovery and Reinvestment Act of 2009. Health Information Technology (HITECH) Act 2009. p. 112-164.
6. van der Sijs H, Aarts J, Vulto A, Berg M. Overriding of drug safety alerts in computerized physician order entry. J Am Med Inform Assoc. 2006;13(2):138-147. doi: 10.1197/jamia.M1809. PubMed
7. Ancker JS, Kern LM1, Edwards A, et al. How is the electronic health record being used? Use of EHR data to assess physician-level variability in technology use. J Am Med Inform Assoc. 2014;21(6):1001-1008. doi: 10.1136/amiajnl-2013-002627. PubMed
8. Hendey GW, Barth BE, Soliz T. Overnight and postcall errors in medication orders. Acad Emerg Med. 2005;12(7):629-634. doi: 10.1197/j.aem.2005.02.009. PubMed
9. Elliott DJ, Young RS2, Brice J3, Aguiar R4, Kolm P. Effect of hospitalist workload on the quality and efficiency of care. JAMA Intern Med. 2014;174(5):786-793. doi: 10.1001/jamainternmed.2014.300. PubMed
10. Ong M, Bostrom A, Vidyarthi A, McCulloch C, Auerbach A. House staff team workload and organization effects on patient outcomes in an academic general internal medicine inpatient service. Arch Intern Med. 2007;167(1):47-52. doi: 10.1001/archinte.167.1.47. PubMed
11. Epic Systems. [cited 2017 March 28]; Available from: http://www.epic.com/. Accessed June 28, 2018.
12. MS-DRG Classifications and software. https://www.cms.gov/Medicare/Medicare-Fee-for-Service-Payment/AcuteInpatientPPS/MS-DRG-Classifications-and-Software.html. Accessed June 28, 2018.
13. Hummel J, Evans P. Providing Clinical Summaries to Patients after Each Office Visit: A Technical Guide. [cited 2017 March 27]. https://www.healthit.gov/sites/default/files/measure-tools/avs-tech-guide.pdf. Accessed June 28, 2018.
14. Haycock M, Stuttaford L, Ruscombe-King O, Barker Z, Callaghan K, Davis T. Improving the percentage of electronic discharge summaries completed within 24 hours of discharge. BMJ Qual Improv Rep. 2014;3(1) pii: u205963.w2604. doi: 10.1136/bmjquality.u205963.w2604. PubMed
15. Block L, Habicht R, Wu AW, et al. In the wake of the 2003 and 2011 duty hours regulations, how do internal medicine interns spend their time? J Gen Intern Med. 2013;28(8):1042-1047. doi: 10.1007/s11606-013-2376-6. PubMed
16. Wenger N, Méan M, Castioni J, Marques-Vidal P, Waeber G, Garnier A. Allocation of internal medicine resident time in a Swiss hospital: a time and motion study of day and evening shifts. Ann Intern Med. 2017;166(8):579-586. doi: 10.7326/M16-2238. PubMed
17. Mamykina L, Vawdrey DK, Hripcsak G. How do residents spend their shift time? A time and motion study with a particular focus on the use of computers. Acad Med. 2016;91(6):827-832. doi: 10.1097/ACM.0000000000001148. PubMed
18. Fletcher KE, Visotcky AM, Slagle JM, Tarima S, Weinger MB, Schapira MM. The composition of intern work while on call. J Gen Intern Med. 2012;27(11):1432-1437. doi: 10.1007/s11606-012-2120-7. PubMed
19. Was A, Blankenburg R, Park KT. Pediatric resident workload intensity and variability. Pediatrics 2016;138(1):e20154371. doi: 10.1542/peds.2015-4371. PubMed
20. Michtalik HJ, Pronovost PJ, Marsteller JA, Spetz J, Brotman DJ. Developing a model for attending physician workload and outcomes. JAMA Intern Med. 2013;173(11):1026-1028. doi: 10.1001/jamainternmed.2013.405. PubMed
21. Mant J. Process versus outcome indicators in the assessment of quality of health care. Int J Qual Health Care. 2001;13(6):475-480. doi: 10.1093/intqhc/13.6.475. PubMed
Hospitalist and Internal Medicine Leaders’ Perspectives of Early Discharge Challenges at Academic Medical Centers
The discharge process is a critical bottleneck for efficient patient flow through the hospital. Delayed discharges translate into delays in admissions and other patient transitions, often leading to excess costs, patient dissatisfaction, and even patient harm.1-3 The emergency department is particularly impacted by these delays; bottlenecks there lead to overcrowding, increased overall hospital length of stay, and increased risks for bad outcomes during hospitalization.2
Academic medical centers in particular may struggle with delayed discharges. In a typical teaching hospital, a team composed of an attending physician and housestaff share responsibility for determining the discharge plan. Additionally, clinical teaching activities may affect the process and quality of discharge.4-6
The prevalence and causes of delayed discharges vary greatly.7-9 To improve efficiency around discharge, many hospitals have launched initiatives designed to discharge patients earlier in the day, including goal setting (“discharge by noon”), scheduling discharge appointments, and using quality-improvement methods, such as Lean Methodology (LEAN), to remove inefficiencies within discharge processes.10-12 However, there are few data on the prevalence and effectiveness of different strategies.
The aim of this study was to survey academic hospitalist and general internal medicine physician leaders to elicit their perspectives on the factors contributing to discharge timing and the relative importance and effectiveness of early-discharge initiatives.
METHODS
Study Design, Participants, and Oversight
We obtained a list of 115 university-affiliated hospitals associated with a residency program and, in most cases, a medical school from Vizient Inc. (formerly University HealthSystem Consortium), an alliance of academic medical centers and affiliated hospitals. Each member institution submits clinical data to allow for the benchmarking of outcomes to drive transparency and quality improvement.13 More than 95% of the nation’s academic medical centers and affiliated hospitals participate in this collaborative. Vizient works with members but does not set nor promote quality metrics, such as discharge timeliness. E-mail addresses for hospital medicine physician leaders (eg, division chief) of major academic medical centers were obtained from each institution via publicly available data (eg, the institution’s website). When an institution did not have a hospital medicine section, we identified the division chief of general internal medicine. The University of California, San Francisco Institutional Review Board approved this study.
Survey Development and Domains
We developed a 30-item survey to evaluate 5 main domains of interest: current discharge practices, degree of prioritization of early discharge on the inpatient service, barriers to timely discharge, prevalence and perceived effectiveness of implemented early-discharge initiatives, and barriers to implementation of early-discharge initiatives.
Respondents were first asked to identify their institutions’ goals for discharge time. They were then asked to compare the priority of early-discharge initiatives to other departmental quality-improvement initiatives, such as reducing 30-day readmissions, improving interpreter use, and improving patient satisfaction. Next, respondents were asked to estimate the degree to which clinical or patient factors contributed to delays in discharge. Respondents were then asked whether specific early-discharge initiatives, such as changes to rounding practices or communication interventions, were implemented at their institutions and, if so, the perceived effectiveness of these initiatives at meeting discharge targets. We piloted the questions locally with physicians and researchers prior to finalizing the survey.
Data Collection
We sent surveys via an online platform (Research Electronic Data Capture).14 Nonresponders were sent 2 e-mail reminders and then a follow-up telephone call asking them to complete the survey. Only 1 survey per academic medical center was collected. Any respondent who completed the survey within 2 weeks of receiving it was entered to win a Kindle Fire.
Data Analysis
We summarized survey responses using descriptive statistics. Analysis was completed in IBM SPSS version 22 (Armonk, NY).
RESULTS
Survey Respondent and Institutional Characteristics
Of the 115 institutions surveyed, we received 61 responses (response rate of 53%), with 39 (64%) respondents from divisions of hospital medicine and 22 (36%) from divisions of general internal medicine. A majority (n = 53; 87%) stated their medicine services have a combination of teaching (with residents) and nonteaching (without residents) teams. Thirty-nine (64%) reported having daily multidisciplinary rounds.
Early Discharge as a Priority
Forty-seven (77%) institutional representatives strongly agreed or agreed that early discharge was a priority, with discharge by noon being the most common target time (n = 23; 38%). Thirty (50%) respondents rated early discharge as more important than improving interpreter use for non-English-speaking patients and equally important as reducing 30-day readmissions (n = 29; 48%) and improving patient satisfaction (n = 27; 44%).
Factors Delaying Discharge
The most common factors perceived as delaying discharge were considered external to the hospital, such as postacute care bed availability or scheduled (eg, ambulance) transport delays (n = 48; 79%), followed by patient factors such as patient transport issues (n = 44; 72%). Less commonly reported were workflow issues, such as competing primary team priorities or case manager bandwidth (n = 38; 62%; Table 1).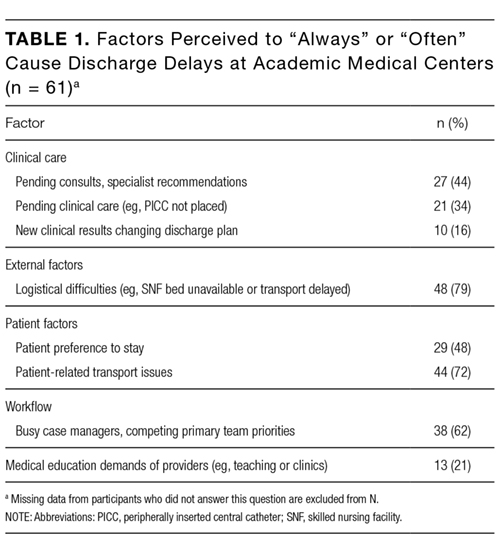
Initiatives to Improve Discharge
The most commonly implemented initiatives perceived as effective at improving discharge times were the preemptive identification of early discharges to plan discharge paperwork (n = 34; 56%), communication with patients about anticipated discharge time on the day prior to discharge (n = 29; 48%), and the implementation of additional rounds between physician teams and case managers specifically around discharge planning (n = 28; 46%). Initiatives not commonly implemented included regular audit of and feedback on discharge times to providers and teams (n = 21; 34%), the use of a discharge readiness checklist (n = 26; 43%), incentives such as bonuses or penalties (n = 37; 61%), the use of a whiteboard to indicate discharge times (n = 23; 38%), and dedicated quality-improvement approaches such as LEAN (n = 37; 61%; Table 2).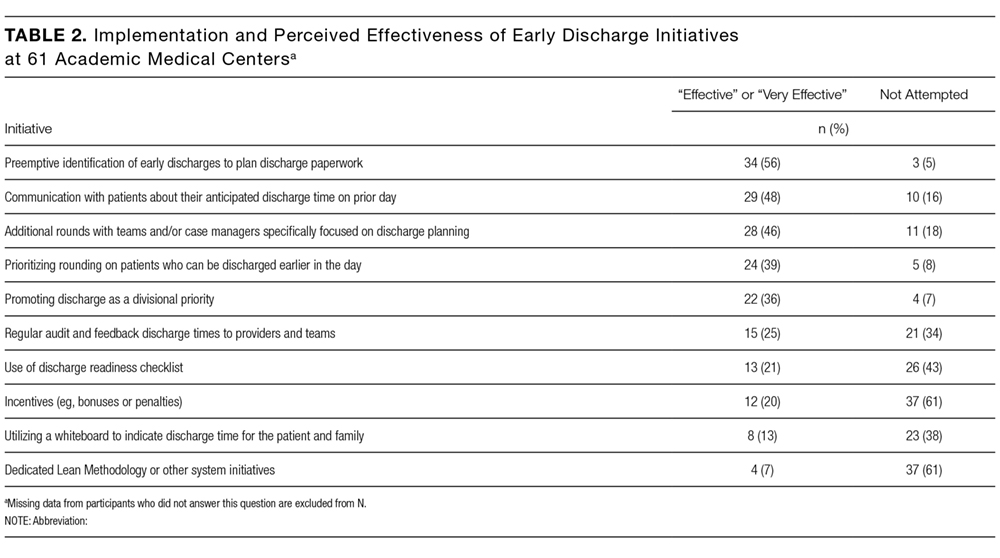
DISCUSSION
Our study suggests early discharge for medicine patients is a priority among academic institutions. Hospitalist and general internal medicine physician leaders in our study generally attributed delayed discharges to external factors, particularly unavailability of postacute care facilities and transportation delays. Having issues with finding postacute care placements is consistent with previous findings by Selker et al.15 and Carey et al.8 This is despite the 20-year difference between Selker et al.’s study and the current study, reflecting a continued opportunity for improvement, including stronger partnerships with local and regional postacute care facilities to expedite care transition and stronger discharge-planning efforts early in the admission process. Efforts in postacute care placement may be particularly important for Medicaid-insured and uninsured patients.
Our responders, hospitalist and internal medicine physician leaders, did not perceive the additional responsibilities of teaching and supervising trainees to be factors that significantly delayed patient discharge. This is in contrast to previous studies, which attributed delays in discharge to prolonged clinical decision-making related to teaching and supervision.4-6,8 This discrepancy may be due to the fact that we only surveyed single physician leaders at each institution and not residents. Our finding warrants further investigation to understand the degree to which resident skills may impact discharge planning and processes.
Institutions represented in our study have attempted a variety of initiatives promoting earlier discharge, with varying levels of perceived success. Initiatives perceived to be the most effective by hospital leaders centered on 2 main areas: (1) changing individual provider practice and (2) anticipatory discharge preparation. Interestingly, this is in discordance with the main factors labeled as causing delays in discharges, such as obtaining postacute care beds, busy case managers, and competing demands on primary teams. We hypothesize this may be because such changes require organization- or system-level changes and are perceived as more arduous than changes at the individual level. In addition, changes to individual provider behavior may be more cost- and time-effective than more systemic initiatives.
Our findings are consistent with the work published by Wertheimer and colleagues,11 who show that additional afternoon interdisciplinary rounds can help identify patients who may be discharged before noon the next day. In their study, identifying such patients in advance improved the overall early-discharge rate the following day.
Our findings should be interpreted in light of several limitations. Our survey only considers the perspectives of hospitalist and general internal medicine physician leaders at academic medical centers that are part of the Vizient Inc. collaborative. They do not represent all academic or community-based medical centers. Although the perceived effectiveness of some initiatives was high, we did not collect empirical data to support these claims or to determine which initiative had the greatest relative impact on discharge timeliness. Lastly, we did not obtain resident, nursing, or case manager perspectives on discharge practices. Given their roles as frontline providers, we may have missed these alternative perspectives.
Our study shows there is a strong interest in increasing early discharges in an effort to improve hospital throughput and patient flow.
Acknowledgments
The authors thank all participants who completed the survey and Danielle Carrier at Vizient Inc. (formally University HealthSystem Consortium) for her assistance in obtaining data.
Disclosures
Hemali Patel, Margaret Fang, Michelle Mourad, Adrienne Green, Ryan Murphy, and James Harrison report no conflicts of interest. At the time the research was conducted, Robert Wachter reported that he is a member of the Lucian Leape Institute at the National Patient Safety Foundation (no compensation except travel expenses); recently chaired an advisory board to England’s National Health Service (NHS) reviewing the NHS’s digital health strategy (no compensation except travel expenses); has a contract with UCSF from the Agency for Healthcare Research and Quality to edit a patient-safety website; receives compensation from John Wiley & Sons for writing a blog; receives royalties from Lippincott Williams & Wilkins and McGraw-Hill Education for writing and/or editing several books; receives stock options for serving on the board of Acuity Medical Management Systems; receives a yearly stipend for serving on the board of The Doctors Company; serves on the scientific advisory boards for amino.com, PatientSafe Solutions Inc., Twine, and EarlySense (for which he receives stock options); has a small royalty stake in CareWeb, a hospital communication tool developed at UCSF; and holds the Marc and Lynne Benioff Endowed Chair in Hospital Medicine and the Holly Smith Distinguished Professorship in Science and Medicine at UCSF.
1. Khanna S, Boyle J, Good N, Lind J. Impact of admission and discharge peak times on hospital overcrowding. Stud Health Technol Inform. 2011;168:82-88. PubMed
2. White BA, Biddinger PD, Chang Y, Grabowski B, Carignan S, Brown DFM. Boarding Inpatients in the Emergency Department Increases Discharged Patient Length of Stay. J Emerg Med. 2013;44(1):230-235. doi:10.1016/j.jemermed.2012.05.007. PubMed
3. Derlet RW, Richards JR. Overcrowding in the nation’s emergency departments: complex causes and disturbing effects. Ann Emerg Med. 2000;35(1):63-68. PubMed
4. da Silva SA, Valácio RA, Botelho FC, Amaral CFS. Reasons for discharge delays in teaching hospitals. Rev Saúde Pública. 2014;48(2):314-321. doi:10.1590/S0034-8910.2014048004971. PubMed
5. Greysen SR, Schiliro D, Horwitz LI, Curry L, Bradley EH. “Out of Sight, Out of Mind”: Housestaff Perceptions of Quality-Limiting Factors in Discharge Care at Teaching Hospitals. J Hosp Med Off Publ Soc Hosp Med. 2012;7(5):376-381. doi:10.1002/jhm.1928. PubMed
6. Goldman J, Reeves S, Wu R, Silver I, MacMillan K, Kitto S. Medical Residents and Interprofessional Interactions in Discharge: An Ethnographic Exploration of Factors That Affect Negotiation. J Gen Intern Med. 2015;30(10):1454-1460. doi:10.1007/s11606-015-3306-6. PubMed
7. Okoniewska B, Santana MJ, Groshaus H, et al. Barriers to discharge in an acute care medical teaching unit: a qualitative analysis of health providers’ perceptions. J Multidiscip Healthc. 2015;8:83-89. doi:10.2147/JMDH.S72633. PubMed
8. Carey MR, Sheth H, Scott Braithwaite R. A Prospective Study of Reasons for Prolonged Hospitalizations on a General Medicine Teaching Service. J Gen Intern Med. 2005;20(2):108-115. doi:10.1111/j.1525-1497.2005.40269.x. PubMed
9. Kim CS, Hart AL, Paretti RF, et al. Excess Hospitalization Days in an Academic Medical Center: Perceptions of Hospitalists and Discharge Planners. Am J Manag Care. 2011;17(2):e34-e42. http://www.ajmc.com/journals/issue/2011/2011-2-vol17-n2/AJMC_11feb_Kim_WebX_e34to42/. Accessed on October 26, 2016.
10. Gershengorn HB, Kocher R, Factor P. Management Strategies to Effect Change in Intensive Care Units: Lessons from the World of Business. Part II. Quality-Improvement Strategies. Ann Am Thorac Soc. 2014;11(3):444-453. doi:10.1513/AnnalsATS.201311-392AS. PubMed
11. Wertheimer B, Jacobs REA, Bailey M, et al. Discharge before noon: An achievable hospital goal. J Hosp Med. 2014;9(4):210-214. doi:10.1002/jhm.2154. PubMed
12. Manning DM, Tammel KJ, Blegen RN, et al. In-room display of day and time patient is anticipated to leave hospital: a “discharge appointment.” J Hosp Med. 2007;2(1):13-16. doi:10.1002/jhm.146. PubMed
13. Networks for academic medical centers. https://www.vizientinc.com/Our-networks/Networks-for-academic-medical-centers. Accessed on July 13, 2017.
14. Harris PA, Taylor R, Thielke R, Payne J, Gonzalez N, Conde JG. Research Electronic Data Capture (REDCap) - A metadata-driven methodology and workflow process for providing translational research informatics support. J Biomed Inform. 2009;42(2):377-381. doi:10.1016/j.jbi.2008.08.010. PubMed
15. Selker HP, Beshansky JR, Pauker SG, Kassirer JP. The epidemiology of delays in a teaching hospital. The development and use of a tool that detects unnecessary hospital days. Med Care. 1989;27(2):112-129. PubMed
The discharge process is a critical bottleneck for efficient patient flow through the hospital. Delayed discharges translate into delays in admissions and other patient transitions, often leading to excess costs, patient dissatisfaction, and even patient harm.1-3 The emergency department is particularly impacted by these delays; bottlenecks there lead to overcrowding, increased overall hospital length of stay, and increased risks for bad outcomes during hospitalization.2
Academic medical centers in particular may struggle with delayed discharges. In a typical teaching hospital, a team composed of an attending physician and housestaff share responsibility for determining the discharge plan. Additionally, clinical teaching activities may affect the process and quality of discharge.4-6
The prevalence and causes of delayed discharges vary greatly.7-9 To improve efficiency around discharge, many hospitals have launched initiatives designed to discharge patients earlier in the day, including goal setting (“discharge by noon”), scheduling discharge appointments, and using quality-improvement methods, such as Lean Methodology (LEAN), to remove inefficiencies within discharge processes.10-12 However, there are few data on the prevalence and effectiveness of different strategies.
The aim of this study was to survey academic hospitalist and general internal medicine physician leaders to elicit their perspectives on the factors contributing to discharge timing and the relative importance and effectiveness of early-discharge initiatives.
METHODS
Study Design, Participants, and Oversight
We obtained a list of 115 university-affiliated hospitals associated with a residency program and, in most cases, a medical school from Vizient Inc. (formerly University HealthSystem Consortium), an alliance of academic medical centers and affiliated hospitals. Each member institution submits clinical data to allow for the benchmarking of outcomes to drive transparency and quality improvement.13 More than 95% of the nation’s academic medical centers and affiliated hospitals participate in this collaborative. Vizient works with members but does not set nor promote quality metrics, such as discharge timeliness. E-mail addresses for hospital medicine physician leaders (eg, division chief) of major academic medical centers were obtained from each institution via publicly available data (eg, the institution’s website). When an institution did not have a hospital medicine section, we identified the division chief of general internal medicine. The University of California, San Francisco Institutional Review Board approved this study.
Survey Development and Domains
We developed a 30-item survey to evaluate 5 main domains of interest: current discharge practices, degree of prioritization of early discharge on the inpatient service, barriers to timely discharge, prevalence and perceived effectiveness of implemented early-discharge initiatives, and barriers to implementation of early-discharge initiatives.
Respondents were first asked to identify their institutions’ goals for discharge time. They were then asked to compare the priority of early-discharge initiatives to other departmental quality-improvement initiatives, such as reducing 30-day readmissions, improving interpreter use, and improving patient satisfaction. Next, respondents were asked to estimate the degree to which clinical or patient factors contributed to delays in discharge. Respondents were then asked whether specific early-discharge initiatives, such as changes to rounding practices or communication interventions, were implemented at their institutions and, if so, the perceived effectiveness of these initiatives at meeting discharge targets. We piloted the questions locally with physicians and researchers prior to finalizing the survey.
Data Collection
We sent surveys via an online platform (Research Electronic Data Capture).14 Nonresponders were sent 2 e-mail reminders and then a follow-up telephone call asking them to complete the survey. Only 1 survey per academic medical center was collected. Any respondent who completed the survey within 2 weeks of receiving it was entered to win a Kindle Fire.
Data Analysis
We summarized survey responses using descriptive statistics. Analysis was completed in IBM SPSS version 22 (Armonk, NY).
RESULTS
Survey Respondent and Institutional Characteristics
Of the 115 institutions surveyed, we received 61 responses (response rate of 53%), with 39 (64%) respondents from divisions of hospital medicine and 22 (36%) from divisions of general internal medicine. A majority (n = 53; 87%) stated their medicine services have a combination of teaching (with residents) and nonteaching (without residents) teams. Thirty-nine (64%) reported having daily multidisciplinary rounds.
Early Discharge as a Priority
Forty-seven (77%) institutional representatives strongly agreed or agreed that early discharge was a priority, with discharge by noon being the most common target time (n = 23; 38%). Thirty (50%) respondents rated early discharge as more important than improving interpreter use for non-English-speaking patients and equally important as reducing 30-day readmissions (n = 29; 48%) and improving patient satisfaction (n = 27; 44%).
Factors Delaying Discharge
The most common factors perceived as delaying discharge were considered external to the hospital, such as postacute care bed availability or scheduled (eg, ambulance) transport delays (n = 48; 79%), followed by patient factors such as patient transport issues (n = 44; 72%). Less commonly reported were workflow issues, such as competing primary team priorities or case manager bandwidth (n = 38; 62%; Table 1).
Initiatives to Improve Discharge
The most commonly implemented initiatives perceived as effective at improving discharge times were the preemptive identification of early discharges to plan discharge paperwork (n = 34; 56%), communication with patients about anticipated discharge time on the day prior to discharge (n = 29; 48%), and the implementation of additional rounds between physician teams and case managers specifically around discharge planning (n = 28; 46%). Initiatives not commonly implemented included regular audit of and feedback on discharge times to providers and teams (n = 21; 34%), the use of a discharge readiness checklist (n = 26; 43%), incentives such as bonuses or penalties (n = 37; 61%), the use of a whiteboard to indicate discharge times (n = 23; 38%), and dedicated quality-improvement approaches such as LEAN (n = 37; 61%; Table 2).
DISCUSSION
Our study suggests early discharge for medicine patients is a priority among academic institutions. Hospitalist and general internal medicine physician leaders in our study generally attributed delayed discharges to external factors, particularly unavailability of postacute care facilities and transportation delays. Having issues with finding postacute care placements is consistent with previous findings by Selker et al.15 and Carey et al.8 This is despite the 20-year difference between Selker et al.’s study and the current study, reflecting a continued opportunity for improvement, including stronger partnerships with local and regional postacute care facilities to expedite care transition and stronger discharge-planning efforts early in the admission process. Efforts in postacute care placement may be particularly important for Medicaid-insured and uninsured patients.
Our responders, hospitalist and internal medicine physician leaders, did not perceive the additional responsibilities of teaching and supervising trainees to be factors that significantly delayed patient discharge. This is in contrast to previous studies, which attributed delays in discharge to prolonged clinical decision-making related to teaching and supervision.4-6,8 This discrepancy may be due to the fact that we only surveyed single physician leaders at each institution and not residents. Our finding warrants further investigation to understand the degree to which resident skills may impact discharge planning and processes.
Institutions represented in our study have attempted a variety of initiatives promoting earlier discharge, with varying levels of perceived success. Initiatives perceived to be the most effective by hospital leaders centered on 2 main areas: (1) changing individual provider practice and (2) anticipatory discharge preparation. Interestingly, this is in discordance with the main factors labeled as causing delays in discharges, such as obtaining postacute care beds, busy case managers, and competing demands on primary teams. We hypothesize this may be because such changes require organization- or system-level changes and are perceived as more arduous than changes at the individual level. In addition, changes to individual provider behavior may be more cost- and time-effective than more systemic initiatives.
Our findings are consistent with the work published by Wertheimer and colleagues,11 who show that additional afternoon interdisciplinary rounds can help identify patients who may be discharged before noon the next day. In their study, identifying such patients in advance improved the overall early-discharge rate the following day.
Our findings should be interpreted in light of several limitations. Our survey only considers the perspectives of hospitalist and general internal medicine physician leaders at academic medical centers that are part of the Vizient Inc. collaborative. They do not represent all academic or community-based medical centers. Although the perceived effectiveness of some initiatives was high, we did not collect empirical data to support these claims or to determine which initiative had the greatest relative impact on discharge timeliness. Lastly, we did not obtain resident, nursing, or case manager perspectives on discharge practices. Given their roles as frontline providers, we may have missed these alternative perspectives.
Our study shows there is a strong interest in increasing early discharges in an effort to improve hospital throughput and patient flow.
Acknowledgments
The authors thank all participants who completed the survey and Danielle Carrier at Vizient Inc. (formally University HealthSystem Consortium) for her assistance in obtaining data.
Disclosures
Hemali Patel, Margaret Fang, Michelle Mourad, Adrienne Green, Ryan Murphy, and James Harrison report no conflicts of interest. At the time the research was conducted, Robert Wachter reported that he is a member of the Lucian Leape Institute at the National Patient Safety Foundation (no compensation except travel expenses); recently chaired an advisory board to England’s National Health Service (NHS) reviewing the NHS’s digital health strategy (no compensation except travel expenses); has a contract with UCSF from the Agency for Healthcare Research and Quality to edit a patient-safety website; receives compensation from John Wiley & Sons for writing a blog; receives royalties from Lippincott Williams & Wilkins and McGraw-Hill Education for writing and/or editing several books; receives stock options for serving on the board of Acuity Medical Management Systems; receives a yearly stipend for serving on the board of The Doctors Company; serves on the scientific advisory boards for amino.com, PatientSafe Solutions Inc., Twine, and EarlySense (for which he receives stock options); has a small royalty stake in CareWeb, a hospital communication tool developed at UCSF; and holds the Marc and Lynne Benioff Endowed Chair in Hospital Medicine and the Holly Smith Distinguished Professorship in Science and Medicine at UCSF.
1. Khanna S, Boyle J, Good N, Lind J. Impact of admission and discharge peak times on hospital overcrowding. Stud Health Technol Inform. 2011;168:82-88. PubMed
2. White BA, Biddinger PD, Chang Y, Grabowski B, Carignan S, Brown DFM. Boarding Inpatients in the Emergency Department Increases Discharged Patient Length of Stay. J Emerg Med. 2013;44(1):230-235. doi:10.1016/j.jemermed.2012.05.007. PubMed
3. Derlet RW, Richards JR. Overcrowding in the nation’s emergency departments: complex causes and disturbing effects. Ann Emerg Med. 2000;35(1):63-68. PubMed
4. da Silva SA, Valácio RA, Botelho FC, Amaral CFS. Reasons for discharge delays in teaching hospitals. Rev Saúde Pública. 2014;48(2):314-321. doi:10.1590/S0034-8910.2014048004971. PubMed
5. Greysen SR, Schiliro D, Horwitz LI, Curry L, Bradley EH. “Out of Sight, Out of Mind”: Housestaff Perceptions of Quality-Limiting Factors in Discharge Care at Teaching Hospitals. J Hosp Med Off Publ Soc Hosp Med. 2012;7(5):376-381. doi:10.1002/jhm.1928. PubMed
6. Goldman J, Reeves S, Wu R, Silver I, MacMillan K, Kitto S. Medical Residents and Interprofessional Interactions in Discharge: An Ethnographic Exploration of Factors That Affect Negotiation. J Gen Intern Med. 2015;30(10):1454-1460. doi:10.1007/s11606-015-3306-6. PubMed
7. Okoniewska B, Santana MJ, Groshaus H, et al. Barriers to discharge in an acute care medical teaching unit: a qualitative analysis of health providers’ perceptions. J Multidiscip Healthc. 2015;8:83-89. doi:10.2147/JMDH.S72633. PubMed
8. Carey MR, Sheth H, Scott Braithwaite R. A Prospective Study of Reasons for Prolonged Hospitalizations on a General Medicine Teaching Service. J Gen Intern Med. 2005;20(2):108-115. doi:10.1111/j.1525-1497.2005.40269.x. PubMed
9. Kim CS, Hart AL, Paretti RF, et al. Excess Hospitalization Days in an Academic Medical Center: Perceptions of Hospitalists and Discharge Planners. Am J Manag Care. 2011;17(2):e34-e42. http://www.ajmc.com/journals/issue/2011/2011-2-vol17-n2/AJMC_11feb_Kim_WebX_e34to42/. Accessed on October 26, 2016.
10. Gershengorn HB, Kocher R, Factor P. Management Strategies to Effect Change in Intensive Care Units: Lessons from the World of Business. Part II. Quality-Improvement Strategies. Ann Am Thorac Soc. 2014;11(3):444-453. doi:10.1513/AnnalsATS.201311-392AS. PubMed
11. Wertheimer B, Jacobs REA, Bailey M, et al. Discharge before noon: An achievable hospital goal. J Hosp Med. 2014;9(4):210-214. doi:10.1002/jhm.2154. PubMed
12. Manning DM, Tammel KJ, Blegen RN, et al. In-room display of day and time patient is anticipated to leave hospital: a “discharge appointment.” J Hosp Med. 2007;2(1):13-16. doi:10.1002/jhm.146. PubMed
13. Networks for academic medical centers. https://www.vizientinc.com/Our-networks/Networks-for-academic-medical-centers. Accessed on July 13, 2017.
14. Harris PA, Taylor R, Thielke R, Payne J, Gonzalez N, Conde JG. Research Electronic Data Capture (REDCap) - A metadata-driven methodology and workflow process for providing translational research informatics support. J Biomed Inform. 2009;42(2):377-381. doi:10.1016/j.jbi.2008.08.010. PubMed
15. Selker HP, Beshansky JR, Pauker SG, Kassirer JP. The epidemiology of delays in a teaching hospital. The development and use of a tool that detects unnecessary hospital days. Med Care. 1989;27(2):112-129. PubMed
© 2017 Society of Hospital Medicine
Associations of Physician Empathy with Patient Anxiety and Ratings of Communication in Hospital Admission Encounters
Admission to a hospital can be a stressful event,1,2 and patients report having many concerns at the time of hospital admission.3 Over the last 20 years, the United States has widely adopted the hospitalist model of inpatient care. Although this model has clear benefits, it also has the potential to contribute to patient stress, as hospitalized patients generally lack preexisting relationships with their inpatient physicians.4,5 In this changing hospital environment, defining and promoting effective medical communication has become an essential goal of both individual practitioners and medical centers.
Successful communication and strong therapeutic relationships with physicians support patients’ coping with illness-associated stress6,7 as well as promote adherence to medical treatment plans.8 Empathy serves as an important building block of patient-centered communication and encourages a strong therapeutic alliance.9 Studies from primary care, oncology, and intensive care unit (ICU) settings indicate that physician empathy is associated with decreased emotional distress,10,11 improved ratings of communication,12 and even better medical outcomes.13
Prior work has shown that hospitalists, like other clinicians, underutilize empathy as a tool in their daily interactions with patients.14-16 Our prior qualitative analysis of audio-recorded hospitalist-patient admission encounters indicated that how hospitalists respond to patient expressions of negative emotion influences relationships with patients and alignment around care plans.17 To determine whether empathic communication is associated with patient-reported outcomes in the hospitalist model, we quantitatively analyzed coded admission encounters and survey data to examine the association between hospitalists’ responses to patient expressions of negative emotion (anxiety, sadness, and anger) and patient anxiety and ratings of communication. Given the often-limited time hospitalists have to complete admission encounters, we also examined the association between response to emotion and encounter length.
METHODS
We analyzed data collected as part of an observational study of hospitalist-patient communication during hospital admission encounters14 to assess the association between the way physicians responded to patient expressions of negative emotion and patient anxiety, ratings of communication in the encounter, and encounter length. We collected data between August 2008 and March 2009 on the general medical service at 2 urban hospitals that are part of an academic medical center. Participants were attending hospitalists (not physician trainees), and patients admitted under participating hospitalists’ care who were able to communicate verbally in English and provide informed consent for the study. The institutional review board at the University of California, San Francisco approved the study; physician and patient participants provided written informed consent.
Enrollment and data collection has been described previously.17 Our cohort for this analysis included 76 patients of 27 physicians who completed encounter audio recordings and pre- and postencounter surveys. Following enrollment, patients completed a preencounter survey to collect demographic information and to measure their baseline anxiety via the State Anxiety Scale (STAI-S), which assesses transient anxious mood using 20 items answered on a 4-point scale for a final score range of 20 to 80.10,18,19 We timed and audio-recorded admission encounters. Encounter recordings were obtained solely from patient interactions with attending hospitalists and did not take into account the time patients may have spent with other physicians, including trainees. After the encounter, patients completed postencounter surveys, which included the STAI-S and patients’ ratings of communication during the encounter. To rate communication, patients responded to 7 items on a 0- to 10-point scale that were derived from previous work (Table 1)12,20,21; the anchors were “not at all” and “completely.” To identify patients with serious illness, which we used as a covariate in regression models, we asked physicians on a postencounter survey whether or not they “would be surprised by this patient’s death or admission to the ICU in the next year.”22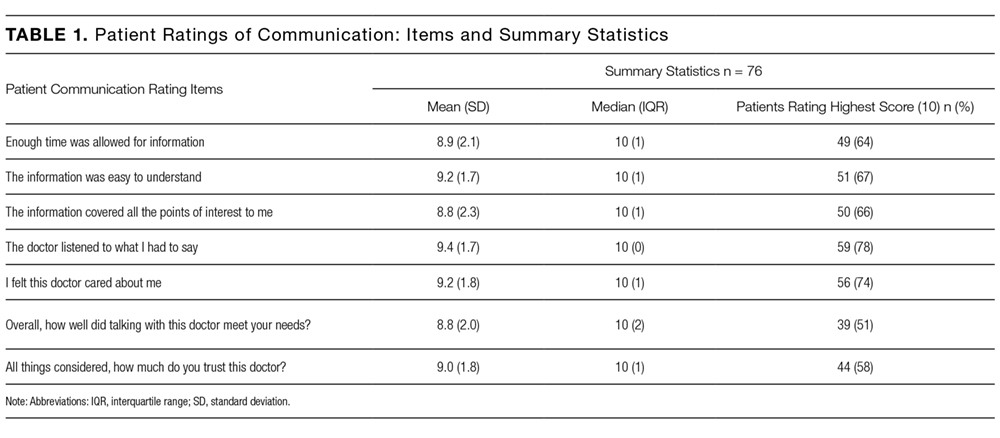
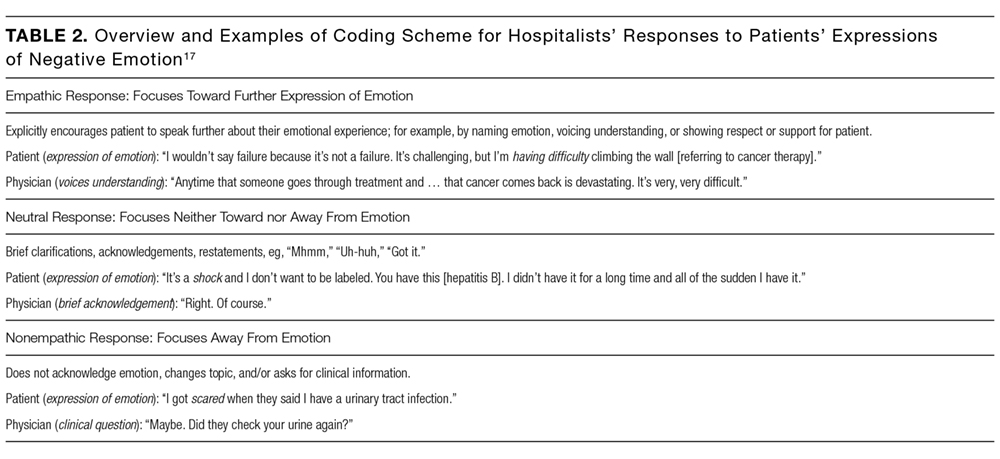
We considered physician as a clustering variable in the calculation of robust standard errors for all models. In addition, we included in each model covariates that were associated with the outcome at P ≤ 0.10, including patient gender, patient age, serious illness,22 preencounter anxiety, encounter length, and hospital. We considered P values < 0.05 to be statistically significant. We used Stata SE 13 (StataCorp LLC, College Station, TX) for all statistical analyses.
RESULTS

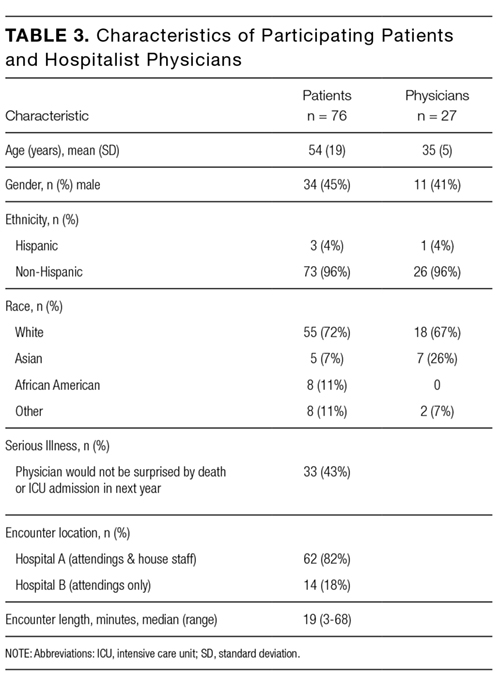
We analyzed data from admission encounters with 76 patients (consent rate 63%) and 27 hospitalists (consent rate 91%). Their characteristics are shown in Table 3. Median encounter length was 19 minutes (mean 21 minutes, range 3-68). Patients expressed negative emotion in 190 instances across all encounters; median number of expressions per encounter was 1 (range 0-14). Hospitalists responded empathically to 32% (n = 61) of the patient expressions, neutrally to 43% (n = 81), and nonempathically to 25% (n = 48).
The STAI-S was normally distributed. The mean preencounter STAI-S score was 39 (standard deviation [SD] 8.9). Mean postencounter STAI-S score was 38 (SD 10.7). Mean change in anxiety over the course of the encounter, calculated as the postencounter minus preencounter mean was −1.2 (SD 7.6). Table 1 shows summary statistics for the patient ratings of communication items. All items were rated highly. Across the items, between 51% and 78% of patients rated the highest score of 10.
Across the range of frequencies of emotional expressions per encounter in our data set (0-14 expressions), each additional empathic hospitalist response was associated with a 1.65-point decrease in the STAI-S (95% confidence interval [CI], 0.48-2.82). We did not find significant associations between changes in the STAI-S and the number of neutral hospitalist responses (−0.65 per response; 95% CI, −1.67-0.37) or nonempathic hospitalist responses (0.61 per response; 95% CI, −0.88-2.10).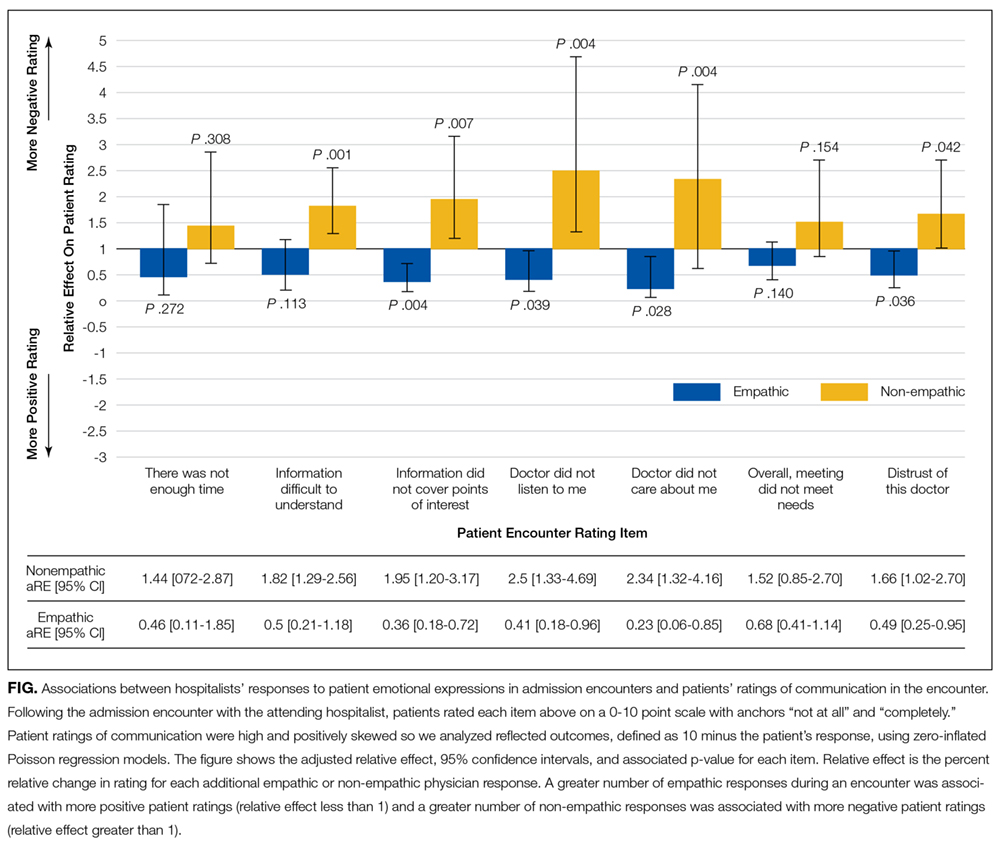
In addition, nonempathic responses were associated with more negative ratings of communication for 5 of the 7 items: ease of understanding information, covering points of interest, the doctor listening, the doctor caring, and trusting the doctor. For example, for the item “I felt this doctor cared about me,” each nonempathic hospitalist response was associated with a more than doubling of negative patient ratings (aRE: 2.3; 95% CI, 1.32-4.16). Neutral physician responses to patient expressions of negative emotion were associated with less negative patient ratings for 2 of the items: covering points of interest (aRE 0.68; 95% CI, 0.51-0.90) and trusting the doctor (aRE: 0.86; 95% CI, 0.75-0.99).
We did not find a statistical association between encounter length and the number of empathic hospitalist responses in the encounter (percent change in encounter length per response [PC]: 1%; 95% CI, −8%-10%) or the number of nonempathic responses (PC: 18%; 95% CI, −2%-42%). We did find a statistically significant association between the number of neutral responses and encounter length (PC: 13%; 95% CI, 3%-24%), corresponding to 2.5 minutes of additional encounter time per neutral response for the median encounter length of 19 minutes.
DISCUSSION
Our study set out to measure how hospitalists responded to expressions of negative emotion during admission encounters with patients and how those responses correlated with patient anxiety, ratings of communication, and encounter length. We found that empathic responses were associated with diminishing patient anxiety after the visit, as well as with better ratings of several domains of hospitalist communication. Moreover, nonempathic responses to negative emotion were associated with more strongly negative ratings of hospitalist communication. Finally, while clinicians may worry that encouraging patients to speak further about emotion will result in excessive visit lengths, we did not find a statistical association between empathic responses and encounter duration. To our knowledge, this is the first study to indicate an association between empathy and patient anxiety and communication ratings within the hospitalist model, which is rapidly becoming the predominant model for providing inpatient care in the United States.4,5
As in oncologic care, anxiety is an emotion commonly confronted by clinicians meeting admitted medical patients for the first time. Studies show that not only do patient anxiety levels remain high throughout a hospital course, patients who experience higher levels of anxiety tend to stay longer in the hospital.1,2,27-30 But unlike oncologic care or other therapy provided in an outpatient setting, the hospitalist model does not facilitate “continuity” of care, or the ability to care for the same patients over a long period of time. This reality of inpatient care makes rapid, effective rapport-building critical to establishing strong physician-patient relationships. In this setting, a simple communication tool that is potentially able to reduce inpatients’ anxiety could have a meaningful impact on hospitalist-provided care and patient outcomes.
In terms of the magnitude of the effect of empathic responses, the clinical significance of a 1.65-point decrease in the STAI-S anxiety score is not precisely clear. A prior study that examined the effect of music therapy on anxiety levels in patients with cancer found an average anxiety reduction of approximately 9.5 units on the STAIS-S scale after sensitivity analysis, suggesting a rather large meaningful effect size.31 Given we found a reduction of 1.65 points for each empathic response, however, with a range of 0-14 negative emotions expressed over a median 19-minute encounter, there is opportunity for hospitalists to achieve a clinically significant decrease in patient anxiety during an admission encounter. The potential to reduce anxiety is extended further when we consider that the impact of an empathic response may apply not just to the admission encounter alone but also to numerous other patient-clinician interactions over the course of a hospitalization.
A healthy body of communication research supports the associations we found in our study between empathy and patient ratings of communication and physicians. Families in ICU conferences rate communication more positively when physicians express empathy,12 and a number of studies indicate an association between empathy and patient satisfaction in outpatient settings.8 Given the associations we found with negative ratings on the items in our study, promoting empathic responses to expressions of emotion and, more importantly, stressing avoidance of nonempathic responses may be relevant efforts in working to improve patient satisfaction scores on surveys reporting “top box” percentages, such as Hospital Consumer Assessment of Healthcare Providers and Systems (HCAHPS). More notably, evidence indicates that empathy has positive impacts beyond satisfaction surveys, such as adherence, better diagnostic and clinical outcomes, and strengthening of patient enablement.8Not all hospitalist responses to emotion were associated with patient ratings across the 7 communication items we assessed. For example, we did not find an association between how physicians responded to patient expressions of negative emotion and patient perception that enough time was spent in the visit or the degree to which talking with the doctor met a patient’s overall needs. It follows logically, and other research supports, that empathy would influence patient ratings of physician caring and trust,32 whereas other communication factors we were unable to measure (eg, physician body language, tone, and use of jargon and patient health literacy and primary language) may have a more significant association with patient ratings of the other items we assessed.
In considering the clinical application of our results, it is important to note that communication skills, including responding empathically to patient expressions of negative emotion, can be imparted through training in the same way as abdominal examination or electrocardiogram interpretation skills.33-35 However, training of hospitalists in communication skills requires time and some financial investment on the part of the physician, their hospital or group, or, ideally, both. Effective training methods, like those for other skill acquisition, involve learner-centered teaching and practicing skills with role-play and feedback.36 Given the importance of a learner-centered approach, learning would likely be better received and more effective if it was tailored to the specific needs and patient scenarios commonly encountered by hospitalist physicians. As these programs are developed, it will be important to assess the impact of any training on the patient-reported outcomes we assessed in this observational study, along with clinical outcomes.
Our study has several limitations. First, we were only able to evaluate whether hospitalists verbally responded to patient emotion and were thus not able to account for nonverbal empathy such as facial expressions, body language, or voice tone. Second, given our patient consent rate of 63%, patients who agreed to participate in the study may have had different opinions than those who declined to participate. Also, hospitalists and patients may have behaved differently as a result of being audio recorded. We only included patients who spoke English, and our patient population was predominately non-Hispanic white. Patients who spoke other languages or came from other cultural backgrounds may have had different responses. Third, we did not use a single validated scale for patient ratings of communication, and multiple analyses increase our risk of finding statistically significant associations by chance. The skewing of the communication rating items toward high scores may also have led to our results being driven by outliers, although the model we chose for analysis does penalize for this. Furthermore, our sample size was small, leading to wide CIs and potential for lack of statistical associations due to insufficient power. Our findings warrant replication in larger studies. Fourth, the setting of our study in an academic center may affect generalizability. Finally, the age of our data (collected between 2008 and 2009) is also a limitation. Given a recent focus on communication and patient experience since the initiation of HCAHPS feedback, a similar analysis of empathy and communication methods now may result in different outcomes.
In conclusion, our results suggest that enhancing hospitalists’ empathic responses to patient expressions of negative emotion could decrease patient anxiety and improve patients’ perceptions of (and thus possibly their relationships with) hospitalists, without sacrificing efficiency. Future work should focus on tailoring and implementing communication skills training programs for hospitalists and evaluating the impact of training on patient outcomes.
Acknowledgments
The authors extend their sincere thanks to the patients and physicians who participated in this study. Dr. Anderson was funded by the National Palliative Care Research Center and the University of California, San Francisco Clinical and Translational Science Institute Career Development Program, National Institutes of Health (NIH) grant number 5 KL2 RR024130-04. Project costs were funded by a grant from the University of California, San Francisco Academic Senate.
Disclosure
All coauthors have seen and agree with the contents of this manuscript. This submission is not under review by any other publication. Wendy Anderson received funding for this project from the National Palliative Care Research Center, University of California San Francisco Clinical and Translational Science Institute (NIH grant number 5KL2RR024130-04), and the University of San Francisco Academic Senate [From Section 2 of Author Disclosure Form]. Andy Auerbach has a Patient-Centered Outcomes Research Institute research grant in development [From Section 3 of the Author Disclosure Form].
1. Walker FB, Novack DH, Kaiser DL, Knight A, Oblinger P. Anxiety and depression among medical and surgical patients nearing hospital discharge. J Gen Intern Med. 1987;2(2):99-101. PubMed
2. Castillo MI, Cooke M, Macfarlane B, Aitken LM. Factors associated with anxiety in critically ill patients: A prospective observational cohort study. Int J Nurs Stud. 2016;60:225-233. PubMed
3. Anderson WG, Winters K, Auerbach AD. Patient concerns at hospital admission. Arch Intern Med. 2011;171(15):1399-1400. PubMed
4. Kuo Y-F, Sharma G, Freeman JL, Goodwin JS. Growth in the care of older patients by hospitalists in the United States. N Engl J Med. 2009;360(11):1102-1112. PubMed
5. Wachter RM, Goldman L. Zero to 50,000 - The 20th Anniversary of the Hospitalist. N Engl J Med. 2016;375(11):1009-1011. PubMed
6. Mack JW, Block SD, Nilsson M, et al. Measuring therapeutic alliance between oncologists and patients with advanced cancer: the Human Connection Scale. Cancer. 2009;115(14):3302-3311. PubMed
7. Huff NG, Nadig N, Ford DW, Cox CE. Therapeutic Alliance between the Caregivers of Critical Illness Survivors and Intensive Care Unit Clinicians. [published correction appears in Ann Am Thorac Soc. 2016;13(4):576]. Ann Am Thorac Soc. 2015;12(11):1646-1653. PubMed
8. Derksen F, Bensing J, Lagro-Janssen A. Effectiveness of empathy in general practice: a systematic review. Br J Gen Pract. 2013;63(606):e76-e84. PubMed
9. Dwamena F, Holmes-Rovner M, Gaulden CM, et al. Interventions for providers to promote a patient-centred approach in clinical consultations. Cochrane Database Syst Rev. 2012;12:CD003267. PubMed
10. Fogarty LA, Curbow BA, Wingard JR, McDonnell K, Somerfield MR. Can 40 seconds of compassion reduce patient anxiety? J Clin Oncol. 1999;17(1):371-379. PubMed
11. Roter DL, Hall JA, Kern DE, Barker LR, Cole KA, Roca RP. Improving physicians’ interviewing skills and reducing patients’ emotional distress. A randomized clinical trial. Arch Intern Med. 1995;155(17):1877-1884. PubMed
12. Stapleton RD, Engelberg RA, Wenrich MD, Goss CH, Curtis JR. Clinician statements and family satisfaction with family conferences in the intensive care unit. Crit Care Med. 2006;34(6):1679-1685. PubMed
13. Hojat M, Louis DZ, Markham FW, Wender R, Rabinowitz C, Gonnella JS. Physicians’ empathy and clinical outcomes for diabetic patients. Acad Med. 2011;86(3):359-364. PubMed
14. Anderson WG, Winters K, Arnold RM, Puntillo KA, White DB, Auerbach AD. Studying physician-patient communication in the acute care setting: the hospitalist rapport study. Patient Educ Couns. 2011;82(2):275-279. PubMed
15. Pollak KI, Arnold RM, Jeffreys AS, et al. Oncologist communication about emotion during visits with patients with advanced cancer. J Clin Oncol. 2007;25(36):5748-5752. PubMed
16. Suchman AL, Markakis K, Beckman HB, Frankel R. A model of empathic communication in the medical interview. JAMA. 1997;277(8):678-682. PubMed
17. Adams K, Cimino JEW, Arnold RM, Anderson WG. Why should I talk about emotion? Communication patterns associated with physician discussion of patient expressions of negative emotion in hospital admission encounters. Patient Educ Couns. 2012;89(1):44-50. PubMed
18. Julian LJ. Measures of anxiety: State-Trait Anxiety Inventory (STAI), Beck Anxiety Inventory (BAI), and Hospital Anxiety and Depression Scale-Anxiety (HADS-A). Arthritis Care Res (Hoboken). 2011;63 Suppl 11:S467-S472. PubMed
19. Speilberger C, Ritterband L, Sydeman S, Reheiser E, Unger K. Assessment of emotional states and personality traits: measuring psychological vital signs. In: Butcher J, editor. Clinical personality assessment: practical approaches. New York: Oxford University Press; 1995.
20. Safran DG, Kosinski M, Tarlov AR, et al. The Primary Care Assessment Survey: tests of data quality and measurement performance. Med Care. 1998;36(5):728-739. PubMed
21. Azoulay E, Pochard F, Kentish-Barnes N, et al. Risk of post-traumatic stress symptoms in family members of intensive care unit patients. Am J Respir Crit Care Med. 2005;171(9):987-994. PubMed
22. Lynn J. Perspectives on care at the close of life. Serving patients who may die soon and their families: the role of hospice and other services. JAMA. 2001;285(7):925-932. PubMed
23. Kennifer SL, Alexander SC, Pollak KI, et al. Negative emotions in cancer care: do oncologists’ responses depend on severity and type of emotion? Patient Educ Couns. 2009;76(1):51-56. PubMed
24. Butow PN, Brown RF, Cogar S, Tattersall MHN, Dunn SM. Oncologists’ reactions to cancer patients’ verbal cues. Psychooncology. 2002;11(1):47-58. PubMed
25. Levinson W, Gorawara-Bhat R, Lamb J. A study of patient clues and physician responses in primary care and surgical settings. JAMA. 2000;284(8):1021-1027. PubMed
26. Cohen J. A coefficient of agreement for nominal scales. Educ Psychol Meas. 1960;20(1):37-46.
27. Fulop G. Anxiety disorders in the general hospital setting. Psychiatr Med. 1990;8(3):187-195. PubMed
28. Gerson S, Mistry R, Bastani R, et al. Symptoms of depression and anxiety (MHI) following acute medical/surgical hospitalization and post-discharge psychiatric diagnoses (DSM) in 839 geriatric US veterans. Int J Geriatr Psychiatry. 2004;19(12):1155-1167. PubMed
29. Kathol RG, Wenzel RP. Natural history of symptoms of depression and anxiety during inpatient treatment on general medicine wards. J Gen Intern Med. 1992;7(3):287-293. PubMed
30. Unsal A, Unaldi C, Baytemir C. Anxiety and depression levels of inpatients in the city centre of Kirşehir in Turkey. Int J Nurs Pract. 2011;17(4):411-418. PubMed
31. Bradt J, Dileo C, Grocke D, Magill L. Music interventions for improving psychological and physical outcomes in cancer patients. [Update appears in Cochrane Database Syst Rev. 2016;(8):CD006911] Cochrane Database Syst Rev. 2011;(8):CD006911. PubMed
32. Kim SS, Kaplowitz S, Johnston MV. The effects of physician empathy on patient satisfaction and compliance. Eval Health Prof. 2004;27(3):237-251. PubMed
33. Tulsky JA, Arnold RM, Alexander SC, et al. Enhancing communication between oncologists and patients with a computer-based training program: a randomized trial. Ann Intern Med. 2011;155(9):593-601. PubMed
34. Bays AM, Engelberg RA, Back AL, et al. Interprofessional communication skills training for serious illness: evaluation of a small-group, simulated patient intervention. J Palliat Med. 2014;17(2):159-166. PubMed
35. Epstein RM, Duberstein PR, Fenton JJ, et al. Effect of a Patient-Centered Communication Intervention on Oncologist-Patient Communication, Quality of Life, and Health Care Utilization in Advanced Cancer: The VOICE Randomized Clinical Trial. JAMA Oncol. 2017;3(1):92-100. PubMed
36. Berkhof M, van Rijssen HJ, Schellart AJM, Anema JR, van der Beek AJ. Effective training strategies for teaching communication skills to physicians: an overview of systematic reviews. Patient Educ Couns. 2011;84(2):152-162. PubMed
Admission to a hospital can be a stressful event,1,2 and patients report having many concerns at the time of hospital admission.3 Over the last 20 years, the United States has widely adopted the hospitalist model of inpatient care. Although this model has clear benefits, it also has the potential to contribute to patient stress, as hospitalized patients generally lack preexisting relationships with their inpatient physicians.4,5 In this changing hospital environment, defining and promoting effective medical communication has become an essential goal of both individual practitioners and medical centers.
Successful communication and strong therapeutic relationships with physicians support patients’ coping with illness-associated stress6,7 as well as promote adherence to medical treatment plans.8 Empathy serves as an important building block of patient-centered communication and encourages a strong therapeutic alliance.9 Studies from primary care, oncology, and intensive care unit (ICU) settings indicate that physician empathy is associated with decreased emotional distress,10,11 improved ratings of communication,12 and even better medical outcomes.13
Prior work has shown that hospitalists, like other clinicians, underutilize empathy as a tool in their daily interactions with patients.14-16 Our prior qualitative analysis of audio-recorded hospitalist-patient admission encounters indicated that how hospitalists respond to patient expressions of negative emotion influences relationships with patients and alignment around care plans.17 To determine whether empathic communication is associated with patient-reported outcomes in the hospitalist model, we quantitatively analyzed coded admission encounters and survey data to examine the association between hospitalists’ responses to patient expressions of negative emotion (anxiety, sadness, and anger) and patient anxiety and ratings of communication. Given the often-limited time hospitalists have to complete admission encounters, we also examined the association between response to emotion and encounter length.
METHODS
We analyzed data collected as part of an observational study of hospitalist-patient communication during hospital admission encounters14 to assess the association between the way physicians responded to patient expressions of negative emotion and patient anxiety, ratings of communication in the encounter, and encounter length. We collected data between August 2008 and March 2009 on the general medical service at 2 urban hospitals that are part of an academic medical center. Participants were attending hospitalists (not physician trainees), and patients admitted under participating hospitalists’ care who were able to communicate verbally in English and provide informed consent for the study. The institutional review board at the University of California, San Francisco approved the study; physician and patient participants provided written informed consent.
Enrollment and data collection has been described previously.17 Our cohort for this analysis included 76 patients of 27 physicians who completed encounter audio recordings and pre- and postencounter surveys. Following enrollment, patients completed a preencounter survey to collect demographic information and to measure their baseline anxiety via the State Anxiety Scale (STAI-S), which assesses transient anxious mood using 20 items answered on a 4-point scale for a final score range of 20 to 80.10,18,19 We timed and audio-recorded admission encounters. Encounter recordings were obtained solely from patient interactions with attending hospitalists and did not take into account the time patients may have spent with other physicians, including trainees. After the encounter, patients completed postencounter surveys, which included the STAI-S and patients’ ratings of communication during the encounter. To rate communication, patients responded to 7 items on a 0- to 10-point scale that were derived from previous work (Table 1)12,20,21; the anchors were “not at all” and “completely.” To identify patients with serious illness, which we used as a covariate in regression models, we asked physicians on a postencounter survey whether or not they “would be surprised by this patient’s death or admission to the ICU in the next year.”22
We considered physician as a clustering variable in the calculation of robust standard errors for all models. In addition, we included in each model covariates that were associated with the outcome at P ≤ 0.10, including patient gender, patient age, serious illness,22 preencounter anxiety, encounter length, and hospital. We considered P values < 0.05 to be statistically significant. We used Stata SE 13 (StataCorp LLC, College Station, TX) for all statistical analyses.
RESULTS
We analyzed data from admission encounters with 76 patients (consent rate 63%) and 27 hospitalists (consent rate 91%). Their characteristics are shown in Table 3. Median encounter length was 19 minutes (mean 21 minutes, range 3-68). Patients expressed negative emotion in 190 instances across all encounters; median number of expressions per encounter was 1 (range 0-14). Hospitalists responded empathically to 32% (n = 61) of the patient expressions, neutrally to 43% (n = 81), and nonempathically to 25% (n = 48).
The STAI-S was normally distributed. The mean preencounter STAI-S score was 39 (standard deviation [SD] 8.9). Mean postencounter STAI-S score was 38 (SD 10.7). Mean change in anxiety over the course of the encounter, calculated as the postencounter minus preencounter mean was −1.2 (SD 7.6). Table 1 shows summary statistics for the patient ratings of communication items. All items were rated highly. Across the items, between 51% and 78% of patients rated the highest score of 10.
Across the range of frequencies of emotional expressions per encounter in our data set (0-14 expressions), each additional empathic hospitalist response was associated with a 1.65-point decrease in the STAI-S (95% confidence interval [CI], 0.48-2.82). We did not find significant associations between changes in the STAI-S and the number of neutral hospitalist responses (−0.65 per response; 95% CI, −1.67-0.37) or nonempathic hospitalist responses (0.61 per response; 95% CI, −0.88-2.10).
In addition, nonempathic responses were associated with more negative ratings of communication for 5 of the 7 items: ease of understanding information, covering points of interest, the doctor listening, the doctor caring, and trusting the doctor. For example, for the item “I felt this doctor cared about me,” each nonempathic hospitalist response was associated with a more than doubling of negative patient ratings (aRE: 2.3; 95% CI, 1.32-4.16). Neutral physician responses to patient expressions of negative emotion were associated with less negative patient ratings for 2 of the items: covering points of interest (aRE 0.68; 95% CI, 0.51-0.90) and trusting the doctor (aRE: 0.86; 95% CI, 0.75-0.99).
We did not find a statistical association between encounter length and the number of empathic hospitalist responses in the encounter (percent change in encounter length per response [PC]: 1%; 95% CI, −8%-10%) or the number of nonempathic responses (PC: 18%; 95% CI, −2%-42%). We did find a statistically significant association between the number of neutral responses and encounter length (PC: 13%; 95% CI, 3%-24%), corresponding to 2.5 minutes of additional encounter time per neutral response for the median encounter length of 19 minutes.
DISCUSSION
Our study set out to measure how hospitalists responded to expressions of negative emotion during admission encounters with patients and how those responses correlated with patient anxiety, ratings of communication, and encounter length. We found that empathic responses were associated with diminishing patient anxiety after the visit, as well as with better ratings of several domains of hospitalist communication. Moreover, nonempathic responses to negative emotion were associated with more strongly negative ratings of hospitalist communication. Finally, while clinicians may worry that encouraging patients to speak further about emotion will result in excessive visit lengths, we did not find a statistical association between empathic responses and encounter duration. To our knowledge, this is the first study to indicate an association between empathy and patient anxiety and communication ratings within the hospitalist model, which is rapidly becoming the predominant model for providing inpatient care in the United States.4,5
As in oncologic care, anxiety is an emotion commonly confronted by clinicians meeting admitted medical patients for the first time. Studies show that not only do patient anxiety levels remain high throughout a hospital course, patients who experience higher levels of anxiety tend to stay longer in the hospital.1,2,27-30 But unlike oncologic care or other therapy provided in an outpatient setting, the hospitalist model does not facilitate “continuity” of care, or the ability to care for the same patients over a long period of time. This reality of inpatient care makes rapid, effective rapport-building critical to establishing strong physician-patient relationships. In this setting, a simple communication tool that is potentially able to reduce inpatients’ anxiety could have a meaningful impact on hospitalist-provided care and patient outcomes.
In terms of the magnitude of the effect of empathic responses, the clinical significance of a 1.65-point decrease in the STAI-S anxiety score is not precisely clear. A prior study that examined the effect of music therapy on anxiety levels in patients with cancer found an average anxiety reduction of approximately 9.5 units on the STAIS-S scale after sensitivity analysis, suggesting a rather large meaningful effect size.31 Given we found a reduction of 1.65 points for each empathic response, however, with a range of 0-14 negative emotions expressed over a median 19-minute encounter, there is opportunity for hospitalists to achieve a clinically significant decrease in patient anxiety during an admission encounter. The potential to reduce anxiety is extended further when we consider that the impact of an empathic response may apply not just to the admission encounter alone but also to numerous other patient-clinician interactions over the course of a hospitalization.
A healthy body of communication research supports the associations we found in our study between empathy and patient ratings of communication and physicians. Families in ICU conferences rate communication more positively when physicians express empathy,12 and a number of studies indicate an association between empathy and patient satisfaction in outpatient settings.8 Given the associations we found with negative ratings on the items in our study, promoting empathic responses to expressions of emotion and, more importantly, stressing avoidance of nonempathic responses may be relevant efforts in working to improve patient satisfaction scores on surveys reporting “top box” percentages, such as Hospital Consumer Assessment of Healthcare Providers and Systems (HCAHPS). More notably, evidence indicates that empathy has positive impacts beyond satisfaction surveys, such as adherence, better diagnostic and clinical outcomes, and strengthening of patient enablement.8Not all hospitalist responses to emotion were associated with patient ratings across the 7 communication items we assessed. For example, we did not find an association between how physicians responded to patient expressions of negative emotion and patient perception that enough time was spent in the visit or the degree to which talking with the doctor met a patient’s overall needs. It follows logically, and other research supports, that empathy would influence patient ratings of physician caring and trust,32 whereas other communication factors we were unable to measure (eg, physician body language, tone, and use of jargon and patient health literacy and primary language) may have a more significant association with patient ratings of the other items we assessed.
In considering the clinical application of our results, it is important to note that communication skills, including responding empathically to patient expressions of negative emotion, can be imparted through training in the same way as abdominal examination or electrocardiogram interpretation skills.33-35 However, training of hospitalists in communication skills requires time and some financial investment on the part of the physician, their hospital or group, or, ideally, both. Effective training methods, like those for other skill acquisition, involve learner-centered teaching and practicing skills with role-play and feedback.36 Given the importance of a learner-centered approach, learning would likely be better received and more effective if it was tailored to the specific needs and patient scenarios commonly encountered by hospitalist physicians. As these programs are developed, it will be important to assess the impact of any training on the patient-reported outcomes we assessed in this observational study, along with clinical outcomes.
Our study has several limitations. First, we were only able to evaluate whether hospitalists verbally responded to patient emotion and were thus not able to account for nonverbal empathy such as facial expressions, body language, or voice tone. Second, given our patient consent rate of 63%, patients who agreed to participate in the study may have had different opinions than those who declined to participate. Also, hospitalists and patients may have behaved differently as a result of being audio recorded. We only included patients who spoke English, and our patient population was predominately non-Hispanic white. Patients who spoke other languages or came from other cultural backgrounds may have had different responses. Third, we did not use a single validated scale for patient ratings of communication, and multiple analyses increase our risk of finding statistically significant associations by chance. The skewing of the communication rating items toward high scores may also have led to our results being driven by outliers, although the model we chose for analysis does penalize for this. Furthermore, our sample size was small, leading to wide CIs and potential for lack of statistical associations due to insufficient power. Our findings warrant replication in larger studies. Fourth, the setting of our study in an academic center may affect generalizability. Finally, the age of our data (collected between 2008 and 2009) is also a limitation. Given a recent focus on communication and patient experience since the initiation of HCAHPS feedback, a similar analysis of empathy and communication methods now may result in different outcomes.
In conclusion, our results suggest that enhancing hospitalists’ empathic responses to patient expressions of negative emotion could decrease patient anxiety and improve patients’ perceptions of (and thus possibly their relationships with) hospitalists, without sacrificing efficiency. Future work should focus on tailoring and implementing communication skills training programs for hospitalists and evaluating the impact of training on patient outcomes.
Acknowledgments
The authors extend their sincere thanks to the patients and physicians who participated in this study. Dr. Anderson was funded by the National Palliative Care Research Center and the University of California, San Francisco Clinical and Translational Science Institute Career Development Program, National Institutes of Health (NIH) grant number 5 KL2 RR024130-04. Project costs were funded by a grant from the University of California, San Francisco Academic Senate.
Disclosure
All coauthors have seen and agree with the contents of this manuscript. This submission is not under review by any other publication. Wendy Anderson received funding for this project from the National Palliative Care Research Center, University of California San Francisco Clinical and Translational Science Institute (NIH grant number 5KL2RR024130-04), and the University of San Francisco Academic Senate [From Section 2 of Author Disclosure Form]. Andy Auerbach has a Patient-Centered Outcomes Research Institute research grant in development [From Section 3 of the Author Disclosure Form].
1. Walker FB, Novack DH, Kaiser DL, Knight A, Oblinger P. Anxiety and depression among medical and surgical patients nearing hospital discharge. J Gen Intern Med. 1987;2(2):99-101. PubMed
2. Castillo MI, Cooke M, Macfarlane B, Aitken LM. Factors associated with anxiety in critically ill patients: A prospective observational cohort study. Int J Nurs Stud. 2016;60:225-233. PubMed
3. Anderson WG, Winters K, Auerbach AD. Patient concerns at hospital admission. Arch Intern Med. 2011;171(15):1399-1400. PubMed
4. Kuo Y-F, Sharma G, Freeman JL, Goodwin JS. Growth in the care of older patients by hospitalists in the United States. N Engl J Med. 2009;360(11):1102-1112. PubMed
5. Wachter RM, Goldman L. Zero to 50,000 - The 20th Anniversary of the Hospitalist. N Engl J Med. 2016;375(11):1009-1011. PubMed
6. Mack JW, Block SD, Nilsson M, et al. Measuring therapeutic alliance between oncologists and patients with advanced cancer: the Human Connection Scale. Cancer. 2009;115(14):3302-3311. PubMed
7. Huff NG, Nadig N, Ford DW, Cox CE. Therapeutic Alliance between the Caregivers of Critical Illness Survivors and Intensive Care Unit Clinicians. [published correction appears in Ann Am Thorac Soc. 2016;13(4):576]. Ann Am Thorac Soc. 2015;12(11):1646-1653. PubMed
8. Derksen F, Bensing J, Lagro-Janssen A. Effectiveness of empathy in general practice: a systematic review. Br J Gen Pract. 2013;63(606):e76-e84. PubMed
9. Dwamena F, Holmes-Rovner M, Gaulden CM, et al. Interventions for providers to promote a patient-centred approach in clinical consultations. Cochrane Database Syst Rev. 2012;12:CD003267. PubMed
10. Fogarty LA, Curbow BA, Wingard JR, McDonnell K, Somerfield MR. Can 40 seconds of compassion reduce patient anxiety? J Clin Oncol. 1999;17(1):371-379. PubMed
11. Roter DL, Hall JA, Kern DE, Barker LR, Cole KA, Roca RP. Improving physicians’ interviewing skills and reducing patients’ emotional distress. A randomized clinical trial. Arch Intern Med. 1995;155(17):1877-1884. PubMed
12. Stapleton RD, Engelberg RA, Wenrich MD, Goss CH, Curtis JR. Clinician statements and family satisfaction with family conferences in the intensive care unit. Crit Care Med. 2006;34(6):1679-1685. PubMed
13. Hojat M, Louis DZ, Markham FW, Wender R, Rabinowitz C, Gonnella JS. Physicians’ empathy and clinical outcomes for diabetic patients. Acad Med. 2011;86(3):359-364. PubMed
14. Anderson WG, Winters K, Arnold RM, Puntillo KA, White DB, Auerbach AD. Studying physician-patient communication in the acute care setting: the hospitalist rapport study. Patient Educ Couns. 2011;82(2):275-279. PubMed
15. Pollak KI, Arnold RM, Jeffreys AS, et al. Oncologist communication about emotion during visits with patients with advanced cancer. J Clin Oncol. 2007;25(36):5748-5752. PubMed
16. Suchman AL, Markakis K, Beckman HB, Frankel R. A model of empathic communication in the medical interview. JAMA. 1997;277(8):678-682. PubMed
17. Adams K, Cimino JEW, Arnold RM, Anderson WG. Why should I talk about emotion? Communication patterns associated with physician discussion of patient expressions of negative emotion in hospital admission encounters. Patient Educ Couns. 2012;89(1):44-50. PubMed
18. Julian LJ. Measures of anxiety: State-Trait Anxiety Inventory (STAI), Beck Anxiety Inventory (BAI), and Hospital Anxiety and Depression Scale-Anxiety (HADS-A). Arthritis Care Res (Hoboken). 2011;63 Suppl 11:S467-S472. PubMed
19. Speilberger C, Ritterband L, Sydeman S, Reheiser E, Unger K. Assessment of emotional states and personality traits: measuring psychological vital signs. In: Butcher J, editor. Clinical personality assessment: practical approaches. New York: Oxford University Press; 1995.
20. Safran DG, Kosinski M, Tarlov AR, et al. The Primary Care Assessment Survey: tests of data quality and measurement performance. Med Care. 1998;36(5):728-739. PubMed
21. Azoulay E, Pochard F, Kentish-Barnes N, et al. Risk of post-traumatic stress symptoms in family members of intensive care unit patients. Am J Respir Crit Care Med. 2005;171(9):987-994. PubMed
22. Lynn J. Perspectives on care at the close of life. Serving patients who may die soon and their families: the role of hospice and other services. JAMA. 2001;285(7):925-932. PubMed
23. Kennifer SL, Alexander SC, Pollak KI, et al. Negative emotions in cancer care: do oncologists’ responses depend on severity and type of emotion? Patient Educ Couns. 2009;76(1):51-56. PubMed
24. Butow PN, Brown RF, Cogar S, Tattersall MHN, Dunn SM. Oncologists’ reactions to cancer patients’ verbal cues. Psychooncology. 2002;11(1):47-58. PubMed
25. Levinson W, Gorawara-Bhat R, Lamb J. A study of patient clues and physician responses in primary care and surgical settings. JAMA. 2000;284(8):1021-1027. PubMed
26. Cohen J. A coefficient of agreement for nominal scales. Educ Psychol Meas. 1960;20(1):37-46.
27. Fulop G. Anxiety disorders in the general hospital setting. Psychiatr Med. 1990;8(3):187-195. PubMed
28. Gerson S, Mistry R, Bastani R, et al. Symptoms of depression and anxiety (MHI) following acute medical/surgical hospitalization and post-discharge psychiatric diagnoses (DSM) in 839 geriatric US veterans. Int J Geriatr Psychiatry. 2004;19(12):1155-1167. PubMed
29. Kathol RG, Wenzel RP. Natural history of symptoms of depression and anxiety during inpatient treatment on general medicine wards. J Gen Intern Med. 1992;7(3):287-293. PubMed
30. Unsal A, Unaldi C, Baytemir C. Anxiety and depression levels of inpatients in the city centre of Kirşehir in Turkey. Int J Nurs Pract. 2011;17(4):411-418. PubMed
31. Bradt J, Dileo C, Grocke D, Magill L. Music interventions for improving psychological and physical outcomes in cancer patients. [Update appears in Cochrane Database Syst Rev. 2016;(8):CD006911] Cochrane Database Syst Rev. 2011;(8):CD006911. PubMed
32. Kim SS, Kaplowitz S, Johnston MV. The effects of physician empathy on patient satisfaction and compliance. Eval Health Prof. 2004;27(3):237-251. PubMed
33. Tulsky JA, Arnold RM, Alexander SC, et al. Enhancing communication between oncologists and patients with a computer-based training program: a randomized trial. Ann Intern Med. 2011;155(9):593-601. PubMed
34. Bays AM, Engelberg RA, Back AL, et al. Interprofessional communication skills training for serious illness: evaluation of a small-group, simulated patient intervention. J Palliat Med. 2014;17(2):159-166. PubMed
35. Epstein RM, Duberstein PR, Fenton JJ, et al. Effect of a Patient-Centered Communication Intervention on Oncologist-Patient Communication, Quality of Life, and Health Care Utilization in Advanced Cancer: The VOICE Randomized Clinical Trial. JAMA Oncol. 2017;3(1):92-100. PubMed
36. Berkhof M, van Rijssen HJ, Schellart AJM, Anema JR, van der Beek AJ. Effective training strategies for teaching communication skills to physicians: an overview of systematic reviews. Patient Educ Couns. 2011;84(2):152-162. PubMed
© 2017 Society of Hospital Medicine
The Authors Reply, “What Can Be Done to Maintain Positive Patient Experience and Improve Residents’ Satisfaction?” and “Standardized Attending Rounds to Improve the Patient Experience: A Pragmatic Cluster Randomized Controlled Trial”
We thank Talari et al. for their comments in response to our randomized controlled trial evaluating the impact of standardized rounds on patient, attending, and trainee satisfaction. We agree that many factors beyond rounding structure contribute to resident satisfaction, including those highlighted by the authors, and would enthusiastically welcome additional research in this realm.
Because our study intervention addressed rounding structure, we elected to specifically focus on satisfaction with rounds, both from the physician and patient perspectives. We chose to ask about patient satisfaction with attending rounds, as opposed to more generic measures of patient satisfaction, to allow for more direct comparison between attending/resident responses and patient responses. Certainly, there are many other factors that affect overall patient experience. Surveys such as Hospital Consumer Assessment of Healthcare Providers and Systems (HCAHPS) and Press Ganey do not specifically address rounds, are often completed several weeks following hospitalization, and may have low response rates. Relying on such global assessments of patient experience may also reduce the power of the study. Although patient responses to our survey may be higher than scores seen with HCAHPS and Press Ganey, the randomized nature of our study helps control for other differences in the hospitalization experience unrelated to rounding structure. Similarly, because physician teams were randomly assigned, differences in census were not a major factor in the study. Physician blinding was not possible due to the nature of the intervention, which may have affected the satisfaction reports from attendings and residents. For our primary outcome (patient satisfaction with rounds), patients were blinded to the nature of our intervention, and all study team members involved in data collection and statistical analyses were blinded to study arm allocation.
In summary, we feel that evaluating the trade-offs and consequences of interventions should be examined from multiple perspectives, and we welcome additional investigations in this area.
© 2017 Society of Hospital Medicine
Dosing accuracy of direct oral anticoagulants in an academic medical center
Direct-acting oral anticoagulants (DOACs) have been introduced into clinical use for stroke prevention in patients with nonvalvular atrial fibrillation (NVAF), prevention of venous thrombosis after hip or knee surgery, and treatment of deep vein thrombosis (DVT) and pulmonary embolism (PE).1-7 Advantages of DOACs over warfarin are often stated as fixed dosing, minor drug and food interactions, wider therapeutic index, and no need for laboratory test monitoring.1,8 Yet, recommended DOAC dosages vary by renal function and therapeutic indications. Dosing recommendations for prevention of stroke in patients with NVAF are based on estimated creatinine clearance (dabigatran, rivaroxaban, edoxaban), age (apixaban), weight (apixaban, edoxaban), serum creatinine level (apixaban, edoxaban), and presence of cirrhosis by Child-Pugh class9,10 (apixaban, edoxaban).4-6,11,12 Dosing recommendations based on coadministration of strong CYP34A and P-glycoprotein inhibitors or inducers vary by DOAC. In addition, dabigatran cannot be crushed and must be stored in its original packaging, and rivaroxaban should be taken with food when the dose is over 10 mg.
We studied DOAC prescribing in adults admitted to a large academic medical center by comparing initial prescribed dosing with FDA-approved prescribing information. We hypothesized that the complexity of DOAC dosing may not be recognized by prescribers.
METHODS
Our study protocol was approved by the Committee on Human Research (Institutional Review Board) of the University of California San Francisco.
Data Collection
We used electronic medical records (EMRs) to identify adult inpatients who were prescribed a DOAC (apixaban, dabigatran, edoxaban, or rivaroxaban) at the University of California San Francisco Medical Center, a large academic hospital, between July 1, 2014 and June 30, 2015. Demographic and medical information related to therapeutic indications, contraindications, and indications for dose adjustments were collected and included diagnoses classified by International Classification of Diseases, Ninth Revision (ICD-9) and Tenth Revision (ICD-10) for venous thromboses; phlebitis or thrombophlebitis; PE or venous embolism; atrial arrhythmias; surgical procedures; cirrhosis and/or ascites or liver disease; coagulopathies; artificial heart valves or implanted devices; prior use of medications including parenteral anticoagulants; and laboratory data obtained before the first DOAC order (serum creatinine level, estimated glomerular filtration rate [eGFR] determined by Chronic Kidney Disease Epidemiology Collaboration,13 international normalized ratio, or, if available, activated partial thromboplastin time and bilirubin level). Creatinine clearance was calculated with the Cockcroft-Gault method14 using total body weight, per drug label recommendation. Child-Pugh class was calculated if cirrhosis was diagnosed.10 DOAC dose, frequency, dosing directions, and prescriber medical specialty were determined.
Accuracy of search results was confirmed by review of the first 200 patients’ records. Records were manually reviewed for encounters lacking ICD-9/10 codes and approved DOAC indications (30%) and encounters having multiple coded diagnostic indications (to identify the indication). ICD-9 codes for venous thrombosis were reviewed to differentiate acute from chronic events.
Data Analysis
The main outcome was concordance or discordance between the first DOAC prescribing order and the FDA-approved prescribing information at the time. Initial classification, performed by 2 independent reviewers (a pharmacist and a physician, or 2 pharmacists), was followed by adjudication and individual record review (by 2 independent reviewers) of all initial prescribing orders classified as discordant. A third reviewer adjudicated any disagreement. Records and notes were reviewed to identify stated or potential reasons for dosing variation and pre-admission prescriptions. Data are presented as means and standard deviations (SDs) and as raw numbers and percentages. Differences in patient characteristics by DOAC or therapeutic indication were determined by analysis of variance (ANOVA) with Bonferroni correction for post hoc comparisons. Dosing information was categorized as the same as recommended, lower than recommended, higher than recommended, or avoid drug use (drug–drug or drug–disease interaction), per FDA-approved prescribing information, and χ2 tests were used to determine whether variation in dosing occurred by individual DOAC, therapeutic indication, or prescriber specialty. Relationships between dosing variation and age or renal function were tested by ANOVA with Bonferroni correction for post hoc comparisons.
RESULTS


Patients with AF were older with lower creatinine clearance compared to patients with other diagnoses. Mean (SD) patient age was 72.1 (12.7) years for AF, 53.1 (10.9) years for chronic PE, 55.5 (14) years for acute PE, 56.4 (15.9) years for chronic DVT, 57.9 (18.4) years for acute DVT, and 61.4 (11.6) years for DVT prevention after hip or knee surgery (P < 0.0001 for all comparisons). Mean (SD) estimated creatinine clearance was 76.8 (43.5) mL/min for AF, 92.4 (44.4) mL/min for DVT prevention after hip or knee surgery, 111 (53) mL/min for chronic DVT, 118 (55) mL/min for acute DVT, 126 (60) mL/min for chronic PE, and 127 (54) mL/min for acute PE (P < 0.0001 for all comparisons). Differences between patient groups by therapeutic indication were not detected for weight, body mass index, or serum creatinine level.
The most frequent deviation from prescribing recommendations was omission of directions to administer rivaroxaban with food—93% (248/268) of orders—but not for DVT prevention after hip or knee surgery, for which the 10-mg dose is appropriately administered without food. Doses were the same as recommended for 82% of apixaban orders, 84% of rivaroxaban orders, and 93% of initial dabigatran orders (P < 0.05 for differences; Table 3). Dosages not concordant with FDA recommendations were prescribed in 44 (18.1%) of 243 apixaban orders, 41 (14.3%) of 286 rivaroxaban orders, and 7 (7.2%) of 89 initial dabigatran orders. Lower than recommended doses were more common than higher than recommended doses (Table 3, Figure 1): 15.2% versus 2.1% of apixaban orders, 9.4% versus 3.5% of rivaroxaban orders, and 4.2% versus 1.0% of initial dabigatran orders (P < 0.05). Failure to avoid drug use (for potential drug–drug or drug–disease interactions) was uncommon (1%-2%). There were more deviations from recommended doses for patients with AF or DVT prevention after hip or knee surgery than for patients with acute or chronic PE or acute DVT (Table 3). No significant differences were detected between prescribed and recommended doses by prescriber specialty.


For apixaban, patients who were prescribed lower than recommended doses were older than those prescribed recommended doses: mean (SD), 78.1 (12.2) years versus 71 (13.6) years (P = 0.003). Seventy-six percent of those prescribed lower than recommended doses were older than 75. Prescriptions for apixaban at lower than recommended doses were continuations of prior outpatient prescriptions in 20 of 37 cases (almost half), and in 12 cases (one-fourth) antiplatelet drugs were coprescribed (aspirin in 10 cases, clopidogrel in 1, prasugrel in 1). For rivaroxaban, older age was associated with both lower than recommended dosing (P = 0.003) and higher than recommended dosing (P < 0.001). Variations from prescribing recommendations were continuations of outpatient rivaroxaban doses in about two-thirds (26 of 41; 63.4 %) with 13 receiving antiplatelet drugs. For dabigatran, 6 of 7 orders not in agreement with recommendations were continuations of outpatient dosing.
The specific equation used to estimate renal function also had the potential to lead to dosing errors. Among the 41 rivaroxaban patients categorized as receiving doses discordant with recommendations, 8 would have had an inappropriate DOAC dose if eGFR were used instead of eCrCL as recommended. No relationships were detected for other patient variables/measures and dosing deviations from recommendations.
DISCUSSION
We examined initial hospital orders for DOACs in adults admitted to a single academic medical center during 2014-2015. Dabigatran, apixaban and rivaroxaban were prescribed for prevention of stroke in patients with atrial fibrillation/flutter (AF) in three quarters of the encounters similar to national patterns. (15) Prescribing departures from FDA-approved recommendations ranged from failure to prescribe rivaroxaban with food to failure to recognize drug-drug interactions in 1% to 2%. Unexpectedly, lower than recommended dosing was more common than higher than recommended dosing of the three DOACs.
Rivaroxaban bioavailability is dose dependent with the presence of food required to enhance absorption for doses over 10 mg that are used for prevention of stroke in patients with non-valvular AF or treatment of DVT or PE.5,16 Peak rivaroxaban concentrations are 75% higher and the total area under the concentration vs. time curve after dosing is 40% higher when rivaroxaban is administered with high fat high calorie meals compared to the fasting state.16 If rivaroxaban is not administered with food, drug concentrations and pharmacologic effects may be less than in clinical trials that specified co-administration with food.17-19 A small survey of outpatients receiving rivaroxaban found that 23% reported taking it without food.20 With electronic pharmacy systems in almost all hospitals and electronic prescriber order entry in most, automated addition of directions for rivaroxaban administration with food for doses over 10 mg to labels or dispensing instructions could easily correct this deviation from recommended practice.
Lower than recommended doses were prescribed in 9.4% of orders for rivaroxaban and 15.2% of orders for apixaban, with dose-deviations often appearing to be a continuation of outpatient doses. Patients 75 years or older were more likely to receive lower than recommended dosing of apixaban. Reductions in apixaban doses from 5 mg twice daily to 2.5 mg twice daily are recommended in patients with non-valvular AF with two of the following criteria: age ≥80 y, weight ≤60 kg, serum creatinine ≥1.5 mg/dL or co-administration of a strong PgP inhibitor to a patient without 2 of the 3 dose reduction criteria. Our study was not designed to determine reasons for under-dosing, but we speculate that clinicians may have considered patients aged 75-79 years to be similar to those 80 years of age or older, or, older and not as healthy as those enrolled in randomized trials.21-25 The median age of our patients with AF receiving apixaban was 75y (interquartile range of 16) vs 70y ( interquartile range 63-76) in the pivotal trial comparing warfarin to apixaban.21 Renal function was also lower with 37% having eCrCL below 50 mL/min compared to 17% in ARISTOTLE. (21). Twenty-six percent of our apixaban-treated AF patients qualified for the lower 2.5 mg twice daily compared to only 5% of ARISTOTLE participants,21 further suggesting differences between patients in our sample compared to randomized trial participants.
Concerns regarding bleeding or falls in older patients, may also have contributed to lower than recommended doses. Recent analyses of patients at risk for falls confirmed that increased risk of falling was associated with more bone fractures, bleeding and all-cause death but not stroke or systemic emboli, and with less severe bleeding with the DOAC edoxaban compared to warfarin.26 While a rationale for personalized or lower than recommended dosing of apixaban may exist in very old patients and those at risk of falls and bleeding, more data are needed to determine outcomes of lower than recommended doses of DOACs before such an approach can be endorsed. Monitoring of anticoagulant effect in patients who receive doses lower than those investigated in clinical trials could provide important information. The assays that measure DOAC effects are likely to be more available because of the use of reversal agents in the setting of bleeding with DOACs.27
We had anticipated higher than recommended dosing for rivaroxaban as recommendations are based on creatinine clearance while laboratories routinely report estimated glomerular filtration rate (eGFR) that can provide higher estimates of renal clearance and estimated DOAC doses in older and smaller individuals.28 Higher than recommended dosing was found in only 3.5% of our sample. In half, eGFR estimates were higher than creatinine clearance estimates. An international postmarketing registry of rivaroxaban use for the prevention of stroke in patients with NVAF, which included outpatients, found that 36% of those with creatinine clearances below 50 mL/min received a dose higher than recommended, and 15% received a dose lower than expected.29 A more recent outpatient registry report on patients with NVAF, in which apixaban, dabigatran, or rivaroxaban was administered, found that overall 9.4% received a dose lower than recommended, and 3.4% were overdosed, with a similar percentage (34%) of rivaroxaban patients with creatinine clearance of 15 to 50 mL/min receiving higher than recommended dosing.30 The lower rate of higher-than-recommended doses that we observed may have been related to the routine measurement of serum creatinine and attention to dosing adjustments for renal function in the inpatient setting compared to the outpatient setting. In addition, renal function data may not be available to outpatient pharmacies, limiting potential input on dosing recommendations. At least one cardiac society recommends monitoring of renal function in patients treated with DOACs, annually in patients with normal estimated creatinine clearance and more frequently (at intervals in months equal to the creatinine clearance divided by 10) in patients with abnormal creatinine clearance.11 A hospital encounter provides an opportunity to assess or reassess renal status to optimize DOAC dosing.
Dabigatran was the first DOAC introduced into use in the United States with the same dose recommended for prevention of stroke in patients with AF or venous thromboembolic disease with reductions for creatinine clearance below 30 mL/min or creatinine clearance between 30 and 50 mL/min and concomitant use of the potent P-glycoprotein inhibitor dronedarone or systemic ketoconazole. The relative simplicity of dosing may have been responsible for the lowest rate of prescribing outside of recommendations observed in this study, but the low dabigatran use limits analyses of contributing factors.
Failure to avoid drug use in combination with use of strong P-glycoprotein inducers or inhibitors was infrequent but should be preventable. Current prescribing recommendations refer to “strong” P-glycoprotein inhibitors and list different specific agents that interact with each DOAC without a standardized definition or classification. Standardized classifications or reference sources would be helpful.
Our primary goal in this study was to compare initial prescribed dosing of DOACs with FDA-approved prescribing directions. However, therapeutic indication data warrant discussion. In our sample, 7.5% of patients with AF had bioprosthetic valves or recent mitral valve repair or replacement. Using the NVAF definition found in the 2014 AHA/ACC/HRS (American Heart Association, American College of Cardiology, Heart Rhythm Society) AF guidelines1—“absence of rheumatic mitral valve disease, a prosthetic heart valve, or mitral valve repair”—these patients would not appear to be candidates for DOACs. However, arguments have been made that a bioprosthetic heart valve or native valve after valve repair does not have a risk profile for thromboembolism that differs from other forms of NVAF and would be equally responsive to DOAC therapy.31 Data are sparse, but retrospective subanalyses of limited numbers of patients with valvular disease (including bioprosthesis and mitral repair patients but excluding mechanical valve patients) enrolled in the pivotal DOAC studies support this conclusion.32 For the first months after biological valve replacement (including catheter-based valve replacement), recent European guidelines recommend vitamin K antagonists but also state, “NOACs probably deliver the same protection.”8 DOACs were also used for management of venous thromboembolic disease (both acute and chronic) in patients with active cancer. Our data predate the most recent American College of Chest Physician guidelines on treatment of venous thromboembolism in patients with cancer, which provide grade 2B recommendations for use of low-molecular-weight heparin (LMWH) over vitamin K antagonists and grade 2C recommendations for use of LMWH over dabigatran, rivaroxaban, apixaban, or edoxaban.33
Our study had several limitations. First, data were from a single US academic medical center, though similar rates of prescribing deviation from recommendations have been reported for rivaroxaban and dabigatran in NVAF patients in other countries.29,34 Second, therapeutic indications may have been misclassified because of errors, incomplete EMR data, or multiple indications. Third, we analyzed the first DOAC order and not dispensing information or subsequent corrections. Therefore, deviations from recommendations should not be interpreted as errors that reached patients. We evaluated dosing based on the measures used at the time of hospital admission, noting that, in a significant fraction of deviations from recommended doses, they represented continuations of outpatient doses when renal function or weight may have differed, and it is unknown whether patients were counseled to take rivaroxaban with food in the outpatient setting. Fourth, the number of patients with acute DVT was small, so firm conclusions cannot be drawn for this specific population. Fifth, our estimates of off-label dosing may have been underestimates, as data on cancer and cancer activity or cardiac valvular disease may not have been complete.
CONCLUSION
Healthcare professionals are prescribing DOACs in ways that differ from recommendations. These differences may reflect the older ages and reduced renal function of clinical populations relative to randomized clinical trial groups, but they could also potentially alter clinical efficacy. Our findings support the need to evaluate the appropriateness and dosing of DOACs at each encounter and to determine the outcomes of patients treated with lower than recommended doses of DOACs and the outcomes of DOAC-treated patients with bioprostheses or active malignancies.
Acknowledgment
The authors thank Tobias Schmelzinger for electronic data extraction and compilation and University of California San Francisco students Eduardo De La Torre Cruz (School of Pharmacy) and Carlos Mikell (School of Medicine) for assistance with data review.
Disclosure
Dr. Schwartz reports receiving personal fees from Bristol-Myers Squibb and Amgen and grants from Bristol-Myers Squibb and Pfizer, outside the submitted work. The other authors have nothing to report.
1. January CT, Wann LS, Alpert JS, et al. 2014 AHA/ACC/HRS guideline for the management of patients with atrial fibrillation: executive summary. A report of the American College of Cardiology/American Heart Association Task Force on Practice Guidelines and the Heart Rhythm Society. J Am Coll Cardiol. 2014;64(21):2246-2280. PubMed
2. Saraf K, Morris PD, Garg P, Sheridan P, Storey R. Non–vitamin K antagonist oral anticoagulants (NOACs): clinical evidence and therapeutic considerations. Postgrad Med J. 2014;90(1067):520-528. PubMed
3. Yeh CH, Gross PL, Weitz JI. Evolving use of new oral anticoagulants for treatment of venous thromboembolism. Blood. 2014;124(7):1020-1028. PubMed
4. Pradaxa website. https://www.pradaxa.com. Accessed June 1, 2017.
5. Xarelto website. https://www.xarelto-us.com. Accessed June 1, 2017.
6. Eliquis website. http://www.eliquis.com. Accessed June 1, 2017.
7. Savaysa [prescribing information]. Tokyo, Japan: Daiichi Sankyo; 2015.
8. Kirchhof P, Benussi S, Kotecha D, et al. 2016 ESC guidelines for the management of atrial fibrillation developed in collaboration with EACTS. Eur Heart J. 2016;37(38):2893-2962. PubMed
9. Child C, Turcotte J. Surgery and portal hypertension. In: Child CG, ed. The Liver and Portal Hypertension. Philadelphia, PA: Saunders; 1964:50-64. PubMed
10. Pugh RN, Murray-Lyon IM, Dawson JL, Pietroni MC, Williams R. Transection of the oesophagus for bleeding oesophageal varices. Br J Surg. 1973;60(8):646-649. PubMed
11. Heidbuchel H, Verhamme P, Alings M, et al. Updated European Heart Rhythm Association practical guide on the use of non–vitamin K antagonist anticoagulants in patients with non-valvular atrial fibrillation. Europace. 2015;17(10):1467-1507. PubMed
12. Savaysa website. https://savaysahcp.com. Accessed June 1, 2017.
13. Levey AS, Stevens LA, Schmid CH, et al; CKD-EPI (Chronic Kidney Disease Epidemiology Collaboration). A new equation to estimate glomerular filtration rate. Ann Intern Med. 2009;150(9):604-612. PubMed
14. Cockcroft DW, Gault MH. Prediction of creatinine clearance from serum creatinine. Nephron. 1976;16(1):31-41. PubMed
15. Rose AJ, Reisman JI, Allen AL, Miller DR. Potentially inappropriate prescribing of direct-acting oral anticoagulants in the Veterans Health Administration. Am J Pharm Benefits. 2016;4(4):e75-e80.
16. Stampfuss J, Kubitza D, Becka M, Mueck W. The effect of food on the absorption and pharmacokinetics of rivaroxaban. Int J Clin Pharmacol Ther. 2013;51(7):549-561. PubMed
17. Patel MR, Mahaffey KW, Garg J, et al; ROCKET AF Investigators. Rivaroxaban versus warfarin in nonvalvular atrial fibrillation. N Engl J Med. 2011;365(10):883-891. PubMed
18. EINSTEIN Investigators, Bauersachs R, Berkowitz SD, et al. Oral rivaroxaban for symptomatic venous thromboembolism. N Engl J Med. 2010;363(26):2499-2510. PubMed
19. EINSTEIN-PE Investigators, Büller HR, Prins MH, et al. Oral rivaroxaban for the treatment of symptomatic pulmonary embolism. N Engl J Med. 2012;366(14):1287-1297. PubMed
20. Simon J, Hawes E, Deyo Z, Bryant-Shilliday B. Evaluation of prescribing and patient use of target-specific oral anticoagulants in the outpatient setting. J Clin Pharm Ther. 2015;40(5):525-530. PubMed
21. Granger CB, Alexander JH, McMurray JJ, et al; ARISTOTLE Committees and Investigators. Apixaban versus warfarin in patients with atrial fibrillation. N Engl J Med. 2011;365(11):981-992. PubMed
22. Ruff CT, Giugliano RP, Braunwald E, et al. Comparison of the efficacy and safety of new oral anticoagulants with warfarin in patients with atrial fibrillation: a meta-analysis of randomised trials. Lancet. 2014;383(9921):955-962. PubMed
23. van der Hulle T, Kooiman J, den Exter PL, Dekkers OM, Klok FA, Huisman MV. Effectiveness and safety of novel oral anticoagulants as compared with vitamin K antagonists in the treatment of acute symptomatic venous thromboembolism: a systematic review and meta-analysis. J Thromb Haemost. 2014;12(3):320-328. PubMed
24. Schuh T, Reichardt B, Finsterer J, Stöllberger C. Age-dependency of prescribing patterns of oral anticoagulant drugs in Austria during 2011–2014. J Thromb Thrombolysis. 2016;42(3):447-451. PubMed
25. Stöllberger C, Brooks R, Finsterer J, Pachofszky T. Use of direct-acting oral anticoagulants in nonagenarians: a call for more data. Drugs Aging. 2016;33(5):315-320. PubMed
26. Steffel J, Giugliano RP, Braunwald E, et al. Edoxaban versus warfarin in atrial fibrillation patients at risk of falling: ENGAGE AF-TIMI 48 analysis. J Am Coll Cardiol. 2016;68(11):1169-1178. PubMed
27. Ruff CT, Giugliano RP, Antman EM. Management of bleeding with non–vitamin K antagonist oral anticoagulants in the era of specific reversal agents. Circulation. 2016;134(3):248-261. PubMed
28. Schwartz JB. Potential impact of substituting estimated glomerular filtration rate for estimated creatinine clearance for dosing of direct oral anticoagulants. J Am Geriatr Soc. 2016;64(10):1996-2002. PubMed
29. Camm AJ, Amarenco P, Haas S, et al; XANTUS Investigators. XANTUS: a real-world, prospective, observational study of patients treated with rivaroxaban for stroke prevention in atrial fibrillation. Eur Heart J. 2016;37(14):1145-1153. PubMed
30. Steinberg BA, Shrader P, Thomas L, et al; ORBIT-AF Investigators and Patients. Off-label dosing of non–vitamin K antagonist oral anticoagulants and adverse outcomes: the ORBIT-AF II Registry. J Am Coll Cardiol. 2016;68(24):2597-2604. PubMed
31. Fauchier L, Philippart R, Clementy N, et al. How to define valvular atrial fibrillation? Arch Cardiovasc Dis. 2015;108(10):530-539. PubMed
32. Di Biase L. Use of direct oral anticoagulants in patients with atrial fibrillation and valvular heart lesions. J Am Heart Assoc. 2016;5(2). PubMed
33. Kearon C, Akl EA, Ornelas J, et al. Antithrombotic therapy for VTE disease:
CHEST guideline and expert panel report. Chest. 2016;149(2):315-352. PubMed
34. Larock AS, Mullier F, Sennesael AL, et al. Appropriateness of prescribing dabigatran
etexilate and rivaroxaban in patients with nonvalvular atrial fibrillation: a prospective
study. Ann Pharmacother. 2014;48(10):1258-1268. PubMed
Direct-acting oral anticoagulants (DOACs) have been introduced into clinical use for stroke prevention in patients with nonvalvular atrial fibrillation (NVAF), prevention of venous thrombosis after hip or knee surgery, and treatment of deep vein thrombosis (DVT) and pulmonary embolism (PE).1-7 Advantages of DOACs over warfarin are often stated as fixed dosing, minor drug and food interactions, wider therapeutic index, and no need for laboratory test monitoring.1,8 Yet, recommended DOAC dosages vary by renal function and therapeutic indications. Dosing recommendations for prevention of stroke in patients with NVAF are based on estimated creatinine clearance (dabigatran, rivaroxaban, edoxaban), age (apixaban), weight (apixaban, edoxaban), serum creatinine level (apixaban, edoxaban), and presence of cirrhosis by Child-Pugh class9,10 (apixaban, edoxaban).4-6,11,12 Dosing recommendations based on coadministration of strong CYP34A and P-glycoprotein inhibitors or inducers vary by DOAC. In addition, dabigatran cannot be crushed and must be stored in its original packaging, and rivaroxaban should be taken with food when the dose is over 10 mg.
We studied DOAC prescribing in adults admitted to a large academic medical center by comparing initial prescribed dosing with FDA-approved prescribing information. We hypothesized that the complexity of DOAC dosing may not be recognized by prescribers.
METHODS
Our study protocol was approved by the Committee on Human Research (Institutional Review Board) of the University of California San Francisco.
Data Collection
We used electronic medical records (EMRs) to identify adult inpatients who were prescribed a DOAC (apixaban, dabigatran, edoxaban, or rivaroxaban) at the University of California San Francisco Medical Center, a large academic hospital, between July 1, 2014 and June 30, 2015. Demographic and medical information related to therapeutic indications, contraindications, and indications for dose adjustments were collected and included diagnoses classified by International Classification of Diseases, Ninth Revision (ICD-9) and Tenth Revision (ICD-10) for venous thromboses; phlebitis or thrombophlebitis; PE or venous embolism; atrial arrhythmias; surgical procedures; cirrhosis and/or ascites or liver disease; coagulopathies; artificial heart valves or implanted devices; prior use of medications including parenteral anticoagulants; and laboratory data obtained before the first DOAC order (serum creatinine level, estimated glomerular filtration rate [eGFR] determined by Chronic Kidney Disease Epidemiology Collaboration,13 international normalized ratio, or, if available, activated partial thromboplastin time and bilirubin level). Creatinine clearance was calculated with the Cockcroft-Gault method14 using total body weight, per drug label recommendation. Child-Pugh class was calculated if cirrhosis was diagnosed.10 DOAC dose, frequency, dosing directions, and prescriber medical specialty were determined.
Accuracy of search results was confirmed by review of the first 200 patients’ records. Records were manually reviewed for encounters lacking ICD-9/10 codes and approved DOAC indications (30%) and encounters having multiple coded diagnostic indications (to identify the indication). ICD-9 codes for venous thrombosis were reviewed to differentiate acute from chronic events.
Data Analysis
The main outcome was concordance or discordance between the first DOAC prescribing order and the FDA-approved prescribing information at the time. Initial classification, performed by 2 independent reviewers (a pharmacist and a physician, or 2 pharmacists), was followed by adjudication and individual record review (by 2 independent reviewers) of all initial prescribing orders classified as discordant. A third reviewer adjudicated any disagreement. Records and notes were reviewed to identify stated or potential reasons for dosing variation and pre-admission prescriptions. Data are presented as means and standard deviations (SDs) and as raw numbers and percentages. Differences in patient characteristics by DOAC or therapeutic indication were determined by analysis of variance (ANOVA) with Bonferroni correction for post hoc comparisons. Dosing information was categorized as the same as recommended, lower than recommended, higher than recommended, or avoid drug use (drug–drug or drug–disease interaction), per FDA-approved prescribing information, and χ2 tests were used to determine whether variation in dosing occurred by individual DOAC, therapeutic indication, or prescriber specialty. Relationships between dosing variation and age or renal function were tested by ANOVA with Bonferroni correction for post hoc comparisons.
RESULTS
Patients with AF were older with lower creatinine clearance compared to patients with other diagnoses. Mean (SD) patient age was 72.1 (12.7) years for AF, 53.1 (10.9) years for chronic PE, 55.5 (14) years for acute PE, 56.4 (15.9) years for chronic DVT, 57.9 (18.4) years for acute DVT, and 61.4 (11.6) years for DVT prevention after hip or knee surgery (P < 0.0001 for all comparisons). Mean (SD) estimated creatinine clearance was 76.8 (43.5) mL/min for AF, 92.4 (44.4) mL/min for DVT prevention after hip or knee surgery, 111 (53) mL/min for chronic DVT, 118 (55) mL/min for acute DVT, 126 (60) mL/min for chronic PE, and 127 (54) mL/min for acute PE (P < 0.0001 for all comparisons). Differences between patient groups by therapeutic indication were not detected for weight, body mass index, or serum creatinine level.
The most frequent deviation from prescribing recommendations was omission of directions to administer rivaroxaban with food—93% (248/268) of orders—but not for DVT prevention after hip or knee surgery, for which the 10-mg dose is appropriately administered without food. Doses were the same as recommended for 82% of apixaban orders, 84% of rivaroxaban orders, and 93% of initial dabigatran orders (P < 0.05 for differences; Table 3). Dosages not concordant with FDA recommendations were prescribed in 44 (18.1%) of 243 apixaban orders, 41 (14.3%) of 286 rivaroxaban orders, and 7 (7.2%) of 89 initial dabigatran orders. Lower than recommended doses were more common than higher than recommended doses (Table 3, Figure 1): 15.2% versus 2.1% of apixaban orders, 9.4% versus 3.5% of rivaroxaban orders, and 4.2% versus 1.0% of initial dabigatran orders (P < 0.05). Failure to avoid drug use (for potential drug–drug or drug–disease interactions) was uncommon (1%-2%). There were more deviations from recommended doses for patients with AF or DVT prevention after hip or knee surgery than for patients with acute or chronic PE or acute DVT (Table 3). No significant differences were detected between prescribed and recommended doses by prescriber specialty.
For apixaban, patients who were prescribed lower than recommended doses were older than those prescribed recommended doses: mean (SD), 78.1 (12.2) years versus 71 (13.6) years (P = 0.003). Seventy-six percent of those prescribed lower than recommended doses were older than 75. Prescriptions for apixaban at lower than recommended doses were continuations of prior outpatient prescriptions in 20 of 37 cases (almost half), and in 12 cases (one-fourth) antiplatelet drugs were coprescribed (aspirin in 10 cases, clopidogrel in 1, prasugrel in 1). For rivaroxaban, older age was associated with both lower than recommended dosing (P = 0.003) and higher than recommended dosing (P < 0.001). Variations from prescribing recommendations were continuations of outpatient rivaroxaban doses in about two-thirds (26 of 41; 63.4 %) with 13 receiving antiplatelet drugs. For dabigatran, 6 of 7 orders not in agreement with recommendations were continuations of outpatient dosing.
The specific equation used to estimate renal function also had the potential to lead to dosing errors. Among the 41 rivaroxaban patients categorized as receiving doses discordant with recommendations, 8 would have had an inappropriate DOAC dose if eGFR were used instead of eCrCL as recommended. No relationships were detected for other patient variables/measures and dosing deviations from recommendations.
DISCUSSION
We examined initial hospital orders for DOACs in adults admitted to a single academic medical center during 2014-2015. Dabigatran, apixaban and rivaroxaban were prescribed for prevention of stroke in patients with atrial fibrillation/flutter (AF) in three quarters of the encounters similar to national patterns. (15) Prescribing departures from FDA-approved recommendations ranged from failure to prescribe rivaroxaban with food to failure to recognize drug-drug interactions in 1% to 2%. Unexpectedly, lower than recommended dosing was more common than higher than recommended dosing of the three DOACs.
Rivaroxaban bioavailability is dose dependent with the presence of food required to enhance absorption for doses over 10 mg that are used for prevention of stroke in patients with non-valvular AF or treatment of DVT or PE.5,16 Peak rivaroxaban concentrations are 75% higher and the total area under the concentration vs. time curve after dosing is 40% higher when rivaroxaban is administered with high fat high calorie meals compared to the fasting state.16 If rivaroxaban is not administered with food, drug concentrations and pharmacologic effects may be less than in clinical trials that specified co-administration with food.17-19 A small survey of outpatients receiving rivaroxaban found that 23% reported taking it without food.20 With electronic pharmacy systems in almost all hospitals and electronic prescriber order entry in most, automated addition of directions for rivaroxaban administration with food for doses over 10 mg to labels or dispensing instructions could easily correct this deviation from recommended practice.
Lower than recommended doses were prescribed in 9.4% of orders for rivaroxaban and 15.2% of orders for apixaban, with dose-deviations often appearing to be a continuation of outpatient doses. Patients 75 years or older were more likely to receive lower than recommended dosing of apixaban. Reductions in apixaban doses from 5 mg twice daily to 2.5 mg twice daily are recommended in patients with non-valvular AF with two of the following criteria: age ≥80 y, weight ≤60 kg, serum creatinine ≥1.5 mg/dL or co-administration of a strong PgP inhibitor to a patient without 2 of the 3 dose reduction criteria. Our study was not designed to determine reasons for under-dosing, but we speculate that clinicians may have considered patients aged 75-79 years to be similar to those 80 years of age or older, or, older and not as healthy as those enrolled in randomized trials.21-25 The median age of our patients with AF receiving apixaban was 75y (interquartile range of 16) vs 70y ( interquartile range 63-76) in the pivotal trial comparing warfarin to apixaban.21 Renal function was also lower with 37% having eCrCL below 50 mL/min compared to 17% in ARISTOTLE. (21). Twenty-six percent of our apixaban-treated AF patients qualified for the lower 2.5 mg twice daily compared to only 5% of ARISTOTLE participants,21 further suggesting differences between patients in our sample compared to randomized trial participants.
Concerns regarding bleeding or falls in older patients, may also have contributed to lower than recommended doses. Recent analyses of patients at risk for falls confirmed that increased risk of falling was associated with more bone fractures, bleeding and all-cause death but not stroke or systemic emboli, and with less severe bleeding with the DOAC edoxaban compared to warfarin.26 While a rationale for personalized or lower than recommended dosing of apixaban may exist in very old patients and those at risk of falls and bleeding, more data are needed to determine outcomes of lower than recommended doses of DOACs before such an approach can be endorsed. Monitoring of anticoagulant effect in patients who receive doses lower than those investigated in clinical trials could provide important information. The assays that measure DOAC effects are likely to be more available because of the use of reversal agents in the setting of bleeding with DOACs.27
We had anticipated higher than recommended dosing for rivaroxaban as recommendations are based on creatinine clearance while laboratories routinely report estimated glomerular filtration rate (eGFR) that can provide higher estimates of renal clearance and estimated DOAC doses in older and smaller individuals.28 Higher than recommended dosing was found in only 3.5% of our sample. In half, eGFR estimates were higher than creatinine clearance estimates. An international postmarketing registry of rivaroxaban use for the prevention of stroke in patients with NVAF, which included outpatients, found that 36% of those with creatinine clearances below 50 mL/min received a dose higher than recommended, and 15% received a dose lower than expected.29 A more recent outpatient registry report on patients with NVAF, in which apixaban, dabigatran, or rivaroxaban was administered, found that overall 9.4% received a dose lower than recommended, and 3.4% were overdosed, with a similar percentage (34%) of rivaroxaban patients with creatinine clearance of 15 to 50 mL/min receiving higher than recommended dosing.30 The lower rate of higher-than-recommended doses that we observed may have been related to the routine measurement of serum creatinine and attention to dosing adjustments for renal function in the inpatient setting compared to the outpatient setting. In addition, renal function data may not be available to outpatient pharmacies, limiting potential input on dosing recommendations. At least one cardiac society recommends monitoring of renal function in patients treated with DOACs, annually in patients with normal estimated creatinine clearance and more frequently (at intervals in months equal to the creatinine clearance divided by 10) in patients with abnormal creatinine clearance.11 A hospital encounter provides an opportunity to assess or reassess renal status to optimize DOAC dosing.
Dabigatran was the first DOAC introduced into use in the United States with the same dose recommended for prevention of stroke in patients with AF or venous thromboembolic disease with reductions for creatinine clearance below 30 mL/min or creatinine clearance between 30 and 50 mL/min and concomitant use of the potent P-glycoprotein inhibitor dronedarone or systemic ketoconazole. The relative simplicity of dosing may have been responsible for the lowest rate of prescribing outside of recommendations observed in this study, but the low dabigatran use limits analyses of contributing factors.
Failure to avoid drug use in combination with use of strong P-glycoprotein inducers or inhibitors was infrequent but should be preventable. Current prescribing recommendations refer to “strong” P-glycoprotein inhibitors and list different specific agents that interact with each DOAC without a standardized definition or classification. Standardized classifications or reference sources would be helpful.
Our primary goal in this study was to compare initial prescribed dosing of DOACs with FDA-approved prescribing directions. However, therapeutic indication data warrant discussion. In our sample, 7.5% of patients with AF had bioprosthetic valves or recent mitral valve repair or replacement. Using the NVAF definition found in the 2014 AHA/ACC/HRS (American Heart Association, American College of Cardiology, Heart Rhythm Society) AF guidelines1—“absence of rheumatic mitral valve disease, a prosthetic heart valve, or mitral valve repair”—these patients would not appear to be candidates for DOACs. However, arguments have been made that a bioprosthetic heart valve or native valve after valve repair does not have a risk profile for thromboembolism that differs from other forms of NVAF and would be equally responsive to DOAC therapy.31 Data are sparse, but retrospective subanalyses of limited numbers of patients with valvular disease (including bioprosthesis and mitral repair patients but excluding mechanical valve patients) enrolled in the pivotal DOAC studies support this conclusion.32 For the first months after biological valve replacement (including catheter-based valve replacement), recent European guidelines recommend vitamin K antagonists but also state, “NOACs probably deliver the same protection.”8 DOACs were also used for management of venous thromboembolic disease (both acute and chronic) in patients with active cancer. Our data predate the most recent American College of Chest Physician guidelines on treatment of venous thromboembolism in patients with cancer, which provide grade 2B recommendations for use of low-molecular-weight heparin (LMWH) over vitamin K antagonists and grade 2C recommendations for use of LMWH over dabigatran, rivaroxaban, apixaban, or edoxaban.33
Our study had several limitations. First, data were from a single US academic medical center, though similar rates of prescribing deviation from recommendations have been reported for rivaroxaban and dabigatran in NVAF patients in other countries.29,34 Second, therapeutic indications may have been misclassified because of errors, incomplete EMR data, or multiple indications. Third, we analyzed the first DOAC order and not dispensing information or subsequent corrections. Therefore, deviations from recommendations should not be interpreted as errors that reached patients. We evaluated dosing based on the measures used at the time of hospital admission, noting that, in a significant fraction of deviations from recommended doses, they represented continuations of outpatient doses when renal function or weight may have differed, and it is unknown whether patients were counseled to take rivaroxaban with food in the outpatient setting. Fourth, the number of patients with acute DVT was small, so firm conclusions cannot be drawn for this specific population. Fifth, our estimates of off-label dosing may have been underestimates, as data on cancer and cancer activity or cardiac valvular disease may not have been complete.
CONCLUSION
Healthcare professionals are prescribing DOACs in ways that differ from recommendations. These differences may reflect the older ages and reduced renal function of clinical populations relative to randomized clinical trial groups, but they could also potentially alter clinical efficacy. Our findings support the need to evaluate the appropriateness and dosing of DOACs at each encounter and to determine the outcomes of patients treated with lower than recommended doses of DOACs and the outcomes of DOAC-treated patients with bioprostheses or active malignancies.
Acknowledgment
The authors thank Tobias Schmelzinger for electronic data extraction and compilation and University of California San Francisco students Eduardo De La Torre Cruz (School of Pharmacy) and Carlos Mikell (School of Medicine) for assistance with data review.
Disclosure
Dr. Schwartz reports receiving personal fees from Bristol-Myers Squibb and Amgen and grants from Bristol-Myers Squibb and Pfizer, outside the submitted work. The other authors have nothing to report.
1. January CT, Wann LS, Alpert JS, et al. 2014 AHA/ACC/HRS guideline for the management of patients with atrial fibrillation: executive summary. A report of the American College of Cardiology/American Heart Association Task Force on Practice Guidelines and the Heart Rhythm Society. J Am Coll Cardiol. 2014;64(21):2246-2280. PubMed
2. Saraf K, Morris PD, Garg P, Sheridan P, Storey R. Non–vitamin K antagonist oral anticoagulants (NOACs): clinical evidence and therapeutic considerations. Postgrad Med J. 2014;90(1067):520-528. PubMed
3. Yeh CH, Gross PL, Weitz JI. Evolving use of new oral anticoagulants for treatment of venous thromboembolism. Blood. 2014;124(7):1020-1028. PubMed
4. Pradaxa website. https://www.pradaxa.com. Accessed June 1, 2017.
5. Xarelto website. https://www.xarelto-us.com. Accessed June 1, 2017.
6. Eliquis website. http://www.eliquis.com. Accessed June 1, 2017.
7. Savaysa [prescribing information]. Tokyo, Japan: Daiichi Sankyo; 2015.
8. Kirchhof P, Benussi S, Kotecha D, et al. 2016 ESC guidelines for the management of atrial fibrillation developed in collaboration with EACTS. Eur Heart J. 2016;37(38):2893-2962. PubMed
9. Child C, Turcotte J. Surgery and portal hypertension. In: Child CG, ed. The Liver and Portal Hypertension. Philadelphia, PA: Saunders; 1964:50-64. PubMed
10. Pugh RN, Murray-Lyon IM, Dawson JL, Pietroni MC, Williams R. Transection of the oesophagus for bleeding oesophageal varices. Br J Surg. 1973;60(8):646-649. PubMed
11. Heidbuchel H, Verhamme P, Alings M, et al. Updated European Heart Rhythm Association practical guide on the use of non–vitamin K antagonist anticoagulants in patients with non-valvular atrial fibrillation. Europace. 2015;17(10):1467-1507. PubMed
12. Savaysa website. https://savaysahcp.com. Accessed June 1, 2017.
13. Levey AS, Stevens LA, Schmid CH, et al; CKD-EPI (Chronic Kidney Disease Epidemiology Collaboration). A new equation to estimate glomerular filtration rate. Ann Intern Med. 2009;150(9):604-612. PubMed
14. Cockcroft DW, Gault MH. Prediction of creatinine clearance from serum creatinine. Nephron. 1976;16(1):31-41. PubMed
15. Rose AJ, Reisman JI, Allen AL, Miller DR. Potentially inappropriate prescribing of direct-acting oral anticoagulants in the Veterans Health Administration. Am J Pharm Benefits. 2016;4(4):e75-e80.
16. Stampfuss J, Kubitza D, Becka M, Mueck W. The effect of food on the absorption and pharmacokinetics of rivaroxaban. Int J Clin Pharmacol Ther. 2013;51(7):549-561. PubMed
17. Patel MR, Mahaffey KW, Garg J, et al; ROCKET AF Investigators. Rivaroxaban versus warfarin in nonvalvular atrial fibrillation. N Engl J Med. 2011;365(10):883-891. PubMed
18. EINSTEIN Investigators, Bauersachs R, Berkowitz SD, et al. Oral rivaroxaban for symptomatic venous thromboembolism. N Engl J Med. 2010;363(26):2499-2510. PubMed
19. EINSTEIN-PE Investigators, Büller HR, Prins MH, et al. Oral rivaroxaban for the treatment of symptomatic pulmonary embolism. N Engl J Med. 2012;366(14):1287-1297. PubMed
20. Simon J, Hawes E, Deyo Z, Bryant-Shilliday B. Evaluation of prescribing and patient use of target-specific oral anticoagulants in the outpatient setting. J Clin Pharm Ther. 2015;40(5):525-530. PubMed
21. Granger CB, Alexander JH, McMurray JJ, et al; ARISTOTLE Committees and Investigators. Apixaban versus warfarin in patients with atrial fibrillation. N Engl J Med. 2011;365(11):981-992. PubMed
22. Ruff CT, Giugliano RP, Braunwald E, et al. Comparison of the efficacy and safety of new oral anticoagulants with warfarin in patients with atrial fibrillation: a meta-analysis of randomised trials. Lancet. 2014;383(9921):955-962. PubMed
23. van der Hulle T, Kooiman J, den Exter PL, Dekkers OM, Klok FA, Huisman MV. Effectiveness and safety of novel oral anticoagulants as compared with vitamin K antagonists in the treatment of acute symptomatic venous thromboembolism: a systematic review and meta-analysis. J Thromb Haemost. 2014;12(3):320-328. PubMed
24. Schuh T, Reichardt B, Finsterer J, Stöllberger C. Age-dependency of prescribing patterns of oral anticoagulant drugs in Austria during 2011–2014. J Thromb Thrombolysis. 2016;42(3):447-451. PubMed
25. Stöllberger C, Brooks R, Finsterer J, Pachofszky T. Use of direct-acting oral anticoagulants in nonagenarians: a call for more data. Drugs Aging. 2016;33(5):315-320. PubMed
26. Steffel J, Giugliano RP, Braunwald E, et al. Edoxaban versus warfarin in atrial fibrillation patients at risk of falling: ENGAGE AF-TIMI 48 analysis. J Am Coll Cardiol. 2016;68(11):1169-1178. PubMed
27. Ruff CT, Giugliano RP, Antman EM. Management of bleeding with non–vitamin K antagonist oral anticoagulants in the era of specific reversal agents. Circulation. 2016;134(3):248-261. PubMed
28. Schwartz JB. Potential impact of substituting estimated glomerular filtration rate for estimated creatinine clearance for dosing of direct oral anticoagulants. J Am Geriatr Soc. 2016;64(10):1996-2002. PubMed
29. Camm AJ, Amarenco P, Haas S, et al; XANTUS Investigators. XANTUS: a real-world, prospective, observational study of patients treated with rivaroxaban for stroke prevention in atrial fibrillation. Eur Heart J. 2016;37(14):1145-1153. PubMed
30. Steinberg BA, Shrader P, Thomas L, et al; ORBIT-AF Investigators and Patients. Off-label dosing of non–vitamin K antagonist oral anticoagulants and adverse outcomes: the ORBIT-AF II Registry. J Am Coll Cardiol. 2016;68(24):2597-2604. PubMed
31. Fauchier L, Philippart R, Clementy N, et al. How to define valvular atrial fibrillation? Arch Cardiovasc Dis. 2015;108(10):530-539. PubMed
32. Di Biase L. Use of direct oral anticoagulants in patients with atrial fibrillation and valvular heart lesions. J Am Heart Assoc. 2016;5(2). PubMed
33. Kearon C, Akl EA, Ornelas J, et al. Antithrombotic therapy for VTE disease:
CHEST guideline and expert panel report. Chest. 2016;149(2):315-352. PubMed
34. Larock AS, Mullier F, Sennesael AL, et al. Appropriateness of prescribing dabigatran
etexilate and rivaroxaban in patients with nonvalvular atrial fibrillation: a prospective
study. Ann Pharmacother. 2014;48(10):1258-1268. PubMed
© 2017 Society of Hospital Medicine
Standardized attending rounds to improve the patient experience: A pragmatic cluster randomized controlled trial
Patient experience has recently received heightened attention given evidence supporting an association between patient experience and quality of care,1 and the coupling of patient satisfaction to reimbursement rates for Medicare patients.2 Patient experience is often assessed through surveys of patient satisfaction, which correlates with patient perceptions of nurse and physician communication.3 Teaching hospitals introduce variables that may impact communication, including the involvement of multiple levels of care providers and competing patient care vs. educational priorities. Patients admitted to teaching services express decreased satisfaction with coordination and overall care compared with patients on nonteaching services.4
Clinical supervision of trainees on teaching services is primarily achieved through attending rounds (AR), where patients’ clinical presentations and management are discussed with an attending physician. Poor communication during AR may negatively affect the patient experience through inefficient care coordination among the inter-professional care team or through implementation of interventions without patients’ knowledge or input.5-11 Although patient engagement in rounds has been associated with higher patient satisfaction with rounds,12-19 AR and case presentations often occur at a distance from the patient’s bedside.20,21 Furthermore, AR vary in the time allotted per patient and the extent of participation of nurses and other allied health professionals. Standardized bedside rounding processes have been shown to improve efficiency, decrease daily resident work hours,22 and improve nurse-physician teamwork.23
Despite these benefits, recent prospective studies of bedside AR interventions have not improved patient satisfaction with rounds. One involved the implementation of interprofessional patient-centered bedside rounds on a nonteaching service,24 while the other evaluated the impact of integrating athletic principles into multidisciplinary work rounds.25 Work at our institution had sought to develop AR practice recommendations to foster an optimal patient experience, while maintaining provider workflow efficiency, facilitating interdisciplinary communication, and advancing trainee education.26 Using these AR recommendations, we conducted a prospective randomized controlled trial to evaluate the impact of implementing a standardized bedside AR model on patient satisfaction with rounds. We also assessed attending physician and trainee satisfaction with rounds, and perceived and actual AR duration.
METHODS
Setting and Participants
This trial was conducted on the internal medicine teaching service of the University of California San Francisco Medical Center from September 3, 2013 to November 27, 2013. The service is comprised of 8 teams, with a total average daily census of 80 to 90 patients. Teams are comprised of an attending physician, a senior resident (in the second or third year of residency training), 2 interns, and a third- and/or fourth-year medical student.
This trial, which was approved by the University of California, San Francisco Committee on Human Research (UCSF CHR) and was registered with ClinicalTrials.gov (NCT01931553), was classified under Quality Improvement and did not require informed consent of patients or providers.
Intervention Description
We conducted a cluster randomized trial to evaluate the impact of a bundled set of 5 AR practice recommendations, adapted from published work,26 on patient experience, as well as on attending and trainee satisfaction: 1) huddling to establish the rounding schedule and priorities; 2) conducting bedside rounds; 3) integrating bedside nurses; 4) completing real-time order entry using bedside computers; 5) updating the whiteboard in each patient’s room with care plan information.
At the beginning of each month, study investigators (Nader Najafi and Bradley Monash) led a 1.5-hour workshop to train attending physicians and trainees allocated to the intervention arm on the recommended AR practices. Participants also received informational handouts to be referenced during AR. Attending physicians and trainees randomized to the control arm continued usual rounding practices. Control teams were notified that there would be observers on rounds but were not informed of the study aims.
Randomization and Team Assignments
The medicine service was divided into 2 arms, each comprised of 4 teams. Using a coin flip, Cluster 1 (Teams A, B, C and D) was randomized to the intervention, and Cluster 2 (Teams E, F, G and H) was randomized to the control. This design was pragmatically chosen to ensure that 1 team from each arm would admit patients daily. Allocation concealment of attending physicians and trainees was not possible given the nature of the intervention. Patients were blinded to study arm allocation.
MEASURES AND OUTCOMES
Adherence to Practice Recommendations
Thirty premedical students served as volunteer AR auditors. Each auditor received orientation and training in data collection techniques during a single 2-hour workshop. The auditors, blinded to study arm allocation, independently observed morning AR during weekdays and recorded the completion of the following elements as a dichotomous (yes/no) outcome: pre-rounds huddle, participation of nurse in AR, real-time order entry, and whiteboard use. They recorded the duration of AR per day for each team (minutes) and the rounding model for each patient rounding encounter during AR (bedside, hallway, or card flip).23 Bedside rounds were defined as presentation and discussion of the patient care plan in the presence of the patient. Hallway rounds were defined as presentation and discussion of the patient care plan partially outside the patient’s room and partially in the presence of the patient. Card-flip rounds were defined as presentation and discussion of the patient care plan entirely outside of the patient’s room without the team seeing the patient together. Two auditors simultaneously observed a random subset of patient-rounding encounters to evaluate inter-rater reliability, and the concordance between auditor observations was good (Pearson correlation = 0.66).27
Patient-Related Outcomes
The primary outcome was patient satisfaction with AR, assessed using a survey adapted from published work.12,14,28,29 Patients were approached to complete the questionnaire after they had experienced at least 1 AR. Patients were excluded if they were non-English-speaking, unavailable (eg, off the unit for testing or treatment), in isolation, or had impaired mental status. For patients admitted multiple times during the study period, only the first questionnaire was used. Survey questions included patient involvement in decision-making, quality of communication between patient and medicine team, and the perception that the medicine team cared about the patient. Patients were asked to state their level of agreement with each item on a 5-point Likert scale. We obtained data on patient demographics from administrative datasets.
Healthcare Provider Outcomes
Attending physicians and trainees on service for at least 7 consecutive days were sent an electronic survey, adapted from published work.25,30 Questions assessed satisfaction with AR, perceived value of bedside rounds, and extent of patient and nursing involvement.Level of agreement with each item was captured on a continuous scale; 0 = strongly disagree to 100 = strongly agree, or from 0 (far too little) to 100 (far too much), with 50 equating to “about right.” Attending physicians and trainees were also asked to estimate the average duration of AR (in minutes).
Statistical Analyses
Analyses were blinded to study arm allocation and followed intention-to-treat principles. One attending physician crossed over from intervention to control arm; patient surveys associated with this attending (n = 4) were excluded to avoid contamination. No trainees crossed over.
Demographic and clinical characteristics of patients who completed the survey are reported (Appendix). To compare patient satisfaction scores, we used a random-effects regression model to account for correlation among responses within teams within randomized clusters, defining teams by attending physician. As this correlation was negligible and not statistically significant, we did not adjust ordinary linear regression models for clustering. Given observed differences in patient characteristics, we adjusted for a number of covariates (eg, age, gender, insurance payer, race, marital status, trial group arm).
We conducted simple linear regression for attending and trainee satisfaction comparisons between arms, adjusting only for trainee type (eg, resident, intern, and medical student).
We compared the frequency with which intervention and control teams adhered to the 5 recommended AR practices using chi-square tests. We used independent Student’s t tests to compare total duration of AR by teams within each arm, as well as mean time spent per patient.
This trial had a fixed number of arms (n = 2), each of fixed size (n = 600), based on the average monthly inpatient census on the medicine service. This fixed sample size, with 80% power and α = 0.05, will be able to detect a 0.16 difference in patient satisfaction scores between groups.
All analyses were conducted using SAS® v 9.4 (SAS Institute, Inc., Cary, NC).
RESULTS
We observed 241 AR involving 1855 patient rounding encounters in the intervention arm and 264 AR involving 1903 patient rounding encounters in the control arm (response rates shown in Figure 1). 

Patient Satisfaction and Clinical Outcomes
Five hundred ninety-five patients were allocated to the intervention arm and 605 were allocated to the control arm (Figure 1). Mean age, gender, race, marital status, primary language, and insurance provider did not differ between intervention and control arms (Table 1). 
Patients in the intervention arm reported significantly higher satisfaction with AR and felt more cared for by their medicine team (Table 2). 
Actual and Perceived Duration of Attending Rounds
The intervention shortened the total duration of AR by 8 minutes on average (143 vs. 151 minutes, P = 0.052) and the time spent per patient by 4 minutes on average (19 vs. 23 minutes, P < 0.001). Despite this, trainees in the intervention arm perceived AR to last longer (mean estimated time: 167 min vs. 152 min, P < 0.001).
Healthcare Provider Outcomes
We observed 79 attending physicians and trainees in the intervention arm and 78 in the control arm, with survey response rates shown in Figure 1. Attending physicians in the intervention and the control arms reported high levels of satisfaction with the quality of AR (Table 2). Attending physicians in the intervention arm were more likely to report an appropriate level of patient involvement and nurse involvement.
Although trainees in the intervention and control arms reported high levels of satisfaction with the quality of AR, trainees in the intervention arm reported lower satisfaction with AR compared with control arm trainees (Table 2). Trainees in the intervention arm reported that AR involved less autonomy, efficiency, and teaching. Trainees in the intervention arm also scored patient involvement more towards the “far too much” end of the scale compared with “about right” in the control arm. However, trainees in the intervention arm perceived nurse involvement closer to “about right,” as opposed to “far too little” in the control arm.
CONCLUSION/DISCUSSION
Training internal medicine teams to adhere to 5 recommended AR practices increased patient satisfaction with AR and the perception that patients were more cared for by their medicine team. Despite the intervention potentially shortening the duration of AR, attending physicians and trainees perceived AR to last longer, and trainee satisfaction with AR decreased.
Teams in the intervention arm adhered to all recommended rounding practices at higher rates than the control teams. Although intervention teams rounded at the bedside 53% of the time, they were encouraged to bedside round only on patients who desired to participate in rounds, were not altered, and for whom the clinical discussion was not too sensitive to occur at the bedside. Of the recommended rounding behaviors, the lowest adherence was seen with whiteboard use.
A major component of the intervention was to move the clinical presentation to the patient’s bedside. Most patients prefer being included in rounds and partaking in trainee education.12-19,28,29,31-33 Patients may also perceive that more time is spent with them during bedside case presentations,14,28 and exposure to providers conferring on their care may enhance patient confidence in the care being delivered.12 Although a recent study of patient-centered bedside rounding on a nonteaching service did not result in increased patient satisfaction,24 teaching services may offer more opportunities for improvement in care coordination and communication.4
Other aspects of the intervention may have contributed to increased patient satisfaction with AR. The pre-rounds huddle may have helped teams prioritize which patients required more time or would benefit most from bedside rounds. The involvement of nurses in AR may have bolstered communication and team dynamics, enhancing the patient’s perception of interprofessional collaboration. Real-time order entry might have led to more efficient implementation of the care plan, and whiteboard use may have helped to keep patients abreast of the care plan.
Patients in the intervention arm felt more cared for by their medicine teams but did not report improvements in communication or in shared decision-making. Prior work highlights that limited patient engagement, activation, and shared decision-making may occur during AR.24,34 Patient-physician communication during AR is challenged by time pressures and competing priorities, including the “need” for trainees to demonstrate their medical knowledge and clinical skills. Efforts that encourage bedside rounding should include communication training with respect to patient engagement and shared decision-making.
Attending physicians reported positive attitudes toward bedside rounding, consistent with prior studies.13,21,31 However, trainees in the intervention arm expressed decreased satisfaction with AR, estimating that AR took longer and reporting too much patient involvement. Prior studies reflect similar bedside-rounding concerns, including perceived workflow inefficiencies, infringement on teaching opportunities, and time constraints.12,20,35 Trainees are under intense time pressures to complete their work, attend educational conferences, and leave the hospital to attend afternoon clinic or to comply with duty-hour restrictions. Trainees value succinctness,12,35,36 so the perception that intervention AR lasted longer likely contributed to trainee dissatisfaction.
Reduced trainee satisfaction with intervention AR may have also stemmed from the perception of decreased autonomy and less teaching, both valued by trainees.20,35,36 The intervention itself reduced trainee autonomy because usual practice at our hospital involves residents deciding where and how to round. Attending physician presence at the bedside during rounds may have further infringed on trainee autonomy if the patient looked to the attending for answers, or if the attending was seen as the AR leader. Attending physicians may mitigate the risk of compromising trainee autonomy by allowing the trainee to speak first, ensuring the trainee is positioned closer to, and at eye level with, the patient, and redirecting patient questions to the trainee as appropriate. Optimizing trainee experience with bedside AR requires preparation and training of attending physicians, who may feel inadequately prepared to lead bedside rounds and conduct bedside teaching.37 Faculty must learn how to preserve team efficiency, create a safe, nonpunitive bedside environment that fosters the trainee-patient relationship, and ensure rounds remain educational.36,38,39
The intervention reduced the average time spent on AR and time spent per patient. Studies examining the relationship between bedside rounding and duration of rounds have yielded mixed results: some have demonstrated no effect of bedside rounds on rounding time,28,40 while others report longer rounding times.37 The pre-rounds huddle and real-time order writing may have enhanced workflow efficiency.
Our study has several limitations. These results reflect the experience of a single large academic medical center and may not be generalizable to other settings. Although overall patient response to the survey was low and may not be representative of the entire patient population, response rates in the intervention and control arms were equivalent. Non-English speaking patients may have preferences that were not reflected in our survey results, and we did not otherwise quantify individual reasons for survey noncompletion. The presence of auditors on AR may have introduced observer bias. There may have been crossover effect; however, observed prevalence of individual practices remained low in the control arm. The 1.5-hour workshop may have inadequately equipped trainees with the complex skills required to lead and participate in bedside rounding, and more training, experience, and feedback may have yielded different results. For instance, residents with more exposure to bedside rounding express greater appreciation of its role in education and patient care.20 While adherence to some of the recommended practices remained low, we did not employ a full range of change-management techniques. Instead, we opted for a “low intensity” intervention (eg, single workshop, handouts) that relied on voluntary adoption by medicine teams and that we hoped other institutions could reproduce. Finally, we did not assess the relative impact of individual rounding behaviors on the measured outcomes.
In conclusion, training medicine teams to adhere to a standardized bedside AR model increased patient satisfaction with rounds. Concomitant trainee dissatisfaction may require further experience and training of attending physicians and trainees to ensure successful adoption.
Acknowledgements
We would like to thank all patients, providers, and trainees who participated in this study. We would also like to acknowledge the following volunteer auditors who observed teams daily: Arianna Abundo, Elahhe Afkhamnejad, Yolanda Banuelos, Laila Fozoun, Soe Yupar Khin, Tam Thien Le, Wing Sum Li, Yaqiao Li, Mengyao Liu, Tzyy-Harn Lo, Shynh-Herng Lo, David Lowe, Danoush Paborji, Sa Nan Park, Urmila Powale, Redha Fouad Qabazard, Monique Quiroz, John-Luke Marcelo Rivera, Manfred Roy Luna Salvador, Tobias Gowen Squier-Roper, Flora Yan Ting, Francesca Natasha T. Tizon, Emily Claire Trautner, Stephen Weiner, Alice Wilson, Kimberly Woo, Bingling J Wu, Johnny Wu, Brenda Yee. Statistical expertise was provided by Joan Hilton from the UCSF Clinical and Translational Science Institute (CTSI), which is supported by the National Center for Advancing Translational Sciences, National Institutes of Health, through UCSF-CTSI Grant Number UL1 TR000004. Its contents are solely the responsibility of the authors and do not necessarily represent the official views of the NIH. Thanks also to Oralia Schatzman, Andrea Mazzini, and Erika Huie for their administrative support, and John Hillman for data-related support. Special thanks to Kirsten Kangelaris and Andrew Auerbach for their valuable feedback throughout, and to Maria Novelero and Robert Wachter for their divisional support of this project.
Disclosure
The authors report no financial conflicts of interest.
1. Doyle C, Lennox L, Bell D. A systematic review of evidence on the links between patient experience and clinical safety and effectiveness. BMJ Open. 2013;3(1):1-18. PubMed
2. Hospital Consumer Assessment of Healthcare Providers and Systems (HCAHPS) Fact Sheet. August 2013. Centers for Medicare and Medicaid Services (CMS). Baltimore, MD.http://www.hcahpsonline.org/files/August_2013_HCAHPS_Fact_Sheet3.pdf. Accessed December 1, 2015.
3. Boulding W, Glickman SW, Manary MP, Schulman KA, Staelin R. Relationship between patient satisfaction with inpatient care and hospital readmission within 30 days. Am J Manag Care. 2011;17:41-48. PubMed
4. Wray CM, Flores A, Padula WV, Prochaska MT, Meltzer DO, Arora VM. Measuring patient experiences on hospitalist and teaching services: Patient responses to a 30-day postdischarge questionnaire. J Hosp Med. 2016;11(2):99-104. PubMed
5. Bharwani AM, Harris GC, Southwick FS. Perspective: A business school view of medical interprofessional rounds: transforming rounding groups into rounding teams. Acad Med. 2012;87(12):1768-1771. PubMed
6. Chand DV. Observational study using the tools of lean six sigma to improve the efficiency of the resident rounding process. J Grad Med Educ. 2011;3(2):144-150. PubMed
7. Stickrath C, Noble M, Prochazka A, et al. Attending rounds in the current era: what is and is not happening. JAMA Intern Med. 2013;173(12):1084-1089. PubMed
8. Weber H, Stöckli M, Nübling M, Langewitz WA. Communication during ward rounds in internal medicine. An analysis of patient-nurse-physician interactions using RIAS. Patient Educ Couns. 2007;67(3):343-348. PubMed
9. McMahon GT, Katz JT, Thorndike ME, Levy BD, Loscalzo J. Evaluation of a redesign initiative in an internal-medicine residency. N Engl J Med. 2010;362(14):1304-1311. PubMed
10. Amoss J. Attending rounds: where do we go from here?: comment on “Attending rounds in the current era”. JAMA Intern Med. 2013;173(12):1089-1090. PubMed
11. Curley C, McEachern JE, Speroff T. A firm trial of interdisciplinary rounds on the inpatient medical wards: an intervention designed using continuous quality improvement. Med Care. 1998;36(suppl 8):AS4-A12. PubMed
12. Wang-Cheng RM, Barnas GP, Sigmann P, Riendl PA, Young MJ. Bedside case presentations: why patients like them but learners don’t. J Gen Intern Med. 1989;4(4):284-287. PubMed
13. Chauke, HL, Pattinson RC. Ward rounds—bedside or conference room? S Afr Med J. 2006;96(5):398-400. PubMed
14. Lehmann LS, Brancati FL, Chen MC, Roter D, Dobs AS. The effect of bedside case presentations on patients’ perceptions of their medical care. N Engl J Med. 1997;336(16):336, 1150-1155. PubMed
15. Simons RJ, Baily RG, Zelis R, Zwillich CW. The physiologic and psychological effects of the bedside presentation. N Engl J Med. 1989;321(18):1273-1275. PubMed
16. Wise TN, Feldheim D, Mann LS, Boyle E, Rustgi VK. Patients’ reactions to house staff work rounds. Psychosomatics. 1985;26(8):669-672. PubMed
17. Linfors EW, Neelon FA. Sounding Boards. The case of bedside rounds. N Engl J Med. 1980;303(21):1230-1233. PubMed
18. Nair BR, Coughlan JL, Hensley MJ. Student and patient perspectives on bedside teaching. Med Educ. 1997;31(5):341-346. PubMed
19. Romano J. Patients’ attitudes and behavior in ward round teaching. JAMA. 1941;117(9):664-667.
20. Gonzalo JD, Masters PA, Simons RJ, Chuang CH. Attending rounds and bedside case presentations: medical student and medicine resident experiences and attitudes. Teach Learn Med. 2009;21(2):105-110. PubMed
21. Shoeb M, Khanna R, Fang M, et al. Internal medicine rounding practices and the Accreditation Council for Graduate Medical Education core competencies. J Hosp Med. 2014;9(4):239-243. PubMed
22. Calderon AS, Blackmore CC, Williams BL, et al. Transforming ward rounds through rounding-in-flow. J Grad Med Educ. 2014;6(4):750-755. PubMed
23. Henkin S, Chon TY, Christopherson ML, Halvorsen AJ, Worden LM, Ratelle JT. Improving nurse-physician teamwork through interprofessional bedside rounding. J Multidiscip Healthc. 2016;9:201-205. PubMed
24. O’Leary KJ, Killarney A, Hansen LO, et al. Effect of patient-centred bedside rounds on hospitalised patients’ decision control, activation and satisfaction with care. BMJ Qual Saf. 2016;25:921-928. PubMed
25. Southwick F, Lewis M, Treloar D, et al. Applying athletic principles to medical rounds to improve teaching and patient care. Acad Med. 2014;89(7):1018-1023. PubMed
26. Najafi N, Monash B, Mourad M, et al. Improving attending rounds: Qualitative reflections from multidisciplinary providers. Hosp Pract (1995). 2015;43(3):186-190. PubMed
27. Altman DG. Practical Statistics For Medical Research. Boca Raton, FL: Chapman & Hall/CRC; 2006.
28. Gonzalo JD, Chuang CH, Huang G, Smith C. The return of bedside rounds: an educational intervention. J Gen Intern Med. 2010;25(8):792-798. PubMed
29. Fletcher KE, Rankey DS, Stern DT. Bedside interactions from the other side of the bedrail. J Gen Intern Med. 2005;20(1):58-61. PubMed
30. Gatorounds: Applying Championship Athletic Principles to Healthcare. University of Florida Health. http://gatorounds.med.ufl.edu/surveys/. Accessed March 1, 2013.
31. Gonzalo JD, Heist BS, Duffy BL, et al. The value of bedside rounds: a multicenter qualitative study. Teach Learn Med. 2013;25(4):326-333. PubMed
32. Rogers HD, Carline JD, Paauw DS. Examination room presentations in general internal medicine clinic: patients’ and students’ perceptions. Acad Med. 2003;78(9):945-949. PubMed
33. Fletcher KE, Furney SL, Stern DT. Patients speak: what’s really important about bedside interactions with physician teams. Teach Learn Med. 2007;19(2):120-127. PubMed
34. Satterfield JM, Bereknyei S, Hilton JF, et al. The prevalence of social and behavioral topics and related educational opportunities during attending rounds. Acad Med. 2014; 89(11):1548-1557. PubMed
35. Kroenke K, Simmons JO, Copley JB, Smith C. Attending rounds: a survey of physician attitudes. J Gen Intern Med. 1990;5(3):229-233. PubMed
36. Castiglioni A, Shewchuk RM, Willett LL, Heudebert GR, Centor RM. A pilot study using nominal group technique to assess residents’ perceptions of successful attending rounds. J Gen Intern Med. 2008;23(7):1060-1065. PubMed
37. Crumlish CM, Yialamas MA, McMahon GT. Quantification of bedside teaching by an academic hospitalist group. J Hosp Med. 2009;4(5):304-307. PubMed
38. Gonzalo JD, Wolpaw DR, Lehman E, Chuang CH. Patient-centered interprofessional collaborative care: factors associated with bedside interprofessional rounds. J Gen Intern Med. 2014;29(7):1040-1047. PubMed
39. Roy B, Castiglioni A, Kraemer RR, et al. Using cognitive mapping to define key domains for successful attending rounds. J Gen Intern Med. 2012;27(11):1492-1498. PubMed
40. Bhansali P, Birch S, Campbell JK, et al. A time-motion study of inpatient rounds using a family-centered rounds model. Hosp Pediatr. 2013;3(1):31-38. PubMed
Patient experience has recently received heightened attention given evidence supporting an association between patient experience and quality of care,1 and the coupling of patient satisfaction to reimbursement rates for Medicare patients.2 Patient experience is often assessed through surveys of patient satisfaction, which correlates with patient perceptions of nurse and physician communication.3 Teaching hospitals introduce variables that may impact communication, including the involvement of multiple levels of care providers and competing patient care vs. educational priorities. Patients admitted to teaching services express decreased satisfaction with coordination and overall care compared with patients on nonteaching services.4
Clinical supervision of trainees on teaching services is primarily achieved through attending rounds (AR), where patients’ clinical presentations and management are discussed with an attending physician. Poor communication during AR may negatively affect the patient experience through inefficient care coordination among the inter-professional care team or through implementation of interventions without patients’ knowledge or input.5-11 Although patient engagement in rounds has been associated with higher patient satisfaction with rounds,12-19 AR and case presentations often occur at a distance from the patient’s bedside.20,21 Furthermore, AR vary in the time allotted per patient and the extent of participation of nurses and other allied health professionals. Standardized bedside rounding processes have been shown to improve efficiency, decrease daily resident work hours,22 and improve nurse-physician teamwork.23
Despite these benefits, recent prospective studies of bedside AR interventions have not improved patient satisfaction with rounds. One involved the implementation of interprofessional patient-centered bedside rounds on a nonteaching service,24 while the other evaluated the impact of integrating athletic principles into multidisciplinary work rounds.25 Work at our institution had sought to develop AR practice recommendations to foster an optimal patient experience, while maintaining provider workflow efficiency, facilitating interdisciplinary communication, and advancing trainee education.26 Using these AR recommendations, we conducted a prospective randomized controlled trial to evaluate the impact of implementing a standardized bedside AR model on patient satisfaction with rounds. We also assessed attending physician and trainee satisfaction with rounds, and perceived and actual AR duration.
METHODS
Setting and Participants
This trial was conducted on the internal medicine teaching service of the University of California San Francisco Medical Center from September 3, 2013 to November 27, 2013. The service is comprised of 8 teams, with a total average daily census of 80 to 90 patients. Teams are comprised of an attending physician, a senior resident (in the second or third year of residency training), 2 interns, and a third- and/or fourth-year medical student.
This trial, which was approved by the University of California, San Francisco Committee on Human Research (UCSF CHR) and was registered with ClinicalTrials.gov (NCT01931553), was classified under Quality Improvement and did not require informed consent of patients or providers.
Intervention Description
We conducted a cluster randomized trial to evaluate the impact of a bundled set of 5 AR practice recommendations, adapted from published work,26 on patient experience, as well as on attending and trainee satisfaction: 1) huddling to establish the rounding schedule and priorities; 2) conducting bedside rounds; 3) integrating bedside nurses; 4) completing real-time order entry using bedside computers; 5) updating the whiteboard in each patient’s room with care plan information.
At the beginning of each month, study investigators (Nader Najafi and Bradley Monash) led a 1.5-hour workshop to train attending physicians and trainees allocated to the intervention arm on the recommended AR practices. Participants also received informational handouts to be referenced during AR. Attending physicians and trainees randomized to the control arm continued usual rounding practices. Control teams were notified that there would be observers on rounds but were not informed of the study aims.
Randomization and Team Assignments
The medicine service was divided into 2 arms, each comprised of 4 teams. Using a coin flip, Cluster 1 (Teams A, B, C and D) was randomized to the intervention, and Cluster 2 (Teams E, F, G and H) was randomized to the control. This design was pragmatically chosen to ensure that 1 team from each arm would admit patients daily. Allocation concealment of attending physicians and trainees was not possible given the nature of the intervention. Patients were blinded to study arm allocation.
MEASURES AND OUTCOMES
Adherence to Practice Recommendations
Thirty premedical students served as volunteer AR auditors. Each auditor received orientation and training in data collection techniques during a single 2-hour workshop. The auditors, blinded to study arm allocation, independently observed morning AR during weekdays and recorded the completion of the following elements as a dichotomous (yes/no) outcome: pre-rounds huddle, participation of nurse in AR, real-time order entry, and whiteboard use. They recorded the duration of AR per day for each team (minutes) and the rounding model for each patient rounding encounter during AR (bedside, hallway, or card flip).23 Bedside rounds were defined as presentation and discussion of the patient care plan in the presence of the patient. Hallway rounds were defined as presentation and discussion of the patient care plan partially outside the patient’s room and partially in the presence of the patient. Card-flip rounds were defined as presentation and discussion of the patient care plan entirely outside of the patient’s room without the team seeing the patient together. Two auditors simultaneously observed a random subset of patient-rounding encounters to evaluate inter-rater reliability, and the concordance between auditor observations was good (Pearson correlation = 0.66).27
Patient-Related Outcomes
The primary outcome was patient satisfaction with AR, assessed using a survey adapted from published work.12,14,28,29 Patients were approached to complete the questionnaire after they had experienced at least 1 AR. Patients were excluded if they were non-English-speaking, unavailable (eg, off the unit for testing or treatment), in isolation, or had impaired mental status. For patients admitted multiple times during the study period, only the first questionnaire was used. Survey questions included patient involvement in decision-making, quality of communication between patient and medicine team, and the perception that the medicine team cared about the patient. Patients were asked to state their level of agreement with each item on a 5-point Likert scale. We obtained data on patient demographics from administrative datasets.
Healthcare Provider Outcomes
Attending physicians and trainees on service for at least 7 consecutive days were sent an electronic survey, adapted from published work.25,30 Questions assessed satisfaction with AR, perceived value of bedside rounds, and extent of patient and nursing involvement.Level of agreement with each item was captured on a continuous scale; 0 = strongly disagree to 100 = strongly agree, or from 0 (far too little) to 100 (far too much), with 50 equating to “about right.” Attending physicians and trainees were also asked to estimate the average duration of AR (in minutes).
Statistical Analyses
Analyses were blinded to study arm allocation and followed intention-to-treat principles. One attending physician crossed over from intervention to control arm; patient surveys associated with this attending (n = 4) were excluded to avoid contamination. No trainees crossed over.
Demographic and clinical characteristics of patients who completed the survey are reported (Appendix). To compare patient satisfaction scores, we used a random-effects regression model to account for correlation among responses within teams within randomized clusters, defining teams by attending physician. As this correlation was negligible and not statistically significant, we did not adjust ordinary linear regression models for clustering. Given observed differences in patient characteristics, we adjusted for a number of covariates (eg, age, gender, insurance payer, race, marital status, trial group arm).
We conducted simple linear regression for attending and trainee satisfaction comparisons between arms, adjusting only for trainee type (eg, resident, intern, and medical student).
We compared the frequency with which intervention and control teams adhered to the 5 recommended AR practices using chi-square tests. We used independent Student’s t tests to compare total duration of AR by teams within each arm, as well as mean time spent per patient.
This trial had a fixed number of arms (n = 2), each of fixed size (n = 600), based on the average monthly inpatient census on the medicine service. This fixed sample size, with 80% power and α = 0.05, will be able to detect a 0.16 difference in patient satisfaction scores between groups.
All analyses were conducted using SAS® v 9.4 (SAS Institute, Inc., Cary, NC).
RESULTS
We observed 241 AR involving 1855 patient rounding encounters in the intervention arm and 264 AR involving 1903 patient rounding encounters in the control arm (response rates shown in Figure 1).
Patient Satisfaction and Clinical Outcomes
Five hundred ninety-five patients were allocated to the intervention arm and 605 were allocated to the control arm (Figure 1). Mean age, gender, race, marital status, primary language, and insurance provider did not differ between intervention and control arms (Table 1).
Patients in the intervention arm reported significantly higher satisfaction with AR and felt more cared for by their medicine team (Table 2).
Actual and Perceived Duration of Attending Rounds
The intervention shortened the total duration of AR by 8 minutes on average (143 vs. 151 minutes, P = 0.052) and the time spent per patient by 4 minutes on average (19 vs. 23 minutes, P < 0.001). Despite this, trainees in the intervention arm perceived AR to last longer (mean estimated time: 167 min vs. 152 min, P < 0.001).
Healthcare Provider Outcomes
We observed 79 attending physicians and trainees in the intervention arm and 78 in the control arm, with survey response rates shown in Figure 1. Attending physicians in the intervention and the control arms reported high levels of satisfaction with the quality of AR (Table 2). Attending physicians in the intervention arm were more likely to report an appropriate level of patient involvement and nurse involvement.
Although trainees in the intervention and control arms reported high levels of satisfaction with the quality of AR, trainees in the intervention arm reported lower satisfaction with AR compared with control arm trainees (Table 2). Trainees in the intervention arm reported that AR involved less autonomy, efficiency, and teaching. Trainees in the intervention arm also scored patient involvement more towards the “far too much” end of the scale compared with “about right” in the control arm. However, trainees in the intervention arm perceived nurse involvement closer to “about right,” as opposed to “far too little” in the control arm.
CONCLUSION/DISCUSSION
Training internal medicine teams to adhere to 5 recommended AR practices increased patient satisfaction with AR and the perception that patients were more cared for by their medicine team. Despite the intervention potentially shortening the duration of AR, attending physicians and trainees perceived AR to last longer, and trainee satisfaction with AR decreased.
Teams in the intervention arm adhered to all recommended rounding practices at higher rates than the control teams. Although intervention teams rounded at the bedside 53% of the time, they were encouraged to bedside round only on patients who desired to participate in rounds, were not altered, and for whom the clinical discussion was not too sensitive to occur at the bedside. Of the recommended rounding behaviors, the lowest adherence was seen with whiteboard use.
A major component of the intervention was to move the clinical presentation to the patient’s bedside. Most patients prefer being included in rounds and partaking in trainee education.12-19,28,29,31-33 Patients may also perceive that more time is spent with them during bedside case presentations,14,28 and exposure to providers conferring on their care may enhance patient confidence in the care being delivered.12 Although a recent study of patient-centered bedside rounding on a nonteaching service did not result in increased patient satisfaction,24 teaching services may offer more opportunities for improvement in care coordination and communication.4
Other aspects of the intervention may have contributed to increased patient satisfaction with AR. The pre-rounds huddle may have helped teams prioritize which patients required more time or would benefit most from bedside rounds. The involvement of nurses in AR may have bolstered communication and team dynamics, enhancing the patient’s perception of interprofessional collaboration. Real-time order entry might have led to more efficient implementation of the care plan, and whiteboard use may have helped to keep patients abreast of the care plan.
Patients in the intervention arm felt more cared for by their medicine teams but did not report improvements in communication or in shared decision-making. Prior work highlights that limited patient engagement, activation, and shared decision-making may occur during AR.24,34 Patient-physician communication during AR is challenged by time pressures and competing priorities, including the “need” for trainees to demonstrate their medical knowledge and clinical skills. Efforts that encourage bedside rounding should include communication training with respect to patient engagement and shared decision-making.
Attending physicians reported positive attitudes toward bedside rounding, consistent with prior studies.13,21,31 However, trainees in the intervention arm expressed decreased satisfaction with AR, estimating that AR took longer and reporting too much patient involvement. Prior studies reflect similar bedside-rounding concerns, including perceived workflow inefficiencies, infringement on teaching opportunities, and time constraints.12,20,35 Trainees are under intense time pressures to complete their work, attend educational conferences, and leave the hospital to attend afternoon clinic or to comply with duty-hour restrictions. Trainees value succinctness,12,35,36 so the perception that intervention AR lasted longer likely contributed to trainee dissatisfaction.
Reduced trainee satisfaction with intervention AR may have also stemmed from the perception of decreased autonomy and less teaching, both valued by trainees.20,35,36 The intervention itself reduced trainee autonomy because usual practice at our hospital involves residents deciding where and how to round. Attending physician presence at the bedside during rounds may have further infringed on trainee autonomy if the patient looked to the attending for answers, or if the attending was seen as the AR leader. Attending physicians may mitigate the risk of compromising trainee autonomy by allowing the trainee to speak first, ensuring the trainee is positioned closer to, and at eye level with, the patient, and redirecting patient questions to the trainee as appropriate. Optimizing trainee experience with bedside AR requires preparation and training of attending physicians, who may feel inadequately prepared to lead bedside rounds and conduct bedside teaching.37 Faculty must learn how to preserve team efficiency, create a safe, nonpunitive bedside environment that fosters the trainee-patient relationship, and ensure rounds remain educational.36,38,39
The intervention reduced the average time spent on AR and time spent per patient. Studies examining the relationship between bedside rounding and duration of rounds have yielded mixed results: some have demonstrated no effect of bedside rounds on rounding time,28,40 while others report longer rounding times.37 The pre-rounds huddle and real-time order writing may have enhanced workflow efficiency.
Our study has several limitations. These results reflect the experience of a single large academic medical center and may not be generalizable to other settings. Although overall patient response to the survey was low and may not be representative of the entire patient population, response rates in the intervention and control arms were equivalent. Non-English speaking patients may have preferences that were not reflected in our survey results, and we did not otherwise quantify individual reasons for survey noncompletion. The presence of auditors on AR may have introduced observer bias. There may have been crossover effect; however, observed prevalence of individual practices remained low in the control arm. The 1.5-hour workshop may have inadequately equipped trainees with the complex skills required to lead and participate in bedside rounding, and more training, experience, and feedback may have yielded different results. For instance, residents with more exposure to bedside rounding express greater appreciation of its role in education and patient care.20 While adherence to some of the recommended practices remained low, we did not employ a full range of change-management techniques. Instead, we opted for a “low intensity” intervention (eg, single workshop, handouts) that relied on voluntary adoption by medicine teams and that we hoped other institutions could reproduce. Finally, we did not assess the relative impact of individual rounding behaviors on the measured outcomes.
In conclusion, training medicine teams to adhere to a standardized bedside AR model increased patient satisfaction with rounds. Concomitant trainee dissatisfaction may require further experience and training of attending physicians and trainees to ensure successful adoption.
Acknowledgements
We would like to thank all patients, providers, and trainees who participated in this study. We would also like to acknowledge the following volunteer auditors who observed teams daily: Arianna Abundo, Elahhe Afkhamnejad, Yolanda Banuelos, Laila Fozoun, Soe Yupar Khin, Tam Thien Le, Wing Sum Li, Yaqiao Li, Mengyao Liu, Tzyy-Harn Lo, Shynh-Herng Lo, David Lowe, Danoush Paborji, Sa Nan Park, Urmila Powale, Redha Fouad Qabazard, Monique Quiroz, John-Luke Marcelo Rivera, Manfred Roy Luna Salvador, Tobias Gowen Squier-Roper, Flora Yan Ting, Francesca Natasha T. Tizon, Emily Claire Trautner, Stephen Weiner, Alice Wilson, Kimberly Woo, Bingling J Wu, Johnny Wu, Brenda Yee. Statistical expertise was provided by Joan Hilton from the UCSF Clinical and Translational Science Institute (CTSI), which is supported by the National Center for Advancing Translational Sciences, National Institutes of Health, through UCSF-CTSI Grant Number UL1 TR000004. Its contents are solely the responsibility of the authors and do not necessarily represent the official views of the NIH. Thanks also to Oralia Schatzman, Andrea Mazzini, and Erika Huie for their administrative support, and John Hillman for data-related support. Special thanks to Kirsten Kangelaris and Andrew Auerbach for their valuable feedback throughout, and to Maria Novelero and Robert Wachter for their divisional support of this project.
Disclosure
The authors report no financial conflicts of interest.
1. Doyle C, Lennox L, Bell D. A systematic review of evidence on the links between patient experience and clinical safety and effectiveness. BMJ Open. 2013;3(1):1-18. PubMed
2. Hospital Consumer Assessment of Healthcare Providers and Systems (HCAHPS) Fact Sheet. August 2013. Centers for Medicare and Medicaid Services (CMS). Baltimore, MD.http://www.hcahpsonline.org/files/August_2013_HCAHPS_Fact_Sheet3.pdf. Accessed December 1, 2015.
3. Boulding W, Glickman SW, Manary MP, Schulman KA, Staelin R. Relationship between patient satisfaction with inpatient care and hospital readmission within 30 days. Am J Manag Care. 2011;17:41-48. PubMed
4. Wray CM, Flores A, Padula WV, Prochaska MT, Meltzer DO, Arora VM. Measuring patient experiences on hospitalist and teaching services: Patient responses to a 30-day postdischarge questionnaire. J Hosp Med. 2016;11(2):99-104. PubMed
5. Bharwani AM, Harris GC, Southwick FS. Perspective: A business school view of medical interprofessional rounds: transforming rounding groups into rounding teams. Acad Med. 2012;87(12):1768-1771. PubMed
6. Chand DV. Observational study using the tools of lean six sigma to improve the efficiency of the resident rounding process. J Grad Med Educ. 2011;3(2):144-150. PubMed
7. Stickrath C, Noble M, Prochazka A, et al. Attending rounds in the current era: what is and is not happening. JAMA Intern Med. 2013;173(12):1084-1089. PubMed
8. Weber H, Stöckli M, Nübling M, Langewitz WA. Communication during ward rounds in internal medicine. An analysis of patient-nurse-physician interactions using RIAS. Patient Educ Couns. 2007;67(3):343-348. PubMed
9. McMahon GT, Katz JT, Thorndike ME, Levy BD, Loscalzo J. Evaluation of a redesign initiative in an internal-medicine residency. N Engl J Med. 2010;362(14):1304-1311. PubMed
10. Amoss J. Attending rounds: where do we go from here?: comment on “Attending rounds in the current era”. JAMA Intern Med. 2013;173(12):1089-1090. PubMed
11. Curley C, McEachern JE, Speroff T. A firm trial of interdisciplinary rounds on the inpatient medical wards: an intervention designed using continuous quality improvement. Med Care. 1998;36(suppl 8):AS4-A12. PubMed
12. Wang-Cheng RM, Barnas GP, Sigmann P, Riendl PA, Young MJ. Bedside case presentations: why patients like them but learners don’t. J Gen Intern Med. 1989;4(4):284-287. PubMed
13. Chauke, HL, Pattinson RC. Ward rounds—bedside or conference room? S Afr Med J. 2006;96(5):398-400. PubMed
14. Lehmann LS, Brancati FL, Chen MC, Roter D, Dobs AS. The effect of bedside case presentations on patients’ perceptions of their medical care. N Engl J Med. 1997;336(16):336, 1150-1155. PubMed
15. Simons RJ, Baily RG, Zelis R, Zwillich CW. The physiologic and psychological effects of the bedside presentation. N Engl J Med. 1989;321(18):1273-1275. PubMed
16. Wise TN, Feldheim D, Mann LS, Boyle E, Rustgi VK. Patients’ reactions to house staff work rounds. Psychosomatics. 1985;26(8):669-672. PubMed
17. Linfors EW, Neelon FA. Sounding Boards. The case of bedside rounds. N Engl J Med. 1980;303(21):1230-1233. PubMed
18. Nair BR, Coughlan JL, Hensley MJ. Student and patient perspectives on bedside teaching. Med Educ. 1997;31(5):341-346. PubMed
19. Romano J. Patients’ attitudes and behavior in ward round teaching. JAMA. 1941;117(9):664-667.
20. Gonzalo JD, Masters PA, Simons RJ, Chuang CH. Attending rounds and bedside case presentations: medical student and medicine resident experiences and attitudes. Teach Learn Med. 2009;21(2):105-110. PubMed
21. Shoeb M, Khanna R, Fang M, et al. Internal medicine rounding practices and the Accreditation Council for Graduate Medical Education core competencies. J Hosp Med. 2014;9(4):239-243. PubMed
22. Calderon AS, Blackmore CC, Williams BL, et al. Transforming ward rounds through rounding-in-flow. J Grad Med Educ. 2014;6(4):750-755. PubMed
23. Henkin S, Chon TY, Christopherson ML, Halvorsen AJ, Worden LM, Ratelle JT. Improving nurse-physician teamwork through interprofessional bedside rounding. J Multidiscip Healthc. 2016;9:201-205. PubMed
24. O’Leary KJ, Killarney A, Hansen LO, et al. Effect of patient-centred bedside rounds on hospitalised patients’ decision control, activation and satisfaction with care. BMJ Qual Saf. 2016;25:921-928. PubMed
25. Southwick F, Lewis M, Treloar D, et al. Applying athletic principles to medical rounds to improve teaching and patient care. Acad Med. 2014;89(7):1018-1023. PubMed
26. Najafi N, Monash B, Mourad M, et al. Improving attending rounds: Qualitative reflections from multidisciplinary providers. Hosp Pract (1995). 2015;43(3):186-190. PubMed
27. Altman DG. Practical Statistics For Medical Research. Boca Raton, FL: Chapman & Hall/CRC; 2006.
28. Gonzalo JD, Chuang CH, Huang G, Smith C. The return of bedside rounds: an educational intervention. J Gen Intern Med. 2010;25(8):792-798. PubMed
29. Fletcher KE, Rankey DS, Stern DT. Bedside interactions from the other side of the bedrail. J Gen Intern Med. 2005;20(1):58-61. PubMed
30. Gatorounds: Applying Championship Athletic Principles to Healthcare. University of Florida Health. http://gatorounds.med.ufl.edu/surveys/. Accessed March 1, 2013.
31. Gonzalo JD, Heist BS, Duffy BL, et al. The value of bedside rounds: a multicenter qualitative study. Teach Learn Med. 2013;25(4):326-333. PubMed
32. Rogers HD, Carline JD, Paauw DS. Examination room presentations in general internal medicine clinic: patients’ and students’ perceptions. Acad Med. 2003;78(9):945-949. PubMed
33. Fletcher KE, Furney SL, Stern DT. Patients speak: what’s really important about bedside interactions with physician teams. Teach Learn Med. 2007;19(2):120-127. PubMed
34. Satterfield JM, Bereknyei S, Hilton JF, et al. The prevalence of social and behavioral topics and related educational opportunities during attending rounds. Acad Med. 2014; 89(11):1548-1557. PubMed
35. Kroenke K, Simmons JO, Copley JB, Smith C. Attending rounds: a survey of physician attitudes. J Gen Intern Med. 1990;5(3):229-233. PubMed
36. Castiglioni A, Shewchuk RM, Willett LL, Heudebert GR, Centor RM. A pilot study using nominal group technique to assess residents’ perceptions of successful attending rounds. J Gen Intern Med. 2008;23(7):1060-1065. PubMed
37. Crumlish CM, Yialamas MA, McMahon GT. Quantification of bedside teaching by an academic hospitalist group. J Hosp Med. 2009;4(5):304-307. PubMed
38. Gonzalo JD, Wolpaw DR, Lehman E, Chuang CH. Patient-centered interprofessional collaborative care: factors associated with bedside interprofessional rounds. J Gen Intern Med. 2014;29(7):1040-1047. PubMed
39. Roy B, Castiglioni A, Kraemer RR, et al. Using cognitive mapping to define key domains for successful attending rounds. J Gen Intern Med. 2012;27(11):1492-1498. PubMed
40. Bhansali P, Birch S, Campbell JK, et al. A time-motion study of inpatient rounds using a family-centered rounds model. Hosp Pediatr. 2013;3(1):31-38. PubMed
© 2017 Society of Hospital Medicine
Promoting Scholarship for Hospitalists
Academic hospital medicine is a fast‐growing specialty and has a strong emphasis on high‐value care, efficiency, and quality improvement (QI).[1] Developing scholarly work in these areas and describing findings in peer‐reviewed publications can help disseminate ideas and innovations more widely. In addition, success in academic medicine, at least in part, continues to be measured by traditional academic benchmarks, including the production of scholarly publications, conference presentations, and abstracts.[2]
Hospital medicine, however, faces challenges in providing an academic environment conducive to fostering scholarly work. As a relatively young specialty, there may be a dearth of senior mentors and experienced researchers; lack of structured mentorship can be associated with failure to produce publications or lead national teaching sessions.[3] Relatively few hospitalists undergo fellowships or other specialized training that provides a clinical research background, and internal medicine residency programs rarely provide the comprehensive research skill set required to design, implement, or disseminate academic work.[4, 5, 6] Finally, heavy clinical responsibilities may hinder efforts to conduct and sustain research.
A works‐in‐progress (WIP) session, commonly employed in clinical research groups, can provide a forum to discuss and receive feedback on evolving projects and can foster mentorship, motivation, and training.[7] Although a WIP session may stimulate discussion and advance project ideas, academic hospitalist groups do not commonly employ this model, and it is not known if a regularly scheduled WIP session can provide the mentorship, training, and motivation necessary to assist junior faculty in advancing scholarly project to completion.[8] In this article, we describe how we developed a regular WIP series to promote scholarship activities within our rapidly growing, primarily clinically focused Division of Hospital Medicine (DHM) at the University of California, San Francisco (UCSF), and the results of a survey of WIP participants. We hope that our experience can help illustrate key features of such a model, as well as describe inherent challenges and lessons learned to help promote successful academic efforts at other institutions.
METHODS
Program Setting
During years 2010 to 2013, the time period captured by our survey, the DHM at UCSF grew from 37 to 46 full‐time hospitalists, with 76% primarily clinical faculty (nonresearchers) and 24% primarily clinician‐investigators (researchers), defined as individuals having completed a 2‐year clinical research fellowship and/or dedicating 70% time in their faculty position to clinical research. In addition, there were between 1 and 3 hospitalist fellows per year. In 2012, a PhD researcher joined the division to support research and academic activities within the division as well as to pursue an independent research career.
Program Description
The DHM WIP, named the Incubator, was initially developed in 2007 when researchers recognized the need and desire for a forum where scholarly projects could be reviewed and evaluated. In the first year, the Incubator was primarily utilized by junior research‐trained mentees applying for National Institutes of Health career development awards. However, it soon became clear that nonresearch trained junior fellow and faculty members were pursuing scholarly projects needing additional guidance and input. In particular, the Incubator became frequently utilized by academic hospital medicine fellows and resident trainees pursuing QI and education projects. Over time, more DHM faculty, and junior faculty in particular, began to present their projects and receive structured feedback from researchers as well as other senior members of the group.
Incubator is structured as a 50‐minute session held from 1:10 to 2:00 pm on Thursdays in a DHM conference room. The time was selected because it did not conflict with other divisional conferences and to reserve mornings for clinical responsibilities. Incubator is held on most weeks of the year except for holidays or when there is no scheduled presenter. Presenting at Incubator is voluntary, and presenters sign up for open spots in advance with the upcoming presenter schedule sent out to the division in advance of the conference. Incubator is also used as a forum to provide feedback on anticipated abstract submissions for professional society meetings. For the purposes of the survey described in this article, we did not include Incubator sessions on reviewing abstracts/posters. Trainees and hospitalists present a broad range of projects at any stage of preparation. These include project ideas, grant applications, manuscripts, abstracts, and oral presentations at any stage of completion for feedback. Our mission was to create a forum where researchers, clinicians, and educators meet to provide the tools and guidance necessary to promote scholarly projects across the range of the division's activities by connecting individuals with complementary skills and interests and providing necessary mentorship and peer support. We have defined scholarship broadly, including evaluation of QI, global health, or other health system innovations, as well as advancements in medical education and traditional clinical research.
All faculty are invited to Incubator, and attendees include senior and junior faculty, researchers in the division, fellows, and occasionally residents and medical students. One week prior to the session, an administrative assistant solicits project information, including any related materials and questions the presenter may have for the group using a prespecified template, and emails this information to division members for review. In addition, the same materials are also printed prior to Incubator for any attendees who may not have reviewed the material in advance. Also, prior to the session, a physician is specified to serve as moderator of the discussion, and another physician is assigned the role of primary reviewer to provide the initial specific feedback and recommendations. The role of the moderator is to manage the discussion and keep the focus on time, and is assigned to a researcher or senior clinical faculty member. The role of primary reviewer is assigned to provide more junior faculty (both researchers and nonresearchers) the opportunity to practice their editing and critiquing skills by providing the initial feedback. Presenters and moderators receive worksheets outlining the structure of Incubator and their respective roles (see Supporting Information, Appendix 1, in the online version of this article).
Incubator begins with the presenter providing a brief synopsis of their project and their specific goals and objectives for the session. The moderator then leads the discussion and guides the format, often starting with any questions the group may have for the presenter followed by the specific feedback from the primary reviewer. The primary reviewer, having reviewed the materials in advance of the session, answers the prespecified questions as listed by the presenter, occasionally providing additional targeted feedback. The session is then opened to the rest of the group for feedback and suggestions. Meanwhile, the presenter is encouraged to wait until the end of the hour to summarize their take on the feedback and what their initial thoughts on the next to do items would be (Table 1).
| Presenter | Administrative assistant |
| 2‐ to 3‐sentence summary of career focus | Schedule session and conference room |
| Distribute short set of materials in advance | Collect presenters' materials in advance |
| Summarize feedback at end of session | Prepare materials for Incubator |
| Brainstorm on next steps at end of session | Monitor attendance and topics of presentation |
| Primary reviewer | Moderator |
| Junior faculty (24 years) | Senior or research faculty |
| Provide brief overview of project | Keep session on time |
| Reiterate key questions | Give additional input |
| Provide 2 major, 3 minor suggestions | Summarize comments from group at the end |
| Constructive, outside the box feedback | Allow last 10 minutes for presenter to discuss plans |
Program Evaluation
Survey Respondents and Process
We retrospectively surveyed the lead presenter for each Incubator session held between May 2010 through November 2013. Surveys were administered through the Research Electronic Data Capture application (REDCap).[9] Participants who were lead presenters at Incubator for more than 1 Incubator session completed a survey for each individual presentation. Therefore, some presenters completed more than 1 survey. The presenters included resident physicians, hospital medicine fellows, junior faculty, and researchers. We defined researchers as hospitalists who had completed a 2‐year research fellowship and/or devoted at least 70% time in their faculty position to research.
Survey Development and Domains
We developed a survey questionnaire using the Kirkpatrick 4‐level model to evaluate the educational experience of the primary presenters and to determine how the session impacted their progress on the project, with each model component graded according to a Likert scale.[10] The 4 major components of the model are: (1) Reaction: participants' estimates of satisfaction with Incubator; (2) Learning: extent of knowledge acquisition achieved at Incubator; (3) Behavior: extent to which learning has been applied or transfer of skills through participation in Incubator; and (4) Results: results of the project, wider changes in organizational scholarship as impacted by Incubator.
We also collected information on the presenter's status at time of presentation including career paths (researcher or nonresearcher), their job description (faculty, fellow, resident), and the total number of years on faculty (if applicable). Hospitalists in their first 2 years on the faculty were considered junior physicians. We also collected information on the number of times they had presented at the Incubator sessions and stage of progress of the project, whether in the early, mid, or late phase at the time of presentation. Early phase was defined as presenting an initial project idea or brainstorming possible project options and/or directions. Mid phase was defined as presenting initial results, data, and initial drafts prior to completion of analysis. Late phase was defined as presenting a project nearing completion such as a written abstract, oral presentation, paper, or grant application. Respondents were also asked to identify the main focus of their projects, selecting the categories based on the interests of the division, including medical education, clinical research, QI, high‐value care, and global health.
Survey Data Analysis
We converted Likert scale data into dichotomous variables, with paring of positive responses versus the negative options. We summarized survey responses using descriptive statistics and determined if there were any differences in responses between career researchers and nonresearchers using 2 tests. All analysis was performed using StataSE version 13.1 (StataCorp, College Station, TX).
RESULTS
Survey Respondent Characteristics
We received 51 completed surveys from presenters at an Incubator session, for a total survey response rate of 70%. Of the 51 presentations, 26 (51%) of the projects were led by physicians in training or junior faculty, and 35 (69%) of the presenters were nonresearchers.
Project Characteristics
The most frequently presented topic areas were QI (N = 20), clinical research (N = 14), medical education (N = 6), and global health (N = 6). Whereas researchers were more likely to present clinical research topics and grant applications, nonresearchers more often presented on QI or medical education projects (Table 2). Projects were presented at all stages of development, with the middle stage, where presenters presented initial results, being the most common phase.
| All | Nonresearcher, No. (%) | Researcher, No. (%) | P Value | |
|---|---|---|---|---|
| ||||
| Total | 51 | 35 | 16 | |
| Trainee or junior faculty | 19 (54%) | 7 (44%) | 0.49 | |
| Topic of project | 0.02 | |||
| Quality improvement | 20 (39%) | 15 (43%) | 5 (31%) | |
| Clinical research | 14 (27%) | 8 (23%) | 6 (38%) | |
| Medical education | 6 (12%) | 5 (14%) | 1 (6%) | |
| Health technology | 4 (8%) | 0 (0%) | 4 (25%) | |
| High‐value care | 1 (2%) | 1 (3%) | 0 (0%) | |
| Global health | 6 (12%) | 6 (12%) | 0 (0%) | |
| Stage of project | 0.31 | |||
| Early* | 12 (23%) | 7 (20%) | 5 (31%) | |
| Middle | 24 (47%) | 19 (54%) | 5 (31%) | |
| Late | 15 (29%) | 9 (26%) | 6 (38%) | |
Impact of Incubator
The reaction to the session was very positive, with 100% of respondents recommending Incubator to others (Table 3), and 35% reported learning as a result of the session. Twenty‐three (45%) of respondents reported that the session helped reframe the project idea and changed the study design, and 20 (39%) reported improved written or oral presentation style. A majority (45, 88%) reported that Incubator was valuable in advancing the project to completion.
| All | Nonresearcher, No. (%) | Researcher, No. (%) | P Value | |
|---|---|---|---|---|
| ||||
| Trainee or junior faculty | 51 | 35 (69%) | 16 (31%) | 0.49 |
| Reaction | ||||
| Satisfied with their WIP session | 50 (98%) | 35 (100%) | 15 (94%) | 0.25 |
| Would recommend WIP to others | 51 (100%) | 35 (100%) | 16 (100%) | 1.00 |
| Any of the above | 35 (100%) | 16 (100%) | 1.00 | |
| Learning | ||||
| Advanced research methodology | 18 (35%) | 12 (34%) | 6 (38%) | 0.82 |
| Advanced knowledge in the area | 9 (18%) | 5 (14%) | 4 (25%) | 0.35 |
| Any of the above | 14 (40%) | 9 (56%) | 0.28 | |
| Behavior | ||||
| Current project | ||||
| Reframed project idea | 23 (45%) | 15 (43%) | 8 (50%) | 0.63 |
| Changed study design or methodology | 23 (45%) | 16 (46%) | 7 (44%) | 0.9 |
| Improved written or oral presentation style | 20 (39%) | 15 (43%) | 5 (31%) | 0.43 |
| Future projects | ||||
| Changed approach to future projects | 19 (37%) | 17 (49%) | 2 (13%) | 0.01 |
| Any of the above | 34 (97%) | 14 (88%) | 0.17 | |
| Results | ||||
| Valuable in advancing project to completion | 45 (88%) | 31 (89%) | 14 (88%) | 0.18 |
| Provided mentoring and peer support | 29 (57%) | 24 (69%) | 5 (31%) | 0.01 |
| Connected individuals with similar results | 13 (13%) | 9 (26%) | 4 (25%) | 0.96 |
| Any of the above | 34 (97%) | 14 (88%) | 0.17 | |
Survey results of researchers compared to nonresearchers were similar overall, although nonresearchers were more likely to report changes in behavior and in improved mentoring as a result of presenting at Incubator. Notably, 17 (49%) of nonresearchers reported that Incubator changed their approach to future projects as opposed to only 2 (13%) researchers (P = 0.01). In addition, 24 (69%) nonresearchers reported value in mentorship and peer support compared to 5 (31%) researchers (P = 0.01). A reasonably large proportion of projects originally presented during the Incubator sessions became published articles at the time of survey completion (N = 19, 37%) or were publications in progress (N = 14, 27%). For all remaining items, there were no statistically significant differences in the survey responses among junior faculty/trainees (N = 26) compared to nonjunior faculty (N = 25) presenters (P > 0.05).
Attendance at Incubator During the Study Period
Attendance at Incubator was open and voluntary for all DHM faculty, fellows, and collaborating UCSF trainees. From July 2012, when we began tracking attendance, through the end of the survey period in November 2013, the average number of attendees for each session was 10.7 (standard deviation [SD] 3.8). On average, 50% (SD 16%) of attendees at Incubator were career researchers.
DISCUSSION
The results of this program evaluation suggest that a WIP session employed by an academic division of hospital medicine, consisting of a weekly moderated session, can help advance scholarly work. Our evaluation found that presenters, both researchers and nonresearchers, favorably viewed the regular WIP sessions and reported that feedback in the Incubator helped them advance their project to completion. Importantly, nonresearch‐focused faculty and fellows reported the biggest gains in learning from presenting at Incubator. Whereas half the Incubator attendees were career researchers, consistent with the observation that researchers within the division were most committed to attending Incubator regularly, 69% of the presenters were nonresearchers, demonstrating strong participation among both researchers and nonresearchers within the division.
WIP sessions, though informal, are interactive, inspire critical self‐reflection, and encourage physicians to act on generated ideas, as evidenced by the change in behavior of the participants after the session. These sessions allow for transformative learning by encouraging physicians to be open to alternative viewpoints and engage in discourse, boosting learning beyond just content knowledge. Prior assessments of WIP seminars similarly found high satisfaction with these formats.[11]
Although we cannot identify specifically which features made Incubator effective, we believe that our WIP had some characteristics that may have contributed to its success and may aid in implementation at other institutions: holding the session regularly, voluntary participation, distributing the materials and questions for the group in advance, and designating a moderator for the session in advance to facilitate discussion.
A potential strength of the Incubator is that both researchers and nonresearchers attend. We hypothesize that combining these groups provides improved mentorship and learning for nonresearchers, in particular. In addition, it creates a mutually beneficial environment where each group is able to witness the diversity of projects within the division and learn to provide focused, constructive feedback on the presented work. Not only did this create a transparent environment with better understanding of divisional activities, but also fostered collaboration among hospitalists with similar interests and complementary skills.
Challenges, Setbacks, Updated Approaches
The creation of a successful Incubator session, however, was not without its challenges. At initial inception, the WIP was attended primarily by researchers and had low overall attendance. Members of the division who were primarily clinicians initially perceived the conferences as largely inapplicable to their career objectives and had competing demands from patient care, educational, or administrative responsibilities. However, over time and with encouragement from divisional leaders and service line directors, increasing numbers of hospitalists began to participate in Incubator. The timing of Incubator during afternoons after the Department of Medicine Grand Rounds was chosen specifically to allow clinicians to complete their responsibilities, including morning rounds and teaching, to allow better attendance.
In addition, the results of our survey informed changes to the structure of Incubator. The efficacy of assigning a primary reviewer for each session was not clear, so this component was eventually dropped. The finding that nonresearchers in particular reported a benefit from mentoring and peer‐support at Incubator led to the implementation of querying the presenter for a wish list of faculty attendees at their Incubator session. We then sent a special invitation to those faculty members thought to have special insights on the project. This gave junior faculty the opportunity to present their projects to more senior faculty members within their areas of research, as well as to receive focused expert feedback.
Finally, we have initiated special Incubator sessions focused more on didactics to teach the process of writing manuscripts and brainstorming workshop ideas for national meetings.
Limitations
Our study has limitations. It is a single‐center study based on a small overall sample size, and it is not certain whether a similar innovation would have comparable effects at another institution. In addition, generalizability of our results may be limited for hospital medicine groups without a robust research program. We did not have a control group nor do we know whether participants would have been equally successful without Incubator. We also were unable to assess how Incubator affected long‐term outcomes such as promotion and overall publication record, as we do not have detailed data on productivity prior to the survey period. Finally, we are unable to quantify the effect of Incubator on scholarly success in the division. Although the numbers of published articles and grant funding has increased since the Incubator began (data not shown), the division also grew both in number of research‐focused and nonresearch‐focused faculty, and this study does not account for other temporal changes that may have contributed to improvements in the scholarly output of the division.
CONCLUSIONS
In summary, the Incubator has been a successful program that fostered progress on scholarly projects within a largely clinically focused DHM. Given the importance of scholarship in academic hospital medicine, a WIP session such as the one we describe is a valuable way to support and mentor junior hospitalists and nonresearchers.
Acknowledgements
The authors extend special thanks to Oralia Schatzman, divisional administrative assistant, who organized and arranged the Incubator sessions and recorded attendance, and to Katherine Li, who collected data on numbers of faculty within the division over the duration of the study.
Disclosures: Dr. Hemali Patel, Dr. Margaret Fang, and Mr. James Harrison report no conflicts of interest. At the time the research was conducted, Dr. Kangelaris was supported by the National Heart, Lung, and Blood Institute (1K23HL116800‐01). Dr. Auerbach was supported by the National Heart, Lung, and Blood Institute (K24 K24HL098372).
- , , , . Investing in the future: building an academic hospitalist faculty development program. J Hosp Med. 2011;6(3):161–166.
- , , , , . Tried and true: a survey of successfully promoted academic hospitalists. J Hosp Med. 2011;6(7):411–415.
- , , , , , . Mentorship, productivity, and promotion among academic hospitalists. J Gen Intern Med. 2012;27(1):23–27.
- , , , , , . The PRIME curriculum. J Gen Intern Med. 2006;21(5):506–509.
- , , , . Hospital medicine fellowships: works in progress. Am J Med. 2006;119(1):72.e1–7.
- , , . Instituting systems‐based practice and practice‐based learning and improvement: a curriculum of inquiry. Med Educ Online. 2013;18:21612.
- , , , et al. A physician peer support writing group. Fam Med. 2003;35(3):195–201.
- , , , . Research in progress conference for hospitalists provides valuable peer mentoring. J Hosp Med. 2011;6(1):43–46.
- , , , , , . Research electronic data capture (REDCap)—a metadata‐driven methodology and workflow process for providing translational research informatics support. J Biomed Inform. 2009;42(2):377–381.
- , . Evaluating Training Programs: The Four Levels. 3rd ed. San Francisco, CA: Berrett‐Koehler; 2006.
- , , . Works‐in‐progress: guiding junior scientists through career development applications. J Cancer Educ. 2008;23(3):142–148.
Academic hospital medicine is a fast‐growing specialty and has a strong emphasis on high‐value care, efficiency, and quality improvement (QI).[1] Developing scholarly work in these areas and describing findings in peer‐reviewed publications can help disseminate ideas and innovations more widely. In addition, success in academic medicine, at least in part, continues to be measured by traditional academic benchmarks, including the production of scholarly publications, conference presentations, and abstracts.[2]
Hospital medicine, however, faces challenges in providing an academic environment conducive to fostering scholarly work. As a relatively young specialty, there may be a dearth of senior mentors and experienced researchers; lack of structured mentorship can be associated with failure to produce publications or lead national teaching sessions.[3] Relatively few hospitalists undergo fellowships or other specialized training that provides a clinical research background, and internal medicine residency programs rarely provide the comprehensive research skill set required to design, implement, or disseminate academic work.[4, 5, 6] Finally, heavy clinical responsibilities may hinder efforts to conduct and sustain research.
A works‐in‐progress (WIP) session, commonly employed in clinical research groups, can provide a forum to discuss and receive feedback on evolving projects and can foster mentorship, motivation, and training.[7] Although a WIP session may stimulate discussion and advance project ideas, academic hospitalist groups do not commonly employ this model, and it is not known if a regularly scheduled WIP session can provide the mentorship, training, and motivation necessary to assist junior faculty in advancing scholarly project to completion.[8] In this article, we describe how we developed a regular WIP series to promote scholarship activities within our rapidly growing, primarily clinically focused Division of Hospital Medicine (DHM) at the University of California, San Francisco (UCSF), and the results of a survey of WIP participants. We hope that our experience can help illustrate key features of such a model, as well as describe inherent challenges and lessons learned to help promote successful academic efforts at other institutions.
METHODS
Program Setting
During years 2010 to 2013, the time period captured by our survey, the DHM at UCSF grew from 37 to 46 full‐time hospitalists, with 76% primarily clinical faculty (nonresearchers) and 24% primarily clinician‐investigators (researchers), defined as individuals having completed a 2‐year clinical research fellowship and/or dedicating 70% time in their faculty position to clinical research. In addition, there were between 1 and 3 hospitalist fellows per year. In 2012, a PhD researcher joined the division to support research and academic activities within the division as well as to pursue an independent research career.
Program Description
The DHM WIP, named the Incubator, was initially developed in 2007 when researchers recognized the need and desire for a forum where scholarly projects could be reviewed and evaluated. In the first year, the Incubator was primarily utilized by junior research‐trained mentees applying for National Institutes of Health career development awards. However, it soon became clear that nonresearch trained junior fellow and faculty members were pursuing scholarly projects needing additional guidance and input. In particular, the Incubator became frequently utilized by academic hospital medicine fellows and resident trainees pursuing QI and education projects. Over time, more DHM faculty, and junior faculty in particular, began to present their projects and receive structured feedback from researchers as well as other senior members of the group.
Incubator is structured as a 50‐minute session held from 1:10 to 2:00 pm on Thursdays in a DHM conference room. The time was selected because it did not conflict with other divisional conferences and to reserve mornings for clinical responsibilities. Incubator is held on most weeks of the year except for holidays or when there is no scheduled presenter. Presenting at Incubator is voluntary, and presenters sign up for open spots in advance with the upcoming presenter schedule sent out to the division in advance of the conference. Incubator is also used as a forum to provide feedback on anticipated abstract submissions for professional society meetings. For the purposes of the survey described in this article, we did not include Incubator sessions on reviewing abstracts/posters. Trainees and hospitalists present a broad range of projects at any stage of preparation. These include project ideas, grant applications, manuscripts, abstracts, and oral presentations at any stage of completion for feedback. Our mission was to create a forum where researchers, clinicians, and educators meet to provide the tools and guidance necessary to promote scholarly projects across the range of the division's activities by connecting individuals with complementary skills and interests and providing necessary mentorship and peer support. We have defined scholarship broadly, including evaluation of QI, global health, or other health system innovations, as well as advancements in medical education and traditional clinical research.
All faculty are invited to Incubator, and attendees include senior and junior faculty, researchers in the division, fellows, and occasionally residents and medical students. One week prior to the session, an administrative assistant solicits project information, including any related materials and questions the presenter may have for the group using a prespecified template, and emails this information to division members for review. In addition, the same materials are also printed prior to Incubator for any attendees who may not have reviewed the material in advance. Also, prior to the session, a physician is specified to serve as moderator of the discussion, and another physician is assigned the role of primary reviewer to provide the initial specific feedback and recommendations. The role of the moderator is to manage the discussion and keep the focus on time, and is assigned to a researcher or senior clinical faculty member. The role of primary reviewer is assigned to provide more junior faculty (both researchers and nonresearchers) the opportunity to practice their editing and critiquing skills by providing the initial feedback. Presenters and moderators receive worksheets outlining the structure of Incubator and their respective roles (see Supporting Information, Appendix 1, in the online version of this article).
Incubator begins with the presenter providing a brief synopsis of their project and their specific goals and objectives for the session. The moderator then leads the discussion and guides the format, often starting with any questions the group may have for the presenter followed by the specific feedback from the primary reviewer. The primary reviewer, having reviewed the materials in advance of the session, answers the prespecified questions as listed by the presenter, occasionally providing additional targeted feedback. The session is then opened to the rest of the group for feedback and suggestions. Meanwhile, the presenter is encouraged to wait until the end of the hour to summarize their take on the feedback and what their initial thoughts on the next to do items would be (Table 1).
| Presenter | Administrative assistant |
| 2‐ to 3‐sentence summary of career focus | Schedule session and conference room |
| Distribute short set of materials in advance | Collect presenters' materials in advance |
| Summarize feedback at end of session | Prepare materials for Incubator |
| Brainstorm on next steps at end of session | Monitor attendance and topics of presentation |
| Primary reviewer | Moderator |
| Junior faculty (24 years) | Senior or research faculty |
| Provide brief overview of project | Keep session on time |
| Reiterate key questions | Give additional input |
| Provide 2 major, 3 minor suggestions | Summarize comments from group at the end |
| Constructive, outside the box feedback | Allow last 10 minutes for presenter to discuss plans |
Program Evaluation
Survey Respondents and Process
We retrospectively surveyed the lead presenter for each Incubator session held between May 2010 through November 2013. Surveys were administered through the Research Electronic Data Capture application (REDCap).[9] Participants who were lead presenters at Incubator for more than 1 Incubator session completed a survey for each individual presentation. Therefore, some presenters completed more than 1 survey. The presenters included resident physicians, hospital medicine fellows, junior faculty, and researchers. We defined researchers as hospitalists who had completed a 2‐year research fellowship and/or devoted at least 70% time in their faculty position to research.
Survey Development and Domains
We developed a survey questionnaire using the Kirkpatrick 4‐level model to evaluate the educational experience of the primary presenters and to determine how the session impacted their progress on the project, with each model component graded according to a Likert scale.[10] The 4 major components of the model are: (1) Reaction: participants' estimates of satisfaction with Incubator; (2) Learning: extent of knowledge acquisition achieved at Incubator; (3) Behavior: extent to which learning has been applied or transfer of skills through participation in Incubator; and (4) Results: results of the project, wider changes in organizational scholarship as impacted by Incubator.
We also collected information on the presenter's status at time of presentation including career paths (researcher or nonresearcher), their job description (faculty, fellow, resident), and the total number of years on faculty (if applicable). Hospitalists in their first 2 years on the faculty were considered junior physicians. We also collected information on the number of times they had presented at the Incubator sessions and stage of progress of the project, whether in the early, mid, or late phase at the time of presentation. Early phase was defined as presenting an initial project idea or brainstorming possible project options and/or directions. Mid phase was defined as presenting initial results, data, and initial drafts prior to completion of analysis. Late phase was defined as presenting a project nearing completion such as a written abstract, oral presentation, paper, or grant application. Respondents were also asked to identify the main focus of their projects, selecting the categories based on the interests of the division, including medical education, clinical research, QI, high‐value care, and global health.
Survey Data Analysis
We converted Likert scale data into dichotomous variables, with paring of positive responses versus the negative options. We summarized survey responses using descriptive statistics and determined if there were any differences in responses between career researchers and nonresearchers using 2 tests. All analysis was performed using StataSE version 13.1 (StataCorp, College Station, TX).
RESULTS
Survey Respondent Characteristics
We received 51 completed surveys from presenters at an Incubator session, for a total survey response rate of 70%. Of the 51 presentations, 26 (51%) of the projects were led by physicians in training or junior faculty, and 35 (69%) of the presenters were nonresearchers.
Project Characteristics
The most frequently presented topic areas were QI (N = 20), clinical research (N = 14), medical education (N = 6), and global health (N = 6). Whereas researchers were more likely to present clinical research topics and grant applications, nonresearchers more often presented on QI or medical education projects (Table 2). Projects were presented at all stages of development, with the middle stage, where presenters presented initial results, being the most common phase.
| All | Nonresearcher, No. (%) | Researcher, No. (%) | P Value | |
|---|---|---|---|---|
| ||||
| Total | 51 | 35 | 16 | |
| Trainee or junior faculty | 19 (54%) | 7 (44%) | 0.49 | |
| Topic of project | 0.02 | |||
| Quality improvement | 20 (39%) | 15 (43%) | 5 (31%) | |
| Clinical research | 14 (27%) | 8 (23%) | 6 (38%) | |
| Medical education | 6 (12%) | 5 (14%) | 1 (6%) | |
| Health technology | 4 (8%) | 0 (0%) | 4 (25%) | |
| High‐value care | 1 (2%) | 1 (3%) | 0 (0%) | |
| Global health | 6 (12%) | 6 (12%) | 0 (0%) | |
| Stage of project | 0.31 | |||
| Early* | 12 (23%) | 7 (20%) | 5 (31%) | |
| Middle | 24 (47%) | 19 (54%) | 5 (31%) | |
| Late | 15 (29%) | 9 (26%) | 6 (38%) | |
Impact of Incubator
The reaction to the session was very positive, with 100% of respondents recommending Incubator to others (Table 3), and 35% reported learning as a result of the session. Twenty‐three (45%) of respondents reported that the session helped reframe the project idea and changed the study design, and 20 (39%) reported improved written or oral presentation style. A majority (45, 88%) reported that Incubator was valuable in advancing the project to completion.
| All | Nonresearcher, No. (%) | Researcher, No. (%) | P Value | |
|---|---|---|---|---|
| ||||
| Trainee or junior faculty | 51 | 35 (69%) | 16 (31%) | 0.49 |
| Reaction | ||||
| Satisfied with their WIP session | 50 (98%) | 35 (100%) | 15 (94%) | 0.25 |
| Would recommend WIP to others | 51 (100%) | 35 (100%) | 16 (100%) | 1.00 |
| Any of the above | 35 (100%) | 16 (100%) | 1.00 | |
| Learning | ||||
| Advanced research methodology | 18 (35%) | 12 (34%) | 6 (38%) | 0.82 |
| Advanced knowledge in the area | 9 (18%) | 5 (14%) | 4 (25%) | 0.35 |
| Any of the above | 14 (40%) | 9 (56%) | 0.28 | |
| Behavior | ||||
| Current project | ||||
| Reframed project idea | 23 (45%) | 15 (43%) | 8 (50%) | 0.63 |
| Changed study design or methodology | 23 (45%) | 16 (46%) | 7 (44%) | 0.9 |
| Improved written or oral presentation style | 20 (39%) | 15 (43%) | 5 (31%) | 0.43 |
| Future projects | ||||
| Changed approach to future projects | 19 (37%) | 17 (49%) | 2 (13%) | 0.01 |
| Any of the above | 34 (97%) | 14 (88%) | 0.17 | |
| Results | ||||
| Valuable in advancing project to completion | 45 (88%) | 31 (89%) | 14 (88%) | 0.18 |
| Provided mentoring and peer support | 29 (57%) | 24 (69%) | 5 (31%) | 0.01 |
| Connected individuals with similar results | 13 (13%) | 9 (26%) | 4 (25%) | 0.96 |
| Any of the above | 34 (97%) | 14 (88%) | 0.17 | |
Survey results of researchers compared to nonresearchers were similar overall, although nonresearchers were more likely to report changes in behavior and in improved mentoring as a result of presenting at Incubator. Notably, 17 (49%) of nonresearchers reported that Incubator changed their approach to future projects as opposed to only 2 (13%) researchers (P = 0.01). In addition, 24 (69%) nonresearchers reported value in mentorship and peer support compared to 5 (31%) researchers (P = 0.01). A reasonably large proportion of projects originally presented during the Incubator sessions became published articles at the time of survey completion (N = 19, 37%) or were publications in progress (N = 14, 27%). For all remaining items, there were no statistically significant differences in the survey responses among junior faculty/trainees (N = 26) compared to nonjunior faculty (N = 25) presenters (P > 0.05).
Attendance at Incubator During the Study Period
Attendance at Incubator was open and voluntary for all DHM faculty, fellows, and collaborating UCSF trainees. From July 2012, when we began tracking attendance, through the end of the survey period in November 2013, the average number of attendees for each session was 10.7 (standard deviation [SD] 3.8). On average, 50% (SD 16%) of attendees at Incubator were career researchers.
DISCUSSION
The results of this program evaluation suggest that a WIP session employed by an academic division of hospital medicine, consisting of a weekly moderated session, can help advance scholarly work. Our evaluation found that presenters, both researchers and nonresearchers, favorably viewed the regular WIP sessions and reported that feedback in the Incubator helped them advance their project to completion. Importantly, nonresearch‐focused faculty and fellows reported the biggest gains in learning from presenting at Incubator. Whereas half the Incubator attendees were career researchers, consistent with the observation that researchers within the division were most committed to attending Incubator regularly, 69% of the presenters were nonresearchers, demonstrating strong participation among both researchers and nonresearchers within the division.
WIP sessions, though informal, are interactive, inspire critical self‐reflection, and encourage physicians to act on generated ideas, as evidenced by the change in behavior of the participants after the session. These sessions allow for transformative learning by encouraging physicians to be open to alternative viewpoints and engage in discourse, boosting learning beyond just content knowledge. Prior assessments of WIP seminars similarly found high satisfaction with these formats.[11]
Although we cannot identify specifically which features made Incubator effective, we believe that our WIP had some characteristics that may have contributed to its success and may aid in implementation at other institutions: holding the session regularly, voluntary participation, distributing the materials and questions for the group in advance, and designating a moderator for the session in advance to facilitate discussion.
A potential strength of the Incubator is that both researchers and nonresearchers attend. We hypothesize that combining these groups provides improved mentorship and learning for nonresearchers, in particular. In addition, it creates a mutually beneficial environment where each group is able to witness the diversity of projects within the division and learn to provide focused, constructive feedback on the presented work. Not only did this create a transparent environment with better understanding of divisional activities, but also fostered collaboration among hospitalists with similar interests and complementary skills.
Challenges, Setbacks, Updated Approaches
The creation of a successful Incubator session, however, was not without its challenges. At initial inception, the WIP was attended primarily by researchers and had low overall attendance. Members of the division who were primarily clinicians initially perceived the conferences as largely inapplicable to their career objectives and had competing demands from patient care, educational, or administrative responsibilities. However, over time and with encouragement from divisional leaders and service line directors, increasing numbers of hospitalists began to participate in Incubator. The timing of Incubator during afternoons after the Department of Medicine Grand Rounds was chosen specifically to allow clinicians to complete their responsibilities, including morning rounds and teaching, to allow better attendance.
In addition, the results of our survey informed changes to the structure of Incubator. The efficacy of assigning a primary reviewer for each session was not clear, so this component was eventually dropped. The finding that nonresearchers in particular reported a benefit from mentoring and peer‐support at Incubator led to the implementation of querying the presenter for a wish list of faculty attendees at their Incubator session. We then sent a special invitation to those faculty members thought to have special insights on the project. This gave junior faculty the opportunity to present their projects to more senior faculty members within their areas of research, as well as to receive focused expert feedback.
Finally, we have initiated special Incubator sessions focused more on didactics to teach the process of writing manuscripts and brainstorming workshop ideas for national meetings.
Limitations
Our study has limitations. It is a single‐center study based on a small overall sample size, and it is not certain whether a similar innovation would have comparable effects at another institution. In addition, generalizability of our results may be limited for hospital medicine groups without a robust research program. We did not have a control group nor do we know whether participants would have been equally successful without Incubator. We also were unable to assess how Incubator affected long‐term outcomes such as promotion and overall publication record, as we do not have detailed data on productivity prior to the survey period. Finally, we are unable to quantify the effect of Incubator on scholarly success in the division. Although the numbers of published articles and grant funding has increased since the Incubator began (data not shown), the division also grew both in number of research‐focused and nonresearch‐focused faculty, and this study does not account for other temporal changes that may have contributed to improvements in the scholarly output of the division.
CONCLUSIONS
In summary, the Incubator has been a successful program that fostered progress on scholarly projects within a largely clinically focused DHM. Given the importance of scholarship in academic hospital medicine, a WIP session such as the one we describe is a valuable way to support and mentor junior hospitalists and nonresearchers.
Acknowledgements
The authors extend special thanks to Oralia Schatzman, divisional administrative assistant, who organized and arranged the Incubator sessions and recorded attendance, and to Katherine Li, who collected data on numbers of faculty within the division over the duration of the study.
Disclosures: Dr. Hemali Patel, Dr. Margaret Fang, and Mr. James Harrison report no conflicts of interest. At the time the research was conducted, Dr. Kangelaris was supported by the National Heart, Lung, and Blood Institute (1K23HL116800‐01). Dr. Auerbach was supported by the National Heart, Lung, and Blood Institute (K24 K24HL098372).
- , , , . Investing in the future: building an academic hospitalist faculty development program. J Hosp Med. 2011;6(3):161–166.
- , , , , . Tried and true: a survey of successfully promoted academic hospitalists. J Hosp Med. 2011;6(7):411–415.
- , , , , , . Mentorship, productivity, and promotion among academic hospitalists. J Gen Intern Med. 2012;27(1):23–27.
- , , , , , . The PRIME curriculum. J Gen Intern Med. 2006;21(5):506–509.
- , , , . Hospital medicine fellowships: works in progress. Am J Med. 2006;119(1):72.e1–7.
- , , . Instituting systems‐based practice and practice‐based learning and improvement: a curriculum of inquiry. Med Educ Online. 2013;18:21612.
- , , , et al. A physician peer support writing group. Fam Med. 2003;35(3):195–201.
- , , , . Research in progress conference for hospitalists provides valuable peer mentoring. J Hosp Med. 2011;6(1):43–46.
- , , , , , . Research electronic data capture (REDCap)—a metadata‐driven methodology and workflow process for providing translational research informatics support. J Biomed Inform. 2009;42(2):377–381.
- , . Evaluating Training Programs: The Four Levels. 3rd ed. San Francisco, CA: Berrett‐Koehler; 2006.
- , , . Works‐in‐progress: guiding junior scientists through career development applications. J Cancer Educ. 2008;23(3):142–148.
© 2016 Society of Hospital Medicine
How can I predict bleeding in my elderly patient taking anticoagulants?
We have tools to predict bleeding risk, but their predictive value is modest, and the estimated risk of bleeding is often outweighed by the benefits of anticoagulant therapy.
Anticoagulant therapy is commonly prescribed for conditions that disproportionately affect the elderly, including atrial fibrillation, venous thromboembolism, and valvular heart disease. Though anticoagulants are highly effective in preventing clots, they also significantly increase the risk of bleeding. Since older age is a risk factor for bleeding as well as thrombosis, it is essential to weigh the risks and benefits of anticoagulants for each patient.
WHAT KINDS OF BLEEDING DEVELOP IN PATIENTS ON ANTICOAGULANTS?
Patients taking anticoagulants have roughly double the risk of bleeding compared with patients not on anticoagulants.1 Bleeding rates tend to be slightly higher in patients taking anticoagulants for venous thromboembolism than in those taking them for atrial fibrillation. The average yearly risk of a “major” anticoagulant-associated bleeding event (eg, requiring transfusion or intervention or occurring in a critical anatomic site) is about 2% to 3%, with most of the bleeding being gastrointestinal.2
Intracranial hemorrhage is by far the most deadly complication of anticoagulant therapy: it causes 90% of deaths and disability from warfarin-associated hemorrhage and is associated with a death rate over 50%; however, it is much less common than gastrointestinal bleeding.3 Anticoagulant therapy increases the risk of intracranial hemorrhage by only 0.2% per year.1
RISK-PREDICTION TOOLS HAVE LIMITATIONS
Not all patients have the same risk of bleeding when taking anticoagulants. Many factors in addition to advanced age have been associated with increased bleeding risk, including coexisting medical conditions (such as malignancy, prior stroke or bleeding event, and renal insufficiency), medications (particularly aspirin, nonsteroidal anti-inflammatory drugs, and other antiplatelet drugs), and the timing and intensity of anticoagulation therapy.4
Scoring tools have been developed to identify patients at higher risk of bleeding (Table 1).4–9 The various schemes incorporate many of the same variables, such as older age, renal impairment, and history of bleeding, but some include additional risk factors while others are more parsimonious. They also differ in how individual risk factors are weighted to generate a final risk score.
In terms of predictive ability, none of the available risk schemes appears to be vastly superior, and their ability to predict hemorrhage is modest at best. There is also no universal or well-established threshold at which the risk of bleeding is so high that one would not consider anticoagulants. In fact, a “high-risk” patient may have an aggregate bleeding rate of only 4% to 6% per year. Using risk schemes such as ATRIA,5 HEMORR2HAGES,6 and HAS-BLED7 may be more useful because they provide an estimate of bleeding risk for each point on the scale.
Moreover, the current tools to predict bleeding risk have several other limitations. They were developed in patients already taking anticoagulants and so probably underestimate the actual risk of hemorrhage, as people who could not take anticoagulants were excluded, most likely because they were at high risk of bleeding. Therefore, bleeding risk tools probably apply best to a patient for whom anticoagulation can be considered.
Some clinical variables are necessarily broad. For example, “prior bleeding” is a risk factor included in several risk scores, but does not distinguish between massive variceal bleeding and minor hemorrhoidal bleeding.
Risk scores do not effectively predict intracranial hemorrhage.
Finally, these risk tools were developed in patients taking vitamin K antagonists, and it is not yet established that they can effectively predict hemorrhage related to other, newer anticoagulants.
WHEN DOES BLEEDING RISK OUTWEIGH ANTICOAGULATION BENEFIT?
For patients with atrial fibrillation, the net clinical benefit of anticoagulation (strokes prevented minus bleeding events induced) increases as the risk of stroke rises. Updated guidelines for managing atrial fibrillation now recommend anticoagulation for most patients.10
For most older patients with atrial fibrillation, the decision to anticoagulate may not change even if a bleeding risk tool indicates a high bleeding risk.11 For example, a patient with a history of ischemic stroke will generally derive more benefit than harm from anticoagulants. The primary exception is in patients with prior lobar intracranial hemorrhage, because of the high risk of rebleeding and the worse outcomes associated with intracranial hemorrhage.12 As a general rule, most patients with atrial fibrillation and an additional risk factor for stroke should be considered for anticoagulant therapy unless they have a history of lobar intracranial hemorrhage.
Anticoagulation may be deferred if the patient is at the lower end of the stroke risk spectrum and if the bleeding risk is calculated to be high. However, as noted before, current bleeding risk tools probably do not capture the experiences of patients at the extremes of high bleeding risk, so clinical judgment continues to be important. In addition, forgoing anticoagulation could be reasonable even in patients at high risk for recurrent stroke if their life expectancy is limited, if anticoagulation is unacceptably burdensome, or if it is not within their goals and preferences.
WHAT ABOUT FALL RISK?
Fall risk commonly deters clinicians from prescribing anticoagulants because of the fear of causing intracranial hemorrhage. In particular, falls increase the risk for subdural hematoma, which has a death rate comparable to that of ischemic stroke.13
Studies have had difficulty quantifying the exact risk associated with falls because these patients are less likely to be prescribed anticoagulants. One decision analysis estimated that a person would have to fall about 300 times per year before the risk of intracranial hemorrhage outweighed the benefits from stroke reduction.14 Studies have found that patients at high risk of falls have a higher risk of intracranial hemorrhage, but that this risk is counterbalanced by an even greater risk of ischemic stroke.15
Therefore, if the baseline risk of ischemic stroke is high, anticoagulation is still favored.
WHEN SHOULD I USE A BLEEDING RISK TOOL?
Despite their limitations, bleeding risk tools are useful in clinical practice when estimates of bleeding risk affect clinical behavior. They are most helpful for patients at the lower end of the stroke or thromboembolism risk spectrum, where the decision to anticoagulate is strongly influenced by bleeding risk. Risk tools may also be helpful when counseling patients about their bleeding risk off and on anticoagulants.
Finally, recognizing that a patient is at high bleeding risk may lead the clinician to consider closer monitoring of anticoagulants or to implement strategies to reduce the risk.
- Hart RG, Pearce LA, Aguilar MI. Meta-analysis: antithrombotic therapy to prevent stroke in patients who have nonvalvular atrial fibrillation. Ann Intern Med 2007; 146:857–867.
- Lopes LC, Spencer FA, Neumann I, et al. Bleeding risk in atrial fibrillation patients taking vitamin K antagonists: systematic review and meta-analysis. Clin Pharmacol Ther 2013; 94:367–375.
- Fang MC, Go AS, Chang Y, et al. Death and disability from warfarin-associated intracranial and extracranial hemorrhages. Am J Med 2007; 120:700–705.
- Lopes RD, Crowley MJ, Shah BR, et al. Stroke prevention in atrial fibrillation. Rockville (MD): Agency for Healthcare Research and Quality (US); 2013 Aug. Report No.: 13-EHC113-EF.
- Fang MC, Go AS, Chang Y, et al. A new risk scheme to predict warfarin-associated hemorrhage: the ATRIA (Anticoagulation and Risk Factors in Atrial Fibrillation) Study. J Am Coll Cardiol 2011; 58:395–401.
- Gage BF, Yan Y, Milligan PE, et al. Clinical classification schemes for predicting hemorrhage: results from the National Registry of Atrial Fibrillation (NRAF) Am Heart J 2006; 151:713–719.
- Pisters R, Lane DA, Nieuwlaat R, de Vos CB, Crijns HJ, Lip GY. A novel user-friendly score (HAS-BLED) to assess 1-year risk of major bleeding in patients with atrial fibrillation: the Euro Heart Survey. Chest 2010; 138:1093–1100.
- Beyth RJ, Quinn LM, Landefeld CS. Prospective evaluation of an index for predicting the risk of major bleeding in outpatients treated with warfarin. Am J Med 1998; 105:91–99.
- Nieto JA, Solano R, Iglesias NT, et al, for the RIETE Investigators. Validation of a score for predicting fatal bleeding in patients receiving anticoagulation for venous thromboembolism. Thrombosis Res 2013; 132:175–179.
- January CT, Wann LS, Alpert JS, et al; ACC/AHA Task Force Members. 2014 AHA/ACC/HRS guideline for the management of patients with atrial fibrillation: executive summary: a report of the American College of Cardiology/American Heart Association Task Force on practice guidelines and the Heart Rhythm Society. Circulation 2014; 130:2071–2104.
- Singer DE, Chang Y, Fang MC, et al. The net clinical benefit of warfarin anticoagulation in atrial fibrillation. Ann Intern Med 2009; 151:297–305.
- Eckman MH, Rosand J, Knudsen KA, Singer DE, Greenberg SM. Can patients be anticoagulated after intracerebral hemorrhage? A decision analysis. Stroke 2003; 34:1710–1716.
- Fang MC, Go AS, Chang Y, et al. Thirty-day mortality after ischemic stroke and intracranial hemorrhage in patients with atrial fibrillation on and off anticoagulants. Stroke 2012; 43:1795–1799.
- Man-Son-Hing M, Laupacis A. Anticoagulant-related bleeding in older persons with atrial fibrillation: physicians' fears often unfounded. Arch Intern Med 2003; 163:1580–1586.
- Gage BF, Birman-Deych E, Kerzner R, Radford MJ, Nilasena DS, Rich MW. Incidence of intracranial hemorrhage in patients with atrial fibrillation who are prone to fall. Am J Med 2005; 118:612–617.
We have tools to predict bleeding risk, but their predictive value is modest, and the estimated risk of bleeding is often outweighed by the benefits of anticoagulant therapy.
Anticoagulant therapy is commonly prescribed for conditions that disproportionately affect the elderly, including atrial fibrillation, venous thromboembolism, and valvular heart disease. Though anticoagulants are highly effective in preventing clots, they also significantly increase the risk of bleeding. Since older age is a risk factor for bleeding as well as thrombosis, it is essential to weigh the risks and benefits of anticoagulants for each patient.
WHAT KINDS OF BLEEDING DEVELOP IN PATIENTS ON ANTICOAGULANTS?
Patients taking anticoagulants have roughly double the risk of bleeding compared with patients not on anticoagulants.1 Bleeding rates tend to be slightly higher in patients taking anticoagulants for venous thromboembolism than in those taking them for atrial fibrillation. The average yearly risk of a “major” anticoagulant-associated bleeding event (eg, requiring transfusion or intervention or occurring in a critical anatomic site) is about 2% to 3%, with most of the bleeding being gastrointestinal.2
Intracranial hemorrhage is by far the most deadly complication of anticoagulant therapy: it causes 90% of deaths and disability from warfarin-associated hemorrhage and is associated with a death rate over 50%; however, it is much less common than gastrointestinal bleeding.3 Anticoagulant therapy increases the risk of intracranial hemorrhage by only 0.2% per year.1
RISK-PREDICTION TOOLS HAVE LIMITATIONS
Not all patients have the same risk of bleeding when taking anticoagulants. Many factors in addition to advanced age have been associated with increased bleeding risk, including coexisting medical conditions (such as malignancy, prior stroke or bleeding event, and renal insufficiency), medications (particularly aspirin, nonsteroidal anti-inflammatory drugs, and other antiplatelet drugs), and the timing and intensity of anticoagulation therapy.4
Scoring tools have been developed to identify patients at higher risk of bleeding (Table 1).4–9 The various schemes incorporate many of the same variables, such as older age, renal impairment, and history of bleeding, but some include additional risk factors while others are more parsimonious. They also differ in how individual risk factors are weighted to generate a final risk score.
In terms of predictive ability, none of the available risk schemes appears to be vastly superior, and their ability to predict hemorrhage is modest at best. There is also no universal or well-established threshold at which the risk of bleeding is so high that one would not consider anticoagulants. In fact, a “high-risk” patient may have an aggregate bleeding rate of only 4% to 6% per year. Using risk schemes such as ATRIA,5 HEMORR2HAGES,6 and HAS-BLED7 may be more useful because they provide an estimate of bleeding risk for each point on the scale.
Moreover, the current tools to predict bleeding risk have several other limitations. They were developed in patients already taking anticoagulants and so probably underestimate the actual risk of hemorrhage, as people who could not take anticoagulants were excluded, most likely because they were at high risk of bleeding. Therefore, bleeding risk tools probably apply best to a patient for whom anticoagulation can be considered.
Some clinical variables are necessarily broad. For example, “prior bleeding” is a risk factor included in several risk scores, but does not distinguish between massive variceal bleeding and minor hemorrhoidal bleeding.
Risk scores do not effectively predict intracranial hemorrhage.
Finally, these risk tools were developed in patients taking vitamin K antagonists, and it is not yet established that they can effectively predict hemorrhage related to other, newer anticoagulants.
WHEN DOES BLEEDING RISK OUTWEIGH ANTICOAGULATION BENEFIT?
For patients with atrial fibrillation, the net clinical benefit of anticoagulation (strokes prevented minus bleeding events induced) increases as the risk of stroke rises. Updated guidelines for managing atrial fibrillation now recommend anticoagulation for most patients.10
For most older patients with atrial fibrillation, the decision to anticoagulate may not change even if a bleeding risk tool indicates a high bleeding risk.11 For example, a patient with a history of ischemic stroke will generally derive more benefit than harm from anticoagulants. The primary exception is in patients with prior lobar intracranial hemorrhage, because of the high risk of rebleeding and the worse outcomes associated with intracranial hemorrhage.12 As a general rule, most patients with atrial fibrillation and an additional risk factor for stroke should be considered for anticoagulant therapy unless they have a history of lobar intracranial hemorrhage.
Anticoagulation may be deferred if the patient is at the lower end of the stroke risk spectrum and if the bleeding risk is calculated to be high. However, as noted before, current bleeding risk tools probably do not capture the experiences of patients at the extremes of high bleeding risk, so clinical judgment continues to be important. In addition, forgoing anticoagulation could be reasonable even in patients at high risk for recurrent stroke if their life expectancy is limited, if anticoagulation is unacceptably burdensome, or if it is not within their goals and preferences.
WHAT ABOUT FALL RISK?
Fall risk commonly deters clinicians from prescribing anticoagulants because of the fear of causing intracranial hemorrhage. In particular, falls increase the risk for subdural hematoma, which has a death rate comparable to that of ischemic stroke.13
Studies have had difficulty quantifying the exact risk associated with falls because these patients are less likely to be prescribed anticoagulants. One decision analysis estimated that a person would have to fall about 300 times per year before the risk of intracranial hemorrhage outweighed the benefits from stroke reduction.14 Studies have found that patients at high risk of falls have a higher risk of intracranial hemorrhage, but that this risk is counterbalanced by an even greater risk of ischemic stroke.15
Therefore, if the baseline risk of ischemic stroke is high, anticoagulation is still favored.
WHEN SHOULD I USE A BLEEDING RISK TOOL?
Despite their limitations, bleeding risk tools are useful in clinical practice when estimates of bleeding risk affect clinical behavior. They are most helpful for patients at the lower end of the stroke or thromboembolism risk spectrum, where the decision to anticoagulate is strongly influenced by bleeding risk. Risk tools may also be helpful when counseling patients about their bleeding risk off and on anticoagulants.
Finally, recognizing that a patient is at high bleeding risk may lead the clinician to consider closer monitoring of anticoagulants or to implement strategies to reduce the risk.
- Hart RG, Pearce LA, Aguilar MI. Meta-analysis: antithrombotic therapy to prevent stroke in patients who have nonvalvular atrial fibrillation. Ann Intern Med 2007; 146:857–867.
- Lopes LC, Spencer FA, Neumann I, et al. Bleeding risk in atrial fibrillation patients taking vitamin K antagonists: systematic review and meta-analysis. Clin Pharmacol Ther 2013; 94:367–375.
- Fang MC, Go AS, Chang Y, et al. Death and disability from warfarin-associated intracranial and extracranial hemorrhages. Am J Med 2007; 120:700–705.
- Lopes RD, Crowley MJ, Shah BR, et al. Stroke prevention in atrial fibrillation. Rockville (MD): Agency for Healthcare Research and Quality (US); 2013 Aug. Report No.: 13-EHC113-EF.
- Fang MC, Go AS, Chang Y, et al. A new risk scheme to predict warfarin-associated hemorrhage: the ATRIA (Anticoagulation and Risk Factors in Atrial Fibrillation) Study. J Am Coll Cardiol 2011; 58:395–401.
- Gage BF, Yan Y, Milligan PE, et al. Clinical classification schemes for predicting hemorrhage: results from the National Registry of Atrial Fibrillation (NRAF) Am Heart J 2006; 151:713–719.
- Pisters R, Lane DA, Nieuwlaat R, de Vos CB, Crijns HJ, Lip GY. A novel user-friendly score (HAS-BLED) to assess 1-year risk of major bleeding in patients with atrial fibrillation: the Euro Heart Survey. Chest 2010; 138:1093–1100.
- Beyth RJ, Quinn LM, Landefeld CS. Prospective evaluation of an index for predicting the risk of major bleeding in outpatients treated with warfarin. Am J Med 1998; 105:91–99.
- Nieto JA, Solano R, Iglesias NT, et al, for the RIETE Investigators. Validation of a score for predicting fatal bleeding in patients receiving anticoagulation for venous thromboembolism. Thrombosis Res 2013; 132:175–179.
- January CT, Wann LS, Alpert JS, et al; ACC/AHA Task Force Members. 2014 AHA/ACC/HRS guideline for the management of patients with atrial fibrillation: executive summary: a report of the American College of Cardiology/American Heart Association Task Force on practice guidelines and the Heart Rhythm Society. Circulation 2014; 130:2071–2104.
- Singer DE, Chang Y, Fang MC, et al. The net clinical benefit of warfarin anticoagulation in atrial fibrillation. Ann Intern Med 2009; 151:297–305.
- Eckman MH, Rosand J, Knudsen KA, Singer DE, Greenberg SM. Can patients be anticoagulated after intracerebral hemorrhage? A decision analysis. Stroke 2003; 34:1710–1716.
- Fang MC, Go AS, Chang Y, et al. Thirty-day mortality after ischemic stroke and intracranial hemorrhage in patients with atrial fibrillation on and off anticoagulants. Stroke 2012; 43:1795–1799.
- Man-Son-Hing M, Laupacis A. Anticoagulant-related bleeding in older persons with atrial fibrillation: physicians' fears often unfounded. Arch Intern Med 2003; 163:1580–1586.
- Gage BF, Birman-Deych E, Kerzner R, Radford MJ, Nilasena DS, Rich MW. Incidence of intracranial hemorrhage in patients with atrial fibrillation who are prone to fall. Am J Med 2005; 118:612–617.
Management and Outcomes After SVTE
Superficial thrombophlebitis (SVTE), inflammation of superficial veins associated with thrombosis, is a painful condition, and 3% to 11% of the population will develop SVTE during their lifetime. Although generally considered a benign, self‐limited disease, it can cause considerable discomfort, impact mobility, and lead to further complications. Recent and accumulating evidence suggests that it is often associated with more serious forms of venous thromboembolism (VTE), including deep vein thrombosis (DVT) and pulmonary embolism (PE),[1] and SVTE is a strong risk factor for subsequent DVT or PE.[2, 3]
There is no clear consensus on the optimal treatment of SVTE. Although antithrombotic medications such as fondaparinux may be more effective than placebo in reducing the risk of subsequent DVT,[4] the evidence is generally of low grade, and the costs and inconveniences of anticoagulant therapy are not inconsequential.[1, 5, 6] Surveys suggest that physician opinions on the appropriate management of SVTE vary significantly, and management includes nonsteroidal anti‐inflammatory drugs (NSAIDs), topical therapies, or watchful waiting.[7] The objective of our study was to describe the initial management of SVTE in a community‐based population and examine subsequent rates of diagnosed DVT or PE in the following year.
MATERIALS AND METHODS
This was a retrospective, observational study seeking to describe the initial treatment for patients diagnosed with isolated SVTE.
Cohort Assembly
Data for this study were obtained from the Cardiovascular Research Network Venous Thromboembolism cohort study. The source population was based in Kaiser Permanente Northern California (KPNC), a large, integrated healthcare delivery system currently providing comprehensive care for >3.84 million members, and comprised of all adults aged 21 years or older with continuous enrollment in the KPNC health plan for 1 year and with a primary or secondary International Classification of Diseases, 9th RevisionClinical Modification (ICD‐9‐CM) diagnosis code of venous thrombosis (415.1x, 451.1x, 451.2, 451.81, 453.4x, 453.5x, 451.83, 451.84, 451.89, 453.72, 453.73, 453.74, 453.75, 453.76, 453.77, 453.82, 453.83, 453.84, 453.85, 453.86, 453.87, 451, 451.9, 452, 453, 453.0, 453.1, 453.2, 453.3, 453.79, 453.8, 453.89, 453.9) between January 1, 2004 and December 31, 2010. Of the 31,967 individuals meeting these criteria, 930 patients were selected by a random number generator for manual chart abstraction and review. Trained physician reviewers reviewed available emergency department, admission and discharge notes, outpatient clinic notes, and relevant radiology reports to determine whether or not the encounter represented a DVT, a SVTE, or other event.
Episodes were considered isolated SVTE if there was no evidence of a DVT or PE, and if there was medical chart documentation of either a diagnosis of SVTE, ultrasound evidence of a superficial vein clot, or a clinical description of SVTE as determined by the reviewing physician. All SVTE episodes in the study underwent a confirmatory review by second physician reviewer to confirm the diagnosis of SVTE.
Predictors and Outcomes
The primary outcome was documentation in the medical chart of a treatment recommendation for an antithrombotic agent, specifically, antiplatelet agents (aspirin, clopidogrel, ticlopidine), NSAIDs, and anticoagulants (low‐molecular‐weight heparin, fondaparinux, or warfarin). The secondary outcome was a subsequent diagnosis of VTE, which we defined as a subsequent encounter with an ICD‐9‐CM code for DVT or PE within 12 months after the initial episode, accompanied by a prescription for an anticoagulant within 7 days.
Data on patient age, sex, self‐reported race/ethnicity, and treatment setting (inpatient, emergency department, or outpatient) were obtained from health plan databases. Clinical risk factors for SVTE and the clinical presentation and treatment were obtained from physician chart review. Assessed risk factors included clinical conditions that have been associated with mildly increased SVTE risk (history of tobacco smoking, high body mass index), strongly increased risk (surgery or hospitalization within 30 days, active malignancy, hormonal therapy/pregnant or postpartum), provoking events (local trauma, central or peripheral intravenous catheter placement), and medical conditions that raise the risk for DVT (such as prior history of thrombosis or ischemic stroke).[8, 9] Data were abstracted by a single author (B.T.S.) using a standardized abstraction form. The study was approved by the institutional review boards of the collaborating institutions and informed consent was waived due to the nature of the study.
Statistical Methods
Analyses were conducted using SAS statistical software version 9.3 (SAS Institute Inc., Cary, NC), with a 2‐sided P < 0.05 considered significant. We used 2 tests and Student t tests for categorical and continuous variables, respectively, to test the bivariate association of risk factors with receipt of antithrombotic therapy after SVTE. Multivariable models were not developed due to the limited sample size.
RESULTS
Out of 930 patients with a diagnosis code for venous thrombosis and who underwent chart review, we identified 329 individuals who were considered by reviewers to have isolated SVTE events. Most SVTEs were of the lower extremity (60.8%) and diagnosed in an outpatient or emergency department setting (91.8%). Risk factors for SVTE were common, including documented varicose veins, recent peripheral venous catheterization or injection, or antecedent hospitalization (Table 1).
| Clinical Characteristic | Value, n = 329 |
|---|---|
| Age, y, mean (standard deviation) | 59.4 (15.8) |
| Female, n (%) | 199 (60.5) |
| Race, n (%) | |
| White | 236 (71.7) |
| Black | 23 (7.0) |
| Asian/Pacific Islander | 22 (6.7) |
| Unknown | 48 (14.6) |
| Location of thrombophlebitis, n (%) | |
| Lower extremity | 200 (60.8) |
| Upper extremity | 108 (32.8) |
| Other/unknown | 21 (6.3) |
| Clinical risk factors, n (%) | |
| Varicose veins | 85 (25.8) |
| History of recent peripheral intravenous catheters | 71 (21.6) |
| History of recent local trauma | 22 (6.7) |
| History of thrombosis | 12 (3.7) |
| History of stroke | 7 (2.1) |
| Sepsis/acute infection | 18 (5.5) |
| Heart failure | 7 (2.1) |
| Chronic lung disease | 24 (7.3) |
| Malignant neoplasm | 29 (8.8) |
| Hospitalization or surgery within 30 days | 48 (14.6) |
| Hormone therapy | 12 (3.6) |
| Pregnant/postpartum | 3 (0.9) |
| Current smoker | 13 (4.0) |
| Body mass index available | 184 (55.9) |
| <25 | 48 (14.6) |
| >2530 | 64 (19.5) |
| >30 | 72 (21.9) |
Initial treatment strategies for the 329 patients are presented in Table 2. Few patients with SVTE received anticoagulants for initial treatment, although patients with lower extremity SVTE were more likely to receive antithrombotic therapy compared to patients with SVTE of other locations (P < 0.001). None of the identified risk factors for thrombosis were statistically significantly associated with a greater likelihood of receiving anticoagulants (P > 0.05 for all).
| VTE Risk* | Initial Management, % (No.) | Total | |||
|---|---|---|---|---|---|
| NSAIDs | LMWH | Warfarin | No Documented Antithrombotic Therapy | ||
| |||||
| Low | 52% (128) | 1% (3) | 2% (5) | 45% (112) | 248 |
| High | 25% (20) | 4% (3) | 4% (3) | 68% (55) | 81 |
| Total | 45% (148) | 2% (6) | 2% (8) | 51% (167) | 329 |
In the 12 months after SVTE, 19 (5.8%) patients had a diagnosis encounter for VTE associated with a prescription for either warfarin or parenteral anticoagulant. Of the 200 patients in our study with lower extremity SVTE, 15 (7.5%) had a subsequent VTE diagnosis associated with anticoagulation prescription in the following year.
DISCUSSION
Clinically significant VTE within a year after SVTE diagnosis was uncommon in our study despite infrequent use of antithrombotic therapy. Although recommendations for the initial treatment of SVTE have evolved in more recent years to support the use of fondaparinux in selected patients, there are significant costs and inconveniences associated with anticoagulation therapy and debate among physicians about the preferred treatment.[7] The low rate of anticoagulant use in our study may be related to the years studied (before guidelines supported fondaparinux), as well as being largely comprised of outpatients, and also because we included types of SVTE that are unlikely to progress to DVT, such as small vein phlebitis or upper extremity SVTE.[4, 10]
Limitations of our analysis include the heterogeneous types of SVTE included in our study and our reliance on available chart documentation to ascertain SVTE diagnosis, risk factors, and treatment. Because of the observational nature of our study, SVTE in the hospital setting may have been less well documented in medical records, leading to a sample of mostly outpatients. Hence, our observed subsequent VTE rate may not be generalizable to a more inclusive population. Finally, the low rate of anticoagulant treatment and VTE diagnoses limited our ability to conduct multivariable modeling.
In conclusion, clinically significant VTE within a year after SVTE was uncommon in our study despite infrequent use of antithrombotic therapy. Although our data are observational, they suggest that not all patients may require anticoagulation for the management of SVTE, and that further investigation into defining which populations would most benefit from treatment with fondaparinux or other agents is warranted.
Disclosures
This study was funded by the National Heart, Lung, and Blood Institute of the National Institutes of Health (grants R01HL103820 and U19HL91179). The sponsor was not involved in the design and conduct of the study; collection, management, analysis, and interpretation of the data; or preparation, review, or approval of the manuscript. Dr. Go received research grant funding from CSL Behring. None of the other authors have financial conflicts of interest.
- , , . Treatment for superficial thrombophlebitis of the leg. Cochrane Database Syst Rev. 2013;4:CD004982.
- , , , et al. Superficial venous thrombosis and venous thromboembolism: a large, prospective epidemiologic study. Ann Intern Med. 2010;152:218–224.
- , , , et al. Risk of venous and arterial thrombotic events in patients diagnosed with superficial vein thrombosis: a nationwide cohort study. Blood. 2015;125:229–235.
- , , , et al. Fondaparinux for the treatment of superficial‐vein thrombosis in the legs. N Engl J Med. 2010;363:1222–1232.
- , , , . Fondaparinux for isolated superficial vein thrombosis of the legs: a cost‐effectiveness analysis. Chest. 2012;141:321–329.
- , , , et al. Antithrombotic therapy for VTE disease: Antithrombotic Therapy and Prevention of Thrombosis, 9th ed: American College of Chest Physicians Evidence‐Based Clinical Practice Guidelines. Chest. 2012;141(2 suppl):e419S–e494S.
- , , , , . The disparate management of superficial venous thrombosis in primary and secondary care. Phlebology. 2015;30:172–179.
- , , , , , . The risk of venous thrombosis in individuals with a history of superficial vein thrombosis and acquired venous thrombotic risk factors. Blood. 2013;122:4264–4269.
- , , , et al. Risk factors for recurrent events in subjects with superficial vein thrombosis in the randomized clinical trial SteFlux (Superficial Thromboembolism Fluxum). Thromb Res. 2014;133:196–202.
- , , , et al. Superficial vein thrombosis and recurrent venous thromboembolism: a pooled analysis of two observational studies. J Thromb Haemost. 2012;10:1004–1011.
Superficial thrombophlebitis (SVTE), inflammation of superficial veins associated with thrombosis, is a painful condition, and 3% to 11% of the population will develop SVTE during their lifetime. Although generally considered a benign, self‐limited disease, it can cause considerable discomfort, impact mobility, and lead to further complications. Recent and accumulating evidence suggests that it is often associated with more serious forms of venous thromboembolism (VTE), including deep vein thrombosis (DVT) and pulmonary embolism (PE),[1] and SVTE is a strong risk factor for subsequent DVT or PE.[2, 3]
There is no clear consensus on the optimal treatment of SVTE. Although antithrombotic medications such as fondaparinux may be more effective than placebo in reducing the risk of subsequent DVT,[4] the evidence is generally of low grade, and the costs and inconveniences of anticoagulant therapy are not inconsequential.[1, 5, 6] Surveys suggest that physician opinions on the appropriate management of SVTE vary significantly, and management includes nonsteroidal anti‐inflammatory drugs (NSAIDs), topical therapies, or watchful waiting.[7] The objective of our study was to describe the initial management of SVTE in a community‐based population and examine subsequent rates of diagnosed DVT or PE in the following year.
MATERIALS AND METHODS
This was a retrospective, observational study seeking to describe the initial treatment for patients diagnosed with isolated SVTE.
Cohort Assembly
Data for this study were obtained from the Cardiovascular Research Network Venous Thromboembolism cohort study. The source population was based in Kaiser Permanente Northern California (KPNC), a large, integrated healthcare delivery system currently providing comprehensive care for >3.84 million members, and comprised of all adults aged 21 years or older with continuous enrollment in the KPNC health plan for 1 year and with a primary or secondary International Classification of Diseases, 9th RevisionClinical Modification (ICD‐9‐CM) diagnosis code of venous thrombosis (415.1x, 451.1x, 451.2, 451.81, 453.4x, 453.5x, 451.83, 451.84, 451.89, 453.72, 453.73, 453.74, 453.75, 453.76, 453.77, 453.82, 453.83, 453.84, 453.85, 453.86, 453.87, 451, 451.9, 452, 453, 453.0, 453.1, 453.2, 453.3, 453.79, 453.8, 453.89, 453.9) between January 1, 2004 and December 31, 2010. Of the 31,967 individuals meeting these criteria, 930 patients were selected by a random number generator for manual chart abstraction and review. Trained physician reviewers reviewed available emergency department, admission and discharge notes, outpatient clinic notes, and relevant radiology reports to determine whether or not the encounter represented a DVT, a SVTE, or other event.
Episodes were considered isolated SVTE if there was no evidence of a DVT or PE, and if there was medical chart documentation of either a diagnosis of SVTE, ultrasound evidence of a superficial vein clot, or a clinical description of SVTE as determined by the reviewing physician. All SVTE episodes in the study underwent a confirmatory review by second physician reviewer to confirm the diagnosis of SVTE.
Predictors and Outcomes
The primary outcome was documentation in the medical chart of a treatment recommendation for an antithrombotic agent, specifically, antiplatelet agents (aspirin, clopidogrel, ticlopidine), NSAIDs, and anticoagulants (low‐molecular‐weight heparin, fondaparinux, or warfarin). The secondary outcome was a subsequent diagnosis of VTE, which we defined as a subsequent encounter with an ICD‐9‐CM code for DVT or PE within 12 months after the initial episode, accompanied by a prescription for an anticoagulant within 7 days.
Data on patient age, sex, self‐reported race/ethnicity, and treatment setting (inpatient, emergency department, or outpatient) were obtained from health plan databases. Clinical risk factors for SVTE and the clinical presentation and treatment were obtained from physician chart review. Assessed risk factors included clinical conditions that have been associated with mildly increased SVTE risk (history of tobacco smoking, high body mass index), strongly increased risk (surgery or hospitalization within 30 days, active malignancy, hormonal therapy/pregnant or postpartum), provoking events (local trauma, central or peripheral intravenous catheter placement), and medical conditions that raise the risk for DVT (such as prior history of thrombosis or ischemic stroke).[8, 9] Data were abstracted by a single author (B.T.S.) using a standardized abstraction form. The study was approved by the institutional review boards of the collaborating institutions and informed consent was waived due to the nature of the study.
Statistical Methods
Analyses were conducted using SAS statistical software version 9.3 (SAS Institute Inc., Cary, NC), with a 2‐sided P < 0.05 considered significant. We used 2 tests and Student t tests for categorical and continuous variables, respectively, to test the bivariate association of risk factors with receipt of antithrombotic therapy after SVTE. Multivariable models were not developed due to the limited sample size.
RESULTS
Out of 930 patients with a diagnosis code for venous thrombosis and who underwent chart review, we identified 329 individuals who were considered by reviewers to have isolated SVTE events. Most SVTEs were of the lower extremity (60.8%) and diagnosed in an outpatient or emergency department setting (91.8%). Risk factors for SVTE were common, including documented varicose veins, recent peripheral venous catheterization or injection, or antecedent hospitalization (Table 1).
| Clinical Characteristic | Value, n = 329 |
|---|---|
| Age, y, mean (standard deviation) | 59.4 (15.8) |
| Female, n (%) | 199 (60.5) |
| Race, n (%) | |
| White | 236 (71.7) |
| Black | 23 (7.0) |
| Asian/Pacific Islander | 22 (6.7) |
| Unknown | 48 (14.6) |
| Location of thrombophlebitis, n (%) | |
| Lower extremity | 200 (60.8) |
| Upper extremity | 108 (32.8) |
| Other/unknown | 21 (6.3) |
| Clinical risk factors, n (%) | |
| Varicose veins | 85 (25.8) |
| History of recent peripheral intravenous catheters | 71 (21.6) |
| History of recent local trauma | 22 (6.7) |
| History of thrombosis | 12 (3.7) |
| History of stroke | 7 (2.1) |
| Sepsis/acute infection | 18 (5.5) |
| Heart failure | 7 (2.1) |
| Chronic lung disease | 24 (7.3) |
| Malignant neoplasm | 29 (8.8) |
| Hospitalization or surgery within 30 days | 48 (14.6) |
| Hormone therapy | 12 (3.6) |
| Pregnant/postpartum | 3 (0.9) |
| Current smoker | 13 (4.0) |
| Body mass index available | 184 (55.9) |
| <25 | 48 (14.6) |
| >2530 | 64 (19.5) |
| >30 | 72 (21.9) |
Initial treatment strategies for the 329 patients are presented in Table 2. Few patients with SVTE received anticoagulants for initial treatment, although patients with lower extremity SVTE were more likely to receive antithrombotic therapy compared to patients with SVTE of other locations (P < 0.001). None of the identified risk factors for thrombosis were statistically significantly associated with a greater likelihood of receiving anticoagulants (P > 0.05 for all).
| VTE Risk* | Initial Management, % (No.) | Total | |||
|---|---|---|---|---|---|
| NSAIDs | LMWH | Warfarin | No Documented Antithrombotic Therapy | ||
| |||||
| Low | 52% (128) | 1% (3) | 2% (5) | 45% (112) | 248 |
| High | 25% (20) | 4% (3) | 4% (3) | 68% (55) | 81 |
| Total | 45% (148) | 2% (6) | 2% (8) | 51% (167) | 329 |
In the 12 months after SVTE, 19 (5.8%) patients had a diagnosis encounter for VTE associated with a prescription for either warfarin or parenteral anticoagulant. Of the 200 patients in our study with lower extremity SVTE, 15 (7.5%) had a subsequent VTE diagnosis associated with anticoagulation prescription in the following year.
DISCUSSION
Clinically significant VTE within a year after SVTE diagnosis was uncommon in our study despite infrequent use of antithrombotic therapy. Although recommendations for the initial treatment of SVTE have evolved in more recent years to support the use of fondaparinux in selected patients, there are significant costs and inconveniences associated with anticoagulation therapy and debate among physicians about the preferred treatment.[7] The low rate of anticoagulant use in our study may be related to the years studied (before guidelines supported fondaparinux), as well as being largely comprised of outpatients, and also because we included types of SVTE that are unlikely to progress to DVT, such as small vein phlebitis or upper extremity SVTE.[4, 10]
Limitations of our analysis include the heterogeneous types of SVTE included in our study and our reliance on available chart documentation to ascertain SVTE diagnosis, risk factors, and treatment. Because of the observational nature of our study, SVTE in the hospital setting may have been less well documented in medical records, leading to a sample of mostly outpatients. Hence, our observed subsequent VTE rate may not be generalizable to a more inclusive population. Finally, the low rate of anticoagulant treatment and VTE diagnoses limited our ability to conduct multivariable modeling.
In conclusion, clinically significant VTE within a year after SVTE was uncommon in our study despite infrequent use of antithrombotic therapy. Although our data are observational, they suggest that not all patients may require anticoagulation for the management of SVTE, and that further investigation into defining which populations would most benefit from treatment with fondaparinux or other agents is warranted.
Disclosures
This study was funded by the National Heart, Lung, and Blood Institute of the National Institutes of Health (grants R01HL103820 and U19HL91179). The sponsor was not involved in the design and conduct of the study; collection, management, analysis, and interpretation of the data; or preparation, review, or approval of the manuscript. Dr. Go received research grant funding from CSL Behring. None of the other authors have financial conflicts of interest.
- , , . Treatment for superficial thrombophlebitis of the leg. Cochrane Database Syst Rev. 2013;4:CD004982.
- , , , et al. Superficial venous thrombosis and venous thromboembolism: a large, prospective epidemiologic study. Ann Intern Med. 2010;152:218–224.
- , , , et al. Risk of venous and arterial thrombotic events in patients diagnosed with superficial vein thrombosis: a nationwide cohort study. Blood. 2015;125:229–235.
- , , , et al. Fondaparinux for the treatment of superficial‐vein thrombosis in the legs. N Engl J Med. 2010;363:1222–1232.
- , , , . Fondaparinux for isolated superficial vein thrombosis of the legs: a cost‐effectiveness analysis. Chest. 2012;141:321–329.
- , , , et al. Antithrombotic therapy for VTE disease: Antithrombotic Therapy and Prevention of Thrombosis, 9th ed: American College of Chest Physicians Evidence‐Based Clinical Practice Guidelines. Chest. 2012;141(2 suppl):e419S–e494S.
- , , , , . The disparate management of superficial venous thrombosis in primary and secondary care. Phlebology. 2015;30:172–179.
- , , , , , . The risk of venous thrombosis in individuals with a history of superficial vein thrombosis and acquired venous thrombotic risk factors. Blood. 2013;122:4264–4269.
- , , , et al. Risk factors for recurrent events in subjects with superficial vein thrombosis in the randomized clinical trial SteFlux (Superficial Thromboembolism Fluxum). Thromb Res. 2014;133:196–202.
- , , , et al. Superficial vein thrombosis and recurrent venous thromboembolism: a pooled analysis of two observational studies. J Thromb Haemost. 2012;10:1004–1011.
Care as a Continuum
Patients who are hospitalized for an acute event often have a range of prior outpatient experiences within the healthcare system, both before and after a hospitalization. In particular, continuity with a primary care provider can influence health outcomes.[1] In this issue of the Journal of Hospital Medicine, Boonyasai et al. found several characteristics of primary care physicians that were associated with whether their hospitalized patients were cared for by hospitalists.[2] Using Medicare claims data from the state of Texas during years 2001 to 2009, the authors calculated the percent of primary care physicians' hospitalized patients who were cared for by hospitalists. Hospitalist use increased overall during the time period, but primary care physicians differed in the rate and extent of hospitalist use. A minority of physicians were early adopters, with the majority of their hospitalized patients cared for by hospitalists during the entire time period. A sizeable group of primary care physicians mostly avoided using hospitalists. Moreover, there was a significant cluster of primary care physicians who, at some point during the study period, rapidly began using hospitalists within a relatively short time.
Several physician characteristics were associated with a greater adoption of the hospitalist model, including being female, in a family practice specialty, or in a rural practice setting. What this study lacks is the ability to explain why some physicians used hospitalists and others did not. It is probable that adoption (or not) of hospitalists is less an individual physician decision and instead reflects a choice of their clinical practice group. If an outpatient practice group or provider can influence whether or not their patients are cared for by hospitalists, it is also conceivable that they can affect hospital‐based outcomes as well. This finding reinforces the importance of examining the care and outcomes of patient care across the continuum of care, rather than focusing on the inpatient or outpatient setting.
As a result of the Affordable Care Act and rising healthcare costs, provider groups are beginning to form accountable care organizations (ACOs). An ACO is partnership between payers and providers to care for a population of patients across the continuum of care. In these arrangements, the providers often take on financial risk for the total cost of care for a population as well as for providing high‐quality care as monitored by specific metrics.[3] The population of patients for which ACOs take risks often include predominantly patients who receive primary care from the group.[4] For overall cost management, given that acute hospitalizations are disproportionately high cost, a primary focus of a majority of ACOs is to reduce unnecessary hospital days. Overall, ACOs that have been successful in the short term in managing costs have done so primarily by reducing overall hospital days.[5] ACOs have started to do so by creating intensive outpatient care management programs for high‐risk patients, by focusing on transitions of care to help decrease readmissions, by working with primary care clinics to transform into patient‐centered medical homes, where same‐day access to care is a priority, and developing other disease‐management tools to keep patients healthy.
To manage hospital utilization, many ACOs have developed plans to transform primary care and shift hospital care to outpatient care through enhanced outpatient case management for complex cases. As the way primary care is delivered changes, it will be very important to understand how this will modify the utilization and impact of hospitalist care on patients. The hope is that these modifications will work synergistically with hospitalist programs.
As the lines between outpatient and inpatient care become increasingly blurred, it may not be fair to attribute hospitalization outcome measures to hospitalists alone, particularly as ACOs are likely to move only the sickest or most difficult to manage patients to the inpatient setting. This may affect hospital‐based quality metrics such as readmissions and mortality. Seamless communication and transfer of information between outpatient and inpatient care will be vital to the success of ACOs.[6] In addition to improved communication, however, some systems may look to hospitalists to staff postdischarge clinics or act as extensivists or ambulatory intensivists to help manage the sickest in the population.[7]
Boonyasi et al. show that primary care physician characteristics as associated with whether or not patients' receive care from hospitalists.[2] As such, it reinforces the concept that providers in part of the continuum of care are integrally tied to care received by patients in different treatment settings. As our healthcare system rapidly transforms over the next few years, it will become more important to understand how outpatient and inpatient providers influence one another's care patterns and how these relationships influence care and cost‐related outcomes for patients.
ACKNOWLEDGMENTS
Disclosure: Nothing to report.
- , . Does continuity of care improve patient outcomes? J Fam Pract. 2004;53(12):974–980.
- et al. Characteristics of primary care providers who adopted the hospitalist model 2001–2009. J Hosp Med.
- . Understanding the new vocabulary of healthcare reform. J Hosp Med. 2010;5:197–199.
- Centers for Medicare 8:472–477.
- Agency for Healthcare Research and Quality. Medical “extensivists” care for high‐acuity patients across settings, leading to reduced hospital use. AHRQ Service Delivery Innovation Profile. Available at: https://innovations.ahrq.gov/profiles/medical‐extensivists‐care‐high‐acuity‐patients‐across‐settings‐leading‐reduced‐hospital‐use. Accessed December 17, 2014.
Patients who are hospitalized for an acute event often have a range of prior outpatient experiences within the healthcare system, both before and after a hospitalization. In particular, continuity with a primary care provider can influence health outcomes.[1] In this issue of the Journal of Hospital Medicine, Boonyasai et al. found several characteristics of primary care physicians that were associated with whether their hospitalized patients were cared for by hospitalists.[2] Using Medicare claims data from the state of Texas during years 2001 to 2009, the authors calculated the percent of primary care physicians' hospitalized patients who were cared for by hospitalists. Hospitalist use increased overall during the time period, but primary care physicians differed in the rate and extent of hospitalist use. A minority of physicians were early adopters, with the majority of their hospitalized patients cared for by hospitalists during the entire time period. A sizeable group of primary care physicians mostly avoided using hospitalists. Moreover, there was a significant cluster of primary care physicians who, at some point during the study period, rapidly began using hospitalists within a relatively short time.
Several physician characteristics were associated with a greater adoption of the hospitalist model, including being female, in a family practice specialty, or in a rural practice setting. What this study lacks is the ability to explain why some physicians used hospitalists and others did not. It is probable that adoption (or not) of hospitalists is less an individual physician decision and instead reflects a choice of their clinical practice group. If an outpatient practice group or provider can influence whether or not their patients are cared for by hospitalists, it is also conceivable that they can affect hospital‐based outcomes as well. This finding reinforces the importance of examining the care and outcomes of patient care across the continuum of care, rather than focusing on the inpatient or outpatient setting.
As a result of the Affordable Care Act and rising healthcare costs, provider groups are beginning to form accountable care organizations (ACOs). An ACO is partnership between payers and providers to care for a population of patients across the continuum of care. In these arrangements, the providers often take on financial risk for the total cost of care for a population as well as for providing high‐quality care as monitored by specific metrics.[3] The population of patients for which ACOs take risks often include predominantly patients who receive primary care from the group.[4] For overall cost management, given that acute hospitalizations are disproportionately high cost, a primary focus of a majority of ACOs is to reduce unnecessary hospital days. Overall, ACOs that have been successful in the short term in managing costs have done so primarily by reducing overall hospital days.[5] ACOs have started to do so by creating intensive outpatient care management programs for high‐risk patients, by focusing on transitions of care to help decrease readmissions, by working with primary care clinics to transform into patient‐centered medical homes, where same‐day access to care is a priority, and developing other disease‐management tools to keep patients healthy.
To manage hospital utilization, many ACOs have developed plans to transform primary care and shift hospital care to outpatient care through enhanced outpatient case management for complex cases. As the way primary care is delivered changes, it will be very important to understand how this will modify the utilization and impact of hospitalist care on patients. The hope is that these modifications will work synergistically with hospitalist programs.
As the lines between outpatient and inpatient care become increasingly blurred, it may not be fair to attribute hospitalization outcome measures to hospitalists alone, particularly as ACOs are likely to move only the sickest or most difficult to manage patients to the inpatient setting. This may affect hospital‐based quality metrics such as readmissions and mortality. Seamless communication and transfer of information between outpatient and inpatient care will be vital to the success of ACOs.[6] In addition to improved communication, however, some systems may look to hospitalists to staff postdischarge clinics or act as extensivists or ambulatory intensivists to help manage the sickest in the population.[7]
Boonyasi et al. show that primary care physician characteristics as associated with whether or not patients' receive care from hospitalists.[2] As such, it reinforces the concept that providers in part of the continuum of care are integrally tied to care received by patients in different treatment settings. As our healthcare system rapidly transforms over the next few years, it will become more important to understand how outpatient and inpatient providers influence one another's care patterns and how these relationships influence care and cost‐related outcomes for patients.
ACKNOWLEDGMENTS
Disclosure: Nothing to report.
- , . Does continuity of care improve patient outcomes? J Fam Pract. 2004;53(12):974–980.
- et al. Characteristics of primary care providers who adopted the hospitalist model 2001–2009. J Hosp Med.
- . Understanding the new vocabulary of healthcare reform. J Hosp Med. 2010;5:197–199.
- Centers for Medicare 8:472–477.
- Agency for Healthcare Research and Quality. Medical “extensivists” care for high‐acuity patients across settings, leading to reduced hospital use. AHRQ Service Delivery Innovation Profile. Available at: https://innovations.ahrq.gov/profiles/medical‐extensivists‐care‐high‐acuity‐patients‐across‐settings‐leading‐reduced‐hospital‐use. Accessed December 17, 2014.