User login
Accuracy of GoogleTranslate™
The population of patients in the US with limited English proficiency (LEP)those who speak English less than very well1is substantial and continues to grow.1, 2 Patients with LEP are at risk for lower quality health care overall than their English‐speaking counterparts.38 Professional in‐person interpreters greatly improve spoken communication and quality of care for these patients,4, 9 but their assistance is typically based on the clinical encounter. Particularly if interpreting by phone, interpreters are unlikely to be able to help with materials such as discharge instructions or information sheets meant for family members. Professional written translations of patient educational material help to bridge this gap, allowing clinicians to convey detailed written instructions to patients. However, professional translations must be prepared well in advance of any encounter and can only be used for easily anticipated problems.
The need to translate less common, patient‐specific instructions arises spontaneously in clinical practice, and formally prepared written translations are not useful in these situations. Online translation tools such as GoogleTranslate (available at
We conducted a pilot evaluation of an online translation tool as it relates to detailed, complex patient educational material. Our primary goal was to compare the accuracy of a Spanish translation generated by the online tool to that done by a professional agency. Our secondary goals were: 1) to assess whether sentence word length or complexity mediated the accuracy of GT; and 2) to lay the foundation for a more comprehensive study of the accuracy of online translation tools, with respect to patient educational material.
Methods
Translation Tool and Language Choice
We selected Google Translate (GT) since it is one of the more commonly used online translation tools and because Google is the most widely used search engine in the United States.13 GT uses statistical translation methodology to convert text, documents, and websites between languages; statistical translation involves the following three steps. First, the translation program recognizes a sentence to translate. Second, it compares the words and phrases within that sentence to the billions of words in its library (drawn from bilingual professionally translated documents, such as United Nations proceedings). Third, it uses this comparison to generate a translation combining the words and phrases deemed most equivalent between the source sentence and the target language. If there are multiple sentences, the program recognizes and translates each independently. As the body of bilingual work grows, the program learns and refines its rules automatically.14 In contrast, in rule‐based translation, a program would use manually prespecified rules regarding word choice and grammar to generate a translation.15 We assessed GT's accuracy translating from English to Spanish because Spanish is the predominant non‐English language spoken in the US.1
Document Selection and Preparation
We selected the instruction manual regarding warfarin use prepared by the Agency for Healthcare Research and Quality (AHRQ) for this accuracy evaluation. We selected this manual,16 written at a 6th grade reading level, because a professional Spanish translation was available (completed by ASET International Service, LLC, before and independently of this study), and because patient educational material regarding warfarin has been associated with fewer bleeding events.17 We downloaded the English document on October 19, 2009 and used the GT website to translate it en bloc. We then copied the resulting Spanish output into a text file. The English document and the professional Spanish translation (downloaded the same day) were both converted into text files in the same manner.
Grading Methodology
We scored the translation chosen using both manual and automated evaluation techniques. These techniques are widely used in the machine translation literature and are explained below.
Manual Evaluation: Evaluators, Domains, Scoring
We recruited three nonclinician, bilingual, nativeSpanish‐speaking research assistants as evaluators. The evaluators were all college educated with a Bachelor's degree or higher and were of Mexican, Nicaraguan, and Guatemalan ancestry. Each evaluator received a brief orientation regarding the project, as well as an explanation of the scores, and then proceeded to the blinded evaluation independently.
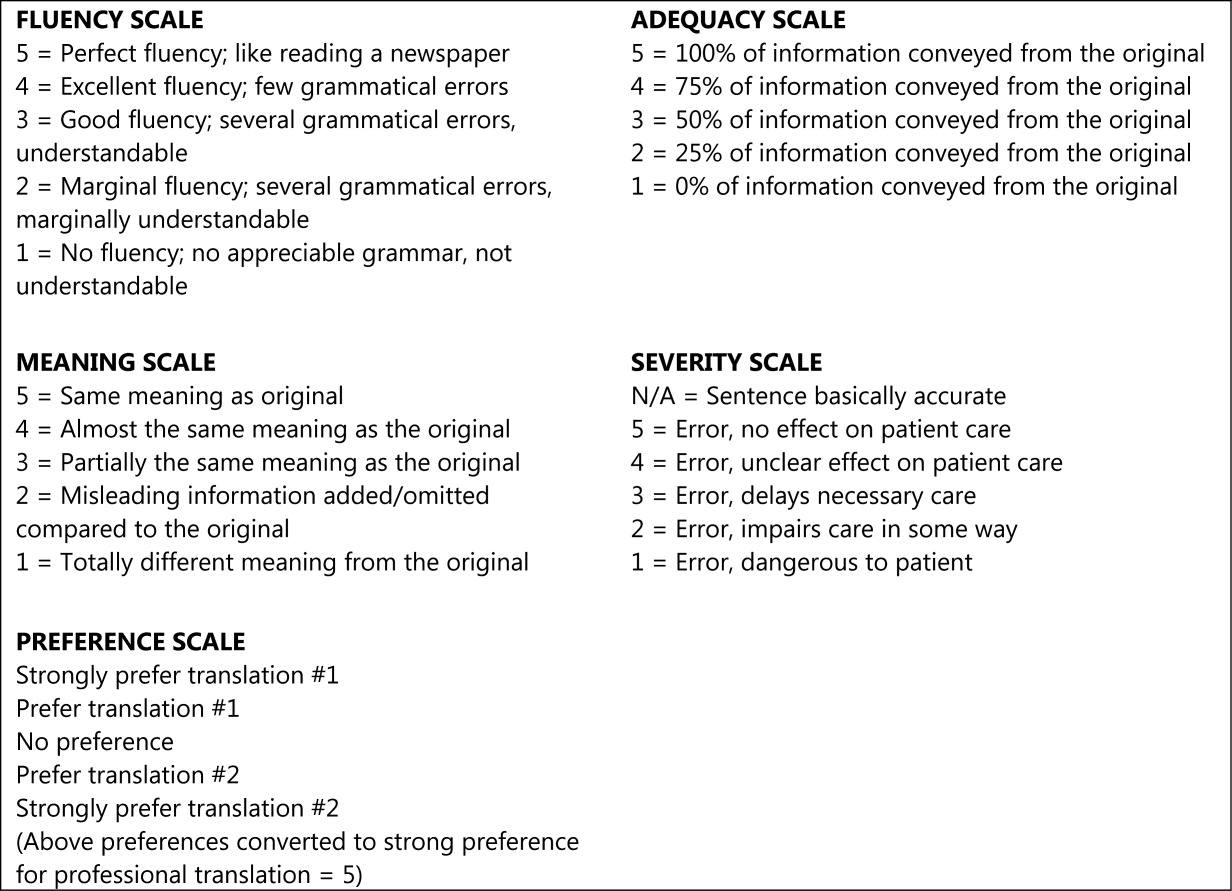
We asked evaluators to score sentences on Likert scales along five primary domains: fluency, adequacy, meaning, severity, and preference. Fluency and adequacy are well accepted components of machine translation evaluation,18 with fluency being an assessment of grammar and readability ranging from 5 (Perfect fluency; like reading a newspaper) to 1 (No fluency; no appreciable grammar, not understandable) and adequacy being an assessment of information preservation ranging from 5 (100% of information conveyed from the original) to 1 (0% of information conveyed from the original). Given that a sentence can be highly adequate but drastically change the connotation and intent of the sentence (eg, a sentence that contains 75% of the correct words but changes a sentence from take this medication twice a day to take this medication once every two days), we asked evaluators to assess meaning, a measure of connotation and intent maintenance, with scores ranging from 5 (Same meaning as original) to 1 (Totally different meaning from the original).19 Evaluators also assessed severity, a new measure of potential harm if a given sentence was assessed as having errors of any kind, ranging from 5 (Error, no effect on patient care) to 1 (Error, dangerous to patient) with an additional option of N/A (Sentence basically accurate). Finally, evaluators rated a blinded preference (also a new measure) for either of two translated sentences, ranging from Strongly prefer translation #1 to Strongly prefer translation #2. The order of the sentences was random (eg, sometimes the professional translation was first and sometimes the GT translation was). We subsequently converted this to preference for the professional translation, ranging from 5 (Strongly prefer the professional translation) to 1 (Strongly prefer the GT translation) in order to standardize the responses (Figures 1 and 2).


The overall flow of the study is given in Figure 3. Each evaluator initially scored 20 sentences translated by GT and 10 sentences translated professionally along the first four domains. All 30 of these sentences were randomly selected from the original, 263‐sentence pamphlet. For fluency, evaluators had access only to the translated sentence to be scored; for adequacy, meaning, and severity, they had access to both the translated sentence and the original English sentence. Ten of the 30 sentences were further selected randomly for scoring on the preference domain. For these 10 sentences, evaluators compared the GT and professional translations of the same sentence (with the original English sentence available as a reference) and indicated a preference, for any reason, for one translation or the other. Evaluators were blinded to the technique of translation (GT or professional) for all scored sentences and domains. We chose twice as many sentences from the GT preparations for the first four domains to maximize measurements for the translation technology we were evaluating, with the smaller number of professional translations serving as controls.
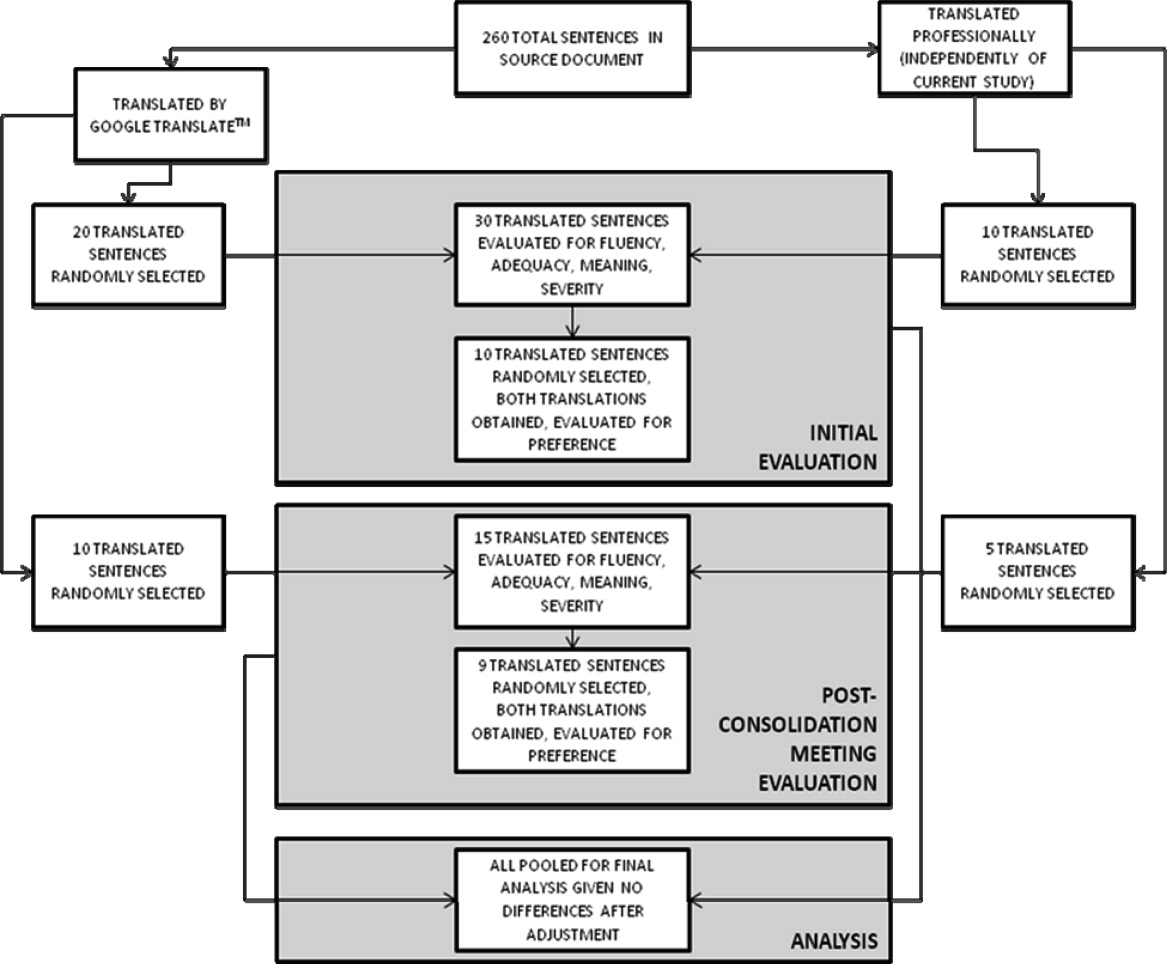
After scoring the first 30 sentences, evaluators met with one of the authors (R.R.K.) to discuss and consolidate their approach to scoring. They then scored an additional 10 GT‐translated sentences and 5 professionally translated sentences for the first four domains, and 9 of these 15 sentences for preference, to see if the meeting changed their scoring approach. These sentences were selected randomly from the original, 263‐sentence pamphlet, excluding the 30 evaluated in the previous step.
Automated Machine Translation Evaluation
Machine translation researchers have developed automated measures allowing the rapid and inexpensive scoring and rescoring of translations. These automated measures supplement more time‐ and resource‐intensive manual evaluations. The automated measures are based upon how well the translation compares to one or, ideally, multiple professionally prepared reference translations. They correlate well with human judgments on the domains above, especially when multiple reference translations are used (increasing the number of reference translations increases the variability allowed for words and phrases in the machine translation, improving the likelihood that differences in score are related to differences in quality rather than differences in translator preference).20 For this study, we used Metric for Evaluation of Translation with Explicit Ordering (METEOR), a machine translation evaluation system that allows additional flexibility for the machine translation in terms of grading individual sentences and being sensitive to synonyms, word stemming, and word order.21 We obtained a METEOR score for each of the GT‐translated sentences using the professional translation as our reference, and assessed correlation between this automated measure and the manual evaluations for the GT sentences, with the aim of assessing the feasibility of using METEOR in future work on patient educational material translation.
Outcomes and Statistical Analysis
We compared the scores assigned to GT‐translated sentences for each of the five manually scored domains as compared to the scores of the professionally translated sentences, as well as the impact of word count and sentence complexity on the scores achieved specifically by the GT‐translated sentences, using clustered linear regression to account for the fact that each of the 45 sentences were scored by each of the three evaluators. Sentences were classified as simple if they contained one or fewer clauses and complex if they contained more than one clause.22 We also assessed interrater reliability for the manual scoring system using intraclass correlation coefficients and repeatability. Repeatability is an estimate of the maximum difference, with 95% confidence, between scores assigned to the same sentence on the same domain by two different evaluators;23 lower scores indicate greater agreement between evaluators. Since we did not have clinical data or a gold standard, we used repeatability to estimate the value above which a difference between two scores might be clinically significant and not simply due to interrater variability.24 Finally, we assessed the correlation of the manual scores with those calculated by the METEOR automated evaluation tool using Pearson correlation coefficients. All analyses were conducted using Stata 11 (College Station, TX).
Results
Sentence Description
A total of 45 sentences were evaluated by the bilingual research assistants. The initial 30 sentences and the subsequent, post‐consolidation meeting 15 sentences were scored similarly in all outcomes, after adjustment for word length and complexity, so we pooled all 45 sentences (as well as the 19 total sentence pairs scored for preference) for the final analysis. Average sentence lengths were 14.2 words, 15.5 words, and 16.6 words for the English source text, professionally translated sentences, and GT‐translated sentences, respectively. Thirty‐three percent of the English source sentences were simple and 67% were complex.
Manual Evaluation Scores
Sentences translated by GT received worse scores on fluency as compared to the professional translations (3.4 vs 4.7, P < 0.0001). Comparisons for adequacy and meaning were not statistically significantly different. GT‐translated sentences contained more errors of any severity as compared to the professional translations (39% vs 22%, P = 0.05), but a similar number of serious, clinically impactful errors (severity scores of 3, 2, or 1; 4% vs 2%, P = 0.61). However, one GT‐translated sentence was considered erroneous with a severity level of 1 (Error, dangerous to patient). This particular sentence was 25 words long and complex in structure in the original English document; all three evaluators considered the GT translation nonsensical (La hemorragia mayor, llame a su mdico, o ir a la emergencia de un hospital habitacin si usted tiene cualquiera de los siguientes: Red N, oscuro, caf o cola de orina de color.) Evaluators had no overall preference for the professional translation (3.2, 95% confidence interval = 2.7 to 3.7, with 3 indicating no preference; P = 0.36) (Table 1).
| GoogleTranslate Translation | Professional Translation | P Value | |
|---|---|---|---|
| |||
| Fluency* | 3.4 | 4.7 | <0.0001 |
| Adequacy* | 4.5 | 4.8 | 0.19 |
| Meaning* | 4.2 | 4.5 | 0.29 |
| Severity | |||
| Any error | 39% | 22% | 0.05 |
| Serious error | 4% | 2% | 0.61 |
| Preference* | 3.2 | 0.36 | |
Mediation of Scores by Sentence Length or Complexity
We found that sentence length was not associated with scores for fluency, adequacy, meaning, severity, or preference (P > 0.30 in each case). Complexity, however, was significantly associated with preference: evaluators' preferred the professional translation for complex English sentences while being more ambivalent about simple English sentences (3.6 vs 2.6, P = 0.03).
Interrater Reliability and Repeatability
We assessed the interrater reliability for each domain using intraclass correlation coefficients and repeatability. For fluency, the intraclass correlation was best at 0.70; for adequacy, it was 0.58; for meaning, 0.42; for severity, 0.48; and for preference, 0.37. The repeatability scores were 1.4 for fluency, 0.6 for adequacy, 2.2 for meaning, 1.2 for severity, and 3.8 for preference, indicating that two evaluators might give a sentence almost the same score (at most, 1 point apart from one another) for adequacy, but might have opposite preferences regarding which translation of a sentence was superior.
Correlation with METEOR
Correlation between the first four domains and the METEOR scores were less than in prior studies.21 Fluency correlated best with METEOR at 0.53; adequacy correlated least with METEOR at 0.29. The remaining scores were in‐between. All correlations were statistically significant at P < 0.01 (Table 2).
| Correlation with METEOR | P value | |
|---|---|---|
| ||
| Fluency | 0.53 | <0.0001 |
| Adequacy | 0.29 | 0.006 |
| Meaning | 0.33 | 0.002 |
| Severity | 0.39 | 0.002 |
Discussion
In this preliminary study comparing the accuracy of GT to professional translation for patient educational material, we found that GT was inferior to the professional translation in grammatical fluency but generally preserved the content and sense of the original text. Out of 30 GT sentences assessed, there was one substantially erroneous translation that was considered potentially dangerous. Evaluators preferred the professionally translated sentences for complex sentences, but when the English source sentence was simplecontaining a single clausethis preference disappeared.
Like Sharif and Tse,12 we found that for information not arranged in sentences, automated translation sometimes produced nonsensical sentences. In our study, these resulted from an English sentence fragment followed by a bulleted list; in their study, the nonsensical translations resulted from pharmacy labels. The difference in frequency of these errors between our studies may have resulted partly from the translation tool evaluated (GT vs programs used by pharmacies in the Bronx), but may have also been due to our use of machine translation for complete sentencesthe purpose for which it is optimally designed. The hypothesis that machine translations of clinical information are most understandable when used for simple, complete sentences concurs with the methodology used by these tools and requires further study.
GT has the potential to be very useful to clinicians, particularly for those instances when the communication required is both spontaneous and routine or noncritical. For example, in the inpatient setting, patients could communicate diet and other nonclinical requests, as well as ask or answer simple, short questions when the interpreter is not available. In such situations, the low cost and ease of using online translations and machine translation more generally may help to circumvent the tendency of clinicians to get by with inadequate language skills or to avoid communication altogether.25 If used wisely, GT and other online tools could supplement the use of standardized translations and professional interpreters in helping clinicians to overcome language barriers and linguistic inertia, though this will require further assessment.
Ours is a pilot study, and while it suggests a more promising way to use online translation tools, significant further evaluation is required regarding accuracy and applicability prior to widespread use of any machine translation tools for patient care. The document we utilized for evaluation was a professionally translated patient educational brochure provided to individuals starting a complex medication. As online translation tools would most likely not be used in this setting, but rather for spontaneous and less critical patient‐specific instructions, further testing of GT as applied to such scenarios should be considered. Second, we only evaluated GT for English translated into Spanish; its usefulness in other languages will need to be evaluated. It also remains to be seen how easily GT translations will be understood by patients, who may have variable medical understanding and educational attainment as compared to our evaluators. Finally, in this evaluation, we only assessed automated written translation, not automated spoken translation services such as those now available on cellular phones and other mobile devices.11 The latter are based upon translation software with an additional speech recognition interface. These applications may prove to be even more useful than online translation, but the speech recognition component will add an additional layer of potential error and these applications will need to be evaluated on their own merits.
The domains chosen for this study had only moderate interrater reliability as assessed by intraclass correlation and repeatability, with meaning and preference scoring particularly poorly. The latter domains in particular will require more thorough assessment before routine use in online translation assessment. The variability in all domains may have resulted partly from the choice of nonclinicians of different ancestral backgrounds as evaluators. However, this variability is likely better representative of the wide range of patient backgrounds. Because our evaluators were not professional translators, we asked a professional interpreter to grade all sentences to assess the quality of their evaluation. While the interpreter noted slightly fewer errors among the professionally translated sentences (13% vs 22%) and slightly more errors among the GT‐translated sentences (50% vs 39%), and preferred the professional translation slightly more (3.8 vs 3.2), his scores for all of the other measures were almost identical, increasing our confidence in our primary findings (Appendix A). Additionally, since statistical translation is conducted sentence by sentence, in our study evaluators only scored translations at the sentence level. The accuracy of GT for whole paragraphs or entire documents will need to be assessed separately. The correlation between METEOR and the manual evaluation scores was less than in prior studies; while inexpensive to assess, METEOR will have to be recalibrated in optimal circumstanceswith several reference translations available rather than just onebefore it can be used to supplement the assessment of new languages, new materials, other translation technologies, and improvements in a given technology over time for patient educational material.
In summary, GT scored worse in grammar but similarly in content and sense to the professional translation, committing one critical error in translating a complex, fragmented sentence as nonsense. We believe that, with further study and judicious use, GT has the potential to substantially improve clinicians' communication with patients with limited English proficiency in the area of brief spontaneous patient‐specific information, supplementing well the role that professional spoken interpretation and standardized written translations already play.
- ,.Language use and English‐speaking ability: 2000. In:Census 2000 Brief.Washington, DC:US Census Bureau;2003. p. 2. http://www.census.gov/prod/2003pubs/c2kbr‐29.pdf.
- ,,,,.The need for more research on language barriers in health care: a proposed research agenda.Milbank Q.2006;84(1):111–133.
- ,,,.Language proficiency and adverse events in US hospitals: a pilot study.Int J Qual Health Care.2007;19(2):60–67.
- .The impact of medical interpreter services on the quality of health care: a systematic review.Med Care Res Rev.2005;62(3):255–299.
- ,,, et al.Errors in medical interpretation and their potential clinical consequences in pediatric encounters.Pediatrics.2003;111(1):6–14.
- ,,, et al.The effect of English language proficiency on length of stay and in‐hospital mortality.J Gen Intern Med.2004;19(3):221–228.
- ,,,.Influence of language barriers on outcomes of hospital care for general medicine inpatients.J Hosp Med.2010;5(5):276–282.
- ,.Hospitals, language, and culture: a snapshot of the nation. In:Los Angeles, CA:The California Endowment, the Joint Commission;2007. p.51–52. http://www.jointcommission.org/assets/1/6/hlc_paper.pdf.
- ,,,.Do professional interpreters improve clinical care for patients with limited English proficiency? A systematic review of the literature.Health Serv Res.2007;42(2):727–754.
- .Google's Computing Power Refines Translation Tool.New York Times; March 9,2010. Accessed March 24, 2010. http://www.nytimes.com/2010/03/09/technology/09translate.html?_r=1.
- , Translator. New York Times; March 20,2010. Accessed March 24, 2010. http://www.nytimes.com/2010/03/21/opinion/21bellos.html.
- ,.Accuracy of computer‐generated, Spanish‐language medicine labels.Pediatrics.2010;125(5):960–965.
- .Nielsen NetRatings Search Engine Ratings.SearchEngineWatch; August 22,2006. Accessed March 24, 2010. http://searchenginewatch.com/2156451.
- Google.Google Translate Help;2010. Accessed March 24, 2010. http://translate.google.com/support/?hl=en.
- ,.Chapter 4: Basic strategies. In:An Introduction to Machine Translation;1992. Accessed April 22, 2010. http://www.hutchinsweb.me.uk/IntroMT‐4.pdf
- .Your Guide to Coumadin®/Warfarin Therapy.Agency for Healthcare Research and Quality; August 21,2008. Accessed October 19, 2009. http://www.ahrq.gov/consumer/btpills.htm.
- ,,, et al.Patient reported receipt of medication instructions for warfarin is associated with reduced risk of serious bleeding events.J Gen Intern Med.2008;23(10):1589–1594.
- ,,.The ARPA MT evaluation methodologies: evolution, lessons, and future approaches. In: Proceedings of AMTA, 1994, Columbia, MD; October1994.
- ,.Overview of the IWSLT 2005 evaluation campaign. In: Proceedings of IWSLT 2005, Pittsburgh, PA; October2005.
- ,,,.BLEU: a method for automatic evaluation of machine translation. In: ACL‐2002: 40th Annual Meeting of the Association for Computational Linguistics.2002:311–318.
- ,.METEOR: an automatic metric for MT evaluation with high levels of correlation with human judgments. In: Proceedings of the Second Workshop on Statistical Machine Translation at ACL, Prague, Czech Republic; June2007.
- .The Structure of a Sentence.Ottawa:The Writing Centre, University of Ottawa;2007.
- ,.Statistical methods for assessing agreement between two methods of clinical measurement.Lancet.1986;1(8476):307–310.
- .Measurement, reproducibility, and validity. In:Epidemiologic Methods 203.San Francisco:Department of Biostatistics and Epidemiology, University of California;2009.
- ,,,,.Getting by: underuse of interpreters by resident physicians.J Gen Intern Med.2009;24(2):256–262.
The population of patients in the US with limited English proficiency (LEP)those who speak English less than very well1is substantial and continues to grow.1, 2 Patients with LEP are at risk for lower quality health care overall than their English‐speaking counterparts.38 Professional in‐person interpreters greatly improve spoken communication and quality of care for these patients,4, 9 but their assistance is typically based on the clinical encounter. Particularly if interpreting by phone, interpreters are unlikely to be able to help with materials such as discharge instructions or information sheets meant for family members. Professional written translations of patient educational material help to bridge this gap, allowing clinicians to convey detailed written instructions to patients. However, professional translations must be prepared well in advance of any encounter and can only be used for easily anticipated problems.
The need to translate less common, patient‐specific instructions arises spontaneously in clinical practice, and formally prepared written translations are not useful in these situations. Online translation tools such as GoogleTranslate (available at
We conducted a pilot evaluation of an online translation tool as it relates to detailed, complex patient educational material. Our primary goal was to compare the accuracy of a Spanish translation generated by the online tool to that done by a professional agency. Our secondary goals were: 1) to assess whether sentence word length or complexity mediated the accuracy of GT; and 2) to lay the foundation for a more comprehensive study of the accuracy of online translation tools, with respect to patient educational material.
Methods
Translation Tool and Language Choice
We selected Google Translate (GT) since it is one of the more commonly used online translation tools and because Google is the most widely used search engine in the United States.13 GT uses statistical translation methodology to convert text, documents, and websites between languages; statistical translation involves the following three steps. First, the translation program recognizes a sentence to translate. Second, it compares the words and phrases within that sentence to the billions of words in its library (drawn from bilingual professionally translated documents, such as United Nations proceedings). Third, it uses this comparison to generate a translation combining the words and phrases deemed most equivalent between the source sentence and the target language. If there are multiple sentences, the program recognizes and translates each independently. As the body of bilingual work grows, the program learns and refines its rules automatically.14 In contrast, in rule‐based translation, a program would use manually prespecified rules regarding word choice and grammar to generate a translation.15 We assessed GT's accuracy translating from English to Spanish because Spanish is the predominant non‐English language spoken in the US.1
Document Selection and Preparation
We selected the instruction manual regarding warfarin use prepared by the Agency for Healthcare Research and Quality (AHRQ) for this accuracy evaluation. We selected this manual,16 written at a 6th grade reading level, because a professional Spanish translation was available (completed by ASET International Service, LLC, before and independently of this study), and because patient educational material regarding warfarin has been associated with fewer bleeding events.17 We downloaded the English document on October 19, 2009 and used the GT website to translate it en bloc. We then copied the resulting Spanish output into a text file. The English document and the professional Spanish translation (downloaded the same day) were both converted into text files in the same manner.
Grading Methodology
We scored the translation chosen using both manual and automated evaluation techniques. These techniques are widely used in the machine translation literature and are explained below.
Manual Evaluation: Evaluators, Domains, Scoring
We recruited three nonclinician, bilingual, nativeSpanish‐speaking research assistants as evaluators. The evaluators were all college educated with a Bachelor's degree or higher and were of Mexican, Nicaraguan, and Guatemalan ancestry. Each evaluator received a brief orientation regarding the project, as well as an explanation of the scores, and then proceeded to the blinded evaluation independently.
We asked evaluators to score sentences on Likert scales along five primary domains: fluency, adequacy, meaning, severity, and preference. Fluency and adequacy are well accepted components of machine translation evaluation,18 with fluency being an assessment of grammar and readability ranging from 5 (Perfect fluency; like reading a newspaper) to 1 (No fluency; no appreciable grammar, not understandable) and adequacy being an assessment of information preservation ranging from 5 (100% of information conveyed from the original) to 1 (0% of information conveyed from the original). Given that a sentence can be highly adequate but drastically change the connotation and intent of the sentence (eg, a sentence that contains 75% of the correct words but changes a sentence from take this medication twice a day to take this medication once every two days), we asked evaluators to assess meaning, a measure of connotation and intent maintenance, with scores ranging from 5 (Same meaning as original) to 1 (Totally different meaning from the original).19 Evaluators also assessed severity, a new measure of potential harm if a given sentence was assessed as having errors of any kind, ranging from 5 (Error, no effect on patient care) to 1 (Error, dangerous to patient) with an additional option of N/A (Sentence basically accurate). Finally, evaluators rated a blinded preference (also a new measure) for either of two translated sentences, ranging from Strongly prefer translation #1 to Strongly prefer translation #2. The order of the sentences was random (eg, sometimes the professional translation was first and sometimes the GT translation was). We subsequently converted this to preference for the professional translation, ranging from 5 (Strongly prefer the professional translation) to 1 (Strongly prefer the GT translation) in order to standardize the responses (Figures 1 and 2).
The overall flow of the study is given in Figure 3. Each evaluator initially scored 20 sentences translated by GT and 10 sentences translated professionally along the first four domains. All 30 of these sentences were randomly selected from the original, 263‐sentence pamphlet. For fluency, evaluators had access only to the translated sentence to be scored; for adequacy, meaning, and severity, they had access to both the translated sentence and the original English sentence. Ten of the 30 sentences were further selected randomly for scoring on the preference domain. For these 10 sentences, evaluators compared the GT and professional translations of the same sentence (with the original English sentence available as a reference) and indicated a preference, for any reason, for one translation or the other. Evaluators were blinded to the technique of translation (GT or professional) for all scored sentences and domains. We chose twice as many sentences from the GT preparations for the first four domains to maximize measurements for the translation technology we were evaluating, with the smaller number of professional translations serving as controls.
After scoring the first 30 sentences, evaluators met with one of the authors (R.R.K.) to discuss and consolidate their approach to scoring. They then scored an additional 10 GT‐translated sentences and 5 professionally translated sentences for the first four domains, and 9 of these 15 sentences for preference, to see if the meeting changed their scoring approach. These sentences were selected randomly from the original, 263‐sentence pamphlet, excluding the 30 evaluated in the previous step.
Automated Machine Translation Evaluation
Machine translation researchers have developed automated measures allowing the rapid and inexpensive scoring and rescoring of translations. These automated measures supplement more time‐ and resource‐intensive manual evaluations. The automated measures are based upon how well the translation compares to one or, ideally, multiple professionally prepared reference translations. They correlate well with human judgments on the domains above, especially when multiple reference translations are used (increasing the number of reference translations increases the variability allowed for words and phrases in the machine translation, improving the likelihood that differences in score are related to differences in quality rather than differences in translator preference).20 For this study, we used Metric for Evaluation of Translation with Explicit Ordering (METEOR), a machine translation evaluation system that allows additional flexibility for the machine translation in terms of grading individual sentences and being sensitive to synonyms, word stemming, and word order.21 We obtained a METEOR score for each of the GT‐translated sentences using the professional translation as our reference, and assessed correlation between this automated measure and the manual evaluations for the GT sentences, with the aim of assessing the feasibility of using METEOR in future work on patient educational material translation.
Outcomes and Statistical Analysis
We compared the scores assigned to GT‐translated sentences for each of the five manually scored domains as compared to the scores of the professionally translated sentences, as well as the impact of word count and sentence complexity on the scores achieved specifically by the GT‐translated sentences, using clustered linear regression to account for the fact that each of the 45 sentences were scored by each of the three evaluators. Sentences were classified as simple if they contained one or fewer clauses and complex if they contained more than one clause.22 We also assessed interrater reliability for the manual scoring system using intraclass correlation coefficients and repeatability. Repeatability is an estimate of the maximum difference, with 95% confidence, between scores assigned to the same sentence on the same domain by two different evaluators;23 lower scores indicate greater agreement between evaluators. Since we did not have clinical data or a gold standard, we used repeatability to estimate the value above which a difference between two scores might be clinically significant and not simply due to interrater variability.24 Finally, we assessed the correlation of the manual scores with those calculated by the METEOR automated evaluation tool using Pearson correlation coefficients. All analyses were conducted using Stata 11 (College Station, TX).
Results
Sentence Description
A total of 45 sentences were evaluated by the bilingual research assistants. The initial 30 sentences and the subsequent, post‐consolidation meeting 15 sentences were scored similarly in all outcomes, after adjustment for word length and complexity, so we pooled all 45 sentences (as well as the 19 total sentence pairs scored for preference) for the final analysis. Average sentence lengths were 14.2 words, 15.5 words, and 16.6 words for the English source text, professionally translated sentences, and GT‐translated sentences, respectively. Thirty‐three percent of the English source sentences were simple and 67% were complex.
Manual Evaluation Scores
Sentences translated by GT received worse scores on fluency as compared to the professional translations (3.4 vs 4.7, P < 0.0001). Comparisons for adequacy and meaning were not statistically significantly different. GT‐translated sentences contained more errors of any severity as compared to the professional translations (39% vs 22%, P = 0.05), but a similar number of serious, clinically impactful errors (severity scores of 3, 2, or 1; 4% vs 2%, P = 0.61). However, one GT‐translated sentence was considered erroneous with a severity level of 1 (Error, dangerous to patient). This particular sentence was 25 words long and complex in structure in the original English document; all three evaluators considered the GT translation nonsensical (La hemorragia mayor, llame a su mdico, o ir a la emergencia de un hospital habitacin si usted tiene cualquiera de los siguientes: Red N, oscuro, caf o cola de orina de color.) Evaluators had no overall preference for the professional translation (3.2, 95% confidence interval = 2.7 to 3.7, with 3 indicating no preference; P = 0.36) (Table 1).
| GoogleTranslate Translation | Professional Translation | P Value | |
|---|---|---|---|
| |||
| Fluency* | 3.4 | 4.7 | <0.0001 |
| Adequacy* | 4.5 | 4.8 | 0.19 |
| Meaning* | 4.2 | 4.5 | 0.29 |
| Severity | |||
| Any error | 39% | 22% | 0.05 |
| Serious error | 4% | 2% | 0.61 |
| Preference* | 3.2 | 0.36 | |
Mediation of Scores by Sentence Length or Complexity
We found that sentence length was not associated with scores for fluency, adequacy, meaning, severity, or preference (P > 0.30 in each case). Complexity, however, was significantly associated with preference: evaluators' preferred the professional translation for complex English sentences while being more ambivalent about simple English sentences (3.6 vs 2.6, P = 0.03).
Interrater Reliability and Repeatability
We assessed the interrater reliability for each domain using intraclass correlation coefficients and repeatability. For fluency, the intraclass correlation was best at 0.70; for adequacy, it was 0.58; for meaning, 0.42; for severity, 0.48; and for preference, 0.37. The repeatability scores were 1.4 for fluency, 0.6 for adequacy, 2.2 for meaning, 1.2 for severity, and 3.8 for preference, indicating that two evaluators might give a sentence almost the same score (at most, 1 point apart from one another) for adequacy, but might have opposite preferences regarding which translation of a sentence was superior.
Correlation with METEOR
Correlation between the first four domains and the METEOR scores were less than in prior studies.21 Fluency correlated best with METEOR at 0.53; adequacy correlated least with METEOR at 0.29. The remaining scores were in‐between. All correlations were statistically significant at P < 0.01 (Table 2).
| Correlation with METEOR | P value | |
|---|---|---|
| ||
| Fluency | 0.53 | <0.0001 |
| Adequacy | 0.29 | 0.006 |
| Meaning | 0.33 | 0.002 |
| Severity | 0.39 | 0.002 |
Discussion
In this preliminary study comparing the accuracy of GT to professional translation for patient educational material, we found that GT was inferior to the professional translation in grammatical fluency but generally preserved the content and sense of the original text. Out of 30 GT sentences assessed, there was one substantially erroneous translation that was considered potentially dangerous. Evaluators preferred the professionally translated sentences for complex sentences, but when the English source sentence was simplecontaining a single clausethis preference disappeared.
Like Sharif and Tse,12 we found that for information not arranged in sentences, automated translation sometimes produced nonsensical sentences. In our study, these resulted from an English sentence fragment followed by a bulleted list; in their study, the nonsensical translations resulted from pharmacy labels. The difference in frequency of these errors between our studies may have resulted partly from the translation tool evaluated (GT vs programs used by pharmacies in the Bronx), but may have also been due to our use of machine translation for complete sentencesthe purpose for which it is optimally designed. The hypothesis that machine translations of clinical information are most understandable when used for simple, complete sentences concurs with the methodology used by these tools and requires further study.
GT has the potential to be very useful to clinicians, particularly for those instances when the communication required is both spontaneous and routine or noncritical. For example, in the inpatient setting, patients could communicate diet and other nonclinical requests, as well as ask or answer simple, short questions when the interpreter is not available. In such situations, the low cost and ease of using online translations and machine translation more generally may help to circumvent the tendency of clinicians to get by with inadequate language skills or to avoid communication altogether.25 If used wisely, GT and other online tools could supplement the use of standardized translations and professional interpreters in helping clinicians to overcome language barriers and linguistic inertia, though this will require further assessment.
Ours is a pilot study, and while it suggests a more promising way to use online translation tools, significant further evaluation is required regarding accuracy and applicability prior to widespread use of any machine translation tools for patient care. The document we utilized for evaluation was a professionally translated patient educational brochure provided to individuals starting a complex medication. As online translation tools would most likely not be used in this setting, but rather for spontaneous and less critical patient‐specific instructions, further testing of GT as applied to such scenarios should be considered. Second, we only evaluated GT for English translated into Spanish; its usefulness in other languages will need to be evaluated. It also remains to be seen how easily GT translations will be understood by patients, who may have variable medical understanding and educational attainment as compared to our evaluators. Finally, in this evaluation, we only assessed automated written translation, not automated spoken translation services such as those now available on cellular phones and other mobile devices.11 The latter are based upon translation software with an additional speech recognition interface. These applications may prove to be even more useful than online translation, but the speech recognition component will add an additional layer of potential error and these applications will need to be evaluated on their own merits.
The domains chosen for this study had only moderate interrater reliability as assessed by intraclass correlation and repeatability, with meaning and preference scoring particularly poorly. The latter domains in particular will require more thorough assessment before routine use in online translation assessment. The variability in all domains may have resulted partly from the choice of nonclinicians of different ancestral backgrounds as evaluators. However, this variability is likely better representative of the wide range of patient backgrounds. Because our evaluators were not professional translators, we asked a professional interpreter to grade all sentences to assess the quality of their evaluation. While the interpreter noted slightly fewer errors among the professionally translated sentences (13% vs 22%) and slightly more errors among the GT‐translated sentences (50% vs 39%), and preferred the professional translation slightly more (3.8 vs 3.2), his scores for all of the other measures were almost identical, increasing our confidence in our primary findings (Appendix A). Additionally, since statistical translation is conducted sentence by sentence, in our study evaluators only scored translations at the sentence level. The accuracy of GT for whole paragraphs or entire documents will need to be assessed separately. The correlation between METEOR and the manual evaluation scores was less than in prior studies; while inexpensive to assess, METEOR will have to be recalibrated in optimal circumstanceswith several reference translations available rather than just onebefore it can be used to supplement the assessment of new languages, new materials, other translation technologies, and improvements in a given technology over time for patient educational material.
In summary, GT scored worse in grammar but similarly in content and sense to the professional translation, committing one critical error in translating a complex, fragmented sentence as nonsense. We believe that, with further study and judicious use, GT has the potential to substantially improve clinicians' communication with patients with limited English proficiency in the area of brief spontaneous patient‐specific information, supplementing well the role that professional spoken interpretation and standardized written translations already play.
- ,.Language use and English‐speaking ability: 2000. In:Census 2000 Brief.Washington, DC:US Census Bureau;2003. p. 2. http://www.census.gov/prod/2003pubs/c2kbr‐29.pdf.
- ,,,,.The need for more research on language barriers in health care: a proposed research agenda.Milbank Q.2006;84(1):111–133.
- ,,,.Language proficiency and adverse events in US hospitals: a pilot study.Int J Qual Health Care.2007;19(2):60–67.
- .The impact of medical interpreter services on the quality of health care: a systematic review.Med Care Res Rev.2005;62(3):255–299.
- ,,, et al.Errors in medical interpretation and their potential clinical consequences in pediatric encounters.Pediatrics.2003;111(1):6–14.
- ,,, et al.The effect of English language proficiency on length of stay and in‐hospital mortality.J Gen Intern Med.2004;19(3):221–228.
- ,,,.Influence of language barriers on outcomes of hospital care for general medicine inpatients.J Hosp Med.2010;5(5):276–282.
- ,.Hospitals, language, and culture: a snapshot of the nation. In:Los Angeles, CA:The California Endowment, the Joint Commission;2007. p.51–52. http://www.jointcommission.org/assets/1/6/hlc_paper.pdf.
- ,,,.Do professional interpreters improve clinical care for patients with limited English proficiency? A systematic review of the literature.Health Serv Res.2007;42(2):727–754.
- .Google's Computing Power Refines Translation Tool.New York Times; March 9,2010. Accessed March 24, 2010. http://www.nytimes.com/2010/03/09/technology/09translate.html?_r=1.
- , Translator. New York Times; March 20,2010. Accessed March 24, 2010. http://www.nytimes.com/2010/03/21/opinion/21bellos.html.
- ,.Accuracy of computer‐generated, Spanish‐language medicine labels.Pediatrics.2010;125(5):960–965.
- .Nielsen NetRatings Search Engine Ratings.SearchEngineWatch; August 22,2006. Accessed March 24, 2010. http://searchenginewatch.com/2156451.
- Google.Google Translate Help;2010. Accessed March 24, 2010. http://translate.google.com/support/?hl=en.
- ,.Chapter 4: Basic strategies. In:An Introduction to Machine Translation;1992. Accessed April 22, 2010. http://www.hutchinsweb.me.uk/IntroMT‐4.pdf
- .Your Guide to Coumadin®/Warfarin Therapy.Agency for Healthcare Research and Quality; August 21,2008. Accessed October 19, 2009. http://www.ahrq.gov/consumer/btpills.htm.
- ,,, et al.Patient reported receipt of medication instructions for warfarin is associated with reduced risk of serious bleeding events.J Gen Intern Med.2008;23(10):1589–1594.
- ,,.The ARPA MT evaluation methodologies: evolution, lessons, and future approaches. In: Proceedings of AMTA, 1994, Columbia, MD; October1994.
- ,.Overview of the IWSLT 2005 evaluation campaign. In: Proceedings of IWSLT 2005, Pittsburgh, PA; October2005.
- ,,,.BLEU: a method for automatic evaluation of machine translation. In: ACL‐2002: 40th Annual Meeting of the Association for Computational Linguistics.2002:311–318.
- ,.METEOR: an automatic metric for MT evaluation with high levels of correlation with human judgments. In: Proceedings of the Second Workshop on Statistical Machine Translation at ACL, Prague, Czech Republic; June2007.
- .The Structure of a Sentence.Ottawa:The Writing Centre, University of Ottawa;2007.
- ,.Statistical methods for assessing agreement between two methods of clinical measurement.Lancet.1986;1(8476):307–310.
- .Measurement, reproducibility, and validity. In:Epidemiologic Methods 203.San Francisco:Department of Biostatistics and Epidemiology, University of California;2009.
- ,,,,.Getting by: underuse of interpreters by resident physicians.J Gen Intern Med.2009;24(2):256–262.
Copyright © 2011 Society of Hospital Medicine
Trends in Thrombolytic Use for Stroke
Recombinant tissue plasminogen activator (tPA), approved for use in the United States for the treatment for acute ischemic stroke since 1996, improves overall outcomes from ischemic stroke when administered to selected patients.14 Several prominent guidelines, including the Brain Attack Coalition and the American Stroke Association, have recommended increasing the use of tPA for acute ischemic stroke.57 In addition, in 2003 the Joint Commission on Accreditation of Healthcare Organizations developed a disease‐specific certification program to designate certain institutions Primary Stroke Centers, with one of the performance measures being the availability of thrombolysis.8
Despite guidelines and regulatory agencies promoting the use of thrombolysis for ischemic stroke, previous studies have shown disappointingly low rates of use.912 The goals of this study were to assess whether national trends in the use of thrombolysis for acute ischemic stroke have increased in light of increased regulatory activity as well as to identify patient characteristics associated with thrombolytic administration.
Materials and Methods
Data for this study were obtained from the 2001 through 2006 National Hospital Discharge Survey (NHDS), a nationally representative sample of inpatient hospitalizations conducted annually by the National Center for Health Statistics.13 The NHDS collects data on approximately 300,000 patients from about 500 short‐stay nonfederal hospitals in the United States and uses a 3‐stage sampling strategy that allows for extrapolation to national level estimates. Response rates typically exceed 90% from participating hospitals. The survey collects demographic data, including age, sex, race, hospital geographic region, hospital bedsize and patient insurance status. In addition, up to 7 diagnostic and 4 procedural codes from the hospitalization are available, as is hospitalization length of stay and patient discharge disposition. No information on timing of symptoms, degree of neurologic compromise, or results of imaging tests were available in the NHDS.
We searched for all patients age 18 years or older with a primary diagnostic code of ischemic stroke using the International Classification of Diseases, 9th Edition, Clinical Modification (ICD‐9‐CM) codes 433, 434, 436, 437.0, and 437.1, excluding codes with a fifth digit of 0 (which indicated arterial occlusion without mention of cerebral infarction). We then searched for the presence of an ICD‐9‐CM procedure code for injection or infusion of thrombolytic agent (code 99.10). Specific comorbid conditions associated with ischemic stroke were identified by searching for specific ICD‐9‐CM codes, including for heart failure, coronary artery disease, hypertension, diabetes mellitus, and atrial fibrillation. To provide a general assessment of the severity of illness of the patients, we calculated an adapted Charlson comorbidity score for each patient using available secondary discharge diagnosis codes.14 We also searched for codes corresponding to intracranial hemorrhage, a complication associated with tPA administration.
Statistical Analysis
We defined thrombolytic utilization rates as the number of patients hospitalized with a primary diagnosis of ischemic stroke who had a procedure code for thrombolysis divided by the total number of patients hospitalized with ischemic stroke. To calculate nationally representative prevalence rates, we used the sample weights provided by the NHDS to account for the complex sampling design of the survey. Differences in thrombolytic administration rates by patient and hospital characteristics were tested using chi‐squared tests for categorical variables and t‐tests for continuous variables. Variables underwent a backwards selection process with a significance level of 0.05 to develop the final multivariable model of predictors of thrombolytic administration. Length of stay and hospital discharge status were not included in the variable selection process, as the focus was on predictors of initial administration of thrombolytics. All analyses were conducted using SAS Version 9.1 (SAS Institute Inc., Cary, NC).
Results
From years 2001 through 2006, we identified 22,842 patients with a primary diagnosis of ischemic stroke. Of these, 313 (1.37%, 95% confidence interval [CI], 1.22‐1.53%) had a procedure code for injection or infusion of thrombolysis. Using NHDS sample weights, these numbers corresponded to an estimated 2.55 million hospitalizations for ischemic stroke in the United States during the time period and to 35,082 patients receiving intravenous thrombolytics. Although the overall rate of thrombolysis administration was quite low overall, the administration rate increased over time, from 0.87% [95% CI, 0.61‐1.22%] of stroke patients in year 2001 to 2.40% [95% CI, 1.95‐2.93%] in year 2006 and with a particular increase especially noted after year 2003 (P <0.001 for trend, Figure 1).
On bivariate analysis, a lower proportion of African‐American patients received tPA compared to white patients (0.8% vs. 1.5%, P = 0.003), while a higher proportion of patients with atrial fibrillation received tPA (2.3% vs. 1.2%, P < 0.001). Older patients were less likely than younger patients to receive tPA (Table 1). The rate of intracranial hemorrhage was significantly higher in patients who received tPA (5.4% vs. 0.6%, P < 0.001) and the overall inpatient mortality in patients who received tPA was 9.0%. Mortality in patients receiving tPA continued to be higher than in patients who did not receive tPA even when patients with intracranial hemorrhage were excluded (8.1% vs. 5.3%, P < 0.001). Larger hospitals were more likely to administer tPA to patients with ischemic stroke, with a 1.79% administration rate in hospitals with 300 beds compared to 0.90% in hospitals with 100 to 199 beds and 0.52% in hospitals with 6 to 99 beds (P < 0.001).
| Thrombolysis, n (%) | No Thrombolysis, n (%) | P Value | |
|---|---|---|---|
| |||
| Age | 0.001 | ||
| <60 | 76 (24.3) | 4478 (19.9) | |
| 60‐69 | 73 (23.3) | 3942 (17.5) | |
| 70‐79 | 82 (26.2) | 6265 (27.8) | |
| 80+ | 82 (26.2) | 7844 (34.8) | |
| Female | 155 (49.5) | 12625 (56.0) | 0.02 |
| Race | 0.003 | ||
| White | 173 (55.3) | 11542 (51.2) | |
| African American | 29 (9.3) | 3774 (16.8) | |
| Other | 16 (5.1) | 814 (3.6) | |
| Not stated | 95 (30.4) | 6399 (28.4) | |
| Region | 0.05 | ||
| Northeast | 78 (24.9) | 4570 (20.3) | |
| Midwest | 84 (26.8) | 6924 (30.7) | |
| South | 104 (33.2) | 8284 (36.8) | |
| West | 47 (15.0) | 2751 (12.2) | |
| Type of admission | <0.001 | ||
| Emergent | 247 (78.9) | 14233 (63.2) | |
| Urgent | 33 (10.5) | 3703 (16.4) | |
| Elective | 5 (1.6) | 1346 (6.0) | |
| Unknown | 28 (9.0) | 3247 (14.4) | |
| Length of stay, days [95% CI] | 7.2 [6.6‐7.8] | 6.0 [5.9‐6.1] | <0.001 |
| Hospital bedsize | <0.001 | ||
| 6‐99 | 16 (5.1) | 3065 (13.6) | |
| 100‐199 | 48 (15.3) | 5289 (23.5) | |
| 200‐299 | 86 (27.5) | 5212 (23.1) | |
| 300+ | 163 (52.1) | 8963 (39.8) | |
| Payment type | <0.001 | ||
| Medicare | 176 (56.2) | 15197 (67.5) | |
| Medicaid | 21 (6.7) | 1245 (5.5) | |
| Private | 45 (14.4) | 2483 (11.0) | |
| HMO/PPO | 39 (12.5) | 2224 (9.9) | |
| Other/unknown | 32 (10.2) | 1380 (6.1) | |
| Discharge status | <0.001 | ||
| Home | 98 (31.3) | 9507 (42.2) | |
| Short term care facility | 25 (8.0) | 1271 (5.6) | |
| Long term care facility | 62 (19.8) | 5400 (24.0) | |
| Alive, status unknown | 89 (28.4) | 4514 (20.0) | |
| Death | 28 (9.0) | 1218 (5.4) | |
| Unknown | 11 (3.5) | 619 (2.8) | |
| Comorbid conditions | |||
| Congestive heart failure | 48 (15.3) | 2769 (12.3) | 0.10 |
| Coronary artery disease | 49 (15.7) | 4082 (18.1) | 0.26 |
| Hypertension | 164 (52.4) | 12480 (55.4) | 0.29 |
| Diabetes mellitus | 42 (13.4) | 4965 (22.0) | <0.001 |
| Atrial fibrillation | 96 (30.7) | 4096 (18.2) | <0.001 |
| Intracranial hemorrhage | 17 (5.4) | 139 (0.6) | <0.001 |
| Charlson score14 (mean) | 2.48 [2.32‐2.64] | 2.38 [2.36‐2.40] | 0.23 |
After adjusting for patient and hospital characteristics, the absolute rate of thrombolysis administration increased by an average of 0.19% per year (95% CI, 0.12‐0.26%). Factors that were significantly associated with administration of thrombolytics included being hospitalized in a larger hospital, having a history of atrial fibrillation, and a higher Charlson comorbidity index (Table 2). Patients aged 80 years or older, African American patients, and those with diabetes mellitus were significantly less likely to receive thrombolysis.
| Characteristic | Adjusted OR (95% CI) |
|---|---|
| |
| Year (per year, from 2001 to 2006) | 1.2 (1.1‐1.3) |
| Age, years | |
| <60 | Referent |
| 60‐69 | 1.0 (0.7‐1.4) |
| 70‐79 | 0.6 (0.5‐0.9) |
| 80+ | 0.4 (0.3‐0.6) |
| Race | |
| Not African American | Referent |
| African‐American | 0.4 (0.3‐0.7) |
| Unknown | 1.0 (0.8‐1.2) |
| Hospital bedsize | |
| 6‐99 | Referent |
| 100‐199 | 1.7 (1.0‐3.1) |
| 200‐299 | 3.2 (1.8‐5.4) |
| 300+ | 3.3 (2.0‐5.6) |
| Diabetes mellitus | 0.5 (0.3‐0.6) |
| Atrial fibrillation | 2.2 (1.7‐2.9) |
| Charlson comorbidity score14 (per point increase) | 1.1 (1.1‐1.2) |
Discussion
Despite strong recommendations from guidelines and regulatory agencies, national rates of intravenous thrombolysis for ischemic stroke continue to be quite low overall. However, tPA administration appears to have increased from previous years and particularly increased in years after the Joint Commission began to accredit institutions as Primary Stroke Centers.11 The oldest patients and African Americans were less likely to receive thrombolytics, while patients with atrial fibrillation were more likely to receive thrombolysis, potentially related to atrial fibrillation causing more severe strokes.15 A total of 5.4% of patients who received tPA were diagnosed with intracranial hemorrhage, and the inpatient mortality rate of patients with tPA was 9.0%.
The exact optimal rate of thrombolysis administration for the patients in our study is unknown, as the NHDS database lacked detailed information on factors that would preclude tPA administration such as late timing of presentation and mild stroke symptoms.3 Studies conducted in stroke registries and regional settings have found that only approximately 15% to 32% of patients presenting with ischemic stroke arrive within 3 hours of symptom onset, and of these, only about 40% to 50% are eligible for tPA clinically.9, 10, 1619 However, even among presumed eligible patients, tPA administration rates only range between 25% and 43%,17, 19, 20 and the ideal rate is likely to be higher than the very low rates we observed in our study. Newer evidence that extending the time window where tPA may be given safely may increase the number of eligible patients.21
Patients who received thrombolysis had higher mortality rates than patients who did not. Although we were unable to determine a causal association, prior observational studies of tPA administration for acute stroke have found that patients with more severe neurologic deficits were more likely to receive thrombolysis.17, 18 The 9.0% inpatient case‐fatality rate observed in our study compares favorably to the 13.4% mortality rate after tPA reported in a post‐approval meta‐analysis of safety outcomes22 and the rate of intracranial hemorrhage in our analysis was similar to those observed in other settings.9, 2225 We were unable to determine whether intracranial hemorrhages in our study were as a result of tPA administration or whether patients who received tPA were more likely to have intracranial hemorrhages detected, such as may be due to increased frequency of head imaging.
Larger hospitals were more likely to administer tPA. This may reflect regionalization of stroke care, particularly in those designated as stroke centers of excellence. As well, there is some evidence that there is a learning curve with thrombolysis administration, where guideline‐recommended practice and use of tPA increases with additional experience with the drug.9, 26 Promoting systems that allow for rapid triage and diagnosis of acute stroke should be encouraged and hospital leaders should develop strategies that allow for early recognition of potential tPA candidates.
There are several limitations to our analysis. The NHDS does not collect detailed data on clinical or presenting features of stroke, and so we lacked information on stroke severity and eligibility for administration of thrombolysis. Our study may have underestimated the overall rates of thrombolysis, as it was dependent on diagnostic codes. A previous study of 34 patients who received tPA found that although the 99.10 code was 100% specific, the code identified only 17 patients who actually received tPA (sensitivity of 50%).20 Another study comparing Medicare administrative claims data to actual pharmacy billing charges for tPA found that administrative data underestimated the rate of tPA administration by approximately 25% to 30%.12 If a diagnostic code sensitivity of 50% was assumed, rates of tPA administration in our study may have been as high as 4.8% (95% CI, 4.1‐5.5%) by year 2006.
Conclusion
In conclusion, the use of intravenous thrombolysis in patients admitted with acute ischemic stroke in the United States has risen over time, but overall use remains very low. Further efforts to improve appropriate administration rates should be encouraged, particularly as the acceptable time‐window for using tPA widens.
Acknowledgements
The authors thank Mr. Loren Yglecias for his assistance with manuscript text and references.
- The National Institute of Neurological Disorders and Stroke rt‐PA Stroke Study Group.Tissue plasminogen activator for acute ischemic stroke.N Engl J Med.1995;333:1581–1587.
- ,,, et al.Effects of tissue plasminogen activator for acute ischemic stroke at one year. National Institute of Neurological Disorders and Stroke Recombinant Tissue Plasminogen Activator Stroke Study Group.N Engl J Med.1999;340:1781–1787.
- ,,, et al.Association of outcome with early stroke treatment: Pooled analysis of ATLANTIS, ECASS, and NINDS rT‐PA stroke trials.Lancet.2004;363:768–774.
- ,,, et al.Thrombolysis with alteplase for acute ischaemic stroke in the safe implementation of thrombolysis in stroke‐monitoring study (SITS‐MOST): An observational study.Lancet.2007;369:275–282.
- ,,, et al.Recommendations for the establishment of primary stroke centers.JAMA.2000;283:3102–3109.
- ,.Management of acute ischaemic stroke: new guidelines from the American Stroke Association and European Stroke Initiative.Lancet Neurol.2003;2:698–701.
- ,,, et al.Guidelines for the early management of adults with ischemic stroke: a guideline from the American Heart Association/American Stroke Association Stroke Council, Clinical Cardiology Council, Cardiovascular Radiology and Intervention council, and the Atherosclerotic Peripheral Vascular Disease and Quality of Care Outcomes in Research Interdisciplinary Working groups: The American Academy of Neurology affirms the value of this guideline as an educational tool for neurologists.Circulation.2007;115:e478–534.
- The Joint Commission Primary Stroke Center Certification. Available at: http://www.jointcommission.org/CertificationPrograms/PrimaryStrokeCenters. Accessed February 2010.
- ,,, et al.Use of tissue‐type plasminogen activator for acute ischemic stroke: The Cleveland area experience.JAMA.2000;283:1151–1158.
- California Acute Stroke Pilot Registry (CASPR) Investigators.Prioritizing interventions to improve rates of thrombolysis for ischemic stroke.Neurology.2005;64:654–659.
- ,,, et al.Thrombolysis for ischemic stroke in the united states: Data from National Hospital Discharge Survey 1999–2001.Neurosurgery.2005;57:647–654; discussion647–654.
- ,,,,.National US estimates of recombinant tissue plasminogen activator use: ICD‐9 codes substantially underestimate.Stroke.2008;39:924–928.
- US Department of Health and Human Services Public Health Service and National Center for Health Statistics.National Hospital Discharge Durvey 1991–2006. Multi‐year public‐use data file documentation.
- ,,.Adapting a clinical comorbidity index for use with ICD‐9‐CM administrative databases.J Clin Epidemiol.1992;45:613–619.
- ,,, et al.Stroke severity in atrial fibrillation. The Framingham study.Stroke.1996;27:1760–1764.
- ,,,,.Why are stroke patients excluded from tPA therapy? An analysis of patient eligibility.Neurology.2001;57:1739–1740.
- ,,,,,.Utilization of intravenous tissue plasminogen activator for acute ischemic stroke.Arch Neurol.2004;61:346–350.
- ,,, et al.Eligibility for recombinant tissue plasminogen activator in acute ischemic stroke: a population‐based study.Stroke.2004;35:27–29.
- ,,, et al.Tpa use for stroke in the registry of the Canadian stroke network.Can J Neurol Sci.2005;32:433–439.
- ,,, et al.Utilization of intravenous tissue‐type plasminogen activator for ischemic stroke at academic medical centers: the influence of ethnicity.Stroke.2001;32:1061–1068.
- ,,, et al.Number needed to treat to benefit and to harm for intravenous tissue plasminogen activator therapy in the 3‐ to 4.5‐hour window: Joint outcome table analysis of the ECASS 3 trial.Stroke.2009;40:2433–2437.
- .Tissue plasminogen activator for acute ischemic stroke in clinical practice: a meta‐analysis of safety data.Stroke.2003;34:2847–2850.
- ,,, et al.Early intravenous thrombolysis for acute ischemic stroke in a community‐based approach.Stroke.1998;29:1544–1549.
- ,,, et al.Factors associated with in‐hospital mortality after administration of thrombolysis in acute ischemic stroke patients: an analysis of the Nationwide Inpatient Sample 1999 to 2002.Stroke.2006;37:440–446.
- ,,, et al.Intravenous t‐PA for acute ischemic stroke: therapeutic yield of a stroke code system.Neurology.1998;50:501–503.
- ,,, et al.Intravenous tissue‐type plasminogen activator therapy for ischemic stroke: Houston experience 1996 to 2000.Arch Neurol.2001;58:2009–2013.
Recombinant tissue plasminogen activator (tPA), approved for use in the United States for the treatment for acute ischemic stroke since 1996, improves overall outcomes from ischemic stroke when administered to selected patients.14 Several prominent guidelines, including the Brain Attack Coalition and the American Stroke Association, have recommended increasing the use of tPA for acute ischemic stroke.57 In addition, in 2003 the Joint Commission on Accreditation of Healthcare Organizations developed a disease‐specific certification program to designate certain institutions Primary Stroke Centers, with one of the performance measures being the availability of thrombolysis.8
Despite guidelines and regulatory agencies promoting the use of thrombolysis for ischemic stroke, previous studies have shown disappointingly low rates of use.912 The goals of this study were to assess whether national trends in the use of thrombolysis for acute ischemic stroke have increased in light of increased regulatory activity as well as to identify patient characteristics associated with thrombolytic administration.
Materials and Methods
Data for this study were obtained from the 2001 through 2006 National Hospital Discharge Survey (NHDS), a nationally representative sample of inpatient hospitalizations conducted annually by the National Center for Health Statistics.13 The NHDS collects data on approximately 300,000 patients from about 500 short‐stay nonfederal hospitals in the United States and uses a 3‐stage sampling strategy that allows for extrapolation to national level estimates. Response rates typically exceed 90% from participating hospitals. The survey collects demographic data, including age, sex, race, hospital geographic region, hospital bedsize and patient insurance status. In addition, up to 7 diagnostic and 4 procedural codes from the hospitalization are available, as is hospitalization length of stay and patient discharge disposition. No information on timing of symptoms, degree of neurologic compromise, or results of imaging tests were available in the NHDS.
We searched for all patients age 18 years or older with a primary diagnostic code of ischemic stroke using the International Classification of Diseases, 9th Edition, Clinical Modification (ICD‐9‐CM) codes 433, 434, 436, 437.0, and 437.1, excluding codes with a fifth digit of 0 (which indicated arterial occlusion without mention of cerebral infarction). We then searched for the presence of an ICD‐9‐CM procedure code for injection or infusion of thrombolytic agent (code 99.10). Specific comorbid conditions associated with ischemic stroke were identified by searching for specific ICD‐9‐CM codes, including for heart failure, coronary artery disease, hypertension, diabetes mellitus, and atrial fibrillation. To provide a general assessment of the severity of illness of the patients, we calculated an adapted Charlson comorbidity score for each patient using available secondary discharge diagnosis codes.14 We also searched for codes corresponding to intracranial hemorrhage, a complication associated with tPA administration.
Statistical Analysis
We defined thrombolytic utilization rates as the number of patients hospitalized with a primary diagnosis of ischemic stroke who had a procedure code for thrombolysis divided by the total number of patients hospitalized with ischemic stroke. To calculate nationally representative prevalence rates, we used the sample weights provided by the NHDS to account for the complex sampling design of the survey. Differences in thrombolytic administration rates by patient and hospital characteristics were tested using chi‐squared tests for categorical variables and t‐tests for continuous variables. Variables underwent a backwards selection process with a significance level of 0.05 to develop the final multivariable model of predictors of thrombolytic administration. Length of stay and hospital discharge status were not included in the variable selection process, as the focus was on predictors of initial administration of thrombolytics. All analyses were conducted using SAS Version 9.1 (SAS Institute Inc., Cary, NC).
Results
From years 2001 through 2006, we identified 22,842 patients with a primary diagnosis of ischemic stroke. Of these, 313 (1.37%, 95% confidence interval [CI], 1.22‐1.53%) had a procedure code for injection or infusion of thrombolysis. Using NHDS sample weights, these numbers corresponded to an estimated 2.55 million hospitalizations for ischemic stroke in the United States during the time period and to 35,082 patients receiving intravenous thrombolytics. Although the overall rate of thrombolysis administration was quite low overall, the administration rate increased over time, from 0.87% [95% CI, 0.61‐1.22%] of stroke patients in year 2001 to 2.40% [95% CI, 1.95‐2.93%] in year 2006 and with a particular increase especially noted after year 2003 (P <0.001 for trend, Figure 1).
On bivariate analysis, a lower proportion of African‐American patients received tPA compared to white patients (0.8% vs. 1.5%, P = 0.003), while a higher proportion of patients with atrial fibrillation received tPA (2.3% vs. 1.2%, P < 0.001). Older patients were less likely than younger patients to receive tPA (Table 1). The rate of intracranial hemorrhage was significantly higher in patients who received tPA (5.4% vs. 0.6%, P < 0.001) and the overall inpatient mortality in patients who received tPA was 9.0%. Mortality in patients receiving tPA continued to be higher than in patients who did not receive tPA even when patients with intracranial hemorrhage were excluded (8.1% vs. 5.3%, P < 0.001). Larger hospitals were more likely to administer tPA to patients with ischemic stroke, with a 1.79% administration rate in hospitals with 300 beds compared to 0.90% in hospitals with 100 to 199 beds and 0.52% in hospitals with 6 to 99 beds (P < 0.001).
| Thrombolysis, n (%) | No Thrombolysis, n (%) | P Value | |
|---|---|---|---|
| |||
| Age | 0.001 | ||
| <60 | 76 (24.3) | 4478 (19.9) | |
| 60‐69 | 73 (23.3) | 3942 (17.5) | |
| 70‐79 | 82 (26.2) | 6265 (27.8) | |
| 80+ | 82 (26.2) | 7844 (34.8) | |
| Female | 155 (49.5) | 12625 (56.0) | 0.02 |
| Race | 0.003 | ||
| White | 173 (55.3) | 11542 (51.2) | |
| African American | 29 (9.3) | 3774 (16.8) | |
| Other | 16 (5.1) | 814 (3.6) | |
| Not stated | 95 (30.4) | 6399 (28.4) | |
| Region | 0.05 | ||
| Northeast | 78 (24.9) | 4570 (20.3) | |
| Midwest | 84 (26.8) | 6924 (30.7) | |
| South | 104 (33.2) | 8284 (36.8) | |
| West | 47 (15.0) | 2751 (12.2) | |
| Type of admission | <0.001 | ||
| Emergent | 247 (78.9) | 14233 (63.2) | |
| Urgent | 33 (10.5) | 3703 (16.4) | |
| Elective | 5 (1.6) | 1346 (6.0) | |
| Unknown | 28 (9.0) | 3247 (14.4) | |
| Length of stay, days [95% CI] | 7.2 [6.6‐7.8] | 6.0 [5.9‐6.1] | <0.001 |
| Hospital bedsize | <0.001 | ||
| 6‐99 | 16 (5.1) | 3065 (13.6) | |
| 100‐199 | 48 (15.3) | 5289 (23.5) | |
| 200‐299 | 86 (27.5) | 5212 (23.1) | |
| 300+ | 163 (52.1) | 8963 (39.8) | |
| Payment type | <0.001 | ||
| Medicare | 176 (56.2) | 15197 (67.5) | |
| Medicaid | 21 (6.7) | 1245 (5.5) | |
| Private | 45 (14.4) | 2483 (11.0) | |
| HMO/PPO | 39 (12.5) | 2224 (9.9) | |
| Other/unknown | 32 (10.2) | 1380 (6.1) | |
| Discharge status | <0.001 | ||
| Home | 98 (31.3) | 9507 (42.2) | |
| Short term care facility | 25 (8.0) | 1271 (5.6) | |
| Long term care facility | 62 (19.8) | 5400 (24.0) | |
| Alive, status unknown | 89 (28.4) | 4514 (20.0) | |
| Death | 28 (9.0) | 1218 (5.4) | |
| Unknown | 11 (3.5) | 619 (2.8) | |
| Comorbid conditions | |||
| Congestive heart failure | 48 (15.3) | 2769 (12.3) | 0.10 |
| Coronary artery disease | 49 (15.7) | 4082 (18.1) | 0.26 |
| Hypertension | 164 (52.4) | 12480 (55.4) | 0.29 |
| Diabetes mellitus | 42 (13.4) | 4965 (22.0) | <0.001 |
| Atrial fibrillation | 96 (30.7) | 4096 (18.2) | <0.001 |
| Intracranial hemorrhage | 17 (5.4) | 139 (0.6) | <0.001 |
| Charlson score14 (mean) | 2.48 [2.32‐2.64] | 2.38 [2.36‐2.40] | 0.23 |
After adjusting for patient and hospital characteristics, the absolute rate of thrombolysis administration increased by an average of 0.19% per year (95% CI, 0.12‐0.26%). Factors that were significantly associated with administration of thrombolytics included being hospitalized in a larger hospital, having a history of atrial fibrillation, and a higher Charlson comorbidity index (Table 2). Patients aged 80 years or older, African American patients, and those with diabetes mellitus were significantly less likely to receive thrombolysis.
| Characteristic | Adjusted OR (95% CI) |
|---|---|
| |
| Year (per year, from 2001 to 2006) | 1.2 (1.1‐1.3) |
| Age, years | |
| <60 | Referent |
| 60‐69 | 1.0 (0.7‐1.4) |
| 70‐79 | 0.6 (0.5‐0.9) |
| 80+ | 0.4 (0.3‐0.6) |
| Race | |
| Not African American | Referent |
| African‐American | 0.4 (0.3‐0.7) |
| Unknown | 1.0 (0.8‐1.2) |
| Hospital bedsize | |
| 6‐99 | Referent |
| 100‐199 | 1.7 (1.0‐3.1) |
| 200‐299 | 3.2 (1.8‐5.4) |
| 300+ | 3.3 (2.0‐5.6) |
| Diabetes mellitus | 0.5 (0.3‐0.6) |
| Atrial fibrillation | 2.2 (1.7‐2.9) |
| Charlson comorbidity score14 (per point increase) | 1.1 (1.1‐1.2) |
Discussion
Despite strong recommendations from guidelines and regulatory agencies, national rates of intravenous thrombolysis for ischemic stroke continue to be quite low overall. However, tPA administration appears to have increased from previous years and particularly increased in years after the Joint Commission began to accredit institutions as Primary Stroke Centers.11 The oldest patients and African Americans were less likely to receive thrombolytics, while patients with atrial fibrillation were more likely to receive thrombolysis, potentially related to atrial fibrillation causing more severe strokes.15 A total of 5.4% of patients who received tPA were diagnosed with intracranial hemorrhage, and the inpatient mortality rate of patients with tPA was 9.0%.
The exact optimal rate of thrombolysis administration for the patients in our study is unknown, as the NHDS database lacked detailed information on factors that would preclude tPA administration such as late timing of presentation and mild stroke symptoms.3 Studies conducted in stroke registries and regional settings have found that only approximately 15% to 32% of patients presenting with ischemic stroke arrive within 3 hours of symptom onset, and of these, only about 40% to 50% are eligible for tPA clinically.9, 10, 1619 However, even among presumed eligible patients, tPA administration rates only range between 25% and 43%,17, 19, 20 and the ideal rate is likely to be higher than the very low rates we observed in our study. Newer evidence that extending the time window where tPA may be given safely may increase the number of eligible patients.21
Patients who received thrombolysis had higher mortality rates than patients who did not. Although we were unable to determine a causal association, prior observational studies of tPA administration for acute stroke have found that patients with more severe neurologic deficits were more likely to receive thrombolysis.17, 18 The 9.0% inpatient case‐fatality rate observed in our study compares favorably to the 13.4% mortality rate after tPA reported in a post‐approval meta‐analysis of safety outcomes22 and the rate of intracranial hemorrhage in our analysis was similar to those observed in other settings.9, 2225 We were unable to determine whether intracranial hemorrhages in our study were as a result of tPA administration or whether patients who received tPA were more likely to have intracranial hemorrhages detected, such as may be due to increased frequency of head imaging.
Larger hospitals were more likely to administer tPA. This may reflect regionalization of stroke care, particularly in those designated as stroke centers of excellence. As well, there is some evidence that there is a learning curve with thrombolysis administration, where guideline‐recommended practice and use of tPA increases with additional experience with the drug.9, 26 Promoting systems that allow for rapid triage and diagnosis of acute stroke should be encouraged and hospital leaders should develop strategies that allow for early recognition of potential tPA candidates.
There are several limitations to our analysis. The NHDS does not collect detailed data on clinical or presenting features of stroke, and so we lacked information on stroke severity and eligibility for administration of thrombolysis. Our study may have underestimated the overall rates of thrombolysis, as it was dependent on diagnostic codes. A previous study of 34 patients who received tPA found that although the 99.10 code was 100% specific, the code identified only 17 patients who actually received tPA (sensitivity of 50%).20 Another study comparing Medicare administrative claims data to actual pharmacy billing charges for tPA found that administrative data underestimated the rate of tPA administration by approximately 25% to 30%.12 If a diagnostic code sensitivity of 50% was assumed, rates of tPA administration in our study may have been as high as 4.8% (95% CI, 4.1‐5.5%) by year 2006.
Conclusion
In conclusion, the use of intravenous thrombolysis in patients admitted with acute ischemic stroke in the United States has risen over time, but overall use remains very low. Further efforts to improve appropriate administration rates should be encouraged, particularly as the acceptable time‐window for using tPA widens.
Acknowledgements
The authors thank Mr. Loren Yglecias for his assistance with manuscript text and references.
- The National Institute of Neurological Disorders and Stroke rt‐PA Stroke Study Group.Tissue plasminogen activator for acute ischemic stroke.N Engl J Med.1995;333:1581–1587.
- ,,, et al.Effects of tissue plasminogen activator for acute ischemic stroke at one year. National Institute of Neurological Disorders and Stroke Recombinant Tissue Plasminogen Activator Stroke Study Group.N Engl J Med.1999;340:1781–1787.
- ,,, et al.Association of outcome with early stroke treatment: Pooled analysis of ATLANTIS, ECASS, and NINDS rT‐PA stroke trials.Lancet.2004;363:768–774.
- ,,, et al.Thrombolysis with alteplase for acute ischaemic stroke in the safe implementation of thrombolysis in stroke‐monitoring study (SITS‐MOST): An observational study.Lancet.2007;369:275–282.
- ,,, et al.Recommendations for the establishment of primary stroke centers.JAMA.2000;283:3102–3109.
- ,.Management of acute ischaemic stroke: new guidelines from the American Stroke Association and European Stroke Initiative.Lancet Neurol.2003;2:698–701.
- ,,, et al.Guidelines for the early management of adults with ischemic stroke: a guideline from the American Heart Association/American Stroke Association Stroke Council, Clinical Cardiology Council, Cardiovascular Radiology and Intervention council, and the Atherosclerotic Peripheral Vascular Disease and Quality of Care Outcomes in Research Interdisciplinary Working groups: The American Academy of Neurology affirms the value of this guideline as an educational tool for neurologists.Circulation.2007;115:e478–534.
- The Joint Commission Primary Stroke Center Certification. Available at: http://www.jointcommission.org/CertificationPrograms/PrimaryStrokeCenters. Accessed February 2010.
- ,,, et al.Use of tissue‐type plasminogen activator for acute ischemic stroke: The Cleveland area experience.JAMA.2000;283:1151–1158.
- California Acute Stroke Pilot Registry (CASPR) Investigators.Prioritizing interventions to improve rates of thrombolysis for ischemic stroke.Neurology.2005;64:654–659.
- ,,, et al.Thrombolysis for ischemic stroke in the united states: Data from National Hospital Discharge Survey 1999–2001.Neurosurgery.2005;57:647–654; discussion647–654.
- ,,,,.National US estimates of recombinant tissue plasminogen activator use: ICD‐9 codes substantially underestimate.Stroke.2008;39:924–928.
- US Department of Health and Human Services Public Health Service and National Center for Health Statistics.National Hospital Discharge Durvey 1991–2006. Multi‐year public‐use data file documentation.
- ,,.Adapting a clinical comorbidity index for use with ICD‐9‐CM administrative databases.J Clin Epidemiol.1992;45:613–619.
- ,,, et al.Stroke severity in atrial fibrillation. The Framingham study.Stroke.1996;27:1760–1764.
- ,,,,.Why are stroke patients excluded from tPA therapy? An analysis of patient eligibility.Neurology.2001;57:1739–1740.
- ,,,,,.Utilization of intravenous tissue plasminogen activator for acute ischemic stroke.Arch Neurol.2004;61:346–350.
- ,,, et al.Eligibility for recombinant tissue plasminogen activator in acute ischemic stroke: a population‐based study.Stroke.2004;35:27–29.
- ,,, et al.Tpa use for stroke in the registry of the Canadian stroke network.Can J Neurol Sci.2005;32:433–439.
- ,,, et al.Utilization of intravenous tissue‐type plasminogen activator for ischemic stroke at academic medical centers: the influence of ethnicity.Stroke.2001;32:1061–1068.
- ,,, et al.Number needed to treat to benefit and to harm for intravenous tissue plasminogen activator therapy in the 3‐ to 4.5‐hour window: Joint outcome table analysis of the ECASS 3 trial.Stroke.2009;40:2433–2437.
- .Tissue plasminogen activator for acute ischemic stroke in clinical practice: a meta‐analysis of safety data.Stroke.2003;34:2847–2850.
- ,,, et al.Early intravenous thrombolysis for acute ischemic stroke in a community‐based approach.Stroke.1998;29:1544–1549.
- ,,, et al.Factors associated with in‐hospital mortality after administration of thrombolysis in acute ischemic stroke patients: an analysis of the Nationwide Inpatient Sample 1999 to 2002.Stroke.2006;37:440–446.
- ,,, et al.Intravenous t‐PA for acute ischemic stroke: therapeutic yield of a stroke code system.Neurology.1998;50:501–503.
- ,,, et al.Intravenous tissue‐type plasminogen activator therapy for ischemic stroke: Houston experience 1996 to 2000.Arch Neurol.2001;58:2009–2013.
Copyright © 2010 Society of Hospital Medicine

Trends in Catheter Ablation for AF
Atrial fibrillation (AF), the most common clinically significant cardiac arrhythmia, affects over 2.3 million people in the United States.1 AF is associated with an increased risk of stroke and heart failure and independently increases the risk of all cause mortality.26 As such, AF confers a staggering healthcare cost burden.7, 8 Pharmacologic treatments to restore sinus rhythm in patients with AF are associated with a considerable relapse rate911 and the development of nonpharmacologic treatments for AF, such as catheter ablation procedures,1214 may be significantly more successful in restoring and maintaining sinus rhythm.15, 16 Despite relatively poor results from early catheter ablation techniques, the practice has evolved and boasts short‐term success rates as high as 73% to 91% depending on the specific type of procedure.17
In light of the success of ablative therapy, this approach, which was once used primarily in younger patients with structurally intact hearts, has been expanded to include more medically complex patients, including elderly patients, those with cardiomyopathy, and those with implanted devices.16, 18 At the same time, catheter ablation is not without complications, with major complications observed in up to 6% of cases,19 and significant costs.20 Moreover, while the most optimistic randomized control data demonstrate the ability of catheter ablation to prevent the recurrence of AF at 1 year,12, 21, 22 long‐term outcome data are lacking, particularly in patients older than 65 years or those with heart failure.17, 23
The encouraging results supporting catheter ablation continue to stimulate the utilization of catheter ablation practices and spur innovations in ablation techniques.24 The American College of Cardiology/American Heart Association/European Society of Cardiology consensus guidelines recommend consideration of ablative therapy in many instances of AF.17 AF is primarily a disease of older adults25 and although most studies have focused on younger individuals,26 it is possible that increasing numbers of older patients are receiving ablation therapy.16 Although single center studies are available,16 there are few data about the characteristics of patients undergoing ablative therapy on a national level. In order to better understand the current use of catheter ablation treatment for AF, we analyzed data from the National Hospital Discharge Survey (NHDS) to explore trends in patient characteristics and rates of ablation procedures in hospitalized patients with AF from the years 1990 to 2005.
Methods
The NHDS is a nationally representative study of hospitalized patients conducted annually by the National Center for Health Statistics,27 which collects data from approximately 270,000 inpatient records using a representative sample of about 500 short‐stay nonfederal hospitals in the United States. Data for each patient are obtained for age, sex, hospital geographic region (Northeast, Midwest, South, West), and hospital bed size, as well as up to 7 diagnostic codes and 4 procedural codes using the International Classification of Diseases, 9th Revision, Clinical Modification (ICD‐9‐CM). Of note, data on race/ethnicity were not consistently coded in the NHDS and are therefore not included in this analysis.
We searched for all patients age 18 years or older who had an ICD‐9‐CM diagnosis of AF (427.31). Of these patients, we then identified those who had a procedure code for nonsurgical ablation of lesions or tissues of the heart via peripherally‐inserted catheter or an endovascular approach (37.34). We also searched for specific ICD‐9‐CM‐coded diagnoses corresponding to higher stroke risk according to the (CHADS2) risk index,28 where 1 point is assigned for congestive heart failure, hypertension, age >75 years, or diabetes mellitus, and 2 points for prior stroke or transient ischemic attack. We calculated a CHADS2 score for each patient.
Statistical Analysis
Ablation rates were calculated as the number of patients with a diagnosis of AF and a code for catheter ablation divided by all patients with AF. The change in ablation rate over time was determined using simple logistic regression. Differences in ablation rates by patient and hospital characteristics were tested using chi‐square tests for categorical variables and t‐tests for continuous variables. All variables that were tested in univariate analysis (age, sex, insurance status, year of procedure, hospital region, hospital bed‐size, and CHADS2 score) were forced into the final multivariable model examining predictors of ablation. The fit of the final model was tested using the Hosmer‐Lemeshow test for goodness‐of‐fit. Nationally representative estimates were calculated from the sample weights provided by the NHDS to account for the complex sampling design of the survey. All analyses were conducted using SAS Version 9.1 (SAS Institute, Inc., Cary, NC).
Results
From 1990 to 2005, we identified 269,471 hospitalizations in the NHDS with a diagnosis of AF, of which 1,144 (0.42%) had a procedure code for catheter ablation. When extrapolated to national estimates, this corresponds to 32 million hospitalizations of patients with AF in the United States during the time period, of which 133,003 underwent ablation. The proportion of patients with AF who had ablation increased significantly over time, from 0.06% in 1990 to 0.79% in 2005 (P < 0.001 for trend; Figure 1).
On univariate analysis, people with AF undergoing ablation were on average younger and more likely to be male than those who did not have ablation (Table 1). The rate of catheter ablation was higher in patients younger than 50 years (1.75%) compared to 0.55% in patients aged 50 to 79 years, and 0.16% in patients aged 80 years or older. However, ablation rates increased significantly in all age groups over time, with no one age group increasing at a significantly faster rate than the others (P value for interaction between age categories and hospitalization year = 0.7; Figure 2). People undergoing ablation tended to have lower CHADS2 stroke risk scores and fewer risk factors for stroke, including heart failure, coronary artery disease, and diabetes mellitus (Table 1).
| Characteristic | Ablation (n = 1,144) | No Ablation (n = 268,327) | P Value |
|---|---|---|---|
| |||
| Age (years), mean (95% CI) | 66.0 (65.2‐66.8) | 75.9 (75.8‐75.9) | <0.001 |
| Male (%) | 56.6 | 43.4 | <0.001 |
| Insurance (%) | <0.001 | ||
| Private | 22.1 | 10.9 | |
| Medicare | 56.5 | 78.2 | |
| Medicaid | 2.2 | 2.5 | |
| Self‐pay | 0.7 | 1.2 | |
| Other/unknown | 18.5 | 7.2 | |
| Region (%) | <0.001 | ||
| West | 14.5 | 11.8 | |
| Midwest | 23.4 | 31.6 | |
| Northeast | 23.7 | 25.4 | |
| South | 39.3 | 31.2 | |
| Hospital bed size (%) | <0.001 | ||
| 6‐99 | 1.2 | 12.7 | |
| 100‐199 | 6.6 | 22.3 | |
| 200‐299 | 17.4 | 23.8 | |
| 300‐499 | 35.5 | 29.3 | |
| 500+ | 39.3 | 12.0 | |
| CHADS2 score, mean (95% CI) | 1.0 (0.9‐1.0) | 1.5 (1.5‐1.5) | <0.001 |
| CHADS2 = 0 (%) | 36.5 | 15.7 | <0.001 |
| Comorbid conditions | |||
| Heart failure (%) | 26.8 | 38.2 | <0.001 |
| Coronary artery disease (%) | 25.4 | 32.7 | <0.001 |
| Hypertension (%) | 30.8 | 29.2 | 0.24 |
| Diabetes mellitus (%) | 11.4 | 14.5 | 0.003 |
| Length of stay (days), mean (95% CI) | 5.1 (4.7‐5.5) | 7.4 (7.3‐7.4) | <0.001 |
| Discharge status (%) | <0.001 | ||
| Home | 88.8 | 58.7 | |
| Short‐term skilled facility | 0.8 | 4.06 | |
| Long‐term skilled facility | 4.0 | 18.3 | |
| Inpatient death | 1.0 | 6.7 | |
| Alive but status unknown | 5.0 | 10.9 | |
People who underwent ablation were more likely to have private insurance as their primary source of payment and less likely to have Medicare (Table 1). Ablation rates were higher among patients with AF hospitalized in the Western and Southern regions of the United States (0.52% and 0.53%, respectively), compared to rates in the Midwest (0.30%) and Northeast (0.40%). Hospital bed‐size was significantly related to the frequency of ablation, with the overall rate of ablation in patients with AF being 0.04% in hospitals with 6 to 99 beds compared to 1.37% in hospitals with at least 500 beds (P < 0.001). Length of stay was shorter in patients with ablations compared to patients without ablation therapy, and patients with ablation were more likely to be discharged home (Table 1). The inpatient mortality rate in patients undergoing ablation was quite low (0.96%).
In multivariate analysis, the likelihood of ablation therapy in a hospitalized patient with AF increased by 15% per year (95% confidence interval [CI], 13%‐16%) over the time period, adjusted for clinical and hospital characteristics. The likelihood of ablation decreased with older age (adjusted odds ratio [aOR], 0.7 [95% CI, 0.6‐0.7] for each decade of age over 50 years) and for each 1‐point increase in CHADS2 score (aOR, 0.7 [95% CI, 0.7‐0.8]). Ablation was significantly more likely to be performed in hospitals with larger bed‐sizes (aOR, 27.4 [95% CI, 16.1‐46.6] comparing bed‐size of 500+ to bed‐size of 6 to 99) and in patients with private insurance (aOR, 1.4 [95% CI, 1.2‐1.6]; Table 2). The goodness‐of‐fit of the model was appropriate, with a nonsignificant Hosmer‐Lemeshow test P value of 0.13.
| Characteristic | Adjusted Odds Ratio (95 % CI) | |
|---|---|---|
| All Patients (n = 269,471) | Subset* (n = 246,402) | |
| ||
| Age (per decade over 50 years) | 0.67 (0.64‐0.71) | 0.69 (0.64‐0.74) |
| Male | 1.0 (0.91‐1.2) | 0.88 (0.75‐1.0) |
| Insurance | ||
| Private | Ref | Ref |
| Not private | 0.73 (0.63‐0.85) | 0.70 (0.58‐0.86) |
| Other/unknown | 0.71 (0.38‐1.4) | 0.93 (0.45‐1.9) |
| Region | ||
| Northeast | Ref | Ref |
| West | 1.4 (1.2‐1.8) | 1.2 (0.95‐1.6) |
| Midwest | 0.84 (0.71‐1.0) | 0.81 (0.65‐1.0) |
| South | 1.3 (1.1‐1.5) | 1.1 (0.94‐1.4) |
| Hospital bed size | ||
| 6‐99 | Ref | Ref |
| 100‐199 | 2.8 (1.6‐4.9) | 5.0 (2.1‐11.5) |
| 200‐299 | 6.8 (4.0‐11.7) | 10.2 (4.5‐21.1) |
| 300‐499 | 11.1 (6.5‐19.0) | 16.6 (7.4‐37.3) |
| 500+ | 26.1 (15.3‐44.5) | 40.2 (17.9‐90.4) |
| CHADS2 score (per point increase) | 0.74 (0.69‐0.79) | 0.77 (0.71‐0.85) |
To account for the possibility that the ablation procedure was not specifically for AF, we performed a subgroup analysis that excluded all patients who also had diagnostic codes for supraventricular or ventricular tachycardias (427.0, 427.1, 427.2, and 427.4), or atrial flutter (427.32). Of the 269,471 hospitalizations with AF, 23,069 (8.6%) had a code for an arrhythmia in addition to AF. When we excluded patients with other arrhythmias, we identified 691 patients who underwent ablation and who only had a diagnosis of AF. An analysis of this subset yielded results similar to the full analysis (Table 2). The likelihood of ablation therapy in this subset of patients with only AF increased by 14% per year (95% CI, 11%‐16%), adjusting for patient age, sex, insurance status, CHADS2 score, hospital region, and hospital bed‐size.
Discussion
The proportion of hospitalized patients with AF who undergo ablation therapy in the United States has been increasing by approximately 15% per year over the last 15 years. Patients receiving ablation therapy are more likely to be younger, have private insurance, and have fewer stroke risk factors. These demographics likely reflect the fact that these ablations are elective procedures that are preferentially performed in healthier, lower‐risk patients. Despite these preferences, the rate of ablation therapy has been increasing significantly across all age groups, even in the oldest patients.
Though limited by relatively short follow‐up data, published studies of ablation therapies for AF show promising results,17, 26 and initial cost analyses suggest possible fiscal benefits of ablation for AF.20 Despite a paucity of randomized clinical trials comparing ablation to pharmacologic rhythm and rate control, studies suggest that quality of life may be significantly improved with ablation as compared to antiarrhythmic drugs.21 This may be because ablation may reduce AF‐related symptoms.12 As ablation becomes more widespread and recommended, physicians, including hospitalists, may be increasingly likely to refer their patients for ablation, even for patient subgroups who were not well‐represented in clinical trial settings.
The inpatient mortality rate in patients undergoing ablation therapy was quite low in our study, although ablation is not without some risk of procedure‐related stroke and other complications.19 An analysis of the compiled studies on ablation for AF estimates that major complication such as cardiac tamponade or thromboembolism occur in as many as 7% of patients.26 Patients are at highest risk for embolic events, such as transient ischemic attacks or ischemic strokes, in the immediate hours to weeks after ablation. An estimated 5% to 25% of patients will develop a new arrhythmia at some point in the postablation period and other complications, including esophageal injury, phrenic nerve injury, groin hematoma, and retroperitoneal bleed, have been observed.26 Increasing comanagement of postablation patients will necessitate that hospitalists understand the potential complications of ablation as well as current strategies for bridging anticoagulation therapy.
Few data are available about the safety and efficacy of catheter ablation for patients over the age of 65 years. In fact, the mean age of patients enrolled in most clinical trials of catheter ablation was younger than 60 years.26, 29 There are also limited data about the long‐term efficacy of ablation therapy in patients with structural heart disease30; despite this, our study shows that a quarter of patients with AF undergoing ablation therapy in the United States have diagnosed heart failure. As always, the optimistic introduction of new technologies to unstudied patient populations carries the risk of unintended harm. Hospitalists are well situated to collect and analyze outcome data for older patients with multiple comorbidities and to provide real‐time monitoring of potential complications.
Few studies have focused on the demographic and comorbid characteristics of patients undergoing ablation for AF on a national level. One study examined characteristics of patients referred to a single academic center for AF ablation from 1999 to 2005 and found that referred patients have, over time, been older (mean age 47 years in 1999 versus 56 years in 2005), have more persistent AF, larger atria, and were more likely to have had a history of cardiomyopathy (0% in 1999 versus 16% in 2006).16 This study also reported that men were consistently more likely to be referred for ablation than women. These results are generally consistent with our findings.
Our study has several limitations. The exact indication and specific type of ablation were not available in the NHDS, and it is possible that the ablation procedure was for an arrhythmia other than AF. However, our analysis of the subset of patients who only had AF as a diagnosis yielded results similar to the full analysis. We were unable to assess specific efficacy or complication data, but mortality was low and patients tended to have short hospital stays. Because the NHDS samples random hospitalizations, it is possible that some patients were overrepresented in the database if they were repeatedly hospitalized in a single year. This could potentially bias our results toward an overestimate of the number of patients who receive ablation.
It remains unclear what proportion of AF ablation procedures occur in the outpatient versus inpatient setting. Inpatient versus outpatient status is not specified in the few single‐center ablation experiences reported in the literature,16 and the few trials reported are not reliable for determining practice in a nonstudy setting. The most recent (2006) Heart Rhythm Society/European Heart Rhythm Association/European Cardiac Arrhythmia Society Expert Consensus Statement on Catheter and Surgical Ablation of AF recommends aggressive anticoagulation in the periprocedure period with either heparin or low‐molecular‐weight heparins, followed by a bridge to warfarin.17 It makes intuitive sense that patients undergoing ablation for AF would be admitted at least overnight to bridge anticoagulation therapy and monitor for complications, but widespread use of low‐molecular‐weight heparin may make hospitalization less necessary. The observation that patients undergoing ablation had shorter hospital stays does not necessarily imply that ablation procedures shorten hospital stays. Rather, the data almost certainly reflect the fact that ablations are mostly elective procedures performed in the setting of planned short‐term admissions.
Our study provides important epidemiologic data about national trends in the use of ablation therapy in hospitalized patients with AF. We find that the rate of catheter ablation in patients with AF has been increasing significantly over time and across all age groups, including the oldest patients. As the proportion of patients with AF who receive ablation therapy continues to increase over time, comprehensive long‐term outcome data and cost‐effectiveness analyses will be important.
- ,,, et al.Prevalence of diagnosed atrial fibrillation in adults: national implications for rhythm management and stroke prevention: the AnTicoagulation and Risk Factors in Atrial Fibrillation (ATRIA) Study.JAMA.2001;285(18):2370–2375.
- Atrial Fibrillation Investigators.Risk factors for stroke and efficacy of antithrombotic therapy in atrial fibrillation. Analysis of pooled data from five randomized controlled trials.Arch Intern Med.1994;154(13):1449–1457.
- ,,,.A population‐based study of the long‐term risks associated with atrial fibrillation: 20‐year follow‐up of the Renfrew/Paisley study.Am J Med.2002;113(5):359–364.
- ,,,,.The natural history of atrial fibrillation: incidence, risk factors, and prognosis in the Manitoba Follow‐Up Study.Am J Med.1995;98(5):476–484.
- ,,, et al.Comparison of carvedilol and metoprolol on clinical outcomes in patients with chronic heart failure in the Carvedilol Or Metoprolol European Trial (COMET): randomized controlled trial.Lancet.2003;362(9377):7–13.
- ,,, et al.Valsartan reduces the incidence of atrial fibrillation in patients with heart failure: results from the Valsartan Heart Failure Trial (Val‐HeFT).Am Heart J.2005;149(3):548–557.
- ,,,,.Impact of atrial fibrillation on mortality, stroke, and medical costs.Arch Intern Med.1998;158(3):229–234.
- ,,, et al.Cost of care distribution in atrial fibrillation patients: the COCAF study.Am Heart J.2004;147(1):121–126.
- ,,,,,.Serial antiarrhythmic drug treatment to maintain sinus rhythm after electrical cardioversion for chronic atrial fibrillation or atrial flutter.Am J Cardiol.1991;68(4):335–341.
- ,,, et al.Amiodarone to prevent recurrence of atrial fibrillation. Canadian Trial of Atrial Fibrillation Investigators.N Engl J Med.2000;342(13):913–920.
- ,,, et al.Chronic atrial fibrillation. Success of serial cardioversion therapy and safety of oral anticoagulation.Arch Intern Med.1996;156(22):2585–2592.
- ,,, et al.Circumferential pulmonary‐vein ablation for chronic atrial fibrillation.N Engl J Med.2006;354(9):934–941.
- ,.Atrial fibrillation: catheter ablation.J Interv Card Electrophysiol.2006;16(1):15–26.
- ,,.Progress in nonpharmacologic therapy of atrial fibrillation.J Cardiovasc Electrophysiol.2003;14(12 Suppl):S296–S309.
- ,,,,,.Survey of physician experience, trends and outcomes with atrial fibrillation ablation.J Interv Card Electrophysiol.2005;12(3):213–220.
- ,,, et al.Characteristics of patients undergoing atrial fibrillation ablation: trends over a seven‐year period 1999–2005.J Cardiovasc Electrophysiol.2007;18(1):23–28.
- ,,, et al.ACC/AHA/ESC 2006 Guidelines for the management of patients with atrial fibrillation: a report of the American College of Cardiology/American Heart Association Task Force on Practice Guidelines and the European Society of Cardiology Committee for Practice Guidelines (Writing Committee to Revise the 2001 Guidelines for the Management of Patients With Atrial Fibrillation): developed in collaboration with the European Heart Rhythm Association and the Heart Rhythm Society.Circulation.2006;114(7):e257–e354.
- ,,, et al.Safety and efficacy of radiofrequency energy catheter ablation of atrial fibrillation in patients with pacemakers and implantable cardiac defibrillators.Heart Rhythm.2005;2(12):1309–1316.
- ,,, et al.Worldwide survey on the methods, efficacy, and safety of catheter ablation for human atrial fibrillation.Circulation.2005;111(9):1100–1105.
- ,,,,,.Cost comparison of catheter ablation and medical therapy in atrial fibrillation.J Cardiovasc Electrophysiol.2007;18(9):907–913.
- ,,, et al.Radiofrequency ablation vs antiarrhythmic drugs as first‐line treatment of symptomatic atrial fibrillation: a randomized trial.JAMA.2005;293(21):2634–2640.
- ,,, et al.A randomized trial of circumferential pulmonary vein ablation versus antiarrhythmic drug therapy in paroxysmal atrial fibrillation: the APAF Study.J Am Coll Cardiol.2006;48(11):2340–2347.
- ,,.Atrial fibrillation in the elderly.Am J Med.2007;120(6):481–487.
- ,,,,,,.Catheter ablation for atrial fibrillation.Circulation.2007;116(13):1515–1523.
- ,,,,,.Prevalence of atrial fibrillation in elderly subjects (the Cardiovascular Health Study).Am J Cardiol.1994;74(3):236–241.
- ,,, et al.HRS/EHRA/ECAS Expert Consensus Statement on catheter and surgical ablation of atrial fibrillation: recommendations for personnel, policy, procedures and follow‐up. A report of the Heart Rhythm Society (HRS) Task Force on Catheter and Surgical Ablation of Atrial Fibrillation. European Heart Rhythm Association (EHRA), European Cardiac Arrhythmia Scoiety (ECAS), American College of Cardiology (ACC), American Heart Association (AHA), Society of Thoracic Surgeons (STS).Heart Rhythm.2007;4(6):816–861.
- U.S. Department of Health and Human Services, Public Health Service, National Center for Health Statistics National Hospital Discharge Survey 1990–2005. Multi‐Year Public‐Use Data File Documentation. Available at: http://www.cdc.gov/nchs/about/major/hdasd/nhds.htm. Accessed December2008.
- ,,,,,.Validation of clinical classification schemes for predicting stroke: results from the National Registry of Atrial Fibrillation.JAMA.2001;285(22):2864–2870.
- ,,,.Clinical outcomes after ablation and pacing therapy for atrial fibrillation: a meta‐analysis.Circulation.2000;101(10):1138–1144.
- ,,, et al.Catheter ablation for atrial fibrillation in congestive heart failure.N Engl J Med.2004;351(23):2373–2383.
Atrial fibrillation (AF), the most common clinically significant cardiac arrhythmia, affects over 2.3 million people in the United States.1 AF is associated with an increased risk of stroke and heart failure and independently increases the risk of all cause mortality.26 As such, AF confers a staggering healthcare cost burden.7, 8 Pharmacologic treatments to restore sinus rhythm in patients with AF are associated with a considerable relapse rate911 and the development of nonpharmacologic treatments for AF, such as catheter ablation procedures,1214 may be significantly more successful in restoring and maintaining sinus rhythm.15, 16 Despite relatively poor results from early catheter ablation techniques, the practice has evolved and boasts short‐term success rates as high as 73% to 91% depending on the specific type of procedure.17
In light of the success of ablative therapy, this approach, which was once used primarily in younger patients with structurally intact hearts, has been expanded to include more medically complex patients, including elderly patients, those with cardiomyopathy, and those with implanted devices.16, 18 At the same time, catheter ablation is not without complications, with major complications observed in up to 6% of cases,19 and significant costs.20 Moreover, while the most optimistic randomized control data demonstrate the ability of catheter ablation to prevent the recurrence of AF at 1 year,12, 21, 22 long‐term outcome data are lacking, particularly in patients older than 65 years or those with heart failure.17, 23
The encouraging results supporting catheter ablation continue to stimulate the utilization of catheter ablation practices and spur innovations in ablation techniques.24 The American College of Cardiology/American Heart Association/European Society of Cardiology consensus guidelines recommend consideration of ablative therapy in many instances of AF.17 AF is primarily a disease of older adults25 and although most studies have focused on younger individuals,26 it is possible that increasing numbers of older patients are receiving ablation therapy.16 Although single center studies are available,16 there are few data about the characteristics of patients undergoing ablative therapy on a national level. In order to better understand the current use of catheter ablation treatment for AF, we analyzed data from the National Hospital Discharge Survey (NHDS) to explore trends in patient characteristics and rates of ablation procedures in hospitalized patients with AF from the years 1990 to 2005.
Methods
The NHDS is a nationally representative study of hospitalized patients conducted annually by the National Center for Health Statistics,27 which collects data from approximately 270,000 inpatient records using a representative sample of about 500 short‐stay nonfederal hospitals in the United States. Data for each patient are obtained for age, sex, hospital geographic region (Northeast, Midwest, South, West), and hospital bed size, as well as up to 7 diagnostic codes and 4 procedural codes using the International Classification of Diseases, 9th Revision, Clinical Modification (ICD‐9‐CM). Of note, data on race/ethnicity were not consistently coded in the NHDS and are therefore not included in this analysis.
We searched for all patients age 18 years or older who had an ICD‐9‐CM diagnosis of AF (427.31). Of these patients, we then identified those who had a procedure code for nonsurgical ablation of lesions or tissues of the heart via peripherally‐inserted catheter or an endovascular approach (37.34). We also searched for specific ICD‐9‐CM‐coded diagnoses corresponding to higher stroke risk according to the (CHADS2) risk index,28 where 1 point is assigned for congestive heart failure, hypertension, age >75 years, or diabetes mellitus, and 2 points for prior stroke or transient ischemic attack. We calculated a CHADS2 score for each patient.
Statistical Analysis
Ablation rates were calculated as the number of patients with a diagnosis of AF and a code for catheter ablation divided by all patients with AF. The change in ablation rate over time was determined using simple logistic regression. Differences in ablation rates by patient and hospital characteristics were tested using chi‐square tests for categorical variables and t‐tests for continuous variables. All variables that were tested in univariate analysis (age, sex, insurance status, year of procedure, hospital region, hospital bed‐size, and CHADS2 score) were forced into the final multivariable model examining predictors of ablation. The fit of the final model was tested using the Hosmer‐Lemeshow test for goodness‐of‐fit. Nationally representative estimates were calculated from the sample weights provided by the NHDS to account for the complex sampling design of the survey. All analyses were conducted using SAS Version 9.1 (SAS Institute, Inc., Cary, NC).
Results
From 1990 to 2005, we identified 269,471 hospitalizations in the NHDS with a diagnosis of AF, of which 1,144 (0.42%) had a procedure code for catheter ablation. When extrapolated to national estimates, this corresponds to 32 million hospitalizations of patients with AF in the United States during the time period, of which 133,003 underwent ablation. The proportion of patients with AF who had ablation increased significantly over time, from 0.06% in 1990 to 0.79% in 2005 (P < 0.001 for trend; Figure 1).
On univariate analysis, people with AF undergoing ablation were on average younger and more likely to be male than those who did not have ablation (Table 1). The rate of catheter ablation was higher in patients younger than 50 years (1.75%) compared to 0.55% in patients aged 50 to 79 years, and 0.16% in patients aged 80 years or older. However, ablation rates increased significantly in all age groups over time, with no one age group increasing at a significantly faster rate than the others (P value for interaction between age categories and hospitalization year = 0.7; Figure 2). People undergoing ablation tended to have lower CHADS2 stroke risk scores and fewer risk factors for stroke, including heart failure, coronary artery disease, and diabetes mellitus (Table 1).
| Characteristic | Ablation (n = 1,144) | No Ablation (n = 268,327) | P Value |
|---|---|---|---|
| |||
| Age (years), mean (95% CI) | 66.0 (65.2‐66.8) | 75.9 (75.8‐75.9) | <0.001 |
| Male (%) | 56.6 | 43.4 | <0.001 |
| Insurance (%) | <0.001 | ||
| Private | 22.1 | 10.9 | |
| Medicare | 56.5 | 78.2 | |
| Medicaid | 2.2 | 2.5 | |
| Self‐pay | 0.7 | 1.2 | |
| Other/unknown | 18.5 | 7.2 | |
| Region (%) | <0.001 | ||
| West | 14.5 | 11.8 | |
| Midwest | 23.4 | 31.6 | |
| Northeast | 23.7 | 25.4 | |
| South | 39.3 | 31.2 | |
| Hospital bed size (%) | <0.001 | ||
| 6‐99 | 1.2 | 12.7 | |
| 100‐199 | 6.6 | 22.3 | |
| 200‐299 | 17.4 | 23.8 | |
| 300‐499 | 35.5 | 29.3 | |
| 500+ | 39.3 | 12.0 | |
| CHADS2 score, mean (95% CI) | 1.0 (0.9‐1.0) | 1.5 (1.5‐1.5) | <0.001 |
| CHADS2 = 0 (%) | 36.5 | 15.7 | <0.001 |
| Comorbid conditions | |||
| Heart failure (%) | 26.8 | 38.2 | <0.001 |
| Coronary artery disease (%) | 25.4 | 32.7 | <0.001 |
| Hypertension (%) | 30.8 | 29.2 | 0.24 |
| Diabetes mellitus (%) | 11.4 | 14.5 | 0.003 |
| Length of stay (days), mean (95% CI) | 5.1 (4.7‐5.5) | 7.4 (7.3‐7.4) | <0.001 |
| Discharge status (%) | <0.001 | ||
| Home | 88.8 | 58.7 | |
| Short‐term skilled facility | 0.8 | 4.06 | |
| Long‐term skilled facility | 4.0 | 18.3 | |
| Inpatient death | 1.0 | 6.7 | |
| Alive but status unknown | 5.0 | 10.9 | |
People who underwent ablation were more likely to have private insurance as their primary source of payment and less likely to have Medicare (Table 1). Ablation rates were higher among patients with AF hospitalized in the Western and Southern regions of the United States (0.52% and 0.53%, respectively), compared to rates in the Midwest (0.30%) and Northeast (0.40%). Hospital bed‐size was significantly related to the frequency of ablation, with the overall rate of ablation in patients with AF being 0.04% in hospitals with 6 to 99 beds compared to 1.37% in hospitals with at least 500 beds (P < 0.001). Length of stay was shorter in patients with ablations compared to patients without ablation therapy, and patients with ablation were more likely to be discharged home (Table 1). The inpatient mortality rate in patients undergoing ablation was quite low (0.96%).
In multivariate analysis, the likelihood of ablation therapy in a hospitalized patient with AF increased by 15% per year (95% confidence interval [CI], 13%‐16%) over the time period, adjusted for clinical and hospital characteristics. The likelihood of ablation decreased with older age (adjusted odds ratio [aOR], 0.7 [95% CI, 0.6‐0.7] for each decade of age over 50 years) and for each 1‐point increase in CHADS2 score (aOR, 0.7 [95% CI, 0.7‐0.8]). Ablation was significantly more likely to be performed in hospitals with larger bed‐sizes (aOR, 27.4 [95% CI, 16.1‐46.6] comparing bed‐size of 500+ to bed‐size of 6 to 99) and in patients with private insurance (aOR, 1.4 [95% CI, 1.2‐1.6]; Table 2). The goodness‐of‐fit of the model was appropriate, with a nonsignificant Hosmer‐Lemeshow test P value of 0.13.
| Characteristic | Adjusted Odds Ratio (95 % CI) | |
|---|---|---|
| All Patients (n = 269,471) | Subset* (n = 246,402) | |
| ||
| Age (per decade over 50 years) | 0.67 (0.64‐0.71) | 0.69 (0.64‐0.74) |
| Male | 1.0 (0.91‐1.2) | 0.88 (0.75‐1.0) |
| Insurance | ||
| Private | Ref | Ref |
| Not private | 0.73 (0.63‐0.85) | 0.70 (0.58‐0.86) |
| Other/unknown | 0.71 (0.38‐1.4) | 0.93 (0.45‐1.9) |
| Region | ||
| Northeast | Ref | Ref |
| West | 1.4 (1.2‐1.8) | 1.2 (0.95‐1.6) |
| Midwest | 0.84 (0.71‐1.0) | 0.81 (0.65‐1.0) |
| South | 1.3 (1.1‐1.5) | 1.1 (0.94‐1.4) |
| Hospital bed size | ||
| 6‐99 | Ref | Ref |
| 100‐199 | 2.8 (1.6‐4.9) | 5.0 (2.1‐11.5) |
| 200‐299 | 6.8 (4.0‐11.7) | 10.2 (4.5‐21.1) |
| 300‐499 | 11.1 (6.5‐19.0) | 16.6 (7.4‐37.3) |
| 500+ | 26.1 (15.3‐44.5) | 40.2 (17.9‐90.4) |
| CHADS2 score (per point increase) | 0.74 (0.69‐0.79) | 0.77 (0.71‐0.85) |
To account for the possibility that the ablation procedure was not specifically for AF, we performed a subgroup analysis that excluded all patients who also had diagnostic codes for supraventricular or ventricular tachycardias (427.0, 427.1, 427.2, and 427.4), or atrial flutter (427.32). Of the 269,471 hospitalizations with AF, 23,069 (8.6%) had a code for an arrhythmia in addition to AF. When we excluded patients with other arrhythmias, we identified 691 patients who underwent ablation and who only had a diagnosis of AF. An analysis of this subset yielded results similar to the full analysis (Table 2). The likelihood of ablation therapy in this subset of patients with only AF increased by 14% per year (95% CI, 11%‐16%), adjusting for patient age, sex, insurance status, CHADS2 score, hospital region, and hospital bed‐size.
Discussion
The proportion of hospitalized patients with AF who undergo ablation therapy in the United States has been increasing by approximately 15% per year over the last 15 years. Patients receiving ablation therapy are more likely to be younger, have private insurance, and have fewer stroke risk factors. These demographics likely reflect the fact that these ablations are elective procedures that are preferentially performed in healthier, lower‐risk patients. Despite these preferences, the rate of ablation therapy has been increasing significantly across all age groups, even in the oldest patients.
Though limited by relatively short follow‐up data, published studies of ablation therapies for AF show promising results,17, 26 and initial cost analyses suggest possible fiscal benefits of ablation for AF.20 Despite a paucity of randomized clinical trials comparing ablation to pharmacologic rhythm and rate control, studies suggest that quality of life may be significantly improved with ablation as compared to antiarrhythmic drugs.21 This may be because ablation may reduce AF‐related symptoms.12 As ablation becomes more widespread and recommended, physicians, including hospitalists, may be increasingly likely to refer their patients for ablation, even for patient subgroups who were not well‐represented in clinical trial settings.
The inpatient mortality rate in patients undergoing ablation therapy was quite low in our study, although ablation is not without some risk of procedure‐related stroke and other complications.19 An analysis of the compiled studies on ablation for AF estimates that major complication such as cardiac tamponade or thromboembolism occur in as many as 7% of patients.26 Patients are at highest risk for embolic events, such as transient ischemic attacks or ischemic strokes, in the immediate hours to weeks after ablation. An estimated 5% to 25% of patients will develop a new arrhythmia at some point in the postablation period and other complications, including esophageal injury, phrenic nerve injury, groin hematoma, and retroperitoneal bleed, have been observed.26 Increasing comanagement of postablation patients will necessitate that hospitalists understand the potential complications of ablation as well as current strategies for bridging anticoagulation therapy.
Few data are available about the safety and efficacy of catheter ablation for patients over the age of 65 years. In fact, the mean age of patients enrolled in most clinical trials of catheter ablation was younger than 60 years.26, 29 There are also limited data about the long‐term efficacy of ablation therapy in patients with structural heart disease30; despite this, our study shows that a quarter of patients with AF undergoing ablation therapy in the United States have diagnosed heart failure. As always, the optimistic introduction of new technologies to unstudied patient populations carries the risk of unintended harm. Hospitalists are well situated to collect and analyze outcome data for older patients with multiple comorbidities and to provide real‐time monitoring of potential complications.
Few studies have focused on the demographic and comorbid characteristics of patients undergoing ablation for AF on a national level. One study examined characteristics of patients referred to a single academic center for AF ablation from 1999 to 2005 and found that referred patients have, over time, been older (mean age 47 years in 1999 versus 56 years in 2005), have more persistent AF, larger atria, and were more likely to have had a history of cardiomyopathy (0% in 1999 versus 16% in 2006).16 This study also reported that men were consistently more likely to be referred for ablation than women. These results are generally consistent with our findings.
Our study has several limitations. The exact indication and specific type of ablation were not available in the NHDS, and it is possible that the ablation procedure was for an arrhythmia other than AF. However, our analysis of the subset of patients who only had AF as a diagnosis yielded results similar to the full analysis. We were unable to assess specific efficacy or complication data, but mortality was low and patients tended to have short hospital stays. Because the NHDS samples random hospitalizations, it is possible that some patients were overrepresented in the database if they were repeatedly hospitalized in a single year. This could potentially bias our results toward an overestimate of the number of patients who receive ablation.
It remains unclear what proportion of AF ablation procedures occur in the outpatient versus inpatient setting. Inpatient versus outpatient status is not specified in the few single‐center ablation experiences reported in the literature,16 and the few trials reported are not reliable for determining practice in a nonstudy setting. The most recent (2006) Heart Rhythm Society/European Heart Rhythm Association/European Cardiac Arrhythmia Society Expert Consensus Statement on Catheter and Surgical Ablation of AF recommends aggressive anticoagulation in the periprocedure period with either heparin or low‐molecular‐weight heparins, followed by a bridge to warfarin.17 It makes intuitive sense that patients undergoing ablation for AF would be admitted at least overnight to bridge anticoagulation therapy and monitor for complications, but widespread use of low‐molecular‐weight heparin may make hospitalization less necessary. The observation that patients undergoing ablation had shorter hospital stays does not necessarily imply that ablation procedures shorten hospital stays. Rather, the data almost certainly reflect the fact that ablations are mostly elective procedures performed in the setting of planned short‐term admissions.
Our study provides important epidemiologic data about national trends in the use of ablation therapy in hospitalized patients with AF. We find that the rate of catheter ablation in patients with AF has been increasing significantly over time and across all age groups, including the oldest patients. As the proportion of patients with AF who receive ablation therapy continues to increase over time, comprehensive long‐term outcome data and cost‐effectiveness analyses will be important.
- ,,, et al.Prevalence of diagnosed atrial fibrillation in adults: national implications for rhythm management and stroke prevention: the AnTicoagulation and Risk Factors in Atrial Fibrillation (ATRIA) Study.JAMA.2001;285(18):2370–2375.
- Atrial Fibrillation Investigators.Risk factors for stroke and efficacy of antithrombotic therapy in atrial fibrillation. Analysis of pooled data from five randomized controlled trials.Arch Intern Med.1994;154(13):1449–1457.
- ,,,.A population‐based study of the long‐term risks associated with atrial fibrillation: 20‐year follow‐up of the Renfrew/Paisley study.Am J Med.2002;113(5):359–364.
- ,,,,.The natural history of atrial fibrillation: incidence, risk factors, and prognosis in the Manitoba Follow‐Up Study.Am J Med.1995;98(5):476–484.
- ,,, et al.Comparison of carvedilol and metoprolol on clinical outcomes in patients with chronic heart failure in the Carvedilol Or Metoprolol European Trial (COMET): randomized controlled trial.Lancet.2003;362(9377):7–13.
- ,,, et al.Valsartan reduces the incidence of atrial fibrillation in patients with heart failure: results from the Valsartan Heart Failure Trial (Val‐HeFT).Am Heart J.2005;149(3):548–557.
- ,,,,.Impact of atrial fibrillation on mortality, stroke, and medical costs.Arch Intern Med.1998;158(3):229–234.
- ,,, et al.Cost of care distribution in atrial fibrillation patients: the COCAF study.Am Heart J.2004;147(1):121–126.
- ,,,,,.Serial antiarrhythmic drug treatment to maintain sinus rhythm after electrical cardioversion for chronic atrial fibrillation or atrial flutter.Am J Cardiol.1991;68(4):335–341.
- ,,, et al.Amiodarone to prevent recurrence of atrial fibrillation. Canadian Trial of Atrial Fibrillation Investigators.N Engl J Med.2000;342(13):913–920.
- ,,, et al.Chronic atrial fibrillation. Success of serial cardioversion therapy and safety of oral anticoagulation.Arch Intern Med.1996;156(22):2585–2592.
- ,,, et al.Circumferential pulmonary‐vein ablation for chronic atrial fibrillation.N Engl J Med.2006;354(9):934–941.
- ,.Atrial fibrillation: catheter ablation.J Interv Card Electrophysiol.2006;16(1):15–26.
- ,,.Progress in nonpharmacologic therapy of atrial fibrillation.J Cardiovasc Electrophysiol.2003;14(12 Suppl):S296–S309.
- ,,,,,.Survey of physician experience, trends and outcomes with atrial fibrillation ablation.J Interv Card Electrophysiol.2005;12(3):213–220.
- ,,, et al.Characteristics of patients undergoing atrial fibrillation ablation: trends over a seven‐year period 1999–2005.J Cardiovasc Electrophysiol.2007;18(1):23–28.
- ,,, et al.ACC/AHA/ESC 2006 Guidelines for the management of patients with atrial fibrillation: a report of the American College of Cardiology/American Heart Association Task Force on Practice Guidelines and the European Society of Cardiology Committee for Practice Guidelines (Writing Committee to Revise the 2001 Guidelines for the Management of Patients With Atrial Fibrillation): developed in collaboration with the European Heart Rhythm Association and the Heart Rhythm Society.Circulation.2006;114(7):e257–e354.
- ,,, et al.Safety and efficacy of radiofrequency energy catheter ablation of atrial fibrillation in patients with pacemakers and implantable cardiac defibrillators.Heart Rhythm.2005;2(12):1309–1316.
- ,,, et al.Worldwide survey on the methods, efficacy, and safety of catheter ablation for human atrial fibrillation.Circulation.2005;111(9):1100–1105.
- ,,,,,.Cost comparison of catheter ablation and medical therapy in atrial fibrillation.J Cardiovasc Electrophysiol.2007;18(9):907–913.
- ,,, et al.Radiofrequency ablation vs antiarrhythmic drugs as first‐line treatment of symptomatic atrial fibrillation: a randomized trial.JAMA.2005;293(21):2634–2640.
- ,,, et al.A randomized trial of circumferential pulmonary vein ablation versus antiarrhythmic drug therapy in paroxysmal atrial fibrillation: the APAF Study.J Am Coll Cardiol.2006;48(11):2340–2347.
- ,,.Atrial fibrillation in the elderly.Am J Med.2007;120(6):481–487.
- ,,,,,,.Catheter ablation for atrial fibrillation.Circulation.2007;116(13):1515–1523.
- ,,,,,.Prevalence of atrial fibrillation in elderly subjects (the Cardiovascular Health Study).Am J Cardiol.1994;74(3):236–241.
- ,,, et al.HRS/EHRA/ECAS Expert Consensus Statement on catheter and surgical ablation of atrial fibrillation: recommendations for personnel, policy, procedures and follow‐up. A report of the Heart Rhythm Society (HRS) Task Force on Catheter and Surgical Ablation of Atrial Fibrillation. European Heart Rhythm Association (EHRA), European Cardiac Arrhythmia Scoiety (ECAS), American College of Cardiology (ACC), American Heart Association (AHA), Society of Thoracic Surgeons (STS).Heart Rhythm.2007;4(6):816–861.
- U.S. Department of Health and Human Services, Public Health Service, National Center for Health Statistics National Hospital Discharge Survey 1990–2005. Multi‐Year Public‐Use Data File Documentation. Available at: http://www.cdc.gov/nchs/about/major/hdasd/nhds.htm. Accessed December2008.
- ,,,,,.Validation of clinical classification schemes for predicting stroke: results from the National Registry of Atrial Fibrillation.JAMA.2001;285(22):2864–2870.
- ,,,.Clinical outcomes after ablation and pacing therapy for atrial fibrillation: a meta‐analysis.Circulation.2000;101(10):1138–1144.
- ,,, et al.Catheter ablation for atrial fibrillation in congestive heart failure.N Engl J Med.2004;351(23):2373–2383.
Copyright © 2009 Society of Hospital Medicine

Training Opportunities for Academic Hospitalists
There is a growing demand for hospitalists in the United States. In academic settings, hospitalists are called on to perform a variety of duties, from leading quality improvement initiatives to serving on hospital committees to helping to offset restrictions on work hours of the house staff.1 Although hospitalists may be well positioned to take on these roles, obtaining adequate protected time and recognition for such contributions remains a challenge. The existing promotion and tenure processes at academic institutions may not give adequate consideration to such responsibilities. Hospitalists who do not meet the traditional benchmarks of teaching and research may suffer in their career advancement and, ultimately, in their desire to remain in academics. Developing a sustainable and long‐term career in hospital medicine is important not only from a professional developmental standpoint, but also because it may lead to better patient care; evidence from a large multicenter hospitalist study suggests that physician experience is linked to improved patient care and outcomes.2 Thus, it behooves academic medical centers that employ hospitalists to create rewarding hospitalist career paths.
Goldman described academic hospital medicine as comprising periods of systole, during which hospitalists provide clinical care, and periods of diastole, the portion of a hospitalist's time spent in nonclinical activities.3 Far from being a period of relaxation, diastole is an active component of a hospitalist's work, the time devoted to the pursuit of complementary interests, career advancement, and job diversity. A well‐thought‐out plan for the diastolic phase of a hospitalist job description can lead to significant improvement in quality, education, research, and outcomes for an academic medical center.4 A good balance of systole and diastole allows for focus on career development and advancement and has the potential to be very helpful in preventing burnout. This is of particular concern to academic hospitalists, who report working longer hours, feeling more stress, and worrying more about burnout than their nonhospitalist colleagues.5 This suggests the diastolic phase is an important part of creating a sustainable hospitalist job and should be funded as part of an academic hospitalist position.
Although the optimal balance of systole and diastole to prevent burnout is not known, outlining clear expectations is an important strategy for preparing physicians for a sustainable academic hospitalist career. This is an important issue, given the increasing number of residency graduates who are choosing careers in hospital medicine.6 Based on the reported career plans of residents taking internal medicine in‐training exams from 2002 through 2006, the number of residents going into hospital medicine has more than doubled, from 3% (in 2002) to 6.5% (in 2006). The goal of this article is to compare and contrast several career paths that balance systole and diastole in academic hospital medicine. Specifically, we review training opportunities for becoming a successful hospitalist‐educator, hospitalistquality expert, hospitalist‐investigator, and hospitalist‐administrator.
EDUCATION (THE HOSPITALIST‐EDUCATOR)
Hospitalists in academic centers often play central roles as teachers and leaders in medical education. This is not surprising given that most teaching of medical trainees occurs in the inpatient setting.7 Furthermore, several studies have consistently demonstrated that trainee satisfaction with teaching by hospitalists is high, and hospitalists are rated as more effective teachers than traditional subspecialist ward attendings.810
A typical hospitalist‐educator position is 80%‐90% clinical time, with 10%‐20% set aside for teaching. However, academic hospitalists are often expected to teach medical trainees concurrently with their clinical care activities, rather than during a separate, protected time.11 Thus, most hospitalist‐educator responsibilities do not occur during diastole, as may be conceived, but instead are add to the systole. Small amounts of protected diastolic time for a hospitalist‐educator can be used for related administrative activities, such as writing letters of recommendation, mentoring students and residents, doing creative thinking and curriculum development, and conducting educational research, such as evaluating a new educational program or curriculum. Some hospitalist‐educator positions, such as director of the residency program or internal medicine clerkship, are exceptions in that they generally include a greater amount of protected time, which may be earmarked for administrative activities and hands‐on teaching.
Education and Training
One possibility for advanced training in education is the addition of a chief resident year, either at a physician's own institution or at another academic center. Such a year provides an opportunity to consolidate knowledge, build a teaching portfolio, and accumulate expertise in an area such as evidence‐based medicine or perioperative care. Serving as a chief resident can enhance subsequent applications by being able to demonstrate the ability to teach and, more importantly, to assume a leadership role within an organization. These skills can be applied to a number of activities in an academic hospitalist program, such as heading a committee, teaching during inpatient service time, or developing a new course for students, residents, or faculty.
An advanced training program in medical education is also an option (Table 1). Offerings include medical education fellowship training, formal degree‐granting programs (such as a master's in health professions education), or short‐term intensive coursework. Fellowships and degree‐granting programs are generally 2‐year programs designed for health professionals who want to better prepare for educational leadership roles. Core topics include curriculum development, program evaluation, instruction, student assessment, current educational issues, research methods, and leadership. An alternative option for busy clinician‐educators is online or distance learning courses in medical education, which cover similar topics and skill sets. In early 2006 the Society of Hospital Medicine released the Core Competencies in Hospital Medicine, which can serve as a useful framework for developing novel inpatient curricula for faculty, residents, and students.12, 13
| Description | Length of time | Cost | Source/website |
|---|---|---|---|
| Degrees/fellowships | |||
| Master's in health professional education (MHPE): Preparation for educational leadership roles. Typical coursework in curriculum development, program evaluation, instruction, student assessment, current educational issues, research methods, and leadership. | Varies according to program | Tuition ranges from approximately $1500‐$4300 | Example: University of Illinois |
| Fellowship in medical education: Prepares faculty to pursue scholarship in medical education or educational leadership or to become effective teachers through workshops, coursework, and/or a mentored project. Often affiliated with a department of medical education. | Varies according to program. Generally 1 year. | Varies. May be subsidized in certain institutions as part of internal faculty development. | Example: University of Michigan |
| Short‐term coursework | |||
| Harvard Macy Institute: Programs designed to promote leadership and scholarship in medical education | 1‐ or 2‐week programs | Fees for the year 2006 are $4500 USD. | |
| Stanford Faculty Development Center (SFDC): Train‐the‐trainer approach for clinical teaching and professionalism in contemporary practice | 4‐week training sessions | The institutions of faculty selected for the month‐long training programs are asked to pay a fee of $5000. Transportation, housing and food are not included. | |
Short‐term extramural courses offered by institutions such as the Harvard Macy Institute for Medical Educators and the Stanford Faculty Development Program in Teaching can also provide advanced instruction to hospitalist‐educators.14, 15 In addition to these training programs, the Society of General Internal Medicine, along with other professional societies, offers career development workshops for clinician educators on topics such as curriculum development and teaching skills.
Regardless of the type of training, adequate mentorship and resources are critical to the successful application of new skills to the design or evaluation of hospital‐based curricula. Mentorship may be available from institutional leaders in medical education, even those not formally affiliated with the hospitalist program. For instance, medical school leaders, such as deans, division chiefs, chairpersons, program directors, and clerkship directors, can often be helpful in guiding junior faculty in obtaining skills and time for teaching.
We encourage those interested in a career in medical education to begin volunteering at their institution early on. Volunteering to directly teach residents and students (eg, assisting in introduction to clinical medicine, giving lectures to third‐year clerks) can be a valuable way of becoming distinguished as a qualified teacher. Likewise, joining a professional medical society of individuals with similar interests can facilitate mentorship and skill acquisition. Certain professional medical societies, such as the American College of Physicians, promote national recognition through awarding fellowships, an honor for those physicians who have demonstrated superior competence in internal medicine, professional accomplishment, and scholarship.16 Developing concrete examples of expertise in the field, such as through the publication of abstracts and articles on medical education and development of curricula, help lead to advancement in the educational track. Clear focus on a career path, development of an intellectual product, positive learner evaluation of educational activities, and national recognition can all be used by an academic institution to evaluate suitability for promotion.
Rewards and Challenges
One of the rewards of a hospitalist‐educator career is being able to meaningfully interact with a variety of trainees, including medical students and residents. As teaching attendings, hospitalist‐educators are likely to engage students and residents for short‐term but intensive periods, resulting in the ability to influence career choice and professional growth as a physician.17 Hospitalists may be called on by trainees to serve as mentors or advisers and to write letters of recommendation. In addition, with experience, hospitalist‐educators are well positioned to serve in administrative roles in medical education, such as clerkship director or program director.
Burnout is a particular concern for hospitalist‐educators, given the heavy clinical demands of inpatient academic service combined with the additional pressure to be academically productive.5 Because of this, it is important to design academic hospitalist‐educator positions with a diastole that contains time to recover from the heavy clinical demands of inpatient service, in addition to providing time for career development activities.
Successful career development as an educator can be difficult. There are relatively few venues at which educational work can be peer‐evaluated and published, which are keys to successful academic promotion.18 Because some educational journals are highly competitive, one possibility way to get educational work disseminated is through the MedEd Portal, sponsored by the Association of American Medical Colleges, which allows peer review of medical educational materials, including innovative curricula.19 In addition to original research contributions, many scientific meetings and medical education journals also accept descriptions of interesting clinical vignettes and innovations in medical education. New online education journals, such as BMC Medical Education and Seminars in Medical Practice, have expanded publication opportunities.20
Limited opportunities are available to help fund research in medical education. Although funding may be more readily available to educators who focus on a particular clinical entity or patient population, most medical education research is conducted with inadequate funding and requires extensive donated time by committed faculty.21 For this reason, securing advanced training in medical education and having protected time will allow hospitalists on the educator track to compete more successfully for limited educational research dollars and to have sufficient time to produce and publish scholarly work, thus improving their chances of academic success and career satisfaction.
CLINICAL QUALITY AND OPERATIONS IMPROVEMENT (THE HOSPITALISTQUALITY EXPERT)
Hospitalists are increasingly being called on to lead clinical quality and operations improvement at academic teaching hospitals. Benefits to the institution include the consistent presence of a committed physician who is able to plan and execute change in the context of clinical care. This is in contrast to the transient nature of residents and nonhospitalist attending physicians, whose ability to participate in such initiatives is impaired by the scheduling of their rotations. Hospitalists, however, are often able to cultivate long‐standing relationships with nurses, case managers, and hospital administrators, thereby building the institutional clout to lead such initiatives while considering views from all the necessary stakeholders.22 Thus, they are in a good position to serve as physician champions and expedite the adoption of new innovations within hospitalist groups and among other physician groups and clinical staff.23, 24
Education and Training
Being a successful agent of change requires knowledge of the science of quality improvement coupled with the skills necessary to make such changes, such as the ability to perform a needs assessment, to develop measures of performance, to negotiate and motivate others to change behaviors, to adopt new tools and practices, and to implement and test interventions designed to improve care. It is possible for residents or junior faculty members to gain this experience through designing and implementing a quality improvement project during residency training under the direction of a mentor.25, 26 However, given the likely variability in such experience, there is no substitute for formal training in these core areas of hospital medicine.
A broad range of opportunities for advanced training in quality and operations improvement are available (Table 2). Choosing the correct program may depend on baseline expertise, availability, and the desired level of involvement. For example, introductions to these skills can be obtained through precourses or workshops at medical conferences such as the Institute of Healthcare Improvement or the Society of Hospital Medicine. For more in‐depth training, the Advanced Training Program (ATP) in Health Care Delivery Improvement, sponsored by Intermountain Healthcare, offers 12‐ to 21‐day in‐depth minicourses designed to train individuals for leadership positions in quality and safety.27 Lastly, more structured fellowships, such as the Veterans Affairs Quality Scholars Program or the George W. Merck Fellowships in Health Care Improvement, offer junior and midcareer faculty the opportunity to obtain formal training in the science of quality improvement.28, 29 Because early‐career hospitalists may face geographic and financial restrictions, exploration of local or institutional opportunities for advanced education in quality improvement can be particularly important.
| Description | Length of time | Cost | Source/website |
|---|---|---|---|
| Degrees/fellowships | |||
| Veterans Association National Quality Scholars: Fellowship to learn and apply knowledge for improvement of health care | 2 years | No cost, application to fellowship program required | |
| George W. Merck Fellowship: Mentored research or improvement project at Institute of Healthcare Improvement with a plan to return to home institution to execute change | 1 year | No cost, application to fellowship program required | |
| Short‐term coursework | |||
| Intermountain Health Care: Designed to give executives and quality improvement leaders the necessary tools to conduct clinical practice improvement projects. | 20‐ and 12‐day training programs in Salt Lake City, UT | Tuition for the 20‐day program:
| |
Rewards and Challenges
Engaging in successful clinical or process improvement can be very rewarding, both professionally and personally. Professional gains include building new interdisciplinary relationships and infrastructure to continually monitor and improve key performance measures. In addition, a rigorous evaluation of this type of work can result in being able to make presentations at national meetings or to be published in a variety of peer‐reviewed medical journals, including specialty journals for quality improvement work, such as Quality and Safety in Healthcare and the Joint Commission Journal on Quality Improvement. Many national medical meetings, such as the Institute for Healthcare Improvement, the Society of Hospital Medicine and other subspecialty society meetings, also provide an opportunity to showcase innovations in practice.
Despite the potential rewards, it can also be challenging for academic hospitalists to participate in or lead quality improvement projects. One major challenge is ensuring that hospitalists are engaged in improvement work that is aligned with the interests of the hospital. Because most hospital administrators and frontline staff are employed by the hospital, whereas those comprising the academic faculty are employed by the university, this alignment is not always guaranteed. For example, an area of interest to a hospitalist that also could lead to academic productivity and career advancement might not be considered a priority area of improvement for the hospital because of competing clinical or operations improvements. In this scenario, it can be extremely difficult to engage other stakeholders such as nurses or administrative support staff in order to make a meaningful, sustainable change or improvement. To avoid this situation, it can be helpful from the outset to partner with hospital quality leaders in discussing priority areas, with attention to any potential interface in which hospitalist expertise is needed. In the event a potential project or area is identified, a hospitalist is particularly well positioned to serve as a physician champion, which is often key to the success of any hospitalwide initiative. In some cases, hospital funding may be available for these types of initiatives, increasing the likelihood of resource development for sustainable change.
RESEARCH (THE HOSPITALIST‐INVESTIGATOR)
Few hospitalists devote most of their time to clinical research. Having a strong research base is essential for the field of hospital medicine to gain credibility as a distinct specialty.4 Although the initial research in hospital medicine sought to prove the value of the field itself, hospitalists have now begun to focus on quality improvement and outcomes research.3032 Because of their unique position in clinical care, hospitalists are well situated to oversee inpatient data collection and perform research on a variety of conditions ranging from acute coronary syndromes to venous thromboembolism. Another potential area of research for hospitalists is participation in clinical trials focused on the inpatient setting. Although the proportion of time spent in research can vary widely, to become an independently successful clinical researcher typically requires a substantial amount of time be devoted to research. In general, at least 50% protected time, greater if possible, is recommended.
Education and Training
To develop a career around research generally requires advanced training in research methods. The most frequently used option for obtaining such training is through completing a clinical research fellowship in general internal medicine or an equivalent program, such as the fellowships administered by the Robert Wood Johnson Clinical Scholars Program (Table 3).33 Several academic centers also have developed such hospital medicine fellowships, which often can be tailored to provide the desired experience in research ethics, methodology, and statistical analysis.34, 35 In selecting a training program, prospective hospitalist‐researchers should consider the availability of suitable research mentors. Because hospital medicine as a field is relatively new, research mentors within the group of hospitalists may be scarce; if so, researchers should seek appropriate mentorship from established investigators in other programs or departments. Effective mentorship is a strong predictor of future research success.36
| Description | Length of time | Cost | Source/website |
|---|---|---|---|
| Degrees/fellowships | |||
| Hospital or General Medicine Fellowships: Designed to provide clinical research training through mentored projects and coursework with possible master's degree | Generally 2‐year programs | No cost, application to program is required. Stipends vary. No cost, application to program is required | Hospital Medicine: |
| Robert Wood Johnson Clinical‐Scholars Program: Training in health services research with an emphasis on community‐based research and leadership training. | 2 years | Stipends currently range from $48,000 to $50,000 per year, depending on the training site. | Robert Wood Johnson: |
| Short‐term coursework | |||
| University‐based summer programs in clinical research (eg, Harvard University Summer Session for Public Health Studies which features graduate courses in epidemiology, biostatistics, economics, health care management, etc.) | Intensive 3‐week courses in Harvard University Summer Session | 2004 tuition for each 2.5‐credit course was $1830. There is a nonrefundable deposit/registration fee of $125. These fees do not include certain course materials (ie, texts estimated at $60 per course). | Example: Harvard School of Public Health |
Negotiating protected time can be challenging for new investigators, particularly when hospitalist salaries are generated by clinical activity. Some academic programs are willing to provide a few years of departmental support to promising young investigators in order to allow them to develop their research program and obtain additional funding. Several career development awards are available through the National Institutes of Health and through nonfederally funded sources.37, 38 These awards generally protect 3‐5 years of a researcher's time for research and require that a substantial proportion of time be devoted to that purpose, often at least 75%.
To gain visibility as a researcher, it is advantageous to present original findings at national meetings, such as those of the Society of Hospital Medicine, the Society of General Internal Medicine, and other subspecialty meetings.39, 40 These meetings not only increase awareness of a hospitalist's research but also provide opportunities for networking and developing collaboration on research. Many societies, including the Society of Hospital Medicine, have research abstract competitions and offer research grants for investigators that can help to fund projects and support protected time.
Rewards and Challenges
There are many rewards and opportunities for a hospitalist investigator, particularly because the field is young and there are many unanswered research questions related to inpatient medicine. There are also the intrinsic rewards of being devoted to scientific inquiry and having greater autonomy over how time is spent. A hospitalist's schedule can be well suited to research. Although attending on the wards can be very time‐consuming, time off the wards is often free of outpatient duties and can be entirely devoted to research.
There are also several challenges to becoming a successful researcher. The pressure to obtain grant funding and publish high‐quality scientific manuscripts is high. Obtaining sufficient protected time may be difficult in busy clinical departments, and applying for grant funding is both time‐consuming and highly competitive. It is very important to be familiar with the specific criteria for academic promotion at one's institution. Understanding these expectations can help to effectively prioritize activities. Standard requirements generally include number and quality of articles published in peer‐reviewed journals, successful application for research funding, national recognition in the field, service to the institution and research community, and evidence of research independence. One significant challenge is the lack of a single large funding source for hospital‐related research. Although the Agency for Healthcare Research and Quality funds studies related to hospital care, such as on the quality of care or cost effectiveness of various system‐based hospital care interventions, their budget for investigator‐initiated proposals is limited.41 One promising funding source for research in hospital care is from agencies and foundations dedicated to the aging population, such as the National Institute for Aging (NIA), the Hartford Foundation, and the Aetna Foundation, to name a few.42, 43 Yet research on hospital care alone, without detailed attention to issues unique to geriatric‐specific conditions or populations, is unlikely to be funded by these avenues. With few federal grant programs directly suited to the emerging research agenda in hospital medicine, hospitalist‐investigators may be at a disadvantage for obtaining tenure‐track positions, compared with their subspecialist colleagues, who may receive funding from NIH agencies or foundations dedicated to their own field.
ADMINISTRATION (THE HOSPITALIST‐ADMINISTRATOR)
Physician leaders in hospital administration are not new. Many hospitals already include physicians in senior management positions, such as chief medical officer.44 Naturally, a career in hospital administration is another potential path for diastole in academic medical centers.
Education and Training
Although a master of business, health administration, or medical management is not a prerequisite for the physician who wants to move into management, it is an increasingly important credential for senior administrative positions (Table 4). Primarily, it serves as a signal that a physician is committed to management and has a working knowledge of strategic planning, business models, human resources, leadership, and clinical operations. For physicians without formal business training who are interested in management, exploring internal opportunities is a necessary first step. Likewise, getting a business degree is not as important as management experience. The successful application of business skills requires practice, mentoring, and on‐the‐job experience. For hospitalists, this experience could be obtained by volunteering to serve on committees such as utilization review, quality assurance, credentialing, or medical staff executive committees. In lieu of a graduate degree, physicians may wish to participate in one of the many fellowships in health services administration. These programs generally aim to provide practical mentored learning experience in a health care organization and may last up to 2 years.45
| Description | Length of time | Cost | Source/website |
|---|---|---|---|
| Degrees/fellowships | |||
| Master's in business administration (MBA): General management core with option for courses specializing in health care. | Generally 2‐year program | Varies in accordance with each institution. | Directory websites (MBA): |
| Master's in health administration (MHA): Studies in analytic and management needs of health care. | Generally 2‐year program | Varies in accordance with each institution. | Directory websites (MHA): |
| Fellowship in health services administration: Preceptor‐directed program that provides practical learning experience in a health care organization beyond graduate‐level academic instruction. | Usually lasts 1‐2 years. | Compensation varies. Median reported as $39,055. | Directory (American College of Healthcare Executives): |
| Short‐term coursework | |||
| Society of Hospital Medicine Leadership Academy: Instruction for hospitalists in leading change, communicating effectively, handling conflict and negotiation, doing strategic planning, and interpreting hospital business drivers. Held biannually. | 3‐ to 4‐day program | $1400‐$1600. Discounted rate for members of Society of Hospital Medicine | |
For hospitalists and trainees considering a career as an executive, the American College of Physician Executives can serve as a valuable resource.46 This organization, founded in 1975, offers educational resources, including publications, comprehensive CD‐ROM products, and 1‐day courses and master's degree programs in conjunction with several leading business schools in medical management. In addition, the Society of Hospital Medicine offers a Leadership Academy designed to assist practicing hospitalists in evaluating their leadership strengths and applying them to everyday management challenges.47 Such a program also can facilitate the development of a peer network and the mentoring relationships needed to achieve these goals.
Rewards and Challenges
The life of the physician executive can be rewarding, but making the transition may prove challenging. However, if physicians can navigate this transition successfully, they will likely find a wide array of opportunities, as demand for physician‐executives remains high.
One major challenge to becoming a physician‐executive is reconciling the administrative role with the initial desire to enter a career in clinical medicine.48 Physician‐executives who continue to see patients are more likely to be satisfied with their jobs than physician‐executives who do not.49 Physician‐executives also may feel they are being criticized by their purely clinical colleagues for working in the business or management of medicine.50 Actual or perceived lack of support may promote isolation and burnout.51 In addition, the constantly shifting landscape of health care administration results in a much more unstable environment than that found in clinical medicine. For example, the risk of termination for a physician‐executive is 20‐40 times higher than that for a practicing physician.50 The reasons for this higher risk include personal conflict with a boss, reorganization (ie, downsizing, merging, etc.), and immediate departure of a supervisor. Access to mentors, support groups, and the option to practice part time are all potential mechanisms to ensure long‐term success as a physician‐administrator.
CONCLUSIONS
As hospital medicine continues to grow and evolve, designing sustainable and rewarding academic careers will be crucial to the success of the field. Being able to balance clinical systole time with obtaining the skills to support nonclinical diastole time is important to ensuring a successful career as an academic hospitalist. We have described several possible career paths in teaching, research, quality improvement, and administration. By preparing future hospitalists with the knowledge and skills required to assume a variety of roles during their diastolic time, we hope to encourage the growth of hospitalist leaders with well‐developed skill sets. If hospitalists adequately prepare themselves, academic hospital medicine will likely remain sustainable and rewarding, and future generations of trainees will be inspired and prepared to enter the field.
Acknowledgements
We are grateful to Jennifer Higa and Kimberly Alvarez for their assistance in preparing this manuscript.
- ,,.Balancing continuity of care with residents' limited work hours: defining the implications.Acad Med.2005;80:39–43.
- ,,, et al.Effects of inpatient experience on outcomes and costs in a multicenter trial of academic hospitalists.J Gen Intern Med.2005;20(s1):141–142.
- .The hospitalist movement.Ann Intern Med.1999;131:545.
- .The future of hospital medicine: evolution or revolution?Am J Med.2004;117:446–450.
- ,,, et al.Satisfaction and worklife of academic hospitalist and non‐hospitalist attendings on general medical inpatient rotations.J Gen Intern Med.2006;21(s4):128.
- ,,.Career plans for trainees in internal medicine residency programs.Acad Med.2005;80:507–512.
- ,,,,.Closing the gap between internal medicine training and practice: recommendations from recent graduates.Amer J Med.2005;118:680–687.
- ,,, et al..Hospitalists as teachers.J Gen Intern Med.2004;19(1):8–15.
- ,.Implications of the hospitalist model for medical students' education.Acad Med.2001;76:324–330.
- ,,,,,.Resident satisfaction on an academic hospitalist service: time to teach.Am J Med.2002;112:597–601.
- ,.The present and future of appointment, tenure, and compensation policies for medical school clinical faculty.Acad Med.2001;76:993–1004.
- ,,,,.Core competencies in hospital medicine: development and methodology.J Hosp Med.2006;1(1):48–56.
- ,,,,.The core competencies in hospital medicine.J Hosp Med.2006;1(1).
- Harvard Macy Institute. Harvard College. Available at: http://www.harvardmacy.org/programs.asp?DocumentID=1. Accessed October 3,2005.
- Stanford Faculty Development Center. Stanford University. Available at http://sfdc.stanford.edu/. Accessed January 23,2006.
- American College of Physicians. Available at: http://www.acponline.org/college/membership/classes.htm#fellow. Accessed June 10,2006
- ,,, et al.Effect of the inpatient general medicine rotation on student pursuit of a generalist career.J Gen Intern Med.2006;21:471–475.
- ,.Graduate medical education research in the 21st century and JAMA on call.JAMA.2004;292:2913–2915.
- Association of American Medical Colleges. MedEd (PORTAL); Providing Online Resources to Advance Learning in Medical Education. Available at: http://www.aamc.org/meded/mededportal/start.htm. Accessed January 23,2006.
- BioMed Central. BMC Medical Education. Available at: http://www.biomedcentral.com/bmcmededuc/.Accessed January 23,2006.
- ,,,.Costs and funding for published medical education research.JAMA.2005;294(9):1052–7.
- .Teamwork and hospital medicine. A vision for the future.Crit Care Nurse.2003;23(3):8,10–11.
- . (1995)Diffusion of Innovations.4th ed.The Free Press:,Toronto.
- ,,.Clarifying the concepts in knowledge transfer: a literature review.J Adv Nurs.2006;53:691–701.
- ,,,,.Creating a quality improvement elective for medical house officers.J Gen Intern Med.2004;19:861–867.
- ,,.A continuous quality improvement curriculum for residents: addressing core competency, improving systems.Acad Med.2004;79(10 Suppl):S65–7.
- Institute for Healthcare Delivery Research. Advanced Training Program in Health Care Delivery Improvement (ATP). Available at: http://www.ihc.com/xp/ihc/institute/education/atp/. Accessed October 3,2005.
- Veterans Health Administration. VA Quality Scholars Program. Available at: http://www.dartmouth.edu/∼cecs/fellowships/vaqs.html
- Institute for Healthcare Improvement. George W. Merck Fellowships. Available at: http://www.ihi.org/ihi. Accessed October 3,2005.
- ,,, et al.Effects of physician experience on costs and outcomes on an academic general medicine service: results of a trial of hospitalists.Ann Intern Med.2002;137:866–874.
- ,,,,,.Implementation of a voluntary hospitalist service at a community teaching hospital: improved clinical efficiency and patient outcomes.Ann Intern Med.2002;137:859–865.
- ,.The hospitalist movement 5 years later.JAMA.2002;287:487–494.
- Robert Wood Johnson Clinical Scholars Program. Stanford University (Palo Alto, CA). Available at: http://rwjcsp.stanford.edu/. Accessed October 3,2005.
- ,.Hospital Medicine Fellowship Update.Society of Hospital Medicine.The Hospitalist.2004;8(5):38.
- ,,,.Hospital medicine fellowships: works in progress.Am J Med.2006;119(1):72.e1–e7.
- ,,, et al.Mentorship in Academic General Internal Medicine.J Gen Intern Med.2005;2(34):1–5.
- ,,,,.Getting funded. Career development awards for aspiring clinical investigators.J Gen Intern Med.2004;19(5 Pt 1):472–478.
- K Kiosk—Information about NIH Career Development Awards. Available at: http://grants.nih.gov/training/careerdevelopmentawards.htm. Accessed March 20,2006.
- Research Career Development Awards for Junior Faculty and Fellows in General Internal Medicine. Available at: http://www.sgim.org/careerdevelopment.cfm. Accessed March 24,2006.
- Society of Hospital Medicine. Available at: http://www.hospitalmedicine.org//AM/Template.cfm?Section=Home. Accessed October 4,2005.
- ,.What is an academic general internist? Career options and training pathways.JAMA.2002;288:2045–2048.
- U.S. National Institutes of Health.National Institute on Aging. Available at: http://www.nia.nih.gov/. Accessed January 25,2006.
- .Hartford Foundation. Available from: http://www.jhartfound.org/. Accessed January 25,2006.
- .Why will physicians in this new environment replace MHAs?Physician Exec.1996;22(2):5–10.
- Directory of Fellowships in Health Services Administration. Available at: http://www.ache.org/pgfd/purpose.cfm. Accessed March 24,2006.
- American College of Physician Executives. Available at: http://www.acpe.org/. Accessed October 3,2005.
- Society of Hospital Medicine. Leadership Academy statement. Available at: http://www.hospitalmedicine.org/AM/Template.cfm?Section=Search_Advanced_Search6(7):37–40.
- ,,,.Satisfaction higher for physician executives who treat patients, survey finds.Physician Exec.2002;28(3):17–21.
- .Physician executives don't have to go it alone.Managed Care Magazine.2003. Available at: http://www.managedcaremag.com/archives/0307/0307.viewpoint_lazarus.html.Accessed January 25,year="2006"2006.
- .Controlled burn! Physician executives must be ready to handle job burnout, career stress.Physician Exec.2001;27(4):42–45.
There is a growing demand for hospitalists in the United States. In academic settings, hospitalists are called on to perform a variety of duties, from leading quality improvement initiatives to serving on hospital committees to helping to offset restrictions on work hours of the house staff.1 Although hospitalists may be well positioned to take on these roles, obtaining adequate protected time and recognition for such contributions remains a challenge. The existing promotion and tenure processes at academic institutions may not give adequate consideration to such responsibilities. Hospitalists who do not meet the traditional benchmarks of teaching and research may suffer in their career advancement and, ultimately, in their desire to remain in academics. Developing a sustainable and long‐term career in hospital medicine is important not only from a professional developmental standpoint, but also because it may lead to better patient care; evidence from a large multicenter hospitalist study suggests that physician experience is linked to improved patient care and outcomes.2 Thus, it behooves academic medical centers that employ hospitalists to create rewarding hospitalist career paths.
Goldman described academic hospital medicine as comprising periods of systole, during which hospitalists provide clinical care, and periods of diastole, the portion of a hospitalist's time spent in nonclinical activities.3 Far from being a period of relaxation, diastole is an active component of a hospitalist's work, the time devoted to the pursuit of complementary interests, career advancement, and job diversity. A well‐thought‐out plan for the diastolic phase of a hospitalist job description can lead to significant improvement in quality, education, research, and outcomes for an academic medical center.4 A good balance of systole and diastole allows for focus on career development and advancement and has the potential to be very helpful in preventing burnout. This is of particular concern to academic hospitalists, who report working longer hours, feeling more stress, and worrying more about burnout than their nonhospitalist colleagues.5 This suggests the diastolic phase is an important part of creating a sustainable hospitalist job and should be funded as part of an academic hospitalist position.
Although the optimal balance of systole and diastole to prevent burnout is not known, outlining clear expectations is an important strategy for preparing physicians for a sustainable academic hospitalist career. This is an important issue, given the increasing number of residency graduates who are choosing careers in hospital medicine.6 Based on the reported career plans of residents taking internal medicine in‐training exams from 2002 through 2006, the number of residents going into hospital medicine has more than doubled, from 3% (in 2002) to 6.5% (in 2006). The goal of this article is to compare and contrast several career paths that balance systole and diastole in academic hospital medicine. Specifically, we review training opportunities for becoming a successful hospitalist‐educator, hospitalistquality expert, hospitalist‐investigator, and hospitalist‐administrator.
EDUCATION (THE HOSPITALIST‐EDUCATOR)
Hospitalists in academic centers often play central roles as teachers and leaders in medical education. This is not surprising given that most teaching of medical trainees occurs in the inpatient setting.7 Furthermore, several studies have consistently demonstrated that trainee satisfaction with teaching by hospitalists is high, and hospitalists are rated as more effective teachers than traditional subspecialist ward attendings.810
A typical hospitalist‐educator position is 80%‐90% clinical time, with 10%‐20% set aside for teaching. However, academic hospitalists are often expected to teach medical trainees concurrently with their clinical care activities, rather than during a separate, protected time.11 Thus, most hospitalist‐educator responsibilities do not occur during diastole, as may be conceived, but instead are add to the systole. Small amounts of protected diastolic time for a hospitalist‐educator can be used for related administrative activities, such as writing letters of recommendation, mentoring students and residents, doing creative thinking and curriculum development, and conducting educational research, such as evaluating a new educational program or curriculum. Some hospitalist‐educator positions, such as director of the residency program or internal medicine clerkship, are exceptions in that they generally include a greater amount of protected time, which may be earmarked for administrative activities and hands‐on teaching.
Education and Training
One possibility for advanced training in education is the addition of a chief resident year, either at a physician's own institution or at another academic center. Such a year provides an opportunity to consolidate knowledge, build a teaching portfolio, and accumulate expertise in an area such as evidence‐based medicine or perioperative care. Serving as a chief resident can enhance subsequent applications by being able to demonstrate the ability to teach and, more importantly, to assume a leadership role within an organization. These skills can be applied to a number of activities in an academic hospitalist program, such as heading a committee, teaching during inpatient service time, or developing a new course for students, residents, or faculty.
An advanced training program in medical education is also an option (Table 1). Offerings include medical education fellowship training, formal degree‐granting programs (such as a master's in health professions education), or short‐term intensive coursework. Fellowships and degree‐granting programs are generally 2‐year programs designed for health professionals who want to better prepare for educational leadership roles. Core topics include curriculum development, program evaluation, instruction, student assessment, current educational issues, research methods, and leadership. An alternative option for busy clinician‐educators is online or distance learning courses in medical education, which cover similar topics and skill sets. In early 2006 the Society of Hospital Medicine released the Core Competencies in Hospital Medicine, which can serve as a useful framework for developing novel inpatient curricula for faculty, residents, and students.12, 13
| Description | Length of time | Cost | Source/website |
|---|---|---|---|
| Degrees/fellowships | |||
| Master's in health professional education (MHPE): Preparation for educational leadership roles. Typical coursework in curriculum development, program evaluation, instruction, student assessment, current educational issues, research methods, and leadership. | Varies according to program | Tuition ranges from approximately $1500‐$4300 | Example: University of Illinois |
| Fellowship in medical education: Prepares faculty to pursue scholarship in medical education or educational leadership or to become effective teachers through workshops, coursework, and/or a mentored project. Often affiliated with a department of medical education. | Varies according to program. Generally 1 year. | Varies. May be subsidized in certain institutions as part of internal faculty development. | Example: University of Michigan |
| Short‐term coursework | |||
| Harvard Macy Institute: Programs designed to promote leadership and scholarship in medical education | 1‐ or 2‐week programs | Fees for the year 2006 are $4500 USD. | |
| Stanford Faculty Development Center (SFDC): Train‐the‐trainer approach for clinical teaching and professionalism in contemporary practice | 4‐week training sessions | The institutions of faculty selected for the month‐long training programs are asked to pay a fee of $5000. Transportation, housing and food are not included. | |
Short‐term extramural courses offered by institutions such as the Harvard Macy Institute for Medical Educators and the Stanford Faculty Development Program in Teaching can also provide advanced instruction to hospitalist‐educators.14, 15 In addition to these training programs, the Society of General Internal Medicine, along with other professional societies, offers career development workshops for clinician educators on topics such as curriculum development and teaching skills.
Regardless of the type of training, adequate mentorship and resources are critical to the successful application of new skills to the design or evaluation of hospital‐based curricula. Mentorship may be available from institutional leaders in medical education, even those not formally affiliated with the hospitalist program. For instance, medical school leaders, such as deans, division chiefs, chairpersons, program directors, and clerkship directors, can often be helpful in guiding junior faculty in obtaining skills and time for teaching.
We encourage those interested in a career in medical education to begin volunteering at their institution early on. Volunteering to directly teach residents and students (eg, assisting in introduction to clinical medicine, giving lectures to third‐year clerks) can be a valuable way of becoming distinguished as a qualified teacher. Likewise, joining a professional medical society of individuals with similar interests can facilitate mentorship and skill acquisition. Certain professional medical societies, such as the American College of Physicians, promote national recognition through awarding fellowships, an honor for those physicians who have demonstrated superior competence in internal medicine, professional accomplishment, and scholarship.16 Developing concrete examples of expertise in the field, such as through the publication of abstracts and articles on medical education and development of curricula, help lead to advancement in the educational track. Clear focus on a career path, development of an intellectual product, positive learner evaluation of educational activities, and national recognition can all be used by an academic institution to evaluate suitability for promotion.
Rewards and Challenges
One of the rewards of a hospitalist‐educator career is being able to meaningfully interact with a variety of trainees, including medical students and residents. As teaching attendings, hospitalist‐educators are likely to engage students and residents for short‐term but intensive periods, resulting in the ability to influence career choice and professional growth as a physician.17 Hospitalists may be called on by trainees to serve as mentors or advisers and to write letters of recommendation. In addition, with experience, hospitalist‐educators are well positioned to serve in administrative roles in medical education, such as clerkship director or program director.
Burnout is a particular concern for hospitalist‐educators, given the heavy clinical demands of inpatient academic service combined with the additional pressure to be academically productive.5 Because of this, it is important to design academic hospitalist‐educator positions with a diastole that contains time to recover from the heavy clinical demands of inpatient service, in addition to providing time for career development activities.
Successful career development as an educator can be difficult. There are relatively few venues at which educational work can be peer‐evaluated and published, which are keys to successful academic promotion.18 Because some educational journals are highly competitive, one possibility way to get educational work disseminated is through the MedEd Portal, sponsored by the Association of American Medical Colleges, which allows peer review of medical educational materials, including innovative curricula.19 In addition to original research contributions, many scientific meetings and medical education journals also accept descriptions of interesting clinical vignettes and innovations in medical education. New online education journals, such as BMC Medical Education and Seminars in Medical Practice, have expanded publication opportunities.20
Limited opportunities are available to help fund research in medical education. Although funding may be more readily available to educators who focus on a particular clinical entity or patient population, most medical education research is conducted with inadequate funding and requires extensive donated time by committed faculty.21 For this reason, securing advanced training in medical education and having protected time will allow hospitalists on the educator track to compete more successfully for limited educational research dollars and to have sufficient time to produce and publish scholarly work, thus improving their chances of academic success and career satisfaction.
CLINICAL QUALITY AND OPERATIONS IMPROVEMENT (THE HOSPITALISTQUALITY EXPERT)
Hospitalists are increasingly being called on to lead clinical quality and operations improvement at academic teaching hospitals. Benefits to the institution include the consistent presence of a committed physician who is able to plan and execute change in the context of clinical care. This is in contrast to the transient nature of residents and nonhospitalist attending physicians, whose ability to participate in such initiatives is impaired by the scheduling of their rotations. Hospitalists, however, are often able to cultivate long‐standing relationships with nurses, case managers, and hospital administrators, thereby building the institutional clout to lead such initiatives while considering views from all the necessary stakeholders.22 Thus, they are in a good position to serve as physician champions and expedite the adoption of new innovations within hospitalist groups and among other physician groups and clinical staff.23, 24
Education and Training
Being a successful agent of change requires knowledge of the science of quality improvement coupled with the skills necessary to make such changes, such as the ability to perform a needs assessment, to develop measures of performance, to negotiate and motivate others to change behaviors, to adopt new tools and practices, and to implement and test interventions designed to improve care. It is possible for residents or junior faculty members to gain this experience through designing and implementing a quality improvement project during residency training under the direction of a mentor.25, 26 However, given the likely variability in such experience, there is no substitute for formal training in these core areas of hospital medicine.
A broad range of opportunities for advanced training in quality and operations improvement are available (Table 2). Choosing the correct program may depend on baseline expertise, availability, and the desired level of involvement. For example, introductions to these skills can be obtained through precourses or workshops at medical conferences such as the Institute of Healthcare Improvement or the Society of Hospital Medicine. For more in‐depth training, the Advanced Training Program (ATP) in Health Care Delivery Improvement, sponsored by Intermountain Healthcare, offers 12‐ to 21‐day in‐depth minicourses designed to train individuals for leadership positions in quality and safety.27 Lastly, more structured fellowships, such as the Veterans Affairs Quality Scholars Program or the George W. Merck Fellowships in Health Care Improvement, offer junior and midcareer faculty the opportunity to obtain formal training in the science of quality improvement.28, 29 Because early‐career hospitalists may face geographic and financial restrictions, exploration of local or institutional opportunities for advanced education in quality improvement can be particularly important.
| Description | Length of time | Cost | Source/website |
|---|---|---|---|
| Degrees/fellowships | |||
| Veterans Association National Quality Scholars: Fellowship to learn and apply knowledge for improvement of health care | 2 years | No cost, application to fellowship program required | |
| George W. Merck Fellowship: Mentored research or improvement project at Institute of Healthcare Improvement with a plan to return to home institution to execute change | 1 year | No cost, application to fellowship program required | |
| Short‐term coursework | |||
| Intermountain Health Care: Designed to give executives and quality improvement leaders the necessary tools to conduct clinical practice improvement projects. | 20‐ and 12‐day training programs in Salt Lake City, UT | Tuition for the 20‐day program:
| |
Rewards and Challenges
Engaging in successful clinical or process improvement can be very rewarding, both professionally and personally. Professional gains include building new interdisciplinary relationships and infrastructure to continually monitor and improve key performance measures. In addition, a rigorous evaluation of this type of work can result in being able to make presentations at national meetings or to be published in a variety of peer‐reviewed medical journals, including specialty journals for quality improvement work, such as Quality and Safety in Healthcare and the Joint Commission Journal on Quality Improvement. Many national medical meetings, such as the Institute for Healthcare Improvement, the Society of Hospital Medicine and other subspecialty society meetings, also provide an opportunity to showcase innovations in practice.
Despite the potential rewards, it can also be challenging for academic hospitalists to participate in or lead quality improvement projects. One major challenge is ensuring that hospitalists are engaged in improvement work that is aligned with the interests of the hospital. Because most hospital administrators and frontline staff are employed by the hospital, whereas those comprising the academic faculty are employed by the university, this alignment is not always guaranteed. For example, an area of interest to a hospitalist that also could lead to academic productivity and career advancement might not be considered a priority area of improvement for the hospital because of competing clinical or operations improvements. In this scenario, it can be extremely difficult to engage other stakeholders such as nurses or administrative support staff in order to make a meaningful, sustainable change or improvement. To avoid this situation, it can be helpful from the outset to partner with hospital quality leaders in discussing priority areas, with attention to any potential interface in which hospitalist expertise is needed. In the event a potential project or area is identified, a hospitalist is particularly well positioned to serve as a physician champion, which is often key to the success of any hospitalwide initiative. In some cases, hospital funding may be available for these types of initiatives, increasing the likelihood of resource development for sustainable change.
RESEARCH (THE HOSPITALIST‐INVESTIGATOR)
Few hospitalists devote most of their time to clinical research. Having a strong research base is essential for the field of hospital medicine to gain credibility as a distinct specialty.4 Although the initial research in hospital medicine sought to prove the value of the field itself, hospitalists have now begun to focus on quality improvement and outcomes research.3032 Because of their unique position in clinical care, hospitalists are well situated to oversee inpatient data collection and perform research on a variety of conditions ranging from acute coronary syndromes to venous thromboembolism. Another potential area of research for hospitalists is participation in clinical trials focused on the inpatient setting. Although the proportion of time spent in research can vary widely, to become an independently successful clinical researcher typically requires a substantial amount of time be devoted to research. In general, at least 50% protected time, greater if possible, is recommended.
Education and Training
To develop a career around research generally requires advanced training in research methods. The most frequently used option for obtaining such training is through completing a clinical research fellowship in general internal medicine or an equivalent program, such as the fellowships administered by the Robert Wood Johnson Clinical Scholars Program (Table 3).33 Several academic centers also have developed such hospital medicine fellowships, which often can be tailored to provide the desired experience in research ethics, methodology, and statistical analysis.34, 35 In selecting a training program, prospective hospitalist‐researchers should consider the availability of suitable research mentors. Because hospital medicine as a field is relatively new, research mentors within the group of hospitalists may be scarce; if so, researchers should seek appropriate mentorship from established investigators in other programs or departments. Effective mentorship is a strong predictor of future research success.36
| Description | Length of time | Cost | Source/website |
|---|---|---|---|
| Degrees/fellowships | |||
| Hospital or General Medicine Fellowships: Designed to provide clinical research training through mentored projects and coursework with possible master's degree | Generally 2‐year programs | No cost, application to program is required. Stipends vary. No cost, application to program is required | Hospital Medicine: |
| Robert Wood Johnson Clinical‐Scholars Program: Training in health services research with an emphasis on community‐based research and leadership training. | 2 years | Stipends currently range from $48,000 to $50,000 per year, depending on the training site. | Robert Wood Johnson: |
| Short‐term coursework | |||
| University‐based summer programs in clinical research (eg, Harvard University Summer Session for Public Health Studies which features graduate courses in epidemiology, biostatistics, economics, health care management, etc.) | Intensive 3‐week courses in Harvard University Summer Session | 2004 tuition for each 2.5‐credit course was $1830. There is a nonrefundable deposit/registration fee of $125. These fees do not include certain course materials (ie, texts estimated at $60 per course). | Example: Harvard School of Public Health |
Negotiating protected time can be challenging for new investigators, particularly when hospitalist salaries are generated by clinical activity. Some academic programs are willing to provide a few years of departmental support to promising young investigators in order to allow them to develop their research program and obtain additional funding. Several career development awards are available through the National Institutes of Health and through nonfederally funded sources.37, 38 These awards generally protect 3‐5 years of a researcher's time for research and require that a substantial proportion of time be devoted to that purpose, often at least 75%.
To gain visibility as a researcher, it is advantageous to present original findings at national meetings, such as those of the Society of Hospital Medicine, the Society of General Internal Medicine, and other subspecialty meetings.39, 40 These meetings not only increase awareness of a hospitalist's research but also provide opportunities for networking and developing collaboration on research. Many societies, including the Society of Hospital Medicine, have research abstract competitions and offer research grants for investigators that can help to fund projects and support protected time.
Rewards and Challenges
There are many rewards and opportunities for a hospitalist investigator, particularly because the field is young and there are many unanswered research questions related to inpatient medicine. There are also the intrinsic rewards of being devoted to scientific inquiry and having greater autonomy over how time is spent. A hospitalist's schedule can be well suited to research. Although attending on the wards can be very time‐consuming, time off the wards is often free of outpatient duties and can be entirely devoted to research.
There are also several challenges to becoming a successful researcher. The pressure to obtain grant funding and publish high‐quality scientific manuscripts is high. Obtaining sufficient protected time may be difficult in busy clinical departments, and applying for grant funding is both time‐consuming and highly competitive. It is very important to be familiar with the specific criteria for academic promotion at one's institution. Understanding these expectations can help to effectively prioritize activities. Standard requirements generally include number and quality of articles published in peer‐reviewed journals, successful application for research funding, national recognition in the field, service to the institution and research community, and evidence of research independence. One significant challenge is the lack of a single large funding source for hospital‐related research. Although the Agency for Healthcare Research and Quality funds studies related to hospital care, such as on the quality of care or cost effectiveness of various system‐based hospital care interventions, their budget for investigator‐initiated proposals is limited.41 One promising funding source for research in hospital care is from agencies and foundations dedicated to the aging population, such as the National Institute for Aging (NIA), the Hartford Foundation, and the Aetna Foundation, to name a few.42, 43 Yet research on hospital care alone, without detailed attention to issues unique to geriatric‐specific conditions or populations, is unlikely to be funded by these avenues. With few federal grant programs directly suited to the emerging research agenda in hospital medicine, hospitalist‐investigators may be at a disadvantage for obtaining tenure‐track positions, compared with their subspecialist colleagues, who may receive funding from NIH agencies or foundations dedicated to their own field.
ADMINISTRATION (THE HOSPITALIST‐ADMINISTRATOR)
Physician leaders in hospital administration are not new. Many hospitals already include physicians in senior management positions, such as chief medical officer.44 Naturally, a career in hospital administration is another potential path for diastole in academic medical centers.
Education and Training
Although a master of business, health administration, or medical management is not a prerequisite for the physician who wants to move into management, it is an increasingly important credential for senior administrative positions (Table 4). Primarily, it serves as a signal that a physician is committed to management and has a working knowledge of strategic planning, business models, human resources, leadership, and clinical operations. For physicians without formal business training who are interested in management, exploring internal opportunities is a necessary first step. Likewise, getting a business degree is not as important as management experience. The successful application of business skills requires practice, mentoring, and on‐the‐job experience. For hospitalists, this experience could be obtained by volunteering to serve on committees such as utilization review, quality assurance, credentialing, or medical staff executive committees. In lieu of a graduate degree, physicians may wish to participate in one of the many fellowships in health services administration. These programs generally aim to provide practical mentored learning experience in a health care organization and may last up to 2 years.45
| Description | Length of time | Cost | Source/website |
|---|---|---|---|
| Degrees/fellowships | |||
| Master's in business administration (MBA): General management core with option for courses specializing in health care. | Generally 2‐year program | Varies in accordance with each institution. | Directory websites (MBA): |
| Master's in health administration (MHA): Studies in analytic and management needs of health care. | Generally 2‐year program | Varies in accordance with each institution. | Directory websites (MHA): |
| Fellowship in health services administration: Preceptor‐directed program that provides practical learning experience in a health care organization beyond graduate‐level academic instruction. | Usually lasts 1‐2 years. | Compensation varies. Median reported as $39,055. | Directory (American College of Healthcare Executives): |
| Short‐term coursework | |||
| Society of Hospital Medicine Leadership Academy: Instruction for hospitalists in leading change, communicating effectively, handling conflict and negotiation, doing strategic planning, and interpreting hospital business drivers. Held biannually. | 3‐ to 4‐day program | $1400‐$1600. Discounted rate for members of Society of Hospital Medicine | |
For hospitalists and trainees considering a career as an executive, the American College of Physician Executives can serve as a valuable resource.46 This organization, founded in 1975, offers educational resources, including publications, comprehensive CD‐ROM products, and 1‐day courses and master's degree programs in conjunction with several leading business schools in medical management. In addition, the Society of Hospital Medicine offers a Leadership Academy designed to assist practicing hospitalists in evaluating their leadership strengths and applying them to everyday management challenges.47 Such a program also can facilitate the development of a peer network and the mentoring relationships needed to achieve these goals.
Rewards and Challenges
The life of the physician executive can be rewarding, but making the transition may prove challenging. However, if physicians can navigate this transition successfully, they will likely find a wide array of opportunities, as demand for physician‐executives remains high.
One major challenge to becoming a physician‐executive is reconciling the administrative role with the initial desire to enter a career in clinical medicine.48 Physician‐executives who continue to see patients are more likely to be satisfied with their jobs than physician‐executives who do not.49 Physician‐executives also may feel they are being criticized by their purely clinical colleagues for working in the business or management of medicine.50 Actual or perceived lack of support may promote isolation and burnout.51 In addition, the constantly shifting landscape of health care administration results in a much more unstable environment than that found in clinical medicine. For example, the risk of termination for a physician‐executive is 20‐40 times higher than that for a practicing physician.50 The reasons for this higher risk include personal conflict with a boss, reorganization (ie, downsizing, merging, etc.), and immediate departure of a supervisor. Access to mentors, support groups, and the option to practice part time are all potential mechanisms to ensure long‐term success as a physician‐administrator.
CONCLUSIONS
As hospital medicine continues to grow and evolve, designing sustainable and rewarding academic careers will be crucial to the success of the field. Being able to balance clinical systole time with obtaining the skills to support nonclinical diastole time is important to ensuring a successful career as an academic hospitalist. We have described several possible career paths in teaching, research, quality improvement, and administration. By preparing future hospitalists with the knowledge and skills required to assume a variety of roles during their diastolic time, we hope to encourage the growth of hospitalist leaders with well‐developed skill sets. If hospitalists adequately prepare themselves, academic hospital medicine will likely remain sustainable and rewarding, and future generations of trainees will be inspired and prepared to enter the field.
Acknowledgements
We are grateful to Jennifer Higa and Kimberly Alvarez for their assistance in preparing this manuscript.
- ,,.Balancing continuity of care with residents' limited work hours: defining the implications.Acad Med.2005;80:39–43.
- ,,, et al.Effects of inpatient experience on outcomes and costs in a multicenter trial of academic hospitalists.J Gen Intern Med.2005;20(s1):141–142.
- .The hospitalist movement.Ann Intern Med.1999;131:545.
- .The future of hospital medicine: evolution or revolution?Am J Med.2004;117:446–450.
- ,,, et al.Satisfaction and worklife of academic hospitalist and non‐hospitalist attendings on general medical inpatient rotations.J Gen Intern Med.2006;21(s4):128.
- ,,.Career plans for trainees in internal medicine residency programs.Acad Med.2005;80:507–512.
- ,,,,.Closing the gap between internal medicine training and practice: recommendations from recent graduates.Amer J Med.2005;118:680–687.
- ,,, et al..Hospitalists as teachers.J Gen Intern Med.2004;19(1):8–15.
- ,.Implications of the hospitalist model for medical students' education.Acad Med.2001;76:324–330.
- ,,,,,.Resident satisfaction on an academic hospitalist service: time to teach.Am J Med.2002;112:597–601.
- ,.The present and future of appointment, tenure, and compensation policies for medical school clinical faculty.Acad Med.2001;76:993–1004.
- ,,,,.Core competencies in hospital medicine: development and methodology.J Hosp Med.2006;1(1):48–56.
- ,,,,.The core competencies in hospital medicine.J Hosp Med.2006;1(1).
- Harvard Macy Institute. Harvard College. Available at: http://www.harvardmacy.org/programs.asp?DocumentID=1. Accessed October 3,2005.
- Stanford Faculty Development Center. Stanford University. Available at http://sfdc.stanford.edu/. Accessed January 23,2006.
- American College of Physicians. Available at: http://www.acponline.org/college/membership/classes.htm#fellow. Accessed June 10,2006
- ,,, et al.Effect of the inpatient general medicine rotation on student pursuit of a generalist career.J Gen Intern Med.2006;21:471–475.
- ,.Graduate medical education research in the 21st century and JAMA on call.JAMA.2004;292:2913–2915.
- Association of American Medical Colleges. MedEd (PORTAL); Providing Online Resources to Advance Learning in Medical Education. Available at: http://www.aamc.org/meded/mededportal/start.htm. Accessed January 23,2006.
- BioMed Central. BMC Medical Education. Available at: http://www.biomedcentral.com/bmcmededuc/.Accessed January 23,2006.
- ,,,.Costs and funding for published medical education research.JAMA.2005;294(9):1052–7.
- .Teamwork and hospital medicine. A vision for the future.Crit Care Nurse.2003;23(3):8,10–11.
- . (1995)Diffusion of Innovations.4th ed.The Free Press:,Toronto.
- ,,.Clarifying the concepts in knowledge transfer: a literature review.J Adv Nurs.2006;53:691–701.
- ,,,,.Creating a quality improvement elective for medical house officers.J Gen Intern Med.2004;19:861–867.
- ,,.A continuous quality improvement curriculum for residents: addressing core competency, improving systems.Acad Med.2004;79(10 Suppl):S65–7.
- Institute for Healthcare Delivery Research. Advanced Training Program in Health Care Delivery Improvement (ATP). Available at: http://www.ihc.com/xp/ihc/institute/education/atp/. Accessed October 3,2005.
- Veterans Health Administration. VA Quality Scholars Program. Available at: http://www.dartmouth.edu/∼cecs/fellowships/vaqs.html
- Institute for Healthcare Improvement. George W. Merck Fellowships. Available at: http://www.ihi.org/ihi. Accessed October 3,2005.
- ,,, et al.Effects of physician experience on costs and outcomes on an academic general medicine service: results of a trial of hospitalists.Ann Intern Med.2002;137:866–874.
- ,,,,,.Implementation of a voluntary hospitalist service at a community teaching hospital: improved clinical efficiency and patient outcomes.Ann Intern Med.2002;137:859–865.
- ,.The hospitalist movement 5 years later.JAMA.2002;287:487–494.
- Robert Wood Johnson Clinical Scholars Program. Stanford University (Palo Alto, CA). Available at: http://rwjcsp.stanford.edu/. Accessed October 3,2005.
- ,.Hospital Medicine Fellowship Update.Society of Hospital Medicine.The Hospitalist.2004;8(5):38.
- ,,,.Hospital medicine fellowships: works in progress.Am J Med.2006;119(1):72.e1–e7.
- ,,, et al.Mentorship in Academic General Internal Medicine.J Gen Intern Med.2005;2(34):1–5.
- ,,,,.Getting funded. Career development awards for aspiring clinical investigators.J Gen Intern Med.2004;19(5 Pt 1):472–478.
- K Kiosk—Information about NIH Career Development Awards. Available at: http://grants.nih.gov/training/careerdevelopmentawards.htm. Accessed March 20,2006.
- Research Career Development Awards for Junior Faculty and Fellows in General Internal Medicine. Available at: http://www.sgim.org/careerdevelopment.cfm. Accessed March 24,2006.
- Society of Hospital Medicine. Available at: http://www.hospitalmedicine.org//AM/Template.cfm?Section=Home. Accessed October 4,2005.
- ,.What is an academic general internist? Career options and training pathways.JAMA.2002;288:2045–2048.
- U.S. National Institutes of Health.National Institute on Aging. Available at: http://www.nia.nih.gov/. Accessed January 25,2006.
- .Hartford Foundation. Available from: http://www.jhartfound.org/. Accessed January 25,2006.
- .Why will physicians in this new environment replace MHAs?Physician Exec.1996;22(2):5–10.
- Directory of Fellowships in Health Services Administration. Available at: http://www.ache.org/pgfd/purpose.cfm. Accessed March 24,2006.
- American College of Physician Executives. Available at: http://www.acpe.org/. Accessed October 3,2005.
- Society of Hospital Medicine. Leadership Academy statement. Available at: http://www.hospitalmedicine.org/AM/Template.cfm?Section=Search_Advanced_Search6(7):37–40.
- ,,,.Satisfaction higher for physician executives who treat patients, survey finds.Physician Exec.2002;28(3):17–21.
- .Physician executives don't have to go it alone.Managed Care Magazine.2003. Available at: http://www.managedcaremag.com/archives/0307/0307.viewpoint_lazarus.html.Accessed January 25,year="2006"2006.
- .Controlled burn! Physician executives must be ready to handle job burnout, career stress.Physician Exec.2001;27(4):42–45.
Copyright © 2006 Society of Hospital Medicine