User login
Traditional Medicare Spending on Inpatient Episodes as Hospitalizations Decline
The rate of inpatient admissions among adults aged 65 years and older has decreased by approximately 25% since 2000.1,2 This long-term trend raises important questions about inpatient-related spending in the traditional Medicare program for hospitals and providers who treat beneficiaries after a hospitalization. As traditional Medicare’s most expensive sector (accounting for 21% of all Medicare spending3), reducing hospitalizations is often championed as an opportunity to moderate Medicare spending growth.
Medicare’s ability to achieve significant savings from declining inpatient use may be tempered by a shift toward more expensive hospitalizations. If marginal hospitalizations among healthier beneficiaries are avoided, then the remaining inpatient users may be sicker and have greater spending per hospitalization and greater need for follow-up services. This study examines trends in Medicare spending related to episodes initiated by an inpatient stay because of its importance to overall Medicare spending and the implications for several Medicare value-based payment initiatives. In care models seeking to contain spending at a population level, such as accountable care organizations and managed care plans, reducing inpatient use and associated services may have the largest impact in curbing overall spending growth per beneficiary. Other models focused on spending at an episode level, including bundled payment initiatives, may face challenges if inpatient episodes become more expensive over time.
As Medicare shifts toward value-based payments, hospitalists and other hospital leaders are often involved in redesigning care delivery models for the hospital or accountable care organization (eg, through readmission reduction initiatives, post–acute care coordination, and bundled-care delivery programs). Not all savings strategies rely on providers to change how services are delivered; Medicare can modify payment rates, such as Affordable Care Act provisions that slowed how quickly Medicare payment rates increased.4 For clinicians to navigate the shift toward new payment models, it is important to recognize how each of these elements—declining hospital admissions, spending per inpatient episode, and payment rates—affect spending trends for inpatient services and associated care. Previous articles on overall Medicare inpatient spending have examined inpatient stays alone5 or focused mainly on spending per episode6,7 without quantifying how these elements contributed to overall episode-related Medicare spending per beneficiary. This article addresses this gap by demonstrating how inpatient-related spending trends reflect each component.
This study examined trends in Medicare’s spending on inpatient episodes during the years 2009 to 2017. We described changes in the volume and spending on inpatient-initiated episodes across several dimensions, including beneficiary-level and hospitalization-level factors. We examined whether declines in spending associated with fewer inpatient-initiated episodes have been offset by increased spending per episode and how spending would have differed without changes in Medicare payment rates.
Episode Definition
We constructed an episode measure that captured traditional Medicare spending for 30 days prior to hospital admission, hospitalization duration, and 90 days following hospital discharge (additional details in the Appendix).
Any acute hospitalization triggered a new episode, with one exception: if a beneficiary was discharged and readmitted within 90 days for the same diagnosis-related group (DRG), then the readmission did not trigger a new episode. The spending for that readmission was attributed to the prior hospital stay. In effect, the annual number of episodes is equivalent to the annual number of hospital admissions minus subsequent rehospitalizations for the same DRG. Neither observation stays nor hospitalizations in inpatient rehabilitation, psychiatric, or long-term facilities were considered acute hospital admissions.
We assigned claims from noninpatient sectors to an episode based on whether the claim start date fell within the episode window. All traditional Medicare sectors were measured, including outpatient services, physician claims, post–acute care services, and Medicare Part D prescription drug events.
Our analysis aimed to measure all spending related to inpatient episodes without double-counting spending for overlapping episodes. If episodes overlapped, then spending for overlapping days was weighted to be evenly divided across episodes.
Outcome Measures
The study’s main outcomes summarized episode trends across the entire traditional Medicare population, including beneficiaries without an episode, in annual mean number of episodes per beneficiary and annual mean episode-related spending per beneficiary. The denominator of these measures is person-years, or total number of beneficiary months with Medicare Part A and B coverage divided by 12. The annual mean number of episodes per beneficiary is the total number of episodes initiated in a calendar year divided by person-years. The annual mean episode-related spending per beneficiary is the total amount of spending attributed to episodes divided by person-years. We also measured annual mean spending per episode, or total amount of spending attributed to episodes divided by the total number of episodes.
Medicare annually updates each sector’s payment rates for several factors, including inflation. We constructed an index for each sector to adjust for these annual payment rate changes. We also accounted for sequestration measures in effect since April 2013 that reduced Medicare payments to all sectors by 2%. We report our spending measures twice, with and without adjusting for changes in payment rates. Adjusted numbers reflect payment rates in effect in 2015.
Analysis Approach
We present annual trends on changes in the number of inpatient episodes per beneficiary, mean episode-related spending per beneficiary, and mean spending per episode. To quantify how changes in episode-related spending per beneficiary reflect changes in the number of episodes per beneficiary vs changes in spending per episode, we modified an approach implemented by Rosen and colleagues.8
To better understand which beneficiaries have declining inpatient use, we performed stratified analyses describing changes in the number of episodes per beneficiary between 2009 and 2017, spending per episode, and total episode-related spending per beneficiary. We report these measures for several subpopulations defined by age, sex, race, dual-eligible status, and whether the beneficiary used long-term nursing home services during the episode’s calendar year. Descriptive statistics also detail how these measures changed between 2009 and 2017 for episodes stratified by characteristics of the index hospital stay: planned vs unplanned, medical vs surgical, and any use of intensive care unit (ICU) or coronary care unit services. We also stratify study measures by whether an episode included any use of post–acute care services (skilled nursing facility, home health, or inpatient rehabilitation facility use). Finally, we aggregate the episodes into major diagnostic categories (MDCs) based on the index hospital stay’s DRG to report study outcomes by condition. Because of a shift in coding hospitalizations for pneumonia as sepsis,9,10 we exclude these two diseases from their respective MDCs and analyze them jointly as a unique category.
RESULTS
Changes in Number of Inpatient Episodes and Related Spending
From 2009 to 2017, the number of inpatient episodes per 1000 traditional Medicare beneficiaries declined from 326 to 267 (Table 1), or a relative decline of 18.2% (Figure 1). The total volume of inpatient episodes declined by only 13.4%, from 10.2 million to 8.8 million, reflecting that the size of the traditional Medicare population grew during these years. Over the same years, mean payment-rate–adjusted spending per episode increased 11.4% from $20,891 to $23,273.

When considering overall episode-related spending, the large decline in the volume of episodes outweighed increased spending per episode: the mean amount of episode-related Medicare spending per beneficiary decreased 8.9% from $6810 to $6206 (Table 1), or a net change of $604 (Figure 2). This net change reflects decreased spending due to fewer episodes per beneficiary ($1239 reduction in episode-related spending) offset by increased spending per episode (translating to a $776 increase in episode-related spending per beneficiary).

When these estimates are calculated separately for the inpatient sector and all other sectors, the inpatient sector experienced small increases in spending associated with greater spending per episode ($304) compared with noninpatient sectors ($472). Accordingly, the inpatient sector had a larger net decline in episode-related spending per beneficiary ($420) than noninpatient sectors ($184) after taking into account declining episode volume.
As expected, episode-related spending increased more when measures were not adjusted for annual payment rate increases. Without such adjustment, mean spending per episode increased 25.5%, and episode-related spending per beneficiary was nearly flat (2.6% between 2009 and 2017 [Figure 1]). The decline in unadjusted spending associated with fewer episodes ($1138) was offset by the spending increase associated with higher spending per episode ($1592) (Figure 2).

Analyses Stratified by Beneficiary Characteristics
Every population examined had declines in the number of inpatient episodes, even beneficiaries with more frequent inpatient use (Table 2). Among Medicare beneficiaries aged 85 years and older, the mean number of episodes per 1000 beneficiaries declined by 12.7%, from 524 to 457. Populations with less frequent inpatient use often experienced larger relative declines in number of episodes than populations with more frequent inpatient use. For example, the mean number of episodes per 1000 beneficiaries decreased by 17.7% for beneficiaries without nursing home use (306 to 252), as compared with an 8.1% decline for beneficiaries with nursing home use (from 888 to 816). In contrast, populations with less frequent inpatient use had larger relative increases in spending per episode with adjustment for payment rate changes. For example, spending per episode increased by 13.1% for beneficiaries aged 65 to 74 years ($20,904 to $23,644), but only by 8.6% for beneficiaries 85 years and older ($20,384 to $22,138).

Analyses Stratified by Service Use Characteristics
Some types of inpatient episodes had larger declines in the number of episodes, including episodes with planned admissions for the index hospital stay (28.8% decline from 68 to 48 episodes per 1000 beneficiaries) and episodes without post–acute care use (23.9% decline from 169 to 129 episodes per 1000 beneficiaries) (Appendix Table). In contrast, declines in the number of episodes were similar for index hospital admissions that did or did not involve ICU use (17.8% and 18.3% reduction in mean number of episodes per 1000 beneficiaries, respectively) or that included a surgical procedure or not (17.1% versus 18.6%, respectively). Several types of inpatient episodes had larger increases in spending per episode, such as a 15.1% increase for planned admissions and a 13.2% increase for hospitalizations without ICU use.
According to diagnosis information for an episode’s index hospital stay, inpatient episodes related to conditions affecting the circulatory system had the largest decline in mean number of episodes, decreasing by 31.8% from 78 to 53 episodes per 1000 beneficiaries (Appendix Table). Episodes for other diseases had much smaller declines in volume. Admissions for diagnoses of pneumonia or sepsis had notable increases in the volume of episodes, increasing by 20.7% from 25 to 30 admissions per 1000 beneficiaries.
DISCUSSION
Medicare spending per beneficiary on inpatient episodes, including services provided pre- and post hospitalization, declined by 8.9% from 2009 to 2017 after adjusting for payment rate changes. This decline reflects two components. First, the number of episodes per 1000 beneficiaries declined by 18.2%. Although the extent of this decrease varied across populations, every group examined had declines in inpatient use. In particular, hospitalizations for conditions affecting the circulatory system, such as heart attacks and cardiac procedures, decreased. Second, as inpatient volume declined, spending per episode increased by 11.4% to an average of $23,273 in 2017. This increase in spending per episode offset how much overall Medicare spending on episode-related care declined.
Medicare is increasingly challenging hospitals to demonstrate the value of inpatient services and associated treatment, which requires hospital leaders to recognize how their facilities’ spending trends relate to these national patterns. Understanding how much national episode-related spending has decreased over time with declining inpatient volume can help an accountable care organization evaluate whether it is feasible to achieve significant savings by reducing hospitalizations. Bundled payment providers focused on managing spending per episode can benefit from identifying which types of hospitalizations have increased spending per episode, especially for certain diagnoses.
These results also highlight the continued importance of a perennial factor in Medicare spending: payment rates. If Medicare payment rates had not increased over our study period, Medicare spending per inpatient episode would have increased by only 11%. Actual Medicare spending per episode increased by 25%, demonstrating that over half of the relative increase in spending per episode reflected increases in Medicare’s payment rates.
Increased spending per episode, even after adjustment for payment rate changes, suggests that services provided during an episode have increased in intensity or shifted toward higher-cost treatments.
When interpreting these trends, several points are notable. The underlying health of the Medicare population may contribute to declining inpatient use but is difficult to quantify. The observed decline in cardiac-related hospitalizations is consistent with evidence that the impact of ischemic heart disease, the leading source of disease or injury in the US population, has dramatically declined over recent decades15 and that the Medicare program has experienced large declines in overall spending and use related to cardiac conditions.16-18
Other potential factors include a shift toward hospitals treating Medicare beneficiaries as outpatients during an observation stay instead of admitting them as inpatients. Observation stays have increased as traditional Medicare implemented measures to penalize readmissions and limit payments for short inpatient stays.19-21 Even so, the increase in observation stays would have to be at least three times as large as described in other work to fully substitute for the decrease in inpatient stays: between the years 2007 and 2018, the number of observation stays per 1000 beneficiaries increased by only 26 stays, whereas the number of hospitalizations per 1000 beneficiaries decreased by 83 hospitalizations.20
Outpatient services may also broaden treatment availability in alternative settings or enable beneficiaries to avoid inpatient treatment with appropriate preventative care.22-27 These considerations are even more relevant as the COVID-19 pandemic spurred reduced admissions and shifted acute services outside of hospitals.28,29 Some services, such as elective surgeries, have probably shifted from an inpatient to an outpatient setting, which would be consistent with our finding that there are larger relative declines in planned hospitalizations. Although this analysis does not capture spending for outpatient services that are not linked to an inpatient admission, prior work demonstrates that annual growth in total Medicare spending per beneficiary (episode related or not) has recently declined for the inpatient sector but increased for outpatient and physician sectors.30 By offering other outpatient services, hospitals may be able to recoup some declining inpatient revenues. However, outpatient services are reimbursed at a lower rate than inpatient services, suggesting these trends may create financial pressure for hospitals.
There are several limitations to our analysis. First, our analysis is not designed to uncover the reason for the shift away from inpatient services nor to analyze how it has affected beneficiaries’ overall quality of care.
CONCLUSION
Over an 8-year period, Medicare spending per beneficiary on inpatient episodes, including all services immediately preceding and following hospitalizations, declined by 8.9% after taking into account payment rate increases. This broad shift away from inpatient services among all Medicare beneficiaries suggests policymakers should aim for payment policies that balance financial sustainability for hospitals and associated facilities with more efficient use of inpatient and related services.
Acknowledgments
The authors thank Sunita Thapa, Lucas Stewart, Christine Lai, and Liliana Podczerwinski for contributions in data analysis and manuscript preparation.
1. Sun R, Karaca Z, Wong HS. Trends in hospital inpatient stays by age and payer, 2000-2015: Statistical Brief #235. In: Healthcare Cost and Utilization Project (HCUP) Statistical Briefs. Agency for Healthcare Research and Quality; 2006.
2. HCUP Fast Stats - trends in inpatient stays. Healthcare Cost and Utilization Project (HCUP). April 2021. Accessed August 29, 2021. www.hcup-us.ahrq.gov/faststats/national/inpatienttrends.jsp
3. The Medicare Payment Advisory Commission. Section 1: National health care and Medicare spending. In: A Data Book: Health Care Spending and the Medicare Program. June 2018. Accessed August 13, 2021. http://www.medpac.gov/docs/default-source/data-book/jun18_databooksec1_sec.pdf
4. Buntin MB, Graves JA. How the ACA dented the cost curve. Health Aff (Millwood). 2020;39(3):403-412. https://doi.org/10.1377/hlthaff.2019.01478
5. Krumholz HM, Nuti SV, Downing NS, Normand SLT, Wang Y. Mortality, hospitalizations, and expenditures for the Medicare population aged 65 years or older, 1999-2013. JAMA. 2015;314(4):355-365. https://doi.org/10.1001/jama.2015.8035
6. Chen LM, Norton EC, Banerjee M, Regenbogen SE, Cain-Nielsen AH, Birkmeyer JD. Spending on care after surgery driven by choice of care settings instead of intensity of services. Health Aff (Millwood). 2017;36(1):83-90. https://doi.org/10.1377/hlthaff.2016.0668
7. Ibrahim AM, Nuliyalu U, Lawton EJ, et al. Evaluation of US hospital episode spending for acute inpatient conditions after the Patient Protection and Affordable Care Act. JAMA Netw Open. 2020;3(11):e2023926. https://doi.org/10.1001/jamanetworkopen.2020.23926
8. Rosen A, Aizcorbe A, Ryu AJ, Nestoriak N, Cutler DM, Chernew ME. Policy makers will need a way to update bundled payments that reflects highly skewed spending growth of various care episodes. Health Aff (Millwood). 2013;32(5):944-951. https://doi.org/10.1377/hlthaff.2012.1246
9. Lindenauer PK, Lagu T, Shieh MS, Pekow PS, Rothberg MB. Association of diagnostic coding with trends in hospitalizations and mortality of patients with pneumonia, 2003-2009. JAMA. 2012;307(13):1405-1413. https://doi.org/10.1001/jama.2012.384
10. Buntin MB, Lai C, Podczerwinski L, Poon S, Wallis C. Changing diagnosis patterns are increasing Medicare spending for inpatient hospital services. The Commonwealth Fund. April 28, 2021. Accessed August 13, 2021. https://www.commonwealthfund.org/publications/2021/apr/changing-diagnosis-patterns-are-increasing-medicare-spending-inpatient
11. The Medicare Payment Advisory Commission. Hospital inpatient and outpatient services. In: Report to the Congress: Medicare Payment Policy. . March 2018. Accessed August 13, 2021. http://www.medpac.gov/docs/default-source/reports/mar18_medpac_ch3_sec.pdf?sfvrsn=0
12. Ody C, Msall L, Dafny LS, Grabowski DC, Cutler DM. Decreases In readmissions credited to Medicare’s program to reduce hospital readmissions have been overstated. Health Aff (Millwood). 2019;38(1):36-43. https://doi.org/10.1377/hlthaff.2018.05178
13. Dharmarajan K, Qin L, Lin Z, et al. Declining admission rates and thirty-day readmission rates positively associated even though patients grew sicker over time. Health Aff (Millwood). 2016;35(7):1294-1302. https://doi.org/10.1377/hlthaff.2015.1614
14. Sjoding MW, Prescott HC, Wunsch H, Iwashyna TJ, Cooke CR. Longitudinal changes in ICU admissions among elderly patients in the United States. Crit Care Med. 2016;44(7):1353-1360. https://doi.org/10.1097/CCM.0000000000001664
15. Murray CJ, Atkinson C, Bhalla K, et al. The state of US health, 1990-2010: burden of diseases, injuries, and risk factors. JAMA. 2013;310(6):591-608. https://doi.org/10.1001/jama.2013.13805
16. Cutler DM, Ghosh K, Messer KL, Raghunathan TE, Stewart ST, Rosen AB. Explaining the slowdown in medical spending growth among the elderly, 1999-2012. Health Aff (Millwood). 2019;38(2):222-229. https://doi.org/10.1377/hlthaff.2018.05372
17. Ward MJ, Kripalani S, Zhu Y, et al. Incidence of emergency department visits for ST-elevation myocardial infarction in a recent six-year period in the United States. Am J Cardiol. 2015;115(2):167-170. https://doi.org/10.1016/j.amjcard.2014.10.020
18. Keohane LM, Gambrel RJ, Freed SS, Stevenson D, Buntin MB. Understanding trends in Medicare spending, 2007-2014. Health Serv Res. 2018;53(5):3507-3527. https://doi.org/10.1111/1475-6773.12845
19. Nuckols TK, Fingar KR, Barrett M, Steiner CA, Stocks C, Owens PL. The shifting landscape in utilization of inpatient, observation, and emergency department services across payers. J Hosp Med. 2017;12(6):443-446. https://doi.org/10.12788/jhm.2751
20. Poon SJ, Wallis CJ, Lai P, Podczerwinski L, Buntin MB. Medicare two-midnight rule accelerated shift to observation stays. Health Affairs. In press.
21. Sheehy AM, Kaiksow F, Powell WR, et al. The Hospital Readmissions Reduction Program and observation hospitalizations. J Hosp Med. 2021;16(7):409-411. https://doi.org/10.12788/jhm.3634
22. Culler SD, Parchman ML, Przybylski M. Factors related to potentially preventable hospitalizations among the elderly. Med Care. 1998;36(6):804-817. https://doi.org/10.1097/00005650-199806000-00004
23. Kozak LJ, Hall MJ, Owings MF. Trends in avoidable hospitalizations, 1980-1998. Health Aff (Millwood). 2001;20(2):225-232. https://doi.org/10.1377/hlthaff.20.2.225
24. Ouslander JG, Lamb G, Perloe M, et al. Potentially avoidable hospitalizations of nursing home residents: frequency, causes, and costs. J Am Geriatr Soc. 2010;58(4):627-635. https://doi.org/10.1111/j.1532-5415.2010.02768.x
25. Konetzka RT, Karon SL, Potter DEB. Users of Medicaid home and community-based services are especially vulnerable to costly avoidable hospital admissions. Health Aff (Millwood). 2012;31(6):1167-1175. https://doi.org/10.1377/hlthaff.2011.0902
26. Nyweide DJ, Anthony DL, Bynum JPW, et al. Continuity of care and the risk of preventable hospitalization in older adults. JAMA Intern Med. 2013;173(20):1879-1885. https://doi.org/10.1001/jamainternmed.2013.10059
27. Auerbach AD, Kripalani S, Vasilevskis EE, et al. Preventability and causes of readmissions in a national cohort of general medicine patients. JAMA Intern Med. 2016;176(4):484-493. https://doi.org/10.1001/jamainternmed.2015.7863
28. Birkmeyer JD, Barnato A, Birkmeyer N, Bessler R, Skinner J. The impact of the COVID-19 pandemic on hospital admissions in the United States. Health Aff (Millwood). 2020;39(11):2010-2017. https://doi.org/10.1377/hlthaff.2020.00980
29. Nundy S, Patel KK. Hospital-at-home to support COVID-19 surge—time to bring down the walls? JAMA Health Forum. 2020;1(5):e200504. https://doi.org/10.1001/jamahealthforum.2020.0504
30. Keohane LM, Stevenson DG, Freed S, Thapa S, Stewart L, Buntin MB. Trends in Medicare fee-for-service spending growth for dual-eligible beneficiaries, 2007–15. Health Aff (Millwood). 2018;37(8):1265-1273. https://doi.org/10.1377/hlthaff.2018.0143
31. Freed M, Biniek JF, Damico A, Neuman T. Medicare Advantage in 2021: enrollment update and key trends. June 21, 2021. Accessed August 13, 2021. https://www.kff.org/medicare/issue-brief/medicare-advantage-in-2021-enrollment-update-and-key-trends/
32. Li Q, Rahman M, Gozalo P, Keohane LM, Gold MR, Trivedi AN. Regional variations: the use of hospitals, home health, and skilled nursing in traditional Medicare and Medicare Advantage. Health Aff (Millwood). 2018;37(8):1274-1281. https://doi.org/10.1377/hlthaff.2018.0147
The rate of inpatient admissions among adults aged 65 years and older has decreased by approximately 25% since 2000.1,2 This long-term trend raises important questions about inpatient-related spending in the traditional Medicare program for hospitals and providers who treat beneficiaries after a hospitalization. As traditional Medicare’s most expensive sector (accounting for 21% of all Medicare spending3), reducing hospitalizations is often championed as an opportunity to moderate Medicare spending growth.
Medicare’s ability to achieve significant savings from declining inpatient use may be tempered by a shift toward more expensive hospitalizations. If marginal hospitalizations among healthier beneficiaries are avoided, then the remaining inpatient users may be sicker and have greater spending per hospitalization and greater need for follow-up services. This study examines trends in Medicare spending related to episodes initiated by an inpatient stay because of its importance to overall Medicare spending and the implications for several Medicare value-based payment initiatives. In care models seeking to contain spending at a population level, such as accountable care organizations and managed care plans, reducing inpatient use and associated services may have the largest impact in curbing overall spending growth per beneficiary. Other models focused on spending at an episode level, including bundled payment initiatives, may face challenges if inpatient episodes become more expensive over time.
As Medicare shifts toward value-based payments, hospitalists and other hospital leaders are often involved in redesigning care delivery models for the hospital or accountable care organization (eg, through readmission reduction initiatives, post–acute care coordination, and bundled-care delivery programs). Not all savings strategies rely on providers to change how services are delivered; Medicare can modify payment rates, such as Affordable Care Act provisions that slowed how quickly Medicare payment rates increased.4 For clinicians to navigate the shift toward new payment models, it is important to recognize how each of these elements—declining hospital admissions, spending per inpatient episode, and payment rates—affect spending trends for inpatient services and associated care. Previous articles on overall Medicare inpatient spending have examined inpatient stays alone5 or focused mainly on spending per episode6,7 without quantifying how these elements contributed to overall episode-related Medicare spending per beneficiary. This article addresses this gap by demonstrating how inpatient-related spending trends reflect each component.
This study examined trends in Medicare’s spending on inpatient episodes during the years 2009 to 2017. We described changes in the volume and spending on inpatient-initiated episodes across several dimensions, including beneficiary-level and hospitalization-level factors. We examined whether declines in spending associated with fewer inpatient-initiated episodes have been offset by increased spending per episode and how spending would have differed without changes in Medicare payment rates.
Episode Definition
We constructed an episode measure that captured traditional Medicare spending for 30 days prior to hospital admission, hospitalization duration, and 90 days following hospital discharge (additional details in the Appendix).
Any acute hospitalization triggered a new episode, with one exception: if a beneficiary was discharged and readmitted within 90 days for the same diagnosis-related group (DRG), then the readmission did not trigger a new episode. The spending for that readmission was attributed to the prior hospital stay. In effect, the annual number of episodes is equivalent to the annual number of hospital admissions minus subsequent rehospitalizations for the same DRG. Neither observation stays nor hospitalizations in inpatient rehabilitation, psychiatric, or long-term facilities were considered acute hospital admissions.
We assigned claims from noninpatient sectors to an episode based on whether the claim start date fell within the episode window. All traditional Medicare sectors were measured, including outpatient services, physician claims, post–acute care services, and Medicare Part D prescription drug events.
Our analysis aimed to measure all spending related to inpatient episodes without double-counting spending for overlapping episodes. If episodes overlapped, then spending for overlapping days was weighted to be evenly divided across episodes.
Outcome Measures
The study’s main outcomes summarized episode trends across the entire traditional Medicare population, including beneficiaries without an episode, in annual mean number of episodes per beneficiary and annual mean episode-related spending per beneficiary. The denominator of these measures is person-years, or total number of beneficiary months with Medicare Part A and B coverage divided by 12. The annual mean number of episodes per beneficiary is the total number of episodes initiated in a calendar year divided by person-years. The annual mean episode-related spending per beneficiary is the total amount of spending attributed to episodes divided by person-years. We also measured annual mean spending per episode, or total amount of spending attributed to episodes divided by the total number of episodes.
Medicare annually updates each sector’s payment rates for several factors, including inflation. We constructed an index for each sector to adjust for these annual payment rate changes. We also accounted for sequestration measures in effect since April 2013 that reduced Medicare payments to all sectors by 2%. We report our spending measures twice, with and without adjusting for changes in payment rates. Adjusted numbers reflect payment rates in effect in 2015.
Analysis Approach
We present annual trends on changes in the number of inpatient episodes per beneficiary, mean episode-related spending per beneficiary, and mean spending per episode. To quantify how changes in episode-related spending per beneficiary reflect changes in the number of episodes per beneficiary vs changes in spending per episode, we modified an approach implemented by Rosen and colleagues.8
To better understand which beneficiaries have declining inpatient use, we performed stratified analyses describing changes in the number of episodes per beneficiary between 2009 and 2017, spending per episode, and total episode-related spending per beneficiary. We report these measures for several subpopulations defined by age, sex, race, dual-eligible status, and whether the beneficiary used long-term nursing home services during the episode’s calendar year. Descriptive statistics also detail how these measures changed between 2009 and 2017 for episodes stratified by characteristics of the index hospital stay: planned vs unplanned, medical vs surgical, and any use of intensive care unit (ICU) or coronary care unit services. We also stratify study measures by whether an episode included any use of post–acute care services (skilled nursing facility, home health, or inpatient rehabilitation facility use). Finally, we aggregate the episodes into major diagnostic categories (MDCs) based on the index hospital stay’s DRG to report study outcomes by condition. Because of a shift in coding hospitalizations for pneumonia as sepsis,9,10 we exclude these two diseases from their respective MDCs and analyze them jointly as a unique category.
RESULTS
Changes in Number of Inpatient Episodes and Related Spending
From 2009 to 2017, the number of inpatient episodes per 1000 traditional Medicare beneficiaries declined from 326 to 267 (Table 1), or a relative decline of 18.2% (Figure 1). The total volume of inpatient episodes declined by only 13.4%, from 10.2 million to 8.8 million, reflecting that the size of the traditional Medicare population grew during these years. Over the same years, mean payment-rate–adjusted spending per episode increased 11.4% from $20,891 to $23,273.
When considering overall episode-related spending, the large decline in the volume of episodes outweighed increased spending per episode: the mean amount of episode-related Medicare spending per beneficiary decreased 8.9% from $6810 to $6206 (Table 1), or a net change of $604 (Figure 2). This net change reflects decreased spending due to fewer episodes per beneficiary ($1239 reduction in episode-related spending) offset by increased spending per episode (translating to a $776 increase in episode-related spending per beneficiary).
When these estimates are calculated separately for the inpatient sector and all other sectors, the inpatient sector experienced small increases in spending associated with greater spending per episode ($304) compared with noninpatient sectors ($472). Accordingly, the inpatient sector had a larger net decline in episode-related spending per beneficiary ($420) than noninpatient sectors ($184) after taking into account declining episode volume.
As expected, episode-related spending increased more when measures were not adjusted for annual payment rate increases. Without such adjustment, mean spending per episode increased 25.5%, and episode-related spending per beneficiary was nearly flat (2.6% between 2009 and 2017 [Figure 1]). The decline in unadjusted spending associated with fewer episodes ($1138) was offset by the spending increase associated with higher spending per episode ($1592) (Figure 2).
Analyses Stratified by Beneficiary Characteristics
Every population examined had declines in the number of inpatient episodes, even beneficiaries with more frequent inpatient use (Table 2). Among Medicare beneficiaries aged 85 years and older, the mean number of episodes per 1000 beneficiaries declined by 12.7%, from 524 to 457. Populations with less frequent inpatient use often experienced larger relative declines in number of episodes than populations with more frequent inpatient use. For example, the mean number of episodes per 1000 beneficiaries decreased by 17.7% for beneficiaries without nursing home use (306 to 252), as compared with an 8.1% decline for beneficiaries with nursing home use (from 888 to 816). In contrast, populations with less frequent inpatient use had larger relative increases in spending per episode with adjustment for payment rate changes. For example, spending per episode increased by 13.1% for beneficiaries aged 65 to 74 years ($20,904 to $23,644), but only by 8.6% for beneficiaries 85 years and older ($20,384 to $22,138).
Analyses Stratified by Service Use Characteristics
Some types of inpatient episodes had larger declines in the number of episodes, including episodes with planned admissions for the index hospital stay (28.8% decline from 68 to 48 episodes per 1000 beneficiaries) and episodes without post–acute care use (23.9% decline from 169 to 129 episodes per 1000 beneficiaries) (Appendix Table). In contrast, declines in the number of episodes were similar for index hospital admissions that did or did not involve ICU use (17.8% and 18.3% reduction in mean number of episodes per 1000 beneficiaries, respectively) or that included a surgical procedure or not (17.1% versus 18.6%, respectively). Several types of inpatient episodes had larger increases in spending per episode, such as a 15.1% increase for planned admissions and a 13.2% increase for hospitalizations without ICU use.
According to diagnosis information for an episode’s index hospital stay, inpatient episodes related to conditions affecting the circulatory system had the largest decline in mean number of episodes, decreasing by 31.8% from 78 to 53 episodes per 1000 beneficiaries (Appendix Table). Episodes for other diseases had much smaller declines in volume. Admissions for diagnoses of pneumonia or sepsis had notable increases in the volume of episodes, increasing by 20.7% from 25 to 30 admissions per 1000 beneficiaries.
DISCUSSION
Medicare spending per beneficiary on inpatient episodes, including services provided pre- and post hospitalization, declined by 8.9% from 2009 to 2017 after adjusting for payment rate changes. This decline reflects two components. First, the number of episodes per 1000 beneficiaries declined by 18.2%. Although the extent of this decrease varied across populations, every group examined had declines in inpatient use. In particular, hospitalizations for conditions affecting the circulatory system, such as heart attacks and cardiac procedures, decreased. Second, as inpatient volume declined, spending per episode increased by 11.4% to an average of $23,273 in 2017. This increase in spending per episode offset how much overall Medicare spending on episode-related care declined.
Medicare is increasingly challenging hospitals to demonstrate the value of inpatient services and associated treatment, which requires hospital leaders to recognize how their facilities’ spending trends relate to these national patterns. Understanding how much national episode-related spending has decreased over time with declining inpatient volume can help an accountable care organization evaluate whether it is feasible to achieve significant savings by reducing hospitalizations. Bundled payment providers focused on managing spending per episode can benefit from identifying which types of hospitalizations have increased spending per episode, especially for certain diagnoses.
These results also highlight the continued importance of a perennial factor in Medicare spending: payment rates. If Medicare payment rates had not increased over our study period, Medicare spending per inpatient episode would have increased by only 11%. Actual Medicare spending per episode increased by 25%, demonstrating that over half of the relative increase in spending per episode reflected increases in Medicare’s payment rates.
Increased spending per episode, even after adjustment for payment rate changes, suggests that services provided during an episode have increased in intensity or shifted toward higher-cost treatments.
When interpreting these trends, several points are notable. The underlying health of the Medicare population may contribute to declining inpatient use but is difficult to quantify. The observed decline in cardiac-related hospitalizations is consistent with evidence that the impact of ischemic heart disease, the leading source of disease or injury in the US population, has dramatically declined over recent decades15 and that the Medicare program has experienced large declines in overall spending and use related to cardiac conditions.16-18
Other potential factors include a shift toward hospitals treating Medicare beneficiaries as outpatients during an observation stay instead of admitting them as inpatients. Observation stays have increased as traditional Medicare implemented measures to penalize readmissions and limit payments for short inpatient stays.19-21 Even so, the increase in observation stays would have to be at least three times as large as described in other work to fully substitute for the decrease in inpatient stays: between the years 2007 and 2018, the number of observation stays per 1000 beneficiaries increased by only 26 stays, whereas the number of hospitalizations per 1000 beneficiaries decreased by 83 hospitalizations.20
Outpatient services may also broaden treatment availability in alternative settings or enable beneficiaries to avoid inpatient treatment with appropriate preventative care.22-27 These considerations are even more relevant as the COVID-19 pandemic spurred reduced admissions and shifted acute services outside of hospitals.28,29 Some services, such as elective surgeries, have probably shifted from an inpatient to an outpatient setting, which would be consistent with our finding that there are larger relative declines in planned hospitalizations. Although this analysis does not capture spending for outpatient services that are not linked to an inpatient admission, prior work demonstrates that annual growth in total Medicare spending per beneficiary (episode related or not) has recently declined for the inpatient sector but increased for outpatient and physician sectors.30 By offering other outpatient services, hospitals may be able to recoup some declining inpatient revenues. However, outpatient services are reimbursed at a lower rate than inpatient services, suggesting these trends may create financial pressure for hospitals.
There are several limitations to our analysis. First, our analysis is not designed to uncover the reason for the shift away from inpatient services nor to analyze how it has affected beneficiaries’ overall quality of care.
CONCLUSION
Over an 8-year period, Medicare spending per beneficiary on inpatient episodes, including all services immediately preceding and following hospitalizations, declined by 8.9% after taking into account payment rate increases. This broad shift away from inpatient services among all Medicare beneficiaries suggests policymakers should aim for payment policies that balance financial sustainability for hospitals and associated facilities with more efficient use of inpatient and related services.
Acknowledgments
The authors thank Sunita Thapa, Lucas Stewart, Christine Lai, and Liliana Podczerwinski for contributions in data analysis and manuscript preparation.
1. Sun R, Karaca Z, Wong HS. Trends in hospital inpatient stays by age and payer, 2000-2015: Statistical Brief #235. In: Healthcare Cost and Utilization Project (HCUP) Statistical Briefs. Agency for Healthcare Research and Quality; 2006.
2. HCUP Fast Stats - trends in inpatient stays. Healthcare Cost and Utilization Project (HCUP). April 2021. Accessed August 29, 2021. www.hcup-us.ahrq.gov/faststats/national/inpatienttrends.jsp
3. The Medicare Payment Advisory Commission. Section 1: National health care and Medicare spending. In: A Data Book: Health Care Spending and the Medicare Program. June 2018. Accessed August 13, 2021. http://www.medpac.gov/docs/default-source/data-book/jun18_databooksec1_sec.pdf
4. Buntin MB, Graves JA. How the ACA dented the cost curve. Health Aff (Millwood). 2020;39(3):403-412. https://doi.org/10.1377/hlthaff.2019.01478
5. Krumholz HM, Nuti SV, Downing NS, Normand SLT, Wang Y. Mortality, hospitalizations, and expenditures for the Medicare population aged 65 years or older, 1999-2013. JAMA. 2015;314(4):355-365. https://doi.org/10.1001/jama.2015.8035
6. Chen LM, Norton EC, Banerjee M, Regenbogen SE, Cain-Nielsen AH, Birkmeyer JD. Spending on care after surgery driven by choice of care settings instead of intensity of services. Health Aff (Millwood). 2017;36(1):83-90. https://doi.org/10.1377/hlthaff.2016.0668
7. Ibrahim AM, Nuliyalu U, Lawton EJ, et al. Evaluation of US hospital episode spending for acute inpatient conditions after the Patient Protection and Affordable Care Act. JAMA Netw Open. 2020;3(11):e2023926. https://doi.org/10.1001/jamanetworkopen.2020.23926
8. Rosen A, Aizcorbe A, Ryu AJ, Nestoriak N, Cutler DM, Chernew ME. Policy makers will need a way to update bundled payments that reflects highly skewed spending growth of various care episodes. Health Aff (Millwood). 2013;32(5):944-951. https://doi.org/10.1377/hlthaff.2012.1246
9. Lindenauer PK, Lagu T, Shieh MS, Pekow PS, Rothberg MB. Association of diagnostic coding with trends in hospitalizations and mortality of patients with pneumonia, 2003-2009. JAMA. 2012;307(13):1405-1413. https://doi.org/10.1001/jama.2012.384
10. Buntin MB, Lai C, Podczerwinski L, Poon S, Wallis C. Changing diagnosis patterns are increasing Medicare spending for inpatient hospital services. The Commonwealth Fund. April 28, 2021. Accessed August 13, 2021. https://www.commonwealthfund.org/publications/2021/apr/changing-diagnosis-patterns-are-increasing-medicare-spending-inpatient
11. The Medicare Payment Advisory Commission. Hospital inpatient and outpatient services. In: Report to the Congress: Medicare Payment Policy. . March 2018. Accessed August 13, 2021. http://www.medpac.gov/docs/default-source/reports/mar18_medpac_ch3_sec.pdf?sfvrsn=0
12. Ody C, Msall L, Dafny LS, Grabowski DC, Cutler DM. Decreases In readmissions credited to Medicare’s program to reduce hospital readmissions have been overstated. Health Aff (Millwood). 2019;38(1):36-43. https://doi.org/10.1377/hlthaff.2018.05178
13. Dharmarajan K, Qin L, Lin Z, et al. Declining admission rates and thirty-day readmission rates positively associated even though patients grew sicker over time. Health Aff (Millwood). 2016;35(7):1294-1302. https://doi.org/10.1377/hlthaff.2015.1614
14. Sjoding MW, Prescott HC, Wunsch H, Iwashyna TJ, Cooke CR. Longitudinal changes in ICU admissions among elderly patients in the United States. Crit Care Med. 2016;44(7):1353-1360. https://doi.org/10.1097/CCM.0000000000001664
15. Murray CJ, Atkinson C, Bhalla K, et al. The state of US health, 1990-2010: burden of diseases, injuries, and risk factors. JAMA. 2013;310(6):591-608. https://doi.org/10.1001/jama.2013.13805
16. Cutler DM, Ghosh K, Messer KL, Raghunathan TE, Stewart ST, Rosen AB. Explaining the slowdown in medical spending growth among the elderly, 1999-2012. Health Aff (Millwood). 2019;38(2):222-229. https://doi.org/10.1377/hlthaff.2018.05372
17. Ward MJ, Kripalani S, Zhu Y, et al. Incidence of emergency department visits for ST-elevation myocardial infarction in a recent six-year period in the United States. Am J Cardiol. 2015;115(2):167-170. https://doi.org/10.1016/j.amjcard.2014.10.020
18. Keohane LM, Gambrel RJ, Freed SS, Stevenson D, Buntin MB. Understanding trends in Medicare spending, 2007-2014. Health Serv Res. 2018;53(5):3507-3527. https://doi.org/10.1111/1475-6773.12845
19. Nuckols TK, Fingar KR, Barrett M, Steiner CA, Stocks C, Owens PL. The shifting landscape in utilization of inpatient, observation, and emergency department services across payers. J Hosp Med. 2017;12(6):443-446. https://doi.org/10.12788/jhm.2751
20. Poon SJ, Wallis CJ, Lai P, Podczerwinski L, Buntin MB. Medicare two-midnight rule accelerated shift to observation stays. Health Affairs. In press.
21. Sheehy AM, Kaiksow F, Powell WR, et al. The Hospital Readmissions Reduction Program and observation hospitalizations. J Hosp Med. 2021;16(7):409-411. https://doi.org/10.12788/jhm.3634
22. Culler SD, Parchman ML, Przybylski M. Factors related to potentially preventable hospitalizations among the elderly. Med Care. 1998;36(6):804-817. https://doi.org/10.1097/00005650-199806000-00004
23. Kozak LJ, Hall MJ, Owings MF. Trends in avoidable hospitalizations, 1980-1998. Health Aff (Millwood). 2001;20(2):225-232. https://doi.org/10.1377/hlthaff.20.2.225
24. Ouslander JG, Lamb G, Perloe M, et al. Potentially avoidable hospitalizations of nursing home residents: frequency, causes, and costs. J Am Geriatr Soc. 2010;58(4):627-635. https://doi.org/10.1111/j.1532-5415.2010.02768.x
25. Konetzka RT, Karon SL, Potter DEB. Users of Medicaid home and community-based services are especially vulnerable to costly avoidable hospital admissions. Health Aff (Millwood). 2012;31(6):1167-1175. https://doi.org/10.1377/hlthaff.2011.0902
26. Nyweide DJ, Anthony DL, Bynum JPW, et al. Continuity of care and the risk of preventable hospitalization in older adults. JAMA Intern Med. 2013;173(20):1879-1885. https://doi.org/10.1001/jamainternmed.2013.10059
27. Auerbach AD, Kripalani S, Vasilevskis EE, et al. Preventability and causes of readmissions in a national cohort of general medicine patients. JAMA Intern Med. 2016;176(4):484-493. https://doi.org/10.1001/jamainternmed.2015.7863
28. Birkmeyer JD, Barnato A, Birkmeyer N, Bessler R, Skinner J. The impact of the COVID-19 pandemic on hospital admissions in the United States. Health Aff (Millwood). 2020;39(11):2010-2017. https://doi.org/10.1377/hlthaff.2020.00980
29. Nundy S, Patel KK. Hospital-at-home to support COVID-19 surge—time to bring down the walls? JAMA Health Forum. 2020;1(5):e200504. https://doi.org/10.1001/jamahealthforum.2020.0504
30. Keohane LM, Stevenson DG, Freed S, Thapa S, Stewart L, Buntin MB. Trends in Medicare fee-for-service spending growth for dual-eligible beneficiaries, 2007–15. Health Aff (Millwood). 2018;37(8):1265-1273. https://doi.org/10.1377/hlthaff.2018.0143
31. Freed M, Biniek JF, Damico A, Neuman T. Medicare Advantage in 2021: enrollment update and key trends. June 21, 2021. Accessed August 13, 2021. https://www.kff.org/medicare/issue-brief/medicare-advantage-in-2021-enrollment-update-and-key-trends/
32. Li Q, Rahman M, Gozalo P, Keohane LM, Gold MR, Trivedi AN. Regional variations: the use of hospitals, home health, and skilled nursing in traditional Medicare and Medicare Advantage. Health Aff (Millwood). 2018;37(8):1274-1281. https://doi.org/10.1377/hlthaff.2018.0147
© 2021 Society of Hospital Medicine
Dearth of Hospitalist Investigators in Academic Medicine: A Call to Action
In their report celebrating the increase in the number of hospitalists from a few hundred in the 1990s to more than 50,000 in 2016, Drs Robert Wachter and Lee Goldman also noted the stunted growth of productive hospital medicine research programs, which presents a challenge to academic credibility in hospital medicine.1 Given the substantial increase in the number of hospitalists over the past two decades, we surveyed adult academic hospital medicine groups to quantify the number of hospitalist clinician investigators and identify gaps in resources for researchers. The number of clinician investigators supported at academic medical centers (AMCs) remains disturbingly low despite the rapid growth of our specialty. Some programs also reported a lack of access to fundamental research services. We report selected results from our survey and provide recommendations to support and facilitate the development of clinician investigators in hospital medicine.
DEARTH OF CLINICIAN INVESTIGATORS IN HOSPITAL MEDICINE
We performed a survey of hospital medicine programs at AMCs in the United States through the Hospital Medicine Reengineering Network (HOMERuN), a hospital medicine research collaborative that facilitates and conducts multisite research studies.2 The purpose of this survey was to obtain a profile of adult academic hospital medicine groups. Surveys were distributed via email to directors and/or senior leaders of each hospital medicine group between January and August 2019. In the survey, a clinician investigator was defined as “faculty whose primary nonclinical focus is scientific papers and grant writing.”
We received responses from 43 of the 86 invitees (50%), each of whom represented a unique hospital medicine group; 41 of the representatives responded to the questions concerning available research services. Collectively, these 43 programs represented 2,503 hospitalists. There were 79 clinician investigators reported among all surveyed hospital medicine groups (3.1% of all hospitalists). The median number of clinician investigators per hospital medicine group was 0 (range 0-12) (Appendix Figure 1), and 22 of 43 (51.2%) hospital medicine groups reported having no clinician investigators. Two of the hospital medicine groups, however, reported having 12 clinician investigators at their respective institutions, comprising nearly one third of the total number of clinician investigators reported in the survey.
Many of the programs reported lack of access to resources such as research assistants (56.1%) and dedicated research fellowships (53.7%) (Appendix Figure 2). A number of groups reported a need for more support for various junior faculty development activities, including research mentoring (53.5%), networking with other researchers (60.5%), and access to clinical data from multiple sites (62.8%).
One of the limitations of this survey was the manner in which the participating hospital medicine groups were chosen. Selection was based on groups affiliated with HOMERuN; among those chosen were highly visible US AMCs, including 70% of the top 20 AMCs based on National Institutes of Health (NIH) funding.3 Therefore, our results likely overestimate the research presence of hospital medicine across all AMCs in the United States.
LACK OF GROWTH OVER TIME: CONTEXTUALIZATION AND IMPLICATIONS
Despite the substantial growth of hospital medicine over the past 2 decades, there has been no proportional increase in the number of hospitalist clinician investigators, with earlier surveys also demonstrating low numbers.4,5 Along with the survey by Chopra and colleagues published in 2019,6 our survey provides an additional contemporary appraisal of research activities for adult academic hospital medicine groups. In the survey by Chopra et al, only 54% (15 of 28) of responding programs reported having any faculty with research as their major activity (ie, >50% effort), and 3% of total faculty reported having funding for >50% effort toward research.6 Our study expands upon these findings by providing more detailed data on the number of clinician investigators per hospital medicine group. Results of our survey showed a concentration of hospitalists within a small number of programs, which may have contributed to the observed lack of growth. We also expand on prior work by identifying a lack of resources and services to support hospitalist researchers.
The findings of our survey have important implications for the field of hospital medicine. Without a critical mass of hospitalist clinician investigators, the quality of research that addresses important questions in our field will suffer. It will also limit academic credibility of the field, as well as individual academic achievement; previous studies have consistently demonstrated that few hospitalists at AMCs achieve the rank of associate or full professor.5-9
POTENTIAL EXPLANATIONS FOR LACK OF RESEARCH GROWTH
The results of our study additionally offer possible explanations for the dearth of clinician investigators in hospital medicine. The limited access to research resources and fellowship training identified in our survey are critical domains that must be addressed in order to develop successful academic hospital medicine programs.4,6,8,10
Regarding dedicated hospital medicine research fellowships, there are only a handful across the country. The small number of existing research fellowships only have one or two fellows per year, and these positions often go unfilled because of a lack of applicants and lower salaries compared to full-time clinical positions.11 The lack of applicants for adult hospital medicine fellowship positions is also integrally linked to board certification requirements. Unlike pediatric hospital medicine where additional fellowship training is required to become board-certified, no such fellowship is required in adult hospital medicine. In pediatrics, this requirement has led to a rapid increase in the number of fellowships with scholarly work requirements (more than 60 fellowships, plus additional programs in development) and greater standardization among training experiences.12,13
The lack of fellowship applicants may also stem from the fact that many trainees are not aware of a potential career as a hospitalist clinician investigator due to limited exposure to this career at most AMCs. Our results revealed that nearly half of sites in our survey had zero clinician investigators, depriving trainees at these programs of role models and thus perpetuating a negative feedback loop. Lastly, although unfilled fellowship positions may indicate that demand is a larger problem than supply, it is also true that fellowship programs generate their own demand through recruitment efforts and the gradual establishment of a positive reputation.
Another potential explanation could relate to the development of hospital medicine in response to rising clinical demands at hospitals: compared with other medical specialties, AMCs may regard hospitalists as being clinicians first and academicians second.1,7,10 Also, hospitalists may be perceived as being beholden to hospitals and less engaged with their surrounding communities than other general medicine fields. With a small footprint in health equity research, academic hospital medicine may be less of a draw to generalists interested in pursuing this area of research. Further, there are very few underrepresented in medicine (URiM) hospital medicine research faculty.5
Another challenge to the career development of hospitalist researchers is the lack of available funding for the type of research typically conducted by hospitalists (eg, rigorous quality improvement implementation and evaluation, optimizing best evidence-based care delivery models, evaluation of patient safety in the hospital setting). As hospitalists tend to be system-level thinkers, this lack of funding may steer potential researchers away from externally funded research careers and into hospital operations and quality improvement positions. Also, unlike other medical specialties, there is no dedicated NIH funding source for hospital medicine research (eg, cardiology and the National Heart, Lung, and Blood Institute), placing hospitalists at a disadvantage in seeking funding compared to subspecialists.
STRATEGIES TO ENHANCE RESEARCH PRESENCE
We recommend several approaches—ones that should be pursued simultaneously—to increase the number of clinician investigators in hospital medicine. First, hospital medicine groups and their respective divisions, departments, and hospitals should allocate funding to support research resources; this includes investing in research assistants, data analysts, statisticians, and administrative support. Through the funding of such research infrastructure programs, AMCs could incentivize hospitalists to research best approaches to improve the value of healthcare delivery, ultimately leading to cost savings.
With 60% of respondents identifying the need for improved access to data across multiple sites, our survey also emphasizes the requirement for further collaboration among hospital medicine groups. Such collaboration could lead to high-powered observational studies and the evaluation of interventions across multiple sites, thus improving the generalizability of study findings.
The Society of Hospital Medicine (SHM) and its research committee can continue to expand the research footprint of hospital medicine. To date, the committee has achieved this by highlighting hospitalist research activity at the SHM Annual Conference Scientific Abstract and Poster Competition and developing a visiting professorship exchange program. In addition to these efforts, SHM could foster collaboration and networking between institutions, as well as take advantage of the current political push for expanded Medicare access by lobbying for robust funding for the Agency for Healthcare Research and Quality, which could provide more opportunities for hospitalists to study the effects of healthcare policy reform on the delivery of inpatient care.
Another strategy to increase the number of hospitalist clinician investigators is to expand hospital medicine research fellowships and recruit trainees for these programs. Fellowships could be internally funded wherein a fellow’s clinical productivity is used to offset the costs associated with obtaining advanced degrees. As an incentive to encourage applicants to temporarily forego a full-time clinical salary during fellowship, hospital medicine groups could offer expanded moonlighting opportunities and contribute to repayment of medical school loans. Hospital medicine groups should also advocate for NIH-funded T32 or K12 training grants for hospital medicine. (There are, however, challenges with this approach because the number of T32 spots per NIH institute is usually fixed). The success of academic emergency medicine offers a precedent for such efforts: After the development of a K12 research training program in emergency medicine, the number of NIH-sponsored principal investigators in this specialty increased by 40% in 6 years.14 Additionally, now that fellowships are required for the pediatric hospital medicine clinician investigators, it would be revealing to track the growth of this workforce.12,13
Structured and formalized mentorship is an essential part of the development of clinician investigators in hospital medicine.4,7,8,10 One successful strategy for mentorship has been the partnering of hospital medicine groups with faculty of general internal medicine and other subspecialty divisions with robust research programs.7,8,15 In addition to developing sustainable mentorship programs, hospital medicine researchers must increase their visibility to trainees. Therefore, it is essential that the majority of academic hospital medicine groups not only hire clinician investigators but also invest in their development, rather than rely on the few programs that have several such faculty members. With this strategy, we could dramatically increase the number of hospitalist clinician investigators from a diverse background of training institutions.
SHM could also play a greater role in organizing events for networking and mentoring for trainees and medical students interested in pursuing a career in hospital medicine research. It is also critically important that hospital medicine groups actively recruit, retain, and develop URiM hospital medicine research faculty in order to attract talented researchers and actively participate in the necessary effort to mitigate the inequities prevalent throughout our healthcare system.
CONCLUSION
Despite the growth of hospital medicine over the past decade, there remains a dearth of hospitalist clinician investigators at major AMCs in the United States. This may be due in part to lack of research resources and mentorship within hospital medicine groups. We believe that investment in these resources, expanded funding opportunities, mentorship development, research fellowship programs, and greater exposure of trainees to hospitalist researchers are solutions that should be strongly considered to develop hospitalist clinician investigators.
Acknowledgments
The authors thank HOMERuN executive committee members, including Grant Fletcher, MD, James Harrison, PhD, BSC, MPH, Peter K. Lindenauer, MD, Melissa Mattison, MD, David Meltzer, MD, PhD, Joshua Metlay, MD, PhD, Jennifer Myers, MD, Sumant Ranji, MD, Gregory Ruhnke, MD, MPH, Edmondo Robinson, MD, MBA, and Neil Sehgal, MPH PhD, for their assistance in developing the survey. They also thank Tiffany Lee, MA, for her project management assistance for HOMERuN.
1. Wachter RM, Goldman L. Zero to 50,000 – The 20th anniversary of the hospitalist. N Engl J Med. 2016;375(11):1009-1011. https://doi.org/10.1056/NEJMp1607958
2. Auerbach AD, Patel MS, Metlay JP, et al. The Hospital Medicine Reengineering Network (HOMERuN): a learning organization focused on improving hospital care. Acad Med. 2014;89(3):415-420. https://doi.org/10.1097/acm.0000000000000139
3. Roskoski R Jr, Parslow TG. Ranking Tables of NIH funding to US medical schools in 2019. Blue Ridge Institute for Medical Research. Published 2020. Updated July 14, 2020. Accessed July 30, 2020. http://www.brimr.org/NIH_Awards/2019/NIH_Awards_2019.htm
4. Reid MB, Misky GJ, Harrison RA, Sharpe B, Auerbach A, Glasheen JJ. Mentorship, productivity, and promotion among academic hospitalists. J Gen Intern Med. 2012;27(1):23-27. https://doi.org/10.1007/s11606-011-1892-5
5. Miller CS, Fogerty RL, Gann J, Bruti CP, Klein R; The Society of General Internal Medicine Membership Committee. The growth of hospitalists and the future of the society of general internal medicine: results from the 2014 membership survey. J Gen Intern Med. 2017;32(11):1179-1185. https://doi.org/10.1007/s11606-017-4126-7
6. Chopra V, Burden M, Jones CD, et al; Society of Hospital Medicine Research Committee. State of research in adult hospital medicine: results of a national survey. J Hosp Med. 2019;14(4):207-211. https://doi.org/10.12788/jhm.3136
7. Seymann GB, Southern W, Burger A, et al. Features of successful academic hospitalist programs: insights from the SCHOLAR (SuCcessful HOspitaLists in academics and research) project. J Hosp Med. 2016;11(10):708-713. https://doi.org/10.1002/jhm.2603
8. Harrison R, Hunter AJ, Sharpe B, Auerbach AD. Survey of US academic hospitalist leaders about mentorship and academic activities in hospitalist groups. J Hosp Med. 2011;6(1):5-9. https://doi.org/10.1002/jhm.836
9. Dang Do AN, Munchhof AM, Terry C, Emmett T, Kara A. Research and publication trends in hospital medicine. J Hosp Med. 2014;9(3):148-154. https://doi.org/10.1002/jhm.2148
10. Sehgal NL, Sharpe BA, Auerbach AA, Wachter RM. Investing in the future: building an academic hospitalist faculty development program. J Hosp Med. 2011;6(3):161-166. https://doi.org/10.1002/jhm.845
11. Ranji SR, Rosenman DJ, Amin AN, Kripalani S. Hospital medicine fellowships: works in progress. Am J Med. 2006;119(1):72.e1-72.e7. https://doi.org/10.1016/j.amjmed.2005.07.061
12. Shah NH, Rhim HJ, Maniscalco J, Wilson K, Rassbach C. The current state of pediatric hospital medicine fellowships: a survey of program directors. J Hosp Med. 2016;11(5):324-328. https://doi.org/10.1002/jhm.2571
13. Jerardi KE, Fisher E, Rassbach C, et al; Council of Pediatric Hospital Medicine Fellowship Directors. Development of a curricular framework for pediatric hospital medicine fellowships. Pediatrics. 2017;140(1):e20170698. https://doi.org/10.1542/peds.2017-0698
14. Lewis RJ, Neumar RW. Research in emergency medicine: building the investigator pipeline. Ann Emerg Med. 2018;72(6):691-695. https://doi.org/10.1016/j.annemergmed.2018.10.019
15. Flanders SA, Kaufman SR, Nallamothu BK, Saint S. The University of Michigan Specialist-Hospitalist Allied Research Program: jumpstarting hospital medicine research. J Hosp Med. 2008;3(4):308-313. https://doi.org/10.1002/jhm.342
In their report celebrating the increase in the number of hospitalists from a few hundred in the 1990s to more than 50,000 in 2016, Drs Robert Wachter and Lee Goldman also noted the stunted growth of productive hospital medicine research programs, which presents a challenge to academic credibility in hospital medicine.1 Given the substantial increase in the number of hospitalists over the past two decades, we surveyed adult academic hospital medicine groups to quantify the number of hospitalist clinician investigators and identify gaps in resources for researchers. The number of clinician investigators supported at academic medical centers (AMCs) remains disturbingly low despite the rapid growth of our specialty. Some programs also reported a lack of access to fundamental research services. We report selected results from our survey and provide recommendations to support and facilitate the development of clinician investigators in hospital medicine.
DEARTH OF CLINICIAN INVESTIGATORS IN HOSPITAL MEDICINE
We performed a survey of hospital medicine programs at AMCs in the United States through the Hospital Medicine Reengineering Network (HOMERuN), a hospital medicine research collaborative that facilitates and conducts multisite research studies.2 The purpose of this survey was to obtain a profile of adult academic hospital medicine groups. Surveys were distributed via email to directors and/or senior leaders of each hospital medicine group between January and August 2019. In the survey, a clinician investigator was defined as “faculty whose primary nonclinical focus is scientific papers and grant writing.”
We received responses from 43 of the 86 invitees (50%), each of whom represented a unique hospital medicine group; 41 of the representatives responded to the questions concerning available research services. Collectively, these 43 programs represented 2,503 hospitalists. There were 79 clinician investigators reported among all surveyed hospital medicine groups (3.1% of all hospitalists). The median number of clinician investigators per hospital medicine group was 0 (range 0-12) (Appendix Figure 1), and 22 of 43 (51.2%) hospital medicine groups reported having no clinician investigators. Two of the hospital medicine groups, however, reported having 12 clinician investigators at their respective institutions, comprising nearly one third of the total number of clinician investigators reported in the survey.
Many of the programs reported lack of access to resources such as research assistants (56.1%) and dedicated research fellowships (53.7%) (Appendix Figure 2). A number of groups reported a need for more support for various junior faculty development activities, including research mentoring (53.5%), networking with other researchers (60.5%), and access to clinical data from multiple sites (62.8%).
One of the limitations of this survey was the manner in which the participating hospital medicine groups were chosen. Selection was based on groups affiliated with HOMERuN; among those chosen were highly visible US AMCs, including 70% of the top 20 AMCs based on National Institutes of Health (NIH) funding.3 Therefore, our results likely overestimate the research presence of hospital medicine across all AMCs in the United States.
LACK OF GROWTH OVER TIME: CONTEXTUALIZATION AND IMPLICATIONS
Despite the substantial growth of hospital medicine over the past 2 decades, there has been no proportional increase in the number of hospitalist clinician investigators, with earlier surveys also demonstrating low numbers.4,5 Along with the survey by Chopra and colleagues published in 2019,6 our survey provides an additional contemporary appraisal of research activities for adult academic hospital medicine groups. In the survey by Chopra et al, only 54% (15 of 28) of responding programs reported having any faculty with research as their major activity (ie, >50% effort), and 3% of total faculty reported having funding for >50% effort toward research.6 Our study expands upon these findings by providing more detailed data on the number of clinician investigators per hospital medicine group. Results of our survey showed a concentration of hospitalists within a small number of programs, which may have contributed to the observed lack of growth. We also expand on prior work by identifying a lack of resources and services to support hospitalist researchers.
The findings of our survey have important implications for the field of hospital medicine. Without a critical mass of hospitalist clinician investigators, the quality of research that addresses important questions in our field will suffer. It will also limit academic credibility of the field, as well as individual academic achievement; previous studies have consistently demonstrated that few hospitalists at AMCs achieve the rank of associate or full professor.5-9
POTENTIAL EXPLANATIONS FOR LACK OF RESEARCH GROWTH
The results of our study additionally offer possible explanations for the dearth of clinician investigators in hospital medicine. The limited access to research resources and fellowship training identified in our survey are critical domains that must be addressed in order to develop successful academic hospital medicine programs.4,6,8,10
Regarding dedicated hospital medicine research fellowships, there are only a handful across the country. The small number of existing research fellowships only have one or two fellows per year, and these positions often go unfilled because of a lack of applicants and lower salaries compared to full-time clinical positions.11 The lack of applicants for adult hospital medicine fellowship positions is also integrally linked to board certification requirements. Unlike pediatric hospital medicine where additional fellowship training is required to become board-certified, no such fellowship is required in adult hospital medicine. In pediatrics, this requirement has led to a rapid increase in the number of fellowships with scholarly work requirements (more than 60 fellowships, plus additional programs in development) and greater standardization among training experiences.12,13
The lack of fellowship applicants may also stem from the fact that many trainees are not aware of a potential career as a hospitalist clinician investigator due to limited exposure to this career at most AMCs. Our results revealed that nearly half of sites in our survey had zero clinician investigators, depriving trainees at these programs of role models and thus perpetuating a negative feedback loop. Lastly, although unfilled fellowship positions may indicate that demand is a larger problem than supply, it is also true that fellowship programs generate their own demand through recruitment efforts and the gradual establishment of a positive reputation.
Another potential explanation could relate to the development of hospital medicine in response to rising clinical demands at hospitals: compared with other medical specialties, AMCs may regard hospitalists as being clinicians first and academicians second.1,7,10 Also, hospitalists may be perceived as being beholden to hospitals and less engaged with their surrounding communities than other general medicine fields. With a small footprint in health equity research, academic hospital medicine may be less of a draw to generalists interested in pursuing this area of research. Further, there are very few underrepresented in medicine (URiM) hospital medicine research faculty.5
Another challenge to the career development of hospitalist researchers is the lack of available funding for the type of research typically conducted by hospitalists (eg, rigorous quality improvement implementation and evaluation, optimizing best evidence-based care delivery models, evaluation of patient safety in the hospital setting). As hospitalists tend to be system-level thinkers, this lack of funding may steer potential researchers away from externally funded research careers and into hospital operations and quality improvement positions. Also, unlike other medical specialties, there is no dedicated NIH funding source for hospital medicine research (eg, cardiology and the National Heart, Lung, and Blood Institute), placing hospitalists at a disadvantage in seeking funding compared to subspecialists.
STRATEGIES TO ENHANCE RESEARCH PRESENCE
We recommend several approaches—ones that should be pursued simultaneously—to increase the number of clinician investigators in hospital medicine. First, hospital medicine groups and their respective divisions, departments, and hospitals should allocate funding to support research resources; this includes investing in research assistants, data analysts, statisticians, and administrative support. Through the funding of such research infrastructure programs, AMCs could incentivize hospitalists to research best approaches to improve the value of healthcare delivery, ultimately leading to cost savings.
With 60% of respondents identifying the need for improved access to data across multiple sites, our survey also emphasizes the requirement for further collaboration among hospital medicine groups. Such collaboration could lead to high-powered observational studies and the evaluation of interventions across multiple sites, thus improving the generalizability of study findings.
The Society of Hospital Medicine (SHM) and its research committee can continue to expand the research footprint of hospital medicine. To date, the committee has achieved this by highlighting hospitalist research activity at the SHM Annual Conference Scientific Abstract and Poster Competition and developing a visiting professorship exchange program. In addition to these efforts, SHM could foster collaboration and networking between institutions, as well as take advantage of the current political push for expanded Medicare access by lobbying for robust funding for the Agency for Healthcare Research and Quality, which could provide more opportunities for hospitalists to study the effects of healthcare policy reform on the delivery of inpatient care.
Another strategy to increase the number of hospitalist clinician investigators is to expand hospital medicine research fellowships and recruit trainees for these programs. Fellowships could be internally funded wherein a fellow’s clinical productivity is used to offset the costs associated with obtaining advanced degrees. As an incentive to encourage applicants to temporarily forego a full-time clinical salary during fellowship, hospital medicine groups could offer expanded moonlighting opportunities and contribute to repayment of medical school loans. Hospital medicine groups should also advocate for NIH-funded T32 or K12 training grants for hospital medicine. (There are, however, challenges with this approach because the number of T32 spots per NIH institute is usually fixed). The success of academic emergency medicine offers a precedent for such efforts: After the development of a K12 research training program in emergency medicine, the number of NIH-sponsored principal investigators in this specialty increased by 40% in 6 years.14 Additionally, now that fellowships are required for the pediatric hospital medicine clinician investigators, it would be revealing to track the growth of this workforce.12,13
Structured and formalized mentorship is an essential part of the development of clinician investigators in hospital medicine.4,7,8,10 One successful strategy for mentorship has been the partnering of hospital medicine groups with faculty of general internal medicine and other subspecialty divisions with robust research programs.7,8,15 In addition to developing sustainable mentorship programs, hospital medicine researchers must increase their visibility to trainees. Therefore, it is essential that the majority of academic hospital medicine groups not only hire clinician investigators but also invest in their development, rather than rely on the few programs that have several such faculty members. With this strategy, we could dramatically increase the number of hospitalist clinician investigators from a diverse background of training institutions.
SHM could also play a greater role in organizing events for networking and mentoring for trainees and medical students interested in pursuing a career in hospital medicine research. It is also critically important that hospital medicine groups actively recruit, retain, and develop URiM hospital medicine research faculty in order to attract talented researchers and actively participate in the necessary effort to mitigate the inequities prevalent throughout our healthcare system.
CONCLUSION
Despite the growth of hospital medicine over the past decade, there remains a dearth of hospitalist clinician investigators at major AMCs in the United States. This may be due in part to lack of research resources and mentorship within hospital medicine groups. We believe that investment in these resources, expanded funding opportunities, mentorship development, research fellowship programs, and greater exposure of trainees to hospitalist researchers are solutions that should be strongly considered to develop hospitalist clinician investigators.
Acknowledgments
The authors thank HOMERuN executive committee members, including Grant Fletcher, MD, James Harrison, PhD, BSC, MPH, Peter K. Lindenauer, MD, Melissa Mattison, MD, David Meltzer, MD, PhD, Joshua Metlay, MD, PhD, Jennifer Myers, MD, Sumant Ranji, MD, Gregory Ruhnke, MD, MPH, Edmondo Robinson, MD, MBA, and Neil Sehgal, MPH PhD, for their assistance in developing the survey. They also thank Tiffany Lee, MA, for her project management assistance for HOMERuN.
1. Wachter RM, Goldman L. Zero to 50,000 – The 20th anniversary of the hospitalist. N Engl J Med. 2016;375(11):1009-1011. https://doi.org/10.1056/NEJMp1607958
2. Auerbach AD, Patel MS, Metlay JP, et al. The Hospital Medicine Reengineering Network (HOMERuN): a learning organization focused on improving hospital care. Acad Med. 2014;89(3):415-420. https://doi.org/10.1097/acm.0000000000000139
3. Roskoski R Jr, Parslow TG. Ranking Tables of NIH funding to US medical schools in 2019. Blue Ridge Institute for Medical Research. Published 2020. Updated July 14, 2020. Accessed July 30, 2020. http://www.brimr.org/NIH_Awards/2019/NIH_Awards_2019.htm
4. Reid MB, Misky GJ, Harrison RA, Sharpe B, Auerbach A, Glasheen JJ. Mentorship, productivity, and promotion among academic hospitalists. J Gen Intern Med. 2012;27(1):23-27. https://doi.org/10.1007/s11606-011-1892-5
5. Miller CS, Fogerty RL, Gann J, Bruti CP, Klein R; The Society of General Internal Medicine Membership Committee. The growth of hospitalists and the future of the society of general internal medicine: results from the 2014 membership survey. J Gen Intern Med. 2017;32(11):1179-1185. https://doi.org/10.1007/s11606-017-4126-7
6. Chopra V, Burden M, Jones CD, et al; Society of Hospital Medicine Research Committee. State of research in adult hospital medicine: results of a national survey. J Hosp Med. 2019;14(4):207-211. https://doi.org/10.12788/jhm.3136
7. Seymann GB, Southern W, Burger A, et al. Features of successful academic hospitalist programs: insights from the SCHOLAR (SuCcessful HOspitaLists in academics and research) project. J Hosp Med. 2016;11(10):708-713. https://doi.org/10.1002/jhm.2603
8. Harrison R, Hunter AJ, Sharpe B, Auerbach AD. Survey of US academic hospitalist leaders about mentorship and academic activities in hospitalist groups. J Hosp Med. 2011;6(1):5-9. https://doi.org/10.1002/jhm.836
9. Dang Do AN, Munchhof AM, Terry C, Emmett T, Kara A. Research and publication trends in hospital medicine. J Hosp Med. 2014;9(3):148-154. https://doi.org/10.1002/jhm.2148
10. Sehgal NL, Sharpe BA, Auerbach AA, Wachter RM. Investing in the future: building an academic hospitalist faculty development program. J Hosp Med. 2011;6(3):161-166. https://doi.org/10.1002/jhm.845
11. Ranji SR, Rosenman DJ, Amin AN, Kripalani S. Hospital medicine fellowships: works in progress. Am J Med. 2006;119(1):72.e1-72.e7. https://doi.org/10.1016/j.amjmed.2005.07.061
12. Shah NH, Rhim HJ, Maniscalco J, Wilson K, Rassbach C. The current state of pediatric hospital medicine fellowships: a survey of program directors. J Hosp Med. 2016;11(5):324-328. https://doi.org/10.1002/jhm.2571
13. Jerardi KE, Fisher E, Rassbach C, et al; Council of Pediatric Hospital Medicine Fellowship Directors. Development of a curricular framework for pediatric hospital medicine fellowships. Pediatrics. 2017;140(1):e20170698. https://doi.org/10.1542/peds.2017-0698
14. Lewis RJ, Neumar RW. Research in emergency medicine: building the investigator pipeline. Ann Emerg Med. 2018;72(6):691-695. https://doi.org/10.1016/j.annemergmed.2018.10.019
15. Flanders SA, Kaufman SR, Nallamothu BK, Saint S. The University of Michigan Specialist-Hospitalist Allied Research Program: jumpstarting hospital medicine research. J Hosp Med. 2008;3(4):308-313. https://doi.org/10.1002/jhm.342
© 2021 Society of Hospital Medicine
Hospital Ward Adaptation During the COVID-19 Pandemic: A National Survey of Academic Medical Centers
The coronavirus disease of 2019 (COVID-19) pandemic has resulted in a surge in hospitalizations of patients with a novel, serious, and highly contagious infectious disease for which there is yet no proven treatment. Currently, much of the focus has been on intensive care unit (ICU) and ventilator capacity for the sickest of these patients who develop respiratory failure. However, most hospitalized patients are being cared for in general medical units.1 Some evidence exists to describe adaptations to capacity needs outside of medical wards,2-4 but few studies have specifically addressed the ward setting. Therefore, there is a pressing need for evidence to describe how to expand capacity and deliver medical ward–based care.
To better understand how inpatient care in the United States is adapting to the COVID-19 pandemic, we surveyed 72 sites participating in the Hospital Medicine Reengineering Network (HOMERuN), a national consortium of hospital medicine groups.5 We report results of this survey, carried out between April 3 and April 5, 2020.
METHODS
Sites and Subjects
HOMERuN is a collaborative network of hospitalists from across the United States whose primary goal is to catalyze research and share best practices across hospital medicine groups. Using surveys of Hospital Medicine leaders, targeted medical record review, and other methods, HOMERuN’s funded research interests to date have included care transitions, workforce issues, patient and family engagement, and diagnostic errors. Sites participating in HOMERuN sites are relatively large urban academic medical centers (Appendix).
Survey Development and Deployment
We designed a focused survey that aimed to provide a snapshot of evolving operational and clinical aspects of COVID-19 care (Appendix). Domains included COVID-19 testing turnaround times, personal protective equipment (PPE) stewardship,6 features of respiratory isolation units (RIUs; ie, dedicated units for patients with known or suspected COVID-19), and observed effects on clinical care. We tested the instrument to ensure feasibility and clarity internally, performed brief cognitive testing with several hospital medicine leaders in HOMERuN, then disseminated the survey by email on April 3, with two follow-up emails on 2 subsequent days. Our study was deemed non–human subjects research by the University of California, San Francisco, Committee on Human Research. Descriptive statistics were used to characterize survey responses.
RESULTS
Of 72 hospitals surveyed, 51 (71%) responded. Mean hospital bed count was 940, three were safety-net hospitals, and one was a community-based teaching center; responding and nonresponding hospitals did not differ significantly in terms of bed count (Appendix).
Health System Adaptations, Testing, and PPE Status
Nearly all responding hospitals (46 of 51; 90%) had RIUs for patients with known or suspected COVID-19 (Table 1). Nearly all hospitals took steps to keep potentially sick healthcare providers from infecting others (eg, staying home if sick or exposed). Among respondents, 32% had rapid response teams, 24% had respiratory therapy teams, and 29% had case management teams that were dedicated to COVID-19 care. Thirty-two (63%) had developed models, such as ethics or palliative care consult services, to assist with difficult resource-allocation decisions (eg, how to prioritize ventilator use if demand exceeded supply). Twenty-three (45%) had developed post-acute care monitoring programs dedicated to COVID-19 patients.

At the time of our survey, only 2 sites (4%) reported COVID-19 test time turnaround under 1 hour, and 15 (30%) reported turnaround in less than 6 hours. Of the 29 sites able to provide estimates of PPE stockpile, 14 (48%) reported a supply of 2 weeks or less. The most common approaches to PPE stewardship focused on reuse of masks and face shields if not obviously soiled, centralizing PPE distribution, and disinfecting or sterilizing masks. Ten sites (20%) were utilizing 3-D printed masks, while 10% used homemade face shields or masks.
Characteristics of COVID-19 RIUs
Forty-six hospitals (90% of all respondents) in our cohort had developed RIUs at the time of survey administration. The earliest RIU implementation date was February 10, 2020, and the most recent was launched on the day of our survey. Admission to RIUs was primarily based on clinical factors associated with known or suspected COVID-19 infection (Table 2). The number of non–critical care RIU beds among locations at that time ranged from 10 or less to more than 50. The mean number of hospitalist attendings caring for patients in the RIUs was 10.2, with a mean 4.1 advanced practice providers, 5.5 residents, and 0 medical students. The number of planned patients per attending was typically 5 to 15. Nurses and physicians typically rounded separately. Medical distancing (eg, reducing patient room entry) was accomplished most commonly by grouped timing of medication administration (76% of sites), video links to room outside of rounding times (54% of sites), the use of video or telemedicine during rounds (17%), and clustering of activities such as medication administration or phlebotomy. The most common criteria prompting discharge from the RIU were a negative COVID-19 test (59%) and hospital discharge (57%), though comments from many respondents suggested that discharge criteria were changing rapidly.

Effects of Isolation Measures on In-Room Encounters and Diagnostic Processes
More than 90% of sites reported decreases in in-room encounter frequency across all provider types whether as a result of policies in place or not. Reductions were reported among hospitalists, advanced practice providers, residents, consultants, and therapists (Table 3). Reduced room entry most often resulted from an established or developing policy, but many noted reduced room entry without formal policies in place. Nearly all sites reported moving specialty consultations to phone or video evaluations. Diagnostic error was commonly reported, with missed non–COVID-19 medical diagnoses among COVID-19 infected patients being reported by 22 sites (46%) and missed COVID-19 diagnoses in patients admitted for other reasons by 22 sites (45%).

DISCUSSION
In this study of medical wards at academic medical centers, we found that, in response to the COVID-19 pandemic, hospitals made several changes in a short period of time to adapt to the crisis. These included implementation and rapid expansion of dedicated RIUs, greatly expanded use of inpatient telehealth for patient assessments and consultation, implementation of other approaches to minimize room entry (such as grouping in-room activities), and deployment of ethics consultation services to help manage issues around potential scarcity of life-saving measures such as ventilators. We also found that availability of PPE and timely testing was limited. Finally, a large proportion of sites reported potential diagnostic problems in the assessment of both patients suspected and those not suspected of having COVID-19.
RIUs are emerging as a primary modality for caring for non-ICU COVID-19 patients, though they never involved medical students; we hope the role of students in particular will increase as new models of training emerge in response to the pandemic.7 In contrast, telemedicine evolved rapidly to hold a substantial role in RIUs, with both ward and specialty teams using video visit technology to communicate with patients. COVID-19 has been viewed as a perfect use case for outpatient telemedicine,8 and a growing number of studies are examining its outpatient use9,10; however, to date, somewhat less attention has been paid to inpatient deployment. Although our data suggest telemedicine has found a prominent place in RIUs, it remains to be seen whether it is associated with differences in patient or provider outcomes. For example, deficiencies in the physical examination, limited face-to-face contact, and lack of physical presence could all affect the patient–provider relationship, patient engagement, and the accuracy of the diagnostic process.
Our data suggest the possibility of missing non–COVID-19 diagnoses in patients suspected of COVID-19 and missing COVID-19 in those admitted for nonrespiratory reasons. The latter may be addressed as routine COVID-19 screening of admitted patients becomes commonplace. For the former, however, it is possible that physicians are “anchoring” their thinking on COVID-19 to the exclusion of other diagnoses, that physicians are not fully aware of complications unique to COVID-19 infection (such as thromboembolism), and/or that the above-mentioned limitations of telemedicine have decreased diagnostic performance.
Although PPE stockpile data were not easily available for some sites, a distressingly large number reported stockpiles of 2 weeks or less, with reuse being the most common approach to extending PPE supply. We also found it concerning that 43% of hospital leaders did not know their stockpile data; we believe this is an important question that hospital leaders need to be asking. Most sites in our study reported test turnaround times of longer than 6 hours; lack of rapid COVID-19 testing further stresses PPE stockpile and may slow patients’ transition out of the RIU or discharge to home.
Our study has several limitations, including the evolving nature of the pandemic and rapid adaptations of care systems in the pandemic’s surge phase. However, we attempted to frame our questions in ways that provided a focused snapshot of care. Furthermore, respondents may not have had exhaustive knowledge of their institution’s COVID-19 response strategies, but most were the directors of their hospitalist services, and we encouraged the respondents to confer with others to gather high-fidelity data. Finally, as a survey of large academic medical centers, our results may not apply to nonacademic centers.
Approaches to caring for non-ICU patients during the COVID-19 pandemic are rapidly evolving. Expansion of RIUs and developing the workforce to support them has been a primary focus, with rapid innovation in use of technology emerging as a critical adaptation while PPE limitations persist and needs for “medical distancing” continue to grow. Although rates of missed COVID-19 diagnoses will likely be reduced with testing and systems improvements, physicians and systems will also need to consider how to utilize emerging technology in ways that can improve clinical care and provider safety while aiding diagnostic thinking. This survey illustrates the rapid adaptations made by our hospitals in response to the pandemic; ongoing adaptation will likely be needed to optimally care for hospitalized patients with COVID-19 while the pandemic continues to evolve.
Acknowledgment
Thanks to members of the HOMERuN COVID-19 Collaborative Group: Baylor Scott & White Medical Center – Temple, Texas - Tresa McNeal MD; Beth Israel Deaconess Medical Center - Shani Herzig MD MPH, Joseph Li MD, Julius Yang MD PhD; Brigham and Women’s Hospital - Christopher Roy MD, Jeffrey Schnipper MD MPH; Cedars-Sinai Medical Center - Ed Seferian MD, ; ChristianaCare - Surekha Bhamidipati MD; Cleveland Clinic - Matthew Pappas MD MPH; Dartmouth-Hitchcock Medical Center - Jonathan Lurie MD MS; Dell Medical School at The University of Texas at Austin - Chris Moriates MD, Luci Leykum MD MBA MSc; Denver Health and Hospitals Authority - Diana Mancini MD; Emory University Hospital - Dan Hunt MD; Johns Hopkins Hospital - Daniel J Brotman MD, Zishan K Siddiqui MD, Shaker Eid MD MBA; Maine Medical Center - Daniel A Meyer MD, Robert Trowbridge MD; Massachusetts General Hospital - Melissa Mattison MD; Mayo Clinic Rochester – Caroline Burton MD, Sagar Dugani MD PhD; Medical College of Wisconsin - Sanjay Bhandari MD; Miriam Hospital - Kwame Dapaah-Afriyie MD MBA; Mount Sinai Hospital - Andrew Dunn MD; NorthShore - David Lovinger MD; Northwestern Memorial Hospital - Kevin O’Leary MD MS; Ohio State University Wexner Medical Center - Eric Schumacher DO; Oregon Health & Science University - Angela Alday MD; Penn Medicine - Ryan Greysen MD MHS MA; Rutgers- Robert Wood Johnson University Hospital - Michael Steinberg MD MPH; Stanford University School of Medicine - Neera Ahuja MD; Tulane Hospital and University Medical Center - Geraldine Ménard MD; UC San Diego Health - Ian Jenkins MD; UC Los Angeles Health - Michael Lazarus MD, Magdalena E. Ptaszny, MD; UC San Francisco Health - Bradley A Sharpe, MD, Margaret Fang MD MPH; UK HealthCare - Mark Williams MD MHM, John Romond MD; University of Chicago – David Meltzer MD PhD, Gregory Ruhnke MD; University of Colorado - Marisha Burden MD; University of Florida - Nila Radhakrishnan MD; University of Iowa Hospitals and Clinics - Kevin Glenn MD MS; University of Miami - Efren Manjarrez MD; University of Michigan - Vineet Chopra MD MSc, Valerie Vaughn MD MSc; University of Missouri-Columbia Hospital - Hasan Naqvi MD; University of Nebraska Medical Center - Chad Vokoun MD; University of North Carolina at Chapel Hill - David Hemsey MD; University of Pittsburgh Medical Center - Gena Marie Walker MD; University of Vermont Medical Center - Steven Grant MD; University of Washington Medical Center - Christopher Kim MD MBA, Andrew White MD; University of Washington-Harborview Medical Center - Maralyssa Bann MD; University of Wisconsin Hospital and Clinics - David Sterken MD, Farah Kaiksow MD MPP, Ann Sheehy MD MS, Jordan Kenik MD MPH; UW Northwest Campus - Ben Wolpaw MD; Vanderbilt University Medical Center - Sunil Kripalani MD MSc, Eduard E Vasilevskis MD, Kathleene T Wooldridge MD MPH; Wake Forest Baptist Health - Erik Summers MD; Washington University St. Louis - Michael Lin MD; Weill Cornell - Justin Choi MD; Yale New Haven Hospital - William Cushing MA, Chris Sankey MD; Zuckerberg San Francisco General Hospital - Sumant Ranji MD.
1. Institute for Health Metrics and Evaluation. COVID-19 Projections: United States of America. 2020. Accessed May 5, 2020. https://covid19.healthdata.org/united-states-of-america
2. Iserson KV. Alternative care sites: an option in disasters. West J Emerg Med. 2020;21(3):484‐489. https://doi.org/10.5811/westjem.2020.4.47552
3. Paganini M, Conti A, Weinstein E, Della Corte F, Ragazzoni L. Translating COVID-19 pandemic surge theory to practice in the emergency department: how to expand structure [online first]. Disaster Med Public Health Prep. 2020:1-10. https://doi.org/10.1017/dmp.2020.57
4. Kumaraiah D, Yip N, Ivascu N, Hill L. Innovative ICU Physician Care Models: Covid-19 Pandemic at NewYork-Presbyterian. NEJM: Catalyst. April 28, 2020. Accessed May 5, 2020. https://catalyst.nejm.org/doi/full/10.1056/CAT.20.0158
5. Auerbach AD, Patel MS, Metlay JP, et al. The Hospital Medicine Reengineering Network (HOMERuN): a learning organization focused on improving hospital care. Acad Med. 2014;89(3):415-420. https://doi.org/10.1097/acm.0000000000000139
6. Livingston E, Desai A, Berkwits M. Sourcing personal protective equipment during the COVID-19 pandemic [online first]. JAMA. 2020. https://doi.org/10.1001/jama.2020.5317
7. Bauchner H, Sharfstein J. A bold response to the COVID-19 pandemic: medical students, national service, and public health [online first]. JAMA. 2020. https://doi.org/10.1001/jama.2020.6166
8. Hollander JE, Carr BG. Virtually perfect? telemedicine for Covid-19. N Engl J Med. 2020;382(18):1679‐1681. https://doi.org/10.1056/nejmp2003539
9. Hau YS, Kim JK, Hur J, Chang MC. How about actively using telemedicine during the COVID-19 pandemic? J Med Syst. 2020;44(6):108. https://doi.org/10.1007/s10916-020-01580-z
10. Smith WR, Atala AJ, Terlecki RP, Kelly EE, Matthews CA. Implementation guide for rapid integration of an outpatient telemedicine program during the COVID-19 pandemic [online first]. J Am Coll Surg. 2020. https://doi.org/10.1016/j.jamcollsurg.2020.04.030
The coronavirus disease of 2019 (COVID-19) pandemic has resulted in a surge in hospitalizations of patients with a novel, serious, and highly contagious infectious disease for which there is yet no proven treatment. Currently, much of the focus has been on intensive care unit (ICU) and ventilator capacity for the sickest of these patients who develop respiratory failure. However, most hospitalized patients are being cared for in general medical units.1 Some evidence exists to describe adaptations to capacity needs outside of medical wards,2-4 but few studies have specifically addressed the ward setting. Therefore, there is a pressing need for evidence to describe how to expand capacity and deliver medical ward–based care.
To better understand how inpatient care in the United States is adapting to the COVID-19 pandemic, we surveyed 72 sites participating in the Hospital Medicine Reengineering Network (HOMERuN), a national consortium of hospital medicine groups.5 We report results of this survey, carried out between April 3 and April 5, 2020.
METHODS
Sites and Subjects
HOMERuN is a collaborative network of hospitalists from across the United States whose primary goal is to catalyze research and share best practices across hospital medicine groups. Using surveys of Hospital Medicine leaders, targeted medical record review, and other methods, HOMERuN’s funded research interests to date have included care transitions, workforce issues, patient and family engagement, and diagnostic errors. Sites participating in HOMERuN sites are relatively large urban academic medical centers (Appendix).
Survey Development and Deployment
We designed a focused survey that aimed to provide a snapshot of evolving operational and clinical aspects of COVID-19 care (Appendix). Domains included COVID-19 testing turnaround times, personal protective equipment (PPE) stewardship,6 features of respiratory isolation units (RIUs; ie, dedicated units for patients with known or suspected COVID-19), and observed effects on clinical care. We tested the instrument to ensure feasibility and clarity internally, performed brief cognitive testing with several hospital medicine leaders in HOMERuN, then disseminated the survey by email on April 3, with two follow-up emails on 2 subsequent days. Our study was deemed non–human subjects research by the University of California, San Francisco, Committee on Human Research. Descriptive statistics were used to characterize survey responses.
RESULTS
Of 72 hospitals surveyed, 51 (71%) responded. Mean hospital bed count was 940, three were safety-net hospitals, and one was a community-based teaching center; responding and nonresponding hospitals did not differ significantly in terms of bed count (Appendix).
Health System Adaptations, Testing, and PPE Status
Nearly all responding hospitals (46 of 51; 90%) had RIUs for patients with known or suspected COVID-19 (Table 1). Nearly all hospitals took steps to keep potentially sick healthcare providers from infecting others (eg, staying home if sick or exposed). Among respondents, 32% had rapid response teams, 24% had respiratory therapy teams, and 29% had case management teams that were dedicated to COVID-19 care. Thirty-two (63%) had developed models, such as ethics or palliative care consult services, to assist with difficult resource-allocation decisions (eg, how to prioritize ventilator use if demand exceeded supply). Twenty-three (45%) had developed post-acute care monitoring programs dedicated to COVID-19 patients.
At the time of our survey, only 2 sites (4%) reported COVID-19 test time turnaround under 1 hour, and 15 (30%) reported turnaround in less than 6 hours. Of the 29 sites able to provide estimates of PPE stockpile, 14 (48%) reported a supply of 2 weeks or less. The most common approaches to PPE stewardship focused on reuse of masks and face shields if not obviously soiled, centralizing PPE distribution, and disinfecting or sterilizing masks. Ten sites (20%) were utilizing 3-D printed masks, while 10% used homemade face shields or masks.
Characteristics of COVID-19 RIUs
Forty-six hospitals (90% of all respondents) in our cohort had developed RIUs at the time of survey administration. The earliest RIU implementation date was February 10, 2020, and the most recent was launched on the day of our survey. Admission to RIUs was primarily based on clinical factors associated with known or suspected COVID-19 infection (Table 2). The number of non–critical care RIU beds among locations at that time ranged from 10 or less to more than 50. The mean number of hospitalist attendings caring for patients in the RIUs was 10.2, with a mean 4.1 advanced practice providers, 5.5 residents, and 0 medical students. The number of planned patients per attending was typically 5 to 15. Nurses and physicians typically rounded separately. Medical distancing (eg, reducing patient room entry) was accomplished most commonly by grouped timing of medication administration (76% of sites), video links to room outside of rounding times (54% of sites), the use of video or telemedicine during rounds (17%), and clustering of activities such as medication administration or phlebotomy. The most common criteria prompting discharge from the RIU were a negative COVID-19 test (59%) and hospital discharge (57%), though comments from many respondents suggested that discharge criteria were changing rapidly.
Effects of Isolation Measures on In-Room Encounters and Diagnostic Processes
More than 90% of sites reported decreases in in-room encounter frequency across all provider types whether as a result of policies in place or not. Reductions were reported among hospitalists, advanced practice providers, residents, consultants, and therapists (Table 3). Reduced room entry most often resulted from an established or developing policy, but many noted reduced room entry without formal policies in place. Nearly all sites reported moving specialty consultations to phone or video evaluations. Diagnostic error was commonly reported, with missed non–COVID-19 medical diagnoses among COVID-19 infected patients being reported by 22 sites (46%) and missed COVID-19 diagnoses in patients admitted for other reasons by 22 sites (45%).
DISCUSSION
In this study of medical wards at academic medical centers, we found that, in response to the COVID-19 pandemic, hospitals made several changes in a short period of time to adapt to the crisis. These included implementation and rapid expansion of dedicated RIUs, greatly expanded use of inpatient telehealth for patient assessments and consultation, implementation of other approaches to minimize room entry (such as grouping in-room activities), and deployment of ethics consultation services to help manage issues around potential scarcity of life-saving measures such as ventilators. We also found that availability of PPE and timely testing was limited. Finally, a large proportion of sites reported potential diagnostic problems in the assessment of both patients suspected and those not suspected of having COVID-19.
RIUs are emerging as a primary modality for caring for non-ICU COVID-19 patients, though they never involved medical students; we hope the role of students in particular will increase as new models of training emerge in response to the pandemic.7 In contrast, telemedicine evolved rapidly to hold a substantial role in RIUs, with both ward and specialty teams using video visit technology to communicate with patients. COVID-19 has been viewed as a perfect use case for outpatient telemedicine,8 and a growing number of studies are examining its outpatient use9,10; however, to date, somewhat less attention has been paid to inpatient deployment. Although our data suggest telemedicine has found a prominent place in RIUs, it remains to be seen whether it is associated with differences in patient or provider outcomes. For example, deficiencies in the physical examination, limited face-to-face contact, and lack of physical presence could all affect the patient–provider relationship, patient engagement, and the accuracy of the diagnostic process.
Our data suggest the possibility of missing non–COVID-19 diagnoses in patients suspected of COVID-19 and missing COVID-19 in those admitted for nonrespiratory reasons. The latter may be addressed as routine COVID-19 screening of admitted patients becomes commonplace. For the former, however, it is possible that physicians are “anchoring” their thinking on COVID-19 to the exclusion of other diagnoses, that physicians are not fully aware of complications unique to COVID-19 infection (such as thromboembolism), and/or that the above-mentioned limitations of telemedicine have decreased diagnostic performance.
Although PPE stockpile data were not easily available for some sites, a distressingly large number reported stockpiles of 2 weeks or less, with reuse being the most common approach to extending PPE supply. We also found it concerning that 43% of hospital leaders did not know their stockpile data; we believe this is an important question that hospital leaders need to be asking. Most sites in our study reported test turnaround times of longer than 6 hours; lack of rapid COVID-19 testing further stresses PPE stockpile and may slow patients’ transition out of the RIU or discharge to home.
Our study has several limitations, including the evolving nature of the pandemic and rapid adaptations of care systems in the pandemic’s surge phase. However, we attempted to frame our questions in ways that provided a focused snapshot of care. Furthermore, respondents may not have had exhaustive knowledge of their institution’s COVID-19 response strategies, but most were the directors of their hospitalist services, and we encouraged the respondents to confer with others to gather high-fidelity data. Finally, as a survey of large academic medical centers, our results may not apply to nonacademic centers.
Approaches to caring for non-ICU patients during the COVID-19 pandemic are rapidly evolving. Expansion of RIUs and developing the workforce to support them has been a primary focus, with rapid innovation in use of technology emerging as a critical adaptation while PPE limitations persist and needs for “medical distancing” continue to grow. Although rates of missed COVID-19 diagnoses will likely be reduced with testing and systems improvements, physicians and systems will also need to consider how to utilize emerging technology in ways that can improve clinical care and provider safety while aiding diagnostic thinking. This survey illustrates the rapid adaptations made by our hospitals in response to the pandemic; ongoing adaptation will likely be needed to optimally care for hospitalized patients with COVID-19 while the pandemic continues to evolve.
Acknowledgment
Thanks to members of the HOMERuN COVID-19 Collaborative Group: Baylor Scott & White Medical Center – Temple, Texas - Tresa McNeal MD; Beth Israel Deaconess Medical Center - Shani Herzig MD MPH, Joseph Li MD, Julius Yang MD PhD; Brigham and Women’s Hospital - Christopher Roy MD, Jeffrey Schnipper MD MPH; Cedars-Sinai Medical Center - Ed Seferian MD, ; ChristianaCare - Surekha Bhamidipati MD; Cleveland Clinic - Matthew Pappas MD MPH; Dartmouth-Hitchcock Medical Center - Jonathan Lurie MD MS; Dell Medical School at The University of Texas at Austin - Chris Moriates MD, Luci Leykum MD MBA MSc; Denver Health and Hospitals Authority - Diana Mancini MD; Emory University Hospital - Dan Hunt MD; Johns Hopkins Hospital - Daniel J Brotman MD, Zishan K Siddiqui MD, Shaker Eid MD MBA; Maine Medical Center - Daniel A Meyer MD, Robert Trowbridge MD; Massachusetts General Hospital - Melissa Mattison MD; Mayo Clinic Rochester – Caroline Burton MD, Sagar Dugani MD PhD; Medical College of Wisconsin - Sanjay Bhandari MD; Miriam Hospital - Kwame Dapaah-Afriyie MD MBA; Mount Sinai Hospital - Andrew Dunn MD; NorthShore - David Lovinger MD; Northwestern Memorial Hospital - Kevin O’Leary MD MS; Ohio State University Wexner Medical Center - Eric Schumacher DO; Oregon Health & Science University - Angela Alday MD; Penn Medicine - Ryan Greysen MD MHS MA; Rutgers- Robert Wood Johnson University Hospital - Michael Steinberg MD MPH; Stanford University School of Medicine - Neera Ahuja MD; Tulane Hospital and University Medical Center - Geraldine Ménard MD; UC San Diego Health - Ian Jenkins MD; UC Los Angeles Health - Michael Lazarus MD, Magdalena E. Ptaszny, MD; UC San Francisco Health - Bradley A Sharpe, MD, Margaret Fang MD MPH; UK HealthCare - Mark Williams MD MHM, John Romond MD; University of Chicago – David Meltzer MD PhD, Gregory Ruhnke MD; University of Colorado - Marisha Burden MD; University of Florida - Nila Radhakrishnan MD; University of Iowa Hospitals and Clinics - Kevin Glenn MD MS; University of Miami - Efren Manjarrez MD; University of Michigan - Vineet Chopra MD MSc, Valerie Vaughn MD MSc; University of Missouri-Columbia Hospital - Hasan Naqvi MD; University of Nebraska Medical Center - Chad Vokoun MD; University of North Carolina at Chapel Hill - David Hemsey MD; University of Pittsburgh Medical Center - Gena Marie Walker MD; University of Vermont Medical Center - Steven Grant MD; University of Washington Medical Center - Christopher Kim MD MBA, Andrew White MD; University of Washington-Harborview Medical Center - Maralyssa Bann MD; University of Wisconsin Hospital and Clinics - David Sterken MD, Farah Kaiksow MD MPP, Ann Sheehy MD MS, Jordan Kenik MD MPH; UW Northwest Campus - Ben Wolpaw MD; Vanderbilt University Medical Center - Sunil Kripalani MD MSc, Eduard E Vasilevskis MD, Kathleene T Wooldridge MD MPH; Wake Forest Baptist Health - Erik Summers MD; Washington University St. Louis - Michael Lin MD; Weill Cornell - Justin Choi MD; Yale New Haven Hospital - William Cushing MA, Chris Sankey MD; Zuckerberg San Francisco General Hospital - Sumant Ranji MD.
1. Institute for Health Metrics and Evaluation. COVID-19 Projections: United States of America. 2020. Accessed May 5, 2020. https://covid19.healthdata.org/united-states-of-america
2. Iserson KV. Alternative care sites: an option in disasters. West J Emerg Med. 2020;21(3):484‐489. https://doi.org/10.5811/westjem.2020.4.47552
3. Paganini M, Conti A, Weinstein E, Della Corte F, Ragazzoni L. Translating COVID-19 pandemic surge theory to practice in the emergency department: how to expand structure [online first]. Disaster Med Public Health Prep. 2020:1-10. https://doi.org/10.1017/dmp.2020.57
4. Kumaraiah D, Yip N, Ivascu N, Hill L. Innovative ICU Physician Care Models: Covid-19 Pandemic at NewYork-Presbyterian. NEJM: Catalyst. April 28, 2020. Accessed May 5, 2020. https://catalyst.nejm.org/doi/full/10.1056/CAT.20.0158
5. Auerbach AD, Patel MS, Metlay JP, et al. The Hospital Medicine Reengineering Network (HOMERuN): a learning organization focused on improving hospital care. Acad Med. 2014;89(3):415-420. https://doi.org/10.1097/acm.0000000000000139
6. Livingston E, Desai A, Berkwits M. Sourcing personal protective equipment during the COVID-19 pandemic [online first]. JAMA. 2020. https://doi.org/10.1001/jama.2020.5317
7. Bauchner H, Sharfstein J. A bold response to the COVID-19 pandemic: medical students, national service, and public health [online first]. JAMA. 2020. https://doi.org/10.1001/jama.2020.6166
8. Hollander JE, Carr BG. Virtually perfect? telemedicine for Covid-19. N Engl J Med. 2020;382(18):1679‐1681. https://doi.org/10.1056/nejmp2003539
9. Hau YS, Kim JK, Hur J, Chang MC. How about actively using telemedicine during the COVID-19 pandemic? J Med Syst. 2020;44(6):108. https://doi.org/10.1007/s10916-020-01580-z
10. Smith WR, Atala AJ, Terlecki RP, Kelly EE, Matthews CA. Implementation guide for rapid integration of an outpatient telemedicine program during the COVID-19 pandemic [online first]. J Am Coll Surg. 2020. https://doi.org/10.1016/j.jamcollsurg.2020.04.030
© 2020 Society of Hospital Medicine
Deimplementation of Routine Chest X-rays in Adult Intensive Care Units
Despite increased awareness of Choosing Wisely (CW)® recommendations to reduce low-value care,1 there is limited published data about strategies to implement these guidelines or evidence that they have influenced ordering patterns or reduced healthcare spending
In ICUs, CXR ordering strategies may be routine (daily) or on-demand (with clinical indication). The former strategy’s principal advantage is the potential to detect life-threatening situations that may otherwise escape diagnosis.11 Disadvantages include cost, radiation exposure, patient inconvenience, false-positive workups, and low diagnostic and therapeutic value.12,13 On-demand strategies may safely reduce CXR ordering by 32% to 45%.11-17 Based on this evidence, the Critical Care Societies Collaborative and the American College of Radiology have recommended on-demand CXR ordering.18,19 Here, we describe the effectiveness of an intervention to reduce CXR ordering in two ICUs while evaluating the deimplementation strategies using a validated framework.
METHODS
Setting and Design
Vanderbilt University Medical Center (VUMC) is an academic referral center in Nashville, Tennessee. The cardiovascular ICU (CVICU) has 27 beds and the medical ICU (MICU) has 34 beds. Acute care nurse practitioners (ACNPs) and two critical care physicians staff the CVICU; cardiology fellows, anesthesia critical care fellows, and transplant and cardiac surgeons are also active in patient care. The MICU is staffed by two critical care physicians who supervise one team of ACNPs and two teams of medical residents who rotate through the unit every two weeks. Each MICU team is assigned a fellow in pulmonary and critical care.
We conducted a prospective, nonrandomized study in these units from October 2015 to June 2016. The VUMC Institutional Review Board approved the intervention as a quality improvement (QI) activity, waiving the requirement for informed consent.
Intervention
Following the top CW recommendation of the Critical Care Societies Collaborative—“Don’t order diagnostic tests at regular intervals (such as every day), but rather in response to specific clinical questions.”19—the VUMC resident-led CW Steering Committee designed a multifaceted approach to reduce ordering of routine CXRs in ICUs. The intervention included a didactic session on CW and proper CXR ordering practices, peer champions, data audits, and feedback to providers through weekly e-mails (see Supplemental Materials, 1 – Resident Presentation and 2 – CXR Flyer). 20
In September 2015, CVICU and MICU teams received a didactic session highlighting CW, current CXR ordering rates, and the plan for reducing CXR ordering. On October 5, 2015, teams began receiving weekly e-mails with ordering rates defined as CXRs ordered per patient per day and a brief rationale for reducing unnecessary CXRs. To encourage friendly competition, we provided weekly rates to the MICU teams, allowing for transparent benchmarking against one another. A similar competition strategy was not used in the CVICU due to the lack of multiple teams.
In the CVICU, two ACNPs volunteered as peer champions. These champions coordinated data feedback and advocated for the intervention among their colleagues. In the MICU, three internal medicine residents volunteered as peer champions and fulfilled similar roles.
To facilitate deimplementation, we conducted two Plan-Do-Study-Act (PDSA) cycles, the first from November to mid-December 2015 and the second from mid-December 2015 to mid-January 2016. During these cycles, we tailored our deimplementation strategy based on barriers identified by the peer champions and ICU leaders (described in the Qualitative Results section). Peer champions and the CW Steering Committee generated potential solutions by conversing with stakeholders and using the Expert Recommendations for Implementing Change (ERIC).20 Interventions included disseminating promotional flyers, holding meetings with stakeholders, and providing monthly CXR ordering rates. After the PDSA cycles, we continued reexamining the deimplementation efforts by reviewing ordering rates and soliciting feedback from ICU leaders and peer champions. However, no significant changes to the intervention were made during this time.
Quantitative Evaluation
We extracted data from VUMC’s Enterprise Data Warehouse during the intervention period (October 5, 2015 to May 24, 2016) and a historical control period (October 1, 2014 to October 4, 2015). Within each ICU, descriptive statistics were used to compare patient cohorts in the baseline and intervention periods by age, sex, and race.
The primary outcome was CXRs ordered per patient per day by hospital unit (CVICU or MICU). The baseline period included all data between October 1, 2014 and September 15, 2015. To account for priming of providers from didactic education, we allowed a washout period from September 16, 2015 to October 4, 2015. As a preliminary analysis, we compared CXR rates in the baseline and intervention periods using Wilcoxon rank-sum tests. We then conducted interrupted time-series analyses with segmented linear regression to assess differences in linear trends in CXR rates over the two periods. To account for different staffing models in the MICU, we stratified the impact of the intervention by team—medical resident (physician) or ACNP. R version 3.4.0 was used for statistical analysis.21
Qualitative Evaluation
Our qualitative evaluation consisted of embedded observation and semistructured interviews with stakeholders. The qualitative portion was guided by the Consolidated Framework for Implementation Research (CFIR), a widely used framework for design and evaluation of improvement initiatives that helped us to determine major facilitators and barriers to implementation.22,23
Embedded Observation
From November 2015 to January 2016, we observed morning rounds in the CVICU and MICU one to two times weekly to understand factors facilitating and inhibiting uptake of the intervention. Observations were recorded and organized using a CFIR-based template and directed toward understanding interactions among team members (eg, the decision-making process hierarchy), team workflows and decision-making processes, process of ordering CXRs, and providers’ knowledge and perceptions of the CXR intervention (see Supplemental Material, 3 – CFIR Table).22,23 After rounds, ICU team members were invited to share suggestions for improving the intervention. All observations occurred during and shortly following morning rounds when the vast majority of routine CXRs are ordered; we did not evaluate night or evening workflows. In the spirit of continuous improvement, we evaluated data in real-time.
Semistructured Interviews
Based on the direct observations, we developed semistructured interview questions to further evaluate provider perspectives (eg, “Do you believe ICU patients need a daily CXR?”) and constructs aligning with CFIR (eg, “intervention source—internally vs externally developed;” see Supplemental Material, 4 – Interview Questions).
Stakeholders from both ICUs were recruited through e-mail and in-person requests to participate in semistructured interviews. In the CVICU, we interviewed critical care physicians, anesthesia critical care fellows, and ACNPs. In the MICU, we interviewed medical students, interns, residents, critical care fellows, attending intensivist physicians, and ACNPs. We also interviewed X-ray technologists who routinely perform portable films in the units.
RESULTS
Quantitative Results

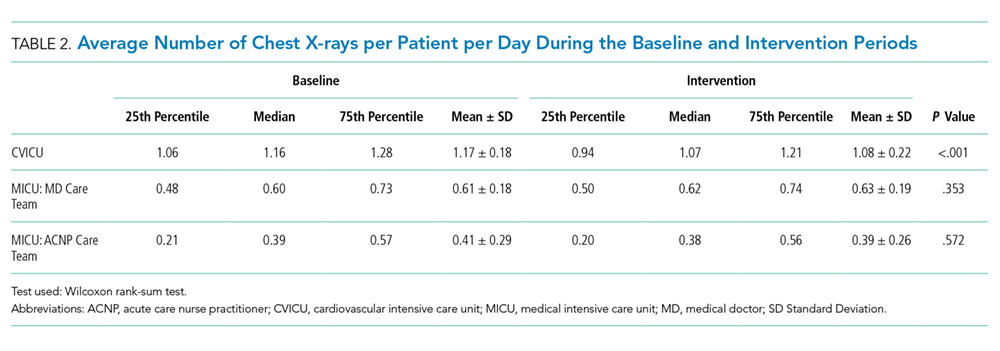
Cardiovascular Intensive Care Unit
The median baseline CXR ordering rate in the CVICU was 1.16 CXRs per patient per day, with interquartile range (IQR) 1.06-1.28. During the intervention period, the rate dropped to 1.07 (IQR 0.94-1.21; P < .001; Table 2). The time-series analysis suggested an essentially flat trend during the baseline period, followed by a small but significant drop in ordering rates during the intervention period (P < .001; Table 3 and Figure 1). Ordering rates appeared to increase slightly over the course of the intervention period, but this slight upward trend was not significantly different from the flat trend seen during the baseline period.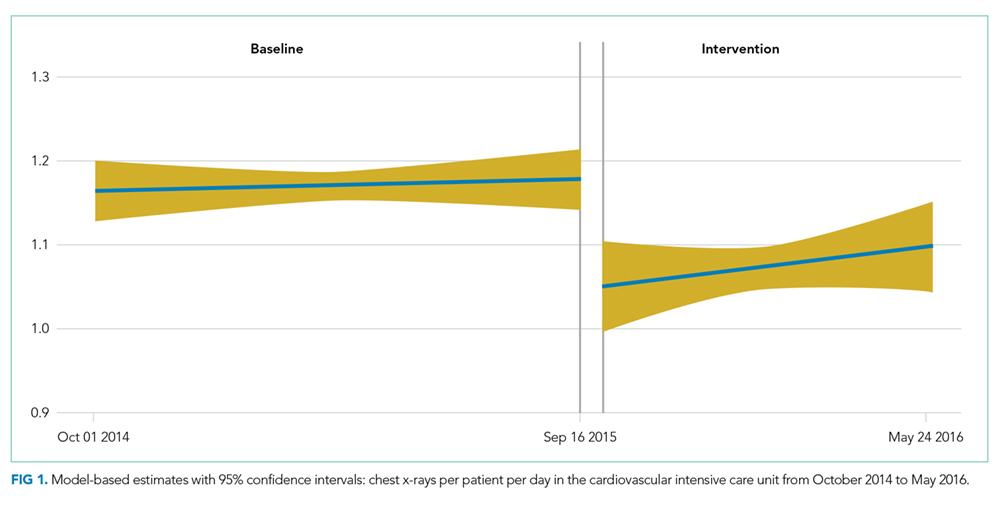
Medical Intensive Care Unit
For both physician and ACPN teams, the median baseline CXR ordering rates in the MICU were much lower than the baseline rate in the CVICU (Table 2). For the MICU physician care team, the baseline CXR ordering rate was 0.60 CXRs per patient per day (IQR 0.48-0.73). For the ACNP team, the median rate was 0.39 CXRs per patient per day (IQR 0.21-0.57). Both rates stayed approximately the same during the intervention period (Table 2). The time-series analysis suggested a statistically significant but very slight downward trend in CXR ordering rates during the baseline period, in the physician (P = .011) and ACNP (P = .022) teams (Table 3, Figure 2). Under this model, a small increase in CXR ordering initially occurred during the intervention period for both physician and ACNP teams (P = .010 and P = .055, respectively), after which the rates declined slightly. Trends in ordering rates during the intervention period were not significantly different from the slight downward trends seen during the baseline period.
Qualitative Results
We identified 25 of 39 CFIR constructs as relevant to the initiative (see Supplemental Materials, 3 – CFIR Table.) We determined the major facilitators of deimplementation to be peer champion discussions about CXR ordering on rounds and weekly data feedback, particularly if accompanied by in-person follow-up.
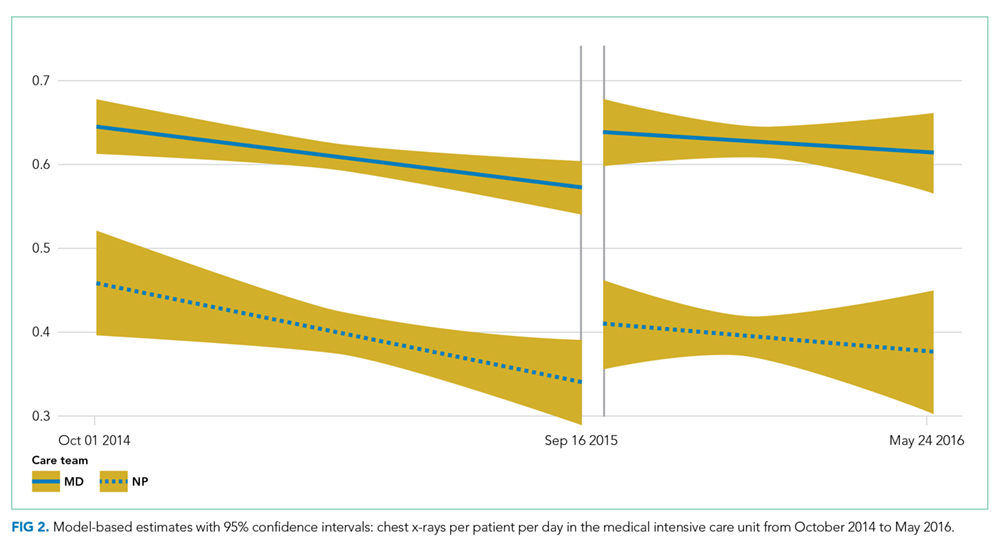
We also noted differences in CXR ordering rationales and decisions between the units. Generally, residents in the MICU and ACNPs in the CVICU made decisions to order CXRs. However, decisions were influenced by the expectations of attending physicians. While CVICU providers tended to order CXRs reflexively as part of morning labs, MICU providers—in particular, ACNPs who had been trained on indications for proper CXR ordering—generally ordered CXRs for specific indications (eg, worsening respiratory status). Of note, MICU ACNPs reported the use of bedside ultrasound as an alternate imaging modality and a reason for their higher threshold to order CXRs.
Deimplementation barriers in both units included the need to identify goal CXR ordering rates and the intervention’s limited visibility. To address these barriers, we conducted PDSA cycles and used the CFIR and ERIC to generate potential solutions.24 We established a goal of a 20% absolute reduction in the CVICU, added monthly CXR rates to weekly e-mail reports to better account for variations in patient populations and ordering practices, and circulated materials to promote on-demand CXR ordering. Promotional materials contained guidelines on CXR ordering and five “Frequently Held Misconceptions” about ordering practices with succinct, evidence-based explanations (see Supplemental Material, 2 – CXR Flyer).
Approximately four months after the start of intervention, some CVICU physicians became concerned that on-demand CXR ordering might be inappropriate for high-risk surgical patients, including those who are undergoing or have undergone heart transplants, lung transplants, or left-ventricular assist device placement. This concern arose following two adverse outcomes, which were not attributed to the CXR initiative, but which heightened concerns about patient safety. A rise in CXR ordering then occurred, and CVICU providers requested that we perform an analysis of these high-risk groups. While segmented linear regression in this subgroup suggested that average daily CXR ordering rates did decrease among the high-risk group at the start of the intervention period (P = .001), the difference between the rates in the two periods was not significant using the Wilcoxon rank-sum test. Exclusion of these patients from the main analysis did not alter the interpretation of the findings reported above for the CVICU.
DISCUSSION
A deimplementation intervention using provider education, peer champions, and data feedback was associated with fewer CXRs in the CVICU (P < .001) but not in the MICU. The CFIR-guided qualitative analysis was valuable for evaluating our deimplementation strategy and for identifying differences between the two ICUs.
Relatively few studies have demonstrated effective interventions that address CW recommendations.25-28 However, three population-level analyses of insurance claims show mixed results.3,4,29 Experts have thus proposed using implementation science to improve uptake of CW recommendations.2,3,7,8 Our study demonstrates the effectiveness of this approach. As expected, providers largely endorsed an on-demand CXR ordering strategy. Using the CFIR, however, we discovered barriers (eg, concern that data feedback did not reflect variations in patients’ needs). Using methods from implementation science allowed us to diagnose and tailor our approaches.
Our qualitative evaluation suggested that the intervention was ineffective mostly due to CFIR’s “inner setting” constructs, including resident fatigue, competing priorities, and decreased investment in QI projects because of the rotating nature of providers in training. Baseline CXR ordering rates in the MICU were also considerably lower than in the CVICU. We observed that CVICU providers ordered many CXRs following the placement of lines or tubes and that ACNPs in the MICU had received education on appropriate CXR ordering practices and had access to an alternate imaging modality in ultrasound. These factors may partially explain the difference in baseline rates.
As noted in a study of cardiac stress testing guidelines, the existence of high-value care recommendations does not mean overuse.30 Indeed, the lack of significant CXR over-ordering in the MICU highlights the importance of baseline measurement and partnering with information technology departments to create the best possible data feedback systems.30-32 Our experience shows that these systems should provide sufficient pre-implementation data (ideally >1 year), such that teams selecting QI projects can ensure that a project is a good use of institutional resources and change capital.
To inform future work, we informally assessed program costs and savings. We estimate the initiative cost $1,600, including $1,000 for curriculum development and teaching time, $300 for educational materials, and $300 for CXR tracking dashboard development. Hospital charges and reimbursements for CXR vary widely.33 We calculated savings using a range of rates, from a conservative $23 (the Medicare reimbursement rate for single-view CXR, CPT code 71010, global fee) to $50 (an approximate blended reimbursement rate across payers).34,35 In the CVICU, we estimate that 51 CXRs were avoided each month, saving $1,173-$2,550 per month or $9,384-$20,400 over eight months of follow-up. Annualizing these figures, we estimate net savings of $12,476-$29,000 in the first year in a 27-bed ICU. Costs to continue the program include education of new employees, booster training, and dashboard maintenance for an estimated annual cost of $1,000. It is difficult to estimate effectiveness over time, but if we conservatively assume that 30 CXRs were avoided each month, then the projected savings would be $8,280-$18,000 per year or an annual net savings of $7,280-$17,000 in the ICU. Although these amounts are modest, providing trainees with experiential learning opportunities in high-value care is valuable in its own right, meets curricular goals, may result in spill-over effects to other diagnostic and therapeutic decisions, and may influence long-term practice patterns. Institutional decisions to pursue projects such as this should take into account these potential benefits.
This evaluation is not without limitations. First, the study was conducted in a single tertiary-care hospital, potentially limiting its generalizability.36 Second, the study design lacked a concurrent control group, and observed outcomes may have been influenced by broader CXR utilization trends, increased awareness of low-value care generally or from previous CW projects at VUMC, seasonal effects, or the Hawthorne effect. Third, the study outcome was all CXRs ordered, rather than CXRs that were unnecessary or not clinically indicated. We chose all CXRs because it was more pragmatic, did not require clinical case review, and could be incorporated promptly into dashboards, enabling timely performance feedback. Other performance measures have taken a similar tack (eg, tracking all-cause readmissions rather than preventable readmissions). Given this approach, we did not track clinical indications for CXRs (eg, central line placement). Fourth, although we compared resident and APRN orders, we did not collect data on other provider characteristics such as years in/out of training or board certification status. These considerations should be addressed in future research.
Finally, the increase in CVICU CXR ordering at the end of the intervention period, which occurred following two adverse events, raises concerns about sustainability. While unrelated to CXR orders, the events resulted in increased ordering of diagnostic tests and showed the difficulty of deimplementation in ICUs. Indeed, some CVICU providers argued that on-demand CXR ordering represented minimal potential cost savings and had not been studied among heart and lung transplant patients. Subsequently, Tonna et al. have shown that on-demand CXR ordering can be safely implemented among such patients.37 Also similar to our study, Tonna et al. observed an initial decrease in CXR ordering, followed by a gradual increase toward baseline ordering rates. These findings highlight the need for sustained awareness and interventions and for the careful selection of high-value projects.
In conclusion, our study shows that a deimplementation intervention based on CW recommendations can reduce CXR ordering and that ongoing evaluation of contextual factors provides insights for both real-time modifications of current interventions and the design of future interventions. We found that messaging about reducing unnecessary tests works well when discussions are framed at the unit level but may be counterproductive if used to question individual ordering decisions.38 Additional lessons learned include the value of participation on rounds to build trust among stakeholders, the utility of monthly rather than weekly statistics for feedback, stakeholder input and peer champions, and differences in approach with physician and ACNP audiences.
Acknowledgments
The authors thank the VUMC Choosing Wisely committee; Mr. Bill Harrell in Advanced Data Analytics for developing the Tableau platform used in our data feedback strategy; Emily Feld, MD, Jerry Zifodya, MD, and Ryan Kindle, MD for assisting with data feedback to providers in the MICU; Todd Rice, MD, Director of the MICU, for his support of the initiative; and Beth Prusaczyk, PhD, MSW and David Stevenson, PhD for providing feedback on earlier drafts of this manuscript.
Disclosures
Dr. Kripalani reports personal fees from Verustat, personal fees from SAI Interactive, and equity from Bioscape Digital, outside the submitted work. All other authors have nothing to disclose.
Funding
This work was supported by an Innovation Grant from the Alliance for Academic Internal Medicine (AAIM, 2016) and by the Departments of Internal Medicine and Graduate Medical Education at Vanderbilt University Medical Center. The AAIM did not have a role in the study design, data collection, data analysis, data interpretation, or manuscript writing.
1. Cassel CK, Guest JA. Choosing Wisely: Helping physicians and patients make smart decisions about their care. JAMA. 2012;307(17):1801-1802.
2. Gonzales R, Cattamanchi A. Changing clinician behavior when less is more. JAMA Intern Med. 2015;175(12):1921-1922.
3. Rosenberg A, Agiro A, Gottlieb M, et al. Early trends among seven recommendations from the Choosing Wisely campaign. JAMA Intern Med. 2015;175(12):1913-1920.
4. Hong AS, Ross-Degnan D, Zhang F, Wharam JF. Small decline in low-value back imaging associated with the ‘Choosing Wisely’ campaign, 2012-14. Health Aff (Millwood). 2017;36(4):671-679. doi: 10.1377/hlthaff.2016.1263.
5. Parks AL, O’Malley PG. From choosing wisely to practicing value—more to the story. JAMA Intern Med. 2016;176(10):1571-1572.
6. Johnson PT, Pahwa AK, Feldman LS, Ziegelstein RC, Hellmann DB. Advancing high-value health care: a new AJM column dedicated to cost-conscious care quality improvement. Am J Med. 2017;130(6):619-621. doi: 10.1016/j.amjmed.2016.12.018.
7. Eccles MP, Mittman BS. Welcome to implementation science. Implement Sci. 2006;1:1. doi: 10.1186/1748-5908-1-1.
8. Bhatia RS, Levinson W, Shortt S, et al. Measuring the effect of Choosing Wisely: an integrated framework to assess campaign impact on low-value care. BMJ Qual Saf. 2015;24:523-531. doi: 10.1136/bmjqs-2015-004070.
9. Selby K, Barnes GD. Learning to de-adopt ineffective healthcare practices. Am J Med. 2018;131(7):721-722. doi: 10.1016/j.amjmed.2018.03.014.
10. Curran GM, Bauer M, Mittman B, Pyne JM, Stetler C. Effectiveness-implementation hybrid designs. Med Care. 2012;50(3):217-226. doi: 10.1097/MLR.0b013e3182408812.
11. Ganapathy A, Adhikari NK, Spiegelman J, Scales DC. Routine chest x-rays in intensive care units: a systematic review and meta-analysis. Crit Care. 2012;16(2):R68. doi: 10.1186/cc11321.
12. Graat ME, Kröner A, Spronk PE, et al. Elimination of daily routine chest radiographs in a mixed medical-surgical intensive care unit. Intensive Care Med. 2007;33(4):639-644. doi: 10.1007/s00134-007-0542-1.
13. Hendrikse KA, Gratama JWC, Ten Hove W, Rommes JH, Schultz MJ, Spronk PE. Low value of routine chest radiographs in a mixed medical-surgical ICU. Chest. 2007;132(3):823-828. doi: 10.1378/chest.07-1162.
14. Clec’h C, Simon P, Hamdi A, et al. Are daily routine chest radiographs useful in critically ill, mechanically ventilated patients? A randomized study. Intensive Care Med. 2008;34(2):264-270. doi: 10.1007/s00134-007-0919-1.
15. Oba Y, Zaza T. Abandoning daily routine chest radiography in the intensive care unit: meta-analysis. Radiology. 2010;255(2):386-395. doi: 10.1148/radiol.10090946.
16. Mets O, Spronk PE, Binnekade J, Stoker J, de Mol BAJM, Schultz MJ. Elimination of daily routine chest radiographs does not change on-demand radiography practice in post-cardiothoracic surgery patients. J Thorac Cardiovasc Surg. 2007;134(1):139-144. doi: 10.1016/j.jtcvs.2007.02.029.
17. Hejblum G, Chalumeau-Lemoine L, Ioos V, et al. Comparison of routine and on-demand prescription of chest radiographs in mechanically ventilated adults: a multicentre, cluster-randomised, two-period crossover study. Lancet. 2009;374(9702):1687-1693. doi: 10.1016/S0140-6736(09)61459-8.
18. McComb BL, Chung JH, Crabtree TD, et al. ACR appropriateness criteria® routine chest radiography. J Thorac Imaging. 2016;31(2):W13-W15. doi: 10.1097/RTI.0000000000000200.
19. Halpern SD, Becker D, Curtis JR, et al. An official American Thoracic Society/American Association of Critical-Care Nurses/American College of Chest Physicians/Society of Critical Care Medicine policy statement: the Choosing Wisely® top 5 list in critical care medicine. Am J Respir Crit Care Med. 2014;190(7):818-826. doi: 10.1164/rccm.201407-1317ST.
20. Powell BJ, Waltz TJ, Chinman MJ, et al. A refined compilation of implementation strategies: Results from the Expert Recommendations for Implementing Change (ERIC) project. Implement Sci. 2015;10:21. doi: 10.1186/s13012-015-0209-1.
21. R [computer program]. Version 3.4.0. Vienna, Austria: R Foundation for Statistical Computing; 2013.
22. Damschroder LJ, Aron DC, Keith RE, Kirsh SR, Alexander JA, Lowery JC. Fostering implementation of health services research findings into practice: a consolidated framework for advancing implementation science. Implement Sci. 2009;4:50. doi: 10.1186/1748-5908-4-50.
23. Kirk MA, Kelley C, Yankey N, Birken SA, Abadie B, Damschroder L. A systematic review of the use of the Consolidated Framework for Implementation Research. Implement Sci. 2016;11:72. doi: 10.1186/s13012-016-0437-z.
24. Speroff T, James BC, Nelson EC, Headrick LA, Brommels M, Reed JE. Guidelines for appraisal and publication of PDSA quality improvement. Qual Manag Health Care. 2014;13(1):33-39. doi: 10.1097/00019514-200401000-00003.
25. Corson AH, Fan VS, White T, et al. A multifaceted hospitalist quality improvement intervention: Decreased frequency of common labs. J Hosp Med. 2015;10(6):390-395. doi: 10.1002/jhm.2354.
26. Ferrari R. Evaluation of the Canadian Rheumatology Association Choosing Wisely recommendation concerning anti-nuclear antibody (ANA) testing. Clin Rheumatol. 2015;34(9):1551-1556. doi: 10.1007/s10067-015-2985-z.
27. Ferrari R, Prosser C. Testing vitamin D levels and choosing wisely. JAMA Intern Med. 2016;176(7):1019-1020.
28. Iams W, Heck J, Kapp M, et al. A multidisciplinary housestaff-led initiative to safely reduce daily laboratory testing. Acad Med. 2016;91(6):813-820. doi: 10.1097/ACM.0000000000001149.
29. Kost A, Genao I, Lee JW, Smith SR. Clinical decisions made in primary care clinics before and after Choosing WiselyTM. J Am Board Fam Med. 2015;28(4):471-474. doi: 10.3122/jabfm.2015.05.140332.
30. Kerr EA, Chen J, Sussman JB, Klamerus ML, Nallamothu BK. Stress testing before low-risk surgery: so many recommendations, so little overuse. JAMA Intern Med. 2015;175(4):645-647. doi: 10.1001/jamainternmed.2014.7877.
31. Colla CH, Morden NE, Sequist TD, Schpero WL, Rosenthal MB. Choosing wisely: prevalence and correlates of low-value health care services in the United States. J Gen Intern Med. 2014;30(2):221-228. doi: 10.1007/s11606-014-3070-z.
32. Shetty KD, Meeker D, Schneider EC, Hussey PS, Damberg CL. Evaluating the feasibility and utility of translating Choosing Wisely recommendations into e-Measures. Healthcare. 2015;3(1):24-37. doi: 10.1016/j.hjdsi.2014.12.002.
33. Woodland DC, Cooper CR, Rashid MF, et al. Routine chest X-ray is unnecessary after ultrasound-guided central venous line placement in the operating room. J Crit Care. 2018;46:13-16. doi: 10.1016/j.jcrc.2018.03.027.
34. Krause TM, Ukhanova M, Revere FL. Private carriers’ physician payment rates compared with Medicare and Medicaid. Tex Med. 2016;112(6):e1.
35. American College of Radiology. Medicare physician fee schedule. Available at https://www.acr.org/Advocacy-and-Economics/Radiology-Economics/Medicare-Medicaid/MPFS. Accessed October 15, 2018.
36. Siegel MD, Rubinowitz AN. Routine daily vs on-demand chest radiographs in intensive care. Lancet. 2009;374(9702):1656-1658. doi: 10.1016/S0140-6736(09)61632-9.
37. Tonna JE, Kawamoto K, Presson AP, et al. Single intervention for a reduction in portable chest radiography (pCXR) in cardiovascular and surgical/trauma ICUs and associated outcomes. J Crit Care. 2018;44:18-23. doi: 10.1016/j.jcrc.2017.10.003.
38. Wolfson D, Santa J, Slass L. Engaging physicians and consumers in conversations about treatment overuse and waste: a short history of the choosing wisely campaign. Acad Med. 2014;89(7):990-995. doi: 10.1097/ACM.0000000000000270.
Despite increased awareness of Choosing Wisely (CW)® recommendations to reduce low-value care,1 there is limited published data about strategies to implement these guidelines or evidence that they have influenced ordering patterns or reduced healthcare spending
In ICUs, CXR ordering strategies may be routine (daily) or on-demand (with clinical indication). The former strategy’s principal advantage is the potential to detect life-threatening situations that may otherwise escape diagnosis.11 Disadvantages include cost, radiation exposure, patient inconvenience, false-positive workups, and low diagnostic and therapeutic value.12,13 On-demand strategies may safely reduce CXR ordering by 32% to 45%.11-17 Based on this evidence, the Critical Care Societies Collaborative and the American College of Radiology have recommended on-demand CXR ordering.18,19 Here, we describe the effectiveness of an intervention to reduce CXR ordering in two ICUs while evaluating the deimplementation strategies using a validated framework.
METHODS
Setting and Design
Vanderbilt University Medical Center (VUMC) is an academic referral center in Nashville, Tennessee. The cardiovascular ICU (CVICU) has 27 beds and the medical ICU (MICU) has 34 beds. Acute care nurse practitioners (ACNPs) and two critical care physicians staff the CVICU; cardiology fellows, anesthesia critical care fellows, and transplant and cardiac surgeons are also active in patient care. The MICU is staffed by two critical care physicians who supervise one team of ACNPs and two teams of medical residents who rotate through the unit every two weeks. Each MICU team is assigned a fellow in pulmonary and critical care.
We conducted a prospective, nonrandomized study in these units from October 2015 to June 2016. The VUMC Institutional Review Board approved the intervention as a quality improvement (QI) activity, waiving the requirement for informed consent.
Intervention
Following the top CW recommendation of the Critical Care Societies Collaborative—“Don’t order diagnostic tests at regular intervals (such as every day), but rather in response to specific clinical questions.”19—the VUMC resident-led CW Steering Committee designed a multifaceted approach to reduce ordering of routine CXRs in ICUs. The intervention included a didactic session on CW and proper CXR ordering practices, peer champions, data audits, and feedback to providers through weekly e-mails (see Supplemental Materials, 1 – Resident Presentation and 2 – CXR Flyer). 20
In September 2015, CVICU and MICU teams received a didactic session highlighting CW, current CXR ordering rates, and the plan for reducing CXR ordering. On October 5, 2015, teams began receiving weekly e-mails with ordering rates defined as CXRs ordered per patient per day and a brief rationale for reducing unnecessary CXRs. To encourage friendly competition, we provided weekly rates to the MICU teams, allowing for transparent benchmarking against one another. A similar competition strategy was not used in the CVICU due to the lack of multiple teams.
In the CVICU, two ACNPs volunteered as peer champions. These champions coordinated data feedback and advocated for the intervention among their colleagues. In the MICU, three internal medicine residents volunteered as peer champions and fulfilled similar roles.
To facilitate deimplementation, we conducted two Plan-Do-Study-Act (PDSA) cycles, the first from November to mid-December 2015 and the second from mid-December 2015 to mid-January 2016. During these cycles, we tailored our deimplementation strategy based on barriers identified by the peer champions and ICU leaders (described in the Qualitative Results section). Peer champions and the CW Steering Committee generated potential solutions by conversing with stakeholders and using the Expert Recommendations for Implementing Change (ERIC).20 Interventions included disseminating promotional flyers, holding meetings with stakeholders, and providing monthly CXR ordering rates. After the PDSA cycles, we continued reexamining the deimplementation efforts by reviewing ordering rates and soliciting feedback from ICU leaders and peer champions. However, no significant changes to the intervention were made during this time.
Quantitative Evaluation
We extracted data from VUMC’s Enterprise Data Warehouse during the intervention period (October 5, 2015 to May 24, 2016) and a historical control period (October 1, 2014 to October 4, 2015). Within each ICU, descriptive statistics were used to compare patient cohorts in the baseline and intervention periods by age, sex, and race.
The primary outcome was CXRs ordered per patient per day by hospital unit (CVICU or MICU). The baseline period included all data between October 1, 2014 and September 15, 2015. To account for priming of providers from didactic education, we allowed a washout period from September 16, 2015 to October 4, 2015. As a preliminary analysis, we compared CXR rates in the baseline and intervention periods using Wilcoxon rank-sum tests. We then conducted interrupted time-series analyses with segmented linear regression to assess differences in linear trends in CXR rates over the two periods. To account for different staffing models in the MICU, we stratified the impact of the intervention by team—medical resident (physician) or ACNP. R version 3.4.0 was used for statistical analysis.21
Qualitative Evaluation
Our qualitative evaluation consisted of embedded observation and semistructured interviews with stakeholders. The qualitative portion was guided by the Consolidated Framework for Implementation Research (CFIR), a widely used framework for design and evaluation of improvement initiatives that helped us to determine major facilitators and barriers to implementation.22,23
Embedded Observation
From November 2015 to January 2016, we observed morning rounds in the CVICU and MICU one to two times weekly to understand factors facilitating and inhibiting uptake of the intervention. Observations were recorded and organized using a CFIR-based template and directed toward understanding interactions among team members (eg, the decision-making process hierarchy), team workflows and decision-making processes, process of ordering CXRs, and providers’ knowledge and perceptions of the CXR intervention (see Supplemental Material, 3 – CFIR Table).22,23 After rounds, ICU team members were invited to share suggestions for improving the intervention. All observations occurred during and shortly following morning rounds when the vast majority of routine CXRs are ordered; we did not evaluate night or evening workflows. In the spirit of continuous improvement, we evaluated data in real-time.
Semistructured Interviews
Based on the direct observations, we developed semistructured interview questions to further evaluate provider perspectives (eg, “Do you believe ICU patients need a daily CXR?”) and constructs aligning with CFIR (eg, “intervention source—internally vs externally developed;” see Supplemental Material, 4 – Interview Questions).
Stakeholders from both ICUs were recruited through e-mail and in-person requests to participate in semistructured interviews. In the CVICU, we interviewed critical care physicians, anesthesia critical care fellows, and ACNPs. In the MICU, we interviewed medical students, interns, residents, critical care fellows, attending intensivist physicians, and ACNPs. We also interviewed X-ray technologists who routinely perform portable films in the units.
RESULTS
Quantitative Results
Cardiovascular Intensive Care Unit
The median baseline CXR ordering rate in the CVICU was 1.16 CXRs per patient per day, with interquartile range (IQR) 1.06-1.28. During the intervention period, the rate dropped to 1.07 (IQR 0.94-1.21; P < .001; Table 2). The time-series analysis suggested an essentially flat trend during the baseline period, followed by a small but significant drop in ordering rates during the intervention period (P < .001; Table 3 and Figure 1). Ordering rates appeared to increase slightly over the course of the intervention period, but this slight upward trend was not significantly different from the flat trend seen during the baseline period.
Medical Intensive Care Unit
For both physician and ACPN teams, the median baseline CXR ordering rates in the MICU were much lower than the baseline rate in the CVICU (Table 2). For the MICU physician care team, the baseline CXR ordering rate was 0.60 CXRs per patient per day (IQR 0.48-0.73). For the ACNP team, the median rate was 0.39 CXRs per patient per day (IQR 0.21-0.57). Both rates stayed approximately the same during the intervention period (Table 2). The time-series analysis suggested a statistically significant but very slight downward trend in CXR ordering rates during the baseline period, in the physician (P = .011) and ACNP (P = .022) teams (Table 3, Figure 2). Under this model, a small increase in CXR ordering initially occurred during the intervention period for both physician and ACNP teams (P = .010 and P = .055, respectively), after which the rates declined slightly. Trends in ordering rates during the intervention period were not significantly different from the slight downward trends seen during the baseline period.
Qualitative Results
We identified 25 of 39 CFIR constructs as relevant to the initiative (see Supplemental Materials, 3 – CFIR Table.) We determined the major facilitators of deimplementation to be peer champion discussions about CXR ordering on rounds and weekly data feedback, particularly if accompanied by in-person follow-up.
We also noted differences in CXR ordering rationales and decisions between the units. Generally, residents in the MICU and ACNPs in the CVICU made decisions to order CXRs. However, decisions were influenced by the expectations of attending physicians. While CVICU providers tended to order CXRs reflexively as part of morning labs, MICU providers—in particular, ACNPs who had been trained on indications for proper CXR ordering—generally ordered CXRs for specific indications (eg, worsening respiratory status). Of note, MICU ACNPs reported the use of bedside ultrasound as an alternate imaging modality and a reason for their higher threshold to order CXRs.
Deimplementation barriers in both units included the need to identify goal CXR ordering rates and the intervention’s limited visibility. To address these barriers, we conducted PDSA cycles and used the CFIR and ERIC to generate potential solutions.24 We established a goal of a 20% absolute reduction in the CVICU, added monthly CXR rates to weekly e-mail reports to better account for variations in patient populations and ordering practices, and circulated materials to promote on-demand CXR ordering. Promotional materials contained guidelines on CXR ordering and five “Frequently Held Misconceptions” about ordering practices with succinct, evidence-based explanations (see Supplemental Material, 2 – CXR Flyer).
Approximately four months after the start of intervention, some CVICU physicians became concerned that on-demand CXR ordering might be inappropriate for high-risk surgical patients, including those who are undergoing or have undergone heart transplants, lung transplants, or left-ventricular assist device placement. This concern arose following two adverse outcomes, which were not attributed to the CXR initiative, but which heightened concerns about patient safety. A rise in CXR ordering then occurred, and CVICU providers requested that we perform an analysis of these high-risk groups. While segmented linear regression in this subgroup suggested that average daily CXR ordering rates did decrease among the high-risk group at the start of the intervention period (P = .001), the difference between the rates in the two periods was not significant using the Wilcoxon rank-sum test. Exclusion of these patients from the main analysis did not alter the interpretation of the findings reported above for the CVICU.
DISCUSSION
A deimplementation intervention using provider education, peer champions, and data feedback was associated with fewer CXRs in the CVICU (P < .001) but not in the MICU. The CFIR-guided qualitative analysis was valuable for evaluating our deimplementation strategy and for identifying differences between the two ICUs.
Relatively few studies have demonstrated effective interventions that address CW recommendations.25-28 However, three population-level analyses of insurance claims show mixed results.3,4,29 Experts have thus proposed using implementation science to improve uptake of CW recommendations.2,3,7,8 Our study demonstrates the effectiveness of this approach. As expected, providers largely endorsed an on-demand CXR ordering strategy. Using the CFIR, however, we discovered barriers (eg, concern that data feedback did not reflect variations in patients’ needs). Using methods from implementation science allowed us to diagnose and tailor our approaches.
Our qualitative evaluation suggested that the intervention was ineffective mostly due to CFIR’s “inner setting” constructs, including resident fatigue, competing priorities, and decreased investment in QI projects because of the rotating nature of providers in training. Baseline CXR ordering rates in the MICU were also considerably lower than in the CVICU. We observed that CVICU providers ordered many CXRs following the placement of lines or tubes and that ACNPs in the MICU had received education on appropriate CXR ordering practices and had access to an alternate imaging modality in ultrasound. These factors may partially explain the difference in baseline rates.
As noted in a study of cardiac stress testing guidelines, the existence of high-value care recommendations does not mean overuse.30 Indeed, the lack of significant CXR over-ordering in the MICU highlights the importance of baseline measurement and partnering with information technology departments to create the best possible data feedback systems.30-32 Our experience shows that these systems should provide sufficient pre-implementation data (ideally >1 year), such that teams selecting QI projects can ensure that a project is a good use of institutional resources and change capital.
To inform future work, we informally assessed program costs and savings. We estimate the initiative cost $1,600, including $1,000 for curriculum development and teaching time, $300 for educational materials, and $300 for CXR tracking dashboard development. Hospital charges and reimbursements for CXR vary widely.33 We calculated savings using a range of rates, from a conservative $23 (the Medicare reimbursement rate for single-view CXR, CPT code 71010, global fee) to $50 (an approximate blended reimbursement rate across payers).34,35 In the CVICU, we estimate that 51 CXRs were avoided each month, saving $1,173-$2,550 per month or $9,384-$20,400 over eight months of follow-up. Annualizing these figures, we estimate net savings of $12,476-$29,000 in the first year in a 27-bed ICU. Costs to continue the program include education of new employees, booster training, and dashboard maintenance for an estimated annual cost of $1,000. It is difficult to estimate effectiveness over time, but if we conservatively assume that 30 CXRs were avoided each month, then the projected savings would be $8,280-$18,000 per year or an annual net savings of $7,280-$17,000 in the ICU. Although these amounts are modest, providing trainees with experiential learning opportunities in high-value care is valuable in its own right, meets curricular goals, may result in spill-over effects to other diagnostic and therapeutic decisions, and may influence long-term practice patterns. Institutional decisions to pursue projects such as this should take into account these potential benefits.
This evaluation is not without limitations. First, the study was conducted in a single tertiary-care hospital, potentially limiting its generalizability.36 Second, the study design lacked a concurrent control group, and observed outcomes may have been influenced by broader CXR utilization trends, increased awareness of low-value care generally or from previous CW projects at VUMC, seasonal effects, or the Hawthorne effect. Third, the study outcome was all CXRs ordered, rather than CXRs that were unnecessary or not clinically indicated. We chose all CXRs because it was more pragmatic, did not require clinical case review, and could be incorporated promptly into dashboards, enabling timely performance feedback. Other performance measures have taken a similar tack (eg, tracking all-cause readmissions rather than preventable readmissions). Given this approach, we did not track clinical indications for CXRs (eg, central line placement). Fourth, although we compared resident and APRN orders, we did not collect data on other provider characteristics such as years in/out of training or board certification status. These considerations should be addressed in future research.
Finally, the increase in CVICU CXR ordering at the end of the intervention period, which occurred following two adverse events, raises concerns about sustainability. While unrelated to CXR orders, the events resulted in increased ordering of diagnostic tests and showed the difficulty of deimplementation in ICUs. Indeed, some CVICU providers argued that on-demand CXR ordering represented minimal potential cost savings and had not been studied among heart and lung transplant patients. Subsequently, Tonna et al. have shown that on-demand CXR ordering can be safely implemented among such patients.37 Also similar to our study, Tonna et al. observed an initial decrease in CXR ordering, followed by a gradual increase toward baseline ordering rates. These findings highlight the need for sustained awareness and interventions and for the careful selection of high-value projects.
In conclusion, our study shows that a deimplementation intervention based on CW recommendations can reduce CXR ordering and that ongoing evaluation of contextual factors provides insights for both real-time modifications of current interventions and the design of future interventions. We found that messaging about reducing unnecessary tests works well when discussions are framed at the unit level but may be counterproductive if used to question individual ordering decisions.38 Additional lessons learned include the value of participation on rounds to build trust among stakeholders, the utility of monthly rather than weekly statistics for feedback, stakeholder input and peer champions, and differences in approach with physician and ACNP audiences.
Acknowledgments
The authors thank the VUMC Choosing Wisely committee; Mr. Bill Harrell in Advanced Data Analytics for developing the Tableau platform used in our data feedback strategy; Emily Feld, MD, Jerry Zifodya, MD, and Ryan Kindle, MD for assisting with data feedback to providers in the MICU; Todd Rice, MD, Director of the MICU, for his support of the initiative; and Beth Prusaczyk, PhD, MSW and David Stevenson, PhD for providing feedback on earlier drafts of this manuscript.
Disclosures
Dr. Kripalani reports personal fees from Verustat, personal fees from SAI Interactive, and equity from Bioscape Digital, outside the submitted work. All other authors have nothing to disclose.
Funding
This work was supported by an Innovation Grant from the Alliance for Academic Internal Medicine (AAIM, 2016) and by the Departments of Internal Medicine and Graduate Medical Education at Vanderbilt University Medical Center. The AAIM did not have a role in the study design, data collection, data analysis, data interpretation, or manuscript writing.
1. Cassel CK, Guest JA. Choosing Wisely: Helping physicians and patients make smart decisions about their care. JAMA. 2012;307(17):1801-1802.
2. Gonzales R, Cattamanchi A. Changing clinician behavior when less is more. JAMA Intern Med. 2015;175(12):1921-1922.
3. Rosenberg A, Agiro A, Gottlieb M, et al. Early trends among seven recommendations from the Choosing Wisely campaign. JAMA Intern Med. 2015;175(12):1913-1920.
4. Hong AS, Ross-Degnan D, Zhang F, Wharam JF. Small decline in low-value back imaging associated with the ‘Choosing Wisely’ campaign, 2012-14. Health Aff (Millwood). 2017;36(4):671-679. doi: 10.1377/hlthaff.2016.1263.
5. Parks AL, O’Malley PG. From choosing wisely to practicing value—more to the story. JAMA Intern Med. 2016;176(10):1571-1572.
6. Johnson PT, Pahwa AK, Feldman LS, Ziegelstein RC, Hellmann DB. Advancing high-value health care: a new AJM column dedicated to cost-conscious care quality improvement. Am J Med. 2017;130(6):619-621. doi: 10.1016/j.amjmed.2016.12.018.
7. Eccles MP, Mittman BS. Welcome to implementation science. Implement Sci. 2006;1:1. doi: 10.1186/1748-5908-1-1.
8. Bhatia RS, Levinson W, Shortt S, et al. Measuring the effect of Choosing Wisely: an integrated framework to assess campaign impact on low-value care. BMJ Qual Saf. 2015;24:523-531. doi: 10.1136/bmjqs-2015-004070.
9. Selby K, Barnes GD. Learning to de-adopt ineffective healthcare practices. Am J Med. 2018;131(7):721-722. doi: 10.1016/j.amjmed.2018.03.014.
10. Curran GM, Bauer M, Mittman B, Pyne JM, Stetler C. Effectiveness-implementation hybrid designs. Med Care. 2012;50(3):217-226. doi: 10.1097/MLR.0b013e3182408812.
11. Ganapathy A, Adhikari NK, Spiegelman J, Scales DC. Routine chest x-rays in intensive care units: a systematic review and meta-analysis. Crit Care. 2012;16(2):R68. doi: 10.1186/cc11321.
12. Graat ME, Kröner A, Spronk PE, et al. Elimination of daily routine chest radiographs in a mixed medical-surgical intensive care unit. Intensive Care Med. 2007;33(4):639-644. doi: 10.1007/s00134-007-0542-1.
13. Hendrikse KA, Gratama JWC, Ten Hove W, Rommes JH, Schultz MJ, Spronk PE. Low value of routine chest radiographs in a mixed medical-surgical ICU. Chest. 2007;132(3):823-828. doi: 10.1378/chest.07-1162.
14. Clec’h C, Simon P, Hamdi A, et al. Are daily routine chest radiographs useful in critically ill, mechanically ventilated patients? A randomized study. Intensive Care Med. 2008;34(2):264-270. doi: 10.1007/s00134-007-0919-1.
15. Oba Y, Zaza T. Abandoning daily routine chest radiography in the intensive care unit: meta-analysis. Radiology. 2010;255(2):386-395. doi: 10.1148/radiol.10090946.
16. Mets O, Spronk PE, Binnekade J, Stoker J, de Mol BAJM, Schultz MJ. Elimination of daily routine chest radiographs does not change on-demand radiography practice in post-cardiothoracic surgery patients. J Thorac Cardiovasc Surg. 2007;134(1):139-144. doi: 10.1016/j.jtcvs.2007.02.029.
17. Hejblum G, Chalumeau-Lemoine L, Ioos V, et al. Comparison of routine and on-demand prescription of chest radiographs in mechanically ventilated adults: a multicentre, cluster-randomised, two-period crossover study. Lancet. 2009;374(9702):1687-1693. doi: 10.1016/S0140-6736(09)61459-8.
18. McComb BL, Chung JH, Crabtree TD, et al. ACR appropriateness criteria® routine chest radiography. J Thorac Imaging. 2016;31(2):W13-W15. doi: 10.1097/RTI.0000000000000200.
19. Halpern SD, Becker D, Curtis JR, et al. An official American Thoracic Society/American Association of Critical-Care Nurses/American College of Chest Physicians/Society of Critical Care Medicine policy statement: the Choosing Wisely® top 5 list in critical care medicine. Am J Respir Crit Care Med. 2014;190(7):818-826. doi: 10.1164/rccm.201407-1317ST.
20. Powell BJ, Waltz TJ, Chinman MJ, et al. A refined compilation of implementation strategies: Results from the Expert Recommendations for Implementing Change (ERIC) project. Implement Sci. 2015;10:21. doi: 10.1186/s13012-015-0209-1.
21. R [computer program]. Version 3.4.0. Vienna, Austria: R Foundation for Statistical Computing; 2013.
22. Damschroder LJ, Aron DC, Keith RE, Kirsh SR, Alexander JA, Lowery JC. Fostering implementation of health services research findings into practice: a consolidated framework for advancing implementation science. Implement Sci. 2009;4:50. doi: 10.1186/1748-5908-4-50.
23. Kirk MA, Kelley C, Yankey N, Birken SA, Abadie B, Damschroder L. A systematic review of the use of the Consolidated Framework for Implementation Research. Implement Sci. 2016;11:72. doi: 10.1186/s13012-016-0437-z.
24. Speroff T, James BC, Nelson EC, Headrick LA, Brommels M, Reed JE. Guidelines for appraisal and publication of PDSA quality improvement. Qual Manag Health Care. 2014;13(1):33-39. doi: 10.1097/00019514-200401000-00003.
25. Corson AH, Fan VS, White T, et al. A multifaceted hospitalist quality improvement intervention: Decreased frequency of common labs. J Hosp Med. 2015;10(6):390-395. doi: 10.1002/jhm.2354.
26. Ferrari R. Evaluation of the Canadian Rheumatology Association Choosing Wisely recommendation concerning anti-nuclear antibody (ANA) testing. Clin Rheumatol. 2015;34(9):1551-1556. doi: 10.1007/s10067-015-2985-z.
27. Ferrari R, Prosser C. Testing vitamin D levels and choosing wisely. JAMA Intern Med. 2016;176(7):1019-1020.
28. Iams W, Heck J, Kapp M, et al. A multidisciplinary housestaff-led initiative to safely reduce daily laboratory testing. Acad Med. 2016;91(6):813-820. doi: 10.1097/ACM.0000000000001149.
29. Kost A, Genao I, Lee JW, Smith SR. Clinical decisions made in primary care clinics before and after Choosing WiselyTM. J Am Board Fam Med. 2015;28(4):471-474. doi: 10.3122/jabfm.2015.05.140332.
30. Kerr EA, Chen J, Sussman JB, Klamerus ML, Nallamothu BK. Stress testing before low-risk surgery: so many recommendations, so little overuse. JAMA Intern Med. 2015;175(4):645-647. doi: 10.1001/jamainternmed.2014.7877.
31. Colla CH, Morden NE, Sequist TD, Schpero WL, Rosenthal MB. Choosing wisely: prevalence and correlates of low-value health care services in the United States. J Gen Intern Med. 2014;30(2):221-228. doi: 10.1007/s11606-014-3070-z.
32. Shetty KD, Meeker D, Schneider EC, Hussey PS, Damberg CL. Evaluating the feasibility and utility of translating Choosing Wisely recommendations into e-Measures. Healthcare. 2015;3(1):24-37. doi: 10.1016/j.hjdsi.2014.12.002.
33. Woodland DC, Cooper CR, Rashid MF, et al. Routine chest X-ray is unnecessary after ultrasound-guided central venous line placement in the operating room. J Crit Care. 2018;46:13-16. doi: 10.1016/j.jcrc.2018.03.027.
34. Krause TM, Ukhanova M, Revere FL. Private carriers’ physician payment rates compared with Medicare and Medicaid. Tex Med. 2016;112(6):e1.
35. American College of Radiology. Medicare physician fee schedule. Available at https://www.acr.org/Advocacy-and-Economics/Radiology-Economics/Medicare-Medicaid/MPFS. Accessed October 15, 2018.
36. Siegel MD, Rubinowitz AN. Routine daily vs on-demand chest radiographs in intensive care. Lancet. 2009;374(9702):1656-1658. doi: 10.1016/S0140-6736(09)61632-9.
37. Tonna JE, Kawamoto K, Presson AP, et al. Single intervention for a reduction in portable chest radiography (pCXR) in cardiovascular and surgical/trauma ICUs and associated outcomes. J Crit Care. 2018;44:18-23. doi: 10.1016/j.jcrc.2017.10.003.
38. Wolfson D, Santa J, Slass L. Engaging physicians and consumers in conversations about treatment overuse and waste: a short history of the choosing wisely campaign. Acad Med. 2014;89(7):990-995. doi: 10.1097/ACM.0000000000000270.
© 2019 Society of Hospital Medicine
Interhospital Transfer Handover Tool
The transfer of inpatients between hospitals for specialized services is common, affecting nearly 10% of all Medicare admissions1 and 4.5% of all critical care hospitalizations.2 At tertiary referral centers, 49% of medical intensive care unit (ICU) admissions are transferred from another hospital.3
Transfer patients have longer length of stay (LOS) than patients admitted directly from the emergency department or clinic. Among patients initially admitted to an ICU, transfer patients spend 1 day to 2.2 more days in the ICU and an additional 2 days to 4 more days total at the receiving hospital.4,5 Furthermore, transfer patients have higher mortality than nontransferred patients by 4% to 8%.3-5 Even after adjustment for case mix and comorbid disease, interhospital transfer is an independent predictor of both ICU death and LOS.6,7 As a result, interhospital transfer has been associated with a $9600 increase (on average) in hospital costs.4
Despite evidence detailing patient handovers as a key time when poor communication can lead to delays in care and significant patient risk, 8-10 most studies have focused on hospital discharge or change of shift, and scant effort has been dedicated to improving the interhospital handover. The process of interhospital transfer is often prolonged and discontinuous,11 commonly including delays of more than 24 hours between initiation and completion. This frequently precludes direct physician-to-physician contact at the time of transfer, and physicians rely on the discharge/transfer summary.12 Yet discharge summaries are frequently absent or incomplete,13 and often lack information for high-risk treatments such as systemic anticoagulation.14 The traditional reliance on discharge summaries for handover communication requires interpretation of unstandardized documentation and increases the risk for miscommunication, delays, and error.
To improve communication, we developed a 1-page handover tool for all inbound adult interhospital transfers to our academic medical center. We sought to determine whether implementation of this standardized handover tool improved the timeliness of initial care, LOS, and mortality among interhospital transfer patients.
METHODS
Study Design, Setting, Population
We conducted a retrospective cohort study of patients transferred into Vanderbilt University Hospital (VUH), an adult 626-bed quaternary care academic medical center in Nashville, Tennessee. The Vanderbilt University Institutional Review Board approved this study.
Population
We selected for inclusion all patients age 18 or older who were transferred into VUH between July 1, 2009 and December 31, 2010. We excluded patients whose transfer was routed outside the main VUH Patient Flow Center as well as patients who did not arrive alive at VUH. We also excluded patients transferred to the emergency department and patients admitted to obstetrics, burn, or trauma services, because these admitting services did not initially use the handover tool. Patients were followed for the duration of their hospitalization at VUH.
Intervention
The 1-page handover tool was developed with multidisciplinary physician input from house staff; medical directors from intensive care, neurology, and surgery; and the chief of staff. The tool was structured on the SBAR model (Situation, Background, Assessment, and Recommendation).15 Fields on the handover tool were limited to those deemed critical for immediate patient care and designed for 1 tool to be used for both ICU and non-ICU transfers. Fields included primary diagnosis; allergies; use and last dose of anticoagulants, vasopressors, sedative/paralytics, and antibiotics; isolation needs; indwelling devices; recent operations/procedures; code status; emergency contact information; problem list; active medication list; vital signs; pertinent exam; imaging; lab findings; and overall reason for transfer.
The handover tool was completed by the physician at the transferring hospital, faxed to VUH, and immediately scanned into the electronic record, allowing the receiving physicians to review information before patient arrival. Use of the tool was piloted first with 2 referring hospitals in April 2010 and universally recommended but not compulsory for all adult patients routed through the main VUH Patient Flow Center beginning July 1, 2010. Immediately before full implementation, the chief of staff sent letters to leadership of the 40 highest volume referral hospitals, highlighting the institutional goal of improving hand-off communication, framing completion of the tool as a step in the transfer acceptance process, and providing contact information for questions, feedback, or concerns. To ensure the tool was a standard part of the transfer process, the VUH Patient Flow Center maintained the responsibility of faxing the form to the outside facility and monitoring its receipt. The tool was processed in the same manner as other faxed patient records and treated as a part of the formal medical record to meet all standards for the Health Insurance Portability and Accountability Act (HIPAA) and medicolegal compliance. The medical center also has a separate cardiac transfer center where the handover tool was not implemented owing to its specialized workflow.
Data Source
The VUH Patient Flow Center maintains a database of all patients for whom transfer to VUH is requested, including information on the requesting hospital and the duration of transfer process. Outcome data and patient characteristics were extracted from the Enterprise Data Warehouse. Data related to comorbid illness were extracted from the Perioperative Data Warehouse, an IRB-approved data registry.
Measures
We evaluated 3 outcomes. First, we defined 2 measures of the timeliness of initial care, the time from arrival at VUH until entry of an admission order, and the time from arrival until entry of the first antibiotic order. Only antibiotics ordered within the first 36 hours of admission were included. Second, we evaluated the total LOS after transfer to VUH and the ICU LOS for patients transferred into an ICU setting. Finally, we examined in-hospital mortality at VUH. These metrics were chosen for their broad applicability across patient groups and feasibility of data capture. Length of stay and mortality also represent final common pathways for avoidance of complications. Specific patient safety indicators and complications were not abstracted due to their low frequency and burden of data collection. Due to system changes in our cost accounting systems, we were not able to obtain cost data pre- and postimplementation that provided meaningful comparisons.
Patient covariates included age, gender, payer, and Elixhauser comorbidity index as modified by van Walraven,16 calculated based on the admission of interest and the previous 365 days. We also examined admission characteristics including location (ICU vs. non-ICU), admitting service (medicine, surgery, neurology, or gynecology), and shift of arrival (day, 7:00 am to 6:00 pm; or night, 6:00 pm to 7:00 pm). Finally, we examined duration of the transfer process (ie, time between transfer request and arrival at VUH) and the volume of the transferring hospital (high was defined as 3 or more transfers to VUH per year).
Statistical analysis
Patient characteristics before and after implementation of the handover tool were compared using Pearson’s chi-square test and Fisher exact test for categorical variables and using Student t test and the Wilcoxon rank sum test for continuous variables. The outcome variables of time to admission order entry, time to antibiotic order entry, LOS, ICU LOS, and in-hospital mortality were compared between the before- and after-intervention time periods, using the Wilcoxon rank sum test for continuous outcomes and Pearson’s chi-square test for in-hospital mortality.
To account for temporal trends, the effect of the handover tool on time-to-admission order entry, hospital LOS, and mortality was measured using an interrupted time-series design with segmented linear regression analysis.17 The study period was divided into 2-week intervals, with 26 time periods in the pre-intervention period and 13 time periods in the postintervention period. Expected rates for the postintervention time periods were projected from the pre-intervention data using a linear regression model. To assess the observed effect of the intervention, rates from the postintervention periods were compared with these projected rates, assuming continuation of the trend. Restricted cubic spline models were also fit for time-to-admission order and hospital LOS; however, the F-statistics for these models were not significant, suggesting the linear regression provided a more appropriate model.
To further account for potential confounding of outcomes by comorbid disease and other patient factors, multivariate linear regression models assessed change in timeliness and LOS with implementation of the intervention. A multivariate logistic regression model was used to assess change in mortality with intervention implementation. All models adjusted for age, gender, payer, comorbid illness, admitting team, shift of arrival (day vs. night), transfer duration, volume of transferring hospital, and ICU status. Outcomes were further adjusted for calendar month to account for temporal trends in house staff efficiency. Because the cardiac transfer center did not adopt the use of the transfer tool, we evaluated adjusted in-hospital mortality for these patients as a concurrent control group.
All statistical testing was 2-sided at a significance level of 0.05. All analyses were conducted using STATA 12.1 statistical software (StataCorp LP, College Station, Texas).
RESULTS
Of 10,325 patients for whom transfer to VUH was requested during the study period, 1715 met inclusion criteria, including 798 patients (46.5%) initially admitted to an ICU setting. Specific patient exclusions are detailed in the Supplemental Figure; the majority of exclusions were due to patients being transferred directly to the emergency department setting. Table 1 summarizes patient characteristics before and after implementation of the handover tool. The median age was 57 years, with 48.6% male patients. Accepting services included medicine (56%), surgery (34%), neurology (9%), and gynecology (1%). The median duration of transfer was 8 hours, and the majority (93%) of patients came from higher volume transferring hospitals. Most (65%) of patients were admitted during night shift. The median modified Elixhauser comorbidity index was 11 (range of possible scores, -19 to 89). A slightly higher proportion of patients admitted postimplementation of the handover tool came from higher volume transferring hospitals; otherwise, there were no significant differences between the pre- and postintervention groups.

Vanderbilt University Hospital received transfers from more than 350 unique facilities in more than 25 U.S. states during the overall study period. During the postintervention period, adherence to the handover process was excellent, with more than 85% of patients having a completed handover tool available in their medical record at the time of transfer. The remaining 15% had either incomplete forms or no form.
Timeliness of Initial Care
There was no change in either the median time-to-admission order entry after implementation (47 vs. 45 minutes, unadjusted P = 0.36) or time to antibiotic order entry (199 vs. 202 minutes; unadjusted P = 0.81; Table 2).
In the time-series analysis, the pre-intervention period did not have a significant temporal trend in median time-to-admission order entry (ß-coefficient = -0.27; 95% confidence interval [CI] -0.85 to 0.31; R2 = 0.04; P = 0.34; Figure 1A). The postintervention period showed a trend toward a reduction in median time-to-admission order entry (ß-coefficient = -1.39; 95% CI -2.92 to 0.15; R2 = 0.27; P = 0.07). There was no significant difference between the actual time-to-admission order entry in the postintervention period when compared to the projected rates from the pre-intervention period (P = 0.18).
After multivariate adjustment, the postintervention time period was not associated with any significant change in the median time-to-admission order entry (P = 0.94, R2 = 0.09) nor time-to-antibiotic order entry (P = 0.91; R2 = 0.08; Table 2).

Length of Stay
Hospital LOS demonstrated a nonstatistically significant decline after implementation of the handover tool from 6.47 days to 5.81 days (unadjusted P = 0.18; Table 2). There was no significant change in ICU LOS postintervention (4.34 days to 4.55 days; P = 0.38).
In time series analysis, hospital LOS did not have a significant temporal trend in either the pre-intervention period (ß-coefficient = 0.00094; 95% CI, -0.07 to 0.07; R2 = 0.00; P = 0.98) or the postintervention period (ß-coefficient = 0.09; 95% CI, -0.07 to 0.25; R2 = 0.13; P = 0.23; Figure 1B). Similarly, there was no significant difference between the actual and projected hospital LOS after implementation of the handover tool (P = 0.31).
After multivariate adjustment, the postintervention time period was associated with a trend toward reduction in overall LOS (P = 0.06; R2 = 0.07) but no significant change in ICU LOS (P = 0.99; R2 = 0.09).

Mortality
In-hospital mortality declined significantly from 12.0% in the pre-intervention period to 8.9% in the postintervention period (P = 0.04; Table 2). In time-series analysis, mortality did not have a significant trend in the pre-intervention period (ß-coefficient = 0.00017, 95% CI, -0.0020 to 0.0024; P = 0.878) and had a trend toward reduction in the postintervention period (ß-coefficient = -0.0032; 95% CI, -0.0091 to 0.0027; P = 0.255; Figure 1C) but did not reach statistical significance due to relatively small numbers of deaths in each individual time period.
After multivariate adjustment, the postintervention period was associated with overall lower odds of mortality among transfer patients when compared with the pre-intervention period (adjusted OR 0.68; 95% CI, 0.47 – 0.99; R2 = 0.21; P = 0.04; Figure 2). Among the concurrent control group of patients routed through the cardiac transfer center, there was no significant change in mortality between the pre- and postintervention periods (adjusted OR 1.31; 95% CI, 0.88 – 1.93; R2 = 0.28; P = 0.18).

DISCUSSION
We developed a simple 1-page handover tool for interhospital transfer patients and aimed to improve timeliness, efficiency, and outcomes of care at the receiving hospital. Implementation of the handover tool was feasible and well accepted by transferring physicians despite a geographically large and diverse transfer network. Although implementation did not substantially improve measures of the timeliness of initial care among transfer patients, we noted a nonsignificant trend toward reduced LOS postintervention.
We observed a substantial and statistically significant reduction in mortality among transfer patients after implementation of the handover tool that persisted after controlling for time trends, comorbid illness, and several other patient factors. This effect was not seen in a concurrent control group of cardiac transfer patients for whom the handover tool was not implemented. Standardizing communication regarding high-risk clinical care processes may be responsible for the observed mortality reduction, similar to improvements seen in other small pilot studies.18 We acknowledge that the magnitude of the improvement in mortality is more than might be expected from the handover tool alone and could be due to chance.
In this initial evaluation, it was not feasible to determine whether information provided in the handover tool helped avert specific complications that could affect mortality, such as complications related to the use of ventilators, high-risk medications, or indwelling devices. Assessment of additional patient safety indices such as code events, unplanned ICU transfers, and medication errors could also help clarify the effect of the handover tool on patient-safety outcomes, and future work should include these metrics as well. Alternately, the improvement in mortality may result from other unmeasured processes that occurred concurrently and verification of this finding should be completed in other settings.
CONCLUSION
More work is needed to determine suitable process and outcome measures for interhospital transfers. Most literature has focused on cost and LOS at the exclusion of more proximal measures of initial care.3-7 The Institute of Medicine has identified timeliness as 1 of the 6 aims for care delivery redesign,19 yet standardized timeliness outcomes do not exist across broad inpatient populations. We chose to monitor the time-to-admission order entry and time-to-antibiotic order entry as 2 indicators of timeliness that would be applicable to a variety of patients. The lack of change in these selected measures should prompt examination for other measures of efficiency, including those that affect nontransferred patients. It is possible that nontransferred patients cared for by the same physician also benefit from fewer delays or disruptions and experience increased efficiency of care if transfer patient communication is improved. Further work is necessary to understand whether other measures of timely initial patient care may be more suitable.
The use of a time-series design to account for temporal trends adds substantial rigor to this study, since the majority of these patients were cared for by house staff whose experience and efficiency vary throughout the academic year. Furthermore, subsequent multivariate analysis demonstrated consistent findings after adjustment for comorbid illness and several other hospital and patient-level confounders.
This study has several limitations. The primary limitation is its nonrandomized design. Patient characteristics were stable across multiple variables before and after implementation, but it is possible that another confounding factor was responsible for observed improvements. Likewise, we collected data for only 6 rather than 12 months during the postintervention time period, which limited our sample size and statistical power. This was chosen because a significant restructuring of resident duty hours occurred in spring 2011 that had the potential to affect all measures studied.20,21 Finally, we did not collect data on accuracy of the information provided in the handover tool or end-user utilization and were unable to account for effects of these.
Since implementation in 2010, this process for interhospital transfers at VUH remains the same, although the volume of incoming transfers has significantly increased. Electronic handover tools with similar structure and content have since been adopted for patients being transferred to the emergency department or directly admitted from clinic. As VUH moves in the coming years from a locally developed electronic medical record to a national vendor, there will be an opportunity to transform this tool into an electronic template that will easily share data between institutions and further enhance communication.
Interhospital transfer patients represent a high-risk population whose unique handover needs have not been adequately measured or addressed. Our investigation demonstrated that a standardized handover aid can be implemented across a broad transfer network and may contribute to reductions in LOS and mortality. Further study is warranted to confirm these findings and assess the effect on other clinical outcomes.
Disclosures
This material is based upon work supported by the Office of Academic Affiliations, Department of Veterans Affairs, VA National Quality Scholars Program, and was made possible by the use of the facilities at VA Tennessee Valley Healthcare System, Nashville, Tennessee. The views expressed in this article are those of the authors and do not necessarily reflect the position or policy of the Department of Veterans Affairs or the US government. Additionally, this publication was supported in part by CTSA award No. UL1TR000445 from the National Center for Advancing Translational Sciences. Its contents are solely the responsibility of the authors and do not necessarily represent official views of the National Center for Advancing Translational Sciences or the National Institutes of Health.
1. Coleman EA, Min SJ, Chomiak A, Kramer AM. Posthospital care transitions: patterns, complications, and risk identification. Health Serv Res. 2004;39:1449-1465. PubMed
2. Iwashyna TJ, Christie JD, Moody J, Kahn JM, Asch DA. The structure of critical care transfer networks. Med Care. 2009;47:787-793. PubMed
3. Durairaj L, Will JG, Torner JC, Doebbeling BN. Prognostic factors for mortality following interhospital transfers to the medical intensive care unit of a tertiary referral center. Crit Care Med. 2003;31:1981-1986. PubMed
4. Golestanian E, Scruggs JE, Gangnon RE, Mak RP, Wood KE. Effect of interhospital transfer on resource utilization and outcomes at a tertiary care referral center. Crit Care Med. 2007;35:1470-1476. PubMed
5. Flabouris A, Hart GK, George C. Outcomes of patients admitted to tertiary intensive care units after interhospital transfer: comparison with patients admitted from emergency departments. Crit Care Resusc. 2008;10:97-105. PubMed
6. Combes A, Luyt CE, Trouillet JL, Chastre J, Gibert C. Adverse effect on a referral intensive care unit’s performance of accepting patients transferred from another intensive care unit. Crit Care Med. 2005;33:705-710. PubMed
7. Rosenberg AL, Hofer TP, Strachan C, Watts CM, Hayward RA. Accepting critically ill transfer patients: adverse effect on a referral center’s outcome and benchmark measures. A Intern Med. 2003;138:882-890. PubMed
8. Horwitz LI, Moin T, Krumholz HM, Wang L, Bradley EH. Consequences of inadequate sign-out for patient care. Arch Intern Med. 2008;168:1755-1760. PubMed
9. Starmer AJ, Sectish TC, Simon DW, et al. Rates of medical errors and preventable adverse events among hospitalized children following implementation of a resident handoff bundle. JAMA. 2013;310:2262-2270. PubMed
10. Arora VM, Manjarrez E, Dressler DD, Basaviah P, Halasyamani L, Kripalani S. Hospitalist handoffs: a systematic review and task force recommendations. J Hosp Med. 2009;4:433-440. PubMed
11. Bosk EA, Veinot T, Iwashyna TJ. Which patients and where: a qualitative study of patient transfers from community hospitals. Med Care. 2011;49:592-598. PubMed
12. Herrigel DJ, Carroll M, Fanning C, Steinberg MB, Parikh A, Usher M. Interhospital transfer handoff practices among US tertiary care centers: a descriptive survey. J Hosp Med. 2016;11:413-417. PubMed
13. Kripalani S, LeFevre F, Phillips CO, Williams MV, Basaviah P, Baker DW. Deficits in communication and information transfer between hospital-based and primary care physicians. JAMA. 2007;297:831-841. PubMed
14. Gandara E, Moniz TT, Ungar J, et al. Deficits in discharge documentation in patients transferred to rehabilitation facilities on anticoagulation: results of a systemwide evaluation. Jt Comm J Qual Patient Saf. 2008;34:460-463. PubMed
15. Haig KM, Sutton S, Whittington J. SBAR: a shared mental model for improving communication between clinicians. Jt Comm J Qual Patient Saf. 2006;32:167-175. PubMed
16. van Walraven C, Austin PC, Jennings A, Quan H, Forster AJ. A modification of the Elixhauser comorbidity measures into a point system for hospital death using administrative data. Med Care. 2009;47:626-633. PubMed
17. Wagner AK, Soumerai SB, Zhang F, Ross-Degnan D. Segmented regression analysis of interrupted time series studies in medication use research. J Clin Pharm Ther. 2002;27:299-309. PubMed
18. Malpass HC, Enfield KB, Keim-Malpass J, Verghese GM. The interhospital medical intensive care unit transfer instrument facilitates early implementation of critical therapies and is associated with fewer emergent procedures upon arrival. J Intensive Care Med. 2015;30:351-357. PubMed
19. National Academy of Sciences. Institute of Medicine. Crossing the Quality Chasm: A New Health System for the 21st Century. March 2005:1–360. Washington, DC. PubMed
20. Theobald CN, Stover DG, Choma NN, et al. The effect of reducing maximum shift lengths to 16 hours on internal medicine interns’ educational opportunities. Acad Med. 2013;88:512-518. PubMed
21. Choma NN, Vasilevskis EE, Sponsler KC, Hathaway J, Kripalani S. Effect of the ACGME 16-hour rule on efficiency and quality of care: duty hours 2.0. JAMA Intern Med. 2013;173:819-821. PubMed
The transfer of inpatients between hospitals for specialized services is common, affecting nearly 10% of all Medicare admissions1 and 4.5% of all critical care hospitalizations.2 At tertiary referral centers, 49% of medical intensive care unit (ICU) admissions are transferred from another hospital.3
Transfer patients have longer length of stay (LOS) than patients admitted directly from the emergency department or clinic. Among patients initially admitted to an ICU, transfer patients spend 1 day to 2.2 more days in the ICU and an additional 2 days to 4 more days total at the receiving hospital.4,5 Furthermore, transfer patients have higher mortality than nontransferred patients by 4% to 8%.3-5 Even after adjustment for case mix and comorbid disease, interhospital transfer is an independent predictor of both ICU death and LOS.6,7 As a result, interhospital transfer has been associated with a $9600 increase (on average) in hospital costs.4
Despite evidence detailing patient handovers as a key time when poor communication can lead to delays in care and significant patient risk, 8-10 most studies have focused on hospital discharge or change of shift, and scant effort has been dedicated to improving the interhospital handover. The process of interhospital transfer is often prolonged and discontinuous,11 commonly including delays of more than 24 hours between initiation and completion. This frequently precludes direct physician-to-physician contact at the time of transfer, and physicians rely on the discharge/transfer summary.12 Yet discharge summaries are frequently absent or incomplete,13 and often lack information for high-risk treatments such as systemic anticoagulation.14 The traditional reliance on discharge summaries for handover communication requires interpretation of unstandardized documentation and increases the risk for miscommunication, delays, and error.
To improve communication, we developed a 1-page handover tool for all inbound adult interhospital transfers to our academic medical center. We sought to determine whether implementation of this standardized handover tool improved the timeliness of initial care, LOS, and mortality among interhospital transfer patients.
METHODS
Study Design, Setting, Population
We conducted a retrospective cohort study of patients transferred into Vanderbilt University Hospital (VUH), an adult 626-bed quaternary care academic medical center in Nashville, Tennessee. The Vanderbilt University Institutional Review Board approved this study.
Population
We selected for inclusion all patients age 18 or older who were transferred into VUH between July 1, 2009 and December 31, 2010. We excluded patients whose transfer was routed outside the main VUH Patient Flow Center as well as patients who did not arrive alive at VUH. We also excluded patients transferred to the emergency department and patients admitted to obstetrics, burn, or trauma services, because these admitting services did not initially use the handover tool. Patients were followed for the duration of their hospitalization at VUH.
Intervention
The 1-page handover tool was developed with multidisciplinary physician input from house staff; medical directors from intensive care, neurology, and surgery; and the chief of staff. The tool was structured on the SBAR model (Situation, Background, Assessment, and Recommendation).15 Fields on the handover tool were limited to those deemed critical for immediate patient care and designed for 1 tool to be used for both ICU and non-ICU transfers. Fields included primary diagnosis; allergies; use and last dose of anticoagulants, vasopressors, sedative/paralytics, and antibiotics; isolation needs; indwelling devices; recent operations/procedures; code status; emergency contact information; problem list; active medication list; vital signs; pertinent exam; imaging; lab findings; and overall reason for transfer.
The handover tool was completed by the physician at the transferring hospital, faxed to VUH, and immediately scanned into the electronic record, allowing the receiving physicians to review information before patient arrival. Use of the tool was piloted first with 2 referring hospitals in April 2010 and universally recommended but not compulsory for all adult patients routed through the main VUH Patient Flow Center beginning July 1, 2010. Immediately before full implementation, the chief of staff sent letters to leadership of the 40 highest volume referral hospitals, highlighting the institutional goal of improving hand-off communication, framing completion of the tool as a step in the transfer acceptance process, and providing contact information for questions, feedback, or concerns. To ensure the tool was a standard part of the transfer process, the VUH Patient Flow Center maintained the responsibility of faxing the form to the outside facility and monitoring its receipt. The tool was processed in the same manner as other faxed patient records and treated as a part of the formal medical record to meet all standards for the Health Insurance Portability and Accountability Act (HIPAA) and medicolegal compliance. The medical center also has a separate cardiac transfer center where the handover tool was not implemented owing to its specialized workflow.
Data Source
The VUH Patient Flow Center maintains a database of all patients for whom transfer to VUH is requested, including information on the requesting hospital and the duration of transfer process. Outcome data and patient characteristics were extracted from the Enterprise Data Warehouse. Data related to comorbid illness were extracted from the Perioperative Data Warehouse, an IRB-approved data registry.
Measures
We evaluated 3 outcomes. First, we defined 2 measures of the timeliness of initial care, the time from arrival at VUH until entry of an admission order, and the time from arrival until entry of the first antibiotic order. Only antibiotics ordered within the first 36 hours of admission were included. Second, we evaluated the total LOS after transfer to VUH and the ICU LOS for patients transferred into an ICU setting. Finally, we examined in-hospital mortality at VUH. These metrics were chosen for their broad applicability across patient groups and feasibility of data capture. Length of stay and mortality also represent final common pathways for avoidance of complications. Specific patient safety indicators and complications were not abstracted due to their low frequency and burden of data collection. Due to system changes in our cost accounting systems, we were not able to obtain cost data pre- and postimplementation that provided meaningful comparisons.
Patient covariates included age, gender, payer, and Elixhauser comorbidity index as modified by van Walraven,16 calculated based on the admission of interest and the previous 365 days. We also examined admission characteristics including location (ICU vs. non-ICU), admitting service (medicine, surgery, neurology, or gynecology), and shift of arrival (day, 7:00 am to 6:00 pm; or night, 6:00 pm to 7:00 pm). Finally, we examined duration of the transfer process (ie, time between transfer request and arrival at VUH) and the volume of the transferring hospital (high was defined as 3 or more transfers to VUH per year).
Statistical analysis
Patient characteristics before and after implementation of the handover tool were compared using Pearson’s chi-square test and Fisher exact test for categorical variables and using Student t test and the Wilcoxon rank sum test for continuous variables. The outcome variables of time to admission order entry, time to antibiotic order entry, LOS, ICU LOS, and in-hospital mortality were compared between the before- and after-intervention time periods, using the Wilcoxon rank sum test for continuous outcomes and Pearson’s chi-square test for in-hospital mortality.
To account for temporal trends, the effect of the handover tool on time-to-admission order entry, hospital LOS, and mortality was measured using an interrupted time-series design with segmented linear regression analysis.17 The study period was divided into 2-week intervals, with 26 time periods in the pre-intervention period and 13 time periods in the postintervention period. Expected rates for the postintervention time periods were projected from the pre-intervention data using a linear regression model. To assess the observed effect of the intervention, rates from the postintervention periods were compared with these projected rates, assuming continuation of the trend. Restricted cubic spline models were also fit for time-to-admission order and hospital LOS; however, the F-statistics for these models were not significant, suggesting the linear regression provided a more appropriate model.
To further account for potential confounding of outcomes by comorbid disease and other patient factors, multivariate linear regression models assessed change in timeliness and LOS with implementation of the intervention. A multivariate logistic regression model was used to assess change in mortality with intervention implementation. All models adjusted for age, gender, payer, comorbid illness, admitting team, shift of arrival (day vs. night), transfer duration, volume of transferring hospital, and ICU status. Outcomes were further adjusted for calendar month to account for temporal trends in house staff efficiency. Because the cardiac transfer center did not adopt the use of the transfer tool, we evaluated adjusted in-hospital mortality for these patients as a concurrent control group.
All statistical testing was 2-sided at a significance level of 0.05. All analyses were conducted using STATA 12.1 statistical software (StataCorp LP, College Station, Texas).
RESULTS
Of 10,325 patients for whom transfer to VUH was requested during the study period, 1715 met inclusion criteria, including 798 patients (46.5%) initially admitted to an ICU setting. Specific patient exclusions are detailed in the Supplemental Figure; the majority of exclusions were due to patients being transferred directly to the emergency department setting. Table 1 summarizes patient characteristics before and after implementation of the handover tool. The median age was 57 years, with 48.6% male patients. Accepting services included medicine (56%), surgery (34%), neurology (9%), and gynecology (1%). The median duration of transfer was 8 hours, and the majority (93%) of patients came from higher volume transferring hospitals. Most (65%) of patients were admitted during night shift. The median modified Elixhauser comorbidity index was 11 (range of possible scores, -19 to 89). A slightly higher proportion of patients admitted postimplementation of the handover tool came from higher volume transferring hospitals; otherwise, there were no significant differences between the pre- and postintervention groups.
Vanderbilt University Hospital received transfers from more than 350 unique facilities in more than 25 U.S. states during the overall study period. During the postintervention period, adherence to the handover process was excellent, with more than 85% of patients having a completed handover tool available in their medical record at the time of transfer. The remaining 15% had either incomplete forms or no form.
Timeliness of Initial Care
There was no change in either the median time-to-admission order entry after implementation (47 vs. 45 minutes, unadjusted P = 0.36) or time to antibiotic order entry (199 vs. 202 minutes; unadjusted P = 0.81; Table 2).
In the time-series analysis, the pre-intervention period did not have a significant temporal trend in median time-to-admission order entry (ß-coefficient = -0.27; 95% confidence interval [CI] -0.85 to 0.31; R2 = 0.04; P = 0.34; Figure 1A). The postintervention period showed a trend toward a reduction in median time-to-admission order entry (ß-coefficient = -1.39; 95% CI -2.92 to 0.15; R2 = 0.27; P = 0.07). There was no significant difference between the actual time-to-admission order entry in the postintervention period when compared to the projected rates from the pre-intervention period (P = 0.18).
After multivariate adjustment, the postintervention time period was not associated with any significant change in the median time-to-admission order entry (P = 0.94, R2 = 0.09) nor time-to-antibiotic order entry (P = 0.91; R2 = 0.08; Table 2).
Length of Stay
Hospital LOS demonstrated a nonstatistically significant decline after implementation of the handover tool from 6.47 days to 5.81 days (unadjusted P = 0.18; Table 2). There was no significant change in ICU LOS postintervention (4.34 days to 4.55 days; P = 0.38).
In time series analysis, hospital LOS did not have a significant temporal trend in either the pre-intervention period (ß-coefficient = 0.00094; 95% CI, -0.07 to 0.07; R2 = 0.00; P = 0.98) or the postintervention period (ß-coefficient = 0.09; 95% CI, -0.07 to 0.25; R2 = 0.13; P = 0.23; Figure 1B). Similarly, there was no significant difference between the actual and projected hospital LOS after implementation of the handover tool (P = 0.31).
After multivariate adjustment, the postintervention time period was associated with a trend toward reduction in overall LOS (P = 0.06; R2 = 0.07) but no significant change in ICU LOS (P = 0.99; R2 = 0.09).
Mortality
In-hospital mortality declined significantly from 12.0% in the pre-intervention period to 8.9% in the postintervention period (P = 0.04; Table 2). In time-series analysis, mortality did not have a significant trend in the pre-intervention period (ß-coefficient = 0.00017, 95% CI, -0.0020 to 0.0024; P = 0.878) and had a trend toward reduction in the postintervention period (ß-coefficient = -0.0032; 95% CI, -0.0091 to 0.0027; P = 0.255; Figure 1C) but did not reach statistical significance due to relatively small numbers of deaths in each individual time period.
After multivariate adjustment, the postintervention period was associated with overall lower odds of mortality among transfer patients when compared with the pre-intervention period (adjusted OR 0.68; 95% CI, 0.47 – 0.99; R2 = 0.21; P = 0.04; Figure 2). Among the concurrent control group of patients routed through the cardiac transfer center, there was no significant change in mortality between the pre- and postintervention periods (adjusted OR 1.31; 95% CI, 0.88 – 1.93; R2 = 0.28; P = 0.18).
DISCUSSION
We developed a simple 1-page handover tool for interhospital transfer patients and aimed to improve timeliness, efficiency, and outcomes of care at the receiving hospital. Implementation of the handover tool was feasible and well accepted by transferring physicians despite a geographically large and diverse transfer network. Although implementation did not substantially improve measures of the timeliness of initial care among transfer patients, we noted a nonsignificant trend toward reduced LOS postintervention.
We observed a substantial and statistically significant reduction in mortality among transfer patients after implementation of the handover tool that persisted after controlling for time trends, comorbid illness, and several other patient factors. This effect was not seen in a concurrent control group of cardiac transfer patients for whom the handover tool was not implemented. Standardizing communication regarding high-risk clinical care processes may be responsible for the observed mortality reduction, similar to improvements seen in other small pilot studies.18 We acknowledge that the magnitude of the improvement in mortality is more than might be expected from the handover tool alone and could be due to chance.
In this initial evaluation, it was not feasible to determine whether information provided in the handover tool helped avert specific complications that could affect mortality, such as complications related to the use of ventilators, high-risk medications, or indwelling devices. Assessment of additional patient safety indices such as code events, unplanned ICU transfers, and medication errors could also help clarify the effect of the handover tool on patient-safety outcomes, and future work should include these metrics as well. Alternately, the improvement in mortality may result from other unmeasured processes that occurred concurrently and verification of this finding should be completed in other settings.
CONCLUSION
More work is needed to determine suitable process and outcome measures for interhospital transfers. Most literature has focused on cost and LOS at the exclusion of more proximal measures of initial care.3-7 The Institute of Medicine has identified timeliness as 1 of the 6 aims for care delivery redesign,19 yet standardized timeliness outcomes do not exist across broad inpatient populations. We chose to monitor the time-to-admission order entry and time-to-antibiotic order entry as 2 indicators of timeliness that would be applicable to a variety of patients. The lack of change in these selected measures should prompt examination for other measures of efficiency, including those that affect nontransferred patients. It is possible that nontransferred patients cared for by the same physician also benefit from fewer delays or disruptions and experience increased efficiency of care if transfer patient communication is improved. Further work is necessary to understand whether other measures of timely initial patient care may be more suitable.
The use of a time-series design to account for temporal trends adds substantial rigor to this study, since the majority of these patients were cared for by house staff whose experience and efficiency vary throughout the academic year. Furthermore, subsequent multivariate analysis demonstrated consistent findings after adjustment for comorbid illness and several other hospital and patient-level confounders.
This study has several limitations. The primary limitation is its nonrandomized design. Patient characteristics were stable across multiple variables before and after implementation, but it is possible that another confounding factor was responsible for observed improvements. Likewise, we collected data for only 6 rather than 12 months during the postintervention time period, which limited our sample size and statistical power. This was chosen because a significant restructuring of resident duty hours occurred in spring 2011 that had the potential to affect all measures studied.20,21 Finally, we did not collect data on accuracy of the information provided in the handover tool or end-user utilization and were unable to account for effects of these.
Since implementation in 2010, this process for interhospital transfers at VUH remains the same, although the volume of incoming transfers has significantly increased. Electronic handover tools with similar structure and content have since been adopted for patients being transferred to the emergency department or directly admitted from clinic. As VUH moves in the coming years from a locally developed electronic medical record to a national vendor, there will be an opportunity to transform this tool into an electronic template that will easily share data between institutions and further enhance communication.
Interhospital transfer patients represent a high-risk population whose unique handover needs have not been adequately measured or addressed. Our investigation demonstrated that a standardized handover aid can be implemented across a broad transfer network and may contribute to reductions in LOS and mortality. Further study is warranted to confirm these findings and assess the effect on other clinical outcomes.
Disclosures
This material is based upon work supported by the Office of Academic Affiliations, Department of Veterans Affairs, VA National Quality Scholars Program, and was made possible by the use of the facilities at VA Tennessee Valley Healthcare System, Nashville, Tennessee. The views expressed in this article are those of the authors and do not necessarily reflect the position or policy of the Department of Veterans Affairs or the US government. Additionally, this publication was supported in part by CTSA award No. UL1TR000445 from the National Center for Advancing Translational Sciences. Its contents are solely the responsibility of the authors and do not necessarily represent official views of the National Center for Advancing Translational Sciences or the National Institutes of Health.
1. Coleman EA, Min SJ, Chomiak A, Kramer AM. Posthospital care transitions: patterns, complications, and risk identification. Health Serv Res. 2004;39:1449-1465. PubMed
2. Iwashyna TJ, Christie JD, Moody J, Kahn JM, Asch DA. The structure of critical care transfer networks. Med Care. 2009;47:787-793. PubMed
3. Durairaj L, Will JG, Torner JC, Doebbeling BN. Prognostic factors for mortality following interhospital transfers to the medical intensive care unit of a tertiary referral center. Crit Care Med. 2003;31:1981-1986. PubMed
4. Golestanian E, Scruggs JE, Gangnon RE, Mak RP, Wood KE. Effect of interhospital transfer on resource utilization and outcomes at a tertiary care referral center. Crit Care Med. 2007;35:1470-1476. PubMed
5. Flabouris A, Hart GK, George C. Outcomes of patients admitted to tertiary intensive care units after interhospital transfer: comparison with patients admitted from emergency departments. Crit Care Resusc. 2008;10:97-105. PubMed
6. Combes A, Luyt CE, Trouillet JL, Chastre J, Gibert C. Adverse effect on a referral intensive care unit’s performance of accepting patients transferred from another intensive care unit. Crit Care Med. 2005;33:705-710. PubMed
7. Rosenberg AL, Hofer TP, Strachan C, Watts CM, Hayward RA. Accepting critically ill transfer patients: adverse effect on a referral center’s outcome and benchmark measures. A Intern Med. 2003;138:882-890. PubMed
8. Horwitz LI, Moin T, Krumholz HM, Wang L, Bradley EH. Consequences of inadequate sign-out for patient care. Arch Intern Med. 2008;168:1755-1760. PubMed
9. Starmer AJ, Sectish TC, Simon DW, et al. Rates of medical errors and preventable adverse events among hospitalized children following implementation of a resident handoff bundle. JAMA. 2013;310:2262-2270. PubMed
10. Arora VM, Manjarrez E, Dressler DD, Basaviah P, Halasyamani L, Kripalani S. Hospitalist handoffs: a systematic review and task force recommendations. J Hosp Med. 2009;4:433-440. PubMed
11. Bosk EA, Veinot T, Iwashyna TJ. Which patients and where: a qualitative study of patient transfers from community hospitals. Med Care. 2011;49:592-598. PubMed
12. Herrigel DJ, Carroll M, Fanning C, Steinberg MB, Parikh A, Usher M. Interhospital transfer handoff practices among US tertiary care centers: a descriptive survey. J Hosp Med. 2016;11:413-417. PubMed
13. Kripalani S, LeFevre F, Phillips CO, Williams MV, Basaviah P, Baker DW. Deficits in communication and information transfer between hospital-based and primary care physicians. JAMA. 2007;297:831-841. PubMed
14. Gandara E, Moniz TT, Ungar J, et al. Deficits in discharge documentation in patients transferred to rehabilitation facilities on anticoagulation: results of a systemwide evaluation. Jt Comm J Qual Patient Saf. 2008;34:460-463. PubMed
15. Haig KM, Sutton S, Whittington J. SBAR: a shared mental model for improving communication between clinicians. Jt Comm J Qual Patient Saf. 2006;32:167-175. PubMed
16. van Walraven C, Austin PC, Jennings A, Quan H, Forster AJ. A modification of the Elixhauser comorbidity measures into a point system for hospital death using administrative data. Med Care. 2009;47:626-633. PubMed
17. Wagner AK, Soumerai SB, Zhang F, Ross-Degnan D. Segmented regression analysis of interrupted time series studies in medication use research. J Clin Pharm Ther. 2002;27:299-309. PubMed
18. Malpass HC, Enfield KB, Keim-Malpass J, Verghese GM. The interhospital medical intensive care unit transfer instrument facilitates early implementation of critical therapies and is associated with fewer emergent procedures upon arrival. J Intensive Care Med. 2015;30:351-357. PubMed
19. National Academy of Sciences. Institute of Medicine. Crossing the Quality Chasm: A New Health System for the 21st Century. March 2005:1–360. Washington, DC. PubMed
20. Theobald CN, Stover DG, Choma NN, et al. The effect of reducing maximum shift lengths to 16 hours on internal medicine interns’ educational opportunities. Acad Med. 2013;88:512-518. PubMed
21. Choma NN, Vasilevskis EE, Sponsler KC, Hathaway J, Kripalani S. Effect of the ACGME 16-hour rule on efficiency and quality of care: duty hours 2.0. JAMA Intern Med. 2013;173:819-821. PubMed
© 2017 Society of Hospital Medicine
MAGS Prevalence in Older Adults
Geriatric syndromes are common clinical conditions in older adults that do not fall into specific disease categories. Unlike the traditional definition of a syndrome, geriatric syndrome refers to a condition that is mediated by multiple shared underlying risk factors.[1, 2] Conditions commonly referred to as geriatric syndromes include delirium, cognitive impairment, falls, unintentional weight loss, depressive symptoms, and incontinence. Even though many perceive it as medical misnomer,[3] geriatric syndromes have been shown to negatively impact quality of life and activities of daily living in older adults.[2] They are also associated with adverse outcomes such as increased healthcare utilization, functional decline, and mortality, even after adjusting for age and disease severity.[4, 5, 6] Hospitalized older adults, including those discharged to skilled nursing facilities (SNFs)[7, 8] are particularly at high risk for new‐onset or exacerbation of geriatric syndromes and poor outcomes.[7, 9, 10] However, hospital providers seldom assess, manage, or document geriatric syndromes because they are often overshadowed by disease conditions that lead to an acute episode requiring hospitalization (e.g., heart disease).[11]
Pharmacotherapy is the cornerstone of hospital treatment, and it is well‐known that it affects multiple physiologic systems causing side effects apart from the condition they are approved to treat. Given that geriatric syndromes are a result of impairments in multiple organ systems, it is plausible that pharmacotherapy may initiate or worsen these syndromes.[12] Medication‐related problems in older adults are well known. Polypharmacy and adverse drug events (as a result of drug‐drug/disease interactions and changes in pharmacokinetics and pharmacodynamics) are prevalent in multimorbid elderly patients.[13, 14, 15, 16] The prescribing cascade[17] increases the medication burden and may be a contributing factor for geriatric syndromes in hospitalized patients.[18] For instance, laxatives may be prescribed to counteract constipation caused by anticholinergic drugs.
The American Geriatric Society (AGS) Beers list[19, 20] and similar criteria[21] provide excellent resources to identify medications with potentially harmful interactions or adverse effects in older adults. Although these lists include medicines associated with a specific geriatric syndrome, they were not developed to explicitly link medicines across multiple geriatric syndromes, regardless of indication or appropriateness. For example, medications that effect important geriatric syndromes like unintentional weight/appetite loss, depression, and urinary incontinence are not extensively covered. In addition, disease‐appropriate medications (eg, ‐blockers for systolic heart failure), that may be associated with a geriatric syndrome (eg, falls) are not included; however, they may be important to consider for a patient and clinician who are weighing the disease benefits compared to the geriatric syndrome‐related risks. Finally, the AGS 2015 Beers criteria panel mentions the limitation that many medication associations may be excluded because older adults are less represented in clinical trials.[20] Clinicians are currently limited in identifying medications potentially contributing to a broad set of geriatric syndromes in their patients without a specific list of medications associated with geriatric syndromes (MAGS).[20]
In response to this gap, identifying these medications is important and should be a starting point in efforts toward prevention and treatment of geriatric syndromes. The 2 main objectives of this study were to first identify medications that may meaningfully contribute to 6 geriatric syndromes and subsequently describe the frequency of these medications in a population transitioning from acute care to postacute care to highlight the need and potential impact of such a list.
METHODS
This study included 2 phases that aligned with our 2 primary objectives. Phase 1 involved identifying medications associated with 6 geriatric syndromes, and phase 2 included a cross‐sectional analysis of the prevalence of these medications in a sample of patients discharged to SNFs.
Phase 1: Development of the MAGS List
Figure 1 depicts the underlying conceptual model and approach that was used in phase 1. The interaction between the patient factors and medication leads to polypharmacy that contributes to geriatric syndromes and additional adverse outcomes. As a starting point for mitigating geriatric syndromes, we used an iterative analytical process to identify a list of medications associated with the following geriatric syndromes that were documented to be highly prevalent in patients discharged to SNFs: cognitive impairment, delirium, falls, unintentional weight and/or appetite loss, urinary incontinence, and depression.[8] To be inclusive and sensitive, our approach differed from traditional systematic reviews, and in fact was meant to bring together much of the established systematic literature about disparate geriatric syndromes in 1 place, because patients often do not experience a geriatric syndrome in isolation, but rather experience multiple geriatric syndromes.[8] The MAGS list had 3 main inclusion criteria (Figure 1): (1) evidence in the published literature (systematic reviews, cohort studies, randomized clinical trials) that the medication is related to the syndrome, (2) expert panel opinion, and (3) drug databases (Lexicomp Online database[22] and/or US Food and Drug Administration [FDA]approved package inserts).[23] We generated an initial list of medications based on these 3 main criteria to identify medications with significant associations to each geriatric syndrome. The list was further expanded and vetted using an iterative review of each medication list as it related to each geriatric syndrome through a series of group meetings focused around each geriatric syndrome. Following further discussion, we obtained agreement among all team members for medications included in the final list. For each geriatric syndrome, we excluded medications from consideration if they were used to treat the same geriatric syndrome (eg, ‐adrenergic blockers used to treat incontinence in men were listed as associated with incontinence only in women). We classified medications according to the Established Pharmacologic Class available at the FDA website. We also compared our final MAGS list with the 2015 AGS Beer's list[20] by identifying medications that were related to the 6 geriatric syndromes. This included Beers[20]‐cited rationale of anticholinergic, extrapyramidal symptoms, orthostatic hypotension (eg, falls), high‐risk adverse central nervous system effects, sedating, cognitive decline (eg, antipsychotics), delirium, falls, fractures, incontinence, and gastrointestinal (eg, nausea, vomiting). Specifically, we assessed whether the medications were included as inappropriate by the AGS Beers 2015[20] list and also whether they documented the syndrome association for that medication.
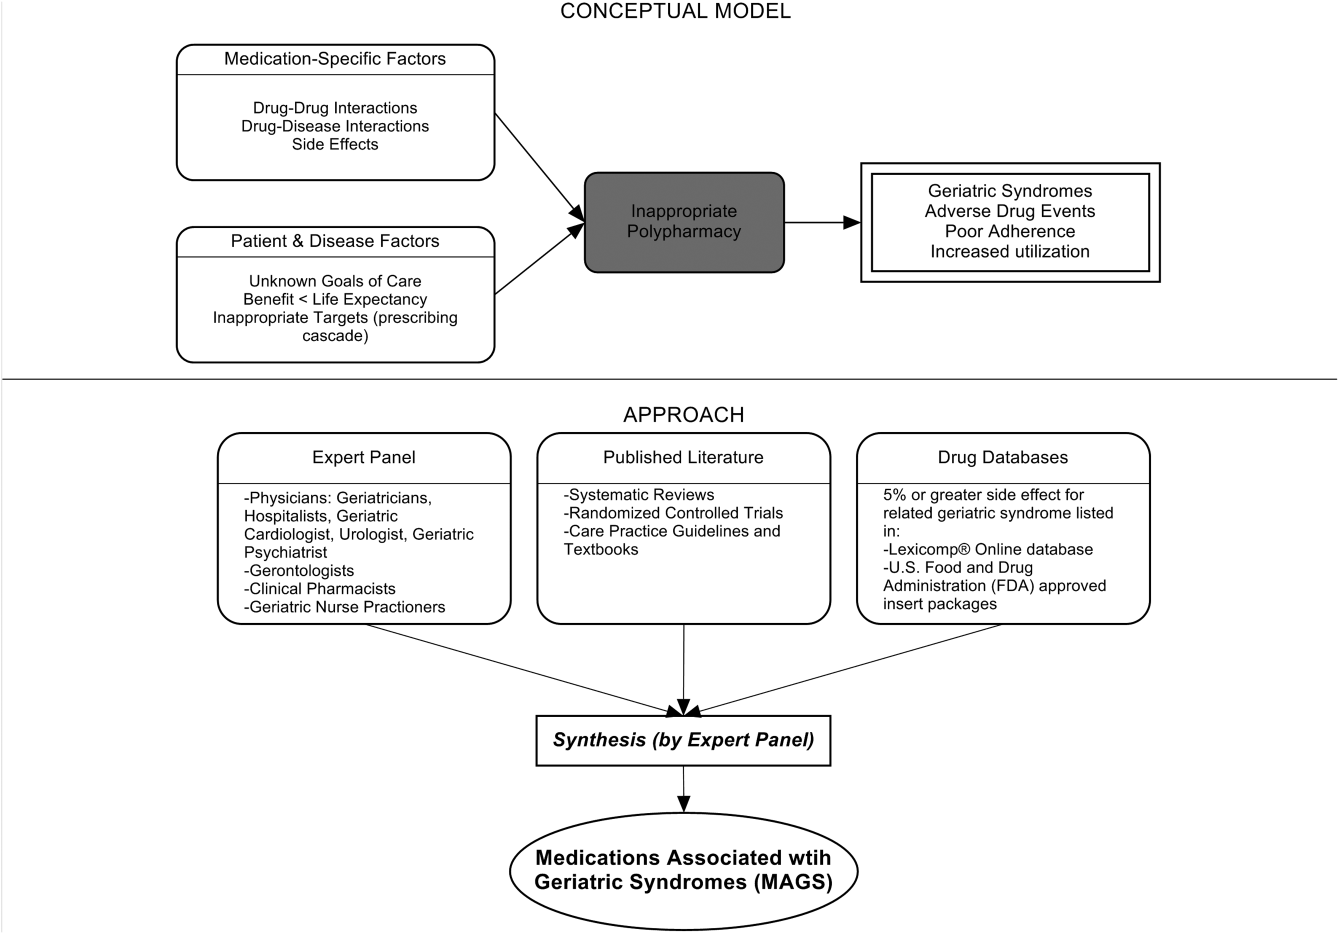
Phase 2: Prevalence of MAGS in Hospitalized Older Adults Discharged to SNFs
Sample
We next applied the MAGS list to a convenience sample of hospitalized patients discharged to SNFs to assess the prevalence of MAGS in this sample, and also to compare with the prevalence of Beers criteria[20] medications. Our sample was selected from data collected as part of a quality‐improvement project to reduce hospital readmissions in patients discharged to SNFs. The larger study enrolled a total 1093 medical and surgical patients who had Medicare insurance eligibility and were discharged from 1 large university hospital to 23 area SNFs from January 17, 2013 through July 31, 2014. The university institutional review board waived the requirement for written consent. For the purpose of this substudy. we selected the first 154 patients with complete chart abstraction (approximately 15% of the total) as a convenience sample.
Data Analysis
We applied descriptive statistics to summarize demographic and clinical characteristics of the convenience sample. To understand potential selection biases that could have resulted by the convenience sampling, we compared participant characteristics of the convenience sample (N = 154) with the characteristics of the remaining participants of the larger study (N = 939) using independent sample t tests and 2 tests for continuous and categorical measures, respectively. We applied the MAGS list and the AGS 2015 Beers criteria[20] for the sample of 154 and identified the medications associated with each of the 6 geriatric syndromes from the discharge medication lists completed by hospital clinical pharmacists. For each patient, we identified both scheduled and PRN (pro re nata, or as needed) medications associated with each geriatric syndrome. Thereafter, we determined whether the discharge list contained at least 1 medication associated with a geriatric syndrome per the MAGS list and the AGS Beers 2015 criteria,[20] and the percentage of overall medications that were part of the MAGS and Beers lists. Data were aggregated using means and standard deviations across syndromes (ie, number of discharge medications per syndrome per patient) along with the percentage of patients with 1 or more medications related to a specific syndrome and the percentage of medications that were MAGS. All analyses were performed using the SPSS statistical package (IBM SPSS Statistics for Windows, version 23.0; IBM, Armonk, NY).
RESULTS
Phase 1: MAGS List
The iterative process applied in this analysis generated a list of 513 medications associated with the 6 geriatric syndromes. The list of medications related to each syndrome and the corresponding rationale and relevant references for their inclusion is presented in the Supporting Information, Appendix 1, in the online version of this article. Table 1 summarizes these medications across 18 major drug categories. Antiepileptics were linked to all 6 geriatric syndromes, whereas antipsychotics, antidepressants, antiparkinsonism, and opioid agonists were associated with 5 syndromes. Ten of the 18 categories were associated with 3 geriatric syndromescognitive impairment, delirium, and falls. Four medication categories were associated with only 1 syndrome. Nonopioid/nonsteroidal anti‐inflammatory and/or analgesics and nonopioid cough suppressant and expectorant medications were associated with falls syndrome only. Hormone replacement medications were associated with depression only, and immunosuppressants were associated with unintentional weight and appetite loss only.
| Major Medication Category | Delirium | Cognitive Impairment | Falls | Unintentional Weight and Appetite Loss | Urinary Incontinence | Depression | Drug Class/Drug Within Each Category |
|---|---|---|---|---|---|---|---|
| |||||||
| Antipsychotics | ✓ | ✓ | ✓ | ✓ | Atypical and typical antipsychotics, buspirone | ||
| Antidepressants | ✓ | ✓ | ✓ | ✓ | ✓ | Tricyclic and tetracyclic antidepressants, serotonin reuptake inhibitors, serotonin and norepinephrine reuptake inhibitor, aminoketone | |
| Antiepileptics | ✓ | ✓ | ✓ | ✓ | ✓ | ✓ | Antiepileptics, mood stabilizers, barbiturates |
| Antiparkinsonism | ✓ | ✓ | ✓ | ✓ | ✓ | Aromatic amino acid decarboxylation inhibitor and catechol‐o‐methyltransferase inhibitor, catecholamine‐depleting sympatholytic, catechol‐o‐methyltransferase inhibitor, dopaminergic agonist, ergot derivative, monoamine oxidase inhibitor, nonergot dopamine agonist, | |
| Benzodiazapines | ✓ | ✓ | ✓ | Benzodiazapines only | |||
| Nonbenzodiazepine hypnotics | ✓ | ✓ | ✓ | Benzodiazepine analogs, nonbenzodiazepine hypnotics, tranquilizers, ‐aminobutyric acid A receptor agonist | |||
| Opioid agonists | ✓ | ✓ | ✓ | ✓ | ✓ | Full or partial opioid agonists, opiates, opioids | |
| Nonopioid/nonsteroidal anti‐inflammatory and/or analgesics | ✓ | Nonopioid analgesics, NSAIDs, COX‐2 selective inhibitor NSAIDs | |||||
| Antihypertensives | ✓ | ✓ | ✓ | Calcium channel blocker, ‐adrenergic blocker, angiotensin‐converting enzyme inhibitor, angiotensin 2 receptor blocker, ‐adrenergic blocker, diuretics (loop, potassium sparing, thiazide), nitrate vasodilators, aldosterone blocker | |||
| Antiarrhythmic | ✓ | ✓ | ✓ | Antiarrhythmics, cardiac glycosides | |||
| Antidiabetics | ✓ | ✓ | Insulin and insulin analogs, sulfonylureas, ‐glucosidase inhibitor, amylin analog, biguanide, glinide, GLP‐1 receptor agonist, glucagon‐like peptide‐1 agonist | ||||
| Anticholinergics and/or antihistaminics | ✓ | ✓ | ✓ | ✓ | Anticholinergics, histamine receptor antagonists, muscarininc antagonists, combined anticholinergics, and histamine receptor antagonists | ||
| Antiemetics | ✓ | ✓ | ✓ | Antiemetics, dopaminergic antagonists, dopamine‐2 receptor antagonist | |||
| Hormone replacement | ✓ | Corticosteroids, progestin, estrogen, estrogen agonist/antagonist, gonadotropin releasing hormone receptor agonist | |||||
| Muscle relaxers | ✓ | ✓ | ✓ | ✓ | Muscle relaxers | ||
| Immunosuppressants | ✓ | Calcineurin inhibitor immunosuppressant, folate analog metabolic inhibitor, purine antimetabolite | |||||
| Nonopioid cough suppressants and expectorants | ✓ | Expectorant, non‐narcotic antitussive, ‐1 agonist, uncompetitive N‐methyl‐D‐aspartate receptor antagonist | |||||
| Antimicrobials | ✓ | ✓ | Macrolide, cephalosporin, penicillin class, rifamycin, non‐nucleoside analog reverse transcriptase inhibitor, influenza A M2 protein inhibitor | ||||
| Others | ✓ | ✓ | ✓ | ✓ | ✓ | ✓ | ‐3‐adrenergic agonist, methylxanthine, cholinesterase inhibitor, interferon and , partial cholinergic nicotinic agonist, tyrosine hydroxylase, retinoid, serotonin‐1b and serotonin‐1d receptor agonist, stimulant laxative, vitamin K antagonist, platelet aggregation inhibitor |
Approximately 58% of the medications overlapped with the AGS 2015 Beer's Criteria[20] irrespective of whether the specific syndrome association was stated in the rationale.[20] Medications that overlapped were mostly in the delirium, cognitive impairment, and falls category with only a few overlaps in depression, unintentional weight loss, and urinary incontinence lists (see Supporting Information, Appendix 1, in the online version of this article).
Phase 2: Prevalence of MAGS
Among 154 participants, the mean age was 76.5 (10.6) years, 64.3% were female, 77.9% were white, and 96.1% non‐Hispanic. The median hospital length of stay was 6 days, with an interquartile range of 5 days. The orthopedic service discharged the highest proportion of patients (24%), followed by the geriatrics and internal medicine services, which each discharged 19.5% of the patients (Table 2). The remaining participants of the larger quality‐improvement project (N = 939) did not significantly differ on these demographic and clinical characteristics except for hospital length of stay, which was shorter in the sample analyzed (see Supporting Information, Appendix 2, in the online version of this article).
| Baseline Characteristics | Mean ( SD) or Percent (n) |
|---|---|
| |
| Age, y | 76.5 ( 10.6) |
| Sex | |
| Female | 64.3% (99) |
| Race | |
| White | 77.9% (126) |
| Black | 16.2% (25) |
| Unknown | 0.6% (1) |
| Declined | 0.6% (1) |
| Missing | 0.6% (1) |
| Ethnicity | |
| Non‐Hispanic | 96.1% (148) |
| Hispanic | 1.3% (2) |
| Unknown | 2.6% (4) |
| Hospital length of stay, d | 7.0 ( 4.2) |
| Hospital length of stay, d, median (IQR) | 6.0 (5.0) |
| No. of hospital discharge medications, count | 14.0 ( 4.7) |
| Discharge service | |
| Orthopedic service | 24.0% (37) |
| Geriatric service | 19.5% (30) |
| Internal medicine | 19.5% (30) |
| Other | 37.0% (57) |
Patients were discharged to SNFs with an average of 14.0 (4.7) medication orders. Overall, 43% (13%) of these discharge medication orders were MAGS. Every patient in the sample was ordered at least 1 medication associated with geriatric syndromes. Multiple MAGS were the norm, with an average of 5.9 (2.2) MAGS per patient. MAGS were also the norm, as 98.1% of the sample had medication orders associated with at least 2 different syndromes.
When the Beer's criteria[20] were applied to the medication orders (instead of the MAGS list), problematic medications appeared less common. Patients had an average of 3.04 (1.7) MAGS that were also listed on the AGS 2015 Beer's list,[20] representing an average of 22.3% of all discharge orders.
Table 3 illustrates the average number of medications per patient associated with each syndrome, and the percentage of patients (number in parentheses) discharged with at least 1 medication associated with each syndrome per the MAGS list and the Beers 2015 criteria.[20] For example, per the MAGS list, the syndrome most frequently associated with medications was falls, with patients discharged on an average of 5.5 (2.2) medications associated with falls, and 100% of the sample had at least 1 discharge medication associated with falls. Alternatively, the syndrome associated with the lowest frequency of medications was unintentional weight loss (with an average of 0.38 medications per patient), although 36% of these patients had more than 1 discharge medication associated with weight loss. As seen in Table 3, the mean and prevalence of 1 or more medications associated with each of the geriatric syndromes as identified by the Beers 2015 criteria[20] was lower than those identified by the MAGS list developed for this study.
| Geriatric Syndromes | Associated Medications per MAGS List | Associated Medications per AGS Beers 2015 Criteria | ||
|---|---|---|---|---|
| Mean SD | Percentage of Patients Receiving 1 Related Medication | Mean SD | Percentage of Patients Receiving 1 Related Medication | |
| ||||
| Cognitive impairment | 1.8 ( 1.2) | 84.4% (130) | 1.6 ( 1.2) | 78.6% (121) |
| Delirium | 1.4 ( 1.1) | 76.0% (117) | 1.3 ( 1.2) | 68.2% (105) |
| Falls | 5.5 ( 2.2) | 100% (154) | 2.6 ( 1.6) | 92.2% (142) |
| Unintentional weight and/or appetite loss | 0.4 ( 0.5) | 36.3% (56) | 0.1 ( 0.3) | 6.5% (10) |
| Urinary incontinence | 1.6 ( 1.0) | 85.7% (132) | 0.1 ( 0.2) | 5.8% (9) |
| Depression | 1.7 ( 1.0) | 90.9% (140) | 0.0 ( 0.0) | 0.0% (0) |
| All syndromes | 5.9 ( 2.2) | 100% (154) | 3.0 ( 1.7) | 95% (149) |
DISCUSSION
An iterative process of evidence review by a multidisciplinary panel resulted in a list of 513 medications associated with 6 common geriatric syndromes. This analysis demonstrated that hospitalized, older patients discharged to SNFs were frequently prescribed MAGS. The rate of prescribing ranged from 100% of patients with a medication associated with falls to 36% for unintentional weight loss. Moreover, an alarming 43% of all medications at hospital discharge were MAGS. For this vulnerable population, the combination of high prevalence of MAGS and high risk of geriatric syndromes emphasize a need to critically review the risks and benefits of MAGS throughout hospitalization and at the time of discharge.
A body of evidence demonstrates that many drugs in a typical older adult regimen have no specific clinical indication, are considered inappropriate, or have uncertain efficacy in the geriatric population.[24, 25, 26] This study builds on the foundational work described in landmark reviews such as the AGS Beers[20] and STOPP/START[21] (Screening Tool of Older Persons' Potentially Inappropriate Prescriptions/Screening Tool to Alert doctors to Right, i.e. appropriate indicated Treatment) criteria. Both of these tools, however, were specifically designed as screening tools to identify medications considered unsafe for older adults under most circumstances and within specific illness states.[19, 20, 21] They are most often utilized when starting a medication to avoid acute adverse events. In contrast, the MAGS list was developed to be inclusive of medications that are often appropriate for many medical diagnoses but may also contribute to underlying geriatric syndromes that are more chronic in nature. In addition, inclusion of such medicines increases the sensitivity of screening for medications that can be targeted through patient‐centered deprescribing efforts when clinically appropriate.
A major strength of this study is that we bring together evidence across a spectrum of geriatric syndromes commonly experienced by hospitalized elders. In addition to evaluating multiple syndromes, we applied multiple modalities; particularly the use of an iterative review process by a multidisciplinary team of experts and using Lexicomp and FDA insert packages for linking medications to specific geriatric conditions. The inclusion criteria were broadened beyond single sources of evidence in an effort to capture a comprehensive list of medications. As a result, the MAGS list can be implemented as a screening tool for deprescribing interventions and assessing medication appropriateness to address individual or clusters of geriatric syndromes within a patient.
In addition to expanding this knowledge base, clinical relevance of the MAGS list is highlighted by its application to a sample of hospitalized older adults discharged to SNFs, a cohort known to experience geriatric syndromes. In fact, 43% of patients' medications at hospital discharge were MAGS. Importantly, due to the cross‐sectional nature of this study, we cannot be certain if the medication caused or potentiated each of the geriatric syndromes. However, hospitals and SNFs are devoting major resources toward reduction of falls, avoidance of urinary catheter use, and reduction of preventable readmissions. These efforts can be complemented by considering the number of medications associated with falls, urinary incontinence, and overall MAGS burden. The striking prevalence of MAGS demonstrates a rigorous need to weigh the risks and benefits of these medications. Above all, the intent of this study is not to propose that any MAGS be reflexively stopped, but rather that the MAGS list should facilitate a holistic approach to care for the complex older adult. For example, standard therapies such as gabapentin may be appropriate for treating neuralgic pain but may also contribute to falls and urinary incontinence. Thus, alternative pain treatments could be selected in place of gabapentin for a 75‐year old patient who is experiencing recurrent falls and increasing incontinence. Therefore, the MAGS list enables a patient‐provider discussion wherein medications' therapeutic benefits can be weighed against risks posed by specific clusters of geriatric syndromes, potential impact on quality of life, and consistency with goals of care.
This study has some limitations. First, although we examined a broad number of geriatric syndromes, several other geriatric syndromes experienced by hospitalized older adults were not addressed including: fecal incontinence, insomnia, and functional impairment. These syndromes were intentionally excluded from the study a priori due to reasons of feasibility and scope. Second, unlike the Beer's 2015 criteria, the MAGS list does not sub‐classify associations of medications with geriatric syndromes for patients with specific diseases (eg, heart failure). In fact, our MAGS list included medications often indicated in treating these diagnoses. A clinician must work with the patient to weigh the disease‐specific benefits of some medications with the potential effect on geriatric syndrome symptoms and outcomes. Third, the instrument has a very high sensitivity, which was intended to generate an inclusive list of medications that enables providers to weigh risks of geriatric syndromes with the intended indication benefit. The objective is not to use this list as a reflexive tool but rather help clinicians identify a starting point to address geriatric syndromes in their patients to make patient‐centered medication decisions. Although the MAGS list is intentionally large (sensitive), the advent of advanced bioinformatics can enable MAGS to be assessed in the future for both clinical and research purposes. Fourth, FDA insert packages and Lexicomp databases report anything experienced by the patient while on the particular medication, but it might not necessarily imply a causative link. The high use of MAGS and the specific geriatric syndrome may coexist due to the high prevalence and interplay of multimorbidity, polypharmacy, and geriatric syndromes in this population. Last, the list was developed by expert panel members predominantly from a single institution, which may introduce bias. Despite these limitations, the prevalence of these medications in a sample of patients transitioning from acute to postacute care highlights the utility of the MAGS list in future clinical research and quality improvement endeavors.
In conclusion, the MAGS list provides a comprehensive and sensitive indicator of medications associated with any of 6 geriatric syndromes regardless of medication indication and appropriateness. The MAGS list provides an overall degree of medication burden with respect to geriatric syndromes and a foundation for future research to assess the relationship between the presence of geriatric syndromes and syndrome‐associated medications. The MAGS list is an important first step in summarizing the data that link medications to geriatric syndromes. Future studies are needed to broaden the analysis of MAGS for other common geriatric syndromes and to identify new and emerging medications not present during the time of this analysis. The MAGS list has the potential to facilitate deprescribing efforts needed to combat the epidemic of overprescribing that may be contributing to the burden of geriatric syndromes among older patients.
Acknowledgements
The authors thank Dr. Linda Beuscher, Dr. Patricia Blair Miller, Dr. Joseph Ouslander, Dr. William Stuart Reynolds, and Dr. Warren Taylor for providing their expertise and participating in the expert panel discussions that facilitated the development of the MAGS list. The authors also recognize the research support provided by Christopher Simon Coelho.
Disclosures: This research was supported by the Department of Health and Human Services, Centers for Medicare & Medicaid Services grant #1C1CMS331006 awarded to Principal Investigator, John F. Schnelle, PhD. Dr. Vasilevskis was supported by the National Institute on Aging of the National Institutes of Health award K23AG040157 and the Geriatric Research, Education and Clinical Center. Dr. Bell was supported by National Institute on Aging‐K award K23AG048347‐01A1. Dr. Mixon is supported by a Veterans Affairs Health Services Research & Development Career Development Award (12‐168). This research was also supported by the National Center for Advancing Translational Sciences Clinical and Translational Science award UL1TR000445. The contents of this publication are solely the responsibility of the authors and do not necessarily represent the official views of the US Department of Health and Human Services or any of its agencies, the National Center for Advancing Translation Science, the National Institutes of Health, or the Department of Veterans Affairs. Each coauthor contributed significantly to the manuscript. Dr. Kripalani has received stock/stock options from Bioscape Digital, LLC. None of the other authors have significant conflicts of interest to report related to this project or the results reported within this article.
- , , , . Geriatric syndromes: clinical, research, and policy implications of a core geriatric concept. J Am Geriatr Soc. 2007;55:780–791.
- , , , . Shared risk factors for falls, incontinence, and functional dependence. Unifying the approach to geriatric syndromes. JAMA. 1995;273:1348–1353.
- , , , . Geriatric syndromes: medical misnomer or progress in geriatrics? Neth J Med. 2003;61:83–87.
- , , , et al. Geriatric conditions in acutely hospitalized older patients: prevalence and one‐year survival and functional decline. PLoS One. 2011;6:e26951.
- , , , , . Geriatric conditions as predictors of increased number of hospital admissions and hospital bed days over one year: findings of a nationwide cohort of older adults from Taiwan. Arch Gerontol Geriatr. 2014;59:169–174.
- , , , , . Geriatric conditions and disability: the Health and Retirement Study. Ann Intern Med. 2007;147:156–164.
- , , , , , . A prospective cohort study of geriatric syndromes among older medical patients admitted to acute care hospitals. J Am Geriatr Soc. 2011;59:2001–2008.
- , , , et al. Geriatric syndromes in hospitalized older adults discharged to skilled nursing facilities. J Am Geriatr Soc. 2016;64(4):715–722.
- , , , et al. Discharge to a skilled nursing facility and subsequent clinical outcomes among older patients hospitalized for heart failure. Circ Heart Fail. 2011;4:293–300.
- . Hazards of hospitalization of the elderly. Ann Intern Med. 1993;118:219–223.
- , , , , . Geriatric syndromes in elderly patients admitted to an inpatient cardiology ward. J Hosp Med. 2007;2:394–400.
- , , , . Effect of hospitalization on inappropriate prescribing in elderly Medicare beneficiaries. J Am Geriatr Soc. 2015;63:699–707.
- , , , et al. Polypharmacy cutoff and outcomes: five or more medicines were used to identify community‐dwelling older men at risk of different adverse outcomes. J Clin Epidemiol. 2012;65:989–995.
- , , , , . Investigating polypharmacy and drug burden index in hospitalised older people. Intern Med J. 2013;43:912–918.
- , . Potentially harmful drug‐drug interactions in the elderly: a review. Am J Geriatr Pharmacother. 2011;9:364–377.
- , , , . Hospital admissions/visits associated with drug‐drug interactions: a systematic review and meta‐analysis. Pharmacoepidemiol Drug Saf. 2014;23:489–497.
- , . Optimising drug treatment for elderly people: the prescribing cascade. BMJ. 1997;315:1096–1099.
- , , , et al. Association between acute geriatric syndromes and medication‐related hospital admissions. Drugs Aging. 2012;29:691–699.
- American Geriatrics Society Beers Criteria Update Expert P. American Geriatrics Society updated Beers Criteria for potentially inappropriate medication use in older adults. J Am Geriatr Soc. 2012;60:616–631.
- By the American Geriatrics Society 2015 Beers Criteria Update Expert Panel. American Geriatrics Society 2015 updated Beers criteria for potentially inappropriate medication use in older adults. J Am Geriatr Soc. 2015;63:2227–2246.
- , . STOPP (Screening Tool of Older Persons' potentially inappropriate Prescriptions): application to acutely ill elderly patients and comparison with Beers' criteria. Age Ageing. 2008;37:673–679.
- , , , et al. Warfarin versus aspirin for stroke prevention in an elderly community population with atrial fibrillation (the Birmingham Atrial Fibrillation Treatment of the Aged Study, BAFTA): a randomised controlled trial. Lancet. 2007;370:493–503.
- U.S. Food and Drug Administration. Drugs. Available at: http://www.fda.gov/Drugs/default.htm. Accessed May 15th, 2015.
- , , , et al. Inappropriate medication use among frail elderly inpatients. Ann Pharmacother. 2004;38:9–14.
- , , , et al. Inappropriate medications in elderly ICU survivors: where to intervene? Arch Intern Med. 2011;171:1032–1034.
- , , , et al. Appropriateness of medication prescribing in ambulatory elderly patients. J Am Geriatr Soc. 1994;42:1241–1247.
Geriatric syndromes are common clinical conditions in older adults that do not fall into specific disease categories. Unlike the traditional definition of a syndrome, geriatric syndrome refers to a condition that is mediated by multiple shared underlying risk factors.[1, 2] Conditions commonly referred to as geriatric syndromes include delirium, cognitive impairment, falls, unintentional weight loss, depressive symptoms, and incontinence. Even though many perceive it as medical misnomer,[3] geriatric syndromes have been shown to negatively impact quality of life and activities of daily living in older adults.[2] They are also associated with adverse outcomes such as increased healthcare utilization, functional decline, and mortality, even after adjusting for age and disease severity.[4, 5, 6] Hospitalized older adults, including those discharged to skilled nursing facilities (SNFs)[7, 8] are particularly at high risk for new‐onset or exacerbation of geriatric syndromes and poor outcomes.[7, 9, 10] However, hospital providers seldom assess, manage, or document geriatric syndromes because they are often overshadowed by disease conditions that lead to an acute episode requiring hospitalization (e.g., heart disease).[11]
Pharmacotherapy is the cornerstone of hospital treatment, and it is well‐known that it affects multiple physiologic systems causing side effects apart from the condition they are approved to treat. Given that geriatric syndromes are a result of impairments in multiple organ systems, it is plausible that pharmacotherapy may initiate or worsen these syndromes.[12] Medication‐related problems in older adults are well known. Polypharmacy and adverse drug events (as a result of drug‐drug/disease interactions and changes in pharmacokinetics and pharmacodynamics) are prevalent in multimorbid elderly patients.[13, 14, 15, 16] The prescribing cascade[17] increases the medication burden and may be a contributing factor for geriatric syndromes in hospitalized patients.[18] For instance, laxatives may be prescribed to counteract constipation caused by anticholinergic drugs.
The American Geriatric Society (AGS) Beers list[19, 20] and similar criteria[21] provide excellent resources to identify medications with potentially harmful interactions or adverse effects in older adults. Although these lists include medicines associated with a specific geriatric syndrome, they were not developed to explicitly link medicines across multiple geriatric syndromes, regardless of indication or appropriateness. For example, medications that effect important geriatric syndromes like unintentional weight/appetite loss, depression, and urinary incontinence are not extensively covered. In addition, disease‐appropriate medications (eg, ‐blockers for systolic heart failure), that may be associated with a geriatric syndrome (eg, falls) are not included; however, they may be important to consider for a patient and clinician who are weighing the disease benefits compared to the geriatric syndrome‐related risks. Finally, the AGS 2015 Beers criteria panel mentions the limitation that many medication associations may be excluded because older adults are less represented in clinical trials.[20] Clinicians are currently limited in identifying medications potentially contributing to a broad set of geriatric syndromes in their patients without a specific list of medications associated with geriatric syndromes (MAGS).[20]
In response to this gap, identifying these medications is important and should be a starting point in efforts toward prevention and treatment of geriatric syndromes. The 2 main objectives of this study were to first identify medications that may meaningfully contribute to 6 geriatric syndromes and subsequently describe the frequency of these medications in a population transitioning from acute care to postacute care to highlight the need and potential impact of such a list.
METHODS
This study included 2 phases that aligned with our 2 primary objectives. Phase 1 involved identifying medications associated with 6 geriatric syndromes, and phase 2 included a cross‐sectional analysis of the prevalence of these medications in a sample of patients discharged to SNFs.
Phase 1: Development of the MAGS List
Figure 1 depicts the underlying conceptual model and approach that was used in phase 1. The interaction between the patient factors and medication leads to polypharmacy that contributes to geriatric syndromes and additional adverse outcomes. As a starting point for mitigating geriatric syndromes, we used an iterative analytical process to identify a list of medications associated with the following geriatric syndromes that were documented to be highly prevalent in patients discharged to SNFs: cognitive impairment, delirium, falls, unintentional weight and/or appetite loss, urinary incontinence, and depression.[8] To be inclusive and sensitive, our approach differed from traditional systematic reviews, and in fact was meant to bring together much of the established systematic literature about disparate geriatric syndromes in 1 place, because patients often do not experience a geriatric syndrome in isolation, but rather experience multiple geriatric syndromes.[8] The MAGS list had 3 main inclusion criteria (Figure 1): (1) evidence in the published literature (systematic reviews, cohort studies, randomized clinical trials) that the medication is related to the syndrome, (2) expert panel opinion, and (3) drug databases (Lexicomp Online database[22] and/or US Food and Drug Administration [FDA]approved package inserts).[23] We generated an initial list of medications based on these 3 main criteria to identify medications with significant associations to each geriatric syndrome. The list was further expanded and vetted using an iterative review of each medication list as it related to each geriatric syndrome through a series of group meetings focused around each geriatric syndrome. Following further discussion, we obtained agreement among all team members for medications included in the final list. For each geriatric syndrome, we excluded medications from consideration if they were used to treat the same geriatric syndrome (eg, ‐adrenergic blockers used to treat incontinence in men were listed as associated with incontinence only in women). We classified medications according to the Established Pharmacologic Class available at the FDA website. We also compared our final MAGS list with the 2015 AGS Beer's list[20] by identifying medications that were related to the 6 geriatric syndromes. This included Beers[20]‐cited rationale of anticholinergic, extrapyramidal symptoms, orthostatic hypotension (eg, falls), high‐risk adverse central nervous system effects, sedating, cognitive decline (eg, antipsychotics), delirium, falls, fractures, incontinence, and gastrointestinal (eg, nausea, vomiting). Specifically, we assessed whether the medications were included as inappropriate by the AGS Beers 2015[20] list and also whether they documented the syndrome association for that medication.
Phase 2: Prevalence of MAGS in Hospitalized Older Adults Discharged to SNFs
Sample
We next applied the MAGS list to a convenience sample of hospitalized patients discharged to SNFs to assess the prevalence of MAGS in this sample, and also to compare with the prevalence of Beers criteria[20] medications. Our sample was selected from data collected as part of a quality‐improvement project to reduce hospital readmissions in patients discharged to SNFs. The larger study enrolled a total 1093 medical and surgical patients who had Medicare insurance eligibility and were discharged from 1 large university hospital to 23 area SNFs from January 17, 2013 through July 31, 2014. The university institutional review board waived the requirement for written consent. For the purpose of this substudy. we selected the first 154 patients with complete chart abstraction (approximately 15% of the total) as a convenience sample.
Data Analysis
We applied descriptive statistics to summarize demographic and clinical characteristics of the convenience sample. To understand potential selection biases that could have resulted by the convenience sampling, we compared participant characteristics of the convenience sample (N = 154) with the characteristics of the remaining participants of the larger study (N = 939) using independent sample t tests and 2 tests for continuous and categorical measures, respectively. We applied the MAGS list and the AGS 2015 Beers criteria[20] for the sample of 154 and identified the medications associated with each of the 6 geriatric syndromes from the discharge medication lists completed by hospital clinical pharmacists. For each patient, we identified both scheduled and PRN (pro re nata, or as needed) medications associated with each geriatric syndrome. Thereafter, we determined whether the discharge list contained at least 1 medication associated with a geriatric syndrome per the MAGS list and the AGS Beers 2015 criteria,[20] and the percentage of overall medications that were part of the MAGS and Beers lists. Data were aggregated using means and standard deviations across syndromes (ie, number of discharge medications per syndrome per patient) along with the percentage of patients with 1 or more medications related to a specific syndrome and the percentage of medications that were MAGS. All analyses were performed using the SPSS statistical package (IBM SPSS Statistics for Windows, version 23.0; IBM, Armonk, NY).
RESULTS
Phase 1: MAGS List
The iterative process applied in this analysis generated a list of 513 medications associated with the 6 geriatric syndromes. The list of medications related to each syndrome and the corresponding rationale and relevant references for their inclusion is presented in the Supporting Information, Appendix 1, in the online version of this article. Table 1 summarizes these medications across 18 major drug categories. Antiepileptics were linked to all 6 geriatric syndromes, whereas antipsychotics, antidepressants, antiparkinsonism, and opioid agonists were associated with 5 syndromes. Ten of the 18 categories were associated with 3 geriatric syndromescognitive impairment, delirium, and falls. Four medication categories were associated with only 1 syndrome. Nonopioid/nonsteroidal anti‐inflammatory and/or analgesics and nonopioid cough suppressant and expectorant medications were associated with falls syndrome only. Hormone replacement medications were associated with depression only, and immunosuppressants were associated with unintentional weight and appetite loss only.
| Major Medication Category | Delirium | Cognitive Impairment | Falls | Unintentional Weight and Appetite Loss | Urinary Incontinence | Depression | Drug Class/Drug Within Each Category |
|---|---|---|---|---|---|---|---|
| |||||||
| Antipsychotics | ✓ | ✓ | ✓ | ✓ | Atypical and typical antipsychotics, buspirone | ||
| Antidepressants | ✓ | ✓ | ✓ | ✓ | ✓ | Tricyclic and tetracyclic antidepressants, serotonin reuptake inhibitors, serotonin and norepinephrine reuptake inhibitor, aminoketone | |
| Antiepileptics | ✓ | ✓ | ✓ | ✓ | ✓ | ✓ | Antiepileptics, mood stabilizers, barbiturates |
| Antiparkinsonism | ✓ | ✓ | ✓ | ✓ | ✓ | Aromatic amino acid decarboxylation inhibitor and catechol‐o‐methyltransferase inhibitor, catecholamine‐depleting sympatholytic, catechol‐o‐methyltransferase inhibitor, dopaminergic agonist, ergot derivative, monoamine oxidase inhibitor, nonergot dopamine agonist, | |
| Benzodiazapines | ✓ | ✓ | ✓ | Benzodiazapines only | |||
| Nonbenzodiazepine hypnotics | ✓ | ✓ | ✓ | Benzodiazepine analogs, nonbenzodiazepine hypnotics, tranquilizers, ‐aminobutyric acid A receptor agonist | |||
| Opioid agonists | ✓ | ✓ | ✓ | ✓ | ✓ | Full or partial opioid agonists, opiates, opioids | |
| Nonopioid/nonsteroidal anti‐inflammatory and/or analgesics | ✓ | Nonopioid analgesics, NSAIDs, COX‐2 selective inhibitor NSAIDs | |||||
| Antihypertensives | ✓ | ✓ | ✓ | Calcium channel blocker, ‐adrenergic blocker, angiotensin‐converting enzyme inhibitor, angiotensin 2 receptor blocker, ‐adrenergic blocker, diuretics (loop, potassium sparing, thiazide), nitrate vasodilators, aldosterone blocker | |||
| Antiarrhythmic | ✓ | ✓ | ✓ | Antiarrhythmics, cardiac glycosides | |||
| Antidiabetics | ✓ | ✓ | Insulin and insulin analogs, sulfonylureas, ‐glucosidase inhibitor, amylin analog, biguanide, glinide, GLP‐1 receptor agonist, glucagon‐like peptide‐1 agonist | ||||
| Anticholinergics and/or antihistaminics | ✓ | ✓ | ✓ | ✓ | Anticholinergics, histamine receptor antagonists, muscarininc antagonists, combined anticholinergics, and histamine receptor antagonists | ||
| Antiemetics | ✓ | ✓ | ✓ | Antiemetics, dopaminergic antagonists, dopamine‐2 receptor antagonist | |||
| Hormone replacement | ✓ | Corticosteroids, progestin, estrogen, estrogen agonist/antagonist, gonadotropin releasing hormone receptor agonist | |||||
| Muscle relaxers | ✓ | ✓ | ✓ | ✓ | Muscle relaxers | ||
| Immunosuppressants | ✓ | Calcineurin inhibitor immunosuppressant, folate analog metabolic inhibitor, purine antimetabolite | |||||
| Nonopioid cough suppressants and expectorants | ✓ | Expectorant, non‐narcotic antitussive, ‐1 agonist, uncompetitive N‐methyl‐D‐aspartate receptor antagonist | |||||
| Antimicrobials | ✓ | ✓ | Macrolide, cephalosporin, penicillin class, rifamycin, non‐nucleoside analog reverse transcriptase inhibitor, influenza A M2 protein inhibitor | ||||
| Others | ✓ | ✓ | ✓ | ✓ | ✓ | ✓ | ‐3‐adrenergic agonist, methylxanthine, cholinesterase inhibitor, interferon and , partial cholinergic nicotinic agonist, tyrosine hydroxylase, retinoid, serotonin‐1b and serotonin‐1d receptor agonist, stimulant laxative, vitamin K antagonist, platelet aggregation inhibitor |
Approximately 58% of the medications overlapped with the AGS 2015 Beer's Criteria[20] irrespective of whether the specific syndrome association was stated in the rationale.[20] Medications that overlapped were mostly in the delirium, cognitive impairment, and falls category with only a few overlaps in depression, unintentional weight loss, and urinary incontinence lists (see Supporting Information, Appendix 1, in the online version of this article).
Phase 2: Prevalence of MAGS
Among 154 participants, the mean age was 76.5 (10.6) years, 64.3% were female, 77.9% were white, and 96.1% non‐Hispanic. The median hospital length of stay was 6 days, with an interquartile range of 5 days. The orthopedic service discharged the highest proportion of patients (24%), followed by the geriatrics and internal medicine services, which each discharged 19.5% of the patients (Table 2). The remaining participants of the larger quality‐improvement project (N = 939) did not significantly differ on these demographic and clinical characteristics except for hospital length of stay, which was shorter in the sample analyzed (see Supporting Information, Appendix 2, in the online version of this article).
| Baseline Characteristics | Mean ( SD) or Percent (n) |
|---|---|
| |
| Age, y | 76.5 ( 10.6) |
| Sex | |
| Female | 64.3% (99) |
| Race | |
| White | 77.9% (126) |
| Black | 16.2% (25) |
| Unknown | 0.6% (1) |
| Declined | 0.6% (1) |
| Missing | 0.6% (1) |
| Ethnicity | |
| Non‐Hispanic | 96.1% (148) |
| Hispanic | 1.3% (2) |
| Unknown | 2.6% (4) |
| Hospital length of stay, d | 7.0 ( 4.2) |
| Hospital length of stay, d, median (IQR) | 6.0 (5.0) |
| No. of hospital discharge medications, count | 14.0 ( 4.7) |
| Discharge service | |
| Orthopedic service | 24.0% (37) |
| Geriatric service | 19.5% (30) |
| Internal medicine | 19.5% (30) |
| Other | 37.0% (57) |
Patients were discharged to SNFs with an average of 14.0 (4.7) medication orders. Overall, 43% (13%) of these discharge medication orders were MAGS. Every patient in the sample was ordered at least 1 medication associated with geriatric syndromes. Multiple MAGS were the norm, with an average of 5.9 (2.2) MAGS per patient. MAGS were also the norm, as 98.1% of the sample had medication orders associated with at least 2 different syndromes.
When the Beer's criteria[20] were applied to the medication orders (instead of the MAGS list), problematic medications appeared less common. Patients had an average of 3.04 (1.7) MAGS that were also listed on the AGS 2015 Beer's list,[20] representing an average of 22.3% of all discharge orders.
Table 3 illustrates the average number of medications per patient associated with each syndrome, and the percentage of patients (number in parentheses) discharged with at least 1 medication associated with each syndrome per the MAGS list and the Beers 2015 criteria.[20] For example, per the MAGS list, the syndrome most frequently associated with medications was falls, with patients discharged on an average of 5.5 (2.2) medications associated with falls, and 100% of the sample had at least 1 discharge medication associated with falls. Alternatively, the syndrome associated with the lowest frequency of medications was unintentional weight loss (with an average of 0.38 medications per patient), although 36% of these patients had more than 1 discharge medication associated with weight loss. As seen in Table 3, the mean and prevalence of 1 or more medications associated with each of the geriatric syndromes as identified by the Beers 2015 criteria[20] was lower than those identified by the MAGS list developed for this study.
| Geriatric Syndromes | Associated Medications per MAGS List | Associated Medications per AGS Beers 2015 Criteria | ||
|---|---|---|---|---|
| Mean SD | Percentage of Patients Receiving 1 Related Medication | Mean SD | Percentage of Patients Receiving 1 Related Medication | |
| ||||
| Cognitive impairment | 1.8 ( 1.2) | 84.4% (130) | 1.6 ( 1.2) | 78.6% (121) |
| Delirium | 1.4 ( 1.1) | 76.0% (117) | 1.3 ( 1.2) | 68.2% (105) |
| Falls | 5.5 ( 2.2) | 100% (154) | 2.6 ( 1.6) | 92.2% (142) |
| Unintentional weight and/or appetite loss | 0.4 ( 0.5) | 36.3% (56) | 0.1 ( 0.3) | 6.5% (10) |
| Urinary incontinence | 1.6 ( 1.0) | 85.7% (132) | 0.1 ( 0.2) | 5.8% (9) |
| Depression | 1.7 ( 1.0) | 90.9% (140) | 0.0 ( 0.0) | 0.0% (0) |
| All syndromes | 5.9 ( 2.2) | 100% (154) | 3.0 ( 1.7) | 95% (149) |
DISCUSSION
An iterative process of evidence review by a multidisciplinary panel resulted in a list of 513 medications associated with 6 common geriatric syndromes. This analysis demonstrated that hospitalized, older patients discharged to SNFs were frequently prescribed MAGS. The rate of prescribing ranged from 100% of patients with a medication associated with falls to 36% for unintentional weight loss. Moreover, an alarming 43% of all medications at hospital discharge were MAGS. For this vulnerable population, the combination of high prevalence of MAGS and high risk of geriatric syndromes emphasize a need to critically review the risks and benefits of MAGS throughout hospitalization and at the time of discharge.
A body of evidence demonstrates that many drugs in a typical older adult regimen have no specific clinical indication, are considered inappropriate, or have uncertain efficacy in the geriatric population.[24, 25, 26] This study builds on the foundational work described in landmark reviews such as the AGS Beers[20] and STOPP/START[21] (Screening Tool of Older Persons' Potentially Inappropriate Prescriptions/Screening Tool to Alert doctors to Right, i.e. appropriate indicated Treatment) criteria. Both of these tools, however, were specifically designed as screening tools to identify medications considered unsafe for older adults under most circumstances and within specific illness states.[19, 20, 21] They are most often utilized when starting a medication to avoid acute adverse events. In contrast, the MAGS list was developed to be inclusive of medications that are often appropriate for many medical diagnoses but may also contribute to underlying geriatric syndromes that are more chronic in nature. In addition, inclusion of such medicines increases the sensitivity of screening for medications that can be targeted through patient‐centered deprescribing efforts when clinically appropriate.
A major strength of this study is that we bring together evidence across a spectrum of geriatric syndromes commonly experienced by hospitalized elders. In addition to evaluating multiple syndromes, we applied multiple modalities; particularly the use of an iterative review process by a multidisciplinary team of experts and using Lexicomp and FDA insert packages for linking medications to specific geriatric conditions. The inclusion criteria were broadened beyond single sources of evidence in an effort to capture a comprehensive list of medications. As a result, the MAGS list can be implemented as a screening tool for deprescribing interventions and assessing medication appropriateness to address individual or clusters of geriatric syndromes within a patient.
In addition to expanding this knowledge base, clinical relevance of the MAGS list is highlighted by its application to a sample of hospitalized older adults discharged to SNFs, a cohort known to experience geriatric syndromes. In fact, 43% of patients' medications at hospital discharge were MAGS. Importantly, due to the cross‐sectional nature of this study, we cannot be certain if the medication caused or potentiated each of the geriatric syndromes. However, hospitals and SNFs are devoting major resources toward reduction of falls, avoidance of urinary catheter use, and reduction of preventable readmissions. These efforts can be complemented by considering the number of medications associated with falls, urinary incontinence, and overall MAGS burden. The striking prevalence of MAGS demonstrates a rigorous need to weigh the risks and benefits of these medications. Above all, the intent of this study is not to propose that any MAGS be reflexively stopped, but rather that the MAGS list should facilitate a holistic approach to care for the complex older adult. For example, standard therapies such as gabapentin may be appropriate for treating neuralgic pain but may also contribute to falls and urinary incontinence. Thus, alternative pain treatments could be selected in place of gabapentin for a 75‐year old patient who is experiencing recurrent falls and increasing incontinence. Therefore, the MAGS list enables a patient‐provider discussion wherein medications' therapeutic benefits can be weighed against risks posed by specific clusters of geriatric syndromes, potential impact on quality of life, and consistency with goals of care.
This study has some limitations. First, although we examined a broad number of geriatric syndromes, several other geriatric syndromes experienced by hospitalized older adults were not addressed including: fecal incontinence, insomnia, and functional impairment. These syndromes were intentionally excluded from the study a priori due to reasons of feasibility and scope. Second, unlike the Beer's 2015 criteria, the MAGS list does not sub‐classify associations of medications with geriatric syndromes for patients with specific diseases (eg, heart failure). In fact, our MAGS list included medications often indicated in treating these diagnoses. A clinician must work with the patient to weigh the disease‐specific benefits of some medications with the potential effect on geriatric syndrome symptoms and outcomes. Third, the instrument has a very high sensitivity, which was intended to generate an inclusive list of medications that enables providers to weigh risks of geriatric syndromes with the intended indication benefit. The objective is not to use this list as a reflexive tool but rather help clinicians identify a starting point to address geriatric syndromes in their patients to make patient‐centered medication decisions. Although the MAGS list is intentionally large (sensitive), the advent of advanced bioinformatics can enable MAGS to be assessed in the future for both clinical and research purposes. Fourth, FDA insert packages and Lexicomp databases report anything experienced by the patient while on the particular medication, but it might not necessarily imply a causative link. The high use of MAGS and the specific geriatric syndrome may coexist due to the high prevalence and interplay of multimorbidity, polypharmacy, and geriatric syndromes in this population. Last, the list was developed by expert panel members predominantly from a single institution, which may introduce bias. Despite these limitations, the prevalence of these medications in a sample of patients transitioning from acute to postacute care highlights the utility of the MAGS list in future clinical research and quality improvement endeavors.
In conclusion, the MAGS list provides a comprehensive and sensitive indicator of medications associated with any of 6 geriatric syndromes regardless of medication indication and appropriateness. The MAGS list provides an overall degree of medication burden with respect to geriatric syndromes and a foundation for future research to assess the relationship between the presence of geriatric syndromes and syndrome‐associated medications. The MAGS list is an important first step in summarizing the data that link medications to geriatric syndromes. Future studies are needed to broaden the analysis of MAGS for other common geriatric syndromes and to identify new and emerging medications not present during the time of this analysis. The MAGS list has the potential to facilitate deprescribing efforts needed to combat the epidemic of overprescribing that may be contributing to the burden of geriatric syndromes among older patients.
Acknowledgements
The authors thank Dr. Linda Beuscher, Dr. Patricia Blair Miller, Dr. Joseph Ouslander, Dr. William Stuart Reynolds, and Dr. Warren Taylor for providing their expertise and participating in the expert panel discussions that facilitated the development of the MAGS list. The authors also recognize the research support provided by Christopher Simon Coelho.
Disclosures: This research was supported by the Department of Health and Human Services, Centers for Medicare & Medicaid Services grant #1C1CMS331006 awarded to Principal Investigator, John F. Schnelle, PhD. Dr. Vasilevskis was supported by the National Institute on Aging of the National Institutes of Health award K23AG040157 and the Geriatric Research, Education and Clinical Center. Dr. Bell was supported by National Institute on Aging‐K award K23AG048347‐01A1. Dr. Mixon is supported by a Veterans Affairs Health Services Research & Development Career Development Award (12‐168). This research was also supported by the National Center for Advancing Translational Sciences Clinical and Translational Science award UL1TR000445. The contents of this publication are solely the responsibility of the authors and do not necessarily represent the official views of the US Department of Health and Human Services or any of its agencies, the National Center for Advancing Translation Science, the National Institutes of Health, or the Department of Veterans Affairs. Each coauthor contributed significantly to the manuscript. Dr. Kripalani has received stock/stock options from Bioscape Digital, LLC. None of the other authors have significant conflicts of interest to report related to this project or the results reported within this article.
- , , , . Geriatric syndromes: clinical, research, and policy implications of a core geriatric concept. J Am Geriatr Soc. 2007;55:780–791.
- , , , . Shared risk factors for falls, incontinence, and functional dependence. Unifying the approach to geriatric syndromes. JAMA. 1995;273:1348–1353.
- , , , . Geriatric syndromes: medical misnomer or progress in geriatrics? Neth J Med. 2003;61:83–87.
- , , , et al. Geriatric conditions in acutely hospitalized older patients: prevalence and one‐year survival and functional decline. PLoS One. 2011;6:e26951.
- , , , , . Geriatric conditions as predictors of increased number of hospital admissions and hospital bed days over one year: findings of a nationwide cohort of older adults from Taiwan. Arch Gerontol Geriatr. 2014;59:169–174.
- , , , , . Geriatric conditions and disability: the Health and Retirement Study. Ann Intern Med. 2007;147:156–164.
- , , , , , . A prospective cohort study of geriatric syndromes among older medical patients admitted to acute care hospitals. J Am Geriatr Soc. 2011;59:2001–2008.
- , , , et al. Geriatric syndromes in hospitalized older adults discharged to skilled nursing facilities. J Am Geriatr Soc. 2016;64(4):715–722.
- , , , et al. Discharge to a skilled nursing facility and subsequent clinical outcomes among older patients hospitalized for heart failure. Circ Heart Fail. 2011;4:293–300.
- . Hazards of hospitalization of the elderly. Ann Intern Med. 1993;118:219–223.
- , , , , . Geriatric syndromes in elderly patients admitted to an inpatient cardiology ward. J Hosp Med. 2007;2:394–400.
- , , , . Effect of hospitalization on inappropriate prescribing in elderly Medicare beneficiaries. J Am Geriatr Soc. 2015;63:699–707.
- , , , et al. Polypharmacy cutoff and outcomes: five or more medicines were used to identify community‐dwelling older men at risk of different adverse outcomes. J Clin Epidemiol. 2012;65:989–995.
- , , , , . Investigating polypharmacy and drug burden index in hospitalised older people. Intern Med J. 2013;43:912–918.
- , . Potentially harmful drug‐drug interactions in the elderly: a review. Am J Geriatr Pharmacother. 2011;9:364–377.
- , , , . Hospital admissions/visits associated with drug‐drug interactions: a systematic review and meta‐analysis. Pharmacoepidemiol Drug Saf. 2014;23:489–497.
- , . Optimising drug treatment for elderly people: the prescribing cascade. BMJ. 1997;315:1096–1099.
- , , , et al. Association between acute geriatric syndromes and medication‐related hospital admissions. Drugs Aging. 2012;29:691–699.
- American Geriatrics Society Beers Criteria Update Expert P. American Geriatrics Society updated Beers Criteria for potentially inappropriate medication use in older adults. J Am Geriatr Soc. 2012;60:616–631.
- By the American Geriatrics Society 2015 Beers Criteria Update Expert Panel. American Geriatrics Society 2015 updated Beers criteria for potentially inappropriate medication use in older adults. J Am Geriatr Soc. 2015;63:2227–2246.
- , . STOPP (Screening Tool of Older Persons' potentially inappropriate Prescriptions): application to acutely ill elderly patients and comparison with Beers' criteria. Age Ageing. 2008;37:673–679.
- , , , et al. Warfarin versus aspirin for stroke prevention in an elderly community population with atrial fibrillation (the Birmingham Atrial Fibrillation Treatment of the Aged Study, BAFTA): a randomised controlled trial. Lancet. 2007;370:493–503.
- U.S. Food and Drug Administration. Drugs. Available at: http://www.fda.gov/Drugs/default.htm. Accessed May 15th, 2015.
- , , , et al. Inappropriate medication use among frail elderly inpatients. Ann Pharmacother. 2004;38:9–14.
- , , , et al. Inappropriate medications in elderly ICU survivors: where to intervene? Arch Intern Med. 2011;171:1032–1034.
- , , , et al. Appropriateness of medication prescribing in ambulatory elderly patients. J Am Geriatr Soc. 1994;42:1241–1247.

Discharge Preparedness and Readmission
In recent years, US hospitals have focused on decreasing readmission rates, incented by reimbursement penalties to hospitals having excessive readmissions.[1] Gaps in the quality of care provided during transitions likely contribute to preventable readmissions.[2] One compelling quality assessment in this setting is measuring patients' discharge preparedness, using key dimensions such as understanding their instructions for medication use and follow‐up. Patient‐reported preparedness for discharge may also be useful to identify risk of readmission.
Several patient‐reported measures of preparedness for discharge exist, and herein we describe 2 measures of interest. First, the Brief‐PREPARED (B‐PREPARED) measure was derived from the longer PREPARED instrument (Prescriptions, Ready to re‐enter community, Education, Placement, Assurance of safety, Realistic expectations, Empowerment, Directed to appropriate services), which reflects the patient's perceived needs at discharge. In previous research, the B‐PREPARED measure predicted emergency department (ED) visits for patients who had been recently hospitalized and had a high risk for readmission.[3] Second, the Care Transitions Measure‐3 (CTM‐3) was developed by Coleman et al. as a patient‐reported measure to discriminate between patients who were more likely to have an ED visit or readmission from those who did not. CTM‐3 has also been used to evaluate hospitals' level of care coordination and for public reporting purposes.[4, 5, 6] It has been endorsed by the National Quality Forum and incorporated into the Hospital Consumer Assessment of Healthcare Providers and Systems (HCAHPS) survey provided to samples of recently hospitalized US patients.[7] However, recent evidence from an inpatient cohort of cardiovascular patients suggests the CTM‐3 overinflates care transition scores compared to the longer 15‐item CTM. In that cohort, the CTM‐3 could not differentiate between patients who did or did not have repeat ED visits or readmission.[8] Thus far, the B‐PREPARED and CTM‐3 measures have not been compared to one another directly.
In addition to the development of patient‐reported measures, hospitals increasingly employ administrative algorithms to predict likelihood of readmission.[9] A commonly used measure is the LACE index (Length of stay, Acuity, Comorbidity, and Emergency department use).[10] The LACE index predicted readmission and death within 30 days of discharge in a large cohort in Canada. In 2 retrospective studies of recently hospitalized patients in the United States, the LACE index's ability to discriminate between patients readmitted or not ranged from slightly better than chance to moderate (C statistic 0.56‐0.77).[11, 12]
It is unknown whether adding patient‐reported preparedness measures to commonly used readmission prediction scores increases the ability to predict readmission risk. We sought to determine whether the B‐PREPARED and CTM‐3 measures were predictive of readmission or death, as compared to the LACE index, in a large cohort of cardiovascular patients. In addition, we sought to determine the additional predictive and discriminative ability gained from administering the B‐PREPARED and CTM‐3 measures, while adjusting for the LACE index and other clinical factors. We hypothesized that: (1) higher preparedness scores on both measures would predict lower risk of readmission or death in a cohort of patients hospitalized with cardiac diagnoses; and (2) because it provides more specific and actionable information, the B‐PREPARED would discriminate readmission more accurately than CTM‐3, after controlling for clinical factors.
METHODS
Study Setting and Design
The Vanderbilt Inpatient Cohort Study (VICS) is a prospective study of patients admitted with cardiovascular disease to Vanderbilt University Hospital. The purpose of VICS is to investigate the impact of patient and social factors on postdischarge health outcomes such as quality of life, unplanned hospital utilization, and mortality. The rationale and design of VICS are detailed elsewhere.[13] Briefly, participants completed a baseline interview while hospitalized, and follow‐up phone calls were conducted within 2 to 9 days and at approximately 30 and 90 days postdischarge. During the first follow‐up call conducted by research assistants, we collected preparedness for discharge data utilizing the 2 measures described below. After the 90‐day phone call, we collected healthcare utilization since the index admission. The study was approved by the Vanderbilt University Institutional Review Board.
Patients
Eligibility screening shortly after admission identified patients with acute decompensated heart failure (ADHF) and/or an intermediate or high likelihood of acute coronary syndrome (ACS) per a physician's review of the clinical record. Exclusion criteria included: age <18 years, non‐English speaker, unstable psychiatric illness, delirium, low likelihood of follow‐up (eg, no reliable telephone number), on hospice, or otherwise too ill to complete an interview. To be included in these analyses, patients must have completed the preparedness for discharge measurements during the first follow‐up call. Patients who died before discharge or before completing the follow‐up call were excluded.
Preparedness for Discharge Measures (Patient‐Reported Data)
Preparedness for discharge was assessed using the 11‐item B‐PREPARED and the 3‐item CTM‐3.
The B‐PREPARED measures how prepared patients felt leaving the hospital with regard to: self‐care information for medications and activity, equipment/community services needed, and confidence in managing one's health after hospitalization. The B‐PREPARED measure has good internal consistency reliability (Cronbach's = 0.76) and has been validated in patients of varying age within a week of discharge. Preparedness is the sum of responses to all 11 questions, with a range of 0 to 22. Higher scores reflect increased preparedness for discharge.[3]
The CTM‐3 asks patients to rate how well their preferences were considered regarding transitional needs, as well as their understanding of postdischarge self‐management and the purpose of their medications, each on a 4‐point response scale (strongly disagree to strongly agree). The sum of the 3 responses quantifies the patient's perception of the quality of the care transition at discharge (Cronbach's = 0.86,[14] 0.92 in a cohort similar to ours[8]). Scores range from 3 to 12, with higher score indicating more preparedness. Then, the sum is transformed to a 0 to 100 scale.[15]
Clinical Readmission Risk Measures (Medical Record Data)
The LACE index, published by Van Walraven et al.,[10] takes into account 4 categories of clinical data: length of hospital stay, acuity of event, comorbidities, and ED visits in the prior 6 months. More specifically, a diagnostic code‐based, modified version of the Charlson Comorbidity Index was used to calculate the comorbidity score. These clinical criteria were obtained from an administrative database and weighted according to the methods used by Van Walraven et al. An overall score was calculated on a scale of 0 to 19, with higher scores indicating higher risk of readmission or death within 30 days.
From medical records, we also collected patients' demographic data including age, race, and gender, and diagnosis of ACS, ADHF, or both at hospital admission.
Outcome Measures
Healthcare utilization data were obtained from the index hospital as well as outside facilities. The electronic medical records from Vanderbilt University Hospital provided information about healthcare utilization at Vanderbilt 90 days after initial discharge. We also used Vanderbilt records to see if patients were transferred to Vanderbilt from other hospitals or if patients visited other hospitals before or after enrollment. We supplemented this with patient self‐report during the follow‐up telephone calls (at 30 and 90 days after initial discharge) so that any additional ED and hospital visits could be captured. Mortality data were collected from medical records, Social Security data, and family reports. The main outcome was time to first unplanned hospital readmission or death within 30 and 90 days of discharge.
Analysis
To describe our sample, we summarized categorical variables with percentages and continuous variables with percentiles. To test for evidence of unadjusted covariate‐outcome relationships, we used Pearson 2 and Wilcoxon rank sum tests for categorical and continuous covariates, respectively.
For the primary analyses we used Cox proportional hazard models to examine the independent associations between the prespecified predictors for patient‐reported preparedness and time to first unplanned readmission or death within 30 and 90 days of discharge. For each outcome (30‐ and 90‐day readmission or death), we fit marginal models separately for each of the B‐PREPARED, CTM‐3, and LACE scores. We then fit multivariable models that used both preparedness measures as well as age, gender, race, and diagnosis (ADHF and/or ACS), variables available to clinicians when patients are admitted. When fitting the multivariable models, we did not find strong evidence of nonlinear effects; therefore, only linear effects are reported. To facilitate comparison of effects, we scaled continuous variables by their interquartile range (IQR). The associated, exponentiated regression parameter estimates may therefore be interpreted as hazard ratios for readmission or death per IQR change in each predictor. In addition to parameter estimation, we computed the C index to evaluate capacity for the model to discriminate those who were and were not readmitted or died. All analyses were conducted in R version 3.1.2 (R Foundation for Statistical Computing, Vienna, Austria).
RESULTS
From the cohort of 1239 patients (Figure 1), 64%, 28%, and 7% of patients were hospitalized with ACS, ADHF, or both, respectively (Table 1). Nearly 45% of patients were female, 83% were white, and the median age was 61 years (IQR 5269). The median length of stay was 3 days (IQR 25). The median preparedness scores were high for both B‐PREPARED (21, IQR 1822) and CTM‐3 (77.8, IQR 66.7100). A total of 211 (17%) and 380 (31%) were readmitted or died within 30 and 90 days, respectively. The completion rate for the postdischarge phone calls was 88%.
| Death or Readmission Within 30 Days | Death or Readmission Within 90 Days | |||||
|---|---|---|---|---|---|---|
| Not Readmitted, N = 1028 | Death/Readmitted, N = 211 | P Value | Not Readmitted, N = 859 | Death/Readmitted, N = 380 | P Value | |
| ||||||
| Gender, male | 55.8% (574) | 53.1% (112) | 0.463* | 56.3% (484) | 53.2% (202) | 0.298* |
| Female | 44.2% (454) | 46.9% (99) | 43.7% (375) | 46.8% (178) | ||
| Race, white | 83.9% (860) | 80.6% (170) | 0.237* | 86.0% (737) | 77.3% (293) | <0.001* |
| Race, nonwhite | 16.1% (165) | 19.4% (41) | 14.0% (120) | 22.7% (86) | ||
| Diagnosis ACS | 68.0% (699) | 46.4% (98) | <0.001* | 72.9% (626) | 45.0% (171) | <0.001* |
| ADHF | 24.8% (255) | 46.0% (97) | 20.3% (174) | 46.8% (178) | ||
| Both | 7.2% (74) | 7.6% (16) | 6.9% (59) | 8.2% (31) | ||
| Age | 39.4:52:61:68:80 | 37.5:53.5:62:70:82 | 0.301 | 40:52:61:68:80 | 38:52:61 :70:82 | 0.651 |
| LOS | 1:2:3:5:10 | 1:3: 4:7.5:17 | <0.001 | 1:2:3:5:9 | 1:3:4:7:15 | <0.001 |
| CTM‐3 | 55.6:66.7: 77.8:100:100 | 55.6:66.7:77.8:100 :100 | 0.305 | 55.6:66.7:88.9:100:100 | 55.6:66.7:77.8:100 :100 | 0.080 |
| B‐PREPARED | 12:18:21:22.:22 | 10:17:20:22:22 | 0.066 | 12:18:21:22:22 | 10:17:20 :22:22 | 0.030 |
| LACE | 1:4: 7:10 :14 | 3.5:7:10:13:17 | <0.001 | 1:4:6: 9:14 | 3:7:10:13:16 | <0.001 |

B‐PREPARED and CTM‐3 were moderately correlated with one another (Spearman's = 0.40, P < 0.001). In bivariate analyses (Table 1), the association between B‐PREPARED and readmission or death was significant at 90 days (P = 0.030) but not 30 days. The CTM‐3 showed no significant association with readmission or death at either time point. The LACE score was significantly associated with rates of readmission at 30 and 90 days (P < 0.001).
Outcomes Within 30 Days of Discharge
When examining readmission or death within 30 days of discharge, simple unadjusted models 2 and 3 showed that the B‐PREPARED and LACE scores, respectively, were each significantly associated with time to first readmission or death (Table 2). Specifically, a 4‐point increase in the B‐PREPARED score was associated with a 16% decrease in the hazard of readmission or death (hazard ratio [HR] = 0.84, 95% confidence interval [CI]: 0.72 to 0.97). A 5‐point increase in the LACE score was associated with a 100% increase in the hazard of readmission or death (HR = 2.00, 95% CI: 1.72 to 2.32). In the multivariable model with both preparedness scores and diagnosis (model 4), the B‐PREPARED score (HR = 0.82, 95% CI: 0.70 to 0.97) was significantly associated with time to first readmission or death. In the full 30‐day model including B‐PREPARED, CTM‐3, LACE, age, gender, race, and diagnosis (model 5), only the LACE score (HR = 1.83, 95% CI: 1.54 to 2.18) was independently associated with time to readmission or death. Finally, the CTM‐3 did not predict 30‐day readmission or death in any of the models tested.
| Models | HR (95% CI)* | P Value | C Index |
|---|---|---|---|
| |||
| 1. CTM (per 10‐point change) | 0.95 (0.88 to 1.03) | 0.257 | 0.523 |
| 2. B‐PREPARED (per 4‐point change) | 0.84 (0.72 to 0.97) | 0.017 | 0.537 |
| 3. LACE (per 5‐point change) | 2.00 (1.72 to 2.32) | <0.001 | 0.679 |
| 4. CTM (per 10‐point change) | 1.00 (0.92 to 1.10) | 0.935 | 0.620 |
| B‐PREPARED (per 4‐point change) | 0.82 (0.70 to 0.97) | 0.019 | |
| ADHF only (vs ACS only) | 2.46 (1.86 to 3.26) | <0.001 | |
| ADHF and ACS (vs ACS only) | 1.42 (0.84 to 2.42) | 0.191 | |
| 5. CTM (per 10‐point change) | 1.02 (0.93 to 1.11) | 0.722 | 0.692 |
| B‐PREPARED (per 4 point change) | 0.87 (0.74 to 1.03) | 0.106 | |
| LACE (per 5‐point change) | 1.83 (1.54 to 2.18) | <0.001 | |
| ADHF only (vs ACS only) | 1.51 (1.10 to 2.08) | 0.010 | |
| ADHF and ACS (vs ACS only) | 0.90 (0.52 to 1.55) | 0.690 | |
| Age (per 10‐year change) | 1.02 (0.92 to 1.14) | 0.669 | |
| Female (vs male) | 1.11 (0.85 to 1.46) | 0.438 | |
| Nonwhite (vs white) | 0.92 (0.64 to 1.30) | 0.624 | |
Outcomes Within 90 Days of Discharge
At 90 days after discharge, again the separate unadjusted models 2 and 3 demonstrated that the B‐PREPARED and LACE scores, respectively, were each significantly associated with time to first readmission or death, whereas the CTM‐3 model only showed marginal significance (Table 3). In the multivariable model with both preparedness scores and diagnosis (model 4), results were similar to 30 days as the B‐PREPARED score was significantly associated with time to first readmission or death. Lastly, in the full model (model 5) at 90 days, again the LACE score was significantly associated with time to first readmission or death. In addition, B‐PREPARED scores were associated with a significant decrease in risk of readmission or death (HR = 0.88, 95% CI: 0.78 to 1.00); CTM‐3 scores were not independently associated with outcomes.
| Model | HR (95% CI)* | P Value | C Index |
|---|---|---|---|
| |||
| 1. CTM (per 10‐point change) | 0.94 (0.89 to 1.00) | 0.051 | 0.526 |
| 2. B‐PREPARED (per 4‐point change) | 0.84 (0.75 to 0.94) | 0.002 | 0.533 |
| 3. LACE (per 5‐point change) | 2.03 (1.82 to 2.27) | <0.001 | 0.683 |
| 4. CTM (per 10‐point change) | 0.99 (0.93 to 1.06) | 0.759 | 0.640 |
| B‐PREPARED (per 4‐point change) | 0.83 (0.74 to 0.94) | 0.003 | |
| ADHF only (vs ACS only) | 2.88 (2.33 to 3.56) | <0.001 | |
| ADHF and ACS (vs ACS only) | 1.62 (1.11 to 2.38) | 0.013 | |
| 5. CTM (per 10‐point change) | 1.00 (0.94 to 1.07) | 0.932 | 0.698 |
| B‐PREPARED (per 4‐point change) | 0.88 (0.78 to 1.00) | 0.043 | |
| LACE (per 5‐point change) | 1.76 (1.55 to 2.00) | <0.001 | |
| ADHF only (vs ACS only) | 1.76 (1.39 to 2.24) | <0.001 | |
| ADHF and ACS (vs ACS only) | 1.00 (0.67 to 1.50) | 0.980 | |
| Age (per 10‐year change) | 1.00 (0.93 to 1.09) | 0.894 | |
| Female (vs male) | 1.10 (0.90 to 1.35) | 0.341 | |
| Nonwhite (vs white) | 1.14 (0.89 to 1.47) | 0.288 | |
Tables 2 and 3 also display the C indices, or the discriminative ability of the models to differentiate whether or not a patient was readmitted or died. The range of the C index is 0.5 to 1, where values closer to 0.5 indicate random predictions and values closer to 1 indicate perfect prediction. At 30 days, the individual C indices for B‐PREPARED and CTM‐3 were only slightly better than chance (0.54 and 0.52, respectively) in their discriminative abilities. However, the C indices for the LACE score alone (0.68) and the multivariable model (0.69) including all 3 measures (ie, B‐PREPARED, CTM‐3, LACE), and clinical and demographic variables, had higher utility in discriminating patients who were readmitted/died or not. The 90‐day C indices were comparable in magnitude to those at 30 days.
DISCUSSION/CONCLUSION
In this cohort of patients hospitalized with cardiovascular disease, we compared 2 patient‐reported measures of preparedness for discharge, their association with time to death or readmission at 30 and 90 days, and their ability to discriminate patients who were or were not readmitted or died. Higher preparedness as measured by higher B‐PREPARED scores was associated with lower risk of readmission or death at 30 and 90 days after discharge in unadjusted models, and at 90 days in adjusted models. CTM‐3 was not associated with the outcome in any analyses. Lastly, the individual preparedness measures were not as strongly associated with readmission or death compared to the LACE readmission index alone.
How do our findings relate to the measurement of care transition quality? We consider 2 scenarios. First, if hospitals utilize the LACE index to predict readmission, then neither self‐reported measure of preparedness adds meaningfully to its predictive ability. However, hospital management may still find the B‐PREPARED and CTM‐3 useful as a means to direct care transition quality‐improvement efforts. These measures can instruct hospitals as to what areas their patients express the greatest difficulty or lack of preparedness and closely attend to patient needs with appropriate resources. Furthermore, the patient's perception of being prepared for discharge may be different than their actual preparedness. Their perceived preparedness may be affected by cognitive impairment, dissatisfaction with medical care, depression, lower health‐related quality of life, and lower educational attainment as demonstrated by Lau et al.[16] If a patient's perception of preparedness were low, it would behoove the clinician to investigate these other issues and address those that are mutable. Additionally, perceived preparedness may not correlate with the patient's understanding of their medical conditions, so it is imperative that clinicians provide prospective guidance about their probable postdischarge trajectory. If hospitals are not utilizing the LACE index, then perhaps using the B‐PREPARED, but not the CTM‐3, may be beneficial for predicting readmission.
How do our results fit with evidence from prior studies, and what do they mean in the context of care transitions quality? First, in the psychometric evaluation of the B‐PREPARED measure in a cohort of recently hospitalized patients, the mean score was 17.3, lower than the median of 21 in our cohort.[3] Numerous studies have utilized the CTM‐3 and the longer‐version CTM‐15. Though we cannot make a direct comparison, the median in our cohort (77.8) was on par with the means from other studies, which ranged from 63 to 82.[5, 17, 18, 19] Several studies also note ceiling effects with clusters of scores at the upper end of the scale, as did we. We conjecture that our cohort's preparedness scores may be higher because our institution has made concerted efforts to improve the discharge education for cardiovascular patients.
In a comparable patient population, the TRACE‐CORE (Transitions, Risks, and Actions in Coronary Events Center for Outcomes Research and Education) study is a cohort of more than 2200 patients with ACS who were administered the CTM‐15 within 1 month of discharge.[8] In that study, the median CTM‐15 score was 66.6, which is lower than our cohort. With regard to the predictive ability of the CTM‐3, they note that CTM‐3 scores did not differentiate between patients who were or were not readmitted or had emergency department visits. Our results support their concern that the CTM‐15 and by extension the CTM‐3, though adopted widely as part of HCAHPS, may not have sufficient ability to discriminate differences in patient outcomes or the quality of care transitions.
More recently, patient‐reported preparedness for discharge was assessed in a prospective cohort in Canada.[16] Lau et al. administered a single‐item measure of readiness at the time of discharge to general medicine patients, and found that lower readiness scores were also not associated with readmission or death at 30 days, when adjusted for the LACE index as we did.
We must acknowledge the limitations of our findings. First, our sample of recently discharged patients with cardiovascular disease is different than the community‐dwelling, underserved Americans hospitalized in the prior year, which served as the sample for reducing the CTM‐15 to 3 items.[5] This fact may explain why we did not find the CTM‐3 to be associated with readmission in our sample. Second, our analyses did not include extensive adjustment for patient‐related factors. Rather, our intention was to see how well the preparedness measures performed independently and compare their abilities to predict readmission, which is particularly relevant for clinicians who may not have all possible covariates in predicting readmission. Finally, because we limited the analyses to the patients who completed the B‐PREPARED and CTM‐3 measures (88% completion rate), we may not have data for: (1) very ill patients, who had a higher risk of readmission and least prepared, and were not able to answer the postdischarge phone call; and (2) very functional patients, who had a lower risk of readmission and were too busy to answer the postdischarge phone call. This may have limited the extremes in the spectrum of our sample.
Importantly, our study has several strengths. We report on the largest sample to date with results of both B‐PREPARED and CTM‐3. Moreover, we examined how these measures compared to a widely used readmission prediction tool, the LACE index. We had very high postdischarge phone call completion rates in the week following discharge. Furthermore, we had thorough assessment of readmission data through patient report, electronic medical record documentation, and collection of outside medical records.
Further research is needed to elucidate: (1) the ideal administration time of the patient‐reported measures of preparedness (before or after discharge), and (2) the challenges to the implementation of measures in healthcare systems. Remaining research questions center on the tradeoffs and barriers to implementing a longer measure like the 11‐item B‐PREPARED compared to a shorter measure like the CTM‐3. We do not know whether longer measures preclude their use by busy clinicians, though it provides more specific information about what patients feel they need at hospital discharge. Additionally, studies need to demonstrate the mutability of preparedness and the response of measures to interventions designed to improve the hospital discharge process.
In our sample of recently hospitalized cardiovascular patients, there was a statistically significant association between patient‐reported preparedness for discharged, as measured by B‐PREPARED, and readmissions/death at 30 and 90 days, but the magnitude of the association was very small. Furthermore, another patient‐reported preparedness measure, CTM‐3, was not associated with readmissions or death at either 30 or 90 days. Lastly, neither measure discriminated well between patients who were readmitted or not, and neither measure added meaningfully to the LACE index in terms of predicting 30‐ or 90‐day readmissions.
Disclosures
This study was supported by grant R01 HL109388 from the National Heart, Lung, and Blood Institute (Dr. Kripalani) and in part by grant UL1 RR024975‐01 from the National Center for Research Resources, and grant 2 UL1 TR000445‐06 from the National Center for Advancing Translational Sciences. Dr. Kripalani is a consultant to SAI Interactive and holds equity in Bioscape Digital, and is a consultant to and holds equity in PictureRx, LLC. Dr. Bell is supported by the National Institutes of Health (K23AG048347) and by the Eisenstein Women's Heart Fund. Dr. Vasilevskis is supported by the National Institutes of Health (K23AG040157) and the Geriatric Research, Education and Clinical Center. Dr. Mixon is a Veterans Affairs Health Services Research and Development Service Career Development awardee (12‐168) at the Nashville Department of Veterans Affairs. The content is solely the responsibility of the authors and does not necessarily represent the official views of the National Institutes of Health. The funding agency was not involved in the design and conduct of the study; collection, management, analysis, and interpretation of the data; and preparation, review, or approval of the manuscript. All authors had full access to all study data and had a significant role in writing the manuscript. The contents do not represent the views of the US Department of Veterans Affairs or the United States government. Dr. Kripalani is a consultant to and holds equity in PictureRx, LLC.
- Centers for Medicare 9(9):598–603.
- , , . Brief scale measuring patient preparedness for hospital discharge to home: psychometric properties. J Hosp Med. 2008;3(6):446–454.
- , , . Assessing the quality of preparation for posthospital care from the patient's perspective: the care transitions measure. Med Care. 2005;43(3):246–255.
- , , , . Assessing the quality of transitional care: further applications of the care transitions measure. Med Care. 2008;46(3):317–322.
- , , , , . The central role of performance measurement in improving the quality of transitional care. Home Health Care Serv Q. 2007;26(4):93–104.
- Centers for Medicare 3:e001053.
- , , , et al. Risk prediction models for hospital readmission: a systematic review. JAMA. 2011;306(15):1688–1698.
- , , , et al. Derivation and validation of an index to predict early death or unplanned readmission after discharge from hospital to the community. CMAJ. 2010;182(6):551–557.
- , , , et al. Using the LACE index to predict hospital readmissions in congestive heart failure patients. BMC Cardiovasc Disord. 2014;14:97.
- , , , . Validation of a predictive model to identify patients at high risk for hospital readmission. J Healthc Qual. 2016;38(1):34–41.
- , , , et al. Determinants of health after hospital discharge: rationale and design of the Vanderbilt Inpatient Cohort Study (VICS). BMC Health Serv Res. 2014;14:10.
- . CTM frequently asked questions. Available at: http://caretransitions.org/tools-and-resources/. Accessed January 22, 2016.
- . Instructions for scoring the CTM‐3. Available at: http://caretransitions.org/tools-and-resources/. Accessed January 22, 2016.
- , , , et al. Patient‐reported discharge readiness and 30‐day risk of readmission or death: a prospective cohort study. Am J Med. 2016;129:89–95.
- , , , , . Implementaiton of the Care Transitions Intervention: sustainability and lessons learned. Prof Case Manag. 2009;14(6):282–293.
- , , , . The care transitions innovation (C‐TraIn) for socioeconomically disadvantaged adults: results of a cluster randomized controlled trial. J Gen Intern Med. 2014;29(11):1460–1467.
- , , , et al. Telephone calls to patients after discharge from the hospital: an important part of transitions of care. Med Educ Online. 2015;29(20):26701.
In recent years, US hospitals have focused on decreasing readmission rates, incented by reimbursement penalties to hospitals having excessive readmissions.[1] Gaps in the quality of care provided during transitions likely contribute to preventable readmissions.[2] One compelling quality assessment in this setting is measuring patients' discharge preparedness, using key dimensions such as understanding their instructions for medication use and follow‐up. Patient‐reported preparedness for discharge may also be useful to identify risk of readmission.
Several patient‐reported measures of preparedness for discharge exist, and herein we describe 2 measures of interest. First, the Brief‐PREPARED (B‐PREPARED) measure was derived from the longer PREPARED instrument (Prescriptions, Ready to re‐enter community, Education, Placement, Assurance of safety, Realistic expectations, Empowerment, Directed to appropriate services), which reflects the patient's perceived needs at discharge. In previous research, the B‐PREPARED measure predicted emergency department (ED) visits for patients who had been recently hospitalized and had a high risk for readmission.[3] Second, the Care Transitions Measure‐3 (CTM‐3) was developed by Coleman et al. as a patient‐reported measure to discriminate between patients who were more likely to have an ED visit or readmission from those who did not. CTM‐3 has also been used to evaluate hospitals' level of care coordination and for public reporting purposes.[4, 5, 6] It has been endorsed by the National Quality Forum and incorporated into the Hospital Consumer Assessment of Healthcare Providers and Systems (HCAHPS) survey provided to samples of recently hospitalized US patients.[7] However, recent evidence from an inpatient cohort of cardiovascular patients suggests the CTM‐3 overinflates care transition scores compared to the longer 15‐item CTM. In that cohort, the CTM‐3 could not differentiate between patients who did or did not have repeat ED visits or readmission.[8] Thus far, the B‐PREPARED and CTM‐3 measures have not been compared to one another directly.
In addition to the development of patient‐reported measures, hospitals increasingly employ administrative algorithms to predict likelihood of readmission.[9] A commonly used measure is the LACE index (Length of stay, Acuity, Comorbidity, and Emergency department use).[10] The LACE index predicted readmission and death within 30 days of discharge in a large cohort in Canada. In 2 retrospective studies of recently hospitalized patients in the United States, the LACE index's ability to discriminate between patients readmitted or not ranged from slightly better than chance to moderate (C statistic 0.56‐0.77).[11, 12]
It is unknown whether adding patient‐reported preparedness measures to commonly used readmission prediction scores increases the ability to predict readmission risk. We sought to determine whether the B‐PREPARED and CTM‐3 measures were predictive of readmission or death, as compared to the LACE index, in a large cohort of cardiovascular patients. In addition, we sought to determine the additional predictive and discriminative ability gained from administering the B‐PREPARED and CTM‐3 measures, while adjusting for the LACE index and other clinical factors. We hypothesized that: (1) higher preparedness scores on both measures would predict lower risk of readmission or death in a cohort of patients hospitalized with cardiac diagnoses; and (2) because it provides more specific and actionable information, the B‐PREPARED would discriminate readmission more accurately than CTM‐3, after controlling for clinical factors.
METHODS
Study Setting and Design
The Vanderbilt Inpatient Cohort Study (VICS) is a prospective study of patients admitted with cardiovascular disease to Vanderbilt University Hospital. The purpose of VICS is to investigate the impact of patient and social factors on postdischarge health outcomes such as quality of life, unplanned hospital utilization, and mortality. The rationale and design of VICS are detailed elsewhere.[13] Briefly, participants completed a baseline interview while hospitalized, and follow‐up phone calls were conducted within 2 to 9 days and at approximately 30 and 90 days postdischarge. During the first follow‐up call conducted by research assistants, we collected preparedness for discharge data utilizing the 2 measures described below. After the 90‐day phone call, we collected healthcare utilization since the index admission. The study was approved by the Vanderbilt University Institutional Review Board.
Patients
Eligibility screening shortly after admission identified patients with acute decompensated heart failure (ADHF) and/or an intermediate or high likelihood of acute coronary syndrome (ACS) per a physician's review of the clinical record. Exclusion criteria included: age <18 years, non‐English speaker, unstable psychiatric illness, delirium, low likelihood of follow‐up (eg, no reliable telephone number), on hospice, or otherwise too ill to complete an interview. To be included in these analyses, patients must have completed the preparedness for discharge measurements during the first follow‐up call. Patients who died before discharge or before completing the follow‐up call were excluded.
Preparedness for Discharge Measures (Patient‐Reported Data)
Preparedness for discharge was assessed using the 11‐item B‐PREPARED and the 3‐item CTM‐3.
The B‐PREPARED measures how prepared patients felt leaving the hospital with regard to: self‐care information for medications and activity, equipment/community services needed, and confidence in managing one's health after hospitalization. The B‐PREPARED measure has good internal consistency reliability (Cronbach's = 0.76) and has been validated in patients of varying age within a week of discharge. Preparedness is the sum of responses to all 11 questions, with a range of 0 to 22. Higher scores reflect increased preparedness for discharge.[3]
The CTM‐3 asks patients to rate how well their preferences were considered regarding transitional needs, as well as their understanding of postdischarge self‐management and the purpose of their medications, each on a 4‐point response scale (strongly disagree to strongly agree). The sum of the 3 responses quantifies the patient's perception of the quality of the care transition at discharge (Cronbach's = 0.86,[14] 0.92 in a cohort similar to ours[8]). Scores range from 3 to 12, with higher score indicating more preparedness. Then, the sum is transformed to a 0 to 100 scale.[15]
Clinical Readmission Risk Measures (Medical Record Data)
The LACE index, published by Van Walraven et al.,[10] takes into account 4 categories of clinical data: length of hospital stay, acuity of event, comorbidities, and ED visits in the prior 6 months. More specifically, a diagnostic code‐based, modified version of the Charlson Comorbidity Index was used to calculate the comorbidity score. These clinical criteria were obtained from an administrative database and weighted according to the methods used by Van Walraven et al. An overall score was calculated on a scale of 0 to 19, with higher scores indicating higher risk of readmission or death within 30 days.
From medical records, we also collected patients' demographic data including age, race, and gender, and diagnosis of ACS, ADHF, or both at hospital admission.
Outcome Measures
Healthcare utilization data were obtained from the index hospital as well as outside facilities. The electronic medical records from Vanderbilt University Hospital provided information about healthcare utilization at Vanderbilt 90 days after initial discharge. We also used Vanderbilt records to see if patients were transferred to Vanderbilt from other hospitals or if patients visited other hospitals before or after enrollment. We supplemented this with patient self‐report during the follow‐up telephone calls (at 30 and 90 days after initial discharge) so that any additional ED and hospital visits could be captured. Mortality data were collected from medical records, Social Security data, and family reports. The main outcome was time to first unplanned hospital readmission or death within 30 and 90 days of discharge.
Analysis
To describe our sample, we summarized categorical variables with percentages and continuous variables with percentiles. To test for evidence of unadjusted covariate‐outcome relationships, we used Pearson 2 and Wilcoxon rank sum tests for categorical and continuous covariates, respectively.
For the primary analyses we used Cox proportional hazard models to examine the independent associations between the prespecified predictors for patient‐reported preparedness and time to first unplanned readmission or death within 30 and 90 days of discharge. For each outcome (30‐ and 90‐day readmission or death), we fit marginal models separately for each of the B‐PREPARED, CTM‐3, and LACE scores. We then fit multivariable models that used both preparedness measures as well as age, gender, race, and diagnosis (ADHF and/or ACS), variables available to clinicians when patients are admitted. When fitting the multivariable models, we did not find strong evidence of nonlinear effects; therefore, only linear effects are reported. To facilitate comparison of effects, we scaled continuous variables by their interquartile range (IQR). The associated, exponentiated regression parameter estimates may therefore be interpreted as hazard ratios for readmission or death per IQR change in each predictor. In addition to parameter estimation, we computed the C index to evaluate capacity for the model to discriminate those who were and were not readmitted or died. All analyses were conducted in R version 3.1.2 (R Foundation for Statistical Computing, Vienna, Austria).
RESULTS
From the cohort of 1239 patients (Figure 1), 64%, 28%, and 7% of patients were hospitalized with ACS, ADHF, or both, respectively (Table 1). Nearly 45% of patients were female, 83% were white, and the median age was 61 years (IQR 5269). The median length of stay was 3 days (IQR 25). The median preparedness scores were high for both B‐PREPARED (21, IQR 1822) and CTM‐3 (77.8, IQR 66.7100). A total of 211 (17%) and 380 (31%) were readmitted or died within 30 and 90 days, respectively. The completion rate for the postdischarge phone calls was 88%.
| Death or Readmission Within 30 Days | Death or Readmission Within 90 Days | |||||
|---|---|---|---|---|---|---|
| Not Readmitted, N = 1028 | Death/Readmitted, N = 211 | P Value | Not Readmitted, N = 859 | Death/Readmitted, N = 380 | P Value | |
| ||||||
| Gender, male | 55.8% (574) | 53.1% (112) | 0.463* | 56.3% (484) | 53.2% (202) | 0.298* |
| Female | 44.2% (454) | 46.9% (99) | 43.7% (375) | 46.8% (178) | ||
| Race, white | 83.9% (860) | 80.6% (170) | 0.237* | 86.0% (737) | 77.3% (293) | <0.001* |
| Race, nonwhite | 16.1% (165) | 19.4% (41) | 14.0% (120) | 22.7% (86) | ||
| Diagnosis ACS | 68.0% (699) | 46.4% (98) | <0.001* | 72.9% (626) | 45.0% (171) | <0.001* |
| ADHF | 24.8% (255) | 46.0% (97) | 20.3% (174) | 46.8% (178) | ||
| Both | 7.2% (74) | 7.6% (16) | 6.9% (59) | 8.2% (31) | ||
| Age | 39.4:52:61:68:80 | 37.5:53.5:62:70:82 | 0.301 | 40:52:61:68:80 | 38:52:61 :70:82 | 0.651 |
| LOS | 1:2:3:5:10 | 1:3: 4:7.5:17 | <0.001 | 1:2:3:5:9 | 1:3:4:7:15 | <0.001 |
| CTM‐3 | 55.6:66.7: 77.8:100:100 | 55.6:66.7:77.8:100 :100 | 0.305 | 55.6:66.7:88.9:100:100 | 55.6:66.7:77.8:100 :100 | 0.080 |
| B‐PREPARED | 12:18:21:22.:22 | 10:17:20:22:22 | 0.066 | 12:18:21:22:22 | 10:17:20 :22:22 | 0.030 |
| LACE | 1:4: 7:10 :14 | 3.5:7:10:13:17 | <0.001 | 1:4:6: 9:14 | 3:7:10:13:16 | <0.001 |
B‐PREPARED and CTM‐3 were moderately correlated with one another (Spearman's = 0.40, P < 0.001). In bivariate analyses (Table 1), the association between B‐PREPARED and readmission or death was significant at 90 days (P = 0.030) but not 30 days. The CTM‐3 showed no significant association with readmission or death at either time point. The LACE score was significantly associated with rates of readmission at 30 and 90 days (P < 0.001).
Outcomes Within 30 Days of Discharge
When examining readmission or death within 30 days of discharge, simple unadjusted models 2 and 3 showed that the B‐PREPARED and LACE scores, respectively, were each significantly associated with time to first readmission or death (Table 2). Specifically, a 4‐point increase in the B‐PREPARED score was associated with a 16% decrease in the hazard of readmission or death (hazard ratio [HR] = 0.84, 95% confidence interval [CI]: 0.72 to 0.97). A 5‐point increase in the LACE score was associated with a 100% increase in the hazard of readmission or death (HR = 2.00, 95% CI: 1.72 to 2.32). In the multivariable model with both preparedness scores and diagnosis (model 4), the B‐PREPARED score (HR = 0.82, 95% CI: 0.70 to 0.97) was significantly associated with time to first readmission or death. In the full 30‐day model including B‐PREPARED, CTM‐3, LACE, age, gender, race, and diagnosis (model 5), only the LACE score (HR = 1.83, 95% CI: 1.54 to 2.18) was independently associated with time to readmission or death. Finally, the CTM‐3 did not predict 30‐day readmission or death in any of the models tested.
| Models | HR (95% CI)* | P Value | C Index |
|---|---|---|---|
| |||
| 1. CTM (per 10‐point change) | 0.95 (0.88 to 1.03) | 0.257 | 0.523 |
| 2. B‐PREPARED (per 4‐point change) | 0.84 (0.72 to 0.97) | 0.017 | 0.537 |
| 3. LACE (per 5‐point change) | 2.00 (1.72 to 2.32) | <0.001 | 0.679 |
| 4. CTM (per 10‐point change) | 1.00 (0.92 to 1.10) | 0.935 | 0.620 |
| B‐PREPARED (per 4‐point change) | 0.82 (0.70 to 0.97) | 0.019 | |
| ADHF only (vs ACS only) | 2.46 (1.86 to 3.26) | <0.001 | |
| ADHF and ACS (vs ACS only) | 1.42 (0.84 to 2.42) | 0.191 | |
| 5. CTM (per 10‐point change) | 1.02 (0.93 to 1.11) | 0.722 | 0.692 |
| B‐PREPARED (per 4 point change) | 0.87 (0.74 to 1.03) | 0.106 | |
| LACE (per 5‐point change) | 1.83 (1.54 to 2.18) | <0.001 | |
| ADHF only (vs ACS only) | 1.51 (1.10 to 2.08) | 0.010 | |
| ADHF and ACS (vs ACS only) | 0.90 (0.52 to 1.55) | 0.690 | |
| Age (per 10‐year change) | 1.02 (0.92 to 1.14) | 0.669 | |
| Female (vs male) | 1.11 (0.85 to 1.46) | 0.438 | |
| Nonwhite (vs white) | 0.92 (0.64 to 1.30) | 0.624 | |
Outcomes Within 90 Days of Discharge
At 90 days after discharge, again the separate unadjusted models 2 and 3 demonstrated that the B‐PREPARED and LACE scores, respectively, were each significantly associated with time to first readmission or death, whereas the CTM‐3 model only showed marginal significance (Table 3). In the multivariable model with both preparedness scores and diagnosis (model 4), results were similar to 30 days as the B‐PREPARED score was significantly associated with time to first readmission or death. Lastly, in the full model (model 5) at 90 days, again the LACE score was significantly associated with time to first readmission or death. In addition, B‐PREPARED scores were associated with a significant decrease in risk of readmission or death (HR = 0.88, 95% CI: 0.78 to 1.00); CTM‐3 scores were not independently associated with outcomes.
| Model | HR (95% CI)* | P Value | C Index |
|---|---|---|---|
| |||
| 1. CTM (per 10‐point change) | 0.94 (0.89 to 1.00) | 0.051 | 0.526 |
| 2. B‐PREPARED (per 4‐point change) | 0.84 (0.75 to 0.94) | 0.002 | 0.533 |
| 3. LACE (per 5‐point change) | 2.03 (1.82 to 2.27) | <0.001 | 0.683 |
| 4. CTM (per 10‐point change) | 0.99 (0.93 to 1.06) | 0.759 | 0.640 |
| B‐PREPARED (per 4‐point change) | 0.83 (0.74 to 0.94) | 0.003 | |
| ADHF only (vs ACS only) | 2.88 (2.33 to 3.56) | <0.001 | |
| ADHF and ACS (vs ACS only) | 1.62 (1.11 to 2.38) | 0.013 | |
| 5. CTM (per 10‐point change) | 1.00 (0.94 to 1.07) | 0.932 | 0.698 |
| B‐PREPARED (per 4‐point change) | 0.88 (0.78 to 1.00) | 0.043 | |
| LACE (per 5‐point change) | 1.76 (1.55 to 2.00) | <0.001 | |
| ADHF only (vs ACS only) | 1.76 (1.39 to 2.24) | <0.001 | |
| ADHF and ACS (vs ACS only) | 1.00 (0.67 to 1.50) | 0.980 | |
| Age (per 10‐year change) | 1.00 (0.93 to 1.09) | 0.894 | |
| Female (vs male) | 1.10 (0.90 to 1.35) | 0.341 | |
| Nonwhite (vs white) | 1.14 (0.89 to 1.47) | 0.288 | |
Tables 2 and 3 also display the C indices, or the discriminative ability of the models to differentiate whether or not a patient was readmitted or died. The range of the C index is 0.5 to 1, where values closer to 0.5 indicate random predictions and values closer to 1 indicate perfect prediction. At 30 days, the individual C indices for B‐PREPARED and CTM‐3 were only slightly better than chance (0.54 and 0.52, respectively) in their discriminative abilities. However, the C indices for the LACE score alone (0.68) and the multivariable model (0.69) including all 3 measures (ie, B‐PREPARED, CTM‐3, LACE), and clinical and demographic variables, had higher utility in discriminating patients who were readmitted/died or not. The 90‐day C indices were comparable in magnitude to those at 30 days.
DISCUSSION/CONCLUSION
In this cohort of patients hospitalized with cardiovascular disease, we compared 2 patient‐reported measures of preparedness for discharge, their association with time to death or readmission at 30 and 90 days, and their ability to discriminate patients who were or were not readmitted or died. Higher preparedness as measured by higher B‐PREPARED scores was associated with lower risk of readmission or death at 30 and 90 days after discharge in unadjusted models, and at 90 days in adjusted models. CTM‐3 was not associated with the outcome in any analyses. Lastly, the individual preparedness measures were not as strongly associated with readmission or death compared to the LACE readmission index alone.
How do our findings relate to the measurement of care transition quality? We consider 2 scenarios. First, if hospitals utilize the LACE index to predict readmission, then neither self‐reported measure of preparedness adds meaningfully to its predictive ability. However, hospital management may still find the B‐PREPARED and CTM‐3 useful as a means to direct care transition quality‐improvement efforts. These measures can instruct hospitals as to what areas their patients express the greatest difficulty or lack of preparedness and closely attend to patient needs with appropriate resources. Furthermore, the patient's perception of being prepared for discharge may be different than their actual preparedness. Their perceived preparedness may be affected by cognitive impairment, dissatisfaction with medical care, depression, lower health‐related quality of life, and lower educational attainment as demonstrated by Lau et al.[16] If a patient's perception of preparedness were low, it would behoove the clinician to investigate these other issues and address those that are mutable. Additionally, perceived preparedness may not correlate with the patient's understanding of their medical conditions, so it is imperative that clinicians provide prospective guidance about their probable postdischarge trajectory. If hospitals are not utilizing the LACE index, then perhaps using the B‐PREPARED, but not the CTM‐3, may be beneficial for predicting readmission.
How do our results fit with evidence from prior studies, and what do they mean in the context of care transitions quality? First, in the psychometric evaluation of the B‐PREPARED measure in a cohort of recently hospitalized patients, the mean score was 17.3, lower than the median of 21 in our cohort.[3] Numerous studies have utilized the CTM‐3 and the longer‐version CTM‐15. Though we cannot make a direct comparison, the median in our cohort (77.8) was on par with the means from other studies, which ranged from 63 to 82.[5, 17, 18, 19] Several studies also note ceiling effects with clusters of scores at the upper end of the scale, as did we. We conjecture that our cohort's preparedness scores may be higher because our institution has made concerted efforts to improve the discharge education for cardiovascular patients.
In a comparable patient population, the TRACE‐CORE (Transitions, Risks, and Actions in Coronary Events Center for Outcomes Research and Education) study is a cohort of more than 2200 patients with ACS who were administered the CTM‐15 within 1 month of discharge.[8] In that study, the median CTM‐15 score was 66.6, which is lower than our cohort. With regard to the predictive ability of the CTM‐3, they note that CTM‐3 scores did not differentiate between patients who were or were not readmitted or had emergency department visits. Our results support their concern that the CTM‐15 and by extension the CTM‐3, though adopted widely as part of HCAHPS, may not have sufficient ability to discriminate differences in patient outcomes or the quality of care transitions.
More recently, patient‐reported preparedness for discharge was assessed in a prospective cohort in Canada.[16] Lau et al. administered a single‐item measure of readiness at the time of discharge to general medicine patients, and found that lower readiness scores were also not associated with readmission or death at 30 days, when adjusted for the LACE index as we did.
We must acknowledge the limitations of our findings. First, our sample of recently discharged patients with cardiovascular disease is different than the community‐dwelling, underserved Americans hospitalized in the prior year, which served as the sample for reducing the CTM‐15 to 3 items.[5] This fact may explain why we did not find the CTM‐3 to be associated with readmission in our sample. Second, our analyses did not include extensive adjustment for patient‐related factors. Rather, our intention was to see how well the preparedness measures performed independently and compare their abilities to predict readmission, which is particularly relevant for clinicians who may not have all possible covariates in predicting readmission. Finally, because we limited the analyses to the patients who completed the B‐PREPARED and CTM‐3 measures (88% completion rate), we may not have data for: (1) very ill patients, who had a higher risk of readmission and least prepared, and were not able to answer the postdischarge phone call; and (2) very functional patients, who had a lower risk of readmission and were too busy to answer the postdischarge phone call. This may have limited the extremes in the spectrum of our sample.
Importantly, our study has several strengths. We report on the largest sample to date with results of both B‐PREPARED and CTM‐3. Moreover, we examined how these measures compared to a widely used readmission prediction tool, the LACE index. We had very high postdischarge phone call completion rates in the week following discharge. Furthermore, we had thorough assessment of readmission data through patient report, electronic medical record documentation, and collection of outside medical records.
Further research is needed to elucidate: (1) the ideal administration time of the patient‐reported measures of preparedness (before or after discharge), and (2) the challenges to the implementation of measures in healthcare systems. Remaining research questions center on the tradeoffs and barriers to implementing a longer measure like the 11‐item B‐PREPARED compared to a shorter measure like the CTM‐3. We do not know whether longer measures preclude their use by busy clinicians, though it provides more specific information about what patients feel they need at hospital discharge. Additionally, studies need to demonstrate the mutability of preparedness and the response of measures to interventions designed to improve the hospital discharge process.
In our sample of recently hospitalized cardiovascular patients, there was a statistically significant association between patient‐reported preparedness for discharged, as measured by B‐PREPARED, and readmissions/death at 30 and 90 days, but the magnitude of the association was very small. Furthermore, another patient‐reported preparedness measure, CTM‐3, was not associated with readmissions or death at either 30 or 90 days. Lastly, neither measure discriminated well between patients who were readmitted or not, and neither measure added meaningfully to the LACE index in terms of predicting 30‐ or 90‐day readmissions.
Disclosures
This study was supported by grant R01 HL109388 from the National Heart, Lung, and Blood Institute (Dr. Kripalani) and in part by grant UL1 RR024975‐01 from the National Center for Research Resources, and grant 2 UL1 TR000445‐06 from the National Center for Advancing Translational Sciences. Dr. Kripalani is a consultant to SAI Interactive and holds equity in Bioscape Digital, and is a consultant to and holds equity in PictureRx, LLC. Dr. Bell is supported by the National Institutes of Health (K23AG048347) and by the Eisenstein Women's Heart Fund. Dr. Vasilevskis is supported by the National Institutes of Health (K23AG040157) and the Geriatric Research, Education and Clinical Center. Dr. Mixon is a Veterans Affairs Health Services Research and Development Service Career Development awardee (12‐168) at the Nashville Department of Veterans Affairs. The content is solely the responsibility of the authors and does not necessarily represent the official views of the National Institutes of Health. The funding agency was not involved in the design and conduct of the study; collection, management, analysis, and interpretation of the data; and preparation, review, or approval of the manuscript. All authors had full access to all study data and had a significant role in writing the manuscript. The contents do not represent the views of the US Department of Veterans Affairs or the United States government. Dr. Kripalani is a consultant to and holds equity in PictureRx, LLC.
- Centers for Medicare 9(9):598–603.
- , , . Brief scale measuring patient preparedness for hospital discharge to home: psychometric properties. J Hosp Med. 2008;3(6):446–454.
- , , . Assessing the quality of preparation for posthospital care from the patient's perspective: the care transitions measure. Med Care. 2005;43(3):246–255.
- , , , . Assessing the quality of transitional care: further applications of the care transitions measure. Med Care. 2008;46(3):317–322.
- , , , , . The central role of performance measurement in improving the quality of transitional care. Home Health Care Serv Q. 2007;26(4):93–104.
- Centers for Medicare 3:e001053.
- , , , et al. Risk prediction models for hospital readmission: a systematic review. JAMA. 2011;306(15):1688–1698.
- , , , et al. Derivation and validation of an index to predict early death or unplanned readmission after discharge from hospital to the community. CMAJ. 2010;182(6):551–557.
- , , , et al. Using the LACE index to predict hospital readmissions in congestive heart failure patients. BMC Cardiovasc Disord. 2014;14:97.
- , , , . Validation of a predictive model to identify patients at high risk for hospital readmission. J Healthc Qual. 2016;38(1):34–41.
- , , , et al. Determinants of health after hospital discharge: rationale and design of the Vanderbilt Inpatient Cohort Study (VICS). BMC Health Serv Res. 2014;14:10.
- . CTM frequently asked questions. Available at: http://caretransitions.org/tools-and-resources/. Accessed January 22, 2016.
- . Instructions for scoring the CTM‐3. Available at: http://caretransitions.org/tools-and-resources/. Accessed January 22, 2016.
- , , , et al. Patient‐reported discharge readiness and 30‐day risk of readmission or death: a prospective cohort study. Am J Med. 2016;129:89–95.
- , , , , . Implementaiton of the Care Transitions Intervention: sustainability and lessons learned. Prof Case Manag. 2009;14(6):282–293.
- , , , . The care transitions innovation (C‐TraIn) for socioeconomically disadvantaged adults: results of a cluster randomized controlled trial. J Gen Intern Med. 2014;29(11):1460–1467.
- , , , et al. Telephone calls to patients after discharge from the hospital: an important part of transitions of care. Med Educ Online. 2015;29(20):26701.
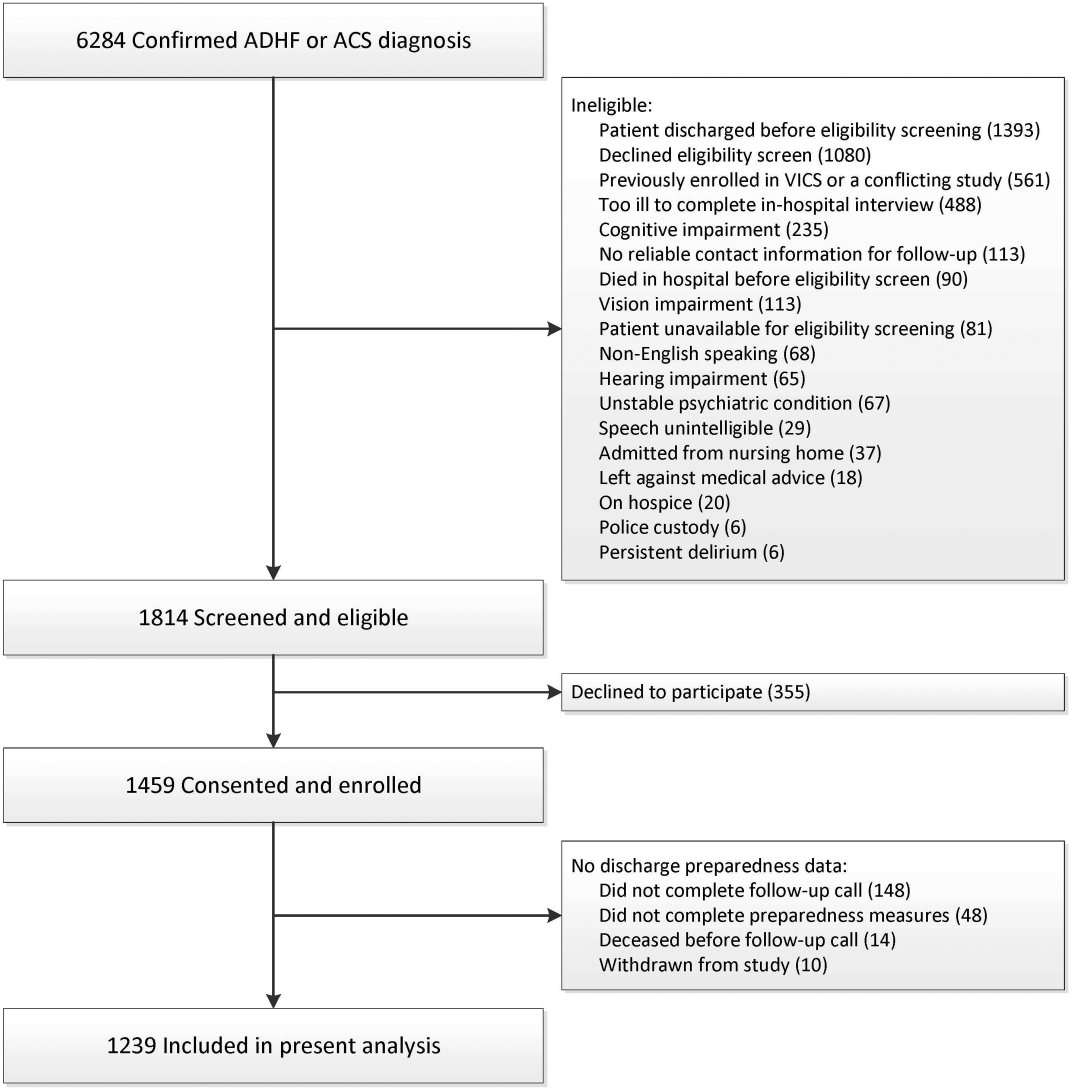
Primary Medication Nonadherence
Medication nonadherence after hospital discharge impacts morbidity and mortality in patients with cardiovascular disease.[1] Primary nonadherence, part of the spectrum of medication underuse, occurs when a patient receives a prescription but does not fill it.[1] Prior studies utilizing retrospective administrative data have found a prevalence of postdischarge primary nonadherence between 24% and 28%,[1, 2] similar to findings in a variety of outpatient populations.[3, 4]
One strategy for reduction in nonadherence is discharge medication counseling, which has been associated with improved postdischarge outcomes.[1] We evaluated the prevalence and predictors of refractory primary nonadherence in a cohort of patients hospitalized for acute cardiovascular conditions who received pharmacist counseling prior to discharge to guide future adherence interventions.
METHODS
Setting and Participants
The present study represents a secondary analysis of data from the Pharmacist Intervention for Low Literacy in Cardiovascular Disease (PILL‐CVD) study. PILL‐CVD was a randomized controlled trial that evaluated the effect of a tailored intervention consisting of pharmacist‐assisted medication reconciliation, discharge counseling, low‐literacy adherence aids, and follow‐up phone calls in adults hospitalized for acute coronary syndromes or acute decompensated heart failure. Patients likely to be discharged home taking primary responsibility for their medication management were eligible. Full study methods and results, including inclusion and exclusion criteria, can be found elsewhere.[5] The institutional review boards of each site approved the study.
For the present analysis, patients were included if they had any new discharge prescriptions to fill and received the study intervention, including a postdischarge follow‐up phone call with questions about filling discharge prescriptions.
Baseline Measures
Baseline data were obtained from medical records and patient interviews, including demographic information as well as survey data for cognitive impairment (Mini‐Cog) and health literacy (Short Test of Functional Health Literacy in Adults).[6, 7]
Data were also collected related to medication use, including the number of scheduled and as‐needed medications listed at discharge, self‐reported preadmission adherence, medication understanding, and medication management practices (eg, use of a pillbox, refill reminders). Self‐reported medication adherence was measured with the 4‐item Morisky scale.[8] Medication understanding was assessed with a tool previously developed by Marvanova et al.[9]
Outcome Measures
The primary outcome was the percentage of patients who reported not filling at least 1 discharge prescription on a telephone call that was conducted 1 to 4 days postdischarge. Patients were asked a dichotomous question about whether or not they filled all of their discharge prescriptions. Further characterization of the class or number of medications not filled was not performed. Patients were asked to provide a reason for not filling the prescriptions.
Analysis
We evaluated the prevalence and possible predictors of primary nonadherence including age, gender, race, marital status, education and income levels, insurance type, health literacy, cognition, presence of a primary care physician, number of listed discharge medications, prehospital medication adherence, medication understanding, and medication management practices using Pearson 2, Fisher exact, or Wilcoxon rank sum tests as appropriate. Multiple logistic regression with backward elimination was performed to identify independent predictors, selected with P values<0.1. We also evaluated reasons that patients cited for not filling prescriptions. Two‐sided P values<0.05 were considered statistically significant. All analyses were conducted using Stata version 13.1 (StataCorp LP, College Station, TX).
RESULTS
Of 851 patients in the PILL‐CVD study, the present sample includes 341 patients who received the intervention, completed the postdischarge follow‐up call, and had new discharge prescriptions to be filled. This represents 85% of patients who received the intervention.
The mean age of participants was 61.3 years, and 59.5% were male (Table 1). The majority were white (75.1%), and 88% had at least a high school education. Married or cohabitating patients represented 54.3% of the group. Just over half of the patients (54%) had an income of $35K or greater. The primary source of insurance for 82.5% of patients was either Medicare or private insurance, and 7.4% of patients were self‐pay. Most patients (80%) had adequate health literacy. The median Mini‐Cog score was 4 out of 5 (interquartile range [IQR]=35), and 11% of patients had scores indicating cognitive impairment. Just less than one‐fourth of the patients (24.1%) had a Morisky score of 8, indicating high self‐reported adherence, and the median score of patients' understanding of medications (range of 03) was 2.5 (IQR=2.22.8), reflecting relatively high understanding. The median number of prescriptions on patients' discharge medications lists was 10 (IQR=813).
| Variable | Overall 341 (100.0%) | Filled Prescription309 (90.6%) | Did Not Fill 32 (9.4%) | P Value |
|---|---|---|---|---|
| ||||
| Age, y, N (%) | 0.745a | |||
| 1849 | 69 | 63 (91.3) | 6 (8.7) | |
| 5064 | 128 | 114 (89.1) | 14 (10.9) | |
| 65+ | 144 | 132 (91.7) | 12 (8.3) | |
| Gender, N (%) | 0.056a | |||
| Male | 203 | 189 (93.1) | 14 (6.9) | |
| Female | 138 | 120 (87.0) | 18 (13.0) | |
| Race, N (%) | 0.712a | |||
| White | 256 | 234 (91.4) | 22 (8.6) | |
| African American | 60 | 54 (90.0) | 6 (10.0) | |
| Other | 22 | 19 (86.4) | 3 (13.6) | |
| Education, N (%) | 0.054a | |||
| Less than high school | 40 | 32 (80.0) | 8 (20.0) | |
| High school | 99 | 91 (91.9) | 8 (8.1) | |
| 1315 years | 93 | 83 (89.2) | 10 (10.8) | |
| 16 years | 109 | 103 (94.5) | 6 (5.5) | |
| Marital status, N (%) | ||||
| Separated/divorced/widowed/never married | 156 | 135 (86.5) | 21 (13.5) | 0.018a, b |
| Married/cohabitating | 185 | 174 (94.1) | 11 (5.9) | |
| Income, N (%) | 0.040a, b | |||
| <10K<20K | 58 | 48 (82.8) | 10 (17.2) | |
| 20K35K | 86 | 76 (88.4) | 10 (11.6) | |
| 35K<50K | 40 | 36 (90.0) | 4 (10.0) | |
| 50K<75K | 46 | 43 (93.5) | 3 (6.5) | |
| 75K+ | 83 | 81 (97.6) | 2 (2.4) | |
| Primary source of payment, N (%) | 0.272a | |||
| Medicaid | 34 | 28 (82.4) | 6 (17.6) | |
| Medicare | 145 | 131 (90.3) | 14 (9.7) | |
| Private | 132 | 123 (93.2) | 9 (6.8) | |
| Self‐pay | 25 | 22 (88.0) | 3 (12.0) | |
| Primary care physician, N (%) | 1.000c | |||
| None/do not know | 28 | 26 (92.9) | 2 (7.1) | |
| Yes | 313 | 283 (90.4) | 30 (9.6) | |
| Site, N (%) | 0.071a | |||
| Nashville, TN | 172 | 151 (87.8) | 21 (12.2) | |
| Boston, MA | 169 | 158 (93.5) | 11 (6.5) | |
The prevalence of refractory primary nonadherence was 9.4%. In univariate analysis, single marital status, lower income, and having more than 10 total discharge medications were significantly associated with not filling medications (P=0.018, 0.04, 0.016, respectively; Table 1). In multivariable analysis, single marital status and having more than 10 total discharge medications maintained significance when controlling for other patient characteristics. Patients who were single had higher odds of failing to fill discharge prescriptions compared to married or cohabitating individuals (odds ratio [OR]: 2.2, 95% confidence interval [CI]: 1.014.8, P=0.047). Patients with more than 10 discharge medications also had higher odds of failing to fill compared with patients who had fewer total medications (OR: 2.3, 95% CI: 1.054.98, P=0.036).
Filling discharge prescriptions was not associated with health literacy, cognition, prehospital adherence, patients' medication understanding, or any of the surveyed medication management practices (Table 2). Patients' reasons for not filling included lack of time to go to the pharmacy, medications not being delivered or dispensed, or inability to afford prescriptions. Prescription cost was cited by 23.5% of patients who did not fill their prescriptions and provided a reason.
| Variable | Overall 341 (100.0%) | Filled Prescription 309 (90.6%) | Did Not Fill 32 (9.4%) | P Value |
|---|---|---|---|---|
| ||||
| s‐TOFHLA score, range 036, N (%) | 0.443a | |||
| Inadequate, 016 | 40 | 34 (85.0) | 6 (15.0) | |
| Marginal, 1722 | 27 | 25 (92.6) | 2 (7.4) | |
| Adequate, 2336 | 268 | 244 (91.0) | 24 (9.0) | |
| MiniCog score, range 05, N (%) | 0.764b | |||
| Not impaired, 35 | 304 | 276 (90.8) | 28 (9.2) | |
| Impaired, 02 | 37 | 33 (89.2) | 4 (10.8) | |
| Morisky score, range 48, N (%) | 0.517a | |||
| Low/moderate self‐reported adherence, 47 | 249 | 224 (90.0) | 25 (10.0) | |
| High self‐reported adherence, 8 | 79 | 73 (92.4) | 6 (7.6) | |
| No. of discharge medications, range 126, N (%)c | 0.016a | |||
| 010 medications | 186 | 175 (94.1) | 11 (5.9) | |
| 11+medications | 155 | 134 (86.5) | 21 (13.5) | |
| Patient responses to medication behavior questions | ||||
| Patient associates medication taking time with daily events | 253 | 229 (90.5) | 24 (9.5) | 0.913a |
| Patient uses a pillbox to organize medicine | 180 | 162 (90.0) | 18 (10.0) | 0.680a |
| Friends of family help remind patient when it is time to take medicine | 89 | 79 (88.8) | 10 (11.2) | 0.486a |
| Patient writes down instructions for when to take medicine | 60 | 55 (91.7) | 5 (8.3) | 0.758a |
| Patient uses an alarm or a reminder that beeps when it is time to take medicine | 8 | 6 (75.0) | 2 (25.0) | 0.167a |
| Patient marks refill date on calendar | 38 | 35 (92.1) | 3 (7.9) | 1.000b |
| Pharmacy gives or sends patient a reminder when it is time to refill medicine | 94 | 84 (89.4) | 10 (10.6) | 0.624a |
| Friends or family help patient to refill medicine | 60 | 53 (88.3) | 7 (11.7) | 0.504a |
DISCUSSION
Almost 1 in 10 patients hospitalized with cardiovascular disease demonstrated primary nonadherence refractory to an intervention including pharmacist discharge medication counseling. Being unmarried and having greater than 10 medications at discharge were significantly associated with higher primary nonadherence when controlling for other patient factors.
Patients with a cohabitant partner were significantly less likely to exhibit primary nonadherence, which may reflect higher levels of social support, including encouragement for disease self‐management and/or support with tasks such as picking up medications from the pharmacy. Previous research has demonstrated that social support mediates outpatient medication adherence for heart failure patients.[10]
Similar to Jackevicius et al., we found that patients with more medications at discharge were less likely to fill their prescriptions.[1] These findings may reflect the challenges that patients face in adhering to complex treatment plans, which are associated with increased coordination and cost. Conversely, some prior studies have found that patients with fewer prescriptions were less likely to fill.[11, 12] These patients were often younger, thus potentially less conditioned to fill prescriptions, and unlike our cohort, these populations had consistent prescription coverage. Interventions for polypharmacy, which have been shown to improve outcomes and decrease costs, especially in the geriatric population, may be of benefit for primary nonadherence as well.[13]
Additionally, patients with lower household incomes had higher rates of primary nonadherence, at least in univariate analysis. Medication cost and transportation limitations, which are more pronounced in lower‐income patients, likely play influential roles in this group. These findings build on prior literature that has found lower prescription cost to be associated with better medication adherence in a variety of settings.[3, 4, 14]
Because the prevalence of primary nonadherence in this cohort is less than half of historical rates, we suspect the intervention did reduce unintentional nonadherence. However, regimen cost and complexity, transportation challenges, and ingrained medication beliefs likely remained barriers. It may be that a postdischarge phone call is able address unintended primary nonadherence in many cases. Meds to beds programs, where a supply of medications is provided to patients prior to discharge, could assist patients with limited transportation. Prior studies have also found reduced primary nonadherence when e‐prescriptions are utilized.[3]
Establishing outpatient follow‐up at discharge provides additional opportunities to address unanticipated adherence barriers. Because the efficacy of any adherence intervention depends on individual patient barriers, we recommend combining medication counseling with a targeted approach for patient‐specific needs.
We note several limitations to our study. First, because we studied primary nonadherence that persisted despite an intervention, this cohort likely underestimates the prevalence of primary nonadherence and alters the associated patient characteristics found in routine practice (although counseling is becoming more common). Second, patient reporting is subject to biases that underestimate nonadherence, although this approach has been validated previously.[15] Third, our outcome measure was unable to capture the spectrum of non‐adherence that could provide a more nuanced look at predictors of postdischarge nonadherence. Fourth, we did not have patient copayment data to better characterize whether out of pocket costs or pharmacologic classes drove nonadherence. Finally, sample size may have limited the detection of other important factors, and the university setting may limit generalizability to cardiovascular patients in other practice environments. Future research should focus on intervention strategies that assess patients' individual adherence barriers for a targeted or multimodal approach to improve adherence.
In conclusion, we found a prevalence of primary nonadherence of almost 1 in 10 patients who received pharmacist counseling. Nonadherence was associated with being single and those discharged with longer medication lists. Our results support existing literature that primary nonadherence is a significant problem in the postdischarge setting and substantiate the need for ongoing efforts to study and implement interventions for adherence after hospital discharge.
Disclosures
This material is based on work supported by the Office of Academic Affiliations, Department of Veterans Affairs, Veterans Affairs National Quality Scholars Program, and with use of facilities at Veterans Affairs Tennessee Valley Healthcare System, Nashville, Tennessee (Dr. Wooldridge). The funding agency supported the work indirectly through provision of salary support and training for the primary author, but had no specific role in the design and conduct of the study; collection, management, analysis, and interpretation of the data; preparation, review, or approval of the manuscript; or decision to submit the manuscript for publication. This work was also supported by R01 HL089755 (Dr. Kripalani) and in part by K23 HL077597 (Dr. Kripalani), K08 HL072806 (Dr. Schnipper), and the Center for Clinical Quality and Implementation Research at Vanderbilt University Medical Center. A preliminary version of this research was presented at the AcademyHealth Annual Research Meeting, June 16, 2015, Minneapolis, Minnesota. The authors report the following potential conflicts of interest: Jeffrey Schnipper: PI, investigator‐initiated study funded by Sanofi‐Aventis to develop, implement, and evaluate a multifaceted intervention to improve transitions of care in patients with diabetes mellitus discharged on insulin. Robert Dittus: passive co‐owner, Medical Decision Modeling, Inc.; Bayer HealthCare. One‐day consultation and panelist on educational video for population health (consultant fee); GlaxoSmithKline. One‐day consultant for population health, envisioning the future (consultant fee). Sunil Kripalani: Bioscape Digital, stock ownership
- , , . Prevalence, predictors, and outcomes of primary nonadherence after acute myocardial infarction. Circulation. 2008;117(8):1028–1036.
- , , , . Primary medication non‐adherence after discharge from a general internal medicine service. PloS One. 2013;8(5):e61735.
- , , , et al. Trouble getting started: predictors of primary medication nonadherence. Am J Med. 2011;124(11):1081.e9–22.
- , , , , . The incidence and determinants of primary nonadherence with prescribed medication in primary care: a cohort study. Ann Intern Med. 2014;160(7):441–450.
- , , , et al. Effect of a pharmacist intervention on clinically important medication errors after hospital discharge: a randomized trial. Ann Intern Med. 2012;157(1):1–10.
- , , , . Short Test of Functional Health Literacy in Adults. Snow Camp, NC: Peppercorn Books and Press; 1998.
- , , , , . Simplifying detection of cognitive impairment: comparison of the Mini‐Cog and Mini‐Mental State Examination in a multiethnic sample. J Am Geriatr Soc. 2005;53(5):871–874.
- , , . Concurrent and predictive validity of a self‐reported measure of medication adherence. Med Care. 1986;24(1):67–74.
- , , , , , . Health literacy and medication understanding among hospitalized adults. J Hosp Med. 2011;6(9):488–493.
- , , , , , . Medication adherence, social support, and event‐free survival in patients with heart failure. Health Psychol. 2013;32(6):637–646.
- , , , , , . Effect of patient comorbidities on filling of antihypertensive prescriptions. Am J Manag Care. 2009;15(1):24–30.
- , , , et al. Primary nonadherence to statin medications in a managed care organization. J Manag Care Pharm. 2013;19(5):367–373.
- , , , et al. Reducing cost by reducing polypharmacy: the polypharmacy outcomes project. J Am Med Dir Assoc. 2012;13(9):818.e811–815.
- , , , et al. The epidemiology of prescriptions abandoned at the pharmacy. Ann Intern Med. 2010;153(10):633–640.
- , , , , , . Can simple clinical measurements detect patient noncompliance? Hypertension. 1980;2(6):757–764.
Medication nonadherence after hospital discharge impacts morbidity and mortality in patients with cardiovascular disease.[1] Primary nonadherence, part of the spectrum of medication underuse, occurs when a patient receives a prescription but does not fill it.[1] Prior studies utilizing retrospective administrative data have found a prevalence of postdischarge primary nonadherence between 24% and 28%,[1, 2] similar to findings in a variety of outpatient populations.[3, 4]
One strategy for reduction in nonadherence is discharge medication counseling, which has been associated with improved postdischarge outcomes.[1] We evaluated the prevalence and predictors of refractory primary nonadherence in a cohort of patients hospitalized for acute cardiovascular conditions who received pharmacist counseling prior to discharge to guide future adherence interventions.
METHODS
Setting and Participants
The present study represents a secondary analysis of data from the Pharmacist Intervention for Low Literacy in Cardiovascular Disease (PILL‐CVD) study. PILL‐CVD was a randomized controlled trial that evaluated the effect of a tailored intervention consisting of pharmacist‐assisted medication reconciliation, discharge counseling, low‐literacy adherence aids, and follow‐up phone calls in adults hospitalized for acute coronary syndromes or acute decompensated heart failure. Patients likely to be discharged home taking primary responsibility for their medication management were eligible. Full study methods and results, including inclusion and exclusion criteria, can be found elsewhere.[5] The institutional review boards of each site approved the study.
For the present analysis, patients were included if they had any new discharge prescriptions to fill and received the study intervention, including a postdischarge follow‐up phone call with questions about filling discharge prescriptions.
Baseline Measures
Baseline data were obtained from medical records and patient interviews, including demographic information as well as survey data for cognitive impairment (Mini‐Cog) and health literacy (Short Test of Functional Health Literacy in Adults).[6, 7]
Data were also collected related to medication use, including the number of scheduled and as‐needed medications listed at discharge, self‐reported preadmission adherence, medication understanding, and medication management practices (eg, use of a pillbox, refill reminders). Self‐reported medication adherence was measured with the 4‐item Morisky scale.[8] Medication understanding was assessed with a tool previously developed by Marvanova et al.[9]
Outcome Measures
The primary outcome was the percentage of patients who reported not filling at least 1 discharge prescription on a telephone call that was conducted 1 to 4 days postdischarge. Patients were asked a dichotomous question about whether or not they filled all of their discharge prescriptions. Further characterization of the class or number of medications not filled was not performed. Patients were asked to provide a reason for not filling the prescriptions.
Analysis
We evaluated the prevalence and possible predictors of primary nonadherence including age, gender, race, marital status, education and income levels, insurance type, health literacy, cognition, presence of a primary care physician, number of listed discharge medications, prehospital medication adherence, medication understanding, and medication management practices using Pearson 2, Fisher exact, or Wilcoxon rank sum tests as appropriate. Multiple logistic regression with backward elimination was performed to identify independent predictors, selected with P values<0.1. We also evaluated reasons that patients cited for not filling prescriptions. Two‐sided P values<0.05 were considered statistically significant. All analyses were conducted using Stata version 13.1 (StataCorp LP, College Station, TX).
RESULTS
Of 851 patients in the PILL‐CVD study, the present sample includes 341 patients who received the intervention, completed the postdischarge follow‐up call, and had new discharge prescriptions to be filled. This represents 85% of patients who received the intervention.
The mean age of participants was 61.3 years, and 59.5% were male (Table 1). The majority were white (75.1%), and 88% had at least a high school education. Married or cohabitating patients represented 54.3% of the group. Just over half of the patients (54%) had an income of $35K or greater. The primary source of insurance for 82.5% of patients was either Medicare or private insurance, and 7.4% of patients were self‐pay. Most patients (80%) had adequate health literacy. The median Mini‐Cog score was 4 out of 5 (interquartile range [IQR]=35), and 11% of patients had scores indicating cognitive impairment. Just less than one‐fourth of the patients (24.1%) had a Morisky score of 8, indicating high self‐reported adherence, and the median score of patients' understanding of medications (range of 03) was 2.5 (IQR=2.22.8), reflecting relatively high understanding. The median number of prescriptions on patients' discharge medications lists was 10 (IQR=813).
| Variable | Overall 341 (100.0%) | Filled Prescription309 (90.6%) | Did Not Fill 32 (9.4%) | P Value |
|---|---|---|---|---|
| ||||
| Age, y, N (%) | 0.745a | |||
| 1849 | 69 | 63 (91.3) | 6 (8.7) | |
| 5064 | 128 | 114 (89.1) | 14 (10.9) | |
| 65+ | 144 | 132 (91.7) | 12 (8.3) | |
| Gender, N (%) | 0.056a | |||
| Male | 203 | 189 (93.1) | 14 (6.9) | |
| Female | 138 | 120 (87.0) | 18 (13.0) | |
| Race, N (%) | 0.712a | |||
| White | 256 | 234 (91.4) | 22 (8.6) | |
| African American | 60 | 54 (90.0) | 6 (10.0) | |
| Other | 22 | 19 (86.4) | 3 (13.6) | |
| Education, N (%) | 0.054a | |||
| Less than high school | 40 | 32 (80.0) | 8 (20.0) | |
| High school | 99 | 91 (91.9) | 8 (8.1) | |
| 1315 years | 93 | 83 (89.2) | 10 (10.8) | |
| 16 years | 109 | 103 (94.5) | 6 (5.5) | |
| Marital status, N (%) | ||||
| Separated/divorced/widowed/never married | 156 | 135 (86.5) | 21 (13.5) | 0.018a, b |
| Married/cohabitating | 185 | 174 (94.1) | 11 (5.9) | |
| Income, N (%) | 0.040a, b | |||
| <10K<20K | 58 | 48 (82.8) | 10 (17.2) | |
| 20K35K | 86 | 76 (88.4) | 10 (11.6) | |
| 35K<50K | 40 | 36 (90.0) | 4 (10.0) | |
| 50K<75K | 46 | 43 (93.5) | 3 (6.5) | |
| 75K+ | 83 | 81 (97.6) | 2 (2.4) | |
| Primary source of payment, N (%) | 0.272a | |||
| Medicaid | 34 | 28 (82.4) | 6 (17.6) | |
| Medicare | 145 | 131 (90.3) | 14 (9.7) | |
| Private | 132 | 123 (93.2) | 9 (6.8) | |
| Self‐pay | 25 | 22 (88.0) | 3 (12.0) | |
| Primary care physician, N (%) | 1.000c | |||
| None/do not know | 28 | 26 (92.9) | 2 (7.1) | |
| Yes | 313 | 283 (90.4) | 30 (9.6) | |
| Site, N (%) | 0.071a | |||
| Nashville, TN | 172 | 151 (87.8) | 21 (12.2) | |
| Boston, MA | 169 | 158 (93.5) | 11 (6.5) | |
The prevalence of refractory primary nonadherence was 9.4%. In univariate analysis, single marital status, lower income, and having more than 10 total discharge medications were significantly associated with not filling medications (P=0.018, 0.04, 0.016, respectively; Table 1). In multivariable analysis, single marital status and having more than 10 total discharge medications maintained significance when controlling for other patient characteristics. Patients who were single had higher odds of failing to fill discharge prescriptions compared to married or cohabitating individuals (odds ratio [OR]: 2.2, 95% confidence interval [CI]: 1.014.8, P=0.047). Patients with more than 10 discharge medications also had higher odds of failing to fill compared with patients who had fewer total medications (OR: 2.3, 95% CI: 1.054.98, P=0.036).
Filling discharge prescriptions was not associated with health literacy, cognition, prehospital adherence, patients' medication understanding, or any of the surveyed medication management practices (Table 2). Patients' reasons for not filling included lack of time to go to the pharmacy, medications not being delivered or dispensed, or inability to afford prescriptions. Prescription cost was cited by 23.5% of patients who did not fill their prescriptions and provided a reason.
| Variable | Overall 341 (100.0%) | Filled Prescription 309 (90.6%) | Did Not Fill 32 (9.4%) | P Value |
|---|---|---|---|---|
| ||||
| s‐TOFHLA score, range 036, N (%) | 0.443a | |||
| Inadequate, 016 | 40 | 34 (85.0) | 6 (15.0) | |
| Marginal, 1722 | 27 | 25 (92.6) | 2 (7.4) | |
| Adequate, 2336 | 268 | 244 (91.0) | 24 (9.0) | |
| MiniCog score, range 05, N (%) | 0.764b | |||
| Not impaired, 35 | 304 | 276 (90.8) | 28 (9.2) | |
| Impaired, 02 | 37 | 33 (89.2) | 4 (10.8) | |
| Morisky score, range 48, N (%) | 0.517a | |||
| Low/moderate self‐reported adherence, 47 | 249 | 224 (90.0) | 25 (10.0) | |
| High self‐reported adherence, 8 | 79 | 73 (92.4) | 6 (7.6) | |
| No. of discharge medications, range 126, N (%)c | 0.016a | |||
| 010 medications | 186 | 175 (94.1) | 11 (5.9) | |
| 11+medications | 155 | 134 (86.5) | 21 (13.5) | |
| Patient responses to medication behavior questions | ||||
| Patient associates medication taking time with daily events | 253 | 229 (90.5) | 24 (9.5) | 0.913a |
| Patient uses a pillbox to organize medicine | 180 | 162 (90.0) | 18 (10.0) | 0.680a |
| Friends of family help remind patient when it is time to take medicine | 89 | 79 (88.8) | 10 (11.2) | 0.486a |
| Patient writes down instructions for when to take medicine | 60 | 55 (91.7) | 5 (8.3) | 0.758a |
| Patient uses an alarm or a reminder that beeps when it is time to take medicine | 8 | 6 (75.0) | 2 (25.0) | 0.167a |
| Patient marks refill date on calendar | 38 | 35 (92.1) | 3 (7.9) | 1.000b |
| Pharmacy gives or sends patient a reminder when it is time to refill medicine | 94 | 84 (89.4) | 10 (10.6) | 0.624a |
| Friends or family help patient to refill medicine | 60 | 53 (88.3) | 7 (11.7) | 0.504a |
DISCUSSION
Almost 1 in 10 patients hospitalized with cardiovascular disease demonstrated primary nonadherence refractory to an intervention including pharmacist discharge medication counseling. Being unmarried and having greater than 10 medications at discharge were significantly associated with higher primary nonadherence when controlling for other patient factors.
Patients with a cohabitant partner were significantly less likely to exhibit primary nonadherence, which may reflect higher levels of social support, including encouragement for disease self‐management and/or support with tasks such as picking up medications from the pharmacy. Previous research has demonstrated that social support mediates outpatient medication adherence for heart failure patients.[10]
Similar to Jackevicius et al., we found that patients with more medications at discharge were less likely to fill their prescriptions.[1] These findings may reflect the challenges that patients face in adhering to complex treatment plans, which are associated with increased coordination and cost. Conversely, some prior studies have found that patients with fewer prescriptions were less likely to fill.[11, 12] These patients were often younger, thus potentially less conditioned to fill prescriptions, and unlike our cohort, these populations had consistent prescription coverage. Interventions for polypharmacy, which have been shown to improve outcomes and decrease costs, especially in the geriatric population, may be of benefit for primary nonadherence as well.[13]
Additionally, patients with lower household incomes had higher rates of primary nonadherence, at least in univariate analysis. Medication cost and transportation limitations, which are more pronounced in lower‐income patients, likely play influential roles in this group. These findings build on prior literature that has found lower prescription cost to be associated with better medication adherence in a variety of settings.[3, 4, 14]
Because the prevalence of primary nonadherence in this cohort is less than half of historical rates, we suspect the intervention did reduce unintentional nonadherence. However, regimen cost and complexity, transportation challenges, and ingrained medication beliefs likely remained barriers. It may be that a postdischarge phone call is able address unintended primary nonadherence in many cases. Meds to beds programs, where a supply of medications is provided to patients prior to discharge, could assist patients with limited transportation. Prior studies have also found reduced primary nonadherence when e‐prescriptions are utilized.[3]
Establishing outpatient follow‐up at discharge provides additional opportunities to address unanticipated adherence barriers. Because the efficacy of any adherence intervention depends on individual patient barriers, we recommend combining medication counseling with a targeted approach for patient‐specific needs.
We note several limitations to our study. First, because we studied primary nonadherence that persisted despite an intervention, this cohort likely underestimates the prevalence of primary nonadherence and alters the associated patient characteristics found in routine practice (although counseling is becoming more common). Second, patient reporting is subject to biases that underestimate nonadherence, although this approach has been validated previously.[15] Third, our outcome measure was unable to capture the spectrum of non‐adherence that could provide a more nuanced look at predictors of postdischarge nonadherence. Fourth, we did not have patient copayment data to better characterize whether out of pocket costs or pharmacologic classes drove nonadherence. Finally, sample size may have limited the detection of other important factors, and the university setting may limit generalizability to cardiovascular patients in other practice environments. Future research should focus on intervention strategies that assess patients' individual adherence barriers for a targeted or multimodal approach to improve adherence.
In conclusion, we found a prevalence of primary nonadherence of almost 1 in 10 patients who received pharmacist counseling. Nonadherence was associated with being single and those discharged with longer medication lists. Our results support existing literature that primary nonadherence is a significant problem in the postdischarge setting and substantiate the need for ongoing efforts to study and implement interventions for adherence after hospital discharge.
Disclosures
This material is based on work supported by the Office of Academic Affiliations, Department of Veterans Affairs, Veterans Affairs National Quality Scholars Program, and with use of facilities at Veterans Affairs Tennessee Valley Healthcare System, Nashville, Tennessee (Dr. Wooldridge). The funding agency supported the work indirectly through provision of salary support and training for the primary author, but had no specific role in the design and conduct of the study; collection, management, analysis, and interpretation of the data; preparation, review, or approval of the manuscript; or decision to submit the manuscript for publication. This work was also supported by R01 HL089755 (Dr. Kripalani) and in part by K23 HL077597 (Dr. Kripalani), K08 HL072806 (Dr. Schnipper), and the Center for Clinical Quality and Implementation Research at Vanderbilt University Medical Center. A preliminary version of this research was presented at the AcademyHealth Annual Research Meeting, June 16, 2015, Minneapolis, Minnesota. The authors report the following potential conflicts of interest: Jeffrey Schnipper: PI, investigator‐initiated study funded by Sanofi‐Aventis to develop, implement, and evaluate a multifaceted intervention to improve transitions of care in patients with diabetes mellitus discharged on insulin. Robert Dittus: passive co‐owner, Medical Decision Modeling, Inc.; Bayer HealthCare. One‐day consultation and panelist on educational video for population health (consultant fee); GlaxoSmithKline. One‐day consultant for population health, envisioning the future (consultant fee). Sunil Kripalani: Bioscape Digital, stock ownership
- , , . Prevalence, predictors, and outcomes of primary nonadherence after acute myocardial infarction. Circulation. 2008;117(8):1028–1036.
- , , , . Primary medication non‐adherence after discharge from a general internal medicine service. PloS One. 2013;8(5):e61735.
- , , , et al. Trouble getting started: predictors of primary medication nonadherence. Am J Med. 2011;124(11):1081.e9–22.
- , , , , . The incidence and determinants of primary nonadherence with prescribed medication in primary care: a cohort study. Ann Intern Med. 2014;160(7):441–450.
- , , , et al. Effect of a pharmacist intervention on clinically important medication errors after hospital discharge: a randomized trial. Ann Intern Med. 2012;157(1):1–10.
- , , , . Short Test of Functional Health Literacy in Adults. Snow Camp, NC: Peppercorn Books and Press; 1998.
- , , , , . Simplifying detection of cognitive impairment: comparison of the Mini‐Cog and Mini‐Mental State Examination in a multiethnic sample. J Am Geriatr Soc. 2005;53(5):871–874.
- , , . Concurrent and predictive validity of a self‐reported measure of medication adherence. Med Care. 1986;24(1):67–74.
- , , , , , . Health literacy and medication understanding among hospitalized adults. J Hosp Med. 2011;6(9):488–493.
- , , , , , . Medication adherence, social support, and event‐free survival in patients with heart failure. Health Psychol. 2013;32(6):637–646.
- , , , , , . Effect of patient comorbidities on filling of antihypertensive prescriptions. Am J Manag Care. 2009;15(1):24–30.
- , , , et al. Primary nonadherence to statin medications in a managed care organization. J Manag Care Pharm. 2013;19(5):367–373.
- , , , et al. Reducing cost by reducing polypharmacy: the polypharmacy outcomes project. J Am Med Dir Assoc. 2012;13(9):818.e811–815.
- , , , et al. The epidemiology of prescriptions abandoned at the pharmacy. Ann Intern Med. 2010;153(10):633–640.
- , , , , , . Can simple clinical measurements detect patient noncompliance? Hypertension. 1980;2(6):757–764.
Improving medication safety during hospital-based transitions of care
Any time patients enter or leave the hospital, they risk being harmed by errors in their medications.1 Adverse events from medication errors during transitions of care are common but often preventable. One key approach is to systematically review every patient’s medication list on admission and discharge and resolve any discrepancies. These transitions are also an opportunity to address other medication-related problems, such as adherence, drug interactions, and clinical appropriateness.
This article summarizes the types and prevalence of medication problems that occur during hospital-based transitions of care, and suggests strategies to decrease the risk of medication errors, focusing on medication reconciliation and related interventions that clinicians can use at the bedside to improve medication safety.
DEFINING TERMS
A medication discrepancy is any variance noted in a patient’s documented medication regimen across different medication lists or sites of care. While some differences reflect intentional and clinically appropriate changes to the regimen, others are unintentional and reflect inaccurate or incomplete information. These unintentional discrepancies are medication errors.
Depending on the clinical circumstances and medications involved, such errors may lead to an adverse drug event (ADE), defined as actual harm or injury resulting from a medication. Sometimes a medication error does not cause harm immediately but could if left uncorrected; this is called a potential ADE.
An important goal during transitions of care is to reduce unintentional medication discrepancies, thereby reducing potential and actual ADEs.
ERRORS ARISE AT DISCHARGE—AND EVEN MORE AT ADMISSION
Hospital discharge is a widely recognized transition in which patient harm occurs. As many as 70% of patients may have an unintentional medication discrepancy at hospital discharge, with many of those discrepancies having potential for harm.2 Indeed, during the first few weeks after discharge, 50% of patients have a clinically important medication error,3 and 20% experience an adverse event, most commonly an ADE.4 ADEs are associated with excess health care utilization,5–7 and many are preventable through strategies such as medication reconciliation.5,8
Importantly, more errors arise at hospital admission than at other times.9,10
Errors in medication histories are the most common source of discrepancies, affecting up to two-thirds of admitted patients.11,12 More than one-quarter of hospital prescribing errors can be attributed to incomplete medication histories at the time of admission,13 and nearly three times as many clinically important medication discrepancies are related to history-taking errors on admission rather than reconciliation errors at discharge.9
Most discrepancies occurring at the time of admission have the potential to cause harm, particularly if the errors persist beyond discharge.14 Therefore, taking a complete and accurate medication history on hospital admission is critical to ensuring safe care transitions.
MEDICATION RECONCILIATION: BARRIERS AND FACILITATORS
Medication reconciliation is a strategy for reducing medication discrepancies in patients moving across care settings. Simply put, it is the process by which a patient’s medication list is obtained, compared, and clarified across different sites of care.15 It has consistently been shown to decrease medication errors compared with usual care,16 and it is strongly supported by national and international organizations.17–21
In clinical practice, many physicians and institutions have found medication reconciliation difficult to implement, owing to barriers at the level of the patient, provider, and system (Table 1). In response to these challenges, two initiatives have synthesized best practices and offer toolkits that hospitals and clinicians can use: the Medications at Transitions and Clinical Handoffs (MATCH) program22 and the Multi-Center Medication Reconciliation Quality Improvement Study (MARQUIS).23
Lack of resources is a widely acknowledged challenge. Thus, the MARQUIS investigators23 suggested focusing on the admission history, where most errors occur, and applying the most resource-intensive interventions in patients at highest risk of ADEs, ie, those who are elderly, have multiple comorbid conditions, or take numerous medications.16
Although the risk of an ADE increases with the number of medications a patient takes,4 the exact number of drugs that defines high risk has not been well established. Targeting patients who take 10 or more maintenance medications is a reasonable initial approach,24 but institutions should tailor risk stratification to their patient populations and available resources. Patients taking high-risk medications such as anticoagulants and insulin could also be prioritized for review, since these medications are more likely to cause serious patient harm when used without appropriate clinical oversight.7
Using pharmacy staff to perform medication history-taking, reconciliation, and patient counseling has been shown to produce favorable patient outcomes, particularly for higher-risk patients.16,23
The MARQUIS investigators found they could boost the chances of success by sharing stories of patient harm to foster “buy-in” among frontline staff, providing formal training to clinicians on how to take a medication history, and obtaining the support of nursing leaders to champion improvement efforts.23
Additionally, patients should be empowered to maintain an accurate medication list. We address strategies for improving patient engagement and adherence in a later section.
BEST PRACTICES FOR IMPROVING MEDICATION SAFETY
Medication reconciliation is one of several measures necessary to optimize medication safety during transitions of care. It typically includes the following actions:
- Interview the patient or caregiver to determine the list of medications the patient is currently taking (or supposed to be taking); consult other sources if needed.
- List medications that are being ordered during the clinical encounter.
- Compare these two lists, making note of medications that are stopped, changed, or newly prescribed.
- Resolve any discrepancies.
- Communicate the reconciled list to the patient, appropriate caregivers, and providers of follow-up care.
At a rudimentary level, medication reconciliation encompasses medication list management along the continuum of care. However, we recommend leveraging medication reconciliation as an opportunity to further enhance medication safety by reviewing the appropriateness of each medication, seizing opportunities to streamline or simplify the regimen, assessing patient and caregiver understanding of medication instructions and potential ADEs, and delivering appropriate counseling to enhance medication use. Table 2 outlines our framework for medication management during hospital-based transitions.
STEP 1: OBTAIN A COMPLETE PREADMISSION MEDICATION LIST
The “best-possible medication history” is obtained in a systematic process of interviewing the patient or caregiver plus reviewing at least one other reliable source.23 The resulting list should include all medications the patient is taking (prescription and nonprescription), doses, directions for use, formulations if applicable, indications, start and stop dates, and medication allergies and reactions.
Review existing information. Before eliciting a history from the patient, review his or her recorded medical history and existing medication lists (eg, prior discharge summaries, records from other facilities, records from outpatient visits, pharmacy fill data). This will provide context about the regimen and help identify issues and questions that can be addressed during the history-taking.
Ask open-ended questions. Instead of just asking the patient to confirm the accuracy of the existing medication list, we recommend actively obtaining the full medication list from the patient or caregiver. The conversation should begin with an open-ended question such as, “What medications do you take at home?” This approach will also allow the clinician to gauge the patient’s level of understanding of each medication’s indication and dosing instructions. Using a series of prompts such as those recommended in Table 3 will elicit a best-possible medical history, while verifying all of the medications on the existing list.
Clarify discrepancies. Resolve differences between the existing medication lists and the patient’s or caregiver’s report during the preadmission interview. Examples include errors of omission (a medication is missing), errors of commission (an additional medication is present), and discrepancies in the strength, formulation, dosing instructions, and indications for the drugs. If necessary, other sources of information should be consulted, such as the patient’s medication bottles, pharmacy or pharmacies, primary care physician, and a family member or caregiver.
Assess adherence. The extent to which patients take their medications as directed is an important component of the history, but is often left out. Medication nonadherence rates in the United States are 40% to 70%,25 contributing to poor patient outcomes and imposing extraordinary costs on the health care system.26
Asking open-ended, nonjudgmental questions at the time of hospital admission will help to uncover medication-taking behaviors as well as barriers to adherence (Table 3). The patient’s responses should be taken into account when determining the treatment plan.
Document your findings. After completing the medication history and clarifying discrepancies, document the preadmission list in the medical record. All members of the health care team should have access to view and update the same list, as new information about the preadmission medications may be uncovered after the initial history.
Make clinical decisions. Complete the admission medication reconciliation by deciding whether each medication on the list should be continued, changed, held, or discontinued on the basis of the patient’s clinical condition. Well-designed information technology applications enable the provider to document each action and the rationale for it, as well as carry that information into the order-entry system. Medications marked as held or discontinued on admission should be revisited as the patient’s clinical condition changes and at discharge.
STEP 2: AVOID RECONCILIATION ERRORS
Reconciliation errors reflect discrepancies between the medication history and the medications that are ordered after admission.
Reconciliation errors are less common than medication history errors, accounting for approximately one-third of potentially harmful medication errors in hospitalized medical patients.9 These include errors of omission (a medication is omitted from the orders), errors of commission (a medication is prescribed with no indication for continuation), and therapeutic duplication.
Preventing errors of omission
Medications are often held at transition points for appropriate clinical reasons. Examples include holding anticoagulants and antiplatelet agents in patients who have gastrointestinal bleeding or an upcoming procedure, antihypertensives in patients with hemodynamic instability, and other chronic medications in patients with an acute illness.
Poor documentation and communication of these decisions can lead to a failure to resume the medications—an error of omission—at hospital discharge.
Hospitalized patients are at risk of unintentional discontinuation of their chronic medications, including antiplatelet drugs, anticoagulants, statins, and thyroid replacement, particularly if admitted to the intensive care unit.12 These errors can be minimized by a standardized medication reconciliation process at each transition and clear documentation of the medication plan.
Communication among providers can be improved if the admitting clinician documents clearly whether each preadmission medication is being continued, changed, or stopped, along with the reason for doing so, and makes this information available throughout the hospital stay. Upon transfer to another unit and at discharge, the physician should review each; preadmission medication that was held and the patient’s current clinical status and, based on that information, decide whether medications that were held should be resumed. If a medication will be restarted later, specific instructions should be documented and communicated to the patient and the physicians who are taking over his or her care.
Preventing errors of commission
Failure to perform a complete reconciliation at each transition of care and match each medication with an appropriate indication can lead to errors of commission.
One study showed that 44% of patients were prescribed at least one unnecessary drug at hospital discharge, one-fourth of which were started during the hospitalization.27 Commonly prescribed unnecessarily were gastrointestinal agents, central nervous system drugs, nutrients, and supplements.
It is critical to assess each medication’s ongoing need, appropriateness, and risk-benefit ratio at every transition. Medications no longer indicated should be discontinued in order to simplify the regimen, avoid unnecessary drug exposure, and prevent ADEs.
For example, proton pump inhibitors or histamine 2 receptor blockers are often started in the hospital for stress ulcer prophylaxis. One-third of patients are then discharged home on the medication, and 6 months later half of those patients are still taking the unnecessary drug.28 This situation can be avoided by limiting use of these medications to appropriate circumstances, clearly marking the indication as stress ulcer prophylaxis (as opposed to an ongoing condition that will require continuing it after discharge), and discontinuing the agent when appropriate.
All drugs, even common and seemingly benign ones, carry some risk and should be discontinued when no longer needed. Thus, medications added during the hospitalization to control acute symptoms should also be reviewed at each transition to prevent inappropriate continuation when symptoms have resolved.
One study, for example, found that many patients were discharged with inappropriate prescriptions for atypical antipsychotics after receiving them in the intensive care unit, likely for delirium.29 Documenting that an acute issue such as delirium has resolved should prompt the discontinuation of therapy.
Preventing therapeutic duplication
Therapeutic duplication occurs in about 8% of discharges.1 These errors often result from formulary substitutions or altering the dosage form in the acute setting. For example, patients who receive a prescription for the substituted agent at discharge and also resume their prehospitalization medications end up with duplicate therapy.
Therapeutic substitution is common at the time of admission to the hospital as a result of formulary restrictions. Drug classes that are frequently substituted include statins, antihypertensives, urinary antispasmodics, and proton pump inhibitors. Physicians should be familiar with the preferred agents on the hospital formulary and make careful note when a substitution occurs. Furthermore, hospital systems should be developed to remind the physician to switch back to the outpatient medication at discharge.
Similar problems occur when home medications are replaced with different dosage forms with different pharmacokinetic properties. For example, a long-acting medication may be temporarily replaced with an intravenous solution or immediate-release tablet for several reasons, including nothing-by-mouth status, unstable clinical condition, need for titration, and need to crush the tablet to give the drug per tube. The differing formulations must be reconciled throughout the patient’s hospital course and at discharge to avoid therapeutic duplication and serious medication errors. Deliberate changes to the dosage form should be clearly communicated in the discharge medication list so that patients and other clinicians are aware.
Hospital systems should also have the capability to identify duplications in the medication list and to warn prescribers of these errors. The ability to group medications by drug class or sort the medication list alphabetically by generic name can help uncover duplication errors.
STEP 3: REVIEW THE LIST IN VIEW OF THE CLINICAL PICTURE
Transitions of care should prompt providers to review the medication list for possible drug-disease interactions, confirm compliance with evidence-based guidelines, and evaluate the risks and benefits of each medication in the context of the patient’s age and acute and chronic medical issues. This is also an opportunity to screen the full list for potentially inappropriate medications and high-alert drugs such as insulin or anticoagulants, which are more likely than other drugs to cause severe harm when used in error.
Acute kidney injury. New drug-disease interactions can arise during a hospitalization and can affect dosing and the choice of drug. The onset of acute kidney injury, for example, often necessitates adjusting or discontinuing nephrotoxic and renally excreted medications. ADEs or potential ADEs have been reported in 43% of hospitalized patients with acute kidney injury.30
Because acute kidney injury is often transient, medications may need to be held or adjusted several times until renal function stabilizes. This can be challenging across the continuum of care and requires close monitoring of the serum creatinine level and associated drug doses and levels, if applicable. Well-designed clinical decision support tools can integrate laboratory data and alert the prescriber to a clinically important increase or decrease in serum creatinine that may warrant a change in therapy. Modifications to the regimen and a plan for timely follow-up of the serum creatinine level should be clearly documented in the discharge plan.
Liver disease. Similar attention should be given to drugs that are hepatically metabolized if a patient has acute or chronic liver impairment.
Geriatric patients, particularly those who present with altered mental status, falls, or urinary retention, should have their medication list reviewed for potentially inappropriate medications, which are drugs that pose increased risk of poor outcomes in older adults.31,32 Patients and providers may have been willing to accept the risk of medications such as anticholinergics or sedative-hypnotics when the drugs were initiated, but circumstances can change over time, especially in this patient population. Hospitalization is a prime opportunity to screen for medications that meet the Beers criteria31 for agents to avoid or use with caution in older adults.
As-needed medications. Medications prescribed on an as-needed basis in the hospital should be reviewed for continuation or discontinuation at discharge. How often the medication was given can inform this decision.
For example, if as-needed opioids were used frequently, failure to develop a plan of care for pain can lead to persistent symptoms and, possibly, to readmission.33,34 Similar scenarios occur with use of as-needed blood pressure medications, laxatives, and correction-dose insulin.
If an as-needed medication was used consistently during hospitalization, the physician should consider whether a regularly scheduled medication is needed. Conversely, if the medication was not used during the inpatient admission, it can likely be discontinued.
STEP 4: PREPARE THE PATIENT AND FOLLOW-UP PROVIDER
Once a clinician has performed medication reconciliation, including obtaining a best-possible medical history and carefully reviewing the medication list and orders for errors and clinical appropriateness, the next steps are to ensure the patient understands what he or she needs to do and to confirm that suitable follow-up plans are in place. These measures should be taken at all transitions of care but are critically important at hospital discharge.
Preparing the patient and caregiver
An accurate, reconciled medication list should be given to the patient, caregiver, or both, and should be reviewed before discharge.17
Approximately one-third of Americans have low health literacy skills, so medication lists and associated materials should be easy to understand.35 Medication lists should be written in plain language and formatted for optimal readability (Table 4), clearly stating which medications to continue, change, hold temporarily, and stop.
Patients recall and comprehend about half of the information provided during a medical encounter.36 Thus, medication teaching should focus on key points including changes or additions to the regimen, specific instructions for follow-up and monitoring, and how to handle common and serious side effects.
To confirm patient understanding, clinicians should use “teach-back,” ie, provide the patient with information and then ask him or her to repeat back key points.37,38 The patient and family should also be encouraged to ask questions before discharge.
If not already addressed during the hospital stay, barriers to medication adherence and ability to obtain the medications should be attended to at this time (Table 5). Also, the plan to pick up the medications should be verified with the patient and caregiver. Verify that there is transportation to a particular pharmacy that is open at the time of discharge, and that the patient can afford the medications.
Ensuring appropriate follow-up
Studies have shown that timely in-home or telephone follow-up after discharge can decrease adverse events and postdischarge health care utilization.39,40 Telephone follow-up that includes thorough medication reconciliation can help detect and resolve medication issues early after discharge and can close gaps related to monitoring and follow-up.
Medication reconciliation by telephone can be time-consuming. Depending on the number of medications that need to be reviewed, calls can take between 10 and 60 minutes. Postdischarge phone calls should be performed by clinical personnel who are able to identify medication-related problems. A pharmacist should be an available resource to assist with complex regimens, to help resolve medication discrepancies, and to address patient concerns. Table 6 provides tips for conducting follow-up phone calls.
Resolving discrepancies identified during follow-up calls can be difficult, as changes to the medication regimen are often not communicated effectively to other members of the care team. Physicians should document the complete medication list and plan in the discharge summary, and there should be a method for the caller to record updates to the medication list in the medical record so that they are apparent at the outpatient follow-up visit.
An additional challenge is that it is frequently unclear which physician “owns” which medications. Therefore, designating a contact person for each medication until follow-up can be very valuable. At a minimum, a “physician owner” for high-alert medications such as insulin, anticoagulants, and diuretics should be identified to provide close follow-up, titration, and monitoring.
There should also be a plan for the patient to obtain refills of essential long-term medications, such as antiplatelet agents following stent placement.
SUMMARY AND RECOMMENDATIONS
Medication-related problems during hospital admission and discharge are common and range from minor discrepancies in the medication list to errors in history-taking, prescribing, and reconciliation that can lead to potential or actual patient harm. Putting systems in place to facilitate medication reconciliation can decrease the occurrence of medication discrepancies and ADEs, thereby improving patient safety during these critical transitions between care settings and providers. Institutional medication reconciliation programs should focus resources on the admission history-taking step, target the highest-risk patients for the most intensive interventions, and involve pharmacy personnel when possible.
On an individual level, clinicians can incorporate additional interventions into their workflows to optimize medication safety for hospitalized patients. Using a structured approach to obtain a complete and accurate medication list at the time of hospital admission will help providers identify medication-related problems and prevent the propagation of errors throughout the hospital stay and at discharge. Focusing additional time and effort on a comprehensive review of the medication list for errors of omission and commission, patient-specific needs, and high-alert drugs will further decrease the risk of medication errors. Finally, providing discharge counseling targeting patient barriers to adherence and ensuring a proper handover of medication information and rationale for medication changes to outpatient providers will improve the chances of a safe transition.
- Coleman EA, Smith JD, Raha D, Min SJ. Posthospital medication discrepancies: prevalence and contributing factors. Arch Intern Med 2005; 165:1842–1847.
- Wong JD, Bajcar JM, Wong GG, et al. Medication reconciliation at hospital discharge: evaluating discrepancies. Ann Pharmacother 2008; 42:1373–1379.
- Kripalani S, Roumie CL, Dalal AK, et al; PILL-CVD (Pharmacist Intervention for Low Literacy in Cardiovascular Disease) Study Group. Effect of a pharmacist intervention on clinically important medication errors after hospital discharge: a randomized trial. Ann Intern Med 2012; 157:1-10.
- Forster AJ, Murff HJ, Peterson JF, Gandhi TK, Bates DW. The incidence and severity of adverse events affecting patients after discharge from the hospital. Ann Intern Med 2003; 138:161–167.
- Forster AJ, Murff HJ, Peterson JF, Gandhi TK, Bates DW. Adverse drug events occurring following hospital discharge. J Gen Intern Med 2005; 20:317–323.
- Johnson JA, Bootman JL. Drug-related morbidity and mortality. A cost-of-illness model. Arch Intern Med 1995; 155:1949–1956.
- Budnitz DS, Lovegrove MC, Shehab N, Richards CL. Emergency hospitalizations for adverse drug events in older Americans. N Engl J Med 2011; 365:2002–2012.
- Bates DW, Boyle DL, Vander Vliet MB, Schneider J, Leape L. Relationship between medication errors and adverse drug events. J Gen Intern Med 1995;10:199–205.
- Pippins JR, Gandhi TK, Hamann C, et al. Classifying and predicting errors of inpatient medication reconciliation. J Gen Intern Med 2008; 23:1414–1422.
- Lau HS, Florax C, Porsius AJ, De Boer A.The completeness of medication histories in hospital medical records of patients admitted to general internal medicine wards. Br J Clin Pharmacol 2000; 49:597–603.
- Tam VC, Knowles SR, Cornish PL, Fine N, Marchesano R, Etchells EE. Frequency, type and clinical importance of medication history errors at admission to hospital: a systematic review. CMAJ 2005; 173:510–515.
- Bell CM, Brener SS, Gunraj N, et al. Association of ICU or hospital admission with unintentional discontinuation of medications for chronic diseases. JAMA 2011; 306:840–847.
- Dobranski S, Hammond I, Khan G, Holdsworth H. The nature of hospital prescribing errors. Br J Clin Governance 2002; 7:187–193.
- Gleason KM, Groszek JM, Sullivan C, Rooney D, Barnard C, Noskin GA. Reconciliation of discrepancies in medication histories and admission orders of newly hospitalized patients. Am J Health Syst Pharm 2004; 61:1689–1695.
- Rozich JD, Resar KR. Medication safety: one organization’s approach to the challenge. J Clin Outcomes Manage 2001; 8:27–34.
- Mueller SK, Sponsler KC, Kripalani S, Schnipper JL. Hospital-based medication reconciliation practices: a systematic review. Arch Intern Med 2012; 172:1057–1069.
- Joint Commission. Using medication reconciliation to prevent errors. Sentinel Event Alert 2006, Issue 35. www.jointcommission.org/assets/1/18/SEA_35.pdf. Accessed March 31, 2015.
- Greenwald JL, Halasyamani L, Greene J, et al. Making inpatient medication reconciliation patient centered, clinically relevant and implementable: a consensus statement on key principles and necessary first steps. J Hosp Med 2010; 5:477–485.
- Berwick DM, Calkins DR, McCannon CJ, Hackbarth AD. The 100,000 lives campaign: setting a goal and a deadline for improving health care quality. JAMA 2006; 295:324–327.
- McCannon CJ, Hackbarth AD, Griffin FA. Miles to go: an introduction to the 5 Million Lives Campaign. Jt Comm J Qual Patient Saf 2007; 33:477–484.
- Leotsakos A, Caisley L, Karga M, Kelly E, O’Leary D, Timmons K. High 5s: addressing excellence in patient safety. World Hosp Health Serv 2009; 45:19–22.
- Gleason KM, Brake H, Agramonte V, Perfetti C. Medications at Transitions and Clinical Handoffs (MATCH) Toolkit for Medication Reconciliation. www.ahrq.gov/professionals/quality-patient-safety/patient-safety-resources/resources/match/match.pdf. Accessed March 31, 2015.
- Mueller SK, Kripalani S, Stein J, et al. A toolkit to disseminate best practices in inpatient medication reconciliation: multi-center medication reconciliation quality improvement study (MARQUIS). Jt Comm J Qual Patient Saf 2013; 39:371–382.
- Pal A, Babbott S, Wilkinson ST. Can the targeted use of a discharge pharmacist significantly decrease 30-day readmissions? Hosp Pharm 2013; 48:380–388.
- Claxton AJ, Cramer J, Pierce C. A systematic review of the associations between dose regimens and medication compliance. Clin Ther 2001; 23:1296–1310.
- Osterberg L, Blaschke T. Adherence to medication. N Engl J Med 2005; 353:487–497.
- Hajjar ER, Hanlon JT, Sloane RJ, et al. Unnecessary drug use in frail older people at hospital discharge. J Am Geriatr Soc 2005; 53:1518–1523.
- Zink DA, Pohlman M, Barnes M, Cannon ME. Long-term use of acid suppression started inappropriately during hospitalization. Aliment Pharmacol Ther 2005; 21:1203–1209.
- Morandi A, Vasilevskis E, Pandharipande PP, et al. Inappropriate medication prescriptions in elderly adults surviving an intensive care unit hospitalization. J Am Geriatr Soc 2013; 61:1128–1134.
- Cox ZL, McCoy AB, Matheny ME, et al. Adverse drug events during AKI and its recovery. Clin J Am Soc Nephrol 2013; 8:1070–1078.
- American Geriatrics Society 2012 Beers Criteria Update Expert Panel. American Geriatrics Society updated Beers Criteria for potentially inappropriate medication use in older adults. J Am Geriatr Soc 2012; 60:616–631.
- Gallagher P, O’Mahony D. STOPP (Screening Tool of Older Persons’ potentially inappropriate Prescriptions): application to acutely ill elderly patients and comparison with Beers’ criteria. Age Ageing 2008; 37:673–679.
- Tjia J, Bonner A, Briesacher BA, McGee S, Terrill E, Miller K. Medication discrepancies upon hospital to skilled nursing facility transitions. J Gen Intern Med 2009; 24:630–635.
- Boockvar K, Fishman E, Kyriacou CK, Monias A, Gavi S, Cortes T. Adverse events due to discontinuations in drug use and dose changes in patients transferred between acute and long-term care facilities. Arch Intern Med 2004; 164:545–550.
- Kutner M, Greenberg E, Jin Y, Paulsen C. The Health Literacy of America’s Adults: Results From the 2003 National Assessment of Adult Literacy. http://nces.ed.gov/pubs2006/2006483_1.pdf. Accessed March 31, 2015.
- Crane JA. Patient comprehension of doctor-patient communication on discharge from the emergency department. J Emerg Med 1997; 15:1–7.
- DeWalt DA, Callahan LF, Hawk VH, et al. Health Literacy Universal Precautions Toolkit. www.ahrq.gov/qual/literacy/healthliteracytoolkit.pdf. Accessed March 31, 2015.
- Schillinger D, Piette J, Grumbach K, et al. Closing the loop: physician communication with diabetic patients who have low health literacy. Arch Intern Med 2003; 163:83–90.
- Coleman EA, Parry C, Chalmers S, Min SJ. The care transitions intervention: results of a randomized controlled trial. Arch Intern Med 2006; 166:1822–1828.
- Jack BW, Chetty VK, Anthony D, et al. A reengineered hospital discharge program to decrease rehospitalization: a randomized trial. Ann Intern Med 2009; 150:178–187.
Any time patients enter or leave the hospital, they risk being harmed by errors in their medications.1 Adverse events from medication errors during transitions of care are common but often preventable. One key approach is to systematically review every patient’s medication list on admission and discharge and resolve any discrepancies. These transitions are also an opportunity to address other medication-related problems, such as adherence, drug interactions, and clinical appropriateness.
This article summarizes the types and prevalence of medication problems that occur during hospital-based transitions of care, and suggests strategies to decrease the risk of medication errors, focusing on medication reconciliation and related interventions that clinicians can use at the bedside to improve medication safety.
DEFINING TERMS
A medication discrepancy is any variance noted in a patient’s documented medication regimen across different medication lists or sites of care. While some differences reflect intentional and clinically appropriate changes to the regimen, others are unintentional and reflect inaccurate or incomplete information. These unintentional discrepancies are medication errors.
Depending on the clinical circumstances and medications involved, such errors may lead to an adverse drug event (ADE), defined as actual harm or injury resulting from a medication. Sometimes a medication error does not cause harm immediately but could if left uncorrected; this is called a potential ADE.
An important goal during transitions of care is to reduce unintentional medication discrepancies, thereby reducing potential and actual ADEs.
ERRORS ARISE AT DISCHARGE—AND EVEN MORE AT ADMISSION
Hospital discharge is a widely recognized transition in which patient harm occurs. As many as 70% of patients may have an unintentional medication discrepancy at hospital discharge, with many of those discrepancies having potential for harm.2 Indeed, during the first few weeks after discharge, 50% of patients have a clinically important medication error,3 and 20% experience an adverse event, most commonly an ADE.4 ADEs are associated with excess health care utilization,5–7 and many are preventable through strategies such as medication reconciliation.5,8
Importantly, more errors arise at hospital admission than at other times.9,10
Errors in medication histories are the most common source of discrepancies, affecting up to two-thirds of admitted patients.11,12 More than one-quarter of hospital prescribing errors can be attributed to incomplete medication histories at the time of admission,13 and nearly three times as many clinically important medication discrepancies are related to history-taking errors on admission rather than reconciliation errors at discharge.9
Most discrepancies occurring at the time of admission have the potential to cause harm, particularly if the errors persist beyond discharge.14 Therefore, taking a complete and accurate medication history on hospital admission is critical to ensuring safe care transitions.
MEDICATION RECONCILIATION: BARRIERS AND FACILITATORS
Medication reconciliation is a strategy for reducing medication discrepancies in patients moving across care settings. Simply put, it is the process by which a patient’s medication list is obtained, compared, and clarified across different sites of care.15 It has consistently been shown to decrease medication errors compared with usual care,16 and it is strongly supported by national and international organizations.17–21
In clinical practice, many physicians and institutions have found medication reconciliation difficult to implement, owing to barriers at the level of the patient, provider, and system (Table 1). In response to these challenges, two initiatives have synthesized best practices and offer toolkits that hospitals and clinicians can use: the Medications at Transitions and Clinical Handoffs (MATCH) program22 and the Multi-Center Medication Reconciliation Quality Improvement Study (MARQUIS).23
Lack of resources is a widely acknowledged challenge. Thus, the MARQUIS investigators23 suggested focusing on the admission history, where most errors occur, and applying the most resource-intensive interventions in patients at highest risk of ADEs, ie, those who are elderly, have multiple comorbid conditions, or take numerous medications.16
Although the risk of an ADE increases with the number of medications a patient takes,4 the exact number of drugs that defines high risk has not been well established. Targeting patients who take 10 or more maintenance medications is a reasonable initial approach,24 but institutions should tailor risk stratification to their patient populations and available resources. Patients taking high-risk medications such as anticoagulants and insulin could also be prioritized for review, since these medications are more likely to cause serious patient harm when used without appropriate clinical oversight.7
Using pharmacy staff to perform medication history-taking, reconciliation, and patient counseling has been shown to produce favorable patient outcomes, particularly for higher-risk patients.16,23
The MARQUIS investigators found they could boost the chances of success by sharing stories of patient harm to foster “buy-in” among frontline staff, providing formal training to clinicians on how to take a medication history, and obtaining the support of nursing leaders to champion improvement efforts.23
Additionally, patients should be empowered to maintain an accurate medication list. We address strategies for improving patient engagement and adherence in a later section.
BEST PRACTICES FOR IMPROVING MEDICATION SAFETY
Medication reconciliation is one of several measures necessary to optimize medication safety during transitions of care. It typically includes the following actions:
- Interview the patient or caregiver to determine the list of medications the patient is currently taking (or supposed to be taking); consult other sources if needed.
- List medications that are being ordered during the clinical encounter.
- Compare these two lists, making note of medications that are stopped, changed, or newly prescribed.
- Resolve any discrepancies.
- Communicate the reconciled list to the patient, appropriate caregivers, and providers of follow-up care.
At a rudimentary level, medication reconciliation encompasses medication list management along the continuum of care. However, we recommend leveraging medication reconciliation as an opportunity to further enhance medication safety by reviewing the appropriateness of each medication, seizing opportunities to streamline or simplify the regimen, assessing patient and caregiver understanding of medication instructions and potential ADEs, and delivering appropriate counseling to enhance medication use. Table 2 outlines our framework for medication management during hospital-based transitions.
STEP 1: OBTAIN A COMPLETE PREADMISSION MEDICATION LIST
The “best-possible medication history” is obtained in a systematic process of interviewing the patient or caregiver plus reviewing at least one other reliable source.23 The resulting list should include all medications the patient is taking (prescription and nonprescription), doses, directions for use, formulations if applicable, indications, start and stop dates, and medication allergies and reactions.
Review existing information. Before eliciting a history from the patient, review his or her recorded medical history and existing medication lists (eg, prior discharge summaries, records from other facilities, records from outpatient visits, pharmacy fill data). This will provide context about the regimen and help identify issues and questions that can be addressed during the history-taking.
Ask open-ended questions. Instead of just asking the patient to confirm the accuracy of the existing medication list, we recommend actively obtaining the full medication list from the patient or caregiver. The conversation should begin with an open-ended question such as, “What medications do you take at home?” This approach will also allow the clinician to gauge the patient’s level of understanding of each medication’s indication and dosing instructions. Using a series of prompts such as those recommended in Table 3 will elicit a best-possible medical history, while verifying all of the medications on the existing list.
Clarify discrepancies. Resolve differences between the existing medication lists and the patient’s or caregiver’s report during the preadmission interview. Examples include errors of omission (a medication is missing), errors of commission (an additional medication is present), and discrepancies in the strength, formulation, dosing instructions, and indications for the drugs. If necessary, other sources of information should be consulted, such as the patient’s medication bottles, pharmacy or pharmacies, primary care physician, and a family member or caregiver.
Assess adherence. The extent to which patients take their medications as directed is an important component of the history, but is often left out. Medication nonadherence rates in the United States are 40% to 70%,25 contributing to poor patient outcomes and imposing extraordinary costs on the health care system.26
Asking open-ended, nonjudgmental questions at the time of hospital admission will help to uncover medication-taking behaviors as well as barriers to adherence (Table 3). The patient’s responses should be taken into account when determining the treatment plan.
Document your findings. After completing the medication history and clarifying discrepancies, document the preadmission list in the medical record. All members of the health care team should have access to view and update the same list, as new information about the preadmission medications may be uncovered after the initial history.
Make clinical decisions. Complete the admission medication reconciliation by deciding whether each medication on the list should be continued, changed, held, or discontinued on the basis of the patient’s clinical condition. Well-designed information technology applications enable the provider to document each action and the rationale for it, as well as carry that information into the order-entry system. Medications marked as held or discontinued on admission should be revisited as the patient’s clinical condition changes and at discharge.
STEP 2: AVOID RECONCILIATION ERRORS
Reconciliation errors reflect discrepancies between the medication history and the medications that are ordered after admission.
Reconciliation errors are less common than medication history errors, accounting for approximately one-third of potentially harmful medication errors in hospitalized medical patients.9 These include errors of omission (a medication is omitted from the orders), errors of commission (a medication is prescribed with no indication for continuation), and therapeutic duplication.
Preventing errors of omission
Medications are often held at transition points for appropriate clinical reasons. Examples include holding anticoagulants and antiplatelet agents in patients who have gastrointestinal bleeding or an upcoming procedure, antihypertensives in patients with hemodynamic instability, and other chronic medications in patients with an acute illness.
Poor documentation and communication of these decisions can lead to a failure to resume the medications—an error of omission—at hospital discharge.
Hospitalized patients are at risk of unintentional discontinuation of their chronic medications, including antiplatelet drugs, anticoagulants, statins, and thyroid replacement, particularly if admitted to the intensive care unit.12 These errors can be minimized by a standardized medication reconciliation process at each transition and clear documentation of the medication plan.
Communication among providers can be improved if the admitting clinician documents clearly whether each preadmission medication is being continued, changed, or stopped, along with the reason for doing so, and makes this information available throughout the hospital stay. Upon transfer to another unit and at discharge, the physician should review each; preadmission medication that was held and the patient’s current clinical status and, based on that information, decide whether medications that were held should be resumed. If a medication will be restarted later, specific instructions should be documented and communicated to the patient and the physicians who are taking over his or her care.
Preventing errors of commission
Failure to perform a complete reconciliation at each transition of care and match each medication with an appropriate indication can lead to errors of commission.
One study showed that 44% of patients were prescribed at least one unnecessary drug at hospital discharge, one-fourth of which were started during the hospitalization.27 Commonly prescribed unnecessarily were gastrointestinal agents, central nervous system drugs, nutrients, and supplements.
It is critical to assess each medication’s ongoing need, appropriateness, and risk-benefit ratio at every transition. Medications no longer indicated should be discontinued in order to simplify the regimen, avoid unnecessary drug exposure, and prevent ADEs.
For example, proton pump inhibitors or histamine 2 receptor blockers are often started in the hospital for stress ulcer prophylaxis. One-third of patients are then discharged home on the medication, and 6 months later half of those patients are still taking the unnecessary drug.28 This situation can be avoided by limiting use of these medications to appropriate circumstances, clearly marking the indication as stress ulcer prophylaxis (as opposed to an ongoing condition that will require continuing it after discharge), and discontinuing the agent when appropriate.
All drugs, even common and seemingly benign ones, carry some risk and should be discontinued when no longer needed. Thus, medications added during the hospitalization to control acute symptoms should also be reviewed at each transition to prevent inappropriate continuation when symptoms have resolved.
One study, for example, found that many patients were discharged with inappropriate prescriptions for atypical antipsychotics after receiving them in the intensive care unit, likely for delirium.29 Documenting that an acute issue such as delirium has resolved should prompt the discontinuation of therapy.
Preventing therapeutic duplication
Therapeutic duplication occurs in about 8% of discharges.1 These errors often result from formulary substitutions or altering the dosage form in the acute setting. For example, patients who receive a prescription for the substituted agent at discharge and also resume their prehospitalization medications end up with duplicate therapy.
Therapeutic substitution is common at the time of admission to the hospital as a result of formulary restrictions. Drug classes that are frequently substituted include statins, antihypertensives, urinary antispasmodics, and proton pump inhibitors. Physicians should be familiar with the preferred agents on the hospital formulary and make careful note when a substitution occurs. Furthermore, hospital systems should be developed to remind the physician to switch back to the outpatient medication at discharge.
Similar problems occur when home medications are replaced with different dosage forms with different pharmacokinetic properties. For example, a long-acting medication may be temporarily replaced with an intravenous solution or immediate-release tablet for several reasons, including nothing-by-mouth status, unstable clinical condition, need for titration, and need to crush the tablet to give the drug per tube. The differing formulations must be reconciled throughout the patient’s hospital course and at discharge to avoid therapeutic duplication and serious medication errors. Deliberate changes to the dosage form should be clearly communicated in the discharge medication list so that patients and other clinicians are aware.
Hospital systems should also have the capability to identify duplications in the medication list and to warn prescribers of these errors. The ability to group medications by drug class or sort the medication list alphabetically by generic name can help uncover duplication errors.
STEP 3: REVIEW THE LIST IN VIEW OF THE CLINICAL PICTURE
Transitions of care should prompt providers to review the medication list for possible drug-disease interactions, confirm compliance with evidence-based guidelines, and evaluate the risks and benefits of each medication in the context of the patient’s age and acute and chronic medical issues. This is also an opportunity to screen the full list for potentially inappropriate medications and high-alert drugs such as insulin or anticoagulants, which are more likely than other drugs to cause severe harm when used in error.
Acute kidney injury. New drug-disease interactions can arise during a hospitalization and can affect dosing and the choice of drug. The onset of acute kidney injury, for example, often necessitates adjusting or discontinuing nephrotoxic and renally excreted medications. ADEs or potential ADEs have been reported in 43% of hospitalized patients with acute kidney injury.30
Because acute kidney injury is often transient, medications may need to be held or adjusted several times until renal function stabilizes. This can be challenging across the continuum of care and requires close monitoring of the serum creatinine level and associated drug doses and levels, if applicable. Well-designed clinical decision support tools can integrate laboratory data and alert the prescriber to a clinically important increase or decrease in serum creatinine that may warrant a change in therapy. Modifications to the regimen and a plan for timely follow-up of the serum creatinine level should be clearly documented in the discharge plan.
Liver disease. Similar attention should be given to drugs that are hepatically metabolized if a patient has acute or chronic liver impairment.
Geriatric patients, particularly those who present with altered mental status, falls, or urinary retention, should have their medication list reviewed for potentially inappropriate medications, which are drugs that pose increased risk of poor outcomes in older adults.31,32 Patients and providers may have been willing to accept the risk of medications such as anticholinergics or sedative-hypnotics when the drugs were initiated, but circumstances can change over time, especially in this patient population. Hospitalization is a prime opportunity to screen for medications that meet the Beers criteria31 for agents to avoid or use with caution in older adults.
As-needed medications. Medications prescribed on an as-needed basis in the hospital should be reviewed for continuation or discontinuation at discharge. How often the medication was given can inform this decision.
For example, if as-needed opioids were used frequently, failure to develop a plan of care for pain can lead to persistent symptoms and, possibly, to readmission.33,34 Similar scenarios occur with use of as-needed blood pressure medications, laxatives, and correction-dose insulin.
If an as-needed medication was used consistently during hospitalization, the physician should consider whether a regularly scheduled medication is needed. Conversely, if the medication was not used during the inpatient admission, it can likely be discontinued.
STEP 4: PREPARE THE PATIENT AND FOLLOW-UP PROVIDER
Once a clinician has performed medication reconciliation, including obtaining a best-possible medical history and carefully reviewing the medication list and orders for errors and clinical appropriateness, the next steps are to ensure the patient understands what he or she needs to do and to confirm that suitable follow-up plans are in place. These measures should be taken at all transitions of care but are critically important at hospital discharge.
Preparing the patient and caregiver
An accurate, reconciled medication list should be given to the patient, caregiver, or both, and should be reviewed before discharge.17
Approximately one-third of Americans have low health literacy skills, so medication lists and associated materials should be easy to understand.35 Medication lists should be written in plain language and formatted for optimal readability (Table 4), clearly stating which medications to continue, change, hold temporarily, and stop.
Patients recall and comprehend about half of the information provided during a medical encounter.36 Thus, medication teaching should focus on key points including changes or additions to the regimen, specific instructions for follow-up and monitoring, and how to handle common and serious side effects.
To confirm patient understanding, clinicians should use “teach-back,” ie, provide the patient with information and then ask him or her to repeat back key points.37,38 The patient and family should also be encouraged to ask questions before discharge.
If not already addressed during the hospital stay, barriers to medication adherence and ability to obtain the medications should be attended to at this time (Table 5). Also, the plan to pick up the medications should be verified with the patient and caregiver. Verify that there is transportation to a particular pharmacy that is open at the time of discharge, and that the patient can afford the medications.
Ensuring appropriate follow-up
Studies have shown that timely in-home or telephone follow-up after discharge can decrease adverse events and postdischarge health care utilization.39,40 Telephone follow-up that includes thorough medication reconciliation can help detect and resolve medication issues early after discharge and can close gaps related to monitoring and follow-up.
Medication reconciliation by telephone can be time-consuming. Depending on the number of medications that need to be reviewed, calls can take between 10 and 60 minutes. Postdischarge phone calls should be performed by clinical personnel who are able to identify medication-related problems. A pharmacist should be an available resource to assist with complex regimens, to help resolve medication discrepancies, and to address patient concerns. Table 6 provides tips for conducting follow-up phone calls.
Resolving discrepancies identified during follow-up calls can be difficult, as changes to the medication regimen are often not communicated effectively to other members of the care team. Physicians should document the complete medication list and plan in the discharge summary, and there should be a method for the caller to record updates to the medication list in the medical record so that they are apparent at the outpatient follow-up visit.
An additional challenge is that it is frequently unclear which physician “owns” which medications. Therefore, designating a contact person for each medication until follow-up can be very valuable. At a minimum, a “physician owner” for high-alert medications such as insulin, anticoagulants, and diuretics should be identified to provide close follow-up, titration, and monitoring.
There should also be a plan for the patient to obtain refills of essential long-term medications, such as antiplatelet agents following stent placement.
SUMMARY AND RECOMMENDATIONS
Medication-related problems during hospital admission and discharge are common and range from minor discrepancies in the medication list to errors in history-taking, prescribing, and reconciliation that can lead to potential or actual patient harm. Putting systems in place to facilitate medication reconciliation can decrease the occurrence of medication discrepancies and ADEs, thereby improving patient safety during these critical transitions between care settings and providers. Institutional medication reconciliation programs should focus resources on the admission history-taking step, target the highest-risk patients for the most intensive interventions, and involve pharmacy personnel when possible.
On an individual level, clinicians can incorporate additional interventions into their workflows to optimize medication safety for hospitalized patients. Using a structured approach to obtain a complete and accurate medication list at the time of hospital admission will help providers identify medication-related problems and prevent the propagation of errors throughout the hospital stay and at discharge. Focusing additional time and effort on a comprehensive review of the medication list for errors of omission and commission, patient-specific needs, and high-alert drugs will further decrease the risk of medication errors. Finally, providing discharge counseling targeting patient barriers to adherence and ensuring a proper handover of medication information and rationale for medication changes to outpatient providers will improve the chances of a safe transition.
- Coleman EA, Smith JD, Raha D, Min SJ. Posthospital medication discrepancies: prevalence and contributing factors. Arch Intern Med 2005; 165:1842–1847.
- Wong JD, Bajcar JM, Wong GG, et al. Medication reconciliation at hospital discharge: evaluating discrepancies. Ann Pharmacother 2008; 42:1373–1379.
- Kripalani S, Roumie CL, Dalal AK, et al; PILL-CVD (Pharmacist Intervention for Low Literacy in Cardiovascular Disease) Study Group. Effect of a pharmacist intervention on clinically important medication errors after hospital discharge: a randomized trial. Ann Intern Med 2012; 157:1-10.
- Forster AJ, Murff HJ, Peterson JF, Gandhi TK, Bates DW. The incidence and severity of adverse events affecting patients after discharge from the hospital. Ann Intern Med 2003; 138:161–167.
- Forster AJ, Murff HJ, Peterson JF, Gandhi TK, Bates DW. Adverse drug events occurring following hospital discharge. J Gen Intern Med 2005; 20:317–323.
- Johnson JA, Bootman JL. Drug-related morbidity and mortality. A cost-of-illness model. Arch Intern Med 1995; 155:1949–1956.
- Budnitz DS, Lovegrove MC, Shehab N, Richards CL. Emergency hospitalizations for adverse drug events in older Americans. N Engl J Med 2011; 365:2002–2012.
- Bates DW, Boyle DL, Vander Vliet MB, Schneider J, Leape L. Relationship between medication errors and adverse drug events. J Gen Intern Med 1995;10:199–205.
- Pippins JR, Gandhi TK, Hamann C, et al. Classifying and predicting errors of inpatient medication reconciliation. J Gen Intern Med 2008; 23:1414–1422.
- Lau HS, Florax C, Porsius AJ, De Boer A.The completeness of medication histories in hospital medical records of patients admitted to general internal medicine wards. Br J Clin Pharmacol 2000; 49:597–603.
- Tam VC, Knowles SR, Cornish PL, Fine N, Marchesano R, Etchells EE. Frequency, type and clinical importance of medication history errors at admission to hospital: a systematic review. CMAJ 2005; 173:510–515.
- Bell CM, Brener SS, Gunraj N, et al. Association of ICU or hospital admission with unintentional discontinuation of medications for chronic diseases. JAMA 2011; 306:840–847.
- Dobranski S, Hammond I, Khan G, Holdsworth H. The nature of hospital prescribing errors. Br J Clin Governance 2002; 7:187–193.
- Gleason KM, Groszek JM, Sullivan C, Rooney D, Barnard C, Noskin GA. Reconciliation of discrepancies in medication histories and admission orders of newly hospitalized patients. Am J Health Syst Pharm 2004; 61:1689–1695.
- Rozich JD, Resar KR. Medication safety: one organization’s approach to the challenge. J Clin Outcomes Manage 2001; 8:27–34.
- Mueller SK, Sponsler KC, Kripalani S, Schnipper JL. Hospital-based medication reconciliation practices: a systematic review. Arch Intern Med 2012; 172:1057–1069.
- Joint Commission. Using medication reconciliation to prevent errors. Sentinel Event Alert 2006, Issue 35. www.jointcommission.org/assets/1/18/SEA_35.pdf. Accessed March 31, 2015.
- Greenwald JL, Halasyamani L, Greene J, et al. Making inpatient medication reconciliation patient centered, clinically relevant and implementable: a consensus statement on key principles and necessary first steps. J Hosp Med 2010; 5:477–485.
- Berwick DM, Calkins DR, McCannon CJ, Hackbarth AD. The 100,000 lives campaign: setting a goal and a deadline for improving health care quality. JAMA 2006; 295:324–327.
- McCannon CJ, Hackbarth AD, Griffin FA. Miles to go: an introduction to the 5 Million Lives Campaign. Jt Comm J Qual Patient Saf 2007; 33:477–484.
- Leotsakos A, Caisley L, Karga M, Kelly E, O’Leary D, Timmons K. High 5s: addressing excellence in patient safety. World Hosp Health Serv 2009; 45:19–22.
- Gleason KM, Brake H, Agramonte V, Perfetti C. Medications at Transitions and Clinical Handoffs (MATCH) Toolkit for Medication Reconciliation. www.ahrq.gov/professionals/quality-patient-safety/patient-safety-resources/resources/match/match.pdf. Accessed March 31, 2015.
- Mueller SK, Kripalani S, Stein J, et al. A toolkit to disseminate best practices in inpatient medication reconciliation: multi-center medication reconciliation quality improvement study (MARQUIS). Jt Comm J Qual Patient Saf 2013; 39:371–382.
- Pal A, Babbott S, Wilkinson ST. Can the targeted use of a discharge pharmacist significantly decrease 30-day readmissions? Hosp Pharm 2013; 48:380–388.
- Claxton AJ, Cramer J, Pierce C. A systematic review of the associations between dose regimens and medication compliance. Clin Ther 2001; 23:1296–1310.
- Osterberg L, Blaschke T. Adherence to medication. N Engl J Med 2005; 353:487–497.
- Hajjar ER, Hanlon JT, Sloane RJ, et al. Unnecessary drug use in frail older people at hospital discharge. J Am Geriatr Soc 2005; 53:1518–1523.
- Zink DA, Pohlman M, Barnes M, Cannon ME. Long-term use of acid suppression started inappropriately during hospitalization. Aliment Pharmacol Ther 2005; 21:1203–1209.
- Morandi A, Vasilevskis E, Pandharipande PP, et al. Inappropriate medication prescriptions in elderly adults surviving an intensive care unit hospitalization. J Am Geriatr Soc 2013; 61:1128–1134.
- Cox ZL, McCoy AB, Matheny ME, et al. Adverse drug events during AKI and its recovery. Clin J Am Soc Nephrol 2013; 8:1070–1078.
- American Geriatrics Society 2012 Beers Criteria Update Expert Panel. American Geriatrics Society updated Beers Criteria for potentially inappropriate medication use in older adults. J Am Geriatr Soc 2012; 60:616–631.
- Gallagher P, O’Mahony D. STOPP (Screening Tool of Older Persons’ potentially inappropriate Prescriptions): application to acutely ill elderly patients and comparison with Beers’ criteria. Age Ageing 2008; 37:673–679.
- Tjia J, Bonner A, Briesacher BA, McGee S, Terrill E, Miller K. Medication discrepancies upon hospital to skilled nursing facility transitions. J Gen Intern Med 2009; 24:630–635.
- Boockvar K, Fishman E, Kyriacou CK, Monias A, Gavi S, Cortes T. Adverse events due to discontinuations in drug use and dose changes in patients transferred between acute and long-term care facilities. Arch Intern Med 2004; 164:545–550.
- Kutner M, Greenberg E, Jin Y, Paulsen C. The Health Literacy of America’s Adults: Results From the 2003 National Assessment of Adult Literacy. http://nces.ed.gov/pubs2006/2006483_1.pdf. Accessed March 31, 2015.
- Crane JA. Patient comprehension of doctor-patient communication on discharge from the emergency department. J Emerg Med 1997; 15:1–7.
- DeWalt DA, Callahan LF, Hawk VH, et al. Health Literacy Universal Precautions Toolkit. www.ahrq.gov/qual/literacy/healthliteracytoolkit.pdf. Accessed March 31, 2015.
- Schillinger D, Piette J, Grumbach K, et al. Closing the loop: physician communication with diabetic patients who have low health literacy. Arch Intern Med 2003; 163:83–90.
- Coleman EA, Parry C, Chalmers S, Min SJ. The care transitions intervention: results of a randomized controlled trial. Arch Intern Med 2006; 166:1822–1828.
- Jack BW, Chetty VK, Anthony D, et al. A reengineered hospital discharge program to decrease rehospitalization: a randomized trial. Ann Intern Med 2009; 150:178–187.
KEY POINTS
- Institutional medication reconciliation programs should include taking a best-possible medication history at admission, intervening when patients are at high risk, and involving pharmacy staff when possible.
- Clinicians can incorporate additional interventions into their workflows to optimize medication safety for hospitalized patients.
- Reviewing the medication list for errors of omission and commission, patient-specific needs, and “high-alert” drugs further decreases the risk of medication errors.
- At discharge, patients should receive counseling to ensure understanding of medications and follow-up plans. Hospital physicians should communicate with outpatient providers about medications and rationales for medication changes.

Hospital Readmissions and Preventability
Hospital readmissions cost Medicare $15 to $17 billion per year.[1, 2] In 2010, the Hospital Readmission Reduction Program (HRRP), created by the Patient Protection and Affordable Care Act, authorized the Centers for Medicare and Medicaid Services (CMS) to penalize hospitals with higher‐than‐expected readmission rates for certain index conditions.[3] Other payers may follow suit, so hospitals and health systems nationwide are devoting significant resources to reducing readmissions.[4, 5, 6]
Implicit in these efforts are the assumptions that a significant proportion of readmissions are preventable, and that preventable readmissions can be identified. Unfortunately, estimates of preventability vary widely.[7, 8] In this article, we examine how preventable readmissions have been defined, measured, and calculated, and explore the associated implications for readmission reduction efforts.
THE MEDICARE READMISSION METRIC
The medical literature reveals substantial heterogeneity in how readmissions are assessed. Time periods range from 14 days to 4 years, and readmissions may be counted differently depending on whether they are to the same hospital or to any hospital, whether they are for the same (or a related) condition or for any condition, whether a patient is allowed to count only once during the follow‐up period, how mortality is treated, and whether observation stays are considered.[9]
Despite a lack of consensus in the literature, the approach adopted by CMS is endorsed by the National Quality Forum (NQF)[10] and has become the de facto standard for calculating readmission rates. CMS derives risk‐standardized readmission rates for acute myocardial infarction (AMI), heart failure (HF), and pneumonia (PN), using administrative claims data for each Medicare fee‐for‐service beneficiary 65 years or older.[11, 12, 13, 14] CMS counts the first readmission (but not subsequent ones) for any cause within 30 days of the index discharge, including readmissions to other facilities. Certain planned readmissions for revascularization are excluded, as are patients who left against medical advice, transferred to another acute‐care hospital, or died during the index admission. Admissions to psychiatric, rehabilitation, cancer specialty, and children's hospitals[12] are also excluded, as well as patients classified as observation status for either hospital stay.[15] Only administrative data are used in readmission calculations (ie, there are no chart reviews or interviews with healthcare personnel or patients). Details are published online and updated at least annually.[15]
EFFECTS AND LIMITATIONS OF THE HRRP AND THE CMS READMISSION METRIC
Penalizing hospitals for higher‐than‐expected readmission rates based on the CMS metric has been successful in the sense that hospitals now feel more accountable for patient outcomes after discharge; they are implementing transitional care programs, improving communication, and building relationships with community programs.[4, 5, 16] Early data suggest a small decline in readmission rates of Medicare beneficiaries nationally.[17] Previously, such readmission rates were constant.[18]
Nevertheless, significant concerns with the current approach have surfaced.[19, 20, 21] First, why choose 30 days? This time horizon was believed to be long enough to identify readmissions attributable to an index admission and short enough to reflect hospital‐delivered care and transitions to the outpatient setting, and it allows for collaboration between hospitals and their communities to reduce readmissions.[3] However, some have argued that this time horizon has little scientific basis,[22] and that hospitals are unfairly held accountable for a timeframe when outcomes may largely be influenced by the quality of outpatient care or the development of new problems.[23, 24] Approximately one‐third of 30‐day readmissions occur within the first 7 days, and more than half (55.7%) occur within the first 14 days[22, 25]; such time frames may be more appropriate for hospital accountability.[26]
Second, spurred by the focus of CMS penalties, efforts to reduce readmissions have largely concerned patients admitted for HF, AMI, or PN, although these 3 medical conditions account for only 10% of Medicare hospitalizations.[18] Programs focused on a narrow patient population may not benefit other patients with high readmission rates, such as those with gastrointestinal or psychiatric problems,[2] or lead to improvements in the underlying processes of care that could benefit patients in additional ways. Indeed, research suggests that low readmission rates may not be related to other measures of hospital quality.[27, 28]
Third, public reporting and hospital penalties are based on 3‐year historical performance, in part to accumulate a large enough sample size for each diagnosis. Hospitals that seek real‐time performance monitoring are limited to tracking surrogate outcomes, such as readmissions back to their own facility.[29, 30] Moreover, because of the long performance time frame, hospitals that achieve rapid improvement may endure penalties precisely when they are attempting to sustain their achievements.
Fourth, the CMS approach utilizes a complex risk‐standardization methodology, which has only modest ability to predict readmissions and allow hospital comparisons.[9] There is no adjustment for community characteristics, even though practice patterns are significantly associated with readmission rates,[9, 31] and more than half of the variation in readmission rates across hospitals can be explained by characteristics of the community such as access to care.[32] Moreover, patient factors, such as race and socioeconomic status, are currently not included in an attempt to hold hospitals to similar standards regardless of their patient population. This is hotly contested, however, and critics note this policy penalizes hospitals for factors outside of their control, such as patients' ability to afford medications.[33] Indeed, the June 2013 Medicare Payment Advisory Committee (MedPAC) report to Congress recommended evaluating hospital performance against facilities with a like percentage of low‐income patients as a way to take into account socioeconomic status.[34]
Fifth, observation stays are excluded, so patients who remain in observation status during their index or subsequent hospitalization cannot be counted as a readmission. Prevalence of observation care has increased, raising concerns that inpatient admissions are being shifted to observation status, producing an artificial decline in readmissions.[35] Fortunately, recent population‐level data provide some reassuring evidence to the contrary.[36]
Finally, and perhaps most significantly, the current readmission metric does not consider preventability. Recent reviews have demonstrated that estimates of preventability vary widely in individual studies, ranging from 5% to 79%, depending on study methodology and setting.[7, 8] Across these studies, on average, only 23% of 30‐day readmissions appear to be avoidable.[8] Another way to consider the preventability of hospital readmissions is by noting that the most effective multimodal care‐transition interventions reduce readmission rates by only about 30%, and most interventions are much less effective.[26] The likely fact that only 23% to 30% of readmissions are preventable has profound implications for the anticipated results of hospital readmission reduction efforts. Interventions that are 75% effective in reducing preventable readmissions should be expected to produce only an 18% to 22% reduction in overall readmission rates.[37]
FOCUSING ON PREVENTABLE READMISSIONS
A greater focus on identifying and targeting preventable readmissions would offer a number of advantages over the present approach. First, it is more meaningful to compare hospitals based on their percentage of discharges resulting in a preventable readmission, than on the basis of highly complex risk standardization procedures for selected conditions. Second, a focus on preventable readmissions more clearly identifies and permits hospitals to target opportunities for improvement. Third, if the focus were on preventable readmissions for a large number of conditions, the necessary sample size could be obtained over a shorter period of time. Overall, such a preventable readmissions metric could serve as a more agile and undiluted performance indicator, as opposed to the present 3‐year rolling average rate of all‐cause readmissions for certain conditions, the majority of which are probably not preventable.
DEFINING PREVENTABILITY
Defining a preventable readmission is critically important. However, neither a consensus definition nor a validated standard for assessing preventable hospital readmissions exists. Different conceptual frameworks and terms (eg, avoidable, potentially preventable, or urgent readmission) complicate the issue.[38, 39, 40]
Although the CMS measure does not address preventability, it is helpful to consider whether other readmission metrics incorporate this concept. The United Health Group's (UHG, formerly Pacificare) All‐Cause Readmission Index, University HealthSystem Consortium's 30‐Day Readmission Rate (all cause), and 3M Health Information Systems' (3M) Potentially Preventable Readmissions (PPR) are 3 commonly used measures.
Of these, only the 3M PPR metric includes the concept of preventability. 3M created a proprietary matrix of 98,000 readmission‐index admission All Patient Refined Diagnosis Related Group pairs based on the review of several physicians and the logical assumption that a readmission for a clinically related diagnosis is potentially preventable.[24, 41] Readmission and index admissions are considered clinically related if any of the following occur: (1) medical readmission for continuation or recurrence of an initial, or closely related, condition; (2) medical readmission for acute decompensation of a chronic condition that was not the reason for the index admission but was plausibly related to care during or immediately afterward (eg, readmission for diabetes in a patient whose index admission was AMI); (3) medical readmission for acute complication plausibly related to care during index admission; (4) readmission for surgical procedure for continuation or recurrence of initial problem (eg, readmission for appendectomy following admission for abdominal pain and fever); or (5) readmission for surgical procedure to address complication resulting from care during index admission.[24, 41] The readmission time frame is not standardized and may be set by the user. Though conceptually appealing in some ways, CMS and the NQF have expressed concern about this specific approach because of the uncertain reliability of the relatedness of the admission‐readmission diagnosis dyads.[3]
In the research literature, only a few studies have examined the 3M PPR or other preventability assessments that rely on the relatedness of diagnostic codes.[8] Using the 3M PPR, a study showed that 78% of readmissions were classified as potentially preventable,[42] which explains why the 3M PPR and all‐cause readmission metric may correlate highly.[43] Others have demonstrated that ratings of hospital performance on readmission rates vary by a moderate to large amount, depending on whether the 3M PPR, CMS, or UHG methodology is used.[43, 44] An algorithm called SQLape[45, 46] is used in Switzerland to benchmark hospitals and defines potentially avoidable readmissions as being related to index diagnoses or complications of those conditions. It has recently been tested in the United States in a single‐center study,[47] and a multihospital study is underway.
Aside from these algorithms using related diagnosis codes, most ratings of preventability have relied on subjective assessments made primarily through a review of hospital records, and approximately one‐third also included data from clinic visits or interviews with the treating medical team or patients/families.[8] Unfortunately, these reports provide insufficient detail on how to apply their preventability criteria to subsequent readmission reviews. Studies did, however, provide categories of preventability into which readmissions could be organized (see Supporting Information, Appendix Table 1, in the online version of this article for details from a subset of studies cited in van Walraven's reviews that illustrate this point).
Assessment of preventability by clinician review can be challenging. In general, such assessments have considered readmissions resulting from factors within the hospital's control to be avoidable (eg, providing appropriate discharge instructions, reconciling medications, arranging timely postdischarge follow‐up appointments), whereas readmissions resulting from factors not within the hospital's control are unavoidable (eg, patient socioeconomic status, social support, disease progression). However, readmissions resulting from patient behaviors or social reasons could potentially be classified as avoidable or unavoidable depending on the circumstances. For example, if a patient decides not to take a prescribed antibiotic and is readmitted with worsening infection, this could be classified as an unavoidable readmission from the hospital's perspective. Alternatively, if the physician prescribing the antibiotic was inattentive to the cost of the medication and the patient would have taken a less expensive medication had it been prescribed, this could be classified as an avoidable readmission. Differing interpretations of contextual factors may partially account for the variability in clinical assessments of preventability.
Indeed, despite the lack of consensus around a standard method of defining preventability, hospitals and health systems are moving forward to address the issue and reduce readmissions. A recent survey by America's Essential Hospitals (previously the National Association of Public Hospitals and Health Systems), indicated that: (1) reducing readmissions was a high priority for the majority (86%) of members, (2) most had established interdisciplinary teams to address the issue, and (3) over half had a formal process for determining which readmissions were potentially preventable. Of the survey respondents, just over one‐third rely on staff review of individual patient charts or patient and family interviews, and slightly less than one‐third rely on other mechanisms such as external consultants, criteria developed by other entities, or the Institute for Clinical Systems Improvement methodology.[48] Approximately one‐fifth make use of 3M's PPR product, and slightly fewer use the list of the Agency for Healthcare Research and Quality's ambulatory care sensitive conditions (ACSCs). These are medical conditions for which it is believed that good outpatient care could prevent the need for hospitalization (eg, asthma, congestive heart failure, diabetes) or for which early intervention minimizes complications.[49] Hospitalization rates for ACSCs may represent a good measure of excess hospitalization, with a focus on the quality of outpatient care.
RECOMMENDATIONS
We recommend that reporting of hospital readmission rates be based on preventable or potentially preventable readmissions. Although we acknowledge the challenges in doing so, the advantages are notable. At minimum, a preventable readmission rate would more accurately reflect the true gap in care and therefore hospitals' real opportunity for improvement, without being obscured by readmissions that are not preventable.
Because readmission rates are used for public reporting and financial penalties for hospitals, we favor a measure of preventability that reflects the readmissions that the hospital or hospital system has the ability to prevent. This would not penalize hospitals for factors that are under the control of others, namely patients and caregivers, community supports, or society at large. We further recommend that this measure apply to a broader composite of unplanned care, inclusive of both inpatient and observation stays, which have little distinction in patients' eyes, and both represent potentially unnecessary utilization of acute‐care resources.[50] Such a measure would require development, validation, and appropriate vetting before it is implemented.
The first step is for researchers and policy makers to agree on how a measure of preventable or potentially preventable readmissions could be defined. A common element of preventability assessment is to identify the degree to which the reasons for readmission are related to the diagnoses of the index hospitalization. To be reliable and scalable, this measure will need to be based on algorithms that relate the index and readmission diagnoses, most likely using claims data. Choosing common medical and surgical conditions and developing a consensus‐based list of related readmission diagnoses is an important first step. It would also be important to include some less common conditions, because they may reflect very different aspects of hospital care.
An approach based on a list of related diagnoses would represent potentially preventable rehospitalizations. Generally, clinical review is required to determine actual preventability, taking into account patient factors such as a high level of illness or functional impairment that leads to clinical decompensation in spite of excellent management.[51, 52] Clinical review, like a root cause analysis, also provides greater insight into hospital processes that may warrant improvement. Therefore, even if an administrative measure of potentially preventable readmissions is implemented, hospitals may wish to continue performing detailed clinical review of some readmissions for quality improvement purposes. When clinical review becomes more standardized,[53] a combined approach that uses administrative data plus clinical verification and arbitration may be feasible, as with hospital‐acquired infections.
Similar work to develop related sets of admission and readmission diagnoses has already been undertaken in development of the 3M PPR and SQLape measures.[41, 46] However, the 3M PPR is a proprietary system that has low specificity and a high false‐positive rate for identifying preventable readmissions when compared to clinical review.[42] Moreover, neither measure has yet achieved the consensus required for widespread adoption in the United States. What is needed is a nonproprietary listing of related admission and readmission diagnoses, developed with the engagement of relevant stakeholders, that goes through a period of public comment and vetting by a body such as the NQF.
Until a validated measure of potentially preventable readmission can be developed, how could the current approach evolve toward preventability? The most feasible, rapidly implementable change would be to alter the readmission time horizon from 30 days to 7 or 15 days. A 30‐day period holds hospitals accountable for complications of outpatient care or new problems that may develop weeks after discharge. Even though this may foster shared accountability and collaboration among hospitals and outpatient or community settings, research has demonstrated that early readmissions (eg, within 715 days of discharge) are more likely preventable.[54] Second, consideration of the socioeconomic status of hospital patients, as recommended by MedPAC,[34] would improve on the current model by comparing hospitals to like facilities when determining penalties for excess readmission rates. Finally, adjustment for community factors, such as practice patterns and access to care, would enable readmission metrics to better reflect factors under the hospital's control.[32]
CONCLUSION
Holding hospitals accountable for the quality of acute and transitional care is an important policy initiative that has accelerated many improvements in discharge planning and care coordination. Optimally, the policies, public reporting, and penalties should target preventable readmissions, which may represent as little as one‐quarter of all readmissions. By summarizing some of the issues in defining preventability, we hope to foster continued refinement of quality metrics used in this arena.
Acknowledgements
We thank Eduard Vasilevskis, MD, MPH, for feedback on an earlier draft of this article. This manuscript was informed by a special report titled Preventable Readmissions, written by Julia Lavenberg, Joel Betesh, David Goldmann, Craig Kean, and Kendal Williams of the Penn Medicine Center for Evidence‐based Practice. The review was performed at the request of the Penn Medicine Chief Medical Officer Patrick J. Brennan to inform the development of local readmission prevention metrics, and is available at
Disclosures
Dr. Umscheid's contribution to this project was supported in part by the National Center for Research Resources and the National Center for Advancing Translational Sciences, National Institutes of Health, through grant UL1TR000003. Dr. Kripalani receives support from the National Heart, Lung, and Blood Institute of the National Institutes of Health under award number R01HL109388, and from the Centers for Medicare and Medicaid Services under awards 1C1CMS331006‐01 and 1C1CMS330979‐01. The content is solely the responsibility of the authors and does not necessarily represent the official views of the National Institutes of Health or Centers for Medicare and Medicaid Services.
- , . Physician Visits After Hospital Discharge: Implications for Reducing Readmissions. Washington, DC: National Institute for Health Care Reform; 2011. Report no. 6.
- , , . Rehospitalizations among patients in the Medicare fee‐for‐service program. N Engl J Med. 2009;360(14):1418–1428.
- Centers for Medicare and Medicaid Services, US Department of Health and Human Services. Medicare program: hospital inpatient prospective payment systems for acute care hospitals and the long‐term care hospital prospective payment system and FY 2012 rates. Fed Regist. 2011;76(160):51476–51846.
- , , , , , . Quality collaboratives and campaigns to reduce readmissions: what strategies are hospitals using? J Hosp Med. 2013;8:601–608.
- , , , , . Contemporary data about hospital strategies to reduce unplanned readmissions: what has changed [research letter]? JAMA Intern Med. 2014;174(1):154–156.
- , , , , . Interventions to reduce 30‐day rehospitalization: a systematic review. Ann Intern Med. 2011;155(8):520–528.
- , , , . Comparing methods to calculate hospital‐specific rates of early death or urgent readmission. CMAJ. 2012;184(15):E810–E817.
- , , , , . Proportion of hospital readmissions deemed avoidable: a systematic review. CMAJ. 2011;183(7):E391–E402.
- , , , et al. Risk prediction models for hospital readmission: a systematic review. JAMA. 2011;306(15):1688–1698.
- National Quality Forum. Patient outcomes: all‐cause readmissions expedited review 2011. Available at: http://www.qualityforum.org/WorkArea/linkit.aspx?LinkIdentifier=id60(7):607–614.
- , , , , , . Data shows reduction in Medicare hospital readmission rates during 2012. Medicare Medicaid Res Rev. 2013;3(2):E1–E11.
- , . Thirty‐day readmissions—truth and consequences. N Engl J Med. 2012;366(15):1366–1369.
- , , , . Moving beyond readmission penalties: creating an ideal process to improve transitional care. J Hosp Med. 2013;8(2):102–109.
- , . A path forward on Medicare readmissions. N Engl J Med. 2013;368(13):1175–1177.
- American Hospital Association. TrendWatch: examining the drivers of readmissions and reducing unnecessary readmissions for better patient care. Washington, DC: American Hospital Association; 2011.
- , , , et al. Diagnoses and timing of 30‐day readmissions after hospitalization for heart failure, acute myocardial infarction, or pneumonia. JAMA. 2013;309(4):355–363.
- , . Characteristics of hospitals receiving penalties under the hospital readmissions reduction program. JAMA. 2013;309(4):342–343.
- , , , , , , et al. Identifying potentially preventable readmissions. Health Care Financ Rev. 2008;30(1):75–91.
- , , , et al. Use of hospital‐based acute care among patients recently discharged from the hospital. JAMA. 2013;309(4):364–371.
- , , , . Reducing hospital readmission rates: current strategies and future directions. Annu Rev Med. 2014;65:471–485.
- , , , et al. Relationship between hospital readmission and mortality rates for patients hospitalized with acute myocardial infarction, heart failure, or pneumonia. JAMA. 2013;309(6):587–593.
- , , , et al. Hospital performance measures and 30‐day readmission rates. J Gen Intern Med. 2013;28(3):377–385.
- , , , . Limitations of using same‐hospital readmission metrics. Int J Qual Health Care. 2013;25(6):633–639.
- , , , et al. Is same‐hospital readmission rate a good surrogate for all‐hospital readmission rate? Med Care. 2010;48(5):477–481.
- , , . The relationship between hospital admission rates and rehospitalizations. N Engl J Med. 2011;365(24):2287–2295.
- . Community factors and hospital readmission rates [published online April 9, 2014]. Health Serv Res. doi: 10.1111/1475–6773.12177.
- American Hospital Association. Hospital readmissions reduction program: factsheet. American Hospital Association. Available at: http://www.aha.org/content/13/fs‐readmissions.pdf. Published April 14, 2014. Accessed May 5, 2014.
- Medicare Payment Advisory Commission. Report to the congress: Medicare and the health care delivery system. Available at: http://www.medpac.gov/documents/Jun13_EntireReport.pdf. Published June 14, 2013. Accessed May 5, 2014.
- , , . Sharp rise in Medicare enrollees being held in hospitals for observation raises concerns about causes and consequences. Health Aff (Millwood). 2012;31(6):1251–1259.
- , , . Quality improvement of care transitions and the trend of composite hospital care. JAMA. 2014;311(10):1013–1014.
- , . When projecting required effectiveness of interventions for hospital readmission reduction, the percentage that is potentially avoidable must be considered. J Clin Epidemiol. 2013;66(6):688–690.
- , , . Urgent readmission rates can be used to infer differences in avoidable readmission rates between hospitals. J Clin Epidemiol. 2012;65(10):1124–1130.
- , , , , . Proportion of hospital readmissions deemed avoidable: a systematic review. CMAJ. 2011;183(7):E391–E402.
- , , , , , . Measuring and preventing potentially avoidable hospital readmissions: a review of the literature. Hong Kong Med J. 2010;16(5):383–389.
- 3M Health Information Systems. Potentially preventable readmissions classification system methodology: overview. 3M Health Information Systems; May 2008. Report No.: GRP‐139. Available at: http://multimedia.3m.com/mws/mediawebserver?66666UuZjcFSLXTtNXMtmxMEEVuQEcuZgVs6EVs6E666666‐‐. Accessed June 8, 2014.
- , , , , , . Manual and automated methods for identifying potentially preventable readmissions: a comparison in a large healthcare system. BMC Med Inform Decis Mak. 2014;14:28.
- , , , , , , et al. Comparing 2 methods of assessing 30‐day readmissions: what is the impact on hospital profiling in the Veterans Health Administration? Med Care. 2013;51(7):589–596.
- , . It's not six of one, half‐dozen the other: a comparative analysis of 3 rehospitalization measurement systems for Massachusetts. Academy Health Annual Research Meeting. Seattle, WA. 2011. Available at: http://www.academyhealth.org/files/2011/tuesday/boutwell.pdf. Accessed May 9, 2014.
- , , , , , . Validation of the potentially avoidable hospital readmission rate as a routine indicator of the quality of hospital care. Med Care. 2006;44(11):972–981.
- , , , , , . Measuring potentially avoidable hospital readmissions. J Clin Epidemiol. 2002;55:573–587.
- , , , . Potentially avoidable 30‐day hospital readmissions in medical patients: derivation and validation of a prediction model. JAMA Intern Med. 2013;173(8):632–638.
- National Association of Public Hospitals and Health Systems. NAPH members focus on reducing readmissions. Available at: www.naph.org. Published June 2011. Accessed October 19, 2011.
- Agency for Healthcare Research and Quality. AHRQ quality indicators: prevention quality indicators. Available at: http://www.qualityindicators.ahrq.gov/Modules/pqi_resources.aspx. Accessed February 11, 2014.
- , , , , , . Shifting the dialogue from hospital readmissions to unplanned care. Am J Manag Care. 2013;19(6):450–453.
- . Post‐hospital syndrome—an acquired, transient condition of generalized risk. N Engl J Med. 2013;368(2):100–102.
- , . The hospital‐dependent patient. N Engl J Med. 2014;370(8):694–697.
- , , , et al. The hospital medicine reengineering network (HOMERuN): a learning organization focused on improving hospital care. Acad Med. 2014;89(3):415–420.
- , , , et al. Incidence of potentially avoidable urgent readmissions and their relation to all‐cause urgent readmissions. CMAJ. 2011;183(14):E1067–E1072.
Hospital readmissions cost Medicare $15 to $17 billion per year.[1, 2] In 2010, the Hospital Readmission Reduction Program (HRRP), created by the Patient Protection and Affordable Care Act, authorized the Centers for Medicare and Medicaid Services (CMS) to penalize hospitals with higher‐than‐expected readmission rates for certain index conditions.[3] Other payers may follow suit, so hospitals and health systems nationwide are devoting significant resources to reducing readmissions.[4, 5, 6]
Implicit in these efforts are the assumptions that a significant proportion of readmissions are preventable, and that preventable readmissions can be identified. Unfortunately, estimates of preventability vary widely.[7, 8] In this article, we examine how preventable readmissions have been defined, measured, and calculated, and explore the associated implications for readmission reduction efforts.
THE MEDICARE READMISSION METRIC
The medical literature reveals substantial heterogeneity in how readmissions are assessed. Time periods range from 14 days to 4 years, and readmissions may be counted differently depending on whether they are to the same hospital or to any hospital, whether they are for the same (or a related) condition or for any condition, whether a patient is allowed to count only once during the follow‐up period, how mortality is treated, and whether observation stays are considered.[9]
Despite a lack of consensus in the literature, the approach adopted by CMS is endorsed by the National Quality Forum (NQF)[10] and has become the de facto standard for calculating readmission rates. CMS derives risk‐standardized readmission rates for acute myocardial infarction (AMI), heart failure (HF), and pneumonia (PN), using administrative claims data for each Medicare fee‐for‐service beneficiary 65 years or older.[11, 12, 13, 14] CMS counts the first readmission (but not subsequent ones) for any cause within 30 days of the index discharge, including readmissions to other facilities. Certain planned readmissions for revascularization are excluded, as are patients who left against medical advice, transferred to another acute‐care hospital, or died during the index admission. Admissions to psychiatric, rehabilitation, cancer specialty, and children's hospitals[12] are also excluded, as well as patients classified as observation status for either hospital stay.[15] Only administrative data are used in readmission calculations (ie, there are no chart reviews or interviews with healthcare personnel or patients). Details are published online and updated at least annually.[15]
EFFECTS AND LIMITATIONS OF THE HRRP AND THE CMS READMISSION METRIC
Penalizing hospitals for higher‐than‐expected readmission rates based on the CMS metric has been successful in the sense that hospitals now feel more accountable for patient outcomes after discharge; they are implementing transitional care programs, improving communication, and building relationships with community programs.[4, 5, 16] Early data suggest a small decline in readmission rates of Medicare beneficiaries nationally.[17] Previously, such readmission rates were constant.[18]
Nevertheless, significant concerns with the current approach have surfaced.[19, 20, 21] First, why choose 30 days? This time horizon was believed to be long enough to identify readmissions attributable to an index admission and short enough to reflect hospital‐delivered care and transitions to the outpatient setting, and it allows for collaboration between hospitals and their communities to reduce readmissions.[3] However, some have argued that this time horizon has little scientific basis,[22] and that hospitals are unfairly held accountable for a timeframe when outcomes may largely be influenced by the quality of outpatient care or the development of new problems.[23, 24] Approximately one‐third of 30‐day readmissions occur within the first 7 days, and more than half (55.7%) occur within the first 14 days[22, 25]; such time frames may be more appropriate for hospital accountability.[26]
Second, spurred by the focus of CMS penalties, efforts to reduce readmissions have largely concerned patients admitted for HF, AMI, or PN, although these 3 medical conditions account for only 10% of Medicare hospitalizations.[18] Programs focused on a narrow patient population may not benefit other patients with high readmission rates, such as those with gastrointestinal or psychiatric problems,[2] or lead to improvements in the underlying processes of care that could benefit patients in additional ways. Indeed, research suggests that low readmission rates may not be related to other measures of hospital quality.[27, 28]
Third, public reporting and hospital penalties are based on 3‐year historical performance, in part to accumulate a large enough sample size for each diagnosis. Hospitals that seek real‐time performance monitoring are limited to tracking surrogate outcomes, such as readmissions back to their own facility.[29, 30] Moreover, because of the long performance time frame, hospitals that achieve rapid improvement may endure penalties precisely when they are attempting to sustain their achievements.
Fourth, the CMS approach utilizes a complex risk‐standardization methodology, which has only modest ability to predict readmissions and allow hospital comparisons.[9] There is no adjustment for community characteristics, even though practice patterns are significantly associated with readmission rates,[9, 31] and more than half of the variation in readmission rates across hospitals can be explained by characteristics of the community such as access to care.[32] Moreover, patient factors, such as race and socioeconomic status, are currently not included in an attempt to hold hospitals to similar standards regardless of their patient population. This is hotly contested, however, and critics note this policy penalizes hospitals for factors outside of their control, such as patients' ability to afford medications.[33] Indeed, the June 2013 Medicare Payment Advisory Committee (MedPAC) report to Congress recommended evaluating hospital performance against facilities with a like percentage of low‐income patients as a way to take into account socioeconomic status.[34]
Fifth, observation stays are excluded, so patients who remain in observation status during their index or subsequent hospitalization cannot be counted as a readmission. Prevalence of observation care has increased, raising concerns that inpatient admissions are being shifted to observation status, producing an artificial decline in readmissions.[35] Fortunately, recent population‐level data provide some reassuring evidence to the contrary.[36]
Finally, and perhaps most significantly, the current readmission metric does not consider preventability. Recent reviews have demonstrated that estimates of preventability vary widely in individual studies, ranging from 5% to 79%, depending on study methodology and setting.[7, 8] Across these studies, on average, only 23% of 30‐day readmissions appear to be avoidable.[8] Another way to consider the preventability of hospital readmissions is by noting that the most effective multimodal care‐transition interventions reduce readmission rates by only about 30%, and most interventions are much less effective.[26] The likely fact that only 23% to 30% of readmissions are preventable has profound implications for the anticipated results of hospital readmission reduction efforts. Interventions that are 75% effective in reducing preventable readmissions should be expected to produce only an 18% to 22% reduction in overall readmission rates.[37]
FOCUSING ON PREVENTABLE READMISSIONS
A greater focus on identifying and targeting preventable readmissions would offer a number of advantages over the present approach. First, it is more meaningful to compare hospitals based on their percentage of discharges resulting in a preventable readmission, than on the basis of highly complex risk standardization procedures for selected conditions. Second, a focus on preventable readmissions more clearly identifies and permits hospitals to target opportunities for improvement. Third, if the focus were on preventable readmissions for a large number of conditions, the necessary sample size could be obtained over a shorter period of time. Overall, such a preventable readmissions metric could serve as a more agile and undiluted performance indicator, as opposed to the present 3‐year rolling average rate of all‐cause readmissions for certain conditions, the majority of which are probably not preventable.
DEFINING PREVENTABILITY
Defining a preventable readmission is critically important. However, neither a consensus definition nor a validated standard for assessing preventable hospital readmissions exists. Different conceptual frameworks and terms (eg, avoidable, potentially preventable, or urgent readmission) complicate the issue.[38, 39, 40]
Although the CMS measure does not address preventability, it is helpful to consider whether other readmission metrics incorporate this concept. The United Health Group's (UHG, formerly Pacificare) All‐Cause Readmission Index, University HealthSystem Consortium's 30‐Day Readmission Rate (all cause), and 3M Health Information Systems' (3M) Potentially Preventable Readmissions (PPR) are 3 commonly used measures.
Of these, only the 3M PPR metric includes the concept of preventability. 3M created a proprietary matrix of 98,000 readmission‐index admission All Patient Refined Diagnosis Related Group pairs based on the review of several physicians and the logical assumption that a readmission for a clinically related diagnosis is potentially preventable.[24, 41] Readmission and index admissions are considered clinically related if any of the following occur: (1) medical readmission for continuation or recurrence of an initial, or closely related, condition; (2) medical readmission for acute decompensation of a chronic condition that was not the reason for the index admission but was plausibly related to care during or immediately afterward (eg, readmission for diabetes in a patient whose index admission was AMI); (3) medical readmission for acute complication plausibly related to care during index admission; (4) readmission for surgical procedure for continuation or recurrence of initial problem (eg, readmission for appendectomy following admission for abdominal pain and fever); or (5) readmission for surgical procedure to address complication resulting from care during index admission.[24, 41] The readmission time frame is not standardized and may be set by the user. Though conceptually appealing in some ways, CMS and the NQF have expressed concern about this specific approach because of the uncertain reliability of the relatedness of the admission‐readmission diagnosis dyads.[3]
In the research literature, only a few studies have examined the 3M PPR or other preventability assessments that rely on the relatedness of diagnostic codes.[8] Using the 3M PPR, a study showed that 78% of readmissions were classified as potentially preventable,[42] which explains why the 3M PPR and all‐cause readmission metric may correlate highly.[43] Others have demonstrated that ratings of hospital performance on readmission rates vary by a moderate to large amount, depending on whether the 3M PPR, CMS, or UHG methodology is used.[43, 44] An algorithm called SQLape[45, 46] is used in Switzerland to benchmark hospitals and defines potentially avoidable readmissions as being related to index diagnoses or complications of those conditions. It has recently been tested in the United States in a single‐center study,[47] and a multihospital study is underway.
Aside from these algorithms using related diagnosis codes, most ratings of preventability have relied on subjective assessments made primarily through a review of hospital records, and approximately one‐third also included data from clinic visits or interviews with the treating medical team or patients/families.[8] Unfortunately, these reports provide insufficient detail on how to apply their preventability criteria to subsequent readmission reviews. Studies did, however, provide categories of preventability into which readmissions could be organized (see Supporting Information, Appendix Table 1, in the online version of this article for details from a subset of studies cited in van Walraven's reviews that illustrate this point).
Assessment of preventability by clinician review can be challenging. In general, such assessments have considered readmissions resulting from factors within the hospital's control to be avoidable (eg, providing appropriate discharge instructions, reconciling medications, arranging timely postdischarge follow‐up appointments), whereas readmissions resulting from factors not within the hospital's control are unavoidable (eg, patient socioeconomic status, social support, disease progression). However, readmissions resulting from patient behaviors or social reasons could potentially be classified as avoidable or unavoidable depending on the circumstances. For example, if a patient decides not to take a prescribed antibiotic and is readmitted with worsening infection, this could be classified as an unavoidable readmission from the hospital's perspective. Alternatively, if the physician prescribing the antibiotic was inattentive to the cost of the medication and the patient would have taken a less expensive medication had it been prescribed, this could be classified as an avoidable readmission. Differing interpretations of contextual factors may partially account for the variability in clinical assessments of preventability.
Indeed, despite the lack of consensus around a standard method of defining preventability, hospitals and health systems are moving forward to address the issue and reduce readmissions. A recent survey by America's Essential Hospitals (previously the National Association of Public Hospitals and Health Systems), indicated that: (1) reducing readmissions was a high priority for the majority (86%) of members, (2) most had established interdisciplinary teams to address the issue, and (3) over half had a formal process for determining which readmissions were potentially preventable. Of the survey respondents, just over one‐third rely on staff review of individual patient charts or patient and family interviews, and slightly less than one‐third rely on other mechanisms such as external consultants, criteria developed by other entities, or the Institute for Clinical Systems Improvement methodology.[48] Approximately one‐fifth make use of 3M's PPR product, and slightly fewer use the list of the Agency for Healthcare Research and Quality's ambulatory care sensitive conditions (ACSCs). These are medical conditions for which it is believed that good outpatient care could prevent the need for hospitalization (eg, asthma, congestive heart failure, diabetes) or for which early intervention minimizes complications.[49] Hospitalization rates for ACSCs may represent a good measure of excess hospitalization, with a focus on the quality of outpatient care.
RECOMMENDATIONS
We recommend that reporting of hospital readmission rates be based on preventable or potentially preventable readmissions. Although we acknowledge the challenges in doing so, the advantages are notable. At minimum, a preventable readmission rate would more accurately reflect the true gap in care and therefore hospitals' real opportunity for improvement, without being obscured by readmissions that are not preventable.
Because readmission rates are used for public reporting and financial penalties for hospitals, we favor a measure of preventability that reflects the readmissions that the hospital or hospital system has the ability to prevent. This would not penalize hospitals for factors that are under the control of others, namely patients and caregivers, community supports, or society at large. We further recommend that this measure apply to a broader composite of unplanned care, inclusive of both inpatient and observation stays, which have little distinction in patients' eyes, and both represent potentially unnecessary utilization of acute‐care resources.[50] Such a measure would require development, validation, and appropriate vetting before it is implemented.
The first step is for researchers and policy makers to agree on how a measure of preventable or potentially preventable readmissions could be defined. A common element of preventability assessment is to identify the degree to which the reasons for readmission are related to the diagnoses of the index hospitalization. To be reliable and scalable, this measure will need to be based on algorithms that relate the index and readmission diagnoses, most likely using claims data. Choosing common medical and surgical conditions and developing a consensus‐based list of related readmission diagnoses is an important first step. It would also be important to include some less common conditions, because they may reflect very different aspects of hospital care.
An approach based on a list of related diagnoses would represent potentially preventable rehospitalizations. Generally, clinical review is required to determine actual preventability, taking into account patient factors such as a high level of illness or functional impairment that leads to clinical decompensation in spite of excellent management.[51, 52] Clinical review, like a root cause analysis, also provides greater insight into hospital processes that may warrant improvement. Therefore, even if an administrative measure of potentially preventable readmissions is implemented, hospitals may wish to continue performing detailed clinical review of some readmissions for quality improvement purposes. When clinical review becomes more standardized,[53] a combined approach that uses administrative data plus clinical verification and arbitration may be feasible, as with hospital‐acquired infections.
Similar work to develop related sets of admission and readmission diagnoses has already been undertaken in development of the 3M PPR and SQLape measures.[41, 46] However, the 3M PPR is a proprietary system that has low specificity and a high false‐positive rate for identifying preventable readmissions when compared to clinical review.[42] Moreover, neither measure has yet achieved the consensus required for widespread adoption in the United States. What is needed is a nonproprietary listing of related admission and readmission diagnoses, developed with the engagement of relevant stakeholders, that goes through a period of public comment and vetting by a body such as the NQF.
Until a validated measure of potentially preventable readmission can be developed, how could the current approach evolve toward preventability? The most feasible, rapidly implementable change would be to alter the readmission time horizon from 30 days to 7 or 15 days. A 30‐day period holds hospitals accountable for complications of outpatient care or new problems that may develop weeks after discharge. Even though this may foster shared accountability and collaboration among hospitals and outpatient or community settings, research has demonstrated that early readmissions (eg, within 715 days of discharge) are more likely preventable.[54] Second, consideration of the socioeconomic status of hospital patients, as recommended by MedPAC,[34] would improve on the current model by comparing hospitals to like facilities when determining penalties for excess readmission rates. Finally, adjustment for community factors, such as practice patterns and access to care, would enable readmission metrics to better reflect factors under the hospital's control.[32]
CONCLUSION
Holding hospitals accountable for the quality of acute and transitional care is an important policy initiative that has accelerated many improvements in discharge planning and care coordination. Optimally, the policies, public reporting, and penalties should target preventable readmissions, which may represent as little as one‐quarter of all readmissions. By summarizing some of the issues in defining preventability, we hope to foster continued refinement of quality metrics used in this arena.
Acknowledgements
We thank Eduard Vasilevskis, MD, MPH, for feedback on an earlier draft of this article. This manuscript was informed by a special report titled Preventable Readmissions, written by Julia Lavenberg, Joel Betesh, David Goldmann, Craig Kean, and Kendal Williams of the Penn Medicine Center for Evidence‐based Practice. The review was performed at the request of the Penn Medicine Chief Medical Officer Patrick J. Brennan to inform the development of local readmission prevention metrics, and is available at
Disclosures
Dr. Umscheid's contribution to this project was supported in part by the National Center for Research Resources and the National Center for Advancing Translational Sciences, National Institutes of Health, through grant UL1TR000003. Dr. Kripalani receives support from the National Heart, Lung, and Blood Institute of the National Institutes of Health under award number R01HL109388, and from the Centers for Medicare and Medicaid Services under awards 1C1CMS331006‐01 and 1C1CMS330979‐01. The content is solely the responsibility of the authors and does not necessarily represent the official views of the National Institutes of Health or Centers for Medicare and Medicaid Services.
- , . Physician Visits After Hospital Discharge: Implications for Reducing Readmissions. Washington, DC: National Institute for Health Care Reform; 2011. Report no. 6.
- , , . Rehospitalizations among patients in the Medicare fee‐for‐service program. N Engl J Med. 2009;360(14):1418–1428.
- Centers for Medicare and Medicaid Services, US Department of Health and Human Services. Medicare program: hospital inpatient prospective payment systems for acute care hospitals and the long‐term care hospital prospective payment system and FY 2012 rates. Fed Regist. 2011;76(160):51476–51846.
- , , , , , . Quality collaboratives and campaigns to reduce readmissions: what strategies are hospitals using? J Hosp Med. 2013;8:601–608.
- , , , , . Contemporary data about hospital strategies to reduce unplanned readmissions: what has changed [research letter]? JAMA Intern Med. 2014;174(1):154–156.
- , , , , . Interventions to reduce 30‐day rehospitalization: a systematic review. Ann Intern Med. 2011;155(8):520–528.
- , , , . Comparing methods to calculate hospital‐specific rates of early death or urgent readmission. CMAJ. 2012;184(15):E810–E817.
- , , , , . Proportion of hospital readmissions deemed avoidable: a systematic review. CMAJ. 2011;183(7):E391–E402.
- , , , et al. Risk prediction models for hospital readmission: a systematic review. JAMA. 2011;306(15):1688–1698.
- National Quality Forum. Patient outcomes: all‐cause readmissions expedited review 2011. Available at: http://www.qualityforum.org/WorkArea/linkit.aspx?LinkIdentifier=id60(7):607–614.
- , , , , , . Data shows reduction in Medicare hospital readmission rates during 2012. Medicare Medicaid Res Rev. 2013;3(2):E1–E11.
- , . Thirty‐day readmissions—truth and consequences. N Engl J Med. 2012;366(15):1366–1369.
- , , , . Moving beyond readmission penalties: creating an ideal process to improve transitional care. J Hosp Med. 2013;8(2):102–109.
- , . A path forward on Medicare readmissions. N Engl J Med. 2013;368(13):1175–1177.
- American Hospital Association. TrendWatch: examining the drivers of readmissions and reducing unnecessary readmissions for better patient care. Washington, DC: American Hospital Association; 2011.
- , , , et al. Diagnoses and timing of 30‐day readmissions after hospitalization for heart failure, acute myocardial infarction, or pneumonia. JAMA. 2013;309(4):355–363.
- , . Characteristics of hospitals receiving penalties under the hospital readmissions reduction program. JAMA. 2013;309(4):342–343.
- , , , , , , et al. Identifying potentially preventable readmissions. Health Care Financ Rev. 2008;30(1):75–91.
- , , , et al. Use of hospital‐based acute care among patients recently discharged from the hospital. JAMA. 2013;309(4):364–371.
- , , , . Reducing hospital readmission rates: current strategies and future directions. Annu Rev Med. 2014;65:471–485.
- , , , et al. Relationship between hospital readmission and mortality rates for patients hospitalized with acute myocardial infarction, heart failure, or pneumonia. JAMA. 2013;309(6):587–593.
- , , , et al. Hospital performance measures and 30‐day readmission rates. J Gen Intern Med. 2013;28(3):377–385.
- , , , . Limitations of using same‐hospital readmission metrics. Int J Qual Health Care. 2013;25(6):633–639.
- , , , et al. Is same‐hospital readmission rate a good surrogate for all‐hospital readmission rate? Med Care. 2010;48(5):477–481.
- , , . The relationship between hospital admission rates and rehospitalizations. N Engl J Med. 2011;365(24):2287–2295.
- . Community factors and hospital readmission rates [published online April 9, 2014]. Health Serv Res. doi: 10.1111/1475–6773.12177.
- American Hospital Association. Hospital readmissions reduction program: factsheet. American Hospital Association. Available at: http://www.aha.org/content/13/fs‐readmissions.pdf. Published April 14, 2014. Accessed May 5, 2014.
- Medicare Payment Advisory Commission. Report to the congress: Medicare and the health care delivery system. Available at: http://www.medpac.gov/documents/Jun13_EntireReport.pdf. Published June 14, 2013. Accessed May 5, 2014.
- , , . Sharp rise in Medicare enrollees being held in hospitals for observation raises concerns about causes and consequences. Health Aff (Millwood). 2012;31(6):1251–1259.
- , , . Quality improvement of care transitions and the trend of composite hospital care. JAMA. 2014;311(10):1013–1014.
- , . When projecting required effectiveness of interventions for hospital readmission reduction, the percentage that is potentially avoidable must be considered. J Clin Epidemiol. 2013;66(6):688–690.
- , , . Urgent readmission rates can be used to infer differences in avoidable readmission rates between hospitals. J Clin Epidemiol. 2012;65(10):1124–1130.
- , , , , . Proportion of hospital readmissions deemed avoidable: a systematic review. CMAJ. 2011;183(7):E391–E402.
- , , , , , . Measuring and preventing potentially avoidable hospital readmissions: a review of the literature. Hong Kong Med J. 2010;16(5):383–389.
- 3M Health Information Systems. Potentially preventable readmissions classification system methodology: overview. 3M Health Information Systems; May 2008. Report No.: GRP‐139. Available at: http://multimedia.3m.com/mws/mediawebserver?66666UuZjcFSLXTtNXMtmxMEEVuQEcuZgVs6EVs6E666666‐‐. Accessed June 8, 2014.
- , , , , , . Manual and automated methods for identifying potentially preventable readmissions: a comparison in a large healthcare system. BMC Med Inform Decis Mak. 2014;14:28.
- , , , , , , et al. Comparing 2 methods of assessing 30‐day readmissions: what is the impact on hospital profiling in the Veterans Health Administration? Med Care. 2013;51(7):589–596.
- , . It's not six of one, half‐dozen the other: a comparative analysis of 3 rehospitalization measurement systems for Massachusetts. Academy Health Annual Research Meeting. Seattle, WA. 2011. Available at: http://www.academyhealth.org/files/2011/tuesday/boutwell.pdf. Accessed May 9, 2014.
- , , , , , . Validation of the potentially avoidable hospital readmission rate as a routine indicator of the quality of hospital care. Med Care. 2006;44(11):972–981.
- , , , , , . Measuring potentially avoidable hospital readmissions. J Clin Epidemiol. 2002;55:573–587.
- , , , . Potentially avoidable 30‐day hospital readmissions in medical patients: derivation and validation of a prediction model. JAMA Intern Med. 2013;173(8):632–638.
- National Association of Public Hospitals and Health Systems. NAPH members focus on reducing readmissions. Available at: www.naph.org. Published June 2011. Accessed October 19, 2011.
- Agency for Healthcare Research and Quality. AHRQ quality indicators: prevention quality indicators. Available at: http://www.qualityindicators.ahrq.gov/Modules/pqi_resources.aspx. Accessed February 11, 2014.
- , , , , , . Shifting the dialogue from hospital readmissions to unplanned care. Am J Manag Care. 2013;19(6):450–453.
- . Post‐hospital syndrome—an acquired, transient condition of generalized risk. N Engl J Med. 2013;368(2):100–102.
- , . The hospital‐dependent patient. N Engl J Med. 2014;370(8):694–697.
- , , , et al. The hospital medicine reengineering network (HOMERuN): a learning organization focused on improving hospital care. Acad Med. 2014;89(3):415–420.
- , , , et al. Incidence of potentially avoidable urgent readmissions and their relation to all‐cause urgent readmissions. CMAJ. 2011;183(14):E1067–E1072.