User login
Moving Beyond Readmission Penalties
Containing the rise of healthcare costs has taken on a new sense of urgency in the wake of the recent economic recession and continued growth in the cost of healthcare. Accordingly, many stakeholders seek solutions to improve value (reducing costs while improving care)[1]; hospital readmissions, which are common and costly,[2] have emerged as a key target. The Centers for Medicare and Medicaid Services (CMS) have instituted several programs intended to reduce readmissions, including funding for community‐based, care‐transition programs; penalties for hospitals with elevated risk‐adjusted readmission rates for selected diagnoses; pioneer Accountable Care Organizations (ACOs) with incentives to reduce global costs of care; and Hospital Engagement Networks (HENs) through the Partnership for Patients.[3] A primary aim of these initiatives is to enhance the quality of care transitions as patients are discharged from the hospital.
Though the recent focus on hospital readmissions has appropriately drawn attention to transitions in care, some have expressed concerns. Among these are questions about: 1) the extent to which readmissions truly reflect the quality of hospital care[4]; 2) the preventability of readmissions[5]; 3) limitations in risk‐adjustment techniques[6]; and 4) best practices for preventing readmissions.[7] We believe these concerns stem in part from deficiencies in the state of the science of transitional care, and that future efforts in this area will be hindered without a clear vision of an ideal transition in care. We propose the key components of an ideal transition in care and discuss the implications of this concept as it pertains to hospital readmissions.
THE IDEAL TRANSITION IN CARE
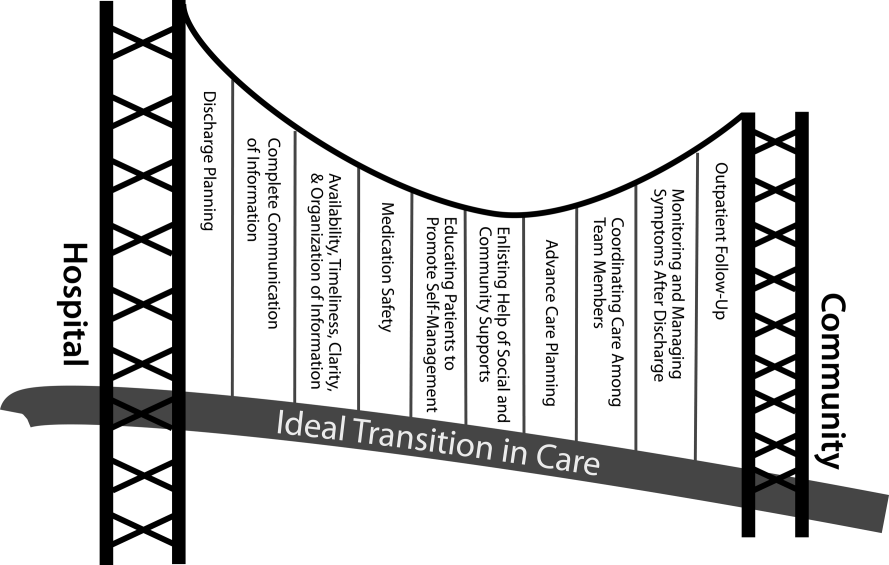
We propose the key components of an ideal transition in care in Figure 1 and Table 1. Figure 1 represents 10 domains described more fully below as structural supports of the bridge patients must cross from one care environment to another during a care transition. This figure highlights key domains and suggests that lack of a domain makes the bridge weaker and more prone to gaps in care and poor outcomes. It also implies that the more components are missing, the less safe is the bridge or transition. Those domains that mainly take place prior to discharge are placed closer to the hospital side of the bridge, those that mainly take place after discharge are placed closer to the community side of the bridge, while those that take place both prior to and after discharge are in the middle. Table 1 provides descriptions of the key content for each of these domains, as well as guidance about which personnel might be involved and where in the transition process that domain should be implemented. We support these domains with supporting evidence where available.
| Domain | Who | When | References |
|---|---|---|---|
| |||
| Discharge planning | |||
| Use a multidisciplinary team to create a discharge plan | Discharging clinician | Predischarge | 911 |
| Collaborate with PCP regarding discharge and follow‐up plan | Care managers/discharge planners | ||
| Arrange follow‐up appointments prior to discharge | Nurses | ||
| Make timely appointments for follow‐up care | |||
| Make appointments that take patient and caregiver's schedules and transportation needs into account | |||
| Complete communication of information | |||
| Includes: | Discharging clinician | Time of discharge | 1214 |
| Patient's full name | |||
| Age | |||
| Dates of admission and discharge | |||
| Names of responsible hospital physicians | |||
| Name of physician preparing discharge summary | |||
| Name of PCP | |||
| Main diagnosis | |||
| Other relevant diagnoses, procedures, and complications | |||
| Relevant findings at admission | |||
| Treatment and response for each active problem | |||
| Results of procedures and abnormal laboratory test results | |||
| Recommendations of any subspecialty consultants | |||
| Patient's functional status at discharge | |||
| Discharge medications | |||
| Follow‐up appointments made and those to be made | |||
| Tests to be ordered and pending tests to be followed‐up | |||
| Counseling provided to patient and caregiver, when applicable | |||
| Contingency planning | |||
| Code status | |||
| Availability, timeliness, clarity, and organization of information | |||
| Timely communication with postdischarge providers verbally (preferred) or by fax/e‐mail | Discharging clinician | Time of discharge | 1214 |
| Timely completion of discharge summary and reliable transmission to postdischarge providers | |||
| Availability of information in medical record | |||
| Use of a structured template with subheadings in discharge communication | |||
| Medication safety | |||
| Take an accurate preadmission medication history | Clinicians | Admission | 1521 |
| Reconcile preadmission medications with all ordered medications at all transfers in care, including discharge | Pharmacists | Throughout hospitalization | |
| Communicate discharge medications to all outpatient providers, including all changes and rationale for those changes | Nurses | Time of discharge | |
| Educating patients, promoting self‐management | |||
| Focus discharge counseling on major diagnoses, medication changes, dates of follow‐up appointments, self‐care instructions, warning signs and symptoms, and who to contact for problems | Clinicians | Daily | 911, 2228, 30 |
| Include caregivers as appropriate | Nurses | Time of discharge | |
| Ensure staff members provide consistent messages | Care managers/discharge planners | Postdischarge | |
| Provide simply written patient‐centered materials with instructions | Transition coaches | ||
| Use teach‐back methods to confirm understanding | |||
| Encourage questions | |||
| Continue teaching during postdischarge follow‐up | |||
| Use transition coaches in high‐risk patients: focus on medication management, keeping a personal medical record, follow‐up appointments, and knowledge of red flags | |||
| Enlisting help of social and community supports | |||
| Assess needs and appropriately arrange for home services | Clinicians | Predischarge and postdischarge | 29, 30 |
| Enlist help of caregivers | Nurses | ||
| Enlist help of community supports | Care managers | ||
| Home health staff | |||
| Advanced care planning | |||
| Establish healthcare proxy | Clinicians | Predischarge and postdischarge | 31, 32 |
| Discuss goals of care | Palliative care staff | ||
| Palliative care consultation (if appropriate) | Social workers | ||
| Enlist hospice services (if appropriate) | Nurses | ||
| Hospice workers | |||
| Coordinating care among team members | |||
| Share medical records | Clinicians | Predischarge and postdischarge | 33 |
| Communicate involving all team members | Nurses | ||
| Optimize continuity of providers and formal handoffs of care | Office personnel | ||
| IT staff | |||
| Monitoring and managing symptoms after discharge | |||
| Monitor for: | Clinicians | Postdischarge | 1113, 28, 3436 |
| Worsening disease control | Nurses | ||
| Medication side effects, discrepancies, nonadherence | Pharmacists | ||
| Therapeutic drug monitoring | Care managers | ||
| Inability to manage conditions at home | Visiting nurses and other home health staff | ||
| Via: | |||
| Postdischarge phone calls | |||
| Home visits | |||
| Postdischarge clinic visits | |||
| Patient hotline | |||
| Availability of inpatient providers after discharge | |||
| Follow‐up with outpatient providers | |||
| Within an appropriate time frame (eg, 7 d or sooner for high‐risk patients) | Clinicians | Postdischarge | 3740 |
| With appropriate providers (eg, most related to reasons for hospitalization, who manage least stable conditions, and/or PCP) | Nurses Pharmacists | ||
| Utilize multidisciplinary teams as appropriate | Care managers | ||
| Ensure appropriate progress along plan of care and safe transition | Office personnel | ||
| Other clinical staff as appropriate | |||
Our concept of an ideal transition in care began with work by Naylor, who described several important components of a safe transition in care, including complete communication of information, patient education, enlisting the help of social and community supports, ensuring continuity of care, and coordinating care among team members.[8] It is supplemented by the Transitions of Care Consensus Policy Statement proposed by representatives from hospital medicine, primary care, and emergency medicine, which emphasized aspects of timeliness and content of communication between providers.[9] Our present articulation of these key components includes 10 organizing domains.
The Discharge Planning domain highlights the important principle of planning ahead for hospital discharge while the patient is still being treated in the hospital, a paradigm espoused by Project RED[10] and other successful care transitions interventions.[11, 12] Collaborating with the outpatient provider and taking the patient and caregiver's preferences for appointment scheduling into account can help ensure optimal outpatient follow‐up.
Complete Communication of Information refers to the content that should be included in discharge summaries and other means of information transfer from hospital to postdischarge care. The specific content areas are based on the Society of Hospital Medicine and Society of General Internal Medicine Continuity of Care Task Force systematic review and recommendations,[13] which takes into account information requested by primary care physicians after discharge.
Availability, Timeliness, Clarity, and Organization of that information is as important as the content because postdischarge providers must be able to access and quickly understand the information they have been provided before assuming care of the patient.[14, 15]
The Medication Safety domain is of central importance because medications are responsible for most postdischarge adverse events.[16] Taking an accurate medication history,[17] reconciling changes throughout the hospitalization,[18] and communicating the reconciled medication regimen to patients and providers across transitions of care can reduce medication errors and improve patient safety.[19, 20, 21, 22]
The Patient Education and Promotion of Self‐Management domain involves teaching patients and their caregivers about the main hospital diagnoses and instructions for self‐care, including medication changes, appointments, and whom to contact if issues arise. Confirming comprehension of instructions through assessments of acute (delirium) and chronic (dementia) cognitive impairments[23, 24, 25, 26] and teach‐back from the patient (or caregiver) is an important aspect of such counseling, as is providing patients and caregivers with educational materials that are appropriate for their level of health literacy and preferred language.[14] High‐risk patients may benefit from patient coaching to improve their self‐management skills.[12] These recommendations are based on years of health literacy research,[27, 28, 29] and such elements are generally included in effective interventions (including Project RED,[10] Naylor and colleagues' Transitional Care Model,[11] and Coleman and colleagues' Care Transitions Intervention[12]).
Enlisting the help of Social and Community Supports is an important adjunct to medical care and is the rationale for the recent increase in CMS funding for community‐based, care‐transition programs. These programs are crucial for assisting patients with household activities, meals, and other necessities during the period of recovery, though they should be distinguished from care management or care coordination interventions, which have not been found to be helpful in preventing readmissions unless high touch in nature.[30, 31]
The Advanced Care Planning domain may begin in the hospital or outpatient setting, and involves establishing goals of care and healthcare proxies, as well as engaging with palliative care or hospice services if appropriate. Emerging evidence supports the intuitive conclusion that this approach prevents readmissions, particularly in patients who do not benefit from hospital readmission.[32, 33]
Attention to the Coordinating Care Among Team Members domain is needed to synchronize efforts across settings and providers. Clearly, many healthcare professionals as well as other involved parties can be involved in helping a single patient during transitions in care. It is vital that they coordinate information, assessments, and plans as a team.[34]
We recognize the domain of Monitoring and Managing Symptoms After Discharge as increasingly crucial as reflected in our growing understanding of the reasons for readmission, especially among patients with fragile conditions such as heart failure, chronic lung disease, gastrointestinal disorders, dementia,[23, 24, 25, 26] and vascular disease.[35] Monitoring for new or worsening symptoms; medication side effects, discrepancies, or nonadherence; and other self‐management challenges will allow problems to be detected and addressed early, before they result in unplanned healthcare utilization. It is noteworthy that successful interventions in this regard rely on in‐home evaluation[13, 14, 29] by nurses rather than telemonitoring, which in isolation has not been effective to date.[36, 37]
Finally, optimal Outpatient Follow‐Up with appropriate postdischarge providers is crucial for providing ideal transitions. These appointments need to be prompt[38, 39] (eg, within 7 days if not sooner for high‐risk patients) and with providers who have a longitudinal relationship to the patient, as prior work has shown increased readmissions when the provider is unfamiliar with the patient.[40] The advantages and disadvantages of hospitalist‐run postdischarge clinics as one way to increase access and expedite follow‐up are currently being explored. Although the optimal content of a postdischarge visit has not been defined, logical tasks to be completed are myriad and imply the need for checklists, adequate time, and a multidisciplinary team of providers.[41]
IMPLICATIONS OF THE IDEAL TRANSITION IN CARE
Our conceptualization of an ideal transition in care provides insight for hospital and healthcare system leadership, policymakers, researchers, clinicians, and educators seeking to improve transitions of care and reduce hospital readmissions. In the sections below, we briefly review commonly cited concerns about the recent focus on readmissions as a quality measure, illustrate how the Ideal Transition in Care addresses these concerns, and propose fruitful areas for future work.
How Does the Framework Address the Extent to Which Readmissions Reflect Hospital Quality?
One of the chief problems with readmissionrates as a hospital quality measure is that many of the factors that influence readmission may not currently be under the hospital's control. The healthcare environment to which a patient is being discharged (and was admitted from in the first place) is an important determinant of readmission.[42] In this context, it is noteworthy that successful interventions to reduce readmission are generally those that focus on outpatient follow‐up, while inpatient‐only interventions have had less success.[7] This is reflected in our framework above, informed by the literature, highlighting the importance of coordination between inpatient and outpatient providers and the importance of postdischarge care, including monitoring and managing symptoms after discharge, prompt follow‐up appointments, the continuation of patient self‐management activities, monitoring for drug‐related problems after discharge, and the effective utilization of community supports. Accountable care organizations, once established, would be responsible for several components of this environment, including the provision of prompt and effective follow‐up care.
The implication of the framework is that if a hospital does not have control over most of the factors that influence its readmission rate, it should see financial incentives to reduce readmission rates as an opportunity to invest in relationships with the outpatient environment from which their patients are admitted and to which they are discharged. One can envision hospitals growing ever‐closer relationships with their network of primary care physician groups, community agencies, and home health services, rehabilitation facilities, and nursing homes through coordinated discharge planning, medication management, patient education, shared electronic medical records, structured handoffs in care, and systems of intensive outpatient monitoring. Our proposed framework, in other words, emphasizes that hospitals cannot reduce their readmission rates by focusing on aspects of care within their walls. They must forge new and stronger relationships with their communities if they are to be successful.
How Does the Framework Help Us Understand Which Readmissions Are Preventable?
Public reporting and financial penalties are currently tied to all‐cause readmission, but preventable readmissions are a more appealing outcome to target. In one study, the ranking of hospitals by all‐cause readmission rate had very little correlation with the ranking by preventable readmission rate.[5] However, researchers have struggled to establish standardized, valid, and reliable measures for determining what proportion of readmissions are in fact preventable, with estimates ranging from 5% to 79% in the published literature.[43]
The difficulty of accurately determining preventability stems from an inadequate understanding of the roles that patient comorbidities, transitional processes of care, individual patient behaviors, and social and environmental determinants of health play in the complex process of hospital recidivism. Our proposed elements of an ideal transition in care provide a structure to frame this discussion and suggest future research opportunities to allow a more accurate and reliable understanding of the spectrum of preventability. Care system leadership can use the framework to rigorously evaluate their readmissions and determine the extent to which the transitions process approached the ideal. For example, if a readmission occurs despite care processes that addressed most of the domains with high fidelity, it becomes much less likely that the readmission was preventable. It should be noted that the converse is not always true: When a transition falls well short of the ideal, it does not always imply that provision of a more ideal transition would necessarily have prevented the readmission, but it does make it more likely.
For educators, the framework may provide insights for trainees into the complexity of the transitions process and vulnerability of patients during this time, highlighting preventable aspects of readmissions that are within the grasp of the discharging clinician or team. It highlights the importance of medication reconciliation, synchronous communication, and predischarge teaching, which are measurable and teachable skills for non‐physician providers, housestaff, and medical students. It also may allow for more structured feedback, for example, on the quality of discharge summaries produced by trainees.
How Could the Framework Improve Risk Adjustment for Between‐Hospital Comparisons?
Under the Patient Protection and Affordable Care Act (PPACA), hospitals will be compared to one another using risk‐standardized readmission rates as a way to penalize poorly performing hospitals. However, risk‐adjustment models have only modest ability to predict hospital readmission.[6] Moreover, current approaches predominantly adjust for patients' medical comorbidities (which are easily measurable), but they do not adequately take into account the growing literature on other factors that influence readmission rates, including a patient's health literacy, visual or cognitive impairment, functional status, language barriers, and community‐level factors such as social supports.[44, 45]
The Ideal Transition of Care provides a comprehensive framework of hospital discharge quality that provides additional process measures on which hospitals could be compared rather than focusing solely on (inadequately) risk‐adjusted readmission rates. Indeed, most other quality and safety measures (such as the National Quality Forum's Safe Practices[46] and The Joint Commission's National Patient Safety Goals),[47] emphasize process over outcome, in part because of issues of fairness. Process measures are less subject to differences in patient populations and also change the focus from simply reducing readmissions to improving transitional care more broadly. These process measures should be based on our framework and should attempt to capture as many dimensions of an optimal care transition as possible.
Possible examples of process measures include: the accuracy of medication reconciliation at admission and discharge; provision of prompt outpatient follow‐up; provision of adequate systems to monitor and manage symptoms after discharge; advanced care planning in appropriate patients; and the quality of discharge education, incorporating measurements of the patient's understanding and ability to self‐manage their illness. At least some of these could be used now as part of a performance measurement set that highlights opportunities for immediate system change and can serve as performance milestones.
The framework could also be used to validate risk‐adjustment techniques. After accounting for patient factors, the remaining variability in outcomes should be accounted for by processes of care that are in the transitions framework. Once these processes are accurately measured, one can determine if indeed the remaining variability is due to transitions processes, or rather unaccounted factors that are not being measured and that hospitals may have little control over. Such work can lead to iterative refinement of patient risk‐adjustment models.
What Does the Framework Imply About Best Practices for Reducing Readmission Rates?
Despite the limitations of readmission rates as a quality measure noted above, hospitals presently face potentially large financial penalties for readmissions and are allocating resources to readmission reduction efforts. However, hospitals currently may not have enough guidance to know what actions to take to reduce readmissions, and thus could be spending money inefficiently and reducing the value proposition of focusing on readmissions.
A recent systematic review of interventions hospitals could employ to reduce readmissions identified several positive studies, but also many negative studies, and there were significant barriers to understanding what works to reduce readmissions.[7] For example, most of the interventions described in both positive and negative studies were multifaceted, and the authors were unable to identify which components of the intervention were most effective. Also, while several studies have identified risk factors for readmission,[6, 48, 49] very few studies have identified which subgroups of patients benefit most from specific interventions. Few of the studies described key contextual factors that may have led to successful or failed implementation, or the fidelity with which the intervention was implemented.[50, 51, 52]
Few if any of the studies were guided by a concept of the ideal transition in care.[10] Such a framework will better guide development of multifaceted interventions and provide an improved means for interpreting the results. Clearly, rigorously conducted, multicenter studies of readmission prevention interventions are needed to move the field forward. These studies should: 1) correlate implementation of specific intervention components with reductions in readmission rates to better understand the most effective components; 2) be adequately powered to show effect modification, ie, which patients benefit most from these interventions; and 3) rigorously measure environmental context and intervention fidelity, and employ mixed methods to better understand predictors of implementation success and failure.
Our framework can be used in the design and evaluation of such interventions. For example, interventions could be designed that incorporate as many of the domains of an ideal transition as possible, in particular those that span the inpatient and outpatient settings. Processes of care metrics can be developed that measure the extent to which each domain is delivered, analogous to the way the Joint Commission might aggregate individual scores on the 10 items in Acute Myocardial Infarction Core Measure Set[53] to provide a composite of the quality of care provided to patients with this diagnosis. These can be used to correlate certain intervention components with success in reducing readmissions and also in measuring intervention fidelity.
NEXT STEPS
For hospital and healthcare system leaders, who need to take action now to avoid financial penalties, we recommend starting with proven, high‐touch interventions such as Project RED and the Care Transitions Intervention, which are durable, cost‐effective, robustly address multiple domains of the Ideal Transition in Care, and have been implemented at numerous sites.[54, 55] Each hospital or group will need to decide on a bundle of interventions and customize them based on local workflow, resources, and culture.
Risk‐stratification, to match the intensity of the intervention to the risk of readmission of the patient, will undoubtedly be a key component for the efficient use of resources. We anticipate future research will allow risk stratification to be a robust part of any implementation plan. However, as noted above, current risk prediction models are imperfect,[6] and more work is needed to determine which patients benefit most from which interventions. Few if any studies have described interventions tailored to risk for this reason.
Based on our ideal transition in care, our collective experience, and published evidence,[7, 10, 11, 12] potential elements to start with include: early discharge planning; medication reconciliation[56]; patient/caregiver education using health literacy principles, cognitive assessments, and teach‐back to confirm understanding; synchronous communication (eg, by phone) between inpatient and postdischarge providers; follow‐up phone calls to patients within 72 hours of discharge; 24/7 availability of a responsible inpatient provider to address questions and problems (both from the patient/caregiver and from postdischarge providers); and prompt appointments for patients discharged home. High‐risk patients will likely require additional interventions, including in‐home assessments, disease‐monitoring programs, and/or patient coaching. Lastly, patients with certain conditions prone to readmission (such as heart failure and chronic obstructive pulmonary disease) may benefit from disease‐specific programs, including patient education, outpatient disease management, and monitoring protocols.
It is likely that the most effective interventions are those that come from combined, coordinated interventions shared between inpatient and outpatient settings, and are intensive in nature. We expect that the more domains in the framework that are addressed, the safer and more seamless transitions in care will be, with improvement in patient outcomes. To the extent that fragmentation of care has been a barrier to the implementation of these types of interventions in the past, ACOs, perhaps with imbedded Patient‐Centered Medical Homes, may be in the best position to take advantage of newly aligned financial incentives to design comprehensive transitional care. Indeed, we anticipate that Figure 1 may provide substrate for a discussion of postdischarge care and division of responsibilities between inpatient and outpatient care teams at the time of transition, so effort is not duplicated and multiple domains are addressed.
Other barriers to implementation of ideal transitions in care will continue to be an issue for most healthcare systems. Financial constraints that have been a barrier up until now will be partially overcome by penalties for high readmission rates and by ACOs, bundled payments, and alternative care contracts (ie, global payments), but the extent to which each institution feels rewarded for investing in transitional interventions will vary greatly. Healthcare leadership that sees the value of improving transitions in care will be critical to overcoming this barrier. Competing demands (such as lowering hospital length of stay and carrying out other patient care responsibilities),[57] lack of coordination and diffusion of responsibility among various clinical personnel, and lack of standards are other barriers[58] that will require clear prioritization from leadership, policy changes, team‐based care, provider education and feedback, and adequate allocation of personnel resources. In short, process redesign using continuous quality improvement efforts and effective tools will be required to maximize the possibility of success.
CONCLUSIONS
Readmissions are costly and undesirable. Intuition suggests they are a marker of poor care and that hospitals should be capable of reducing them, thereby improving care and decreasing costs. In a potential future world of ACOs based on global payments, financial incentives would be aligned for each system to reduce readmissions below their current baseline, therefore obviating the need for external financial rewards and penalties. In the meantime, financial penalties do exist, and controversy exists over their fairness and likelihood of driving appropriate behavior. To address these controversies and promote better transitional care, we call for the development and use of multifaceted, collaborative transitions interventions that span settings, risk‐adjustment models that allow for fairer comparisons among hospitals, better and more widespread measurement of processes of transitional care, a better understanding of what interventions are most effective and in whom, and better guidance in how to implement these interventions. Our conceptualization of an ideal transition of care serves as a guide and provides a common vocabulary for these efforts. Such research is likely to produce the knowledge needed for healthcare systems to improve transitions in care, reduce readmissions, and reduce costs.
Disclosure
Funding for Dr Vasilevskis has been provided by the National Institutes of Health (K23AG040157) and the VA Tennessee Valley Geriatric Research, Education and Clinical Center (GRECC). The content is solely the responsibility of the authors and does not necessarily represent the official views of the National Institute on Aging, the National Institutes of Health, or the US Department of Veterans Affairs.
- , . Redefining Health Care: Creating Value‐Based Competition on Results. Boston, MA:Harvard Business School Press;2006.
- , , . Rehospitalizations among patients in the Medicare fee‐for‐service program. N Engl J Med. 2009;360(14):1418–1428.
- Patient Protection and Affordable Care Act (PPACA). Public Law 111–148; 2010. Available at: http://www.gpo.gov/fdsys/pkg/PLAW‐111publ148/pdf/PLAW‐111publ148.pdf. Accessed on June 4, 2012.
- , . Hospital readmission as an accountability measure. JAMA. 2011;305(5):504–505.
- , , , et al. Incidence of potentially avoidable urgent readmissions and their relation to all‐cause urgent readmissions. Can Med Assoc J. 2011;183(14):E1067–E1072.
- , , , et al. Risk prediction models for hospital readmission: a systematic review. JAMA. 2011;306(15):1688–1698.
- , , , , . Interventions to reduce 30‐day rehospitalization: a systematic review. Ann Intern Med. 2011;155(8):520–528.
- . A decade of transitional care research with vulnerable elders. J Cardiovasc Nurs. 2000;14(3):1–14.
- , , , et al;for the American College of Physicians; Society of General Internal Medicine; Society of Hospital Medicine; American Geriatrics Society; American College of Emergency Physicians; Society of Academic Emergency Medicine. Transitions of Care Consensus Policy Statement American College of Physicians–Society of General Internal Medicine–Society of Hospital Medicine–American Geriatrics Society–American College of Emergency Physicians–Society of Academic Emergency Medicine. J Gen Intern Med. 2009;24(8):971–976.
- , , , et al. A reengineered hospital discharge program to decrease rehospitalization: a randomized trial. Ann Intern Med. 2009;150(3):178–187.
- , , , et al. Comprehensive discharge planning and home follow‐up of hospitalized elders: a randomized clinical trial. JAMA. 1999;281(7):613–620.
- , , , . The care transitions intervention: results of a randomized controlled trial. Arch Intern Med. 2006;166(17):1822–1828.
- , , , , , . Deficits in communication and information transfer between hospital‐based and primary care physicians: implications for patient safety and continuity of care. JAMA. 2007;297(8):831–841.
- , , , . Promoting effective transitions of care at hospital discharge: a review of key issues for hospitalists. J Hosp Med. 2007;2(5):314–323.
- , , , , , . Discharge documentation of patients discharged to subacute facilities: a three‐year quality improvement process across an integrated health care system. Jt Comm J Qual Patient Saf. 2010;36(6):243–251.
- , , , , . The incidence and severity of adverse events affecting patients after discharge from the hospital. Ann Intern Med. 2003;138(3):161–167.
- , , , , , . Frequency, type and clinical importance of medication history errors at admission to hospital: a systematic review. Can Med Assoc J. 2005;173(5):510–515.
- , , , et al. Classifying and predicting errors of inpatient medication reconciliation. J Gen Intern Med. 2008;23(9):1414–1422.
- , , et al;for the PILL‐CVD (Pharmacist Intervention for Low Literacy in Cardiovascular Disease) Study Group. Effect of a pharmacist intervention on clinically important medication errors after hospital discharge: a randomized trial. Ann Intern Med. 2012;157(1):1–10.
- , , , . Hospital‐based medication reconciliation practices: a systematic review. Arch Intern Med. 2012;172(14):1057–1069.
- , , , et al. Effect of an electronic medication reconciliation application and process redesign on potential adverse drug events: a cluster‐randomized trial. Arch Intern Med. 2009;169(8):771–780.
- , , , et al. Role of pharmacist counseling in preventing adverse drug events after hospitalization. Arch Intern Med. 2006;166(5):565–571.
- , , , , . Insufficient help for activity of daily living disabilities and risk of all–cause hospitalization. J Am Geriatr Soc. 2012;60(5):927–933.
- , , , et al. Transitions in care for older adults with and without dementia. J Am Geriatr Soc. 2012;60(5):813–820.
- , , , , . Association of incident dementia with hospitalizations. JAMA. 2012;307(2):165–172.
- , , , et al. Potentially avoidable hospitalizations of dually eligible Medicare and Medicaid beneficiaries from nursing facility and home– and community–based services waiver programs. J Am Geriatr Soc. 2012;60(5):821–829.
- , . Teaching about health literacy and clear communication. J Gen Intern Med. 2006;21(8):888–890.
- , , , et al. Health literacy and outcomes among patients with heart failure. JAMA. 2011;305(16):1695–1701.
- , , , , . Patient experiences of transitioning from hospital to home: an ethnographic quality improvement project. J Hosp Med. 2012;7(5):382–387.
- , , , . Effects of care coordination on hospitalization, quality of care, and health care expenditures among Medicare beneficiaries: 15 randomized trials. JAMA. 2009;301(6):603–618.
- , , , , . How changes in Washington University's Medicare coordinated care demonstration pilot ultimately achieved savings. Health Aff (Millwood). 2012;31(6):1216–1226.
- , , , et al. Quality of care and rehospitalization rate in the last stage of disease in brain tumor patients assisted at home: a cost effectiveness study. J Palliat Med. 2012;15(2):225–227.
- , , , , . Inpatient palliative care consults and the probability of hospital readmission. Perm J. 2011;15(2):48–51.
- , , , et al. TeamSTEPPS™: team strategies and tools to enhance performance and patient safety. In: Henriksen K, Battles JB, Keyes MA, Grady ML, ed. Advances in Patient Safety: New Directions and Alternative Approaches. Vol 3: Performance and Tools. Rockville, MD:Agency for Healthcare Research and Quality; August2008.
- , , , et al. Factors contributing to all‐cause 30‐day readmissions: a structured case series across 18 hospitals. Med Care. 2012;50(7):599–605.
- , , , et al. Telemonitoring in patients with heart failure [erratum, N Engl J Med. 2011;364(5):490]. N Engl J Med. 2010;363(24):2301–2309.
- , , , et al. A randomized controlled trial of telemonitoring in older adults with multiple health issues to prevent hospitalizations and emergency department visits. Arch Intern Med. 2012;172(10):773–779.
- , , , et al. Relationship between early physician follow‐up and 30‐day readmission among Medicare beneficiaries hospitalized for heart failure. JAMA. 2010;303(17):1716–1722.
- , , . Post‐hospitalization transitions: examining the effects of timing of primary care provider follow‐up. J Hosp Med. 2010;5(7):392–397.
- , , . Does increased access to primary care reduce hospital readmissions? Veterans Affairs Cooperative Study Group on Primary Care and Hospital Readmission. N Engl J Med. 1996;334(22):1441–1447.
- . The Post‐Hospital Follow‐Up Visit: A Physician Checklist to Reduce Readmissions. California Healthcare Foundation; October 2010. Available at: http://www.chcf.org/publications/2010/10/the‐post‐hospital‐follow‐up‐visit‐a‐physician‐checklist. Accessed on January 10, 2012.
- , , . Thirty‐day readmission rates for Medicare beneficiaries by race and site of care. JAMA. 2011;305(7):675–681.
- , , , , . Proportion of hospital readmissions deemed avoidable: a systematic review. Can Med Assoc J. 2011;183(7):E391–E402.
- , , , et al. Postdischarge environmental and socioeconomic factors and the likelihood of early hospital readmission among community‐dwelling Medicare beneficiaries. Gerontologist. 2008;48(4):495–504.
- , , , , . Low health literacy and health outcomes: an updated systematic review. Ann Intern Med. 2011;155(2):97–107.
- National Quality Forum. Safe Practices for Better Healthcare—2010 Update: A Consensus Report. Washington, DC;2010.
- Joint Commission on Accreditation of Healthcare Organizations. Accreditation Program: Hospital 2010 National Patient Safety Goals (NPSGs). 2010. Available at: http://www.jointcommission.org/PatientSafety/NationalPatientSafetyGoals/. Accessed on March 20, 2012.
- , , , et al. Hospital readmission in general medicine patients: a prediction model. J Gen Intern Med. 2010;25(3):211–219.
- , , , et al. Derivation and validation of an index to predict early death or unplanned readmission after discharge from hospital to the community. Can Med Assoc J. 2010;182(6):551–557.
- , . Evaluating service delivery interventions to enhance patient safety. BMJ. 2008;337:a2764.
- , , . Assessing the Evidence for Context‐Sensitive Effectiveness and Safety of Patient Safety Practices: Developing Criteria. Rockville, MD:Agency for Healthcare Research and Quality; December2010.
- , , , et al. Advancing the science of patient safety. Ann Intern Med. 2011;154(10):693–696.
- The Joint Commission. Acute Myocardial Infarction Core Measure Set. Available at: http://www.jointcommission.org/assets/1/6/Acute%20Myocardial%20Infarction.pdf. Accessed August 20,2012.
- , , , , , . The care transitions intervention: translating from efficacy to effectiveness. Arch Intern Med. 2011;171(14):1232–1237.
- Project RED toolkit, AHRQ Innovations Exchange. Available at:http://www.innovations.ahrq.gov/content.aspx?id=2180. Accessed on July 2, 2012.
- , , , et al. A comprehensive pharmacist intervention to reduce morbidity in patients 80 years or older: a randomized controlled trial. Arch Intern Med. 2009;169(9):894–900.
- , . Thirty‐day readmissions—truth and consequences. N Engl J Med. 2012;366(15):1366–1369.
- , , , , . “Out of sight, out of mind”: housestaff perceptions of quality‐limiting factors in discharge care at teaching hospitals. J Hosp Med. 2012;7(5):376–381.
Containing the rise of healthcare costs has taken on a new sense of urgency in the wake of the recent economic recession and continued growth in the cost of healthcare. Accordingly, many stakeholders seek solutions to improve value (reducing costs while improving care)[1]; hospital readmissions, which are common and costly,[2] have emerged as a key target. The Centers for Medicare and Medicaid Services (CMS) have instituted several programs intended to reduce readmissions, including funding for community‐based, care‐transition programs; penalties for hospitals with elevated risk‐adjusted readmission rates for selected diagnoses; pioneer Accountable Care Organizations (ACOs) with incentives to reduce global costs of care; and Hospital Engagement Networks (HENs) through the Partnership for Patients.[3] A primary aim of these initiatives is to enhance the quality of care transitions as patients are discharged from the hospital.
Though the recent focus on hospital readmissions has appropriately drawn attention to transitions in care, some have expressed concerns. Among these are questions about: 1) the extent to which readmissions truly reflect the quality of hospital care[4]; 2) the preventability of readmissions[5]; 3) limitations in risk‐adjustment techniques[6]; and 4) best practices for preventing readmissions.[7] We believe these concerns stem in part from deficiencies in the state of the science of transitional care, and that future efforts in this area will be hindered without a clear vision of an ideal transition in care. We propose the key components of an ideal transition in care and discuss the implications of this concept as it pertains to hospital readmissions.
THE IDEAL TRANSITION IN CARE
We propose the key components of an ideal transition in care in Figure 1 and Table 1. Figure 1 represents 10 domains described more fully below as structural supports of the bridge patients must cross from one care environment to another during a care transition. This figure highlights key domains and suggests that lack of a domain makes the bridge weaker and more prone to gaps in care and poor outcomes. It also implies that the more components are missing, the less safe is the bridge or transition. Those domains that mainly take place prior to discharge are placed closer to the hospital side of the bridge, those that mainly take place after discharge are placed closer to the community side of the bridge, while those that take place both prior to and after discharge are in the middle. Table 1 provides descriptions of the key content for each of these domains, as well as guidance about which personnel might be involved and where in the transition process that domain should be implemented. We support these domains with supporting evidence where available.
| Domain | Who | When | References |
|---|---|---|---|
| |||
| Discharge planning | |||
| Use a multidisciplinary team to create a discharge plan | Discharging clinician | Predischarge | 911 |
| Collaborate with PCP regarding discharge and follow‐up plan | Care managers/discharge planners | ||
| Arrange follow‐up appointments prior to discharge | Nurses | ||
| Make timely appointments for follow‐up care | |||
| Make appointments that take patient and caregiver's schedules and transportation needs into account | |||
| Complete communication of information | |||
| Includes: | Discharging clinician | Time of discharge | 1214 |
| Patient's full name | |||
| Age | |||
| Dates of admission and discharge | |||
| Names of responsible hospital physicians | |||
| Name of physician preparing discharge summary | |||
| Name of PCP | |||
| Main diagnosis | |||
| Other relevant diagnoses, procedures, and complications | |||
| Relevant findings at admission | |||
| Treatment and response for each active problem | |||
| Results of procedures and abnormal laboratory test results | |||
| Recommendations of any subspecialty consultants | |||
| Patient's functional status at discharge | |||
| Discharge medications | |||
| Follow‐up appointments made and those to be made | |||
| Tests to be ordered and pending tests to be followed‐up | |||
| Counseling provided to patient and caregiver, when applicable | |||
| Contingency planning | |||
| Code status | |||
| Availability, timeliness, clarity, and organization of information | |||
| Timely communication with postdischarge providers verbally (preferred) or by fax/e‐mail | Discharging clinician | Time of discharge | 1214 |
| Timely completion of discharge summary and reliable transmission to postdischarge providers | |||
| Availability of information in medical record | |||
| Use of a structured template with subheadings in discharge communication | |||
| Medication safety | |||
| Take an accurate preadmission medication history | Clinicians | Admission | 1521 |
| Reconcile preadmission medications with all ordered medications at all transfers in care, including discharge | Pharmacists | Throughout hospitalization | |
| Communicate discharge medications to all outpatient providers, including all changes and rationale for those changes | Nurses | Time of discharge | |
| Educating patients, promoting self‐management | |||
| Focus discharge counseling on major diagnoses, medication changes, dates of follow‐up appointments, self‐care instructions, warning signs and symptoms, and who to contact for problems | Clinicians | Daily | 911, 2228, 30 |
| Include caregivers as appropriate | Nurses | Time of discharge | |
| Ensure staff members provide consistent messages | Care managers/discharge planners | Postdischarge | |
| Provide simply written patient‐centered materials with instructions | Transition coaches | ||
| Use teach‐back methods to confirm understanding | |||
| Encourage questions | |||
| Continue teaching during postdischarge follow‐up | |||
| Use transition coaches in high‐risk patients: focus on medication management, keeping a personal medical record, follow‐up appointments, and knowledge of red flags | |||
| Enlisting help of social and community supports | |||
| Assess needs and appropriately arrange for home services | Clinicians | Predischarge and postdischarge | 29, 30 |
| Enlist help of caregivers | Nurses | ||
| Enlist help of community supports | Care managers | ||
| Home health staff | |||
| Advanced care planning | |||
| Establish healthcare proxy | Clinicians | Predischarge and postdischarge | 31, 32 |
| Discuss goals of care | Palliative care staff | ||
| Palliative care consultation (if appropriate) | Social workers | ||
| Enlist hospice services (if appropriate) | Nurses | ||
| Hospice workers | |||
| Coordinating care among team members | |||
| Share medical records | Clinicians | Predischarge and postdischarge | 33 |
| Communicate involving all team members | Nurses | ||
| Optimize continuity of providers and formal handoffs of care | Office personnel | ||
| IT staff | |||
| Monitoring and managing symptoms after discharge | |||
| Monitor for: | Clinicians | Postdischarge | 1113, 28, 3436 |
| Worsening disease control | Nurses | ||
| Medication side effects, discrepancies, nonadherence | Pharmacists | ||
| Therapeutic drug monitoring | Care managers | ||
| Inability to manage conditions at home | Visiting nurses and other home health staff | ||
| Via: | |||
| Postdischarge phone calls | |||
| Home visits | |||
| Postdischarge clinic visits | |||
| Patient hotline | |||
| Availability of inpatient providers after discharge | |||
| Follow‐up with outpatient providers | |||
| Within an appropriate time frame (eg, 7 d or sooner for high‐risk patients) | Clinicians | Postdischarge | 3740 |
| With appropriate providers (eg, most related to reasons for hospitalization, who manage least stable conditions, and/or PCP) | Nurses Pharmacists | ||
| Utilize multidisciplinary teams as appropriate | Care managers | ||
| Ensure appropriate progress along plan of care and safe transition | Office personnel | ||
| Other clinical staff as appropriate | |||
Our concept of an ideal transition in care began with work by Naylor, who described several important components of a safe transition in care, including complete communication of information, patient education, enlisting the help of social and community supports, ensuring continuity of care, and coordinating care among team members.[8] It is supplemented by the Transitions of Care Consensus Policy Statement proposed by representatives from hospital medicine, primary care, and emergency medicine, which emphasized aspects of timeliness and content of communication between providers.[9] Our present articulation of these key components includes 10 organizing domains.
The Discharge Planning domain highlights the important principle of planning ahead for hospital discharge while the patient is still being treated in the hospital, a paradigm espoused by Project RED[10] and other successful care transitions interventions.[11, 12] Collaborating with the outpatient provider and taking the patient and caregiver's preferences for appointment scheduling into account can help ensure optimal outpatient follow‐up.
Complete Communication of Information refers to the content that should be included in discharge summaries and other means of information transfer from hospital to postdischarge care. The specific content areas are based on the Society of Hospital Medicine and Society of General Internal Medicine Continuity of Care Task Force systematic review and recommendations,[13] which takes into account information requested by primary care physicians after discharge.
Availability, Timeliness, Clarity, and Organization of that information is as important as the content because postdischarge providers must be able to access and quickly understand the information they have been provided before assuming care of the patient.[14, 15]
The Medication Safety domain is of central importance because medications are responsible for most postdischarge adverse events.[16] Taking an accurate medication history,[17] reconciling changes throughout the hospitalization,[18] and communicating the reconciled medication regimen to patients and providers across transitions of care can reduce medication errors and improve patient safety.[19, 20, 21, 22]
The Patient Education and Promotion of Self‐Management domain involves teaching patients and their caregivers about the main hospital diagnoses and instructions for self‐care, including medication changes, appointments, and whom to contact if issues arise. Confirming comprehension of instructions through assessments of acute (delirium) and chronic (dementia) cognitive impairments[23, 24, 25, 26] and teach‐back from the patient (or caregiver) is an important aspect of such counseling, as is providing patients and caregivers with educational materials that are appropriate for their level of health literacy and preferred language.[14] High‐risk patients may benefit from patient coaching to improve their self‐management skills.[12] These recommendations are based on years of health literacy research,[27, 28, 29] and such elements are generally included in effective interventions (including Project RED,[10] Naylor and colleagues' Transitional Care Model,[11] and Coleman and colleagues' Care Transitions Intervention[12]).
Enlisting the help of Social and Community Supports is an important adjunct to medical care and is the rationale for the recent increase in CMS funding for community‐based, care‐transition programs. These programs are crucial for assisting patients with household activities, meals, and other necessities during the period of recovery, though they should be distinguished from care management or care coordination interventions, which have not been found to be helpful in preventing readmissions unless high touch in nature.[30, 31]
The Advanced Care Planning domain may begin in the hospital or outpatient setting, and involves establishing goals of care and healthcare proxies, as well as engaging with palliative care or hospice services if appropriate. Emerging evidence supports the intuitive conclusion that this approach prevents readmissions, particularly in patients who do not benefit from hospital readmission.[32, 33]
Attention to the Coordinating Care Among Team Members domain is needed to synchronize efforts across settings and providers. Clearly, many healthcare professionals as well as other involved parties can be involved in helping a single patient during transitions in care. It is vital that they coordinate information, assessments, and plans as a team.[34]
We recognize the domain of Monitoring and Managing Symptoms After Discharge as increasingly crucial as reflected in our growing understanding of the reasons for readmission, especially among patients with fragile conditions such as heart failure, chronic lung disease, gastrointestinal disorders, dementia,[23, 24, 25, 26] and vascular disease.[35] Monitoring for new or worsening symptoms; medication side effects, discrepancies, or nonadherence; and other self‐management challenges will allow problems to be detected and addressed early, before they result in unplanned healthcare utilization. It is noteworthy that successful interventions in this regard rely on in‐home evaluation[13, 14, 29] by nurses rather than telemonitoring, which in isolation has not been effective to date.[36, 37]
Finally, optimal Outpatient Follow‐Up with appropriate postdischarge providers is crucial for providing ideal transitions. These appointments need to be prompt[38, 39] (eg, within 7 days if not sooner for high‐risk patients) and with providers who have a longitudinal relationship to the patient, as prior work has shown increased readmissions when the provider is unfamiliar with the patient.[40] The advantages and disadvantages of hospitalist‐run postdischarge clinics as one way to increase access and expedite follow‐up are currently being explored. Although the optimal content of a postdischarge visit has not been defined, logical tasks to be completed are myriad and imply the need for checklists, adequate time, and a multidisciplinary team of providers.[41]
IMPLICATIONS OF THE IDEAL TRANSITION IN CARE
Our conceptualization of an ideal transition in care provides insight for hospital and healthcare system leadership, policymakers, researchers, clinicians, and educators seeking to improve transitions of care and reduce hospital readmissions. In the sections below, we briefly review commonly cited concerns about the recent focus on readmissions as a quality measure, illustrate how the Ideal Transition in Care addresses these concerns, and propose fruitful areas for future work.
How Does the Framework Address the Extent to Which Readmissions Reflect Hospital Quality?
One of the chief problems with readmissionrates as a hospital quality measure is that many of the factors that influence readmission may not currently be under the hospital's control. The healthcare environment to which a patient is being discharged (and was admitted from in the first place) is an important determinant of readmission.[42] In this context, it is noteworthy that successful interventions to reduce readmission are generally those that focus on outpatient follow‐up, while inpatient‐only interventions have had less success.[7] This is reflected in our framework above, informed by the literature, highlighting the importance of coordination between inpatient and outpatient providers and the importance of postdischarge care, including monitoring and managing symptoms after discharge, prompt follow‐up appointments, the continuation of patient self‐management activities, monitoring for drug‐related problems after discharge, and the effective utilization of community supports. Accountable care organizations, once established, would be responsible for several components of this environment, including the provision of prompt and effective follow‐up care.
The implication of the framework is that if a hospital does not have control over most of the factors that influence its readmission rate, it should see financial incentives to reduce readmission rates as an opportunity to invest in relationships with the outpatient environment from which their patients are admitted and to which they are discharged. One can envision hospitals growing ever‐closer relationships with their network of primary care physician groups, community agencies, and home health services, rehabilitation facilities, and nursing homes through coordinated discharge planning, medication management, patient education, shared electronic medical records, structured handoffs in care, and systems of intensive outpatient monitoring. Our proposed framework, in other words, emphasizes that hospitals cannot reduce their readmission rates by focusing on aspects of care within their walls. They must forge new and stronger relationships with their communities if they are to be successful.
How Does the Framework Help Us Understand Which Readmissions Are Preventable?
Public reporting and financial penalties are currently tied to all‐cause readmission, but preventable readmissions are a more appealing outcome to target. In one study, the ranking of hospitals by all‐cause readmission rate had very little correlation with the ranking by preventable readmission rate.[5] However, researchers have struggled to establish standardized, valid, and reliable measures for determining what proportion of readmissions are in fact preventable, with estimates ranging from 5% to 79% in the published literature.[43]
The difficulty of accurately determining preventability stems from an inadequate understanding of the roles that patient comorbidities, transitional processes of care, individual patient behaviors, and social and environmental determinants of health play in the complex process of hospital recidivism. Our proposed elements of an ideal transition in care provide a structure to frame this discussion and suggest future research opportunities to allow a more accurate and reliable understanding of the spectrum of preventability. Care system leadership can use the framework to rigorously evaluate their readmissions and determine the extent to which the transitions process approached the ideal. For example, if a readmission occurs despite care processes that addressed most of the domains with high fidelity, it becomes much less likely that the readmission was preventable. It should be noted that the converse is not always true: When a transition falls well short of the ideal, it does not always imply that provision of a more ideal transition would necessarily have prevented the readmission, but it does make it more likely.
For educators, the framework may provide insights for trainees into the complexity of the transitions process and vulnerability of patients during this time, highlighting preventable aspects of readmissions that are within the grasp of the discharging clinician or team. It highlights the importance of medication reconciliation, synchronous communication, and predischarge teaching, which are measurable and teachable skills for non‐physician providers, housestaff, and medical students. It also may allow for more structured feedback, for example, on the quality of discharge summaries produced by trainees.
How Could the Framework Improve Risk Adjustment for Between‐Hospital Comparisons?
Under the Patient Protection and Affordable Care Act (PPACA), hospitals will be compared to one another using risk‐standardized readmission rates as a way to penalize poorly performing hospitals. However, risk‐adjustment models have only modest ability to predict hospital readmission.[6] Moreover, current approaches predominantly adjust for patients' medical comorbidities (which are easily measurable), but they do not adequately take into account the growing literature on other factors that influence readmission rates, including a patient's health literacy, visual or cognitive impairment, functional status, language barriers, and community‐level factors such as social supports.[44, 45]
The Ideal Transition of Care provides a comprehensive framework of hospital discharge quality that provides additional process measures on which hospitals could be compared rather than focusing solely on (inadequately) risk‐adjusted readmission rates. Indeed, most other quality and safety measures (such as the National Quality Forum's Safe Practices[46] and The Joint Commission's National Patient Safety Goals),[47] emphasize process over outcome, in part because of issues of fairness. Process measures are less subject to differences in patient populations and also change the focus from simply reducing readmissions to improving transitional care more broadly. These process measures should be based on our framework and should attempt to capture as many dimensions of an optimal care transition as possible.
Possible examples of process measures include: the accuracy of medication reconciliation at admission and discharge; provision of prompt outpatient follow‐up; provision of adequate systems to monitor and manage symptoms after discharge; advanced care planning in appropriate patients; and the quality of discharge education, incorporating measurements of the patient's understanding and ability to self‐manage their illness. At least some of these could be used now as part of a performance measurement set that highlights opportunities for immediate system change and can serve as performance milestones.
The framework could also be used to validate risk‐adjustment techniques. After accounting for patient factors, the remaining variability in outcomes should be accounted for by processes of care that are in the transitions framework. Once these processes are accurately measured, one can determine if indeed the remaining variability is due to transitions processes, or rather unaccounted factors that are not being measured and that hospitals may have little control over. Such work can lead to iterative refinement of patient risk‐adjustment models.
What Does the Framework Imply About Best Practices for Reducing Readmission Rates?
Despite the limitations of readmission rates as a quality measure noted above, hospitals presently face potentially large financial penalties for readmissions and are allocating resources to readmission reduction efforts. However, hospitals currently may not have enough guidance to know what actions to take to reduce readmissions, and thus could be spending money inefficiently and reducing the value proposition of focusing on readmissions.
A recent systematic review of interventions hospitals could employ to reduce readmissions identified several positive studies, but also many negative studies, and there were significant barriers to understanding what works to reduce readmissions.[7] For example, most of the interventions described in both positive and negative studies were multifaceted, and the authors were unable to identify which components of the intervention were most effective. Also, while several studies have identified risk factors for readmission,[6, 48, 49] very few studies have identified which subgroups of patients benefit most from specific interventions. Few of the studies described key contextual factors that may have led to successful or failed implementation, or the fidelity with which the intervention was implemented.[50, 51, 52]
Few if any of the studies were guided by a concept of the ideal transition in care.[10] Such a framework will better guide development of multifaceted interventions and provide an improved means for interpreting the results. Clearly, rigorously conducted, multicenter studies of readmission prevention interventions are needed to move the field forward. These studies should: 1) correlate implementation of specific intervention components with reductions in readmission rates to better understand the most effective components; 2) be adequately powered to show effect modification, ie, which patients benefit most from these interventions; and 3) rigorously measure environmental context and intervention fidelity, and employ mixed methods to better understand predictors of implementation success and failure.
Our framework can be used in the design and evaluation of such interventions. For example, interventions could be designed that incorporate as many of the domains of an ideal transition as possible, in particular those that span the inpatient and outpatient settings. Processes of care metrics can be developed that measure the extent to which each domain is delivered, analogous to the way the Joint Commission might aggregate individual scores on the 10 items in Acute Myocardial Infarction Core Measure Set[53] to provide a composite of the quality of care provided to patients with this diagnosis. These can be used to correlate certain intervention components with success in reducing readmissions and also in measuring intervention fidelity.
NEXT STEPS
For hospital and healthcare system leaders, who need to take action now to avoid financial penalties, we recommend starting with proven, high‐touch interventions such as Project RED and the Care Transitions Intervention, which are durable, cost‐effective, robustly address multiple domains of the Ideal Transition in Care, and have been implemented at numerous sites.[54, 55] Each hospital or group will need to decide on a bundle of interventions and customize them based on local workflow, resources, and culture.
Risk‐stratification, to match the intensity of the intervention to the risk of readmission of the patient, will undoubtedly be a key component for the efficient use of resources. We anticipate future research will allow risk stratification to be a robust part of any implementation plan. However, as noted above, current risk prediction models are imperfect,[6] and more work is needed to determine which patients benefit most from which interventions. Few if any studies have described interventions tailored to risk for this reason.
Based on our ideal transition in care, our collective experience, and published evidence,[7, 10, 11, 12] potential elements to start with include: early discharge planning; medication reconciliation[56]; patient/caregiver education using health literacy principles, cognitive assessments, and teach‐back to confirm understanding; synchronous communication (eg, by phone) between inpatient and postdischarge providers; follow‐up phone calls to patients within 72 hours of discharge; 24/7 availability of a responsible inpatient provider to address questions and problems (both from the patient/caregiver and from postdischarge providers); and prompt appointments for patients discharged home. High‐risk patients will likely require additional interventions, including in‐home assessments, disease‐monitoring programs, and/or patient coaching. Lastly, patients with certain conditions prone to readmission (such as heart failure and chronic obstructive pulmonary disease) may benefit from disease‐specific programs, including patient education, outpatient disease management, and monitoring protocols.
It is likely that the most effective interventions are those that come from combined, coordinated interventions shared between inpatient and outpatient settings, and are intensive in nature. We expect that the more domains in the framework that are addressed, the safer and more seamless transitions in care will be, with improvement in patient outcomes. To the extent that fragmentation of care has been a barrier to the implementation of these types of interventions in the past, ACOs, perhaps with imbedded Patient‐Centered Medical Homes, may be in the best position to take advantage of newly aligned financial incentives to design comprehensive transitional care. Indeed, we anticipate that Figure 1 may provide substrate for a discussion of postdischarge care and division of responsibilities between inpatient and outpatient care teams at the time of transition, so effort is not duplicated and multiple domains are addressed.
Other barriers to implementation of ideal transitions in care will continue to be an issue for most healthcare systems. Financial constraints that have been a barrier up until now will be partially overcome by penalties for high readmission rates and by ACOs, bundled payments, and alternative care contracts (ie, global payments), but the extent to which each institution feels rewarded for investing in transitional interventions will vary greatly. Healthcare leadership that sees the value of improving transitions in care will be critical to overcoming this barrier. Competing demands (such as lowering hospital length of stay and carrying out other patient care responsibilities),[57] lack of coordination and diffusion of responsibility among various clinical personnel, and lack of standards are other barriers[58] that will require clear prioritization from leadership, policy changes, team‐based care, provider education and feedback, and adequate allocation of personnel resources. In short, process redesign using continuous quality improvement efforts and effective tools will be required to maximize the possibility of success.
CONCLUSIONS
Readmissions are costly and undesirable. Intuition suggests they are a marker of poor care and that hospitals should be capable of reducing them, thereby improving care and decreasing costs. In a potential future world of ACOs based on global payments, financial incentives would be aligned for each system to reduce readmissions below their current baseline, therefore obviating the need for external financial rewards and penalties. In the meantime, financial penalties do exist, and controversy exists over their fairness and likelihood of driving appropriate behavior. To address these controversies and promote better transitional care, we call for the development and use of multifaceted, collaborative transitions interventions that span settings, risk‐adjustment models that allow for fairer comparisons among hospitals, better and more widespread measurement of processes of transitional care, a better understanding of what interventions are most effective and in whom, and better guidance in how to implement these interventions. Our conceptualization of an ideal transition of care serves as a guide and provides a common vocabulary for these efforts. Such research is likely to produce the knowledge needed for healthcare systems to improve transitions in care, reduce readmissions, and reduce costs.
Disclosure
Funding for Dr Vasilevskis has been provided by the National Institutes of Health (K23AG040157) and the VA Tennessee Valley Geriatric Research, Education and Clinical Center (GRECC). The content is solely the responsibility of the authors and does not necessarily represent the official views of the National Institute on Aging, the National Institutes of Health, or the US Department of Veterans Affairs.
- , . Redefining Health Care: Creating Value‐Based Competition on Results. Boston, MA:Harvard Business School Press;2006.
- , , . Rehospitalizations among patients in the Medicare fee‐for‐service program. N Engl J Med. 2009;360(14):1418–1428.
- Patient Protection and Affordable Care Act (PPACA). Public Law 111–148; 2010. Available at: http://www.gpo.gov/fdsys/pkg/PLAW‐111publ148/pdf/PLAW‐111publ148.pdf. Accessed on June 4, 2012.
- , . Hospital readmission as an accountability measure. JAMA. 2011;305(5):504–505.
- , , , et al. Incidence of potentially avoidable urgent readmissions and their relation to all‐cause urgent readmissions. Can Med Assoc J. 2011;183(14):E1067–E1072.
- , , , et al. Risk prediction models for hospital readmission: a systematic review. JAMA. 2011;306(15):1688–1698.
- , , , , . Interventions to reduce 30‐day rehospitalization: a systematic review. Ann Intern Med. 2011;155(8):520–528.
- . A decade of transitional care research with vulnerable elders. J Cardiovasc Nurs. 2000;14(3):1–14.
- , , , et al;for the American College of Physicians; Society of General Internal Medicine; Society of Hospital Medicine; American Geriatrics Society; American College of Emergency Physicians; Society of Academic Emergency Medicine. Transitions of Care Consensus Policy Statement American College of Physicians–Society of General Internal Medicine–Society of Hospital Medicine–American Geriatrics Society–American College of Emergency Physicians–Society of Academic Emergency Medicine. J Gen Intern Med. 2009;24(8):971–976.
- , , , et al. A reengineered hospital discharge program to decrease rehospitalization: a randomized trial. Ann Intern Med. 2009;150(3):178–187.
- , , , et al. Comprehensive discharge planning and home follow‐up of hospitalized elders: a randomized clinical trial. JAMA. 1999;281(7):613–620.
- , , , . The care transitions intervention: results of a randomized controlled trial. Arch Intern Med. 2006;166(17):1822–1828.
- , , , , , . Deficits in communication and information transfer between hospital‐based and primary care physicians: implications for patient safety and continuity of care. JAMA. 2007;297(8):831–841.
- , , , . Promoting effective transitions of care at hospital discharge: a review of key issues for hospitalists. J Hosp Med. 2007;2(5):314–323.
- , , , , , . Discharge documentation of patients discharged to subacute facilities: a three‐year quality improvement process across an integrated health care system. Jt Comm J Qual Patient Saf. 2010;36(6):243–251.
- , , , , . The incidence and severity of adverse events affecting patients after discharge from the hospital. Ann Intern Med. 2003;138(3):161–167.
- , , , , , . Frequency, type and clinical importance of medication history errors at admission to hospital: a systematic review. Can Med Assoc J. 2005;173(5):510–515.
- , , , et al. Classifying and predicting errors of inpatient medication reconciliation. J Gen Intern Med. 2008;23(9):1414–1422.
- , , et al;for the PILL‐CVD (Pharmacist Intervention for Low Literacy in Cardiovascular Disease) Study Group. Effect of a pharmacist intervention on clinically important medication errors after hospital discharge: a randomized trial. Ann Intern Med. 2012;157(1):1–10.
- , , , . Hospital‐based medication reconciliation practices: a systematic review. Arch Intern Med. 2012;172(14):1057–1069.
- , , , et al. Effect of an electronic medication reconciliation application and process redesign on potential adverse drug events: a cluster‐randomized trial. Arch Intern Med. 2009;169(8):771–780.
- , , , et al. Role of pharmacist counseling in preventing adverse drug events after hospitalization. Arch Intern Med. 2006;166(5):565–571.
- , , , , . Insufficient help for activity of daily living disabilities and risk of all–cause hospitalization. J Am Geriatr Soc. 2012;60(5):927–933.
- , , , et al. Transitions in care for older adults with and without dementia. J Am Geriatr Soc. 2012;60(5):813–820.
- , , , , . Association of incident dementia with hospitalizations. JAMA. 2012;307(2):165–172.
- , , , et al. Potentially avoidable hospitalizations of dually eligible Medicare and Medicaid beneficiaries from nursing facility and home– and community–based services waiver programs. J Am Geriatr Soc. 2012;60(5):821–829.
- , . Teaching about health literacy and clear communication. J Gen Intern Med. 2006;21(8):888–890.
- , , , et al. Health literacy and outcomes among patients with heart failure. JAMA. 2011;305(16):1695–1701.
- , , , , . Patient experiences of transitioning from hospital to home: an ethnographic quality improvement project. J Hosp Med. 2012;7(5):382–387.
- , , , . Effects of care coordination on hospitalization, quality of care, and health care expenditures among Medicare beneficiaries: 15 randomized trials. JAMA. 2009;301(6):603–618.
- , , , , . How changes in Washington University's Medicare coordinated care demonstration pilot ultimately achieved savings. Health Aff (Millwood). 2012;31(6):1216–1226.
- , , , et al. Quality of care and rehospitalization rate in the last stage of disease in brain tumor patients assisted at home: a cost effectiveness study. J Palliat Med. 2012;15(2):225–227.
- , , , , . Inpatient palliative care consults and the probability of hospital readmission. Perm J. 2011;15(2):48–51.
- , , , et al. TeamSTEPPS™: team strategies and tools to enhance performance and patient safety. In: Henriksen K, Battles JB, Keyes MA, Grady ML, ed. Advances in Patient Safety: New Directions and Alternative Approaches. Vol 3: Performance and Tools. Rockville, MD:Agency for Healthcare Research and Quality; August2008.
- , , , et al. Factors contributing to all‐cause 30‐day readmissions: a structured case series across 18 hospitals. Med Care. 2012;50(7):599–605.
- , , , et al. Telemonitoring in patients with heart failure [erratum, N Engl J Med. 2011;364(5):490]. N Engl J Med. 2010;363(24):2301–2309.
- , , , et al. A randomized controlled trial of telemonitoring in older adults with multiple health issues to prevent hospitalizations and emergency department visits. Arch Intern Med. 2012;172(10):773–779.
- , , , et al. Relationship between early physician follow‐up and 30‐day readmission among Medicare beneficiaries hospitalized for heart failure. JAMA. 2010;303(17):1716–1722.
- , , . Post‐hospitalization transitions: examining the effects of timing of primary care provider follow‐up. J Hosp Med. 2010;5(7):392–397.
- , , . Does increased access to primary care reduce hospital readmissions? Veterans Affairs Cooperative Study Group on Primary Care and Hospital Readmission. N Engl J Med. 1996;334(22):1441–1447.
- . The Post‐Hospital Follow‐Up Visit: A Physician Checklist to Reduce Readmissions. California Healthcare Foundation; October 2010. Available at: http://www.chcf.org/publications/2010/10/the‐post‐hospital‐follow‐up‐visit‐a‐physician‐checklist. Accessed on January 10, 2012.
- , , . Thirty‐day readmission rates for Medicare beneficiaries by race and site of care. JAMA. 2011;305(7):675–681.
- , , , , . Proportion of hospital readmissions deemed avoidable: a systematic review. Can Med Assoc J. 2011;183(7):E391–E402.
- , , , et al. Postdischarge environmental and socioeconomic factors and the likelihood of early hospital readmission among community‐dwelling Medicare beneficiaries. Gerontologist. 2008;48(4):495–504.
- , , , , . Low health literacy and health outcomes: an updated systematic review. Ann Intern Med. 2011;155(2):97–107.
- National Quality Forum. Safe Practices for Better Healthcare—2010 Update: A Consensus Report. Washington, DC;2010.
- Joint Commission on Accreditation of Healthcare Organizations. Accreditation Program: Hospital 2010 National Patient Safety Goals (NPSGs). 2010. Available at: http://www.jointcommission.org/PatientSafety/NationalPatientSafetyGoals/. Accessed on March 20, 2012.
- , , , et al. Hospital readmission in general medicine patients: a prediction model. J Gen Intern Med. 2010;25(3):211–219.
- , , , et al. Derivation and validation of an index to predict early death or unplanned readmission after discharge from hospital to the community. Can Med Assoc J. 2010;182(6):551–557.
- , . Evaluating service delivery interventions to enhance patient safety. BMJ. 2008;337:a2764.
- , , . Assessing the Evidence for Context‐Sensitive Effectiveness and Safety of Patient Safety Practices: Developing Criteria. Rockville, MD:Agency for Healthcare Research and Quality; December2010.
- , , , et al. Advancing the science of patient safety. Ann Intern Med. 2011;154(10):693–696.
- The Joint Commission. Acute Myocardial Infarction Core Measure Set. Available at: http://www.jointcommission.org/assets/1/6/Acute%20Myocardial%20Infarction.pdf. Accessed August 20,2012.
- , , , , , . The care transitions intervention: translating from efficacy to effectiveness. Arch Intern Med. 2011;171(14):1232–1237.
- Project RED toolkit, AHRQ Innovations Exchange. Available at:http://www.innovations.ahrq.gov/content.aspx?id=2180. Accessed on July 2, 2012.
- , , , et al. A comprehensive pharmacist intervention to reduce morbidity in patients 80 years or older: a randomized controlled trial. Arch Intern Med. 2009;169(9):894–900.
- , . Thirty‐day readmissions—truth and consequences. N Engl J Med. 2012;366(15):1366–1369.
- , , , , . “Out of sight, out of mind”: housestaff perceptions of quality‐limiting factors in discharge care at teaching hospitals. J Hosp Med. 2012;7(5):376–381.

Predictors of Medication Adherence
In the outpatient setting, medication adherence (defined as percentage of prescribed medication doses taken by a patient during a specific time period) ranges between 40% and 80% for chronic conditions.1 During acute care hospitalization, changes are often made to patients' medication regimens, which can be confusing and contribute to nonadherence, medication errors, and harmful adverse events.2 Indeed, it is estimated that almost half of patients encounter a medication error after discharge, and approximately 12%17% experience an adverse drug event after returning home.36 It is likely that some of these adverse events may be the result of medication nonadherence.7 Improved patientprovider communication, systems to reconcile prehospitalization and posthospitalization medications, as well as development of mechanisms to enhance adherence, may prevent many of these errors and have become new targets for quality improvement.4, 8 Although postdischarge medication adherence is a crucial target for avoiding adverse events and rehospitalization, few studies have focused on understanding its incidence and predictors, in particular, patient demographic factors such as age and insurance status.911
In addition, few studies have looked at general and posthospital adherence in a population where health literacy is measured, an important area because medication changes during hospitalization may be particularly confusing for patients with low health literacy.11, 12 Health literacy is defined as the degree to which an individual has the capacity to obtain, process, and understand basic health information and services needed to make appropriate health decisions.13 Prior outpatient research shows that low health literacy is associated with poor patient understanding of the medication regimen and instructions for medication use, which may contribute to postdischarge medication nonadherence.14, 15 Understanding the factors associated with postdischarge medication adherence could help refine interventions that are oriented toward improving transitions in care, patient safety, and reducing unnecessary rehospitalization.
We report here on factors associated with postdischarge medication adherence using data from the Pharmacist Intervention for Low Literacy in Cardiovascular Disease (PILL‐CVD) study.16
METHODS
Study and Participants
PILL‐CVD was a federally funded, 2‐site randomized controlled trial using pharmacist‐assisted medication reconciliation, inpatient pharmacist counseling, low‐literacy adherence aids, and telephone follow‐up that aimed to decrease rates of serious medication errors after hospital discharge.16 The study targeted patients with cardiovascular disease (hospitalized on cardiology or general medical or geriatric services for acute coronary syndromes [ACS] or acute decompensated heart failure [ADHF]) at 2 large academic hospitals, Brigham and Women's Hospital (BWH) and Vanderbilt University Hospital (VUH).
Subjects were eligible for enrollment if they met criteria for ACS or ADHF, were likely to be discharged to home as determined by the primary medical team at the time of study enrollment, and took primary responsibility for administering their medications prior to admission (caregivers could be involved in medication management after discharge). Exclusion criteria included severe visual or hearing impairment, inability to communicate in English or Spanish, active psychiatric illness, dementia, delirium, illness too severe to participate, lack of a home phone number, being in police custody, or participation in another intensive medication adherence program (eg, due to renal transplant).
Out of 6416 patients originally screened for possible enrollment, 862 were randomly assigned to receive usual care or usual care plus the intervention, and 851 remained in the study.16 Both the main study and this secondary data analysis were approved by the Institutional Review Boards of each site.
Baseline Measures
Following informed consent and study enrollment, a variety of baseline data were collected on study participants from medical records and patient interview, including primary language, demographic information (age, race, insurance status, income, and education level), cognition (through administration of the 05‐point MiniCog scale),17 and level of health literacy (through use of the 036‐point short form of the Test of Functional Health Literacy in Adults [s‐TOFHLA] scale).18 Baseline information was also collected on medication use, including number of preadmission medications, measurement of self‐reported adherence prior to admission (using the Morisky scale, a validated 04‐point questionnaire shown to correlate with disease control and indicative of general patterns of adherence),19 and a medication understanding score, adapted from other instruments, which quantifies understanding of the indication, dose, and frequency of up to 5 randomly selected preadmission medications on a 03‐point scale.16, 20, 21
Outcome Measures
Outcomes were collected 30 days postdischarge through a structured questionnaire, administered by telephone. Only patients who completed this call are included in the present analysis. Postdischarge medication adherence was assessed by asking patients to report the number of days out of the previous week they had taken each medication from their postdischarge regimen exactly as prescribed.22 A score was calculated for each medication as the proportion of adherent days (eg, if a patient reported missing 2 days of a medication in the previous week, then adherence would be 5/7 or 71%). A global postdischarge adherence score was then derived for each patient by averaging the adherence score for all regularly scheduled medications. This quantitative measure focused on adherence to medications patients knew they should be taking and did not measure medication discrepancies (sometimes termed unintentional nonadherence).
Analysis
Patient characteristics were summarized and reported using simple descriptive statistics. Candidate predictors of postdischarge medication adherence were chosen a priori from patient characteristics assessed during hospital admission. These included patient age, gender, race, ethnicity, marital status, insurance, years of education, presence of primary care physician (PCP), study site, number of preadmission medications, medication understanding, baseline adherence, cognition, and health literacy. Unadjusted results were calculated using univariable linear regression, with each patient's adherence score as the dependent variable and each predictor as the independent variable. Adjusted results were then derived using multivariable linear regression with all the candidate predictors in the model.
Lastly, because of missing data for some predictors, in particular baseline adherence and medication understanding, multiple imputation techniques were used to impute missing data and increase statistical power.23 We used the Markov Chain Monte Carlo (MCMC) method for multiple imputation, which generally assumes that the data came from a normal distribution and that the missing data are missing at random. Because of the essentially normal distribution of the data, and because the amount of missing data was so small (<1% for almost all variables, 5% for baseline adherence, and 8% for medication understanding), we expected little bias and present the complete case analysis, which maximized statistical power.
Two‐sided P values <0.05 were considered significant, and SAS version 9.2 (Cary, NC) was used for all analyses.
RESULTS
Table 1 shows descriptive baseline patient characteristics of study sample (responders) as well as nonresponders at 30 days. For the responders, the mean age of the 646 patients was 61.2 years, 94.7% were insured, and 19.3% had inadequate or marginal health literacy. Patients were prescribed an average of 8 preadmission medications. Most patients (92.3%) had a regular PCP prior to admission. Nonresponders had nonsignificant trends towards having lower health literacy, medication understanding, and baseline medication adherence.
| Characteristic | Total N, 30‐Day Respondents | Value | Total N, Nonrespondents | Value |
|---|---|---|---|---|
| ||||
| Age, mean in yr (SD) | 646 | 61.2 (13.5) | 45 | 55.4 (14.3) |
| Gender, N (percentage) | 646 | 45 | ||
| Female | 272 (42.1) | 18 (40.0) | ||
| Male | 374 (57.9) | 27 (60.0) | ||
| Race, N (percentage) | 643 | 45 | ||
| White | 511 (79.5) | 32 (71.1) | ||
| Black | 104 (16.2) | 11 (24.4) | ||
| Other | 28 (4.4) | 2 (4.4) | ||
| Ethnicity, N (percentage) | 639 | 45 | ||
| Hispanic | 24 (3.8) | 1 (2.2) | ||
| Not Hispanic | 615 (96.2) | 44 (97.8) | ||
| Marital status, N (percentage) | 646 | 45 | ||
| Married/cohabitate | 382 (59.1) | 20 (44.4) | ||
| Separated/divorced | 118 (18.3) | 11 (24.4) | ||
| Widowed | 81 (12.5) | 5 (11.1) | ||
| Never married | 65 (10.1) | 9 (2.0) | ||
| Insurance type, N (percentage) | 646 | 45 | ||
| Medicaid | 53 (8.2) | 5 (11.1) | ||
| Medicare | 270 (41.8) | 13 (28.9) | ||
| Private | 289 (44.7) | 19 (42.2) | ||
| Self‐pay | 34 (5.3) | 8 (17.8) | ||
| Years of education, mean in yr (SD) | 643 | 14.0 (3.1) | 45 | 13.3 (2.7) |
| Presence of PCP prior to admission, N (percentage) | 646 | 45 | ||
| Yes | 596 (92.3) | 38 (84.4) | ||
| No | 50 (7.74) | 7 (15.6) | ||
| Site, N (percentage) | 646 | 45 | ||
| Site 1 | 358 (55.4) | 8 (17.8) | ||
| Site 2 | 288 (44.6) | 37 (82.2) | ||
| No. of preadmission medications, mean no. (SD) | 641 | 7.8 (4.8) | 45 | 7.7 (5.4) |
| Medication understanding score, mean (SD)* | 597 | 2.4 (0.5) | 40 | 2.2 (0.62) |
| Health literacy (s‐TOFHLA) score, mean (SD) | 642 | 29.1 (8.9) | 45 | 26.0 (12.0) |
| Baseline adherence (SD) | 613 | 2.7 (1.1) | 45 | 2.4 (1.2) |
| MiniCog score, N (percentage) | 646 | 45 | ||
| Demented | 63 (9.8) | 5 (11.1) | ||
| Not demented | 583 (90.2) | 40 (88.9) | ||
The average postdischarge adherence score was 95% (standard deviation [SD] = 10.2%), and less than 10% of patients had an adherence score of less than 85%; overall the distribution was left‐skewed. Table 2 illustrates crude and adjusted parameter estimates for variables in the model. Table 3 shows significant findings in the fully adjusted model, which used multiple imputation techniques to account for missing data.
| Predictor | Crude Parameter Estimate (Beta) With 95% Confidence Intervals | P Value | Adjusted Parameter Estimate (Beta) With 95% Confidence Intervals | P Value |
|---|---|---|---|---|
| ||||
| Age per 10 yr | 0.010 (0.007, 0.020) | <0.0001 | 0.010 (0.002, 0.020) | 0.018 |
| Male gender | 0.012 (0.004, 0.028) | 0.137 | 0.003 (0.014, 0.020) | 0.727 |
| Race/ethnicity | ||||
| White | 0.011 (0.009, 0.031) | 0.266 | Ref | Ref |
| Black | 0.017 (0.038, 0.005) | 0.13 | 0.006 (0.017, 0.030) | 0.598 |
| Other | 0.010 (0.029, 0.049) | 0.599 | 0.017 (0.027, 0.062) | 0.446 |
| Hispanic/Latino | 0.005 (0.037, 0.047) | 0.803 | 0.036 (0.013, 0.085) | 0.149 |
| Marital status | ||||
| Married/cohabitate | 0.006 (0.011, 0.022) | 0.500 | Ref | Ref |
| Separated/divorced | 0.005 (0.025, 0.016) | 0.664 | 0.009 (0.014, 0.031) | 0.446 |
| Widowed | 0.001 (0.023, 0.025) | 0.922 | 0.013 (0.039, 0.013) | 0.338 |
| Never married | 0.009 (0.035, 0.018) | 0.515 | 0.004 (0.033, 0.025) | 0.784 |
| Insurance type | ||||
| Private | 0.008 (0.008, 0.024) | 0.347 | Ref | Ref |
| Medicaid | 0.046 (0.075, 0.018) | 0.002 | 0.026 (0.058, 0.007) | 0.121 |
| Medicare | 0.012 (0.004, 0.028) | 0.138 | 0.002 (0.023, 0.018) | 0.844 |
| Self‐pay | 0.027 (0.062, 0.008) | 0.135 | 0.029 (0.073, 0.015) | 0.202 |
| Years of education | 0.003 (0.0003, 0.005) | 0.028 | 0.0001 (0.003, 0.003) | 0.949 |
| Presence of PCP prior to admission | 0.007 (0.022, 0.037) | 0.630 | 0.002 (0.032, 0.036) | 0.888 |
| Site | 0.050 (0.065, 0.034) | <0.0001 | 0.038 (0.056, 0.021) | <0.0001 |
| No. of preadmission medications | 0.0003 (0.002, 0.001) | 0.684 | 0.0001 (0.002, 0.002) | 0.918 |
| Medication understanding score per point | 0.007 (0.009, 0.023) | 0.390 | 0.006 (0.011, 0.023) | 0.513 |
| Health literacy (s‐TOFHLA) score per 10 points | 0.0006 (0.008, 0.01) | 0.897 | 0.003 (0.008, 0.01) | 0.644 |
| Baseline adherence per point | 0.023 (0.016, 0.031) | <0.0001 | 0.017 (0.009, 0.024) | <0.0001 |
| Cognitive function | 0.004 (0.022, 0.031) | 0.757 | 0.008 (0.019, 0.036) | 0.549 |
| Predictor | Parameter Estimate (Beta) With 95% Confidence Intervals | P Value |
|---|---|---|
| ||
| Age per 10 yr | 0.010 (0.004, 0.020) | 0.004 |
| Insurance type | ||
| Private | Ref | Ref |
| Medicaid | 0.045 (0.076, 0.014) | 0.005 |
| Medicare | 0.010 (0.030, 0.010) | 0.333 |
| Self‐pay | 0.013 (0.050, 0.025) | 0.512 |
| Site | 0.036 (0.053, 0.019) | <0.0001 |
| Baseline adherence per point | 0.016 (0.008, 0.024) | <0.0001 |
Intervention arm was of borderline statistical significance in predicting postdischarge adherence (P = 0.052), and so was removed from the final model. Study site, age, insurance, and baseline adherence were the only significant independent predictors of postdischarge adherence in the fully adjusted model (Table 3). For example, for every 10‐year increase in age, patients had, on average, an adjusted 1% absolute increase in their adherence score (95% confidence interval [CI] 0.4% to 2.0%). For every 1‐point increase in baseline medication adherence (based on the Morisky scale), there was a 1.6% absolute increase in medication adherence (95% CI 0.8% to 2.4%). In unadjusted analyses, patients with Medicaid were less adherent with medications after discharge than were patients with private insurance. This difference became nonsignificant in adjusted analyses, but when analyses were repeated using multiple imputation techniques, the results again became statistically significantMedicaid insurance was associated with a 4.5% absolute decrease in postdischarge adherence compared with private insurance (95% CI 7.6% to 1.4%). Study site (specifically, Brigham and Women's Hospital) was also a significant predictor of greater postdischarge medication adherence. Years of education was a significant predictor of adherence in unadjusted analyses, but was not an independent predictor when adjusted for other factors. When baseline adherence was removed from the multiple imputation model, there were no changes in which factors were significant predictors of adherence.
DISCUSSION
In this study, we found that low baseline adherence, younger age, Medicaid insurance, and study site were significant predictors of lower 30‐day medication adherence. Of particular interest is our finding regarding baseline adherence, a simple measure to obtain on hospitalized patients. It is notable that in our study, education was not an independent significant predictor of postdischarge adherence, even when baseline adherence was removed from the model. The same is true for medication understanding, cognitive function, and health literacy.
Older patients appeared more adherent with medications in the month after hospital discharge, perhaps reflecting increased interaction with the healthcare system (appointments, number of physician interactions), a greater belief in the importance of chronic medication management, or a higher level of experience with managing medications. A similar relationship between age and adherence has been shown in outpatient studies of patients with hypertension, diabetes, and other chronic diseases.2427
Medicaid patients may be less likely to remain adherent because of the plan's limited coverage of medications relative to patients' ability to pay. For example, Medicaid in Tennessee covers the first 5 generic medications at no cost to the patient but has co‐payments for additional medications and for brand name drugs. Medicaid in Massachusetts has co‐payments of $1 to $3 for each medication. Alternatively, Medicaid insurance may be a marker for other patient characteristics associated with low adherence for which we were not fully able to adjust.
Site differences were also notable in this study; these differences could have been due to differences in insurance coverage in Tennessee versus Massachusetts (which has near‐universal coverage), differences in types of insurance (eg, fewer patients at Brigham and Women's Hospital had Medicaid than at Vanderbilt), cultural and geographic differences between the 2 locations, or other differences in transitional care between the 2 sites.
This study corroborates previous literature on medication adherence (specifically unintentional nonadherence) in the outpatient setting,4, 811 for example, on the association of younger age with low adherence in certain populations. On the other hand, it may contrast with previous literature which has sometimes shown a relationship between patient education or health literacy and medication adherence.14, 15, 2835 However, previous studies have not focused on the transition from inpatient to outpatient settings. Perhaps intensive medication education in the hospital, even under usual care, mitigates the effects of these factors on postdischarge adherence. Finally, baseline adherence seems to correlate with postdischarge adherence, a finding which makes intuitive sense and has been previously reported for specific medications.36
There are several limitations to this study. Although large, the study was performed at only 2 clinical sites where most patients were white and fairly well‐educated, perhaps because patients admitted to a tertiary care center with ACS or ADHF are more affluent than general medical inpatients as a whole; this may limit generalizability. Postdischarge medication adherence might have been higher than in other patient populations given the nature of the population, possible loss‐to‐follow‐up bias, and the fact that half of the subjects received an intervention designed to improve medication management after discharge; such low rates of nonadherence in our study may have reduced our ability to detect important predictors in our models. In addition, the period of follow‐up was 30 days, thus limiting our findings to short‐term postdischarge medication adherence. Postdischarge medication adherence was based on patient self‐report, which not only assumed that the patient was still managing his/her own medications after discharge, but may also be susceptible to both recall and social acceptability bias, which might overestimate our adherence scores, again limiting our ability to detect important predictors of nonadherence. However, other studies have shown a good correlation between self‐reported medication adherence and other more objective measures,37, 38 and recall was only for 7 days, a measure used previously in the literature39, 40 and one designed to reduce recall bias. Systematic underreporting in certain patient populations is less likely but possible.
In the future, research should focus on targeting patients who have low baseline adherence to evaluate the effects of various interventions on postdischarge medication outcomes. Repeating the study in a population with a high prevalence of low health literacy might be illuminating, given that previous studies have shown that patients with low health literacy have less ability to identify their medications and have less refill adherence.29, 30
In conclusion, in patients hospitalized with cardiovascular disease, predictors of lower postdischarge adherence include younger age, Medicaid insurance, and low baseline adherence. It may be prudent to assess baseline adherence and insurance type in hospitalized patients in order to identify those who may benefit from additional assistance to improve medication adherence and medication safety during transitions in care.
Acknowledgements
Meeting Presentations: SGIM New England Regional Meeting, oral presentation, Boston, MA, March 4, 2011; and SGIM National Meeting, poster presentation, Phoenix, AZ, May 6, 2011. Dr Schnipper had full access to all of the data in the study and takes responsibility for the integrity of the data and the accuracy of the data analysis.
Disclosures: Financial support was provided by R01 HL089755 (NHLBI, Kripalani), K23 HL077597 (NHLBI, Kripalani), K08 HL072806 (NHLBI, Schnipper), T32HP10251‐02 (Cohen), and by the Division of General Medicine, Massachusetts General Hospital and the Harvard Medical School Fellowship in General Medicine and Primary Care (Cohen). Dr Kripalani is a consultant to and holds equity in PictureRx, LLC, which makes patient education tools to improve medication management. PictureRx did not provide materials or funding for this study. All other authors disclose no relevant or financial conflicts of interest.
- ,.Adherence to medication.N Engl J Med.2005;353(5):487–497.
- ,,,.Posthospital medication discrepancies: prevalence and contributing factors.Arch Intern Med.2005;165(16):1842–1847.
- ,.Medication use in the transition from hospital to home.Ann Acad Med Singapore.2008;37(2):136–141.
- ,,,.Medical errors related to discontinuity of care from an inpatient to an outpatient setting.J Gen Intern Med.2003;18(8):646–651.
- ,,,,.The incidence and severity of adverse events affecting patients after discharge from the hospital.Ann Intern Med.2003;138(3):161–167.
- ,,,,.Adverse drug events occurring following hospital discharge.J Gen Intern Med.2005;20(4):317–323.
- ,,, et al.Role of pharmacist counseling in preventing adverse drug events after hospitalization.Arch Intern Med.2006;166(5):565–571.
- ,,.Reconcilable differences: correcting medication errors at hospital admission and discharge.Qual Saf Health Care.2006;15(2):122–126.
- ,.Risk of rehospitalization among bipolar disorder patients who are nonadherent to antipsychotic therapy after hospital discharge.Am J Health Syst Pharm.2009;66(4):358–365.
- ,,,,.Continuity and adherence to long‐term drug treatment by geriatric patients after hospital discharge: a prospective cohort study.Drugs Aging.2008;25(10):861–870.
- ,,,.Medication use among inner‐city patients after hospital discharge: patient‐reported barriers and solutions.Mayo Clin Proc.2008;83(5):529–535.
- ,,,,,.Relationship of health literacy to intentional and unintentional non‐adherence of hospital discharge medications.J Gen Intern Med.2012;27(2):173–178.
- Office of Disease Prevention and Health Promotion, US Department of Health and Human Services.Healthy People 2010. Available at: http://www.healthypeople.gov/Document/pdf/uih/2010uih.pdf. Accessed February 15,2012.
- ,,, et al.Literacy and misunderstanding prescription drug labels.Ann Intern Med.2006;145(12):887–894.
- ,,,,,.Predictors of medication self‐management skill in a low‐literacy population.J Gen Intern Med.2006;21(8):852–856.
- ,,, et al;for the PILL‐CVD Study Group.Rationale and design of the Pharmacist Intervention for Low Literacy in Cardiovascular Disease (PILL‐CVD) study.Circ Cardiovasc Qual Outcomes.2010;3(2):212–219.
- ,,,,.Simplifying detection of cognitive impairment: comparison of the Mini‐Cog and Mini‐Mental State Examination in a multiethnic sample.J Am Geriatr Soc.2005;53(5):871–874.
- .Short Test of Functional Health Literacy in Adults.Snow Camp, NC:Peppercorn Books and Press;1998.
- ,,,.Predictive validity of a medication adherence measure in an outpatient setting.J Clin Hypertens (Greenwich).2008;10(5):348–354.
- ,,,,,.Health literacy and medication understanding among hospitalized adults.J Hosp Med. In press.
- ,,,,,.Health literacy and medication understanding among hospitalized adults.J Hosp Med.2011;6(9):488–493.
- ,,.The summary of diabetes self‐care activities measure: results from 7 studies and a revised scale.Diabetes Care.2000;23(7):943–950.
- .Multiple Imputation for Nonresponse in Surveys.New York, NY:John Wiley 1987.
- ,,, et al.Medication adherence in HIV‐infected adults: effect of patient age, cognitive status, and substance abuse.AIDS.2004;18(suppl 1):S19–S25.
- ,,.Factors associated with antihypertensive drug compliance in 83,884 Chinese patients: a cohort study.J Epidemiol Community Health.2010;64(10):895–901.
- ,,,,,.Adherence to oral hypoglycemic agents in 26,782 Chinese patients: a cohort study.J Clin Pharmacol.2011;51(10):1474–1482.
- ,,,,.Effect of a pharmacy‐based health literacy intervention and patient characteristics on medication refill adherence in an urban health system.Ann Pharmacother.2010;44(1):80–87.
- ,,.Adherence to combination antiretroviral therapies in HIV patients of low health literacy.J Gen Intern Med.1999;14(5):267–273.
- ,,,,,.Factors associated with medication refill adherence in cardiovascular‐related diseases: a focus on health literacy.J Gen Intern Med.2006;21(12):1215–1221.
- ,,,,.Limited health literacy is a barrier to medication reconciliation in ambulatory care.J Gen Intern Med.2007;22(11):1523–1526.
- ,,,,.The impact of low health literacy on surgical practice.Am J Surg.2004;188(3):250–253.
- ,,,,.Relationships between beliefs about medications and adherence.Am J Health Syst Pharm.2009;66(7):657–664.
- ,,,.Health literacy and anticoagulation‐related outcomes among patients taking warfarin.J Gen Intern Med.2006;21(8):841–846.
- ,,,,,.Health literacy, antiretroviral adherence, and HIV‐RNA suppression: a longitudinal perspective.J Gen Intern Med.2006;21(8):835–840.
- ,,, et al.Risk factors for nonadherence to warfarin: results from the IN‐RANGE study.Pharmacoepidemiol Drug Saf.2008;17(9):853–860.
- ,,, et al.Predictors of low clopidogrel adherence following percutaneous coronary intervention.Am J Cardiol.2011;108(6):822–827.
- ,,,,,.Correlation between adherence rates measured by MEMS and self‐reported questionnaires: a meta‐analysis.Health Qual Life Outcomes.2010;8:99.
- ,,,,,.Concordance of adherence measurement using self‐reported adherence questionnaires and medication monitoring devices.Pharmacoeconomics.2010;28(12):1097–1107.
- ,,,.Polypharmacy and medication adherence in patients with type 2 diabetes.Diabetes Care.2003;26(5):1408–1412.
- ,,,.Improving adherence and reducing medication discrepancies in patients with diabetes.Ann Pharmacother.2003;37(7–8):962–969.
In the outpatient setting, medication adherence (defined as percentage of prescribed medication doses taken by a patient during a specific time period) ranges between 40% and 80% for chronic conditions.1 During acute care hospitalization, changes are often made to patients' medication regimens, which can be confusing and contribute to nonadherence, medication errors, and harmful adverse events.2 Indeed, it is estimated that almost half of patients encounter a medication error after discharge, and approximately 12%17% experience an adverse drug event after returning home.36 It is likely that some of these adverse events may be the result of medication nonadherence.7 Improved patientprovider communication, systems to reconcile prehospitalization and posthospitalization medications, as well as development of mechanisms to enhance adherence, may prevent many of these errors and have become new targets for quality improvement.4, 8 Although postdischarge medication adherence is a crucial target for avoiding adverse events and rehospitalization, few studies have focused on understanding its incidence and predictors, in particular, patient demographic factors such as age and insurance status.911
In addition, few studies have looked at general and posthospital adherence in a population where health literacy is measured, an important area because medication changes during hospitalization may be particularly confusing for patients with low health literacy.11, 12 Health literacy is defined as the degree to which an individual has the capacity to obtain, process, and understand basic health information and services needed to make appropriate health decisions.13 Prior outpatient research shows that low health literacy is associated with poor patient understanding of the medication regimen and instructions for medication use, which may contribute to postdischarge medication nonadherence.14, 15 Understanding the factors associated with postdischarge medication adherence could help refine interventions that are oriented toward improving transitions in care, patient safety, and reducing unnecessary rehospitalization.
We report here on factors associated with postdischarge medication adherence using data from the Pharmacist Intervention for Low Literacy in Cardiovascular Disease (PILL‐CVD) study.16
METHODS
Study and Participants
PILL‐CVD was a federally funded, 2‐site randomized controlled trial using pharmacist‐assisted medication reconciliation, inpatient pharmacist counseling, low‐literacy adherence aids, and telephone follow‐up that aimed to decrease rates of serious medication errors after hospital discharge.16 The study targeted patients with cardiovascular disease (hospitalized on cardiology or general medical or geriatric services for acute coronary syndromes [ACS] or acute decompensated heart failure [ADHF]) at 2 large academic hospitals, Brigham and Women's Hospital (BWH) and Vanderbilt University Hospital (VUH).
Subjects were eligible for enrollment if they met criteria for ACS or ADHF, were likely to be discharged to home as determined by the primary medical team at the time of study enrollment, and took primary responsibility for administering their medications prior to admission (caregivers could be involved in medication management after discharge). Exclusion criteria included severe visual or hearing impairment, inability to communicate in English or Spanish, active psychiatric illness, dementia, delirium, illness too severe to participate, lack of a home phone number, being in police custody, or participation in another intensive medication adherence program (eg, due to renal transplant).
Out of 6416 patients originally screened for possible enrollment, 862 were randomly assigned to receive usual care or usual care plus the intervention, and 851 remained in the study.16 Both the main study and this secondary data analysis were approved by the Institutional Review Boards of each site.
Baseline Measures
Following informed consent and study enrollment, a variety of baseline data were collected on study participants from medical records and patient interview, including primary language, demographic information (age, race, insurance status, income, and education level), cognition (through administration of the 05‐point MiniCog scale),17 and level of health literacy (through use of the 036‐point short form of the Test of Functional Health Literacy in Adults [s‐TOFHLA] scale).18 Baseline information was also collected on medication use, including number of preadmission medications, measurement of self‐reported adherence prior to admission (using the Morisky scale, a validated 04‐point questionnaire shown to correlate with disease control and indicative of general patterns of adherence),19 and a medication understanding score, adapted from other instruments, which quantifies understanding of the indication, dose, and frequency of up to 5 randomly selected preadmission medications on a 03‐point scale.16, 20, 21
Outcome Measures
Outcomes were collected 30 days postdischarge through a structured questionnaire, administered by telephone. Only patients who completed this call are included in the present analysis. Postdischarge medication adherence was assessed by asking patients to report the number of days out of the previous week they had taken each medication from their postdischarge regimen exactly as prescribed.22 A score was calculated for each medication as the proportion of adherent days (eg, if a patient reported missing 2 days of a medication in the previous week, then adherence would be 5/7 or 71%). A global postdischarge adherence score was then derived for each patient by averaging the adherence score for all regularly scheduled medications. This quantitative measure focused on adherence to medications patients knew they should be taking and did not measure medication discrepancies (sometimes termed unintentional nonadherence).
Analysis
Patient characteristics were summarized and reported using simple descriptive statistics. Candidate predictors of postdischarge medication adherence were chosen a priori from patient characteristics assessed during hospital admission. These included patient age, gender, race, ethnicity, marital status, insurance, years of education, presence of primary care physician (PCP), study site, number of preadmission medications, medication understanding, baseline adherence, cognition, and health literacy. Unadjusted results were calculated using univariable linear regression, with each patient's adherence score as the dependent variable and each predictor as the independent variable. Adjusted results were then derived using multivariable linear regression with all the candidate predictors in the model.
Lastly, because of missing data for some predictors, in particular baseline adherence and medication understanding, multiple imputation techniques were used to impute missing data and increase statistical power.23 We used the Markov Chain Monte Carlo (MCMC) method for multiple imputation, which generally assumes that the data came from a normal distribution and that the missing data are missing at random. Because of the essentially normal distribution of the data, and because the amount of missing data was so small (<1% for almost all variables, 5% for baseline adherence, and 8% for medication understanding), we expected little bias and present the complete case analysis, which maximized statistical power.
Two‐sided P values <0.05 were considered significant, and SAS version 9.2 (Cary, NC) was used for all analyses.
RESULTS
Table 1 shows descriptive baseline patient characteristics of study sample (responders) as well as nonresponders at 30 days. For the responders, the mean age of the 646 patients was 61.2 years, 94.7% were insured, and 19.3% had inadequate or marginal health literacy. Patients were prescribed an average of 8 preadmission medications. Most patients (92.3%) had a regular PCP prior to admission. Nonresponders had nonsignificant trends towards having lower health literacy, medication understanding, and baseline medication adherence.
| Characteristic | Total N, 30‐Day Respondents | Value | Total N, Nonrespondents | Value |
|---|---|---|---|---|
| ||||
| Age, mean in yr (SD) | 646 | 61.2 (13.5) | 45 | 55.4 (14.3) |
| Gender, N (percentage) | 646 | 45 | ||
| Female | 272 (42.1) | 18 (40.0) | ||
| Male | 374 (57.9) | 27 (60.0) | ||
| Race, N (percentage) | 643 | 45 | ||
| White | 511 (79.5) | 32 (71.1) | ||
| Black | 104 (16.2) | 11 (24.4) | ||
| Other | 28 (4.4) | 2 (4.4) | ||
| Ethnicity, N (percentage) | 639 | 45 | ||
| Hispanic | 24 (3.8) | 1 (2.2) | ||
| Not Hispanic | 615 (96.2) | 44 (97.8) | ||
| Marital status, N (percentage) | 646 | 45 | ||
| Married/cohabitate | 382 (59.1) | 20 (44.4) | ||
| Separated/divorced | 118 (18.3) | 11 (24.4) | ||
| Widowed | 81 (12.5) | 5 (11.1) | ||
| Never married | 65 (10.1) | 9 (2.0) | ||
| Insurance type, N (percentage) | 646 | 45 | ||
| Medicaid | 53 (8.2) | 5 (11.1) | ||
| Medicare | 270 (41.8) | 13 (28.9) | ||
| Private | 289 (44.7) | 19 (42.2) | ||
| Self‐pay | 34 (5.3) | 8 (17.8) | ||
| Years of education, mean in yr (SD) | 643 | 14.0 (3.1) | 45 | 13.3 (2.7) |
| Presence of PCP prior to admission, N (percentage) | 646 | 45 | ||
| Yes | 596 (92.3) | 38 (84.4) | ||
| No | 50 (7.74) | 7 (15.6) | ||
| Site, N (percentage) | 646 | 45 | ||
| Site 1 | 358 (55.4) | 8 (17.8) | ||
| Site 2 | 288 (44.6) | 37 (82.2) | ||
| No. of preadmission medications, mean no. (SD) | 641 | 7.8 (4.8) | 45 | 7.7 (5.4) |
| Medication understanding score, mean (SD)* | 597 | 2.4 (0.5) | 40 | 2.2 (0.62) |
| Health literacy (s‐TOFHLA) score, mean (SD) | 642 | 29.1 (8.9) | 45 | 26.0 (12.0) |
| Baseline adherence (SD) | 613 | 2.7 (1.1) | 45 | 2.4 (1.2) |
| MiniCog score, N (percentage) | 646 | 45 | ||
| Demented | 63 (9.8) | 5 (11.1) | ||
| Not demented | 583 (90.2) | 40 (88.9) | ||
The average postdischarge adherence score was 95% (standard deviation [SD] = 10.2%), and less than 10% of patients had an adherence score of less than 85%; overall the distribution was left‐skewed. Table 2 illustrates crude and adjusted parameter estimates for variables in the model. Table 3 shows significant findings in the fully adjusted model, which used multiple imputation techniques to account for missing data.
| Predictor | Crude Parameter Estimate (Beta) With 95% Confidence Intervals | P Value | Adjusted Parameter Estimate (Beta) With 95% Confidence Intervals | P Value |
|---|---|---|---|---|
| ||||
| Age per 10 yr | 0.010 (0.007, 0.020) | <0.0001 | 0.010 (0.002, 0.020) | 0.018 |
| Male gender | 0.012 (0.004, 0.028) | 0.137 | 0.003 (0.014, 0.020) | 0.727 |
| Race/ethnicity | ||||
| White | 0.011 (0.009, 0.031) | 0.266 | Ref | Ref |
| Black | 0.017 (0.038, 0.005) | 0.13 | 0.006 (0.017, 0.030) | 0.598 |
| Other | 0.010 (0.029, 0.049) | 0.599 | 0.017 (0.027, 0.062) | 0.446 |
| Hispanic/Latino | 0.005 (0.037, 0.047) | 0.803 | 0.036 (0.013, 0.085) | 0.149 |
| Marital status | ||||
| Married/cohabitate | 0.006 (0.011, 0.022) | 0.500 | Ref | Ref |
| Separated/divorced | 0.005 (0.025, 0.016) | 0.664 | 0.009 (0.014, 0.031) | 0.446 |
| Widowed | 0.001 (0.023, 0.025) | 0.922 | 0.013 (0.039, 0.013) | 0.338 |
| Never married | 0.009 (0.035, 0.018) | 0.515 | 0.004 (0.033, 0.025) | 0.784 |
| Insurance type | ||||
| Private | 0.008 (0.008, 0.024) | 0.347 | Ref | Ref |
| Medicaid | 0.046 (0.075, 0.018) | 0.002 | 0.026 (0.058, 0.007) | 0.121 |
| Medicare | 0.012 (0.004, 0.028) | 0.138 | 0.002 (0.023, 0.018) | 0.844 |
| Self‐pay | 0.027 (0.062, 0.008) | 0.135 | 0.029 (0.073, 0.015) | 0.202 |
| Years of education | 0.003 (0.0003, 0.005) | 0.028 | 0.0001 (0.003, 0.003) | 0.949 |
| Presence of PCP prior to admission | 0.007 (0.022, 0.037) | 0.630 | 0.002 (0.032, 0.036) | 0.888 |
| Site | 0.050 (0.065, 0.034) | <0.0001 | 0.038 (0.056, 0.021) | <0.0001 |
| No. of preadmission medications | 0.0003 (0.002, 0.001) | 0.684 | 0.0001 (0.002, 0.002) | 0.918 |
| Medication understanding score per point | 0.007 (0.009, 0.023) | 0.390 | 0.006 (0.011, 0.023) | 0.513 |
| Health literacy (s‐TOFHLA) score per 10 points | 0.0006 (0.008, 0.01) | 0.897 | 0.003 (0.008, 0.01) | 0.644 |
| Baseline adherence per point | 0.023 (0.016, 0.031) | <0.0001 | 0.017 (0.009, 0.024) | <0.0001 |
| Cognitive function | 0.004 (0.022, 0.031) | 0.757 | 0.008 (0.019, 0.036) | 0.549 |
| Predictor | Parameter Estimate (Beta) With 95% Confidence Intervals | P Value |
|---|---|---|
| ||
| Age per 10 yr | 0.010 (0.004, 0.020) | 0.004 |
| Insurance type | ||
| Private | Ref | Ref |
| Medicaid | 0.045 (0.076, 0.014) | 0.005 |
| Medicare | 0.010 (0.030, 0.010) | 0.333 |
| Self‐pay | 0.013 (0.050, 0.025) | 0.512 |
| Site | 0.036 (0.053, 0.019) | <0.0001 |
| Baseline adherence per point | 0.016 (0.008, 0.024) | <0.0001 |
Intervention arm was of borderline statistical significance in predicting postdischarge adherence (P = 0.052), and so was removed from the final model. Study site, age, insurance, and baseline adherence were the only significant independent predictors of postdischarge adherence in the fully adjusted model (Table 3). For example, for every 10‐year increase in age, patients had, on average, an adjusted 1% absolute increase in their adherence score (95% confidence interval [CI] 0.4% to 2.0%). For every 1‐point increase in baseline medication adherence (based on the Morisky scale), there was a 1.6% absolute increase in medication adherence (95% CI 0.8% to 2.4%). In unadjusted analyses, patients with Medicaid were less adherent with medications after discharge than were patients with private insurance. This difference became nonsignificant in adjusted analyses, but when analyses were repeated using multiple imputation techniques, the results again became statistically significantMedicaid insurance was associated with a 4.5% absolute decrease in postdischarge adherence compared with private insurance (95% CI 7.6% to 1.4%). Study site (specifically, Brigham and Women's Hospital) was also a significant predictor of greater postdischarge medication adherence. Years of education was a significant predictor of adherence in unadjusted analyses, but was not an independent predictor when adjusted for other factors. When baseline adherence was removed from the multiple imputation model, there were no changes in which factors were significant predictors of adherence.
DISCUSSION
In this study, we found that low baseline adherence, younger age, Medicaid insurance, and study site were significant predictors of lower 30‐day medication adherence. Of particular interest is our finding regarding baseline adherence, a simple measure to obtain on hospitalized patients. It is notable that in our study, education was not an independent significant predictor of postdischarge adherence, even when baseline adherence was removed from the model. The same is true for medication understanding, cognitive function, and health literacy.
Older patients appeared more adherent with medications in the month after hospital discharge, perhaps reflecting increased interaction with the healthcare system (appointments, number of physician interactions), a greater belief in the importance of chronic medication management, or a higher level of experience with managing medications. A similar relationship between age and adherence has been shown in outpatient studies of patients with hypertension, diabetes, and other chronic diseases.2427
Medicaid patients may be less likely to remain adherent because of the plan's limited coverage of medications relative to patients' ability to pay. For example, Medicaid in Tennessee covers the first 5 generic medications at no cost to the patient but has co‐payments for additional medications and for brand name drugs. Medicaid in Massachusetts has co‐payments of $1 to $3 for each medication. Alternatively, Medicaid insurance may be a marker for other patient characteristics associated with low adherence for which we were not fully able to adjust.
Site differences were also notable in this study; these differences could have been due to differences in insurance coverage in Tennessee versus Massachusetts (which has near‐universal coverage), differences in types of insurance (eg, fewer patients at Brigham and Women's Hospital had Medicaid than at Vanderbilt), cultural and geographic differences between the 2 locations, or other differences in transitional care between the 2 sites.
This study corroborates previous literature on medication adherence (specifically unintentional nonadherence) in the outpatient setting,4, 811 for example, on the association of younger age with low adherence in certain populations. On the other hand, it may contrast with previous literature which has sometimes shown a relationship between patient education or health literacy and medication adherence.14, 15, 2835 However, previous studies have not focused on the transition from inpatient to outpatient settings. Perhaps intensive medication education in the hospital, even under usual care, mitigates the effects of these factors on postdischarge adherence. Finally, baseline adherence seems to correlate with postdischarge adherence, a finding which makes intuitive sense and has been previously reported for specific medications.36
There are several limitations to this study. Although large, the study was performed at only 2 clinical sites where most patients were white and fairly well‐educated, perhaps because patients admitted to a tertiary care center with ACS or ADHF are more affluent than general medical inpatients as a whole; this may limit generalizability. Postdischarge medication adherence might have been higher than in other patient populations given the nature of the population, possible loss‐to‐follow‐up bias, and the fact that half of the subjects received an intervention designed to improve medication management after discharge; such low rates of nonadherence in our study may have reduced our ability to detect important predictors in our models. In addition, the period of follow‐up was 30 days, thus limiting our findings to short‐term postdischarge medication adherence. Postdischarge medication adherence was based on patient self‐report, which not only assumed that the patient was still managing his/her own medications after discharge, but may also be susceptible to both recall and social acceptability bias, which might overestimate our adherence scores, again limiting our ability to detect important predictors of nonadherence. However, other studies have shown a good correlation between self‐reported medication adherence and other more objective measures,37, 38 and recall was only for 7 days, a measure used previously in the literature39, 40 and one designed to reduce recall bias. Systematic underreporting in certain patient populations is less likely but possible.
In the future, research should focus on targeting patients who have low baseline adherence to evaluate the effects of various interventions on postdischarge medication outcomes. Repeating the study in a population with a high prevalence of low health literacy might be illuminating, given that previous studies have shown that patients with low health literacy have less ability to identify their medications and have less refill adherence.29, 30
In conclusion, in patients hospitalized with cardiovascular disease, predictors of lower postdischarge adherence include younger age, Medicaid insurance, and low baseline adherence. It may be prudent to assess baseline adherence and insurance type in hospitalized patients in order to identify those who may benefit from additional assistance to improve medication adherence and medication safety during transitions in care.
Acknowledgements
Meeting Presentations: SGIM New England Regional Meeting, oral presentation, Boston, MA, March 4, 2011; and SGIM National Meeting, poster presentation, Phoenix, AZ, May 6, 2011. Dr Schnipper had full access to all of the data in the study and takes responsibility for the integrity of the data and the accuracy of the data analysis.
Disclosures: Financial support was provided by R01 HL089755 (NHLBI, Kripalani), K23 HL077597 (NHLBI, Kripalani), K08 HL072806 (NHLBI, Schnipper), T32HP10251‐02 (Cohen), and by the Division of General Medicine, Massachusetts General Hospital and the Harvard Medical School Fellowship in General Medicine and Primary Care (Cohen). Dr Kripalani is a consultant to and holds equity in PictureRx, LLC, which makes patient education tools to improve medication management. PictureRx did not provide materials or funding for this study. All other authors disclose no relevant or financial conflicts of interest.
- ,.Adherence to medication.N Engl J Med.2005;353(5):487–497.
- ,,,.Posthospital medication discrepancies: prevalence and contributing factors.Arch Intern Med.2005;165(16):1842–1847.
- ,.Medication use in the transition from hospital to home.Ann Acad Med Singapore.2008;37(2):136–141.
- ,,,.Medical errors related to discontinuity of care from an inpatient to an outpatient setting.J Gen Intern Med.2003;18(8):646–651.
- ,,,,.The incidence and severity of adverse events affecting patients after discharge from the hospital.Ann Intern Med.2003;138(3):161–167.
- ,,,,.Adverse drug events occurring following hospital discharge.J Gen Intern Med.2005;20(4):317–323.
- ,,, et al.Role of pharmacist counseling in preventing adverse drug events after hospitalization.Arch Intern Med.2006;166(5):565–571.
- ,,.Reconcilable differences: correcting medication errors at hospital admission and discharge.Qual Saf Health Care.2006;15(2):122–126.
- ,.Risk of rehospitalization among bipolar disorder patients who are nonadherent to antipsychotic therapy after hospital discharge.Am J Health Syst Pharm.2009;66(4):358–365.
- ,,,,.Continuity and adherence to long‐term drug treatment by geriatric patients after hospital discharge: a prospective cohort study.Drugs Aging.2008;25(10):861–870.
- ,,,.Medication use among inner‐city patients after hospital discharge: patient‐reported barriers and solutions.Mayo Clin Proc.2008;83(5):529–535.
- ,,,,,.Relationship of health literacy to intentional and unintentional non‐adherence of hospital discharge medications.J Gen Intern Med.2012;27(2):173–178.
- Office of Disease Prevention and Health Promotion, US Department of Health and Human Services.Healthy People 2010. Available at: http://www.healthypeople.gov/Document/pdf/uih/2010uih.pdf. Accessed February 15,2012.
- ,,, et al.Literacy and misunderstanding prescription drug labels.Ann Intern Med.2006;145(12):887–894.
- ,,,,,.Predictors of medication self‐management skill in a low‐literacy population.J Gen Intern Med.2006;21(8):852–856.
- ,,, et al;for the PILL‐CVD Study Group.Rationale and design of the Pharmacist Intervention for Low Literacy in Cardiovascular Disease (PILL‐CVD) study.Circ Cardiovasc Qual Outcomes.2010;3(2):212–219.
- ,,,,.Simplifying detection of cognitive impairment: comparison of the Mini‐Cog and Mini‐Mental State Examination in a multiethnic sample.J Am Geriatr Soc.2005;53(5):871–874.
- .Short Test of Functional Health Literacy in Adults.Snow Camp, NC:Peppercorn Books and Press;1998.
- ,,,.Predictive validity of a medication adherence measure in an outpatient setting.J Clin Hypertens (Greenwich).2008;10(5):348–354.
- ,,,,,.Health literacy and medication understanding among hospitalized adults.J Hosp Med. In press.
- ,,,,,.Health literacy and medication understanding among hospitalized adults.J Hosp Med.2011;6(9):488–493.
- ,,.The summary of diabetes self‐care activities measure: results from 7 studies and a revised scale.Diabetes Care.2000;23(7):943–950.
- .Multiple Imputation for Nonresponse in Surveys.New York, NY:John Wiley 1987.
- ,,, et al.Medication adherence in HIV‐infected adults: effect of patient age, cognitive status, and substance abuse.AIDS.2004;18(suppl 1):S19–S25.
- ,,.Factors associated with antihypertensive drug compliance in 83,884 Chinese patients: a cohort study.J Epidemiol Community Health.2010;64(10):895–901.
- ,,,,,.Adherence to oral hypoglycemic agents in 26,782 Chinese patients: a cohort study.J Clin Pharmacol.2011;51(10):1474–1482.
- ,,,,.Effect of a pharmacy‐based health literacy intervention and patient characteristics on medication refill adherence in an urban health system.Ann Pharmacother.2010;44(1):80–87.
- ,,.Adherence to combination antiretroviral therapies in HIV patients of low health literacy.J Gen Intern Med.1999;14(5):267–273.
- ,,,,,.Factors associated with medication refill adherence in cardiovascular‐related diseases: a focus on health literacy.J Gen Intern Med.2006;21(12):1215–1221.
- ,,,,.Limited health literacy is a barrier to medication reconciliation in ambulatory care.J Gen Intern Med.2007;22(11):1523–1526.
- ,,,,.The impact of low health literacy on surgical practice.Am J Surg.2004;188(3):250–253.
- ,,,,.Relationships between beliefs about medications and adherence.Am J Health Syst Pharm.2009;66(7):657–664.
- ,,,.Health literacy and anticoagulation‐related outcomes among patients taking warfarin.J Gen Intern Med.2006;21(8):841–846.
- ,,,,,.Health literacy, antiretroviral adherence, and HIV‐RNA suppression: a longitudinal perspective.J Gen Intern Med.2006;21(8):835–840.
- ,,, et al.Risk factors for nonadherence to warfarin: results from the IN‐RANGE study.Pharmacoepidemiol Drug Saf.2008;17(9):853–860.
- ,,, et al.Predictors of low clopidogrel adherence following percutaneous coronary intervention.Am J Cardiol.2011;108(6):822–827.
- ,,,,,.Correlation between adherence rates measured by MEMS and self‐reported questionnaires: a meta‐analysis.Health Qual Life Outcomes.2010;8:99.
- ,,,,,.Concordance of adherence measurement using self‐reported adherence questionnaires and medication monitoring devices.Pharmacoeconomics.2010;28(12):1097–1107.
- ,,,.Polypharmacy and medication adherence in patients with type 2 diabetes.Diabetes Care.2003;26(5):1408–1412.
- ,,,.Improving adherence and reducing medication discrepancies in patients with diabetes.Ann Pharmacother.2003;37(7–8):962–969.
Copyright © 2012 Society of Hospital Medicine
Health literacy and medication understanding among hospitalized adults
If you wish to receive credit for this activity, please refer to the website:
Accreditation and Designation Statement
Blackwell Futura Media Services designates this journal‐based CME activity for a maximum of 1 AMA PRA Category 1 Credit. Physicians should only claim credit commensurate with the extent of their participation in the activity.
Blackwell Futura Media Services is accredited by the Accreditation Council for Continuing Medical Education to provide continuing medical education for physicians.
Educational Objectives
Upon completion of this activity, participants will be better able to:
-
Assess the factors associated with reduced medication adherence.
-
Distinguish which components of medication understanding are assessed by the Medication Understanding Questionnaire.
This manuscript underwent peer review in line with the standards of editorial integrity and publication ethics maintained by Journal of Hospital Medicine. The peer reviewers have no relevant financial relationships. The peer review process for Journal of Hospital Medicine is single‐blinded. As such, the identities of the reviewers are not disclosed in line with the standard accepted practices of medical journal peer review.
Conflicts of interest have been identified and resolved in accordance with Blackwell Futura Media Services's Policy on Activity Disclosure and Conflict of Interest. The primary resolution method used was peer review and review by a non‐conflicted expert.
Instructions on Receiving Credit
For information on applicability and acceptance of CME credit for this activity, please consult your professional licensing board.
This activity is designed to be completed within an hour; physicians should claim only those credits that reflect the time actually spent in the activity. To successfully earn credit, participants must complete the activity during the valid credit period, which is up to two years from initial publication.
Follow these steps to earn credit:
-
Log on to www.wileyblackwellcme.com
-
Read the target audience, learning objectives, and author disclosures.
-
Read the article in print or online format.
-
Reflect on the article.
-
Access the CME Exam, and choose the best answer to each question.
-
Complete the required evaluation component of the activity.
This activity will be available for CME credit for twelve months following its publication date. At that time, it will be reviewed and potentially updated and extended for an additional twelve months.
Health Literacy and Medication Use
With the aging of the US population, complex medication regimens to treat multiple comorbidities are increasingly common.1 Nevertheless, patients often do not fully understand the instructions for safe and effective medication use. Aspects of medication understanding include knowledge of the drug indication, dose, frequency, and for certain medications, special instructions.2 Medication understanding is associated with better medication adherence, fewer drug‐related problems, and fewer emergency department visits.3 Among patients with chronic conditions, such as cardiovascular disease (CVD), understanding and adherence to the medication regimen are critical for successful disease control and clinical outcomes.4
Patients' understanding of their medication regimen is also vitally important upon admission to the hospital. Patients often are the main source of information for the admission medication history and subsequent medication reconciliation.5 Poor patient understanding of the preadmission medication regimen can contribute to errors in inpatient and postdischarge medication orders, and adversely affect patient safety.6 However, little research has examined patients' understanding of the preadmission medication regimen and factors that affect it.
In the outpatient setting, previous investigations have suggested that low health literacy, advanced age, and impaired cognitive function adversely affect patients' understanding of medication instructions.2, 7, 8 These studies were limited by a small sample size, single site, or focus on a specific population, such as inner‐city patients. Additionally, the measures used to assess medication understanding were time‐consuming and required patients' medications to be present for testing, thus limiting their utility.2
To address these gaps in the literature, we developed and implemented the Medication Understanding Questionnaire (MUQ), an original and relatively rapid measure that does not require patients' medications be present for testing. In a study of adults at 2 large teaching hospitals, we examined the association of health literacy, age, cognitive function, number of preadmission medications, and other factors on patients' understanding of their preadmission medication regimen. We hypothesized that lower health literacy would be independently associated with lower medication understanding as assessed using the MUQ.
METHODS
The present study was a cross‐sectional assessment conducted using baseline interview data from the Pharmacist Intervention for Low Literacy in Cardiovascular Disease (PILL‐CVD) Study (ClinicalTrials.gov Registration #NCT00632021; available at:
Population
The PILL‐CVD study protocol and eligibility criteria has been previously published.9 Briefly, patients were eligible if they were at least 18 years old and admitted with acute coronary syndrome or acute decompensated heart failure. Patients were excluded if they: were too ill to complete an interview; were not oriented to person, place, or time; had a corrected visual acuity worse than 20/200; had impaired hearing; could not communicate in English or Spanish; were not responsible for managing their own medications; had no phone; were unlikely to be discharged to home; were in police custody; or had been previously enrolled in the study. For the present analysis, we also excluded any patient who was not on at least 1 prescription medication prior to admission. Saline nasal spray, saline eye drops, herbal products, nutritional supplements, vitamins, and over the counter (OTC) lotions and creams were not counted as prescription medications. Oral medications available both OTC and by prescription (eg, aspirin, nonsteroidal anti‐inflammatory drugs, and acid reflux medications) were counted as prescription medications.
Measures
At enrollment, which was usually within 24 to 48 hours of admission, participants completed the short form of the Test of Functional Health Literacy in Adults (s‐TOFHLA) in English or Spanish,10 the Mini‐Cog test of cognition,11 and the Medication Understanding Questionnaire (MUQ), as well as demographic information. The number of prescription medications prior to hospital admission was abstracted from the best available reference listthat documented by the treating physicians in the electronic health record (EHR). The EHR at each site was a home‐grown system and included both inpatient and outpatient records, which facilitated physicians' documentation of the medication list.
The s‐TOFHLA consists of 2 short reading‐comprehension passages. Scores on the s‐TOFHLA range from 0 to 36, and can be categorized as inadequate (0‐16), marginal (17‐22), or adequate (23‐36) health literacy.10 The Mini‐Cog includes 3‐item recall and clock‐drawing tests. It provides a brief measure of cognitive function and performs well among patients with limited literacy or educational attainment.11 Scores range from 0 to 5, with a score <3 indicating possible dementia.
The MUQ was administered verbally and assessed patients' understanding of their own preadmission medication regimen. It was developed for this study, based on published measures of medication understanding.2, 12 To administer the MUQ, research assistants (RAs) accessed the patient's preadmission medication list from the EHR and used a random number table to select up to 5 prescription medications from the list. If the patient was taking 5 or fewer medications, all of their medications were selected. Saline nasal spray, saline eye drops, herbal products, nutritional supplements, vitamins, and OTC lotions and creams were excluded from testing. The RA provided the brand and generic name of each medication, and then asked the patient for the drug's purpose, strength per unit (eg, 20 mg tablet), number of units taken at a time (eg, 2 tablets), and dosing frequency (eg, twice a day). For drugs prescribed on an as‐needed basis, the RA asked patients for the maximum allowable dose and frequency. Patients were instructed to not refer to a medication list or bottles when responding. The RA documented the patient's responses on the MUQ, along with the dosing information from the EHR for each selected medication.
One clinical pharmacist (MM) scored all MUQ forms by applying a set of scoring rules. Each medication score could range from 0 to 3. The components of the score included indication (1 point), strength (0.5 point), units (0.5 point), and frequency (1 point). The patient's overall MUQ score was an average of the MUQ scores for each tested medication.
Statistical Analysis
We summarized patient characteristics, number of preadmission medications, and MUQ scores using median and interquartile range (IRQ) for continuous variables, and frequencies and proportions for categorical variables. We conducted proportional odds logistic regression (ordinal regression) to estimate the effect of s‐TOFHLA score, other patient characteristics, and number of medications on MUQ scores.13
Important covariates were selected a priori based on clinical significance. These included age (continuous), gender, patient self‐reported race (white, black, other nonwhite), Mini‐Cog score (continuous), primary language (English or Spanish), years of education (continuous), number of preadmission medications (continuous), income (ordinal categories), insurance type (categorical), and study site. Covariates with missing data (household income, health literacy, and years of education) were imputed using multiple imputation techniques.14 The relationship between number of preadmission medications and MUQ scores was found to be nonlinear, and it was modeled using restricted cubic splines.14 We also fit models which treated health literacy and cognition as categorical variables. Results are reported as odds ratios (OR) with 95% confidence intervals (CI). Wald tests were used to test for the statistical significance of predictor variables. Two‐sided P values less than 0.05 were considered statistically significant. All analyses were performed using statistical language R (R Foundation, available at:
RESULTS
Baseline Characteristics
Among the 862 patients enrolled in PILL‐CVD, 790 (91.7 %) had at least 1 preadmission medication and were included in this analysis (Table 1). Forty‐seven percent were admitted to VUH (N = 373) and 53% to BWH (N = 417). The median age was 61 (interquartile range [IQR] 52, 71), 77% were white, and 57% were male. Inadequate or marginal health literacy was identified among 11% and 9% of patients, respectively. The median number of preadmission medications was 8 (IQR 5, 11). Patients excluded from the analysis for not having preadmission medications were similar to included patients, except they were more likely to be male (76% vs 57%) and less likely to have health insurance (23% self‐pay vs 4%). (Data available upon request.)
| Characteristic | N = 790 |
|---|---|
| |
| Study hospital, N (%) | |
| Vanderbilt University Hospital | 373 (47.2) |
| Brigham and Women's Hospital | 417 (52.8) |
| Age in years, median (IQR) | 61 (52, 71) |
| Gender, N (%) | |
| Male | 452 (57.2) |
| Female | 338 (42.8) |
| Primary language, N (%) | |
| English | 779 (98.6) |
| Spanish | 11 (1.4) |
| Race, N (%) | |
| White | 610 (77.2) |
| Black or African American | 136 (17.2) |
| Other | 44 (5.6) |
| Health literacy, s‐TOFHLA score, median (IQR) | 33 (25, 35) |
| Health literacy, N (%)& | |
| Inadequate | 84 (10.6) |
| Marginal | 74 (9.4) |
| Adequate | 613 (77.6) |
| Mini‐Cog score, median (IQR) | 4 (3, 5) |
| Dementia, N (%) | |
| No | 692 (87.6) |
| Yes | 98 (12.4) |
| Number of medications, median (IQR) | 8 (5, 11) |
| Health insurance type, N (%) | |
| Medicaid | 74 (9.4) |
| Medicare | 337 (42.6) |
| Private | 334 (42.3) |
| Self‐pay | 35 (4.4) |
| Other | 10 (1.3) |
| Self‐reported household income, N (%)& | |
| <$10,000 | 38 (4.8) |
| $10,000 to <$15,000 | 45 (5.7) |
| $15,000 to <$20,000 | 42 (5.3) |
| $20,000 to <$25,000 | 105 (13.3) |
| $25,000 to <$35,000 | 99 (12.5) |
| $35,000 to <$50,000 | 112 (14.2) |
| $50,000 to <$75,000 | 118 (14.9) |
| $75,000+ | 227 (28.7) |
| Years of school, median (IQR)& | 14 (12, 16) |
MUQ Scores
The MUQ was administered in approximately 5 minutes. The median MUQ score was 2.5 (IQR 2.2, 2.8) (Table 2); 16.3% of patients scored less than 2. Subjects typically achieved high scores for the domains of indication, units, and frequency, while scores on the strength domain were lower (median = 0.2 [IQR 0.1, 0.4], maximum possible = 0.5).
| Median (IQR) | |
|---|---|
| |
| No. of drugs tested | 5 (4, 5) |
| MUQ score* | 2.5 (2.2, 2.8) |
| Indication | 1.0 (0.8, 1.0) |
| Strength | 0.2 (0.1, 0.4) |
| Units | 0.5 (0.4, 0.5) |
| Frequency | 1.0 (0.8, 1.0) |
Predictors of Medication Understanding
Unadjusted relationships of health literacy, cognition, and number of medications with medication understanding are shown in Figure 1 (panels A, B, and C, respectively). The figure demonstrates a linear relationship with both health literacy (Figure 1A) and cognition (Figure 1B), and a nonlinear relationship between number of preadmission medications and MUQ score (Figure 1C).

Adjusted relationships using imputed data for missing covariates are shown in Figure 2. Lower health literacy, cognitive impairment, male gender, and black race were independently associated with lower understanding of preadmission medications. Each 1 point increase in s‐TOFHLA or Mini‐Cog score led to an increase in medication understanding (OR = 1.04; 95% CI, 1.02 to 1.06; P = 0.0001; and OR = 1.24; 95% CI, 1.1 to 1.4; P = 0.001; respectively). Patients with marginal or inadequate health literacy had lower odds of understanding their regimen (OR = 0.53; 95% CI, 0.34 to 0.84; and OR = 0.49; 95% CI, 0.31 to 0.78, respectively) compared to those with adequate health literacy. Impaired cognitive function (Mini‐Cog score <3, indicating dementia) was also associated with lower odds of medication understanding (OR = 0.57; 95% CI, 0.38 to 0.86) compared to those with no cognitive impairment. An increase in the number of preadmission medications (up to 10) was also strongly associated with lower MUQ scores. For each increase by 1 medication, there was a significant decrease in medication understanding, up to 10 medications, beyond which understanding did not significantly decrease further. Patients on 6 medications were about half as likely to understand their medication regimen as patients on only 1 medication (OR = 0.52; 95% CI, 0.36 to 0.75). For patients on 11 medications, the odds of medication understanding were 24% lower than for patients on 6 medications (OR = 0.76; 95% CI, 0.65 to 0.89). Patients' age, years of schooling, and household income were not independently associated with medication understanding. Results were similar using data without multiple imputation.
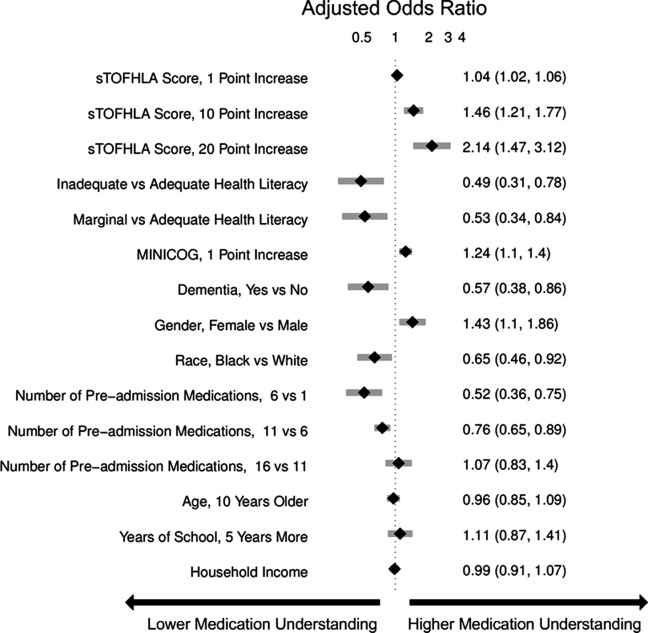
Examples of Misunderstanding of Common Medications
Table 3 provides examples of incorrect patient responses for several commonly prescribed medications or drug classes, including aspirin, digoxin, nitroglycerin, and HMG‐CoA reductase inhibitors (statins). For aspirin, many patients were not aware of the strength. For digoxin, several participants reported splitting a higher‐strength pill to obtain the prescribed dose, which should not be done given the imprecision of splitting and narrow therapeutic index of this drug. Patients prescribed nitroglycerin sublingual tablets were commonly unable to report the correct dosing and frequency for angina treatment. Medications for cholesterol were often reported as being taken in the morning; this was scored strictly as a frequency error if the medication timing in the EHR was listed as evening or bedtime. We also identified many patients with poor understanding of opioid analgesics, particularly regarding their dosing and frequency.
| Medications | Common Incorrect Responses | Correct Information | Coded Error |
|---|---|---|---|
| |||
| Aspirin | tablet twice a day | 1 tablet once a day | Units and frequency |
| I am not aware what aspirin I am taking | 81 mg once a day | Strength | |
| I am taking 6‐something every day | 81 mg once a day | Strength | |
| 31 mg a day | 81 mg once a day | Strength | |
| 180 mg a day | 81 mg once a day | Strength | |
| 1 low‐dose daily | 325 mg once a day | Strength | |
| 125 mg a day | 325 mg once a day | Strength | |
| I am taking it for my blood pressure | Heart medication | Indication | |
| Nitroglycerin sublingual | As needed, I have taken up to 4 a day | Dissolve 1 tablet under the tongue, every 5 min as needed, up to 3 doses | Frequency |
| As needed every 15 min | Frequency | ||
| As needed up to 4 doses every 10 min | Frequency | ||
| Dissolve couple units under the tongue, as needed | Units and frequency | ||
| As many as I want, every 5 min | Frequency | ||
| Digoxin | tablet daily | 1 tablet daily | Units |
| 1 tablet daily | 1 tablet every other day | Frequency | |
| I am taking it for my blood pressure | Heart medication | Indication | |
| HMG‐CoA reductase inhibitors | 1 tablet every morning | 1 tablet every evening | Frequency |
| tablet twice a day | 1 tablet once a day | Units and frequency | |
| I do not know the indication | High cholesterol | Indication | |
| Propoxyphene/acetaminophen | tablet as needed | 1 tablet every 4‐6 hr as needed | Units and frequency |
| Hydrocodone/acetaminophen | I do not know the strength of this medication | 5 mg/500 mg | Strength |
| 1 tablet as I need it | 1 tablet every 4‐6 hr as needed | Frequency | |
DISCUSSION
We used a novel four‐component medication understanding questionnaire, developed for this study, to assess patients' understanding of up to 5 drugs selected randomly from the participant's preadmission medication list. The MUQ proved to be easy to administer by nonmedical staff within a short period of time (approximately 5 minutes per patient). It was well understood by patients. By limiting the assessment to 5 or fewer medications, the MUQ has a distinct advantage over existing measures of medication understanding that require testing the entire regimen. We did not find any limitations related to cutting off the assessment at 5 medications. In addition, this tool affords assessment of medication understanding without requiring medication bottles be present, enhancing its utility in the inpatient setting.
MUQ scores were associated with health literacy and other patient characteristics in an expected manner. We demonstrated that inadequate or marginal health literacy, as well as impaired cognitive function, were associated with low medication understanding. We also were able to demonstrate a relationship between increasing number of medications and lower medication understanding. Interestingly, in our patient population, understanding continued to decrease until reaching 10 medications, beyond which further increases in the number of medications had no additional detrimental effect on medication understanding. This nonlinear relationship between number of medications and medication understanding has potential implications for prescribing practice.
Our findings which utilize the MUQ among inpatients are consistent with prior literature in other settings.2, 7, 8 In a previous outpatient study, we identified that health literacy plays an important role in a patient's ability to successfully report and manage their daily medications.2 Other studies have also shown that patients with low health literacy have more difficulty understanding prescription drug information, and that they often experience medication‐related problems after hospital discharge.15, 16 The number and often the types of medications an individual takes have also been shown to increase the risk for adverse events and nonadherence to the treatment plan.1720 We postulate that this risk of adverse drug events is related at least in part to a patient's understanding of their medication regimen.
There are several limitations to this study. First, the MUQ did not assess certain aspects of medication understanding, such as knowledge of pill appearance or side effects, nor did it assess components of patients' actual drug‐taking behavior, such as organization of medications or behavioral cues. Thus, adaptive behaviors that patients may perform to improve their medication management, such as writing on labels or memory cues, are not captured by this test. Second, in administering and scoring the MUQ, we used the patient's preadmission medication list documented in the EHR as the reference standard. This was the best available reference list, and was generally accurate, as both hospitals had medication reconciliation systems in use at the time of the study21; nevertheless, it may contain inaccuracies. Documentation for certain medications, such as warfarin, in which dose can change frequently, often did not reflect the latest prescribed dose. In such cases, we scored the patient's answer as correct if the dose appeared reasonable and appropriate to the clinical pharmacist. As a result, a patient's MUQ score may have been overestimated in these cases.
Additional research will be needed to further validate the MUQ in other settings. In particular, studies should establish the relationship between the MUQ, serious medication errors after discharge, and potential to benefit from educational interventions. Also, as noted above, the nonlinear relationship between number of medications and medication understanding should be confirmed in other studies.
In conclusion, we demonstrated that patients with low health literacy, impaired cognition, or a higher number of medications had significantly poorer understanding of their preadmission medication regimen. These findings have important clinical implications. It would be appropriate to exercise greater caution when taking a medication history from patients who cannot readily provide the purpose, strength, units, and frequency of their medications. Attempts to validate the information obtained from patients with other sources of data, such as family members, inpatient or outpatient health records, and community pharmacy records should be considered. Patients at high risk for poor medication understanding, either measured directly using the MUQ or identified via risk factors such as polypharmacy, low cognition, or low health literacy, may warrant more intensive medication reconciliation interventions and/or educational counseling and follow‐up to prevent postdischarge adverse drug events. Further research is needed to determine if targeting these populations for interventions improves medication safety during transitions in care.
- ,,.Prevalence, expenditures, and complications of multiple chronic conditions in the elderly.Arch Intern Med.2002;162(20):2269–2276.
- ,,,,,.Predictors of medication self‐management skill in a low‐literacy population.J Gen Intern Med.2006;21(8):852–856.
- ,.Adherence to medication.N Engl J Med.2005;353(5):487–497.
- ,,.Medication adherence: its importance in cardiovascular outcomes.Circulation.2009;119(23):3028–3035.
- ,,, et al.Classifying and predicting errors of inpatient medication reconciliation.J Gen Intern Med.2008;23(9):1414–1422.
- ,.Addressing postdischarge adverse events: a neglected area.Jt Comm J Qual Patient Saf.2008;34(2):85–97.
- ,,.Medication management capacity in highly functioning community‐living older adults: detection of early deficits.J Am Geriatr Soc.1999;47(5):592–596.
- ,,.Variation in medication understanding among the elderly.Am J Health‐Syst Pharm.2004;61(4):373–380.
- ,,, et al.The rationale and design of the Pharmacist Intervention for Low Literacy in Cardiovascular Disease (PILL‐CVD) study.Circ Cardiovasc Qual Outcomes.2010;3:212–219.
- ,,,.Short Test of Functional Health Literacy in Adults.Snow Camp, NC:Peppercorn Books and Press;1998.
- ,,,,.Simplifying detection of cognitive impairment: comparison of the Mini‐Cog and Mini‐Mental State Examination in a multiethnic sample.J Am Geriatr Soc.2005;53(5):871–874.
- ,.Instruments assessing capacity to manage medications.Ann Pharmacother.2008;42(7):1026–1036.
- ,.Estimation of the probability of an event as a function of several independent variables.Biometrika.1967;54(1):167–179.
- ,.Using full probability models to compute probabilities of actual interest to decision makers.Int J Technol Assess Health Care.2001;17(1):17–26.
- ,,, et al.Literacy and misunderstanding prescription drug labels.Ann Intern Med.2006;145(12):887–894.
- ,,,.Medication use among inner‐city patients after hospital discharge: patient reported barriers and solutions.Mayo Clin Proc.2008;83(5):529–535.
- ,,,,,.National surveillance of emergency department visits for outpatient adverse drug events.JAMA.2006;296(15):1858–1866.
- ,,,.Medication use leading to emergency department visits for adverse drug events in older adults.Ann Intern Med.2007;147(11):755–765.
- ,,,,.Adverse drug events occurring following hospital discharge.J Gen Intern Med.2005;20:317–323.
- ,,, et al.Adverse drug events in ambulatory care.N Engl J Med.2003;348(16):1556–1564.
- ,,, et al.Effect of an electronic medication reconciliation application and process redesign on potential adverse drug events: a cluster‐randomized trial.Arch Intern Med.2009;169(8):771–780.
With the aging of the US population, complex medication regimens to treat multiple comorbidities are increasingly common.1 Nevertheless, patients often do not fully understand the instructions for safe and effective medication use. Aspects of medication understanding include knowledge of the drug indication, dose, frequency, and for certain medications, special instructions.2 Medication understanding is associated with better medication adherence, fewer drug‐related problems, and fewer emergency department visits.3 Among patients with chronic conditions, such as cardiovascular disease (CVD), understanding and adherence to the medication regimen are critical for successful disease control and clinical outcomes.4
Patients' understanding of their medication regimen is also vitally important upon admission to the hospital. Patients often are the main source of information for the admission medication history and subsequent medication reconciliation.5 Poor patient understanding of the preadmission medication regimen can contribute to errors in inpatient and postdischarge medication orders, and adversely affect patient safety.6 However, little research has examined patients' understanding of the preadmission medication regimen and factors that affect it.
In the outpatient setting, previous investigations have suggested that low health literacy, advanced age, and impaired cognitive function adversely affect patients' understanding of medication instructions.2, 7, 8 These studies were limited by a small sample size, single site, or focus on a specific population, such as inner‐city patients. Additionally, the measures used to assess medication understanding were time‐consuming and required patients' medications to be present for testing, thus limiting their utility.2
To address these gaps in the literature, we developed and implemented the Medication Understanding Questionnaire (MUQ), an original and relatively rapid measure that does not require patients' medications be present for testing. In a study of adults at 2 large teaching hospitals, we examined the association of health literacy, age, cognitive function, number of preadmission medications, and other factors on patients' understanding of their preadmission medication regimen. We hypothesized that lower health literacy would be independently associated with lower medication understanding as assessed using the MUQ.
METHODS
The present study was a cross‐sectional assessment conducted using baseline interview data from the Pharmacist Intervention for Low Literacy in Cardiovascular Disease (PILL‐CVD) Study (ClinicalTrials.gov Registration #NCT00632021; available at:
Population
The PILL‐CVD study protocol and eligibility criteria has been previously published.9 Briefly, patients were eligible if they were at least 18 years old and admitted with acute coronary syndrome or acute decompensated heart failure. Patients were excluded if they: were too ill to complete an interview; were not oriented to person, place, or time; had a corrected visual acuity worse than 20/200; had impaired hearing; could not communicate in English or Spanish; were not responsible for managing their own medications; had no phone; were unlikely to be discharged to home; were in police custody; or had been previously enrolled in the study. For the present analysis, we also excluded any patient who was not on at least 1 prescription medication prior to admission. Saline nasal spray, saline eye drops, herbal products, nutritional supplements, vitamins, and over the counter (OTC) lotions and creams were not counted as prescription medications. Oral medications available both OTC and by prescription (eg, aspirin, nonsteroidal anti‐inflammatory drugs, and acid reflux medications) were counted as prescription medications.
Measures
At enrollment, which was usually within 24 to 48 hours of admission, participants completed the short form of the Test of Functional Health Literacy in Adults (s‐TOFHLA) in English or Spanish,10 the Mini‐Cog test of cognition,11 and the Medication Understanding Questionnaire (MUQ), as well as demographic information. The number of prescription medications prior to hospital admission was abstracted from the best available reference listthat documented by the treating physicians in the electronic health record (EHR). The EHR at each site was a home‐grown system and included both inpatient and outpatient records, which facilitated physicians' documentation of the medication list.
The s‐TOFHLA consists of 2 short reading‐comprehension passages. Scores on the s‐TOFHLA range from 0 to 36, and can be categorized as inadequate (0‐16), marginal (17‐22), or adequate (23‐36) health literacy.10 The Mini‐Cog includes 3‐item recall and clock‐drawing tests. It provides a brief measure of cognitive function and performs well among patients with limited literacy or educational attainment.11 Scores range from 0 to 5, with a score <3 indicating possible dementia.
The MUQ was administered verbally and assessed patients' understanding of their own preadmission medication regimen. It was developed for this study, based on published measures of medication understanding.2, 12 To administer the MUQ, research assistants (RAs) accessed the patient's preadmission medication list from the EHR and used a random number table to select up to 5 prescription medications from the list. If the patient was taking 5 or fewer medications, all of their medications were selected. Saline nasal spray, saline eye drops, herbal products, nutritional supplements, vitamins, and OTC lotions and creams were excluded from testing. The RA provided the brand and generic name of each medication, and then asked the patient for the drug's purpose, strength per unit (eg, 20 mg tablet), number of units taken at a time (eg, 2 tablets), and dosing frequency (eg, twice a day). For drugs prescribed on an as‐needed basis, the RA asked patients for the maximum allowable dose and frequency. Patients were instructed to not refer to a medication list or bottles when responding. The RA documented the patient's responses on the MUQ, along with the dosing information from the EHR for each selected medication.
One clinical pharmacist (MM) scored all MUQ forms by applying a set of scoring rules. Each medication score could range from 0 to 3. The components of the score included indication (1 point), strength (0.5 point), units (0.5 point), and frequency (1 point). The patient's overall MUQ score was an average of the MUQ scores for each tested medication.
Statistical Analysis
We summarized patient characteristics, number of preadmission medications, and MUQ scores using median and interquartile range (IRQ) for continuous variables, and frequencies and proportions for categorical variables. We conducted proportional odds logistic regression (ordinal regression) to estimate the effect of s‐TOFHLA score, other patient characteristics, and number of medications on MUQ scores.13
Important covariates were selected a priori based on clinical significance. These included age (continuous), gender, patient self‐reported race (white, black, other nonwhite), Mini‐Cog score (continuous), primary language (English or Spanish), years of education (continuous), number of preadmission medications (continuous), income (ordinal categories), insurance type (categorical), and study site. Covariates with missing data (household income, health literacy, and years of education) were imputed using multiple imputation techniques.14 The relationship between number of preadmission medications and MUQ scores was found to be nonlinear, and it was modeled using restricted cubic splines.14 We also fit models which treated health literacy and cognition as categorical variables. Results are reported as odds ratios (OR) with 95% confidence intervals (CI). Wald tests were used to test for the statistical significance of predictor variables. Two‐sided P values less than 0.05 were considered statistically significant. All analyses were performed using statistical language R (R Foundation, available at:
RESULTS
Baseline Characteristics
Among the 862 patients enrolled in PILL‐CVD, 790 (91.7 %) had at least 1 preadmission medication and were included in this analysis (Table 1). Forty‐seven percent were admitted to VUH (N = 373) and 53% to BWH (N = 417). The median age was 61 (interquartile range [IQR] 52, 71), 77% were white, and 57% were male. Inadequate or marginal health literacy was identified among 11% and 9% of patients, respectively. The median number of preadmission medications was 8 (IQR 5, 11). Patients excluded from the analysis for not having preadmission medications were similar to included patients, except they were more likely to be male (76% vs 57%) and less likely to have health insurance (23% self‐pay vs 4%). (Data available upon request.)
| Characteristic | N = 790 |
|---|---|
| |
| Study hospital, N (%) | |
| Vanderbilt University Hospital | 373 (47.2) |
| Brigham and Women's Hospital | 417 (52.8) |
| Age in years, median (IQR) | 61 (52, 71) |
| Gender, N (%) | |
| Male | 452 (57.2) |
| Female | 338 (42.8) |
| Primary language, N (%) | |
| English | 779 (98.6) |
| Spanish | 11 (1.4) |
| Race, N (%) | |
| White | 610 (77.2) |
| Black or African American | 136 (17.2) |
| Other | 44 (5.6) |
| Health literacy, s‐TOFHLA score, median (IQR) | 33 (25, 35) |
| Health literacy, N (%)& | |
| Inadequate | 84 (10.6) |
| Marginal | 74 (9.4) |
| Adequate | 613 (77.6) |
| Mini‐Cog score, median (IQR) | 4 (3, 5) |
| Dementia, N (%) | |
| No | 692 (87.6) |
| Yes | 98 (12.4) |
| Number of medications, median (IQR) | 8 (5, 11) |
| Health insurance type, N (%) | |
| Medicaid | 74 (9.4) |
| Medicare | 337 (42.6) |
| Private | 334 (42.3) |
| Self‐pay | 35 (4.4) |
| Other | 10 (1.3) |
| Self‐reported household income, N (%)& | |
| <$10,000 | 38 (4.8) |
| $10,000 to <$15,000 | 45 (5.7) |
| $15,000 to <$20,000 | 42 (5.3) |
| $20,000 to <$25,000 | 105 (13.3) |
| $25,000 to <$35,000 | 99 (12.5) |
| $35,000 to <$50,000 | 112 (14.2) |
| $50,000 to <$75,000 | 118 (14.9) |
| $75,000+ | 227 (28.7) |
| Years of school, median (IQR)& | 14 (12, 16) |
MUQ Scores
The MUQ was administered in approximately 5 minutes. The median MUQ score was 2.5 (IQR 2.2, 2.8) (Table 2); 16.3% of patients scored less than 2. Subjects typically achieved high scores for the domains of indication, units, and frequency, while scores on the strength domain were lower (median = 0.2 [IQR 0.1, 0.4], maximum possible = 0.5).
| Median (IQR) | |
|---|---|
| |
| No. of drugs tested | 5 (4, 5) |
| MUQ score* | 2.5 (2.2, 2.8) |
| Indication | 1.0 (0.8, 1.0) |
| Strength | 0.2 (0.1, 0.4) |
| Units | 0.5 (0.4, 0.5) |
| Frequency | 1.0 (0.8, 1.0) |
Predictors of Medication Understanding
Unadjusted relationships of health literacy, cognition, and number of medications with medication understanding are shown in Figure 1 (panels A, B, and C, respectively). The figure demonstrates a linear relationship with both health literacy (Figure 1A) and cognition (Figure 1B), and a nonlinear relationship between number of preadmission medications and MUQ score (Figure 1C).
Adjusted relationships using imputed data for missing covariates are shown in Figure 2. Lower health literacy, cognitive impairment, male gender, and black race were independently associated with lower understanding of preadmission medications. Each 1 point increase in s‐TOFHLA or Mini‐Cog score led to an increase in medication understanding (OR = 1.04; 95% CI, 1.02 to 1.06; P = 0.0001; and OR = 1.24; 95% CI, 1.1 to 1.4; P = 0.001; respectively). Patients with marginal or inadequate health literacy had lower odds of understanding their regimen (OR = 0.53; 95% CI, 0.34 to 0.84; and OR = 0.49; 95% CI, 0.31 to 0.78, respectively) compared to those with adequate health literacy. Impaired cognitive function (Mini‐Cog score <3, indicating dementia) was also associated with lower odds of medication understanding (OR = 0.57; 95% CI, 0.38 to 0.86) compared to those with no cognitive impairment. An increase in the number of preadmission medications (up to 10) was also strongly associated with lower MUQ scores. For each increase by 1 medication, there was a significant decrease in medication understanding, up to 10 medications, beyond which understanding did not significantly decrease further. Patients on 6 medications were about half as likely to understand their medication regimen as patients on only 1 medication (OR = 0.52; 95% CI, 0.36 to 0.75). For patients on 11 medications, the odds of medication understanding were 24% lower than for patients on 6 medications (OR = 0.76; 95% CI, 0.65 to 0.89). Patients' age, years of schooling, and household income were not independently associated with medication understanding. Results were similar using data without multiple imputation.
Examples of Misunderstanding of Common Medications
Table 3 provides examples of incorrect patient responses for several commonly prescribed medications or drug classes, including aspirin, digoxin, nitroglycerin, and HMG‐CoA reductase inhibitors (statins). For aspirin, many patients were not aware of the strength. For digoxin, several participants reported splitting a higher‐strength pill to obtain the prescribed dose, which should not be done given the imprecision of splitting and narrow therapeutic index of this drug. Patients prescribed nitroglycerin sublingual tablets were commonly unable to report the correct dosing and frequency for angina treatment. Medications for cholesterol were often reported as being taken in the morning; this was scored strictly as a frequency error if the medication timing in the EHR was listed as evening or bedtime. We also identified many patients with poor understanding of opioid analgesics, particularly regarding their dosing and frequency.
| Medications | Common Incorrect Responses | Correct Information | Coded Error |
|---|---|---|---|
| |||
| Aspirin | tablet twice a day | 1 tablet once a day | Units and frequency |
| I am not aware what aspirin I am taking | 81 mg once a day | Strength | |
| I am taking 6‐something every day | 81 mg once a day | Strength | |
| 31 mg a day | 81 mg once a day | Strength | |
| 180 mg a day | 81 mg once a day | Strength | |
| 1 low‐dose daily | 325 mg once a day | Strength | |
| 125 mg a day | 325 mg once a day | Strength | |
| I am taking it for my blood pressure | Heart medication | Indication | |
| Nitroglycerin sublingual | As needed, I have taken up to 4 a day | Dissolve 1 tablet under the tongue, every 5 min as needed, up to 3 doses | Frequency |
| As needed every 15 min | Frequency | ||
| As needed up to 4 doses every 10 min | Frequency | ||
| Dissolve couple units under the tongue, as needed | Units and frequency | ||
| As many as I want, every 5 min | Frequency | ||
| Digoxin | tablet daily | 1 tablet daily | Units |
| 1 tablet daily | 1 tablet every other day | Frequency | |
| I am taking it for my blood pressure | Heart medication | Indication | |
| HMG‐CoA reductase inhibitors | 1 tablet every morning | 1 tablet every evening | Frequency |
| tablet twice a day | 1 tablet once a day | Units and frequency | |
| I do not know the indication | High cholesterol | Indication | |
| Propoxyphene/acetaminophen | tablet as needed | 1 tablet every 4‐6 hr as needed | Units and frequency |
| Hydrocodone/acetaminophen | I do not know the strength of this medication | 5 mg/500 mg | Strength |
| 1 tablet as I need it | 1 tablet every 4‐6 hr as needed | Frequency | |
DISCUSSION
We used a novel four‐component medication understanding questionnaire, developed for this study, to assess patients' understanding of up to 5 drugs selected randomly from the participant's preadmission medication list. The MUQ proved to be easy to administer by nonmedical staff within a short period of time (approximately 5 minutes per patient). It was well understood by patients. By limiting the assessment to 5 or fewer medications, the MUQ has a distinct advantage over existing measures of medication understanding that require testing the entire regimen. We did not find any limitations related to cutting off the assessment at 5 medications. In addition, this tool affords assessment of medication understanding without requiring medication bottles be present, enhancing its utility in the inpatient setting.
MUQ scores were associated with health literacy and other patient characteristics in an expected manner. We demonstrated that inadequate or marginal health literacy, as well as impaired cognitive function, were associated with low medication understanding. We also were able to demonstrate a relationship between increasing number of medications and lower medication understanding. Interestingly, in our patient population, understanding continued to decrease until reaching 10 medications, beyond which further increases in the number of medications had no additional detrimental effect on medication understanding. This nonlinear relationship between number of medications and medication understanding has potential implications for prescribing practice.
Our findings which utilize the MUQ among inpatients are consistent with prior literature in other settings.2, 7, 8 In a previous outpatient study, we identified that health literacy plays an important role in a patient's ability to successfully report and manage their daily medications.2 Other studies have also shown that patients with low health literacy have more difficulty understanding prescription drug information, and that they often experience medication‐related problems after hospital discharge.15, 16 The number and often the types of medications an individual takes have also been shown to increase the risk for adverse events and nonadherence to the treatment plan.1720 We postulate that this risk of adverse drug events is related at least in part to a patient's understanding of their medication regimen.
There are several limitations to this study. First, the MUQ did not assess certain aspects of medication understanding, such as knowledge of pill appearance or side effects, nor did it assess components of patients' actual drug‐taking behavior, such as organization of medications or behavioral cues. Thus, adaptive behaviors that patients may perform to improve their medication management, such as writing on labels or memory cues, are not captured by this test. Second, in administering and scoring the MUQ, we used the patient's preadmission medication list documented in the EHR as the reference standard. This was the best available reference list, and was generally accurate, as both hospitals had medication reconciliation systems in use at the time of the study21; nevertheless, it may contain inaccuracies. Documentation for certain medications, such as warfarin, in which dose can change frequently, often did not reflect the latest prescribed dose. In such cases, we scored the patient's answer as correct if the dose appeared reasonable and appropriate to the clinical pharmacist. As a result, a patient's MUQ score may have been overestimated in these cases.
Additional research will be needed to further validate the MUQ in other settings. In particular, studies should establish the relationship between the MUQ, serious medication errors after discharge, and potential to benefit from educational interventions. Also, as noted above, the nonlinear relationship between number of medications and medication understanding should be confirmed in other studies.
In conclusion, we demonstrated that patients with low health literacy, impaired cognition, or a higher number of medications had significantly poorer understanding of their preadmission medication regimen. These findings have important clinical implications. It would be appropriate to exercise greater caution when taking a medication history from patients who cannot readily provide the purpose, strength, units, and frequency of their medications. Attempts to validate the information obtained from patients with other sources of data, such as family members, inpatient or outpatient health records, and community pharmacy records should be considered. Patients at high risk for poor medication understanding, either measured directly using the MUQ or identified via risk factors such as polypharmacy, low cognition, or low health literacy, may warrant more intensive medication reconciliation interventions and/or educational counseling and follow‐up to prevent postdischarge adverse drug events. Further research is needed to determine if targeting these populations for interventions improves medication safety during transitions in care.
- ,,.Prevalence, expenditures, and complications of multiple chronic conditions in the elderly.Arch Intern Med.2002;162(20):2269–2276.
- ,,,,,.Predictors of medication self‐management skill in a low‐literacy population.J Gen Intern Med.2006;21(8):852–856.
- ,.Adherence to medication.N Engl J Med.2005;353(5):487–497.
- ,,.Medication adherence: its importance in cardiovascular outcomes.Circulation.2009;119(23):3028–3035.
- ,,, et al.Classifying and predicting errors of inpatient medication reconciliation.J Gen Intern Med.2008;23(9):1414–1422.
- ,.Addressing postdischarge adverse events: a neglected area.Jt Comm J Qual Patient Saf.2008;34(2):85–97.
- ,,.Medication management capacity in highly functioning community‐living older adults: detection of early deficits.J Am Geriatr Soc.1999;47(5):592–596.
- ,,.Variation in medication understanding among the elderly.Am J Health‐Syst Pharm.2004;61(4):373–380.
- ,,, et al.The rationale and design of the Pharmacist Intervention for Low Literacy in Cardiovascular Disease (PILL‐CVD) study.Circ Cardiovasc Qual Outcomes.2010;3:212–219.
- ,,,.Short Test of Functional Health Literacy in Adults.Snow Camp, NC:Peppercorn Books and Press;1998.
- ,,,,.Simplifying detection of cognitive impairment: comparison of the Mini‐Cog and Mini‐Mental State Examination in a multiethnic sample.J Am Geriatr Soc.2005;53(5):871–874.
- ,.Instruments assessing capacity to manage medications.Ann Pharmacother.2008;42(7):1026–1036.
- ,.Estimation of the probability of an event as a function of several independent variables.Biometrika.1967;54(1):167–179.
- ,.Using full probability models to compute probabilities of actual interest to decision makers.Int J Technol Assess Health Care.2001;17(1):17–26.
- ,,, et al.Literacy and misunderstanding prescription drug labels.Ann Intern Med.2006;145(12):887–894.
- ,,,.Medication use among inner‐city patients after hospital discharge: patient reported barriers and solutions.Mayo Clin Proc.2008;83(5):529–535.
- ,,,,,.National surveillance of emergency department visits for outpatient adverse drug events.JAMA.2006;296(15):1858–1866.
- ,,,.Medication use leading to emergency department visits for adverse drug events in older adults.Ann Intern Med.2007;147(11):755–765.
- ,,,,.Adverse drug events occurring following hospital discharge.J Gen Intern Med.2005;20:317–323.
- ,,, et al.Adverse drug events in ambulatory care.N Engl J Med.2003;348(16):1556–1564.
- ,,, et al.Effect of an electronic medication reconciliation application and process redesign on potential adverse drug events: a cluster‐randomized trial.Arch Intern Med.2009;169(8):771–780.
Copyright © 2011 Society of Hospital Medicine
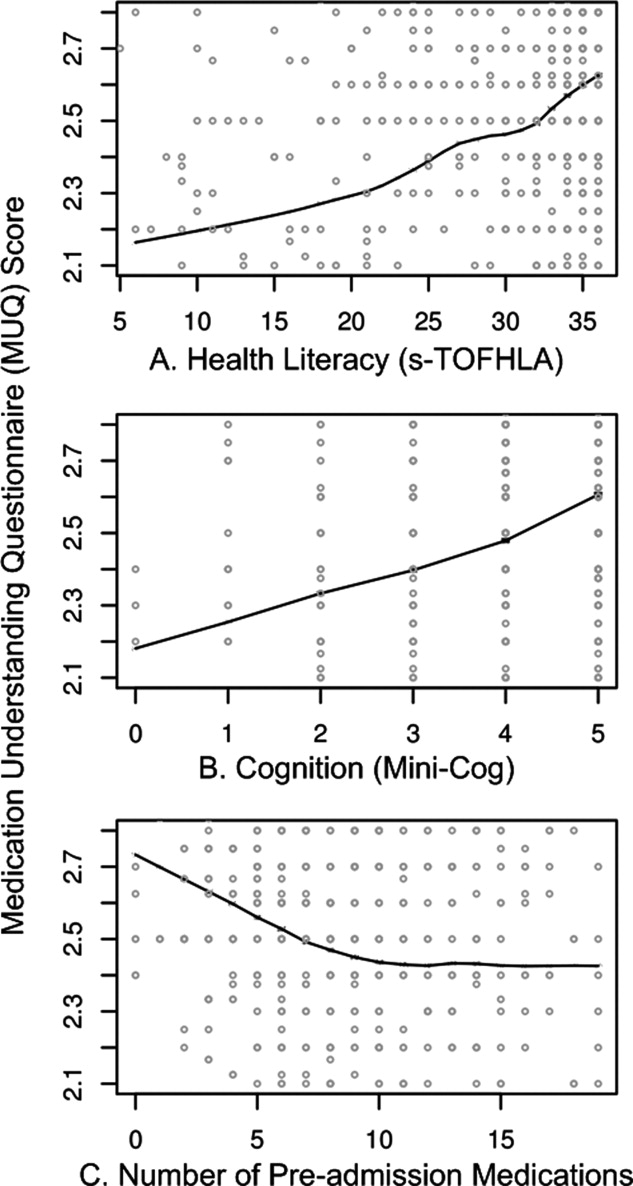
Continuing Medical Education Program in
If you wish to receive credit for this activity, which begins on the next page, please refer to the website: www.blackwellpublishing.com/cme.
Accreditation and Designation Statement
Blackwell Futura Media Services designates this educational activity for a 1 AMA PRA Category 1 Credit. Physicians should only claim credit commensurate with the extent of their participation in the activity.
Blackwell Futura Media Services is accredited by the Accreditation Council for Continuing Medical Education to provide continuing medical education for physicians.
Educational Objectives
Continuous participation in the Journal of Hospital Medicine CME program will enable learners to be better able to:
-
Interpret clinical guidelines and their applications for higher quality and more efficient care for all hospitalized patients.
-
Describe the standard of care for common illnesses and conditions treated in the hospital; such as pneumonia, COPD exacerbation, acute coronary syndrome, HF exacerbation, glycemic control, venous thromboembolic disease, stroke, etc.
-
Discuss evidence‐based recommendations involving transitions of care, including the hospital discharge process.
-
Gain insights into the roles of hospitalists as medical educators, researchers, medical ethicists, palliative care providers, and hospital‐based geriatricians.
-
Incorporate best practices for hospitalist administration, including quality improvement, patient safety, practice management, leadership, and demonstrating hospitalist value.
-
Identify evidence‐based best practices and trends for both adult and pediatric hospital medicine.
Instructions on Receiving Credit
For information on applicability and acceptance of continuing medical education credit for this activity, please consult your professional licensing board.
This activity is designed to be completed within the time designated on the title page; physicians should claim only those credits that reflect the time actually spent in the activity. To successfully earn credit, participants must complete the activity during the valid credit period that is noted on the title page.
Follow these steps to earn credit:
-
Log on to www.blackwellpublishing.com/cme.
-
Read the target audience, learning objectives, and author disclosures.
-
Read the article in print or online format.
-
Reflect on the article.
-
Access the CME Exam, and choose the best answer to each question.
-
Complete the required evaluation component of the activity.
Quality of Hospital Communication
It is well established that patients have difficulty understanding written health materials,1 medical terminology,2, 3 and other aspects of provider‐patient communication.4, 5 Such difficulties in communication can be magnified at transitions of care like hospital discharge.6 Patients often receive a large amount of information in a short period of time at discharge, and this information may be delivered in a way that is not straightforward or standardized.7, 8 When asked, patients commonly report a poor understanding of important self‐care instructions such as how to take medications upon returning home.9, 10 One study even showed that more than half of patients did not recall anyone providing instructions about how they should care for themselves after hospitalization.11 Poor medication management after hospital discharge contributes to adverse events,1215 inadequate disease control,16 and in the setting of cardiovascular disease, higher mortality.17, 18 Most adverse events after hospital discharge could be prevented or ameliorated through relatively simple means, including better communication among patients and providers.6, 1416, 1921 Greater attention to communication and care transitions could also reduce the number of unplanned rehospitalizations in the United States.22
Patients' health literacy is an important factor in effective health communication, yet little research has examined the role of health literacy in care transitions. Health literacy is defined as the extent to which an individual is able to obtain, process and understand basic health information and services needed to make appropriate health decisions.23, 24 Low health literacy is a prevalent problem in the United States, affecting approximately 40% of adults.25 Research has shown that low health literacy is associated with low self‐efficacy26 and less interaction in physician‐patient encounters,27 which in combination with physicians' use of complex medical language,28 may contribute to poor physician‐patient communication. Patients with low health literacy also have greater difficulty understanding prescription drug labels,29 limited knowledge of disease self‐management skills,30 a higher incidence of hospitalization,31 and higher mortality rates.3234
In order to elucidate the relationship between patient‐provider communication and health literacy in the hospital setting, we analyzed patients' ratings of their communication experience during their hospitalization. We report patients' perceptions of the clarity of communication and how this may vary by level of health literacy and other important patient characteristics.
Methods
Setting and Participants
Patients admitted to the general medical wards at Grady Memorial Hospital were recruited for participation. Grady Memorial Hospital is a public, urban teaching hospital located in Atlanta, GA. It serves a primarily low income, African American population, many of whom lack health insurance. Approximately 30% to 50% of patients at this hospital have inadequate health literacy skills.35
The present study was conducted as preliminary research for a randomized controlled trial to improve post‐discharge medication adherence among patients with acute coronary syndromes (ACS). The criteria for the present study mirrored those of the planned trial. Patients were eligible for the current study if they were admitted with suspected ACS and evidence of myocardial ischemia.36 Exclusion criteria included lack of cooperation/refusal to participate, unintelligible speech (eg, dysarthria), lack of English fluency (determined subjectively by interviewer), delirium (determined by lack of orientation to person, place, and time), severe hearing impairment (determined subjectively by interviewer), visual acuity worse than 20/60 (per pocket vision screening card), acute psychotic illness (per admission history), police custody, age younger than 18 years, no regular telephone number, administration of all medications by a caregiver, and not taking prescription medications in the 6 months before admission.
Data Collection and Measures
Enrollment occurred between August 2005 and April 2006, after approval was obtained from both the Emory University Institutional Review Board (IRB) and Grady Research Oversight Committee. Interested and willing participants provided written informed consent and subsequently completed an interviewer‐assisted questionnaire prior to hospital discharge to collect information regarding demographics and cardiovascular risk factors. To ensure that answers were not confounded by participants' inability to read the questionnaire text, all questions were read to participants by study interviewers, with the exception of the health literacy assessmentthe Rapid Estimate of Adult Literacy in Medicine (REALM).37 The REALM classifies a patient's literacy according to the number of medical terms from a list that the patient pronounces correctly. It correlates highly with other assessments of literacy and health literacy.38 Cognitive function was measured using the Mini‐Mental State Examination (MMSE).39
Research staff contacted patients by telephone approximately 2 weeks after hospital discharge to complete a survey which included the Interpersonal Processes of Care in Diverse Populations Questionnaire (IPC).40 The IPC is a validated, self‐report questionnaire with high internal consistency reliability. It was developed and normalized among ethnically diverse populations of low socioeconomic status. Items on the IPC originally referred to communication during the last 6 months in the outpatient clinic; they were reworded to refer to the recent hospitalization only. The research assistant administered 8 of 12 domains of the IPC that were most pertinent to rating the quality and clarity of patient communication with hospital physicians.41 Four other IPC domains that pertained to interpersonal style (eg, friendliness, emotional support) were not administered to minimize response burden. Each domain was comprised of 2 to 7 items, and responses were given on a 5‐point Likert scale. The 8 domains and sample items were as follows: (1) General clarity (eg, Did the doctors use medical words that you did not understand?); (2) Elicitation of and responsiveness to patient problems, concerns, and expectations (eg, Did the doctors listen carefully to what you had to say?); (3) Explanations of condition, progress, and prognosis (eg, Did the doctors make sure you understand your health problem?); (4) Explanations of processes of care (eg, Did the doctors explain why a test was being done?); (5) Explanations of self‐care (eg, Did the doctors tell you what you could do to take care of yourself at home?); (6) Empowerment (eg, Did the doctors make you feel that following your treatment plan would make a difference in your health?); (7) Decision‐making: responsiveness to patient preferences regarding decisions (eg, Did the doctors try to involve you or include you in decisions about your treatment?); and (8) Consideration of patient's desire and ability to comply with recommendations (eg, Did the doctors understand the kinds of problems you might have in doing the recommended treatment?).
Statistical Analysis
Patient characteristics were summarized using frequency, mean, and standard deviation measures. Nondichotomous measures were recategorized into dichotomous variables as follows: age (less than 55 years vs. 55 years or older), race (black vs. white or other), marital status (married or living with someone vs. living alone), education (less than high school vs. high school graduate), employment status (employed full/part time vs. unemployed/retired), MMSE score (cognitively impaired [MMSE score 24] vs. no significant cognitive impairment [MMSE score >24]),39 and health literacy score (inadequate [REALM score 0 to 44] vs. marginal or adequate [REALM score 45‐66]).38 Dichotomous variables were summarized using frequencies.
Scores for each individual IPC question ranged from 1 to 5 with lower scores indicating better communication, except for questions in the domain of general clarity where higher scores indicated better communication. Then, for each of the 8 domains, scores of the individual IPC questions within that domain were averaged.
Bivariate analyses were conducted for each of the 8 IPC domains, by level of health literacy and other relevant patient characteristics, using the independent samples t‐test. Multivariable linear regression models were then constructed to examine the independent association of health literacy with each of the 8 IPC domains, while controlling for other patient characteristics that were also found to be associated with IPC domain scores. Bivariate analyses were also conducted for each of the 27 individual IPC items, to gain an understanding of which items might be driving the overall effect. A 2‐sided P < 0.05 was considered statistically significant. All analyses were performed using SPSS 15 for Windows (SPSS, Chicago, IL).
Results
Patient Characteristics
A total of 109 eligible patients were approached, 100 agreed to participate and were enrolled in the hospital, and 84 of them completed the follow‐up interview by telephone to comprise the sample for this study (Table 1). Most of the 84 participants were under the age of 55 (54%), male (58%), African American (88%), unemployed (79%), lived alone (73%), and had completed high school (62%). Age ranged from 24 to 80 years, REALM score ranged from 0 to 66, and MMSE ranged from 12 to 30. A large proportion (44%) had inadequate health literacy skills, and 50% had cognitive impairment. Patients with inadequate health literacy were more likely to have not finished high school and to suffer cognitive impairment, P < 0.01 for each comparison.
| Characteristic | n (%) |
|---|---|
| Age | |
| <55 years | 45 (54) |
| 55 years | 39 (46) |
| Gender | |
| Male | 49 (58) |
| Female | 35 (42) |
| Race | |
| Black | 74 (88) |
| White or other | 10 (12) |
| Marital status | |
| Married or living with someone | 23 (27) |
| Living alone | 61 (73) |
| Education | |
| Did not complete high school | 32 (38) |
| High school graduate | 52 (62) |
| Employment status | |
| Employed (full/part time) | 18 (21) |
| Not employed | 66 (79) |
| Mini‐Mental State Exam | |
| Cognition impaired | 42 (50) |
| Cognition not impaired | 42 (50) |
| Health literacy | |
| Inadequate | 37 (44) |
| Marginal or adequate | 47 (56) |
Hospital Communication Ratings by IPC Domains
Overall, patients' ratings of hospital communication were positive, with most IPC domain score means lying in the favorable half of the Likert scale (Table 2). The domains with the best communication ratings were responsiveness to patient concerns (mean = 1.68), explanations of condition and prognosis (mean = 1.75), and empowerment (mean 1.76). The domain of worst performance was consideration of patients' desire and ability to comply with recommendations (mean = 3.15).
| IPC Domain | Total (n = 84), Mean (SD) | Patients with Inadequate Literacy (n = 37), Mean (SD) | Patients with Marginal or Adequate Literacy (n = 47), Mean (SD) | P Value | |
|---|---|---|---|---|---|
| |||||
| 1 | General clarity* | 3.66 (1.00) | 3.36 (1.14) | 3.89 (0.74) | 0.02 |
| 2 | Responsiveness to patient concerns | 1.68 (0.68) | 1.86 (0.76) | 1.53 (0.58) | 0.03 |
| 3 | Explanations of condition and prognosis | 1.75 (0.87) | 1.93 (0.99) | 1.61 (0.74) | 0.09 |
| 4 | Explanations of processes of care | 2.01 (0.86) | 2.22 (0.96) | 1.84 (0.74) | 0.04 |
| 5 | Explanations of self‐care | 2.37 (1.04) | 2.42 (1.20) | 2.33 (0.90) | 0.71 |
| 6 | Empowerment | 1.76 (1.03) | 1.85 (1.27) | 1.69 (0.81) | 0.51 |
| 7 | Decision‐making | 2.34 (0.78) | 2.34 (0.80) | 2.34 (0.77) | 1.00 |
| 8 | Consideration of patients' desire and ability to comply with recommendations | 3.15 (1.19) | 3.24 (1.16) | 3.07 (1.23) | 0.54 |
In bivariate analyses that compared IPC domains by patients' level of health literacy, several differences emerged. Patients with inadequate health literacy skills gave significantly worse ratings to the quality of communication on the domains of general clarity (mean = 3.36 vs. 3.89 for patients with marginal or adequate health literacy, P = 0.02), Responsiveness to patient concerns (mean = 1.86 vs. 1.53, P = 0.03), and Explanations of processes of care (mean = 2.22 vs. 1.84, P = 0.04). On a fourth domain, Explanations of condition and prognosis, a nonsignificant trend was present (mean = 1.93 vs. 1.61, P = 0.09).
Fewer significant relationships were found between other patient characteristics and IPC domain scores. Patients who were age 55 or older provided worse ratings on explanations of self‐care (mean = 2.74 vs. 2.05 for patients under the age of 55, P = 0.003). Lower ratings on the domain of general clarity, which indicated unclear communication, were found among patients who had not graduated from high school (mean = 3.31 vs. 3.88 for high school graduates, P = 0.02) or who had cognitive impairment (mean = 3.39 vs. 3.93 for patients without impaired cognition, P = 0.01). No significant differences were present by gender or race.
Based on these bivariate relationships, terms for inadequate health literacy, age 55, Cognitive impairment, and high school graduation were entered into multivariable models that predicted scores on each of the 8 IPC domains. Inadequate health literacy was independently associated with Responsiveness to patient concerns ( = 0.512, P = 0.007) and Explanations of processes of care ( = 0.548, P = 0.023); a nonsignificant trend was present for consideration of patients' desire and ability to comply with recommendations ( = 0.582, P = 0.09). The association of age with explanations of self‐care remained after adjustment for the other variables ( = 0.705, P = 0.002). None of the patient characteristics was independently associated with ratings of general clarity.
IPC Item Responses
Examination of responses on the individual IPC items revealed the specific areas of difficulty in communication as rated by patients (Table 3). In the domain of general clarity, patients with inadequate literacy provided poorer ratings on the item pertaining to use of medical terminology (mean = 2.92 vs. 3.68 for patients with marginal or adequate literacy, P = 0.004). Regarding Responsiveness to patient concerns, differences by literacy were present in the item that pertained to patients being given enough time to say what they thought was important (mean = 2.27 vs. 1.51, P = 0.003). On the domain of explanations of processes of care, the item rated differently by patients with inadequate literacy referred to feeling confused about their care because doctors did not explain things well (mean = 2.51 vs. 1.83, P = 0.02).
Discussion
We used a validated instrument, the IPC,40 to examine patients' ratings of the quality and clarity of hospital‐based communication. Overall, patients provided favorable ratings in many domains, including those pertaining to Responsiveness to patient concerns and Explanations of condition and prognosis. Clinicians' consideration of patients' desire and ability to comply with recommendations was rated least favorably overall. This represents an important area for improvement, particularly when considering the prevalence of nonadherence to medical therapy after hospital discharge, which may be as high as 50%.9, 42 Nonadherence after hospital discharge contributes to avoidable emergency department visits,43 hospital readmissions,44 and higher mortality.18, 45 The results of this study suggest that hospital physicians should give greater consideration to patients' preferences and problems that they may have in following the treatment recommendations.16 Future research will determine the extent to which this may enhance post‐discharge adherence.
Another important finding is that patients with inadequate health literacy rated hospital‐based communication less favorably than did patients with marginal or adequate literacy. In bivariate analyses, this effect was seen on several domains, including general clarity, Responsiveness to patient concerns, and explanations of processes of care. The latter 2 relationships persisted after adjustment for age, cognitive impairment, and educational attainment. To our knowledge, this is the first study which examines the effect of health literacy on patients' ratings of hospital‐based communication.
The majority of the literature on health communication and health literacy focuses on the outpatient setting.34, 46 However, the quality and clarity of patient‐provider communication in the hospital is also critically important. Ineffective communication in the hospital contributes to poor care transitions and post‐discharge complications. Patients commonly leave the hospital with a poor understanding of what transpired (eg, diagnoses, treatment provided, major test results) and inadequate knowledge about the self‐care activities that they must perform upon returning home (eg, medication management, physical activity, follow‐up appointments).911 Poor communication is often cited as the main underlying and remediable factor behind medical errors, adverse events, and the readmissions that commonly occur after hospital discharge.6, 16, 20 The results of this study provide complementary evidence, showing that patients often feel they have experienced suboptimal communication in the hospital setting. These findings highlight an opportunity for improvement in care transitions and patient safety, particularly among patients with inadequate health literacy.
In outpatient research that utilized the IPC, Schillinger et al.41 found that patients with inadequate functional health literacy reported significantly worse communication on the domains of general clarity, explanations of processes of care, and Explanations of condition and prognosis. Subsequent analyses by Sudore et al.47 demonstrated that patients with inadequate or marginal health literacy more often reported that physicians did not give them enough time to say what they thought was important, did not explain processes of care well, and did not ask about problems in following the recommended treatment (Table 3, IPC items 3, 12, and 26, respectively). Our findings were very similar. These relatively consistent results across studies and populations strengthen the conclusion that patients with inadequate health literacy feel their physicians do not communicate as effectively in these areas.
| IPC Items | Overall (n = 84), Mean (SD) | Inadequate Literacy (n = 37), Mean (SD) | Marginal or Adequate Literacy (n = 47), Mean (SD) | P Value |
|---|---|---|---|---|
| ||||
| General clarity* | ||||
| 1. Did the doctors use medical words you did not understand? | 3.35 (1.14) | 2.92 (1.40) | 3.68 (0.73) | 0.004 |
| 2. Did you have trouble understanding your doctors because they spoke too fast? | 3.98 (1.06) | 3.81 (1.13) | 4.11 (1.01) | 0.21 |
| Responsiveness to patient concerns | ||||
| 3. Did the doctors give you enough time to say what you thought was important? | 1.85 (1.14) | 2.27 (1.28) | 1.51 (0.88) | 0.003 |
| 4. Did the doctors listen carefully to what you had to say? | 1.62 (0.88) | 1.76 (1.04) | 1.51 (0.72) | 0.22 |
| 5. Did the doctors ignore what you told them? | 1.70 (0.92) | 1.81 (1.09) | 1.62 (0.77) | 0.38 |
| 6. Did the doctors take your concerns seriously? | 1.55 (0.92) | 1.65 (0.98) | 1.47 (0.88) | 0.38 |
| Explanations of condition and prognosis | ||||
| 7. Did the doctors give you enough information about your health problems? | 1.88 (1.11) | 2.11 (1.27) | 1.70 (0.95) | 0.11 |
| 8. Did the doctors make sure you understand your health problems? | 1.62 (0.88) | 1.76 (0.98) | 1.51 (0.78) | 0.22 |
| Explanations of processes of care | ||||
| 9. Did the doctors explain why a test was being done? | 1.70 (1.10) | 1.89 (1.24) | 1.55 (0.95) | 0.16 |
| 10. Did the doctors explain how the test was done? | 2.20 (1.35) | 2.27 (1.39) | 2.15 (1.34) | 0.69 |
| 11. Did the doctors tell you what they were doing as they examined you? | 1.99 (1.20) | 2.22 (1.34) | 1.81 (1.06) | 0.13 |
| 12. Did you feel confused about what was going on with your medical care because doctors did not explain things well? | 2.13 (1.23) | 2.51 (1.47) | 1.83 (0.92) | 0.02 |
| Explanations of self‐care | ||||
| 13. Did the doctors tell you what you could do to take care of yourself at home? | 1.67 (1.09) | 1.81 (1.29) | 1.55 (0.90) | 0.31 |
| 14. Did the doctors tell you how to pay attention to your symptoms and when to call the doctor? | 2.01 (1.38) | 2.19 (1.60) | 1.87 (1.17) | 0.32 |
| 15. Did the doctors clearly explain how to take the medicine (that is when, how much and for how long)? | 1.88 (1.36) | 2.00 (1.53) | 1.79 (1.22) | 0.48 |
| 16. Did the doctors go over all the medicines you are taking? | 2.39 (1.55) | 2.51 (1.74) | 2.30 (1.40) | 0.54 |
| 17. Did the doctors give you written instruction about how to take the medicine (other than what was on the container)? | 3.29 (1.70) | 3.05 (1.75) | 3.48 (1.66) | 0.26 |
| 18. Did the doctors tell you the reason for taking each medicine? | 2.05 (1.43) | 2.24 (1.64) | 1.89 (1.24) | 0.29 |
| 19. Did the doctors tell you about side effects you might get from your medicine? | 3.32 (1.64) | 3.11 (1.73) | 3.49 (1.56) | 0.29 |
| Empowerment | ||||
| 20. Did doctors make you feel that following your treatment plan would make a difference in your health? | 1.75 (1.07) | 1.89 (1.27) | 1.64 (0.90) | 0.31 |
| 21. Did the doctors make you feel that your everyday activities such as your diet and lifestyle would make a difference in your health? | 1.77 (1.21) | 1.81 (1.41) | 1.74 (1.03) | 0.81 |
| Decision‐making | ||||
| 22. Did the doctors try to involve you or include you in decisions about your treatment? | 2.43 (1.55) | 2.30 (1.49) | 2.53 (1.60) | 0.49 |
| 23. Did the doctors ask how you felt about different treatments? | 3.08 (1.58) | 2.89 (1.66) | 3.23 (1.51) | 0.33 |
| 24. Did the doctors make decision without taking your preferences and opinions into account? | 2.23 (1.35) | 2.34 (1.55) | 2.15 (1.20) | 0.54 |
| 25. Did you feel pressured by doctors in the hospital to have a treatment you were not sure you wanted? | 1.60 (0.97) | 1.81 (1.18) | 1.43 (0.74) | 0.09 |
| Consideration of patients' desire and ability to comply with recommendations | ||||
| 26. Did the doctors ask if you might have any problems actually doing the recommended treatment (for example taking the medication correctly)? | 3.82 (1.47) | 4.08 (1.40) | 3.62 (1.51) | 0.15 |
| 27. Did the doctors understand the kinds of problems you might have in doing the recommended treatment? | 2.43 (1.44) | 2.26 (1.52) | 2.57 (1.38) | 0.34 |
Importantly, the differences in patient responses by literacy category were driven by a few IPC items. These items pertained to physicians' use of medical terminology, the amount of time they gave patients to express their concerns, and how well they explained the patients' medical care. Training physicians to improve their communication skills in these specific areas may improve their ability to communicate effectively with patients who have limited literacy skills. Indeed, published recommendations on how to improve the clarity of verbal communication emphasize just a few major areas, including limiting the amount of medical terminology used, effectively encouraging patients to ask questions and express their concerns, and asking patients to teach‐back key points to make sure the physician has provided adequate explanation.4851 The present study provides some evidence for those recommendations, which for the most part, have been based on clinical experience and expert opinion.
There remains a need for professional education about health literacy and techniques to improve communication with patients who may have limited literacy skills. Many experts advocate clear verbal communication with all patients, so‐called Universal Precautions.52 Although 10 years have passed since the American Medical Association (AMA) called for more work in this area,53 few curricula have been described in the literature.48, 5456 The extent to which health literacy curricula have been implemented in medical schools and other professional schools is unknown. The impact of such training on the communication skills of health care providers and patient outcomes is also unclear.
The strengths of this study include a relatively good response rate and use of a validated measure to grade the quality of physician‐patient communication. This measure, the IPC, has been used previously in the context of health literacy.41 Nevertheless, certain limitations should be acknowledged. First, the study was performed at a single teaching hospital, where patients had a high prevalence of inadequate health literacy. The findings may not generalize to other institutions that serve a different patient population or to nonacademic programs. Second, communication was assessed by patient report, rather than by recording patient‐provider discussions for rating by independent observers. While patient report is inherently more subjective, patients' own perceptions about the effectiveness of health communication are arguably more important than those of independent raters, and thus, the data source may not represent a true limitation. Third, patient responses were obtained approximately 2 weeks after hospital discharge, and accordingly, they are subject to recall bias, which may be greater among those with cognitive impairment. Finally, patients were directed to rate the communication of the overall group of physicians who took care of them in the hospital. Given the academic setting, patients typically received care from a team that included medical students, interns, a resident, and an attending physician. We were not able to determine whether patients' ratings were influenced by a specific member of the team, nor how ratings may have been influenced by certain characteristics of that team member (eg, year of training, prior communication skills training, race or gender concordance, etc).
In summary, by surveying patients soon after an acute care hospitalization, we determined that certain areas held room for improvement, such as consideration of patients' desire and ability to comply with treatment recommendations. Patients with inadequate health literacy reported lower quality physician‐patient communication on several domains. They expressed particular concern about physicians' use of medical terminology, not getting enough time to express their concerns, and not receiving clear enough explanations about the medical care. Efforts are needed to improve physicians' communication skills in these areas. Such training should be evaluated to determine if it has a beneficial effect on physician communication skills and patient outcomes.
- ,,,,.The gap between patient reading comprehension and the readability of patient education materials.J Fam Pract.1990;31:533–538.
- .Differences between patients' and doctors' interpretation of some common medical terms.BMJ.1970;1:286–289.
- ,,.Patient understanding of commonly used medical vocabulary.J Fam Pract.1987;25:176–178.
- ,,,,,.Improving education for patients with low literacy skills.Am Fam Physician.1996;53:205–211.
- ,,,.Doctor‐patient communication: a review of the literature.Soc Sci Med.1995;40:903–918.
- ,,,.Promoting effective transitions of care at hospital discharge: a review of key issues for hospitalists.J Hosp Med.2007;2(5):314–323.
- ,.Lost in transition: challenges and opportunities for improving the quality of transitional care.Ann Intern Med.2004;141(7):533–536.
- ,,.The hospital discharge: a review of a high risk care transition with highlights of a reengineered discharge process.J Patient Saf.2007;3(2):97–106.
- ,,,.Medication use among inner‐city patients after hospital discharge: patient reported barriers and solutions.Mayo Clin Proc.2008;83(5):529–535.
- ,.Patients' understanding of their treatment plans and diagnosis at discharge.Mayo Clin Proc.2005;80(8):991–994.
- ,,.Hospital discharge information and older patients: do they get what they need?J Hosp Med.2007;2(5):291–296.
- ,.Uncovering a multitude of sins: medication management in the home post acute hospitalisation among the chronically ill.Aust NZ J Med.1999;29(2):220–227.
- ,,,.Medical errors related to discontinuity of care from an inpatient to an outpatient setting.J Gen Intern Med.2003;18:646–651.
- ,,,.Posthospital medication discrepancies: prevalence and contributing factors.Arch Intern Med.2005;165(16):1842–1847.
- ,,,,.The incidence and severity of adverse events affecting patients after discharge from the hospital.Ann Intern Med.2003;138:161–167.
- ,.Medication use in the transition from hospital to home.Ann Acad Med Singapore.2008;37(2):136–141.
- ,,, et al.Adherence to medications by patients after acute coronary syndromes.Ann Pharmacother.2005;39(11):1792–1797.
- ,,, et al.Impact of medication therapy discontinuation on mortality after myocardial infarction.Arch Intern Med.2006;166(17):1842–1847.
- ,,,,,.Deficits in communication and information transfer between hospital‐based and primary care physicians: implications for patient safety and continuity of care.JAMA.2007;297(8):831–841.
- ,,,,.Impact of patient communication problems on the risk of preventable adverse events in acute care settings.CMAJ.2008;178(12):1555–1562.
- ,,.Communication gaps and readmissions to hospital for patients aged 75 years and older: observational study.Qual Saf Health Care.2008;17(1):71–75.
- ,,.Rehospitalizations among patients in the Medicare fee‐for‐service program.N Engl J Med.2009;360(14):1418–1428.
- Institute of Medicine.Health Literacy. A Prescription to End Confusion.Washington, DC:National Academies Press;2004.
- ,,,.Current Bibliographies in Medicine: Health Literacy.Bethesda, MD:National Library of Medicine;2000.
- ,,. National Assessment of Adult Literacy (NAAL). A first look at the literacy of America's adults in the 21st century. Available at: http://nces.ed.gov/naal. Accessed January2010.
- ,,, et al.The health care experience of patients with low literacy.Arch Fam Med.1996;5:329–334.
- ,,,.Patient literacy and question‐asking behavior in the medical encounter: a mixed‐methods analysis.J Gen Intern Med.2007;22(6):782–786.
- ,,,.Babel babble: physicians' use of unclarified medical jargon with patients.Am J Health Behav.2007;31(Suppl 1):S85–S95.
- ,,, et al.Literacy and misunderstanding prescription drug labels.Ann Intern Med.2006;145(12):887–894.
- ,,,.Relationship of functional health literacy to patients' knowledge of their chronic disease: a study of patients with hypertension and diabetes.Arch Intern Med.1998;158(2):166–172.
- ,,,.Health literacy and the risk of hospital admission.J Gen Intern Med.1998;13:791–798.
- ,,, et al.Limited literacy and mortality in the elderly: The Health, Aging, and Body Composition Study.J Gen Intern Med.2006;21(8):806–812.
- ,,,,,.Health literacy and mortality among elderly persons.Arch Intern Med.2007;167(14):1503–1509.
- ,,,,.Literacy and health outcomes: a systematic review of the literature.J Gen Intern Med.2004;19(12):1129–1139.
- ,,, et al.Inadequate functional health literacy among patients at two public hospitals.JAMA.1995;274(21):1677–1682.
- ,,, et al.ACC/AHA 2002 guideline update for the management of patients with unstable angina and non‐ST‐segment elevation myocardial infarction–summary article: a report of the American College of Cardiology/American Heart Association task force on practice guidelines (Committee on the Management of Patients With Unstable Angina).J Am Coll Cardiol.2002;40(7):1366–1374.
- ,,, et al.Rapid assessment of literacy levels of adult primary care patients.Fam Med.1991;23(6):433–435.
- ,,,.Literacy testing in health care research. In: Schwartzberg JG, VanGeest JB, Wang CC, eds.Understanding Health Literacy.Chicago:American Medical Association;2005:157–179.
- ,,.“Mini‐Mental State”. A practical method for grading the cognitive state of patients for the clinician.J Psychiatr Res.1975;12:189–198.
- ,,, et al.Interpersonal processes of care in diverse populations.Milbank Q.1999;77:305–339.
- ,,,,.Functional health literacy and the quality of physician‐patient communication among diabetes patients.Patient Educ Couns.2004;52(3):315–323.
- ,,,.Frequency and predictors of prescription‐related issues after hospital discharge.J Hosp Med.2008;3(1):12–19.
- ,,,,.Association of medication adherence, knowledge, and skills with emergency department visits by adults 50 years or older with congestive heart failure.Am J Health Syst Pharm.2004;61(19):2043–2049.
- ,,,,,.Factors associated with exacerbation of heart failure include treatment adherence and health literacy skills.Clin Pharmacol Ther.2009;85(6):651–658.
- ,,, et al.Prevalence, predictors, and outcomes of premature discontinuation of thienopyridine therapy after drug‐eluting stent placement: results from the PREMIER registry.Circulation.2006;113(24):2803–2809.
- ,,.Patient‐physician communication: a descriptive summary of the literature.Patient Educ Couns.1988;12:99–119.
- ,,,,,.Unraveling the relationship between literacy, language proficiency, and patient‐physician communication.Patient Educ Couns.2009;75(3):398–402.
- ,.Teaching about health literacy and clear communication.J Gen Intern Med.2006;21:888–890.
- .Health Literacy: A Manual for Clinicians.Chicago, IL:American Medical Association;2003.
- ,.Communicating with patients who cannot read.N Engl J Med.1997;337:272–274.
- ,,,.The role of health literacy in patient‐physician communication.Fam Med.2002;34(5):383–389.
- ,,,,,.Health literacy: universal precautions needed.J Allied Health.2004;33(2):150–155.
- American Medical Association Council on Scientific Affairs.Health literacy.JAMA.1999;281:552–557.
- ,,.Teaching medical students about health literacy: 2 Chicago initiatives.Am J Health Behav.2007;31Suppl 1:S111–S114.
- ,,,,,.Development and implementation of a health literacy training program for medical residents.Med Educ Online.2006;11(13):1–8.
- ,.The use of standardized patients to teach low‐literacy communication skills.Am J Health Behav.2007;31Suppl 1:S105–S110.
It is well established that patients have difficulty understanding written health materials,1 medical terminology,2, 3 and other aspects of provider‐patient communication.4, 5 Such difficulties in communication can be magnified at transitions of care like hospital discharge.6 Patients often receive a large amount of information in a short period of time at discharge, and this information may be delivered in a way that is not straightforward or standardized.7, 8 When asked, patients commonly report a poor understanding of important self‐care instructions such as how to take medications upon returning home.9, 10 One study even showed that more than half of patients did not recall anyone providing instructions about how they should care for themselves after hospitalization.11 Poor medication management after hospital discharge contributes to adverse events,1215 inadequate disease control,16 and in the setting of cardiovascular disease, higher mortality.17, 18 Most adverse events after hospital discharge could be prevented or ameliorated through relatively simple means, including better communication among patients and providers.6, 1416, 1921 Greater attention to communication and care transitions could also reduce the number of unplanned rehospitalizations in the United States.22
Patients' health literacy is an important factor in effective health communication, yet little research has examined the role of health literacy in care transitions. Health literacy is defined as the extent to which an individual is able to obtain, process and understand basic health information and services needed to make appropriate health decisions.23, 24 Low health literacy is a prevalent problem in the United States, affecting approximately 40% of adults.25 Research has shown that low health literacy is associated with low self‐efficacy26 and less interaction in physician‐patient encounters,27 which in combination with physicians' use of complex medical language,28 may contribute to poor physician‐patient communication. Patients with low health literacy also have greater difficulty understanding prescription drug labels,29 limited knowledge of disease self‐management skills,30 a higher incidence of hospitalization,31 and higher mortality rates.3234
In order to elucidate the relationship between patient‐provider communication and health literacy in the hospital setting, we analyzed patients' ratings of their communication experience during their hospitalization. We report patients' perceptions of the clarity of communication and how this may vary by level of health literacy and other important patient characteristics.
Methods
Setting and Participants
Patients admitted to the general medical wards at Grady Memorial Hospital were recruited for participation. Grady Memorial Hospital is a public, urban teaching hospital located in Atlanta, GA. It serves a primarily low income, African American population, many of whom lack health insurance. Approximately 30% to 50% of patients at this hospital have inadequate health literacy skills.35
The present study was conducted as preliminary research for a randomized controlled trial to improve post‐discharge medication adherence among patients with acute coronary syndromes (ACS). The criteria for the present study mirrored those of the planned trial. Patients were eligible for the current study if they were admitted with suspected ACS and evidence of myocardial ischemia.36 Exclusion criteria included lack of cooperation/refusal to participate, unintelligible speech (eg, dysarthria), lack of English fluency (determined subjectively by interviewer), delirium (determined by lack of orientation to person, place, and time), severe hearing impairment (determined subjectively by interviewer), visual acuity worse than 20/60 (per pocket vision screening card), acute psychotic illness (per admission history), police custody, age younger than 18 years, no regular telephone number, administration of all medications by a caregiver, and not taking prescription medications in the 6 months before admission.
Data Collection and Measures
Enrollment occurred between August 2005 and April 2006, after approval was obtained from both the Emory University Institutional Review Board (IRB) and Grady Research Oversight Committee. Interested and willing participants provided written informed consent and subsequently completed an interviewer‐assisted questionnaire prior to hospital discharge to collect information regarding demographics and cardiovascular risk factors. To ensure that answers were not confounded by participants' inability to read the questionnaire text, all questions were read to participants by study interviewers, with the exception of the health literacy assessmentthe Rapid Estimate of Adult Literacy in Medicine (REALM).37 The REALM classifies a patient's literacy according to the number of medical terms from a list that the patient pronounces correctly. It correlates highly with other assessments of literacy and health literacy.38 Cognitive function was measured using the Mini‐Mental State Examination (MMSE).39
Research staff contacted patients by telephone approximately 2 weeks after hospital discharge to complete a survey which included the Interpersonal Processes of Care in Diverse Populations Questionnaire (IPC).40 The IPC is a validated, self‐report questionnaire with high internal consistency reliability. It was developed and normalized among ethnically diverse populations of low socioeconomic status. Items on the IPC originally referred to communication during the last 6 months in the outpatient clinic; they were reworded to refer to the recent hospitalization only. The research assistant administered 8 of 12 domains of the IPC that were most pertinent to rating the quality and clarity of patient communication with hospital physicians.41 Four other IPC domains that pertained to interpersonal style (eg, friendliness, emotional support) were not administered to minimize response burden. Each domain was comprised of 2 to 7 items, and responses were given on a 5‐point Likert scale. The 8 domains and sample items were as follows: (1) General clarity (eg, Did the doctors use medical words that you did not understand?); (2) Elicitation of and responsiveness to patient problems, concerns, and expectations (eg, Did the doctors listen carefully to what you had to say?); (3) Explanations of condition, progress, and prognosis (eg, Did the doctors make sure you understand your health problem?); (4) Explanations of processes of care (eg, Did the doctors explain why a test was being done?); (5) Explanations of self‐care (eg, Did the doctors tell you what you could do to take care of yourself at home?); (6) Empowerment (eg, Did the doctors make you feel that following your treatment plan would make a difference in your health?); (7) Decision‐making: responsiveness to patient preferences regarding decisions (eg, Did the doctors try to involve you or include you in decisions about your treatment?); and (8) Consideration of patient's desire and ability to comply with recommendations (eg, Did the doctors understand the kinds of problems you might have in doing the recommended treatment?).
Statistical Analysis
Patient characteristics were summarized using frequency, mean, and standard deviation measures. Nondichotomous measures were recategorized into dichotomous variables as follows: age (less than 55 years vs. 55 years or older), race (black vs. white or other), marital status (married or living with someone vs. living alone), education (less than high school vs. high school graduate), employment status (employed full/part time vs. unemployed/retired), MMSE score (cognitively impaired [MMSE score 24] vs. no significant cognitive impairment [MMSE score >24]),39 and health literacy score (inadequate [REALM score 0 to 44] vs. marginal or adequate [REALM score 45‐66]).38 Dichotomous variables were summarized using frequencies.
Scores for each individual IPC question ranged from 1 to 5 with lower scores indicating better communication, except for questions in the domain of general clarity where higher scores indicated better communication. Then, for each of the 8 domains, scores of the individual IPC questions within that domain were averaged.
Bivariate analyses were conducted for each of the 8 IPC domains, by level of health literacy and other relevant patient characteristics, using the independent samples t‐test. Multivariable linear regression models were then constructed to examine the independent association of health literacy with each of the 8 IPC domains, while controlling for other patient characteristics that were also found to be associated with IPC domain scores. Bivariate analyses were also conducted for each of the 27 individual IPC items, to gain an understanding of which items might be driving the overall effect. A 2‐sided P < 0.05 was considered statistically significant. All analyses were performed using SPSS 15 for Windows (SPSS, Chicago, IL).
Results
Patient Characteristics
A total of 109 eligible patients were approached, 100 agreed to participate and were enrolled in the hospital, and 84 of them completed the follow‐up interview by telephone to comprise the sample for this study (Table 1). Most of the 84 participants were under the age of 55 (54%), male (58%), African American (88%), unemployed (79%), lived alone (73%), and had completed high school (62%). Age ranged from 24 to 80 years, REALM score ranged from 0 to 66, and MMSE ranged from 12 to 30. A large proportion (44%) had inadequate health literacy skills, and 50% had cognitive impairment. Patients with inadequate health literacy were more likely to have not finished high school and to suffer cognitive impairment, P < 0.01 for each comparison.
| Characteristic | n (%) |
|---|---|
| Age | |
| <55 years | 45 (54) |
| 55 years | 39 (46) |
| Gender | |
| Male | 49 (58) |
| Female | 35 (42) |
| Race | |
| Black | 74 (88) |
| White or other | 10 (12) |
| Marital status | |
| Married or living with someone | 23 (27) |
| Living alone | 61 (73) |
| Education | |
| Did not complete high school | 32 (38) |
| High school graduate | 52 (62) |
| Employment status | |
| Employed (full/part time) | 18 (21) |
| Not employed | 66 (79) |
| Mini‐Mental State Exam | |
| Cognition impaired | 42 (50) |
| Cognition not impaired | 42 (50) |
| Health literacy | |
| Inadequate | 37 (44) |
| Marginal or adequate | 47 (56) |
Hospital Communication Ratings by IPC Domains
Overall, patients' ratings of hospital communication were positive, with most IPC domain score means lying in the favorable half of the Likert scale (Table 2). The domains with the best communication ratings were responsiveness to patient concerns (mean = 1.68), explanations of condition and prognosis (mean = 1.75), and empowerment (mean 1.76). The domain of worst performance was consideration of patients' desire and ability to comply with recommendations (mean = 3.15).
| IPC Domain | Total (n = 84), Mean (SD) | Patients with Inadequate Literacy (n = 37), Mean (SD) | Patients with Marginal or Adequate Literacy (n = 47), Mean (SD) | P Value | |
|---|---|---|---|---|---|
| |||||
| 1 | General clarity* | 3.66 (1.00) | 3.36 (1.14) | 3.89 (0.74) | 0.02 |
| 2 | Responsiveness to patient concerns | 1.68 (0.68) | 1.86 (0.76) | 1.53 (0.58) | 0.03 |
| 3 | Explanations of condition and prognosis | 1.75 (0.87) | 1.93 (0.99) | 1.61 (0.74) | 0.09 |
| 4 | Explanations of processes of care | 2.01 (0.86) | 2.22 (0.96) | 1.84 (0.74) | 0.04 |
| 5 | Explanations of self‐care | 2.37 (1.04) | 2.42 (1.20) | 2.33 (0.90) | 0.71 |
| 6 | Empowerment | 1.76 (1.03) | 1.85 (1.27) | 1.69 (0.81) | 0.51 |
| 7 | Decision‐making | 2.34 (0.78) | 2.34 (0.80) | 2.34 (0.77) | 1.00 |
| 8 | Consideration of patients' desire and ability to comply with recommendations | 3.15 (1.19) | 3.24 (1.16) | 3.07 (1.23) | 0.54 |
In bivariate analyses that compared IPC domains by patients' level of health literacy, several differences emerged. Patients with inadequate health literacy skills gave significantly worse ratings to the quality of communication on the domains of general clarity (mean = 3.36 vs. 3.89 for patients with marginal or adequate health literacy, P = 0.02), Responsiveness to patient concerns (mean = 1.86 vs. 1.53, P = 0.03), and Explanations of processes of care (mean = 2.22 vs. 1.84, P = 0.04). On a fourth domain, Explanations of condition and prognosis, a nonsignificant trend was present (mean = 1.93 vs. 1.61, P = 0.09).
Fewer significant relationships were found between other patient characteristics and IPC domain scores. Patients who were age 55 or older provided worse ratings on explanations of self‐care (mean = 2.74 vs. 2.05 for patients under the age of 55, P = 0.003). Lower ratings on the domain of general clarity, which indicated unclear communication, were found among patients who had not graduated from high school (mean = 3.31 vs. 3.88 for high school graduates, P = 0.02) or who had cognitive impairment (mean = 3.39 vs. 3.93 for patients without impaired cognition, P = 0.01). No significant differences were present by gender or race.
Based on these bivariate relationships, terms for inadequate health literacy, age 55, Cognitive impairment, and high school graduation were entered into multivariable models that predicted scores on each of the 8 IPC domains. Inadequate health literacy was independently associated with Responsiveness to patient concerns ( = 0.512, P = 0.007) and Explanations of processes of care ( = 0.548, P = 0.023); a nonsignificant trend was present for consideration of patients' desire and ability to comply with recommendations ( = 0.582, P = 0.09). The association of age with explanations of self‐care remained after adjustment for the other variables ( = 0.705, P = 0.002). None of the patient characteristics was independently associated with ratings of general clarity.
IPC Item Responses
Examination of responses on the individual IPC items revealed the specific areas of difficulty in communication as rated by patients (Table 3). In the domain of general clarity, patients with inadequate literacy provided poorer ratings on the item pertaining to use of medical terminology (mean = 2.92 vs. 3.68 for patients with marginal or adequate literacy, P = 0.004). Regarding Responsiveness to patient concerns, differences by literacy were present in the item that pertained to patients being given enough time to say what they thought was important (mean = 2.27 vs. 1.51, P = 0.003). On the domain of explanations of processes of care, the item rated differently by patients with inadequate literacy referred to feeling confused about their care because doctors did not explain things well (mean = 2.51 vs. 1.83, P = 0.02).
Discussion
We used a validated instrument, the IPC,40 to examine patients' ratings of the quality and clarity of hospital‐based communication. Overall, patients provided favorable ratings in many domains, including those pertaining to Responsiveness to patient concerns and Explanations of condition and prognosis. Clinicians' consideration of patients' desire and ability to comply with recommendations was rated least favorably overall. This represents an important area for improvement, particularly when considering the prevalence of nonadherence to medical therapy after hospital discharge, which may be as high as 50%.9, 42 Nonadherence after hospital discharge contributes to avoidable emergency department visits,43 hospital readmissions,44 and higher mortality.18, 45 The results of this study suggest that hospital physicians should give greater consideration to patients' preferences and problems that they may have in following the treatment recommendations.16 Future research will determine the extent to which this may enhance post‐discharge adherence.
Another important finding is that patients with inadequate health literacy rated hospital‐based communication less favorably than did patients with marginal or adequate literacy. In bivariate analyses, this effect was seen on several domains, including general clarity, Responsiveness to patient concerns, and explanations of processes of care. The latter 2 relationships persisted after adjustment for age, cognitive impairment, and educational attainment. To our knowledge, this is the first study which examines the effect of health literacy on patients' ratings of hospital‐based communication.
The majority of the literature on health communication and health literacy focuses on the outpatient setting.34, 46 However, the quality and clarity of patient‐provider communication in the hospital is also critically important. Ineffective communication in the hospital contributes to poor care transitions and post‐discharge complications. Patients commonly leave the hospital with a poor understanding of what transpired (eg, diagnoses, treatment provided, major test results) and inadequate knowledge about the self‐care activities that they must perform upon returning home (eg, medication management, physical activity, follow‐up appointments).911 Poor communication is often cited as the main underlying and remediable factor behind medical errors, adverse events, and the readmissions that commonly occur after hospital discharge.6, 16, 20 The results of this study provide complementary evidence, showing that patients often feel they have experienced suboptimal communication in the hospital setting. These findings highlight an opportunity for improvement in care transitions and patient safety, particularly among patients with inadequate health literacy.
In outpatient research that utilized the IPC, Schillinger et al.41 found that patients with inadequate functional health literacy reported significantly worse communication on the domains of general clarity, explanations of processes of care, and Explanations of condition and prognosis. Subsequent analyses by Sudore et al.47 demonstrated that patients with inadequate or marginal health literacy more often reported that physicians did not give them enough time to say what they thought was important, did not explain processes of care well, and did not ask about problems in following the recommended treatment (Table 3, IPC items 3, 12, and 26, respectively). Our findings were very similar. These relatively consistent results across studies and populations strengthen the conclusion that patients with inadequate health literacy feel their physicians do not communicate as effectively in these areas.
| IPC Items | Overall (n = 84), Mean (SD) | Inadequate Literacy (n = 37), Mean (SD) | Marginal or Adequate Literacy (n = 47), Mean (SD) | P Value |
|---|---|---|---|---|
| ||||
| General clarity* | ||||
| 1. Did the doctors use medical words you did not understand? | 3.35 (1.14) | 2.92 (1.40) | 3.68 (0.73) | 0.004 |
| 2. Did you have trouble understanding your doctors because they spoke too fast? | 3.98 (1.06) | 3.81 (1.13) | 4.11 (1.01) | 0.21 |
| Responsiveness to patient concerns | ||||
| 3. Did the doctors give you enough time to say what you thought was important? | 1.85 (1.14) | 2.27 (1.28) | 1.51 (0.88) | 0.003 |
| 4. Did the doctors listen carefully to what you had to say? | 1.62 (0.88) | 1.76 (1.04) | 1.51 (0.72) | 0.22 |
| 5. Did the doctors ignore what you told them? | 1.70 (0.92) | 1.81 (1.09) | 1.62 (0.77) | 0.38 |
| 6. Did the doctors take your concerns seriously? | 1.55 (0.92) | 1.65 (0.98) | 1.47 (0.88) | 0.38 |
| Explanations of condition and prognosis | ||||
| 7. Did the doctors give you enough information about your health problems? | 1.88 (1.11) | 2.11 (1.27) | 1.70 (0.95) | 0.11 |
| 8. Did the doctors make sure you understand your health problems? | 1.62 (0.88) | 1.76 (0.98) | 1.51 (0.78) | 0.22 |
| Explanations of processes of care | ||||
| 9. Did the doctors explain why a test was being done? | 1.70 (1.10) | 1.89 (1.24) | 1.55 (0.95) | 0.16 |
| 10. Did the doctors explain how the test was done? | 2.20 (1.35) | 2.27 (1.39) | 2.15 (1.34) | 0.69 |
| 11. Did the doctors tell you what they were doing as they examined you? | 1.99 (1.20) | 2.22 (1.34) | 1.81 (1.06) | 0.13 |
| 12. Did you feel confused about what was going on with your medical care because doctors did not explain things well? | 2.13 (1.23) | 2.51 (1.47) | 1.83 (0.92) | 0.02 |
| Explanations of self‐care | ||||
| 13. Did the doctors tell you what you could do to take care of yourself at home? | 1.67 (1.09) | 1.81 (1.29) | 1.55 (0.90) | 0.31 |
| 14. Did the doctors tell you how to pay attention to your symptoms and when to call the doctor? | 2.01 (1.38) | 2.19 (1.60) | 1.87 (1.17) | 0.32 |
| 15. Did the doctors clearly explain how to take the medicine (that is when, how much and for how long)? | 1.88 (1.36) | 2.00 (1.53) | 1.79 (1.22) | 0.48 |
| 16. Did the doctors go over all the medicines you are taking? | 2.39 (1.55) | 2.51 (1.74) | 2.30 (1.40) | 0.54 |
| 17. Did the doctors give you written instruction about how to take the medicine (other than what was on the container)? | 3.29 (1.70) | 3.05 (1.75) | 3.48 (1.66) | 0.26 |
| 18. Did the doctors tell you the reason for taking each medicine? | 2.05 (1.43) | 2.24 (1.64) | 1.89 (1.24) | 0.29 |
| 19. Did the doctors tell you about side effects you might get from your medicine? | 3.32 (1.64) | 3.11 (1.73) | 3.49 (1.56) | 0.29 |
| Empowerment | ||||
| 20. Did doctors make you feel that following your treatment plan would make a difference in your health? | 1.75 (1.07) | 1.89 (1.27) | 1.64 (0.90) | 0.31 |
| 21. Did the doctors make you feel that your everyday activities such as your diet and lifestyle would make a difference in your health? | 1.77 (1.21) | 1.81 (1.41) | 1.74 (1.03) | 0.81 |
| Decision‐making | ||||
| 22. Did the doctors try to involve you or include you in decisions about your treatment? | 2.43 (1.55) | 2.30 (1.49) | 2.53 (1.60) | 0.49 |
| 23. Did the doctors ask how you felt about different treatments? | 3.08 (1.58) | 2.89 (1.66) | 3.23 (1.51) | 0.33 |
| 24. Did the doctors make decision without taking your preferences and opinions into account? | 2.23 (1.35) | 2.34 (1.55) | 2.15 (1.20) | 0.54 |
| 25. Did you feel pressured by doctors in the hospital to have a treatment you were not sure you wanted? | 1.60 (0.97) | 1.81 (1.18) | 1.43 (0.74) | 0.09 |
| Consideration of patients' desire and ability to comply with recommendations | ||||
| 26. Did the doctors ask if you might have any problems actually doing the recommended treatment (for example taking the medication correctly)? | 3.82 (1.47) | 4.08 (1.40) | 3.62 (1.51) | 0.15 |
| 27. Did the doctors understand the kinds of problems you might have in doing the recommended treatment? | 2.43 (1.44) | 2.26 (1.52) | 2.57 (1.38) | 0.34 |
Importantly, the differences in patient responses by literacy category were driven by a few IPC items. These items pertained to physicians' use of medical terminology, the amount of time they gave patients to express their concerns, and how well they explained the patients' medical care. Training physicians to improve their communication skills in these specific areas may improve their ability to communicate effectively with patients who have limited literacy skills. Indeed, published recommendations on how to improve the clarity of verbal communication emphasize just a few major areas, including limiting the amount of medical terminology used, effectively encouraging patients to ask questions and express their concerns, and asking patients to teach‐back key points to make sure the physician has provided adequate explanation.4851 The present study provides some evidence for those recommendations, which for the most part, have been based on clinical experience and expert opinion.
There remains a need for professional education about health literacy and techniques to improve communication with patients who may have limited literacy skills. Many experts advocate clear verbal communication with all patients, so‐called Universal Precautions.52 Although 10 years have passed since the American Medical Association (AMA) called for more work in this area,53 few curricula have been described in the literature.48, 5456 The extent to which health literacy curricula have been implemented in medical schools and other professional schools is unknown. The impact of such training on the communication skills of health care providers and patient outcomes is also unclear.
The strengths of this study include a relatively good response rate and use of a validated measure to grade the quality of physician‐patient communication. This measure, the IPC, has been used previously in the context of health literacy.41 Nevertheless, certain limitations should be acknowledged. First, the study was performed at a single teaching hospital, where patients had a high prevalence of inadequate health literacy. The findings may not generalize to other institutions that serve a different patient population or to nonacademic programs. Second, communication was assessed by patient report, rather than by recording patient‐provider discussions for rating by independent observers. While patient report is inherently more subjective, patients' own perceptions about the effectiveness of health communication are arguably more important than those of independent raters, and thus, the data source may not represent a true limitation. Third, patient responses were obtained approximately 2 weeks after hospital discharge, and accordingly, they are subject to recall bias, which may be greater among those with cognitive impairment. Finally, patients were directed to rate the communication of the overall group of physicians who took care of them in the hospital. Given the academic setting, patients typically received care from a team that included medical students, interns, a resident, and an attending physician. We were not able to determine whether patients' ratings were influenced by a specific member of the team, nor how ratings may have been influenced by certain characteristics of that team member (eg, year of training, prior communication skills training, race or gender concordance, etc).
In summary, by surveying patients soon after an acute care hospitalization, we determined that certain areas held room for improvement, such as consideration of patients' desire and ability to comply with treatment recommendations. Patients with inadequate health literacy reported lower quality physician‐patient communication on several domains. They expressed particular concern about physicians' use of medical terminology, not getting enough time to express their concerns, and not receiving clear enough explanations about the medical care. Efforts are needed to improve physicians' communication skills in these areas. Such training should be evaluated to determine if it has a beneficial effect on physician communication skills and patient outcomes.
- ,,,,.The gap between patient reading comprehension and the readability of patient education materials.J Fam Pract.1990;31:533–538.
- .Differences between patients' and doctors' interpretation of some common medical terms.BMJ.1970;1:286–289.
- ,,.Patient understanding of commonly used medical vocabulary.J Fam Pract.1987;25:176–178.
- ,,,,,.Improving education for patients with low literacy skills.Am Fam Physician.1996;53:205–211.
- ,,,.Doctor‐patient communication: a review of the literature.Soc Sci Med.1995;40:903–918.
- ,,,.Promoting effective transitions of care at hospital discharge: a review of key issues for hospitalists.J Hosp Med.2007;2(5):314–323.
- ,.Lost in transition: challenges and opportunities for improving the quality of transitional care.Ann Intern Med.2004;141(7):533–536.
- ,,.The hospital discharge: a review of a high risk care transition with highlights of a reengineered discharge process.J Patient Saf.2007;3(2):97–106.
- ,,,.Medication use among inner‐city patients after hospital discharge: patient reported barriers and solutions.Mayo Clin Proc.2008;83(5):529–535.
- ,.Patients' understanding of their treatment plans and diagnosis at discharge.Mayo Clin Proc.2005;80(8):991–994.
- ,,.Hospital discharge information and older patients: do they get what they need?J Hosp Med.2007;2(5):291–296.
- ,.Uncovering a multitude of sins: medication management in the home post acute hospitalisation among the chronically ill.Aust NZ J Med.1999;29(2):220–227.
- ,,,.Medical errors related to discontinuity of care from an inpatient to an outpatient setting.J Gen Intern Med.2003;18:646–651.
- ,,,.Posthospital medication discrepancies: prevalence and contributing factors.Arch Intern Med.2005;165(16):1842–1847.
- ,,,,.The incidence and severity of adverse events affecting patients after discharge from the hospital.Ann Intern Med.2003;138:161–167.
- ,.Medication use in the transition from hospital to home.Ann Acad Med Singapore.2008;37(2):136–141.
- ,,, et al.Adherence to medications by patients after acute coronary syndromes.Ann Pharmacother.2005;39(11):1792–1797.
- ,,, et al.Impact of medication therapy discontinuation on mortality after myocardial infarction.Arch Intern Med.2006;166(17):1842–1847.
- ,,,,,.Deficits in communication and information transfer between hospital‐based and primary care physicians: implications for patient safety and continuity of care.JAMA.2007;297(8):831–841.
- ,,,,.Impact of patient communication problems on the risk of preventable adverse events in acute care settings.CMAJ.2008;178(12):1555–1562.
- ,,.Communication gaps and readmissions to hospital for patients aged 75 years and older: observational study.Qual Saf Health Care.2008;17(1):71–75.
- ,,.Rehospitalizations among patients in the Medicare fee‐for‐service program.N Engl J Med.2009;360(14):1418–1428.
- Institute of Medicine.Health Literacy. A Prescription to End Confusion.Washington, DC:National Academies Press;2004.
- ,,,.Current Bibliographies in Medicine: Health Literacy.Bethesda, MD:National Library of Medicine;2000.
- ,,. National Assessment of Adult Literacy (NAAL). A first look at the literacy of America's adults in the 21st century. Available at: http://nces.ed.gov/naal. Accessed January2010.
- ,,, et al.The health care experience of patients with low literacy.Arch Fam Med.1996;5:329–334.
- ,,,.Patient literacy and question‐asking behavior in the medical encounter: a mixed‐methods analysis.J Gen Intern Med.2007;22(6):782–786.
- ,,,.Babel babble: physicians' use of unclarified medical jargon with patients.Am J Health Behav.2007;31(Suppl 1):S85–S95.
- ,,, et al.Literacy and misunderstanding prescription drug labels.Ann Intern Med.2006;145(12):887–894.
- ,,,.Relationship of functional health literacy to patients' knowledge of their chronic disease: a study of patients with hypertension and diabetes.Arch Intern Med.1998;158(2):166–172.
- ,,,.Health literacy and the risk of hospital admission.J Gen Intern Med.1998;13:791–798.
- ,,, et al.Limited literacy and mortality in the elderly: The Health, Aging, and Body Composition Study.J Gen Intern Med.2006;21(8):806–812.
- ,,,,,.Health literacy and mortality among elderly persons.Arch Intern Med.2007;167(14):1503–1509.
- ,,,,.Literacy and health outcomes: a systematic review of the literature.J Gen Intern Med.2004;19(12):1129–1139.
- ,,, et al.Inadequate functional health literacy among patients at two public hospitals.JAMA.1995;274(21):1677–1682.
- ,,, et al.ACC/AHA 2002 guideline update for the management of patients with unstable angina and non‐ST‐segment elevation myocardial infarction–summary article: a report of the American College of Cardiology/American Heart Association task force on practice guidelines (Committee on the Management of Patients With Unstable Angina).J Am Coll Cardiol.2002;40(7):1366–1374.
- ,,, et al.Rapid assessment of literacy levels of adult primary care patients.Fam Med.1991;23(6):433–435.
- ,,,.Literacy testing in health care research. In: Schwartzberg JG, VanGeest JB, Wang CC, eds.Understanding Health Literacy.Chicago:American Medical Association;2005:157–179.
- ,,.“Mini‐Mental State”. A practical method for grading the cognitive state of patients for the clinician.J Psychiatr Res.1975;12:189–198.
- ,,, et al.Interpersonal processes of care in diverse populations.Milbank Q.1999;77:305–339.
- ,,,,.Functional health literacy and the quality of physician‐patient communication among diabetes patients.Patient Educ Couns.2004;52(3):315–323.
- ,,,.Frequency and predictors of prescription‐related issues after hospital discharge.J Hosp Med.2008;3(1):12–19.
- ,,,,.Association of medication adherence, knowledge, and skills with emergency department visits by adults 50 years or older with congestive heart failure.Am J Health Syst Pharm.2004;61(19):2043–2049.
- ,,,,,.Factors associated with exacerbation of heart failure include treatment adherence and health literacy skills.Clin Pharmacol Ther.2009;85(6):651–658.
- ,,, et al.Prevalence, predictors, and outcomes of premature discontinuation of thienopyridine therapy after drug‐eluting stent placement: results from the PREMIER registry.Circulation.2006;113(24):2803–2809.
- ,,.Patient‐physician communication: a descriptive summary of the literature.Patient Educ Couns.1988;12:99–119.
- ,,,,,.Unraveling the relationship between literacy, language proficiency, and patient‐physician communication.Patient Educ Couns.2009;75(3):398–402.
- ,.Teaching about health literacy and clear communication.J Gen Intern Med.2006;21:888–890.
- .Health Literacy: A Manual for Clinicians.Chicago, IL:American Medical Association;2003.
- ,.Communicating with patients who cannot read.N Engl J Med.1997;337:272–274.
- ,,,.The role of health literacy in patient‐physician communication.Fam Med.2002;34(5):383–389.
- ,,,,,.Health literacy: universal precautions needed.J Allied Health.2004;33(2):150–155.
- American Medical Association Council on Scientific Affairs.Health literacy.JAMA.1999;281:552–557.
- ,,.Teaching medical students about health literacy: 2 Chicago initiatives.Am J Health Behav.2007;31Suppl 1:S111–S114.
- ,,,,,.Development and implementation of a health literacy training program for medical residents.Med Educ Online.2006;11(13):1–8.
- ,.The use of standardized patients to teach low‐literacy communication skills.Am J Health Behav.2007;31Suppl 1:S105–S110.
Copyright © 2010 Society of Hospital Medicine
In the Literature
In This Edition
Literature at a Glance
A guide to this month’s studies
- Risk of VTE with travel
- Hyponatremia and mortality
- Clopidogrel and aspirin for atrial fibrillation
- Cost-effective evaluation of syncope
- Early vs. delayed intervention in STEMI patients receiving fibrinolytics
- Predictors of prolonged SSU length of stay
- Rates of survival for in-hospital CPR
- Hospitalists and hospital quality measures
Travel Increases Risk for Venous Thromboembolism in a Dose-Response Relationship
Clinical question: What is the association between travel and the risk of venous thromboembolism (VTE)?
Background: Previous studies evaluating the relationship between long-distance travel and VTE have been heterogeneous and inconclusive. Though a relationship is often discussed, only about half of prior investigations have identified an elevated VTE risk in those who travel, and the impact of duration on VTE risk is unclear.
Study design: Meta-analysis.
Setting: Western countries.
Synopsis: Studies were included if they investigated the association between travel and VTE for persons using any mode of transportation and if nontraveling persons were included for comparison. Fourteen studies met the criteria, and included 4,055 patients with VTE. Compared with nontravelers, the overall pooled relative risk for VTE in travelers was 2.0 (95% CI, 1.5-2.7).
Significant heterogeneity was present among these 14 studies, specifically with regard to the method used for selecting control participants. Six case-control studies used control patients who had been referred for VTE evaluation. When these studies were excluded, the pooled relative risk for VTE in travelers was 2.8 (95% CI, 2.2-3.7).
A dose-response relationship was identified. There was an 18% higher risk for VTE for each two-hour increase in duration of travel among all modes of transportation (P=0.010). When studies evaluating only air travel were analyzed, a 26% higher risk was found for every two-hour increase in air travel (P=0.005).
Bottom line: Travel is associated with a three-fold increase in the risk for VTE, and for each two-hour increase in travel duration, the risk increases approximately 18%.
Citation: Chandra D, Parisini E, Mozaffarian D. Meta-analysis: travel and risk for venous thromboembolism. Ann Intern Med. 2009;151(3):180-190.
Hyponatremia in Hospitalized Patients is Associated with Increased Mortality
Clinical question: Is hyponatremia in hospitalized patients associated with increased mortality?
Background: Hyponatremia is the most common electrolyte abnormality in hospitalized patients. Patients admitted with hyponatremia have increased in-hospital mortality. Long-term mortality in hospitalized patients with hyponatremia is not known. Further, the effects of the degree of hyponatremia on mortality are not known.
Study design: Prospective cohort.
Setting: Two teaching hospitals in Boston.
Synopsis: The study identified 14,290 patients with hyponatremia (serum sodium <135 mEq/L) at admission (14.5%) and an additional 5,093 patients (19,383 total patients, or 19.7% of the 98,411 study patients) with hyponatremia at some point during their hospital stay. After multivariable adjustments and correction for hyperglycemia, patients with hyponatremia had increased mortality in the hospital (OR 1.47, 95% CI, 1.33-1.62), at one year (HR 1.38, 95% CI, 1.32-1.46), and at five years (HR 1.25, 95% CI, 1.21-1.30) compared with normonatremic patients. These mortality differences were seen in patients with mild, moderate, and moderately severe hyponatremia (serum sodium concentrations 130-134, 125-129, and 120-124 mEq/L, respectively), but not in patients with severe hyponatremia (serum sodium <120 mEq/L).
This study is limited by its post-hoc identification and classification of patients using ICD-9-CM codes, which could have resulted in some misclassification. Also, this study includes only two teaching hospitals in an urban setting; the prevalence of hyponatremia might differ in other settings. Causality cannot be determined based on these results.
Bottom line: Hospitalized patients with hyponatremia have increased in-hospital and long-term mortality.
Citation: Waikar SS, Mount DB, Curhan GC. Mortality after hospitalization with mild, moderate, and severe hyponatremia. Am J Med. 2009;122(9):857-865.
Clopidogrel Plus Aspirin in Patients with Atrial Fibrillation Reduces Risk of Major Vascular Events
Clinical question: Does the addition of clopidogrel to aspirin therapy reduce the risk of major vascular events in patients with atrial fibrillation for whom vitamin K antagonists (VKAs) are unsuitable?
Background: Although VKAs reduce the risk of stroke in atrial fibrillation, many patients are unable to use VKAs and are treated with aspirin instead. The potential benefits of adding clopidogrel to aspirin therapy in this population are unknown.
Study design: Randomized controlled trial.
Setting: Five hundred eighty medical centers in 33 countries.
Synopsis: More than 7,500 patients with atrial fibrillation who were also at high risk for stroke were randomly assigned to receive either clopidogrel or placebo once daily. All patients also received aspirin at a dose of 75 mg to 100 mg daily. A major vascular event occurred in 6.8% of patients per year who received clopidogrel and in 7.6% of patients per year who received placebo (RR 0.89, 95% CI, 0.89-0.98, P=0.01). This reduction primarily was due to a reduction in stroke, which occurred in 2.4% of patients per year who received clopidogrel, compared with 3.3% of patients per year who received placebo (RR 0.72, 95% CI, 0.62-0.83, P<0.001).
Major bleeding occurred in 2% of patients per year who received clopidogrel and in 1.3% of patients per year who received placebo (RR 1.57, 95% CI, 1.29-1.92, P<0.001).
Bottom line: Adding clopidogrel to aspirin in patients with atrial fibrillation who are not eligible for VKAs decreases the risk of major vascular events, including stroke, but increases risk of major hemorrhage compared with aspirin alone.
Citation: ACTIVE Investigators, Connolly SJ, Pogue J, et al. Effect of clopidogrel added to aspirin in patients with atrial fibrillation. N Engl J Med. 2009;360(20):2066-2078.
Prioritize Syncope Testing by Diagnostic Yield and Cost Effectiveness
Clinical question: What are the utilization, yield, and cost effectiveness of tests used for evaluation of syncope in older patients?
Background: Clinicians utilize multiple diagnostic tests to help delineate the cause of syncope, but the yield and cost effectiveness of many of these tests are unclear. Further, it is unknown if considering patient characteristics, as in the San Francisco syncope rule (SFSR), can improve the yield of diagnostic tests.
Study design: Retrospective cohort.
Setting: Single acute-care hospital.
Synopsis: Review of 2,106 admissions in patients 65 and older with syncope revealed that the most common tests were electrocardiogram (99%), telemetry (95%), cardiac enzymes (95%), and head computed tomography (CT) scan (63%). The majority of tests did not affect diagnosis or management.
Postural blood pressure (BP) reading was infrequently recorded (38%) but had the highest yield. BP influenced diagnosis at least 18% of the time and management at least 25% of the time. Tests with the lowest likelihood of affecting diagnosis and management were head CT, carotid ultrasound, electroencephalography (EEG), and cardiac enzymes.
EEG had the highest cost per test affecting the diagnosis or management ($32,973), followed by head CT. The cost per test affecting diagnosis or management for postural BP was $17. Cardiac testing, including telemetry, echocardiogram, and cardiac enzymes, had significantly better yield in patients who met SFSR criteria.
Bottom line: In patients with syncope, the history and exam should guide evaluation, and tests with high yield and low cost per test, such as postural BP, should be prioritized.
Citation: Mendu ML, McAvay G, Lampert R, Stoehr J, Tinetti ME. Yield of diagnostic tests in evaluating syncopal episodes in older patients. Arch Intern Med. 2009;169(14): 1299-1305.
Early PCI is Superior to Delayed Intervention in Patients with STEMI Receiving Fibrinolytic Therapy
Clinical question: Does early percutaneous coronary intervention (PCI) improve clinical outcomes compared with standard management in patients with ST elevation myocardial infarction (STEMI) who receive fibrinolysis?
Background: Prior research has demonstrated the benefit of timely PCI in the management of acute coronary syndrome, specifically with ST elevation. However, many hospitals do not have this capability and utilize fibrinolysis as a standard alternative. The optimal timing of subsequent invasive intervention following fibrinolysis has not been established.
Study design: Multicenter randomized trial.
Setting: Fifty-two sites in three provinces in Canada.
Synopsis: This study randomized 1,059 patients presenting with STEMI and receiving fibrinolysis to early intervention (immediate transfer to another hospital with PCI less than six hours after fibrinolysis) versus standard intervention (rescue PCI if needed, or delayed angiography at more than 24 hours). The primary outcome was the composite of death, reinfarction, recurrent ischemia, new or worsening congestive heart failure, or cardiogenic shock within 30 days.
The primary outcome occurred in 11% of patients in the early intervention group, compared with 17.2% of patients randomized to standard intervention (RR 0.64, 95% CI, 0.47-0.87, P=0.004). Urgent catheterization was performed within 12 hours of fibrinolysis in 34.9% of patients randomized to the standard treatment group.
This study was not powered to detect differences in mortality and other individual components of the primary endpoint.
Bottom line: STEMI patients who received fibrinolysis had a lower risk of adverse outcomes when receiving transfer and PCI within six hours, compared with standard delayed intervention.
Citation: Cantor WJ, Fitchett D, Borgundvaag B, et al. Routine early angioplasty after fibrinolysis for acute myocardial infarction. N Engl J Med. 2009;360(26):2705-2718.
Specialty Consultation and Limited Access Tests Predict Unsuccessful SSU Admissions
Clinical question: In patients admitted to short-stay units (SSUs), what characteristics are associated with unsuccessful SSU admission?
Background: Short-stay units have become prevalent in U.S. hospitals, but it is unclear which patient populations are best served by SSUs.
Study design: Prospective cohort.
Setting: Fourteen-bed SSU in a 500-bed public teaching hospital in Chicago.
Synopsis: More than 700 patients admitted to the Cook County Hospital SSU over a four-month period were interviewed and examined, and their ED and inpatient records were reviewed. An SSU admission was defined as “successful” if the length of stay (LOS) was less than 72 hours and the patient was discharged directly from the SSU.
Overall, 79% of patients had a successful SSU admission. In multivariate analysis, the strongest predictors of an unsuccessful SSU stay were subspecialty consultation (OR 8.1, P<0.001), a provisional diagnosis of heart failure (OR 1.9, P=0.02), and limited availability of a diagnostic test (OR 2.5, P<0.001).
The study was limited primarily to patients with cardiovascular diagnoses.
Bottom line: Patients admitted to SSUs who receive specialty consultation, carry a diagnosis of heart failure, or require diagnostic testing that is not readily available might have a longer LOS or eventual inpatient admission.
Citation: Lucas BP, Kumapley R, Mba B, et al. A hospitalist-run short-stay unit: features that predict length-of-stay and eventual admission to traditional inpatient services. J Hosp Med. 2009;4(5):276-284.
Lack of Significant Gains in Survival Rates Following In-Hospital CPR
Clinical question: Is survival after in-hospital CPR improving over time, and what are the factors associated with survival?
Background: Advances in out-of-hospital CPR have improved outcomes. However, it is unknown whether the survival rate after in-hospital CPR is improving over time, and it is unclear which patient and/or hospital characteristics predict post-CPR survival.
Study design: Retrospective cohort.
Setting: Inpatient Medicare beneficiaries from 1992 to 2005.
Synopsis: The study examined more than 150 million Medicare admissions, 433,985 of which underwent in-hospital CPR. Survival to discharge occurred in 18.3% of CPR events and did not change significantly from 1992 to 2005. The cumulative incidence of in-hospital CPR events was 2.73 per 1,000 admissions; it did not change substantially over time.
The survival rate was lower among black patients (OR 0.76, 95% CI, 0.74-0.79), which is partially explained due to the fact they tended to receive CPR at hospitals with lower post-CPR survival. Gender (specifically male), older age, race (specifically other nonwhite patients), higher burden of chronic illness, and admission from a skilled nursing facility were significantly associated with decreased survival to hospital discharge following CPR.
Limitations of this study included the identification of CPR by ICD-9 codes, which have not been validated for this purpose and could vary among hospitals. Other factors that might explain variations in survival were not available, including severity of acute illness and the presence (or absence) of a shockable rhythm at initial presentation.
Bottom line: Rates of survival to hospital discharge among Medicare beneficiaries receiving in-hospital CPR have remained constant over time, with poorer survival rates among blacks and other nonwhite patients.
Citation: Ehlenbach WJ, Barnato AE, Curtis JR, et al. Epidemiologic study of in-hospital cardiopulmonary resuscitation in the elderly. N Engl J Med. 2009;361(1):22-31.
Hospitalists Are Associated with Improved Performance on Quality Metrics
Clinical question: Is the presence of hospitalist physicians associated with improved performance on standard quality measures for acute myocardial infarction (AMI), congestive heart failure (CHF), and pneumonia?
Background: Previous investigations have demonstrated significant improvements in cost and LOS for patients under the care of hospitalists compared with other inpatient providers. The association between hospitalist prevalence and quality of care, as measured by standard quality process measures, is unknown.
Study design: Cross-sectional.
Setting: More than 3,600 hospitals participating in the Health Quality Alliance (HQA) program.
Synopsis: Investigators looked at a large sample of HQA hospitals in the American Hospital Association survey, and identified facilities with hospitalist services and those without. The primary endpoint was the adherence to composites of standard quality process measures across three disease categories (AMI, CHF, and pneumonia) and two domains of care (disease treatment/diagnosis and counseling/prevention).
Multivariable analyses revealed a statistically significant association between the presence of hospitalists and adherence to composite quality measures for AMI and pneumonia. This association was demonstrated for both treatment and counseling domains.
The study is cross-sectional, so conclusions cannot be drawn about causality. Also, there are likely unmeasured differences between hospitals that utilize hospitalists compared with those that do not, which could further confound the relationship between the presence of hospitalists and adherence to quality measures.
Finally, this study only evaluated hospital-level performance, and it cannot offer insight on the quality of individual patient care by hospitalist providers.
Bottom line: The presence of hospitalists is associated with improvement in adherence to quality measures for both AMI and pneumonia, and across clinical domains of treatment and counseling.
Citation: López L, Hicks LS, Cohen AP, McKean S, Weissman JS. Hospitalists and the quality of care in hospitals. Arch Intern Med. 2009;169(15):1389-1394. TH
PEDIATRIC HM LITerature
Inpatient Curriculum Implicit, but Aligns with ACGME Competencies
By Mark Shen, MD

Clinical question: Does implicit resident learning on an inpatient unit correspond to the explicit Accreditation Council for Graduate Medical Education (ACGME) competencies?
Background: The ACGME competency-based model of education places an emphasis on task-oriented ability as a translation of skills and knowledge. Although it is recognized that most learning occurs through the process of daily patient care, it is unclear how much learning is explicit and linked to ACGME competencies, as defined in the goals and objectives of an inpatient rotation.
Study design: Qualitative, ethnographic case study.
Setting: One general pediatric floor in a large, urban pediatric hospital.
Synopsis: Over an eight-month period, one researcher directly observed and asked questions of inpatient teams as they worked on a general pediatric service. There was a particular emphasis on morning rounds. Data coding was completed in an iterative manner, and both data and method triangulation were used to enhance trustworthiness.
Curricular convergence occurred and was most obvious in the patient-care domain; however, the explicit curriculum was not formally referred to during the study period. The implicit curriculum was ill-structured and unpredictable, typically dictated by the patients’ socioclinical environment.
The primary limitations of this work are the focus on one service on one hospital floor, and that the study authors were former trainees or employees of that institution. This institution-specific bias, however, might be gauged by the degree to which the themes in this research will resonate with clinician-educators who read this article. Given the increasing time constraints on explicit inpatient didactic teaching, the vignettes and conclusions within this report are likely to find many a sympathetic ear. Illumination of the hidden curriculum could further support learner-centered education.
Bottom line: The inpatient service is a fertile and primarily implicit training ground for the ACGME competencies.
Citation: Balmer DF, Master CL, Richards B, Giardino AP. Implicit versus explicit curricula in general pediatrics education: is there a convergence? Pediatrics. 2009;124(2):e347-354.
In This Edition
Literature at a Glance
A guide to this month’s studies
- Risk of VTE with travel
- Hyponatremia and mortality
- Clopidogrel and aspirin for atrial fibrillation
- Cost-effective evaluation of syncope
- Early vs. delayed intervention in STEMI patients receiving fibrinolytics
- Predictors of prolonged SSU length of stay
- Rates of survival for in-hospital CPR
- Hospitalists and hospital quality measures
Travel Increases Risk for Venous Thromboembolism in a Dose-Response Relationship
Clinical question: What is the association between travel and the risk of venous thromboembolism (VTE)?
Background: Previous studies evaluating the relationship between long-distance travel and VTE have been heterogeneous and inconclusive. Though a relationship is often discussed, only about half of prior investigations have identified an elevated VTE risk in those who travel, and the impact of duration on VTE risk is unclear.
Study design: Meta-analysis.
Setting: Western countries.
Synopsis: Studies were included if they investigated the association between travel and VTE for persons using any mode of transportation and if nontraveling persons were included for comparison. Fourteen studies met the criteria, and included 4,055 patients with VTE. Compared with nontravelers, the overall pooled relative risk for VTE in travelers was 2.0 (95% CI, 1.5-2.7).
Significant heterogeneity was present among these 14 studies, specifically with regard to the method used for selecting control participants. Six case-control studies used control patients who had been referred for VTE evaluation. When these studies were excluded, the pooled relative risk for VTE in travelers was 2.8 (95% CI, 2.2-3.7).
A dose-response relationship was identified. There was an 18% higher risk for VTE for each two-hour increase in duration of travel among all modes of transportation (P=0.010). When studies evaluating only air travel were analyzed, a 26% higher risk was found for every two-hour increase in air travel (P=0.005).
Bottom line: Travel is associated with a three-fold increase in the risk for VTE, and for each two-hour increase in travel duration, the risk increases approximately 18%.
Citation: Chandra D, Parisini E, Mozaffarian D. Meta-analysis: travel and risk for venous thromboembolism. Ann Intern Med. 2009;151(3):180-190.
Hyponatremia in Hospitalized Patients is Associated with Increased Mortality
Clinical question: Is hyponatremia in hospitalized patients associated with increased mortality?
Background: Hyponatremia is the most common electrolyte abnormality in hospitalized patients. Patients admitted with hyponatremia have increased in-hospital mortality. Long-term mortality in hospitalized patients with hyponatremia is not known. Further, the effects of the degree of hyponatremia on mortality are not known.
Study design: Prospective cohort.
Setting: Two teaching hospitals in Boston.
Synopsis: The study identified 14,290 patients with hyponatremia (serum sodium <135 mEq/L) at admission (14.5%) and an additional 5,093 patients (19,383 total patients, or 19.7% of the 98,411 study patients) with hyponatremia at some point during their hospital stay. After multivariable adjustments and correction for hyperglycemia, patients with hyponatremia had increased mortality in the hospital (OR 1.47, 95% CI, 1.33-1.62), at one year (HR 1.38, 95% CI, 1.32-1.46), and at five years (HR 1.25, 95% CI, 1.21-1.30) compared with normonatremic patients. These mortality differences were seen in patients with mild, moderate, and moderately severe hyponatremia (serum sodium concentrations 130-134, 125-129, and 120-124 mEq/L, respectively), but not in patients with severe hyponatremia (serum sodium <120 mEq/L).
This study is limited by its post-hoc identification and classification of patients using ICD-9-CM codes, which could have resulted in some misclassification. Also, this study includes only two teaching hospitals in an urban setting; the prevalence of hyponatremia might differ in other settings. Causality cannot be determined based on these results.
Bottom line: Hospitalized patients with hyponatremia have increased in-hospital and long-term mortality.
Citation: Waikar SS, Mount DB, Curhan GC. Mortality after hospitalization with mild, moderate, and severe hyponatremia. Am J Med. 2009;122(9):857-865.
Clopidogrel Plus Aspirin in Patients with Atrial Fibrillation Reduces Risk of Major Vascular Events
Clinical question: Does the addition of clopidogrel to aspirin therapy reduce the risk of major vascular events in patients with atrial fibrillation for whom vitamin K antagonists (VKAs) are unsuitable?
Background: Although VKAs reduce the risk of stroke in atrial fibrillation, many patients are unable to use VKAs and are treated with aspirin instead. The potential benefits of adding clopidogrel to aspirin therapy in this population are unknown.
Study design: Randomized controlled trial.
Setting: Five hundred eighty medical centers in 33 countries.
Synopsis: More than 7,500 patients with atrial fibrillation who were also at high risk for stroke were randomly assigned to receive either clopidogrel or placebo once daily. All patients also received aspirin at a dose of 75 mg to 100 mg daily. A major vascular event occurred in 6.8% of patients per year who received clopidogrel and in 7.6% of patients per year who received placebo (RR 0.89, 95% CI, 0.89-0.98, P=0.01). This reduction primarily was due to a reduction in stroke, which occurred in 2.4% of patients per year who received clopidogrel, compared with 3.3% of patients per year who received placebo (RR 0.72, 95% CI, 0.62-0.83, P<0.001).
Major bleeding occurred in 2% of patients per year who received clopidogrel and in 1.3% of patients per year who received placebo (RR 1.57, 95% CI, 1.29-1.92, P<0.001).
Bottom line: Adding clopidogrel to aspirin in patients with atrial fibrillation who are not eligible for VKAs decreases the risk of major vascular events, including stroke, but increases risk of major hemorrhage compared with aspirin alone.
Citation: ACTIVE Investigators, Connolly SJ, Pogue J, et al. Effect of clopidogrel added to aspirin in patients with atrial fibrillation. N Engl J Med. 2009;360(20):2066-2078.
Prioritize Syncope Testing by Diagnostic Yield and Cost Effectiveness
Clinical question: What are the utilization, yield, and cost effectiveness of tests used for evaluation of syncope in older patients?
Background: Clinicians utilize multiple diagnostic tests to help delineate the cause of syncope, but the yield and cost effectiveness of many of these tests are unclear. Further, it is unknown if considering patient characteristics, as in the San Francisco syncope rule (SFSR), can improve the yield of diagnostic tests.
Study design: Retrospective cohort.
Setting: Single acute-care hospital.
Synopsis: Review of 2,106 admissions in patients 65 and older with syncope revealed that the most common tests were electrocardiogram (99%), telemetry (95%), cardiac enzymes (95%), and head computed tomography (CT) scan (63%). The majority of tests did not affect diagnosis or management.
Postural blood pressure (BP) reading was infrequently recorded (38%) but had the highest yield. BP influenced diagnosis at least 18% of the time and management at least 25% of the time. Tests with the lowest likelihood of affecting diagnosis and management were head CT, carotid ultrasound, electroencephalography (EEG), and cardiac enzymes.
EEG had the highest cost per test affecting the diagnosis or management ($32,973), followed by head CT. The cost per test affecting diagnosis or management for postural BP was $17. Cardiac testing, including telemetry, echocardiogram, and cardiac enzymes, had significantly better yield in patients who met SFSR criteria.
Bottom line: In patients with syncope, the history and exam should guide evaluation, and tests with high yield and low cost per test, such as postural BP, should be prioritized.
Citation: Mendu ML, McAvay G, Lampert R, Stoehr J, Tinetti ME. Yield of diagnostic tests in evaluating syncopal episodes in older patients. Arch Intern Med. 2009;169(14): 1299-1305.
Early PCI is Superior to Delayed Intervention in Patients with STEMI Receiving Fibrinolytic Therapy
Clinical question: Does early percutaneous coronary intervention (PCI) improve clinical outcomes compared with standard management in patients with ST elevation myocardial infarction (STEMI) who receive fibrinolysis?
Background: Prior research has demonstrated the benefit of timely PCI in the management of acute coronary syndrome, specifically with ST elevation. However, many hospitals do not have this capability and utilize fibrinolysis as a standard alternative. The optimal timing of subsequent invasive intervention following fibrinolysis has not been established.
Study design: Multicenter randomized trial.
Setting: Fifty-two sites in three provinces in Canada.
Synopsis: This study randomized 1,059 patients presenting with STEMI and receiving fibrinolysis to early intervention (immediate transfer to another hospital with PCI less than six hours after fibrinolysis) versus standard intervention (rescue PCI if needed, or delayed angiography at more than 24 hours). The primary outcome was the composite of death, reinfarction, recurrent ischemia, new or worsening congestive heart failure, or cardiogenic shock within 30 days.
The primary outcome occurred in 11% of patients in the early intervention group, compared with 17.2% of patients randomized to standard intervention (RR 0.64, 95% CI, 0.47-0.87, P=0.004). Urgent catheterization was performed within 12 hours of fibrinolysis in 34.9% of patients randomized to the standard treatment group.
This study was not powered to detect differences in mortality and other individual components of the primary endpoint.
Bottom line: STEMI patients who received fibrinolysis had a lower risk of adverse outcomes when receiving transfer and PCI within six hours, compared with standard delayed intervention.
Citation: Cantor WJ, Fitchett D, Borgundvaag B, et al. Routine early angioplasty after fibrinolysis for acute myocardial infarction. N Engl J Med. 2009;360(26):2705-2718.
Specialty Consultation and Limited Access Tests Predict Unsuccessful SSU Admissions
Clinical question: In patients admitted to short-stay units (SSUs), what characteristics are associated with unsuccessful SSU admission?
Background: Short-stay units have become prevalent in U.S. hospitals, but it is unclear which patient populations are best served by SSUs.
Study design: Prospective cohort.
Setting: Fourteen-bed SSU in a 500-bed public teaching hospital in Chicago.
Synopsis: More than 700 patients admitted to the Cook County Hospital SSU over a four-month period were interviewed and examined, and their ED and inpatient records were reviewed. An SSU admission was defined as “successful” if the length of stay (LOS) was less than 72 hours and the patient was discharged directly from the SSU.
Overall, 79% of patients had a successful SSU admission. In multivariate analysis, the strongest predictors of an unsuccessful SSU stay were subspecialty consultation (OR 8.1, P<0.001), a provisional diagnosis of heart failure (OR 1.9, P=0.02), and limited availability of a diagnostic test (OR 2.5, P<0.001).
The study was limited primarily to patients with cardiovascular diagnoses.
Bottom line: Patients admitted to SSUs who receive specialty consultation, carry a diagnosis of heart failure, or require diagnostic testing that is not readily available might have a longer LOS or eventual inpatient admission.
Citation: Lucas BP, Kumapley R, Mba B, et al. A hospitalist-run short-stay unit: features that predict length-of-stay and eventual admission to traditional inpatient services. J Hosp Med. 2009;4(5):276-284.
Lack of Significant Gains in Survival Rates Following In-Hospital CPR
Clinical question: Is survival after in-hospital CPR improving over time, and what are the factors associated with survival?
Background: Advances in out-of-hospital CPR have improved outcomes. However, it is unknown whether the survival rate after in-hospital CPR is improving over time, and it is unclear which patient and/or hospital characteristics predict post-CPR survival.
Study design: Retrospective cohort.
Setting: Inpatient Medicare beneficiaries from 1992 to 2005.
Synopsis: The study examined more than 150 million Medicare admissions, 433,985 of which underwent in-hospital CPR. Survival to discharge occurred in 18.3% of CPR events and did not change significantly from 1992 to 2005. The cumulative incidence of in-hospital CPR events was 2.73 per 1,000 admissions; it did not change substantially over time.
The survival rate was lower among black patients (OR 0.76, 95% CI, 0.74-0.79), which is partially explained due to the fact they tended to receive CPR at hospitals with lower post-CPR survival. Gender (specifically male), older age, race (specifically other nonwhite patients), higher burden of chronic illness, and admission from a skilled nursing facility were significantly associated with decreased survival to hospital discharge following CPR.
Limitations of this study included the identification of CPR by ICD-9 codes, which have not been validated for this purpose and could vary among hospitals. Other factors that might explain variations in survival were not available, including severity of acute illness and the presence (or absence) of a shockable rhythm at initial presentation.
Bottom line: Rates of survival to hospital discharge among Medicare beneficiaries receiving in-hospital CPR have remained constant over time, with poorer survival rates among blacks and other nonwhite patients.
Citation: Ehlenbach WJ, Barnato AE, Curtis JR, et al. Epidemiologic study of in-hospital cardiopulmonary resuscitation in the elderly. N Engl J Med. 2009;361(1):22-31.
Hospitalists Are Associated with Improved Performance on Quality Metrics
Clinical question: Is the presence of hospitalist physicians associated with improved performance on standard quality measures for acute myocardial infarction (AMI), congestive heart failure (CHF), and pneumonia?
Background: Previous investigations have demonstrated significant improvements in cost and LOS for patients under the care of hospitalists compared with other inpatient providers. The association between hospitalist prevalence and quality of care, as measured by standard quality process measures, is unknown.
Study design: Cross-sectional.
Setting: More than 3,600 hospitals participating in the Health Quality Alliance (HQA) program.
Synopsis: Investigators looked at a large sample of HQA hospitals in the American Hospital Association survey, and identified facilities with hospitalist services and those without. The primary endpoint was the adherence to composites of standard quality process measures across three disease categories (AMI, CHF, and pneumonia) and two domains of care (disease treatment/diagnosis and counseling/prevention).
Multivariable analyses revealed a statistically significant association between the presence of hospitalists and adherence to composite quality measures for AMI and pneumonia. This association was demonstrated for both treatment and counseling domains.
The study is cross-sectional, so conclusions cannot be drawn about causality. Also, there are likely unmeasured differences between hospitals that utilize hospitalists compared with those that do not, which could further confound the relationship between the presence of hospitalists and adherence to quality measures.
Finally, this study only evaluated hospital-level performance, and it cannot offer insight on the quality of individual patient care by hospitalist providers.
Bottom line: The presence of hospitalists is associated with improvement in adherence to quality measures for both AMI and pneumonia, and across clinical domains of treatment and counseling.
Citation: López L, Hicks LS, Cohen AP, McKean S, Weissman JS. Hospitalists and the quality of care in hospitals. Arch Intern Med. 2009;169(15):1389-1394. TH
PEDIATRIC HM LITerature
Inpatient Curriculum Implicit, but Aligns with ACGME Competencies
By Mark Shen, MD
Clinical question: Does implicit resident learning on an inpatient unit correspond to the explicit Accreditation Council for Graduate Medical Education (ACGME) competencies?
Background: The ACGME competency-based model of education places an emphasis on task-oriented ability as a translation of skills and knowledge. Although it is recognized that most learning occurs through the process of daily patient care, it is unclear how much learning is explicit and linked to ACGME competencies, as defined in the goals and objectives of an inpatient rotation.
Study design: Qualitative, ethnographic case study.
Setting: One general pediatric floor in a large, urban pediatric hospital.
Synopsis: Over an eight-month period, one researcher directly observed and asked questions of inpatient teams as they worked on a general pediatric service. There was a particular emphasis on morning rounds. Data coding was completed in an iterative manner, and both data and method triangulation were used to enhance trustworthiness.
Curricular convergence occurred and was most obvious in the patient-care domain; however, the explicit curriculum was not formally referred to during the study period. The implicit curriculum was ill-structured and unpredictable, typically dictated by the patients’ socioclinical environment.
The primary limitations of this work are the focus on one service on one hospital floor, and that the study authors were former trainees or employees of that institution. This institution-specific bias, however, might be gauged by the degree to which the themes in this research will resonate with clinician-educators who read this article. Given the increasing time constraints on explicit inpatient didactic teaching, the vignettes and conclusions within this report are likely to find many a sympathetic ear. Illumination of the hidden curriculum could further support learner-centered education.
Bottom line: The inpatient service is a fertile and primarily implicit training ground for the ACGME competencies.
Citation: Balmer DF, Master CL, Richards B, Giardino AP. Implicit versus explicit curricula in general pediatrics education: is there a convergence? Pediatrics. 2009;124(2):e347-354.
Recommendations for Hospitalist Handoffs
Handoffs during hospitalization from one provider to another represent critical transition points in patient care.1 In‐hospital handoffs are a frequent occurrence, with 1 teaching hospital reporting 4000 handoffs daily for a total of 1.6 million per year.2
Incomplete or poor‐quality handoffs have been implicated as a source of adverse events and near misses in hospitalized patients.35 Standardizing the handoff process may improve patient safety during care transitions.6 In 2006, the Joint Commission issued a National Patient Safety Goal that requires care providers to adopt a standardized approach for handoff communications, including an opportunity to ask and respond to questions about a patient's care.7 The reductions in resident work hours by the Accreditation Council for Graduate Medical Education (ACGME) has also resulted in a greater number and greater scrutiny of handoffs in teaching hospitals.8, 9
In response to these issues, and because handoffs are a core competency for hospitalists, the Society of Hospital Medicine (SHM)convened a task force.10 Our goal was to develop a set of recommendations for handoffs that would be applicable in both community and academic settings; among physicians (hospitalists, internists, subspecialists, residents), nurse practitioners, and physicians assistants; and across roles including serving as the primary provider of hospital care, comanager, or consultant. This work focuses on handoffs that occur at shift change and service change.11 Shift changes are transitions of care between an outgoing provider and an incoming provider that occur at the end of the outgoing provider's continuous on‐duty period. Service changesa special type of shift changeare transitions of care between an outgoing provider and an incoming provider that occur when an outgoing provider is leaving a rotation or period of consecutive daily care for patients on the same service.
For this initiative, transfers of care in which the patient is moving from one patient area to another (eg, Emergency Department to inpatient floor, or floor to intensive care unit [ICU]) were excluded since they likely require unique consideration given their cross‐disciplinary and multispecialty nature. Likewise, transitions of care at hospital admission and discharge were also excluded because recommendations for discharge are already summarized in 2 complementary reports.12, 13
To develop recommendations for handoffs at routine shift change and service changes, the Handoff Task Force performed a systematic review of the literature to develop initial recommendations, obtained feedback from hospital‐based clinicians in addition to a panel of handoff experts, and finalized handoff recommendations, as well as a proposed research agenda, for the SHM.
Methods
The SHM Healthcare Quality and Patient Safety (HQPS) Committee convened the Handoff Task Force, which was comprised of 6 geographically diverse, predominantly academic hospitalists with backgrounds in education, patient safety, health communication, evidence‐based medicine, and handoffs. The Task Force then engaged a panel of 4 content experts selected for their work on handoffs in the fields of nursing, information technology, human factors engineering, and hospital medicine. Similar to clinical guideline development by professional societies, the Task Force used a combination of evidence‐based review and expert opinions to propose recommendations.
Literature Review
A PubMed search was performed for English language articles published from January 1975 to January 2007, using the following keywords: handover or handoff or hand‐off or shift change or signout or sign‐out. Articles were eligible if they presented results from a controlled intervention to improve handoffs at shift change or service change, by any health profession. Articles that appeared potentially relevant based on their title were retrieved for full‐text review and included if deemed eligible by at least 2 reviewers. Additional studies were obtained through the Agency for Healthcare Research and Quality (AHRQ) Patient Safety Network,14 using the category Safety target and subcategory Discontinuities, gaps, and hand‐off problems. Finally, the expert panel reviewed the results of the literature review and suggested additional articles.
Eligible studies were abstracted by individual members of the Handoff Task Force using a structured form (Appendix Figure 1), and abstractions were verified by a second member. Handoff‐related outcome measures were categorized as referring to (1) patient outcomes, (2) staff outcomes, or (3) system outcomes. Because studies included those from nursing and other industries, interventions were evaluated by abstractors for their applicability to routine hospitalist handoffs. The literature review was supplemented by review of expert consensus or policy white papers that described recommendations for handoffs. The list of white papers was generated utilizing a common internet search engine (Google;
Peer and Expert Panel Review
The Task Force generated draft recommendations, which were revised through interactive discussions until consensus was achieved. These recommendations were then presented at a workshop to an audience of approximately 300 hospitalists, case managers, nurses, and pharmacists at the 2007 SHM Annual Meeting.
During the workshop, participants were asked to cast up to 3 votes for recommendations that should be removed. Those recommendations that received more than 20 votes for removal were then discussed. Participants also had the opportunity to anonymously suggest new recommendations or revisions using index cards, which were reviewed by 2 workshop faculty, assembled into themes, and immediately presented to the group. Through group discussion of prevalent themes, additional recommendations were developed.
Four content experts were then asked to review a draft paper that summarized the literature review, discussion at the SHM meeting, and handoff recommendations. Their input regarding the process, potential gaps in the literature, and additional items of relevance, was incorporated into this final manuscript.
Final Review by SHM Board and Rating each Recommendation
A working paper was reviewed and approved by the Board of the SHM in early January 2008. With Board input, the Task Force adopted the American College of Cardiology/American Heart Association (ACC/AHA) framework to rate each recommendation because of its appropriateness, ease of use, and familiarity to hospital‐based physicians.15 Recommendations are rated as Class I (effective), IIa (conflicting findings but weight of evidence supports use), IIb (conflicting findings but weight of evidence does not support use), or III (not effective). The Level of Evidence behind each recommendation is graded as A (from multiple large randomized controlled trials), B (from smaller or limited randomized trials, or nonrandomized studies), or C (based primarily on expert consensus). A recommendation with Level of Evidence B or C should not imply that the recommendation is not supported.15
Results
Literature Review
Of the 374 articles identified by the electronic search of PubMed and the AHRQ Patient Safety Network, 109 were retrieved for detailed review, and 10 of these met the criteria for inclusion (Figure 1). Of these studies, 3 were derived from nursing literature and the remaining were tests of technology solutions or structured templates (Table 1).1618, 20, 22, 3842 No studies examined hospitalist handoffs. All eligible studies concerned shift change. There were no studies of service change. Only 1 study was a randomized controlled trial; the rest were pre‐post studies with historical controls or a controlled simulation. All reports were single‐site studies. Most outcomes were staff‐related or system‐related, with only 2 studies using patient outcomes.
| Author (Year) | Study Design | Intervention | Setting and Study Population | Target | Outcomes |
|---|---|---|---|---|---|
| |||||
| Nursing | |||||
| Kelly22 (2005) | Pre‐post | Change to walk‐round handover (at bedside) from baseline (control) | 12‐bed rehab unit with 18 nurses and 10 patients | Staff, patient | 11/18 nurses felt more or much more informed and involved; 8/10 patients felt more involved |
| Pothier et al.20 (2005) | Controlled simulation | Compared pure verbal to verbal with note‐taking to verbal plus typed content | Handover of 12 simulated patients over 5 cycles | System (data loss) | Minimal data loss with typed content, compared to 31% data retained with note‐taking, and no data retained with verbal only |
| Wallum38 (1995) | Pre‐post | Change from oral handover (baseline) to written template read with exchange | 20 nurses in a geriatric dementia ward | Staff | 83% of nurses felt care plans followed better; 88% knew care plans better |
| Technology or structured template | |||||
| Cheah et al.39 (2005) | Pre‐post | Electronic template with free‐text entry compared to baseline | 14 UK Surgery residents | Staff | 100% (14) of residents rated electronic system as desirable, but 7 (50%) reported that information was not updated |
| Lee et al.40 (1996) | Pre‐post | Standardized signout card for interns to transmit information during handoffs compared to handwritten (baseline) | Inpatient cardiology service at IM residency program in Minnesota with 19 new interns over a 3‐month period | Staff | Intervention interns (n = 10) reported poor sign‐out less often than controls (n = 9) [intervention 8 nights (5.8%) vs. control 17 nights (14.9%); P = 0.016] |
| Kannry and Moore18 (1999) | Pre‐post | Compared web‐based signout program to usual system (baseline) | An academic teaching hospital in New York (34 patients admitted in 1997; 40 patients admitted in 1998) | System | Improved provider identification (86% web signout vs. 57% hospital census) |
| Petersen et al.17 (1998) | Pre‐post | 4 months of computerized signouts compared to baseline period (control) | 3747 patients admitted to the medical service at an academic teaching hospital | Patient | Preventable adverse events (ADE) decreased (1.7% to 1.2%, P < 0.10); risk of cross‐cover physician for ADE eliminated |
| Ram and Block41 (1993) | Pre‐post | Compared handwritten (baseline) to computer‐generated | Family medicine residents at 2 academic teaching hospitals [Buffalo (n = 16) and Pittsburgh (n = 16)] | Staff | Higher satisfaction after electronic signout, but complaints with burden of data entry and need to keep information updated |
| Van Eaton et al.42 (2004) | Pre‐post | Use of UW Cores links sign‐out to list for rounds and IS data | 28 surgical and medical residents at 2 teaching hospitals | System | At 6 months, 66% of patients entered in system (adoption) |
| Van Eaton et al.16 (2005) | Prospective, randomized, crossover study. | Compared UW Cores* integrated system compared to usual system | 14 inpatient resident teams (6 surgery, 8 IM) at 2 teaching hospitals for 5 months | Staff, system | 50% reduction in the perceived time spent copying data [from 24% to 12% (P < 0.0001)] and number of patients missed on rounds (2.5 vs. 5 patients/team/month, P = 0.0001); improved signout quality (69.6% agree or strongly agree); and improved continuity of care (66.1% agree or strongly agree) |

Overall, the literature presented supports the use of a verbal handoff supplemented with written documentation in a structured format or technology solution. The 2 most rigorous studies were led by Van Eaton et al.16 and Petersen et al.17 and focused on evaluating technology solutions. Van Eaton et al.16 performed a randomized controlled trial of a locally created rounding template with 161 surgical residents. This template downloads certain information (lab values and recent vital signs) from the hospital system into a sign‐out sheet and allows residents to enter notes about diagnoses, allergies, medications and to‐do items. When implemented, the investigators found the number of patients missed on rounds decreased by 50%. Residents reported an increase of 40% in the amount of time available to pre‐round, due largely to not having to copy data such as vital signs. They reported a decrease in rounding time by 3 hours per week, and this was perceived as helping them meet the ACGME 80 hours work rules. Lastly, the residents reported a higher quality of sign‐outs from their peers and perceived an overall improvement in continuity of care. Petersen and colleagues implemented a computerized sign‐out (auto‐imported medications, name, room number) in an internal medicine residency to improve continuity of care during cross‐coverage and decrease adverse events.17 Prior to the intervention, the frequency of preventable adverse events was 1.7% and it was significantly associated with cross‐coverage. Preventable adverse events were identified using a confidential self‐report system that was also validated by clinician review. After the intervention, the frequency of preventable adverse events dropped to 1.2% (P < 0.1), and cross‐coverage was no longer associated with preventable adverse events. In other studies, technological solutions also improved provider identification and staff communication.18, 19 Together, these technology‐based intervention studies suggest that a computerized sign‐out with auto‐imported fields has the ability to improve physician efficiency and also improve inpatient care (reduction in number of patients missed on rounds, decrease in preventable adverse events).
Studies from nursing demonstrated that supplementing a verbal exchange with written information improved transfer of information, compared to verbal exchange alone.20 One of these studies rated the transfer of information using videotaped simulated handoff cases.21 Last, 1 nursing study that more directly involved patients in the handoff process resulted in improved nursing knowledge and greater patient empowerment (Table 1).22
White papers or consensus statements originated from international and national consortia in patient safety including the Australian Council for Safety and Quality in Healthcare,23 the Junior Doctors Committee of the British Medical Association,24 University Health Consortium,25 the Department of Defense Patient Safety Program,26 and The Joint Commission.27 Several common themes were prevalent in all white papers. First, there exists a need to train new personnel on how to perform an effective handoff. Second, efforts should be undertaken to ensure adequate time for handoffs and reduce interruptions during handoffs. Third, several of the papers supported verbal exchange that facilitates interactive questioning, focuses on ill patients, and delineates actions to be taken. Lastly, content should be updated to ensure transfer of the latest clinical information.
Peer Review at SHM Meeting of Preliminary Handoff Recommendations
In the presentation of preliminary handoff recommendations to over 300 attendees at the SHM Annual Meeting in 2007, 2 recommendations were supported unanimously: (1) a formal recognized handoff plan should be instituted at end of shift or change in service; and (2) ill patients should be given priority during verbal exchange.
During the workshop, discussion focused on three recommendations of concern, or those that received greater than 20 negative votes by participants. The proposed recommendation that raised the most objections (48 negative votes) was that interruptions be limited. Audience members expressed that it was hard to expect that interruptions would be limited given the busy workplace in the absence of endorsing a separate room and time. This recommendation was ultimately deleted.
The 2 other debated recommendations, which were retained after discussion, were ensuring adequate time for handoffs and using an interactive process during verbal communication. Several attendees stated that ensuring adequate time for handoffs may be difficult without setting a specific time. Others questioned the need for interactive verbal communication, and endorsed leaving a handoff by voicemail with a phone number or pager to answer questions. However, this type of asynchronous communication (senders and receivers not present at the same time) was not desirable or consistent with the Joint Commission's National Patient Safety Goal.
Two new recommendations were proposed from anonymous input and incorporated in the final recommendations, including (a) all patients should be on the sign‐out, and (b) sign‐outs should be accessible from a centralized location. Another recommendation proposed at the Annual Meeting was to institute feedback for poor sign‐outs, but this was not added to the final recommendations after discussion at the meeting and with content experts about the difficulty of maintaining anonymity in small hospitalist groups. Nevertheless, this should not preclude informal feedback among practitioners.
Anonymous commentary also yielded several major themes regarding handoff improvements and areas of uncertainty that merit future work. Several hospitalists described the need to delineate specific content domains for handoffs including, for example, code status, allergies, discharge plan, and parental contact information in the case of pediatric care. However, due to the variability in hospitalist programs and health systems and the general lack of evidence in this area, the Task Force opted to avoid recommending specific content domains which may have limited applicability in certain settings and little support from the literature. Several questions were raised regarding the legal status of written sign‐outs, and whether sign‐outs, especially those that are web‐based, are compliant with the Healthcare Information Portability and Accountability Act (HIPAA). Hospitalists also questioned the appropriate number of patients to be handed off safely. Promoting efficient technology solutions that reduce documentation burden, such as linking the most current progress note to the sign‐out, was also proposed. Concerns were also raised about promoting safe handoffs when using moonlighting or rotating physicians, who may be less invested in the continuity of the patients' overall care.
Expert Panel Review
The final version of the Task Force recommendations incorporates feedback provided by the expert panel. In particular, the expert panel favored the use of the term, recommendations, rather than standards, minimum acceptable practices, or best practices. While the distinction may appear semantic, the Task Force and expert panel acknowledge that the current state of scientific knowledge regarding hospital handoffs is limited. Although an evidence‐based process informed the development of these recommendations, they are not a legal standard for practice. Additional research may allow for refinement of recommendations and development of more formal handoff standards.
The expert panel also highlighted the need to provide tools to hospitalist programs to facilitate the adoption of these recommendations. For example, recommendations for content exchange are difficult to adopt if groups do not already use a written template. The panel also commented on the need to consider the possible consequences if efforts are undertaken to include handoff documents (whether paper or electronic) as part of the medical record. While formalizing handoff documents may raise their quality, it is also possible that handoff documents become less helpful by either excluding the most candid impression regarding a patient's status or by encouraging hospitalists to provide too much detail. Privacy and confidentiality of paper‐based systems, in particular, were also questioned.
Additional Recommendations for Service Change
Patient handoffs during a change of service are a routine part of hospitalist care. Since service change is a type of shift change, the handoff recommendations for shift change do apply. Unlike shift change, service changes involve a more significant transfer of responsibility. Therefore, the Task Force recommends also that the incoming hospitalist be readily identified in the medical record or chart as the new provider, so that relevant clinical information can be communicated to the correct physician. This program‐level recommendation can be met by an electronic or paper‐based system that correctly identifies the current primary inpatient physician.
Final Handoff Recommendations
The final handoff recommendations are shown in Figure 2. The recommendations were designed to be consistent with the overall finding of the literature review, which supports the use of a verbal handoff supplemented with written documentation or a technological solution in a structured format. With the exception of 1 recommendation that is specific to service changes, all recommendations are designed to refer to shift changes and service changes. One overarching recommendation refers to the need for a formally recognized handoff plan at a shift change or change of service. The remaining 12 recommendations are divided into 4 that refer to hospitalist groups or programs, 3 that refer to verbal exchange, and 5 that refer to content exchange. The distinction is an important one because program‐level recommendations require organizational support and buy‐in to promote clinician participation and adherence. The 4 program recommendations also form the necessary framework for the remaining recommendations. For example, the second program recommendation describes the need for a standardized template or technology solution for accessing and recording patient information during the handoff. After a program adopts such a mechanism for exchanging patient information, the specific details for use and maintenance are outlined in greater detail in content exchange recommendations.
Because of the limited trials of handoff strategies, none of the recommendations are supported with level of evidence A (multiple numerous randomized controlled trials). In fact, with the exception of using a template or technology solution which was supported with level of evidence B, all handoff recommendations were supported with C level of evidence. The recommendations, however, were rated as Class I (effective) because there were no conflicting expert opinions or studies (Figure 2).
Discussion
In summary, our review of the literature supports the use of face‐to‐face verbal handoffs that are aided by the use of structured template to guide exchange of information. Furthermore, the development of these recommendations is the first effort of its kind for hospitalist handoffs and a movement towards standardizing the handoff process. While these recommendations are meant to provide structure to the hospitalist handoff process, the use and implementation by individual hospitalist programs may require more specific detail than these recommendations provide. Local modifications can allow for improved acceptance and adoption by practicing hospitalists. These recommendations can also help guide teaching efforts for academic hospitalists who are responsible for supervising residents.
The limitations of these recommendations related to lack of evidence in this field. Studies suffered from small size, poor description of methods, and a paucity of controlled interventions. The described technology solutions are not standardized or commercially available. Only 1 study included patient outcomes.28 There are no multicenter studies, studies of hospitalist handoffs, or studies to guide inclusion of specific content. Randomized controlled trials, interrupted time series analyses, and other rigorous study designs are needed in both teaching and non‐teaching settings to evaluate these recommendations and other approaches to improving handoffs. Ideally, these studies would occur through multicenter collaboratives and with human factors researchers familiar with mixed methods approaches to evaluate how and why interventions work.29 Efforts should focus on developing surrogate measures that are sensitive to handoff quality and related to important patient outcomes. The results of future studies should be used to refine the present recommendations. Locating new literature could be facilitated through the introduction of Medical Subject Heading for the term handoff by the National Library of Medicine. After completing this systematic review and developing the handoff recommendations described here, a few other noteworthy articles have been published on this topic, to which we refer interested readers. Several of these studies demonstrate that standardizing content and process during medical or surgical intern sign‐out improves resident confidence with handoffs,30 resident perceptions of accuracy and completeness of signout,31 and perceptions of patient safety.32 Another prospective audiotape study of 12 days of resident signout of clinical information demonstrated that poor quality oral sign‐outs was associated with an increased risk of post‐call resident reported signout‐related problems.5 Lastly, 1 nursing study demonstrated improved staff reports of safety, efficiency, and teamwork after a change from verbal reporting in an isolated room to bedside handover.33 Overall, these additional studies continue to support the current recommendations presented in this paper and do not significantly impact the conclusions of our literature review.
While lacking specific content domain recommendations, this report can be used as a starting point to guide development of self and peer assessment of hospitalist handoff quality. Development and validation of such assessments is especially important and can be incorporated into efforts to certify hospitalists through the recently approved certificate of focused practice in hospital medicine by the American Board of Internal Medicine (ABIM). Initiatives by several related organizations may help guide these effortsThe Joint Commission, the ABIM's Stepping Up to the Plate (SUTTP) Alliance, the Institute for Healthcare Improvement, the Information Transfer and Communication Practices (ITCP) Project for surgical care transitions, and the Hospital at Night (H@N) Program sponsored by the United Kingdom's National Health Service.3437 Professional medical organizations can also serve as powerful mediators of change in this area, not only by raising the visibility of handoffs, but also by mobilizing research funding. Patients and their caregivers may also play an important role in increasing awareness and education in this area. Future efforts should target handoffs not addressed in this initiative, such as transfers from emergency departments to inpatient care units, or between ICUs and the medical floor.
Conclusion
With the growth of hospital medicine and the increased acuity of inpatients, improving handoffs becomes an important part of ensuring patient safety. The goal of the SHM Handoffs Task Force was to begin to standardize handoffs at change of shift and change of servicea fundamental activity of hospitalists. These recommendations build on the limited literature in surgery, nursing, and medical informatics and provide a starting point for promoting safe and seamless in‐hospital handoffs for practitioners of Hospital Medicine.
Acknowledgements
The authors also acknowledge Tina Budnitz and the Healthcare Quality and Safety Committee of the Society of Hospital Medicine. Last, they are indebted to the staff support provided by Shannon Roach from the Society of Hospital Medicine.
- ,,,.Lost in translation: challenges and opportunities in physician‐to‐physician communication during patient handoffs.Acad Med.2005;80(12):1094–1099.
- ... AHRQ WebM167(19):2030–2036.
- ,,,,.Communication failures in patient signout and suggestions for improvement: a critical incident analysis.Qual Saf Health Care.2005;14:401–407.
- ,,,,.Consequences of inadequate sign‐out for patient care.Arch Intern Med.2008;168(16):1755–1760.
- ,,, et al.Handoff strategies in settings with high consequences for failure: lessons for health care operations.Int J Qual Health Care.2004;16:125–132.
- Joint Commission. 2006 Critical Access Hospital and Hospital National Patient Safety Goals. Available at: http://www.jointcommission.org/PatientSafety/NationalPatientSafetyGoals/06_npsg_cah.htm. Accessed June2009.
- ,,,.Transfers of patient care between house staff on internal medicine wards: a national survey.Arch Intern Med.2006;166(11):1173–1177.
- ,.Re‐framing continuity of care for this century.Qual Saf Health Care.2005;14(6):394–396.
- ,,,,.Core competencies in hospital medicine: development and methodology.J Hosp Med.2006;1(suppl 1):48–56.
- ,,, et al.Managing discontinuity in academic medical centers: strategies for a safe and effective resident sign‐out.J Hosp Med.2006;1(4):257–266.
- ,,, et al.Deficits in communication and information transfer between hospital‐based and primary‐care physicians: implications for patient safety and continuity of care.JAMA.2007;297(8):831–841.
- ,,, et al.Transition of care for hospitalized elderly patients: development of a discharge checklist for hospitalists.J Hosp Med.2006;1(6):354–360.
- Discontinuities, Gaps, and Hand‐Off Problems. AHRQ PSNet Patient Safety Network. Available at: http://www.psnet.ahrq.gov/content.aspx?taxonomyID=412. Accessed June2009.
- Manual for ACC/AHA Guideline Writing Committees. Methodologies and Policies from the ACC/AHA Task Force on Practice Guidelines. Available at: http://circ.ahajournals.org/manual/manual_IIstep6.shtml. Accessed June2009.
- ,,,,.A randomized, controlled trial evaluating the impact of a computerized rounding and sign‐out system on continuity of care and resident work hours.J Am Coll Surg.2005;200(4):538–545.
- ,,,,.Using a computerized sign‐out program to improve continuity of inpatient care and prevent adverse events.Jt Comm J Qual Improv.1998;24(2):77–87.
- ,.MediSign: using a web‐based SignOut System to improve provider identification.Proc AMIA Symp.1999:550–554.
- ,.Using a computerized sign‐out system to improve physician‐nurse communication.Jt Comm J Qual Patient Saf.2006;32(1):32–36.
- ,,,.Pilot study to show the loss of important data in nursing handover.Br J Nurs.2005;14(20):1090–1093.
- .Using care plans to replace the handover.Nurs Stand.1995;9(32):24–26.
- .Change from an office‐based to a walk‐around handover system.Nurs Times.2005;101(10):34–35.
- Clinical Handover and Patient Safety. Literature review report. Australian Council for Safety and Quality in Health Care. Available at: http://www.health.gov.au/internet/safety/publishing.nsf/Content/AA1369AD4AC5FC2ACA2571BF0081CD95/$File/clinhovrlitrev.pdf. Accessed June2009.
- Safe Handover: Safe Patients. Guidance on clinical handover for clinicians and managers. Junior Doctors Committee, British Medical Association. Available at: http://www.bma.org.uk/ap.nsf/AttachmentsByTitle/PDFsafehandover/$FILE/safehandover.pdf. Accessed June2009.
- University HealthSystem Consortium (UHC).UHC Best Practice Recommendation: Patient Hand Off Communication White Paper, May 2006.Oak Brook, IL:University HealthSystem Consortium;2006.
- Healthcare Communications Toolkit to Improve Transitions in Care. Department of Defense Patient Safety Program. Available at: http://dodpatientsafety.usuhs.mil/files/Handoff_Toolkit.pdf. Accessed June2009.
- Joint Commission on Accreditation of Healthcare Organizations. Joint Commission announces 2006 national patient safety goals for ambulatory care and office‐based surgery organizations. Available at: http://www.jcaho.org/news+room/news+release+archives/06_npsg_amb_obs.htm. Accessed June2009.
- ,,,,.Does housestaff discontinuity of care increase the risk for preventable adverse events?Ann Intern Med.1994;121(11):866–872.
- .Communication strategies from high‐reliability organizations: translation is hard work.Ann Surg.2007;245(2):170–172.
- ,,, et al.A structured handoff program for interns.Acad Med.2009;84(3):347–352.
- ,,, et al.Simple standardized patient handoff system that increases accuracy and completeness.J Surg Educ.2008;65(6):476–485.
- ,,.Standardized sign‐out reduces intern perception of medical errors on the general internal medicine ward.Teach Learn Med.2009;21(2):121–126.
- ,,,,,.Bedside handover: quality improvement strategy to “transform care at the bedside”.J Nurs Care Qual.2009;24(2):136–142.
- Pillow M, ed.Improving Handoff Communications.Chicago:Joint Commission Resources;2007.
- American Board of Internal Medicine Foundation. Step Up To The Plate. Available at: http://www.abimfoundation.org/quality/suttp.shtm. Accessed June2009.
- ,,, et al.Surgeon information transfer and communication: factors affecting quality and efficiency of inpatient care.Ann Surg.2007;245(2):159–169.
- Hospital at Night. Available at: http://www.healthcareworkforce.nhs.uk/hospitalatnight.html. Accessed June2009.
- .Using care plans to replace the handover.Nurs Stand.1995;9(32):24–26.
- ,,,.Electronic medical handover: towards safer medical care.Med J Aust.2005;183(7):369–372.
- ,,.Utility of a standardized sign‐out card for new medical interns.J Gen Intern Med.1996;11(12):753–755.
- ,.Signing out patients for off‐hours coverage: comparison of manual and computer‐aided methods.Proc Annu Symp Comput Appl Med Care.1992:114–118.
- ,,,.Organizing the transfer of patient care information: the development of a computerized resident sign‐out system.Surgery.2004;136(1):5–13.
Handoffs during hospitalization from one provider to another represent critical transition points in patient care.1 In‐hospital handoffs are a frequent occurrence, with 1 teaching hospital reporting 4000 handoffs daily for a total of 1.6 million per year.2
Incomplete or poor‐quality handoffs have been implicated as a source of adverse events and near misses in hospitalized patients.35 Standardizing the handoff process may improve patient safety during care transitions.6 In 2006, the Joint Commission issued a National Patient Safety Goal that requires care providers to adopt a standardized approach for handoff communications, including an opportunity to ask and respond to questions about a patient's care.7 The reductions in resident work hours by the Accreditation Council for Graduate Medical Education (ACGME) has also resulted in a greater number and greater scrutiny of handoffs in teaching hospitals.8, 9
In response to these issues, and because handoffs are a core competency for hospitalists, the Society of Hospital Medicine (SHM)convened a task force.10 Our goal was to develop a set of recommendations for handoffs that would be applicable in both community and academic settings; among physicians (hospitalists, internists, subspecialists, residents), nurse practitioners, and physicians assistants; and across roles including serving as the primary provider of hospital care, comanager, or consultant. This work focuses on handoffs that occur at shift change and service change.11 Shift changes are transitions of care between an outgoing provider and an incoming provider that occur at the end of the outgoing provider's continuous on‐duty period. Service changesa special type of shift changeare transitions of care between an outgoing provider and an incoming provider that occur when an outgoing provider is leaving a rotation or period of consecutive daily care for patients on the same service.
For this initiative, transfers of care in which the patient is moving from one patient area to another (eg, Emergency Department to inpatient floor, or floor to intensive care unit [ICU]) were excluded since they likely require unique consideration given their cross‐disciplinary and multispecialty nature. Likewise, transitions of care at hospital admission and discharge were also excluded because recommendations for discharge are already summarized in 2 complementary reports.12, 13
To develop recommendations for handoffs at routine shift change and service changes, the Handoff Task Force performed a systematic review of the literature to develop initial recommendations, obtained feedback from hospital‐based clinicians in addition to a panel of handoff experts, and finalized handoff recommendations, as well as a proposed research agenda, for the SHM.
Methods
The SHM Healthcare Quality and Patient Safety (HQPS) Committee convened the Handoff Task Force, which was comprised of 6 geographically diverse, predominantly academic hospitalists with backgrounds in education, patient safety, health communication, evidence‐based medicine, and handoffs. The Task Force then engaged a panel of 4 content experts selected for their work on handoffs in the fields of nursing, information technology, human factors engineering, and hospital medicine. Similar to clinical guideline development by professional societies, the Task Force used a combination of evidence‐based review and expert opinions to propose recommendations.
Literature Review
A PubMed search was performed for English language articles published from January 1975 to January 2007, using the following keywords: handover or handoff or hand‐off or shift change or signout or sign‐out. Articles were eligible if they presented results from a controlled intervention to improve handoffs at shift change or service change, by any health profession. Articles that appeared potentially relevant based on their title were retrieved for full‐text review and included if deemed eligible by at least 2 reviewers. Additional studies were obtained through the Agency for Healthcare Research and Quality (AHRQ) Patient Safety Network,14 using the category Safety target and subcategory Discontinuities, gaps, and hand‐off problems. Finally, the expert panel reviewed the results of the literature review and suggested additional articles.
Eligible studies were abstracted by individual members of the Handoff Task Force using a structured form (Appendix Figure 1), and abstractions were verified by a second member. Handoff‐related outcome measures were categorized as referring to (1) patient outcomes, (2) staff outcomes, or (3) system outcomes. Because studies included those from nursing and other industries, interventions were evaluated by abstractors for their applicability to routine hospitalist handoffs. The literature review was supplemented by review of expert consensus or policy white papers that described recommendations for handoffs. The list of white papers was generated utilizing a common internet search engine (Google;
Peer and Expert Panel Review
The Task Force generated draft recommendations, which were revised through interactive discussions until consensus was achieved. These recommendations were then presented at a workshop to an audience of approximately 300 hospitalists, case managers, nurses, and pharmacists at the 2007 SHM Annual Meeting.
During the workshop, participants were asked to cast up to 3 votes for recommendations that should be removed. Those recommendations that received more than 20 votes for removal were then discussed. Participants also had the opportunity to anonymously suggest new recommendations or revisions using index cards, which were reviewed by 2 workshop faculty, assembled into themes, and immediately presented to the group. Through group discussion of prevalent themes, additional recommendations were developed.
Four content experts were then asked to review a draft paper that summarized the literature review, discussion at the SHM meeting, and handoff recommendations. Their input regarding the process, potential gaps in the literature, and additional items of relevance, was incorporated into this final manuscript.
Final Review by SHM Board and Rating each Recommendation
A working paper was reviewed and approved by the Board of the SHM in early January 2008. With Board input, the Task Force adopted the American College of Cardiology/American Heart Association (ACC/AHA) framework to rate each recommendation because of its appropriateness, ease of use, and familiarity to hospital‐based physicians.15 Recommendations are rated as Class I (effective), IIa (conflicting findings but weight of evidence supports use), IIb (conflicting findings but weight of evidence does not support use), or III (not effective). The Level of Evidence behind each recommendation is graded as A (from multiple large randomized controlled trials), B (from smaller or limited randomized trials, or nonrandomized studies), or C (based primarily on expert consensus). A recommendation with Level of Evidence B or C should not imply that the recommendation is not supported.15
Results
Literature Review
Of the 374 articles identified by the electronic search of PubMed and the AHRQ Patient Safety Network, 109 were retrieved for detailed review, and 10 of these met the criteria for inclusion (Figure 1). Of these studies, 3 were derived from nursing literature and the remaining were tests of technology solutions or structured templates (Table 1).1618, 20, 22, 3842 No studies examined hospitalist handoffs. All eligible studies concerned shift change. There were no studies of service change. Only 1 study was a randomized controlled trial; the rest were pre‐post studies with historical controls or a controlled simulation. All reports were single‐site studies. Most outcomes were staff‐related or system‐related, with only 2 studies using patient outcomes.
| Author (Year) | Study Design | Intervention | Setting and Study Population | Target | Outcomes |
|---|---|---|---|---|---|
| |||||
| Nursing | |||||
| Kelly22 (2005) | Pre‐post | Change to walk‐round handover (at bedside) from baseline (control) | 12‐bed rehab unit with 18 nurses and 10 patients | Staff, patient | 11/18 nurses felt more or much more informed and involved; 8/10 patients felt more involved |
| Pothier et al.20 (2005) | Controlled simulation | Compared pure verbal to verbal with note‐taking to verbal plus typed content | Handover of 12 simulated patients over 5 cycles | System (data loss) | Minimal data loss with typed content, compared to 31% data retained with note‐taking, and no data retained with verbal only |
| Wallum38 (1995) | Pre‐post | Change from oral handover (baseline) to written template read with exchange | 20 nurses in a geriatric dementia ward | Staff | 83% of nurses felt care plans followed better; 88% knew care plans better |
| Technology or structured template | |||||
| Cheah et al.39 (2005) | Pre‐post | Electronic template with free‐text entry compared to baseline | 14 UK Surgery residents | Staff | 100% (14) of residents rated electronic system as desirable, but 7 (50%) reported that information was not updated |
| Lee et al.40 (1996) | Pre‐post | Standardized signout card for interns to transmit information during handoffs compared to handwritten (baseline) | Inpatient cardiology service at IM residency program in Minnesota with 19 new interns over a 3‐month period | Staff | Intervention interns (n = 10) reported poor sign‐out less often than controls (n = 9) [intervention 8 nights (5.8%) vs. control 17 nights (14.9%); P = 0.016] |
| Kannry and Moore18 (1999) | Pre‐post | Compared web‐based signout program to usual system (baseline) | An academic teaching hospital in New York (34 patients admitted in 1997; 40 patients admitted in 1998) | System | Improved provider identification (86% web signout vs. 57% hospital census) |
| Petersen et al.17 (1998) | Pre‐post | 4 months of computerized signouts compared to baseline period (control) | 3747 patients admitted to the medical service at an academic teaching hospital | Patient | Preventable adverse events (ADE) decreased (1.7% to 1.2%, P < 0.10); risk of cross‐cover physician for ADE eliminated |
| Ram and Block41 (1993) | Pre‐post | Compared handwritten (baseline) to computer‐generated | Family medicine residents at 2 academic teaching hospitals [Buffalo (n = 16) and Pittsburgh (n = 16)] | Staff | Higher satisfaction after electronic signout, but complaints with burden of data entry and need to keep information updated |
| Van Eaton et al.42 (2004) | Pre‐post | Use of UW Cores links sign‐out to list for rounds and IS data | 28 surgical and medical residents at 2 teaching hospitals | System | At 6 months, 66% of patients entered in system (adoption) |
| Van Eaton et al.16 (2005) | Prospective, randomized, crossover study. | Compared UW Cores* integrated system compared to usual system | 14 inpatient resident teams (6 surgery, 8 IM) at 2 teaching hospitals for 5 months | Staff, system | 50% reduction in the perceived time spent copying data [from 24% to 12% (P < 0.0001)] and number of patients missed on rounds (2.5 vs. 5 patients/team/month, P = 0.0001); improved signout quality (69.6% agree or strongly agree); and improved continuity of care (66.1% agree or strongly agree) |
Overall, the literature presented supports the use of a verbal handoff supplemented with written documentation in a structured format or technology solution. The 2 most rigorous studies were led by Van Eaton et al.16 and Petersen et al.17 and focused on evaluating technology solutions. Van Eaton et al.16 performed a randomized controlled trial of a locally created rounding template with 161 surgical residents. This template downloads certain information (lab values and recent vital signs) from the hospital system into a sign‐out sheet and allows residents to enter notes about diagnoses, allergies, medications and to‐do items. When implemented, the investigators found the number of patients missed on rounds decreased by 50%. Residents reported an increase of 40% in the amount of time available to pre‐round, due largely to not having to copy data such as vital signs. They reported a decrease in rounding time by 3 hours per week, and this was perceived as helping them meet the ACGME 80 hours work rules. Lastly, the residents reported a higher quality of sign‐outs from their peers and perceived an overall improvement in continuity of care. Petersen and colleagues implemented a computerized sign‐out (auto‐imported medications, name, room number) in an internal medicine residency to improve continuity of care during cross‐coverage and decrease adverse events.17 Prior to the intervention, the frequency of preventable adverse events was 1.7% and it was significantly associated with cross‐coverage. Preventable adverse events were identified using a confidential self‐report system that was also validated by clinician review. After the intervention, the frequency of preventable adverse events dropped to 1.2% (P < 0.1), and cross‐coverage was no longer associated with preventable adverse events. In other studies, technological solutions also improved provider identification and staff communication.18, 19 Together, these technology‐based intervention studies suggest that a computerized sign‐out with auto‐imported fields has the ability to improve physician efficiency and also improve inpatient care (reduction in number of patients missed on rounds, decrease in preventable adverse events).
Studies from nursing demonstrated that supplementing a verbal exchange with written information improved transfer of information, compared to verbal exchange alone.20 One of these studies rated the transfer of information using videotaped simulated handoff cases.21 Last, 1 nursing study that more directly involved patients in the handoff process resulted in improved nursing knowledge and greater patient empowerment (Table 1).22
White papers or consensus statements originated from international and national consortia in patient safety including the Australian Council for Safety and Quality in Healthcare,23 the Junior Doctors Committee of the British Medical Association,24 University Health Consortium,25 the Department of Defense Patient Safety Program,26 and The Joint Commission.27 Several common themes were prevalent in all white papers. First, there exists a need to train new personnel on how to perform an effective handoff. Second, efforts should be undertaken to ensure adequate time for handoffs and reduce interruptions during handoffs. Third, several of the papers supported verbal exchange that facilitates interactive questioning, focuses on ill patients, and delineates actions to be taken. Lastly, content should be updated to ensure transfer of the latest clinical information.
Peer Review at SHM Meeting of Preliminary Handoff Recommendations
In the presentation of preliminary handoff recommendations to over 300 attendees at the SHM Annual Meeting in 2007, 2 recommendations were supported unanimously: (1) a formal recognized handoff plan should be instituted at end of shift or change in service; and (2) ill patients should be given priority during verbal exchange.
During the workshop, discussion focused on three recommendations of concern, or those that received greater than 20 negative votes by participants. The proposed recommendation that raised the most objections (48 negative votes) was that interruptions be limited. Audience members expressed that it was hard to expect that interruptions would be limited given the busy workplace in the absence of endorsing a separate room and time. This recommendation was ultimately deleted.
The 2 other debated recommendations, which were retained after discussion, were ensuring adequate time for handoffs and using an interactive process during verbal communication. Several attendees stated that ensuring adequate time for handoffs may be difficult without setting a specific time. Others questioned the need for interactive verbal communication, and endorsed leaving a handoff by voicemail with a phone number or pager to answer questions. However, this type of asynchronous communication (senders and receivers not present at the same time) was not desirable or consistent with the Joint Commission's National Patient Safety Goal.
Two new recommendations were proposed from anonymous input and incorporated in the final recommendations, including (a) all patients should be on the sign‐out, and (b) sign‐outs should be accessible from a centralized location. Another recommendation proposed at the Annual Meeting was to institute feedback for poor sign‐outs, but this was not added to the final recommendations after discussion at the meeting and with content experts about the difficulty of maintaining anonymity in small hospitalist groups. Nevertheless, this should not preclude informal feedback among practitioners.
Anonymous commentary also yielded several major themes regarding handoff improvements and areas of uncertainty that merit future work. Several hospitalists described the need to delineate specific content domains for handoffs including, for example, code status, allergies, discharge plan, and parental contact information in the case of pediatric care. However, due to the variability in hospitalist programs and health systems and the general lack of evidence in this area, the Task Force opted to avoid recommending specific content domains which may have limited applicability in certain settings and little support from the literature. Several questions were raised regarding the legal status of written sign‐outs, and whether sign‐outs, especially those that are web‐based, are compliant with the Healthcare Information Portability and Accountability Act (HIPAA). Hospitalists also questioned the appropriate number of patients to be handed off safely. Promoting efficient technology solutions that reduce documentation burden, such as linking the most current progress note to the sign‐out, was also proposed. Concerns were also raised about promoting safe handoffs when using moonlighting or rotating physicians, who may be less invested in the continuity of the patients' overall care.
Expert Panel Review
The final version of the Task Force recommendations incorporates feedback provided by the expert panel. In particular, the expert panel favored the use of the term, recommendations, rather than standards, minimum acceptable practices, or best practices. While the distinction may appear semantic, the Task Force and expert panel acknowledge that the current state of scientific knowledge regarding hospital handoffs is limited. Although an evidence‐based process informed the development of these recommendations, they are not a legal standard for practice. Additional research may allow for refinement of recommendations and development of more formal handoff standards.
The expert panel also highlighted the need to provide tools to hospitalist programs to facilitate the adoption of these recommendations. For example, recommendations for content exchange are difficult to adopt if groups do not already use a written template. The panel also commented on the need to consider the possible consequences if efforts are undertaken to include handoff documents (whether paper or electronic) as part of the medical record. While formalizing handoff documents may raise their quality, it is also possible that handoff documents become less helpful by either excluding the most candid impression regarding a patient's status or by encouraging hospitalists to provide too much detail. Privacy and confidentiality of paper‐based systems, in particular, were also questioned.
Additional Recommendations for Service Change
Patient handoffs during a change of service are a routine part of hospitalist care. Since service change is a type of shift change, the handoff recommendations for shift change do apply. Unlike shift change, service changes involve a more significant transfer of responsibility. Therefore, the Task Force recommends also that the incoming hospitalist be readily identified in the medical record or chart as the new provider, so that relevant clinical information can be communicated to the correct physician. This program‐level recommendation can be met by an electronic or paper‐based system that correctly identifies the current primary inpatient physician.
Final Handoff Recommendations
The final handoff recommendations are shown in Figure 2. The recommendations were designed to be consistent with the overall finding of the literature review, which supports the use of a verbal handoff supplemented with written documentation or a technological solution in a structured format. With the exception of 1 recommendation that is specific to service changes, all recommendations are designed to refer to shift changes and service changes. One overarching recommendation refers to the need for a formally recognized handoff plan at a shift change or change of service. The remaining 12 recommendations are divided into 4 that refer to hospitalist groups or programs, 3 that refer to verbal exchange, and 5 that refer to content exchange. The distinction is an important one because program‐level recommendations require organizational support and buy‐in to promote clinician participation and adherence. The 4 program recommendations also form the necessary framework for the remaining recommendations. For example, the second program recommendation describes the need for a standardized template or technology solution for accessing and recording patient information during the handoff. After a program adopts such a mechanism for exchanging patient information, the specific details for use and maintenance are outlined in greater detail in content exchange recommendations.
Because of the limited trials of handoff strategies, none of the recommendations are supported with level of evidence A (multiple numerous randomized controlled trials). In fact, with the exception of using a template or technology solution which was supported with level of evidence B, all handoff recommendations were supported with C level of evidence. The recommendations, however, were rated as Class I (effective) because there were no conflicting expert opinions or studies (Figure 2).
Discussion
In summary, our review of the literature supports the use of face‐to‐face verbal handoffs that are aided by the use of structured template to guide exchange of information. Furthermore, the development of these recommendations is the first effort of its kind for hospitalist handoffs and a movement towards standardizing the handoff process. While these recommendations are meant to provide structure to the hospitalist handoff process, the use and implementation by individual hospitalist programs may require more specific detail than these recommendations provide. Local modifications can allow for improved acceptance and adoption by practicing hospitalists. These recommendations can also help guide teaching efforts for academic hospitalists who are responsible for supervising residents.
The limitations of these recommendations related to lack of evidence in this field. Studies suffered from small size, poor description of methods, and a paucity of controlled interventions. The described technology solutions are not standardized or commercially available. Only 1 study included patient outcomes.28 There are no multicenter studies, studies of hospitalist handoffs, or studies to guide inclusion of specific content. Randomized controlled trials, interrupted time series analyses, and other rigorous study designs are needed in both teaching and non‐teaching settings to evaluate these recommendations and other approaches to improving handoffs. Ideally, these studies would occur through multicenter collaboratives and with human factors researchers familiar with mixed methods approaches to evaluate how and why interventions work.29 Efforts should focus on developing surrogate measures that are sensitive to handoff quality and related to important patient outcomes. The results of future studies should be used to refine the present recommendations. Locating new literature could be facilitated through the introduction of Medical Subject Heading for the term handoff by the National Library of Medicine. After completing this systematic review and developing the handoff recommendations described here, a few other noteworthy articles have been published on this topic, to which we refer interested readers. Several of these studies demonstrate that standardizing content and process during medical or surgical intern sign‐out improves resident confidence with handoffs,30 resident perceptions of accuracy and completeness of signout,31 and perceptions of patient safety.32 Another prospective audiotape study of 12 days of resident signout of clinical information demonstrated that poor quality oral sign‐outs was associated with an increased risk of post‐call resident reported signout‐related problems.5 Lastly, 1 nursing study demonstrated improved staff reports of safety, efficiency, and teamwork after a change from verbal reporting in an isolated room to bedside handover.33 Overall, these additional studies continue to support the current recommendations presented in this paper and do not significantly impact the conclusions of our literature review.
While lacking specific content domain recommendations, this report can be used as a starting point to guide development of self and peer assessment of hospitalist handoff quality. Development and validation of such assessments is especially important and can be incorporated into efforts to certify hospitalists through the recently approved certificate of focused practice in hospital medicine by the American Board of Internal Medicine (ABIM). Initiatives by several related organizations may help guide these effortsThe Joint Commission, the ABIM's Stepping Up to the Plate (SUTTP) Alliance, the Institute for Healthcare Improvement, the Information Transfer and Communication Practices (ITCP) Project for surgical care transitions, and the Hospital at Night (H@N) Program sponsored by the United Kingdom's National Health Service.3437 Professional medical organizations can also serve as powerful mediators of change in this area, not only by raising the visibility of handoffs, but also by mobilizing research funding. Patients and their caregivers may also play an important role in increasing awareness and education in this area. Future efforts should target handoffs not addressed in this initiative, such as transfers from emergency departments to inpatient care units, or between ICUs and the medical floor.
Conclusion
With the growth of hospital medicine and the increased acuity of inpatients, improving handoffs becomes an important part of ensuring patient safety. The goal of the SHM Handoffs Task Force was to begin to standardize handoffs at change of shift and change of servicea fundamental activity of hospitalists. These recommendations build on the limited literature in surgery, nursing, and medical informatics and provide a starting point for promoting safe and seamless in‐hospital handoffs for practitioners of Hospital Medicine.
Acknowledgements
The authors also acknowledge Tina Budnitz and the Healthcare Quality and Safety Committee of the Society of Hospital Medicine. Last, they are indebted to the staff support provided by Shannon Roach from the Society of Hospital Medicine.
- ,,,.Lost in translation: challenges and opportunities in physician‐to‐physician communication during patient handoffs.Acad Med.2005;80(12):1094–1099.
- ... AHRQ WebM167(19):2030–2036.
- ,,,,.Communication failures in patient signout and suggestions for improvement: a critical incident analysis.Qual Saf Health Care.2005;14:401–407.
- ,,,,.Consequences of inadequate sign‐out for patient care.Arch Intern Med.2008;168(16):1755–1760.
- ,,, et al.Handoff strategies in settings with high consequences for failure: lessons for health care operations.Int J Qual Health Care.2004;16:125–132.
- Joint Commission. 2006 Critical Access Hospital and Hospital National Patient Safety Goals. Available at: http://www.jointcommission.org/PatientSafety/NationalPatientSafetyGoals/06_npsg_cah.htm. Accessed June2009.
- ,,,.Transfers of patient care between house staff on internal medicine wards: a national survey.Arch Intern Med.2006;166(11):1173–1177.
- ,.Re‐framing continuity of care for this century.Qual Saf Health Care.2005;14(6):394–396.
- ,,,,.Core competencies in hospital medicine: development and methodology.J Hosp Med.2006;1(suppl 1):48–56.
- ,,, et al.Managing discontinuity in academic medical centers: strategies for a safe and effective resident sign‐out.J Hosp Med.2006;1(4):257–266.
- ,,, et al.Deficits in communication and information transfer between hospital‐based and primary‐care physicians: implications for patient safety and continuity of care.JAMA.2007;297(8):831–841.
- ,,, et al.Transition of care for hospitalized elderly patients: development of a discharge checklist for hospitalists.J Hosp Med.2006;1(6):354–360.
- Discontinuities, Gaps, and Hand‐Off Problems. AHRQ PSNet Patient Safety Network. Available at: http://www.psnet.ahrq.gov/content.aspx?taxonomyID=412. Accessed June2009.
- Manual for ACC/AHA Guideline Writing Committees. Methodologies and Policies from the ACC/AHA Task Force on Practice Guidelines. Available at: http://circ.ahajournals.org/manual/manual_IIstep6.shtml. Accessed June2009.
- ,,,,.A randomized, controlled trial evaluating the impact of a computerized rounding and sign‐out system on continuity of care and resident work hours.J Am Coll Surg.2005;200(4):538–545.
- ,,,,.Using a computerized sign‐out program to improve continuity of inpatient care and prevent adverse events.Jt Comm J Qual Improv.1998;24(2):77–87.
- ,.MediSign: using a web‐based SignOut System to improve provider identification.Proc AMIA Symp.1999:550–554.
- ,.Using a computerized sign‐out system to improve physician‐nurse communication.Jt Comm J Qual Patient Saf.2006;32(1):32–36.
- ,,,.Pilot study to show the loss of important data in nursing handover.Br J Nurs.2005;14(20):1090–1093.
- .Using care plans to replace the handover.Nurs Stand.1995;9(32):24–26.
- .Change from an office‐based to a walk‐around handover system.Nurs Times.2005;101(10):34–35.
- Clinical Handover and Patient Safety. Literature review report. Australian Council for Safety and Quality in Health Care. Available at: http://www.health.gov.au/internet/safety/publishing.nsf/Content/AA1369AD4AC5FC2ACA2571BF0081CD95/$File/clinhovrlitrev.pdf. Accessed June2009.
- Safe Handover: Safe Patients. Guidance on clinical handover for clinicians and managers. Junior Doctors Committee, British Medical Association. Available at: http://www.bma.org.uk/ap.nsf/AttachmentsByTitle/PDFsafehandover/$FILE/safehandover.pdf. Accessed June2009.
- University HealthSystem Consortium (UHC).UHC Best Practice Recommendation: Patient Hand Off Communication White Paper, May 2006.Oak Brook, IL:University HealthSystem Consortium;2006.
- Healthcare Communications Toolkit to Improve Transitions in Care. Department of Defense Patient Safety Program. Available at: http://dodpatientsafety.usuhs.mil/files/Handoff_Toolkit.pdf. Accessed June2009.
- Joint Commission on Accreditation of Healthcare Organizations. Joint Commission announces 2006 national patient safety goals for ambulatory care and office‐based surgery organizations. Available at: http://www.jcaho.org/news+room/news+release+archives/06_npsg_amb_obs.htm. Accessed June2009.
- ,,,,.Does housestaff discontinuity of care increase the risk for preventable adverse events?Ann Intern Med.1994;121(11):866–872.
- .Communication strategies from high‐reliability organizations: translation is hard work.Ann Surg.2007;245(2):170–172.
- ,,, et al.A structured handoff program for interns.Acad Med.2009;84(3):347–352.
- ,,, et al.Simple standardized patient handoff system that increases accuracy and completeness.J Surg Educ.2008;65(6):476–485.
- ,,.Standardized sign‐out reduces intern perception of medical errors on the general internal medicine ward.Teach Learn Med.2009;21(2):121–126.
- ,,,,,.Bedside handover: quality improvement strategy to “transform care at the bedside”.J Nurs Care Qual.2009;24(2):136–142.
- Pillow M, ed.Improving Handoff Communications.Chicago:Joint Commission Resources;2007.
- American Board of Internal Medicine Foundation. Step Up To The Plate. Available at: http://www.abimfoundation.org/quality/suttp.shtm. Accessed June2009.
- ,,, et al.Surgeon information transfer and communication: factors affecting quality and efficiency of inpatient care.Ann Surg.2007;245(2):159–169.
- Hospital at Night. Available at: http://www.healthcareworkforce.nhs.uk/hospitalatnight.html. Accessed June2009.
- .Using care plans to replace the handover.Nurs Stand.1995;9(32):24–26.
- ,,,.Electronic medical handover: towards safer medical care.Med J Aust.2005;183(7):369–372.
- ,,.Utility of a standardized sign‐out card for new medical interns.J Gen Intern Med.1996;11(12):753–755.
- ,.Signing out patients for off‐hours coverage: comparison of manual and computer‐aided methods.Proc Annu Symp Comput Appl Med Care.1992:114–118.
- ,,,.Organizing the transfer of patient care information: the development of a computerized resident sign‐out system.Surgery.2004;136(1):5–13.
What is the proper duration of antibiotic treatment in adults hospitalized with community-acquired pneumonia?
Case
An 83-year-old male with hypertension, coronary artery disease, and obstructive sleep apnea presents with progressive shortness of breath, a productive cough, wheezing, and tachypnea. His blood pressure is 158/70 mm/Hg; temperature is 101.8; respirations are 26 breaths per minute; and oxygen saturation is 87% on room air. He has coarse breath sounds bilaterally, and decreased breath sounds over the right lower lung fields. His chest X-ray reveals a right lower lobe infiltrate. He is admitted to the hospital with a diagnosis of community-acquired pneumonia (CAP), and medical therapy is started. How should his antibiotic treatment be managed?
Overview
Community-acquired pneumonia is the most common infection-related cause of death in the U.S., and the eighth-leading cause of mortality overall.1 According to a 2006 survey, CAP results in more than 1.2 million hospital admissions annually, with an average length of stay of 5.1 days.2 Though less than 20% of CAP patients require hospitalization, cases necessitating admission contribute to more than 90% of the overall cost of pneumonia care.3
During the past several years, the availability of new antibiotics and the evolution of microbial resistance patterns have changed CAP treatment strategies. Furthermore, the development of prognostic scoring systems and increasing pressure to streamline resource utilization while improving quality of care have led to new treatment considerations, such as managing low-risk cases as outpatients.
More recently, attention has been directed to the optimal duration of antibiotic treatment, with a focus on shortening the duration of therapy. Historically, CAP treatment duration has been variable and not evidence-based. Shortening the course of antibiotics might limit antibiotic resistance, decrease costs, and improve patient adherence and tolerability.4 However, before defining the appropriate antibiotic duration for a patient hospitalized with CAP, other factors must be considered, such as the choice of empiric antibiotics, the patient’s initial response to treatment, severity of the disease, and presence of co-morbidities.
Review of the Data
Antibiotic choice. The most widely referenced practice guidelines for the management of CAP patients were published in 2007 by representatives of the Infectious Diseases Society of America (IDSA) and the American Thoracic Society (ATS).5 Table 1 (above, right) summarizes the recommendations for empiric antibiotics for patients requiring inpatient treatment.
Time to clinical stability. A patient’s clinical response to empiric antibiotic therapy contributes heavily to the decision regarding treatment course and duration. The IDSA/ATS guidelines recommend patients be afebrile for 48 to 72 hours and have no more than one CAP-associated sign of clinical instability before discontinuation of therapy. Although studies have used different definitions of clinical stability, the consensus guidelines refer to six parameters, which are summarized in Table 2 (right).
With appropriate antibiotic therapy, most patients hospitalized with CAP achieve clinical stability in approximately three days.6,7 Providers should expect to see some improvement in vital signs within 48 to 72 hours of admission. Should a patient fail to demonstrate objective improvement during that time, providers should look for unusual pathogens, resistant organisms, nosocomial superinfections, or noninfectious conditions.5 Certain patients, such as those with multilobar pneumonia, associated pleural effusion, or higher pneumonia-severity index scores, also take longer to reach clinical stability.8
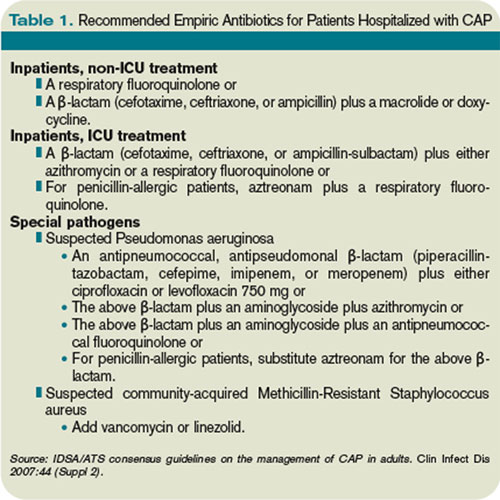
Switch to oral therapy. The ability to achieve clinical stability has important implications for hospital length of stay. Most patients hospitalized with CAP initially are treated with intravenous (IV) antibiotics and require transition to oral therapy in anticipation of discharge. Several studies have found there is no advantage to continuing IV medication once a patient is deemed clinically stable and is able to tolerate oral medication.9,10 There are no specific guidelines regarding choice of oral antibiotics, but it is common practice, supported by the IDSA/ATS recommendations, to use the same agent as the IV antibiotic or a medication in the same drug class. For patients started on β-lactam and macrolide combination therapy, it usually is appropriate to switch to a macrolide alone.5 In cases in which a pathogen has been identified, antibiotic selection should be based on the susceptibility profile.
Once patients are switched to oral antibiotics, it is not necessary for them to remain in the hospital for further observation, provided they have no other active medical problems or social needs. A retrospective analysis of 39,232 patients hospitalized with CAP compared those who were observed overnight after switching to oral antibiotics with those who were not and found no difference in 14-day readmission rate or 30-day mortality rate.11 These findings, in conjunction with the strategy of an early switch to oral therapy, suggest hospital length of stay may be safely reduced for many patients with uncomplicated CAP.
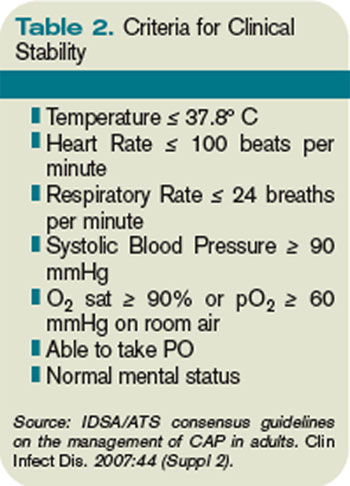
Duration of therapy. After a patient becomes clinically stable and a decision is made to switch to oral medication and a plan for hospital discharge, the question becomes how long to continue the course of antibiotics. Historically, clinical practice has extended treatment for up to two weeks, despite lack of evidence for this duration of therapy. The IDSA/ATS guidelines offer some general recommendations, noting patients should be treated for a minimum of five days, in addition to being afebrile for 48 to 72 hours and meet other criteria for clinical stability.5
Li and colleagues conducted a systematic review evaluating 15 randomized controlled trials comparing short-course (less than seven days) with extended (more than seven days) monotherapy for CAP in adults.4 Overall, the authors found no difference in the risk of treatment failure between short-course and extended-course antibiotic therapy, and they found no difference in bacteriologic eradication or mortality. It is important to note the studies included in this analysis enrolled patients with mild to moderate CAP, including those treated as outpatients, which limits the ability to extrapolate to exclusively inpatient populations and more severely ill patients.
Another meta-analysis, published shortly thereafter, examined randomized controlled trials in outpatients and inpatients not requiring intensive care. It compared different durations of treatment with the same agent in the same dosage. The authors similarly found no difference in effectiveness or safety of short (less than seven days) versus longer (at least two additional days of therapy) courses.12 Table 3 (above) reviews selected trials of short courses of antibiotics, which have been studied in inpatient populations.
The trials summarized in these meta-analyses examined monotherapy with levofloxacin for five days; gemifloxacin for seven days, azithromycin for three to five days; ceftriaxone for five days; cefuroxime for seven days; amoxicillin for three days; or telithromycin for five to seven days. The variety of antibiotics in these studies contrasts the IDSA/ATS guidelines, which recommend only fluoroquinolones as monotherapy for inpatient CAP.
One important randomized, double-blind study of fluoroquinolones compared a five-day course of levofloxacin 750 mg daily, with a 10-day course of levofloxacin, 500 mg daily, in 528 patients with mild to severe CAP.13 The authors found no difference in clinical success or microbiologic eradication between the two groups, concluding high-dose levofloxacin for five days is an effective and well-tolerated alternative to a longer course of a lower dose, likely related to the drug’s concentration-dependent properties.
Azithromycin also offers potential for short courses of therapy, as pulmonary concentrations of azithromycin remain elevated for as many as five days following a single oral dose.14 Several small studies have demonstrated the safety, efficacy, and cost-effectiveness of three to five days of azithromycin, as summarized in a meta-analysis by Contopoulos-Ioannidis and colleagues.15 Most of these trials, however, were limited to outpatients or inpatients with mild disease or confirmed atypical pneumonia. One randomized trial of 40 inpatients with mild to moderately severe CAP found comparable clinical outcomes with a three-day course of oral azithromycin 500 mg daily versus clarithromycin for at least eight days.16 Larger studies in more severely ill patients must be completed before routinely recommending this approach in hospitalized patients. Furthermore, due to the rising prevalence of macrolide resistance, empiric therapy with a macrolide alone can only be used for the treatment of carefully selected hospitalized patients with nonsevere diseases and without risk factors for drug-resistant Streptococcus pneumoniae.5
Telithromycin is a ketolide antibiotic, which has been studied in mild to moderate CAP, including multidrug-resistant strains of S. pneumoniae, in courses of five to seven days.17 However, severe adverse reactions, including hepatotoxicity, have been reported. At the time of the 2007 guidelines, the IDSA/ATS committee waited for additional safety data before making any recommendations on its use.
One additional study of note was a trial of amoxicillin in adult inpatients with mild to moderately severe CAP.18 One hundred twenty-one patients who clinically improved (based on a composite score of pulmonary symptoms and general improvement) following three days of IV amoxicillin were randomized to oral amoxicillin for an additional five days or given a placebo. At days 10 and 28, there was no difference in clinical success between the two groups. The authors concluded that a total of three days of treatment was not inferior to eight days in patients who substantially improved after the first 72 hours of empiric treatment. This trial was conducted in the Netherlands, where amoxicillin is the preferred empiric antibiotic for CAP and patterns of antimicrobial resistance differ greatly from those found in the U.S.
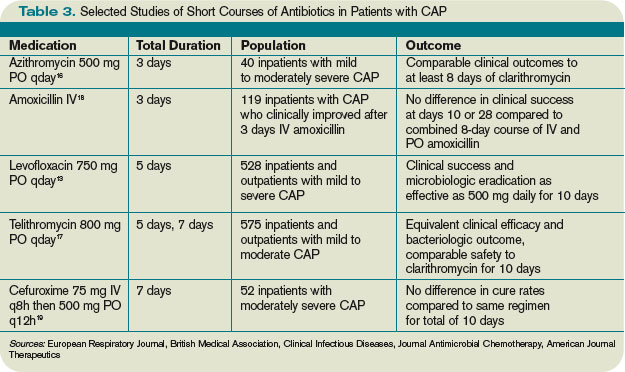
Other considerations. While some evidence supports shorter courses of antibiotics, many of the existing studies are limited by their inclusion of outpatients, adults with mild to moderate CAP, or small sample size. Hence, clinical judgment continues to play an important role in determining the appropriate duration of therapy. Factors such as pre-existing co-morbidities, severity of illness, and occurrence of complications should be considered. Data is limited on the appropriate duration of antibiotics in CAP patients requiring intensive care. It also is important to note the IDSA/ATS recommendations and most of the studies reviewed exclude patients with human immunodeficiency virus (HIV), and it is unknown whether these shorter courses of antibiotics are appropriate in the HIV population.
Lastly, the IDSA/ATS guidelines note longer durations of treatment may be required if the initial therapy was not active against the identified pathogen, or in cases complicated by extrapulmonary infections, such as endocarditis or meningitis.
Back to the Case
Our patient with moderately severe CAP was hospitalized based on his age and hypoxia. He was immediately treated with supplemental oxygen by nasal cannula, IV fluids, and a dose of IV levofloxacin 750 mg. Within 48 hours he met criteria for clinical stability, including defervescence, a decline in his respiratory rate to 19 breaths per minute, and improvement in oxygen saturation to 95% on room air. At this point, he was changed from IV to oral antibiotics. He continued on levofloxacin 750 mg daily and later that day was discharged home in good condition to complete a five-day course.
Bottom Line
For hospitalized adults with mild to moderately severe CAP, five to seven days of treatment, depending on the antibiotic selected, appears to be effective in most cases. Patients should be afebrile for 48 to 72 hours and demonstrate signs of clinical stability before therapy is discontinued. TH
Kelly Cunningham, MD, and Shelley Ellis, MD, MPH, are members of the Section of Hospital Medicine at Vanderbilt University in Nashville, Tenn. Sunil Kripalani, MD, MSc, serves as the section chief.
References
1. Kung HC, Hoyert DL, Xu J, Murphy SL. Deaths: final data for 2005. Natl Vital Stat Rep. 2008;56.
2. DeFrances CJ, Lucas CA, Buie VC, Golosinskiy A. 2006 National Hospital Discharge Survey. Natl Health Stat Report. 2008;5.
3. Niederman MS. Recent advances in community-acquired pneumonia: inpatient and outpatient. Chest. 2007;131:1205-1215.
4. Li JZ, Winston LG, Moore DH, Bent S. Efficacy of short-course antibiotic regimens for community-acquired pneumonia: a meta-analysis. Am J Med. 2007;120:783-790.
5. Mandell LA, Wunderink RG, Anzueto A et al. Infectious Diseases Society of America/American Thoracic Society consensus guidelines on the management of community-acquired pneumonia in adults. Clin Infect Dis. 2007;44(Suppl 2):S27-72.
6. Ramirez JA, Bordon J. Early switch from intravenous to oral antibiotics in hospitalized patients with bacteremic community-acquired Streptococcus pneumoniae pneumonia. Arch Intern Med. 2001;161:848-850.
7. Halm EA, Fine MJ, Marrie TJ et al. Time to clinical stability in patients hospitalized with community-acquired pneumonia: implications for practice guidelines. JAMA. 1998;279:1452-1457.
8. Menendez R, Torres A, Rodriguez de Castro F et al. Reaching stability in community-acquired pneumonia: the effects of the severity of disease, treatment, and the characteristics of patients. Clin Infect Dis. 2004;39:1783-1790.
9. Siegal RE, Halpern NA, Almenoff PL et al. A prospective randomised study of inpatient IV antibiotics for community-acquired pneumonia: the optimal duration of therapy. Chest. 1996;110:965-971.
10. Oosterheert JJ, Bonten MJ, Schneider MM et al. Effectiveness of early switch from intravenous to oral antibiotics in severe community acquired pneumonia: multicentre randomized trial. BMJ. 2006;333:1193-1197.
11. Nathan RV, Rhew DC, Murray C et al. In-hospital observation after antibiotic switch in pneumonia: a national evaluation. Am J Med. 2006;119:512-518.
12. Dimopoulos G, Matthaiou DK, Karageorgopoulos DE, et al. Short- versus long-course antibacterial therapy for community-acquired pneumonia: a meta-analysis. Drugs. 2008;68:1841-1854.
13. Dunbar LM, Wunderink RG, Habib MP et al. High-dose, short-course levofloxacin for community-acquired pneumonia: a new treatment paradigm. Clin Infect Dis. 2003;37:752-760.
14. Morris DL, De Souza A, Jones JA, Morgan WE. High and prolonged pulmonary tissue concentrations of azithromycin following a single oral dose. Eur J Clin Microbiol Infect Dis. 1991;10:859-861.
15. Contopoulos-Ioannidis DG, Ioannidis JPA, Chew P, Lau J. Meta-analysis of randomized controlled trials on the comparative efficacy and safety of azithromycin against other antibiotics for lower respiratory tract infections. J Antimicrob Chemother. 2001;48:691-703.
16. Rizzato G, Montemurro L, Fraioli P et al. Efficacy of a three-day course of azithromycin in moderately severe community-acquired pneumonia. Eur Respir J. 1995;8:398-402.
17. Tellier G, Niederman MS, Nusrat R et al. Clinical and bacteriological efficacy and safety of 5- and 7-day regimens of telithromycin once daily compared with a 10-day regimen of clarithromycin twice daily in patients with mild to moderate community-acquired pneumonia. J Antimicrob Chemother. 2004;54:515.
18. El Moussaoui R, de Borgie CA, van den Broek P et al. Effectiveness of discontinuing antibiotic treatment after three days versus eight days in mild to moderate-severe community acquired pneumonia: randomised, double blind study. BMJ. 2006;332:1355-1361.
19. Siegel RE, Alicea M, Lee A, Blaiklock R. Comparison of 7 versus 10 days of antibiotic therapy for hospitalized patients with uncomplicated community-acquired pneumonia: a prospective, randomized double-blind study. Am J Ther. 1999;6:217-222.
Case
An 83-year-old male with hypertension, coronary artery disease, and obstructive sleep apnea presents with progressive shortness of breath, a productive cough, wheezing, and tachypnea. His blood pressure is 158/70 mm/Hg; temperature is 101.8; respirations are 26 breaths per minute; and oxygen saturation is 87% on room air. He has coarse breath sounds bilaterally, and decreased breath sounds over the right lower lung fields. His chest X-ray reveals a right lower lobe infiltrate. He is admitted to the hospital with a diagnosis of community-acquired pneumonia (CAP), and medical therapy is started. How should his antibiotic treatment be managed?
Overview
Community-acquired pneumonia is the most common infection-related cause of death in the U.S., and the eighth-leading cause of mortality overall.1 According to a 2006 survey, CAP results in more than 1.2 million hospital admissions annually, with an average length of stay of 5.1 days.2 Though less than 20% of CAP patients require hospitalization, cases necessitating admission contribute to more than 90% of the overall cost of pneumonia care.3
During the past several years, the availability of new antibiotics and the evolution of microbial resistance patterns have changed CAP treatment strategies. Furthermore, the development of prognostic scoring systems and increasing pressure to streamline resource utilization while improving quality of care have led to new treatment considerations, such as managing low-risk cases as outpatients.
More recently, attention has been directed to the optimal duration of antibiotic treatment, with a focus on shortening the duration of therapy. Historically, CAP treatment duration has been variable and not evidence-based. Shortening the course of antibiotics might limit antibiotic resistance, decrease costs, and improve patient adherence and tolerability.4 However, before defining the appropriate antibiotic duration for a patient hospitalized with CAP, other factors must be considered, such as the choice of empiric antibiotics, the patient’s initial response to treatment, severity of the disease, and presence of co-morbidities.
Review of the Data
Antibiotic choice. The most widely referenced practice guidelines for the management of CAP patients were published in 2007 by representatives of the Infectious Diseases Society of America (IDSA) and the American Thoracic Society (ATS).5 Table 1 (above, right) summarizes the recommendations for empiric antibiotics for patients requiring inpatient treatment.
Time to clinical stability. A patient’s clinical response to empiric antibiotic therapy contributes heavily to the decision regarding treatment course and duration. The IDSA/ATS guidelines recommend patients be afebrile for 48 to 72 hours and have no more than one CAP-associated sign of clinical instability before discontinuation of therapy. Although studies have used different definitions of clinical stability, the consensus guidelines refer to six parameters, which are summarized in Table 2 (right).
With appropriate antibiotic therapy, most patients hospitalized with CAP achieve clinical stability in approximately three days.6,7 Providers should expect to see some improvement in vital signs within 48 to 72 hours of admission. Should a patient fail to demonstrate objective improvement during that time, providers should look for unusual pathogens, resistant organisms, nosocomial superinfections, or noninfectious conditions.5 Certain patients, such as those with multilobar pneumonia, associated pleural effusion, or higher pneumonia-severity index scores, also take longer to reach clinical stability.8
Switch to oral therapy. The ability to achieve clinical stability has important implications for hospital length of stay. Most patients hospitalized with CAP initially are treated with intravenous (IV) antibiotics and require transition to oral therapy in anticipation of discharge. Several studies have found there is no advantage to continuing IV medication once a patient is deemed clinically stable and is able to tolerate oral medication.9,10 There are no specific guidelines regarding choice of oral antibiotics, but it is common practice, supported by the IDSA/ATS recommendations, to use the same agent as the IV antibiotic or a medication in the same drug class. For patients started on β-lactam and macrolide combination therapy, it usually is appropriate to switch to a macrolide alone.5 In cases in which a pathogen has been identified, antibiotic selection should be based on the susceptibility profile.
Once patients are switched to oral antibiotics, it is not necessary for them to remain in the hospital for further observation, provided they have no other active medical problems or social needs. A retrospective analysis of 39,232 patients hospitalized with CAP compared those who were observed overnight after switching to oral antibiotics with those who were not and found no difference in 14-day readmission rate or 30-day mortality rate.11 These findings, in conjunction with the strategy of an early switch to oral therapy, suggest hospital length of stay may be safely reduced for many patients with uncomplicated CAP.
Duration of therapy. After a patient becomes clinically stable and a decision is made to switch to oral medication and a plan for hospital discharge, the question becomes how long to continue the course of antibiotics. Historically, clinical practice has extended treatment for up to two weeks, despite lack of evidence for this duration of therapy. The IDSA/ATS guidelines offer some general recommendations, noting patients should be treated for a minimum of five days, in addition to being afebrile for 48 to 72 hours and meet other criteria for clinical stability.5
Li and colleagues conducted a systematic review evaluating 15 randomized controlled trials comparing short-course (less than seven days) with extended (more than seven days) monotherapy for CAP in adults.4 Overall, the authors found no difference in the risk of treatment failure between short-course and extended-course antibiotic therapy, and they found no difference in bacteriologic eradication or mortality. It is important to note the studies included in this analysis enrolled patients with mild to moderate CAP, including those treated as outpatients, which limits the ability to extrapolate to exclusively inpatient populations and more severely ill patients.
Another meta-analysis, published shortly thereafter, examined randomized controlled trials in outpatients and inpatients not requiring intensive care. It compared different durations of treatment with the same agent in the same dosage. The authors similarly found no difference in effectiveness or safety of short (less than seven days) versus longer (at least two additional days of therapy) courses.12 Table 3 (above) reviews selected trials of short courses of antibiotics, which have been studied in inpatient populations.
The trials summarized in these meta-analyses examined monotherapy with levofloxacin for five days; gemifloxacin for seven days, azithromycin for three to five days; ceftriaxone for five days; cefuroxime for seven days; amoxicillin for three days; or telithromycin for five to seven days. The variety of antibiotics in these studies contrasts the IDSA/ATS guidelines, which recommend only fluoroquinolones as monotherapy for inpatient CAP.
One important randomized, double-blind study of fluoroquinolones compared a five-day course of levofloxacin 750 mg daily, with a 10-day course of levofloxacin, 500 mg daily, in 528 patients with mild to severe CAP.13 The authors found no difference in clinical success or microbiologic eradication between the two groups, concluding high-dose levofloxacin for five days is an effective and well-tolerated alternative to a longer course of a lower dose, likely related to the drug’s concentration-dependent properties.
Azithromycin also offers potential for short courses of therapy, as pulmonary concentrations of azithromycin remain elevated for as many as five days following a single oral dose.14 Several small studies have demonstrated the safety, efficacy, and cost-effectiveness of three to five days of azithromycin, as summarized in a meta-analysis by Contopoulos-Ioannidis and colleagues.15 Most of these trials, however, were limited to outpatients or inpatients with mild disease or confirmed atypical pneumonia. One randomized trial of 40 inpatients with mild to moderately severe CAP found comparable clinical outcomes with a three-day course of oral azithromycin 500 mg daily versus clarithromycin for at least eight days.16 Larger studies in more severely ill patients must be completed before routinely recommending this approach in hospitalized patients. Furthermore, due to the rising prevalence of macrolide resistance, empiric therapy with a macrolide alone can only be used for the treatment of carefully selected hospitalized patients with nonsevere diseases and without risk factors for drug-resistant Streptococcus pneumoniae.5
Telithromycin is a ketolide antibiotic, which has been studied in mild to moderate CAP, including multidrug-resistant strains of S. pneumoniae, in courses of five to seven days.17 However, severe adverse reactions, including hepatotoxicity, have been reported. At the time of the 2007 guidelines, the IDSA/ATS committee waited for additional safety data before making any recommendations on its use.
One additional study of note was a trial of amoxicillin in adult inpatients with mild to moderately severe CAP.18 One hundred twenty-one patients who clinically improved (based on a composite score of pulmonary symptoms and general improvement) following three days of IV amoxicillin were randomized to oral amoxicillin for an additional five days or given a placebo. At days 10 and 28, there was no difference in clinical success between the two groups. The authors concluded that a total of three days of treatment was not inferior to eight days in patients who substantially improved after the first 72 hours of empiric treatment. This trial was conducted in the Netherlands, where amoxicillin is the preferred empiric antibiotic for CAP and patterns of antimicrobial resistance differ greatly from those found in the U.S.
Other considerations. While some evidence supports shorter courses of antibiotics, many of the existing studies are limited by their inclusion of outpatients, adults with mild to moderate CAP, or small sample size. Hence, clinical judgment continues to play an important role in determining the appropriate duration of therapy. Factors such as pre-existing co-morbidities, severity of illness, and occurrence of complications should be considered. Data is limited on the appropriate duration of antibiotics in CAP patients requiring intensive care. It also is important to note the IDSA/ATS recommendations and most of the studies reviewed exclude patients with human immunodeficiency virus (HIV), and it is unknown whether these shorter courses of antibiotics are appropriate in the HIV population.
Lastly, the IDSA/ATS guidelines note longer durations of treatment may be required if the initial therapy was not active against the identified pathogen, or in cases complicated by extrapulmonary infections, such as endocarditis or meningitis.
Back to the Case
Our patient with moderately severe CAP was hospitalized based on his age and hypoxia. He was immediately treated with supplemental oxygen by nasal cannula, IV fluids, and a dose of IV levofloxacin 750 mg. Within 48 hours he met criteria for clinical stability, including defervescence, a decline in his respiratory rate to 19 breaths per minute, and improvement in oxygen saturation to 95% on room air. At this point, he was changed from IV to oral antibiotics. He continued on levofloxacin 750 mg daily and later that day was discharged home in good condition to complete a five-day course.
Bottom Line
For hospitalized adults with mild to moderately severe CAP, five to seven days of treatment, depending on the antibiotic selected, appears to be effective in most cases. Patients should be afebrile for 48 to 72 hours and demonstrate signs of clinical stability before therapy is discontinued. TH
Kelly Cunningham, MD, and Shelley Ellis, MD, MPH, are members of the Section of Hospital Medicine at Vanderbilt University in Nashville, Tenn. Sunil Kripalani, MD, MSc, serves as the section chief.
References
1. Kung HC, Hoyert DL, Xu J, Murphy SL. Deaths: final data for 2005. Natl Vital Stat Rep. 2008;56.
2. DeFrances CJ, Lucas CA, Buie VC, Golosinskiy A. 2006 National Hospital Discharge Survey. Natl Health Stat Report. 2008;5.
3. Niederman MS. Recent advances in community-acquired pneumonia: inpatient and outpatient. Chest. 2007;131:1205-1215.
4. Li JZ, Winston LG, Moore DH, Bent S. Efficacy of short-course antibiotic regimens for community-acquired pneumonia: a meta-analysis. Am J Med. 2007;120:783-790.
5. Mandell LA, Wunderink RG, Anzueto A et al. Infectious Diseases Society of America/American Thoracic Society consensus guidelines on the management of community-acquired pneumonia in adults. Clin Infect Dis. 2007;44(Suppl 2):S27-72.
6. Ramirez JA, Bordon J. Early switch from intravenous to oral antibiotics in hospitalized patients with bacteremic community-acquired Streptococcus pneumoniae pneumonia. Arch Intern Med. 2001;161:848-850.
7. Halm EA, Fine MJ, Marrie TJ et al. Time to clinical stability in patients hospitalized with community-acquired pneumonia: implications for practice guidelines. JAMA. 1998;279:1452-1457.
8. Menendez R, Torres A, Rodriguez de Castro F et al. Reaching stability in community-acquired pneumonia: the effects of the severity of disease, treatment, and the characteristics of patients. Clin Infect Dis. 2004;39:1783-1790.
9. Siegal RE, Halpern NA, Almenoff PL et al. A prospective randomised study of inpatient IV antibiotics for community-acquired pneumonia: the optimal duration of therapy. Chest. 1996;110:965-971.
10. Oosterheert JJ, Bonten MJ, Schneider MM et al. Effectiveness of early switch from intravenous to oral antibiotics in severe community acquired pneumonia: multicentre randomized trial. BMJ. 2006;333:1193-1197.
11. Nathan RV, Rhew DC, Murray C et al. In-hospital observation after antibiotic switch in pneumonia: a national evaluation. Am J Med. 2006;119:512-518.
12. Dimopoulos G, Matthaiou DK, Karageorgopoulos DE, et al. Short- versus long-course antibacterial therapy for community-acquired pneumonia: a meta-analysis. Drugs. 2008;68:1841-1854.
13. Dunbar LM, Wunderink RG, Habib MP et al. High-dose, short-course levofloxacin for community-acquired pneumonia: a new treatment paradigm. Clin Infect Dis. 2003;37:752-760.
14. Morris DL, De Souza A, Jones JA, Morgan WE. High and prolonged pulmonary tissue concentrations of azithromycin following a single oral dose. Eur J Clin Microbiol Infect Dis. 1991;10:859-861.
15. Contopoulos-Ioannidis DG, Ioannidis JPA, Chew P, Lau J. Meta-analysis of randomized controlled trials on the comparative efficacy and safety of azithromycin against other antibiotics for lower respiratory tract infections. J Antimicrob Chemother. 2001;48:691-703.
16. Rizzato G, Montemurro L, Fraioli P et al. Efficacy of a three-day course of azithromycin in moderately severe community-acquired pneumonia. Eur Respir J. 1995;8:398-402.
17. Tellier G, Niederman MS, Nusrat R et al. Clinical and bacteriological efficacy and safety of 5- and 7-day regimens of telithromycin once daily compared with a 10-day regimen of clarithromycin twice daily in patients with mild to moderate community-acquired pneumonia. J Antimicrob Chemother. 2004;54:515.
18. El Moussaoui R, de Borgie CA, van den Broek P et al. Effectiveness of discontinuing antibiotic treatment after three days versus eight days in mild to moderate-severe community acquired pneumonia: randomised, double blind study. BMJ. 2006;332:1355-1361.
19. Siegel RE, Alicea M, Lee A, Blaiklock R. Comparison of 7 versus 10 days of antibiotic therapy for hospitalized patients with uncomplicated community-acquired pneumonia: a prospective, randomized double-blind study. Am J Ther. 1999;6:217-222.
In the Literature
Literature at a Glance
A guide to this month’s studies.
- Adverse events are common after stopping clopidogrel following acute coronary syndrome.
- Treatment intensification with insulin improves inpatient glucose control.
- Pressure for early antibiotic administration leads to inaccuracy of pneumonia diagnosis.
- Multifaceted ventilation strategy no better than low-tidal-volume protocol.
- Higher PEEP ventilation strategy reduces duration of ventilation but not mortality.
- N-acetylcysteine reduces contrast-induced nephropathy.
- Vasopressin is no better than norepinephrine in patients with septic shock.
- Hospital patients desire greater participation in decision-making.
- Outcomes of patients with upper- or lower-extremity DVT are similar.
- Oral and IV steroids may be equally effective in COPD exacerbation.
What is Frequency, Timing of Adverse Events After Stopping Clopidogrel in ACS Patients?
Background: Clopidogrel is recommended in treatment of acute coronary syndrome (ACS) with or without stent placement. A rebound hypercoagulable state may occur following clopidogrel cessation, but this has not been investigated previously.
Study design: Retrospective cohort.
Setting: 127 VA medical centers.
Synopsis: Data were collected as part of the Veterans Health Administration Cardiac Care Follow-up Clinical Study from October 2003 through March 2005 on all patients with acute myocardial infarction (MI) or unstable angina who were discharged with clopidogrel treatment (3,137 patients). The analysis assessed the incidence and timing of adverse events after stopping clopidogrel among medically treated patients and among those treated with percutaneous coronary intervention (PCI).
In adjusted analyses among medically treated patients, the risk of death or acute MI in the first 90 days after clopidogrel cessation was 1.98 times higher, compared with the interval from 91-180 days. Among patients who received PCI (usually with a bare-metal stent), the risk was 1.82 times higher in the first 90 days. The clustering of events shortly after clopidogrel cessation support the possibility of a rebound hypercoagulable state.
Bottom line: In patients with ACS who received medical management or PCI, there was a higher rate of adverse events in the first 90 days after clopidogrel cessation.
Citation: Ho PM, Peterson ED, Wang L, et al. Incidence of death and acute myocardial infarction associated with stopping clopidorel after acute coronary syndrome. JAMA 2008;299(5):532-539.
What is the Relationship Between Treatment Intensification, Blood Pressure Changes in Diabetes Patients?
Background: Hyperglycemia is common in hospitalized patients with diabetes and associated with poor outcomes. Prior research on treatment intensification has focused on the intensive care unit or outpatient setting. The effect of treatment intensification in the inpatient (non-ICU) setting is not known.
Study design: Retrospective cohort.
Setting: 734-bed teaching hospital in Boston.
Synopsis: Between January 2003 and August 2004, data on blood glucose and daily pharmacologic management were gathered from electronic sources on 3,613 inpatients with diabetes. Inpatient hyperglycemia (glucose more than 180 mg/dL) occurred at least once in 2,980 (82.5%) hospitalizations.
Intensification of antihyperglycemic therapy occurred after only 22% of hospital days with hyperglycemia. Intensification included scheduled insulin, sliding scale insulin, and oral antihyperglycemic medications. Intensification of sliding scale insulin, as well as scheduled insulin, but not oral medications, was associated with a significant (12.2 mg/dL and 11.1 mg/dL respectively) average daily reduction in bedside glucose. Hypoglycemia was documented in 2.2% of days after intensification of antihyperglycemic treatment.
Bottom line: Inpatient hyperglycemia is common, and treatment intensification should be considered more often among hospitalized patients with diabetes.
Citation: Matheny ME, Shubina M, Kimmel ZM, Pendergrass ML, Turchin A. Treatment intensification and blood glucose control among hospitalized diabetic patients. J Gen Intern Med. 2008;23(2):184-189.
Does Four-Hour Antibiotic Goal Negatively Affect Accuracy of CAP Diagnosis?
Background: A period of less than our hour from emergency department presentation to first antibiotic dose is a core quality measure for community-acquired pneumonia (CAP). Time pressures might reduce the accuracy of pneumonia diagnosis and lead to unnecessary antibiotic administration.
Study design: Retrospective cohort.
Setting: 365-bed university-affiliated community hospital in Baltimore.
Synopsis: Patients admitted with an initial diagnosis of CAP were studied when the time to first antibiotic dose (TFAD) quality standard was eight hours (n=255) and later when the goal TFAD was four hours (n=293).
At admission, under the eight-hour goal, 45.9% of patients met prespecified diagnostic criteria for CAP, compared with 33.8% of patients under the four-hour goal (odds ratio [OR]=0.61, p=0.004). At discharge, 74.5% of patients had a diagnosis of pneumonia with an eight-hour TFAD standard, vs. 66.9% with a four-hour standard (p=0.05). The most common alternate diagnoses were acute bronchitis, heart failure, and COPD exacerbation.
No significant difference in antibiotic-associated adverse drug events, morbidity, or mortality were detected. Importantly, the goal TFAD reduction did not significantly increase the percentage of patients who received antibiotics within four hours (81.6% when the goal was within eight hours, vs. 85.3% when the goal was within four hours, p=0.21). The study is limited by its retrospective nature and the absence of gold standards for the diagnosis of CAP.
Bottom line: Greater pressure to administer antibiotics early in suspected cases of CAP may decrease diagnostic accuracy, without substantially improving antibiotic administration time.
Citation: Welker JA, Huston M, McCue JD. Antibiotic timing and errors in diagnosing pneumonia. Arch Intern Med. 2008;168(4):351-356.
Do Recruitment Maneuvers and High PEEP Reduce All-cause Hospital Mortality in Acute Lung Injury, ARDS?
Background: Low-tidal-volume ventilation reduces mortality in acute lung injury and acute respiratory distress syndrome (ARDS). Adding methods to open collapsed lung, such as employing recruitment maneuvers or using higher positive end-expiratory pressures (PEEP), may further reduce mortality.
Study design: Randomized controlled trial with blinded analysis. Patients were randomized to ventilation using the ARDS Network protocol (tidal volume of 6 ml/kg predicted body weight, assist control ventilation, low PEEP) vs. a higher PEEP intervention algorithm (using pressure control ventilation but still using 6 ml/kg tidal volume).
Setting: 30 intensive-care units in Canada, Australia, and Saudi Arabia.
Synopsis: Despite higher PEEP in the experimental group (14.6 cm H2O, SD 3.4) vs. the control group (9.8 cm H2O, SD 2.7) during the first 72 hours (p<0.001), there was no difference in all-cause hospital mortality or barotrauma between the two groups. The experimental group did, however, have a lower frequency of refractory hypoxemia (4.6% vs. 10.2%, 95% confidence interval [CI] 0.34-0.86, p=0.01).
At the end of the trial, a difference in the number of patients allocated to each group was noted. Investigation uncovered a programming error that disrupted the specified randomization blocks. Sensitivity analyses, which were not described, indicated that this error did not undermine randomization.
Bottom line: The addition of recruitment maneuvers and high PEEP to low-tidal-volume ventilation in acute lung injury and acute respiratory distress syndrome improved oxygenation but did not lower mortality.
Citation: Meade MO, Cook DJ, Guyatt GH, et al. Ventilation strategy using low tidal volumes, recruitment maneuvers, and high positive end-expiratory pressure for acute lung injury and acute respiratory distress syndrome. A randomized controlled trial. JAMA 2008;299(6):637-645.
Does a Ventilation Strategy Setting PEEP to Increase Alveolar Recruitment, Limit Hyperinflation Improve 28-day Mortality in Acute Lung Injury, ARDS?
Background: The need for lung protection in patients with acute lung injury or acute respiratory distress syndrome (ARDS) is accepted. The optimal level of positive end-expiratory pressure (PEEP) to provide protection yet allow alveolar expansion is debated
Study design: Unblinded, randomized controlled trial. Patients were randomized to standard low tidal volume ventilation with low PEEP or low tidal volume ventilation with higher PEEP (intervention group). PEEP was increased in the intervention group to attain a plateau pressure of 28-30 cm H2O
Setting: 37 intensive care units in France.
Synopsis: Though PEEP, total PEEP, and plateau pressure were considerably higher in the experimental group, there was no difference in 28-day mortality compared with the control group, 27.8% vs. 31.2% (95% CI 0.90-1.40, p=0.31). There was, however, an increase in the number of ventilator-free days (seven vs. three, p=0.04) and organ-failure-free days (six vs. two, p=0.04) in the experimental group compared with the control group. Criteria were used to evaluate patients for readiness for extubation, but the differential application of PEEP between arms may have altered the timing of these evaluations in the two arms and may be at least partly responsible for the difference in ventilator-free days.
Throughout patient recruitment, the primary end point was monitored, resulting in 18 interim analyses of the data. No statistical adjustments were made for these frequent examinations of the data.
Bottom line: The use of higher PEEP and maximum plateau pressure to increase alveolar recruitment while limiting hyperinflation results in more ventilator-free and organ failure-free days in patients with acute lung injury and ARDS. These maneuvers do not, however, alter mortality.
Citation: Mercat A, Richard JCM, Vielle B, et al. Positive end-expiratory pressure setting in adults with acute lung injury and acute respiratory distress syndrome. A randomized controlled trial. JAMA 2008;299(6):646-655.
What are the Effects of N-acetylcysteine, Theophylline, Other Agents on Preventing Contrast-induced Nephropathy
Background: Contrast-induced nephropathy is the third-most common cause of new acute renal failure in hospitalized patients, occurring in up to 25% of patients with renal impairment, diabetes, heart failure, advanced age, or concurrent use of nephrotoxic drugs. Clinicians use different agents to reduce the risk, including intravenous hydration, N-acetylcysteine, theophylline, fenoldopam, dopamine, furosemide, mannitol, and bicarbonate.
Study design: Meta-analysis of randomized controlled trials.
Setting: 41 studies involving 6,379 patients, published internationally between 1994 and 2006.
Synopsis: All but one study evaluated patients undergoing cardiac catheterization, and 34 trials evaluated patients with impaired renal function. N-acetylcysteine significantly reduced the risk of contrast-induced nephropathy more than saline hydration alone (risk ratio [RR]=0.62, 95% CI 0.44 to 0.88). Theophylline may have renoprotective effects but the findings were not statistically significant (RR=0.49, 95% CI 0.23 to 1.06). Ascorbic acid and bicarbonate significantly reduced nephropathy, though only one study was found for each. The other agents evaluated did not significantly reduce risk. Furosemide increased the risk (RR=3.27, 95% CI 1.48 to 7.26).
Bottom line: N-acetylcycteine is an effective agent for prevention of contrast-induced nephropathy, and it has the added benefits of low cost, few side effects, and rare drug interactions.
Citation: Kelly AM, Dwamena B, Cronin P, Bernstein SJ, Carlos RC. Meta-analysis: effectiveness of drugs for preventing contrast-induced nephropathy. Ann Intern Med. 2008;148(4):284-294.
Compared With Norepinephrine, Does Vasopressin Infusion Improve Mortality in Septic Shock Patients?
Background: Vasopressin is commonly used to support blood pressure in patients with septic shock. It has been shown to restore vascular tone, maintain blood pressure, and decrease catecholamine requirements, but its effect on mortality is uncertain.
Study design: Randomized, double-blind trial.
Setting: 27 centers in Canada, Australia, and the United States.
Synopsis: Patients with septic shock who required at least 5 mcg/min of norepinephrine were randomized to receive either low-dose vasopressin infusion (0.01 to 0.03 U/min) or norepinephrine (5 to 15 mcg/min). There was no significant difference in mortality at 28 days (35.4% for vasopressin vs. 39.3% for norepinephrine, p=0.26) or at 90 days (43.9% vs. 49.6%, p=0.11). The vasopressin group had lower heart rate and norepinephrine requirements. There were no significant differences in the frequency of adverse events.
However, since mean blood pressure at baseline was 72-73 mmHg, study patients did not necessarily have catecholamine unresponsive shock. Also, the mean time from meeting criteria for study entry to infusion of the drug was 12 hours, longer than the six-hour time period identified as important in studies of early goal-directed therapy. This may have limited the effectiveness of vasopressin infusion.
Bottom line: Low-dose vasopressin as compared with norepinephrine did not improve mortality in patients with septic shock.
Citation: Russell JA, Walley KR, Singer J, et al. Vasopressin versus norepinephrine infusion in patients with septic shock. N Engl J Med. 2008;358(9):877-887.
How Much do Hospitalized Patients Want to Participate in Decisions on Therapies of Varying Risk, Benefit?
Background: Obtaining informed consent is required for invasive procedures, but most non-invasive medical treatments are performed without discussing the risks, benefits, and alternatives with patients.
Study design: Questionnaire with four scenarios.
Setting: Medical wards in a Connecticut hospital.
Synopsis: Among the 210 patients studied, about one-fourth wanted physicians to obtain their permission “no matter what” even for mundane therapies like potassium supplementation (24%) or diuretic administration (28%). When presented with a higher risk scenario, such as thrombolysis with a greater than 20% chance of hemorrhage, 40.8% of patients definitely wanted to participate in decision-making.
Younger patients (age 65 or younger) were more likely to want to participate in decision-making. For each scenario, at least 85% of patients noted they would like to be consulted about the decision “no matter what” or if time allowed. Importantly, patients expressed these preferences in response to written scenarios that did not provide detailed information about the risks and benefits. Further, patients did not receive explanations of the logistical hurdles of trying to obtain patient input for each decision.
Bottom line: The great majority of patients in this study wished to participate in decision making for hypothetical medical treatments, especially if time allowed. At least 24% always wanted to be consulted, even about mundane therapies like potassium supplementation.
Citation: Upadhyay S, Beck A, Rishi A, Amoateng-Adjepong Y, Manthous CA. Patients’ predilections regarding informed consent for hospital treatments. J Hosp Med. 2008; 3(1):6-11.
What are the Clinical Characteristics, Treatments, and Three-month Outcomes of Patients With Upper-extremity DVT
Background: Anticoagulation is the treatment of choice for upper-extremity deep venous thrombosis (DVT). However, no large studies have characterized the nature, management, and prognosis of upper-extremity DVT.
Study design: Prospective registry of consecutive patients (RIETE registry).
Setting: International multicenter study (124 centers in Spain, France, Italy, Israel, and Argentina).
Synopsis: Among the 11,564 registry patients with acute DVT, 512 (4.4%) were noted to have upper-extremity DVT. Cancer was more common and immobility was less common with upper-extremity DVT. Initially, most patients (91%) were treated with low-molecular-weight heparin (LMWH). For long-term therapy, 75% of patients with cancer received LMWH, and 76% of patients without cancer were given oral vitamin K antagonists. At diagnosis, only 9% of patients with upper-extremity DVT had clinically apparent pulmonary embolism (PE) versus 29% of those with lower-extremity DVT. During the three-month follow-up, the incidence of PE, fatal PE, recurrent DVT, and bleeding was similar for upper- and lower-extremity DVT. Mortality was higher in patients with upper-extremity DVT, which in multivariable analyses, was explained by the higher prevalence of cancer in that group.
Bottom line: Because the incidence of recurrent DVT/PE, fatal PE, or major bleeding is similar between upper and lower extremity DVT, therapy should not differ.
Citation: Muñoz FJ, Mismetti P, Poggio R, et al. Clinical outcome of patients with upper-extremity deep vein thrombosis. Chest 2008;133(1):143-148.
Are Oral Steroids as Effective as IV Steroids in Patients With COPD Exacerbation?
Background: Oral prednisolone has near 100% bioavailability following oral administration. Although current guidelines suggest using oral steroids in the treatment of COPD exacerbation, the optimal route of administration has not been studied rigorously.
Study design: Non-inferiority, double-blinded, randomized controlled trial.
Setting: Single hospital in the Netherlands.
Synopsis: Patients were randomized to receive either a five-day course of IV or oral prednisolone 60 mg, followed by an oral prednisolone taper. All received nebulized ipratropium and albuterol four times daily, as well as oral amoxicillin/clavulanate (or doxycycline if allergic). The primary outcome was treatment failure, which included death, ICU admission, hospital readmission for COPD, or treatment intensification during 90-day follow-up.
Non-inferiority was defined as a treatment failure rate for oral steroids not more than 15% worse than the treatment failure rate for IV steroids. The study design called for 256 patients to provide adequate (80%) power for the primary analysis. However, only 210 were enrolled due to slow recruitment, and 17 withdrew consent or did not meet study entry criteria.
The intention-to-treat analysis showed no significant difference between oral and IV steroids in the treatment failure rate (56.3% vs. 61.7%, respectively). Results of the per-protocol analysis were similar. However, insufficient power and poor patient accounting raise questions about the validity of the results.
Bottom line: Oral steroids appeared no worse than IV steroids in the treatment of COPD exacerbation, but the study was underpowered, which prevents definitive conclusions.
Citation: De Jong YP, Uil SM, Grotjohan HP, et al. Oral or IV prednisolone in the treatment of COPD exacerbations. A randomized, controlled, double-blind study. Chest 2007;132(6):1741-1747. TH