User login
Predictors of Medication Adherence
In the outpatient setting, medication adherence (defined as percentage of prescribed medication doses taken by a patient during a specific time period) ranges between 40% and 80% for chronic conditions.1 During acute care hospitalization, changes are often made to patients' medication regimens, which can be confusing and contribute to nonadherence, medication errors, and harmful adverse events.2 Indeed, it is estimated that almost half of patients encounter a medication error after discharge, and approximately 12%17% experience an adverse drug event after returning home.36 It is likely that some of these adverse events may be the result of medication nonadherence.7 Improved patientprovider communication, systems to reconcile prehospitalization and posthospitalization medications, as well as development of mechanisms to enhance adherence, may prevent many of these errors and have become new targets for quality improvement.4, 8 Although postdischarge medication adherence is a crucial target for avoiding adverse events and rehospitalization, few studies have focused on understanding its incidence and predictors, in particular, patient demographic factors such as age and insurance status.911
In addition, few studies have looked at general and posthospital adherence in a population where health literacy is measured, an important area because medication changes during hospitalization may be particularly confusing for patients with low health literacy.11, 12 Health literacy is defined as the degree to which an individual has the capacity to obtain, process, and understand basic health information and services needed to make appropriate health decisions.13 Prior outpatient research shows that low health literacy is associated with poor patient understanding of the medication regimen and instructions for medication use, which may contribute to postdischarge medication nonadherence.14, 15 Understanding the factors associated with postdischarge medication adherence could help refine interventions that are oriented toward improving transitions in care, patient safety, and reducing unnecessary rehospitalization.
We report here on factors associated with postdischarge medication adherence using data from the Pharmacist Intervention for Low Literacy in Cardiovascular Disease (PILL‐CVD) study.16
METHODS
Study and Participants
PILL‐CVD was a federally funded, 2‐site randomized controlled trial using pharmacist‐assisted medication reconciliation, inpatient pharmacist counseling, low‐literacy adherence aids, and telephone follow‐up that aimed to decrease rates of serious medication errors after hospital discharge.16 The study targeted patients with cardiovascular disease (hospitalized on cardiology or general medical or geriatric services for acute coronary syndromes [ACS] or acute decompensated heart failure [ADHF]) at 2 large academic hospitals, Brigham and Women's Hospital (BWH) and Vanderbilt University Hospital (VUH).
Subjects were eligible for enrollment if they met criteria for ACS or ADHF, were likely to be discharged to home as determined by the primary medical team at the time of study enrollment, and took primary responsibility for administering their medications prior to admission (caregivers could be involved in medication management after discharge). Exclusion criteria included severe visual or hearing impairment, inability to communicate in English or Spanish, active psychiatric illness, dementia, delirium, illness too severe to participate, lack of a home phone number, being in police custody, or participation in another intensive medication adherence program (eg, due to renal transplant).
Out of 6416 patients originally screened for possible enrollment, 862 were randomly assigned to receive usual care or usual care plus the intervention, and 851 remained in the study.16 Both the main study and this secondary data analysis were approved by the Institutional Review Boards of each site.
Baseline Measures
Following informed consent and study enrollment, a variety of baseline data were collected on study participants from medical records and patient interview, including primary language, demographic information (age, race, insurance status, income, and education level), cognition (through administration of the 05‐point MiniCog scale),17 and level of health literacy (through use of the 036‐point short form of the Test of Functional Health Literacy in Adults [s‐TOFHLA] scale).18 Baseline information was also collected on medication use, including number of preadmission medications, measurement of self‐reported adherence prior to admission (using the Morisky scale, a validated 04‐point questionnaire shown to correlate with disease control and indicative of general patterns of adherence),19 and a medication understanding score, adapted from other instruments, which quantifies understanding of the indication, dose, and frequency of up to 5 randomly selected preadmission medications on a 03‐point scale.16, 20, 21
Outcome Measures
Outcomes were collected 30 days postdischarge through a structured questionnaire, administered by telephone. Only patients who completed this call are included in the present analysis. Postdischarge medication adherence was assessed by asking patients to report the number of days out of the previous week they had taken each medication from their postdischarge regimen exactly as prescribed.22 A score was calculated for each medication as the proportion of adherent days (eg, if a patient reported missing 2 days of a medication in the previous week, then adherence would be 5/7 or 71%). A global postdischarge adherence score was then derived for each patient by averaging the adherence score for all regularly scheduled medications. This quantitative measure focused on adherence to medications patients knew they should be taking and did not measure medication discrepancies (sometimes termed unintentional nonadherence).
Analysis
Patient characteristics were summarized and reported using simple descriptive statistics. Candidate predictors of postdischarge medication adherence were chosen a priori from patient characteristics assessed during hospital admission. These included patient age, gender, race, ethnicity, marital status, insurance, years of education, presence of primary care physician (PCP), study site, number of preadmission medications, medication understanding, baseline adherence, cognition, and health literacy. Unadjusted results were calculated using univariable linear regression, with each patient's adherence score as the dependent variable and each predictor as the independent variable. Adjusted results were then derived using multivariable linear regression with all the candidate predictors in the model.
Lastly, because of missing data for some predictors, in particular baseline adherence and medication understanding, multiple imputation techniques were used to impute missing data and increase statistical power.23 We used the Markov Chain Monte Carlo (MCMC) method for multiple imputation, which generally assumes that the data came from a normal distribution and that the missing data are missing at random. Because of the essentially normal distribution of the data, and because the amount of missing data was so small (<1% for almost all variables, 5% for baseline adherence, and 8% for medication understanding), we expected little bias and present the complete case analysis, which maximized statistical power.
Two‐sided P values <0.05 were considered significant, and SAS version 9.2 (Cary, NC) was used for all analyses.
RESULTS
Table 1 shows descriptive baseline patient characteristics of study sample (responders) as well as nonresponders at 30 days. For the responders, the mean age of the 646 patients was 61.2 years, 94.7% were insured, and 19.3% had inadequate or marginal health literacy. Patients were prescribed an average of 8 preadmission medications. Most patients (92.3%) had a regular PCP prior to admission. Nonresponders had nonsignificant trends towards having lower health literacy, medication understanding, and baseline medication adherence.
| Characteristic | Total N, 30‐Day Respondents | Value | Total N, Nonrespondents | Value |
|---|---|---|---|---|
| ||||
| Age, mean in yr (SD) | 646 | 61.2 (13.5) | 45 | 55.4 (14.3) |
| Gender, N (percentage) | 646 | 45 | ||
| Female | 272 (42.1) | 18 (40.0) | ||
| Male | 374 (57.9) | 27 (60.0) | ||
| Race, N (percentage) | 643 | 45 | ||
| White | 511 (79.5) | 32 (71.1) | ||
| Black | 104 (16.2) | 11 (24.4) | ||
| Other | 28 (4.4) | 2 (4.4) | ||
| Ethnicity, N (percentage) | 639 | 45 | ||
| Hispanic | 24 (3.8) | 1 (2.2) | ||
| Not Hispanic | 615 (96.2) | 44 (97.8) | ||
| Marital status, N (percentage) | 646 | 45 | ||
| Married/cohabitate | 382 (59.1) | 20 (44.4) | ||
| Separated/divorced | 118 (18.3) | 11 (24.4) | ||
| Widowed | 81 (12.5) | 5 (11.1) | ||
| Never married | 65 (10.1) | 9 (2.0) | ||
| Insurance type, N (percentage) | 646 | 45 | ||
| Medicaid | 53 (8.2) | 5 (11.1) | ||
| Medicare | 270 (41.8) | 13 (28.9) | ||
| Private | 289 (44.7) | 19 (42.2) | ||
| Self‐pay | 34 (5.3) | 8 (17.8) | ||
| Years of education, mean in yr (SD) | 643 | 14.0 (3.1) | 45 | 13.3 (2.7) |
| Presence of PCP prior to admission, N (percentage) | 646 | 45 | ||
| Yes | 596 (92.3) | 38 (84.4) | ||
| No | 50 (7.74) | 7 (15.6) | ||
| Site, N (percentage) | 646 | 45 | ||
| Site 1 | 358 (55.4) | 8 (17.8) | ||
| Site 2 | 288 (44.6) | 37 (82.2) | ||
| No. of preadmission medications, mean no. (SD) | 641 | 7.8 (4.8) | 45 | 7.7 (5.4) |
| Medication understanding score, mean (SD)* | 597 | 2.4 (0.5) | 40 | 2.2 (0.62) |
| Health literacy (s‐TOFHLA) score, mean (SD) | 642 | 29.1 (8.9) | 45 | 26.0 (12.0) |
| Baseline adherence (SD) | 613 | 2.7 (1.1) | 45 | 2.4 (1.2) |
| MiniCog score, N (percentage) | 646 | 45 | ||
| Demented | 63 (9.8) | 5 (11.1) | ||
| Not demented | 583 (90.2) | 40 (88.9) | ||
The average postdischarge adherence score was 95% (standard deviation [SD] = 10.2%), and less than 10% of patients had an adherence score of less than 85%; overall the distribution was left‐skewed. Table 2 illustrates crude and adjusted parameter estimates for variables in the model. Table 3 shows significant findings in the fully adjusted model, which used multiple imputation techniques to account for missing data.
| Predictor | Crude Parameter Estimate (Beta) With 95% Confidence Intervals | P Value | Adjusted Parameter Estimate (Beta) With 95% Confidence Intervals | P Value |
|---|---|---|---|---|
| ||||
| Age per 10 yr | 0.010 (0.007, 0.020) | <0.0001 | 0.010 (0.002, 0.020) | 0.018 |
| Male gender | 0.012 (0.004, 0.028) | 0.137 | 0.003 (0.014, 0.020) | 0.727 |
| Race/ethnicity | ||||
| White | 0.011 (0.009, 0.031) | 0.266 | Ref | Ref |
| Black | 0.017 (0.038, 0.005) | 0.13 | 0.006 (0.017, 0.030) | 0.598 |
| Other | 0.010 (0.029, 0.049) | 0.599 | 0.017 (0.027, 0.062) | 0.446 |
| Hispanic/Latino | 0.005 (0.037, 0.047) | 0.803 | 0.036 (0.013, 0.085) | 0.149 |
| Marital status | ||||
| Married/cohabitate | 0.006 (0.011, 0.022) | 0.500 | Ref | Ref |
| Separated/divorced | 0.005 (0.025, 0.016) | 0.664 | 0.009 (0.014, 0.031) | 0.446 |
| Widowed | 0.001 (0.023, 0.025) | 0.922 | 0.013 (0.039, 0.013) | 0.338 |
| Never married | 0.009 (0.035, 0.018) | 0.515 | 0.004 (0.033, 0.025) | 0.784 |
| Insurance type | ||||
| Private | 0.008 (0.008, 0.024) | 0.347 | Ref | Ref |
| Medicaid | 0.046 (0.075, 0.018) | 0.002 | 0.026 (0.058, 0.007) | 0.121 |
| Medicare | 0.012 (0.004, 0.028) | 0.138 | 0.002 (0.023, 0.018) | 0.844 |
| Self‐pay | 0.027 (0.062, 0.008) | 0.135 | 0.029 (0.073, 0.015) | 0.202 |
| Years of education | 0.003 (0.0003, 0.005) | 0.028 | 0.0001 (0.003, 0.003) | 0.949 |
| Presence of PCP prior to admission | 0.007 (0.022, 0.037) | 0.630 | 0.002 (0.032, 0.036) | 0.888 |
| Site | 0.050 (0.065, 0.034) | <0.0001 | 0.038 (0.056, 0.021) | <0.0001 |
| No. of preadmission medications | 0.0003 (0.002, 0.001) | 0.684 | 0.0001 (0.002, 0.002) | 0.918 |
| Medication understanding score per point | 0.007 (0.009, 0.023) | 0.390 | 0.006 (0.011, 0.023) | 0.513 |
| Health literacy (s‐TOFHLA) score per 10 points | 0.0006 (0.008, 0.01) | 0.897 | 0.003 (0.008, 0.01) | 0.644 |
| Baseline adherence per point | 0.023 (0.016, 0.031) | <0.0001 | 0.017 (0.009, 0.024) | <0.0001 |
| Cognitive function | 0.004 (0.022, 0.031) | 0.757 | 0.008 (0.019, 0.036) | 0.549 |
| Predictor | Parameter Estimate (Beta) With 95% Confidence Intervals | P Value |
|---|---|---|
| ||
| Age per 10 yr | 0.010 (0.004, 0.020) | 0.004 |
| Insurance type | ||
| Private | Ref | Ref |
| Medicaid | 0.045 (0.076, 0.014) | 0.005 |
| Medicare | 0.010 (0.030, 0.010) | 0.333 |
| Self‐pay | 0.013 (0.050, 0.025) | 0.512 |
| Site | 0.036 (0.053, 0.019) | <0.0001 |
| Baseline adherence per point | 0.016 (0.008, 0.024) | <0.0001 |
Intervention arm was of borderline statistical significance in predicting postdischarge adherence (P = 0.052), and so was removed from the final model. Study site, age, insurance, and baseline adherence were the only significant independent predictors of postdischarge adherence in the fully adjusted model (Table 3). For example, for every 10‐year increase in age, patients had, on average, an adjusted 1% absolute increase in their adherence score (95% confidence interval [CI] 0.4% to 2.0%). For every 1‐point increase in baseline medication adherence (based on the Morisky scale), there was a 1.6% absolute increase in medication adherence (95% CI 0.8% to 2.4%). In unadjusted analyses, patients with Medicaid were less adherent with medications after discharge than were patients with private insurance. This difference became nonsignificant in adjusted analyses, but when analyses were repeated using multiple imputation techniques, the results again became statistically significantMedicaid insurance was associated with a 4.5% absolute decrease in postdischarge adherence compared with private insurance (95% CI 7.6% to 1.4%). Study site (specifically, Brigham and Women's Hospital) was also a significant predictor of greater postdischarge medication adherence. Years of education was a significant predictor of adherence in unadjusted analyses, but was not an independent predictor when adjusted for other factors. When baseline adherence was removed from the multiple imputation model, there were no changes in which factors were significant predictors of adherence.
DISCUSSION
In this study, we found that low baseline adherence, younger age, Medicaid insurance, and study site were significant predictors of lower 30‐day medication adherence. Of particular interest is our finding regarding baseline adherence, a simple measure to obtain on hospitalized patients. It is notable that in our study, education was not an independent significant predictor of postdischarge adherence, even when baseline adherence was removed from the model. The same is true for medication understanding, cognitive function, and health literacy.
Older patients appeared more adherent with medications in the month after hospital discharge, perhaps reflecting increased interaction with the healthcare system (appointments, number of physician interactions), a greater belief in the importance of chronic medication management, or a higher level of experience with managing medications. A similar relationship between age and adherence has been shown in outpatient studies of patients with hypertension, diabetes, and other chronic diseases.2427
Medicaid patients may be less likely to remain adherent because of the plan's limited coverage of medications relative to patients' ability to pay. For example, Medicaid in Tennessee covers the first 5 generic medications at no cost to the patient but has co‐payments for additional medications and for brand name drugs. Medicaid in Massachusetts has co‐payments of $1 to $3 for each medication. Alternatively, Medicaid insurance may be a marker for other patient characteristics associated with low adherence for which we were not fully able to adjust.
Site differences were also notable in this study; these differences could have been due to differences in insurance coverage in Tennessee versus Massachusetts (which has near‐universal coverage), differences in types of insurance (eg, fewer patients at Brigham and Women's Hospital had Medicaid than at Vanderbilt), cultural and geographic differences between the 2 locations, or other differences in transitional care between the 2 sites.
This study corroborates previous literature on medication adherence (specifically unintentional nonadherence) in the outpatient setting,4, 811 for example, on the association of younger age with low adherence in certain populations. On the other hand, it may contrast with previous literature which has sometimes shown a relationship between patient education or health literacy and medication adherence.14, 15, 2835 However, previous studies have not focused on the transition from inpatient to outpatient settings. Perhaps intensive medication education in the hospital, even under usual care, mitigates the effects of these factors on postdischarge adherence. Finally, baseline adherence seems to correlate with postdischarge adherence, a finding which makes intuitive sense and has been previously reported for specific medications.36
There are several limitations to this study. Although large, the study was performed at only 2 clinical sites where most patients were white and fairly well‐educated, perhaps because patients admitted to a tertiary care center with ACS or ADHF are more affluent than general medical inpatients as a whole; this may limit generalizability. Postdischarge medication adherence might have been higher than in other patient populations given the nature of the population, possible loss‐to‐follow‐up bias, and the fact that half of the subjects received an intervention designed to improve medication management after discharge; such low rates of nonadherence in our study may have reduced our ability to detect important predictors in our models. In addition, the period of follow‐up was 30 days, thus limiting our findings to short‐term postdischarge medication adherence. Postdischarge medication adherence was based on patient self‐report, which not only assumed that the patient was still managing his/her own medications after discharge, but may also be susceptible to both recall and social acceptability bias, which might overestimate our adherence scores, again limiting our ability to detect important predictors of nonadherence. However, other studies have shown a good correlation between self‐reported medication adherence and other more objective measures,37, 38 and recall was only for 7 days, a measure used previously in the literature39, 40 and one designed to reduce recall bias. Systematic underreporting in certain patient populations is less likely but possible.
In the future, research should focus on targeting patients who have low baseline adherence to evaluate the effects of various interventions on postdischarge medication outcomes. Repeating the study in a population with a high prevalence of low health literacy might be illuminating, given that previous studies have shown that patients with low health literacy have less ability to identify their medications and have less refill adherence.29, 30
In conclusion, in patients hospitalized with cardiovascular disease, predictors of lower postdischarge adherence include younger age, Medicaid insurance, and low baseline adherence. It may be prudent to assess baseline adherence and insurance type in hospitalized patients in order to identify those who may benefit from additional assistance to improve medication adherence and medication safety during transitions in care.
Acknowledgements
Meeting Presentations: SGIM New England Regional Meeting, oral presentation, Boston, MA, March 4, 2011; and SGIM National Meeting, poster presentation, Phoenix, AZ, May 6, 2011. Dr Schnipper had full access to all of the data in the study and takes responsibility for the integrity of the data and the accuracy of the data analysis.
Disclosures: Financial support was provided by R01 HL089755 (NHLBI, Kripalani), K23 HL077597 (NHLBI, Kripalani), K08 HL072806 (NHLBI, Schnipper), T32HP10251‐02 (Cohen), and by the Division of General Medicine, Massachusetts General Hospital and the Harvard Medical School Fellowship in General Medicine and Primary Care (Cohen). Dr Kripalani is a consultant to and holds equity in PictureRx, LLC, which makes patient education tools to improve medication management. PictureRx did not provide materials or funding for this study. All other authors disclose no relevant or financial conflicts of interest.
- ,.Adherence to medication.N Engl J Med.2005;353(5):487–497.
- ,,,.Posthospital medication discrepancies: prevalence and contributing factors.Arch Intern Med.2005;165(16):1842–1847.
- ,.Medication use in the transition from hospital to home.Ann Acad Med Singapore.2008;37(2):136–141.
- ,,,.Medical errors related to discontinuity of care from an inpatient to an outpatient setting.J Gen Intern Med.2003;18(8):646–651.
- ,,,,.The incidence and severity of adverse events affecting patients after discharge from the hospital.Ann Intern Med.2003;138(3):161–167.
- ,,,,.Adverse drug events occurring following hospital discharge.J Gen Intern Med.2005;20(4):317–323.
- ,,, et al.Role of pharmacist counseling in preventing adverse drug events after hospitalization.Arch Intern Med.2006;166(5):565–571.
- ,,.Reconcilable differences: correcting medication errors at hospital admission and discharge.Qual Saf Health Care.2006;15(2):122–126.
- ,.Risk of rehospitalization among bipolar disorder patients who are nonadherent to antipsychotic therapy after hospital discharge.Am J Health Syst Pharm.2009;66(4):358–365.
- ,,,,.Continuity and adherence to long‐term drug treatment by geriatric patients after hospital discharge: a prospective cohort study.Drugs Aging.2008;25(10):861–870.
- ,,,.Medication use among inner‐city patients after hospital discharge: patient‐reported barriers and solutions.Mayo Clin Proc.2008;83(5):529–535.
- ,,,,,.Relationship of health literacy to intentional and unintentional non‐adherence of hospital discharge medications.J Gen Intern Med.2012;27(2):173–178.
- Office of Disease Prevention and Health Promotion, US Department of Health and Human Services.Healthy People 2010. Available at: http://www.healthypeople.gov/Document/pdf/uih/2010uih.pdf. Accessed February 15,2012.
- ,,, et al.Literacy and misunderstanding prescription drug labels.Ann Intern Med.2006;145(12):887–894.
- ,,,,,.Predictors of medication self‐management skill in a low‐literacy population.J Gen Intern Med.2006;21(8):852–856.
- ,,, et al;for the PILL‐CVD Study Group.Rationale and design of the Pharmacist Intervention for Low Literacy in Cardiovascular Disease (PILL‐CVD) study.Circ Cardiovasc Qual Outcomes.2010;3(2):212–219.
- ,,,,.Simplifying detection of cognitive impairment: comparison of the Mini‐Cog and Mini‐Mental State Examination in a multiethnic sample.J Am Geriatr Soc.2005;53(5):871–874.
- .Short Test of Functional Health Literacy in Adults.Snow Camp, NC:Peppercorn Books and Press;1998.
- ,,,.Predictive validity of a medication adherence measure in an outpatient setting.J Clin Hypertens (Greenwich).2008;10(5):348–354.
- ,,,,,.Health literacy and medication understanding among hospitalized adults.J Hosp Med. In press.
- ,,,,,.Health literacy and medication understanding among hospitalized adults.J Hosp Med.2011;6(9):488–493.
- ,,.The summary of diabetes self‐care activities measure: results from 7 studies and a revised scale.Diabetes Care.2000;23(7):943–950.
- .Multiple Imputation for Nonresponse in Surveys.New York, NY:John Wiley 1987.
- ,,, et al.Medication adherence in HIV‐infected adults: effect of patient age, cognitive status, and substance abuse.AIDS.2004;18(suppl 1):S19–S25.
- ,,.Factors associated with antihypertensive drug compliance in 83,884 Chinese patients: a cohort study.J Epidemiol Community Health.2010;64(10):895–901.
- ,,,,,.Adherence to oral hypoglycemic agents in 26,782 Chinese patients: a cohort study.J Clin Pharmacol.2011;51(10):1474–1482.
- ,,,,.Effect of a pharmacy‐based health literacy intervention and patient characteristics on medication refill adherence in an urban health system.Ann Pharmacother.2010;44(1):80–87.
- ,,.Adherence to combination antiretroviral therapies in HIV patients of low health literacy.J Gen Intern Med.1999;14(5):267–273.
- ,,,,,.Factors associated with medication refill adherence in cardiovascular‐related diseases: a focus on health literacy.J Gen Intern Med.2006;21(12):1215–1221.
- ,,,,.Limited health literacy is a barrier to medication reconciliation in ambulatory care.J Gen Intern Med.2007;22(11):1523–1526.
- ,,,,.The impact of low health literacy on surgical practice.Am J Surg.2004;188(3):250–253.
- ,,,,.Relationships between beliefs about medications and adherence.Am J Health Syst Pharm.2009;66(7):657–664.
- ,,,.Health literacy and anticoagulation‐related outcomes among patients taking warfarin.J Gen Intern Med.2006;21(8):841–846.
- ,,,,,.Health literacy, antiretroviral adherence, and HIV‐RNA suppression: a longitudinal perspective.J Gen Intern Med.2006;21(8):835–840.
- ,,, et al.Risk factors for nonadherence to warfarin: results from the IN‐RANGE study.Pharmacoepidemiol Drug Saf.2008;17(9):853–860.
- ,,, et al.Predictors of low clopidogrel adherence following percutaneous coronary intervention.Am J Cardiol.2011;108(6):822–827.
- ,,,,,.Correlation between adherence rates measured by MEMS and self‐reported questionnaires: a meta‐analysis.Health Qual Life Outcomes.2010;8:99.
- ,,,,,.Concordance of adherence measurement using self‐reported adherence questionnaires and medication monitoring devices.Pharmacoeconomics.2010;28(12):1097–1107.
- ,,,.Polypharmacy and medication adherence in patients with type 2 diabetes.Diabetes Care.2003;26(5):1408–1412.
- ,,,.Improving adherence and reducing medication discrepancies in patients with diabetes.Ann Pharmacother.2003;37(7–8):962–969.
In the outpatient setting, medication adherence (defined as percentage of prescribed medication doses taken by a patient during a specific time period) ranges between 40% and 80% for chronic conditions.1 During acute care hospitalization, changes are often made to patients' medication regimens, which can be confusing and contribute to nonadherence, medication errors, and harmful adverse events.2 Indeed, it is estimated that almost half of patients encounter a medication error after discharge, and approximately 12%17% experience an adverse drug event after returning home.36 It is likely that some of these adverse events may be the result of medication nonadherence.7 Improved patientprovider communication, systems to reconcile prehospitalization and posthospitalization medications, as well as development of mechanisms to enhance adherence, may prevent many of these errors and have become new targets for quality improvement.4, 8 Although postdischarge medication adherence is a crucial target for avoiding adverse events and rehospitalization, few studies have focused on understanding its incidence and predictors, in particular, patient demographic factors such as age and insurance status.911
In addition, few studies have looked at general and posthospital adherence in a population where health literacy is measured, an important area because medication changes during hospitalization may be particularly confusing for patients with low health literacy.11, 12 Health literacy is defined as the degree to which an individual has the capacity to obtain, process, and understand basic health information and services needed to make appropriate health decisions.13 Prior outpatient research shows that low health literacy is associated with poor patient understanding of the medication regimen and instructions for medication use, which may contribute to postdischarge medication nonadherence.14, 15 Understanding the factors associated with postdischarge medication adherence could help refine interventions that are oriented toward improving transitions in care, patient safety, and reducing unnecessary rehospitalization.
We report here on factors associated with postdischarge medication adherence using data from the Pharmacist Intervention for Low Literacy in Cardiovascular Disease (PILL‐CVD) study.16
METHODS
Study and Participants
PILL‐CVD was a federally funded, 2‐site randomized controlled trial using pharmacist‐assisted medication reconciliation, inpatient pharmacist counseling, low‐literacy adherence aids, and telephone follow‐up that aimed to decrease rates of serious medication errors after hospital discharge.16 The study targeted patients with cardiovascular disease (hospitalized on cardiology or general medical or geriatric services for acute coronary syndromes [ACS] or acute decompensated heart failure [ADHF]) at 2 large academic hospitals, Brigham and Women's Hospital (BWH) and Vanderbilt University Hospital (VUH).
Subjects were eligible for enrollment if they met criteria for ACS or ADHF, were likely to be discharged to home as determined by the primary medical team at the time of study enrollment, and took primary responsibility for administering their medications prior to admission (caregivers could be involved in medication management after discharge). Exclusion criteria included severe visual or hearing impairment, inability to communicate in English or Spanish, active psychiatric illness, dementia, delirium, illness too severe to participate, lack of a home phone number, being in police custody, or participation in another intensive medication adherence program (eg, due to renal transplant).
Out of 6416 patients originally screened for possible enrollment, 862 were randomly assigned to receive usual care or usual care plus the intervention, and 851 remained in the study.16 Both the main study and this secondary data analysis were approved by the Institutional Review Boards of each site.
Baseline Measures
Following informed consent and study enrollment, a variety of baseline data were collected on study participants from medical records and patient interview, including primary language, demographic information (age, race, insurance status, income, and education level), cognition (through administration of the 05‐point MiniCog scale),17 and level of health literacy (through use of the 036‐point short form of the Test of Functional Health Literacy in Adults [s‐TOFHLA] scale).18 Baseline information was also collected on medication use, including number of preadmission medications, measurement of self‐reported adherence prior to admission (using the Morisky scale, a validated 04‐point questionnaire shown to correlate with disease control and indicative of general patterns of adherence),19 and a medication understanding score, adapted from other instruments, which quantifies understanding of the indication, dose, and frequency of up to 5 randomly selected preadmission medications on a 03‐point scale.16, 20, 21
Outcome Measures
Outcomes were collected 30 days postdischarge through a structured questionnaire, administered by telephone. Only patients who completed this call are included in the present analysis. Postdischarge medication adherence was assessed by asking patients to report the number of days out of the previous week they had taken each medication from their postdischarge regimen exactly as prescribed.22 A score was calculated for each medication as the proportion of adherent days (eg, if a patient reported missing 2 days of a medication in the previous week, then adherence would be 5/7 or 71%). A global postdischarge adherence score was then derived for each patient by averaging the adherence score for all regularly scheduled medications. This quantitative measure focused on adherence to medications patients knew they should be taking and did not measure medication discrepancies (sometimes termed unintentional nonadherence).
Analysis
Patient characteristics were summarized and reported using simple descriptive statistics. Candidate predictors of postdischarge medication adherence were chosen a priori from patient characteristics assessed during hospital admission. These included patient age, gender, race, ethnicity, marital status, insurance, years of education, presence of primary care physician (PCP), study site, number of preadmission medications, medication understanding, baseline adherence, cognition, and health literacy. Unadjusted results were calculated using univariable linear regression, with each patient's adherence score as the dependent variable and each predictor as the independent variable. Adjusted results were then derived using multivariable linear regression with all the candidate predictors in the model.
Lastly, because of missing data for some predictors, in particular baseline adherence and medication understanding, multiple imputation techniques were used to impute missing data and increase statistical power.23 We used the Markov Chain Monte Carlo (MCMC) method for multiple imputation, which generally assumes that the data came from a normal distribution and that the missing data are missing at random. Because of the essentially normal distribution of the data, and because the amount of missing data was so small (<1% for almost all variables, 5% for baseline adherence, and 8% for medication understanding), we expected little bias and present the complete case analysis, which maximized statistical power.
Two‐sided P values <0.05 were considered significant, and SAS version 9.2 (Cary, NC) was used for all analyses.
RESULTS
Table 1 shows descriptive baseline patient characteristics of study sample (responders) as well as nonresponders at 30 days. For the responders, the mean age of the 646 patients was 61.2 years, 94.7% were insured, and 19.3% had inadequate or marginal health literacy. Patients were prescribed an average of 8 preadmission medications. Most patients (92.3%) had a regular PCP prior to admission. Nonresponders had nonsignificant trends towards having lower health literacy, medication understanding, and baseline medication adherence.
| Characteristic | Total N, 30‐Day Respondents | Value | Total N, Nonrespondents | Value |
|---|---|---|---|---|
| ||||
| Age, mean in yr (SD) | 646 | 61.2 (13.5) | 45 | 55.4 (14.3) |
| Gender, N (percentage) | 646 | 45 | ||
| Female | 272 (42.1) | 18 (40.0) | ||
| Male | 374 (57.9) | 27 (60.0) | ||
| Race, N (percentage) | 643 | 45 | ||
| White | 511 (79.5) | 32 (71.1) | ||
| Black | 104 (16.2) | 11 (24.4) | ||
| Other | 28 (4.4) | 2 (4.4) | ||
| Ethnicity, N (percentage) | 639 | 45 | ||
| Hispanic | 24 (3.8) | 1 (2.2) | ||
| Not Hispanic | 615 (96.2) | 44 (97.8) | ||
| Marital status, N (percentage) | 646 | 45 | ||
| Married/cohabitate | 382 (59.1) | 20 (44.4) | ||
| Separated/divorced | 118 (18.3) | 11 (24.4) | ||
| Widowed | 81 (12.5) | 5 (11.1) | ||
| Never married | 65 (10.1) | 9 (2.0) | ||
| Insurance type, N (percentage) | 646 | 45 | ||
| Medicaid | 53 (8.2) | 5 (11.1) | ||
| Medicare | 270 (41.8) | 13 (28.9) | ||
| Private | 289 (44.7) | 19 (42.2) | ||
| Self‐pay | 34 (5.3) | 8 (17.8) | ||
| Years of education, mean in yr (SD) | 643 | 14.0 (3.1) | 45 | 13.3 (2.7) |
| Presence of PCP prior to admission, N (percentage) | 646 | 45 | ||
| Yes | 596 (92.3) | 38 (84.4) | ||
| No | 50 (7.74) | 7 (15.6) | ||
| Site, N (percentage) | 646 | 45 | ||
| Site 1 | 358 (55.4) | 8 (17.8) | ||
| Site 2 | 288 (44.6) | 37 (82.2) | ||
| No. of preadmission medications, mean no. (SD) | 641 | 7.8 (4.8) | 45 | 7.7 (5.4) |
| Medication understanding score, mean (SD)* | 597 | 2.4 (0.5) | 40 | 2.2 (0.62) |
| Health literacy (s‐TOFHLA) score, mean (SD) | 642 | 29.1 (8.9) | 45 | 26.0 (12.0) |
| Baseline adherence (SD) | 613 | 2.7 (1.1) | 45 | 2.4 (1.2) |
| MiniCog score, N (percentage) | 646 | 45 | ||
| Demented | 63 (9.8) | 5 (11.1) | ||
| Not demented | 583 (90.2) | 40 (88.9) | ||
The average postdischarge adherence score was 95% (standard deviation [SD] = 10.2%), and less than 10% of patients had an adherence score of less than 85%; overall the distribution was left‐skewed. Table 2 illustrates crude and adjusted parameter estimates for variables in the model. Table 3 shows significant findings in the fully adjusted model, which used multiple imputation techniques to account for missing data.
| Predictor | Crude Parameter Estimate (Beta) With 95% Confidence Intervals | P Value | Adjusted Parameter Estimate (Beta) With 95% Confidence Intervals | P Value |
|---|---|---|---|---|
| ||||
| Age per 10 yr | 0.010 (0.007, 0.020) | <0.0001 | 0.010 (0.002, 0.020) | 0.018 |
| Male gender | 0.012 (0.004, 0.028) | 0.137 | 0.003 (0.014, 0.020) | 0.727 |
| Race/ethnicity | ||||
| White | 0.011 (0.009, 0.031) | 0.266 | Ref | Ref |
| Black | 0.017 (0.038, 0.005) | 0.13 | 0.006 (0.017, 0.030) | 0.598 |
| Other | 0.010 (0.029, 0.049) | 0.599 | 0.017 (0.027, 0.062) | 0.446 |
| Hispanic/Latino | 0.005 (0.037, 0.047) | 0.803 | 0.036 (0.013, 0.085) | 0.149 |
| Marital status | ||||
| Married/cohabitate | 0.006 (0.011, 0.022) | 0.500 | Ref | Ref |
| Separated/divorced | 0.005 (0.025, 0.016) | 0.664 | 0.009 (0.014, 0.031) | 0.446 |
| Widowed | 0.001 (0.023, 0.025) | 0.922 | 0.013 (0.039, 0.013) | 0.338 |
| Never married | 0.009 (0.035, 0.018) | 0.515 | 0.004 (0.033, 0.025) | 0.784 |
| Insurance type | ||||
| Private | 0.008 (0.008, 0.024) | 0.347 | Ref | Ref |
| Medicaid | 0.046 (0.075, 0.018) | 0.002 | 0.026 (0.058, 0.007) | 0.121 |
| Medicare | 0.012 (0.004, 0.028) | 0.138 | 0.002 (0.023, 0.018) | 0.844 |
| Self‐pay | 0.027 (0.062, 0.008) | 0.135 | 0.029 (0.073, 0.015) | 0.202 |
| Years of education | 0.003 (0.0003, 0.005) | 0.028 | 0.0001 (0.003, 0.003) | 0.949 |
| Presence of PCP prior to admission | 0.007 (0.022, 0.037) | 0.630 | 0.002 (0.032, 0.036) | 0.888 |
| Site | 0.050 (0.065, 0.034) | <0.0001 | 0.038 (0.056, 0.021) | <0.0001 |
| No. of preadmission medications | 0.0003 (0.002, 0.001) | 0.684 | 0.0001 (0.002, 0.002) | 0.918 |
| Medication understanding score per point | 0.007 (0.009, 0.023) | 0.390 | 0.006 (0.011, 0.023) | 0.513 |
| Health literacy (s‐TOFHLA) score per 10 points | 0.0006 (0.008, 0.01) | 0.897 | 0.003 (0.008, 0.01) | 0.644 |
| Baseline adherence per point | 0.023 (0.016, 0.031) | <0.0001 | 0.017 (0.009, 0.024) | <0.0001 |
| Cognitive function | 0.004 (0.022, 0.031) | 0.757 | 0.008 (0.019, 0.036) | 0.549 |
| Predictor | Parameter Estimate (Beta) With 95% Confidence Intervals | P Value |
|---|---|---|
| ||
| Age per 10 yr | 0.010 (0.004, 0.020) | 0.004 |
| Insurance type | ||
| Private | Ref | Ref |
| Medicaid | 0.045 (0.076, 0.014) | 0.005 |
| Medicare | 0.010 (0.030, 0.010) | 0.333 |
| Self‐pay | 0.013 (0.050, 0.025) | 0.512 |
| Site | 0.036 (0.053, 0.019) | <0.0001 |
| Baseline adherence per point | 0.016 (0.008, 0.024) | <0.0001 |
Intervention arm was of borderline statistical significance in predicting postdischarge adherence (P = 0.052), and so was removed from the final model. Study site, age, insurance, and baseline adherence were the only significant independent predictors of postdischarge adherence in the fully adjusted model (Table 3). For example, for every 10‐year increase in age, patients had, on average, an adjusted 1% absolute increase in their adherence score (95% confidence interval [CI] 0.4% to 2.0%). For every 1‐point increase in baseline medication adherence (based on the Morisky scale), there was a 1.6% absolute increase in medication adherence (95% CI 0.8% to 2.4%). In unadjusted analyses, patients with Medicaid were less adherent with medications after discharge than were patients with private insurance. This difference became nonsignificant in adjusted analyses, but when analyses were repeated using multiple imputation techniques, the results again became statistically significantMedicaid insurance was associated with a 4.5% absolute decrease in postdischarge adherence compared with private insurance (95% CI 7.6% to 1.4%). Study site (specifically, Brigham and Women's Hospital) was also a significant predictor of greater postdischarge medication adherence. Years of education was a significant predictor of adherence in unadjusted analyses, but was not an independent predictor when adjusted for other factors. When baseline adherence was removed from the multiple imputation model, there were no changes in which factors were significant predictors of adherence.
DISCUSSION
In this study, we found that low baseline adherence, younger age, Medicaid insurance, and study site were significant predictors of lower 30‐day medication adherence. Of particular interest is our finding regarding baseline adherence, a simple measure to obtain on hospitalized patients. It is notable that in our study, education was not an independent significant predictor of postdischarge adherence, even when baseline adherence was removed from the model. The same is true for medication understanding, cognitive function, and health literacy.
Older patients appeared more adherent with medications in the month after hospital discharge, perhaps reflecting increased interaction with the healthcare system (appointments, number of physician interactions), a greater belief in the importance of chronic medication management, or a higher level of experience with managing medications. A similar relationship between age and adherence has been shown in outpatient studies of patients with hypertension, diabetes, and other chronic diseases.2427
Medicaid patients may be less likely to remain adherent because of the plan's limited coverage of medications relative to patients' ability to pay. For example, Medicaid in Tennessee covers the first 5 generic medications at no cost to the patient but has co‐payments for additional medications and for brand name drugs. Medicaid in Massachusetts has co‐payments of $1 to $3 for each medication. Alternatively, Medicaid insurance may be a marker for other patient characteristics associated with low adherence for which we were not fully able to adjust.
Site differences were also notable in this study; these differences could have been due to differences in insurance coverage in Tennessee versus Massachusetts (which has near‐universal coverage), differences in types of insurance (eg, fewer patients at Brigham and Women's Hospital had Medicaid than at Vanderbilt), cultural and geographic differences between the 2 locations, or other differences in transitional care between the 2 sites.
This study corroborates previous literature on medication adherence (specifically unintentional nonadherence) in the outpatient setting,4, 811 for example, on the association of younger age with low adherence in certain populations. On the other hand, it may contrast with previous literature which has sometimes shown a relationship between patient education or health literacy and medication adherence.14, 15, 2835 However, previous studies have not focused on the transition from inpatient to outpatient settings. Perhaps intensive medication education in the hospital, even under usual care, mitigates the effects of these factors on postdischarge adherence. Finally, baseline adherence seems to correlate with postdischarge adherence, a finding which makes intuitive sense and has been previously reported for specific medications.36
There are several limitations to this study. Although large, the study was performed at only 2 clinical sites where most patients were white and fairly well‐educated, perhaps because patients admitted to a tertiary care center with ACS or ADHF are more affluent than general medical inpatients as a whole; this may limit generalizability. Postdischarge medication adherence might have been higher than in other patient populations given the nature of the population, possible loss‐to‐follow‐up bias, and the fact that half of the subjects received an intervention designed to improve medication management after discharge; such low rates of nonadherence in our study may have reduced our ability to detect important predictors in our models. In addition, the period of follow‐up was 30 days, thus limiting our findings to short‐term postdischarge medication adherence. Postdischarge medication adherence was based on patient self‐report, which not only assumed that the patient was still managing his/her own medications after discharge, but may also be susceptible to both recall and social acceptability bias, which might overestimate our adherence scores, again limiting our ability to detect important predictors of nonadherence. However, other studies have shown a good correlation between self‐reported medication adherence and other more objective measures,37, 38 and recall was only for 7 days, a measure used previously in the literature39, 40 and one designed to reduce recall bias. Systematic underreporting in certain patient populations is less likely but possible.
In the future, research should focus on targeting patients who have low baseline adherence to evaluate the effects of various interventions on postdischarge medication outcomes. Repeating the study in a population with a high prevalence of low health literacy might be illuminating, given that previous studies have shown that patients with low health literacy have less ability to identify their medications and have less refill adherence.29, 30
In conclusion, in patients hospitalized with cardiovascular disease, predictors of lower postdischarge adherence include younger age, Medicaid insurance, and low baseline adherence. It may be prudent to assess baseline adherence and insurance type in hospitalized patients in order to identify those who may benefit from additional assistance to improve medication adherence and medication safety during transitions in care.
Acknowledgements
Meeting Presentations: SGIM New England Regional Meeting, oral presentation, Boston, MA, March 4, 2011; and SGIM National Meeting, poster presentation, Phoenix, AZ, May 6, 2011. Dr Schnipper had full access to all of the data in the study and takes responsibility for the integrity of the data and the accuracy of the data analysis.
Disclosures: Financial support was provided by R01 HL089755 (NHLBI, Kripalani), K23 HL077597 (NHLBI, Kripalani), K08 HL072806 (NHLBI, Schnipper), T32HP10251‐02 (Cohen), and by the Division of General Medicine, Massachusetts General Hospital and the Harvard Medical School Fellowship in General Medicine and Primary Care (Cohen). Dr Kripalani is a consultant to and holds equity in PictureRx, LLC, which makes patient education tools to improve medication management. PictureRx did not provide materials or funding for this study. All other authors disclose no relevant or financial conflicts of interest.
- ,.Adherence to medication.N Engl J Med.2005;353(5):487–497.
- ,,,.Posthospital medication discrepancies: prevalence and contributing factors.Arch Intern Med.2005;165(16):1842–1847.
- ,.Medication use in the transition from hospital to home.Ann Acad Med Singapore.2008;37(2):136–141.
- ,,,.Medical errors related to discontinuity of care from an inpatient to an outpatient setting.J Gen Intern Med.2003;18(8):646–651.
- ,,,,.The incidence and severity of adverse events affecting patients after discharge from the hospital.Ann Intern Med.2003;138(3):161–167.
- ,,,,.Adverse drug events occurring following hospital discharge.J Gen Intern Med.2005;20(4):317–323.
- ,,, et al.Role of pharmacist counseling in preventing adverse drug events after hospitalization.Arch Intern Med.2006;166(5):565–571.
- ,,.Reconcilable differences: correcting medication errors at hospital admission and discharge.Qual Saf Health Care.2006;15(2):122–126.
- ,.Risk of rehospitalization among bipolar disorder patients who are nonadherent to antipsychotic therapy after hospital discharge.Am J Health Syst Pharm.2009;66(4):358–365.
- ,,,,.Continuity and adherence to long‐term drug treatment by geriatric patients after hospital discharge: a prospective cohort study.Drugs Aging.2008;25(10):861–870.
- ,,,.Medication use among inner‐city patients after hospital discharge: patient‐reported barriers and solutions.Mayo Clin Proc.2008;83(5):529–535.
- ,,,,,.Relationship of health literacy to intentional and unintentional non‐adherence of hospital discharge medications.J Gen Intern Med.2012;27(2):173–178.
- Office of Disease Prevention and Health Promotion, US Department of Health and Human Services.Healthy People 2010. Available at: http://www.healthypeople.gov/Document/pdf/uih/2010uih.pdf. Accessed February 15,2012.
- ,,, et al.Literacy and misunderstanding prescription drug labels.Ann Intern Med.2006;145(12):887–894.
- ,,,,,.Predictors of medication self‐management skill in a low‐literacy population.J Gen Intern Med.2006;21(8):852–856.
- ,,, et al;for the PILL‐CVD Study Group.Rationale and design of the Pharmacist Intervention for Low Literacy in Cardiovascular Disease (PILL‐CVD) study.Circ Cardiovasc Qual Outcomes.2010;3(2):212–219.
- ,,,,.Simplifying detection of cognitive impairment: comparison of the Mini‐Cog and Mini‐Mental State Examination in a multiethnic sample.J Am Geriatr Soc.2005;53(5):871–874.
- .Short Test of Functional Health Literacy in Adults.Snow Camp, NC:Peppercorn Books and Press;1998.
- ,,,.Predictive validity of a medication adherence measure in an outpatient setting.J Clin Hypertens (Greenwich).2008;10(5):348–354.
- ,,,,,.Health literacy and medication understanding among hospitalized adults.J Hosp Med. In press.
- ,,,,,.Health literacy and medication understanding among hospitalized adults.J Hosp Med.2011;6(9):488–493.
- ,,.The summary of diabetes self‐care activities measure: results from 7 studies and a revised scale.Diabetes Care.2000;23(7):943–950.
- .Multiple Imputation for Nonresponse in Surveys.New York, NY:John Wiley 1987.
- ,,, et al.Medication adherence in HIV‐infected adults: effect of patient age, cognitive status, and substance abuse.AIDS.2004;18(suppl 1):S19–S25.
- ,,.Factors associated with antihypertensive drug compliance in 83,884 Chinese patients: a cohort study.J Epidemiol Community Health.2010;64(10):895–901.
- ,,,,,.Adherence to oral hypoglycemic agents in 26,782 Chinese patients: a cohort study.J Clin Pharmacol.2011;51(10):1474–1482.
- ,,,,.Effect of a pharmacy‐based health literacy intervention and patient characteristics on medication refill adherence in an urban health system.Ann Pharmacother.2010;44(1):80–87.
- ,,.Adherence to combination antiretroviral therapies in HIV patients of low health literacy.J Gen Intern Med.1999;14(5):267–273.
- ,,,,,.Factors associated with medication refill adherence in cardiovascular‐related diseases: a focus on health literacy.J Gen Intern Med.2006;21(12):1215–1221.
- ,,,,.Limited health literacy is a barrier to medication reconciliation in ambulatory care.J Gen Intern Med.2007;22(11):1523–1526.
- ,,,,.The impact of low health literacy on surgical practice.Am J Surg.2004;188(3):250–253.
- ,,,,.Relationships between beliefs about medications and adherence.Am J Health Syst Pharm.2009;66(7):657–664.
- ,,,.Health literacy and anticoagulation‐related outcomes among patients taking warfarin.J Gen Intern Med.2006;21(8):841–846.
- ,,,,,.Health literacy, antiretroviral adherence, and HIV‐RNA suppression: a longitudinal perspective.J Gen Intern Med.2006;21(8):835–840.
- ,,, et al.Risk factors for nonadherence to warfarin: results from the IN‐RANGE study.Pharmacoepidemiol Drug Saf.2008;17(9):853–860.
- ,,, et al.Predictors of low clopidogrel adherence following percutaneous coronary intervention.Am J Cardiol.2011;108(6):822–827.
- ,,,,,.Correlation between adherence rates measured by MEMS and self‐reported questionnaires: a meta‐analysis.Health Qual Life Outcomes.2010;8:99.
- ,,,,,.Concordance of adherence measurement using self‐reported adherence questionnaires and medication monitoring devices.Pharmacoeconomics.2010;28(12):1097–1107.
- ,,,.Polypharmacy and medication adherence in patients with type 2 diabetes.Diabetes Care.2003;26(5):1408–1412.
- ,,,.Improving adherence and reducing medication discrepancies in patients with diabetes.Ann Pharmacother.2003;37(7–8):962–969.
Copyright © 2012 Society of Hospital Medicine
Health literacy and medication understanding among hospitalized adults
If you wish to receive credit for this activity, please refer to the website:
Accreditation and Designation Statement
Blackwell Futura Media Services designates this journal‐based CME activity for a maximum of 1 AMA PRA Category 1 Credit. Physicians should only claim credit commensurate with the extent of their participation in the activity.
Blackwell Futura Media Services is accredited by the Accreditation Council for Continuing Medical Education to provide continuing medical education for physicians.
Educational Objectives
Upon completion of this activity, participants will be better able to:
-
Assess the factors associated with reduced medication adherence.
-
Distinguish which components of medication understanding are assessed by the Medication Understanding Questionnaire.
This manuscript underwent peer review in line with the standards of editorial integrity and publication ethics maintained by Journal of Hospital Medicine. The peer reviewers have no relevant financial relationships. The peer review process for Journal of Hospital Medicine is single‐blinded. As such, the identities of the reviewers are not disclosed in line with the standard accepted practices of medical journal peer review.
Conflicts of interest have been identified and resolved in accordance with Blackwell Futura Media Services's Policy on Activity Disclosure and Conflict of Interest. The primary resolution method used was peer review and review by a non‐conflicted expert.
Instructions on Receiving Credit
For information on applicability and acceptance of CME credit for this activity, please consult your professional licensing board.
This activity is designed to be completed within an hour; physicians should claim only those credits that reflect the time actually spent in the activity. To successfully earn credit, participants must complete the activity during the valid credit period, which is up to two years from initial publication.
Follow these steps to earn credit:
-
Log on to www.wileyblackwellcme.com
-
Read the target audience, learning objectives, and author disclosures.
-
Read the article in print or online format.
-
Reflect on the article.
-
Access the CME Exam, and choose the best answer to each question.
-
Complete the required evaluation component of the activity.
This activity will be available for CME credit for twelve months following its publication date. At that time, it will be reviewed and potentially updated and extended for an additional twelve months.
Health Literacy and Medication Use
With the aging of the US population, complex medication regimens to treat multiple comorbidities are increasingly common.1 Nevertheless, patients often do not fully understand the instructions for safe and effective medication use. Aspects of medication understanding include knowledge of the drug indication, dose, frequency, and for certain medications, special instructions.2 Medication understanding is associated with better medication adherence, fewer drug‐related problems, and fewer emergency department visits.3 Among patients with chronic conditions, such as cardiovascular disease (CVD), understanding and adherence to the medication regimen are critical for successful disease control and clinical outcomes.4
Patients' understanding of their medication regimen is also vitally important upon admission to the hospital. Patients often are the main source of information for the admission medication history and subsequent medication reconciliation.5 Poor patient understanding of the preadmission medication regimen can contribute to errors in inpatient and postdischarge medication orders, and adversely affect patient safety.6 However, little research has examined patients' understanding of the preadmission medication regimen and factors that affect it.
In the outpatient setting, previous investigations have suggested that low health literacy, advanced age, and impaired cognitive function adversely affect patients' understanding of medication instructions.2, 7, 8 These studies were limited by a small sample size, single site, or focus on a specific population, such as inner‐city patients. Additionally, the measures used to assess medication understanding were time‐consuming and required patients' medications to be present for testing, thus limiting their utility.2
To address these gaps in the literature, we developed and implemented the Medication Understanding Questionnaire (MUQ), an original and relatively rapid measure that does not require patients' medications be present for testing. In a study of adults at 2 large teaching hospitals, we examined the association of health literacy, age, cognitive function, number of preadmission medications, and other factors on patients' understanding of their preadmission medication regimen. We hypothesized that lower health literacy would be independently associated with lower medication understanding as assessed using the MUQ.
METHODS
The present study was a cross‐sectional assessment conducted using baseline interview data from the Pharmacist Intervention for Low Literacy in Cardiovascular Disease (PILL‐CVD) Study (ClinicalTrials.gov Registration #NCT00632021; available at:
Population
The PILL‐CVD study protocol and eligibility criteria has been previously published.9 Briefly, patients were eligible if they were at least 18 years old and admitted with acute coronary syndrome or acute decompensated heart failure. Patients were excluded if they: were too ill to complete an interview; were not oriented to person, place, or time; had a corrected visual acuity worse than 20/200; had impaired hearing; could not communicate in English or Spanish; were not responsible for managing their own medications; had no phone; were unlikely to be discharged to home; were in police custody; or had been previously enrolled in the study. For the present analysis, we also excluded any patient who was not on at least 1 prescription medication prior to admission. Saline nasal spray, saline eye drops, herbal products, nutritional supplements, vitamins, and over the counter (OTC) lotions and creams were not counted as prescription medications. Oral medications available both OTC and by prescription (eg, aspirin, nonsteroidal anti‐inflammatory drugs, and acid reflux medications) were counted as prescription medications.
Measures
At enrollment, which was usually within 24 to 48 hours of admission, participants completed the short form of the Test of Functional Health Literacy in Adults (s‐TOFHLA) in English or Spanish,10 the Mini‐Cog test of cognition,11 and the Medication Understanding Questionnaire (MUQ), as well as demographic information. The number of prescription medications prior to hospital admission was abstracted from the best available reference listthat documented by the treating physicians in the electronic health record (EHR). The EHR at each site was a home‐grown system and included both inpatient and outpatient records, which facilitated physicians' documentation of the medication list.
The s‐TOFHLA consists of 2 short reading‐comprehension passages. Scores on the s‐TOFHLA range from 0 to 36, and can be categorized as inadequate (0‐16), marginal (17‐22), or adequate (23‐36) health literacy.10 The Mini‐Cog includes 3‐item recall and clock‐drawing tests. It provides a brief measure of cognitive function and performs well among patients with limited literacy or educational attainment.11 Scores range from 0 to 5, with a score <3 indicating possible dementia.
The MUQ was administered verbally and assessed patients' understanding of their own preadmission medication regimen. It was developed for this study, based on published measures of medication understanding.2, 12 To administer the MUQ, research assistants (RAs) accessed the patient's preadmission medication list from the EHR and used a random number table to select up to 5 prescription medications from the list. If the patient was taking 5 or fewer medications, all of their medications were selected. Saline nasal spray, saline eye drops, herbal products, nutritional supplements, vitamins, and OTC lotions and creams were excluded from testing. The RA provided the brand and generic name of each medication, and then asked the patient for the drug's purpose, strength per unit (eg, 20 mg tablet), number of units taken at a time (eg, 2 tablets), and dosing frequency (eg, twice a day). For drugs prescribed on an as‐needed basis, the RA asked patients for the maximum allowable dose and frequency. Patients were instructed to not refer to a medication list or bottles when responding. The RA documented the patient's responses on the MUQ, along with the dosing information from the EHR for each selected medication.
One clinical pharmacist (MM) scored all MUQ forms by applying a set of scoring rules. Each medication score could range from 0 to 3. The components of the score included indication (1 point), strength (0.5 point), units (0.5 point), and frequency (1 point). The patient's overall MUQ score was an average of the MUQ scores for each tested medication.
Statistical Analysis
We summarized patient characteristics, number of preadmission medications, and MUQ scores using median and interquartile range (IRQ) for continuous variables, and frequencies and proportions for categorical variables. We conducted proportional odds logistic regression (ordinal regression) to estimate the effect of s‐TOFHLA score, other patient characteristics, and number of medications on MUQ scores.13
Important covariates were selected a priori based on clinical significance. These included age (continuous), gender, patient self‐reported race (white, black, other nonwhite), Mini‐Cog score (continuous), primary language (English or Spanish), years of education (continuous), number of preadmission medications (continuous), income (ordinal categories), insurance type (categorical), and study site. Covariates with missing data (household income, health literacy, and years of education) were imputed using multiple imputation techniques.14 The relationship between number of preadmission medications and MUQ scores was found to be nonlinear, and it was modeled using restricted cubic splines.14 We also fit models which treated health literacy and cognition as categorical variables. Results are reported as odds ratios (OR) with 95% confidence intervals (CI). Wald tests were used to test for the statistical significance of predictor variables. Two‐sided P values less than 0.05 were considered statistically significant. All analyses were performed using statistical language R (R Foundation, available at:
RESULTS
Baseline Characteristics
Among the 862 patients enrolled in PILL‐CVD, 790 (91.7 %) had at least 1 preadmission medication and were included in this analysis (Table 1). Forty‐seven percent were admitted to VUH (N = 373) and 53% to BWH (N = 417). The median age was 61 (interquartile range [IQR] 52, 71), 77% were white, and 57% were male. Inadequate or marginal health literacy was identified among 11% and 9% of patients, respectively. The median number of preadmission medications was 8 (IQR 5, 11). Patients excluded from the analysis for not having preadmission medications were similar to included patients, except they were more likely to be male (76% vs 57%) and less likely to have health insurance (23% self‐pay vs 4%). (Data available upon request.)
| Characteristic | N = 790 |
|---|---|
| |
| Study hospital, N (%) | |
| Vanderbilt University Hospital | 373 (47.2) |
| Brigham and Women's Hospital | 417 (52.8) |
| Age in years, median (IQR) | 61 (52, 71) |
| Gender, N (%) | |
| Male | 452 (57.2) |
| Female | 338 (42.8) |
| Primary language, N (%) | |
| English | 779 (98.6) |
| Spanish | 11 (1.4) |
| Race, N (%) | |
| White | 610 (77.2) |
| Black or African American | 136 (17.2) |
| Other | 44 (5.6) |
| Health literacy, s‐TOFHLA score, median (IQR) | 33 (25, 35) |
| Health literacy, N (%)& | |
| Inadequate | 84 (10.6) |
| Marginal | 74 (9.4) |
| Adequate | 613 (77.6) |
| Mini‐Cog score, median (IQR) | 4 (3, 5) |
| Dementia, N (%) | |
| No | 692 (87.6) |
| Yes | 98 (12.4) |
| Number of medications, median (IQR) | 8 (5, 11) |
| Health insurance type, N (%) | |
| Medicaid | 74 (9.4) |
| Medicare | 337 (42.6) |
| Private | 334 (42.3) |
| Self‐pay | 35 (4.4) |
| Other | 10 (1.3) |
| Self‐reported household income, N (%)& | |
| <$10,000 | 38 (4.8) |
| $10,000 to <$15,000 | 45 (5.7) |
| $15,000 to <$20,000 | 42 (5.3) |
| $20,000 to <$25,000 | 105 (13.3) |
| $25,000 to <$35,000 | 99 (12.5) |
| $35,000 to <$50,000 | 112 (14.2) |
| $50,000 to <$75,000 | 118 (14.9) |
| $75,000+ | 227 (28.7) |
| Years of school, median (IQR)& | 14 (12, 16) |
MUQ Scores
The MUQ was administered in approximately 5 minutes. The median MUQ score was 2.5 (IQR 2.2, 2.8) (Table 2); 16.3% of patients scored less than 2. Subjects typically achieved high scores for the domains of indication, units, and frequency, while scores on the strength domain were lower (median = 0.2 [IQR 0.1, 0.4], maximum possible = 0.5).
| Median (IQR) | |
|---|---|
| |
| No. of drugs tested | 5 (4, 5) |
| MUQ score* | 2.5 (2.2, 2.8) |
| Indication | 1.0 (0.8, 1.0) |
| Strength | 0.2 (0.1, 0.4) |
| Units | 0.5 (0.4, 0.5) |
| Frequency | 1.0 (0.8, 1.0) |
Predictors of Medication Understanding
Unadjusted relationships of health literacy, cognition, and number of medications with medication understanding are shown in Figure 1 (panels A, B, and C, respectively). The figure demonstrates a linear relationship with both health literacy (Figure 1A) and cognition (Figure 1B), and a nonlinear relationship between number of preadmission medications and MUQ score (Figure 1C).

Adjusted relationships using imputed data for missing covariates are shown in Figure 2. Lower health literacy, cognitive impairment, male gender, and black race were independently associated with lower understanding of preadmission medications. Each 1 point increase in s‐TOFHLA or Mini‐Cog score led to an increase in medication understanding (OR = 1.04; 95% CI, 1.02 to 1.06; P = 0.0001; and OR = 1.24; 95% CI, 1.1 to 1.4; P = 0.001; respectively). Patients with marginal or inadequate health literacy had lower odds of understanding their regimen (OR = 0.53; 95% CI, 0.34 to 0.84; and OR = 0.49; 95% CI, 0.31 to 0.78, respectively) compared to those with adequate health literacy. Impaired cognitive function (Mini‐Cog score <3, indicating dementia) was also associated with lower odds of medication understanding (OR = 0.57; 95% CI, 0.38 to 0.86) compared to those with no cognitive impairment. An increase in the number of preadmission medications (up to 10) was also strongly associated with lower MUQ scores. For each increase by 1 medication, there was a significant decrease in medication understanding, up to 10 medications, beyond which understanding did not significantly decrease further. Patients on 6 medications were about half as likely to understand their medication regimen as patients on only 1 medication (OR = 0.52; 95% CI, 0.36 to 0.75). For patients on 11 medications, the odds of medication understanding were 24% lower than for patients on 6 medications (OR = 0.76; 95% CI, 0.65 to 0.89). Patients' age, years of schooling, and household income were not independently associated with medication understanding. Results were similar using data without multiple imputation.
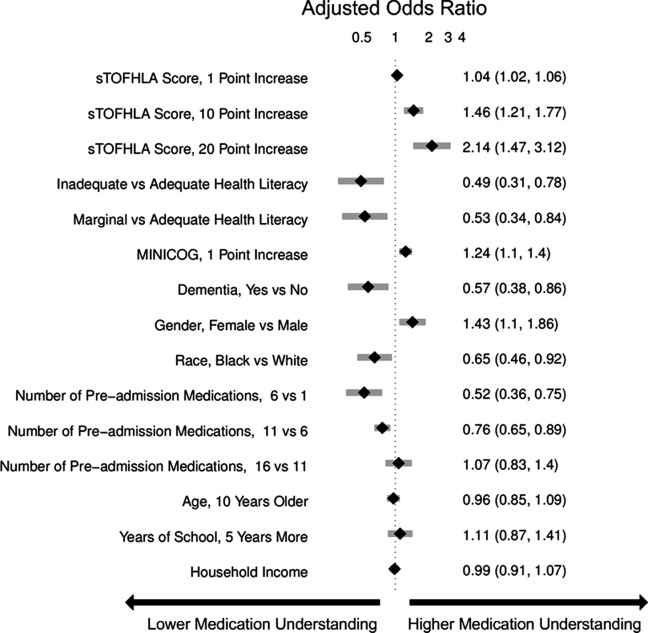
Examples of Misunderstanding of Common Medications
Table 3 provides examples of incorrect patient responses for several commonly prescribed medications or drug classes, including aspirin, digoxin, nitroglycerin, and HMG‐CoA reductase inhibitors (statins). For aspirin, many patients were not aware of the strength. For digoxin, several participants reported splitting a higher‐strength pill to obtain the prescribed dose, which should not be done given the imprecision of splitting and narrow therapeutic index of this drug. Patients prescribed nitroglycerin sublingual tablets were commonly unable to report the correct dosing and frequency for angina treatment. Medications for cholesterol were often reported as being taken in the morning; this was scored strictly as a frequency error if the medication timing in the EHR was listed as evening or bedtime. We also identified many patients with poor understanding of opioid analgesics, particularly regarding their dosing and frequency.
| Medications | Common Incorrect Responses | Correct Information | Coded Error |
|---|---|---|---|
| |||
| Aspirin | tablet twice a day | 1 tablet once a day | Units and frequency |
| I am not aware what aspirin I am taking | 81 mg once a day | Strength | |
| I am taking 6‐something every day | 81 mg once a day | Strength | |
| 31 mg a day | 81 mg once a day | Strength | |
| 180 mg a day | 81 mg once a day | Strength | |
| 1 low‐dose daily | 325 mg once a day | Strength | |
| 125 mg a day | 325 mg once a day | Strength | |
| I am taking it for my blood pressure | Heart medication | Indication | |
| Nitroglycerin sublingual | As needed, I have taken up to 4 a day | Dissolve 1 tablet under the tongue, every 5 min as needed, up to 3 doses | Frequency |
| As needed every 15 min | Frequency | ||
| As needed up to 4 doses every 10 min | Frequency | ||
| Dissolve couple units under the tongue, as needed | Units and frequency | ||
| As many as I want, every 5 min | Frequency | ||
| Digoxin | tablet daily | 1 tablet daily | Units |
| 1 tablet daily | 1 tablet every other day | Frequency | |
| I am taking it for my blood pressure | Heart medication | Indication | |
| HMG‐CoA reductase inhibitors | 1 tablet every morning | 1 tablet every evening | Frequency |
| tablet twice a day | 1 tablet once a day | Units and frequency | |
| I do not know the indication | High cholesterol | Indication | |
| Propoxyphene/acetaminophen | tablet as needed | 1 tablet every 4‐6 hr as needed | Units and frequency |
| Hydrocodone/acetaminophen | I do not know the strength of this medication | 5 mg/500 mg | Strength |
| 1 tablet as I need it | 1 tablet every 4‐6 hr as needed | Frequency | |
DISCUSSION
We used a novel four‐component medication understanding questionnaire, developed for this study, to assess patients' understanding of up to 5 drugs selected randomly from the participant's preadmission medication list. The MUQ proved to be easy to administer by nonmedical staff within a short period of time (approximately 5 minutes per patient). It was well understood by patients. By limiting the assessment to 5 or fewer medications, the MUQ has a distinct advantage over existing measures of medication understanding that require testing the entire regimen. We did not find any limitations related to cutting off the assessment at 5 medications. In addition, this tool affords assessment of medication understanding without requiring medication bottles be present, enhancing its utility in the inpatient setting.
MUQ scores were associated with health literacy and other patient characteristics in an expected manner. We demonstrated that inadequate or marginal health literacy, as well as impaired cognitive function, were associated with low medication understanding. We also were able to demonstrate a relationship between increasing number of medications and lower medication understanding. Interestingly, in our patient population, understanding continued to decrease until reaching 10 medications, beyond which further increases in the number of medications had no additional detrimental effect on medication understanding. This nonlinear relationship between number of medications and medication understanding has potential implications for prescribing practice.
Our findings which utilize the MUQ among inpatients are consistent with prior literature in other settings.2, 7, 8 In a previous outpatient study, we identified that health literacy plays an important role in a patient's ability to successfully report and manage their daily medications.2 Other studies have also shown that patients with low health literacy have more difficulty understanding prescription drug information, and that they often experience medication‐related problems after hospital discharge.15, 16 The number and often the types of medications an individual takes have also been shown to increase the risk for adverse events and nonadherence to the treatment plan.1720 We postulate that this risk of adverse drug events is related at least in part to a patient's understanding of their medication regimen.
There are several limitations to this study. First, the MUQ did not assess certain aspects of medication understanding, such as knowledge of pill appearance or side effects, nor did it assess components of patients' actual drug‐taking behavior, such as organization of medications or behavioral cues. Thus, adaptive behaviors that patients may perform to improve their medication management, such as writing on labels or memory cues, are not captured by this test. Second, in administering and scoring the MUQ, we used the patient's preadmission medication list documented in the EHR as the reference standard. This was the best available reference list, and was generally accurate, as both hospitals had medication reconciliation systems in use at the time of the study21; nevertheless, it may contain inaccuracies. Documentation for certain medications, such as warfarin, in which dose can change frequently, often did not reflect the latest prescribed dose. In such cases, we scored the patient's answer as correct if the dose appeared reasonable and appropriate to the clinical pharmacist. As a result, a patient's MUQ score may have been overestimated in these cases.
Additional research will be needed to further validate the MUQ in other settings. In particular, studies should establish the relationship between the MUQ, serious medication errors after discharge, and potential to benefit from educational interventions. Also, as noted above, the nonlinear relationship between number of medications and medication understanding should be confirmed in other studies.
In conclusion, we demonstrated that patients with low health literacy, impaired cognition, or a higher number of medications had significantly poorer understanding of their preadmission medication regimen. These findings have important clinical implications. It would be appropriate to exercise greater caution when taking a medication history from patients who cannot readily provide the purpose, strength, units, and frequency of their medications. Attempts to validate the information obtained from patients with other sources of data, such as family members, inpatient or outpatient health records, and community pharmacy records should be considered. Patients at high risk for poor medication understanding, either measured directly using the MUQ or identified via risk factors such as polypharmacy, low cognition, or low health literacy, may warrant more intensive medication reconciliation interventions and/or educational counseling and follow‐up to prevent postdischarge adverse drug events. Further research is needed to determine if targeting these populations for interventions improves medication safety during transitions in care.
- ,,.Prevalence, expenditures, and complications of multiple chronic conditions in the elderly.Arch Intern Med.2002;162(20):2269–2276.
- ,,,,,.Predictors of medication self‐management skill in a low‐literacy population.J Gen Intern Med.2006;21(8):852–856.
- ,.Adherence to medication.N Engl J Med.2005;353(5):487–497.
- ,,.Medication adherence: its importance in cardiovascular outcomes.Circulation.2009;119(23):3028–3035.
- ,,, et al.Classifying and predicting errors of inpatient medication reconciliation.J Gen Intern Med.2008;23(9):1414–1422.
- ,.Addressing postdischarge adverse events: a neglected area.Jt Comm J Qual Patient Saf.2008;34(2):85–97.
- ,,.Medication management capacity in highly functioning community‐living older adults: detection of early deficits.J Am Geriatr Soc.1999;47(5):592–596.
- ,,.Variation in medication understanding among the elderly.Am J Health‐Syst Pharm.2004;61(4):373–380.
- ,,, et al.The rationale and design of the Pharmacist Intervention for Low Literacy in Cardiovascular Disease (PILL‐CVD) study.Circ Cardiovasc Qual Outcomes.2010;3:212–219.
- ,,,.Short Test of Functional Health Literacy in Adults.Snow Camp, NC:Peppercorn Books and Press;1998.
- ,,,,.Simplifying detection of cognitive impairment: comparison of the Mini‐Cog and Mini‐Mental State Examination in a multiethnic sample.J Am Geriatr Soc.2005;53(5):871–874.
- ,.Instruments assessing capacity to manage medications.Ann Pharmacother.2008;42(7):1026–1036.
- ,.Estimation of the probability of an event as a function of several independent variables.Biometrika.1967;54(1):167–179.
- ,.Using full probability models to compute probabilities of actual interest to decision makers.Int J Technol Assess Health Care.2001;17(1):17–26.
- ,,, et al.Literacy and misunderstanding prescription drug labels.Ann Intern Med.2006;145(12):887–894.
- ,,,.Medication use among inner‐city patients after hospital discharge: patient reported barriers and solutions.Mayo Clin Proc.2008;83(5):529–535.
- ,,,,,.National surveillance of emergency department visits for outpatient adverse drug events.JAMA.2006;296(15):1858–1866.
- ,,,.Medication use leading to emergency department visits for adverse drug events in older adults.Ann Intern Med.2007;147(11):755–765.
- ,,,,.Adverse drug events occurring following hospital discharge.J Gen Intern Med.2005;20:317–323.
- ,,, et al.Adverse drug events in ambulatory care.N Engl J Med.2003;348(16):1556–1564.
- ,,, et al.Effect of an electronic medication reconciliation application and process redesign on potential adverse drug events: a cluster‐randomized trial.Arch Intern Med.2009;169(8):771–780.
With the aging of the US population, complex medication regimens to treat multiple comorbidities are increasingly common.1 Nevertheless, patients often do not fully understand the instructions for safe and effective medication use. Aspects of medication understanding include knowledge of the drug indication, dose, frequency, and for certain medications, special instructions.2 Medication understanding is associated with better medication adherence, fewer drug‐related problems, and fewer emergency department visits.3 Among patients with chronic conditions, such as cardiovascular disease (CVD), understanding and adherence to the medication regimen are critical for successful disease control and clinical outcomes.4
Patients' understanding of their medication regimen is also vitally important upon admission to the hospital. Patients often are the main source of information for the admission medication history and subsequent medication reconciliation.5 Poor patient understanding of the preadmission medication regimen can contribute to errors in inpatient and postdischarge medication orders, and adversely affect patient safety.6 However, little research has examined patients' understanding of the preadmission medication regimen and factors that affect it.
In the outpatient setting, previous investigations have suggested that low health literacy, advanced age, and impaired cognitive function adversely affect patients' understanding of medication instructions.2, 7, 8 These studies were limited by a small sample size, single site, or focus on a specific population, such as inner‐city patients. Additionally, the measures used to assess medication understanding were time‐consuming and required patients' medications to be present for testing, thus limiting their utility.2
To address these gaps in the literature, we developed and implemented the Medication Understanding Questionnaire (MUQ), an original and relatively rapid measure that does not require patients' medications be present for testing. In a study of adults at 2 large teaching hospitals, we examined the association of health literacy, age, cognitive function, number of preadmission medications, and other factors on patients' understanding of their preadmission medication regimen. We hypothesized that lower health literacy would be independently associated with lower medication understanding as assessed using the MUQ.
METHODS
The present study was a cross‐sectional assessment conducted using baseline interview data from the Pharmacist Intervention for Low Literacy in Cardiovascular Disease (PILL‐CVD) Study (ClinicalTrials.gov Registration #NCT00632021; available at:
Population
The PILL‐CVD study protocol and eligibility criteria has been previously published.9 Briefly, patients were eligible if they were at least 18 years old and admitted with acute coronary syndrome or acute decompensated heart failure. Patients were excluded if they: were too ill to complete an interview; were not oriented to person, place, or time; had a corrected visual acuity worse than 20/200; had impaired hearing; could not communicate in English or Spanish; were not responsible for managing their own medications; had no phone; were unlikely to be discharged to home; were in police custody; or had been previously enrolled in the study. For the present analysis, we also excluded any patient who was not on at least 1 prescription medication prior to admission. Saline nasal spray, saline eye drops, herbal products, nutritional supplements, vitamins, and over the counter (OTC) lotions and creams were not counted as prescription medications. Oral medications available both OTC and by prescription (eg, aspirin, nonsteroidal anti‐inflammatory drugs, and acid reflux medications) were counted as prescription medications.
Measures
At enrollment, which was usually within 24 to 48 hours of admission, participants completed the short form of the Test of Functional Health Literacy in Adults (s‐TOFHLA) in English or Spanish,10 the Mini‐Cog test of cognition,11 and the Medication Understanding Questionnaire (MUQ), as well as demographic information. The number of prescription medications prior to hospital admission was abstracted from the best available reference listthat documented by the treating physicians in the electronic health record (EHR). The EHR at each site was a home‐grown system and included both inpatient and outpatient records, which facilitated physicians' documentation of the medication list.
The s‐TOFHLA consists of 2 short reading‐comprehension passages. Scores on the s‐TOFHLA range from 0 to 36, and can be categorized as inadequate (0‐16), marginal (17‐22), or adequate (23‐36) health literacy.10 The Mini‐Cog includes 3‐item recall and clock‐drawing tests. It provides a brief measure of cognitive function and performs well among patients with limited literacy or educational attainment.11 Scores range from 0 to 5, with a score <3 indicating possible dementia.
The MUQ was administered verbally and assessed patients' understanding of their own preadmission medication regimen. It was developed for this study, based on published measures of medication understanding.2, 12 To administer the MUQ, research assistants (RAs) accessed the patient's preadmission medication list from the EHR and used a random number table to select up to 5 prescription medications from the list. If the patient was taking 5 or fewer medications, all of their medications were selected. Saline nasal spray, saline eye drops, herbal products, nutritional supplements, vitamins, and OTC lotions and creams were excluded from testing. The RA provided the brand and generic name of each medication, and then asked the patient for the drug's purpose, strength per unit (eg, 20 mg tablet), number of units taken at a time (eg, 2 tablets), and dosing frequency (eg, twice a day). For drugs prescribed on an as‐needed basis, the RA asked patients for the maximum allowable dose and frequency. Patients were instructed to not refer to a medication list or bottles when responding. The RA documented the patient's responses on the MUQ, along with the dosing information from the EHR for each selected medication.
One clinical pharmacist (MM) scored all MUQ forms by applying a set of scoring rules. Each medication score could range from 0 to 3. The components of the score included indication (1 point), strength (0.5 point), units (0.5 point), and frequency (1 point). The patient's overall MUQ score was an average of the MUQ scores for each tested medication.
Statistical Analysis
We summarized patient characteristics, number of preadmission medications, and MUQ scores using median and interquartile range (IRQ) for continuous variables, and frequencies and proportions for categorical variables. We conducted proportional odds logistic regression (ordinal regression) to estimate the effect of s‐TOFHLA score, other patient characteristics, and number of medications on MUQ scores.13
Important covariates were selected a priori based on clinical significance. These included age (continuous), gender, patient self‐reported race (white, black, other nonwhite), Mini‐Cog score (continuous), primary language (English or Spanish), years of education (continuous), number of preadmission medications (continuous), income (ordinal categories), insurance type (categorical), and study site. Covariates with missing data (household income, health literacy, and years of education) were imputed using multiple imputation techniques.14 The relationship between number of preadmission medications and MUQ scores was found to be nonlinear, and it was modeled using restricted cubic splines.14 We also fit models which treated health literacy and cognition as categorical variables. Results are reported as odds ratios (OR) with 95% confidence intervals (CI). Wald tests were used to test for the statistical significance of predictor variables. Two‐sided P values less than 0.05 were considered statistically significant. All analyses were performed using statistical language R (R Foundation, available at:
RESULTS
Baseline Characteristics
Among the 862 patients enrolled in PILL‐CVD, 790 (91.7 %) had at least 1 preadmission medication and were included in this analysis (Table 1). Forty‐seven percent were admitted to VUH (N = 373) and 53% to BWH (N = 417). The median age was 61 (interquartile range [IQR] 52, 71), 77% were white, and 57% were male. Inadequate or marginal health literacy was identified among 11% and 9% of patients, respectively. The median number of preadmission medications was 8 (IQR 5, 11). Patients excluded from the analysis for not having preadmission medications were similar to included patients, except they were more likely to be male (76% vs 57%) and less likely to have health insurance (23% self‐pay vs 4%). (Data available upon request.)
| Characteristic | N = 790 |
|---|---|
| |
| Study hospital, N (%) | |
| Vanderbilt University Hospital | 373 (47.2) |
| Brigham and Women's Hospital | 417 (52.8) |
| Age in years, median (IQR) | 61 (52, 71) |
| Gender, N (%) | |
| Male | 452 (57.2) |
| Female | 338 (42.8) |
| Primary language, N (%) | |
| English | 779 (98.6) |
| Spanish | 11 (1.4) |
| Race, N (%) | |
| White | 610 (77.2) |
| Black or African American | 136 (17.2) |
| Other | 44 (5.6) |
| Health literacy, s‐TOFHLA score, median (IQR) | 33 (25, 35) |
| Health literacy, N (%)& | |
| Inadequate | 84 (10.6) |
| Marginal | 74 (9.4) |
| Adequate | 613 (77.6) |
| Mini‐Cog score, median (IQR) | 4 (3, 5) |
| Dementia, N (%) | |
| No | 692 (87.6) |
| Yes | 98 (12.4) |
| Number of medications, median (IQR) | 8 (5, 11) |
| Health insurance type, N (%) | |
| Medicaid | 74 (9.4) |
| Medicare | 337 (42.6) |
| Private | 334 (42.3) |
| Self‐pay | 35 (4.4) |
| Other | 10 (1.3) |
| Self‐reported household income, N (%)& | |
| <$10,000 | 38 (4.8) |
| $10,000 to <$15,000 | 45 (5.7) |
| $15,000 to <$20,000 | 42 (5.3) |
| $20,000 to <$25,000 | 105 (13.3) |
| $25,000 to <$35,000 | 99 (12.5) |
| $35,000 to <$50,000 | 112 (14.2) |
| $50,000 to <$75,000 | 118 (14.9) |
| $75,000+ | 227 (28.7) |
| Years of school, median (IQR)& | 14 (12, 16) |
MUQ Scores
The MUQ was administered in approximately 5 minutes. The median MUQ score was 2.5 (IQR 2.2, 2.8) (Table 2); 16.3% of patients scored less than 2. Subjects typically achieved high scores for the domains of indication, units, and frequency, while scores on the strength domain were lower (median = 0.2 [IQR 0.1, 0.4], maximum possible = 0.5).
| Median (IQR) | |
|---|---|
| |
| No. of drugs tested | 5 (4, 5) |
| MUQ score* | 2.5 (2.2, 2.8) |
| Indication | 1.0 (0.8, 1.0) |
| Strength | 0.2 (0.1, 0.4) |
| Units | 0.5 (0.4, 0.5) |
| Frequency | 1.0 (0.8, 1.0) |
Predictors of Medication Understanding
Unadjusted relationships of health literacy, cognition, and number of medications with medication understanding are shown in Figure 1 (panels A, B, and C, respectively). The figure demonstrates a linear relationship with both health literacy (Figure 1A) and cognition (Figure 1B), and a nonlinear relationship between number of preadmission medications and MUQ score (Figure 1C).
Adjusted relationships using imputed data for missing covariates are shown in Figure 2. Lower health literacy, cognitive impairment, male gender, and black race were independently associated with lower understanding of preadmission medications. Each 1 point increase in s‐TOFHLA or Mini‐Cog score led to an increase in medication understanding (OR = 1.04; 95% CI, 1.02 to 1.06; P = 0.0001; and OR = 1.24; 95% CI, 1.1 to 1.4; P = 0.001; respectively). Patients with marginal or inadequate health literacy had lower odds of understanding their regimen (OR = 0.53; 95% CI, 0.34 to 0.84; and OR = 0.49; 95% CI, 0.31 to 0.78, respectively) compared to those with adequate health literacy. Impaired cognitive function (Mini‐Cog score <3, indicating dementia) was also associated with lower odds of medication understanding (OR = 0.57; 95% CI, 0.38 to 0.86) compared to those with no cognitive impairment. An increase in the number of preadmission medications (up to 10) was also strongly associated with lower MUQ scores. For each increase by 1 medication, there was a significant decrease in medication understanding, up to 10 medications, beyond which understanding did not significantly decrease further. Patients on 6 medications were about half as likely to understand their medication regimen as patients on only 1 medication (OR = 0.52; 95% CI, 0.36 to 0.75). For patients on 11 medications, the odds of medication understanding were 24% lower than for patients on 6 medications (OR = 0.76; 95% CI, 0.65 to 0.89). Patients' age, years of schooling, and household income were not independently associated with medication understanding. Results were similar using data without multiple imputation.
Examples of Misunderstanding of Common Medications
Table 3 provides examples of incorrect patient responses for several commonly prescribed medications or drug classes, including aspirin, digoxin, nitroglycerin, and HMG‐CoA reductase inhibitors (statins). For aspirin, many patients were not aware of the strength. For digoxin, several participants reported splitting a higher‐strength pill to obtain the prescribed dose, which should not be done given the imprecision of splitting and narrow therapeutic index of this drug. Patients prescribed nitroglycerin sublingual tablets were commonly unable to report the correct dosing and frequency for angina treatment. Medications for cholesterol were often reported as being taken in the morning; this was scored strictly as a frequency error if the medication timing in the EHR was listed as evening or bedtime. We also identified many patients with poor understanding of opioid analgesics, particularly regarding their dosing and frequency.
| Medications | Common Incorrect Responses | Correct Information | Coded Error |
|---|---|---|---|
| |||
| Aspirin | tablet twice a day | 1 tablet once a day | Units and frequency |
| I am not aware what aspirin I am taking | 81 mg once a day | Strength | |
| I am taking 6‐something every day | 81 mg once a day | Strength | |
| 31 mg a day | 81 mg once a day | Strength | |
| 180 mg a day | 81 mg once a day | Strength | |
| 1 low‐dose daily | 325 mg once a day | Strength | |
| 125 mg a day | 325 mg once a day | Strength | |
| I am taking it for my blood pressure | Heart medication | Indication | |
| Nitroglycerin sublingual | As needed, I have taken up to 4 a day | Dissolve 1 tablet under the tongue, every 5 min as needed, up to 3 doses | Frequency |
| As needed every 15 min | Frequency | ||
| As needed up to 4 doses every 10 min | Frequency | ||
| Dissolve couple units under the tongue, as needed | Units and frequency | ||
| As many as I want, every 5 min | Frequency | ||
| Digoxin | tablet daily | 1 tablet daily | Units |
| 1 tablet daily | 1 tablet every other day | Frequency | |
| I am taking it for my blood pressure | Heart medication | Indication | |
| HMG‐CoA reductase inhibitors | 1 tablet every morning | 1 tablet every evening | Frequency |
| tablet twice a day | 1 tablet once a day | Units and frequency | |
| I do not know the indication | High cholesterol | Indication | |
| Propoxyphene/acetaminophen | tablet as needed | 1 tablet every 4‐6 hr as needed | Units and frequency |
| Hydrocodone/acetaminophen | I do not know the strength of this medication | 5 mg/500 mg | Strength |
| 1 tablet as I need it | 1 tablet every 4‐6 hr as needed | Frequency | |
DISCUSSION
We used a novel four‐component medication understanding questionnaire, developed for this study, to assess patients' understanding of up to 5 drugs selected randomly from the participant's preadmission medication list. The MUQ proved to be easy to administer by nonmedical staff within a short period of time (approximately 5 minutes per patient). It was well understood by patients. By limiting the assessment to 5 or fewer medications, the MUQ has a distinct advantage over existing measures of medication understanding that require testing the entire regimen. We did not find any limitations related to cutting off the assessment at 5 medications. In addition, this tool affords assessment of medication understanding without requiring medication bottles be present, enhancing its utility in the inpatient setting.
MUQ scores were associated with health literacy and other patient characteristics in an expected manner. We demonstrated that inadequate or marginal health literacy, as well as impaired cognitive function, were associated with low medication understanding. We also were able to demonstrate a relationship between increasing number of medications and lower medication understanding. Interestingly, in our patient population, understanding continued to decrease until reaching 10 medications, beyond which further increases in the number of medications had no additional detrimental effect on medication understanding. This nonlinear relationship between number of medications and medication understanding has potential implications for prescribing practice.
Our findings which utilize the MUQ among inpatients are consistent with prior literature in other settings.2, 7, 8 In a previous outpatient study, we identified that health literacy plays an important role in a patient's ability to successfully report and manage their daily medications.2 Other studies have also shown that patients with low health literacy have more difficulty understanding prescription drug information, and that they often experience medication‐related problems after hospital discharge.15, 16 The number and often the types of medications an individual takes have also been shown to increase the risk for adverse events and nonadherence to the treatment plan.1720 We postulate that this risk of adverse drug events is related at least in part to a patient's understanding of their medication regimen.
There are several limitations to this study. First, the MUQ did not assess certain aspects of medication understanding, such as knowledge of pill appearance or side effects, nor did it assess components of patients' actual drug‐taking behavior, such as organization of medications or behavioral cues. Thus, adaptive behaviors that patients may perform to improve their medication management, such as writing on labels or memory cues, are not captured by this test. Second, in administering and scoring the MUQ, we used the patient's preadmission medication list documented in the EHR as the reference standard. This was the best available reference list, and was generally accurate, as both hospitals had medication reconciliation systems in use at the time of the study21; nevertheless, it may contain inaccuracies. Documentation for certain medications, such as warfarin, in which dose can change frequently, often did not reflect the latest prescribed dose. In such cases, we scored the patient's answer as correct if the dose appeared reasonable and appropriate to the clinical pharmacist. As a result, a patient's MUQ score may have been overestimated in these cases.
Additional research will be needed to further validate the MUQ in other settings. In particular, studies should establish the relationship between the MUQ, serious medication errors after discharge, and potential to benefit from educational interventions. Also, as noted above, the nonlinear relationship between number of medications and medication understanding should be confirmed in other studies.
In conclusion, we demonstrated that patients with low health literacy, impaired cognition, or a higher number of medications had significantly poorer understanding of their preadmission medication regimen. These findings have important clinical implications. It would be appropriate to exercise greater caution when taking a medication history from patients who cannot readily provide the purpose, strength, units, and frequency of their medications. Attempts to validate the information obtained from patients with other sources of data, such as family members, inpatient or outpatient health records, and community pharmacy records should be considered. Patients at high risk for poor medication understanding, either measured directly using the MUQ or identified via risk factors such as polypharmacy, low cognition, or low health literacy, may warrant more intensive medication reconciliation interventions and/or educational counseling and follow‐up to prevent postdischarge adverse drug events. Further research is needed to determine if targeting these populations for interventions improves medication safety during transitions in care.
- ,,.Prevalence, expenditures, and complications of multiple chronic conditions in the elderly.Arch Intern Med.2002;162(20):2269–2276.
- ,,,,,.Predictors of medication self‐management skill in a low‐literacy population.J Gen Intern Med.2006;21(8):852–856.
- ,.Adherence to medication.N Engl J Med.2005;353(5):487–497.
- ,,.Medication adherence: its importance in cardiovascular outcomes.Circulation.2009;119(23):3028–3035.
- ,,, et al.Classifying and predicting errors of inpatient medication reconciliation.J Gen Intern Med.2008;23(9):1414–1422.
- ,.Addressing postdischarge adverse events: a neglected area.Jt Comm J Qual Patient Saf.2008;34(2):85–97.
- ,,.Medication management capacity in highly functioning community‐living older adults: detection of early deficits.J Am Geriatr Soc.1999;47(5):592–596.
- ,,.Variation in medication understanding among the elderly.Am J Health‐Syst Pharm.2004;61(4):373–380.
- ,,, et al.The rationale and design of the Pharmacist Intervention for Low Literacy in Cardiovascular Disease (PILL‐CVD) study.Circ Cardiovasc Qual Outcomes.2010;3:212–219.
- ,,,.Short Test of Functional Health Literacy in Adults.Snow Camp, NC:Peppercorn Books and Press;1998.
- ,,,,.Simplifying detection of cognitive impairment: comparison of the Mini‐Cog and Mini‐Mental State Examination in a multiethnic sample.J Am Geriatr Soc.2005;53(5):871–874.
- ,.Instruments assessing capacity to manage medications.Ann Pharmacother.2008;42(7):1026–1036.
- ,.Estimation of the probability of an event as a function of several independent variables.Biometrika.1967;54(1):167–179.
- ,.Using full probability models to compute probabilities of actual interest to decision makers.Int J Technol Assess Health Care.2001;17(1):17–26.
- ,,, et al.Literacy and misunderstanding prescription drug labels.Ann Intern Med.2006;145(12):887–894.
- ,,,.Medication use among inner‐city patients after hospital discharge: patient reported barriers and solutions.Mayo Clin Proc.2008;83(5):529–535.
- ,,,,,.National surveillance of emergency department visits for outpatient adverse drug events.JAMA.2006;296(15):1858–1866.
- ,,,.Medication use leading to emergency department visits for adverse drug events in older adults.Ann Intern Med.2007;147(11):755–765.
- ,,,,.Adverse drug events occurring following hospital discharge.J Gen Intern Med.2005;20:317–323.
- ,,, et al.Adverse drug events in ambulatory care.N Engl J Med.2003;348(16):1556–1564.
- ,,, et al.Effect of an electronic medication reconciliation application and process redesign on potential adverse drug events: a cluster‐randomized trial.Arch Intern Med.2009;169(8):771–780.
Copyright © 2011 Society of Hospital Medicine