User login
Moving Beyond Readmission Penalties
Containing the rise of healthcare costs has taken on a new sense of urgency in the wake of the recent economic recession and continued growth in the cost of healthcare. Accordingly, many stakeholders seek solutions to improve value (reducing costs while improving care)[1]; hospital readmissions, which are common and costly,[2] have emerged as a key target. The Centers for Medicare and Medicaid Services (CMS) have instituted several programs intended to reduce readmissions, including funding for community‐based, care‐transition programs; penalties for hospitals with elevated risk‐adjusted readmission rates for selected diagnoses; pioneer Accountable Care Organizations (ACOs) with incentives to reduce global costs of care; and Hospital Engagement Networks (HENs) through the Partnership for Patients.[3] A primary aim of these initiatives is to enhance the quality of care transitions as patients are discharged from the hospital.
Though the recent focus on hospital readmissions has appropriately drawn attention to transitions in care, some have expressed concerns. Among these are questions about: 1) the extent to which readmissions truly reflect the quality of hospital care[4]; 2) the preventability of readmissions[5]; 3) limitations in risk‐adjustment techniques[6]; and 4) best practices for preventing readmissions.[7] We believe these concerns stem in part from deficiencies in the state of the science of transitional care, and that future efforts in this area will be hindered without a clear vision of an ideal transition in care. We propose the key components of an ideal transition in care and discuss the implications of this concept as it pertains to hospital readmissions.
THE IDEAL TRANSITION IN CARE
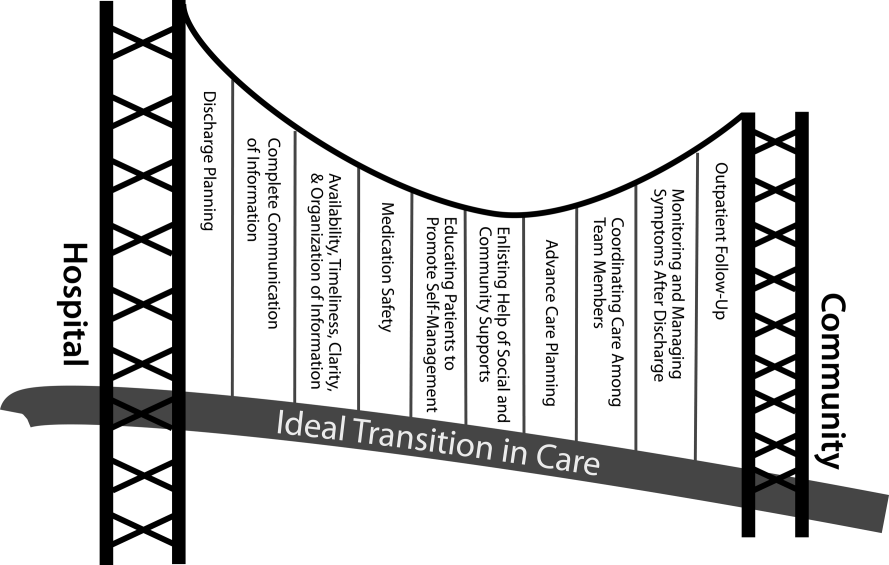
We propose the key components of an ideal transition in care in Figure 1 and Table 1. Figure 1 represents 10 domains described more fully below as structural supports of the bridge patients must cross from one care environment to another during a care transition. This figure highlights key domains and suggests that lack of a domain makes the bridge weaker and more prone to gaps in care and poor outcomes. It also implies that the more components are missing, the less safe is the bridge or transition. Those domains that mainly take place prior to discharge are placed closer to the hospital side of the bridge, those that mainly take place after discharge are placed closer to the community side of the bridge, while those that take place both prior to and after discharge are in the middle. Table 1 provides descriptions of the key content for each of these domains, as well as guidance about which personnel might be involved and where in the transition process that domain should be implemented. We support these domains with supporting evidence where available.
| Domain | Who | When | References |
|---|---|---|---|
| |||
| Discharge planning | |||
| Use a multidisciplinary team to create a discharge plan | Discharging clinician | Predischarge | 911 |
| Collaborate with PCP regarding discharge and follow‐up plan | Care managers/discharge planners | ||
| Arrange follow‐up appointments prior to discharge | Nurses | ||
| Make timely appointments for follow‐up care | |||
| Make appointments that take patient and caregiver's schedules and transportation needs into account | |||
| Complete communication of information | |||
| Includes: | Discharging clinician | Time of discharge | 1214 |
| Patient's full name | |||
| Age | |||
| Dates of admission and discharge | |||
| Names of responsible hospital physicians | |||
| Name of physician preparing discharge summary | |||
| Name of PCP | |||
| Main diagnosis | |||
| Other relevant diagnoses, procedures, and complications | |||
| Relevant findings at admission | |||
| Treatment and response for each active problem | |||
| Results of procedures and abnormal laboratory test results | |||
| Recommendations of any subspecialty consultants | |||
| Patient's functional status at discharge | |||
| Discharge medications | |||
| Follow‐up appointments made and those to be made | |||
| Tests to be ordered and pending tests to be followed‐up | |||
| Counseling provided to patient and caregiver, when applicable | |||
| Contingency planning | |||
| Code status | |||
| Availability, timeliness, clarity, and organization of information | |||
| Timely communication with postdischarge providers verbally (preferred) or by fax/e‐mail | Discharging clinician | Time of discharge | 1214 |
| Timely completion of discharge summary and reliable transmission to postdischarge providers | |||
| Availability of information in medical record | |||
| Use of a structured template with subheadings in discharge communication | |||
| Medication safety | |||
| Take an accurate preadmission medication history | Clinicians | Admission | 1521 |
| Reconcile preadmission medications with all ordered medications at all transfers in care, including discharge | Pharmacists | Throughout hospitalization | |
| Communicate discharge medications to all outpatient providers, including all changes and rationale for those changes | Nurses | Time of discharge | |
| Educating patients, promoting self‐management | |||
| Focus discharge counseling on major diagnoses, medication changes, dates of follow‐up appointments, self‐care instructions, warning signs and symptoms, and who to contact for problems | Clinicians | Daily | 911, 2228, 30 |
| Include caregivers as appropriate | Nurses | Time of discharge | |
| Ensure staff members provide consistent messages | Care managers/discharge planners | Postdischarge | |
| Provide simply written patient‐centered materials with instructions | Transition coaches | ||
| Use teach‐back methods to confirm understanding | |||
| Encourage questions | |||
| Continue teaching during postdischarge follow‐up | |||
| Use transition coaches in high‐risk patients: focus on medication management, keeping a personal medical record, follow‐up appointments, and knowledge of red flags | |||
| Enlisting help of social and community supports | |||
| Assess needs and appropriately arrange for home services | Clinicians | Predischarge and postdischarge | 29, 30 |
| Enlist help of caregivers | Nurses | ||
| Enlist help of community supports | Care managers | ||
| Home health staff | |||
| Advanced care planning | |||
| Establish healthcare proxy | Clinicians | Predischarge and postdischarge | 31, 32 |
| Discuss goals of care | Palliative care staff | ||
| Palliative care consultation (if appropriate) | Social workers | ||
| Enlist hospice services (if appropriate) | Nurses | ||
| Hospice workers | |||
| Coordinating care among team members | |||
| Share medical records | Clinicians | Predischarge and postdischarge | 33 |
| Communicate involving all team members | Nurses | ||
| Optimize continuity of providers and formal handoffs of care | Office personnel | ||
| IT staff | |||
| Monitoring and managing symptoms after discharge | |||
| Monitor for: | Clinicians | Postdischarge | 1113, 28, 3436 |
| Worsening disease control | Nurses | ||
| Medication side effects, discrepancies, nonadherence | Pharmacists | ||
| Therapeutic drug monitoring | Care managers | ||
| Inability to manage conditions at home | Visiting nurses and other home health staff | ||
| Via: | |||
| Postdischarge phone calls | |||
| Home visits | |||
| Postdischarge clinic visits | |||
| Patient hotline | |||
| Availability of inpatient providers after discharge | |||
| Follow‐up with outpatient providers | |||
| Within an appropriate time frame (eg, 7 d or sooner for high‐risk patients) | Clinicians | Postdischarge | 3740 |
| With appropriate providers (eg, most related to reasons for hospitalization, who manage least stable conditions, and/or PCP) | Nurses Pharmacists | ||
| Utilize multidisciplinary teams as appropriate | Care managers | ||
| Ensure appropriate progress along plan of care and safe transition | Office personnel | ||
| Other clinical staff as appropriate | |||
Our concept of an ideal transition in care began with work by Naylor, who described several important components of a safe transition in care, including complete communication of information, patient education, enlisting the help of social and community supports, ensuring continuity of care, and coordinating care among team members.[8] It is supplemented by the Transitions of Care Consensus Policy Statement proposed by representatives from hospital medicine, primary care, and emergency medicine, which emphasized aspects of timeliness and content of communication between providers.[9] Our present articulation of these key components includes 10 organizing domains.
The Discharge Planning domain highlights the important principle of planning ahead for hospital discharge while the patient is still being treated in the hospital, a paradigm espoused by Project RED[10] and other successful care transitions interventions.[11, 12] Collaborating with the outpatient provider and taking the patient and caregiver's preferences for appointment scheduling into account can help ensure optimal outpatient follow‐up.
Complete Communication of Information refers to the content that should be included in discharge summaries and other means of information transfer from hospital to postdischarge care. The specific content areas are based on the Society of Hospital Medicine and Society of General Internal Medicine Continuity of Care Task Force systematic review and recommendations,[13] which takes into account information requested by primary care physicians after discharge.
Availability, Timeliness, Clarity, and Organization of that information is as important as the content because postdischarge providers must be able to access and quickly understand the information they have been provided before assuming care of the patient.[14, 15]
The Medication Safety domain is of central importance because medications are responsible for most postdischarge adverse events.[16] Taking an accurate medication history,[17] reconciling changes throughout the hospitalization,[18] and communicating the reconciled medication regimen to patients and providers across transitions of care can reduce medication errors and improve patient safety.[19, 20, 21, 22]
The Patient Education and Promotion of Self‐Management domain involves teaching patients and their caregivers about the main hospital diagnoses and instructions for self‐care, including medication changes, appointments, and whom to contact if issues arise. Confirming comprehension of instructions through assessments of acute (delirium) and chronic (dementia) cognitive impairments[23, 24, 25, 26] and teach‐back from the patient (or caregiver) is an important aspect of such counseling, as is providing patients and caregivers with educational materials that are appropriate for their level of health literacy and preferred language.[14] High‐risk patients may benefit from patient coaching to improve their self‐management skills.[12] These recommendations are based on years of health literacy research,[27, 28, 29] and such elements are generally included in effective interventions (including Project RED,[10] Naylor and colleagues' Transitional Care Model,[11] and Coleman and colleagues' Care Transitions Intervention[12]).
Enlisting the help of Social and Community Supports is an important adjunct to medical care and is the rationale for the recent increase in CMS funding for community‐based, care‐transition programs. These programs are crucial for assisting patients with household activities, meals, and other necessities during the period of recovery, though they should be distinguished from care management or care coordination interventions, which have not been found to be helpful in preventing readmissions unless high touch in nature.[30, 31]
The Advanced Care Planning domain may begin in the hospital or outpatient setting, and involves establishing goals of care and healthcare proxies, as well as engaging with palliative care or hospice services if appropriate. Emerging evidence supports the intuitive conclusion that this approach prevents readmissions, particularly in patients who do not benefit from hospital readmission.[32, 33]
Attention to the Coordinating Care Among Team Members domain is needed to synchronize efforts across settings and providers. Clearly, many healthcare professionals as well as other involved parties can be involved in helping a single patient during transitions in care. It is vital that they coordinate information, assessments, and plans as a team.[34]
We recognize the domain of Monitoring and Managing Symptoms After Discharge as increasingly crucial as reflected in our growing understanding of the reasons for readmission, especially among patients with fragile conditions such as heart failure, chronic lung disease, gastrointestinal disorders, dementia,[23, 24, 25, 26] and vascular disease.[35] Monitoring for new or worsening symptoms; medication side effects, discrepancies, or nonadherence; and other self‐management challenges will allow problems to be detected and addressed early, before they result in unplanned healthcare utilization. It is noteworthy that successful interventions in this regard rely on in‐home evaluation[13, 14, 29] by nurses rather than telemonitoring, which in isolation has not been effective to date.[36, 37]
Finally, optimal Outpatient Follow‐Up with appropriate postdischarge providers is crucial for providing ideal transitions. These appointments need to be prompt[38, 39] (eg, within 7 days if not sooner for high‐risk patients) and with providers who have a longitudinal relationship to the patient, as prior work has shown increased readmissions when the provider is unfamiliar with the patient.[40] The advantages and disadvantages of hospitalist‐run postdischarge clinics as one way to increase access and expedite follow‐up are currently being explored. Although the optimal content of a postdischarge visit has not been defined, logical tasks to be completed are myriad and imply the need for checklists, adequate time, and a multidisciplinary team of providers.[41]
IMPLICATIONS OF THE IDEAL TRANSITION IN CARE
Our conceptualization of an ideal transition in care provides insight for hospital and healthcare system leadership, policymakers, researchers, clinicians, and educators seeking to improve transitions of care and reduce hospital readmissions. In the sections below, we briefly review commonly cited concerns about the recent focus on readmissions as a quality measure, illustrate how the Ideal Transition in Care addresses these concerns, and propose fruitful areas for future work.
How Does the Framework Address the Extent to Which Readmissions Reflect Hospital Quality?
One of the chief problems with readmissionrates as a hospital quality measure is that many of the factors that influence readmission may not currently be under the hospital's control. The healthcare environment to which a patient is being discharged (and was admitted from in the first place) is an important determinant of readmission.[42] In this context, it is noteworthy that successful interventions to reduce readmission are generally those that focus on outpatient follow‐up, while inpatient‐only interventions have had less success.[7] This is reflected in our framework above, informed by the literature, highlighting the importance of coordination between inpatient and outpatient providers and the importance of postdischarge care, including monitoring and managing symptoms after discharge, prompt follow‐up appointments, the continuation of patient self‐management activities, monitoring for drug‐related problems after discharge, and the effective utilization of community supports. Accountable care organizations, once established, would be responsible for several components of this environment, including the provision of prompt and effective follow‐up care.
The implication of the framework is that if a hospital does not have control over most of the factors that influence its readmission rate, it should see financial incentives to reduce readmission rates as an opportunity to invest in relationships with the outpatient environment from which their patients are admitted and to which they are discharged. One can envision hospitals growing ever‐closer relationships with their network of primary care physician groups, community agencies, and home health services, rehabilitation facilities, and nursing homes through coordinated discharge planning, medication management, patient education, shared electronic medical records, structured handoffs in care, and systems of intensive outpatient monitoring. Our proposed framework, in other words, emphasizes that hospitals cannot reduce their readmission rates by focusing on aspects of care within their walls. They must forge new and stronger relationships with their communities if they are to be successful.
How Does the Framework Help Us Understand Which Readmissions Are Preventable?
Public reporting and financial penalties are currently tied to all‐cause readmission, but preventable readmissions are a more appealing outcome to target. In one study, the ranking of hospitals by all‐cause readmission rate had very little correlation with the ranking by preventable readmission rate.[5] However, researchers have struggled to establish standardized, valid, and reliable measures for determining what proportion of readmissions are in fact preventable, with estimates ranging from 5% to 79% in the published literature.[43]
The difficulty of accurately determining preventability stems from an inadequate understanding of the roles that patient comorbidities, transitional processes of care, individual patient behaviors, and social and environmental determinants of health play in the complex process of hospital recidivism. Our proposed elements of an ideal transition in care provide a structure to frame this discussion and suggest future research opportunities to allow a more accurate and reliable understanding of the spectrum of preventability. Care system leadership can use the framework to rigorously evaluate their readmissions and determine the extent to which the transitions process approached the ideal. For example, if a readmission occurs despite care processes that addressed most of the domains with high fidelity, it becomes much less likely that the readmission was preventable. It should be noted that the converse is not always true: When a transition falls well short of the ideal, it does not always imply that provision of a more ideal transition would necessarily have prevented the readmission, but it does make it more likely.
For educators, the framework may provide insights for trainees into the complexity of the transitions process and vulnerability of patients during this time, highlighting preventable aspects of readmissions that are within the grasp of the discharging clinician or team. It highlights the importance of medication reconciliation, synchronous communication, and predischarge teaching, which are measurable and teachable skills for non‐physician providers, housestaff, and medical students. It also may allow for more structured feedback, for example, on the quality of discharge summaries produced by trainees.
How Could the Framework Improve Risk Adjustment for Between‐Hospital Comparisons?
Under the Patient Protection and Affordable Care Act (PPACA), hospitals will be compared to one another using risk‐standardized readmission rates as a way to penalize poorly performing hospitals. However, risk‐adjustment models have only modest ability to predict hospital readmission.[6] Moreover, current approaches predominantly adjust for patients' medical comorbidities (which are easily measurable), but they do not adequately take into account the growing literature on other factors that influence readmission rates, including a patient's health literacy, visual or cognitive impairment, functional status, language barriers, and community‐level factors such as social supports.[44, 45]
The Ideal Transition of Care provides a comprehensive framework of hospital discharge quality that provides additional process measures on which hospitals could be compared rather than focusing solely on (inadequately) risk‐adjusted readmission rates. Indeed, most other quality and safety measures (such as the National Quality Forum's Safe Practices[46] and The Joint Commission's National Patient Safety Goals),[47] emphasize process over outcome, in part because of issues of fairness. Process measures are less subject to differences in patient populations and also change the focus from simply reducing readmissions to improving transitional care more broadly. These process measures should be based on our framework and should attempt to capture as many dimensions of an optimal care transition as possible.
Possible examples of process measures include: the accuracy of medication reconciliation at admission and discharge; provision of prompt outpatient follow‐up; provision of adequate systems to monitor and manage symptoms after discharge; advanced care planning in appropriate patients; and the quality of discharge education, incorporating measurements of the patient's understanding and ability to self‐manage their illness. At least some of these could be used now as part of a performance measurement set that highlights opportunities for immediate system change and can serve as performance milestones.
The framework could also be used to validate risk‐adjustment techniques. After accounting for patient factors, the remaining variability in outcomes should be accounted for by processes of care that are in the transitions framework. Once these processes are accurately measured, one can determine if indeed the remaining variability is due to transitions processes, or rather unaccounted factors that are not being measured and that hospitals may have little control over. Such work can lead to iterative refinement of patient risk‐adjustment models.
What Does the Framework Imply About Best Practices for Reducing Readmission Rates?
Despite the limitations of readmission rates as a quality measure noted above, hospitals presently face potentially large financial penalties for readmissions and are allocating resources to readmission reduction efforts. However, hospitals currently may not have enough guidance to know what actions to take to reduce readmissions, and thus could be spending money inefficiently and reducing the value proposition of focusing on readmissions.
A recent systematic review of interventions hospitals could employ to reduce readmissions identified several positive studies, but also many negative studies, and there were significant barriers to understanding what works to reduce readmissions.[7] For example, most of the interventions described in both positive and negative studies were multifaceted, and the authors were unable to identify which components of the intervention were most effective. Also, while several studies have identified risk factors for readmission,[6, 48, 49] very few studies have identified which subgroups of patients benefit most from specific interventions. Few of the studies described key contextual factors that may have led to successful or failed implementation, or the fidelity with which the intervention was implemented.[50, 51, 52]
Few if any of the studies were guided by a concept of the ideal transition in care.[10] Such a framework will better guide development of multifaceted interventions and provide an improved means for interpreting the results. Clearly, rigorously conducted, multicenter studies of readmission prevention interventions are needed to move the field forward. These studies should: 1) correlate implementation of specific intervention components with reductions in readmission rates to better understand the most effective components; 2) be adequately powered to show effect modification, ie, which patients benefit most from these interventions; and 3) rigorously measure environmental context and intervention fidelity, and employ mixed methods to better understand predictors of implementation success and failure.
Our framework can be used in the design and evaluation of such interventions. For example, interventions could be designed that incorporate as many of the domains of an ideal transition as possible, in particular those that span the inpatient and outpatient settings. Processes of care metrics can be developed that measure the extent to which each domain is delivered, analogous to the way the Joint Commission might aggregate individual scores on the 10 items in Acute Myocardial Infarction Core Measure Set[53] to provide a composite of the quality of care provided to patients with this diagnosis. These can be used to correlate certain intervention components with success in reducing readmissions and also in measuring intervention fidelity.
NEXT STEPS
For hospital and healthcare system leaders, who need to take action now to avoid financial penalties, we recommend starting with proven, high‐touch interventions such as Project RED and the Care Transitions Intervention, which are durable, cost‐effective, robustly address multiple domains of the Ideal Transition in Care, and have been implemented at numerous sites.[54, 55] Each hospital or group will need to decide on a bundle of interventions and customize them based on local workflow, resources, and culture.
Risk‐stratification, to match the intensity of the intervention to the risk of readmission of the patient, will undoubtedly be a key component for the efficient use of resources. We anticipate future research will allow risk stratification to be a robust part of any implementation plan. However, as noted above, current risk prediction models are imperfect,[6] and more work is needed to determine which patients benefit most from which interventions. Few if any studies have described interventions tailored to risk for this reason.
Based on our ideal transition in care, our collective experience, and published evidence,[7, 10, 11, 12] potential elements to start with include: early discharge planning; medication reconciliation[56]; patient/caregiver education using health literacy principles, cognitive assessments, and teach‐back to confirm understanding; synchronous communication (eg, by phone) between inpatient and postdischarge providers; follow‐up phone calls to patients within 72 hours of discharge; 24/7 availability of a responsible inpatient provider to address questions and problems (both from the patient/caregiver and from postdischarge providers); and prompt appointments for patients discharged home. High‐risk patients will likely require additional interventions, including in‐home assessments, disease‐monitoring programs, and/or patient coaching. Lastly, patients with certain conditions prone to readmission (such as heart failure and chronic obstructive pulmonary disease) may benefit from disease‐specific programs, including patient education, outpatient disease management, and monitoring protocols.
It is likely that the most effective interventions are those that come from combined, coordinated interventions shared between inpatient and outpatient settings, and are intensive in nature. We expect that the more domains in the framework that are addressed, the safer and more seamless transitions in care will be, with improvement in patient outcomes. To the extent that fragmentation of care has been a barrier to the implementation of these types of interventions in the past, ACOs, perhaps with imbedded Patient‐Centered Medical Homes, may be in the best position to take advantage of newly aligned financial incentives to design comprehensive transitional care. Indeed, we anticipate that Figure 1 may provide substrate for a discussion of postdischarge care and division of responsibilities between inpatient and outpatient care teams at the time of transition, so effort is not duplicated and multiple domains are addressed.
Other barriers to implementation of ideal transitions in care will continue to be an issue for most healthcare systems. Financial constraints that have been a barrier up until now will be partially overcome by penalties for high readmission rates and by ACOs, bundled payments, and alternative care contracts (ie, global payments), but the extent to which each institution feels rewarded for investing in transitional interventions will vary greatly. Healthcare leadership that sees the value of improving transitions in care will be critical to overcoming this barrier. Competing demands (such as lowering hospital length of stay and carrying out other patient care responsibilities),[57] lack of coordination and diffusion of responsibility among various clinical personnel, and lack of standards are other barriers[58] that will require clear prioritization from leadership, policy changes, team‐based care, provider education and feedback, and adequate allocation of personnel resources. In short, process redesign using continuous quality improvement efforts and effective tools will be required to maximize the possibility of success.
CONCLUSIONS
Readmissions are costly and undesirable. Intuition suggests they are a marker of poor care and that hospitals should be capable of reducing them, thereby improving care and decreasing costs. In a potential future world of ACOs based on global payments, financial incentives would be aligned for each system to reduce readmissions below their current baseline, therefore obviating the need for external financial rewards and penalties. In the meantime, financial penalties do exist, and controversy exists over their fairness and likelihood of driving appropriate behavior. To address these controversies and promote better transitional care, we call for the development and use of multifaceted, collaborative transitions interventions that span settings, risk‐adjustment models that allow for fairer comparisons among hospitals, better and more widespread measurement of processes of transitional care, a better understanding of what interventions are most effective and in whom, and better guidance in how to implement these interventions. Our conceptualization of an ideal transition of care serves as a guide and provides a common vocabulary for these efforts. Such research is likely to produce the knowledge needed for healthcare systems to improve transitions in care, reduce readmissions, and reduce costs.
Disclosure
Funding for Dr Vasilevskis has been provided by the National Institutes of Health (K23AG040157) and the VA Tennessee Valley Geriatric Research, Education and Clinical Center (GRECC). The content is solely the responsibility of the authors and does not necessarily represent the official views of the National Institute on Aging, the National Institutes of Health, or the US Department of Veterans Affairs.
- , . Redefining Health Care: Creating Value‐Based Competition on Results. Boston, MA:Harvard Business School Press;2006.
- , , . Rehospitalizations among patients in the Medicare fee‐for‐service program. N Engl J Med. 2009;360(14):1418–1428.
- Patient Protection and Affordable Care Act (PPACA). Public Law 111–148; 2010. Available at: http://www.gpo.gov/fdsys/pkg/PLAW‐111publ148/pdf/PLAW‐111publ148.pdf. Accessed on June 4, 2012.
- , . Hospital readmission as an accountability measure. JAMA. 2011;305(5):504–505.
- , , , et al. Incidence of potentially avoidable urgent readmissions and their relation to all‐cause urgent readmissions. Can Med Assoc J. 2011;183(14):E1067–E1072.
- , , , et al. Risk prediction models for hospital readmission: a systematic review. JAMA. 2011;306(15):1688–1698.
- , , , , . Interventions to reduce 30‐day rehospitalization: a systematic review. Ann Intern Med. 2011;155(8):520–528.
- . A decade of transitional care research with vulnerable elders. J Cardiovasc Nurs. 2000;14(3):1–14.
- , , , et al;for the American College of Physicians; Society of General Internal Medicine; Society of Hospital Medicine; American Geriatrics Society; American College of Emergency Physicians; Society of Academic Emergency Medicine. Transitions of Care Consensus Policy Statement American College of Physicians–Society of General Internal Medicine–Society of Hospital Medicine–American Geriatrics Society–American College of Emergency Physicians–Society of Academic Emergency Medicine. J Gen Intern Med. 2009;24(8):971–976.
- , , , et al. A reengineered hospital discharge program to decrease rehospitalization: a randomized trial. Ann Intern Med. 2009;150(3):178–187.
- , , , et al. Comprehensive discharge planning and home follow‐up of hospitalized elders: a randomized clinical trial. JAMA. 1999;281(7):613–620.
- , , , . The care transitions intervention: results of a randomized controlled trial. Arch Intern Med. 2006;166(17):1822–1828.
- , , , , , . Deficits in communication and information transfer between hospital‐based and primary care physicians: implications for patient safety and continuity of care. JAMA. 2007;297(8):831–841.
- , , , . Promoting effective transitions of care at hospital discharge: a review of key issues for hospitalists. J Hosp Med. 2007;2(5):314–323.
- , , , , , . Discharge documentation of patients discharged to subacute facilities: a three‐year quality improvement process across an integrated health care system. Jt Comm J Qual Patient Saf. 2010;36(6):243–251.
- , , , , . The incidence and severity of adverse events affecting patients after discharge from the hospital. Ann Intern Med. 2003;138(3):161–167.
- , , , , , . Frequency, type and clinical importance of medication history errors at admission to hospital: a systematic review. Can Med Assoc J. 2005;173(5):510–515.
- , , , et al. Classifying and predicting errors of inpatient medication reconciliation. J Gen Intern Med. 2008;23(9):1414–1422.
- , , et al;for the PILL‐CVD (Pharmacist Intervention for Low Literacy in Cardiovascular Disease) Study Group. Effect of a pharmacist intervention on clinically important medication errors after hospital discharge: a randomized trial. Ann Intern Med. 2012;157(1):1–10.
- , , , . Hospital‐based medication reconciliation practices: a systematic review. Arch Intern Med. 2012;172(14):1057–1069.
- , , , et al. Effect of an electronic medication reconciliation application and process redesign on potential adverse drug events: a cluster‐randomized trial. Arch Intern Med. 2009;169(8):771–780.
- , , , et al. Role of pharmacist counseling in preventing adverse drug events after hospitalization. Arch Intern Med. 2006;166(5):565–571.
- , , , , . Insufficient help for activity of daily living disabilities and risk of all–cause hospitalization. J Am Geriatr Soc. 2012;60(5):927–933.
- , , , et al. Transitions in care for older adults with and without dementia. J Am Geriatr Soc. 2012;60(5):813–820.
- , , , , . Association of incident dementia with hospitalizations. JAMA. 2012;307(2):165–172.
- , , , et al. Potentially avoidable hospitalizations of dually eligible Medicare and Medicaid beneficiaries from nursing facility and home– and community–based services waiver programs. J Am Geriatr Soc. 2012;60(5):821–829.
- , . Teaching about health literacy and clear communication. J Gen Intern Med. 2006;21(8):888–890.
- , , , et al. Health literacy and outcomes among patients with heart failure. JAMA. 2011;305(16):1695–1701.
- , , , , . Patient experiences of transitioning from hospital to home: an ethnographic quality improvement project. J Hosp Med. 2012;7(5):382–387.
- , , , . Effects of care coordination on hospitalization, quality of care, and health care expenditures among Medicare beneficiaries: 15 randomized trials. JAMA. 2009;301(6):603–618.
- , , , , . How changes in Washington University's Medicare coordinated care demonstration pilot ultimately achieved savings. Health Aff (Millwood). 2012;31(6):1216–1226.
- , , , et al. Quality of care and rehospitalization rate in the last stage of disease in brain tumor patients assisted at home: a cost effectiveness study. J Palliat Med. 2012;15(2):225–227.
- , , , , . Inpatient palliative care consults and the probability of hospital readmission. Perm J. 2011;15(2):48–51.
- , , , et al. TeamSTEPPS™: team strategies and tools to enhance performance and patient safety. In: Henriksen K, Battles JB, Keyes MA, Grady ML, ed. Advances in Patient Safety: New Directions and Alternative Approaches. Vol 3: Performance and Tools. Rockville, MD:Agency for Healthcare Research and Quality; August2008.
- , , , et al. Factors contributing to all‐cause 30‐day readmissions: a structured case series across 18 hospitals. Med Care. 2012;50(7):599–605.
- , , , et al. Telemonitoring in patients with heart failure [erratum, N Engl J Med. 2011;364(5):490]. N Engl J Med. 2010;363(24):2301–2309.
- , , , et al. A randomized controlled trial of telemonitoring in older adults with multiple health issues to prevent hospitalizations and emergency department visits. Arch Intern Med. 2012;172(10):773–779.
- , , , et al. Relationship between early physician follow‐up and 30‐day readmission among Medicare beneficiaries hospitalized for heart failure. JAMA. 2010;303(17):1716–1722.
- , , . Post‐hospitalization transitions: examining the effects of timing of primary care provider follow‐up. J Hosp Med. 2010;5(7):392–397.
- , , . Does increased access to primary care reduce hospital readmissions? Veterans Affairs Cooperative Study Group on Primary Care and Hospital Readmission. N Engl J Med. 1996;334(22):1441–1447.
- . The Post‐Hospital Follow‐Up Visit: A Physician Checklist to Reduce Readmissions. California Healthcare Foundation; October 2010. Available at: http://www.chcf.org/publications/2010/10/the‐post‐hospital‐follow‐up‐visit‐a‐physician‐checklist. Accessed on January 10, 2012.
- , , . Thirty‐day readmission rates for Medicare beneficiaries by race and site of care. JAMA. 2011;305(7):675–681.
- , , , , . Proportion of hospital readmissions deemed avoidable: a systematic review. Can Med Assoc J. 2011;183(7):E391–E402.
- , , , et al. Postdischarge environmental and socioeconomic factors and the likelihood of early hospital readmission among community‐dwelling Medicare beneficiaries. Gerontologist. 2008;48(4):495–504.
- , , , , . Low health literacy and health outcomes: an updated systematic review. Ann Intern Med. 2011;155(2):97–107.
- National Quality Forum. Safe Practices for Better Healthcare—2010 Update: A Consensus Report. Washington, DC;2010.
- Joint Commission on Accreditation of Healthcare Organizations. Accreditation Program: Hospital 2010 National Patient Safety Goals (NPSGs). 2010. Available at: http://www.jointcommission.org/PatientSafety/NationalPatientSafetyGoals/. Accessed on March 20, 2012.
- , , , et al. Hospital readmission in general medicine patients: a prediction model. J Gen Intern Med. 2010;25(3):211–219.
- , , , et al. Derivation and validation of an index to predict early death or unplanned readmission after discharge from hospital to the community. Can Med Assoc J. 2010;182(6):551–557.
- , . Evaluating service delivery interventions to enhance patient safety. BMJ. 2008;337:a2764.
- , , . Assessing the Evidence for Context‐Sensitive Effectiveness and Safety of Patient Safety Practices: Developing Criteria. Rockville, MD:Agency for Healthcare Research and Quality; December2010.
- , , , et al. Advancing the science of patient safety. Ann Intern Med. 2011;154(10):693–696.
- The Joint Commission. Acute Myocardial Infarction Core Measure Set. Available at: http://www.jointcommission.org/assets/1/6/Acute%20Myocardial%20Infarction.pdf. Accessed August 20,2012.
- , , , , , . The care transitions intervention: translating from efficacy to effectiveness. Arch Intern Med. 2011;171(14):1232–1237.
- Project RED toolkit, AHRQ Innovations Exchange. Available at:http://www.innovations.ahrq.gov/content.aspx?id=2180. Accessed on July 2, 2012.
- , , , et al. A comprehensive pharmacist intervention to reduce morbidity in patients 80 years or older: a randomized controlled trial. Arch Intern Med. 2009;169(9):894–900.
- , . Thirty‐day readmissions—truth and consequences. N Engl J Med. 2012;366(15):1366–1369.
- , , , , . “Out of sight, out of mind”: housestaff perceptions of quality‐limiting factors in discharge care at teaching hospitals. J Hosp Med. 2012;7(5):376–381.
Containing the rise of healthcare costs has taken on a new sense of urgency in the wake of the recent economic recession and continued growth in the cost of healthcare. Accordingly, many stakeholders seek solutions to improve value (reducing costs while improving care)[1]; hospital readmissions, which are common and costly,[2] have emerged as a key target. The Centers for Medicare and Medicaid Services (CMS) have instituted several programs intended to reduce readmissions, including funding for community‐based, care‐transition programs; penalties for hospitals with elevated risk‐adjusted readmission rates for selected diagnoses; pioneer Accountable Care Organizations (ACOs) with incentives to reduce global costs of care; and Hospital Engagement Networks (HENs) through the Partnership for Patients.[3] A primary aim of these initiatives is to enhance the quality of care transitions as patients are discharged from the hospital.
Though the recent focus on hospital readmissions has appropriately drawn attention to transitions in care, some have expressed concerns. Among these are questions about: 1) the extent to which readmissions truly reflect the quality of hospital care[4]; 2) the preventability of readmissions[5]; 3) limitations in risk‐adjustment techniques[6]; and 4) best practices for preventing readmissions.[7] We believe these concerns stem in part from deficiencies in the state of the science of transitional care, and that future efforts in this area will be hindered without a clear vision of an ideal transition in care. We propose the key components of an ideal transition in care and discuss the implications of this concept as it pertains to hospital readmissions.
THE IDEAL TRANSITION IN CARE
We propose the key components of an ideal transition in care in Figure 1 and Table 1. Figure 1 represents 10 domains described more fully below as structural supports of the bridge patients must cross from one care environment to another during a care transition. This figure highlights key domains and suggests that lack of a domain makes the bridge weaker and more prone to gaps in care and poor outcomes. It also implies that the more components are missing, the less safe is the bridge or transition. Those domains that mainly take place prior to discharge are placed closer to the hospital side of the bridge, those that mainly take place after discharge are placed closer to the community side of the bridge, while those that take place both prior to and after discharge are in the middle. Table 1 provides descriptions of the key content for each of these domains, as well as guidance about which personnel might be involved and where in the transition process that domain should be implemented. We support these domains with supporting evidence where available.
| Domain | Who | When | References |
|---|---|---|---|
| |||
| Discharge planning | |||
| Use a multidisciplinary team to create a discharge plan | Discharging clinician | Predischarge | 911 |
| Collaborate with PCP regarding discharge and follow‐up plan | Care managers/discharge planners | ||
| Arrange follow‐up appointments prior to discharge | Nurses | ||
| Make timely appointments for follow‐up care | |||
| Make appointments that take patient and caregiver's schedules and transportation needs into account | |||
| Complete communication of information | |||
| Includes: | Discharging clinician | Time of discharge | 1214 |
| Patient's full name | |||
| Age | |||
| Dates of admission and discharge | |||
| Names of responsible hospital physicians | |||
| Name of physician preparing discharge summary | |||
| Name of PCP | |||
| Main diagnosis | |||
| Other relevant diagnoses, procedures, and complications | |||
| Relevant findings at admission | |||
| Treatment and response for each active problem | |||
| Results of procedures and abnormal laboratory test results | |||
| Recommendations of any subspecialty consultants | |||
| Patient's functional status at discharge | |||
| Discharge medications | |||
| Follow‐up appointments made and those to be made | |||
| Tests to be ordered and pending tests to be followed‐up | |||
| Counseling provided to patient and caregiver, when applicable | |||
| Contingency planning | |||
| Code status | |||
| Availability, timeliness, clarity, and organization of information | |||
| Timely communication with postdischarge providers verbally (preferred) or by fax/e‐mail | Discharging clinician | Time of discharge | 1214 |
| Timely completion of discharge summary and reliable transmission to postdischarge providers | |||
| Availability of information in medical record | |||
| Use of a structured template with subheadings in discharge communication | |||
| Medication safety | |||
| Take an accurate preadmission medication history | Clinicians | Admission | 1521 |
| Reconcile preadmission medications with all ordered medications at all transfers in care, including discharge | Pharmacists | Throughout hospitalization | |
| Communicate discharge medications to all outpatient providers, including all changes and rationale for those changes | Nurses | Time of discharge | |
| Educating patients, promoting self‐management | |||
| Focus discharge counseling on major diagnoses, medication changes, dates of follow‐up appointments, self‐care instructions, warning signs and symptoms, and who to contact for problems | Clinicians | Daily | 911, 2228, 30 |
| Include caregivers as appropriate | Nurses | Time of discharge | |
| Ensure staff members provide consistent messages | Care managers/discharge planners | Postdischarge | |
| Provide simply written patient‐centered materials with instructions | Transition coaches | ||
| Use teach‐back methods to confirm understanding | |||
| Encourage questions | |||
| Continue teaching during postdischarge follow‐up | |||
| Use transition coaches in high‐risk patients: focus on medication management, keeping a personal medical record, follow‐up appointments, and knowledge of red flags | |||
| Enlisting help of social and community supports | |||
| Assess needs and appropriately arrange for home services | Clinicians | Predischarge and postdischarge | 29, 30 |
| Enlist help of caregivers | Nurses | ||
| Enlist help of community supports | Care managers | ||
| Home health staff | |||
| Advanced care planning | |||
| Establish healthcare proxy | Clinicians | Predischarge and postdischarge | 31, 32 |
| Discuss goals of care | Palliative care staff | ||
| Palliative care consultation (if appropriate) | Social workers | ||
| Enlist hospice services (if appropriate) | Nurses | ||
| Hospice workers | |||
| Coordinating care among team members | |||
| Share medical records | Clinicians | Predischarge and postdischarge | 33 |
| Communicate involving all team members | Nurses | ||
| Optimize continuity of providers and formal handoffs of care | Office personnel | ||
| IT staff | |||
| Monitoring and managing symptoms after discharge | |||
| Monitor for: | Clinicians | Postdischarge | 1113, 28, 3436 |
| Worsening disease control | Nurses | ||
| Medication side effects, discrepancies, nonadherence | Pharmacists | ||
| Therapeutic drug monitoring | Care managers | ||
| Inability to manage conditions at home | Visiting nurses and other home health staff | ||
| Via: | |||
| Postdischarge phone calls | |||
| Home visits | |||
| Postdischarge clinic visits | |||
| Patient hotline | |||
| Availability of inpatient providers after discharge | |||
| Follow‐up with outpatient providers | |||
| Within an appropriate time frame (eg, 7 d or sooner for high‐risk patients) | Clinicians | Postdischarge | 3740 |
| With appropriate providers (eg, most related to reasons for hospitalization, who manage least stable conditions, and/or PCP) | Nurses Pharmacists | ||
| Utilize multidisciplinary teams as appropriate | Care managers | ||
| Ensure appropriate progress along plan of care and safe transition | Office personnel | ||
| Other clinical staff as appropriate | |||
Our concept of an ideal transition in care began with work by Naylor, who described several important components of a safe transition in care, including complete communication of information, patient education, enlisting the help of social and community supports, ensuring continuity of care, and coordinating care among team members.[8] It is supplemented by the Transitions of Care Consensus Policy Statement proposed by representatives from hospital medicine, primary care, and emergency medicine, which emphasized aspects of timeliness and content of communication between providers.[9] Our present articulation of these key components includes 10 organizing domains.
The Discharge Planning domain highlights the important principle of planning ahead for hospital discharge while the patient is still being treated in the hospital, a paradigm espoused by Project RED[10] and other successful care transitions interventions.[11, 12] Collaborating with the outpatient provider and taking the patient and caregiver's preferences for appointment scheduling into account can help ensure optimal outpatient follow‐up.
Complete Communication of Information refers to the content that should be included in discharge summaries and other means of information transfer from hospital to postdischarge care. The specific content areas are based on the Society of Hospital Medicine and Society of General Internal Medicine Continuity of Care Task Force systematic review and recommendations,[13] which takes into account information requested by primary care physicians after discharge.
Availability, Timeliness, Clarity, and Organization of that information is as important as the content because postdischarge providers must be able to access and quickly understand the information they have been provided before assuming care of the patient.[14, 15]
The Medication Safety domain is of central importance because medications are responsible for most postdischarge adverse events.[16] Taking an accurate medication history,[17] reconciling changes throughout the hospitalization,[18] and communicating the reconciled medication regimen to patients and providers across transitions of care can reduce medication errors and improve patient safety.[19, 20, 21, 22]
The Patient Education and Promotion of Self‐Management domain involves teaching patients and their caregivers about the main hospital diagnoses and instructions for self‐care, including medication changes, appointments, and whom to contact if issues arise. Confirming comprehension of instructions through assessments of acute (delirium) and chronic (dementia) cognitive impairments[23, 24, 25, 26] and teach‐back from the patient (or caregiver) is an important aspect of such counseling, as is providing patients and caregivers with educational materials that are appropriate for their level of health literacy and preferred language.[14] High‐risk patients may benefit from patient coaching to improve their self‐management skills.[12] These recommendations are based on years of health literacy research,[27, 28, 29] and such elements are generally included in effective interventions (including Project RED,[10] Naylor and colleagues' Transitional Care Model,[11] and Coleman and colleagues' Care Transitions Intervention[12]).
Enlisting the help of Social and Community Supports is an important adjunct to medical care and is the rationale for the recent increase in CMS funding for community‐based, care‐transition programs. These programs are crucial for assisting patients with household activities, meals, and other necessities during the period of recovery, though they should be distinguished from care management or care coordination interventions, which have not been found to be helpful in preventing readmissions unless high touch in nature.[30, 31]
The Advanced Care Planning domain may begin in the hospital or outpatient setting, and involves establishing goals of care and healthcare proxies, as well as engaging with palliative care or hospice services if appropriate. Emerging evidence supports the intuitive conclusion that this approach prevents readmissions, particularly in patients who do not benefit from hospital readmission.[32, 33]
Attention to the Coordinating Care Among Team Members domain is needed to synchronize efforts across settings and providers. Clearly, many healthcare professionals as well as other involved parties can be involved in helping a single patient during transitions in care. It is vital that they coordinate information, assessments, and plans as a team.[34]
We recognize the domain of Monitoring and Managing Symptoms After Discharge as increasingly crucial as reflected in our growing understanding of the reasons for readmission, especially among patients with fragile conditions such as heart failure, chronic lung disease, gastrointestinal disorders, dementia,[23, 24, 25, 26] and vascular disease.[35] Monitoring for new or worsening symptoms; medication side effects, discrepancies, or nonadherence; and other self‐management challenges will allow problems to be detected and addressed early, before they result in unplanned healthcare utilization. It is noteworthy that successful interventions in this regard rely on in‐home evaluation[13, 14, 29] by nurses rather than telemonitoring, which in isolation has not been effective to date.[36, 37]
Finally, optimal Outpatient Follow‐Up with appropriate postdischarge providers is crucial for providing ideal transitions. These appointments need to be prompt[38, 39] (eg, within 7 days if not sooner for high‐risk patients) and with providers who have a longitudinal relationship to the patient, as prior work has shown increased readmissions when the provider is unfamiliar with the patient.[40] The advantages and disadvantages of hospitalist‐run postdischarge clinics as one way to increase access and expedite follow‐up are currently being explored. Although the optimal content of a postdischarge visit has not been defined, logical tasks to be completed are myriad and imply the need for checklists, adequate time, and a multidisciplinary team of providers.[41]
IMPLICATIONS OF THE IDEAL TRANSITION IN CARE
Our conceptualization of an ideal transition in care provides insight for hospital and healthcare system leadership, policymakers, researchers, clinicians, and educators seeking to improve transitions of care and reduce hospital readmissions. In the sections below, we briefly review commonly cited concerns about the recent focus on readmissions as a quality measure, illustrate how the Ideal Transition in Care addresses these concerns, and propose fruitful areas for future work.
How Does the Framework Address the Extent to Which Readmissions Reflect Hospital Quality?
One of the chief problems with readmissionrates as a hospital quality measure is that many of the factors that influence readmission may not currently be under the hospital's control. The healthcare environment to which a patient is being discharged (and was admitted from in the first place) is an important determinant of readmission.[42] In this context, it is noteworthy that successful interventions to reduce readmission are generally those that focus on outpatient follow‐up, while inpatient‐only interventions have had less success.[7] This is reflected in our framework above, informed by the literature, highlighting the importance of coordination between inpatient and outpatient providers and the importance of postdischarge care, including monitoring and managing symptoms after discharge, prompt follow‐up appointments, the continuation of patient self‐management activities, monitoring for drug‐related problems after discharge, and the effective utilization of community supports. Accountable care organizations, once established, would be responsible for several components of this environment, including the provision of prompt and effective follow‐up care.
The implication of the framework is that if a hospital does not have control over most of the factors that influence its readmission rate, it should see financial incentives to reduce readmission rates as an opportunity to invest in relationships with the outpatient environment from which their patients are admitted and to which they are discharged. One can envision hospitals growing ever‐closer relationships with their network of primary care physician groups, community agencies, and home health services, rehabilitation facilities, and nursing homes through coordinated discharge planning, medication management, patient education, shared electronic medical records, structured handoffs in care, and systems of intensive outpatient monitoring. Our proposed framework, in other words, emphasizes that hospitals cannot reduce their readmission rates by focusing on aspects of care within their walls. They must forge new and stronger relationships with their communities if they are to be successful.
How Does the Framework Help Us Understand Which Readmissions Are Preventable?
Public reporting and financial penalties are currently tied to all‐cause readmission, but preventable readmissions are a more appealing outcome to target. In one study, the ranking of hospitals by all‐cause readmission rate had very little correlation with the ranking by preventable readmission rate.[5] However, researchers have struggled to establish standardized, valid, and reliable measures for determining what proportion of readmissions are in fact preventable, with estimates ranging from 5% to 79% in the published literature.[43]
The difficulty of accurately determining preventability stems from an inadequate understanding of the roles that patient comorbidities, transitional processes of care, individual patient behaviors, and social and environmental determinants of health play in the complex process of hospital recidivism. Our proposed elements of an ideal transition in care provide a structure to frame this discussion and suggest future research opportunities to allow a more accurate and reliable understanding of the spectrum of preventability. Care system leadership can use the framework to rigorously evaluate their readmissions and determine the extent to which the transitions process approached the ideal. For example, if a readmission occurs despite care processes that addressed most of the domains with high fidelity, it becomes much less likely that the readmission was preventable. It should be noted that the converse is not always true: When a transition falls well short of the ideal, it does not always imply that provision of a more ideal transition would necessarily have prevented the readmission, but it does make it more likely.
For educators, the framework may provide insights for trainees into the complexity of the transitions process and vulnerability of patients during this time, highlighting preventable aspects of readmissions that are within the grasp of the discharging clinician or team. It highlights the importance of medication reconciliation, synchronous communication, and predischarge teaching, which are measurable and teachable skills for non‐physician providers, housestaff, and medical students. It also may allow for more structured feedback, for example, on the quality of discharge summaries produced by trainees.
How Could the Framework Improve Risk Adjustment for Between‐Hospital Comparisons?
Under the Patient Protection and Affordable Care Act (PPACA), hospitals will be compared to one another using risk‐standardized readmission rates as a way to penalize poorly performing hospitals. However, risk‐adjustment models have only modest ability to predict hospital readmission.[6] Moreover, current approaches predominantly adjust for patients' medical comorbidities (which are easily measurable), but they do not adequately take into account the growing literature on other factors that influence readmission rates, including a patient's health literacy, visual or cognitive impairment, functional status, language barriers, and community‐level factors such as social supports.[44, 45]
The Ideal Transition of Care provides a comprehensive framework of hospital discharge quality that provides additional process measures on which hospitals could be compared rather than focusing solely on (inadequately) risk‐adjusted readmission rates. Indeed, most other quality and safety measures (such as the National Quality Forum's Safe Practices[46] and The Joint Commission's National Patient Safety Goals),[47] emphasize process over outcome, in part because of issues of fairness. Process measures are less subject to differences in patient populations and also change the focus from simply reducing readmissions to improving transitional care more broadly. These process measures should be based on our framework and should attempt to capture as many dimensions of an optimal care transition as possible.
Possible examples of process measures include: the accuracy of medication reconciliation at admission and discharge; provision of prompt outpatient follow‐up; provision of adequate systems to monitor and manage symptoms after discharge; advanced care planning in appropriate patients; and the quality of discharge education, incorporating measurements of the patient's understanding and ability to self‐manage their illness. At least some of these could be used now as part of a performance measurement set that highlights opportunities for immediate system change and can serve as performance milestones.
The framework could also be used to validate risk‐adjustment techniques. After accounting for patient factors, the remaining variability in outcomes should be accounted for by processes of care that are in the transitions framework. Once these processes are accurately measured, one can determine if indeed the remaining variability is due to transitions processes, or rather unaccounted factors that are not being measured and that hospitals may have little control over. Such work can lead to iterative refinement of patient risk‐adjustment models.
What Does the Framework Imply About Best Practices for Reducing Readmission Rates?
Despite the limitations of readmission rates as a quality measure noted above, hospitals presently face potentially large financial penalties for readmissions and are allocating resources to readmission reduction efforts. However, hospitals currently may not have enough guidance to know what actions to take to reduce readmissions, and thus could be spending money inefficiently and reducing the value proposition of focusing on readmissions.
A recent systematic review of interventions hospitals could employ to reduce readmissions identified several positive studies, but also many negative studies, and there were significant barriers to understanding what works to reduce readmissions.[7] For example, most of the interventions described in both positive and negative studies were multifaceted, and the authors were unable to identify which components of the intervention were most effective. Also, while several studies have identified risk factors for readmission,[6, 48, 49] very few studies have identified which subgroups of patients benefit most from specific interventions. Few of the studies described key contextual factors that may have led to successful or failed implementation, or the fidelity with which the intervention was implemented.[50, 51, 52]
Few if any of the studies were guided by a concept of the ideal transition in care.[10] Such a framework will better guide development of multifaceted interventions and provide an improved means for interpreting the results. Clearly, rigorously conducted, multicenter studies of readmission prevention interventions are needed to move the field forward. These studies should: 1) correlate implementation of specific intervention components with reductions in readmission rates to better understand the most effective components; 2) be adequately powered to show effect modification, ie, which patients benefit most from these interventions; and 3) rigorously measure environmental context and intervention fidelity, and employ mixed methods to better understand predictors of implementation success and failure.
Our framework can be used in the design and evaluation of such interventions. For example, interventions could be designed that incorporate as many of the domains of an ideal transition as possible, in particular those that span the inpatient and outpatient settings. Processes of care metrics can be developed that measure the extent to which each domain is delivered, analogous to the way the Joint Commission might aggregate individual scores on the 10 items in Acute Myocardial Infarction Core Measure Set[53] to provide a composite of the quality of care provided to patients with this diagnosis. These can be used to correlate certain intervention components with success in reducing readmissions and also in measuring intervention fidelity.
NEXT STEPS
For hospital and healthcare system leaders, who need to take action now to avoid financial penalties, we recommend starting with proven, high‐touch interventions such as Project RED and the Care Transitions Intervention, which are durable, cost‐effective, robustly address multiple domains of the Ideal Transition in Care, and have been implemented at numerous sites.[54, 55] Each hospital or group will need to decide on a bundle of interventions and customize them based on local workflow, resources, and culture.
Risk‐stratification, to match the intensity of the intervention to the risk of readmission of the patient, will undoubtedly be a key component for the efficient use of resources. We anticipate future research will allow risk stratification to be a robust part of any implementation plan. However, as noted above, current risk prediction models are imperfect,[6] and more work is needed to determine which patients benefit most from which interventions. Few if any studies have described interventions tailored to risk for this reason.
Based on our ideal transition in care, our collective experience, and published evidence,[7, 10, 11, 12] potential elements to start with include: early discharge planning; medication reconciliation[56]; patient/caregiver education using health literacy principles, cognitive assessments, and teach‐back to confirm understanding; synchronous communication (eg, by phone) between inpatient and postdischarge providers; follow‐up phone calls to patients within 72 hours of discharge; 24/7 availability of a responsible inpatient provider to address questions and problems (both from the patient/caregiver and from postdischarge providers); and prompt appointments for patients discharged home. High‐risk patients will likely require additional interventions, including in‐home assessments, disease‐monitoring programs, and/or patient coaching. Lastly, patients with certain conditions prone to readmission (such as heart failure and chronic obstructive pulmonary disease) may benefit from disease‐specific programs, including patient education, outpatient disease management, and monitoring protocols.
It is likely that the most effective interventions are those that come from combined, coordinated interventions shared between inpatient and outpatient settings, and are intensive in nature. We expect that the more domains in the framework that are addressed, the safer and more seamless transitions in care will be, with improvement in patient outcomes. To the extent that fragmentation of care has been a barrier to the implementation of these types of interventions in the past, ACOs, perhaps with imbedded Patient‐Centered Medical Homes, may be in the best position to take advantage of newly aligned financial incentives to design comprehensive transitional care. Indeed, we anticipate that Figure 1 may provide substrate for a discussion of postdischarge care and division of responsibilities between inpatient and outpatient care teams at the time of transition, so effort is not duplicated and multiple domains are addressed.
Other barriers to implementation of ideal transitions in care will continue to be an issue for most healthcare systems. Financial constraints that have been a barrier up until now will be partially overcome by penalties for high readmission rates and by ACOs, bundled payments, and alternative care contracts (ie, global payments), but the extent to which each institution feels rewarded for investing in transitional interventions will vary greatly. Healthcare leadership that sees the value of improving transitions in care will be critical to overcoming this barrier. Competing demands (such as lowering hospital length of stay and carrying out other patient care responsibilities),[57] lack of coordination and diffusion of responsibility among various clinical personnel, and lack of standards are other barriers[58] that will require clear prioritization from leadership, policy changes, team‐based care, provider education and feedback, and adequate allocation of personnel resources. In short, process redesign using continuous quality improvement efforts and effective tools will be required to maximize the possibility of success.
CONCLUSIONS
Readmissions are costly and undesirable. Intuition suggests they are a marker of poor care and that hospitals should be capable of reducing them, thereby improving care and decreasing costs. In a potential future world of ACOs based on global payments, financial incentives would be aligned for each system to reduce readmissions below their current baseline, therefore obviating the need for external financial rewards and penalties. In the meantime, financial penalties do exist, and controversy exists over their fairness and likelihood of driving appropriate behavior. To address these controversies and promote better transitional care, we call for the development and use of multifaceted, collaborative transitions interventions that span settings, risk‐adjustment models that allow for fairer comparisons among hospitals, better and more widespread measurement of processes of transitional care, a better understanding of what interventions are most effective and in whom, and better guidance in how to implement these interventions. Our conceptualization of an ideal transition of care serves as a guide and provides a common vocabulary for these efforts. Such research is likely to produce the knowledge needed for healthcare systems to improve transitions in care, reduce readmissions, and reduce costs.
Disclosure
Funding for Dr Vasilevskis has been provided by the National Institutes of Health (K23AG040157) and the VA Tennessee Valley Geriatric Research, Education and Clinical Center (GRECC). The content is solely the responsibility of the authors and does not necessarily represent the official views of the National Institute on Aging, the National Institutes of Health, or the US Department of Veterans Affairs.
- , . Redefining Health Care: Creating Value‐Based Competition on Results. Boston, MA:Harvard Business School Press;2006.
- , , . Rehospitalizations among patients in the Medicare fee‐for‐service program. N Engl J Med. 2009;360(14):1418–1428.
- Patient Protection and Affordable Care Act (PPACA). Public Law 111–148; 2010. Available at: http://www.gpo.gov/fdsys/pkg/PLAW‐111publ148/pdf/PLAW‐111publ148.pdf. Accessed on June 4, 2012.
- , . Hospital readmission as an accountability measure. JAMA. 2011;305(5):504–505.
- , , , et al. Incidence of potentially avoidable urgent readmissions and their relation to all‐cause urgent readmissions. Can Med Assoc J. 2011;183(14):E1067–E1072.
- , , , et al. Risk prediction models for hospital readmission: a systematic review. JAMA. 2011;306(15):1688–1698.
- , , , , . Interventions to reduce 30‐day rehospitalization: a systematic review. Ann Intern Med. 2011;155(8):520–528.
- . A decade of transitional care research with vulnerable elders. J Cardiovasc Nurs. 2000;14(3):1–14.
- , , , et al;for the American College of Physicians; Society of General Internal Medicine; Society of Hospital Medicine; American Geriatrics Society; American College of Emergency Physicians; Society of Academic Emergency Medicine. Transitions of Care Consensus Policy Statement American College of Physicians–Society of General Internal Medicine–Society of Hospital Medicine–American Geriatrics Society–American College of Emergency Physicians–Society of Academic Emergency Medicine. J Gen Intern Med. 2009;24(8):971–976.
- , , , et al. A reengineered hospital discharge program to decrease rehospitalization: a randomized trial. Ann Intern Med. 2009;150(3):178–187.
- , , , et al. Comprehensive discharge planning and home follow‐up of hospitalized elders: a randomized clinical trial. JAMA. 1999;281(7):613–620.
- , , , . The care transitions intervention: results of a randomized controlled trial. Arch Intern Med. 2006;166(17):1822–1828.
- , , , , , . Deficits in communication and information transfer between hospital‐based and primary care physicians: implications for patient safety and continuity of care. JAMA. 2007;297(8):831–841.
- , , , . Promoting effective transitions of care at hospital discharge: a review of key issues for hospitalists. J Hosp Med. 2007;2(5):314–323.
- , , , , , . Discharge documentation of patients discharged to subacute facilities: a three‐year quality improvement process across an integrated health care system. Jt Comm J Qual Patient Saf. 2010;36(6):243–251.
- , , , , . The incidence and severity of adverse events affecting patients after discharge from the hospital. Ann Intern Med. 2003;138(3):161–167.
- , , , , , . Frequency, type and clinical importance of medication history errors at admission to hospital: a systematic review. Can Med Assoc J. 2005;173(5):510–515.
- , , , et al. Classifying and predicting errors of inpatient medication reconciliation. J Gen Intern Med. 2008;23(9):1414–1422.
- , , et al;for the PILL‐CVD (Pharmacist Intervention for Low Literacy in Cardiovascular Disease) Study Group. Effect of a pharmacist intervention on clinically important medication errors after hospital discharge: a randomized trial. Ann Intern Med. 2012;157(1):1–10.
- , , , . Hospital‐based medication reconciliation practices: a systematic review. Arch Intern Med. 2012;172(14):1057–1069.
- , , , et al. Effect of an electronic medication reconciliation application and process redesign on potential adverse drug events: a cluster‐randomized trial. Arch Intern Med. 2009;169(8):771–780.
- , , , et al. Role of pharmacist counseling in preventing adverse drug events after hospitalization. Arch Intern Med. 2006;166(5):565–571.
- , , , , . Insufficient help for activity of daily living disabilities and risk of all–cause hospitalization. J Am Geriatr Soc. 2012;60(5):927–933.
- , , , et al. Transitions in care for older adults with and without dementia. J Am Geriatr Soc. 2012;60(5):813–820.
- , , , , . Association of incident dementia with hospitalizations. JAMA. 2012;307(2):165–172.
- , , , et al. Potentially avoidable hospitalizations of dually eligible Medicare and Medicaid beneficiaries from nursing facility and home– and community–based services waiver programs. J Am Geriatr Soc. 2012;60(5):821–829.
- , . Teaching about health literacy and clear communication. J Gen Intern Med. 2006;21(8):888–890.
- , , , et al. Health literacy and outcomes among patients with heart failure. JAMA. 2011;305(16):1695–1701.
- , , , , . Patient experiences of transitioning from hospital to home: an ethnographic quality improvement project. J Hosp Med. 2012;7(5):382–387.
- , , , . Effects of care coordination on hospitalization, quality of care, and health care expenditures among Medicare beneficiaries: 15 randomized trials. JAMA. 2009;301(6):603–618.
- , , , , . How changes in Washington University's Medicare coordinated care demonstration pilot ultimately achieved savings. Health Aff (Millwood). 2012;31(6):1216–1226.
- , , , et al. Quality of care and rehospitalization rate in the last stage of disease in brain tumor patients assisted at home: a cost effectiveness study. J Palliat Med. 2012;15(2):225–227.
- , , , , . Inpatient palliative care consults and the probability of hospital readmission. Perm J. 2011;15(2):48–51.
- , , , et al. TeamSTEPPS™: team strategies and tools to enhance performance and patient safety. In: Henriksen K, Battles JB, Keyes MA, Grady ML, ed. Advances in Patient Safety: New Directions and Alternative Approaches. Vol 3: Performance and Tools. Rockville, MD:Agency for Healthcare Research and Quality; August2008.
- , , , et al. Factors contributing to all‐cause 30‐day readmissions: a structured case series across 18 hospitals. Med Care. 2012;50(7):599–605.
- , , , et al. Telemonitoring in patients with heart failure [erratum, N Engl J Med. 2011;364(5):490]. N Engl J Med. 2010;363(24):2301–2309.
- , , , et al. A randomized controlled trial of telemonitoring in older adults with multiple health issues to prevent hospitalizations and emergency department visits. Arch Intern Med. 2012;172(10):773–779.
- , , , et al. Relationship between early physician follow‐up and 30‐day readmission among Medicare beneficiaries hospitalized for heart failure. JAMA. 2010;303(17):1716–1722.
- , , . Post‐hospitalization transitions: examining the effects of timing of primary care provider follow‐up. J Hosp Med. 2010;5(7):392–397.
- , , . Does increased access to primary care reduce hospital readmissions? Veterans Affairs Cooperative Study Group on Primary Care and Hospital Readmission. N Engl J Med. 1996;334(22):1441–1447.
- . The Post‐Hospital Follow‐Up Visit: A Physician Checklist to Reduce Readmissions. California Healthcare Foundation; October 2010. Available at: http://www.chcf.org/publications/2010/10/the‐post‐hospital‐follow‐up‐visit‐a‐physician‐checklist. Accessed on January 10, 2012.
- , , . Thirty‐day readmission rates for Medicare beneficiaries by race and site of care. JAMA. 2011;305(7):675–681.
- , , , , . Proportion of hospital readmissions deemed avoidable: a systematic review. Can Med Assoc J. 2011;183(7):E391–E402.
- , , , et al. Postdischarge environmental and socioeconomic factors and the likelihood of early hospital readmission among community‐dwelling Medicare beneficiaries. Gerontologist. 2008;48(4):495–504.
- , , , , . Low health literacy and health outcomes: an updated systematic review. Ann Intern Med. 2011;155(2):97–107.
- National Quality Forum. Safe Practices for Better Healthcare—2010 Update: A Consensus Report. Washington, DC;2010.
- Joint Commission on Accreditation of Healthcare Organizations. Accreditation Program: Hospital 2010 National Patient Safety Goals (NPSGs). 2010. Available at: http://www.jointcommission.org/PatientSafety/NationalPatientSafetyGoals/. Accessed on March 20, 2012.
- , , , et al. Hospital readmission in general medicine patients: a prediction model. J Gen Intern Med. 2010;25(3):211–219.
- , , , et al. Derivation and validation of an index to predict early death or unplanned readmission after discharge from hospital to the community. Can Med Assoc J. 2010;182(6):551–557.
- , . Evaluating service delivery interventions to enhance patient safety. BMJ. 2008;337:a2764.
- , , . Assessing the Evidence for Context‐Sensitive Effectiveness and Safety of Patient Safety Practices: Developing Criteria. Rockville, MD:Agency for Healthcare Research and Quality; December2010.
- , , , et al. Advancing the science of patient safety. Ann Intern Med. 2011;154(10):693–696.
- The Joint Commission. Acute Myocardial Infarction Core Measure Set. Available at: http://www.jointcommission.org/assets/1/6/Acute%20Myocardial%20Infarction.pdf. Accessed August 20,2012.
- , , , , , . The care transitions intervention: translating from efficacy to effectiveness. Arch Intern Med. 2011;171(14):1232–1237.
- Project RED toolkit, AHRQ Innovations Exchange. Available at:http://www.innovations.ahrq.gov/content.aspx?id=2180. Accessed on July 2, 2012.
- , , , et al. A comprehensive pharmacist intervention to reduce morbidity in patients 80 years or older: a randomized controlled trial. Arch Intern Med. 2009;169(9):894–900.
- , . Thirty‐day readmissions—truth and consequences. N Engl J Med. 2012;366(15):1366–1369.
- , , , , . “Out of sight, out of mind”: housestaff perceptions of quality‐limiting factors in discharge care at teaching hospitals. J Hosp Med. 2012;7(5):376–381.

Hospitalists and Quality of Care
Quality of care in US hospitals is inconsistent and often below accepted standards.1 This observation has catalyzed a number of performance measurement initiatives intended to publicize gaps and spur quality improvement.2 As the field has evolved, organizational factors such as teaching status, ownership model, nurse staffing levels, and hospital volume have been found to be associated with performance on quality measures.1, 3‐7 Hospitalists represent a more recent change in the organization of inpatient care8 that may impact hospital‐level performance. In fact, most hospitals provide financial support to hospitalists, not only for hopes of improving efficiency, but also for improving quality and safety.9
Only a few single‐site studies have examined the impact of hospitalists on quality of care for common medical conditions (ie, pneumonia, congestive heart failure, and acute myocardial infarction), and each has focused on patient‐level effects. Rifkin et al.10, 11 did not find differences between hospitalists' and nonhospitalists' patients in terms of pneumonia process measures. Roytman et al.12 found hospitalists more frequently prescribed afterload‐reducing agents for congestive heart failure (CHF), but other studies have shown no differences in care quality for heart failure.13, 14 Importantly, no studies have examined the role of hospitalists in the care of patients with acute myocardial infarction (AMI). In addition, studies have not addressed the effect of hospitalists at the hospital level to understand whether hospitalists have broader system‐level effects reflected by overall hospital performance.
We hypothesized that the presence of hospitalists within a hospital would be associated with improvements in hospital‐level adherence to publicly reported quality process measures, and having a greater percentage of patients admitted by hospitalists would be associated with improved performance. To test these hypotheses, we linked data from a statewide census of hospitalists with data collected as part of a hospital quality‐reporting initiative.
Materials and Methods
Study Sites
We examined the performance of 209 hospitals (63% of all 334 non‐federal facilities in California) participating in the California Hospital Assessment and Reporting Taskforce (CHART) at the time of the survey. CHART is a voluntary quality reporting initiative that began publicly reporting hospital quality data in January 2006.
Hospital‐level Organizational, Case‐mix, and Quality Data
Hospital organizational characteristics (eg, bed size) were obtained from publicly available discharge and utilization data sets from the California Office of Statewide Health Planning and Development (OSHPD). We also linked hospital‐level patient‐mix data (eg, race) from these OSHPD files.
We obtained quality of care data from CHART for January 2006 through June 2007, the time period corresponding to the survey. Quality metrics included 16 measures collected by the Center for Medicare and Medicaid Services (www.cms.hhs.gov) and extensively used in quality research.1, 4, 13, 15‐17 Rather than define a single measure, we examined multiple process measures, anticipating differential impacts of hospitalists on various processes of care for AMI, CHF, and pneumonia. Measures were further divided among those that are usually measured upon initial presentation to the hospital and those that are measured throughout the entire hospitalization and discharge. This division reflects the division of care in the hospital, where emergency room physicians are likely to have a more critical role for admission processes.
Survey Process
We surveyed all nonfederal, acute care hospitals in California that participated in CHART.2 We first identified contacts at each site via professional society mailing lists. We then sent web‐based surveys to all with available email addresses and a fax/paper survey to the remainder. We surveyed individuals between October 2006 and April 2007 and repeated the process at intervals of 1 to 3 weeks. For remaining nonrespondents, we placed a direct call unless consent to survey had been specifically refused. We contacted the following persons in sequence: (1) hospital executives or administrative leaders; (2) hospital medicine department leaders; (3) admitting emergency room personnel or medical staff officers; and (4) hospital website information. In the case of multiple responses with disagreement, the hospital/hospitalist leader's response was treated as the primary source. At each step, respondents were asked to answer questions only if they had a direct working knowledge of their hospitalist services.
Survey Data
Our key survey question to all respondents included whether the respondents could confirm their hospitals had at least one hospitalist medicine group. Hospital leaders were also asked to participate in a more comprehensive survey of their organizational and clinical characteristics. Within the comprehensive survey, leaders also provided estimates of the percent of general medical patients admitted by hospitalists. This measure, used in prior surveys of hospital leaders,9 was intended to be an easily understood approximation of the intensity of hospitalist utilization in any given hospital. A more rigorous, direct measure was not feasible due to the complexity of obtaining admission data over such a large, diverse set of hospitals.
Process Performance Measures
AMI measures assessed at admission included aspirin and ‐blocker administration within 24 hours of arrival. AMI measures assessed at discharge included aspirin administration, ‐blocker administration, angiotensin converting enzyme inhibitor (ACE‐I) (or angiotensin receptor blocker [ARB]) administration for left ventricular (LV) dysfunction, and smoking cessation counseling. There were no CHF admission measures. CHF discharge measures included assessment of LV function, the use of an ACE‐I or ARB for LV dysfunction, and smoking cessation counseling. Pneumonia admission measures included the drawing of blood cultures prior to the receipt of antibiotics, timely administration of initial antibiotics (<8 hours), and antibiotics consistent with recommendations. Pneumonia discharge measures included pneumococcal vaccination, flu vaccination, and smoking cessation counseling.
For each performance measure, we quantified the percentage of missed quality opportunities, defined as the number of patients who did not receive a care process divided by the number of eligible patients, multiplied by 100. In addition, we calculated composite scores for admission and discharge measures across each condition. We summed the numerators and denominators of individual performance measures to generate a disease‐specific composite numerator and denominator. Both individual and composite scores were produced using methodology outlined by the Center for Medicare & Medicaid Services.18 In order to retain as representative a sample of hospitals as possible, we calculated composite scores for hospitals that had a minimum of 25 observations in at least 2 of the quality indicators that made up each composite score.
Statistical Analysis
We used chi‐square tests, Student t tests, and Mann‐Whitney tests, where appropriate, to compare hospital‐level characteristics of hospitals that utilized hospitalists vs. those that did not. Similar analyses were performed among the subset of hospitals that utilized hospitalists. Among this subgroup of hospitals, we compared hospital‐level characteristics between hospitals that provided information regarding the percent of patients admitted by hospitalists vs. those who did not provide this information.
We used multivariable, generalized linear regression models to assess the relationship between having at least 1 hospitalist group and the percentage of missed quality of care measures. Because percentages were not normally distributed (ie, a majority of hospitals had few missed opportunities, while a minority had many), multivariable models employed log‐link functions with a gamma distribution.19, 20 Coefficients for our key predictor (presence of hospitalists) were transformed back to the original units (percentage of missed quality opportunities) so that a positive coefficient represented a higher number of quality measures missed relative to hospitals without hospitalists. Models were adjusted for factors previously reported to be associated with care quality. Hospital organizational characteristics included the number of beds, teaching status, registered nursing (RN) hours per adjusted patient day, and hospital ownership (for‐profit vs. not‐for‐profit). Hospital patient mix factors included annual percentage of admissions by insurance status (Medicare, Medicaid, other), annual percentage of admissions by race (white vs. nonwhite), annual percentage of do‐not‐resuscitate status at admission, and mean diagnosis‐related group‐based case‐mix index.21 We additionally adjusted for the number of cardiac catheterizations, a measure that moderately correlates with the number of cardiologists and technology utilization.22‐24 In our subset analysis among those hospitals with hospitalists, our key predictor for regression analyses was the percentage of patients admitted by hospitalists. For ease of interpretation, the percentage of patients admitted by hospitalists was centered on the mean across all respondent hospitals, and we report the effect of increasing by 10% the percentage of patients admitted by hospitalists. Models were adjusted for the same hospital organizational characteristics listed above. For those models, a positive coefficient also meant a higher number of measures missed.
For both sets of predictors, we additionally tested for the presence of interactions between the predictors and hospital bed size (both continuous as well as dichotomized at 150 beds) in composite measure performance, given the possibility that any hospitalist effect may be greater among smaller, resource‐limited hospitals. Tests for interaction were performed with the likelihood ratio test. In addition, to minimize any potential bias or loss of power that might result from limiting the analysis to hospitals with complete data, we used the multivariate imputation by chained equations method, as implemented in STATA 9.2 (StataCorp, College Station, TX), to create 10 imputed datasets.25 Imputation of missing values was restricted to confounding variables. Standard methods were then used to combine results over the 10 imputed datasets. We also applied Bonferroni corrections to composite measure tests based on the number of composites generated (n = 5). Thus, for the 5 inpatient composites created, standard definitions of significance (P 0.05) were corrected by dividing composite P values by 5, requiring P 0.01 for significance. The institutional review board of the University of California, San Francisco, approved the study. All analyses were performed using STATA 9.2.
Results
Characteristics of Participating Sites
There were 209 eligible hospitals. All 209 (100%) hospitals provided data about the presence or absence of hospitalists via at least 1 of our survey strategies. The majority of identification of hospitalist utilization was via contact with either hospital or hospitalist leaders, n = 147 (70.3%). Web‐sites informed hospitalist prevalence in only 3 (1.4%) hospitals. There were 8 (3.8%) occurrences of disagreement between sources, all of which had available hospital/hospitalist leader responses. Only 1 (0.5%) hospital did not have the minimum 25 patients eligible for any disease‐specific quality measures during the data reporting period. Collectively, the remaining 208 hospitals accounted for 81% of California's acute care hospital population.
Comparisons of Sites With Hospitalists and Those Without
A total of 170 hospitals (82%) participating in CHART used hospitalists. Hospitals with and without hospitalists differed by a variety of characteristics (Table 1). Sites with hospitalists were larger, less likely to be for‐profit, had more registered nursing hours per day, and performed more cardiac catheterizations.
| Characteristic | Hospitals Without Hospitalists (n = 38) | Hospitals With Hospitalists (n = 170) | P Value* |
|---|---|---|---|
| |||
| Number of beds, n (% of hospitals) | <0.001 | ||
| 0‐99 | 16 (42.1) | 14 (8.2) | |
| 100‐199 | 8 (21.1) | 44 (25.9) | |
| 200‐299 | 7 (18.4) | 42 (24.7) | |
| 300+ | 7 (18.4) | 70 (41.2) | |
| For profit, n (% of hospitals) | 9 (23.7) | 18 (10.6) | 0.03 |
| Teaching hospital, n (% of hospitals) | 7 (18.4) | 55 (32.4) | 0.09 |
| RN hours per adjusted patient day, number of hours (IQR) | 7.4 (5.7‐8.6) | 8.5 (7.4‐9.9) | <0.001 |
| Annual cardiac catheterizations, n (IQR) | 0 (0‐356) | 210 (0‐813) | 0.007 |
| Hospital total census days, n (IQR) | 37161 (14910‐59750) | 60626 (34402‐87950) | <0.001 |
| ICU total census, n (IQR) | 2193 (1132‐4289) | 3855 (2489‐6379) | <0.001 |
| Medicare insurance, % patients (IQR) | 36.9 (28.5‐48.0) | 35.3(28.2‐44.3) | 0.95 |
| Medicaid insurance, % patients (IQR) | 21.0 (12.7‐48.3) | 16.6 (5.6‐27.6) | 0.02 |
| Race, white, % patients (IQR) | 53.7 (26.0‐82.7) | 59.1 (45.6‐74.3) | 0.73 |
| DNR at admission, % patients (IQR) | 3.6 (2.0‐6.4) | 4.4 (2.7‐7.1) | 0.12 |
| Case‐mix index, index (IQR) | 1.05 (0.90‐1.21) | 1.13 (1.01‐1.26) | 0.11 |
Relationship Between Hospitalist Group Utilization and the Percentage of Missed Quality Opportunities
Table 2 shows the frequency of missed quality opportunities in sites with hospitalists compared to those without. In general, for both individual and composite measures of quality, multivariable adjustment modestly attenuated the observed differences between the 2 groups of hospitals. We present only the more conservative adjusted estimates.
| Quality Measure | Number of Hospitals | Adjusted Mean % Missed Quality Opportunities (95% CI) | Difference With Hospitalists | Relative % Change | P Value | |
|---|---|---|---|---|---|---|
| Hospitals Without Hospitalists | Hospitals With Hospitalists | |||||
| ||||||
| Acute myocardial infarction | ||||||
| Admission measures | ||||||
| Aspirin at admission | 193 | 3.7 (2.4‐5.1) | 3.4 (2.3‐4.4) | 0.3 | 10.0 | 0.44 |
| Beta‐blocker at admission | 186 | 7.8 (4.7‐10.9) | 6.4 (4.4‐8.3) | 1.4 | 18.3 | 0.19 |
| AMI admission composite | 186 | 5.5 (3.6‐7.5) | 4.8 (3.4‐6.1) | 0.7 | 14.3 | 0.26 |
| Hospital/discharge measures | ||||||
| Aspirin at discharge | 173 | 7.5 (4.5‐10.4) | 5.2 (3.4‐6.9) | 2.3 | 31.0 | 0.02 |
| Beta‐blocker at discharge | 179 | 6.6 (3.8‐9.4) | 5.9 (3.6‐8.2) | 0.7 | 9.6 | 0.54 |
| ACE‐I/ARB at discharge | 119 | 20.7 (9.5‐31.8) | 11.8 (6.6‐17.0) | 8.9 | 43.0 | 0.006 |
| Smoking cessation counseling | 193 | 3.8 (2.4‐5.1) | 3.4 (2.4‐4.4) | 0.4 | 10.0 | 0.44 |
| AMI hospital/discharge composite | 179 | 6.4 (4.1‐8.6) | 5.3 (3.7‐6.8) | 1.1 | 17.6 | 0.16 |
| Congestive heart failure | ||||||
| Hospital/discharge measures | ||||||
| Ejection fraction assessment | 208 | 12.6 (7.7‐17.6) | 6.5 (4.6‐8.4) | 6.1 | 48.2 | <0.001 |
| ACE‐I/ARB at discharge | 201 | 14.7 (10.0‐19.4) | 12.9 (9.8‐16.1) | 1.8 | 12.1 | 0.31 |
| Smoking cessation counseling | 168 | 9.1 (2.9‐15.4) | 9.0 (4.2‐13.8) | 0.1 | 1.8 | 0.98 |
| CHF hospital/discharge composite | 201 | 12.2 (7.9‐16.5) | 8.2 (6.2‐10.2) | 4.0 | 33.1 | 0.006* |
| Pneumonia | ||||||
| Admission measures | ||||||
| Blood culture before antibiotics | 206 | 12.0 (9.1‐14.9) | 10.9 (8.8‐13.0) | 1.1 | 9.1 | 0.29 |
| Timing of antibiotics <8 hours | 208 | 5.8 (4.1‐7.5) | 6.2 (4.7‐7.7) | 0.4 | 6.9 | 0.56 |
| Initial antibiotic consistent with recommendations | 207 | 15.0 (11.6‐18.6) | 13.8 (10.9‐16.8) | 1.2 | 8.1 | 0.27 |
| Pneumonia admission composite | 207 | 10.5 (8.5‐12.5) | 9.9 (8.3‐11.5) | 0.6 | 5.9 | 0.37 |
| Hospital/discharge measures | ||||||
| Pneumonia vaccine | 208 | 29.4 (19.5‐39.2) | 27.1 (19.9‐34.3) | 2.3 | 7.7 | 0.54 |
| Influenza vaccine | 207 | 36.9 (25.4‐48.4) | 35.0 (27.0‐43.1) | 1.9 | 5.2 | 0.67 |
| Smoking cessation counseling | 196 | 15.4 (7.8‐23.1) | 13.9 (8.9‐18.9) | 1.5 | 10.2 | 0.59 |
| Pneumonia hospital/discharge composite | 207 | 29.6 (20.5‐38.7) | 27.3 (20.9‐33.6) | 2.3 | 7.8 | 0.51 |
Compared to hospitals without hospitalists, those with hospitalists did not have any statistically significant differences in the individual and composite admission measures for each of the disease processes. In contrast, there were statistically significant differences between hospitalist and nonhospitalist sites for many individual cardiac processes of care that typically occur after admission from the emergency room (ie, LV function assessment for CHF) or those that occurred at discharge (ie, aspirin and ACE‐I/ARB at discharge for AMI). Similarly, the composite discharge scores for AMI and CHF revealed better overall process measure performance at sites with hospitalists, although the AMI composite did not meet statistical significance. There were no statistically significant differences between groups for the pneumonia process measures assessed at discharge. In addition, for composite measures there were no statistically significant interactions between hospitalist prevalence and bed size, although there was a trend (P = 0.06) for the CHF discharge composite, with a larger effect of hospitalists among smaller hospitals.
Percent of Patients Admitted by Hospitalists
Of the 171 hospitals with hospitalists, 71 (42%) estimated the percent of patients admitted by their hospitalist physicians. Among the respondents, the mean and median percentages of medical patients admitted by hospitalists were 51% (SD = 25%) and 49% (IQR = 30‐70%), respectively. Thirty hospitals were above the sample mean. Compared to nonrespondent sites, respondent hospitals took care of more white patients; otherwise, respondent and nonrespondent hospitals were similar in terms of bed size, location, performance across each measure, and other observable characteristics (Supporting Information, Appendix 1).
Relationship Between the Estimated Percentages of Medical Patients Admitted by Hospitalists and Missed Quality Opportunities
Table 3 displays the change in missed quality measures associated with each additional 10% of patients estimated to be admitted by hospitalists. A higher estimated percentage of patients admitted by hospitalists was associated with statistically significant improvements in quality of care across a majority of individual measures and for all composite discharge measures regardless of condition. For example, every 10% increase in the mean estimated number of patients admitted by hospitalists was associated with a mean of 0.6% (P < 0.001), 0.5% (P = 0.004), and 1.5% (P = 0.006) fewer missed quality opportunities for AMI, CHF, and pneumonia discharge process measures composites, respectively. In addition, for these composite measures, there were no statistically significant interactions between the estimated percentage of patients admitted by hospitalists and bed size (dichotomized at 150 beds), although there was a trend (P = 0.09) for the AMI discharge composite, with a larger effect of hospitalists among smaller hospitals.
| Quality Measure | Number of Hospitals | Adjusted % Missed Quality Opportunities (95% CI) | Difference With Hospitalists | Relative Percent Change | P Value | |
|---|---|---|---|---|---|---|
| Among Hospitals With Mean % of Patients Admitted by Hospitalists | Among Hospitals With Mean + 10% of Patients Admitted by Hospitalists | |||||
| ||||||
| Acute myocardial infarction | ||||||
| Admission measures | ||||||
| Aspirin at admission | 70 | 3.4 (2.3‐4.6) | 3.1 (2.0‐3.1) | 0.3 | 10.2 | 0.001 |
| Beta‐blocker at admission | 65 | 5.8 (3.4‐8.2) | 5.1 (3.0‐7.3) | 0.7 | 11.9 | <0.001 |
| AMI admission composite | 65 | 4.5 (2.9‐6.1) | 4.0 (2.6‐5.5) | 0.5 | 11.1 | <0.001* |
| Hospital/discharge measures | ||||||
| Aspirin at discharge | 62 | 5.1 (3.3‐6.9) | 4.6 (3.1‐6.2) | 0.5 | 9.0 | 0.03 |
| Beta‐blocker at discharge | 63 | 5.1 (2.9‐7.2) | 4.3 (2.5‐6.0) | 0.8 | 15.4 | <0.001 |
| ACE‐I/ARB at discharge | 44 | 11.4 (6.2‐16.6) | 10.3 (5.4‐15.1) | 1.1 | 10.0 | 0.02 |
| Smoking cessation counseling | 70 | 3.4 (2.3‐4.6) | 3.1 (2.0‐4.1) | 0.3 | 10.2 | 0.001 |
| AMI hospital/discharge composite | 63 | 5.0 (3.3‐6.7) | 4.4 (3.0‐5.8) | 0.6 | 11.3 | 0.001* |
| Congestive heart failure | ||||||
| Hospital/discharge measures | ||||||
| Ejection fraction assessment | 71 | 5.9 (4.1‐7.6) | 5.6 (3.9‐7.2) | 0.3 | 2.9 | 0.07 |
| ACE‐I/ARB at discharge | 70 | 12.3 (8.6‐16.0) | 11.4 (7.9‐15.0) | 0.9 | 7.1 | 0.008* |
| Smoking cessation counseling | 56 | 8.4 (4.1‐12.6) | 8.2 (4.2‐12.3) | 0.2 | 1.7 | 0.67 |
| CHF hospital/discharge composite | 70 | 7.7 (5.8‐9.6) | 7.2 (5.4‐9.0) | 0.5 | 6.0 | 0.004* |
| Pneumonia | ||||||
| Admission measures | ||||||
| Timing of antibiotics <8 hours | 71 | 5.9 (4.2‐7.6) | 5.9 (4.1‐7.7) | 0.0 | 0.0 | 0.98 |
| Blood culture before antibiotics | 71 | 10.0 (8.0‐12.0) | 9.8 (7.7‐11.8) | 0.2 | 2.6 | 0.18 |
| Initial antibiotic consistent with recommendations | 71 | 13.3 (10.4‐16.2) | 12.9 (9.9‐15.9) | 0.4 | 2.8 | 0.20 |
| Pneumonia admission composite | 71 | 9.4 (7.7‐11.1) | 9.2 (7.6‐10.9) | 0.2 | 1.8 | 0.23 |
| Hospital/discharge measures | ||||||
| Pneumonia vaccine | 71 | 27.0 (19.2‐34.8) | 24.7 (17.2‐32.2) | 2.3 | 8.4 | 0.006 |
| Influenza vaccine | 71 | 34.1 (25.9‐42.2) | 32.6 (24.7‐40.5) | 1.5 | 4.3 | 0.03 |
| Smoking cessation counseling | 67 | 15.2 (9.8‐20.7) | 15.0 (9.6‐20.4) | 0.2 | 2.0 | 0.56 |
| Pneumonia hospital/discharge composite | 71 | 26.7 (20.3‐33.1) | 25.2 (19.0‐31.3) | 1.5 | 5.8 | 0.006* |
In order to test the robustness of our results, we carried out 2 secondary analyses. First, we used multivariable models to generate a propensity score representing the predicted probability of being assigned to a hospital with hospitalists. We then used the propensity score as an additional covariate in subsequent multivariable models. In addition, we performed a complete‐case analysis (including only hospitals with complete data, n = 204) as a check on the sensitivity of our results to missing data. Neither analysis produced results substantially different from those presented.
Discussion
In this cross‐sectional analysis of hospitals participating in a voluntary quality reporting initiative, hospitals with at least 1 hospitalist group had fewer missed discharge care process measures for CHF, even after adjusting for hospital‐level characteristics. In addition, as the estimated percentage of patients admitted by hospitalists increased, the percentage of missed quality opportunities decreased across all measures. The observed relationships were most apparent for measures that could be completed at any time during the hospitalization and at discharge. While it is likely that hospitalists are a marker of a hospital's ability to invest in systems (and as a result, care improvement initiatives), the presence of a potential dose‐response relationship suggests that hospitalists themselves may have a role in improving processes of care.
Our study suggests a generally positive, but mixed, picture of hospitalists' effects on quality process measure performance. Lack of uniformity across measures may depend on the timing of the process measure (eg, whether or not the process is measured at admission or discharge). For example, in contrast to admission process measures, we more commonly observed a positive association between hospitalists and care quality on process measures targeting processes that generally took place later in hospitalization or at discharge. Many admission process measures (eg, door to antibiotic time, blood cultures, and appropriate initial antibiotics) likely occurred prior to hospitalist involvement in most cases and were instead under the direction of emergency medicine physicians. Performance on these measures would not be expected to relate to use of hospitalists, and that is what we observed.
In addition to the timing of when a process was measured or took place, associations between hospitalists and care quality vary by disease. The apparent variation in impact of hospitalists by disease (more impact for cardiac conditions, less for pneumonia) may relate primarily to the characteristics of the processes of care that were measured for each condition. For example, one‐half of the pneumonia process measures related to care occurring within a few hours of admission, while the other one‐half (smoking cessation advice and streptococcal and influenza vaccines) were often administered per protocol or by nonphysician providers.26‐29 However, more of the cardiac measures required physician action (eg, prescription of an ACE‐I at discharge). Alternatively, unmeasured confounders important in the delivery of cardiac care might play an important role in the relationship between hospitalists and cardiac process measure performance.
Our approach to defining hospitalists bears mention as well. While a dichotomous measure of having hospitalists available was only statistically significant for the single CHF discharge composite measure, our measure of hospitalist availabilitythe percentage of patients admitted by hospitalistswas more strongly associated with a larger number of quality measures. Contrast between the dichotomous and continuous measures may have statistical explanations (the power to see differences between 2 groups is more limited with use of a binary predictor, which itself can be subject to bias),30 but may also indicate a dose‐response relationship. A larger number of admissions to hospitalists may help standardize practices, as care is concentrated in a smaller number of physicians' hands. Moreover, larger hospitalist programs may be more likely to have implemented care standardization or quality improvement processes or to have been incorporated into (or lead) hospitals' quality infrastructures. Finally, presence of larger hospitalist groups may be a marker for a hospital's capacity to make hospital‐wide investments in improvement. However, the association between the percentage of patients admitted by hospitalists and care quality persisted even after adjustment for many measures plausibly associated with ability to invest in care quality.
Our study has several limitations. First, although we used a widely accepted definition of hospitalists endorsed by the Society of Hospital Medicine, there are no gold standard definitions for a hospitalist's job description or skill set. As a result, it is possible that a model utilizing rotating internists (from a multispecialty group) might have been misidentified as a hospitalist model. Second, our findings represent a convenience sample of hospitals in a voluntary reporting initiative (CHART) and may not be applicable to hospitals that are less able to participate in such an endeavor. CHART hospitals are recognized to be better performers than the overall California population of hospitals, potentially decreasing variability in our quality of care measures.2 Third, there were significant differences between our comparison groups within the CHART hospitals, including sample size. Although we attempted to adjust our analyses for many important potential confounders and applied conservative measures to assess statistical significance, given the baseline differences, we cannot rule out the possibility of residual confounding by unmeasured factors. Fourth, as described above, this observational study cannot provide robust evidence to support conclusions regarding causality. Fifth, the estimation of the percent of patients admitted by hospitalists is unvalidated and based upon self‐reported and incomplete (41% of respondents) data. We are somewhat reassured by the fact that respondents and nonresponders were similar across all hospital characteristics, as well as outcomes. Sixth, misclassification of the estimated percentage of patients admitted by hospitalists may have influenced our results. Although possible, misclassification often biases results toward the null, potentially weakening any observed association. Given that our respondents were not aware of our hypotheses, there is no reason to expect recall issues to bias the results one way or the other. Finally, for many performance measures, overall performance was excellent among all hospitals (eg, aspirin at admission) with limited variability, thus limiting the ability to assess for differences.
In summary, in a large, cross‐sectional study of California hospitals participating in a voluntary quality reporting initiative, the presence of hospitalists was associated with modest improvements in hospital‐level performance of quality process measures. In addition, we found a relationship between the percentage of patients admitted by hospitalists and improved process measure adherence. Although we cannot determine causality, our data support the hypothesis that dedicated hospital physicians can positively affect the quality of care. Future research should examine this relationship in other settings and should address causality using broader measures of quality including both processes and outcomes.
Acknowledgements
The authors acknowledge Teresa Chipps, BS, Center for Health Services Research, Division of General Internal Medicine and Public Health, Department of Medicine, Vanderbilt University, Nashville, TN, for her administrative and editorial assistance in the preparation of this manuscript.
- ,,,.Care in U.S. hospitals—the Hospital Quality Alliance Program.N Engl J Med.2005;353:265–274.
- CalHospitalCompare.org: online report card simplifies the search for quality hospital care. Available at: http://www.chcf.org/topics/hospitals/index.cfm?itemID=131387. Accessed September 2009.
- ,,, et al.Hospital characteristics and quality of care.JAMA.1992;268:1709–1714.
- ,,,,.Patient and hospital characteristics associated with recommended processes of care for elderly patients hospitalized with pneumonia: results from the Medicare quality indicator system pneumonia module.Arch Intern Med.2002;162:827–833.
- ,,, et al.A systematic review and meta‐analysis of studies comparing mortality rates of private for‐profit and private not‐for‐profit hospitals.CMAJ.2002;166:1399–1406.
- ,.Teaching hospitals and quality of care: a review of the literature.Milbank Q.2002;80:569–593.
- ,,,,.Nurse‐staffing levels and the quality of care in hospitals.N Engl J Med.2002;346:1715–1722.
- ,,,.Growth in the care of older patients by hospitalists in the United States.N Engl J Med.2009;360:1102–1112.
- ,,,.Health care market trends and the evolution of hospitalist use and roles.J Gen Intern Med.2005;20:101–107.
- ,,,.Comparison of processes and outcomes of pneumonia care between hospitalists and community‐based primary care physicians.Mayo Clin Proc.2002;77:1053–1058.
- ,,,.Comparison of hospitalists and nonhospitalists regarding core measures of pneumonia care.Am J Manag Care.2007;13:129–132.
- ,,.Comparison of practice patterns of hospitalists and community physicians in the care of patients with congestive heart failure.J Hosp Med.2008;3:35–41.
- ,,, et al.Quality of care for decompensated heart failure: comparable performance between academic hospitalists and non‐hospitalists.J Gen Intern Med.2008;23:1399–1406.
- ,,,,.Quality of care for patients hospitalized with heart failure: assessing the impact of hospitalists.Arch Intern Med.2002;162:1251–1256.
- ,,,.The inverse relationship between mortality rates and performance in the Hospital Quality Alliance measures.Health Aff.2007;26:1104–1110.
- ,,,,.Does the Leapfrog program help identify high‐quality hospitals?Jt Comm J Qual Patient Saf.2008;34:318–325.
- ,,,,,.Outcomes of care by hospitalists, general internists, and family physicians.N Engl J Med.2007;357:2589–2600.
- CMS HQI demonstration project—composite quality score methodology overview. Available at: http://www.cms.hhs.gov/HospitalQualityInits/downloads/HospitalCompositeQualityScoreMethodologyOverview.pdf. Accessed September 2009.
- ,,.Modeling risk using generalized linear models.J Health Econ.1999;18:153–171.
- ,,.Generalized modeling approaches to risk adjustment of skewed outcomes data.J Health Econ.2005;24:465–488.
- ,,, et al.Quality of care for the treatment of acute medical conditions in US hospitals.Arch Intern Med.2006;166:2511–2517.
- ,,, et al.The Dartmouth Atlas of Cardiovascular Health Care.Chicago:AHA Press;1999. Current data from the Dartmouth Institute for Health Policy and Clinical Practice, Lebanon, NH. Available at: http://www.dartmouthatlas.org/atlases/atlas_ series.shtm. Accessed September 2009.
- ,,.Differences in per capita rates of revascularization and in choice of revascularization procedure for eleven states.BMC Health Serv Res.2006;6:35.
- ,,.The relationship between physician supply, cardiovascular health service use and cardiac disease burden in Ontario: supply‐need mismatch.Can J Card.2008;24:187.
- .Multiple imputation: a primer.Stat Methods Med Res.1999;8:3–15.
- .Nursing intervention and smoking cessation: Meta‐analysis update.Heart Lung.2006;35:147–163.
- .Ten‐year durability and success of an organized program to increase influenza and pneumococcal vaccination rates among high‐risk adults.Am J Med.1998;105:385–392.
- ,,, et al.Role of student pharmacist interns in hospital‐based standing orders pneumococcal vaccination program.J Am Pharm Assoc.2007;47:404–409.
- ,,,.Effect of a pharmacist‐managed program of pneumococcal and influenza immunization on vaccination rates among adult inpatients.Am J Health Syst Pharm.2003;60:1767–1771.
- ,,.Dichotomizing continuous predictors in multiple regression: a bad idea.Stat Med.2006;25:127–141.
Quality of care in US hospitals is inconsistent and often below accepted standards.1 This observation has catalyzed a number of performance measurement initiatives intended to publicize gaps and spur quality improvement.2 As the field has evolved, organizational factors such as teaching status, ownership model, nurse staffing levels, and hospital volume have been found to be associated with performance on quality measures.1, 3‐7 Hospitalists represent a more recent change in the organization of inpatient care8 that may impact hospital‐level performance. In fact, most hospitals provide financial support to hospitalists, not only for hopes of improving efficiency, but also for improving quality and safety.9
Only a few single‐site studies have examined the impact of hospitalists on quality of care for common medical conditions (ie, pneumonia, congestive heart failure, and acute myocardial infarction), and each has focused on patient‐level effects. Rifkin et al.10, 11 did not find differences between hospitalists' and nonhospitalists' patients in terms of pneumonia process measures. Roytman et al.12 found hospitalists more frequently prescribed afterload‐reducing agents for congestive heart failure (CHF), but other studies have shown no differences in care quality for heart failure.13, 14 Importantly, no studies have examined the role of hospitalists in the care of patients with acute myocardial infarction (AMI). In addition, studies have not addressed the effect of hospitalists at the hospital level to understand whether hospitalists have broader system‐level effects reflected by overall hospital performance.
We hypothesized that the presence of hospitalists within a hospital would be associated with improvements in hospital‐level adherence to publicly reported quality process measures, and having a greater percentage of patients admitted by hospitalists would be associated with improved performance. To test these hypotheses, we linked data from a statewide census of hospitalists with data collected as part of a hospital quality‐reporting initiative.
Materials and Methods
Study Sites
We examined the performance of 209 hospitals (63% of all 334 non‐federal facilities in California) participating in the California Hospital Assessment and Reporting Taskforce (CHART) at the time of the survey. CHART is a voluntary quality reporting initiative that began publicly reporting hospital quality data in January 2006.
Hospital‐level Organizational, Case‐mix, and Quality Data
Hospital organizational characteristics (eg, bed size) were obtained from publicly available discharge and utilization data sets from the California Office of Statewide Health Planning and Development (OSHPD). We also linked hospital‐level patient‐mix data (eg, race) from these OSHPD files.
We obtained quality of care data from CHART for January 2006 through June 2007, the time period corresponding to the survey. Quality metrics included 16 measures collected by the Center for Medicare and Medicaid Services (www.cms.hhs.gov) and extensively used in quality research.1, 4, 13, 15‐17 Rather than define a single measure, we examined multiple process measures, anticipating differential impacts of hospitalists on various processes of care for AMI, CHF, and pneumonia. Measures were further divided among those that are usually measured upon initial presentation to the hospital and those that are measured throughout the entire hospitalization and discharge. This division reflects the division of care in the hospital, where emergency room physicians are likely to have a more critical role for admission processes.
Survey Process
We surveyed all nonfederal, acute care hospitals in California that participated in CHART.2 We first identified contacts at each site via professional society mailing lists. We then sent web‐based surveys to all with available email addresses and a fax/paper survey to the remainder. We surveyed individuals between October 2006 and April 2007 and repeated the process at intervals of 1 to 3 weeks. For remaining nonrespondents, we placed a direct call unless consent to survey had been specifically refused. We contacted the following persons in sequence: (1) hospital executives or administrative leaders; (2) hospital medicine department leaders; (3) admitting emergency room personnel or medical staff officers; and (4) hospital website information. In the case of multiple responses with disagreement, the hospital/hospitalist leader's response was treated as the primary source. At each step, respondents were asked to answer questions only if they had a direct working knowledge of their hospitalist services.
Survey Data
Our key survey question to all respondents included whether the respondents could confirm their hospitals had at least one hospitalist medicine group. Hospital leaders were also asked to participate in a more comprehensive survey of their organizational and clinical characteristics. Within the comprehensive survey, leaders also provided estimates of the percent of general medical patients admitted by hospitalists. This measure, used in prior surveys of hospital leaders,9 was intended to be an easily understood approximation of the intensity of hospitalist utilization in any given hospital. A more rigorous, direct measure was not feasible due to the complexity of obtaining admission data over such a large, diverse set of hospitals.
Process Performance Measures
AMI measures assessed at admission included aspirin and ‐blocker administration within 24 hours of arrival. AMI measures assessed at discharge included aspirin administration, ‐blocker administration, angiotensin converting enzyme inhibitor (ACE‐I) (or angiotensin receptor blocker [ARB]) administration for left ventricular (LV) dysfunction, and smoking cessation counseling. There were no CHF admission measures. CHF discharge measures included assessment of LV function, the use of an ACE‐I or ARB for LV dysfunction, and smoking cessation counseling. Pneumonia admission measures included the drawing of blood cultures prior to the receipt of antibiotics, timely administration of initial antibiotics (<8 hours), and antibiotics consistent with recommendations. Pneumonia discharge measures included pneumococcal vaccination, flu vaccination, and smoking cessation counseling.
For each performance measure, we quantified the percentage of missed quality opportunities, defined as the number of patients who did not receive a care process divided by the number of eligible patients, multiplied by 100. In addition, we calculated composite scores for admission and discharge measures across each condition. We summed the numerators and denominators of individual performance measures to generate a disease‐specific composite numerator and denominator. Both individual and composite scores were produced using methodology outlined by the Center for Medicare & Medicaid Services.18 In order to retain as representative a sample of hospitals as possible, we calculated composite scores for hospitals that had a minimum of 25 observations in at least 2 of the quality indicators that made up each composite score.
Statistical Analysis
We used chi‐square tests, Student t tests, and Mann‐Whitney tests, where appropriate, to compare hospital‐level characteristics of hospitals that utilized hospitalists vs. those that did not. Similar analyses were performed among the subset of hospitals that utilized hospitalists. Among this subgroup of hospitals, we compared hospital‐level characteristics between hospitals that provided information regarding the percent of patients admitted by hospitalists vs. those who did not provide this information.
We used multivariable, generalized linear regression models to assess the relationship between having at least 1 hospitalist group and the percentage of missed quality of care measures. Because percentages were not normally distributed (ie, a majority of hospitals had few missed opportunities, while a minority had many), multivariable models employed log‐link functions with a gamma distribution.19, 20 Coefficients for our key predictor (presence of hospitalists) were transformed back to the original units (percentage of missed quality opportunities) so that a positive coefficient represented a higher number of quality measures missed relative to hospitals without hospitalists. Models were adjusted for factors previously reported to be associated with care quality. Hospital organizational characteristics included the number of beds, teaching status, registered nursing (RN) hours per adjusted patient day, and hospital ownership (for‐profit vs. not‐for‐profit). Hospital patient mix factors included annual percentage of admissions by insurance status (Medicare, Medicaid, other), annual percentage of admissions by race (white vs. nonwhite), annual percentage of do‐not‐resuscitate status at admission, and mean diagnosis‐related group‐based case‐mix index.21 We additionally adjusted for the number of cardiac catheterizations, a measure that moderately correlates with the number of cardiologists and technology utilization.22‐24 In our subset analysis among those hospitals with hospitalists, our key predictor for regression analyses was the percentage of patients admitted by hospitalists. For ease of interpretation, the percentage of patients admitted by hospitalists was centered on the mean across all respondent hospitals, and we report the effect of increasing by 10% the percentage of patients admitted by hospitalists. Models were adjusted for the same hospital organizational characteristics listed above. For those models, a positive coefficient also meant a higher number of measures missed.
For both sets of predictors, we additionally tested for the presence of interactions between the predictors and hospital bed size (both continuous as well as dichotomized at 150 beds) in composite measure performance, given the possibility that any hospitalist effect may be greater among smaller, resource‐limited hospitals. Tests for interaction were performed with the likelihood ratio test. In addition, to minimize any potential bias or loss of power that might result from limiting the analysis to hospitals with complete data, we used the multivariate imputation by chained equations method, as implemented in STATA 9.2 (StataCorp, College Station, TX), to create 10 imputed datasets.25 Imputation of missing values was restricted to confounding variables. Standard methods were then used to combine results over the 10 imputed datasets. We also applied Bonferroni corrections to composite measure tests based on the number of composites generated (n = 5). Thus, for the 5 inpatient composites created, standard definitions of significance (P 0.05) were corrected by dividing composite P values by 5, requiring P 0.01 for significance. The institutional review board of the University of California, San Francisco, approved the study. All analyses were performed using STATA 9.2.
Results
Characteristics of Participating Sites
There were 209 eligible hospitals. All 209 (100%) hospitals provided data about the presence or absence of hospitalists via at least 1 of our survey strategies. The majority of identification of hospitalist utilization was via contact with either hospital or hospitalist leaders, n = 147 (70.3%). Web‐sites informed hospitalist prevalence in only 3 (1.4%) hospitals. There were 8 (3.8%) occurrences of disagreement between sources, all of which had available hospital/hospitalist leader responses. Only 1 (0.5%) hospital did not have the minimum 25 patients eligible for any disease‐specific quality measures during the data reporting period. Collectively, the remaining 208 hospitals accounted for 81% of California's acute care hospital population.
Comparisons of Sites With Hospitalists and Those Without
A total of 170 hospitals (82%) participating in CHART used hospitalists. Hospitals with and without hospitalists differed by a variety of characteristics (Table 1). Sites with hospitalists were larger, less likely to be for‐profit, had more registered nursing hours per day, and performed more cardiac catheterizations.
| Characteristic | Hospitals Without Hospitalists (n = 38) | Hospitals With Hospitalists (n = 170) | P Value* |
|---|---|---|---|
| |||
| Number of beds, n (% of hospitals) | <0.001 | ||
| 0‐99 | 16 (42.1) | 14 (8.2) | |
| 100‐199 | 8 (21.1) | 44 (25.9) | |
| 200‐299 | 7 (18.4) | 42 (24.7) | |
| 300+ | 7 (18.4) | 70 (41.2) | |
| For profit, n (% of hospitals) | 9 (23.7) | 18 (10.6) | 0.03 |
| Teaching hospital, n (% of hospitals) | 7 (18.4) | 55 (32.4) | 0.09 |
| RN hours per adjusted patient day, number of hours (IQR) | 7.4 (5.7‐8.6) | 8.5 (7.4‐9.9) | <0.001 |
| Annual cardiac catheterizations, n (IQR) | 0 (0‐356) | 210 (0‐813) | 0.007 |
| Hospital total census days, n (IQR) | 37161 (14910‐59750) | 60626 (34402‐87950) | <0.001 |
| ICU total census, n (IQR) | 2193 (1132‐4289) | 3855 (2489‐6379) | <0.001 |
| Medicare insurance, % patients (IQR) | 36.9 (28.5‐48.0) | 35.3(28.2‐44.3) | 0.95 |
| Medicaid insurance, % patients (IQR) | 21.0 (12.7‐48.3) | 16.6 (5.6‐27.6) | 0.02 |
| Race, white, % patients (IQR) | 53.7 (26.0‐82.7) | 59.1 (45.6‐74.3) | 0.73 |
| DNR at admission, % patients (IQR) | 3.6 (2.0‐6.4) | 4.4 (2.7‐7.1) | 0.12 |
| Case‐mix index, index (IQR) | 1.05 (0.90‐1.21) | 1.13 (1.01‐1.26) | 0.11 |
Relationship Between Hospitalist Group Utilization and the Percentage of Missed Quality Opportunities
Table 2 shows the frequency of missed quality opportunities in sites with hospitalists compared to those without. In general, for both individual and composite measures of quality, multivariable adjustment modestly attenuated the observed differences between the 2 groups of hospitals. We present only the more conservative adjusted estimates.
| Quality Measure | Number of Hospitals | Adjusted Mean % Missed Quality Opportunities (95% CI) | Difference With Hospitalists | Relative % Change | P Value | |
|---|---|---|---|---|---|---|
| Hospitals Without Hospitalists | Hospitals With Hospitalists | |||||
| ||||||
| Acute myocardial infarction | ||||||
| Admission measures | ||||||
| Aspirin at admission | 193 | 3.7 (2.4‐5.1) | 3.4 (2.3‐4.4) | 0.3 | 10.0 | 0.44 |
| Beta‐blocker at admission | 186 | 7.8 (4.7‐10.9) | 6.4 (4.4‐8.3) | 1.4 | 18.3 | 0.19 |
| AMI admission composite | 186 | 5.5 (3.6‐7.5) | 4.8 (3.4‐6.1) | 0.7 | 14.3 | 0.26 |
| Hospital/discharge measures | ||||||
| Aspirin at discharge | 173 | 7.5 (4.5‐10.4) | 5.2 (3.4‐6.9) | 2.3 | 31.0 | 0.02 |
| Beta‐blocker at discharge | 179 | 6.6 (3.8‐9.4) | 5.9 (3.6‐8.2) | 0.7 | 9.6 | 0.54 |
| ACE‐I/ARB at discharge | 119 | 20.7 (9.5‐31.8) | 11.8 (6.6‐17.0) | 8.9 | 43.0 | 0.006 |
| Smoking cessation counseling | 193 | 3.8 (2.4‐5.1) | 3.4 (2.4‐4.4) | 0.4 | 10.0 | 0.44 |
| AMI hospital/discharge composite | 179 | 6.4 (4.1‐8.6) | 5.3 (3.7‐6.8) | 1.1 | 17.6 | 0.16 |
| Congestive heart failure | ||||||
| Hospital/discharge measures | ||||||
| Ejection fraction assessment | 208 | 12.6 (7.7‐17.6) | 6.5 (4.6‐8.4) | 6.1 | 48.2 | <0.001 |
| ACE‐I/ARB at discharge | 201 | 14.7 (10.0‐19.4) | 12.9 (9.8‐16.1) | 1.8 | 12.1 | 0.31 |
| Smoking cessation counseling | 168 | 9.1 (2.9‐15.4) | 9.0 (4.2‐13.8) | 0.1 | 1.8 | 0.98 |
| CHF hospital/discharge composite | 201 | 12.2 (7.9‐16.5) | 8.2 (6.2‐10.2) | 4.0 | 33.1 | 0.006* |
| Pneumonia | ||||||
| Admission measures | ||||||
| Blood culture before antibiotics | 206 | 12.0 (9.1‐14.9) | 10.9 (8.8‐13.0) | 1.1 | 9.1 | 0.29 |
| Timing of antibiotics <8 hours | 208 | 5.8 (4.1‐7.5) | 6.2 (4.7‐7.7) | 0.4 | 6.9 | 0.56 |
| Initial antibiotic consistent with recommendations | 207 | 15.0 (11.6‐18.6) | 13.8 (10.9‐16.8) | 1.2 | 8.1 | 0.27 |
| Pneumonia admission composite | 207 | 10.5 (8.5‐12.5) | 9.9 (8.3‐11.5) | 0.6 | 5.9 | 0.37 |
| Hospital/discharge measures | ||||||
| Pneumonia vaccine | 208 | 29.4 (19.5‐39.2) | 27.1 (19.9‐34.3) | 2.3 | 7.7 | 0.54 |
| Influenza vaccine | 207 | 36.9 (25.4‐48.4) | 35.0 (27.0‐43.1) | 1.9 | 5.2 | 0.67 |
| Smoking cessation counseling | 196 | 15.4 (7.8‐23.1) | 13.9 (8.9‐18.9) | 1.5 | 10.2 | 0.59 |
| Pneumonia hospital/discharge composite | 207 | 29.6 (20.5‐38.7) | 27.3 (20.9‐33.6) | 2.3 | 7.8 | 0.51 |
Compared to hospitals without hospitalists, those with hospitalists did not have any statistically significant differences in the individual and composite admission measures for each of the disease processes. In contrast, there were statistically significant differences between hospitalist and nonhospitalist sites for many individual cardiac processes of care that typically occur after admission from the emergency room (ie, LV function assessment for CHF) or those that occurred at discharge (ie, aspirin and ACE‐I/ARB at discharge for AMI). Similarly, the composite discharge scores for AMI and CHF revealed better overall process measure performance at sites with hospitalists, although the AMI composite did not meet statistical significance. There were no statistically significant differences between groups for the pneumonia process measures assessed at discharge. In addition, for composite measures there were no statistically significant interactions between hospitalist prevalence and bed size, although there was a trend (P = 0.06) for the CHF discharge composite, with a larger effect of hospitalists among smaller hospitals.
Percent of Patients Admitted by Hospitalists
Of the 171 hospitals with hospitalists, 71 (42%) estimated the percent of patients admitted by their hospitalist physicians. Among the respondents, the mean and median percentages of medical patients admitted by hospitalists were 51% (SD = 25%) and 49% (IQR = 30‐70%), respectively. Thirty hospitals were above the sample mean. Compared to nonrespondent sites, respondent hospitals took care of more white patients; otherwise, respondent and nonrespondent hospitals were similar in terms of bed size, location, performance across each measure, and other observable characteristics (Supporting Information, Appendix 1).
Relationship Between the Estimated Percentages of Medical Patients Admitted by Hospitalists and Missed Quality Opportunities
Table 3 displays the change in missed quality measures associated with each additional 10% of patients estimated to be admitted by hospitalists. A higher estimated percentage of patients admitted by hospitalists was associated with statistically significant improvements in quality of care across a majority of individual measures and for all composite discharge measures regardless of condition. For example, every 10% increase in the mean estimated number of patients admitted by hospitalists was associated with a mean of 0.6% (P < 0.001), 0.5% (P = 0.004), and 1.5% (P = 0.006) fewer missed quality opportunities for AMI, CHF, and pneumonia discharge process measures composites, respectively. In addition, for these composite measures, there were no statistically significant interactions between the estimated percentage of patients admitted by hospitalists and bed size (dichotomized at 150 beds), although there was a trend (P = 0.09) for the AMI discharge composite, with a larger effect of hospitalists among smaller hospitals.
| Quality Measure | Number of Hospitals | Adjusted % Missed Quality Opportunities (95% CI) | Difference With Hospitalists | Relative Percent Change | P Value | |
|---|---|---|---|---|---|---|
| Among Hospitals With Mean % of Patients Admitted by Hospitalists | Among Hospitals With Mean + 10% of Patients Admitted by Hospitalists | |||||
| ||||||
| Acute myocardial infarction | ||||||
| Admission measures | ||||||
| Aspirin at admission | 70 | 3.4 (2.3‐4.6) | 3.1 (2.0‐3.1) | 0.3 | 10.2 | 0.001 |
| Beta‐blocker at admission | 65 | 5.8 (3.4‐8.2) | 5.1 (3.0‐7.3) | 0.7 | 11.9 | <0.001 |
| AMI admission composite | 65 | 4.5 (2.9‐6.1) | 4.0 (2.6‐5.5) | 0.5 | 11.1 | <0.001* |
| Hospital/discharge measures | ||||||
| Aspirin at discharge | 62 | 5.1 (3.3‐6.9) | 4.6 (3.1‐6.2) | 0.5 | 9.0 | 0.03 |
| Beta‐blocker at discharge | 63 | 5.1 (2.9‐7.2) | 4.3 (2.5‐6.0) | 0.8 | 15.4 | <0.001 |
| ACE‐I/ARB at discharge | 44 | 11.4 (6.2‐16.6) | 10.3 (5.4‐15.1) | 1.1 | 10.0 | 0.02 |
| Smoking cessation counseling | 70 | 3.4 (2.3‐4.6) | 3.1 (2.0‐4.1) | 0.3 | 10.2 | 0.001 |
| AMI hospital/discharge composite | 63 | 5.0 (3.3‐6.7) | 4.4 (3.0‐5.8) | 0.6 | 11.3 | 0.001* |
| Congestive heart failure | ||||||
| Hospital/discharge measures | ||||||
| Ejection fraction assessment | 71 | 5.9 (4.1‐7.6) | 5.6 (3.9‐7.2) | 0.3 | 2.9 | 0.07 |
| ACE‐I/ARB at discharge | 70 | 12.3 (8.6‐16.0) | 11.4 (7.9‐15.0) | 0.9 | 7.1 | 0.008* |
| Smoking cessation counseling | 56 | 8.4 (4.1‐12.6) | 8.2 (4.2‐12.3) | 0.2 | 1.7 | 0.67 |
| CHF hospital/discharge composite | 70 | 7.7 (5.8‐9.6) | 7.2 (5.4‐9.0) | 0.5 | 6.0 | 0.004* |
| Pneumonia | ||||||
| Admission measures | ||||||
| Timing of antibiotics <8 hours | 71 | 5.9 (4.2‐7.6) | 5.9 (4.1‐7.7) | 0.0 | 0.0 | 0.98 |
| Blood culture before antibiotics | 71 | 10.0 (8.0‐12.0) | 9.8 (7.7‐11.8) | 0.2 | 2.6 | 0.18 |
| Initial antibiotic consistent with recommendations | 71 | 13.3 (10.4‐16.2) | 12.9 (9.9‐15.9) | 0.4 | 2.8 | 0.20 |
| Pneumonia admission composite | 71 | 9.4 (7.7‐11.1) | 9.2 (7.6‐10.9) | 0.2 | 1.8 | 0.23 |
| Hospital/discharge measures | ||||||
| Pneumonia vaccine | 71 | 27.0 (19.2‐34.8) | 24.7 (17.2‐32.2) | 2.3 | 8.4 | 0.006 |
| Influenza vaccine | 71 | 34.1 (25.9‐42.2) | 32.6 (24.7‐40.5) | 1.5 | 4.3 | 0.03 |
| Smoking cessation counseling | 67 | 15.2 (9.8‐20.7) | 15.0 (9.6‐20.4) | 0.2 | 2.0 | 0.56 |
| Pneumonia hospital/discharge composite | 71 | 26.7 (20.3‐33.1) | 25.2 (19.0‐31.3) | 1.5 | 5.8 | 0.006* |
In order to test the robustness of our results, we carried out 2 secondary analyses. First, we used multivariable models to generate a propensity score representing the predicted probability of being assigned to a hospital with hospitalists. We then used the propensity score as an additional covariate in subsequent multivariable models. In addition, we performed a complete‐case analysis (including only hospitals with complete data, n = 204) as a check on the sensitivity of our results to missing data. Neither analysis produced results substantially different from those presented.
Discussion
In this cross‐sectional analysis of hospitals participating in a voluntary quality reporting initiative, hospitals with at least 1 hospitalist group had fewer missed discharge care process measures for CHF, even after adjusting for hospital‐level characteristics. In addition, as the estimated percentage of patients admitted by hospitalists increased, the percentage of missed quality opportunities decreased across all measures. The observed relationships were most apparent for measures that could be completed at any time during the hospitalization and at discharge. While it is likely that hospitalists are a marker of a hospital's ability to invest in systems (and as a result, care improvement initiatives), the presence of a potential dose‐response relationship suggests that hospitalists themselves may have a role in improving processes of care.
Our study suggests a generally positive, but mixed, picture of hospitalists' effects on quality process measure performance. Lack of uniformity across measures may depend on the timing of the process measure (eg, whether or not the process is measured at admission or discharge). For example, in contrast to admission process measures, we more commonly observed a positive association between hospitalists and care quality on process measures targeting processes that generally took place later in hospitalization or at discharge. Many admission process measures (eg, door to antibiotic time, blood cultures, and appropriate initial antibiotics) likely occurred prior to hospitalist involvement in most cases and were instead under the direction of emergency medicine physicians. Performance on these measures would not be expected to relate to use of hospitalists, and that is what we observed.
In addition to the timing of when a process was measured or took place, associations between hospitalists and care quality vary by disease. The apparent variation in impact of hospitalists by disease (more impact for cardiac conditions, less for pneumonia) may relate primarily to the characteristics of the processes of care that were measured for each condition. For example, one‐half of the pneumonia process measures related to care occurring within a few hours of admission, while the other one‐half (smoking cessation advice and streptococcal and influenza vaccines) were often administered per protocol or by nonphysician providers.26‐29 However, more of the cardiac measures required physician action (eg, prescription of an ACE‐I at discharge). Alternatively, unmeasured confounders important in the delivery of cardiac care might play an important role in the relationship between hospitalists and cardiac process measure performance.
Our approach to defining hospitalists bears mention as well. While a dichotomous measure of having hospitalists available was only statistically significant for the single CHF discharge composite measure, our measure of hospitalist availabilitythe percentage of patients admitted by hospitalistswas more strongly associated with a larger number of quality measures. Contrast between the dichotomous and continuous measures may have statistical explanations (the power to see differences between 2 groups is more limited with use of a binary predictor, which itself can be subject to bias),30 but may also indicate a dose‐response relationship. A larger number of admissions to hospitalists may help standardize practices, as care is concentrated in a smaller number of physicians' hands. Moreover, larger hospitalist programs may be more likely to have implemented care standardization or quality improvement processes or to have been incorporated into (or lead) hospitals' quality infrastructures. Finally, presence of larger hospitalist groups may be a marker for a hospital's capacity to make hospital‐wide investments in improvement. However, the association between the percentage of patients admitted by hospitalists and care quality persisted even after adjustment for many measures plausibly associated with ability to invest in care quality.
Our study has several limitations. First, although we used a widely accepted definition of hospitalists endorsed by the Society of Hospital Medicine, there are no gold standard definitions for a hospitalist's job description or skill set. As a result, it is possible that a model utilizing rotating internists (from a multispecialty group) might have been misidentified as a hospitalist model. Second, our findings represent a convenience sample of hospitals in a voluntary reporting initiative (CHART) and may not be applicable to hospitals that are less able to participate in such an endeavor. CHART hospitals are recognized to be better performers than the overall California population of hospitals, potentially decreasing variability in our quality of care measures.2 Third, there were significant differences between our comparison groups within the CHART hospitals, including sample size. Although we attempted to adjust our analyses for many important potential confounders and applied conservative measures to assess statistical significance, given the baseline differences, we cannot rule out the possibility of residual confounding by unmeasured factors. Fourth, as described above, this observational study cannot provide robust evidence to support conclusions regarding causality. Fifth, the estimation of the percent of patients admitted by hospitalists is unvalidated and based upon self‐reported and incomplete (41% of respondents) data. We are somewhat reassured by the fact that respondents and nonresponders were similar across all hospital characteristics, as well as outcomes. Sixth, misclassification of the estimated percentage of patients admitted by hospitalists may have influenced our results. Although possible, misclassification often biases results toward the null, potentially weakening any observed association. Given that our respondents were not aware of our hypotheses, there is no reason to expect recall issues to bias the results one way or the other. Finally, for many performance measures, overall performance was excellent among all hospitals (eg, aspirin at admission) with limited variability, thus limiting the ability to assess for differences.
In summary, in a large, cross‐sectional study of California hospitals participating in a voluntary quality reporting initiative, the presence of hospitalists was associated with modest improvements in hospital‐level performance of quality process measures. In addition, we found a relationship between the percentage of patients admitted by hospitalists and improved process measure adherence. Although we cannot determine causality, our data support the hypothesis that dedicated hospital physicians can positively affect the quality of care. Future research should examine this relationship in other settings and should address causality using broader measures of quality including both processes and outcomes.
Acknowledgements
The authors acknowledge Teresa Chipps, BS, Center for Health Services Research, Division of General Internal Medicine and Public Health, Department of Medicine, Vanderbilt University, Nashville, TN, for her administrative and editorial assistance in the preparation of this manuscript.
- ,,,.Care in U.S. hospitals—the Hospital Quality Alliance Program.N Engl J Med.2005;353:265–274.
- CalHospitalCompare.org: online report card simplifies the search for quality hospital care. Available at: http://www.chcf.org/topics/hospitals/index.cfm?itemID=131387. Accessed September 2009.
- ,,, et al.Hospital characteristics and quality of care.JAMA.1992;268:1709–1714.
- ,,,,.Patient and hospital characteristics associated with recommended processes of care for elderly patients hospitalized with pneumonia: results from the Medicare quality indicator system pneumonia module.Arch Intern Med.2002;162:827–833.
- ,,, et al.A systematic review and meta‐analysis of studies comparing mortality rates of private for‐profit and private not‐for‐profit hospitals.CMAJ.2002;166:1399–1406.
- ,.Teaching hospitals and quality of care: a review of the literature.Milbank Q.2002;80:569–593.
- ,,,,.Nurse‐staffing levels and the quality of care in hospitals.N Engl J Med.2002;346:1715–1722.
- ,,,.Growth in the care of older patients by hospitalists in the United States.N Engl J Med.2009;360:1102–1112.
- ,,,.Health care market trends and the evolution of hospitalist use and roles.J Gen Intern Med.2005;20:101–107.
- ,,,.Comparison of processes and outcomes of pneumonia care between hospitalists and community‐based primary care physicians.Mayo Clin Proc.2002;77:1053–1058.
- ,,,.Comparison of hospitalists and nonhospitalists regarding core measures of pneumonia care.Am J Manag Care.2007;13:129–132.
- ,,.Comparison of practice patterns of hospitalists and community physicians in the care of patients with congestive heart failure.J Hosp Med.2008;3:35–41.
- ,,, et al.Quality of care for decompensated heart failure: comparable performance between academic hospitalists and non‐hospitalists.J Gen Intern Med.2008;23:1399–1406.
- ,,,,.Quality of care for patients hospitalized with heart failure: assessing the impact of hospitalists.Arch Intern Med.2002;162:1251–1256.
- ,,,.The inverse relationship between mortality rates and performance in the Hospital Quality Alliance measures.Health Aff.2007;26:1104–1110.
- ,,,,.Does the Leapfrog program help identify high‐quality hospitals?Jt Comm J Qual Patient Saf.2008;34:318–325.
- ,,,,,.Outcomes of care by hospitalists, general internists, and family physicians.N Engl J Med.2007;357:2589–2600.
- CMS HQI demonstration project—composite quality score methodology overview. Available at: http://www.cms.hhs.gov/HospitalQualityInits/downloads/HospitalCompositeQualityScoreMethodologyOverview.pdf. Accessed September 2009.
- ,,.Modeling risk using generalized linear models.J Health Econ.1999;18:153–171.
- ,,.Generalized modeling approaches to risk adjustment of skewed outcomes data.J Health Econ.2005;24:465–488.
- ,,, et al.Quality of care for the treatment of acute medical conditions in US hospitals.Arch Intern Med.2006;166:2511–2517.
- ,,, et al.The Dartmouth Atlas of Cardiovascular Health Care.Chicago:AHA Press;1999. Current data from the Dartmouth Institute for Health Policy and Clinical Practice, Lebanon, NH. Available at: http://www.dartmouthatlas.org/atlases/atlas_ series.shtm. Accessed September 2009.
- ,,.Differences in per capita rates of revascularization and in choice of revascularization procedure for eleven states.BMC Health Serv Res.2006;6:35.
- ,,.The relationship between physician supply, cardiovascular health service use and cardiac disease burden in Ontario: supply‐need mismatch.Can J Card.2008;24:187.
- .Multiple imputation: a primer.Stat Methods Med Res.1999;8:3–15.
- .Nursing intervention and smoking cessation: Meta‐analysis update.Heart Lung.2006;35:147–163.
- .Ten‐year durability and success of an organized program to increase influenza and pneumococcal vaccination rates among high‐risk adults.Am J Med.1998;105:385–392.
- ,,, et al.Role of student pharmacist interns in hospital‐based standing orders pneumococcal vaccination program.J Am Pharm Assoc.2007;47:404–409.
- ,,,.Effect of a pharmacist‐managed program of pneumococcal and influenza immunization on vaccination rates among adult inpatients.Am J Health Syst Pharm.2003;60:1767–1771.
- ,,.Dichotomizing continuous predictors in multiple regression: a bad idea.Stat Med.2006;25:127–141.
Copyright © 2010 Society of Hospital Medicine
Hospital Leader Survey
In the late 1990s, hospitalist systems grew rapidly in an environment where cost containment was paramount, complexity of patients increased, and outpatient practices experienced increasing productivity and efficiency pressures.15 While the healthcare delivery environment has changed significantly since that time,68 hospitalists have continued to become more common. In fact, the field's present size of more than 25,000 has already exceeded early projections, and there are no signs of slackening demand.911
Growth has been attributed to primary care physicians' increasing focus on outpatient care, hospitals' response to financial pressures, and the need to facilitate improved communication among various hospital care providers.1216 Hospital leadership has played a similarly important role in fueling the growth of hospitalists, particularly since the vast majority of programs require and receive institutional (usually hospital) support.17 However, the factors that continue to influence leaders' decisions to utilize hospitalists and the current and future needs that hospitalists are fulfilling are unknown. Each of these factors is likely to impact growth of the field, as well as the clinical and organizational identity of hospitalists. In addition, an understanding of the market demand for hospitalists' competencies and the roles they play in the hospital may inform any changes in board certification and training for hospitalists.11, 1821
To gain a more complete understanding of a key part of the engine driving the growth of hospitalists, we performed a cross‐sectional survey of California hospital leaders who were involved with the funding or administration of their hospitalist groups. Our survey aimed to understand: (1) the prevalence of hospitalist groups in California hospitals, (2) hospital leaders' rationale for initiating the use of hospitalists, (3) the scope of clinical and nonclinical practice of hospitalists, and 4) hospital leaders' perspective on the need for further training and/or certification.
Materials and Methods
Sites and Subjects
We targeted all nonfederal, nonspecialty, acute care hospitals in California (n = 334) for this survey. We limited our survey to California in order to maximize our local resources and to improve implementation of and response to the survey. Additionally, California's size and diversity gives it disproportionate impact and potential generalizability. At each site, we focused our efforts on identifying and surveying executives or administrative leaders involved in organizational and staff decisions, specifically the decision whether or not to hire and/or fund a hospitalist program and potentially direct its activities (described in more detail below). The University of California, San Francisco, Committee on Human Research approved the research protocol.
We identified hospital leaders at each site by merging information from multiple sources. These included the American Hospital Association database, the California Hospital Association, the Hospital Association of Southern California (HASC), the California Health Care Safety Net Institute, and individual hospital websites.
Survey Development
Our survey was based upon instruments used in previous research examining hospital medicine group organizational structure15, 22 and enhanced with questions developed by the research team (A.D.A., E.E.V., R.M.W.). The survey was pretested in an advisory group of 5 hospital Chief Executive Officers (CEOs), Chief Medical Officers (CMOs), and Vice Presidents for Medical Affairs (VPMAs) from sites across California. Based on their input, we removed, edited, or added questions to our survey. This advisory group also helped the research team design our survey process.
Our final survey defined a hospitalist as a physician who spends all or the majority of his or her clinical, administrative, educational, or research activities in the care of hospitalized patients.4 We collected data in 4 areas: (1) We asked hospital leaders to confirm the presence or absence of at least 1 hospitalist group practicing within the surveyed hospital. We also asked for the year the first hospitalist group began practicing within the specified hospital. (2) We asked hospital leaders to indicate, among a prespecified list of 11 choices, the reason(s) they implemented a hospitalist group at the surveyed hospital. Surveyed categories included: (a) care for uncovered patients (patients without an identified doctor and/or uninsured), (b) improve costs, (c) improve length of stay, (d) improve emergency department throughput, (e) primary care provider demand, (f) improve patient satisfaction, (g) improve emergency room staffing, (h) quality improvement needs, (i) specialist physician demand, (j) overnight coverage, and (k) surgical comanagement. Due to the close relationship between cost and length of stay, we combined these 2 categories into a single category for reporting and analysis. This resulted in 10 final categories. We asked leaders who did not identify a practicing hospitalist group about the likelihood of hospitalists practicing at their hospital within the next 5 years and the reason(s) for future implementation. (3) We asked leaders to describe the services currently provided among a prespecified list of clinical care duties that go beyond the scope of inpatient general internal medicine (eg, surgical comanagement, rapid response team leadership) as well as nonclinical duties (eg, quality improvement activities, systems project implementation). If hospitalists did not currently provide the identified service, we asked leaders to indicate if they would be inclined to involve hospitalists in the specified service in the future. (4) Finally, we asked hospital leaders their opinion regarding the need for further training or certification for hospitalists.
Survey Protocol
We administered surveys between October 2006 and April 2007. We initially emailed the survey. We repeated this process for nonrespondents at intervals of 1 to 3 weeks after the initial emailing. Next, we sent nonrespondents a physical mailing with a reminder letter. Finally, we made phone calls to those who had not responded within 4 weeks of the last mailed letter. We asked survey recipients to respond only if they felt they had an adequate working knowledge of the hospitalist service at their hospital. If they did not feel they could adequately answer all questions, we allowed them to forward the instrument to others with a better working knowledge of the service.
Because we allowed recipients to forward the survey, we occasionally received 2 surveys from 1 site. In this case, we selected the survey according to the following prioritization order: (1) CEOs/COOs, (2) CMOs, (3) VPMAs, and (4) other vice presidents (VPs) or executive/administrative leaders with staff organization knowledge and responsibilities.
Hospital Descriptive Data
We obtained hospital organizational data from the California Office of Statewide Health Planning and Development's (OSHPD) publicly available Case Mix Index Data, hospital Annual Financial Data, aggregated Patient Discharge Data, and Utilization Data from 2006.23 Organizational characteristics included hospital size, location, profit status, payor mix, and diagnosis‐related groupbased case‐mix. Teaching status was determined from the 2005 American Hospital Association database. Membership status in California's voluntary quality reporting initiative, California Hospital Assessment and Reporting Taskforce (CHART), was publicly available at
Statistical Analyses
We performed univariable analyses to characterize survey respondents, followed by bivariable analyses to compare hospital characteristics and patient mix of responding and nonresponding hospitals. We used similar methods to characterize respondent hospitals with and without at least 1 hospitalist group. We compared continuous data with the Students t tests or Mann‐Whitney tests as appropriate and categorical data with chi‐square tests.
We then summarized the number of times a specific rationale was cited by hospital leaders for implementing a hospitalist group. Among hospitals that did not have a hospitalist system in place at the time of the survey, we asked if they were planning on starting one within the next 5 years. For these hospitals, we used content analysis to summarize open‐ended responses in order to understand factors that are currently influencing these hospital leaders to consider implementing a hospitalist group.
Next, we aimed to understand what clinical and nonclinical roles hospitalists were performing in hospitals with established hospitalist programs. Clinical activities were divided into general clinical areas, triage/emergency‐related, or administrative activities. First, we summarized the number and percent of programs performing each clinical and nonclinical activity. This was followed by logistic regression analyses to assess whether the time period that hospitalist groups began practicing or additional hospital characteristics predicted the performance of individual hospitalist activities. To guard against overfitting of models, analyses were limited to rationales that were cited a minimum of 50 times.24 Hospital factors were selected on the basis of face validity and advisory group input and included hospital bed size, ownership status (public vs. private), teaching status, and membership status in CHART. We divided the year of hospitalist program implementation into 3 time periods: (1) before 2002, (2) between 2002 and 2004, and (3) 2005 or later.
Finally, we described the percentage of hospitals that favored having their hospitalist group(s) perform each of the identified clinical or nonclinical activities, if they were not already performing them. We performed analyses with statistical software (Stata Version 9.2, College Station, TX).
Results
Respondent Characteristics
We received 200 survey responses. Of those, we excluded 15 duplicates (eg, a survey from both the CEO and VPMA) and 6 responses identified as coming from hospitalists who did not have a leadership position in the hospital. Thus, the final hospital leader survey response rate was 54% (n = 179). Forty‐six percent of the final responses were from CEOs or COOs; 37% of responses were from CMOs, VPMAs, and medical directors; and the remaining 17% of responses were from other VPs or administrative directors.
Respondent and nonrespondent hospitals were statistically similar in terms of teaching status and participation in CHART. Hospital patient census, intensive care unit census, payer mix, and diagnosis‐related groupbased case‐mix revealed no statistically significant differences between groups (P > 0.05). Respondent hospitals tended to have fewer beds and were more often for‐profit compared to nonrespondents (P = 0.05 and P < 0.01, respectively).
Descriptive Characteristics of Hospitals with Hospitalists
Sixty‐four percent (n = 115) of hospital leaders stated that they utilized hospitalists for at least some patients. Hospitals with hospitalists were statistically more likely (P < 0.05) to be larger, a major teaching hospital, or a member of a voluntary quality reporting initiative (Table 1).
| Variable | Hospitals without Hospitalists (n = 64) [n (%)] | Hospitals with Hospitalists (n = 115) [n (%)] | P Value* |
|---|---|---|---|
| |||
| Hospital size (total number of beds) | |||
| 0‐99 | 33 (51.6) | 18 (15.7) | <0.001 |
| 100‐199 | 19 (29.7) | 32 (27.8) | |
| 200‐299 | 5 (7.8) | 23 (20.0) | |
| 300+ | 7 (10.9) | 42 (36.5) | |
| Hospital control | 0.12 | ||
| City/county | 8 (12.5) | 7 (6.1) | |
| District | 15 (23.4) | 17 (14.8) | |
| For‐profit | 10 (15.6) | 16 (13.9) | |
| Non‐profit | 31 (48.4) | 71 (61.7) | |
| University of California | 0 (0.0) | 4 (3.5) | |
| Teaching hospital | 8 (12.5) | 30 (26.1) | 0.03 |
| Member of voluntary quality reporting initiative | 27 (42.2) | 93 (80.9) | <0.001 |
Among all hospitals with hospitalists, 39% estimated that hospitalists cared for at least one‐half of admitted medical patients, and 7% stated that hospitalists cared for all patients. Twenty‐four percent of respondents were unable to provide a quantitative estimate of the percent of patients cared for by hospitalists. When asked about expectations of growth in the coming year, 57% of respondents with hospitalists expected to see increases in the number of hospitalists at their hospital, and none expected a decrease. Among the 64 respondent hospitals that currently did not have a hospitalist program, 44% (n = 28) of the hospital leaders felt hospitalists would be managing patients in the future. Of those, 93% felt this would occur within the next 2 years.
Reasons for Implementing Hospitalists
Hospital leaders reported that the most important reasons for implementing a hospitalist model included caring for uncovered patients (68%), decreasing hospital costs and length of stay (63%), and improving throughput in the emergency room (62%). We provide additional reasons in Figure 1. In addition, leaders often identified multiple factors in the decision to utilize hospitalists, including demand from primary care doctors, patient satisfaction, and quality improvement. Among the 28 hospitals that currently did not have hospitalists but anticipated that they would soon (data not shown), the need to improve quality was the most commonly cited reason (54% of respondents) for expecting to start a program within 2 years, followed by demand from primary care doctors (46% of respondents).

Clinical Practice of Hospitalists and Expectations for Future Growth
Hospitalists perform a wide array of clinical and nonclinical duties (Figure 2). In addition to general medical care, the most common clinical activities of hospitalists included screening medical admissions from the emergency room for appropriateness of admission and triaging to appropriate level of care (67%), triaging patients transferred from an outside hospital (72%), and comanaging surgical patients (66%). The most common nonclinical activity was participation in quality improvement activities (72%). Multivariable analyses demonstrated that the performance of the most prevalent activities was not usually associated with the year of hospitalist implementation or hospital characteristics. An exception was that newly initiated programs had a statistically significant decreased odds of involvement in clinical guideline development (odds ratio [OR], 0.3; 95% confidence interval [CI], 0.1‐0.9) and a trend toward decreased leadership in quality improvement (OR, 0.3; 95% CI, 0.1‐1.1). Hospitalists at teaching hospitals had increased odds of managing patient transfers (OR, 4.7; 95% CI, 1.0‐21.2), whereas for‐profit hospitals had lower odds of screening patients in the emergency room (OR, 0.1; 95% CI, 0.0‐0.7).
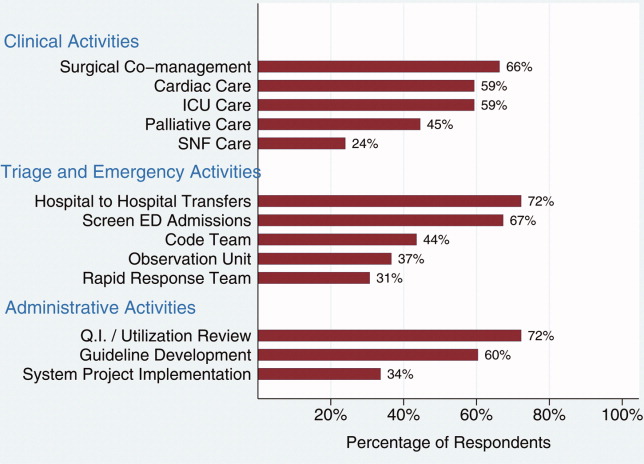
Among those hospitals with hospitalists who were not presently involved in any of the above activities, there was a widespread interest among hospital leaders to have their hospitalist group(s) lead or participate in them (Figure 3). The most commonly cited activities included participation in inpatient clinical guideline development (85%), implementation of system‐wide projects (81%) (eg, computerized physician order entry system), participation on a rapid response team (80%), and caring for patients in an observation unit (80%).
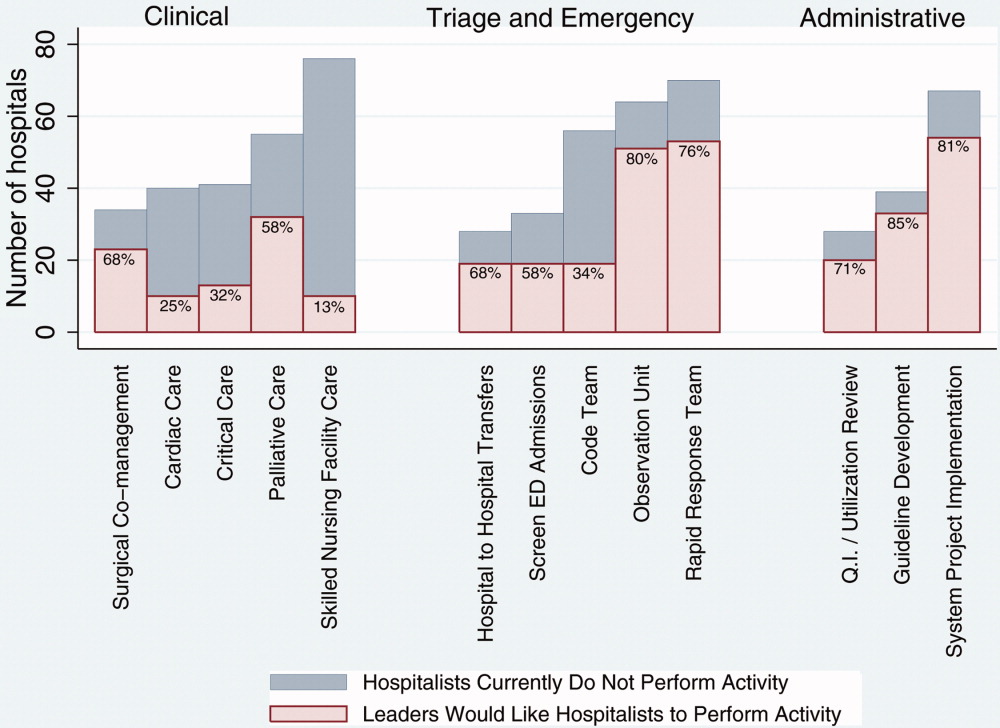
Training and Certification for Hospitalists
About two‐thirds (64%) of hospital leaders with a hospitalist group(s) agreed or strongly agreed that hospitalists should have additional training and/or certification. Seventeen percent were undecided, whereas 11% either disagreed or strongly disagreed, and the remaining 8% did not provide an opinion.
Discussion
Most California hospital leaders reported utilizing hospitalists, and a substantial number of those without a hospitalist service plan to implement one in the next 5 years. Our data suggest that the number of hospitalists and their roles will continue to expand, with quality improvement activities and participation in clinical roles outside of general medical care being key priorities for future growth. Interestingly, much of this growth may not be catalyzed by past drivers (such as need to contain costs or length of stay) but by increasing need to implement quality and safety initiatives, as well as demand from other physicians. As a result, the field of hospital medicine will grow in numbers and breadth of practice. Defining the typical practice of a hospitalist may become more challenging.
Consistent with previous work,11, 16 our data suggest widespread adoption of hospitalists. While our data demonstrates that academic hospitals in California were more likely to have hospitalists, it is also important to note that hospitalist systems were widespread across a wide range of hospital sizes and ownership types. The prevalence appears likely to increase in the future. None of the hospitals surveyed planned to eliminate or reduce the size of their programs. Among hospitals without a hospitalist program, 44% (n = 28) reported they were going to implement a hospitalist group within the next 2 years. Future workforce development must consider this growth in order to increase physician supply to meet the demands of hospitalist growth.
Consistent with prior surveys of hospitalists and the healthcare marketplace,13, 15, 16, 25 our survey of hospital leaders suggests that the care of uncovered patients and the goal of improving hospital efficiency are key reasons for implementing hospitalists. Although these are important, we found that hospital leaders have additional intentions when implementing or expanding hospitalist systems, including improving patient satisfaction and quality. Although quality improvement activities were not among the most common reasons that leaders originally implemented programs, the most established programs had increased odds (relative to the most recently implemented programs) of leading quality improvement and clinical guideline activities. This may reflect a natural progression over time for hospitalist groups to develop from a patient‐focused clinical role to one that incorporates responsibilities that increasingly impact the hospital system and organization. The interest in utilizing hospitalists for leadership in quality improvement was widely expressed among those leaders who had yet to utilize hospitalists. Interestingly, this driver remains even as evidence for whether hospitalist practices produce measurable differences in care outcomes is mixed.26, 27 Nevertheless, hospital leaders are under increasing pressure to improve quality and safety (driven by public reporting and pay‐for‐performance initiatives), and many leaders appear to believe that hospitalists will be a key part of the solution.13, 28
In addition to quality improvement, continued demand for hospitalists may result from growing clinical demands, including clinical support for medical specialists and surgeons. A majority of leaders acknowledged current or future interest in having hospitalists comanage surgical patients, with the hope that such practices will improve surgeons' productivity and clinical outcomes.16, 29, 30 In addition, hospitalists may address potential shortages in specialty areas. For example, having hospitalists participate in critical care may partly ameliorate the impact of a large national shortage of critical care physicians.12, 31 If hospitalists are to assume major roles in the provision of critical care (particularly if not comanaging patients with intensivists), they may require some augmented training in the intensive care unit.
Our results paint a picture of a rapidly expanding field, both in scope and in number. Hospitalists appear to be performing a wide range of clinical, triage, and administrative activities, and there is demand among hospital leadership for hospitalists to take on additional responsibilities. Interestingly, it appears that participation in most clinical and nonclinical activities occur across the spectrum of organizational characteristics, and demand is not limited only to large or academic hospitals. Participation in such a broad array of activities brings into question the need for additional training and certification of hospitalists. While the need for hospitalists to receive additional training has been posited in the past, our data suggest there is a perceived need from the hospital administration as well. This additional training (and subsequent certification) would likely need to encompass many of the practices we have identified as core to hospitalists' practice. In addition to ensuring adequate training, policymakers will need to consider the supply of physicians necessary to meet the present and, likely, future demand for hospitalists. This is especially important in light of recent evidence of continued decreasing interest in general internal medicine, the main pool from which hospitalists are drawn.32 A shortage of internists is likely to influence expansion plans by hospitals in terms of activities in which leaders ask hospitalists to engage, or the number of hospitalists overall.
Our study has several limitations. First, a substantial number of nonrespondents may potentially bias our results. Despite this, we have drawn results across a wide range of hospitals, and the characteristics of responders and nonresponders are very similar. In addition, our study exclusively examines the responses of leaders in California hospitals. Although we sampled a large and heterogeneous group of hospitals, these results may not be entirely generalizable to other regions. As a cross‐sectional survey of hospital executives, responses are subject to leaders' recall. In particular, the reasons for implementation provided by leaders of older programs may potentially reflect contemporary reasons for hospitalist utilization rather than the original reasons. Another limitation of our study is our focus on hospital leaders' reports of prevalence and the clinical/nonclinical activities of hospitalists. Since senior executives often help begin a program but become less involved over time, executives' answers may well underestimate the prevalence of hospitalists and the breadth of their clinical practices, particularly in more mature programs. For instance, hospitalists that are part of an independent practice association (IPA) may provide functions for the IPA group that the hospital itself does not direct or fund. This effect may be more pronounced among the largest hospitals that may be organizationally complex, perhaps making suspect the responses from 7 very large hospitals that claimed not to utilize hospitalists. Finally, we collected information regarding the reasons for hospitalist group implementation and the services they provide by means of a prespecified list of answers. Although a thorough literature review and expert advisory panel guided the development of prespecified lists, they are by no means exhaustive. As a result, our prespecified lists may miss some important reasons for implementation, or services provided by hospitalists, that one could identify using an open‐ended survey. In addition, in the case of multiple responses from hospital leaders, we gave equal weight to responses. This has the effect of overestimating the weight of reasons that were less important, while underestimating the weight of reasons that may have been more important in the decision making process of implementing a hospitalist group.
While nonhospitalist physicians continue to provide a considerable proportion of hospital care for medical patients, hospitalists are assuming a larger role in the care of a growing number of patients in the hospital. The ongoing need to increase care efficiency drives some of this growth, but pressures to improve care quality and demand from other physicians are increasingly important drivers of growth. As the field grows and clinical roles diversify, there must be increased focus placed on the training requirements of hospitalists to reflect the scope of current practice and meet hospital needs to improve quality and efficiency.
Acknowledgements
The authors acknowledge Teresa Chipps, BS, Department of Medicine (General Internal Medicine and Public Health), Center for Health Services Research, Vanderbilt University, Nashville, TN, for her administrative and editorial assistance in the preparation of the manuscript.
- ,,,,,.Implementation of a hospitalist system in a large health maintenance organization: the Kaiser Permanente experience.Ann Intern Med.1999;130:355–359.
- ,,.Primary care family physicians and 2 hospitalist models: comparison of outcomes, processes, and costs.J Fam Pract.2002;51:1021–1027.
- ,.Effects of an HMO hospitalist program on inpatient utilization.Am J Manag Care.2001;7:1051–1057.
- ,.The emerging role of “hospitalists” in the American health care system.N Engl J Med.1996;335:514–517.
- .The hospitalist model: perspectives of the patient, the internist, and internal medicine.Ann Intern Med.1999;130:368–372.
- ,,,.The changing face of managed care.Health Aff.2002;21:11–23.
- .The death of managed care: a regulatory autopsy.J Health Polit Policy Law.2005;30:427–452.
- .The end of managed care.JAMA.2001;285:2622–2628.
- ,,,,,.Trends in market demand for internal medicine 1999 to 2004: an analysis of physician job advertisements.J Gen Intern Med.2006;21:1079–1085.
- ,,,.Growth in the care of older patients by hospitalists in the United States.N Engl J Med.2009;360:1102–1112.
- ,,,.The status of hospital medicine groups in the United States.J Hosp Med.2006;1:75–80.
- .Leapfrog and critical care: evidence‐ and reality‐based intensive care for the 21st century.Am J Med.2004;116:188–193.
- ,,,.Health care market trends and the evolution of hospitalist use and roles.J Gen Intern Med.2005;20:101–107.
- ,,,.Financial pressures spur physician entrepreneurialism.Health Aff.2004;23:70–81.
- ,,,,,.Physician attitudes toward and prevalence of the hospitalist model of care: results of a national survey.Am J Med.2000;109:648–653.
- ,,,.Hospitalists and care transitions: the divorce of inpatient and outpatient care.Health Aff.2008;27:1315–1327.
- Society of Hospital Medicine. 2005‐2006 SHM Survey: State of the Hospital Medicine Movement. Available at: http://dev.hospitalmedicine.org/AM/Template.cfm?Section=Survey2:102–104.
- ,,,.Hospitalists' perceptions of their residency training needs: results of a national survey.Am J Med.2001;111:247–254.
- ,,,,.The spectrum of community‐based hospitalist practice: A call to tailor internal medicine residency training.Arch Intern Med.2007;167:727–728.
- ,,,,.Fulfilling the promise of hospital medicine: tailoring internal medicine training to address hospitalists' needs.J Gen Intern Med.2008;23:1110–1115.
- ,,,.Hospitalists and the practice of inpatient medicine: results of a survey of the national association of inpatient physicians.Ann Intern Med.1999;130:343–349.
- Office of Statewide Health Planning and Development. Healthcare Information Division ‐ Data Products. Available at: http://www.oshpd.ca.gov/HID/DataFlow/HospMain.html. Accessed May2009.
- ,.Relaxing the rule of ten events per variable in logistic and Cox regression.Am J Epidemiol.2007;165:710–718.
- ,,.Hospital‐physician relations: cooperation, competition, or separation?Health Aff.2007;26:w31–w43.
- ,,,,,.Outcomes of care by hospitalists, general internists, and family physicians.N Engl J Med.2007;357:2589–2600.
- ,,, et al.Quality of care for decompensated heart failure: comparable performance between academic hospitalists and non‐hospitalists.J Gen Intern Med.2008;23:1399–1406.
- ,,.The impact of quality‐reporting programs on hospital operations.Health Aff.2006;25:1412–1422.
- ,,, et al.Medical and surgical comanagement after elective hip and knee arthroplasty: a randomized, controlled trial.Ann Intern Med.2004;141:28–38.
- ,,.Associations between the hospitalist model of care and quality‐of‐care‐related outcomes in patients undergoing hip fracture surgery.Mayo Clin Proc.2006;81:28–31.
- ,,, et al.The critical care crisis in the United States: a report from the profession.Chest.2004;125:1514–1517.
- ,,, et al.Factors associated with medical students' career choices regarding internal medicine.JAMA.2008;300:1154–1164.
In the late 1990s, hospitalist systems grew rapidly in an environment where cost containment was paramount, complexity of patients increased, and outpatient practices experienced increasing productivity and efficiency pressures.15 While the healthcare delivery environment has changed significantly since that time,68 hospitalists have continued to become more common. In fact, the field's present size of more than 25,000 has already exceeded early projections, and there are no signs of slackening demand.911
Growth has been attributed to primary care physicians' increasing focus on outpatient care, hospitals' response to financial pressures, and the need to facilitate improved communication among various hospital care providers.1216 Hospital leadership has played a similarly important role in fueling the growth of hospitalists, particularly since the vast majority of programs require and receive institutional (usually hospital) support.17 However, the factors that continue to influence leaders' decisions to utilize hospitalists and the current and future needs that hospitalists are fulfilling are unknown. Each of these factors is likely to impact growth of the field, as well as the clinical and organizational identity of hospitalists. In addition, an understanding of the market demand for hospitalists' competencies and the roles they play in the hospital may inform any changes in board certification and training for hospitalists.11, 1821
To gain a more complete understanding of a key part of the engine driving the growth of hospitalists, we performed a cross‐sectional survey of California hospital leaders who were involved with the funding or administration of their hospitalist groups. Our survey aimed to understand: (1) the prevalence of hospitalist groups in California hospitals, (2) hospital leaders' rationale for initiating the use of hospitalists, (3) the scope of clinical and nonclinical practice of hospitalists, and 4) hospital leaders' perspective on the need for further training and/or certification.
Materials and Methods
Sites and Subjects
We targeted all nonfederal, nonspecialty, acute care hospitals in California (n = 334) for this survey. We limited our survey to California in order to maximize our local resources and to improve implementation of and response to the survey. Additionally, California's size and diversity gives it disproportionate impact and potential generalizability. At each site, we focused our efforts on identifying and surveying executives or administrative leaders involved in organizational and staff decisions, specifically the decision whether or not to hire and/or fund a hospitalist program and potentially direct its activities (described in more detail below). The University of California, San Francisco, Committee on Human Research approved the research protocol.
We identified hospital leaders at each site by merging information from multiple sources. These included the American Hospital Association database, the California Hospital Association, the Hospital Association of Southern California (HASC), the California Health Care Safety Net Institute, and individual hospital websites.
Survey Development
Our survey was based upon instruments used in previous research examining hospital medicine group organizational structure15, 22 and enhanced with questions developed by the research team (A.D.A., E.E.V., R.M.W.). The survey was pretested in an advisory group of 5 hospital Chief Executive Officers (CEOs), Chief Medical Officers (CMOs), and Vice Presidents for Medical Affairs (VPMAs) from sites across California. Based on their input, we removed, edited, or added questions to our survey. This advisory group also helped the research team design our survey process.
Our final survey defined a hospitalist as a physician who spends all or the majority of his or her clinical, administrative, educational, or research activities in the care of hospitalized patients.4 We collected data in 4 areas: (1) We asked hospital leaders to confirm the presence or absence of at least 1 hospitalist group practicing within the surveyed hospital. We also asked for the year the first hospitalist group began practicing within the specified hospital. (2) We asked hospital leaders to indicate, among a prespecified list of 11 choices, the reason(s) they implemented a hospitalist group at the surveyed hospital. Surveyed categories included: (a) care for uncovered patients (patients without an identified doctor and/or uninsured), (b) improve costs, (c) improve length of stay, (d) improve emergency department throughput, (e) primary care provider demand, (f) improve patient satisfaction, (g) improve emergency room staffing, (h) quality improvement needs, (i) specialist physician demand, (j) overnight coverage, and (k) surgical comanagement. Due to the close relationship between cost and length of stay, we combined these 2 categories into a single category for reporting and analysis. This resulted in 10 final categories. We asked leaders who did not identify a practicing hospitalist group about the likelihood of hospitalists practicing at their hospital within the next 5 years and the reason(s) for future implementation. (3) We asked leaders to describe the services currently provided among a prespecified list of clinical care duties that go beyond the scope of inpatient general internal medicine (eg, surgical comanagement, rapid response team leadership) as well as nonclinical duties (eg, quality improvement activities, systems project implementation). If hospitalists did not currently provide the identified service, we asked leaders to indicate if they would be inclined to involve hospitalists in the specified service in the future. (4) Finally, we asked hospital leaders their opinion regarding the need for further training or certification for hospitalists.
Survey Protocol
We administered surveys between October 2006 and April 2007. We initially emailed the survey. We repeated this process for nonrespondents at intervals of 1 to 3 weeks after the initial emailing. Next, we sent nonrespondents a physical mailing with a reminder letter. Finally, we made phone calls to those who had not responded within 4 weeks of the last mailed letter. We asked survey recipients to respond only if they felt they had an adequate working knowledge of the hospitalist service at their hospital. If they did not feel they could adequately answer all questions, we allowed them to forward the instrument to others with a better working knowledge of the service.
Because we allowed recipients to forward the survey, we occasionally received 2 surveys from 1 site. In this case, we selected the survey according to the following prioritization order: (1) CEOs/COOs, (2) CMOs, (3) VPMAs, and (4) other vice presidents (VPs) or executive/administrative leaders with staff organization knowledge and responsibilities.
Hospital Descriptive Data
We obtained hospital organizational data from the California Office of Statewide Health Planning and Development's (OSHPD) publicly available Case Mix Index Data, hospital Annual Financial Data, aggregated Patient Discharge Data, and Utilization Data from 2006.23 Organizational characteristics included hospital size, location, profit status, payor mix, and diagnosis‐related groupbased case‐mix. Teaching status was determined from the 2005 American Hospital Association database. Membership status in California's voluntary quality reporting initiative, California Hospital Assessment and Reporting Taskforce (CHART), was publicly available at
Statistical Analyses
We performed univariable analyses to characterize survey respondents, followed by bivariable analyses to compare hospital characteristics and patient mix of responding and nonresponding hospitals. We used similar methods to characterize respondent hospitals with and without at least 1 hospitalist group. We compared continuous data with the Students t tests or Mann‐Whitney tests as appropriate and categorical data with chi‐square tests.
We then summarized the number of times a specific rationale was cited by hospital leaders for implementing a hospitalist group. Among hospitals that did not have a hospitalist system in place at the time of the survey, we asked if they were planning on starting one within the next 5 years. For these hospitals, we used content analysis to summarize open‐ended responses in order to understand factors that are currently influencing these hospital leaders to consider implementing a hospitalist group.
Next, we aimed to understand what clinical and nonclinical roles hospitalists were performing in hospitals with established hospitalist programs. Clinical activities were divided into general clinical areas, triage/emergency‐related, or administrative activities. First, we summarized the number and percent of programs performing each clinical and nonclinical activity. This was followed by logistic regression analyses to assess whether the time period that hospitalist groups began practicing or additional hospital characteristics predicted the performance of individual hospitalist activities. To guard against overfitting of models, analyses were limited to rationales that were cited a minimum of 50 times.24 Hospital factors were selected on the basis of face validity and advisory group input and included hospital bed size, ownership status (public vs. private), teaching status, and membership status in CHART. We divided the year of hospitalist program implementation into 3 time periods: (1) before 2002, (2) between 2002 and 2004, and (3) 2005 or later.
Finally, we described the percentage of hospitals that favored having their hospitalist group(s) perform each of the identified clinical or nonclinical activities, if they were not already performing them. We performed analyses with statistical software (Stata Version 9.2, College Station, TX).
Results
Respondent Characteristics
We received 200 survey responses. Of those, we excluded 15 duplicates (eg, a survey from both the CEO and VPMA) and 6 responses identified as coming from hospitalists who did not have a leadership position in the hospital. Thus, the final hospital leader survey response rate was 54% (n = 179). Forty‐six percent of the final responses were from CEOs or COOs; 37% of responses were from CMOs, VPMAs, and medical directors; and the remaining 17% of responses were from other VPs or administrative directors.
Respondent and nonrespondent hospitals were statistically similar in terms of teaching status and participation in CHART. Hospital patient census, intensive care unit census, payer mix, and diagnosis‐related groupbased case‐mix revealed no statistically significant differences between groups (P > 0.05). Respondent hospitals tended to have fewer beds and were more often for‐profit compared to nonrespondents (P = 0.05 and P < 0.01, respectively).
Descriptive Characteristics of Hospitals with Hospitalists
Sixty‐four percent (n = 115) of hospital leaders stated that they utilized hospitalists for at least some patients. Hospitals with hospitalists were statistically more likely (P < 0.05) to be larger, a major teaching hospital, or a member of a voluntary quality reporting initiative (Table 1).
| Variable | Hospitals without Hospitalists (n = 64) [n (%)] | Hospitals with Hospitalists (n = 115) [n (%)] | P Value* |
|---|---|---|---|
| |||
| Hospital size (total number of beds) | |||
| 0‐99 | 33 (51.6) | 18 (15.7) | <0.001 |
| 100‐199 | 19 (29.7) | 32 (27.8) | |
| 200‐299 | 5 (7.8) | 23 (20.0) | |
| 300+ | 7 (10.9) | 42 (36.5) | |
| Hospital control | 0.12 | ||
| City/county | 8 (12.5) | 7 (6.1) | |
| District | 15 (23.4) | 17 (14.8) | |
| For‐profit | 10 (15.6) | 16 (13.9) | |
| Non‐profit | 31 (48.4) | 71 (61.7) | |
| University of California | 0 (0.0) | 4 (3.5) | |
| Teaching hospital | 8 (12.5) | 30 (26.1) | 0.03 |
| Member of voluntary quality reporting initiative | 27 (42.2) | 93 (80.9) | <0.001 |
Among all hospitals with hospitalists, 39% estimated that hospitalists cared for at least one‐half of admitted medical patients, and 7% stated that hospitalists cared for all patients. Twenty‐four percent of respondents were unable to provide a quantitative estimate of the percent of patients cared for by hospitalists. When asked about expectations of growth in the coming year, 57% of respondents with hospitalists expected to see increases in the number of hospitalists at their hospital, and none expected a decrease. Among the 64 respondent hospitals that currently did not have a hospitalist program, 44% (n = 28) of the hospital leaders felt hospitalists would be managing patients in the future. Of those, 93% felt this would occur within the next 2 years.
Reasons for Implementing Hospitalists
Hospital leaders reported that the most important reasons for implementing a hospitalist model included caring for uncovered patients (68%), decreasing hospital costs and length of stay (63%), and improving throughput in the emergency room (62%). We provide additional reasons in Figure 1. In addition, leaders often identified multiple factors in the decision to utilize hospitalists, including demand from primary care doctors, patient satisfaction, and quality improvement. Among the 28 hospitals that currently did not have hospitalists but anticipated that they would soon (data not shown), the need to improve quality was the most commonly cited reason (54% of respondents) for expecting to start a program within 2 years, followed by demand from primary care doctors (46% of respondents).
Clinical Practice of Hospitalists and Expectations for Future Growth
Hospitalists perform a wide array of clinical and nonclinical duties (Figure 2). In addition to general medical care, the most common clinical activities of hospitalists included screening medical admissions from the emergency room for appropriateness of admission and triaging to appropriate level of care (67%), triaging patients transferred from an outside hospital (72%), and comanaging surgical patients (66%). The most common nonclinical activity was participation in quality improvement activities (72%). Multivariable analyses demonstrated that the performance of the most prevalent activities was not usually associated with the year of hospitalist implementation or hospital characteristics. An exception was that newly initiated programs had a statistically significant decreased odds of involvement in clinical guideline development (odds ratio [OR], 0.3; 95% confidence interval [CI], 0.1‐0.9) and a trend toward decreased leadership in quality improvement (OR, 0.3; 95% CI, 0.1‐1.1). Hospitalists at teaching hospitals had increased odds of managing patient transfers (OR, 4.7; 95% CI, 1.0‐21.2), whereas for‐profit hospitals had lower odds of screening patients in the emergency room (OR, 0.1; 95% CI, 0.0‐0.7).
Among those hospitals with hospitalists who were not presently involved in any of the above activities, there was a widespread interest among hospital leaders to have their hospitalist group(s) lead or participate in them (Figure 3). The most commonly cited activities included participation in inpatient clinical guideline development (85%), implementation of system‐wide projects (81%) (eg, computerized physician order entry system), participation on a rapid response team (80%), and caring for patients in an observation unit (80%).
Training and Certification for Hospitalists
About two‐thirds (64%) of hospital leaders with a hospitalist group(s) agreed or strongly agreed that hospitalists should have additional training and/or certification. Seventeen percent were undecided, whereas 11% either disagreed or strongly disagreed, and the remaining 8% did not provide an opinion.
Discussion
Most California hospital leaders reported utilizing hospitalists, and a substantial number of those without a hospitalist service plan to implement one in the next 5 years. Our data suggest that the number of hospitalists and their roles will continue to expand, with quality improvement activities and participation in clinical roles outside of general medical care being key priorities for future growth. Interestingly, much of this growth may not be catalyzed by past drivers (such as need to contain costs or length of stay) but by increasing need to implement quality and safety initiatives, as well as demand from other physicians. As a result, the field of hospital medicine will grow in numbers and breadth of practice. Defining the typical practice of a hospitalist may become more challenging.
Consistent with previous work,11, 16 our data suggest widespread adoption of hospitalists. While our data demonstrates that academic hospitals in California were more likely to have hospitalists, it is also important to note that hospitalist systems were widespread across a wide range of hospital sizes and ownership types. The prevalence appears likely to increase in the future. None of the hospitals surveyed planned to eliminate or reduce the size of their programs. Among hospitals without a hospitalist program, 44% (n = 28) reported they were going to implement a hospitalist group within the next 2 years. Future workforce development must consider this growth in order to increase physician supply to meet the demands of hospitalist growth.
Consistent with prior surveys of hospitalists and the healthcare marketplace,13, 15, 16, 25 our survey of hospital leaders suggests that the care of uncovered patients and the goal of improving hospital efficiency are key reasons for implementing hospitalists. Although these are important, we found that hospital leaders have additional intentions when implementing or expanding hospitalist systems, including improving patient satisfaction and quality. Although quality improvement activities were not among the most common reasons that leaders originally implemented programs, the most established programs had increased odds (relative to the most recently implemented programs) of leading quality improvement and clinical guideline activities. This may reflect a natural progression over time for hospitalist groups to develop from a patient‐focused clinical role to one that incorporates responsibilities that increasingly impact the hospital system and organization. The interest in utilizing hospitalists for leadership in quality improvement was widely expressed among those leaders who had yet to utilize hospitalists. Interestingly, this driver remains even as evidence for whether hospitalist practices produce measurable differences in care outcomes is mixed.26, 27 Nevertheless, hospital leaders are under increasing pressure to improve quality and safety (driven by public reporting and pay‐for‐performance initiatives), and many leaders appear to believe that hospitalists will be a key part of the solution.13, 28
In addition to quality improvement, continued demand for hospitalists may result from growing clinical demands, including clinical support for medical specialists and surgeons. A majority of leaders acknowledged current or future interest in having hospitalists comanage surgical patients, with the hope that such practices will improve surgeons' productivity and clinical outcomes.16, 29, 30 In addition, hospitalists may address potential shortages in specialty areas. For example, having hospitalists participate in critical care may partly ameliorate the impact of a large national shortage of critical care physicians.12, 31 If hospitalists are to assume major roles in the provision of critical care (particularly if not comanaging patients with intensivists), they may require some augmented training in the intensive care unit.
Our results paint a picture of a rapidly expanding field, both in scope and in number. Hospitalists appear to be performing a wide range of clinical, triage, and administrative activities, and there is demand among hospital leadership for hospitalists to take on additional responsibilities. Interestingly, it appears that participation in most clinical and nonclinical activities occur across the spectrum of organizational characteristics, and demand is not limited only to large or academic hospitals. Participation in such a broad array of activities brings into question the need for additional training and certification of hospitalists. While the need for hospitalists to receive additional training has been posited in the past, our data suggest there is a perceived need from the hospital administration as well. This additional training (and subsequent certification) would likely need to encompass many of the practices we have identified as core to hospitalists' practice. In addition to ensuring adequate training, policymakers will need to consider the supply of physicians necessary to meet the present and, likely, future demand for hospitalists. This is especially important in light of recent evidence of continued decreasing interest in general internal medicine, the main pool from which hospitalists are drawn.32 A shortage of internists is likely to influence expansion plans by hospitals in terms of activities in which leaders ask hospitalists to engage, or the number of hospitalists overall.
Our study has several limitations. First, a substantial number of nonrespondents may potentially bias our results. Despite this, we have drawn results across a wide range of hospitals, and the characteristics of responders and nonresponders are very similar. In addition, our study exclusively examines the responses of leaders in California hospitals. Although we sampled a large and heterogeneous group of hospitals, these results may not be entirely generalizable to other regions. As a cross‐sectional survey of hospital executives, responses are subject to leaders' recall. In particular, the reasons for implementation provided by leaders of older programs may potentially reflect contemporary reasons for hospitalist utilization rather than the original reasons. Another limitation of our study is our focus on hospital leaders' reports of prevalence and the clinical/nonclinical activities of hospitalists. Since senior executives often help begin a program but become less involved over time, executives' answers may well underestimate the prevalence of hospitalists and the breadth of their clinical practices, particularly in more mature programs. For instance, hospitalists that are part of an independent practice association (IPA) may provide functions for the IPA group that the hospital itself does not direct or fund. This effect may be more pronounced among the largest hospitals that may be organizationally complex, perhaps making suspect the responses from 7 very large hospitals that claimed not to utilize hospitalists. Finally, we collected information regarding the reasons for hospitalist group implementation and the services they provide by means of a prespecified list of answers. Although a thorough literature review and expert advisory panel guided the development of prespecified lists, they are by no means exhaustive. As a result, our prespecified lists may miss some important reasons for implementation, or services provided by hospitalists, that one could identify using an open‐ended survey. In addition, in the case of multiple responses from hospital leaders, we gave equal weight to responses. This has the effect of overestimating the weight of reasons that were less important, while underestimating the weight of reasons that may have been more important in the decision making process of implementing a hospitalist group.
While nonhospitalist physicians continue to provide a considerable proportion of hospital care for medical patients, hospitalists are assuming a larger role in the care of a growing number of patients in the hospital. The ongoing need to increase care efficiency drives some of this growth, but pressures to improve care quality and demand from other physicians are increasingly important drivers of growth. As the field grows and clinical roles diversify, there must be increased focus placed on the training requirements of hospitalists to reflect the scope of current practice and meet hospital needs to improve quality and efficiency.
Acknowledgements
The authors acknowledge Teresa Chipps, BS, Department of Medicine (General Internal Medicine and Public Health), Center for Health Services Research, Vanderbilt University, Nashville, TN, for her administrative and editorial assistance in the preparation of the manuscript.
- ,,,,,.Implementation of a hospitalist system in a large health maintenance organization: the Kaiser Permanente experience.Ann Intern Med.1999;130:355–359.
- ,,.Primary care family physicians and 2 hospitalist models: comparison of outcomes, processes, and costs.J Fam Pract.2002;51:1021–1027.
- ,.Effects of an HMO hospitalist program on inpatient utilization.Am J Manag Care.2001;7:1051–1057.
- ,.The emerging role of “hospitalists” in the American health care system.N Engl J Med.1996;335:514–517.
- .The hospitalist model: perspectives of the patient, the internist, and internal medicine.Ann Intern Med.1999;130:368–372.
- ,,,.The changing face of managed care.Health Aff.2002;21:11–23.
- .The death of managed care: a regulatory autopsy.J Health Polit Policy Law.2005;30:427–452.
- .The end of managed care.JAMA.2001;285:2622–2628.
- ,,,,,.Trends in market demand for internal medicine 1999 to 2004: an analysis of physician job advertisements.J Gen Intern Med.2006;21:1079–1085.
- ,,,.Growth in the care of older patients by hospitalists in the United States.N Engl J Med.2009;360:1102–1112.
- ,,,.The status of hospital medicine groups in the United States.J Hosp Med.2006;1:75–80.
- .Leapfrog and critical care: evidence‐ and reality‐based intensive care for the 21st century.Am J Med.2004;116:188–193.
- ,,,.Health care market trends and the evolution of hospitalist use and roles.J Gen Intern Med.2005;20:101–107.
- ,,,.Financial pressures spur physician entrepreneurialism.Health Aff.2004;23:70–81.
- ,,,,,.Physician attitudes toward and prevalence of the hospitalist model of care: results of a national survey.Am J Med.2000;109:648–653.
- ,,,.Hospitalists and care transitions: the divorce of inpatient and outpatient care.Health Aff.2008;27:1315–1327.
- Society of Hospital Medicine. 2005‐2006 SHM Survey: State of the Hospital Medicine Movement. Available at: http://dev.hospitalmedicine.org/AM/Template.cfm?Section=Survey2:102–104.
- ,,,.Hospitalists' perceptions of their residency training needs: results of a national survey.Am J Med.2001;111:247–254.
- ,,,,.The spectrum of community‐based hospitalist practice: A call to tailor internal medicine residency training.Arch Intern Med.2007;167:727–728.
- ,,,,.Fulfilling the promise of hospital medicine: tailoring internal medicine training to address hospitalists' needs.J Gen Intern Med.2008;23:1110–1115.
- ,,,.Hospitalists and the practice of inpatient medicine: results of a survey of the national association of inpatient physicians.Ann Intern Med.1999;130:343–349.
- Office of Statewide Health Planning and Development. Healthcare Information Division ‐ Data Products. Available at: http://www.oshpd.ca.gov/HID/DataFlow/HospMain.html. Accessed May2009.
- ,.Relaxing the rule of ten events per variable in logistic and Cox regression.Am J Epidemiol.2007;165:710–718.
- ,,.Hospital‐physician relations: cooperation, competition, or separation?Health Aff.2007;26:w31–w43.
- ,,,,,.Outcomes of care by hospitalists, general internists, and family physicians.N Engl J Med.2007;357:2589–2600.
- ,,, et al.Quality of care for decompensated heart failure: comparable performance between academic hospitalists and non‐hospitalists.J Gen Intern Med.2008;23:1399–1406.
- ,,.The impact of quality‐reporting programs on hospital operations.Health Aff.2006;25:1412–1422.
- ,,, et al.Medical and surgical comanagement after elective hip and knee arthroplasty: a randomized, controlled trial.Ann Intern Med.2004;141:28–38.
- ,,.Associations between the hospitalist model of care and quality‐of‐care‐related outcomes in patients undergoing hip fracture surgery.Mayo Clin Proc.2006;81:28–31.
- ,,, et al.The critical care crisis in the United States: a report from the profession.Chest.2004;125:1514–1517.
- ,,, et al.Factors associated with medical students' career choices regarding internal medicine.JAMA.2008;300:1154–1164.
Copyright © 2009 Society of Hospital Medicine