User login
Hospitalists and Quality of Care
Quality of care in US hospitals is inconsistent and often below accepted standards.1 This observation has catalyzed a number of performance measurement initiatives intended to publicize gaps and spur quality improvement.2 As the field has evolved, organizational factors such as teaching status, ownership model, nurse staffing levels, and hospital volume have been found to be associated with performance on quality measures.1, 3‐7 Hospitalists represent a more recent change in the organization of inpatient care8 that may impact hospital‐level performance. In fact, most hospitals provide financial support to hospitalists, not only for hopes of improving efficiency, but also for improving quality and safety.9
Only a few single‐site studies have examined the impact of hospitalists on quality of care for common medical conditions (ie, pneumonia, congestive heart failure, and acute myocardial infarction), and each has focused on patient‐level effects. Rifkin et al.10, 11 did not find differences between hospitalists' and nonhospitalists' patients in terms of pneumonia process measures. Roytman et al.12 found hospitalists more frequently prescribed afterload‐reducing agents for congestive heart failure (CHF), but other studies have shown no differences in care quality for heart failure.13, 14 Importantly, no studies have examined the role of hospitalists in the care of patients with acute myocardial infarction (AMI). In addition, studies have not addressed the effect of hospitalists at the hospital level to understand whether hospitalists have broader system‐level effects reflected by overall hospital performance.
We hypothesized that the presence of hospitalists within a hospital would be associated with improvements in hospital‐level adherence to publicly reported quality process measures, and having a greater percentage of patients admitted by hospitalists would be associated with improved performance. To test these hypotheses, we linked data from a statewide census of hospitalists with data collected as part of a hospital quality‐reporting initiative.
Materials and Methods
Study Sites
We examined the performance of 209 hospitals (63% of all 334 non‐federal facilities in California) participating in the California Hospital Assessment and Reporting Taskforce (CHART) at the time of the survey. CHART is a voluntary quality reporting initiative that began publicly reporting hospital quality data in January 2006.
Hospital‐level Organizational, Case‐mix, and Quality Data
Hospital organizational characteristics (eg, bed size) were obtained from publicly available discharge and utilization data sets from the California Office of Statewide Health Planning and Development (OSHPD). We also linked hospital‐level patient‐mix data (eg, race) from these OSHPD files.
We obtained quality of care data from CHART for January 2006 through June 2007, the time period corresponding to the survey. Quality metrics included 16 measures collected by the Center for Medicare and Medicaid Services (www.cms.hhs.gov) and extensively used in quality research.1, 4, 13, 15‐17 Rather than define a single measure, we examined multiple process measures, anticipating differential impacts of hospitalists on various processes of care for AMI, CHF, and pneumonia. Measures were further divided among those that are usually measured upon initial presentation to the hospital and those that are measured throughout the entire hospitalization and discharge. This division reflects the division of care in the hospital, where emergency room physicians are likely to have a more critical role for admission processes.
Survey Process
We surveyed all nonfederal, acute care hospitals in California that participated in CHART.2 We first identified contacts at each site via professional society mailing lists. We then sent web‐based surveys to all with available email addresses and a fax/paper survey to the remainder. We surveyed individuals between October 2006 and April 2007 and repeated the process at intervals of 1 to 3 weeks. For remaining nonrespondents, we placed a direct call unless consent to survey had been specifically refused. We contacted the following persons in sequence: (1) hospital executives or administrative leaders; (2) hospital medicine department leaders; (3) admitting emergency room personnel or medical staff officers; and (4) hospital website information. In the case of multiple responses with disagreement, the hospital/hospitalist leader's response was treated as the primary source. At each step, respondents were asked to answer questions only if they had a direct working knowledge of their hospitalist services.
Survey Data
Our key survey question to all respondents included whether the respondents could confirm their hospitals had at least one hospitalist medicine group. Hospital leaders were also asked to participate in a more comprehensive survey of their organizational and clinical characteristics. Within the comprehensive survey, leaders also provided estimates of the percent of general medical patients admitted by hospitalists. This measure, used in prior surveys of hospital leaders,9 was intended to be an easily understood approximation of the intensity of hospitalist utilization in any given hospital. A more rigorous, direct measure was not feasible due to the complexity of obtaining admission data over such a large, diverse set of hospitals.
Process Performance Measures
AMI measures assessed at admission included aspirin and ‐blocker administration within 24 hours of arrival. AMI measures assessed at discharge included aspirin administration, ‐blocker administration, angiotensin converting enzyme inhibitor (ACE‐I) (or angiotensin receptor blocker [ARB]) administration for left ventricular (LV) dysfunction, and smoking cessation counseling. There were no CHF admission measures. CHF discharge measures included assessment of LV function, the use of an ACE‐I or ARB for LV dysfunction, and smoking cessation counseling. Pneumonia admission measures included the drawing of blood cultures prior to the receipt of antibiotics, timely administration of initial antibiotics (<8 hours), and antibiotics consistent with recommendations. Pneumonia discharge measures included pneumococcal vaccination, flu vaccination, and smoking cessation counseling.
For each performance measure, we quantified the percentage of missed quality opportunities, defined as the number of patients who did not receive a care process divided by the number of eligible patients, multiplied by 100. In addition, we calculated composite scores for admission and discharge measures across each condition. We summed the numerators and denominators of individual performance measures to generate a disease‐specific composite numerator and denominator. Both individual and composite scores were produced using methodology outlined by the Center for Medicare & Medicaid Services.18 In order to retain as representative a sample of hospitals as possible, we calculated composite scores for hospitals that had a minimum of 25 observations in at least 2 of the quality indicators that made up each composite score.
Statistical Analysis
We used chi‐square tests, Student t tests, and Mann‐Whitney tests, where appropriate, to compare hospital‐level characteristics of hospitals that utilized hospitalists vs. those that did not. Similar analyses were performed among the subset of hospitals that utilized hospitalists. Among this subgroup of hospitals, we compared hospital‐level characteristics between hospitals that provided information regarding the percent of patients admitted by hospitalists vs. those who did not provide this information.
We used multivariable, generalized linear regression models to assess the relationship between having at least 1 hospitalist group and the percentage of missed quality of care measures. Because percentages were not normally distributed (ie, a majority of hospitals had few missed opportunities, while a minority had many), multivariable models employed log‐link functions with a gamma distribution.19, 20 Coefficients for our key predictor (presence of hospitalists) were transformed back to the original units (percentage of missed quality opportunities) so that a positive coefficient represented a higher number of quality measures missed relative to hospitals without hospitalists. Models were adjusted for factors previously reported to be associated with care quality. Hospital organizational characteristics included the number of beds, teaching status, registered nursing (RN) hours per adjusted patient day, and hospital ownership (for‐profit vs. not‐for‐profit). Hospital patient mix factors included annual percentage of admissions by insurance status (Medicare, Medicaid, other), annual percentage of admissions by race (white vs. nonwhite), annual percentage of do‐not‐resuscitate status at admission, and mean diagnosis‐related group‐based case‐mix index.21 We additionally adjusted for the number of cardiac catheterizations, a measure that moderately correlates with the number of cardiologists and technology utilization.22‐24 In our subset analysis among those hospitals with hospitalists, our key predictor for regression analyses was the percentage of patients admitted by hospitalists. For ease of interpretation, the percentage of patients admitted by hospitalists was centered on the mean across all respondent hospitals, and we report the effect of increasing by 10% the percentage of patients admitted by hospitalists. Models were adjusted for the same hospital organizational characteristics listed above. For those models, a positive coefficient also meant a higher number of measures missed.
For both sets of predictors, we additionally tested for the presence of interactions between the predictors and hospital bed size (both continuous as well as dichotomized at 150 beds) in composite measure performance, given the possibility that any hospitalist effect may be greater among smaller, resource‐limited hospitals. Tests for interaction were performed with the likelihood ratio test. In addition, to minimize any potential bias or loss of power that might result from limiting the analysis to hospitals with complete data, we used the multivariate imputation by chained equations method, as implemented in STATA 9.2 (StataCorp, College Station, TX), to create 10 imputed datasets.25 Imputation of missing values was restricted to confounding variables. Standard methods were then used to combine results over the 10 imputed datasets. We also applied Bonferroni corrections to composite measure tests based on the number of composites generated (n = 5). Thus, for the 5 inpatient composites created, standard definitions of significance (P 0.05) were corrected by dividing composite P values by 5, requiring P 0.01 for significance. The institutional review board of the University of California, San Francisco, approved the study. All analyses were performed using STATA 9.2.
Results
Characteristics of Participating Sites
There were 209 eligible hospitals. All 209 (100%) hospitals provided data about the presence or absence of hospitalists via at least 1 of our survey strategies. The majority of identification of hospitalist utilization was via contact with either hospital or hospitalist leaders, n = 147 (70.3%). Web‐sites informed hospitalist prevalence in only 3 (1.4%) hospitals. There were 8 (3.8%) occurrences of disagreement between sources, all of which had available hospital/hospitalist leader responses. Only 1 (0.5%) hospital did not have the minimum 25 patients eligible for any disease‐specific quality measures during the data reporting period. Collectively, the remaining 208 hospitals accounted for 81% of California's acute care hospital population.
Comparisons of Sites With Hospitalists and Those Without
A total of 170 hospitals (82%) participating in CHART used hospitalists. Hospitals with and without hospitalists differed by a variety of characteristics (Table 1). Sites with hospitalists were larger, less likely to be for‐profit, had more registered nursing hours per day, and performed more cardiac catheterizations.
| Characteristic | Hospitals Without Hospitalists (n = 38) | Hospitals With Hospitalists (n = 170) | P Value* |
|---|---|---|---|
| |||
| Number of beds, n (% of hospitals) | <0.001 | ||
| 0‐99 | 16 (42.1) | 14 (8.2) | |
| 100‐199 | 8 (21.1) | 44 (25.9) | |
| 200‐299 | 7 (18.4) | 42 (24.7) | |
| 300+ | 7 (18.4) | 70 (41.2) | |
| For profit, n (% of hospitals) | 9 (23.7) | 18 (10.6) | 0.03 |
| Teaching hospital, n (% of hospitals) | 7 (18.4) | 55 (32.4) | 0.09 |
| RN hours per adjusted patient day, number of hours (IQR) | 7.4 (5.7‐8.6) | 8.5 (7.4‐9.9) | <0.001 |
| Annual cardiac catheterizations, n (IQR) | 0 (0‐356) | 210 (0‐813) | 0.007 |
| Hospital total census days, n (IQR) | 37161 (14910‐59750) | 60626 (34402‐87950) | <0.001 |
| ICU total census, n (IQR) | 2193 (1132‐4289) | 3855 (2489‐6379) | <0.001 |
| Medicare insurance, % patients (IQR) | 36.9 (28.5‐48.0) | 35.3(28.2‐44.3) | 0.95 |
| Medicaid insurance, % patients (IQR) | 21.0 (12.7‐48.3) | 16.6 (5.6‐27.6) | 0.02 |
| Race, white, % patients (IQR) | 53.7 (26.0‐82.7) | 59.1 (45.6‐74.3) | 0.73 |
| DNR at admission, % patients (IQR) | 3.6 (2.0‐6.4) | 4.4 (2.7‐7.1) | 0.12 |
| Case‐mix index, index (IQR) | 1.05 (0.90‐1.21) | 1.13 (1.01‐1.26) | 0.11 |
Relationship Between Hospitalist Group Utilization and the Percentage of Missed Quality Opportunities
Table 2 shows the frequency of missed quality opportunities in sites with hospitalists compared to those without. In general, for both individual and composite measures of quality, multivariable adjustment modestly attenuated the observed differences between the 2 groups of hospitals. We present only the more conservative adjusted estimates.
| Quality Measure | Number of Hospitals | Adjusted Mean % Missed Quality Opportunities (95% CI) | Difference With Hospitalists | Relative % Change | P Value | |
|---|---|---|---|---|---|---|
| Hospitals Without Hospitalists | Hospitals With Hospitalists | |||||
| ||||||
| Acute myocardial infarction | ||||||
| Admission measures | ||||||
| Aspirin at admission | 193 | 3.7 (2.4‐5.1) | 3.4 (2.3‐4.4) | 0.3 | 10.0 | 0.44 |
| Beta‐blocker at admission | 186 | 7.8 (4.7‐10.9) | 6.4 (4.4‐8.3) | 1.4 | 18.3 | 0.19 |
| AMI admission composite | 186 | 5.5 (3.6‐7.5) | 4.8 (3.4‐6.1) | 0.7 | 14.3 | 0.26 |
| Hospital/discharge measures | ||||||
| Aspirin at discharge | 173 | 7.5 (4.5‐10.4) | 5.2 (3.4‐6.9) | 2.3 | 31.0 | 0.02 |
| Beta‐blocker at discharge | 179 | 6.6 (3.8‐9.4) | 5.9 (3.6‐8.2) | 0.7 | 9.6 | 0.54 |
| ACE‐I/ARB at discharge | 119 | 20.7 (9.5‐31.8) | 11.8 (6.6‐17.0) | 8.9 | 43.0 | 0.006 |
| Smoking cessation counseling | 193 | 3.8 (2.4‐5.1) | 3.4 (2.4‐4.4) | 0.4 | 10.0 | 0.44 |
| AMI hospital/discharge composite | 179 | 6.4 (4.1‐8.6) | 5.3 (3.7‐6.8) | 1.1 | 17.6 | 0.16 |
| Congestive heart failure | ||||||
| Hospital/discharge measures | ||||||
| Ejection fraction assessment | 208 | 12.6 (7.7‐17.6) | 6.5 (4.6‐8.4) | 6.1 | 48.2 | <0.001 |
| ACE‐I/ARB at discharge | 201 | 14.7 (10.0‐19.4) | 12.9 (9.8‐16.1) | 1.8 | 12.1 | 0.31 |
| Smoking cessation counseling | 168 | 9.1 (2.9‐15.4) | 9.0 (4.2‐13.8) | 0.1 | 1.8 | 0.98 |
| CHF hospital/discharge composite | 201 | 12.2 (7.9‐16.5) | 8.2 (6.2‐10.2) | 4.0 | 33.1 | 0.006* |
| Pneumonia | ||||||
| Admission measures | ||||||
| Blood culture before antibiotics | 206 | 12.0 (9.1‐14.9) | 10.9 (8.8‐13.0) | 1.1 | 9.1 | 0.29 |
| Timing of antibiotics <8 hours | 208 | 5.8 (4.1‐7.5) | 6.2 (4.7‐7.7) | 0.4 | 6.9 | 0.56 |
| Initial antibiotic consistent with recommendations | 207 | 15.0 (11.6‐18.6) | 13.8 (10.9‐16.8) | 1.2 | 8.1 | 0.27 |
| Pneumonia admission composite | 207 | 10.5 (8.5‐12.5) | 9.9 (8.3‐11.5) | 0.6 | 5.9 | 0.37 |
| Hospital/discharge measures | ||||||
| Pneumonia vaccine | 208 | 29.4 (19.5‐39.2) | 27.1 (19.9‐34.3) | 2.3 | 7.7 | 0.54 |
| Influenza vaccine | 207 | 36.9 (25.4‐48.4) | 35.0 (27.0‐43.1) | 1.9 | 5.2 | 0.67 |
| Smoking cessation counseling | 196 | 15.4 (7.8‐23.1) | 13.9 (8.9‐18.9) | 1.5 | 10.2 | 0.59 |
| Pneumonia hospital/discharge composite | 207 | 29.6 (20.5‐38.7) | 27.3 (20.9‐33.6) | 2.3 | 7.8 | 0.51 |
Compared to hospitals without hospitalists, those with hospitalists did not have any statistically significant differences in the individual and composite admission measures for each of the disease processes. In contrast, there were statistically significant differences between hospitalist and nonhospitalist sites for many individual cardiac processes of care that typically occur after admission from the emergency room (ie, LV function assessment for CHF) or those that occurred at discharge (ie, aspirin and ACE‐I/ARB at discharge for AMI). Similarly, the composite discharge scores for AMI and CHF revealed better overall process measure performance at sites with hospitalists, although the AMI composite did not meet statistical significance. There were no statistically significant differences between groups for the pneumonia process measures assessed at discharge. In addition, for composite measures there were no statistically significant interactions between hospitalist prevalence and bed size, although there was a trend (P = 0.06) for the CHF discharge composite, with a larger effect of hospitalists among smaller hospitals.
Percent of Patients Admitted by Hospitalists
Of the 171 hospitals with hospitalists, 71 (42%) estimated the percent of patients admitted by their hospitalist physicians. Among the respondents, the mean and median percentages of medical patients admitted by hospitalists were 51% (SD = 25%) and 49% (IQR = 30‐70%), respectively. Thirty hospitals were above the sample mean. Compared to nonrespondent sites, respondent hospitals took care of more white patients; otherwise, respondent and nonrespondent hospitals were similar in terms of bed size, location, performance across each measure, and other observable characteristics (Supporting Information, Appendix 1).
Relationship Between the Estimated Percentages of Medical Patients Admitted by Hospitalists and Missed Quality Opportunities
Table 3 displays the change in missed quality measures associated with each additional 10% of patients estimated to be admitted by hospitalists. A higher estimated percentage of patients admitted by hospitalists was associated with statistically significant improvements in quality of care across a majority of individual measures and for all composite discharge measures regardless of condition. For example, every 10% increase in the mean estimated number of patients admitted by hospitalists was associated with a mean of 0.6% (P < 0.001), 0.5% (P = 0.004), and 1.5% (P = 0.006) fewer missed quality opportunities for AMI, CHF, and pneumonia discharge process measures composites, respectively. In addition, for these composite measures, there were no statistically significant interactions between the estimated percentage of patients admitted by hospitalists and bed size (dichotomized at 150 beds), although there was a trend (P = 0.09) for the AMI discharge composite, with a larger effect of hospitalists among smaller hospitals.
| Quality Measure | Number of Hospitals | Adjusted % Missed Quality Opportunities (95% CI) | Difference With Hospitalists | Relative Percent Change | P Value | |
|---|---|---|---|---|---|---|
| Among Hospitals With Mean % of Patients Admitted by Hospitalists | Among Hospitals With Mean + 10% of Patients Admitted by Hospitalists | |||||
| ||||||
| Acute myocardial infarction | ||||||
| Admission measures | ||||||
| Aspirin at admission | 70 | 3.4 (2.3‐4.6) | 3.1 (2.0‐3.1) | 0.3 | 10.2 | 0.001 |
| Beta‐blocker at admission | 65 | 5.8 (3.4‐8.2) | 5.1 (3.0‐7.3) | 0.7 | 11.9 | <0.001 |
| AMI admission composite | 65 | 4.5 (2.9‐6.1) | 4.0 (2.6‐5.5) | 0.5 | 11.1 | <0.001* |
| Hospital/discharge measures | ||||||
| Aspirin at discharge | 62 | 5.1 (3.3‐6.9) | 4.6 (3.1‐6.2) | 0.5 | 9.0 | 0.03 |
| Beta‐blocker at discharge | 63 | 5.1 (2.9‐7.2) | 4.3 (2.5‐6.0) | 0.8 | 15.4 | <0.001 |
| ACE‐I/ARB at discharge | 44 | 11.4 (6.2‐16.6) | 10.3 (5.4‐15.1) | 1.1 | 10.0 | 0.02 |
| Smoking cessation counseling | 70 | 3.4 (2.3‐4.6) | 3.1 (2.0‐4.1) | 0.3 | 10.2 | 0.001 |
| AMI hospital/discharge composite | 63 | 5.0 (3.3‐6.7) | 4.4 (3.0‐5.8) | 0.6 | 11.3 | 0.001* |
| Congestive heart failure | ||||||
| Hospital/discharge measures | ||||||
| Ejection fraction assessment | 71 | 5.9 (4.1‐7.6) | 5.6 (3.9‐7.2) | 0.3 | 2.9 | 0.07 |
| ACE‐I/ARB at discharge | 70 | 12.3 (8.6‐16.0) | 11.4 (7.9‐15.0) | 0.9 | 7.1 | 0.008* |
| Smoking cessation counseling | 56 | 8.4 (4.1‐12.6) | 8.2 (4.2‐12.3) | 0.2 | 1.7 | 0.67 |
| CHF hospital/discharge composite | 70 | 7.7 (5.8‐9.6) | 7.2 (5.4‐9.0) | 0.5 | 6.0 | 0.004* |
| Pneumonia | ||||||
| Admission measures | ||||||
| Timing of antibiotics <8 hours | 71 | 5.9 (4.2‐7.6) | 5.9 (4.1‐7.7) | 0.0 | 0.0 | 0.98 |
| Blood culture before antibiotics | 71 | 10.0 (8.0‐12.0) | 9.8 (7.7‐11.8) | 0.2 | 2.6 | 0.18 |
| Initial antibiotic consistent with recommendations | 71 | 13.3 (10.4‐16.2) | 12.9 (9.9‐15.9) | 0.4 | 2.8 | 0.20 |
| Pneumonia admission composite | 71 | 9.4 (7.7‐11.1) | 9.2 (7.6‐10.9) | 0.2 | 1.8 | 0.23 |
| Hospital/discharge measures | ||||||
| Pneumonia vaccine | 71 | 27.0 (19.2‐34.8) | 24.7 (17.2‐32.2) | 2.3 | 8.4 | 0.006 |
| Influenza vaccine | 71 | 34.1 (25.9‐42.2) | 32.6 (24.7‐40.5) | 1.5 | 4.3 | 0.03 |
| Smoking cessation counseling | 67 | 15.2 (9.8‐20.7) | 15.0 (9.6‐20.4) | 0.2 | 2.0 | 0.56 |
| Pneumonia hospital/discharge composite | 71 | 26.7 (20.3‐33.1) | 25.2 (19.0‐31.3) | 1.5 | 5.8 | 0.006* |
In order to test the robustness of our results, we carried out 2 secondary analyses. First, we used multivariable models to generate a propensity score representing the predicted probability of being assigned to a hospital with hospitalists. We then used the propensity score as an additional covariate in subsequent multivariable models. In addition, we performed a complete‐case analysis (including only hospitals with complete data, n = 204) as a check on the sensitivity of our results to missing data. Neither analysis produced results substantially different from those presented.
Discussion
In this cross‐sectional analysis of hospitals participating in a voluntary quality reporting initiative, hospitals with at least 1 hospitalist group had fewer missed discharge care process measures for CHF, even after adjusting for hospital‐level characteristics. In addition, as the estimated percentage of patients admitted by hospitalists increased, the percentage of missed quality opportunities decreased across all measures. The observed relationships were most apparent for measures that could be completed at any time during the hospitalization and at discharge. While it is likely that hospitalists are a marker of a hospital's ability to invest in systems (and as a result, care improvement initiatives), the presence of a potential dose‐response relationship suggests that hospitalists themselves may have a role in improving processes of care.
Our study suggests a generally positive, but mixed, picture of hospitalists' effects on quality process measure performance. Lack of uniformity across measures may depend on the timing of the process measure (eg, whether or not the process is measured at admission or discharge). For example, in contrast to admission process measures, we more commonly observed a positive association between hospitalists and care quality on process measures targeting processes that generally took place later in hospitalization or at discharge. Many admission process measures (eg, door to antibiotic time, blood cultures, and appropriate initial antibiotics) likely occurred prior to hospitalist involvement in most cases and were instead under the direction of emergency medicine physicians. Performance on these measures would not be expected to relate to use of hospitalists, and that is what we observed.
In addition to the timing of when a process was measured or took place, associations between hospitalists and care quality vary by disease. The apparent variation in impact of hospitalists by disease (more impact for cardiac conditions, less for pneumonia) may relate primarily to the characteristics of the processes of care that were measured for each condition. For example, one‐half of the pneumonia process measures related to care occurring within a few hours of admission, while the other one‐half (smoking cessation advice and streptococcal and influenza vaccines) were often administered per protocol or by nonphysician providers.26‐29 However, more of the cardiac measures required physician action (eg, prescription of an ACE‐I at discharge). Alternatively, unmeasured confounders important in the delivery of cardiac care might play an important role in the relationship between hospitalists and cardiac process measure performance.
Our approach to defining hospitalists bears mention as well. While a dichotomous measure of having hospitalists available was only statistically significant for the single CHF discharge composite measure, our measure of hospitalist availabilitythe percentage of patients admitted by hospitalistswas more strongly associated with a larger number of quality measures. Contrast between the dichotomous and continuous measures may have statistical explanations (the power to see differences between 2 groups is more limited with use of a binary predictor, which itself can be subject to bias),30 but may also indicate a dose‐response relationship. A larger number of admissions to hospitalists may help standardize practices, as care is concentrated in a smaller number of physicians' hands. Moreover, larger hospitalist programs may be more likely to have implemented care standardization or quality improvement processes or to have been incorporated into (or lead) hospitals' quality infrastructures. Finally, presence of larger hospitalist groups may be a marker for a hospital's capacity to make hospital‐wide investments in improvement. However, the association between the percentage of patients admitted by hospitalists and care quality persisted even after adjustment for many measures plausibly associated with ability to invest in care quality.
Our study has several limitations. First, although we used a widely accepted definition of hospitalists endorsed by the Society of Hospital Medicine, there are no gold standard definitions for a hospitalist's job description or skill set. As a result, it is possible that a model utilizing rotating internists (from a multispecialty group) might have been misidentified as a hospitalist model. Second, our findings represent a convenience sample of hospitals in a voluntary reporting initiative (CHART) and may not be applicable to hospitals that are less able to participate in such an endeavor. CHART hospitals are recognized to be better performers than the overall California population of hospitals, potentially decreasing variability in our quality of care measures.2 Third, there were significant differences between our comparison groups within the CHART hospitals, including sample size. Although we attempted to adjust our analyses for many important potential confounders and applied conservative measures to assess statistical significance, given the baseline differences, we cannot rule out the possibility of residual confounding by unmeasured factors. Fourth, as described above, this observational study cannot provide robust evidence to support conclusions regarding causality. Fifth, the estimation of the percent of patients admitted by hospitalists is unvalidated and based upon self‐reported and incomplete (41% of respondents) data. We are somewhat reassured by the fact that respondents and nonresponders were similar across all hospital characteristics, as well as outcomes. Sixth, misclassification of the estimated percentage of patients admitted by hospitalists may have influenced our results. Although possible, misclassification often biases results toward the null, potentially weakening any observed association. Given that our respondents were not aware of our hypotheses, there is no reason to expect recall issues to bias the results one way or the other. Finally, for many performance measures, overall performance was excellent among all hospitals (eg, aspirin at admission) with limited variability, thus limiting the ability to assess for differences.
In summary, in a large, cross‐sectional study of California hospitals participating in a voluntary quality reporting initiative, the presence of hospitalists was associated with modest improvements in hospital‐level performance of quality process measures. In addition, we found a relationship between the percentage of patients admitted by hospitalists and improved process measure adherence. Although we cannot determine causality, our data support the hypothesis that dedicated hospital physicians can positively affect the quality of care. Future research should examine this relationship in other settings and should address causality using broader measures of quality including both processes and outcomes.
Acknowledgements
The authors acknowledge Teresa Chipps, BS, Center for Health Services Research, Division of General Internal Medicine and Public Health, Department of Medicine, Vanderbilt University, Nashville, TN, for her administrative and editorial assistance in the preparation of this manuscript.
- ,,,.Care in U.S. hospitals—the Hospital Quality Alliance Program.N Engl J Med.2005;353:265–274.
- CalHospitalCompare.org: online report card simplifies the search for quality hospital care. Available at: http://www.chcf.org/topics/hospitals/index.cfm?itemID=131387. Accessed September 2009.
- ,,, et al.Hospital characteristics and quality of care.JAMA.1992;268:1709–1714.
- ,,,,.Patient and hospital characteristics associated with recommended processes of care for elderly patients hospitalized with pneumonia: results from the Medicare quality indicator system pneumonia module.Arch Intern Med.2002;162:827–833.
- ,,, et al.A systematic review and meta‐analysis of studies comparing mortality rates of private for‐profit and private not‐for‐profit hospitals.CMAJ.2002;166:1399–1406.
- ,.Teaching hospitals and quality of care: a review of the literature.Milbank Q.2002;80:569–593.
- ,,,,.Nurse‐staffing levels and the quality of care in hospitals.N Engl J Med.2002;346:1715–1722.
- ,,,.Growth in the care of older patients by hospitalists in the United States.N Engl J Med.2009;360:1102–1112.
- ,,,.Health care market trends and the evolution of hospitalist use and roles.J Gen Intern Med.2005;20:101–107.
- ,,,.Comparison of processes and outcomes of pneumonia care between hospitalists and community‐based primary care physicians.Mayo Clin Proc.2002;77:1053–1058.
- ,,,.Comparison of hospitalists and nonhospitalists regarding core measures of pneumonia care.Am J Manag Care.2007;13:129–132.
- ,,.Comparison of practice patterns of hospitalists and community physicians in the care of patients with congestive heart failure.J Hosp Med.2008;3:35–41.
- ,,, et al.Quality of care for decompensated heart failure: comparable performance between academic hospitalists and non‐hospitalists.J Gen Intern Med.2008;23:1399–1406.
- ,,,,.Quality of care for patients hospitalized with heart failure: assessing the impact of hospitalists.Arch Intern Med.2002;162:1251–1256.
- ,,,.The inverse relationship between mortality rates and performance in the Hospital Quality Alliance measures.Health Aff.2007;26:1104–1110.
- ,,,,.Does the Leapfrog program help identify high‐quality hospitals?Jt Comm J Qual Patient Saf.2008;34:318–325.
- ,,,,,.Outcomes of care by hospitalists, general internists, and family physicians.N Engl J Med.2007;357:2589–2600.
- CMS HQI demonstration project—composite quality score methodology overview. Available at: http://www.cms.hhs.gov/HospitalQualityInits/downloads/HospitalCompositeQualityScoreMethodologyOverview.pdf. Accessed September 2009.
- ,,.Modeling risk using generalized linear models.J Health Econ.1999;18:153–171.
- ,,.Generalized modeling approaches to risk adjustment of skewed outcomes data.J Health Econ.2005;24:465–488.
- ,,, et al.Quality of care for the treatment of acute medical conditions in US hospitals.Arch Intern Med.2006;166:2511–2517.
- ,,, et al.The Dartmouth Atlas of Cardiovascular Health Care.Chicago:AHA Press;1999. Current data from the Dartmouth Institute for Health Policy and Clinical Practice, Lebanon, NH. Available at: http://www.dartmouthatlas.org/atlases/atlas_ series.shtm. Accessed September 2009.
- ,,.Differences in per capita rates of revascularization and in choice of revascularization procedure for eleven states.BMC Health Serv Res.2006;6:35.
- ,,.The relationship between physician supply, cardiovascular health service use and cardiac disease burden in Ontario: supply‐need mismatch.Can J Card.2008;24:187.
- .Multiple imputation: a primer.Stat Methods Med Res.1999;8:3–15.
- .Nursing intervention and smoking cessation: Meta‐analysis update.Heart Lung.2006;35:147–163.
- .Ten‐year durability and success of an organized program to increase influenza and pneumococcal vaccination rates among high‐risk adults.Am J Med.1998;105:385–392.
- ,,, et al.Role of student pharmacist interns in hospital‐based standing orders pneumococcal vaccination program.J Am Pharm Assoc.2007;47:404–409.
- ,,,.Effect of a pharmacist‐managed program of pneumococcal and influenza immunization on vaccination rates among adult inpatients.Am J Health Syst Pharm.2003;60:1767–1771.
- ,,.Dichotomizing continuous predictors in multiple regression: a bad idea.Stat Med.2006;25:127–141.
Quality of care in US hospitals is inconsistent and often below accepted standards.1 This observation has catalyzed a number of performance measurement initiatives intended to publicize gaps and spur quality improvement.2 As the field has evolved, organizational factors such as teaching status, ownership model, nurse staffing levels, and hospital volume have been found to be associated with performance on quality measures.1, 3‐7 Hospitalists represent a more recent change in the organization of inpatient care8 that may impact hospital‐level performance. In fact, most hospitals provide financial support to hospitalists, not only for hopes of improving efficiency, but also for improving quality and safety.9
Only a few single‐site studies have examined the impact of hospitalists on quality of care for common medical conditions (ie, pneumonia, congestive heart failure, and acute myocardial infarction), and each has focused on patient‐level effects. Rifkin et al.10, 11 did not find differences between hospitalists' and nonhospitalists' patients in terms of pneumonia process measures. Roytman et al.12 found hospitalists more frequently prescribed afterload‐reducing agents for congestive heart failure (CHF), but other studies have shown no differences in care quality for heart failure.13, 14 Importantly, no studies have examined the role of hospitalists in the care of patients with acute myocardial infarction (AMI). In addition, studies have not addressed the effect of hospitalists at the hospital level to understand whether hospitalists have broader system‐level effects reflected by overall hospital performance.
We hypothesized that the presence of hospitalists within a hospital would be associated with improvements in hospital‐level adherence to publicly reported quality process measures, and having a greater percentage of patients admitted by hospitalists would be associated with improved performance. To test these hypotheses, we linked data from a statewide census of hospitalists with data collected as part of a hospital quality‐reporting initiative.
Materials and Methods
Study Sites
We examined the performance of 209 hospitals (63% of all 334 non‐federal facilities in California) participating in the California Hospital Assessment and Reporting Taskforce (CHART) at the time of the survey. CHART is a voluntary quality reporting initiative that began publicly reporting hospital quality data in January 2006.
Hospital‐level Organizational, Case‐mix, and Quality Data
Hospital organizational characteristics (eg, bed size) were obtained from publicly available discharge and utilization data sets from the California Office of Statewide Health Planning and Development (OSHPD). We also linked hospital‐level patient‐mix data (eg, race) from these OSHPD files.
We obtained quality of care data from CHART for January 2006 through June 2007, the time period corresponding to the survey. Quality metrics included 16 measures collected by the Center for Medicare and Medicaid Services (www.cms.hhs.gov) and extensively used in quality research.1, 4, 13, 15‐17 Rather than define a single measure, we examined multiple process measures, anticipating differential impacts of hospitalists on various processes of care for AMI, CHF, and pneumonia. Measures were further divided among those that are usually measured upon initial presentation to the hospital and those that are measured throughout the entire hospitalization and discharge. This division reflects the division of care in the hospital, where emergency room physicians are likely to have a more critical role for admission processes.
Survey Process
We surveyed all nonfederal, acute care hospitals in California that participated in CHART.2 We first identified contacts at each site via professional society mailing lists. We then sent web‐based surveys to all with available email addresses and a fax/paper survey to the remainder. We surveyed individuals between October 2006 and April 2007 and repeated the process at intervals of 1 to 3 weeks. For remaining nonrespondents, we placed a direct call unless consent to survey had been specifically refused. We contacted the following persons in sequence: (1) hospital executives or administrative leaders; (2) hospital medicine department leaders; (3) admitting emergency room personnel or medical staff officers; and (4) hospital website information. In the case of multiple responses with disagreement, the hospital/hospitalist leader's response was treated as the primary source. At each step, respondents were asked to answer questions only if they had a direct working knowledge of their hospitalist services.
Survey Data
Our key survey question to all respondents included whether the respondents could confirm their hospitals had at least one hospitalist medicine group. Hospital leaders were also asked to participate in a more comprehensive survey of their organizational and clinical characteristics. Within the comprehensive survey, leaders also provided estimates of the percent of general medical patients admitted by hospitalists. This measure, used in prior surveys of hospital leaders,9 was intended to be an easily understood approximation of the intensity of hospitalist utilization in any given hospital. A more rigorous, direct measure was not feasible due to the complexity of obtaining admission data over such a large, diverse set of hospitals.
Process Performance Measures
AMI measures assessed at admission included aspirin and ‐blocker administration within 24 hours of arrival. AMI measures assessed at discharge included aspirin administration, ‐blocker administration, angiotensin converting enzyme inhibitor (ACE‐I) (or angiotensin receptor blocker [ARB]) administration for left ventricular (LV) dysfunction, and smoking cessation counseling. There were no CHF admission measures. CHF discharge measures included assessment of LV function, the use of an ACE‐I or ARB for LV dysfunction, and smoking cessation counseling. Pneumonia admission measures included the drawing of blood cultures prior to the receipt of antibiotics, timely administration of initial antibiotics (<8 hours), and antibiotics consistent with recommendations. Pneumonia discharge measures included pneumococcal vaccination, flu vaccination, and smoking cessation counseling.
For each performance measure, we quantified the percentage of missed quality opportunities, defined as the number of patients who did not receive a care process divided by the number of eligible patients, multiplied by 100. In addition, we calculated composite scores for admission and discharge measures across each condition. We summed the numerators and denominators of individual performance measures to generate a disease‐specific composite numerator and denominator. Both individual and composite scores were produced using methodology outlined by the Center for Medicare & Medicaid Services.18 In order to retain as representative a sample of hospitals as possible, we calculated composite scores for hospitals that had a minimum of 25 observations in at least 2 of the quality indicators that made up each composite score.
Statistical Analysis
We used chi‐square tests, Student t tests, and Mann‐Whitney tests, where appropriate, to compare hospital‐level characteristics of hospitals that utilized hospitalists vs. those that did not. Similar analyses were performed among the subset of hospitals that utilized hospitalists. Among this subgroup of hospitals, we compared hospital‐level characteristics between hospitals that provided information regarding the percent of patients admitted by hospitalists vs. those who did not provide this information.
We used multivariable, generalized linear regression models to assess the relationship between having at least 1 hospitalist group and the percentage of missed quality of care measures. Because percentages were not normally distributed (ie, a majority of hospitals had few missed opportunities, while a minority had many), multivariable models employed log‐link functions with a gamma distribution.19, 20 Coefficients for our key predictor (presence of hospitalists) were transformed back to the original units (percentage of missed quality opportunities) so that a positive coefficient represented a higher number of quality measures missed relative to hospitals without hospitalists. Models were adjusted for factors previously reported to be associated with care quality. Hospital organizational characteristics included the number of beds, teaching status, registered nursing (RN) hours per adjusted patient day, and hospital ownership (for‐profit vs. not‐for‐profit). Hospital patient mix factors included annual percentage of admissions by insurance status (Medicare, Medicaid, other), annual percentage of admissions by race (white vs. nonwhite), annual percentage of do‐not‐resuscitate status at admission, and mean diagnosis‐related group‐based case‐mix index.21 We additionally adjusted for the number of cardiac catheterizations, a measure that moderately correlates with the number of cardiologists and technology utilization.22‐24 In our subset analysis among those hospitals with hospitalists, our key predictor for regression analyses was the percentage of patients admitted by hospitalists. For ease of interpretation, the percentage of patients admitted by hospitalists was centered on the mean across all respondent hospitals, and we report the effect of increasing by 10% the percentage of patients admitted by hospitalists. Models were adjusted for the same hospital organizational characteristics listed above. For those models, a positive coefficient also meant a higher number of measures missed.
For both sets of predictors, we additionally tested for the presence of interactions between the predictors and hospital bed size (both continuous as well as dichotomized at 150 beds) in composite measure performance, given the possibility that any hospitalist effect may be greater among smaller, resource‐limited hospitals. Tests for interaction were performed with the likelihood ratio test. In addition, to minimize any potential bias or loss of power that might result from limiting the analysis to hospitals with complete data, we used the multivariate imputation by chained equations method, as implemented in STATA 9.2 (StataCorp, College Station, TX), to create 10 imputed datasets.25 Imputation of missing values was restricted to confounding variables. Standard methods were then used to combine results over the 10 imputed datasets. We also applied Bonferroni corrections to composite measure tests based on the number of composites generated (n = 5). Thus, for the 5 inpatient composites created, standard definitions of significance (P 0.05) were corrected by dividing composite P values by 5, requiring P 0.01 for significance. The institutional review board of the University of California, San Francisco, approved the study. All analyses were performed using STATA 9.2.
Results
Characteristics of Participating Sites
There were 209 eligible hospitals. All 209 (100%) hospitals provided data about the presence or absence of hospitalists via at least 1 of our survey strategies. The majority of identification of hospitalist utilization was via contact with either hospital or hospitalist leaders, n = 147 (70.3%). Web‐sites informed hospitalist prevalence in only 3 (1.4%) hospitals. There were 8 (3.8%) occurrences of disagreement between sources, all of which had available hospital/hospitalist leader responses. Only 1 (0.5%) hospital did not have the minimum 25 patients eligible for any disease‐specific quality measures during the data reporting period. Collectively, the remaining 208 hospitals accounted for 81% of California's acute care hospital population.
Comparisons of Sites With Hospitalists and Those Without
A total of 170 hospitals (82%) participating in CHART used hospitalists. Hospitals with and without hospitalists differed by a variety of characteristics (Table 1). Sites with hospitalists were larger, less likely to be for‐profit, had more registered nursing hours per day, and performed more cardiac catheterizations.
| Characteristic | Hospitals Without Hospitalists (n = 38) | Hospitals With Hospitalists (n = 170) | P Value* |
|---|---|---|---|
| |||
| Number of beds, n (% of hospitals) | <0.001 | ||
| 0‐99 | 16 (42.1) | 14 (8.2) | |
| 100‐199 | 8 (21.1) | 44 (25.9) | |
| 200‐299 | 7 (18.4) | 42 (24.7) | |
| 300+ | 7 (18.4) | 70 (41.2) | |
| For profit, n (% of hospitals) | 9 (23.7) | 18 (10.6) | 0.03 |
| Teaching hospital, n (% of hospitals) | 7 (18.4) | 55 (32.4) | 0.09 |
| RN hours per adjusted patient day, number of hours (IQR) | 7.4 (5.7‐8.6) | 8.5 (7.4‐9.9) | <0.001 |
| Annual cardiac catheterizations, n (IQR) | 0 (0‐356) | 210 (0‐813) | 0.007 |
| Hospital total census days, n (IQR) | 37161 (14910‐59750) | 60626 (34402‐87950) | <0.001 |
| ICU total census, n (IQR) | 2193 (1132‐4289) | 3855 (2489‐6379) | <0.001 |
| Medicare insurance, % patients (IQR) | 36.9 (28.5‐48.0) | 35.3(28.2‐44.3) | 0.95 |
| Medicaid insurance, % patients (IQR) | 21.0 (12.7‐48.3) | 16.6 (5.6‐27.6) | 0.02 |
| Race, white, % patients (IQR) | 53.7 (26.0‐82.7) | 59.1 (45.6‐74.3) | 0.73 |
| DNR at admission, % patients (IQR) | 3.6 (2.0‐6.4) | 4.4 (2.7‐7.1) | 0.12 |
| Case‐mix index, index (IQR) | 1.05 (0.90‐1.21) | 1.13 (1.01‐1.26) | 0.11 |
Relationship Between Hospitalist Group Utilization and the Percentage of Missed Quality Opportunities
Table 2 shows the frequency of missed quality opportunities in sites with hospitalists compared to those without. In general, for both individual and composite measures of quality, multivariable adjustment modestly attenuated the observed differences between the 2 groups of hospitals. We present only the more conservative adjusted estimates.
| Quality Measure | Number of Hospitals | Adjusted Mean % Missed Quality Opportunities (95% CI) | Difference With Hospitalists | Relative % Change | P Value | |
|---|---|---|---|---|---|---|
| Hospitals Without Hospitalists | Hospitals With Hospitalists | |||||
| ||||||
| Acute myocardial infarction | ||||||
| Admission measures | ||||||
| Aspirin at admission | 193 | 3.7 (2.4‐5.1) | 3.4 (2.3‐4.4) | 0.3 | 10.0 | 0.44 |
| Beta‐blocker at admission | 186 | 7.8 (4.7‐10.9) | 6.4 (4.4‐8.3) | 1.4 | 18.3 | 0.19 |
| AMI admission composite | 186 | 5.5 (3.6‐7.5) | 4.8 (3.4‐6.1) | 0.7 | 14.3 | 0.26 |
| Hospital/discharge measures | ||||||
| Aspirin at discharge | 173 | 7.5 (4.5‐10.4) | 5.2 (3.4‐6.9) | 2.3 | 31.0 | 0.02 |
| Beta‐blocker at discharge | 179 | 6.6 (3.8‐9.4) | 5.9 (3.6‐8.2) | 0.7 | 9.6 | 0.54 |
| ACE‐I/ARB at discharge | 119 | 20.7 (9.5‐31.8) | 11.8 (6.6‐17.0) | 8.9 | 43.0 | 0.006 |
| Smoking cessation counseling | 193 | 3.8 (2.4‐5.1) | 3.4 (2.4‐4.4) | 0.4 | 10.0 | 0.44 |
| AMI hospital/discharge composite | 179 | 6.4 (4.1‐8.6) | 5.3 (3.7‐6.8) | 1.1 | 17.6 | 0.16 |
| Congestive heart failure | ||||||
| Hospital/discharge measures | ||||||
| Ejection fraction assessment | 208 | 12.6 (7.7‐17.6) | 6.5 (4.6‐8.4) | 6.1 | 48.2 | <0.001 |
| ACE‐I/ARB at discharge | 201 | 14.7 (10.0‐19.4) | 12.9 (9.8‐16.1) | 1.8 | 12.1 | 0.31 |
| Smoking cessation counseling | 168 | 9.1 (2.9‐15.4) | 9.0 (4.2‐13.8) | 0.1 | 1.8 | 0.98 |
| CHF hospital/discharge composite | 201 | 12.2 (7.9‐16.5) | 8.2 (6.2‐10.2) | 4.0 | 33.1 | 0.006* |
| Pneumonia | ||||||
| Admission measures | ||||||
| Blood culture before antibiotics | 206 | 12.0 (9.1‐14.9) | 10.9 (8.8‐13.0) | 1.1 | 9.1 | 0.29 |
| Timing of antibiotics <8 hours | 208 | 5.8 (4.1‐7.5) | 6.2 (4.7‐7.7) | 0.4 | 6.9 | 0.56 |
| Initial antibiotic consistent with recommendations | 207 | 15.0 (11.6‐18.6) | 13.8 (10.9‐16.8) | 1.2 | 8.1 | 0.27 |
| Pneumonia admission composite | 207 | 10.5 (8.5‐12.5) | 9.9 (8.3‐11.5) | 0.6 | 5.9 | 0.37 |
| Hospital/discharge measures | ||||||
| Pneumonia vaccine | 208 | 29.4 (19.5‐39.2) | 27.1 (19.9‐34.3) | 2.3 | 7.7 | 0.54 |
| Influenza vaccine | 207 | 36.9 (25.4‐48.4) | 35.0 (27.0‐43.1) | 1.9 | 5.2 | 0.67 |
| Smoking cessation counseling | 196 | 15.4 (7.8‐23.1) | 13.9 (8.9‐18.9) | 1.5 | 10.2 | 0.59 |
| Pneumonia hospital/discharge composite | 207 | 29.6 (20.5‐38.7) | 27.3 (20.9‐33.6) | 2.3 | 7.8 | 0.51 |
Compared to hospitals without hospitalists, those with hospitalists did not have any statistically significant differences in the individual and composite admission measures for each of the disease processes. In contrast, there were statistically significant differences between hospitalist and nonhospitalist sites for many individual cardiac processes of care that typically occur after admission from the emergency room (ie, LV function assessment for CHF) or those that occurred at discharge (ie, aspirin and ACE‐I/ARB at discharge for AMI). Similarly, the composite discharge scores for AMI and CHF revealed better overall process measure performance at sites with hospitalists, although the AMI composite did not meet statistical significance. There were no statistically significant differences between groups for the pneumonia process measures assessed at discharge. In addition, for composite measures there were no statistically significant interactions between hospitalist prevalence and bed size, although there was a trend (P = 0.06) for the CHF discharge composite, with a larger effect of hospitalists among smaller hospitals.
Percent of Patients Admitted by Hospitalists
Of the 171 hospitals with hospitalists, 71 (42%) estimated the percent of patients admitted by their hospitalist physicians. Among the respondents, the mean and median percentages of medical patients admitted by hospitalists were 51% (SD = 25%) and 49% (IQR = 30‐70%), respectively. Thirty hospitals were above the sample mean. Compared to nonrespondent sites, respondent hospitals took care of more white patients; otherwise, respondent and nonrespondent hospitals were similar in terms of bed size, location, performance across each measure, and other observable characteristics (Supporting Information, Appendix 1).
Relationship Between the Estimated Percentages of Medical Patients Admitted by Hospitalists and Missed Quality Opportunities
Table 3 displays the change in missed quality measures associated with each additional 10% of patients estimated to be admitted by hospitalists. A higher estimated percentage of patients admitted by hospitalists was associated with statistically significant improvements in quality of care across a majority of individual measures and for all composite discharge measures regardless of condition. For example, every 10% increase in the mean estimated number of patients admitted by hospitalists was associated with a mean of 0.6% (P < 0.001), 0.5% (P = 0.004), and 1.5% (P = 0.006) fewer missed quality opportunities for AMI, CHF, and pneumonia discharge process measures composites, respectively. In addition, for these composite measures, there were no statistically significant interactions between the estimated percentage of patients admitted by hospitalists and bed size (dichotomized at 150 beds), although there was a trend (P = 0.09) for the AMI discharge composite, with a larger effect of hospitalists among smaller hospitals.
| Quality Measure | Number of Hospitals | Adjusted % Missed Quality Opportunities (95% CI) | Difference With Hospitalists | Relative Percent Change | P Value | |
|---|---|---|---|---|---|---|
| Among Hospitals With Mean % of Patients Admitted by Hospitalists | Among Hospitals With Mean + 10% of Patients Admitted by Hospitalists | |||||
| ||||||
| Acute myocardial infarction | ||||||
| Admission measures | ||||||
| Aspirin at admission | 70 | 3.4 (2.3‐4.6) | 3.1 (2.0‐3.1) | 0.3 | 10.2 | 0.001 |
| Beta‐blocker at admission | 65 | 5.8 (3.4‐8.2) | 5.1 (3.0‐7.3) | 0.7 | 11.9 | <0.001 |
| AMI admission composite | 65 | 4.5 (2.9‐6.1) | 4.0 (2.6‐5.5) | 0.5 | 11.1 | <0.001* |
| Hospital/discharge measures | ||||||
| Aspirin at discharge | 62 | 5.1 (3.3‐6.9) | 4.6 (3.1‐6.2) | 0.5 | 9.0 | 0.03 |
| Beta‐blocker at discharge | 63 | 5.1 (2.9‐7.2) | 4.3 (2.5‐6.0) | 0.8 | 15.4 | <0.001 |
| ACE‐I/ARB at discharge | 44 | 11.4 (6.2‐16.6) | 10.3 (5.4‐15.1) | 1.1 | 10.0 | 0.02 |
| Smoking cessation counseling | 70 | 3.4 (2.3‐4.6) | 3.1 (2.0‐4.1) | 0.3 | 10.2 | 0.001 |
| AMI hospital/discharge composite | 63 | 5.0 (3.3‐6.7) | 4.4 (3.0‐5.8) | 0.6 | 11.3 | 0.001* |
| Congestive heart failure | ||||||
| Hospital/discharge measures | ||||||
| Ejection fraction assessment | 71 | 5.9 (4.1‐7.6) | 5.6 (3.9‐7.2) | 0.3 | 2.9 | 0.07 |
| ACE‐I/ARB at discharge | 70 | 12.3 (8.6‐16.0) | 11.4 (7.9‐15.0) | 0.9 | 7.1 | 0.008* |
| Smoking cessation counseling | 56 | 8.4 (4.1‐12.6) | 8.2 (4.2‐12.3) | 0.2 | 1.7 | 0.67 |
| CHF hospital/discharge composite | 70 | 7.7 (5.8‐9.6) | 7.2 (5.4‐9.0) | 0.5 | 6.0 | 0.004* |
| Pneumonia | ||||||
| Admission measures | ||||||
| Timing of antibiotics <8 hours | 71 | 5.9 (4.2‐7.6) | 5.9 (4.1‐7.7) | 0.0 | 0.0 | 0.98 |
| Blood culture before antibiotics | 71 | 10.0 (8.0‐12.0) | 9.8 (7.7‐11.8) | 0.2 | 2.6 | 0.18 |
| Initial antibiotic consistent with recommendations | 71 | 13.3 (10.4‐16.2) | 12.9 (9.9‐15.9) | 0.4 | 2.8 | 0.20 |
| Pneumonia admission composite | 71 | 9.4 (7.7‐11.1) | 9.2 (7.6‐10.9) | 0.2 | 1.8 | 0.23 |
| Hospital/discharge measures | ||||||
| Pneumonia vaccine | 71 | 27.0 (19.2‐34.8) | 24.7 (17.2‐32.2) | 2.3 | 8.4 | 0.006 |
| Influenza vaccine | 71 | 34.1 (25.9‐42.2) | 32.6 (24.7‐40.5) | 1.5 | 4.3 | 0.03 |
| Smoking cessation counseling | 67 | 15.2 (9.8‐20.7) | 15.0 (9.6‐20.4) | 0.2 | 2.0 | 0.56 |
| Pneumonia hospital/discharge composite | 71 | 26.7 (20.3‐33.1) | 25.2 (19.0‐31.3) | 1.5 | 5.8 | 0.006* |
In order to test the robustness of our results, we carried out 2 secondary analyses. First, we used multivariable models to generate a propensity score representing the predicted probability of being assigned to a hospital with hospitalists. We then used the propensity score as an additional covariate in subsequent multivariable models. In addition, we performed a complete‐case analysis (including only hospitals with complete data, n = 204) as a check on the sensitivity of our results to missing data. Neither analysis produced results substantially different from those presented.
Discussion
In this cross‐sectional analysis of hospitals participating in a voluntary quality reporting initiative, hospitals with at least 1 hospitalist group had fewer missed discharge care process measures for CHF, even after adjusting for hospital‐level characteristics. In addition, as the estimated percentage of patients admitted by hospitalists increased, the percentage of missed quality opportunities decreased across all measures. The observed relationships were most apparent for measures that could be completed at any time during the hospitalization and at discharge. While it is likely that hospitalists are a marker of a hospital's ability to invest in systems (and as a result, care improvement initiatives), the presence of a potential dose‐response relationship suggests that hospitalists themselves may have a role in improving processes of care.
Our study suggests a generally positive, but mixed, picture of hospitalists' effects on quality process measure performance. Lack of uniformity across measures may depend on the timing of the process measure (eg, whether or not the process is measured at admission or discharge). For example, in contrast to admission process measures, we more commonly observed a positive association between hospitalists and care quality on process measures targeting processes that generally took place later in hospitalization or at discharge. Many admission process measures (eg, door to antibiotic time, blood cultures, and appropriate initial antibiotics) likely occurred prior to hospitalist involvement in most cases and were instead under the direction of emergency medicine physicians. Performance on these measures would not be expected to relate to use of hospitalists, and that is what we observed.
In addition to the timing of when a process was measured or took place, associations between hospitalists and care quality vary by disease. The apparent variation in impact of hospitalists by disease (more impact for cardiac conditions, less for pneumonia) may relate primarily to the characteristics of the processes of care that were measured for each condition. For example, one‐half of the pneumonia process measures related to care occurring within a few hours of admission, while the other one‐half (smoking cessation advice and streptococcal and influenza vaccines) were often administered per protocol or by nonphysician providers.26‐29 However, more of the cardiac measures required physician action (eg, prescription of an ACE‐I at discharge). Alternatively, unmeasured confounders important in the delivery of cardiac care might play an important role in the relationship between hospitalists and cardiac process measure performance.
Our approach to defining hospitalists bears mention as well. While a dichotomous measure of having hospitalists available was only statistically significant for the single CHF discharge composite measure, our measure of hospitalist availabilitythe percentage of patients admitted by hospitalistswas more strongly associated with a larger number of quality measures. Contrast between the dichotomous and continuous measures may have statistical explanations (the power to see differences between 2 groups is more limited with use of a binary predictor, which itself can be subject to bias),30 but may also indicate a dose‐response relationship. A larger number of admissions to hospitalists may help standardize practices, as care is concentrated in a smaller number of physicians' hands. Moreover, larger hospitalist programs may be more likely to have implemented care standardization or quality improvement processes or to have been incorporated into (or lead) hospitals' quality infrastructures. Finally, presence of larger hospitalist groups may be a marker for a hospital's capacity to make hospital‐wide investments in improvement. However, the association between the percentage of patients admitted by hospitalists and care quality persisted even after adjustment for many measures plausibly associated with ability to invest in care quality.
Our study has several limitations. First, although we used a widely accepted definition of hospitalists endorsed by the Society of Hospital Medicine, there are no gold standard definitions for a hospitalist's job description or skill set. As a result, it is possible that a model utilizing rotating internists (from a multispecialty group) might have been misidentified as a hospitalist model. Second, our findings represent a convenience sample of hospitals in a voluntary reporting initiative (CHART) and may not be applicable to hospitals that are less able to participate in such an endeavor. CHART hospitals are recognized to be better performers than the overall California population of hospitals, potentially decreasing variability in our quality of care measures.2 Third, there were significant differences between our comparison groups within the CHART hospitals, including sample size. Although we attempted to adjust our analyses for many important potential confounders and applied conservative measures to assess statistical significance, given the baseline differences, we cannot rule out the possibility of residual confounding by unmeasured factors. Fourth, as described above, this observational study cannot provide robust evidence to support conclusions regarding causality. Fifth, the estimation of the percent of patients admitted by hospitalists is unvalidated and based upon self‐reported and incomplete (41% of respondents) data. We are somewhat reassured by the fact that respondents and nonresponders were similar across all hospital characteristics, as well as outcomes. Sixth, misclassification of the estimated percentage of patients admitted by hospitalists may have influenced our results. Although possible, misclassification often biases results toward the null, potentially weakening any observed association. Given that our respondents were not aware of our hypotheses, there is no reason to expect recall issues to bias the results one way or the other. Finally, for many performance measures, overall performance was excellent among all hospitals (eg, aspirin at admission) with limited variability, thus limiting the ability to assess for differences.
In summary, in a large, cross‐sectional study of California hospitals participating in a voluntary quality reporting initiative, the presence of hospitalists was associated with modest improvements in hospital‐level performance of quality process measures. In addition, we found a relationship between the percentage of patients admitted by hospitalists and improved process measure adherence. Although we cannot determine causality, our data support the hypothesis that dedicated hospital physicians can positively affect the quality of care. Future research should examine this relationship in other settings and should address causality using broader measures of quality including both processes and outcomes.
Acknowledgements
The authors acknowledge Teresa Chipps, BS, Center for Health Services Research, Division of General Internal Medicine and Public Health, Department of Medicine, Vanderbilt University, Nashville, TN, for her administrative and editorial assistance in the preparation of this manuscript.
- ,,,.Care in U.S. hospitals—the Hospital Quality Alliance Program.N Engl J Med.2005;353:265–274.
- CalHospitalCompare.org: online report card simplifies the search for quality hospital care. Available at: http://www.chcf.org/topics/hospitals/index.cfm?itemID=131387. Accessed September 2009.
- ,,, et al.Hospital characteristics and quality of care.JAMA.1992;268:1709–1714.
- ,,,,.Patient and hospital characteristics associated with recommended processes of care for elderly patients hospitalized with pneumonia: results from the Medicare quality indicator system pneumonia module.Arch Intern Med.2002;162:827–833.
- ,,, et al.A systematic review and meta‐analysis of studies comparing mortality rates of private for‐profit and private not‐for‐profit hospitals.CMAJ.2002;166:1399–1406.
- ,.Teaching hospitals and quality of care: a review of the literature.Milbank Q.2002;80:569–593.
- ,,,,.Nurse‐staffing levels and the quality of care in hospitals.N Engl J Med.2002;346:1715–1722.
- ,,,.Growth in the care of older patients by hospitalists in the United States.N Engl J Med.2009;360:1102–1112.
- ,,,.Health care market trends and the evolution of hospitalist use and roles.J Gen Intern Med.2005;20:101–107.
- ,,,.Comparison of processes and outcomes of pneumonia care between hospitalists and community‐based primary care physicians.Mayo Clin Proc.2002;77:1053–1058.
- ,,,.Comparison of hospitalists and nonhospitalists regarding core measures of pneumonia care.Am J Manag Care.2007;13:129–132.
- ,,.Comparison of practice patterns of hospitalists and community physicians in the care of patients with congestive heart failure.J Hosp Med.2008;3:35–41.
- ,,, et al.Quality of care for decompensated heart failure: comparable performance between academic hospitalists and non‐hospitalists.J Gen Intern Med.2008;23:1399–1406.
- ,,,,.Quality of care for patients hospitalized with heart failure: assessing the impact of hospitalists.Arch Intern Med.2002;162:1251–1256.
- ,,,.The inverse relationship between mortality rates and performance in the Hospital Quality Alliance measures.Health Aff.2007;26:1104–1110.
- ,,,,.Does the Leapfrog program help identify high‐quality hospitals?Jt Comm J Qual Patient Saf.2008;34:318–325.
- ,,,,,.Outcomes of care by hospitalists, general internists, and family physicians.N Engl J Med.2007;357:2589–2600.
- CMS HQI demonstration project—composite quality score methodology overview. Available at: http://www.cms.hhs.gov/HospitalQualityInits/downloads/HospitalCompositeQualityScoreMethodologyOverview.pdf. Accessed September 2009.
- ,,.Modeling risk using generalized linear models.J Health Econ.1999;18:153–171.
- ,,.Generalized modeling approaches to risk adjustment of skewed outcomes data.J Health Econ.2005;24:465–488.
- ,,, et al.Quality of care for the treatment of acute medical conditions in US hospitals.Arch Intern Med.2006;166:2511–2517.
- ,,, et al.The Dartmouth Atlas of Cardiovascular Health Care.Chicago:AHA Press;1999. Current data from the Dartmouth Institute for Health Policy and Clinical Practice, Lebanon, NH. Available at: http://www.dartmouthatlas.org/atlases/atlas_ series.shtm. Accessed September 2009.
- ,,.Differences in per capita rates of revascularization and in choice of revascularization procedure for eleven states.BMC Health Serv Res.2006;6:35.
- ,,.The relationship between physician supply, cardiovascular health service use and cardiac disease burden in Ontario: supply‐need mismatch.Can J Card.2008;24:187.
- .Multiple imputation: a primer.Stat Methods Med Res.1999;8:3–15.
- .Nursing intervention and smoking cessation: Meta‐analysis update.Heart Lung.2006;35:147–163.
- .Ten‐year durability and success of an organized program to increase influenza and pneumococcal vaccination rates among high‐risk adults.Am J Med.1998;105:385–392.
- ,,, et al.Role of student pharmacist interns in hospital‐based standing orders pneumococcal vaccination program.J Am Pharm Assoc.2007;47:404–409.
- ,,,.Effect of a pharmacist‐managed program of pneumococcal and influenza immunization on vaccination rates among adult inpatients.Am J Health Syst Pharm.2003;60:1767–1771.
- ,,.Dichotomizing continuous predictors in multiple regression: a bad idea.Stat Med.2006;25:127–141.
Copyright © 2010 Society of Hospital Medicine
Hospital Leader Survey
In the late 1990s, hospitalist systems grew rapidly in an environment where cost containment was paramount, complexity of patients increased, and outpatient practices experienced increasing productivity and efficiency pressures.15 While the healthcare delivery environment has changed significantly since that time,68 hospitalists have continued to become more common. In fact, the field's present size of more than 25,000 has already exceeded early projections, and there are no signs of slackening demand.911
Growth has been attributed to primary care physicians' increasing focus on outpatient care, hospitals' response to financial pressures, and the need to facilitate improved communication among various hospital care providers.1216 Hospital leadership has played a similarly important role in fueling the growth of hospitalists, particularly since the vast majority of programs require and receive institutional (usually hospital) support.17 However, the factors that continue to influence leaders' decisions to utilize hospitalists and the current and future needs that hospitalists are fulfilling are unknown. Each of these factors is likely to impact growth of the field, as well as the clinical and organizational identity of hospitalists. In addition, an understanding of the market demand for hospitalists' competencies and the roles they play in the hospital may inform any changes in board certification and training for hospitalists.11, 1821
To gain a more complete understanding of a key part of the engine driving the growth of hospitalists, we performed a cross‐sectional survey of California hospital leaders who were involved with the funding or administration of their hospitalist groups. Our survey aimed to understand: (1) the prevalence of hospitalist groups in California hospitals, (2) hospital leaders' rationale for initiating the use of hospitalists, (3) the scope of clinical and nonclinical practice of hospitalists, and 4) hospital leaders' perspective on the need for further training and/or certification.
Materials and Methods
Sites and Subjects
We targeted all nonfederal, nonspecialty, acute care hospitals in California (n = 334) for this survey. We limited our survey to California in order to maximize our local resources and to improve implementation of and response to the survey. Additionally, California's size and diversity gives it disproportionate impact and potential generalizability. At each site, we focused our efforts on identifying and surveying executives or administrative leaders involved in organizational and staff decisions, specifically the decision whether or not to hire and/or fund a hospitalist program and potentially direct its activities (described in more detail below). The University of California, San Francisco, Committee on Human Research approved the research protocol.
We identified hospital leaders at each site by merging information from multiple sources. These included the American Hospital Association database, the California Hospital Association, the Hospital Association of Southern California (HASC), the California Health Care Safety Net Institute, and individual hospital websites.
Survey Development
Our survey was based upon instruments used in previous research examining hospital medicine group organizational structure15, 22 and enhanced with questions developed by the research team (A.D.A., E.E.V., R.M.W.). The survey was pretested in an advisory group of 5 hospital Chief Executive Officers (CEOs), Chief Medical Officers (CMOs), and Vice Presidents for Medical Affairs (VPMAs) from sites across California. Based on their input, we removed, edited, or added questions to our survey. This advisory group also helped the research team design our survey process.
Our final survey defined a hospitalist as a physician who spends all or the majority of his or her clinical, administrative, educational, or research activities in the care of hospitalized patients.4 We collected data in 4 areas: (1) We asked hospital leaders to confirm the presence or absence of at least 1 hospitalist group practicing within the surveyed hospital. We also asked for the year the first hospitalist group began practicing within the specified hospital. (2) We asked hospital leaders to indicate, among a prespecified list of 11 choices, the reason(s) they implemented a hospitalist group at the surveyed hospital. Surveyed categories included: (a) care for uncovered patients (patients without an identified doctor and/or uninsured), (b) improve costs, (c) improve length of stay, (d) improve emergency department throughput, (e) primary care provider demand, (f) improve patient satisfaction, (g) improve emergency room staffing, (h) quality improvement needs, (i) specialist physician demand, (j) overnight coverage, and (k) surgical comanagement. Due to the close relationship between cost and length of stay, we combined these 2 categories into a single category for reporting and analysis. This resulted in 10 final categories. We asked leaders who did not identify a practicing hospitalist group about the likelihood of hospitalists practicing at their hospital within the next 5 years and the reason(s) for future implementation. (3) We asked leaders to describe the services currently provided among a prespecified list of clinical care duties that go beyond the scope of inpatient general internal medicine (eg, surgical comanagement, rapid response team leadership) as well as nonclinical duties (eg, quality improvement activities, systems project implementation). If hospitalists did not currently provide the identified service, we asked leaders to indicate if they would be inclined to involve hospitalists in the specified service in the future. (4) Finally, we asked hospital leaders their opinion regarding the need for further training or certification for hospitalists.
Survey Protocol
We administered surveys between October 2006 and April 2007. We initially emailed the survey. We repeated this process for nonrespondents at intervals of 1 to 3 weeks after the initial emailing. Next, we sent nonrespondents a physical mailing with a reminder letter. Finally, we made phone calls to those who had not responded within 4 weeks of the last mailed letter. We asked survey recipients to respond only if they felt they had an adequate working knowledge of the hospitalist service at their hospital. If they did not feel they could adequately answer all questions, we allowed them to forward the instrument to others with a better working knowledge of the service.
Because we allowed recipients to forward the survey, we occasionally received 2 surveys from 1 site. In this case, we selected the survey according to the following prioritization order: (1) CEOs/COOs, (2) CMOs, (3) VPMAs, and (4) other vice presidents (VPs) or executive/administrative leaders with staff organization knowledge and responsibilities.
Hospital Descriptive Data
We obtained hospital organizational data from the California Office of Statewide Health Planning and Development's (OSHPD) publicly available Case Mix Index Data, hospital Annual Financial Data, aggregated Patient Discharge Data, and Utilization Data from 2006.23 Organizational characteristics included hospital size, location, profit status, payor mix, and diagnosis‐related groupbased case‐mix. Teaching status was determined from the 2005 American Hospital Association database. Membership status in California's voluntary quality reporting initiative, California Hospital Assessment and Reporting Taskforce (CHART), was publicly available at
Statistical Analyses
We performed univariable analyses to characterize survey respondents, followed by bivariable analyses to compare hospital characteristics and patient mix of responding and nonresponding hospitals. We used similar methods to characterize respondent hospitals with and without at least 1 hospitalist group. We compared continuous data with the Students t tests or Mann‐Whitney tests as appropriate and categorical data with chi‐square tests.
We then summarized the number of times a specific rationale was cited by hospital leaders for implementing a hospitalist group. Among hospitals that did not have a hospitalist system in place at the time of the survey, we asked if they were planning on starting one within the next 5 years. For these hospitals, we used content analysis to summarize open‐ended responses in order to understand factors that are currently influencing these hospital leaders to consider implementing a hospitalist group.
Next, we aimed to understand what clinical and nonclinical roles hospitalists were performing in hospitals with established hospitalist programs. Clinical activities were divided into general clinical areas, triage/emergency‐related, or administrative activities. First, we summarized the number and percent of programs performing each clinical and nonclinical activity. This was followed by logistic regression analyses to assess whether the time period that hospitalist groups began practicing or additional hospital characteristics predicted the performance of individual hospitalist activities. To guard against overfitting of models, analyses were limited to rationales that were cited a minimum of 50 times.24 Hospital factors were selected on the basis of face validity and advisory group input and included hospital bed size, ownership status (public vs. private), teaching status, and membership status in CHART. We divided the year of hospitalist program implementation into 3 time periods: (1) before 2002, (2) between 2002 and 2004, and (3) 2005 or later.
Finally, we described the percentage of hospitals that favored having their hospitalist group(s) perform each of the identified clinical or nonclinical activities, if they were not already performing them. We performed analyses with statistical software (Stata Version 9.2, College Station, TX).
Results
Respondent Characteristics
We received 200 survey responses. Of those, we excluded 15 duplicates (eg, a survey from both the CEO and VPMA) and 6 responses identified as coming from hospitalists who did not have a leadership position in the hospital. Thus, the final hospital leader survey response rate was 54% (n = 179). Forty‐six percent of the final responses were from CEOs or COOs; 37% of responses were from CMOs, VPMAs, and medical directors; and the remaining 17% of responses were from other VPs or administrative directors.
Respondent and nonrespondent hospitals were statistically similar in terms of teaching status and participation in CHART. Hospital patient census, intensive care unit census, payer mix, and diagnosis‐related groupbased case‐mix revealed no statistically significant differences between groups (P > 0.05). Respondent hospitals tended to have fewer beds and were more often for‐profit compared to nonrespondents (P = 0.05 and P < 0.01, respectively).
Descriptive Characteristics of Hospitals with Hospitalists
Sixty‐four percent (n = 115) of hospital leaders stated that they utilized hospitalists for at least some patients. Hospitals with hospitalists were statistically more likely (P < 0.05) to be larger, a major teaching hospital, or a member of a voluntary quality reporting initiative (Table 1).
| Variable | Hospitals without Hospitalists (n = 64) [n (%)] | Hospitals with Hospitalists (n = 115) [n (%)] | P Value* |
|---|---|---|---|
| |||
| Hospital size (total number of beds) | |||
| 0‐99 | 33 (51.6) | 18 (15.7) | <0.001 |
| 100‐199 | 19 (29.7) | 32 (27.8) | |
| 200‐299 | 5 (7.8) | 23 (20.0) | |
| 300+ | 7 (10.9) | 42 (36.5) | |
| Hospital control | 0.12 | ||
| City/county | 8 (12.5) | 7 (6.1) | |
| District | 15 (23.4) | 17 (14.8) | |
| For‐profit | 10 (15.6) | 16 (13.9) | |
| Non‐profit | 31 (48.4) | 71 (61.7) | |
| University of California | 0 (0.0) | 4 (3.5) | |
| Teaching hospital | 8 (12.5) | 30 (26.1) | 0.03 |
| Member of voluntary quality reporting initiative | 27 (42.2) | 93 (80.9) | <0.001 |
Among all hospitals with hospitalists, 39% estimated that hospitalists cared for at least one‐half of admitted medical patients, and 7% stated that hospitalists cared for all patients. Twenty‐four percent of respondents were unable to provide a quantitative estimate of the percent of patients cared for by hospitalists. When asked about expectations of growth in the coming year, 57% of respondents with hospitalists expected to see increases in the number of hospitalists at their hospital, and none expected a decrease. Among the 64 respondent hospitals that currently did not have a hospitalist program, 44% (n = 28) of the hospital leaders felt hospitalists would be managing patients in the future. Of those, 93% felt this would occur within the next 2 years.
Reasons for Implementing Hospitalists
Hospital leaders reported that the most important reasons for implementing a hospitalist model included caring for uncovered patients (68%), decreasing hospital costs and length of stay (63%), and improving throughput in the emergency room (62%). We provide additional reasons in Figure 1. In addition, leaders often identified multiple factors in the decision to utilize hospitalists, including demand from primary care doctors, patient satisfaction, and quality improvement. Among the 28 hospitals that currently did not have hospitalists but anticipated that they would soon (data not shown), the need to improve quality was the most commonly cited reason (54% of respondents) for expecting to start a program within 2 years, followed by demand from primary care doctors (46% of respondents).

Clinical Practice of Hospitalists and Expectations for Future Growth
Hospitalists perform a wide array of clinical and nonclinical duties (Figure 2). In addition to general medical care, the most common clinical activities of hospitalists included screening medical admissions from the emergency room for appropriateness of admission and triaging to appropriate level of care (67%), triaging patients transferred from an outside hospital (72%), and comanaging surgical patients (66%). The most common nonclinical activity was participation in quality improvement activities (72%). Multivariable analyses demonstrated that the performance of the most prevalent activities was not usually associated with the year of hospitalist implementation or hospital characteristics. An exception was that newly initiated programs had a statistically significant decreased odds of involvement in clinical guideline development (odds ratio [OR], 0.3; 95% confidence interval [CI], 0.1‐0.9) and a trend toward decreased leadership in quality improvement (OR, 0.3; 95% CI, 0.1‐1.1). Hospitalists at teaching hospitals had increased odds of managing patient transfers (OR, 4.7; 95% CI, 1.0‐21.2), whereas for‐profit hospitals had lower odds of screening patients in the emergency room (OR, 0.1; 95% CI, 0.0‐0.7).
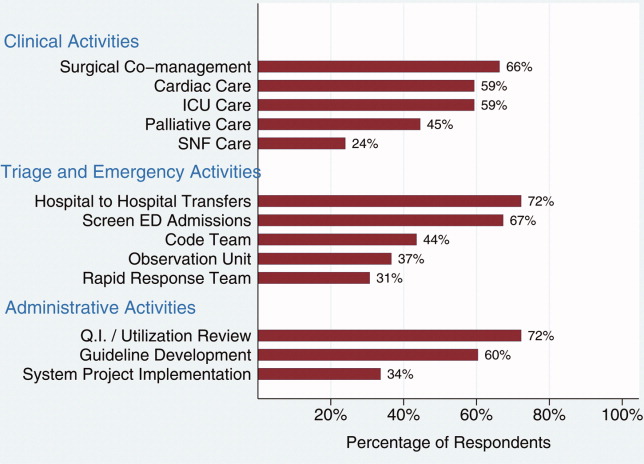
Among those hospitals with hospitalists who were not presently involved in any of the above activities, there was a widespread interest among hospital leaders to have their hospitalist group(s) lead or participate in them (Figure 3). The most commonly cited activities included participation in inpatient clinical guideline development (85%), implementation of system‐wide projects (81%) (eg, computerized physician order entry system), participation on a rapid response team (80%), and caring for patients in an observation unit (80%).
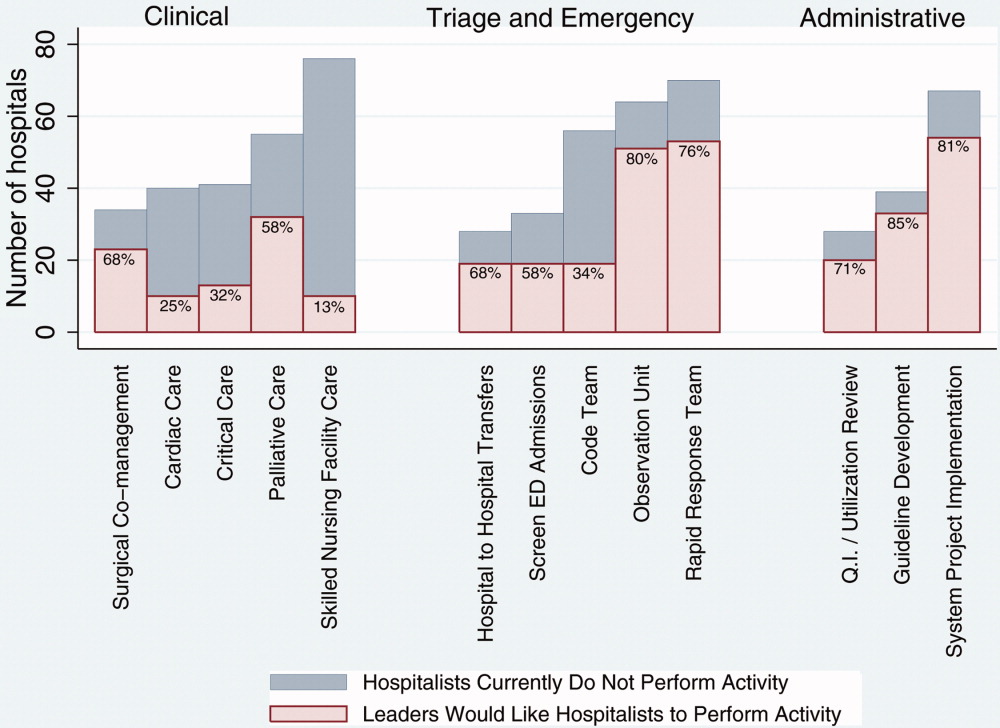
Training and Certification for Hospitalists
About two‐thirds (64%) of hospital leaders with a hospitalist group(s) agreed or strongly agreed that hospitalists should have additional training and/or certification. Seventeen percent were undecided, whereas 11% either disagreed or strongly disagreed, and the remaining 8% did not provide an opinion.
Discussion
Most California hospital leaders reported utilizing hospitalists, and a substantial number of those without a hospitalist service plan to implement one in the next 5 years. Our data suggest that the number of hospitalists and their roles will continue to expand, with quality improvement activities and participation in clinical roles outside of general medical care being key priorities for future growth. Interestingly, much of this growth may not be catalyzed by past drivers (such as need to contain costs or length of stay) but by increasing need to implement quality and safety initiatives, as well as demand from other physicians. As a result, the field of hospital medicine will grow in numbers and breadth of practice. Defining the typical practice of a hospitalist may become more challenging.
Consistent with previous work,11, 16 our data suggest widespread adoption of hospitalists. While our data demonstrates that academic hospitals in California were more likely to have hospitalists, it is also important to note that hospitalist systems were widespread across a wide range of hospital sizes and ownership types. The prevalence appears likely to increase in the future. None of the hospitals surveyed planned to eliminate or reduce the size of their programs. Among hospitals without a hospitalist program, 44% (n = 28) reported they were going to implement a hospitalist group within the next 2 years. Future workforce development must consider this growth in order to increase physician supply to meet the demands of hospitalist growth.
Consistent with prior surveys of hospitalists and the healthcare marketplace,13, 15, 16, 25 our survey of hospital leaders suggests that the care of uncovered patients and the goal of improving hospital efficiency are key reasons for implementing hospitalists. Although these are important, we found that hospital leaders have additional intentions when implementing or expanding hospitalist systems, including improving patient satisfaction and quality. Although quality improvement activities were not among the most common reasons that leaders originally implemented programs, the most established programs had increased odds (relative to the most recently implemented programs) of leading quality improvement and clinical guideline activities. This may reflect a natural progression over time for hospitalist groups to develop from a patient‐focused clinical role to one that incorporates responsibilities that increasingly impact the hospital system and organization. The interest in utilizing hospitalists for leadership in quality improvement was widely expressed among those leaders who had yet to utilize hospitalists. Interestingly, this driver remains even as evidence for whether hospitalist practices produce measurable differences in care outcomes is mixed.26, 27 Nevertheless, hospital leaders are under increasing pressure to improve quality and safety (driven by public reporting and pay‐for‐performance initiatives), and many leaders appear to believe that hospitalists will be a key part of the solution.13, 28
In addition to quality improvement, continued demand for hospitalists may result from growing clinical demands, including clinical support for medical specialists and surgeons. A majority of leaders acknowledged current or future interest in having hospitalists comanage surgical patients, with the hope that such practices will improve surgeons' productivity and clinical outcomes.16, 29, 30 In addition, hospitalists may address potential shortages in specialty areas. For example, having hospitalists participate in critical care may partly ameliorate the impact of a large national shortage of critical care physicians.12, 31 If hospitalists are to assume major roles in the provision of critical care (particularly if not comanaging patients with intensivists), they may require some augmented training in the intensive care unit.
Our results paint a picture of a rapidly expanding field, both in scope and in number. Hospitalists appear to be performing a wide range of clinical, triage, and administrative activities, and there is demand among hospital leadership for hospitalists to take on additional responsibilities. Interestingly, it appears that participation in most clinical and nonclinical activities occur across the spectrum of organizational characteristics, and demand is not limited only to large or academic hospitals. Participation in such a broad array of activities brings into question the need for additional training and certification of hospitalists. While the need for hospitalists to receive additional training has been posited in the past, our data suggest there is a perceived need from the hospital administration as well. This additional training (and subsequent certification) would likely need to encompass many of the practices we have identified as core to hospitalists' practice. In addition to ensuring adequate training, policymakers will need to consider the supply of physicians necessary to meet the present and, likely, future demand for hospitalists. This is especially important in light of recent evidence of continued decreasing interest in general internal medicine, the main pool from which hospitalists are drawn.32 A shortage of internists is likely to influence expansion plans by hospitals in terms of activities in which leaders ask hospitalists to engage, or the number of hospitalists overall.
Our study has several limitations. First, a substantial number of nonrespondents may potentially bias our results. Despite this, we have drawn results across a wide range of hospitals, and the characteristics of responders and nonresponders are very similar. In addition, our study exclusively examines the responses of leaders in California hospitals. Although we sampled a large and heterogeneous group of hospitals, these results may not be entirely generalizable to other regions. As a cross‐sectional survey of hospital executives, responses are subject to leaders' recall. In particular, the reasons for implementation provided by leaders of older programs may potentially reflect contemporary reasons for hospitalist utilization rather than the original reasons. Another limitation of our study is our focus on hospital leaders' reports of prevalence and the clinical/nonclinical activities of hospitalists. Since senior executives often help begin a program but become less involved over time, executives' answers may well underestimate the prevalence of hospitalists and the breadth of their clinical practices, particularly in more mature programs. For instance, hospitalists that are part of an independent practice association (IPA) may provide functions for the IPA group that the hospital itself does not direct or fund. This effect may be more pronounced among the largest hospitals that may be organizationally complex, perhaps making suspect the responses from 7 very large hospitals that claimed not to utilize hospitalists. Finally, we collected information regarding the reasons for hospitalist group implementation and the services they provide by means of a prespecified list of answers. Although a thorough literature review and expert advisory panel guided the development of prespecified lists, they are by no means exhaustive. As a result, our prespecified lists may miss some important reasons for implementation, or services provided by hospitalists, that one could identify using an open‐ended survey. In addition, in the case of multiple responses from hospital leaders, we gave equal weight to responses. This has the effect of overestimating the weight of reasons that were less important, while underestimating the weight of reasons that may have been more important in the decision making process of implementing a hospitalist group.
While nonhospitalist physicians continue to provide a considerable proportion of hospital care for medical patients, hospitalists are assuming a larger role in the care of a growing number of patients in the hospital. The ongoing need to increase care efficiency drives some of this growth, but pressures to improve care quality and demand from other physicians are increasingly important drivers of growth. As the field grows and clinical roles diversify, there must be increased focus placed on the training requirements of hospitalists to reflect the scope of current practice and meet hospital needs to improve quality and efficiency.
Acknowledgements
The authors acknowledge Teresa Chipps, BS, Department of Medicine (General Internal Medicine and Public Health), Center for Health Services Research, Vanderbilt University, Nashville, TN, for her administrative and editorial assistance in the preparation of the manuscript.
- ,,,,,.Implementation of a hospitalist system in a large health maintenance organization: the Kaiser Permanente experience.Ann Intern Med.1999;130:355–359.
- ,,.Primary care family physicians and 2 hospitalist models: comparison of outcomes, processes, and costs.J Fam Pract.2002;51:1021–1027.
- ,.Effects of an HMO hospitalist program on inpatient utilization.Am J Manag Care.2001;7:1051–1057.
- ,.The emerging role of “hospitalists” in the American health care system.N Engl J Med.1996;335:514–517.
- .The hospitalist model: perspectives of the patient, the internist, and internal medicine.Ann Intern Med.1999;130:368–372.
- ,,,.The changing face of managed care.Health Aff.2002;21:11–23.
- .The death of managed care: a regulatory autopsy.J Health Polit Policy Law.2005;30:427–452.
- .The end of managed care.JAMA.2001;285:2622–2628.
- ,,,,,.Trends in market demand for internal medicine 1999 to 2004: an analysis of physician job advertisements.J Gen Intern Med.2006;21:1079–1085.
- ,,,.Growth in the care of older patients by hospitalists in the United States.N Engl J Med.2009;360:1102–1112.
- ,,,.The status of hospital medicine groups in the United States.J Hosp Med.2006;1:75–80.
- .Leapfrog and critical care: evidence‐ and reality‐based intensive care for the 21st century.Am J Med.2004;116:188–193.
- ,,,.Health care market trends and the evolution of hospitalist use and roles.J Gen Intern Med.2005;20:101–107.
- ,,,.Financial pressures spur physician entrepreneurialism.Health Aff.2004;23:70–81.
- ,,,,,.Physician attitudes toward and prevalence of the hospitalist model of care: results of a national survey.Am J Med.2000;109:648–653.
- ,,,.Hospitalists and care transitions: the divorce of inpatient and outpatient care.Health Aff.2008;27:1315–1327.
- Society of Hospital Medicine. 2005‐2006 SHM Survey: State of the Hospital Medicine Movement. Available at: http://dev.hospitalmedicine.org/AM/Template.cfm?Section=Survey2:102–104.
- ,,,.Hospitalists' perceptions of their residency training needs: results of a national survey.Am J Med.2001;111:247–254.
- ,,,,.The spectrum of community‐based hospitalist practice: A call to tailor internal medicine residency training.Arch Intern Med.2007;167:727–728.
- ,,,,.Fulfilling the promise of hospital medicine: tailoring internal medicine training to address hospitalists' needs.J Gen Intern Med.2008;23:1110–1115.
- ,,,.Hospitalists and the practice of inpatient medicine: results of a survey of the national association of inpatient physicians.Ann Intern Med.1999;130:343–349.
- Office of Statewide Health Planning and Development. Healthcare Information Division ‐ Data Products. Available at: http://www.oshpd.ca.gov/HID/DataFlow/HospMain.html. Accessed May2009.
- ,.Relaxing the rule of ten events per variable in logistic and Cox regression.Am J Epidemiol.2007;165:710–718.
- ,,.Hospital‐physician relations: cooperation, competition, or separation?Health Aff.2007;26:w31–w43.
- ,,,,,.Outcomes of care by hospitalists, general internists, and family physicians.N Engl J Med.2007;357:2589–2600.
- ,,, et al.Quality of care for decompensated heart failure: comparable performance between academic hospitalists and non‐hospitalists.J Gen Intern Med.2008;23:1399–1406.
- ,,.The impact of quality‐reporting programs on hospital operations.Health Aff.2006;25:1412–1422.
- ,,, et al.Medical and surgical comanagement after elective hip and knee arthroplasty: a randomized, controlled trial.Ann Intern Med.2004;141:28–38.
- ,,.Associations between the hospitalist model of care and quality‐of‐care‐related outcomes in patients undergoing hip fracture surgery.Mayo Clin Proc.2006;81:28–31.
- ,,, et al.The critical care crisis in the United States: a report from the profession.Chest.2004;125:1514–1517.
- ,,, et al.Factors associated with medical students' career choices regarding internal medicine.JAMA.2008;300:1154–1164.
In the late 1990s, hospitalist systems grew rapidly in an environment where cost containment was paramount, complexity of patients increased, and outpatient practices experienced increasing productivity and efficiency pressures.15 While the healthcare delivery environment has changed significantly since that time,68 hospitalists have continued to become more common. In fact, the field's present size of more than 25,000 has already exceeded early projections, and there are no signs of slackening demand.911
Growth has been attributed to primary care physicians' increasing focus on outpatient care, hospitals' response to financial pressures, and the need to facilitate improved communication among various hospital care providers.1216 Hospital leadership has played a similarly important role in fueling the growth of hospitalists, particularly since the vast majority of programs require and receive institutional (usually hospital) support.17 However, the factors that continue to influence leaders' decisions to utilize hospitalists and the current and future needs that hospitalists are fulfilling are unknown. Each of these factors is likely to impact growth of the field, as well as the clinical and organizational identity of hospitalists. In addition, an understanding of the market demand for hospitalists' competencies and the roles they play in the hospital may inform any changes in board certification and training for hospitalists.11, 1821
To gain a more complete understanding of a key part of the engine driving the growth of hospitalists, we performed a cross‐sectional survey of California hospital leaders who were involved with the funding or administration of their hospitalist groups. Our survey aimed to understand: (1) the prevalence of hospitalist groups in California hospitals, (2) hospital leaders' rationale for initiating the use of hospitalists, (3) the scope of clinical and nonclinical practice of hospitalists, and 4) hospital leaders' perspective on the need for further training and/or certification.
Materials and Methods
Sites and Subjects
We targeted all nonfederal, nonspecialty, acute care hospitals in California (n = 334) for this survey. We limited our survey to California in order to maximize our local resources and to improve implementation of and response to the survey. Additionally, California's size and diversity gives it disproportionate impact and potential generalizability. At each site, we focused our efforts on identifying and surveying executives or administrative leaders involved in organizational and staff decisions, specifically the decision whether or not to hire and/or fund a hospitalist program and potentially direct its activities (described in more detail below). The University of California, San Francisco, Committee on Human Research approved the research protocol.
We identified hospital leaders at each site by merging information from multiple sources. These included the American Hospital Association database, the California Hospital Association, the Hospital Association of Southern California (HASC), the California Health Care Safety Net Institute, and individual hospital websites.
Survey Development
Our survey was based upon instruments used in previous research examining hospital medicine group organizational structure15, 22 and enhanced with questions developed by the research team (A.D.A., E.E.V., R.M.W.). The survey was pretested in an advisory group of 5 hospital Chief Executive Officers (CEOs), Chief Medical Officers (CMOs), and Vice Presidents for Medical Affairs (VPMAs) from sites across California. Based on their input, we removed, edited, or added questions to our survey. This advisory group also helped the research team design our survey process.
Our final survey defined a hospitalist as a physician who spends all or the majority of his or her clinical, administrative, educational, or research activities in the care of hospitalized patients.4 We collected data in 4 areas: (1) We asked hospital leaders to confirm the presence or absence of at least 1 hospitalist group practicing within the surveyed hospital. We also asked for the year the first hospitalist group began practicing within the specified hospital. (2) We asked hospital leaders to indicate, among a prespecified list of 11 choices, the reason(s) they implemented a hospitalist group at the surveyed hospital. Surveyed categories included: (a) care for uncovered patients (patients without an identified doctor and/or uninsured), (b) improve costs, (c) improve length of stay, (d) improve emergency department throughput, (e) primary care provider demand, (f) improve patient satisfaction, (g) improve emergency room staffing, (h) quality improvement needs, (i) specialist physician demand, (j) overnight coverage, and (k) surgical comanagement. Due to the close relationship between cost and length of stay, we combined these 2 categories into a single category for reporting and analysis. This resulted in 10 final categories. We asked leaders who did not identify a practicing hospitalist group about the likelihood of hospitalists practicing at their hospital within the next 5 years and the reason(s) for future implementation. (3) We asked leaders to describe the services currently provided among a prespecified list of clinical care duties that go beyond the scope of inpatient general internal medicine (eg, surgical comanagement, rapid response team leadership) as well as nonclinical duties (eg, quality improvement activities, systems project implementation). If hospitalists did not currently provide the identified service, we asked leaders to indicate if they would be inclined to involve hospitalists in the specified service in the future. (4) Finally, we asked hospital leaders their opinion regarding the need for further training or certification for hospitalists.
Survey Protocol
We administered surveys between October 2006 and April 2007. We initially emailed the survey. We repeated this process for nonrespondents at intervals of 1 to 3 weeks after the initial emailing. Next, we sent nonrespondents a physical mailing with a reminder letter. Finally, we made phone calls to those who had not responded within 4 weeks of the last mailed letter. We asked survey recipients to respond only if they felt they had an adequate working knowledge of the hospitalist service at their hospital. If they did not feel they could adequately answer all questions, we allowed them to forward the instrument to others with a better working knowledge of the service.
Because we allowed recipients to forward the survey, we occasionally received 2 surveys from 1 site. In this case, we selected the survey according to the following prioritization order: (1) CEOs/COOs, (2) CMOs, (3) VPMAs, and (4) other vice presidents (VPs) or executive/administrative leaders with staff organization knowledge and responsibilities.
Hospital Descriptive Data
We obtained hospital organizational data from the California Office of Statewide Health Planning and Development's (OSHPD) publicly available Case Mix Index Data, hospital Annual Financial Data, aggregated Patient Discharge Data, and Utilization Data from 2006.23 Organizational characteristics included hospital size, location, profit status, payor mix, and diagnosis‐related groupbased case‐mix. Teaching status was determined from the 2005 American Hospital Association database. Membership status in California's voluntary quality reporting initiative, California Hospital Assessment and Reporting Taskforce (CHART), was publicly available at
Statistical Analyses
We performed univariable analyses to characterize survey respondents, followed by bivariable analyses to compare hospital characteristics and patient mix of responding and nonresponding hospitals. We used similar methods to characterize respondent hospitals with and without at least 1 hospitalist group. We compared continuous data with the Students t tests or Mann‐Whitney tests as appropriate and categorical data with chi‐square tests.
We then summarized the number of times a specific rationale was cited by hospital leaders for implementing a hospitalist group. Among hospitals that did not have a hospitalist system in place at the time of the survey, we asked if they were planning on starting one within the next 5 years. For these hospitals, we used content analysis to summarize open‐ended responses in order to understand factors that are currently influencing these hospital leaders to consider implementing a hospitalist group.
Next, we aimed to understand what clinical and nonclinical roles hospitalists were performing in hospitals with established hospitalist programs. Clinical activities were divided into general clinical areas, triage/emergency‐related, or administrative activities. First, we summarized the number and percent of programs performing each clinical and nonclinical activity. This was followed by logistic regression analyses to assess whether the time period that hospitalist groups began practicing or additional hospital characteristics predicted the performance of individual hospitalist activities. To guard against overfitting of models, analyses were limited to rationales that were cited a minimum of 50 times.24 Hospital factors were selected on the basis of face validity and advisory group input and included hospital bed size, ownership status (public vs. private), teaching status, and membership status in CHART. We divided the year of hospitalist program implementation into 3 time periods: (1) before 2002, (2) between 2002 and 2004, and (3) 2005 or later.
Finally, we described the percentage of hospitals that favored having their hospitalist group(s) perform each of the identified clinical or nonclinical activities, if they were not already performing them. We performed analyses with statistical software (Stata Version 9.2, College Station, TX).
Results
Respondent Characteristics
We received 200 survey responses. Of those, we excluded 15 duplicates (eg, a survey from both the CEO and VPMA) and 6 responses identified as coming from hospitalists who did not have a leadership position in the hospital. Thus, the final hospital leader survey response rate was 54% (n = 179). Forty‐six percent of the final responses were from CEOs or COOs; 37% of responses were from CMOs, VPMAs, and medical directors; and the remaining 17% of responses were from other VPs or administrative directors.
Respondent and nonrespondent hospitals were statistically similar in terms of teaching status and participation in CHART. Hospital patient census, intensive care unit census, payer mix, and diagnosis‐related groupbased case‐mix revealed no statistically significant differences between groups (P > 0.05). Respondent hospitals tended to have fewer beds and were more often for‐profit compared to nonrespondents (P = 0.05 and P < 0.01, respectively).
Descriptive Characteristics of Hospitals with Hospitalists
Sixty‐four percent (n = 115) of hospital leaders stated that they utilized hospitalists for at least some patients. Hospitals with hospitalists were statistically more likely (P < 0.05) to be larger, a major teaching hospital, or a member of a voluntary quality reporting initiative (Table 1).
| Variable | Hospitals without Hospitalists (n = 64) [n (%)] | Hospitals with Hospitalists (n = 115) [n (%)] | P Value* |
|---|---|---|---|
| |||
| Hospital size (total number of beds) | |||
| 0‐99 | 33 (51.6) | 18 (15.7) | <0.001 |
| 100‐199 | 19 (29.7) | 32 (27.8) | |
| 200‐299 | 5 (7.8) | 23 (20.0) | |
| 300+ | 7 (10.9) | 42 (36.5) | |
| Hospital control | 0.12 | ||
| City/county | 8 (12.5) | 7 (6.1) | |
| District | 15 (23.4) | 17 (14.8) | |
| For‐profit | 10 (15.6) | 16 (13.9) | |
| Non‐profit | 31 (48.4) | 71 (61.7) | |
| University of California | 0 (0.0) | 4 (3.5) | |
| Teaching hospital | 8 (12.5) | 30 (26.1) | 0.03 |
| Member of voluntary quality reporting initiative | 27 (42.2) | 93 (80.9) | <0.001 |
Among all hospitals with hospitalists, 39% estimated that hospitalists cared for at least one‐half of admitted medical patients, and 7% stated that hospitalists cared for all patients. Twenty‐four percent of respondents were unable to provide a quantitative estimate of the percent of patients cared for by hospitalists. When asked about expectations of growth in the coming year, 57% of respondents with hospitalists expected to see increases in the number of hospitalists at their hospital, and none expected a decrease. Among the 64 respondent hospitals that currently did not have a hospitalist program, 44% (n = 28) of the hospital leaders felt hospitalists would be managing patients in the future. Of those, 93% felt this would occur within the next 2 years.
Reasons for Implementing Hospitalists
Hospital leaders reported that the most important reasons for implementing a hospitalist model included caring for uncovered patients (68%), decreasing hospital costs and length of stay (63%), and improving throughput in the emergency room (62%). We provide additional reasons in Figure 1. In addition, leaders often identified multiple factors in the decision to utilize hospitalists, including demand from primary care doctors, patient satisfaction, and quality improvement. Among the 28 hospitals that currently did not have hospitalists but anticipated that they would soon (data not shown), the need to improve quality was the most commonly cited reason (54% of respondents) for expecting to start a program within 2 years, followed by demand from primary care doctors (46% of respondents).
Clinical Practice of Hospitalists and Expectations for Future Growth
Hospitalists perform a wide array of clinical and nonclinical duties (Figure 2). In addition to general medical care, the most common clinical activities of hospitalists included screening medical admissions from the emergency room for appropriateness of admission and triaging to appropriate level of care (67%), triaging patients transferred from an outside hospital (72%), and comanaging surgical patients (66%). The most common nonclinical activity was participation in quality improvement activities (72%). Multivariable analyses demonstrated that the performance of the most prevalent activities was not usually associated with the year of hospitalist implementation or hospital characteristics. An exception was that newly initiated programs had a statistically significant decreased odds of involvement in clinical guideline development (odds ratio [OR], 0.3; 95% confidence interval [CI], 0.1‐0.9) and a trend toward decreased leadership in quality improvement (OR, 0.3; 95% CI, 0.1‐1.1). Hospitalists at teaching hospitals had increased odds of managing patient transfers (OR, 4.7; 95% CI, 1.0‐21.2), whereas for‐profit hospitals had lower odds of screening patients in the emergency room (OR, 0.1; 95% CI, 0.0‐0.7).
Among those hospitals with hospitalists who were not presently involved in any of the above activities, there was a widespread interest among hospital leaders to have their hospitalist group(s) lead or participate in them (Figure 3). The most commonly cited activities included participation in inpatient clinical guideline development (85%), implementation of system‐wide projects (81%) (eg, computerized physician order entry system), participation on a rapid response team (80%), and caring for patients in an observation unit (80%).
Training and Certification for Hospitalists
About two‐thirds (64%) of hospital leaders with a hospitalist group(s) agreed or strongly agreed that hospitalists should have additional training and/or certification. Seventeen percent were undecided, whereas 11% either disagreed or strongly disagreed, and the remaining 8% did not provide an opinion.
Discussion
Most California hospital leaders reported utilizing hospitalists, and a substantial number of those without a hospitalist service plan to implement one in the next 5 years. Our data suggest that the number of hospitalists and their roles will continue to expand, with quality improvement activities and participation in clinical roles outside of general medical care being key priorities for future growth. Interestingly, much of this growth may not be catalyzed by past drivers (such as need to contain costs or length of stay) but by increasing need to implement quality and safety initiatives, as well as demand from other physicians. As a result, the field of hospital medicine will grow in numbers and breadth of practice. Defining the typical practice of a hospitalist may become more challenging.
Consistent with previous work,11, 16 our data suggest widespread adoption of hospitalists. While our data demonstrates that academic hospitals in California were more likely to have hospitalists, it is also important to note that hospitalist systems were widespread across a wide range of hospital sizes and ownership types. The prevalence appears likely to increase in the future. None of the hospitals surveyed planned to eliminate or reduce the size of their programs. Among hospitals without a hospitalist program, 44% (n = 28) reported they were going to implement a hospitalist group within the next 2 years. Future workforce development must consider this growth in order to increase physician supply to meet the demands of hospitalist growth.
Consistent with prior surveys of hospitalists and the healthcare marketplace,13, 15, 16, 25 our survey of hospital leaders suggests that the care of uncovered patients and the goal of improving hospital efficiency are key reasons for implementing hospitalists. Although these are important, we found that hospital leaders have additional intentions when implementing or expanding hospitalist systems, including improving patient satisfaction and quality. Although quality improvement activities were not among the most common reasons that leaders originally implemented programs, the most established programs had increased odds (relative to the most recently implemented programs) of leading quality improvement and clinical guideline activities. This may reflect a natural progression over time for hospitalist groups to develop from a patient‐focused clinical role to one that incorporates responsibilities that increasingly impact the hospital system and organization. The interest in utilizing hospitalists for leadership in quality improvement was widely expressed among those leaders who had yet to utilize hospitalists. Interestingly, this driver remains even as evidence for whether hospitalist practices produce measurable differences in care outcomes is mixed.26, 27 Nevertheless, hospital leaders are under increasing pressure to improve quality and safety (driven by public reporting and pay‐for‐performance initiatives), and many leaders appear to believe that hospitalists will be a key part of the solution.13, 28
In addition to quality improvement, continued demand for hospitalists may result from growing clinical demands, including clinical support for medical specialists and surgeons. A majority of leaders acknowledged current or future interest in having hospitalists comanage surgical patients, with the hope that such practices will improve surgeons' productivity and clinical outcomes.16, 29, 30 In addition, hospitalists may address potential shortages in specialty areas. For example, having hospitalists participate in critical care may partly ameliorate the impact of a large national shortage of critical care physicians.12, 31 If hospitalists are to assume major roles in the provision of critical care (particularly if not comanaging patients with intensivists), they may require some augmented training in the intensive care unit.
Our results paint a picture of a rapidly expanding field, both in scope and in number. Hospitalists appear to be performing a wide range of clinical, triage, and administrative activities, and there is demand among hospital leadership for hospitalists to take on additional responsibilities. Interestingly, it appears that participation in most clinical and nonclinical activities occur across the spectrum of organizational characteristics, and demand is not limited only to large or academic hospitals. Participation in such a broad array of activities brings into question the need for additional training and certification of hospitalists. While the need for hospitalists to receive additional training has been posited in the past, our data suggest there is a perceived need from the hospital administration as well. This additional training (and subsequent certification) would likely need to encompass many of the practices we have identified as core to hospitalists' practice. In addition to ensuring adequate training, policymakers will need to consider the supply of physicians necessary to meet the present and, likely, future demand for hospitalists. This is especially important in light of recent evidence of continued decreasing interest in general internal medicine, the main pool from which hospitalists are drawn.32 A shortage of internists is likely to influence expansion plans by hospitals in terms of activities in which leaders ask hospitalists to engage, or the number of hospitalists overall.
Our study has several limitations. First, a substantial number of nonrespondents may potentially bias our results. Despite this, we have drawn results across a wide range of hospitals, and the characteristics of responders and nonresponders are very similar. In addition, our study exclusively examines the responses of leaders in California hospitals. Although we sampled a large and heterogeneous group of hospitals, these results may not be entirely generalizable to other regions. As a cross‐sectional survey of hospital executives, responses are subject to leaders' recall. In particular, the reasons for implementation provided by leaders of older programs may potentially reflect contemporary reasons for hospitalist utilization rather than the original reasons. Another limitation of our study is our focus on hospital leaders' reports of prevalence and the clinical/nonclinical activities of hospitalists. Since senior executives often help begin a program but become less involved over time, executives' answers may well underestimate the prevalence of hospitalists and the breadth of their clinical practices, particularly in more mature programs. For instance, hospitalists that are part of an independent practice association (IPA) may provide functions for the IPA group that the hospital itself does not direct or fund. This effect may be more pronounced among the largest hospitals that may be organizationally complex, perhaps making suspect the responses from 7 very large hospitals that claimed not to utilize hospitalists. Finally, we collected information regarding the reasons for hospitalist group implementation and the services they provide by means of a prespecified list of answers. Although a thorough literature review and expert advisory panel guided the development of prespecified lists, they are by no means exhaustive. As a result, our prespecified lists may miss some important reasons for implementation, or services provided by hospitalists, that one could identify using an open‐ended survey. In addition, in the case of multiple responses from hospital leaders, we gave equal weight to responses. This has the effect of overestimating the weight of reasons that were less important, while underestimating the weight of reasons that may have been more important in the decision making process of implementing a hospitalist group.
While nonhospitalist physicians continue to provide a considerable proportion of hospital care for medical patients, hospitalists are assuming a larger role in the care of a growing number of patients in the hospital. The ongoing need to increase care efficiency drives some of this growth, but pressures to improve care quality and demand from other physicians are increasingly important drivers of growth. As the field grows and clinical roles diversify, there must be increased focus placed on the training requirements of hospitalists to reflect the scope of current practice and meet hospital needs to improve quality and efficiency.
Acknowledgements
The authors acknowledge Teresa Chipps, BS, Department of Medicine (General Internal Medicine and Public Health), Center for Health Services Research, Vanderbilt University, Nashville, TN, for her administrative and editorial assistance in the preparation of the manuscript.
- ,,,,,.Implementation of a hospitalist system in a large health maintenance organization: the Kaiser Permanente experience.Ann Intern Med.1999;130:355–359.
- ,,.Primary care family physicians and 2 hospitalist models: comparison of outcomes, processes, and costs.J Fam Pract.2002;51:1021–1027.
- ,.Effects of an HMO hospitalist program on inpatient utilization.Am J Manag Care.2001;7:1051–1057.
- ,.The emerging role of “hospitalists” in the American health care system.N Engl J Med.1996;335:514–517.
- .The hospitalist model: perspectives of the patient, the internist, and internal medicine.Ann Intern Med.1999;130:368–372.
- ,,,.The changing face of managed care.Health Aff.2002;21:11–23.
- .The death of managed care: a regulatory autopsy.J Health Polit Policy Law.2005;30:427–452.
- .The end of managed care.JAMA.2001;285:2622–2628.
- ,,,,,.Trends in market demand for internal medicine 1999 to 2004: an analysis of physician job advertisements.J Gen Intern Med.2006;21:1079–1085.
- ,,,.Growth in the care of older patients by hospitalists in the United States.N Engl J Med.2009;360:1102–1112.
- ,,,.The status of hospital medicine groups in the United States.J Hosp Med.2006;1:75–80.
- .Leapfrog and critical care: evidence‐ and reality‐based intensive care for the 21st century.Am J Med.2004;116:188–193.
- ,,,.Health care market trends and the evolution of hospitalist use and roles.J Gen Intern Med.2005;20:101–107.
- ,,,.Financial pressures spur physician entrepreneurialism.Health Aff.2004;23:70–81.
- ,,,,,.Physician attitudes toward and prevalence of the hospitalist model of care: results of a national survey.Am J Med.2000;109:648–653.
- ,,,.Hospitalists and care transitions: the divorce of inpatient and outpatient care.Health Aff.2008;27:1315–1327.
- Society of Hospital Medicine. 2005‐2006 SHM Survey: State of the Hospital Medicine Movement. Available at: http://dev.hospitalmedicine.org/AM/Template.cfm?Section=Survey2:102–104.
- ,,,.Hospitalists' perceptions of their residency training needs: results of a national survey.Am J Med.2001;111:247–254.
- ,,,,.The spectrum of community‐based hospitalist practice: A call to tailor internal medicine residency training.Arch Intern Med.2007;167:727–728.
- ,,,,.Fulfilling the promise of hospital medicine: tailoring internal medicine training to address hospitalists' needs.J Gen Intern Med.2008;23:1110–1115.
- ,,,.Hospitalists and the practice of inpatient medicine: results of a survey of the national association of inpatient physicians.Ann Intern Med.1999;130:343–349.
- Office of Statewide Health Planning and Development. Healthcare Information Division ‐ Data Products. Available at: http://www.oshpd.ca.gov/HID/DataFlow/HospMain.html. Accessed May2009.
- ,.Relaxing the rule of ten events per variable in logistic and Cox regression.Am J Epidemiol.2007;165:710–718.
- ,,.Hospital‐physician relations: cooperation, competition, or separation?Health Aff.2007;26:w31–w43.
- ,,,,,.Outcomes of care by hospitalists, general internists, and family physicians.N Engl J Med.2007;357:2589–2600.
- ,,, et al.Quality of care for decompensated heart failure: comparable performance between academic hospitalists and non‐hospitalists.J Gen Intern Med.2008;23:1399–1406.
- ,,.The impact of quality‐reporting programs on hospital operations.Health Aff.2006;25:1412–1422.
- ,,, et al.Medical and surgical comanagement after elective hip and knee arthroplasty: a randomized, controlled trial.Ann Intern Med.2004;141:28–38.
- ,,.Associations between the hospitalist model of care and quality‐of‐care‐related outcomes in patients undergoing hip fracture surgery.Mayo Clin Proc.2006;81:28–31.
- ,,, et al.The critical care crisis in the United States: a report from the profession.Chest.2004;125:1514–1517.
- ,,, et al.Factors associated with medical students' career choices regarding internal medicine.JAMA.2008;300:1154–1164.
Copyright © 2009 Society of Hospital Medicine