User login
Racial and Ethnic Disparities in Discharge Opioid Prescribing From a Hospital Medicine Service
Within the nationwide effort to combat the opioid epidemic and reduce opioid prescribing, researchers have described different prescribing patterns for non-White racial and ethnic groups, including Black and LatinX populations. This remains a largely unexplored area within hospital medicine. Earlier studies of racial disparities demonstrate how some patients are assessed less often for pain and prescribed fewer opioids from the emergency department, surgical settings, and outpatient primary care practices. Researchers also have documented racial and ethnic disparities in analgesia for cancer pain and chronic noncancer pain.1-11 Studies have demonstrated that White patients are more likely to receive opioid prescriptions compared with Black patients. Even with similar documented pain scores, there is evidence that Black patients receive fewer analgesics compared with White patients. For example, a recent study found that Black and Hispanic patients presenting to the emergency room for renal colic received less opioid medication compared with White patients.3 A study across 22 sites in Northern California found that racial minorities with long-bone fractures received fewer opioids at discharge than White patients.1
It is unknown whether differential prescribing patterns by race exist among patients hospitalized on general medicine services. The objective of our study was to assess whether race and ethnicity were associated with the likelihood of opioids being prescribed and the duration of opioids prescribed when these patients are discharged from the hospital. Quantifying and seeking to understand these differences are the first steps toward ensuring racial and ethnic health equity in patient care.
METHODS
Study Population and Data Sources
We identified all adults (age ≥18 years) discharged from the acute care inpatient general medicine services between June 1, 2012, and November 30, 2018, at the University of California, San Francisco (UCSF) Helen Diller Medical Center at Parnassus Heights, a 785-bed urban academic teaching hospital. All data were obtained from the hospital’s Epic-based electronic medical record (Epic Systems Corporation). Data elements were extracted from Clarity, the relationship database that stores Epic inpatient data. Patients discharged from the inpatient cardiology or bone marrow transplant services were not included. We excluded patients who did not receive opioids in the last 24 hours of their hospitalization. Patients with cancer-related pain diagnoses or sickle cell disease pain crises and patients who were discharged to hospice or followed by palliative care were excluded from the study based on International Classification of Diseases, Tenth Revision (ICD-10) codes (available on request) or service codes, when available, or admitting provider electronic health record documentation (Appendix Figure 1). Palliative care and hospice patients have significantly different pain needs, with management often directed by specialists. Patients with sickle cell disease are disproportionately Black and have distinct opioid prescribing patterns.12,13 We also excluded discharge opioid prescriptions that were a resumption of the patient’s opioid prescription before admission based on medication documentation. Only new prescriptions signed by the discharging hospitalist, including different doses and formulations, were included in this study.
We performed a subgroup analysis of patients who were not prescribed opioids before their admission based on medication reconciliation but were started on opioids while hospitalized.
Primary Outcomes
We examined two primary outcomes: whether a patient received an opioid prescription at discharge, and, for patients prescribed opioids, the number of days prescribed. Days of opioids at discharge were calculated as total morphine milligram equivalents (MMEs) prescribed divided by MMEs administered during the final 24 hours of hospitalization. This metric was used as a patient-specific approach to calculating how long an opioid prescription will last after discharge, standardized according to the actual opioid requirements from hospitalization.14 If a patient was discharged with prescriptions for several opioids, the longest single prescription duration was used.
Primary Predictors
The primary predictor was the patient’s primary self-reported race/ethnicity, categorized as White, Black, LatinX, Asian, Native Hawaiian or other Pacific Islander, American Indian or Alaska Native, and other/unknown. Other/unknown included patients who were listed as other, declined, or who were otherwise unspecified. Self-reported race/ethnicity is obtained through reporting to the registrar. These race/ethnicity groupings were done in concordance with US Census Bureau definitions. Researchers classified patients as LatinX if they had Hispanic documented as their ethnicity, no matter their racial identification. These categorizations were chosen to be consistent with the existing literature, recognizing the role of a combined race/ethnicity definition for Hispanic or LatinX populations.15 These definitions of race/ethnicity are self-reported and reflect socially—not genetically defined—groupings.16 This variable serves as a surrogate for the structural factors that contribute to racism, the determining factor for racially disparate outcomes.17
Covariate Data Collection
Additional data were obtained regarding patient demographics, hospitalization factors, and medical diagnoses. Demographic factors included age, sex, and limited English proficiency (LEP) status. LEP was defined as having a primary language other than English and requiring an interpreter. Hospitalization factors included length of stay, whether they required intensive care unit (ICU) management, average daily MMEs administered during their entire hospitalization, MMEs administered during the final 24 hours of their hospitalization, whether the patient was on a teaching service or direct-care hospitalist service, their disposition on discharge, and year. Medical diagnosis variables included the adjusted Elixhauser Comorbidity Index based on ICD-10 codes; whether the patient was taking opioids at admission; and specific diagnoses of cancer, posttraumatic stress disorder (PTSD), and mood, anxiety, or psychotic disorder based on ICD-10 documentation.18
Statistical Analysis
All statistical analyses were performed using Stata software version 16 (StataCorp LP). Baseline demographic variables, hospitalization factors, and medical diagnosis variables were stratified by race/ethnicity. Within group comparisons were performed using chi-square or analysis of varianace (ANOVA) testing. For regression analyses, we fit two models. First, we fit a multivariable logistic regression model on all patients who received opioids during the last 24 hours of their hospitalization to examine the association between patient race/ethnicity and whether a patient received opioids at discharge, adjusting for additional patient, hospitalization, and medical covariates. Then we fit a negative binomial regression model on patients who were prescribed opioids at discharge to examine the association between patient race/ethnicity and the amount of opioids prescribed at discharge, adjusting for covariates. We used a negative binomial model because of the overdispersed distribution of discharge opioid prescriptions and only examined patients with an opioid prescription at discharge. We included the listed variables in our model because they were all found a priori to be associated with discharge opioid prescriptions.19 Instead of using days of opioids based on the last 24 hours, we performed a secondary analysis using the actual days of opioids supplied as the outcome. For example, a prescription of 12 tablets with every 6 hours dosing would be 3 days’ duration.
For both models, subgroup analyses were performed using the adjusted models restricted to patients newly prescribed opioids during their hospitalization and who were not previously taking opioids based on admission medication reconciliation. After testing for effect modification, this subgroup analysis was performed to reduce selection bias associated with earlier opioid use.
For all models, we reported predicted population opioid prescribing rates from the average marginal effects (AME).20 Marginal effects were used because ours was a population level study and the outcome of interest was relatively common, limiting the effective interpretation of odds ratios.21 Marginal effects allow us to observe the instantaneous effect a given independent variable has on a dependent variable, while holding all other variables constant. It is implemented using the margins command in Stata. Marginal effects enable us to present our results as differences in probabilities, which is a more accurate way to describe the differences found among patient groups. Further, marginal effects are less sensitive to changes in model specifications.22The UCSF Institutional Review Board for Human Subjects Research approved this study with a waiver of informed consent.
RESULTS
Unadjusted Results
We identified 10,953 patients who received opioids during the last 24 hours of hospitalization (see Appendix Figure 1 for study consort diagram). The patient population was 52.2% White, 18.4% Black, 11.5% Latinx, 10.1% Asian, 6.2% other/unknown, 0.9% Native Hawaiian/Other Pacific Islander, and 0.8% American Indian/Alaska Native (Table 1, Appendix Table 1). Black patients had fewer cancer diagnoses and the highest rate of prescribed opioids on admission. Asian patients were older and more likely to be female, and had higher rates of cancer, the highest median comorbidity index, and the smallest median daily MME during both the last 24 hours and total duration of hospitalization. Representative of general medicine patients, the most common principal discharge diagnoses in our dataset were pneumonia, cellulitis, altered mental status, sepsis, and abdominal pain.

Overall, 5541 (50.6%) patients who received opioids in the last 24 hours of their hospitalization received an opioid prescription at discharge. There were significant differences among racial/ethnic groups receiving an opioid prescription at discharge. Black patients were less likely to be discharged with an opioid compared with White patients (47.7% vs 50.3%; P < .001) (Table 2). The median discharge prescription duration for all patients was 9.3 days (interquartile range [IQR], 3.8-20.0). Black patients received the fewest median days of opioids at 7.5 days (IQR, 3.2-16.7) compared with White patients at 8.8 days (IQR, 3.7-20.0; P < .001) (Table 2).

Adjusted Regression Results
Demographic, clinical, and diagnosis specific factors were significantly associated with opioid prescriptions, including previous opioid use, sex, and a concurrent cancer diagnosis. There were fewer opioid prescriptions over time (Figure).
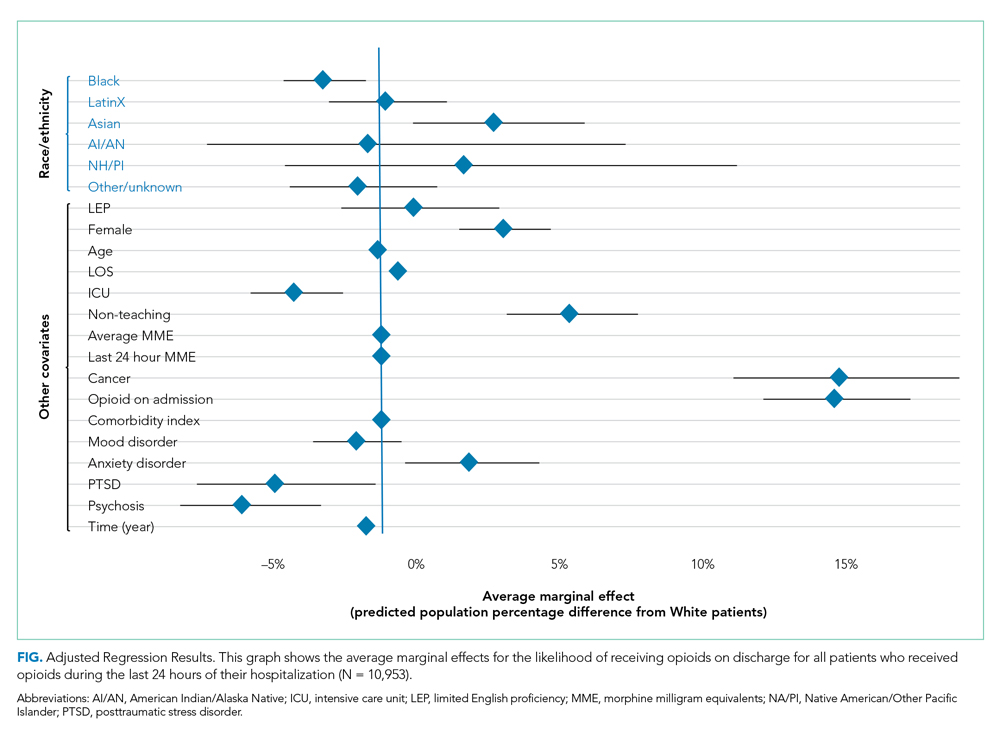
Following multivariable logistic regression for the association between race/ethnicity and opioid on discharge and controlling for covariates, we found that Black patients were less likely to receive an opioid prescription on discharge compared with White patients (predicted population rate, 47.6% vs 50.7%; AME −3.1%; 95% CI, −5.5% to −0.8%). Asian patients were more likely to receive a prescription on discharge compared with White patients (predicted population rate, 55.6% vs 50.7%; AME +4.9; 95% CI, 1.5%-8.3%).
Following multivariable negative binomial regression for the association between race/ethnicity and the number of opioid days on discharge, we found that Black patients received a shorter duration of opioid days compared with White patients (predicted days of opioids on discharge, 15.7 days vs 17.8 days; AME −2.1 days; 95% CI, −3.3 to −0.87) (Table 3). There were no significant differences among patients and the other racial/ethnic groups.
 and Multivariable Negative Binomial Regression between Race/Ethnicity and Days of Opioids Prescribed on Discharge (n = 5541)")
Our secondary analysis from the negative binomial regression with the days of opioids supplied metric yielded similar results to our primary analysis showing that Black patients received statically significantly fewer days of opioid therapy compared with White patients (Appendix Table 2).
Subgroup Regression Results
After testing for effect modification, which was negative, we examined the relationships for patients started on opioids during their hospitalization (Appendix Table 3 and Appendix Table 4). There were 5101 patients with newly prescribed opioids during their hospitalization. Adjusting for covariates, we found that Black patients were less likely to receive opioids at discharge compared with White patients (predicted population rate, 34.9% vs 40.4%; AME −5.5%; 95% CI, −9.2% to −1.9%). American Indian or Alaska Native patients were more likely to receive opioids on discharge (predicted population rate, 58.3% vs 40.4%; AME +17.9%; 95% CI, 1.0%-34.8%). We also found that Asian patients received more days of opioids on discharge (predicted days of opioid on discharge, 16.7 vs 13.7 days; AME +3.0 days; 95% CI, 0.6-5.3 days) (Appendix Table 4, Appendix Figure 2).
DISCUSSION
We found that Black patients discharged from the general medicine service were less likely to receive opioids and received shorter courses on discharge compared with White patients, adjusting for demographic, hospitalization, and medical diagnosis variables. Asian patients were more likely to receive an opioid prescription at discharge—a finding not reported in the literature on opioid prescribing disparities in most other practice settings.1
Previous studies have shown racial disparities in pain management in emergency and surgical settings, but these relationships have not been characterized in an inpatient medicine population. Medicine patients comprise the majority of admitted patients in the United States and reflect a wide diversity of medical conditions, many requiring opioids for pain management. Determining the etiology of these differential prescribing patterns was not within the scope of our study, but earlier studies demonstrate a number of reasons why these patterns exist across racial and ethnic groups in other practice settings.23,24 These reports give us insight into potential mechanisms for our study population.
Differences in pain management likely represent the multiple structural mechanisms by which racism operates.17 Drawing from the existing literature and the socioecological model, we hypothesize the ways that individual, interpersonal relationships, organizations, communities, and public policy impact opioid prescribing.25,26 Using this model and considering the framework of Critical Race Theory (CRT), we can work towards understanding how race and ethnicity stand in as surrogates for racism and how this manifests in different outcomes and identify areas for intervention. CRT draws attention to race consciousness, contemporary orientation, centering in the margins, and praxis. In the context of this analysis, we recognize race consciousness and the interactions among factors such as race/ethnicity, language, and diagnoses such as PTSD.27 This approach is necessary because racism is a multilevel construct influenced by macrolevel factors.28
Individually and interpersonally, there is clinician-driven bias in pain assessment, which is activated under times of stress and diagnostic uncertainty and is amplified by a lack of clear guidelines for pain management prescriptions.23,29-32 Institutional and organizational culture contribute to disparities through ingrained culture, practice patterns, and resource allocation.29,33 Last, public policy and the larger sociopolitical environment worsen disparities through nondiverse workforces, state and federal guidelines, criminal justice policy, supply chain regulation, and access to care.
As individual clinicians, departments, and health systems leaders, we must identify areas for intervention. At the individual and interpersonal levels, there is evidence that taking implicit association tests could help clinicians become more aware of their negative associations, and empathy-inducing, perspective-taking interventions can reduce pain treatment bias.31,34 At the institutional level, we must report data on disparities, create guidelines for pain management, and reevaluate the educational curriculum and culture to assess how certain biases could be propagated. The lack of straightforward guidelines leads to unclear indications for opioid prescriptions, exacerbating provider-level differences in prescribing. At the policy level, legislation that promotes workplace diversity, increases training for and access to pain specialists, and incentivizes data collection and reporting could help reduce disparities.35 Equitable access to prescriptions and care is essential. Pharmacies often understock opioids in minority neighborhoods, meaning that even if a patient is prescribed an opioid on discharge, he or she might have difficulty filling the prescription.36
One could question whether fewer opioid prescriptions for Black patients protects against the harms of opioid overprescribing, and therefore is not reflective of harmful inequity.37 Ongoing national programs aim to reduce the harmful effects of opioids, which is reflected in the reduction in opioid prescribing over time in our institution. Our point is that differences in prescribing could reflect practices that do result in patient harm, such as less adequately controlled pain among Black patients.1,3 Undertreated pain has negative health and social consequences and further contributes to substance-use stigma within minority communities.38 Moreover, Black people who describe more discrimination in medical settings were more likely to report subsequent opioid misuse.39
Although the above mechanisms might partially explain our findings among Black patients, the higher rate of prescribing for Asian patients is more challenging to explain. Our models adjusted for clinical factors. Notably, our Asian patients had the highest baseline comorbidity index, oldest mean age, and highest cancer rates, and it is possible that we were unable to fully account for illness severity or related pain needs (Table 1). It also is possible—although speculative—that factors such as language, provider concordance, and the type of disease process all contribute.40 Some researchers have proposed a “stereotype content model” that seeks to establish a pathway among social structure (status of a patient) to clinician stereotypes (is this patient warm and/or competent) to emotional prejudices (envy, pride) and ultimately to discrimination (active/passive, help/harm).23Our study has limitations. Our model was limited by the available data collected on our patients. Covariates including primary care follow-up, pain scores, and overdose history were not available. Furthermore, our categorization of race/ethnicity was based on self-reported data. We had 676 patients with race/ethnicity specified as other/unknown. We recognize the heterogeneity within these racial/ethnic categorizations. For example, within the LatinX or Asian communities, there are large differences based on region, country, ethnic, or cultural groups. Our study only included patients presenting to a hospital in San Francisco, which is different from the racial/ethnic makeup of other cities across the nation. Our electronic health record capture of history of opioid use disorder and mood disorders is contingent on individual clinician documentation. We did not account for provider-level differences, which is an important part of variation in prescribing differences. We also did not examine differences at the diagnosis-specific level. Finally, we could not determine the indication or appropriateness of opioid prescriptions.
Future studies will be necessary to characterize this relationship at a diagnosis-specific level and to describe causal pathways. Within our own institution, these findings present an opportunity for positive change. We hope to continue to explore the etiology of these disparities and identify areas where differences could impact patient outcomes, such as pain control. It is essential to develop appropriate recommendations for inpatient and discharge opioid prescribing to help minimize disparities and to mitigate potential harms of overprescribing. All health systems should continue to collect data on their own disparities in opioid prescribing and educate clinicians on promoting more equitable practices.
Acknowledgments
The authors thank Sneha Daya, MD, Sachin Shah, MD, MPH, and the UCSF Division of Hospital Medicine Data Core.
1. Romanelli RJ, Shen Z, Szwerinski N, Scott A, Lockhart S, Pressman AR. Racial and ethnic disparities in opioid prescribing for long bone fractures at discharge from the emergency department: a cross-sectional analysis of 22 centers from a health care delivery system in northern California. Ann Emerg Med. 2019;74(5):622-631. https://doi.org/10.1016/j.annemergmed.2019.05.018
2. Tamayo-Sarver JH, Hinze SW, Cydulka RK, Baker DW. Racial and ethnic disparities in emergency department analgesic prescription. Am J Public Health. 2003;93(12):2067-2073. https://doi.org/10.2105/ajph.93.12.2067
3. Berger AJ, Wang Y, Rowe C, Chung B, Chang S, Haleblian G. Racial disparities in analgesic use amongst patients presenting to the emergency department for kidney stones in the United States. Am J Emerg Med. 2021;39:71-74. https://doi.org/10.1016/j.ajem.2020.01.017
4. Dickason RM, Chauhan V, Mor A, et al. Racial differences in opiate administration for pain relief at an academic emergency department. West J Emerg Med. 2015;16(3):372-380. https://doi.org/10.5811/westjem.2015.3.23893
5. Singhal A, Tien Y-Y, Hsia RY. Racial-ethnic disparities in opioid prescriptions at emergency department visits for conditions commonly associated with prescription drug abuse. PloS One. 2016;11(8):e0159224. https://doi.org/10.1371/journal.pone.0159224
6. Green CR, Anderson KO, Baker TA, et al. The unequal burden of pain: confronting racial and ethnic disparities in pain. Pain Med Malden Mass. 2003;4(3):277-294. https://doi.org/10.1046/j.1526-4637.2003.03034.x
7. Hoffman KM, Trawalter S, Axt JR, Oliver MN. Racial bias in pain assessment and treatment recommendations, and false beliefs about biological differences between blacks and whites. Proc Natl Acad Sci U S A. 2016;113(16):4296-4301. https://doi.org/10.1073/pnas.1516047113
8. Anderson KO, Green CR, Payne R. Racial and ethnic disparities in pain: causes and consequences of unequal care. J Pain. 2009;10(12):1187-1204. https://doi.org/10.1016/j.jpain.2009.10.002
9. Cintron A, Morrison RS. Pain and ethnicity in the United States: a systematic review. J Palliat Med. 2006;9(6):1454-1473. https://doi.org/10.1089/jpm.2006.9.1454
10. Pletcher MJ, Kertesz SG, Kohn MA, Gonzales R. Trends in opioid prescribing by race/ethnicity for patients seeking care in US emergency departments. JAMA. 2008;299(1):70-78. https://doi.org/10.1001/jama.2007.64
11. Campbell CM, Edwards RR. Ethnic differences in pain and pain management. Pain Manag. 2012;2(3):219-230. https://doi.org/10.2217/pmt.12.7
12. Yawn BP, Buchanan GR, Afenyi-Annan AN, et al. Management of sickle cell disease: summary of the 2014 evidence-based report by expert panel members. JAMA. 2014;312(10):1033-1048. https://doi.org/10.1001/jama.2014.10517
13. Brown W. Opioid use in dying patients in hospice and hospital, with and without specialist palliative care team involvement. Eur J Cancer Care (Engl). 2008;17(1):65-71. https://doi.org/10.1111/j.1365-2354.2007.00810.x
14. Iverson N, Lau CY, Abe-Jones Y, et al. Evaluating a novel metric for personalized opioid prescribing after hospitalization: a retrospective cohort study. PloS One. 2020;15(12):e0244735. https://doi.org/ 10.1371/journal.pone.0244735
15. Howell J, Emerson MO. So what “ should ” we use? Evaluating the impact of five racial measures on markers of social inequality. Sociol Race Ethn (Thousand Oaks). 2017;3(1):14-30. https://doi.org/10.1177/2332649216648465
16. Kaplan JB, Bennett T. Use of race and ethnicity in biomedical publication. JAMA. 2003;289(20):2709-2716. https://doi.org/10.1001/jama.289.20.2709
17. Boyd RW, Lindo EG, Weeks LD, McLemore MR. On racism: a new standard for publishing on racial health inequities. Health Affairs. Published July 2, 2020. Accessed August 20, 2021. https://www.healthaffairs.org/do/10.1377/hblog20200630.939347/full
18. van Walraven C, Austin PC, Jennings A, Quan H, Forster AJ. A modification of the Elixhauser comorbidity measures into a point system for hospital death using administrative data. Med Care. 2009;47(6):626-633. https://doi.org/10.1097/MLR.0b013e31819432e5
19. Sun GW, Shook TL, Kay GL. Inappropriate use of bivariable analysis to screen risk factors for use in multivariable analysis. J Clin Epidemiol. 1996;49(8):907-916. https://doi.org/10.1016/0895-4356(96)00025-x
20. Norton EC, Dowd BE, Maciejewski ML. Marginal effects-quantifying the effect of changes in risk factors in logistic regression models. JAMA. 2019;321(13):1304-1305. https://doi.org/10.1001/jama.2019.1954
21. Zhang J, Yu KF. What’s the relative risk? A method of correcting the odds ratio in cohort studies of common outcomes. JAMA. 1998;280(19):1690-1691. https://doi.org/10.1001/jama.280.19.1690
22. Norton EC, Dowd BE. Log odds and the interpretation of logit models. Health Serv Res. 2018;53(2):859-878. https://doi.org/10.1111/1475-6773.12712
23. Dovidio JF, Fiske ST. Under the radar: how unexamined biases in decision-making processes in clinical interactions can contribute to health care disparities. Am J Public Health. 2012;102(5):945-952. https://doi.org/10.2105/AJPH.2011.300601
24. van Ryn M. Research on the provider contribution to race/ethnicity disparities in medical care. Med Care. 2002;40(1 Suppl):I140-151. https://doi.org/10.1097/00005650-200201001-00015
25. Krieger N. Theories for social epidemiology in the 21st century: an ecosocial perspective. Int J Epidemiol. 2001;30(4):668-677. https://doi.org/10.1093/ije/30.4.668
26. Golden SD, Earp JAL. Social ecological approaches to individuals and their contexts: twenty years of health education & behavior health promotion interventions. Health Educ Behav Off Publ Soc Public Health Educ. 2012;39(3):364-372. https://doi.org/10.1177/1090198111418634
27. Ford CL, Airhihenbuwa CO. Critical race theory, race equity, and public health: toward antiracism praxis. Am J Public Health. 2010;100 Suppl 1(Suppl 1):S30-5. https://doi.org/10.2105/AJPH.2009.171058
28. Ford CL, Daniel M, Earp JAL, Kaufman JS, Golin CE, Miller WC. Perceived everyday racism, residential segregation, and HIV testing among patients at a sexually transmitted disease clinic. Am J Public Health. 2009;99 Suppl 1:S137-143. https://doi.org/10.2105/AJPH.2007.120865
29. Hall WJ, Chapman MV, Lee KM, et al. Implicit racial/ethnic bias among health care professionals and its influence on health care outcomes: a systematic review. Am J Public Health. 2015;105(12):e60-76. https://doi.org/10.2105/AJPH.2015.302903
30. Staton LJ, Panda M, Chen I, et al. When race matters: disagreement in pain perception between patients and their physicians in primary care. J Natl Med Assoc. 2007;99(5):532-538.
31. Drwecki BB, Moore CF, Ward SE, Prkachin KM. Reducing racial disparities in pain treatment: the role of empathy and perspective-taking. Pain. 2011;152(5):1001-1006. https://doi.org/10.1016/j.pain.2010.12.005
32. Mende-Siedlecki P, Qu-Lee J, Backer R, Van Bavel JJ. Perceptual contributions to racial bias in pain recognition. J Exp Psychol Gen. 2019;148(5):863-889. https://doi.org/10.1037/xge0000600
33. King G. Institutional racism and the medical/health complex: a conceptual analysis. Ethn Dis. 1996;6(1-2):30-46.
34. Maina IW, Belton TD, Ginzberg S, Singh A, Johnson TJ. A decade of studying implicit racial/ethnic bias in healthcare providers using the implicit association test. Soc Sci Med. 2018;199:219-229. https://doi.org/10.1016/j.socscimed.2017.05.009
35. Meghani SH, Byun E, Gallagher RM. Time to take stock: a meta-analysis and systematic review of analgesic treatment disparities for pain in the United States. Pain Med. 2012;13(2):150-174. https://doi.org/10.1111/j.1526-4637.2011.01310.x
36. Morrison RS, Wallenstein S, Natale DK, Senzel RS, Huang LL. “We don’t carry that”—failure of pharmacies in predominantly nonwhite neighborhoods to stock opioid analgesics. N Engl J Med. 2000;342(14):1023-1026. https://doi.org/10.1056/NEJM200004063421406
37. Frakt A, Monkovic T. A ‘rare case where racial biases’ protected African-Americans. The New York Times. November 25, 2019. Updated December 2, 2019. Accessed July 5, 2021. https://www.nytimes.com/2019/11/25/upshot/opioid-epidemic-blacks.html
38. Khatri U, Shoshana Aronowitz S, South E. The opioid crisis shows why racism in health care is always harmful, never ‘protective’. The Philadelphia Inquirer. Updated December 26, 2019. Accessed July 5, 2021. https://www.inquirer.com/health/expert-opinions/opioid-crisis-racism-healthcare-buprenorphine-20191223.html
39. Swift SL, Glymour MM, Elfassy T, et al. Racial discrimination in medical care settings and opioid pain reliever misuse in a U.S. cohort: 1992 to 2015. PloS One. 2019;14(12):e0226490. https://journals.plos.org/plosone/article?id=10.1371/journal.pone.0226490
40. Hsieh AY, Tripp DA, Ji L-J. The influence of ethnic concordance and discordance on verbal reports and nonverbal behaviours of pain. Pain. 2011;152(9):2016-2022. https://doi.org/10.1016/j.pain.2011.04.023
Within the nationwide effort to combat the opioid epidemic and reduce opioid prescribing, researchers have described different prescribing patterns for non-White racial and ethnic groups, including Black and LatinX populations. This remains a largely unexplored area within hospital medicine. Earlier studies of racial disparities demonstrate how some patients are assessed less often for pain and prescribed fewer opioids from the emergency department, surgical settings, and outpatient primary care practices. Researchers also have documented racial and ethnic disparities in analgesia for cancer pain and chronic noncancer pain.1-11 Studies have demonstrated that White patients are more likely to receive opioid prescriptions compared with Black patients. Even with similar documented pain scores, there is evidence that Black patients receive fewer analgesics compared with White patients. For example, a recent study found that Black and Hispanic patients presenting to the emergency room for renal colic received less opioid medication compared with White patients.3 A study across 22 sites in Northern California found that racial minorities with long-bone fractures received fewer opioids at discharge than White patients.1
It is unknown whether differential prescribing patterns by race exist among patients hospitalized on general medicine services. The objective of our study was to assess whether race and ethnicity were associated with the likelihood of opioids being prescribed and the duration of opioids prescribed when these patients are discharged from the hospital. Quantifying and seeking to understand these differences are the first steps toward ensuring racial and ethnic health equity in patient care.
METHODS
Study Population and Data Sources
We identified all adults (age ≥18 years) discharged from the acute care inpatient general medicine services between June 1, 2012, and November 30, 2018, at the University of California, San Francisco (UCSF) Helen Diller Medical Center at Parnassus Heights, a 785-bed urban academic teaching hospital. All data were obtained from the hospital’s Epic-based electronic medical record (Epic Systems Corporation). Data elements were extracted from Clarity, the relationship database that stores Epic inpatient data. Patients discharged from the inpatient cardiology or bone marrow transplant services were not included. We excluded patients who did not receive opioids in the last 24 hours of their hospitalization. Patients with cancer-related pain diagnoses or sickle cell disease pain crises and patients who were discharged to hospice or followed by palliative care were excluded from the study based on International Classification of Diseases, Tenth Revision (ICD-10) codes (available on request) or service codes, when available, or admitting provider electronic health record documentation (Appendix Figure 1). Palliative care and hospice patients have significantly different pain needs, with management often directed by specialists. Patients with sickle cell disease are disproportionately Black and have distinct opioid prescribing patterns.12,13 We also excluded discharge opioid prescriptions that were a resumption of the patient’s opioid prescription before admission based on medication documentation. Only new prescriptions signed by the discharging hospitalist, including different doses and formulations, were included in this study.
We performed a subgroup analysis of patients who were not prescribed opioids before their admission based on medication reconciliation but were started on opioids while hospitalized.
Primary Outcomes
We examined two primary outcomes: whether a patient received an opioid prescription at discharge, and, for patients prescribed opioids, the number of days prescribed. Days of opioids at discharge were calculated as total morphine milligram equivalents (MMEs) prescribed divided by MMEs administered during the final 24 hours of hospitalization. This metric was used as a patient-specific approach to calculating how long an opioid prescription will last after discharge, standardized according to the actual opioid requirements from hospitalization.14 If a patient was discharged with prescriptions for several opioids, the longest single prescription duration was used.
Primary Predictors
The primary predictor was the patient’s primary self-reported race/ethnicity, categorized as White, Black, LatinX, Asian, Native Hawaiian or other Pacific Islander, American Indian or Alaska Native, and other/unknown. Other/unknown included patients who were listed as other, declined, or who were otherwise unspecified. Self-reported race/ethnicity is obtained through reporting to the registrar. These race/ethnicity groupings were done in concordance with US Census Bureau definitions. Researchers classified patients as LatinX if they had Hispanic documented as their ethnicity, no matter their racial identification. These categorizations were chosen to be consistent with the existing literature, recognizing the role of a combined race/ethnicity definition for Hispanic or LatinX populations.15 These definitions of race/ethnicity are self-reported and reflect socially—not genetically defined—groupings.16 This variable serves as a surrogate for the structural factors that contribute to racism, the determining factor for racially disparate outcomes.17
Covariate Data Collection
Additional data were obtained regarding patient demographics, hospitalization factors, and medical diagnoses. Demographic factors included age, sex, and limited English proficiency (LEP) status. LEP was defined as having a primary language other than English and requiring an interpreter. Hospitalization factors included length of stay, whether they required intensive care unit (ICU) management, average daily MMEs administered during their entire hospitalization, MMEs administered during the final 24 hours of their hospitalization, whether the patient was on a teaching service or direct-care hospitalist service, their disposition on discharge, and year. Medical diagnosis variables included the adjusted Elixhauser Comorbidity Index based on ICD-10 codes; whether the patient was taking opioids at admission; and specific diagnoses of cancer, posttraumatic stress disorder (PTSD), and mood, anxiety, or psychotic disorder based on ICD-10 documentation.18
Statistical Analysis
All statistical analyses were performed using Stata software version 16 (StataCorp LP). Baseline demographic variables, hospitalization factors, and medical diagnosis variables were stratified by race/ethnicity. Within group comparisons were performed using chi-square or analysis of varianace (ANOVA) testing. For regression analyses, we fit two models. First, we fit a multivariable logistic regression model on all patients who received opioids during the last 24 hours of their hospitalization to examine the association between patient race/ethnicity and whether a patient received opioids at discharge, adjusting for additional patient, hospitalization, and medical covariates. Then we fit a negative binomial regression model on patients who were prescribed opioids at discharge to examine the association between patient race/ethnicity and the amount of opioids prescribed at discharge, adjusting for covariates. We used a negative binomial model because of the overdispersed distribution of discharge opioid prescriptions and only examined patients with an opioid prescription at discharge. We included the listed variables in our model because they were all found a priori to be associated with discharge opioid prescriptions.19 Instead of using days of opioids based on the last 24 hours, we performed a secondary analysis using the actual days of opioids supplied as the outcome. For example, a prescription of 12 tablets with every 6 hours dosing would be 3 days’ duration.
For both models, subgroup analyses were performed using the adjusted models restricted to patients newly prescribed opioids during their hospitalization and who were not previously taking opioids based on admission medication reconciliation. After testing for effect modification, this subgroup analysis was performed to reduce selection bias associated with earlier opioid use.
For all models, we reported predicted population opioid prescribing rates from the average marginal effects (AME).20 Marginal effects were used because ours was a population level study and the outcome of interest was relatively common, limiting the effective interpretation of odds ratios.21 Marginal effects allow us to observe the instantaneous effect a given independent variable has on a dependent variable, while holding all other variables constant. It is implemented using the margins command in Stata. Marginal effects enable us to present our results as differences in probabilities, which is a more accurate way to describe the differences found among patient groups. Further, marginal effects are less sensitive to changes in model specifications.22The UCSF Institutional Review Board for Human Subjects Research approved this study with a waiver of informed consent.
RESULTS
Unadjusted Results
We identified 10,953 patients who received opioids during the last 24 hours of hospitalization (see Appendix Figure 1 for study consort diagram). The patient population was 52.2% White, 18.4% Black, 11.5% Latinx, 10.1% Asian, 6.2% other/unknown, 0.9% Native Hawaiian/Other Pacific Islander, and 0.8% American Indian/Alaska Native (Table 1, Appendix Table 1). Black patients had fewer cancer diagnoses and the highest rate of prescribed opioids on admission. Asian patients were older and more likely to be female, and had higher rates of cancer, the highest median comorbidity index, and the smallest median daily MME during both the last 24 hours and total duration of hospitalization. Representative of general medicine patients, the most common principal discharge diagnoses in our dataset were pneumonia, cellulitis, altered mental status, sepsis, and abdominal pain.
Overall, 5541 (50.6%) patients who received opioids in the last 24 hours of their hospitalization received an opioid prescription at discharge. There were significant differences among racial/ethnic groups receiving an opioid prescription at discharge. Black patients were less likely to be discharged with an opioid compared with White patients (47.7% vs 50.3%; P < .001) (Table 2). The median discharge prescription duration for all patients was 9.3 days (interquartile range [IQR], 3.8-20.0). Black patients received the fewest median days of opioids at 7.5 days (IQR, 3.2-16.7) compared with White patients at 8.8 days (IQR, 3.7-20.0; P < .001) (Table 2).
Adjusted Regression Results
Demographic, clinical, and diagnosis specific factors were significantly associated with opioid prescriptions, including previous opioid use, sex, and a concurrent cancer diagnosis. There were fewer opioid prescriptions over time (Figure).
Following multivariable logistic regression for the association between race/ethnicity and opioid on discharge and controlling for covariates, we found that Black patients were less likely to receive an opioid prescription on discharge compared with White patients (predicted population rate, 47.6% vs 50.7%; AME −3.1%; 95% CI, −5.5% to −0.8%). Asian patients were more likely to receive a prescription on discharge compared with White patients (predicted population rate, 55.6% vs 50.7%; AME +4.9; 95% CI, 1.5%-8.3%).
Following multivariable negative binomial regression for the association between race/ethnicity and the number of opioid days on discharge, we found that Black patients received a shorter duration of opioid days compared with White patients (predicted days of opioids on discharge, 15.7 days vs 17.8 days; AME −2.1 days; 95% CI, −3.3 to −0.87) (Table 3). There were no significant differences among patients and the other racial/ethnic groups.
Our secondary analysis from the negative binomial regression with the days of opioids supplied metric yielded similar results to our primary analysis showing that Black patients received statically significantly fewer days of opioid therapy compared with White patients (Appendix Table 2).
Subgroup Regression Results
After testing for effect modification, which was negative, we examined the relationships for patients started on opioids during their hospitalization (Appendix Table 3 and Appendix Table 4). There were 5101 patients with newly prescribed opioids during their hospitalization. Adjusting for covariates, we found that Black patients were less likely to receive opioids at discharge compared with White patients (predicted population rate, 34.9% vs 40.4%; AME −5.5%; 95% CI, −9.2% to −1.9%). American Indian or Alaska Native patients were more likely to receive opioids on discharge (predicted population rate, 58.3% vs 40.4%; AME +17.9%; 95% CI, 1.0%-34.8%). We also found that Asian patients received more days of opioids on discharge (predicted days of opioid on discharge, 16.7 vs 13.7 days; AME +3.0 days; 95% CI, 0.6-5.3 days) (Appendix Table 4, Appendix Figure 2).
DISCUSSION
We found that Black patients discharged from the general medicine service were less likely to receive opioids and received shorter courses on discharge compared with White patients, adjusting for demographic, hospitalization, and medical diagnosis variables. Asian patients were more likely to receive an opioid prescription at discharge—a finding not reported in the literature on opioid prescribing disparities in most other practice settings.1
Previous studies have shown racial disparities in pain management in emergency and surgical settings, but these relationships have not been characterized in an inpatient medicine population. Medicine patients comprise the majority of admitted patients in the United States and reflect a wide diversity of medical conditions, many requiring opioids for pain management. Determining the etiology of these differential prescribing patterns was not within the scope of our study, but earlier studies demonstrate a number of reasons why these patterns exist across racial and ethnic groups in other practice settings.23,24 These reports give us insight into potential mechanisms for our study population.
Differences in pain management likely represent the multiple structural mechanisms by which racism operates.17 Drawing from the existing literature and the socioecological model, we hypothesize the ways that individual, interpersonal relationships, organizations, communities, and public policy impact opioid prescribing.25,26 Using this model and considering the framework of Critical Race Theory (CRT), we can work towards understanding how race and ethnicity stand in as surrogates for racism and how this manifests in different outcomes and identify areas for intervention. CRT draws attention to race consciousness, contemporary orientation, centering in the margins, and praxis. In the context of this analysis, we recognize race consciousness and the interactions among factors such as race/ethnicity, language, and diagnoses such as PTSD.27 This approach is necessary because racism is a multilevel construct influenced by macrolevel factors.28
Individually and interpersonally, there is clinician-driven bias in pain assessment, which is activated under times of stress and diagnostic uncertainty and is amplified by a lack of clear guidelines for pain management prescriptions.23,29-32 Institutional and organizational culture contribute to disparities through ingrained culture, practice patterns, and resource allocation.29,33 Last, public policy and the larger sociopolitical environment worsen disparities through nondiverse workforces, state and federal guidelines, criminal justice policy, supply chain regulation, and access to care.
As individual clinicians, departments, and health systems leaders, we must identify areas for intervention. At the individual and interpersonal levels, there is evidence that taking implicit association tests could help clinicians become more aware of their negative associations, and empathy-inducing, perspective-taking interventions can reduce pain treatment bias.31,34 At the institutional level, we must report data on disparities, create guidelines for pain management, and reevaluate the educational curriculum and culture to assess how certain biases could be propagated. The lack of straightforward guidelines leads to unclear indications for opioid prescriptions, exacerbating provider-level differences in prescribing. At the policy level, legislation that promotes workplace diversity, increases training for and access to pain specialists, and incentivizes data collection and reporting could help reduce disparities.35 Equitable access to prescriptions and care is essential. Pharmacies often understock opioids in minority neighborhoods, meaning that even if a patient is prescribed an opioid on discharge, he or she might have difficulty filling the prescription.36
One could question whether fewer opioid prescriptions for Black patients protects against the harms of opioid overprescribing, and therefore is not reflective of harmful inequity.37 Ongoing national programs aim to reduce the harmful effects of opioids, which is reflected in the reduction in opioid prescribing over time in our institution. Our point is that differences in prescribing could reflect practices that do result in patient harm, such as less adequately controlled pain among Black patients.1,3 Undertreated pain has negative health and social consequences and further contributes to substance-use stigma within minority communities.38 Moreover, Black people who describe more discrimination in medical settings were more likely to report subsequent opioid misuse.39
Although the above mechanisms might partially explain our findings among Black patients, the higher rate of prescribing for Asian patients is more challenging to explain. Our models adjusted for clinical factors. Notably, our Asian patients had the highest baseline comorbidity index, oldest mean age, and highest cancer rates, and it is possible that we were unable to fully account for illness severity or related pain needs (Table 1). It also is possible—although speculative—that factors such as language, provider concordance, and the type of disease process all contribute.40 Some researchers have proposed a “stereotype content model” that seeks to establish a pathway among social structure (status of a patient) to clinician stereotypes (is this patient warm and/or competent) to emotional prejudices (envy, pride) and ultimately to discrimination (active/passive, help/harm).23Our study has limitations. Our model was limited by the available data collected on our patients. Covariates including primary care follow-up, pain scores, and overdose history were not available. Furthermore, our categorization of race/ethnicity was based on self-reported data. We had 676 patients with race/ethnicity specified as other/unknown. We recognize the heterogeneity within these racial/ethnic categorizations. For example, within the LatinX or Asian communities, there are large differences based on region, country, ethnic, or cultural groups. Our study only included patients presenting to a hospital in San Francisco, which is different from the racial/ethnic makeup of other cities across the nation. Our electronic health record capture of history of opioid use disorder and mood disorders is contingent on individual clinician documentation. We did not account for provider-level differences, which is an important part of variation in prescribing differences. We also did not examine differences at the diagnosis-specific level. Finally, we could not determine the indication or appropriateness of opioid prescriptions.
Future studies will be necessary to characterize this relationship at a diagnosis-specific level and to describe causal pathways. Within our own institution, these findings present an opportunity for positive change. We hope to continue to explore the etiology of these disparities and identify areas where differences could impact patient outcomes, such as pain control. It is essential to develop appropriate recommendations for inpatient and discharge opioid prescribing to help minimize disparities and to mitigate potential harms of overprescribing. All health systems should continue to collect data on their own disparities in opioid prescribing and educate clinicians on promoting more equitable practices.
Acknowledgments
The authors thank Sneha Daya, MD, Sachin Shah, MD, MPH, and the UCSF Division of Hospital Medicine Data Core.
1. Romanelli RJ, Shen Z, Szwerinski N, Scott A, Lockhart S, Pressman AR. Racial and ethnic disparities in opioid prescribing for long bone fractures at discharge from the emergency department: a cross-sectional analysis of 22 centers from a health care delivery system in northern California. Ann Emerg Med. 2019;74(5):622-631. https://doi.org/10.1016/j.annemergmed.2019.05.018
2. Tamayo-Sarver JH, Hinze SW, Cydulka RK, Baker DW. Racial and ethnic disparities in emergency department analgesic prescription. Am J Public Health. 2003;93(12):2067-2073. https://doi.org/10.2105/ajph.93.12.2067
3. Berger AJ, Wang Y, Rowe C, Chung B, Chang S, Haleblian G. Racial disparities in analgesic use amongst patients presenting to the emergency department for kidney stones in the United States. Am J Emerg Med. 2021;39:71-74. https://doi.org/10.1016/j.ajem.2020.01.017
4. Dickason RM, Chauhan V, Mor A, et al. Racial differences in opiate administration for pain relief at an academic emergency department. West J Emerg Med. 2015;16(3):372-380. https://doi.org/10.5811/westjem.2015.3.23893
5. Singhal A, Tien Y-Y, Hsia RY. Racial-ethnic disparities in opioid prescriptions at emergency department visits for conditions commonly associated with prescription drug abuse. PloS One. 2016;11(8):e0159224. https://doi.org/10.1371/journal.pone.0159224
6. Green CR, Anderson KO, Baker TA, et al. The unequal burden of pain: confronting racial and ethnic disparities in pain. Pain Med Malden Mass. 2003;4(3):277-294. https://doi.org/10.1046/j.1526-4637.2003.03034.x
7. Hoffman KM, Trawalter S, Axt JR, Oliver MN. Racial bias in pain assessment and treatment recommendations, and false beliefs about biological differences between blacks and whites. Proc Natl Acad Sci U S A. 2016;113(16):4296-4301. https://doi.org/10.1073/pnas.1516047113
8. Anderson KO, Green CR, Payne R. Racial and ethnic disparities in pain: causes and consequences of unequal care. J Pain. 2009;10(12):1187-1204. https://doi.org/10.1016/j.jpain.2009.10.002
9. Cintron A, Morrison RS. Pain and ethnicity in the United States: a systematic review. J Palliat Med. 2006;9(6):1454-1473. https://doi.org/10.1089/jpm.2006.9.1454
10. Pletcher MJ, Kertesz SG, Kohn MA, Gonzales R. Trends in opioid prescribing by race/ethnicity for patients seeking care in US emergency departments. JAMA. 2008;299(1):70-78. https://doi.org/10.1001/jama.2007.64
11. Campbell CM, Edwards RR. Ethnic differences in pain and pain management. Pain Manag. 2012;2(3):219-230. https://doi.org/10.2217/pmt.12.7
12. Yawn BP, Buchanan GR, Afenyi-Annan AN, et al. Management of sickle cell disease: summary of the 2014 evidence-based report by expert panel members. JAMA. 2014;312(10):1033-1048. https://doi.org/10.1001/jama.2014.10517
13. Brown W. Opioid use in dying patients in hospice and hospital, with and without specialist palliative care team involvement. Eur J Cancer Care (Engl). 2008;17(1):65-71. https://doi.org/10.1111/j.1365-2354.2007.00810.x
14. Iverson N, Lau CY, Abe-Jones Y, et al. Evaluating a novel metric for personalized opioid prescribing after hospitalization: a retrospective cohort study. PloS One. 2020;15(12):e0244735. https://doi.org/ 10.1371/journal.pone.0244735
15. Howell J, Emerson MO. So what “ should ” we use? Evaluating the impact of five racial measures on markers of social inequality. Sociol Race Ethn (Thousand Oaks). 2017;3(1):14-30. https://doi.org/10.1177/2332649216648465
16. Kaplan JB, Bennett T. Use of race and ethnicity in biomedical publication. JAMA. 2003;289(20):2709-2716. https://doi.org/10.1001/jama.289.20.2709
17. Boyd RW, Lindo EG, Weeks LD, McLemore MR. On racism: a new standard for publishing on racial health inequities. Health Affairs. Published July 2, 2020. Accessed August 20, 2021. https://www.healthaffairs.org/do/10.1377/hblog20200630.939347/full
18. van Walraven C, Austin PC, Jennings A, Quan H, Forster AJ. A modification of the Elixhauser comorbidity measures into a point system for hospital death using administrative data. Med Care. 2009;47(6):626-633. https://doi.org/10.1097/MLR.0b013e31819432e5
19. Sun GW, Shook TL, Kay GL. Inappropriate use of bivariable analysis to screen risk factors for use in multivariable analysis. J Clin Epidemiol. 1996;49(8):907-916. https://doi.org/10.1016/0895-4356(96)00025-x
20. Norton EC, Dowd BE, Maciejewski ML. Marginal effects-quantifying the effect of changes in risk factors in logistic regression models. JAMA. 2019;321(13):1304-1305. https://doi.org/10.1001/jama.2019.1954
21. Zhang J, Yu KF. What’s the relative risk? A method of correcting the odds ratio in cohort studies of common outcomes. JAMA. 1998;280(19):1690-1691. https://doi.org/10.1001/jama.280.19.1690
22. Norton EC, Dowd BE. Log odds and the interpretation of logit models. Health Serv Res. 2018;53(2):859-878. https://doi.org/10.1111/1475-6773.12712
23. Dovidio JF, Fiske ST. Under the radar: how unexamined biases in decision-making processes in clinical interactions can contribute to health care disparities. Am J Public Health. 2012;102(5):945-952. https://doi.org/10.2105/AJPH.2011.300601
24. van Ryn M. Research on the provider contribution to race/ethnicity disparities in medical care. Med Care. 2002;40(1 Suppl):I140-151. https://doi.org/10.1097/00005650-200201001-00015
25. Krieger N. Theories for social epidemiology in the 21st century: an ecosocial perspective. Int J Epidemiol. 2001;30(4):668-677. https://doi.org/10.1093/ije/30.4.668
26. Golden SD, Earp JAL. Social ecological approaches to individuals and their contexts: twenty years of health education & behavior health promotion interventions. Health Educ Behav Off Publ Soc Public Health Educ. 2012;39(3):364-372. https://doi.org/10.1177/1090198111418634
27. Ford CL, Airhihenbuwa CO. Critical race theory, race equity, and public health: toward antiracism praxis. Am J Public Health. 2010;100 Suppl 1(Suppl 1):S30-5. https://doi.org/10.2105/AJPH.2009.171058
28. Ford CL, Daniel M, Earp JAL, Kaufman JS, Golin CE, Miller WC. Perceived everyday racism, residential segregation, and HIV testing among patients at a sexually transmitted disease clinic. Am J Public Health. 2009;99 Suppl 1:S137-143. https://doi.org/10.2105/AJPH.2007.120865
29. Hall WJ, Chapman MV, Lee KM, et al. Implicit racial/ethnic bias among health care professionals and its influence on health care outcomes: a systematic review. Am J Public Health. 2015;105(12):e60-76. https://doi.org/10.2105/AJPH.2015.302903
30. Staton LJ, Panda M, Chen I, et al. When race matters: disagreement in pain perception between patients and their physicians in primary care. J Natl Med Assoc. 2007;99(5):532-538.
31. Drwecki BB, Moore CF, Ward SE, Prkachin KM. Reducing racial disparities in pain treatment: the role of empathy and perspective-taking. Pain. 2011;152(5):1001-1006. https://doi.org/10.1016/j.pain.2010.12.005
32. Mende-Siedlecki P, Qu-Lee J, Backer R, Van Bavel JJ. Perceptual contributions to racial bias in pain recognition. J Exp Psychol Gen. 2019;148(5):863-889. https://doi.org/10.1037/xge0000600
33. King G. Institutional racism and the medical/health complex: a conceptual analysis. Ethn Dis. 1996;6(1-2):30-46.
34. Maina IW, Belton TD, Ginzberg S, Singh A, Johnson TJ. A decade of studying implicit racial/ethnic bias in healthcare providers using the implicit association test. Soc Sci Med. 2018;199:219-229. https://doi.org/10.1016/j.socscimed.2017.05.009
35. Meghani SH, Byun E, Gallagher RM. Time to take stock: a meta-analysis and systematic review of analgesic treatment disparities for pain in the United States. Pain Med. 2012;13(2):150-174. https://doi.org/10.1111/j.1526-4637.2011.01310.x
36. Morrison RS, Wallenstein S, Natale DK, Senzel RS, Huang LL. “We don’t carry that”—failure of pharmacies in predominantly nonwhite neighborhoods to stock opioid analgesics. N Engl J Med. 2000;342(14):1023-1026. https://doi.org/10.1056/NEJM200004063421406
37. Frakt A, Monkovic T. A ‘rare case where racial biases’ protected African-Americans. The New York Times. November 25, 2019. Updated December 2, 2019. Accessed July 5, 2021. https://www.nytimes.com/2019/11/25/upshot/opioid-epidemic-blacks.html
38. Khatri U, Shoshana Aronowitz S, South E. The opioid crisis shows why racism in health care is always harmful, never ‘protective’. The Philadelphia Inquirer. Updated December 26, 2019. Accessed July 5, 2021. https://www.inquirer.com/health/expert-opinions/opioid-crisis-racism-healthcare-buprenorphine-20191223.html
39. Swift SL, Glymour MM, Elfassy T, et al. Racial discrimination in medical care settings and opioid pain reliever misuse in a U.S. cohort: 1992 to 2015. PloS One. 2019;14(12):e0226490. https://journals.plos.org/plosone/article?id=10.1371/journal.pone.0226490
40. Hsieh AY, Tripp DA, Ji L-J. The influence of ethnic concordance and discordance on verbal reports and nonverbal behaviours of pain. Pain. 2011;152(9):2016-2022. https://doi.org/10.1016/j.pain.2011.04.023
© 2021 Society of Hospital Medicine
Identifying the Sickest During Triage: Using Point-of-Care Severity Scores to Predict Prognosis in Emergency Department Patients With Suspected Sepsis
Sepsis is the leading cause of in-hospital mortality in the United States.1 Sepsis is present on admission in 85% of cases, and each hour delay in antibiotic treatment is associated with 4% to 7% increased odds of mortality.2,3 Prompt identification and treatment of sepsis is essential for reducing morbidity and mortality, but identifying sepsis during triage is challenging.2
Risk stratification scores that rely solely on data readily available at the bedside have been developed to quickly identify those at greatest risk of poor outcomes from sepsis in real time. The quick Sequential Organ Failure Assessment (qSOFA) score, the National Early Warning System (NEWS2), and the Shock Index are easy-to-calculate measures that use routinely collected clinical data that are not subject to laboratory delay. These scores can be incorporated into electronic health record (EHR)-based alerts and can be calculated longitudinally to track the risk of poor outcomes over time. qSOFA was developed to quantify patient risk at bedside in non-intensive care unit (ICU) settings, but there is no consensus about its ability to predict adverse outcomes such as mortality and ICU admission.4-6 The United Kingdom’s National Health Service uses NEWS2 to identify patients at risk for sepsis.7 NEWS has been shown to have similar or better sensitivity in identifying poorer outcomes in sepsis patients compared with systemic inflammatory response syndrome (SIRS) criteria and qSOFA.4,8-11 However, since the latest update of NEWS2 in 2017, there has been little study of its predictive ability. The Shock Index is a simple bedside score (heart rate divided by systolic blood pressure) that was developed to detect changes in cardiovascular performance before systemic shock onset. Although it was not developed for infection and has not been regularly applied in the sepsis literature, the Shock Index might be useful for identifying patients at increased risk of poor outcomes. Patients with higher and sustained Shock Index scores are more likely to experience morbidity, such as hyperlactatemia, vasopressor use, and organ failure, and also have an increased risk of mortality.12-14
Although the predictive abilities of these bedside risk stratification scores have been assessed individually using standard binary cut-points, the comparative performance of qSOFA, the Shock Index, and NEWS2 has not been evaluated in patients presenting to an emergency department (ED) with suspected sepsis.
METHODS
Design and Setting
We conducted a retrospective cohort study of ED patients who presented with suspected sepsis to the University of California San Francisco (UCSF) Helen Diller Medical Center at Parnassus Heights between June 1, 2012, and December 31, 2018. Our institution is a 785-bed academic teaching hospital with approximately 30,000 ED encounters per year. The study was approved with a waiver of informed consent by the UCSF Human Research Protection Program.
Participants
We use an Epic-based EHR platform (Epic 2017, Epic Systems Corporation) for clinical care, which was implemented on June 1, 2012. All data elements were obtained from Clarity, the relational database that stores Epic’s inpatient data. The study included encounters for patients age ≥18 years who had blood cultures ordered within 24 hours of ED presentation and administration of intravenous antibiotics within 24 hours. Repeat encounters were treated independently in our analysis.
Outcomes and Measures
We compared the ability of qSOFA, the Shock Index, and NEWS2 to predict in-hospital mortality and admission to the ICU from the ED (ED-to-ICU admission). We used the

We compared demographic and clinical characteristics of patients who were positive for qSOFA, the Shock Index, and NEWS2. Demographic data were extracted from the EHR and included primary language, age, sex, and insurance status. All International Classification of Diseases (ICD)-9/10 diagnosis codes were pulled from Clarity billing tables. We used the Elixhauser comorbidity groupings19 of ICD-9/10 codes present on admission to identify preexisting comorbidities and underlying organ dysfunction. To estimate burden of comorbid illnesses, we calculated the validated van Walraven comorbidity index,20 which provides an estimated risk of in-hospital death based on documented Elixhauser comorbidities. Admission level of care (acute, stepdown, or intensive care) was collected for inpatient admissions to assess initial illness severity.21 We also evaluated discharge disposition and in-hospital mortality. Index blood culture results were collected, and dates and timestamps of mechanical ventilation, fluid, vasopressor, and antibiotic administration were obtained for the duration of the encounter.
UCSF uses an automated, real-time, algorithm-based severe sepsis alert that is triggered when a patient meets ≥2 SIRS criteria and again when the patient meets severe sepsis or septic shock criteria (ie, ≥2 SIRS criteria in addition to end-organ dysfunction and/or fluid nonresponsive hypotension). This sepsis screening alert was in use for the duration of our study.22
Statistical Analysis
We performed a subgroup analysis among those who were diagnosed with sepsis, according to the 2016 Third International Consensus Definitions for Sepsis and Septic Shock (Sepsis-3) criteria.
All statistical analyses were conducted using Stata 14 (StataCorp). We summarized differences in demographic and clinical characteristics among the populations meeting each severity score but elected not to conduct hypothesis testing because patients could be positive for one or more scores. We calculated sensitivity, specificity, positive predictive value (PPV), and negative predictive value (NPV) for each score to predict in-hospital mortality and ED-to-ICU admission. To allow comparison with other studies, we also created a composite outcome of either in-hospital mortality or ED-to-ICU admission.
RESULTS
Within our sample 23,837 ED patients had blood cultures ordered within 24 hours of ED presentation and were considered to have suspected sepsis. The mean age of the cohort was 60.8 years, and 1,612 (6.8%) had positive blood cultures. A total of 12,928 patients (54.2%) were found to have sepsis. We documented 1,427 in-hospital deaths (6.0%) and 3,149 (13.2%) ED-to-ICU admissions. At ED triage 1,921 (8.1%) were qSOFA-positive, 4,273 (17.9%) were Shock Index-positive, and 11,832 (49.6%) were NEWS2-positive. At ED triage, blood pressure, heart rate, respiratory rate, and oxygen saturated were documented in >99% of patients, 93.5% had temperature documented, and 28.5% had GCS recorded. If the window of assessment was widened to 1 hour, GCS was only documented among 44.2% of those with suspected sepsis.
Demographic Characteristics and Clinical Course

qSOFA-positive patients received antibiotics more quickly than those who were Shock Index-positive or NEWS2-positive (median 1.5, 1.8, and 2.8 hours after admission, respectively). In addition, those who were qSOFA-positive were more likely to have a positive blood culture (10.9%, 9.4%, and 8.5%, respectively) and to receive an EHR-based diagnosis of sepsis (77.0%, 69.6%, and 60.9%, respectively) than those who were Shock Index- or NEWS2-positive. Those who were qSOFA-positive also were more likely to be mechanically ventilated during their hospital stay (25.4%, 19.2%, and 10.8%, respectively) and to receive vasopressors (33.5%, 22.5%, and 12.2%, respectively). In-hospital mortality also was more common among those who were qSOFA-positive at triage (23.4%, 15.3%, and 9.2%, respectively).
Because both qSOFA and NEWS2 incorporate GCS, we explored baseline characteristics of patients with GCS documented at triage (n = 6,794). These patients were older (median age 63 and 61 years, P < .0001), more likely to be male (54.9% and 53.4%, P = .0031), more likely to have renal failure (22.8% and 20.1%, P < .0001), more likely to have liver disease (14.2% and 12.8%, P = .006), had a higher van Walraven comorbidity score on presentation (median 10 and 8, P < .0001), and were more likely to go directly to the ICU from the ED (20.2% and 10.6%, P < .0001). However, among the 6,397 GCS scores documented at triage, only 1,579 (24.7%) were abnormal.
Test Characteristics of qSOFA, Shock Index, and NEWS2 for Predicting In-hospital Mortality and ED-to-ICU Admission
Among 23,837 patients with suspected sepsis, NEWS2 had the highest sensitivity for predicting in-hospital mortality (76.0%; 95% CI, 73.7%-78.2%) and ED-to-ICU admission (78.9%; 95% CI, 77.5%-80.4%) but had the lowest specificity for in-hospital mortality (52.0%; 95% CI, 51.4%-52.7%) and for ED-to-ICU admission (54.8%; 95% CI, 54.1%-55.5%) (Table 3). qSOFA had the lowest sensitivity for in-hospital mortality (31.5%; 95% CI, 29.1%-33.9%) and ED-to-ICU admission (29.3%; 95% CI, 27.7%-30.9%) but the highest specificity for in-hospital mortality (93.4%; 95% CI, 93.1%-93.8%) and ED-to-ICU admission (95.2%; 95% CI, 94.9%-95.5%). The Shock Index had a sensitivity that fell between qSOFA and NEWS2 for in-hospital mortality (45.8%; 95% CI, 43.2%-48.5%) and ED-to-ICU admission (49.2%; 95% CI, 47.5%-51.0%). The specificity of the Shock Index also was between qSOFA and NEWS2 for in-hospital mortality (83.9%; 95% CI, 83.4%-84.3%) and ED-to-ICU admission (86.8%; 95% CI, 86.4%-87.3%). All three scores exhibited relatively low PPV, ranging from 9.2% to 23.4% for in-hospital mortality and 21.0% to 48.0% for ED-to-ICU triage. Conversely, all three scores exhibited relatively high NPV, ranging from 95.5% to 97.1% for in-hospital mortality and 89.8% to 94.5% for ED-to-ICU triage.

When considering a binary cutoff, the Shock Index exhibited the highest AUROC for in-hospital mortality (0.648; 95% CI, 0.635-0.662) and had a significantly higher AUROC than qSOFA (AUROC, 0.625; 95% CI, 0.612-0.637; P = .0005), but there was no difference compared with NEWS2 (AUROC, 0.640; 95% CI, 0.628-0.652; P = .2112). NEWS2 had a significantly higher AUROC than qSOFA for predicting in-hospital mortality (P = .0227). The Shock Index also exhibited the highest AUROC for ED-to-ICU admission (0.680; 95% CI, 0.617-0.689), which was significantly higher than the AUROC for qSOFA (P < .0001) and NEWS2 (P = 0.0151). NEWS2 had a significantly higher AUROC than qSOFA for predicting ED-to-ICU admission (P < .0001). Similar findings were seen in patients found to have sepsis. 
DISCUSSION
In this retrospective cohort study of 23,837 patients who presented to the ED with suspected sepsis, the standard qSOFA threshold was met least frequently, followed by the Shock Index and NEWS2. NEWS2 had the highest sensitivity but the lowest specificity for predicting in-hospital mortality and ED-to-ICU admission, making it a challenging bedside risk stratification scale for identifying patients at risk of poor clinical outcomes. When comparing predictive performance among the three scales, qSOFA had the highest specificity and the Shock Index had the highest AUROC for in-hospital mortality and ED-to-ICU admission in this cohort of patients with suspected sepsis. These trends in sensitivity, specificity, and AUROC were consistent among those who met EHR criteria for a sepsis diagnosis. In the analysis of the three scoring systems using all available cut-points, qSOFA and NEWS2 had the highest AUROCs, followed by the Shock Index.
Considering the rapid progression from organ dysfunction to death in sepsis patients, as well as the difficulty establishing a sepsis diagnosis at triage,23 providers must quickly identify patients at increased risk of poor outcomes when they present to the ED. Sepsis alerts often are built using SIRS criteria,27 including the one used for sepsis surveillance at UCSF since 2012,22 but the white blood cell count criterion is subject to a laboratory lag and could lead to a delay in identification. Implementation of a point-of-care bedside score alert that uses readily available clinical data could allow providers to identify patients at greatest risk of poor outcomes immediately at ED presentation and triage, which motivated us to explore the predictive performance of qSOFA, the Shock Index, and NEWS2.
Our study is the first to provide a head-to-head comparison of the predictive performance of qSOFA, the Shock Index, and NEWS2, three easy-to-calculate bedside risk scores that use EHR data collected among patients with suspected sepsis. The Sepsis-3 guidelines recommend qSOFA to quickly identify non-ICU patients at greatest risk of poor outcomes because the measure exhibited predictive performance similar to the more extensive SOFA score outside the ICU.16,23 Although some studies have confirmed qSOFA’s high predictive performance,28-31 our test characteristics and AUROC findings are in line with other published analyses.4,6,10,17 The UK National Health Service is using NEWS2 to screen for patients at risk of poor outcomes from sepsis. Several analyses that assessed the predictive ability of NEWS have reported estimates in line with our findings.4,10,32 The Shock Index was introduced in 1967 and provided a metric to evaluate hemodynamic stability based on heart rate and systolic blood pressure.33 The Shock Index has been studied in several contexts, including sepsis,34 and studies show that a sustained Shock Index is associated with increased odds of vasopressor administration, higher prevalence of hyperlactatemia, and increased risk of poor outcomes in the ICU.13,14
For our study, we were particularly interested in exploring how the Shock Index would compare with more frequently used severity scores such as qSOFA and NEWS2 among patients with suspected sepsis, given the simplicity of its calculation and the easy availability of required data. In our cohort of 23,837 patients, only 159 people had missing blood pressure and only 71 had omitted heart rate. In contrast, both qSOFA and NEWS2 include an assessment of level of consciousness that can be subject to variability in assessment methods and EHR documentation across institutions.11 In our cohort, GCS within 30 minutes of ED presentation was missing in 72 patients, which could have led to incomplete calculation of qSOFA and NEWS2 if a missing value was not actually within normal limits.
Several investigations relate qSOFA to NEWS but few compare qSOFA with the newer NEWS2, and even fewer evaluate the Shock Index with any of these scores.10,11,18,29,35-37 In general, studies have shown that NEWS exhibits a higher AUROC for predicting mortality, sepsis with organ dysfunction, and ICU admission, often as a composite outcome.4,11,18,37,38 A handful of studies compare the Shock Index to SIRS; however, little has been done to compare the Shock Index to qSOFA or NEWS2, scores that have been used specifically for sepsis and might be more predictive of poor outcomes than SIRS.33 In our study, the Shock Index had a higher AUROC than either qSOFA or NEWS2 for predicting in-hospital mortality and ED-to-ICU admission measured as separate outcomes and as a composite outcome using standard cut-points for these scores.
When selecting a severity score to apply in an institution, it is important to carefully evaluate the score’s test characteristics, in addition to considering the availability of reliable data. Tests with high sensitivity and NPV for the population being studied can be useful to rule out disease or risk of poor outcome, while tests with high specificity and PPV can be useful to rule in disease or risk of poor outcome.39 When considering specificity, qSOFA’s performance was superior to the Shock Index and NEWS2 in our study, but a small percentage of the population was identified using a cut-point of qSOFA ≥2. If we used qSOFA and applied this standard cut-point at our institution, we could be confident that those identified were at increased risk, but we would miss a significant number of patients who would experience a poor outcome. When considering sensitivity, performance of NEWS2 was superior to qSOFA and the Shock Index in our study, but one-half of the population was identified using a cut-point of NEWS2 ≥5. If we were to apply this standard NEWS2 cut-point at our institution, we would assume that one-half of our population was at risk, which might drive resource use towards patients who will not experience a poor outcome. Although none of the scores exhibited a robust AUROC measure, the Shock Index had the highest AUROC for in-hospital mortality and ED-to-ICU admission when using the standard binary cut-point, and its sensitivity and specificity is between that of qSOFA and NEWS2, potentially making it a score to use in settings where qSOFA and NEWS2 score components, such as altered mentation, are not reliably collected. Finally, our sensitivity analysis varying the binary cut-point of each score within our population demonstrated that the standard cut-points might not be as useful within a specific population and might need to be tailored for implementation, balancing sensitivity, specificity, PPV, and NPV to meet local priorities and ICU capacity.
Our study has limitations. It is a single-center, retrospective analysis, factors that could reduce generalizability. However, it does include a large and diverse patient population spanning several years. Missing GCS data could have affected the predictive ability of qSOFA and NEWS2 in our cohort. We could not reliably perform imputation of GCS because of the high missingness and therefore we assumed missing was normal, as was done in the Sepsis-3 derivation studies.16 Previous studies have attempted to impute GCS and have not observed improved performance of qSOFA to predict mortality.40 Because manually collected variables such as GCS are less reliably documented in the EHR, there might be limitations in their use for triage risk scores.
Although the current analysis focused on the predictive performance of qSOFA, the Shock Index, and NEWS2 at triage, performance of these scores could affect the ED team’s treatment decisions before handoff to the hospitalist team and the expected level of care the patient will receive after in-patient admission. These tests also have the advantage of being easy to calculate at the bedside over time, which could provide an objective assessment of longitudinal predicted prognosis.
CONCLUSION
Local priorities should drive selection of a screening tool, balancing sensitivity, specificity, PPV, and NPV to achieve the institution’s goals. qSOFA, Shock Index, and NEWS2 are risk stratification tools that can be easily implemented at ED triage using data available at the bedside. Although none of these scores performed strongly when comparing AUROCs, qSOFA was highly specific for identifying patients with poor outcomes, and NEWS2 was the most sensitive for ruling out those at high risk among patients with suspected sepsis. The Shock Index exhibited a sensitivity and specificity that fell between qSOFA and NEWS2 and also might be considered to identify those at increased risk, given its ease of implementation, particularly in settings where altered mentation is unreliably or inconsistently documented.
Acknowledgment
The authors thank the UCSF Division of Hospital Medicine Data Core for their assistance with data acquisition.
1. Jones SL, Ashton CM, Kiehne LB, et al. Outcomes and resource use of sepsis-associated stays by presence on admission, severity, and hospital type. Med Care. 2016;54(3):303-310. https://doi.org/10.1097/MLR.0000000000000481
2. Seymour CW, Gesten F, Prescott HC, et al. Time to treatment and mortality during mandated emergency care for sepsis. N Engl J Med. 2017;376(23):2235-2244. https://doi.org/10.1056/NEJMoa1703058
3. Kumar A, Roberts D, Wood KE, et al. Duration of hypotension before initiation of effective antimicrobial therapy is the critical determinant of survival in human septic shock. Crit Care Med. 2006;34(6):1589-1596. https://doi.org/10.1097/01.CCM.0000217961.75225.E9
4. Churpek MM, Snyder A, Sokol S, Pettit NN, Edelson DP. Investigating the impact of different suspicion of infection criteria on the accuracy of Quick Sepsis-Related Organ Failure Assessment, Systemic Inflammatory Response Syndrome, and Early Warning Scores. Crit Care Med. 2017;45(11):1805-1812. https://doi.org/10.1097/CCM.0000000000002648
5. Abdullah SMOB, Sørensen RH, Dessau RBC, Sattar SMRU, Wiese L, Nielsen FE. Prognostic accuracy of qSOFA in predicting 28-day mortality among infected patients in an emergency department: a prospective validation study. Emerg Med J. 2019;36(12):722-728. https://doi.org/10.1136/emermed-2019-208456
6. Kim KS, Suh GJ, Kim K, et al. Quick Sepsis-related Organ Failure Assessment score is not sensitive enough to predict 28-day mortality in emergency department patients with sepsis: a retrospective review. Clin Exp Emerg Med. 2019;6(1):77-83. HTTPS://DOI.ORG/ 10.15441/ceem.17.294
7. National Early Warning Score (NEWS) 2: Standardising the assessment of acute-illness severity in the NHS. Royal College of Physicians; 2017.
8. Brink A, Alsma J, Verdonschot RJCG, et al. Predicting mortality in patients with suspected sepsis at the emergency department: a retrospective cohort study comparing qSOFA, SIRS and National Early Warning Score. PLoS One. 2019;14(1):e0211133. https://doi.org/ 10.1371/journal.pone.0211133
9. Redfern OC, Smith GB, Prytherch DR, Meredith P, Inada-Kim M, Schmidt PE. A comparison of the Quick Sequential (Sepsis-Related) Organ Failure Assessment Score and the National Early Warning Score in non-ICU patients with/without infection. Crit Care Med. 2018;46(12):1923-1933. https://doi.org/10.1097/CCM.0000000000003359
10. Churpek MM, Snyder A, Han X, et al. Quick Sepsis-related Organ Failure Assessment, Systemic Inflammatory Response Syndrome, and Early Warning Scores for detecting clinical deterioration in infected patients outside the intensive care unit. Am J Respir Crit Care Med. 2017;195(7):906-911. https://doi.org/10.1164/rccm.201604-0854OC
11. Goulden R, Hoyle MC, Monis J, et al. qSOFA, SIRS and NEWS for predicting inhospital mortality and ICU admission in emergency admissions treated as sepsis. Emerg Med J. 2018;35(6):345-349. https://doi.org/10.1136/emermed-2017-207120
12. Biney I, Shepherd A, Thomas J, Mehari A. Shock Index and outcomes in patients admitted to the ICU with sepsis. Chest. 2015;148(suppl 4):337A. https://doi.org/https://doi.org/10.1378/chest.2281151
13. Wira CR, Francis MW, Bhat S, Ehrman R, Conner D, Siegel M. The shock index as a predictor of vasopressor use in emergency department patients with severe sepsis. West J Emerg Med. 2014;15(1):60-66. https://doi.org/10.5811/westjem.2013.7.18472
14. Berger T, Green J, Horeczko T, et al. Shock index and early recognition of sepsis in the emergency department: pilot study. West J Emerg Med. 2013;14(2):168-174. https://doi.org/10.5811/westjem.2012.8.11546
15. Middleton DJ, Smith TO, Bedford R, Neilly M, Myint PK. Shock Index predicts outcome in patients with suspected sepsis or community-acquired pneumonia: a systematic review. J Clin Med. 2019;8(8):1144. https://doi.org/10.3390/jcm8081144
16. Seymour CW, Liu VX, Iwashyna TJ, et al. Assessment of clinical criteria for sepsis: for the Third International Consensus Definitions for Sepsis and Septic Shock (Sepsis-3). JAMA. 2016;315(8):762-774. https://doi.org/ 10.1001/jama.2016.0288
17. Abdullah S, Sørensen RH, Dessau RBC, Sattar S, Wiese L, Nielsen FE. Prognostic accuracy of qSOFA in predicting 28-day mortality among infected patients in an emergency department: a prospective validation study. Emerg Med J. 2019;36(12):722-728. https://doi.org/10.1136/emermed-2019-208456
18. Usman OA, Usman AA, Ward MA. Comparison of SIRS, qSOFA, and NEWS for the early identification of sepsis in the Emergency Department. Am J Emerg Med. 2018;37(8):1490-1497. https://doi.org/10.1016/j.ajem.2018.10.058
19. Elixhauser A, Steiner C, Harris DR, Coffey RM. Comorbidity measures for use with administrative data. Med Care. 1998;36(1):8-27. https://doi.org/10.1097/00005650-199801000-00004
20. van Walraven C, Austin PC, Jennings A, Quan H, Forster AJ. A modification of the Elixhauser comorbidity measures into a point system for hospital death using administrative data. Med Care. 2009;47(6):626-633. https://doi.org/10.1097/MLR.0b013e31819432e5
21. Prin M, Wunsch H. The role of stepdown beds in hospital care. Am J Respir Crit Care Med. 2014;190(11):1210-1216. https://doi.org/10.1164/rccm.201406-1117PP
22. Narayanan N, Gross AK, Pintens M, Fee C, MacDougall C. Effect of an electronic medical record alert for severe sepsis among ED patients. Am J Emerg Med. 2016;34(2):185-188. https://doi.org/10.1016/j.ajem.2015.10.005
23. Singer M, Deutschman CS, Seymour CW, et al. The Third International Consensus Definitions for Sepsis and Septic Shock (Sepsis-3). JAMA. 2016;315(8):801-810. https://doi.org/10.1001/jama.2016.0287
24. Rhee C, Dantes R, Epstein L, et al. Incidence and trends of sepsis in US hospitals using clinical vs claims data, 2009-2014. JAMA. 2017;318(13):1241-1249. https://doi.org/10.1001/jama.2017.13836
25. Safari S, Baratloo A, Elfil M, Negida A. Evidence based emergency medicine; part 5 receiver operating curve and area under the curve. Emerg (Tehran). 2016;4(2):111-113.
26. DeLong ER, DeLong DM, Clarke-Pearson DL. Comparing the areas under two or more correlated receiver operating characteristic curves: a nonparametric approach. Biometrics. 1988;44(3):837-845.
27. Kangas C, Iverson L, Pierce D. Sepsis screening: combining Early Warning Scores and SIRS Criteria. Clin Nurs Res. 2021;30(1):42-49. https://doi.org/10.1177/1054773818823334.
28. Freund Y, Lemachatti N, Krastinova E, et al. Prognostic accuracy of Sepsis-3 Criteria for in-hospital mortality among patients with suspected infection presenting to the emergency department. JAMA. 2017;317(3):301-308. https://doi.org/10.1001/jama.2016.20329
29. Finkelsztein EJ, Jones DS, Ma KC, et al. Comparison of qSOFA and SIRS for predicting adverse outcomes of patients with suspicion of sepsis outside the intensive care unit. Crit Care. 2017;21(1):73. https://doi.org/10.1186/s13054-017-1658-5
30. Canet E, Taylor DM, Khor R, Krishnan V, Bellomo R. qSOFA as predictor of mortality and prolonged ICU admission in Emergency Department patients with suspected infection. J Crit Care. 2018;48:118-123. https://doi.org/10.1016/j.jcrc.2018.08.022
31. Anand V, Zhang Z, Kadri SS, Klompas M, Rhee C; CDC Prevention Epicenters Program. Epidemiology of Quick Sequential Organ Failure Assessment criteria in undifferentiated patients and association with suspected infection and sepsis. Chest. 2019;156(2):289-297. https://doi.org/10.1016/j.chest.2019.03.032
32. Hamilton F, Arnold D, Baird A, Albur M, Whiting P. Early Warning Scores do not accurately predict mortality in sepsis: A meta-analysis and systematic review of the literature. J Infect. 2018;76(3):241-248. https://doi.org/10.1016/j.jinf.2018.01.002
33. Koch E, Lovett S, Nghiem T, Riggs RA, Rech MA. Shock Index in the emergency department: utility and limitations. Open Access Emerg Med. 2019;11:179-199. https://doi.org/10.2147/OAEM.S178358
34. Yussof SJ, Zakaria MI, Mohamed FL, Bujang MA, Lakshmanan S, Asaari AH. Value of Shock Index in prognosticating the short-term outcome of death for patients presenting with severe sepsis and septic shock in the emergency department. Med J Malaysia. 2012;67(4):406-411.
35. Siddiqui S, Chua M, Kumaresh V, Choo R. A comparison of pre ICU admission SIRS, EWS and q SOFA scores for predicting mortality and length of stay in ICU. J Crit Care. 2017;41:191-193. https://doi.org/10.1016/j.jcrc.2017.05.017
36. Costa RT, Nassar AP, Caruso P. Accuracy of SOFA, qSOFA, and SIRS scores for mortality in cancer patients admitted to an intensive care unit with suspected infection. J Crit Care. 2018;45:52-57. https://doi.org/10.1016/j.jcrc.2017.12.024
37. Mellhammar L, Linder A, Tverring J, et al. NEWS2 is Superior to qSOFA in detecting sepsis with organ dysfunction in the emergency department. J Clin Med. 2019;8(8):1128. https://doi.org/10.3390/jcm8081128
38. Szakmany T, Pugh R, Kopczynska M, et al. Defining sepsis on the wards: results of a multi-centre point-prevalence study comparing two sepsis definitions. Anaesthesia. 2018;73(2):195-204. https://doi.org/10.1111/anae.14062
39. Newman TB, Kohn MA. Evidence-Based Diagnosis: An Introduction to Clinical Epidemiology. Cambridge University Press; 2009.
40. Askim Å, Moser F, Gustad LT, et al. Poor performance of quick-SOFA (qSOFA) score in predicting severe sepsis and mortality - a prospective study of patients admitted with infection to the emergency department. Scand J Trauma Resusc Emerg Med. 2017;25(1):56. https://doi.org/10.1186/s13049-017-0399-4
Sepsis is the leading cause of in-hospital mortality in the United States.1 Sepsis is present on admission in 85% of cases, and each hour delay in antibiotic treatment is associated with 4% to 7% increased odds of mortality.2,3 Prompt identification and treatment of sepsis is essential for reducing morbidity and mortality, but identifying sepsis during triage is challenging.2
Risk stratification scores that rely solely on data readily available at the bedside have been developed to quickly identify those at greatest risk of poor outcomes from sepsis in real time. The quick Sequential Organ Failure Assessment (qSOFA) score, the National Early Warning System (NEWS2), and the Shock Index are easy-to-calculate measures that use routinely collected clinical data that are not subject to laboratory delay. These scores can be incorporated into electronic health record (EHR)-based alerts and can be calculated longitudinally to track the risk of poor outcomes over time. qSOFA was developed to quantify patient risk at bedside in non-intensive care unit (ICU) settings, but there is no consensus about its ability to predict adverse outcomes such as mortality and ICU admission.4-6 The United Kingdom’s National Health Service uses NEWS2 to identify patients at risk for sepsis.7 NEWS has been shown to have similar or better sensitivity in identifying poorer outcomes in sepsis patients compared with systemic inflammatory response syndrome (SIRS) criteria and qSOFA.4,8-11 However, since the latest update of NEWS2 in 2017, there has been little study of its predictive ability. The Shock Index is a simple bedside score (heart rate divided by systolic blood pressure) that was developed to detect changes in cardiovascular performance before systemic shock onset. Although it was not developed for infection and has not been regularly applied in the sepsis literature, the Shock Index might be useful for identifying patients at increased risk of poor outcomes. Patients with higher and sustained Shock Index scores are more likely to experience morbidity, such as hyperlactatemia, vasopressor use, and organ failure, and also have an increased risk of mortality.12-14
Although the predictive abilities of these bedside risk stratification scores have been assessed individually using standard binary cut-points, the comparative performance of qSOFA, the Shock Index, and NEWS2 has not been evaluated in patients presenting to an emergency department (ED) with suspected sepsis.
METHODS
Design and Setting
We conducted a retrospective cohort study of ED patients who presented with suspected sepsis to the University of California San Francisco (UCSF) Helen Diller Medical Center at Parnassus Heights between June 1, 2012, and December 31, 2018. Our institution is a 785-bed academic teaching hospital with approximately 30,000 ED encounters per year. The study was approved with a waiver of informed consent by the UCSF Human Research Protection Program.
Participants
We use an Epic-based EHR platform (Epic 2017, Epic Systems Corporation) for clinical care, which was implemented on June 1, 2012. All data elements were obtained from Clarity, the relational database that stores Epic’s inpatient data. The study included encounters for patients age ≥18 years who had blood cultures ordered within 24 hours of ED presentation and administration of intravenous antibiotics within 24 hours. Repeat encounters were treated independently in our analysis.
Outcomes and Measures
We compared the ability of qSOFA, the Shock Index, and NEWS2 to predict in-hospital mortality and admission to the ICU from the ED (ED-to-ICU admission). We used the
We compared demographic and clinical characteristics of patients who were positive for qSOFA, the Shock Index, and NEWS2. Demographic data were extracted from the EHR and included primary language, age, sex, and insurance status. All International Classification of Diseases (ICD)-9/10 diagnosis codes were pulled from Clarity billing tables. We used the Elixhauser comorbidity groupings19 of ICD-9/10 codes present on admission to identify preexisting comorbidities and underlying organ dysfunction. To estimate burden of comorbid illnesses, we calculated the validated van Walraven comorbidity index,20 which provides an estimated risk of in-hospital death based on documented Elixhauser comorbidities. Admission level of care (acute, stepdown, or intensive care) was collected for inpatient admissions to assess initial illness severity.21 We also evaluated discharge disposition and in-hospital mortality. Index blood culture results were collected, and dates and timestamps of mechanical ventilation, fluid, vasopressor, and antibiotic administration were obtained for the duration of the encounter.
UCSF uses an automated, real-time, algorithm-based severe sepsis alert that is triggered when a patient meets ≥2 SIRS criteria and again when the patient meets severe sepsis or septic shock criteria (ie, ≥2 SIRS criteria in addition to end-organ dysfunction and/or fluid nonresponsive hypotension). This sepsis screening alert was in use for the duration of our study.22
Statistical Analysis
We performed a subgroup analysis among those who were diagnosed with sepsis, according to the 2016 Third International Consensus Definitions for Sepsis and Septic Shock (Sepsis-3) criteria.
All statistical analyses were conducted using Stata 14 (StataCorp). We summarized differences in demographic and clinical characteristics among the populations meeting each severity score but elected not to conduct hypothesis testing because patients could be positive for one or more scores. We calculated sensitivity, specificity, positive predictive value (PPV), and negative predictive value (NPV) for each score to predict in-hospital mortality and ED-to-ICU admission. To allow comparison with other studies, we also created a composite outcome of either in-hospital mortality or ED-to-ICU admission.
RESULTS
Within our sample 23,837 ED patients had blood cultures ordered within 24 hours of ED presentation and were considered to have suspected sepsis. The mean age of the cohort was 60.8 years, and 1,612 (6.8%) had positive blood cultures. A total of 12,928 patients (54.2%) were found to have sepsis. We documented 1,427 in-hospital deaths (6.0%) and 3,149 (13.2%) ED-to-ICU admissions. At ED triage 1,921 (8.1%) were qSOFA-positive, 4,273 (17.9%) were Shock Index-positive, and 11,832 (49.6%) were NEWS2-positive. At ED triage, blood pressure, heart rate, respiratory rate, and oxygen saturated were documented in >99% of patients, 93.5% had temperature documented, and 28.5% had GCS recorded. If the window of assessment was widened to 1 hour, GCS was only documented among 44.2% of those with suspected sepsis.
Demographic Characteristics and Clinical Course
qSOFA-positive patients received antibiotics more quickly than those who were Shock Index-positive or NEWS2-positive (median 1.5, 1.8, and 2.8 hours after admission, respectively). In addition, those who were qSOFA-positive were more likely to have a positive blood culture (10.9%, 9.4%, and 8.5%, respectively) and to receive an EHR-based diagnosis of sepsis (77.0%, 69.6%, and 60.9%, respectively) than those who were Shock Index- or NEWS2-positive. Those who were qSOFA-positive also were more likely to be mechanically ventilated during their hospital stay (25.4%, 19.2%, and 10.8%, respectively) and to receive vasopressors (33.5%, 22.5%, and 12.2%, respectively). In-hospital mortality also was more common among those who were qSOFA-positive at triage (23.4%, 15.3%, and 9.2%, respectively).
Because both qSOFA and NEWS2 incorporate GCS, we explored baseline characteristics of patients with GCS documented at triage (n = 6,794). These patients were older (median age 63 and 61 years, P < .0001), more likely to be male (54.9% and 53.4%, P = .0031), more likely to have renal failure (22.8% and 20.1%, P < .0001), more likely to have liver disease (14.2% and 12.8%, P = .006), had a higher van Walraven comorbidity score on presentation (median 10 and 8, P < .0001), and were more likely to go directly to the ICU from the ED (20.2% and 10.6%, P < .0001). However, among the 6,397 GCS scores documented at triage, only 1,579 (24.7%) were abnormal.
Test Characteristics of qSOFA, Shock Index, and NEWS2 for Predicting In-hospital Mortality and ED-to-ICU Admission
Among 23,837 patients with suspected sepsis, NEWS2 had the highest sensitivity for predicting in-hospital mortality (76.0%; 95% CI, 73.7%-78.2%) and ED-to-ICU admission (78.9%; 95% CI, 77.5%-80.4%) but had the lowest specificity for in-hospital mortality (52.0%; 95% CI, 51.4%-52.7%) and for ED-to-ICU admission (54.8%; 95% CI, 54.1%-55.5%) (Table 3). qSOFA had the lowest sensitivity for in-hospital mortality (31.5%; 95% CI, 29.1%-33.9%) and ED-to-ICU admission (29.3%; 95% CI, 27.7%-30.9%) but the highest specificity for in-hospital mortality (93.4%; 95% CI, 93.1%-93.8%) and ED-to-ICU admission (95.2%; 95% CI, 94.9%-95.5%). The Shock Index had a sensitivity that fell between qSOFA and NEWS2 for in-hospital mortality (45.8%; 95% CI, 43.2%-48.5%) and ED-to-ICU admission (49.2%; 95% CI, 47.5%-51.0%). The specificity of the Shock Index also was between qSOFA and NEWS2 for in-hospital mortality (83.9%; 95% CI, 83.4%-84.3%) and ED-to-ICU admission (86.8%; 95% CI, 86.4%-87.3%). All three scores exhibited relatively low PPV, ranging from 9.2% to 23.4% for in-hospital mortality and 21.0% to 48.0% for ED-to-ICU triage. Conversely, all three scores exhibited relatively high NPV, ranging from 95.5% to 97.1% for in-hospital mortality and 89.8% to 94.5% for ED-to-ICU triage.
When considering a binary cutoff, the Shock Index exhibited the highest AUROC for in-hospital mortality (0.648; 95% CI, 0.635-0.662) and had a significantly higher AUROC than qSOFA (AUROC, 0.625; 95% CI, 0.612-0.637; P = .0005), but there was no difference compared with NEWS2 (AUROC, 0.640; 95% CI, 0.628-0.652; P = .2112). NEWS2 had a significantly higher AUROC than qSOFA for predicting in-hospital mortality (P = .0227). The Shock Index also exhibited the highest AUROC for ED-to-ICU admission (0.680; 95% CI, 0.617-0.689), which was significantly higher than the AUROC for qSOFA (P < .0001) and NEWS2 (P = 0.0151). NEWS2 had a significantly higher AUROC than qSOFA for predicting ED-to-ICU admission (P < .0001). Similar findings were seen in patients found to have sepsis.
DISCUSSION
In this retrospective cohort study of 23,837 patients who presented to the ED with suspected sepsis, the standard qSOFA threshold was met least frequently, followed by the Shock Index and NEWS2. NEWS2 had the highest sensitivity but the lowest specificity for predicting in-hospital mortality and ED-to-ICU admission, making it a challenging bedside risk stratification scale for identifying patients at risk of poor clinical outcomes. When comparing predictive performance among the three scales, qSOFA had the highest specificity and the Shock Index had the highest AUROC for in-hospital mortality and ED-to-ICU admission in this cohort of patients with suspected sepsis. These trends in sensitivity, specificity, and AUROC were consistent among those who met EHR criteria for a sepsis diagnosis. In the analysis of the three scoring systems using all available cut-points, qSOFA and NEWS2 had the highest AUROCs, followed by the Shock Index.
Considering the rapid progression from organ dysfunction to death in sepsis patients, as well as the difficulty establishing a sepsis diagnosis at triage,23 providers must quickly identify patients at increased risk of poor outcomes when they present to the ED. Sepsis alerts often are built using SIRS criteria,27 including the one used for sepsis surveillance at UCSF since 2012,22 but the white blood cell count criterion is subject to a laboratory lag and could lead to a delay in identification. Implementation of a point-of-care bedside score alert that uses readily available clinical data could allow providers to identify patients at greatest risk of poor outcomes immediately at ED presentation and triage, which motivated us to explore the predictive performance of qSOFA, the Shock Index, and NEWS2.
Our study is the first to provide a head-to-head comparison of the predictive performance of qSOFA, the Shock Index, and NEWS2, three easy-to-calculate bedside risk scores that use EHR data collected among patients with suspected sepsis. The Sepsis-3 guidelines recommend qSOFA to quickly identify non-ICU patients at greatest risk of poor outcomes because the measure exhibited predictive performance similar to the more extensive SOFA score outside the ICU.16,23 Although some studies have confirmed qSOFA’s high predictive performance,28-31 our test characteristics and AUROC findings are in line with other published analyses.4,6,10,17 The UK National Health Service is using NEWS2 to screen for patients at risk of poor outcomes from sepsis. Several analyses that assessed the predictive ability of NEWS have reported estimates in line with our findings.4,10,32 The Shock Index was introduced in 1967 and provided a metric to evaluate hemodynamic stability based on heart rate and systolic blood pressure.33 The Shock Index has been studied in several contexts, including sepsis,34 and studies show that a sustained Shock Index is associated with increased odds of vasopressor administration, higher prevalence of hyperlactatemia, and increased risk of poor outcomes in the ICU.13,14
For our study, we were particularly interested in exploring how the Shock Index would compare with more frequently used severity scores such as qSOFA and NEWS2 among patients with suspected sepsis, given the simplicity of its calculation and the easy availability of required data. In our cohort of 23,837 patients, only 159 people had missing blood pressure and only 71 had omitted heart rate. In contrast, both qSOFA and NEWS2 include an assessment of level of consciousness that can be subject to variability in assessment methods and EHR documentation across institutions.11 In our cohort, GCS within 30 minutes of ED presentation was missing in 72 patients, which could have led to incomplete calculation of qSOFA and NEWS2 if a missing value was not actually within normal limits.
Several investigations relate qSOFA to NEWS but few compare qSOFA with the newer NEWS2, and even fewer evaluate the Shock Index with any of these scores.10,11,18,29,35-37 In general, studies have shown that NEWS exhibits a higher AUROC for predicting mortality, sepsis with organ dysfunction, and ICU admission, often as a composite outcome.4,11,18,37,38 A handful of studies compare the Shock Index to SIRS; however, little has been done to compare the Shock Index to qSOFA or NEWS2, scores that have been used specifically for sepsis and might be more predictive of poor outcomes than SIRS.33 In our study, the Shock Index had a higher AUROC than either qSOFA or NEWS2 for predicting in-hospital mortality and ED-to-ICU admission measured as separate outcomes and as a composite outcome using standard cut-points for these scores.
When selecting a severity score to apply in an institution, it is important to carefully evaluate the score’s test characteristics, in addition to considering the availability of reliable data. Tests with high sensitivity and NPV for the population being studied can be useful to rule out disease or risk of poor outcome, while tests with high specificity and PPV can be useful to rule in disease or risk of poor outcome.39 When considering specificity, qSOFA’s performance was superior to the Shock Index and NEWS2 in our study, but a small percentage of the population was identified using a cut-point of qSOFA ≥2. If we used qSOFA and applied this standard cut-point at our institution, we could be confident that those identified were at increased risk, but we would miss a significant number of patients who would experience a poor outcome. When considering sensitivity, performance of NEWS2 was superior to qSOFA and the Shock Index in our study, but one-half of the population was identified using a cut-point of NEWS2 ≥5. If we were to apply this standard NEWS2 cut-point at our institution, we would assume that one-half of our population was at risk, which might drive resource use towards patients who will not experience a poor outcome. Although none of the scores exhibited a robust AUROC measure, the Shock Index had the highest AUROC for in-hospital mortality and ED-to-ICU admission when using the standard binary cut-point, and its sensitivity and specificity is between that of qSOFA and NEWS2, potentially making it a score to use in settings where qSOFA and NEWS2 score components, such as altered mentation, are not reliably collected. Finally, our sensitivity analysis varying the binary cut-point of each score within our population demonstrated that the standard cut-points might not be as useful within a specific population and might need to be tailored for implementation, balancing sensitivity, specificity, PPV, and NPV to meet local priorities and ICU capacity.
Our study has limitations. It is a single-center, retrospective analysis, factors that could reduce generalizability. However, it does include a large and diverse patient population spanning several years. Missing GCS data could have affected the predictive ability of qSOFA and NEWS2 in our cohort. We could not reliably perform imputation of GCS because of the high missingness and therefore we assumed missing was normal, as was done in the Sepsis-3 derivation studies.16 Previous studies have attempted to impute GCS and have not observed improved performance of qSOFA to predict mortality.40 Because manually collected variables such as GCS are less reliably documented in the EHR, there might be limitations in their use for triage risk scores.
Although the current analysis focused on the predictive performance of qSOFA, the Shock Index, and NEWS2 at triage, performance of these scores could affect the ED team’s treatment decisions before handoff to the hospitalist team and the expected level of care the patient will receive after in-patient admission. These tests also have the advantage of being easy to calculate at the bedside over time, which could provide an objective assessment of longitudinal predicted prognosis.
CONCLUSION
Local priorities should drive selection of a screening tool, balancing sensitivity, specificity, PPV, and NPV to achieve the institution’s goals. qSOFA, Shock Index, and NEWS2 are risk stratification tools that can be easily implemented at ED triage using data available at the bedside. Although none of these scores performed strongly when comparing AUROCs, qSOFA was highly specific for identifying patients with poor outcomes, and NEWS2 was the most sensitive for ruling out those at high risk among patients with suspected sepsis. The Shock Index exhibited a sensitivity and specificity that fell between qSOFA and NEWS2 and also might be considered to identify those at increased risk, given its ease of implementation, particularly in settings where altered mentation is unreliably or inconsistently documented.
Acknowledgment
The authors thank the UCSF Division of Hospital Medicine Data Core for their assistance with data acquisition.
1. Jones SL, Ashton CM, Kiehne LB, et al. Outcomes and resource use of sepsis-associated stays by presence on admission, severity, and hospital type. Med Care. 2016;54(3):303-310. https://doi.org/10.1097/MLR.0000000000000481
2. Seymour CW, Gesten F, Prescott HC, et al. Time to treatment and mortality during mandated emergency care for sepsis. N Engl J Med. 2017;376(23):2235-2244. https://doi.org/10.1056/NEJMoa1703058
3. Kumar A, Roberts D, Wood KE, et al. Duration of hypotension before initiation of effective antimicrobial therapy is the critical determinant of survival in human septic shock. Crit Care Med. 2006;34(6):1589-1596. https://doi.org/10.1097/01.CCM.0000217961.75225.E9
4. Churpek MM, Snyder A, Sokol S, Pettit NN, Edelson DP. Investigating the impact of different suspicion of infection criteria on the accuracy of Quick Sepsis-Related Organ Failure Assessment, Systemic Inflammatory Response Syndrome, and Early Warning Scores. Crit Care Med. 2017;45(11):1805-1812. https://doi.org/10.1097/CCM.0000000000002648
5. Abdullah SMOB, Sørensen RH, Dessau RBC, Sattar SMRU, Wiese L, Nielsen FE. Prognostic accuracy of qSOFA in predicting 28-day mortality among infected patients in an emergency department: a prospective validation study. Emerg Med J. 2019;36(12):722-728. https://doi.org/10.1136/emermed-2019-208456
6. Kim KS, Suh GJ, Kim K, et al. Quick Sepsis-related Organ Failure Assessment score is not sensitive enough to predict 28-day mortality in emergency department patients with sepsis: a retrospective review. Clin Exp Emerg Med. 2019;6(1):77-83. HTTPS://DOI.ORG/ 10.15441/ceem.17.294
7. National Early Warning Score (NEWS) 2: Standardising the assessment of acute-illness severity in the NHS. Royal College of Physicians; 2017.
8. Brink A, Alsma J, Verdonschot RJCG, et al. Predicting mortality in patients with suspected sepsis at the emergency department: a retrospective cohort study comparing qSOFA, SIRS and National Early Warning Score. PLoS One. 2019;14(1):e0211133. https://doi.org/ 10.1371/journal.pone.0211133
9. Redfern OC, Smith GB, Prytherch DR, Meredith P, Inada-Kim M, Schmidt PE. A comparison of the Quick Sequential (Sepsis-Related) Organ Failure Assessment Score and the National Early Warning Score in non-ICU patients with/without infection. Crit Care Med. 2018;46(12):1923-1933. https://doi.org/10.1097/CCM.0000000000003359
10. Churpek MM, Snyder A, Han X, et al. Quick Sepsis-related Organ Failure Assessment, Systemic Inflammatory Response Syndrome, and Early Warning Scores for detecting clinical deterioration in infected patients outside the intensive care unit. Am J Respir Crit Care Med. 2017;195(7):906-911. https://doi.org/10.1164/rccm.201604-0854OC
11. Goulden R, Hoyle MC, Monis J, et al. qSOFA, SIRS and NEWS for predicting inhospital mortality and ICU admission in emergency admissions treated as sepsis. Emerg Med J. 2018;35(6):345-349. https://doi.org/10.1136/emermed-2017-207120
12. Biney I, Shepherd A, Thomas J, Mehari A. Shock Index and outcomes in patients admitted to the ICU with sepsis. Chest. 2015;148(suppl 4):337A. https://doi.org/https://doi.org/10.1378/chest.2281151
13. Wira CR, Francis MW, Bhat S, Ehrman R, Conner D, Siegel M. The shock index as a predictor of vasopressor use in emergency department patients with severe sepsis. West J Emerg Med. 2014;15(1):60-66. https://doi.org/10.5811/westjem.2013.7.18472
14. Berger T, Green J, Horeczko T, et al. Shock index and early recognition of sepsis in the emergency department: pilot study. West J Emerg Med. 2013;14(2):168-174. https://doi.org/10.5811/westjem.2012.8.11546
15. Middleton DJ, Smith TO, Bedford R, Neilly M, Myint PK. Shock Index predicts outcome in patients with suspected sepsis or community-acquired pneumonia: a systematic review. J Clin Med. 2019;8(8):1144. https://doi.org/10.3390/jcm8081144
16. Seymour CW, Liu VX, Iwashyna TJ, et al. Assessment of clinical criteria for sepsis: for the Third International Consensus Definitions for Sepsis and Septic Shock (Sepsis-3). JAMA. 2016;315(8):762-774. https://doi.org/ 10.1001/jama.2016.0288
17. Abdullah S, Sørensen RH, Dessau RBC, Sattar S, Wiese L, Nielsen FE. Prognostic accuracy of qSOFA in predicting 28-day mortality among infected patients in an emergency department: a prospective validation study. Emerg Med J. 2019;36(12):722-728. https://doi.org/10.1136/emermed-2019-208456
18. Usman OA, Usman AA, Ward MA. Comparison of SIRS, qSOFA, and NEWS for the early identification of sepsis in the Emergency Department. Am J Emerg Med. 2018;37(8):1490-1497. https://doi.org/10.1016/j.ajem.2018.10.058
19. Elixhauser A, Steiner C, Harris DR, Coffey RM. Comorbidity measures for use with administrative data. Med Care. 1998;36(1):8-27. https://doi.org/10.1097/00005650-199801000-00004
20. van Walraven C, Austin PC, Jennings A, Quan H, Forster AJ. A modification of the Elixhauser comorbidity measures into a point system for hospital death using administrative data. Med Care. 2009;47(6):626-633. https://doi.org/10.1097/MLR.0b013e31819432e5
21. Prin M, Wunsch H. The role of stepdown beds in hospital care. Am J Respir Crit Care Med. 2014;190(11):1210-1216. https://doi.org/10.1164/rccm.201406-1117PP
22. Narayanan N, Gross AK, Pintens M, Fee C, MacDougall C. Effect of an electronic medical record alert for severe sepsis among ED patients. Am J Emerg Med. 2016;34(2):185-188. https://doi.org/10.1016/j.ajem.2015.10.005
23. Singer M, Deutschman CS, Seymour CW, et al. The Third International Consensus Definitions for Sepsis and Septic Shock (Sepsis-3). JAMA. 2016;315(8):801-810. https://doi.org/10.1001/jama.2016.0287
24. Rhee C, Dantes R, Epstein L, et al. Incidence and trends of sepsis in US hospitals using clinical vs claims data, 2009-2014. JAMA. 2017;318(13):1241-1249. https://doi.org/10.1001/jama.2017.13836
25. Safari S, Baratloo A, Elfil M, Negida A. Evidence based emergency medicine; part 5 receiver operating curve and area under the curve. Emerg (Tehran). 2016;4(2):111-113.
26. DeLong ER, DeLong DM, Clarke-Pearson DL. Comparing the areas under two or more correlated receiver operating characteristic curves: a nonparametric approach. Biometrics. 1988;44(3):837-845.
27. Kangas C, Iverson L, Pierce D. Sepsis screening: combining Early Warning Scores and SIRS Criteria. Clin Nurs Res. 2021;30(1):42-49. https://doi.org/10.1177/1054773818823334.
28. Freund Y, Lemachatti N, Krastinova E, et al. Prognostic accuracy of Sepsis-3 Criteria for in-hospital mortality among patients with suspected infection presenting to the emergency department. JAMA. 2017;317(3):301-308. https://doi.org/10.1001/jama.2016.20329
29. Finkelsztein EJ, Jones DS, Ma KC, et al. Comparison of qSOFA and SIRS for predicting adverse outcomes of patients with suspicion of sepsis outside the intensive care unit. Crit Care. 2017;21(1):73. https://doi.org/10.1186/s13054-017-1658-5
30. Canet E, Taylor DM, Khor R, Krishnan V, Bellomo R. qSOFA as predictor of mortality and prolonged ICU admission in Emergency Department patients with suspected infection. J Crit Care. 2018;48:118-123. https://doi.org/10.1016/j.jcrc.2018.08.022
31. Anand V, Zhang Z, Kadri SS, Klompas M, Rhee C; CDC Prevention Epicenters Program. Epidemiology of Quick Sequential Organ Failure Assessment criteria in undifferentiated patients and association with suspected infection and sepsis. Chest. 2019;156(2):289-297. https://doi.org/10.1016/j.chest.2019.03.032
32. Hamilton F, Arnold D, Baird A, Albur M, Whiting P. Early Warning Scores do not accurately predict mortality in sepsis: A meta-analysis and systematic review of the literature. J Infect. 2018;76(3):241-248. https://doi.org/10.1016/j.jinf.2018.01.002
33. Koch E, Lovett S, Nghiem T, Riggs RA, Rech MA. Shock Index in the emergency department: utility and limitations. Open Access Emerg Med. 2019;11:179-199. https://doi.org/10.2147/OAEM.S178358
34. Yussof SJ, Zakaria MI, Mohamed FL, Bujang MA, Lakshmanan S, Asaari AH. Value of Shock Index in prognosticating the short-term outcome of death for patients presenting with severe sepsis and septic shock in the emergency department. Med J Malaysia. 2012;67(4):406-411.
35. Siddiqui S, Chua M, Kumaresh V, Choo R. A comparison of pre ICU admission SIRS, EWS and q SOFA scores for predicting mortality and length of stay in ICU. J Crit Care. 2017;41:191-193. https://doi.org/10.1016/j.jcrc.2017.05.017
36. Costa RT, Nassar AP, Caruso P. Accuracy of SOFA, qSOFA, and SIRS scores for mortality in cancer patients admitted to an intensive care unit with suspected infection. J Crit Care. 2018;45:52-57. https://doi.org/10.1016/j.jcrc.2017.12.024
37. Mellhammar L, Linder A, Tverring J, et al. NEWS2 is Superior to qSOFA in detecting sepsis with organ dysfunction in the emergency department. J Clin Med. 2019;8(8):1128. https://doi.org/10.3390/jcm8081128
38. Szakmany T, Pugh R, Kopczynska M, et al. Defining sepsis on the wards: results of a multi-centre point-prevalence study comparing two sepsis definitions. Anaesthesia. 2018;73(2):195-204. https://doi.org/10.1111/anae.14062
39. Newman TB, Kohn MA. Evidence-Based Diagnosis: An Introduction to Clinical Epidemiology. Cambridge University Press; 2009.
40. Askim Å, Moser F, Gustad LT, et al. Poor performance of quick-SOFA (qSOFA) score in predicting severe sepsis and mortality - a prospective study of patients admitted with infection to the emergency department. Scand J Trauma Resusc Emerg Med. 2017;25(1):56. https://doi.org/10.1186/s13049-017-0399-4
© 2021 Society of Hospital Medicine
Hospital Ward Adaptation During the COVID-19 Pandemic: A National Survey of Academic Medical Centers
The coronavirus disease of 2019 (COVID-19) pandemic has resulted in a surge in hospitalizations of patients with a novel, serious, and highly contagious infectious disease for which there is yet no proven treatment. Currently, much of the focus has been on intensive care unit (ICU) and ventilator capacity for the sickest of these patients who develop respiratory failure. However, most hospitalized patients are being cared for in general medical units.1 Some evidence exists to describe adaptations to capacity needs outside of medical wards,2-4 but few studies have specifically addressed the ward setting. Therefore, there is a pressing need for evidence to describe how to expand capacity and deliver medical ward–based care.
To better understand how inpatient care in the United States is adapting to the COVID-19 pandemic, we surveyed 72 sites participating in the Hospital Medicine Reengineering Network (HOMERuN), a national consortium of hospital medicine groups.5 We report results of this survey, carried out between April 3 and April 5, 2020.
METHODS
Sites and Subjects
HOMERuN is a collaborative network of hospitalists from across the United States whose primary goal is to catalyze research and share best practices across hospital medicine groups. Using surveys of Hospital Medicine leaders, targeted medical record review, and other methods, HOMERuN’s funded research interests to date have included care transitions, workforce issues, patient and family engagement, and diagnostic errors. Sites participating in HOMERuN sites are relatively large urban academic medical centers (Appendix).
Survey Development and Deployment
We designed a focused survey that aimed to provide a snapshot of evolving operational and clinical aspects of COVID-19 care (Appendix). Domains included COVID-19 testing turnaround times, personal protective equipment (PPE) stewardship,6 features of respiratory isolation units (RIUs; ie, dedicated units for patients with known or suspected COVID-19), and observed effects on clinical care. We tested the instrument to ensure feasibility and clarity internally, performed brief cognitive testing with several hospital medicine leaders in HOMERuN, then disseminated the survey by email on April 3, with two follow-up emails on 2 subsequent days. Our study was deemed non–human subjects research by the University of California, San Francisco, Committee on Human Research. Descriptive statistics were used to characterize survey responses.
RESULTS
Of 72 hospitals surveyed, 51 (71%) responded. Mean hospital bed count was 940, three were safety-net hospitals, and one was a community-based teaching center; responding and nonresponding hospitals did not differ significantly in terms of bed count (Appendix).
Health System Adaptations, Testing, and PPE Status
Nearly all responding hospitals (46 of 51; 90%) had RIUs for patients with known or suspected COVID-19 (Table 1). Nearly all hospitals took steps to keep potentially sick healthcare providers from infecting others (eg, staying home if sick or exposed). Among respondents, 32% had rapid response teams, 24% had respiratory therapy teams, and 29% had case management teams that were dedicated to COVID-19 care. Thirty-two (63%) had developed models, such as ethics or palliative care consult services, to assist with difficult resource-allocation decisions (eg, how to prioritize ventilator use if demand exceeded supply). Twenty-three (45%) had developed post-acute care monitoring programs dedicated to COVID-19 patients.

At the time of our survey, only 2 sites (4%) reported COVID-19 test time turnaround under 1 hour, and 15 (30%) reported turnaround in less than 6 hours. Of the 29 sites able to provide estimates of PPE stockpile, 14 (48%) reported a supply of 2 weeks or less. The most common approaches to PPE stewardship focused on reuse of masks and face shields if not obviously soiled, centralizing PPE distribution, and disinfecting or sterilizing masks. Ten sites (20%) were utilizing 3-D printed masks, while 10% used homemade face shields or masks.
Characteristics of COVID-19 RIUs
Forty-six hospitals (90% of all respondents) in our cohort had developed RIUs at the time of survey administration. The earliest RIU implementation date was February 10, 2020, and the most recent was launched on the day of our survey. Admission to RIUs was primarily based on clinical factors associated with known or suspected COVID-19 infection (Table 2). The number of non–critical care RIU beds among locations at that time ranged from 10 or less to more than 50. The mean number of hospitalist attendings caring for patients in the RIUs was 10.2, with a mean 4.1 advanced practice providers, 5.5 residents, and 0 medical students. The number of planned patients per attending was typically 5 to 15. Nurses and physicians typically rounded separately. Medical distancing (eg, reducing patient room entry) was accomplished most commonly by grouped timing of medication administration (76% of sites), video links to room outside of rounding times (54% of sites), the use of video or telemedicine during rounds (17%), and clustering of activities such as medication administration or phlebotomy. The most common criteria prompting discharge from the RIU were a negative COVID-19 test (59%) and hospital discharge (57%), though comments from many respondents suggested that discharge criteria were changing rapidly.

Effects of Isolation Measures on In-Room Encounters and Diagnostic Processes
More than 90% of sites reported decreases in in-room encounter frequency across all provider types whether as a result of policies in place or not. Reductions were reported among hospitalists, advanced practice providers, residents, consultants, and therapists (Table 3). Reduced room entry most often resulted from an established or developing policy, but many noted reduced room entry without formal policies in place. Nearly all sites reported moving specialty consultations to phone or video evaluations. Diagnostic error was commonly reported, with missed non–COVID-19 medical diagnoses among COVID-19 infected patients being reported by 22 sites (46%) and missed COVID-19 diagnoses in patients admitted for other reasons by 22 sites (45%).

DISCUSSION
In this study of medical wards at academic medical centers, we found that, in response to the COVID-19 pandemic, hospitals made several changes in a short period of time to adapt to the crisis. These included implementation and rapid expansion of dedicated RIUs, greatly expanded use of inpatient telehealth for patient assessments and consultation, implementation of other approaches to minimize room entry (such as grouping in-room activities), and deployment of ethics consultation services to help manage issues around potential scarcity of life-saving measures such as ventilators. We also found that availability of PPE and timely testing was limited. Finally, a large proportion of sites reported potential diagnostic problems in the assessment of both patients suspected and those not suspected of having COVID-19.
RIUs are emerging as a primary modality for caring for non-ICU COVID-19 patients, though they never involved medical students; we hope the role of students in particular will increase as new models of training emerge in response to the pandemic.7 In contrast, telemedicine evolved rapidly to hold a substantial role in RIUs, with both ward and specialty teams using video visit technology to communicate with patients. COVID-19 has been viewed as a perfect use case for outpatient telemedicine,8 and a growing number of studies are examining its outpatient use9,10; however, to date, somewhat less attention has been paid to inpatient deployment. Although our data suggest telemedicine has found a prominent place in RIUs, it remains to be seen whether it is associated with differences in patient or provider outcomes. For example, deficiencies in the physical examination, limited face-to-face contact, and lack of physical presence could all affect the patient–provider relationship, patient engagement, and the accuracy of the diagnostic process.
Our data suggest the possibility of missing non–COVID-19 diagnoses in patients suspected of COVID-19 and missing COVID-19 in those admitted for nonrespiratory reasons. The latter may be addressed as routine COVID-19 screening of admitted patients becomes commonplace. For the former, however, it is possible that physicians are “anchoring” their thinking on COVID-19 to the exclusion of other diagnoses, that physicians are not fully aware of complications unique to COVID-19 infection (such as thromboembolism), and/or that the above-mentioned limitations of telemedicine have decreased diagnostic performance.
Although PPE stockpile data were not easily available for some sites, a distressingly large number reported stockpiles of 2 weeks or less, with reuse being the most common approach to extending PPE supply. We also found it concerning that 43% of hospital leaders did not know their stockpile data; we believe this is an important question that hospital leaders need to be asking. Most sites in our study reported test turnaround times of longer than 6 hours; lack of rapid COVID-19 testing further stresses PPE stockpile and may slow patients’ transition out of the RIU or discharge to home.
Our study has several limitations, including the evolving nature of the pandemic and rapid adaptations of care systems in the pandemic’s surge phase. However, we attempted to frame our questions in ways that provided a focused snapshot of care. Furthermore, respondents may not have had exhaustive knowledge of their institution’s COVID-19 response strategies, but most were the directors of their hospitalist services, and we encouraged the respondents to confer with others to gather high-fidelity data. Finally, as a survey of large academic medical centers, our results may not apply to nonacademic centers.
Approaches to caring for non-ICU patients during the COVID-19 pandemic are rapidly evolving. Expansion of RIUs and developing the workforce to support them has been a primary focus, with rapid innovation in use of technology emerging as a critical adaptation while PPE limitations persist and needs for “medical distancing” continue to grow. Although rates of missed COVID-19 diagnoses will likely be reduced with testing and systems improvements, physicians and systems will also need to consider how to utilize emerging technology in ways that can improve clinical care and provider safety while aiding diagnostic thinking. This survey illustrates the rapid adaptations made by our hospitals in response to the pandemic; ongoing adaptation will likely be needed to optimally care for hospitalized patients with COVID-19 while the pandemic continues to evolve.
Acknowledgment
Thanks to members of the HOMERuN COVID-19 Collaborative Group: Baylor Scott & White Medical Center – Temple, Texas - Tresa McNeal MD; Beth Israel Deaconess Medical Center - Shani Herzig MD MPH, Joseph Li MD, Julius Yang MD PhD; Brigham and Women’s Hospital - Christopher Roy MD, Jeffrey Schnipper MD MPH; Cedars-Sinai Medical Center - Ed Seferian MD, ; ChristianaCare - Surekha Bhamidipati MD; Cleveland Clinic - Matthew Pappas MD MPH; Dartmouth-Hitchcock Medical Center - Jonathan Lurie MD MS; Dell Medical School at The University of Texas at Austin - Chris Moriates MD, Luci Leykum MD MBA MSc; Denver Health and Hospitals Authority - Diana Mancini MD; Emory University Hospital - Dan Hunt MD; Johns Hopkins Hospital - Daniel J Brotman MD, Zishan K Siddiqui MD, Shaker Eid MD MBA; Maine Medical Center - Daniel A Meyer MD, Robert Trowbridge MD; Massachusetts General Hospital - Melissa Mattison MD; Mayo Clinic Rochester – Caroline Burton MD, Sagar Dugani MD PhD; Medical College of Wisconsin - Sanjay Bhandari MD; Miriam Hospital - Kwame Dapaah-Afriyie MD MBA; Mount Sinai Hospital - Andrew Dunn MD; NorthShore - David Lovinger MD; Northwestern Memorial Hospital - Kevin O’Leary MD MS; Ohio State University Wexner Medical Center - Eric Schumacher DO; Oregon Health & Science University - Angela Alday MD; Penn Medicine - Ryan Greysen MD MHS MA; Rutgers- Robert Wood Johnson University Hospital - Michael Steinberg MD MPH; Stanford University School of Medicine - Neera Ahuja MD; Tulane Hospital and University Medical Center - Geraldine Ménard MD; UC San Diego Health - Ian Jenkins MD; UC Los Angeles Health - Michael Lazarus MD, Magdalena E. Ptaszny, MD; UC San Francisco Health - Bradley A Sharpe, MD, Margaret Fang MD MPH; UK HealthCare - Mark Williams MD MHM, John Romond MD; University of Chicago – David Meltzer MD PhD, Gregory Ruhnke MD; University of Colorado - Marisha Burden MD; University of Florida - Nila Radhakrishnan MD; University of Iowa Hospitals and Clinics - Kevin Glenn MD MS; University of Miami - Efren Manjarrez MD; University of Michigan - Vineet Chopra MD MSc, Valerie Vaughn MD MSc; University of Missouri-Columbia Hospital - Hasan Naqvi MD; University of Nebraska Medical Center - Chad Vokoun MD; University of North Carolina at Chapel Hill - David Hemsey MD; University of Pittsburgh Medical Center - Gena Marie Walker MD; University of Vermont Medical Center - Steven Grant MD; University of Washington Medical Center - Christopher Kim MD MBA, Andrew White MD; University of Washington-Harborview Medical Center - Maralyssa Bann MD; University of Wisconsin Hospital and Clinics - David Sterken MD, Farah Kaiksow MD MPP, Ann Sheehy MD MS, Jordan Kenik MD MPH; UW Northwest Campus - Ben Wolpaw MD; Vanderbilt University Medical Center - Sunil Kripalani MD MSc, Eduard E Vasilevskis MD, Kathleene T Wooldridge MD MPH; Wake Forest Baptist Health - Erik Summers MD; Washington University St. Louis - Michael Lin MD; Weill Cornell - Justin Choi MD; Yale New Haven Hospital - William Cushing MA, Chris Sankey MD; Zuckerberg San Francisco General Hospital - Sumant Ranji MD.
1. Institute for Health Metrics and Evaluation. COVID-19 Projections: United States of America. 2020. Accessed May 5, 2020. https://covid19.healthdata.org/united-states-of-america
2. Iserson KV. Alternative care sites: an option in disasters. West J Emerg Med. 2020;21(3):484‐489. https://doi.org/10.5811/westjem.2020.4.47552
3. Paganini M, Conti A, Weinstein E, Della Corte F, Ragazzoni L. Translating COVID-19 pandemic surge theory to practice in the emergency department: how to expand structure [online first]. Disaster Med Public Health Prep. 2020:1-10. https://doi.org/10.1017/dmp.2020.57
4. Kumaraiah D, Yip N, Ivascu N, Hill L. Innovative ICU Physician Care Models: Covid-19 Pandemic at NewYork-Presbyterian. NEJM: Catalyst. April 28, 2020. Accessed May 5, 2020. https://catalyst.nejm.org/doi/full/10.1056/CAT.20.0158
5. Auerbach AD, Patel MS, Metlay JP, et al. The Hospital Medicine Reengineering Network (HOMERuN): a learning organization focused on improving hospital care. Acad Med. 2014;89(3):415-420. https://doi.org/10.1097/acm.0000000000000139
6. Livingston E, Desai A, Berkwits M. Sourcing personal protective equipment during the COVID-19 pandemic [online first]. JAMA. 2020. https://doi.org/10.1001/jama.2020.5317
7. Bauchner H, Sharfstein J. A bold response to the COVID-19 pandemic: medical students, national service, and public health [online first]. JAMA. 2020. https://doi.org/10.1001/jama.2020.6166
8. Hollander JE, Carr BG. Virtually perfect? telemedicine for Covid-19. N Engl J Med. 2020;382(18):1679‐1681. https://doi.org/10.1056/nejmp2003539
9. Hau YS, Kim JK, Hur J, Chang MC. How about actively using telemedicine during the COVID-19 pandemic? J Med Syst. 2020;44(6):108. https://doi.org/10.1007/s10916-020-01580-z
10. Smith WR, Atala AJ, Terlecki RP, Kelly EE, Matthews CA. Implementation guide for rapid integration of an outpatient telemedicine program during the COVID-19 pandemic [online first]. J Am Coll Surg. 2020. https://doi.org/10.1016/j.jamcollsurg.2020.04.030
The coronavirus disease of 2019 (COVID-19) pandemic has resulted in a surge in hospitalizations of patients with a novel, serious, and highly contagious infectious disease for which there is yet no proven treatment. Currently, much of the focus has been on intensive care unit (ICU) and ventilator capacity for the sickest of these patients who develop respiratory failure. However, most hospitalized patients are being cared for in general medical units.1 Some evidence exists to describe adaptations to capacity needs outside of medical wards,2-4 but few studies have specifically addressed the ward setting. Therefore, there is a pressing need for evidence to describe how to expand capacity and deliver medical ward–based care.
To better understand how inpatient care in the United States is adapting to the COVID-19 pandemic, we surveyed 72 sites participating in the Hospital Medicine Reengineering Network (HOMERuN), a national consortium of hospital medicine groups.5 We report results of this survey, carried out between April 3 and April 5, 2020.
METHODS
Sites and Subjects
HOMERuN is a collaborative network of hospitalists from across the United States whose primary goal is to catalyze research and share best practices across hospital medicine groups. Using surveys of Hospital Medicine leaders, targeted medical record review, and other methods, HOMERuN’s funded research interests to date have included care transitions, workforce issues, patient and family engagement, and diagnostic errors. Sites participating in HOMERuN sites are relatively large urban academic medical centers (Appendix).
Survey Development and Deployment
We designed a focused survey that aimed to provide a snapshot of evolving operational and clinical aspects of COVID-19 care (Appendix). Domains included COVID-19 testing turnaround times, personal protective equipment (PPE) stewardship,6 features of respiratory isolation units (RIUs; ie, dedicated units for patients with known or suspected COVID-19), and observed effects on clinical care. We tested the instrument to ensure feasibility and clarity internally, performed brief cognitive testing with several hospital medicine leaders in HOMERuN, then disseminated the survey by email on April 3, with two follow-up emails on 2 subsequent days. Our study was deemed non–human subjects research by the University of California, San Francisco, Committee on Human Research. Descriptive statistics were used to characterize survey responses.
RESULTS
Of 72 hospitals surveyed, 51 (71%) responded. Mean hospital bed count was 940, three were safety-net hospitals, and one was a community-based teaching center; responding and nonresponding hospitals did not differ significantly in terms of bed count (Appendix).
Health System Adaptations, Testing, and PPE Status
Nearly all responding hospitals (46 of 51; 90%) had RIUs for patients with known or suspected COVID-19 (Table 1). Nearly all hospitals took steps to keep potentially sick healthcare providers from infecting others (eg, staying home if sick or exposed). Among respondents, 32% had rapid response teams, 24% had respiratory therapy teams, and 29% had case management teams that were dedicated to COVID-19 care. Thirty-two (63%) had developed models, such as ethics or palliative care consult services, to assist with difficult resource-allocation decisions (eg, how to prioritize ventilator use if demand exceeded supply). Twenty-three (45%) had developed post-acute care monitoring programs dedicated to COVID-19 patients.
At the time of our survey, only 2 sites (4%) reported COVID-19 test time turnaround under 1 hour, and 15 (30%) reported turnaround in less than 6 hours. Of the 29 sites able to provide estimates of PPE stockpile, 14 (48%) reported a supply of 2 weeks or less. The most common approaches to PPE stewardship focused on reuse of masks and face shields if not obviously soiled, centralizing PPE distribution, and disinfecting or sterilizing masks. Ten sites (20%) were utilizing 3-D printed masks, while 10% used homemade face shields or masks.
Characteristics of COVID-19 RIUs
Forty-six hospitals (90% of all respondents) in our cohort had developed RIUs at the time of survey administration. The earliest RIU implementation date was February 10, 2020, and the most recent was launched on the day of our survey. Admission to RIUs was primarily based on clinical factors associated with known or suspected COVID-19 infection (Table 2). The number of non–critical care RIU beds among locations at that time ranged from 10 or less to more than 50. The mean number of hospitalist attendings caring for patients in the RIUs was 10.2, with a mean 4.1 advanced practice providers, 5.5 residents, and 0 medical students. The number of planned patients per attending was typically 5 to 15. Nurses and physicians typically rounded separately. Medical distancing (eg, reducing patient room entry) was accomplished most commonly by grouped timing of medication administration (76% of sites), video links to room outside of rounding times (54% of sites), the use of video or telemedicine during rounds (17%), and clustering of activities such as medication administration or phlebotomy. The most common criteria prompting discharge from the RIU were a negative COVID-19 test (59%) and hospital discharge (57%), though comments from many respondents suggested that discharge criteria were changing rapidly.
Effects of Isolation Measures on In-Room Encounters and Diagnostic Processes
More than 90% of sites reported decreases in in-room encounter frequency across all provider types whether as a result of policies in place or not. Reductions were reported among hospitalists, advanced practice providers, residents, consultants, and therapists (Table 3). Reduced room entry most often resulted from an established or developing policy, but many noted reduced room entry without formal policies in place. Nearly all sites reported moving specialty consultations to phone or video evaluations. Diagnostic error was commonly reported, with missed non–COVID-19 medical diagnoses among COVID-19 infected patients being reported by 22 sites (46%) and missed COVID-19 diagnoses in patients admitted for other reasons by 22 sites (45%).
DISCUSSION
In this study of medical wards at academic medical centers, we found that, in response to the COVID-19 pandemic, hospitals made several changes in a short period of time to adapt to the crisis. These included implementation and rapid expansion of dedicated RIUs, greatly expanded use of inpatient telehealth for patient assessments and consultation, implementation of other approaches to minimize room entry (such as grouping in-room activities), and deployment of ethics consultation services to help manage issues around potential scarcity of life-saving measures such as ventilators. We also found that availability of PPE and timely testing was limited. Finally, a large proportion of sites reported potential diagnostic problems in the assessment of both patients suspected and those not suspected of having COVID-19.
RIUs are emerging as a primary modality for caring for non-ICU COVID-19 patients, though they never involved medical students; we hope the role of students in particular will increase as new models of training emerge in response to the pandemic.7 In contrast, telemedicine evolved rapidly to hold a substantial role in RIUs, with both ward and specialty teams using video visit technology to communicate with patients. COVID-19 has been viewed as a perfect use case for outpatient telemedicine,8 and a growing number of studies are examining its outpatient use9,10; however, to date, somewhat less attention has been paid to inpatient deployment. Although our data suggest telemedicine has found a prominent place in RIUs, it remains to be seen whether it is associated with differences in patient or provider outcomes. For example, deficiencies in the physical examination, limited face-to-face contact, and lack of physical presence could all affect the patient–provider relationship, patient engagement, and the accuracy of the diagnostic process.
Our data suggest the possibility of missing non–COVID-19 diagnoses in patients suspected of COVID-19 and missing COVID-19 in those admitted for nonrespiratory reasons. The latter may be addressed as routine COVID-19 screening of admitted patients becomes commonplace. For the former, however, it is possible that physicians are “anchoring” their thinking on COVID-19 to the exclusion of other diagnoses, that physicians are not fully aware of complications unique to COVID-19 infection (such as thromboembolism), and/or that the above-mentioned limitations of telemedicine have decreased diagnostic performance.
Although PPE stockpile data were not easily available for some sites, a distressingly large number reported stockpiles of 2 weeks or less, with reuse being the most common approach to extending PPE supply. We also found it concerning that 43% of hospital leaders did not know their stockpile data; we believe this is an important question that hospital leaders need to be asking. Most sites in our study reported test turnaround times of longer than 6 hours; lack of rapid COVID-19 testing further stresses PPE stockpile and may slow patients’ transition out of the RIU or discharge to home.
Our study has several limitations, including the evolving nature of the pandemic and rapid adaptations of care systems in the pandemic’s surge phase. However, we attempted to frame our questions in ways that provided a focused snapshot of care. Furthermore, respondents may not have had exhaustive knowledge of their institution’s COVID-19 response strategies, but most were the directors of their hospitalist services, and we encouraged the respondents to confer with others to gather high-fidelity data. Finally, as a survey of large academic medical centers, our results may not apply to nonacademic centers.
Approaches to caring for non-ICU patients during the COVID-19 pandemic are rapidly evolving. Expansion of RIUs and developing the workforce to support them has been a primary focus, with rapid innovation in use of technology emerging as a critical adaptation while PPE limitations persist and needs for “medical distancing” continue to grow. Although rates of missed COVID-19 diagnoses will likely be reduced with testing and systems improvements, physicians and systems will also need to consider how to utilize emerging technology in ways that can improve clinical care and provider safety while aiding diagnostic thinking. This survey illustrates the rapid adaptations made by our hospitals in response to the pandemic; ongoing adaptation will likely be needed to optimally care for hospitalized patients with COVID-19 while the pandemic continues to evolve.
Acknowledgment
Thanks to members of the HOMERuN COVID-19 Collaborative Group: Baylor Scott & White Medical Center – Temple, Texas - Tresa McNeal MD; Beth Israel Deaconess Medical Center - Shani Herzig MD MPH, Joseph Li MD, Julius Yang MD PhD; Brigham and Women’s Hospital - Christopher Roy MD, Jeffrey Schnipper MD MPH; Cedars-Sinai Medical Center - Ed Seferian MD, ; ChristianaCare - Surekha Bhamidipati MD; Cleveland Clinic - Matthew Pappas MD MPH; Dartmouth-Hitchcock Medical Center - Jonathan Lurie MD MS; Dell Medical School at The University of Texas at Austin - Chris Moriates MD, Luci Leykum MD MBA MSc; Denver Health and Hospitals Authority - Diana Mancini MD; Emory University Hospital - Dan Hunt MD; Johns Hopkins Hospital - Daniel J Brotman MD, Zishan K Siddiqui MD, Shaker Eid MD MBA; Maine Medical Center - Daniel A Meyer MD, Robert Trowbridge MD; Massachusetts General Hospital - Melissa Mattison MD; Mayo Clinic Rochester – Caroline Burton MD, Sagar Dugani MD PhD; Medical College of Wisconsin - Sanjay Bhandari MD; Miriam Hospital - Kwame Dapaah-Afriyie MD MBA; Mount Sinai Hospital - Andrew Dunn MD; NorthShore - David Lovinger MD; Northwestern Memorial Hospital - Kevin O’Leary MD MS; Ohio State University Wexner Medical Center - Eric Schumacher DO; Oregon Health & Science University - Angela Alday MD; Penn Medicine - Ryan Greysen MD MHS MA; Rutgers- Robert Wood Johnson University Hospital - Michael Steinberg MD MPH; Stanford University School of Medicine - Neera Ahuja MD; Tulane Hospital and University Medical Center - Geraldine Ménard MD; UC San Diego Health - Ian Jenkins MD; UC Los Angeles Health - Michael Lazarus MD, Magdalena E. Ptaszny, MD; UC San Francisco Health - Bradley A Sharpe, MD, Margaret Fang MD MPH; UK HealthCare - Mark Williams MD MHM, John Romond MD; University of Chicago – David Meltzer MD PhD, Gregory Ruhnke MD; University of Colorado - Marisha Burden MD; University of Florida - Nila Radhakrishnan MD; University of Iowa Hospitals and Clinics - Kevin Glenn MD MS; University of Miami - Efren Manjarrez MD; University of Michigan - Vineet Chopra MD MSc, Valerie Vaughn MD MSc; University of Missouri-Columbia Hospital - Hasan Naqvi MD; University of Nebraska Medical Center - Chad Vokoun MD; University of North Carolina at Chapel Hill - David Hemsey MD; University of Pittsburgh Medical Center - Gena Marie Walker MD; University of Vermont Medical Center - Steven Grant MD; University of Washington Medical Center - Christopher Kim MD MBA, Andrew White MD; University of Washington-Harborview Medical Center - Maralyssa Bann MD; University of Wisconsin Hospital and Clinics - David Sterken MD, Farah Kaiksow MD MPP, Ann Sheehy MD MS, Jordan Kenik MD MPH; UW Northwest Campus - Ben Wolpaw MD; Vanderbilt University Medical Center - Sunil Kripalani MD MSc, Eduard E Vasilevskis MD, Kathleene T Wooldridge MD MPH; Wake Forest Baptist Health - Erik Summers MD; Washington University St. Louis - Michael Lin MD; Weill Cornell - Justin Choi MD; Yale New Haven Hospital - William Cushing MA, Chris Sankey MD; Zuckerberg San Francisco General Hospital - Sumant Ranji MD.
1. Institute for Health Metrics and Evaluation. COVID-19 Projections: United States of America. 2020. Accessed May 5, 2020. https://covid19.healthdata.org/united-states-of-america
2. Iserson KV. Alternative care sites: an option in disasters. West J Emerg Med. 2020;21(3):484‐489. https://doi.org/10.5811/westjem.2020.4.47552
3. Paganini M, Conti A, Weinstein E, Della Corte F, Ragazzoni L. Translating COVID-19 pandemic surge theory to practice in the emergency department: how to expand structure [online first]. Disaster Med Public Health Prep. 2020:1-10. https://doi.org/10.1017/dmp.2020.57
4. Kumaraiah D, Yip N, Ivascu N, Hill L. Innovative ICU Physician Care Models: Covid-19 Pandemic at NewYork-Presbyterian. NEJM: Catalyst. April 28, 2020. Accessed May 5, 2020. https://catalyst.nejm.org/doi/full/10.1056/CAT.20.0158
5. Auerbach AD, Patel MS, Metlay JP, et al. The Hospital Medicine Reengineering Network (HOMERuN): a learning organization focused on improving hospital care. Acad Med. 2014;89(3):415-420. https://doi.org/10.1097/acm.0000000000000139
6. Livingston E, Desai A, Berkwits M. Sourcing personal protective equipment during the COVID-19 pandemic [online first]. JAMA. 2020. https://doi.org/10.1001/jama.2020.5317
7. Bauchner H, Sharfstein J. A bold response to the COVID-19 pandemic: medical students, national service, and public health [online first]. JAMA. 2020. https://doi.org/10.1001/jama.2020.6166
8. Hollander JE, Carr BG. Virtually perfect? telemedicine for Covid-19. N Engl J Med. 2020;382(18):1679‐1681. https://doi.org/10.1056/nejmp2003539
9. Hau YS, Kim JK, Hur J, Chang MC. How about actively using telemedicine during the COVID-19 pandemic? J Med Syst. 2020;44(6):108. https://doi.org/10.1007/s10916-020-01580-z
10. Smith WR, Atala AJ, Terlecki RP, Kelly EE, Matthews CA. Implementation guide for rapid integration of an outpatient telemedicine program during the COVID-19 pandemic [online first]. J Am Coll Surg. 2020. https://doi.org/10.1016/j.jamcollsurg.2020.04.030
© 2020 Society of Hospital Medicine
The Association between Limited English Proficiency and Sepsis Mortality
Sepsis is defined as a life-threatening organ dysfunction that occurs in response to systemic infection.1,2 It is frequently fatal, common in hospital medicine, and a leading contributor to critical illness, morbidity, and healthcare expenditures.2-5 While sepsis care and outcomes have improved in the past decade,6,7 inpatient mortality remains high.8
A number of studies have sought to determine whether race plays a role in sepsis mortality. While Black patients with sepsis have frequently been identified as having the highest rates of death,9-14 similar observations have been made for most non-White races/ethnicities.13-15 Studies have also demonstrated higher rates of hospital-acquired infections among Asian and Latino patients.16
There are several possible explanations for why racial minorities experience disparate outcomes in sepsis, including access to care, comorbidities, implicit biases, and biological or environmental factors,17-20 as well as characteristics of hospitals most likely to care for racial minorities.13,15,21 One explanation that has not been explored is that racial disparities in sepsis are mediated by language. Limited English proficiency (LEP) has previously been associated with increased rates of adverse hospital events,22 longer length of stay,23 and greater likelihood of readmission.24 LEP has also been shown to represent a significant barrier to accessing healthcare and preventive screening.25 The role of LEP in sepsis mortality, however, has yet to be examined.
The diverse patient population at the University of California, San Francisco (UCSF) provides a unique opportunity to build upon existing literature by further exploring racial differences in sepsis, specifically by investigating the role of LEP. The objective of this study was to determine the association between LEP and inpatient mortality among adults hospitalized with sepsis.
METHODS
Setting
The study was conducted at the University of California, San Francisco, California (UCSF), an 800-bed tertiary care, academic medical center. It was approved by the UCSF Institutional Review Board with waiver of informed consent. UCSF cares for a population of patients who are racially and linguistically diverse, with high proportions of patients of East Asian descent and with LEP. According to recent United States census estimates, more than half of San Francisco County residents identify as non-White (35% Asians, 15% Hispanic/Latino, 6% Black), and 44% report speaking a language other than English at home.26
Study Population and Data Collection
The UCSF Medical Center uses the electronic health record (EHR) Epic (Epic 2017, Epic Systems Corporation, Verona, Wisconsin). We obtained computerized EHR data from Clarity, the relational database that stores Epic’s inpatient data in thousands of tables. We identified all patients ≥18 years of age presenting to the emergency department (ED) between June 1, 2012 and December 31, 2016 with suspected serious infection, defined as having blood cultures ordered within 72 hours of ED presentation (N = 25,441). Patients who did not receive at least two doses of intravenous (IV) antibiotics within 48 hours were excluded, as they were unlikely to have serious infections.
We defined sepsis based on Sepsis-3 consensus guidelines2 as a change in sequential [sepsis-related] organ failure assessment (SOFA) score ≥2 within the first 48 hours of ED presentation. The SOFA score is comprised of six variables representing different organ systems, each rated 0-4 based on the degree of dysfunction.2 Patient vital signs, laboratory data, vasopressor medication doses, and ventilator settings were used to determine the exact timestamp at which each patient attained a change in SOFA score ≥2. Missing values were considered to be normal. To adjust for baseline organ dysfunction, SOFA elements associated with elevated bilirubin and/or creatinine were excluded for patients with chronic liver/kidney disease based on Elixhauser comorbidities.27 We chose to focus on the first 48 hours in an attempt to capture patients with the most severe illnesses and the highest probability of true sepsis.
All primary and secondary International Classification of Diseases (ICD)-9/10 diagnosis codes were extracted from Clarity coding tables at the time of hospital discharge. Diagnosis codes signifying bacterial infection were grouped into the following categories based on type/location: pneumonia; bacteremia; urinary tract infection; and skin and soft tissue infection. All remaining diagnostic codes indicating bacterial infections at other sites were categorized as “Other”. If no codes indicating infection were present, patients were categorized as “None coded”. Patients with discharge diagnosis codes of “sepsis” were also identified. Dates and times of antibiotic administrations were obtained from the medications table. Time to first antibiotic was defined as the time in minutes from ED presentation to initiation of the first IV antibacterial medication. This variable was transformed using a natural log transformation based on best fit for normal distribution.
We limited our analyses to 8,974 patients who were diagnosed with sepsis as defined above and had either (1) ≥4 qualifying antibiotic days (QADs) or (2) an ICD-9/10 discharge diagnosis code of “sepsis” (Figure). QADs were defined based on the recent publication by Rhee et al. as having received four or more consecutive days of antibiotics, with the first dose given IV within 48 hours of presentation.28 Patients who died or were discharged to hospice prior to the 4th QAD were also included. These additional parameters were added to increase specificity of the study sample for patients with true sepsis. Patients admitted to all levels of care (acute care, transitional care unit [TCU], intensive care unit [ICU]) and under all hospital services were included. There were no missing data for mortality, race, or language. We chose to focus on patients with sepsis in this initial study as this is a common diagnosis in hospital medicine that is enriched for high mortality.
Primary Outcome
The primary outcome of the study was inpatient mortality, which was obtained from the hospital encounters table in Clarity.
Primary Predictors
The primary predictor of interest was LEP. The encounter numbers from the dataset were used to link to self-reported demographic data, including “preferred language” and need for interpreter services. A manual chart review of 60 patients speaking the top six languages was conducted to verify the accuracy of the data on language and interpreter use (KNK). Defining the gold standard for LEP as having any chart note indicating non-English language and/or that an interpreter was used, the “interpreter needed” variable in Epic was found to have a positive predictive value for LEP of 100%. Therefore, patients in the study cohort were defined as having LEP if they met both of the following criteria: (1) a self-reported “preferred language” other than English and (2) having the “interpreter needed” variable indicating “yes”.
Covariate Data Collection
Additional data were obtained from the demographics tables, including age, race, sex, and insurance status. Race and ethnicity were combined into a single five-category variable including White, Asian, Black, Latino, and Other. This approach has been suggested as the best way to operationalize these variables29 and has been utilized by similar studies in the literature.9,14,15 We considered the Asian race to include all people of East Asian, Southeast Asian, or South Asian descent, which is consistent with the United States Census Bureau definition.30 Patients identifying as Native Hawaiians/Pacific Islanders, Native Americans/Alaskan Natives, as well as those with unspecified race or ethnicity, were categorized as Other. Insurance status was categorized as Commercial, Medicare, Medicaid, or Other.
We estimated illness severity in several ways. First, the total qualifying SOFA score was calculated for each patient, which was defined as the total score achieved at the time that SOFA criteria were first met (≥2, within 48 hours). Second, we dichotomized patients based on whether they had received mechanical ventilation at any point during hospitalization. Finally, we used admission location as a surrogate marker for severity at the time of initial hospitalization.
To estimate the burden of baseline comorbidities, we calculated the van Walraven score (VWS),31 a validated modification of the Elixhauser Comorbidity Index.27 This score conveys an estimated risk of in hospital death based on ICD-9/10 diagnosis codes for preexisting conditions, which ranges from <1% for the minimum score of –19 to >99% for the maximum score of 89.
Statistical Analyses
All statistical analyses were performed using Stata software version 15 (StataCorp LLC, College Station, Texas). Baseline demographics and patient characteristics were stratified by LEP. These were compared using two-sample t-tests or chi-squared tests of significance. Wilcoxon rank-sum tests were used for non-normally distributed variables. Inpatient mortality was compared across all races stratified by LEP using chi-squared tests of significance.
We fit a series of multivariable logistic regression models to examine the association between race and inpatient mortality adjusting for LEP and other patient/clinical characteristics. We first examined the unadjusted association between mortality and race; then adjusted for LEP alone; and finally adjusted for all covariates of interest, including LEP, age, sex, insurance status, year, admission level of care, VWS, total qualifying SOFA score, need for mechanical ventilation, site of infection, and time to first IV antibiotic. A subgroup analysis was also performed using the fully adjusted model restricted to patients who were mechanically ventilated. This population was selected because the patients (1) have among the highest severity of illness and (2) share a common barrier to communication, regardless of English proficiency.
Several potential interactions between LEP with other covariates were explored, including age, race, ICU admission level of care, and need for mechanical ventilation. Lastly, a mediation analysis was performed based on Baron & Kenny’s four-step model32 in order to calculate the proportion of the association between race and mortality explained by the proposed mediator (LEP).
To evaluate for the likelihood of residual confounding, we calculated an E-value, which is defined as the minimum strength of association that an unmeasured confounder would need to have with both the predictor and outcome variables, above and beyond the measured covariates, in order to fully explain away an observed predictor-outcome association.33,34
RESULTS
We identified 8,974 patients hospitalized with sepsis based on the above inclusion criteria. This represented a medically complex, racially and linguistically diverse population (Table 1). The cohort was comprised of 24% Asian, 12% Black, and 11% Latino patients. Among those categorized as Other race, Native Americans/Alaskan Natives and Native Hawaiians/Pacific Islanders accounted for 4% (n = 31) and 21% (n = 159), respectively. A fifth of all patients had LEP (n = 1,716), 62% of whom were Asian (n = 1,064). Patients with LEP tended to be older, female, and to have a greater number of comorbid conditions (Table 1). The total qualifying SOFA score was also higher among patients with LEP (median 5; interquartile range [IQR]: 4-8 vs 5; IQR: 3-7; P <.001), though there was no association between LEP and mechanical ventilation (P = .22). The prevalence of LEP differed significantly across races, with 50% LEP among Asians, 32% among Latinos, 5% among White patients (P < .001). Only eight Black patients had LEP. More than 40 unique languages were represented in the cohort, with English, Cantonese, Spanish, Russian, and Mandarin accounting for ~95% (Appendix Table 1). Among Latino patients, 63% spoke English and 36% spoke Spanish.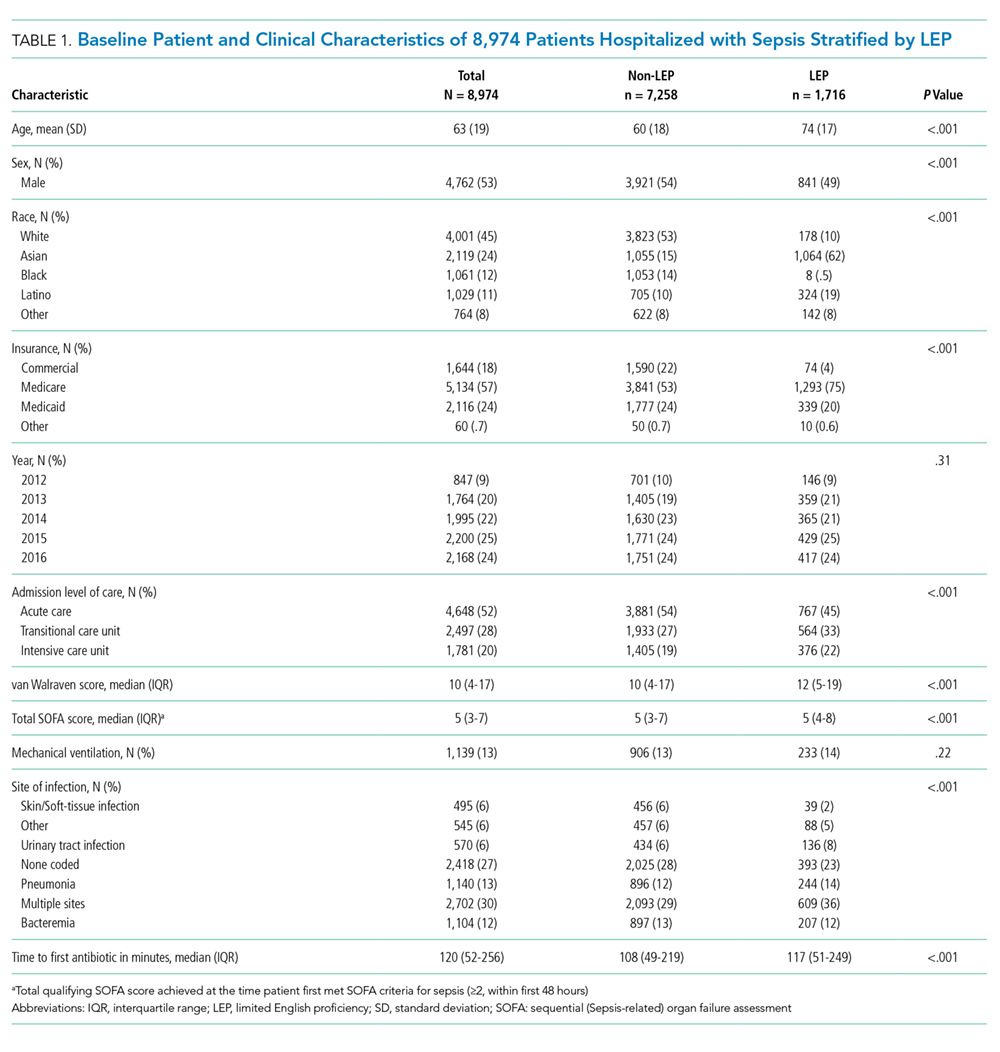
In-hospital mortality was significantly higher among patients who had LEP (n = 268/1,716, 16%) compared to non-LEP patients (n = 678/7,258, 9%), with 80% greater unadjusted odds of mortality (OR 1.80; 95% CI: 1.54-2.09; P < .001). Notably we also found that Asian race was associated with a 1.57 unadjusted odds of mortality compared to White race (95% CI: 1.34-1.85; P < .001). Age, VWS, total qualifying SOFA score, mechanical ventilation, and admission level of care all exhibited a positive dose-response association with mortality (Appendix Table 2). In unadjusted analyses, there was no evidence of interaction between LEP and age (P = .38), LEP and race (P = .45), LEP and ICU admission level of care (P = .31), or LEP and mechanical ventilation (P = .19). Asian patients had the highest overall mortality (14% total, 17% with LEP). LEP was associated with increased unadjusted mortality among White, Asian, and Other races compared to their non-LEP counterparts (Appendix Figure 1). There was no significant difference in mortality between Latino patients with and without LEP. The sample size for Black patients with LEP (n = 8) was too small to draw conclusions about mortality.
Following multivariable logistic regression modeling for the association between race and mortality, we found that the increased odds of death among Asian patients was partially attenuated after adjusting for LEP (odds ratio [OR] 1.23, 95% CI: 1.02-1.48; P = .03; Table 2). Meanwhile, LEP was associated with a 1.66 odds of mortality (95% CI: 1.38-1.99; P < .001) after adjustment for race. In the full multivariable model adjusting for demographics and clinical characteristics, illness severity, and comorbidities, LEP was associated with a 31% increase in the odds of mortality compared to non-LEP (95% CI: 1.06-1.63; P = .02). In this model, the association between Asian race and mortality was now fully attenuated, with a point estimate near 1.0 (OR 0.98; 95% CI: 0.79-1.22; P = .87). Markers of illness severity, including total qualifying SOFA score (OR 1.23; 95% CI: 1.20-1.27; P < .001) and need for mechanical ventilation (OR 1.88; 95% CI: 1.52-2.33; P < .001), were both associated with greater odds of death. Based on a four-step mediation analysis, LEP was found to be a partial mediator to the association between Asian race and mortality (76% proportion explained). The E-value for the association between LEP and mortality was 1.95, with an E-value for the corresponding confidence interval of 1.29.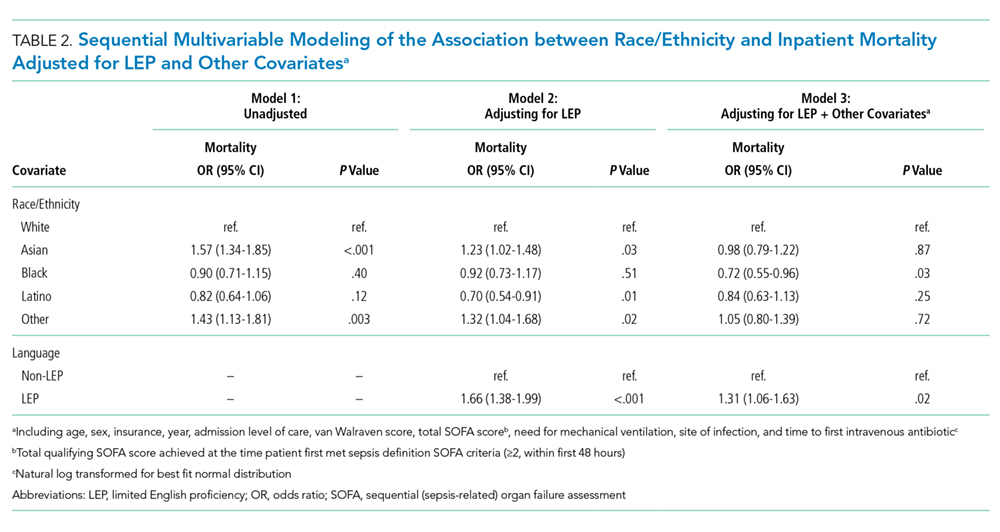
In a subgroup analysis using the fully adjusted model restricted to patients who were mechanically ventilated during hospitalization, the association between LEP and mortality was no longer present (OR 1.15; 95% CI: 0.76-1.72; P = .51).
DISCUSSION
At a single US academic medical center serving a diverse population, we found that LEP was associated with sepsis mortality across all races except Black and Latino, conveying a 31% increase in the odds of death after adjusting for illness severity, comorbidities, and baseline characteristics. The higher mortality among Asian patients was largely mediated by LEP (76% proportion explained). While previous studies have variably found Black, Asian, Latino, and other non-White races/ethnicities to be at an increased risk of death from sepsis,9-15 LEP has not been previously evaluated as a mediator of sepsis mortality. We were uniquely suited to uncover such an association due to the racial and linguistic diversity of our patient population. LEP has previously been implicated in poor health outcomes among hospitalized patients in general.22-24 Future studies will be necessary to determine whether similar associations between LEP and mortality are observed among broader patient populations outside of sepsis.
There are a number of possible explanations for how LEP could mediate the association between race and mortality. First, LEP is known to be associated with greater difficulties in accessing medical care,25 which could result in poorer baseline control of chronic comorbid conditions, fewer opportunities for preventive screening, and greater reluctance to seek medical attention when ill, theoretically leading to more severe presentations and worse outcomes. Indeed, LEP patients in our cohort had both a shorter median time to receiving their first antibiotic, as well as a higher total qualifying SOFA score, both of which may suggest more severe initial presentations. LEP is also known to contribute to, or exacerbate, the impact of low health literacy, which is itself associated with poor health.35 Second, implicit biases may also have been present, as they are known to be common among healthcare providers and have been shown to negatively impact patient care.36
Finally,it is possible that the association is related to the language barrier itself, which impacts providers’ ability to take an appropriate clinical history, and can lead to clinical errors or delays in care.37 The fact that the association between LEP and mortality was eliminated when the analysis was restricted to mechanically ventilated patients seems to support this, since differences in language proficiency become irrelevant in this subgroup. While we are unable to comment on causality based on this observational study, we included a directed acyclic graph (DAG) in the supplemental materials, which shows one proposed model for describing these associations (Appendix Figure 2).
Assuming that the language barrier itself does, at least in part, drive the observed association, LEP represents a potentially modifiable risk factor that could be a target for quality improvement interventions. There is evidence that the use of medical interpreters among patients with LEP leads to greater satisfaction, fewer errors, and improved clinical outcomes;38 however, several recent studies have documented underutilization of professional interpreter services, even when readily available.39,40 At our institution, phone and video interpreter services are available 24/7 for approximately 150 languages. Due to limitations inherent to the EHR, we were unable to ascertain the extent to which these services were used in the present study. Heavy clinical workloads, connectivity issues, and missing or faulty equipment represent theoretical barriers to utilization of these services.
There are some limitations to our study. First, by utilizing a large database of electronic data, the quality of our analyses was reliant on the accuracy of the EHR. Demographic data such as language may have been subject to misclassification due to self-reporting. We attempted to minimize this by also including the need for interpreter services within the definition of LEP, which was validated by manual chart review. Second, generalizability is limited in this single-center study conducted at an institution with unique demographics, wherein nearly two-thirds of the LEP patients were Asian, and the Chinese-speaking population outnumbered those who speak Spanish.
Finally, the most important limitation to our study is the potential for residual confounding. While we attempted to mitigate this by adjusting for as many clinically relevant covariates as possible, there may still be unmeasured confounders to the association between LEP and mortality, such as access to outpatient care, functional status, interpreter use, and other markers of illness severity like the number and type of supportive therapies received. Based on our E-value calculations, with an observed OR of 1.31 for the association between LEP and mortality, an unmeasured confounder with an OR of 1.95 would fully explain away this association, while an OR of 1.29 would shift the confidence interval to include the null. These values suggest at least some risk of residual confounding. The fact that our fully adjusted model included multiple covariates, including several markers of illness severity, does somewhat lessen the likelihood of a confounder achieving these values, since they represent the minimum strength of an unmeasured confounder above and beyond the measured covariates. Regardless, the finding that patients with LEP are more likely to die from sepsis remains an important one, recognizing the need for further studies including multicenter investigations.
In this study, we showed that LEP was associated with sepsis mortality across nearly all races in our cohort. While Asian race was associated with a higher unadjusted odds of death compared to White race, this was attenuated after adjusting for LEP. This may suggest that some of the racial disparities in sepsis identified in prior studies were in fact mediated by language proficiency. Further studies will be required to explore the causal nature of this novel association. If modifiable factors are identified, this could represent a potential target for future quality improvement initiatives aimed at improving sepsis outcomes.
Disclaimer
The contents are solely the responsibility of the authors and do not necessarily represent the official views of the University of California, San Francisco or the National Institutes of Health.
1. De Backer DD, Dorman T. Surviving sepsis guidelines: A continuous move toward better care of patients with sepsis. JAMA. 2017;317(8):807-808. https://doi.org/10.1001/jama.2017.0059.
2. Singer M, Deutschman CS, Seymour CW, et al. The third international consensus definitions for sepsis and septic shock (Sepsis-3). JAMA. 2016;315(8):801-810. https://doi.org/10.1001/jama.2016.0287.
3. Angus DC, Linde-Zwirble WT, Lidicker J, et al. Epidemiology of severe sepsis in the United States: analysis of incidence, outcome, and associated costs of care. Crit Care Med. 2001;29(7):1303-1310. https://doi.org/10.1097/00003246-200107000-00002.
4. Mayr FB, Yende S, Angus DC. Epidemiology of severe sepsis. Virulence. 2014;5(1):4-11. https://doi.org/10.4161/viru.27372.
5. Dellinger RP, Levy MM, Rhodes A, et al. Surviving Sepsis Campaign: international guidelines for management of severe sepsis and septic shock: 2012. Crit Care Med. 2013;41(2):580-637. https://doi.org/10.1097/CCM.0b013e31827e83af.
6. Levy MM, Rhodes A, Phillips GS, et al. Surviving Sepsis Campaign: association between performance metrics and outcomes in a 7.5-year study. Crit Care Med. 2015;43(1):3-12. https://doi.org/10.1097/CCM.0000000000000723.
7. Damiani E, Donati A, Serafini G, et al. Effect of performance improvement programs on compliance with sepsis bundles and mortality: a systematic review and meta-analysis of observational studies. PLOS ONE. 2015;10(5):e0125827. https://doi.org/10.1371/journal.pone.0125827.
8. Paoli CJ, Reynolds MA, Sinha M, Gitlin M, Crouser E. Epidemiology and costs of sepsis in the United States-an analysis based on timing of diagnosis and severity level. Crit Care Med. 2018;46(12):1889-1897. https://doi.org/10.1097/CCM.0000000000003342.
9. Barnato AE, Alexander SL, Linde-Zwirble WT, Angus DC. Racial variation in the incidence, care, and outcomes of severe sepsis: analysis of population, patient, and hospital characteristics. Am J Respir Crit Care Med [patient]. 2008;177(3):279-284. https://doi.org/10.1164/rccm.200703-480OC.
10. Mayr FB, Yende S, Linde-Zwirble WT, et al. Infection rate and acute organ dysfunction risk as explanations for racial differences in severe sepsis. JAMA. 2010;303(24):2495-2503. https://doi.org/10.1001/jama.2010.851.
11. Dombrovskiy VY, Martin AA, Sunderram J, Paz HL. Occurrence and outcomes of sepsis: influence of race. Crit Care Med. 2007;35(3):763-768. https://doi.org/10.1097/01.CCM.0000256726.80998.BF.
12. Yamane D, Huancahuari N, Hou P, Schuur J. Disparities in acute sepsis care: a systematic review. Crit Care. 2015;19(Suppl 1):22. https://doi.org/10.1186/cc14102.
13. Martin GS, Mannino DM, Eaton S, Moss M. The epidemiology of sepsis in the United States from 1979 through 2000. N Engl J Med. 2003;348(16):1546-1554. https://doi.org/10.1056/NEJMoa022139.
14. Melamed A, Sorvillo FJ. The burden of sepsis-associated mortality in the United States from 1999 to 2005: an analysis of multiple-cause-of-death data. Crit Care. 2009;13(1):R28. https://doi.org/10.1186/cc7733.
15. Jones JM, Fingar KR, Miller MA, et al. Racial disparities in sepsis-related in-hospital mortality: using a broad case capture method and multivariate controls for clinical and hospital variables, 2004-2013. Crit Care Med. 2017;45(12):e1209-e1217. https://doi.org/10.1097/CCM.0000000000002699.
16. Bakullari A, Metersky ML, Wang Y, et al. Racial and ethnic disparities in healthcare-associated infections in the United States, 2009–2011. Infect Control Hosp Epidemiol. 2014;35(S3):S10-S16. https://doi.org/10.1086/677827.
17. Institute of Medicine. Unequal Treatment: What Healthcare Providers Need to Know about Racial and Ethnic Disparities in Healthcare. Washington, DC: National Academy Press; 2002.
18. Vogel TR. Update and review of racial disparities in sepsis. Surg Infect. 2012;13(4):203-208. https://doi.org/10.1089/sur.2012.124.
19. Esper AM, Moss M, Lewis CA, et al. The role of infection and comorbidity: factors that influence disparities in sepsis. Crit Care Med. 2006;34(10):2576-2582. https://doi.org/10.1097/01.CCM.0000239114.50519.0E.
20. Soto GJ, Martin GS, Gong MN. Healthcare disparities in critical illness. Crit Care Med. 2013;41(12):2784-2793. https://doi.org/10.1097/CCM.0b013e3182a84a43.
21. Taylor SP, Karvetski CH, Templin MA, Taylor BT. Hospital differences drive antibiotic delays for black patients compared with white patients with suspected septic shock. Crit Care Med. 2018;46(2):e126-e131. https://doi.org/10.1097/CCM.0000000000002829.
22. Divi C, Koss RG, Schmaltz SP, Loeb JM. Language proficiency and adverse events in US hospitals: a pilot study. Int J Qual Health Care. 2007;19(2):60-67. https://doi.org/10.1093/intqhc/mzl069.
23. John-Baptiste A, Naglie G, Tomlinson G, et al. The effect of English language proficiency on length of stay and in-hospital mortality. J Gen Intern Med. 2004;19(3):221-228. https://doi.org/10.1111/j.1525-1497.2004.21205.x.
24. Karliner LS, Kim SE, Meltzer DO, Auerbach AD. Influence of language barriers on outcomes of hospital care for general medicine inpatients. J Hosp Med. 2010;5(5):276-282. https://doi.org/10.1002/jhm.658.
25. Hacker K, Anies M, Folb BL, Zallman L. Barriers to health care for undocumented immigrants: a literature review. Risk Manag Healthc Policy. 2015;8:175-183. https://doi.org/10.2147/RMHP.S70173.
26. QuickFacts: San Francisco County, California. U.S. Census Bureau (2016). https://www.census.gov/quickfacts/fact/table/sanfranciscocountycalifornia/RHI425216. Accessed May 15, 2018.
27. Moore BJ, White S, Washington R, Coenen N, Elixhauser A. Identifying increased risk of readmission and in-hospital mortality using hospital administrative data: The AHRQ Elixhauser comorbidity index. Med Care. 2017;55(7):698-705. https://doi.org/10.1097/MLR.0000000000000735.
28. Rhee C, Dantes R, Epstein L, et al. Incidence and trends of sepsis in us hospitals using clinical vs claims data, 2009-2014. JAMA. 2017;318(13):1241-1249. https://doi.org/10.1001/jama.2017.13836.
29. Howell J, Emerson MO, So M. What “should” we use? Evaluating the impact of five racial measures on markers of social inequality. Sociol Race Ethn. 2017;3(1):14-30. https://doi.org/10.1177/2332649216648465.
30. Reeves T, Claudett B. United States Census Bureau. Asian Pac Islander Popul. March 2002;2003.
31. van Walraven C, Austin PC, Jennings A, Quan H, Forster AJ. A modification of the Elixhauser comorbidity measures into a point system for hospital death using administrative data. Med Care. 2009;47(6):626-633. https://doi.org/10.1097/MLR.0b013e31819432e5.
32. Baron RM, Kenny DA. The moderator-mediator variable distinction in social psychological research: conceptual, strategic, and statistical considerations. J Pers Soc Psychol. 1986;51(6):1173-1182. https://doi.org/10.1037//0022-3514.51.6.1173. 33. VanderWeele TJ, Ding P. Sensitivity analysis in observational research: introducing the E-value. Ann Intern Med. 2017;167(4):268-274. https://doi.org/10.7326/M16-2607.
34. Mathur MB, Ding P, Riddell CA, VanderWeele TJ. Website and R package for computing E-values. Epidemiology. 2018;29(5):e45-e47. https://doi.org/10.1097/EDE.0000000000000864.
35. Sentell T, Braun KL. Low Health Literacy, Limited English proficiency, and health status in Asians, Latinos, and other racial/ethnic groups in California. J Health Commun. 2012;17 Supplement 3:82-99. https://doi.org/10.1080/10810730.2012.712621.
36. FitzGerald C, Hurst S. Implicit bias in healthcare professionals: a systematic review. BMC Med Eth. 2017;18(1):19. https://doi.org/10.1186/s12910-017-0179-8.
37. Flores G. The impact of medical interpreter services on the quality of health care: A systematic review. Med Care Res Rev. 2005;62(3):255-299. https://doi.org/10.1177/1077558705275416.
38. Karliner LS, Jacobs EA, Chen AH, Mutha S. Do professional interpreters improve clinical care for patients with limited English proficiency? A systematic review of the literature. Health Serv Res. 2007;42(2):727-754. https://doi.org/10.1111/j.1475-6773.2006.00629.x.
39. Diamond LC, Schenker Y, Curry L, Bradley EH, Fernandez A. Getting by: underuse of interpreters by resident physicians. J Gen Intern Med. 2009;24(2):256-262. https://doi.org/10.1007/s11606-008-0875-7.
40. López L, Rodriguez F, Huerta D, Soukup J, Hicks L. Use of interpreters by physicians for hospitalized limited English proficient patients and its impact on patient outcomes. J Gen Intern Med. 2015;30(6):783-789. https://doi.org/10.1007/s11606-015-3213-x.
Sepsis is defined as a life-threatening organ dysfunction that occurs in response to systemic infection.1,2 It is frequently fatal, common in hospital medicine, and a leading contributor to critical illness, morbidity, and healthcare expenditures.2-5 While sepsis care and outcomes have improved in the past decade,6,7 inpatient mortality remains high.8
A number of studies have sought to determine whether race plays a role in sepsis mortality. While Black patients with sepsis have frequently been identified as having the highest rates of death,9-14 similar observations have been made for most non-White races/ethnicities.13-15 Studies have also demonstrated higher rates of hospital-acquired infections among Asian and Latino patients.16
There are several possible explanations for why racial minorities experience disparate outcomes in sepsis, including access to care, comorbidities, implicit biases, and biological or environmental factors,17-20 as well as characteristics of hospitals most likely to care for racial minorities.13,15,21 One explanation that has not been explored is that racial disparities in sepsis are mediated by language. Limited English proficiency (LEP) has previously been associated with increased rates of adverse hospital events,22 longer length of stay,23 and greater likelihood of readmission.24 LEP has also been shown to represent a significant barrier to accessing healthcare and preventive screening.25 The role of LEP in sepsis mortality, however, has yet to be examined.
The diverse patient population at the University of California, San Francisco (UCSF) provides a unique opportunity to build upon existing literature by further exploring racial differences in sepsis, specifically by investigating the role of LEP. The objective of this study was to determine the association between LEP and inpatient mortality among adults hospitalized with sepsis.
METHODS
Setting
The study was conducted at the University of California, San Francisco, California (UCSF), an 800-bed tertiary care, academic medical center. It was approved by the UCSF Institutional Review Board with waiver of informed consent. UCSF cares for a population of patients who are racially and linguistically diverse, with high proportions of patients of East Asian descent and with LEP. According to recent United States census estimates, more than half of San Francisco County residents identify as non-White (35% Asians, 15% Hispanic/Latino, 6% Black), and 44% report speaking a language other than English at home.26
Study Population and Data Collection
The UCSF Medical Center uses the electronic health record (EHR) Epic (Epic 2017, Epic Systems Corporation, Verona, Wisconsin). We obtained computerized EHR data from Clarity, the relational database that stores Epic’s inpatient data in thousands of tables. We identified all patients ≥18 years of age presenting to the emergency department (ED) between June 1, 2012 and December 31, 2016 with suspected serious infection, defined as having blood cultures ordered within 72 hours of ED presentation (N = 25,441). Patients who did not receive at least two doses of intravenous (IV) antibiotics within 48 hours were excluded, as they were unlikely to have serious infections.
We defined sepsis based on Sepsis-3 consensus guidelines2 as a change in sequential [sepsis-related] organ failure assessment (SOFA) score ≥2 within the first 48 hours of ED presentation. The SOFA score is comprised of six variables representing different organ systems, each rated 0-4 based on the degree of dysfunction.2 Patient vital signs, laboratory data, vasopressor medication doses, and ventilator settings were used to determine the exact timestamp at which each patient attained a change in SOFA score ≥2. Missing values were considered to be normal. To adjust for baseline organ dysfunction, SOFA elements associated with elevated bilirubin and/or creatinine were excluded for patients with chronic liver/kidney disease based on Elixhauser comorbidities.27 We chose to focus on the first 48 hours in an attempt to capture patients with the most severe illnesses and the highest probability of true sepsis.
All primary and secondary International Classification of Diseases (ICD)-9/10 diagnosis codes were extracted from Clarity coding tables at the time of hospital discharge. Diagnosis codes signifying bacterial infection were grouped into the following categories based on type/location: pneumonia; bacteremia; urinary tract infection; and skin and soft tissue infection. All remaining diagnostic codes indicating bacterial infections at other sites were categorized as “Other”. If no codes indicating infection were present, patients were categorized as “None coded”. Patients with discharge diagnosis codes of “sepsis” were also identified. Dates and times of antibiotic administrations were obtained from the medications table. Time to first antibiotic was defined as the time in minutes from ED presentation to initiation of the first IV antibacterial medication. This variable was transformed using a natural log transformation based on best fit for normal distribution.
We limited our analyses to 8,974 patients who were diagnosed with sepsis as defined above and had either (1) ≥4 qualifying antibiotic days (QADs) or (2) an ICD-9/10 discharge diagnosis code of “sepsis” (Figure). QADs were defined based on the recent publication by Rhee et al. as having received four or more consecutive days of antibiotics, with the first dose given IV within 48 hours of presentation.28 Patients who died or were discharged to hospice prior to the 4th QAD were also included. These additional parameters were added to increase specificity of the study sample for patients with true sepsis. Patients admitted to all levels of care (acute care, transitional care unit [TCU], intensive care unit [ICU]) and under all hospital services were included. There were no missing data for mortality, race, or language. We chose to focus on patients with sepsis in this initial study as this is a common diagnosis in hospital medicine that is enriched for high mortality.
Primary Outcome
The primary outcome of the study was inpatient mortality, which was obtained from the hospital encounters table in Clarity.
Primary Predictors
The primary predictor of interest was LEP. The encounter numbers from the dataset were used to link to self-reported demographic data, including “preferred language” and need for interpreter services. A manual chart review of 60 patients speaking the top six languages was conducted to verify the accuracy of the data on language and interpreter use (KNK). Defining the gold standard for LEP as having any chart note indicating non-English language and/or that an interpreter was used, the “interpreter needed” variable in Epic was found to have a positive predictive value for LEP of 100%. Therefore, patients in the study cohort were defined as having LEP if they met both of the following criteria: (1) a self-reported “preferred language” other than English and (2) having the “interpreter needed” variable indicating “yes”.
Covariate Data Collection
Additional data were obtained from the demographics tables, including age, race, sex, and insurance status. Race and ethnicity were combined into a single five-category variable including White, Asian, Black, Latino, and Other. This approach has been suggested as the best way to operationalize these variables29 and has been utilized by similar studies in the literature.9,14,15 We considered the Asian race to include all people of East Asian, Southeast Asian, or South Asian descent, which is consistent with the United States Census Bureau definition.30 Patients identifying as Native Hawaiians/Pacific Islanders, Native Americans/Alaskan Natives, as well as those with unspecified race or ethnicity, were categorized as Other. Insurance status was categorized as Commercial, Medicare, Medicaid, or Other.
We estimated illness severity in several ways. First, the total qualifying SOFA score was calculated for each patient, which was defined as the total score achieved at the time that SOFA criteria were first met (≥2, within 48 hours). Second, we dichotomized patients based on whether they had received mechanical ventilation at any point during hospitalization. Finally, we used admission location as a surrogate marker for severity at the time of initial hospitalization.
To estimate the burden of baseline comorbidities, we calculated the van Walraven score (VWS),31 a validated modification of the Elixhauser Comorbidity Index.27 This score conveys an estimated risk of in hospital death based on ICD-9/10 diagnosis codes for preexisting conditions, which ranges from <1% for the minimum score of –19 to >99% for the maximum score of 89.
Statistical Analyses
All statistical analyses were performed using Stata software version 15 (StataCorp LLC, College Station, Texas). Baseline demographics and patient characteristics were stratified by LEP. These were compared using two-sample t-tests or chi-squared tests of significance. Wilcoxon rank-sum tests were used for non-normally distributed variables. Inpatient mortality was compared across all races stratified by LEP using chi-squared tests of significance.
We fit a series of multivariable logistic regression models to examine the association between race and inpatient mortality adjusting for LEP and other patient/clinical characteristics. We first examined the unadjusted association between mortality and race; then adjusted for LEP alone; and finally adjusted for all covariates of interest, including LEP, age, sex, insurance status, year, admission level of care, VWS, total qualifying SOFA score, need for mechanical ventilation, site of infection, and time to first IV antibiotic. A subgroup analysis was also performed using the fully adjusted model restricted to patients who were mechanically ventilated. This population was selected because the patients (1) have among the highest severity of illness and (2) share a common barrier to communication, regardless of English proficiency.
Several potential interactions between LEP with other covariates were explored, including age, race, ICU admission level of care, and need for mechanical ventilation. Lastly, a mediation analysis was performed based on Baron & Kenny’s four-step model32 in order to calculate the proportion of the association between race and mortality explained by the proposed mediator (LEP).
To evaluate for the likelihood of residual confounding, we calculated an E-value, which is defined as the minimum strength of association that an unmeasured confounder would need to have with both the predictor and outcome variables, above and beyond the measured covariates, in order to fully explain away an observed predictor-outcome association.33,34
RESULTS
We identified 8,974 patients hospitalized with sepsis based on the above inclusion criteria. This represented a medically complex, racially and linguistically diverse population (Table 1). The cohort was comprised of 24% Asian, 12% Black, and 11% Latino patients. Among those categorized as Other race, Native Americans/Alaskan Natives and Native Hawaiians/Pacific Islanders accounted for 4% (n = 31) and 21% (n = 159), respectively. A fifth of all patients had LEP (n = 1,716), 62% of whom were Asian (n = 1,064). Patients with LEP tended to be older, female, and to have a greater number of comorbid conditions (Table 1). The total qualifying SOFA score was also higher among patients with LEP (median 5; interquartile range [IQR]: 4-8 vs 5; IQR: 3-7; P <.001), though there was no association between LEP and mechanical ventilation (P = .22). The prevalence of LEP differed significantly across races, with 50% LEP among Asians, 32% among Latinos, 5% among White patients (P < .001). Only eight Black patients had LEP. More than 40 unique languages were represented in the cohort, with English, Cantonese, Spanish, Russian, and Mandarin accounting for ~95% (Appendix Table 1). Among Latino patients, 63% spoke English and 36% spoke Spanish.
In-hospital mortality was significantly higher among patients who had LEP (n = 268/1,716, 16%) compared to non-LEP patients (n = 678/7,258, 9%), with 80% greater unadjusted odds of mortality (OR 1.80; 95% CI: 1.54-2.09; P < .001). Notably we also found that Asian race was associated with a 1.57 unadjusted odds of mortality compared to White race (95% CI: 1.34-1.85; P < .001). Age, VWS, total qualifying SOFA score, mechanical ventilation, and admission level of care all exhibited a positive dose-response association with mortality (Appendix Table 2). In unadjusted analyses, there was no evidence of interaction between LEP and age (P = .38), LEP and race (P = .45), LEP and ICU admission level of care (P = .31), or LEP and mechanical ventilation (P = .19). Asian patients had the highest overall mortality (14% total, 17% with LEP). LEP was associated with increased unadjusted mortality among White, Asian, and Other races compared to their non-LEP counterparts (Appendix Figure 1). There was no significant difference in mortality between Latino patients with and without LEP. The sample size for Black patients with LEP (n = 8) was too small to draw conclusions about mortality.
Following multivariable logistic regression modeling for the association between race and mortality, we found that the increased odds of death among Asian patients was partially attenuated after adjusting for LEP (odds ratio [OR] 1.23, 95% CI: 1.02-1.48; P = .03; Table 2). Meanwhile, LEP was associated with a 1.66 odds of mortality (95% CI: 1.38-1.99; P < .001) after adjustment for race. In the full multivariable model adjusting for demographics and clinical characteristics, illness severity, and comorbidities, LEP was associated with a 31% increase in the odds of mortality compared to non-LEP (95% CI: 1.06-1.63; P = .02). In this model, the association between Asian race and mortality was now fully attenuated, with a point estimate near 1.0 (OR 0.98; 95% CI: 0.79-1.22; P = .87). Markers of illness severity, including total qualifying SOFA score (OR 1.23; 95% CI: 1.20-1.27; P < .001) and need for mechanical ventilation (OR 1.88; 95% CI: 1.52-2.33; P < .001), were both associated with greater odds of death. Based on a four-step mediation analysis, LEP was found to be a partial mediator to the association between Asian race and mortality (76% proportion explained). The E-value for the association between LEP and mortality was 1.95, with an E-value for the corresponding confidence interval of 1.29.
In a subgroup analysis using the fully adjusted model restricted to patients who were mechanically ventilated during hospitalization, the association between LEP and mortality was no longer present (OR 1.15; 95% CI: 0.76-1.72; P = .51).
DISCUSSION
At a single US academic medical center serving a diverse population, we found that LEP was associated with sepsis mortality across all races except Black and Latino, conveying a 31% increase in the odds of death after adjusting for illness severity, comorbidities, and baseline characteristics. The higher mortality among Asian patients was largely mediated by LEP (76% proportion explained). While previous studies have variably found Black, Asian, Latino, and other non-White races/ethnicities to be at an increased risk of death from sepsis,9-15 LEP has not been previously evaluated as a mediator of sepsis mortality. We were uniquely suited to uncover such an association due to the racial and linguistic diversity of our patient population. LEP has previously been implicated in poor health outcomes among hospitalized patients in general.22-24 Future studies will be necessary to determine whether similar associations between LEP and mortality are observed among broader patient populations outside of sepsis.
There are a number of possible explanations for how LEP could mediate the association between race and mortality. First, LEP is known to be associated with greater difficulties in accessing medical care,25 which could result in poorer baseline control of chronic comorbid conditions, fewer opportunities for preventive screening, and greater reluctance to seek medical attention when ill, theoretically leading to more severe presentations and worse outcomes. Indeed, LEP patients in our cohort had both a shorter median time to receiving their first antibiotic, as well as a higher total qualifying SOFA score, both of which may suggest more severe initial presentations. LEP is also known to contribute to, or exacerbate, the impact of low health literacy, which is itself associated with poor health.35 Second, implicit biases may also have been present, as they are known to be common among healthcare providers and have been shown to negatively impact patient care.36
Finally,it is possible that the association is related to the language barrier itself, which impacts providers’ ability to take an appropriate clinical history, and can lead to clinical errors or delays in care.37 The fact that the association between LEP and mortality was eliminated when the analysis was restricted to mechanically ventilated patients seems to support this, since differences in language proficiency become irrelevant in this subgroup. While we are unable to comment on causality based on this observational study, we included a directed acyclic graph (DAG) in the supplemental materials, which shows one proposed model for describing these associations (Appendix Figure 2).
Assuming that the language barrier itself does, at least in part, drive the observed association, LEP represents a potentially modifiable risk factor that could be a target for quality improvement interventions. There is evidence that the use of medical interpreters among patients with LEP leads to greater satisfaction, fewer errors, and improved clinical outcomes;38 however, several recent studies have documented underutilization of professional interpreter services, even when readily available.39,40 At our institution, phone and video interpreter services are available 24/7 for approximately 150 languages. Due to limitations inherent to the EHR, we were unable to ascertain the extent to which these services were used in the present study. Heavy clinical workloads, connectivity issues, and missing or faulty equipment represent theoretical barriers to utilization of these services.
There are some limitations to our study. First, by utilizing a large database of electronic data, the quality of our analyses was reliant on the accuracy of the EHR. Demographic data such as language may have been subject to misclassification due to self-reporting. We attempted to minimize this by also including the need for interpreter services within the definition of LEP, which was validated by manual chart review. Second, generalizability is limited in this single-center study conducted at an institution with unique demographics, wherein nearly two-thirds of the LEP patients were Asian, and the Chinese-speaking population outnumbered those who speak Spanish.
Finally, the most important limitation to our study is the potential for residual confounding. While we attempted to mitigate this by adjusting for as many clinically relevant covariates as possible, there may still be unmeasured confounders to the association between LEP and mortality, such as access to outpatient care, functional status, interpreter use, and other markers of illness severity like the number and type of supportive therapies received. Based on our E-value calculations, with an observed OR of 1.31 for the association between LEP and mortality, an unmeasured confounder with an OR of 1.95 would fully explain away this association, while an OR of 1.29 would shift the confidence interval to include the null. These values suggest at least some risk of residual confounding. The fact that our fully adjusted model included multiple covariates, including several markers of illness severity, does somewhat lessen the likelihood of a confounder achieving these values, since they represent the minimum strength of an unmeasured confounder above and beyond the measured covariates. Regardless, the finding that patients with LEP are more likely to die from sepsis remains an important one, recognizing the need for further studies including multicenter investigations.
In this study, we showed that LEP was associated with sepsis mortality across nearly all races in our cohort. While Asian race was associated with a higher unadjusted odds of death compared to White race, this was attenuated after adjusting for LEP. This may suggest that some of the racial disparities in sepsis identified in prior studies were in fact mediated by language proficiency. Further studies will be required to explore the causal nature of this novel association. If modifiable factors are identified, this could represent a potential target for future quality improvement initiatives aimed at improving sepsis outcomes.
Disclaimer
The contents are solely the responsibility of the authors and do not necessarily represent the official views of the University of California, San Francisco or the National Institutes of Health.
1. De Backer DD, Dorman T. Surviving sepsis guidelines: A continuous move toward better care of patients with sepsis. JAMA. 2017;317(8):807-808. https://doi.org/10.1001/jama.2017.0059.
2. Singer M, Deutschman CS, Seymour CW, et al. The third international consensus definitions for sepsis and septic shock (Sepsis-3). JAMA. 2016;315(8):801-810. https://doi.org/10.1001/jama.2016.0287.
3. Angus DC, Linde-Zwirble WT, Lidicker J, et al. Epidemiology of severe sepsis in the United States: analysis of incidence, outcome, and associated costs of care. Crit Care Med. 2001;29(7):1303-1310. https://doi.org/10.1097/00003246-200107000-00002.
4. Mayr FB, Yende S, Angus DC. Epidemiology of severe sepsis. Virulence. 2014;5(1):4-11. https://doi.org/10.4161/viru.27372.
5. Dellinger RP, Levy MM, Rhodes A, et al. Surviving Sepsis Campaign: international guidelines for management of severe sepsis and septic shock: 2012. Crit Care Med. 2013;41(2):580-637. https://doi.org/10.1097/CCM.0b013e31827e83af.
6. Levy MM, Rhodes A, Phillips GS, et al. Surviving Sepsis Campaign: association between performance metrics and outcomes in a 7.5-year study. Crit Care Med. 2015;43(1):3-12. https://doi.org/10.1097/CCM.0000000000000723.
7. Damiani E, Donati A, Serafini G, et al. Effect of performance improvement programs on compliance with sepsis bundles and mortality: a systematic review and meta-analysis of observational studies. PLOS ONE. 2015;10(5):e0125827. https://doi.org/10.1371/journal.pone.0125827.
8. Paoli CJ, Reynolds MA, Sinha M, Gitlin M, Crouser E. Epidemiology and costs of sepsis in the United States-an analysis based on timing of diagnosis and severity level. Crit Care Med. 2018;46(12):1889-1897. https://doi.org/10.1097/CCM.0000000000003342.
9. Barnato AE, Alexander SL, Linde-Zwirble WT, Angus DC. Racial variation in the incidence, care, and outcomes of severe sepsis: analysis of population, patient, and hospital characteristics. Am J Respir Crit Care Med [patient]. 2008;177(3):279-284. https://doi.org/10.1164/rccm.200703-480OC.
10. Mayr FB, Yende S, Linde-Zwirble WT, et al. Infection rate and acute organ dysfunction risk as explanations for racial differences in severe sepsis. JAMA. 2010;303(24):2495-2503. https://doi.org/10.1001/jama.2010.851.
11. Dombrovskiy VY, Martin AA, Sunderram J, Paz HL. Occurrence and outcomes of sepsis: influence of race. Crit Care Med. 2007;35(3):763-768. https://doi.org/10.1097/01.CCM.0000256726.80998.BF.
12. Yamane D, Huancahuari N, Hou P, Schuur J. Disparities in acute sepsis care: a systematic review. Crit Care. 2015;19(Suppl 1):22. https://doi.org/10.1186/cc14102.
13. Martin GS, Mannino DM, Eaton S, Moss M. The epidemiology of sepsis in the United States from 1979 through 2000. N Engl J Med. 2003;348(16):1546-1554. https://doi.org/10.1056/NEJMoa022139.
14. Melamed A, Sorvillo FJ. The burden of sepsis-associated mortality in the United States from 1999 to 2005: an analysis of multiple-cause-of-death data. Crit Care. 2009;13(1):R28. https://doi.org/10.1186/cc7733.
15. Jones JM, Fingar KR, Miller MA, et al. Racial disparities in sepsis-related in-hospital mortality: using a broad case capture method and multivariate controls for clinical and hospital variables, 2004-2013. Crit Care Med. 2017;45(12):e1209-e1217. https://doi.org/10.1097/CCM.0000000000002699.
16. Bakullari A, Metersky ML, Wang Y, et al. Racial and ethnic disparities in healthcare-associated infections in the United States, 2009–2011. Infect Control Hosp Epidemiol. 2014;35(S3):S10-S16. https://doi.org/10.1086/677827.
17. Institute of Medicine. Unequal Treatment: What Healthcare Providers Need to Know about Racial and Ethnic Disparities in Healthcare. Washington, DC: National Academy Press; 2002.
18. Vogel TR. Update and review of racial disparities in sepsis. Surg Infect. 2012;13(4):203-208. https://doi.org/10.1089/sur.2012.124.
19. Esper AM, Moss M, Lewis CA, et al. The role of infection and comorbidity: factors that influence disparities in sepsis. Crit Care Med. 2006;34(10):2576-2582. https://doi.org/10.1097/01.CCM.0000239114.50519.0E.
20. Soto GJ, Martin GS, Gong MN. Healthcare disparities in critical illness. Crit Care Med. 2013;41(12):2784-2793. https://doi.org/10.1097/CCM.0b013e3182a84a43.
21. Taylor SP, Karvetski CH, Templin MA, Taylor BT. Hospital differences drive antibiotic delays for black patients compared with white patients with suspected septic shock. Crit Care Med. 2018;46(2):e126-e131. https://doi.org/10.1097/CCM.0000000000002829.
22. Divi C, Koss RG, Schmaltz SP, Loeb JM. Language proficiency and adverse events in US hospitals: a pilot study. Int J Qual Health Care. 2007;19(2):60-67. https://doi.org/10.1093/intqhc/mzl069.
23. John-Baptiste A, Naglie G, Tomlinson G, et al. The effect of English language proficiency on length of stay and in-hospital mortality. J Gen Intern Med. 2004;19(3):221-228. https://doi.org/10.1111/j.1525-1497.2004.21205.x.
24. Karliner LS, Kim SE, Meltzer DO, Auerbach AD. Influence of language barriers on outcomes of hospital care for general medicine inpatients. J Hosp Med. 2010;5(5):276-282. https://doi.org/10.1002/jhm.658.
25. Hacker K, Anies M, Folb BL, Zallman L. Barriers to health care for undocumented immigrants: a literature review. Risk Manag Healthc Policy. 2015;8:175-183. https://doi.org/10.2147/RMHP.S70173.
26. QuickFacts: San Francisco County, California. U.S. Census Bureau (2016). https://www.census.gov/quickfacts/fact/table/sanfranciscocountycalifornia/RHI425216. Accessed May 15, 2018.
27. Moore BJ, White S, Washington R, Coenen N, Elixhauser A. Identifying increased risk of readmission and in-hospital mortality using hospital administrative data: The AHRQ Elixhauser comorbidity index. Med Care. 2017;55(7):698-705. https://doi.org/10.1097/MLR.0000000000000735.
28. Rhee C, Dantes R, Epstein L, et al. Incidence and trends of sepsis in us hospitals using clinical vs claims data, 2009-2014. JAMA. 2017;318(13):1241-1249. https://doi.org/10.1001/jama.2017.13836.
29. Howell J, Emerson MO, So M. What “should” we use? Evaluating the impact of five racial measures on markers of social inequality. Sociol Race Ethn. 2017;3(1):14-30. https://doi.org/10.1177/2332649216648465.
30. Reeves T, Claudett B. United States Census Bureau. Asian Pac Islander Popul. March 2002;2003.
31. van Walraven C, Austin PC, Jennings A, Quan H, Forster AJ. A modification of the Elixhauser comorbidity measures into a point system for hospital death using administrative data. Med Care. 2009;47(6):626-633. https://doi.org/10.1097/MLR.0b013e31819432e5.
32. Baron RM, Kenny DA. The moderator-mediator variable distinction in social psychological research: conceptual, strategic, and statistical considerations. J Pers Soc Psychol. 1986;51(6):1173-1182. https://doi.org/10.1037//0022-3514.51.6.1173.33. VanderWeele TJ, Ding P. Sensitivity analysis in observational research: introducing the E-value. Ann Intern Med. 2017;167(4):268-274. https://doi.org/10.7326/M16-2607.
34. Mathur MB, Ding P, Riddell CA, VanderWeele TJ. Website and R package for computing E-values. Epidemiology. 2018;29(5):e45-e47. https://doi.org/10.1097/EDE.0000000000000864.
35. Sentell T, Braun KL. Low Health Literacy, Limited English proficiency, and health status in Asians, Latinos, and other racial/ethnic groups in California. J Health Commun. 2012;17 Supplement 3:82-99. https://doi.org/10.1080/10810730.2012.712621.
36. FitzGerald C, Hurst S. Implicit bias in healthcare professionals: a systematic review. BMC Med Eth. 2017;18(1):19. https://doi.org/10.1186/s12910-017-0179-8.
37. Flores G. The impact of medical interpreter services on the quality of health care: A systematic review. Med Care Res Rev. 2005;62(3):255-299. https://doi.org/10.1177/1077558705275416.
38. Karliner LS, Jacobs EA, Chen AH, Mutha S. Do professional interpreters improve clinical care for patients with limited English proficiency? A systematic review of the literature. Health Serv Res. 2007;42(2):727-754. https://doi.org/10.1111/j.1475-6773.2006.00629.x.
39. Diamond LC, Schenker Y, Curry L, Bradley EH, Fernandez A. Getting by: underuse of interpreters by resident physicians. J Gen Intern Med. 2009;24(2):256-262. https://doi.org/10.1007/s11606-008-0875-7.
40. López L, Rodriguez F, Huerta D, Soukup J, Hicks L. Use of interpreters by physicians for hospitalized limited English proficient patients and its impact on patient outcomes. J Gen Intern Med. 2015;30(6):783-789. https://doi.org/10.1007/s11606-015-3213-x.
© 2019 Society of Hospital Medicine