User login
Hospital Ward Adaptation During the COVID-19 Pandemic: A National Survey of Academic Medical Centers
The coronavirus disease of 2019 (COVID-19) pandemic has resulted in a surge in hospitalizations of patients with a novel, serious, and highly contagious infectious disease for which there is yet no proven treatment. Currently, much of the focus has been on intensive care unit (ICU) and ventilator capacity for the sickest of these patients who develop respiratory failure. However, most hospitalized patients are being cared for in general medical units.1 Some evidence exists to describe adaptations to capacity needs outside of medical wards,2-4 but few studies have specifically addressed the ward setting. Therefore, there is a pressing need for evidence to describe how to expand capacity and deliver medical ward–based care.
To better understand how inpatient care in the United States is adapting to the COVID-19 pandemic, we surveyed 72 sites participating in the Hospital Medicine Reengineering Network (HOMERuN), a national consortium of hospital medicine groups.5 We report results of this survey, carried out between April 3 and April 5, 2020.
METHODS
Sites and Subjects
HOMERuN is a collaborative network of hospitalists from across the United States whose primary goal is to catalyze research and share best practices across hospital medicine groups. Using surveys of Hospital Medicine leaders, targeted medical record review, and other methods, HOMERuN’s funded research interests to date have included care transitions, workforce issues, patient and family engagement, and diagnostic errors. Sites participating in HOMERuN sites are relatively large urban academic medical centers (Appendix).
Survey Development and Deployment
We designed a focused survey that aimed to provide a snapshot of evolving operational and clinical aspects of COVID-19 care (Appendix). Domains included COVID-19 testing turnaround times, personal protective equipment (PPE) stewardship,6 features of respiratory isolation units (RIUs; ie, dedicated units for patients with known or suspected COVID-19), and observed effects on clinical care. We tested the instrument to ensure feasibility and clarity internally, performed brief cognitive testing with several hospital medicine leaders in HOMERuN, then disseminated the survey by email on April 3, with two follow-up emails on 2 subsequent days. Our study was deemed non–human subjects research by the University of California, San Francisco, Committee on Human Research. Descriptive statistics were used to characterize survey responses.
RESULTS
Of 72 hospitals surveyed, 51 (71%) responded. Mean hospital bed count was 940, three were safety-net hospitals, and one was a community-based teaching center; responding and nonresponding hospitals did not differ significantly in terms of bed count (Appendix).
Health System Adaptations, Testing, and PPE Status
Nearly all responding hospitals (46 of 51; 90%) had RIUs for patients with known or suspected COVID-19 (Table 1). Nearly all hospitals took steps to keep potentially sick healthcare providers from infecting others (eg, staying home if sick or exposed). Among respondents, 32% had rapid response teams, 24% had respiratory therapy teams, and 29% had case management teams that were dedicated to COVID-19 care. Thirty-two (63%) had developed models, such as ethics or palliative care consult services, to assist with difficult resource-allocation decisions (eg, how to prioritize ventilator use if demand exceeded supply). Twenty-three (45%) had developed post-acute care monitoring programs dedicated to COVID-19 patients.

At the time of our survey, only 2 sites (4%) reported COVID-19 test time turnaround under 1 hour, and 15 (30%) reported turnaround in less than 6 hours. Of the 29 sites able to provide estimates of PPE stockpile, 14 (48%) reported a supply of 2 weeks or less. The most common approaches to PPE stewardship focused on reuse of masks and face shields if not obviously soiled, centralizing PPE distribution, and disinfecting or sterilizing masks. Ten sites (20%) were utilizing 3-D printed masks, while 10% used homemade face shields or masks.
Characteristics of COVID-19 RIUs
Forty-six hospitals (90% of all respondents) in our cohort had developed RIUs at the time of survey administration. The earliest RIU implementation date was February 10, 2020, and the most recent was launched on the day of our survey. Admission to RIUs was primarily based on clinical factors associated with known or suspected COVID-19 infection (Table 2). The number of non–critical care RIU beds among locations at that time ranged from 10 or less to more than 50. The mean number of hospitalist attendings caring for patients in the RIUs was 10.2, with a mean 4.1 advanced practice providers, 5.5 residents, and 0 medical students. The number of planned patients per attending was typically 5 to 15. Nurses and physicians typically rounded separately. Medical distancing (eg, reducing patient room entry) was accomplished most commonly by grouped timing of medication administration (76% of sites), video links to room outside of rounding times (54% of sites), the use of video or telemedicine during rounds (17%), and clustering of activities such as medication administration or phlebotomy. The most common criteria prompting discharge from the RIU were a negative COVID-19 test (59%) and hospital discharge (57%), though comments from many respondents suggested that discharge criteria were changing rapidly.

Effects of Isolation Measures on In-Room Encounters and Diagnostic Processes
More than 90% of sites reported decreases in in-room encounter frequency across all provider types whether as a result of policies in place or not. Reductions were reported among hospitalists, advanced practice providers, residents, consultants, and therapists (Table 3). Reduced room entry most often resulted from an established or developing policy, but many noted reduced room entry without formal policies in place. Nearly all sites reported moving specialty consultations to phone or video evaluations. Diagnostic error was commonly reported, with missed non–COVID-19 medical diagnoses among COVID-19 infected patients being reported by 22 sites (46%) and missed COVID-19 diagnoses in patients admitted for other reasons by 22 sites (45%).

DISCUSSION
In this study of medical wards at academic medical centers, we found that, in response to the COVID-19 pandemic, hospitals made several changes in a short period of time to adapt to the crisis. These included implementation and rapid expansion of dedicated RIUs, greatly expanded use of inpatient telehealth for patient assessments and consultation, implementation of other approaches to minimize room entry (such as grouping in-room activities), and deployment of ethics consultation services to help manage issues around potential scarcity of life-saving measures such as ventilators. We also found that availability of PPE and timely testing was limited. Finally, a large proportion of sites reported potential diagnostic problems in the assessment of both patients suspected and those not suspected of having COVID-19.
RIUs are emerging as a primary modality for caring for non-ICU COVID-19 patients, though they never involved medical students; we hope the role of students in particular will increase as new models of training emerge in response to the pandemic.7 In contrast, telemedicine evolved rapidly to hold a substantial role in RIUs, with both ward and specialty teams using video visit technology to communicate with patients. COVID-19 has been viewed as a perfect use case for outpatient telemedicine,8 and a growing number of studies are examining its outpatient use9,10; however, to date, somewhat less attention has been paid to inpatient deployment. Although our data suggest telemedicine has found a prominent place in RIUs, it remains to be seen whether it is associated with differences in patient or provider outcomes. For example, deficiencies in the physical examination, limited face-to-face contact, and lack of physical presence could all affect the patient–provider relationship, patient engagement, and the accuracy of the diagnostic process.
Our data suggest the possibility of missing non–COVID-19 diagnoses in patients suspected of COVID-19 and missing COVID-19 in those admitted for nonrespiratory reasons. The latter may be addressed as routine COVID-19 screening of admitted patients becomes commonplace. For the former, however, it is possible that physicians are “anchoring” their thinking on COVID-19 to the exclusion of other diagnoses, that physicians are not fully aware of complications unique to COVID-19 infection (such as thromboembolism), and/or that the above-mentioned limitations of telemedicine have decreased diagnostic performance.
Although PPE stockpile data were not easily available for some sites, a distressingly large number reported stockpiles of 2 weeks or less, with reuse being the most common approach to extending PPE supply. We also found it concerning that 43% of hospital leaders did not know their stockpile data; we believe this is an important question that hospital leaders need to be asking. Most sites in our study reported test turnaround times of longer than 6 hours; lack of rapid COVID-19 testing further stresses PPE stockpile and may slow patients’ transition out of the RIU or discharge to home.
Our study has several limitations, including the evolving nature of the pandemic and rapid adaptations of care systems in the pandemic’s surge phase. However, we attempted to frame our questions in ways that provided a focused snapshot of care. Furthermore, respondents may not have had exhaustive knowledge of their institution’s COVID-19 response strategies, but most were the directors of their hospitalist services, and we encouraged the respondents to confer with others to gather high-fidelity data. Finally, as a survey of large academic medical centers, our results may not apply to nonacademic centers.
Approaches to caring for non-ICU patients during the COVID-19 pandemic are rapidly evolving. Expansion of RIUs and developing the workforce to support them has been a primary focus, with rapid innovation in use of technology emerging as a critical adaptation while PPE limitations persist and needs for “medical distancing” continue to grow. Although rates of missed COVID-19 diagnoses will likely be reduced with testing and systems improvements, physicians and systems will also need to consider how to utilize emerging technology in ways that can improve clinical care and provider safety while aiding diagnostic thinking. This survey illustrates the rapid adaptations made by our hospitals in response to the pandemic; ongoing adaptation will likely be needed to optimally care for hospitalized patients with COVID-19 while the pandemic continues to evolve.
Acknowledgment
Thanks to members of the HOMERuN COVID-19 Collaborative Group: Baylor Scott & White Medical Center – Temple, Texas - Tresa McNeal MD; Beth Israel Deaconess Medical Center - Shani Herzig MD MPH, Joseph Li MD, Julius Yang MD PhD; Brigham and Women’s Hospital - Christopher Roy MD, Jeffrey Schnipper MD MPH; Cedars-Sinai Medical Center - Ed Seferian MD, ; ChristianaCare - Surekha Bhamidipati MD; Cleveland Clinic - Matthew Pappas MD MPH; Dartmouth-Hitchcock Medical Center - Jonathan Lurie MD MS; Dell Medical School at The University of Texas at Austin - Chris Moriates MD, Luci Leykum MD MBA MSc; Denver Health and Hospitals Authority - Diana Mancini MD; Emory University Hospital - Dan Hunt MD; Johns Hopkins Hospital - Daniel J Brotman MD, Zishan K Siddiqui MD, Shaker Eid MD MBA; Maine Medical Center - Daniel A Meyer MD, Robert Trowbridge MD; Massachusetts General Hospital - Melissa Mattison MD; Mayo Clinic Rochester – Caroline Burton MD, Sagar Dugani MD PhD; Medical College of Wisconsin - Sanjay Bhandari MD; Miriam Hospital - Kwame Dapaah-Afriyie MD MBA; Mount Sinai Hospital - Andrew Dunn MD; NorthShore - David Lovinger MD; Northwestern Memorial Hospital - Kevin O’Leary MD MS; Ohio State University Wexner Medical Center - Eric Schumacher DO; Oregon Health & Science University - Angela Alday MD; Penn Medicine - Ryan Greysen MD MHS MA; Rutgers- Robert Wood Johnson University Hospital - Michael Steinberg MD MPH; Stanford University School of Medicine - Neera Ahuja MD; Tulane Hospital and University Medical Center - Geraldine Ménard MD; UC San Diego Health - Ian Jenkins MD; UC Los Angeles Health - Michael Lazarus MD, Magdalena E. Ptaszny, MD; UC San Francisco Health - Bradley A Sharpe, MD, Margaret Fang MD MPH; UK HealthCare - Mark Williams MD MHM, John Romond MD; University of Chicago – David Meltzer MD PhD, Gregory Ruhnke MD; University of Colorado - Marisha Burden MD; University of Florida - Nila Radhakrishnan MD; University of Iowa Hospitals and Clinics - Kevin Glenn MD MS; University of Miami - Efren Manjarrez MD; University of Michigan - Vineet Chopra MD MSc, Valerie Vaughn MD MSc; University of Missouri-Columbia Hospital - Hasan Naqvi MD; University of Nebraska Medical Center - Chad Vokoun MD; University of North Carolina at Chapel Hill - David Hemsey MD; University of Pittsburgh Medical Center - Gena Marie Walker MD; University of Vermont Medical Center - Steven Grant MD; University of Washington Medical Center - Christopher Kim MD MBA, Andrew White MD; University of Washington-Harborview Medical Center - Maralyssa Bann MD; University of Wisconsin Hospital and Clinics - David Sterken MD, Farah Kaiksow MD MPP, Ann Sheehy MD MS, Jordan Kenik MD MPH; UW Northwest Campus - Ben Wolpaw MD; Vanderbilt University Medical Center - Sunil Kripalani MD MSc, Eduard E Vasilevskis MD, Kathleene T Wooldridge MD MPH; Wake Forest Baptist Health - Erik Summers MD; Washington University St. Louis - Michael Lin MD; Weill Cornell - Justin Choi MD; Yale New Haven Hospital - William Cushing MA, Chris Sankey MD; Zuckerberg San Francisco General Hospital - Sumant Ranji MD.
1. Institute for Health Metrics and Evaluation. COVID-19 Projections: United States of America. 2020. Accessed May 5, 2020. https://covid19.healthdata.org/united-states-of-america
2. Iserson KV. Alternative care sites: an option in disasters. West J Emerg Med. 2020;21(3):484‐489. https://doi.org/10.5811/westjem.2020.4.47552
3. Paganini M, Conti A, Weinstein E, Della Corte F, Ragazzoni L. Translating COVID-19 pandemic surge theory to practice in the emergency department: how to expand structure [online first]. Disaster Med Public Health Prep. 2020:1-10. https://doi.org/10.1017/dmp.2020.57
4. Kumaraiah D, Yip N, Ivascu N, Hill L. Innovative ICU Physician Care Models: Covid-19 Pandemic at NewYork-Presbyterian. NEJM: Catalyst. April 28, 2020. Accessed May 5, 2020. https://catalyst.nejm.org/doi/full/10.1056/CAT.20.0158
5. Auerbach AD, Patel MS, Metlay JP, et al. The Hospital Medicine Reengineering Network (HOMERuN): a learning organization focused on improving hospital care. Acad Med. 2014;89(3):415-420. https://doi.org/10.1097/acm.0000000000000139
6. Livingston E, Desai A, Berkwits M. Sourcing personal protective equipment during the COVID-19 pandemic [online first]. JAMA. 2020. https://doi.org/10.1001/jama.2020.5317
7. Bauchner H, Sharfstein J. A bold response to the COVID-19 pandemic: medical students, national service, and public health [online first]. JAMA. 2020. https://doi.org/10.1001/jama.2020.6166
8. Hollander JE, Carr BG. Virtually perfect? telemedicine for Covid-19. N Engl J Med. 2020;382(18):1679‐1681. https://doi.org/10.1056/nejmp2003539
9. Hau YS, Kim JK, Hur J, Chang MC. How about actively using telemedicine during the COVID-19 pandemic? J Med Syst. 2020;44(6):108. https://doi.org/10.1007/s10916-020-01580-z
10. Smith WR, Atala AJ, Terlecki RP, Kelly EE, Matthews CA. Implementation guide for rapid integration of an outpatient telemedicine program during the COVID-19 pandemic [online first]. J Am Coll Surg. 2020. https://doi.org/10.1016/j.jamcollsurg.2020.04.030
The coronavirus disease of 2019 (COVID-19) pandemic has resulted in a surge in hospitalizations of patients with a novel, serious, and highly contagious infectious disease for which there is yet no proven treatment. Currently, much of the focus has been on intensive care unit (ICU) and ventilator capacity for the sickest of these patients who develop respiratory failure. However, most hospitalized patients are being cared for in general medical units.1 Some evidence exists to describe adaptations to capacity needs outside of medical wards,2-4 but few studies have specifically addressed the ward setting. Therefore, there is a pressing need for evidence to describe how to expand capacity and deliver medical ward–based care.
To better understand how inpatient care in the United States is adapting to the COVID-19 pandemic, we surveyed 72 sites participating in the Hospital Medicine Reengineering Network (HOMERuN), a national consortium of hospital medicine groups.5 We report results of this survey, carried out between April 3 and April 5, 2020.
METHODS
Sites and Subjects
HOMERuN is a collaborative network of hospitalists from across the United States whose primary goal is to catalyze research and share best practices across hospital medicine groups. Using surveys of Hospital Medicine leaders, targeted medical record review, and other methods, HOMERuN’s funded research interests to date have included care transitions, workforce issues, patient and family engagement, and diagnostic errors. Sites participating in HOMERuN sites are relatively large urban academic medical centers (Appendix).
Survey Development and Deployment
We designed a focused survey that aimed to provide a snapshot of evolving operational and clinical aspects of COVID-19 care (Appendix). Domains included COVID-19 testing turnaround times, personal protective equipment (PPE) stewardship,6 features of respiratory isolation units (RIUs; ie, dedicated units for patients with known or suspected COVID-19), and observed effects on clinical care. We tested the instrument to ensure feasibility and clarity internally, performed brief cognitive testing with several hospital medicine leaders in HOMERuN, then disseminated the survey by email on April 3, with two follow-up emails on 2 subsequent days. Our study was deemed non–human subjects research by the University of California, San Francisco, Committee on Human Research. Descriptive statistics were used to characterize survey responses.
RESULTS
Of 72 hospitals surveyed, 51 (71%) responded. Mean hospital bed count was 940, three were safety-net hospitals, and one was a community-based teaching center; responding and nonresponding hospitals did not differ significantly in terms of bed count (Appendix).
Health System Adaptations, Testing, and PPE Status
Nearly all responding hospitals (46 of 51; 90%) had RIUs for patients with known or suspected COVID-19 (Table 1). Nearly all hospitals took steps to keep potentially sick healthcare providers from infecting others (eg, staying home if sick or exposed). Among respondents, 32% had rapid response teams, 24% had respiratory therapy teams, and 29% had case management teams that were dedicated to COVID-19 care. Thirty-two (63%) had developed models, such as ethics or palliative care consult services, to assist with difficult resource-allocation decisions (eg, how to prioritize ventilator use if demand exceeded supply). Twenty-three (45%) had developed post-acute care monitoring programs dedicated to COVID-19 patients.
At the time of our survey, only 2 sites (4%) reported COVID-19 test time turnaround under 1 hour, and 15 (30%) reported turnaround in less than 6 hours. Of the 29 sites able to provide estimates of PPE stockpile, 14 (48%) reported a supply of 2 weeks or less. The most common approaches to PPE stewardship focused on reuse of masks and face shields if not obviously soiled, centralizing PPE distribution, and disinfecting or sterilizing masks. Ten sites (20%) were utilizing 3-D printed masks, while 10% used homemade face shields or masks.
Characteristics of COVID-19 RIUs
Forty-six hospitals (90% of all respondents) in our cohort had developed RIUs at the time of survey administration. The earliest RIU implementation date was February 10, 2020, and the most recent was launched on the day of our survey. Admission to RIUs was primarily based on clinical factors associated with known or suspected COVID-19 infection (Table 2). The number of non–critical care RIU beds among locations at that time ranged from 10 or less to more than 50. The mean number of hospitalist attendings caring for patients in the RIUs was 10.2, with a mean 4.1 advanced practice providers, 5.5 residents, and 0 medical students. The number of planned patients per attending was typically 5 to 15. Nurses and physicians typically rounded separately. Medical distancing (eg, reducing patient room entry) was accomplished most commonly by grouped timing of medication administration (76% of sites), video links to room outside of rounding times (54% of sites), the use of video or telemedicine during rounds (17%), and clustering of activities such as medication administration or phlebotomy. The most common criteria prompting discharge from the RIU were a negative COVID-19 test (59%) and hospital discharge (57%), though comments from many respondents suggested that discharge criteria were changing rapidly.
Effects of Isolation Measures on In-Room Encounters and Diagnostic Processes
More than 90% of sites reported decreases in in-room encounter frequency across all provider types whether as a result of policies in place or not. Reductions were reported among hospitalists, advanced practice providers, residents, consultants, and therapists (Table 3). Reduced room entry most often resulted from an established or developing policy, but many noted reduced room entry without formal policies in place. Nearly all sites reported moving specialty consultations to phone or video evaluations. Diagnostic error was commonly reported, with missed non–COVID-19 medical diagnoses among COVID-19 infected patients being reported by 22 sites (46%) and missed COVID-19 diagnoses in patients admitted for other reasons by 22 sites (45%).
DISCUSSION
In this study of medical wards at academic medical centers, we found that, in response to the COVID-19 pandemic, hospitals made several changes in a short period of time to adapt to the crisis. These included implementation and rapid expansion of dedicated RIUs, greatly expanded use of inpatient telehealth for patient assessments and consultation, implementation of other approaches to minimize room entry (such as grouping in-room activities), and deployment of ethics consultation services to help manage issues around potential scarcity of life-saving measures such as ventilators. We also found that availability of PPE and timely testing was limited. Finally, a large proportion of sites reported potential diagnostic problems in the assessment of both patients suspected and those not suspected of having COVID-19.
RIUs are emerging as a primary modality for caring for non-ICU COVID-19 patients, though they never involved medical students; we hope the role of students in particular will increase as new models of training emerge in response to the pandemic.7 In contrast, telemedicine evolved rapidly to hold a substantial role in RIUs, with both ward and specialty teams using video visit technology to communicate with patients. COVID-19 has been viewed as a perfect use case for outpatient telemedicine,8 and a growing number of studies are examining its outpatient use9,10; however, to date, somewhat less attention has been paid to inpatient deployment. Although our data suggest telemedicine has found a prominent place in RIUs, it remains to be seen whether it is associated with differences in patient or provider outcomes. For example, deficiencies in the physical examination, limited face-to-face contact, and lack of physical presence could all affect the patient–provider relationship, patient engagement, and the accuracy of the diagnostic process.
Our data suggest the possibility of missing non–COVID-19 diagnoses in patients suspected of COVID-19 and missing COVID-19 in those admitted for nonrespiratory reasons. The latter may be addressed as routine COVID-19 screening of admitted patients becomes commonplace. For the former, however, it is possible that physicians are “anchoring” their thinking on COVID-19 to the exclusion of other diagnoses, that physicians are not fully aware of complications unique to COVID-19 infection (such as thromboembolism), and/or that the above-mentioned limitations of telemedicine have decreased diagnostic performance.
Although PPE stockpile data were not easily available for some sites, a distressingly large number reported stockpiles of 2 weeks or less, with reuse being the most common approach to extending PPE supply. We also found it concerning that 43% of hospital leaders did not know their stockpile data; we believe this is an important question that hospital leaders need to be asking. Most sites in our study reported test turnaround times of longer than 6 hours; lack of rapid COVID-19 testing further stresses PPE stockpile and may slow patients’ transition out of the RIU or discharge to home.
Our study has several limitations, including the evolving nature of the pandemic and rapid adaptations of care systems in the pandemic’s surge phase. However, we attempted to frame our questions in ways that provided a focused snapshot of care. Furthermore, respondents may not have had exhaustive knowledge of their institution’s COVID-19 response strategies, but most were the directors of their hospitalist services, and we encouraged the respondents to confer with others to gather high-fidelity data. Finally, as a survey of large academic medical centers, our results may not apply to nonacademic centers.
Approaches to caring for non-ICU patients during the COVID-19 pandemic are rapidly evolving. Expansion of RIUs and developing the workforce to support them has been a primary focus, with rapid innovation in use of technology emerging as a critical adaptation while PPE limitations persist and needs for “medical distancing” continue to grow. Although rates of missed COVID-19 diagnoses will likely be reduced with testing and systems improvements, physicians and systems will also need to consider how to utilize emerging technology in ways that can improve clinical care and provider safety while aiding diagnostic thinking. This survey illustrates the rapid adaptations made by our hospitals in response to the pandemic; ongoing adaptation will likely be needed to optimally care for hospitalized patients with COVID-19 while the pandemic continues to evolve.
Acknowledgment
Thanks to members of the HOMERuN COVID-19 Collaborative Group: Baylor Scott & White Medical Center – Temple, Texas - Tresa McNeal MD; Beth Israel Deaconess Medical Center - Shani Herzig MD MPH, Joseph Li MD, Julius Yang MD PhD; Brigham and Women’s Hospital - Christopher Roy MD, Jeffrey Schnipper MD MPH; Cedars-Sinai Medical Center - Ed Seferian MD, ; ChristianaCare - Surekha Bhamidipati MD; Cleveland Clinic - Matthew Pappas MD MPH; Dartmouth-Hitchcock Medical Center - Jonathan Lurie MD MS; Dell Medical School at The University of Texas at Austin - Chris Moriates MD, Luci Leykum MD MBA MSc; Denver Health and Hospitals Authority - Diana Mancini MD; Emory University Hospital - Dan Hunt MD; Johns Hopkins Hospital - Daniel J Brotman MD, Zishan K Siddiqui MD, Shaker Eid MD MBA; Maine Medical Center - Daniel A Meyer MD, Robert Trowbridge MD; Massachusetts General Hospital - Melissa Mattison MD; Mayo Clinic Rochester – Caroline Burton MD, Sagar Dugani MD PhD; Medical College of Wisconsin - Sanjay Bhandari MD; Miriam Hospital - Kwame Dapaah-Afriyie MD MBA; Mount Sinai Hospital - Andrew Dunn MD; NorthShore - David Lovinger MD; Northwestern Memorial Hospital - Kevin O’Leary MD MS; Ohio State University Wexner Medical Center - Eric Schumacher DO; Oregon Health & Science University - Angela Alday MD; Penn Medicine - Ryan Greysen MD MHS MA; Rutgers- Robert Wood Johnson University Hospital - Michael Steinberg MD MPH; Stanford University School of Medicine - Neera Ahuja MD; Tulane Hospital and University Medical Center - Geraldine Ménard MD; UC San Diego Health - Ian Jenkins MD; UC Los Angeles Health - Michael Lazarus MD, Magdalena E. Ptaszny, MD; UC San Francisco Health - Bradley A Sharpe, MD, Margaret Fang MD MPH; UK HealthCare - Mark Williams MD MHM, John Romond MD; University of Chicago – David Meltzer MD PhD, Gregory Ruhnke MD; University of Colorado - Marisha Burden MD; University of Florida - Nila Radhakrishnan MD; University of Iowa Hospitals and Clinics - Kevin Glenn MD MS; University of Miami - Efren Manjarrez MD; University of Michigan - Vineet Chopra MD MSc, Valerie Vaughn MD MSc; University of Missouri-Columbia Hospital - Hasan Naqvi MD; University of Nebraska Medical Center - Chad Vokoun MD; University of North Carolina at Chapel Hill - David Hemsey MD; University of Pittsburgh Medical Center - Gena Marie Walker MD; University of Vermont Medical Center - Steven Grant MD; University of Washington Medical Center - Christopher Kim MD MBA, Andrew White MD; University of Washington-Harborview Medical Center - Maralyssa Bann MD; University of Wisconsin Hospital and Clinics - David Sterken MD, Farah Kaiksow MD MPP, Ann Sheehy MD MS, Jordan Kenik MD MPH; UW Northwest Campus - Ben Wolpaw MD; Vanderbilt University Medical Center - Sunil Kripalani MD MSc, Eduard E Vasilevskis MD, Kathleene T Wooldridge MD MPH; Wake Forest Baptist Health - Erik Summers MD; Washington University St. Louis - Michael Lin MD; Weill Cornell - Justin Choi MD; Yale New Haven Hospital - William Cushing MA, Chris Sankey MD; Zuckerberg San Francisco General Hospital - Sumant Ranji MD.
1. Institute for Health Metrics and Evaluation. COVID-19 Projections: United States of America. 2020. Accessed May 5, 2020. https://covid19.healthdata.org/united-states-of-america
2. Iserson KV. Alternative care sites: an option in disasters. West J Emerg Med. 2020;21(3):484‐489. https://doi.org/10.5811/westjem.2020.4.47552
3. Paganini M, Conti A, Weinstein E, Della Corte F, Ragazzoni L. Translating COVID-19 pandemic surge theory to practice in the emergency department: how to expand structure [online first]. Disaster Med Public Health Prep. 2020:1-10. https://doi.org/10.1017/dmp.2020.57
4. Kumaraiah D, Yip N, Ivascu N, Hill L. Innovative ICU Physician Care Models: Covid-19 Pandemic at NewYork-Presbyterian. NEJM: Catalyst. April 28, 2020. Accessed May 5, 2020. https://catalyst.nejm.org/doi/full/10.1056/CAT.20.0158
5. Auerbach AD, Patel MS, Metlay JP, et al. The Hospital Medicine Reengineering Network (HOMERuN): a learning organization focused on improving hospital care. Acad Med. 2014;89(3):415-420. https://doi.org/10.1097/acm.0000000000000139
6. Livingston E, Desai A, Berkwits M. Sourcing personal protective equipment during the COVID-19 pandemic [online first]. JAMA. 2020. https://doi.org/10.1001/jama.2020.5317
7. Bauchner H, Sharfstein J. A bold response to the COVID-19 pandemic: medical students, national service, and public health [online first]. JAMA. 2020. https://doi.org/10.1001/jama.2020.6166
8. Hollander JE, Carr BG. Virtually perfect? telemedicine for Covid-19. N Engl J Med. 2020;382(18):1679‐1681. https://doi.org/10.1056/nejmp2003539
9. Hau YS, Kim JK, Hur J, Chang MC. How about actively using telemedicine during the COVID-19 pandemic? J Med Syst. 2020;44(6):108. https://doi.org/10.1007/s10916-020-01580-z
10. Smith WR, Atala AJ, Terlecki RP, Kelly EE, Matthews CA. Implementation guide for rapid integration of an outpatient telemedicine program during the COVID-19 pandemic [online first]. J Am Coll Surg. 2020. https://doi.org/10.1016/j.jamcollsurg.2020.04.030
© 2020 Society of Hospital Medicine
Interhospital Transfer: Transfer Processes and Patient Outcomes
The transfer of patients between acute care hospitals (interhospital transfer [IHT]) occurs regularly among patients with a variety of diagnoses, in theory, to gain access to unique specialty services and/or a higher level of care, among other reasons.1,2
However, the practice of IHT is variable and nonstandardized,3,4 and existing data largely suggests that transferred patients experience worse outcomes, including longer length of stay, higher hospitalization costs, longer ICU time, and greater mortality, even with rigorous adjustment for confounding by indication.5,6 Though there are many possible reasons for these findings, existing literature suggests that there may be aspects of the transfer process itself which contribute to these outcomes.2,6,7
Understanding which aspects of the transfer process contribute to poor patient outcomes is a key first step toward the development of targeted quality improvement initiatives to improve this process of care. In this study, we aim to examine the association between select characteristics of the transfer process, including the timing of transfer and workload of the admitting physician team, and clinical outcomes among patients undergoing IHT.
METHODS
Data and Study Population
We performed a retrospective analysis of patients ≥age 18 years who transferred to Brigham and Women’s Hospital (BWH), a 777-bed tertiary care hospital, from another acute care hospital between January 2005, and September 2013. Dates of inclusion were purposefully chosen prior to BWH implementation of a new electronic health records system to avoid potential information bias. As at most academic medical centers, night coverage at BWH differs by service and includes a combination of long-call admitting teams and night float coverage. On weekends, many services are less well staffed, and some procedures may only be available if needed emergently. Some services have caps on the daily number of admissions or total patient census, but none have caps on the number of discharges per day. Patients were excluded from analysis if they left BWH against medical advice, were transferred from closely affiliated hospitals with shared personnel and electronic health records (Brigham and Women’s Faulkner Hospital, Dana Farber Cancer Institute), transferred from inpatient psychiatric or inpatient hospice facilities, or transferred to obstetrics or nursery services. Data were obtained from administrative sources and the research patient data repository (RPDR), a centralized clinical data repository that gathers data from various hospital legacy systems and stores them in one data warehouse.8 Our study was approved by the Partners Institutional Review Board (IRB) with a waiver of patient consent.
Transfer Process Characteristics
Predictors included select characteristics of the transfer process, including (1) Day of week of transfer, dichotomized into Friday through Sunday (“weekend”), versus Monday through Thursday (“weekday”);9 Friday was included with “weekend” given the suggestion of increased volume of transfers in advance of the weekend; (2) Time of arrival of the transferred patient, categorized into “daytime” (7
Outcomes
Outcomes included transfer to the intensive care unit (ICU) within 48 hours of arrival and 30-day mortality from date of index admission.5,6
Patient Characteristics
Covariates for adjustment included: patient age, sex, race, Elixhauser comorbidity score,11 Diagnosis-Related Group (DRG)-weight, insurance status, year of admission, number of preadmission medications, and service of admission.
Statistical Analyses
We used descriptive statistics to display baseline characteristics and performed a series of univariable and multivariable logistic regression models to obtain the adjusted odds of each transfer process characteristic on each outcome, adjusting for all covariates (proc logistic, SAS Statistical Software, Cary, North Carolina). For analyses of ICU transfer within 48 hours of arrival, all patients initially admitted to the ICU at time of transfer were excluded.
In the secondary analyses, we used a combined day-of-week and time-of-day variable (ie, Monday day, Monday evening, Monday night, Tuesday day, and so on, with Monday day as the reference group) to obtain a more detailed evaluation of timing of transfer on patient outcomes. We also performed stratified analyses to evaluate each transfer process characteristic on adjusted odds of 30-day mortality stratified by service of admission (ie, at the time of transfer to BWH), adjusting for all covariates. For all analyses, two-sided P values < .05 were considered significant.
RESULTS
Overall, 24,352 patients met our inclusion criteria and underwent IHT, of whom 2,174 (8.9%) died within 30 days. Of the 22,910 transferred patients originally admitted to a non-ICU service, 5,464 (23.8%) underwent ICU transfer within 48 hours of arrival. Cohort characteristics are shown in Table 1.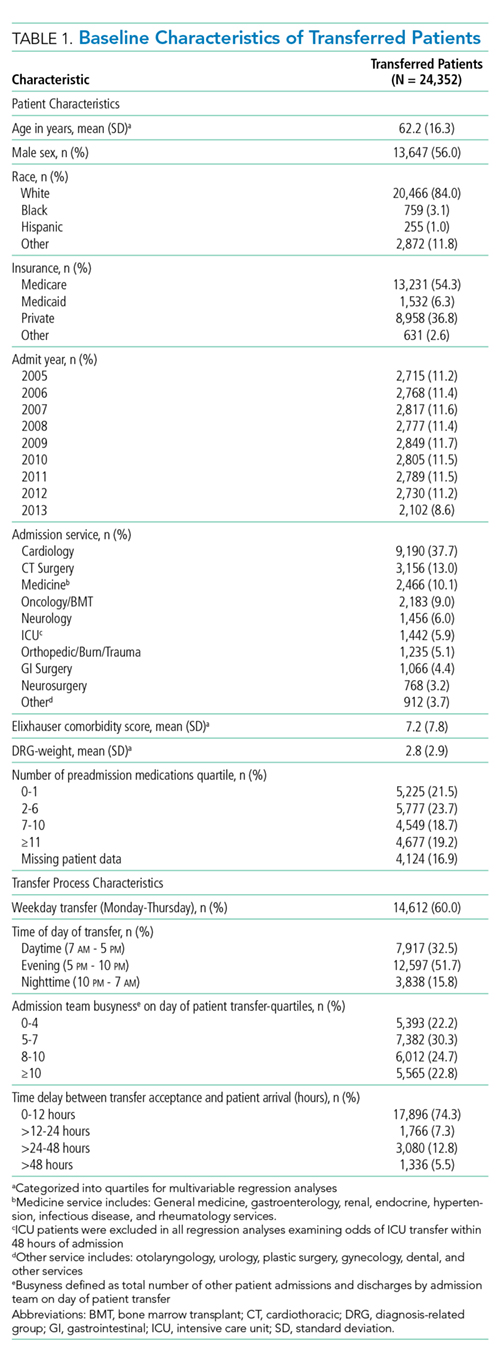
Multivariable regression analyses demonstrated no significant association between weekend (versus weekday) transfer or increased time delay between patient acceptance and arrival (>48 hours) and adjusted odds of ICU transfer within 48 hours or 30-day mortality. However, they did demonstrate that nighttime (versus daytime) transfer was associated with greater adjusted odds of both ICU transfer and 30-day mortality. Increased admitting team busyness was associated with lower adjusted odds of ICU transfer but was not significantly associated with adjusted odds of 30-day mortality (Table 2). As expected, decreased time delay between patient acceptance and arrival (0-12 hours) was associated with increased adjusted odds of both ICU transfer (adjusted OR 2.68; 95% CI 2.29, 3.15) and 30-day mortality (adjusted OR 1.25; 95% CI 1.03, 1.53) compared with 12-24 hours (results not shown). Time delay >48 hours was not associated with either outcome.
Regression analyses with the combined day/time variable demonstrated that compared with Monday daytime transfer, Sunday night transfer was significantly associated with increased adjusted odds of 30-day mortality, and Friday night transfer was associated with a trend toward increased 30-day mortality (adjusted OR [aOR] 1.88; 95% CI 1.25, 2.82, and aOR 1.43; 95% CI 0.99, 2.06, respectively). We also found that all nighttime transfers (ie, Monday through Sunday night) were associated with increased adjusted odds of ICU transfer within 48 hours (as compared with Monday daytime transfer). Other days/time analyses were not significant.
Univariable and multivariable analyses stratified by service were performed (Appendix). Multivariable stratified analyses demonstrated that weekend transfer, nighttime transfer, and increased admitting team busyness were associated with increased adjusted odds of 30-day mortality among cardiothoracic (CT) and gastrointestinal (GI) surgical service patients. Increased admitting team busyness was also associated with increased mortality among ICU service patients but was associated with decreased mortality among cardiology service patients. An increased time delay between patient acceptance and arrival was associated with decreased mortality among CT and GI surgical service patients (Figure; Appendix). Other adjusted stratified outcomes were not significant.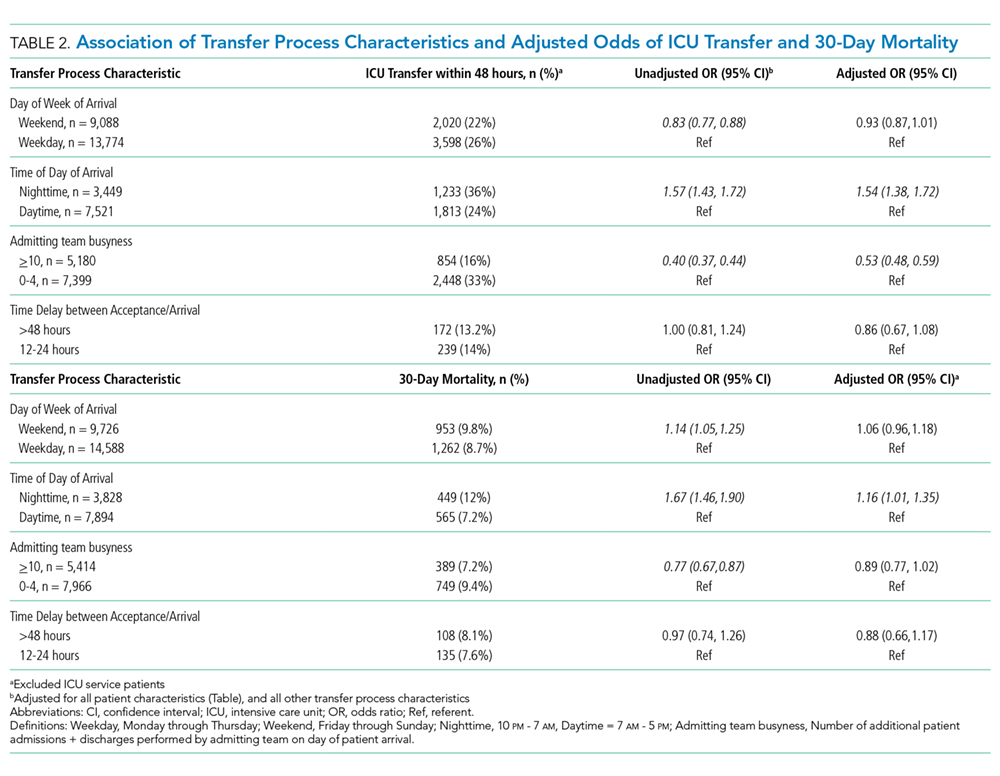
DISCUSSION
In this study of 24,352 patients undergoing IHT, we found no significant association between weekend transfer or increased time delay between transfer acceptance and arrival and patient outcomes in the cohort as a whole; but we found that nighttime transfer is associated with increased adjusted odds of both ICU transfer within 48 hours and 30-day mortality. Our analyses combining day-of-week and time-of-day demonstrate that Sunday night transfer is particularly associated with increased adjusted odds of 30-day mortality (as compared with Monday daytime transfer), and show a trend toward increased mortality with Friday night transfers. These detailed analyses otherwise reinforce that nighttime transfer across all nights of the week is associated with increased adjusted odds of ICU transfer within 48 hours. We also found that increased admitting team busyness on the day of patient transfer is associated with decreased odds of ICU transfer, though this may solely be reflective of higher turnover services (ie, cardiology) caring for lower acuity patients, as suggested by secondary analyses stratified by service. In addition, secondary analyses demonstrated differential associations between weekend transfers, nighttime transfers, and increased team busyness on the odds of 30-day mortality based on service of transfer. These analyses showed that patients transferred to higher acuity services requiring procedural care, including CT surgery, GI surgery, and Medical ICU, do worse under all three circumstances as compared with patients transferred to other services. Secondary analyses also demonstrated that increased time delay between patient acceptance and arrival is inversely associated with 30-day mortality among CT and GI surgery service patients, likely reflecting lower acuity patients (ie, less sick patients are less rapidly transferred).
There are several possible explanations for these findings. Patients transferred to surgical services at night may reflect a more urgent need for surgery and include a sicker cohort of patients, possibly explaining these findings. Alternatively, or in addition, both weekend and nighttime hospital admission expose patients to similar potential risks, ie, limited resources available during off-peak hours. Our findings could, therefore, reflect the possibility that patients transferred to higher acuity services in need of procedural care are most vulnerable to off-peak timing of transfer. Similar data looking at patients admitted through the emergency room (ER) find the strongest effect of off-peak admissions on patients in need of procedures, including GI hemorrhage,12 atrial fibrillation13 and acute myocardial infarction (AMI),14 arguably because of the limited availability of necessary interventions. Patients undergoing IHT are a sicker cohort of patients than those admitted through the ER, and, therefore, may be even more vulnerable to these issues.3,5 This is supported by our findings that Sunday night transfers (and trend toward Friday night transfers) are associated with greater mortality compared with Monday daytime transfers, when at-the-ready resources and/or specialty personnel may be less available (Sunday night), and delays until receipt of necessary procedures may be longer (Friday night). Though we did not observe similar results among cardiology service transfers, as may be expected based on existing literature,13,14 this subset of patients includes more heterogeneous diagnoses, (ie, not solely those that require acute intervention) and exhibited a low level of acuity (low Elixhauser score and DRG-weight, data not shown).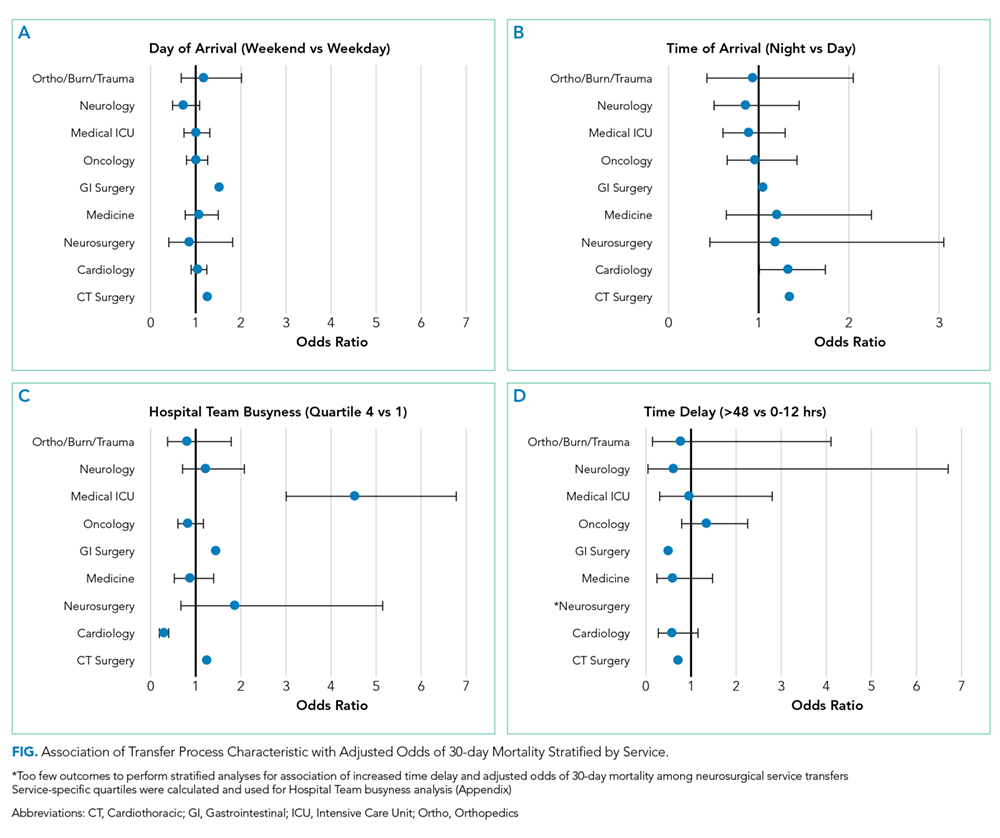
We also found that increased admitting team busyness on the day of patient transfer is associated with increased odds of 30-day mortality among CT surgery, GI surgery, and ICU service transfers. As above, there are several possible explanations for this finding. It is possible that among these services, only the sickest/neediest patients are accepted for transfer when teams are busiest, explaining our findings. Though this explanation is possible, the measure of team “busyness” includes patient discharge, thereby increasing, not decreasing, availability for incoming patients, making this explanation less likely. Alternatively, it is possible that this finding is reflective of reverse causation, ie, that teams have less ability to discharge/admit new patients when caring for particularly sick/unstable patient transfers, though this assumes that transferred patients arrive earlier in the day, (eg, in time to influence discharge decisions), which infrequently occurs (Table 1). Lastly, it is possible that this subset of patients will be more vulnerable to the workload of the team that is caring for them at the time of their arrival. With high patient turnover (admissions/discharges), the time allocated to each patient’s care may be diminished (ie, “work compression,” trying to do the same amount of work in less time), and may result in decreased time to care for the transferred patient. This has been shown to influence patient outcomes at the time of patient discharge.10
In trying to understand why we observed an inverse relationship between admitting team busyness and odds of ICU transfer within 48 hours, we believe this finding is largely driven by cardiology service transfers, which comprise the highest volume of transferred patients in our cohort (Table 1), and are low acuity patients. Within this population of patients, admitting team busyness is likely a surrogate variable for high turnover/low acuity. This idea is supported by our findings that admitting team busyness is associated with decreased adjusted odds of 30-day mortality in this group (and only in this group).
Similarly, our observed inverse relationship between increased time delay and 30-day mortality among CT and GI surgical service patients is also likely reflective of lower acuity patients. We anticipated that decreased time delay (0-12 hours) would be reflective of greater patient acuity (supported by our findings that decreased time delay is associated with increased odds of ICU transfer and 30-day mortality). However, our findings also suggest that increased time delay (>48 hours) is similarly representative of lower patient acuity and therefore an imperfect measure of discontinuity and/or harmful delays in care during IHT (see limitations below).
Our study is subject to several limitations. This is a single site study; given known variation in transfer practices between hospitals,3 it is possible that our findings are not generalizable. However, given similar existing data on patients admitted through the ER, it is likely our findings may be reflective of IHT to similar tertiary referral hospitals. Second, although we adjusted for patient characteristics, there remains the possibility of unmeasured confounding and other bias that account for our results, as discussed. Third, although the definition of “busyness” used in this study was chosen based on prior data demonstrating an effect on patient outcomes,10 we did not include other measures of busyness that may influence outcomes of transferred patients such as overall team census or hospital busyness. However, the workload associated with a high volume of patient admissions and discharges is arguably a greater reflection of “work compression” for the admitting team compared with overall team census, which may reflect a more static workload with less impact on the care of a newly transferred patient. Also, although hospital census may influence the ability to transfer (ie, lower volume of transferred patients during times of high hospital census), this likely has less of an impact on the direct care of transferred patients than the admitting team’s workload. It is more likely that it would serve as a confounder (eg, sicker patients are accepted for transfer despite high hospital census, while lower risk patients are not).
Nevertheless, future studies should further evaluate the association with other measures of busyness/workload and outcomes of transferred patients. Lastly, though we anticipated time delay between transfer acceptance and arrival would be correlated with patient acuity, we hypothesized that longer delay might affect patient continuity and communication and impact patient outcomes. However, our results demonstrate that our measurement of this variable was unsuccessful in unraveling patient acuity from our intended evaluation of these vulnerable aspects of IHT. It is likely that a more detailed evaluation is required to explore potential challenges more fully that may occur with greater time delays (eg, suboptimal communication regarding changes in clinical status during this time period, delays in treatment). Similarly, though our study evaluates the association between nighttime and weekend transfer (and the interaction between these) with patient outcomes, we did not evaluate other intermediate outcomes that may be more affected by the timing of transfer, such as diagnostic errors or delays in procedural care, which warrant further investigation. We do not directly examine the underlying reasons that explain our observed associations, and thus more research is needed to identify these as well as design and evaluate solutions.
Collectively, our findings suggest that high acuity patients in need of procedural care experience worse outcomes during off-peak times of transfer, and during times of high care-team workload. Though further research is needed to identify underlying reasons to explain our findings, both the timing of patient transfer (when modifiable) and workload of the team caring for the patient on arrival may serve as potential targets for interventions to improve the quality and safety of IHT for patients at greatest risk.
Disclosures
Dr. Mueller and Dr. Schnipper have nothing to disclose. Ms. Fiskio has nothing to disclose. Dr. Schnipper is the recipient of grant funding from Mallinckrodt Pharmaceuticals to conduct an investigator-initiated study of predictors and impact of opioid-related adverse drug events.
1. Iwashyna TJ. The incomplete infrastructure for interhospital patient transfer. Crit Care Med. 2 012;40(8):2470-2478. https://doi.org/10.1097/CCM.0b013e318254516f.
2. Mueller SK, Shannon E, Dalal A, Schnipper JL, Dykes P. Patient and physician experience with interhospital transfer: a qualitative study. J Patient Saf. 2018. https://doi.org/10.1097/PTS.0000000000000501
3. Mueller SK, Zheng J, Orav EJ, Schnipper JL. Rates, predictors and variability of interhospital transfers: a national evaluation. J Hosp Med. 2017;12(6):435-442.https://doi.org/10.12788/jhm.2747.
4. Bosk EA, Veinot T, Iwashyna TJ. Which patients and where: a qualitative study of patient transfers from community hospitals. Med Care. 2011;49(6):592-598. https://doi.org/10.1097/MLR.0b013e31820fb71b.
5. Sokol-Hessner L, White AA, Davis KF, Herzig SJ, Hohmann SF. Interhospital transfer patients discharged by academic hospitalists and general internists: characteristics and outcomes. J Hosp Med. 2016;11(4):245-50. https://doi.org/10.1002/jhm.2515.
6. Mueller S, Zheng J, Orav EJP, Schnipper JL. Inter-hospital transfer and patient outcomes: a retrospective cohort study. BMJ Qual Saf. 2018. https://doi.org/10.1136/bmjqs-2018-008087.
7. Mueller SK, Schnipper JL. Physician perspectives on interhospital transfers. J Patient Saf. 2016. https://doi.org/10.1097/PTS.0000000000000312.
8. Research Patient Data Registry (RPDR). http://rc.partners.org/rpdr. Accessed April 20, 2018.
9. Bell CM, Redelmeier DA. Mortality among patients admitted to hospitals on weekends as compared with weekdays. N Engl J Med. 2001;345(9):663-668. https://doi.org/10.1056/NEJMsa003376
10. Mueller SK, Donze J, Schnipper JL. Intern workload and discontinuity of care on 30-day readmission. Am J Med. 2013;126(1):81-88. https://doi.org/10.1016/j.amjmed.2012.09.003.
11. Elixhauser A, Steiner C, Harris DR, Coffey RM. Comorbidity measures for use with administrative data. Med Care. 1998;36(1):8-27. PubMed
12. Ananthakrishnan AN, McGinley EL, Saeian K. Outcomes of weekend admissions for upper gastrointestinal hemorrhage: a nationwide analysis. Clin Gastroenterol Hepatol. 2009;7(3):296-302e1. https://doi.org/10.1016/j.cgh.2008.08.013.
13. Deshmukh A, Pant S, Kumar G, Bursac Z, Paydak H, Mehta JL. Comparison of outcomes of weekend versus weekday admissions for atrial fibrillation. Am J Cardiol. 2012;110(2):208-211. https://doi.org/10.1016/j.amjcard.2012.03.011.
14. Clarke MS, Wills RA, Bowman RV, et al. Exploratory study of the ‘weekend effect’ for acute medical admissions to public hospitals in Queensland, Australia. Intern Med J. 2010;40(11):777-783. https://doi.org/-10.1111/j.1445-5994.2009.02067.x.
The transfer of patients between acute care hospitals (interhospital transfer [IHT]) occurs regularly among patients with a variety of diagnoses, in theory, to gain access to unique specialty services and/or a higher level of care, among other reasons.1,2
However, the practice of IHT is variable and nonstandardized,3,4 and existing data largely suggests that transferred patients experience worse outcomes, including longer length of stay, higher hospitalization costs, longer ICU time, and greater mortality, even with rigorous adjustment for confounding by indication.5,6 Though there are many possible reasons for these findings, existing literature suggests that there may be aspects of the transfer process itself which contribute to these outcomes.2,6,7
Understanding which aspects of the transfer process contribute to poor patient outcomes is a key first step toward the development of targeted quality improvement initiatives to improve this process of care. In this study, we aim to examine the association between select characteristics of the transfer process, including the timing of transfer and workload of the admitting physician team, and clinical outcomes among patients undergoing IHT.
METHODS
Data and Study Population
We performed a retrospective analysis of patients ≥age 18 years who transferred to Brigham and Women’s Hospital (BWH), a 777-bed tertiary care hospital, from another acute care hospital between January 2005, and September 2013. Dates of inclusion were purposefully chosen prior to BWH implementation of a new electronic health records system to avoid potential information bias. As at most academic medical centers, night coverage at BWH differs by service and includes a combination of long-call admitting teams and night float coverage. On weekends, many services are less well staffed, and some procedures may only be available if needed emergently. Some services have caps on the daily number of admissions or total patient census, but none have caps on the number of discharges per day. Patients were excluded from analysis if they left BWH against medical advice, were transferred from closely affiliated hospitals with shared personnel and electronic health records (Brigham and Women’s Faulkner Hospital, Dana Farber Cancer Institute), transferred from inpatient psychiatric or inpatient hospice facilities, or transferred to obstetrics or nursery services. Data were obtained from administrative sources and the research patient data repository (RPDR), a centralized clinical data repository that gathers data from various hospital legacy systems and stores them in one data warehouse.8 Our study was approved by the Partners Institutional Review Board (IRB) with a waiver of patient consent.
Transfer Process Characteristics
Predictors included select characteristics of the transfer process, including (1) Day of week of transfer, dichotomized into Friday through Sunday (“weekend”), versus Monday through Thursday (“weekday”);9 Friday was included with “weekend” given the suggestion of increased volume of transfers in advance of the weekend; (2) Time of arrival of the transferred patient, categorized into “daytime” (7
Outcomes
Outcomes included transfer to the intensive care unit (ICU) within 48 hours of arrival and 30-day mortality from date of index admission.5,6
Patient Characteristics
Covariates for adjustment included: patient age, sex, race, Elixhauser comorbidity score,11 Diagnosis-Related Group (DRG)-weight, insurance status, year of admission, number of preadmission medications, and service of admission.
Statistical Analyses
We used descriptive statistics to display baseline characteristics and performed a series of univariable and multivariable logistic regression models to obtain the adjusted odds of each transfer process characteristic on each outcome, adjusting for all covariates (proc logistic, SAS Statistical Software, Cary, North Carolina). For analyses of ICU transfer within 48 hours of arrival, all patients initially admitted to the ICU at time of transfer were excluded.
In the secondary analyses, we used a combined day-of-week and time-of-day variable (ie, Monday day, Monday evening, Monday night, Tuesday day, and so on, with Monday day as the reference group) to obtain a more detailed evaluation of timing of transfer on patient outcomes. We also performed stratified analyses to evaluate each transfer process characteristic on adjusted odds of 30-day mortality stratified by service of admission (ie, at the time of transfer to BWH), adjusting for all covariates. For all analyses, two-sided P values < .05 were considered significant.
RESULTS
Overall, 24,352 patients met our inclusion criteria and underwent IHT, of whom 2,174 (8.9%) died within 30 days. Of the 22,910 transferred patients originally admitted to a non-ICU service, 5,464 (23.8%) underwent ICU transfer within 48 hours of arrival. Cohort characteristics are shown in Table 1.
Multivariable regression analyses demonstrated no significant association between weekend (versus weekday) transfer or increased time delay between patient acceptance and arrival (>48 hours) and adjusted odds of ICU transfer within 48 hours or 30-day mortality. However, they did demonstrate that nighttime (versus daytime) transfer was associated with greater adjusted odds of both ICU transfer and 30-day mortality. Increased admitting team busyness was associated with lower adjusted odds of ICU transfer but was not significantly associated with adjusted odds of 30-day mortality (Table 2). As expected, decreased time delay between patient acceptance and arrival (0-12 hours) was associated with increased adjusted odds of both ICU transfer (adjusted OR 2.68; 95% CI 2.29, 3.15) and 30-day mortality (adjusted OR 1.25; 95% CI 1.03, 1.53) compared with 12-24 hours (results not shown). Time delay >48 hours was not associated with either outcome.
Regression analyses with the combined day/time variable demonstrated that compared with Monday daytime transfer, Sunday night transfer was significantly associated with increased adjusted odds of 30-day mortality, and Friday night transfer was associated with a trend toward increased 30-day mortality (adjusted OR [aOR] 1.88; 95% CI 1.25, 2.82, and aOR 1.43; 95% CI 0.99, 2.06, respectively). We also found that all nighttime transfers (ie, Monday through Sunday night) were associated with increased adjusted odds of ICU transfer within 48 hours (as compared with Monday daytime transfer). Other days/time analyses were not significant.
Univariable and multivariable analyses stratified by service were performed (Appendix). Multivariable stratified analyses demonstrated that weekend transfer, nighttime transfer, and increased admitting team busyness were associated with increased adjusted odds of 30-day mortality among cardiothoracic (CT) and gastrointestinal (GI) surgical service patients. Increased admitting team busyness was also associated with increased mortality among ICU service patients but was associated with decreased mortality among cardiology service patients. An increased time delay between patient acceptance and arrival was associated with decreased mortality among CT and GI surgical service patients (Figure; Appendix). Other adjusted stratified outcomes were not significant.
DISCUSSION
In this study of 24,352 patients undergoing IHT, we found no significant association between weekend transfer or increased time delay between transfer acceptance and arrival and patient outcomes in the cohort as a whole; but we found that nighttime transfer is associated with increased adjusted odds of both ICU transfer within 48 hours and 30-day mortality. Our analyses combining day-of-week and time-of-day demonstrate that Sunday night transfer is particularly associated with increased adjusted odds of 30-day mortality (as compared with Monday daytime transfer), and show a trend toward increased mortality with Friday night transfers. These detailed analyses otherwise reinforce that nighttime transfer across all nights of the week is associated with increased adjusted odds of ICU transfer within 48 hours. We also found that increased admitting team busyness on the day of patient transfer is associated with decreased odds of ICU transfer, though this may solely be reflective of higher turnover services (ie, cardiology) caring for lower acuity patients, as suggested by secondary analyses stratified by service. In addition, secondary analyses demonstrated differential associations between weekend transfers, nighttime transfers, and increased team busyness on the odds of 30-day mortality based on service of transfer. These analyses showed that patients transferred to higher acuity services requiring procedural care, including CT surgery, GI surgery, and Medical ICU, do worse under all three circumstances as compared with patients transferred to other services. Secondary analyses also demonstrated that increased time delay between patient acceptance and arrival is inversely associated with 30-day mortality among CT and GI surgery service patients, likely reflecting lower acuity patients (ie, less sick patients are less rapidly transferred).
There are several possible explanations for these findings. Patients transferred to surgical services at night may reflect a more urgent need for surgery and include a sicker cohort of patients, possibly explaining these findings. Alternatively, or in addition, both weekend and nighttime hospital admission expose patients to similar potential risks, ie, limited resources available during off-peak hours. Our findings could, therefore, reflect the possibility that patients transferred to higher acuity services in need of procedural care are most vulnerable to off-peak timing of transfer. Similar data looking at patients admitted through the emergency room (ER) find the strongest effect of off-peak admissions on patients in need of procedures, including GI hemorrhage,12 atrial fibrillation13 and acute myocardial infarction (AMI),14 arguably because of the limited availability of necessary interventions. Patients undergoing IHT are a sicker cohort of patients than those admitted through the ER, and, therefore, may be even more vulnerable to these issues.3,5 This is supported by our findings that Sunday night transfers (and trend toward Friday night transfers) are associated with greater mortality compared with Monday daytime transfers, when at-the-ready resources and/or specialty personnel may be less available (Sunday night), and delays until receipt of necessary procedures may be longer (Friday night). Though we did not observe similar results among cardiology service transfers, as may be expected based on existing literature,13,14 this subset of patients includes more heterogeneous diagnoses, (ie, not solely those that require acute intervention) and exhibited a low level of acuity (low Elixhauser score and DRG-weight, data not shown).
We also found that increased admitting team busyness on the day of patient transfer is associated with increased odds of 30-day mortality among CT surgery, GI surgery, and ICU service transfers. As above, there are several possible explanations for this finding. It is possible that among these services, only the sickest/neediest patients are accepted for transfer when teams are busiest, explaining our findings. Though this explanation is possible, the measure of team “busyness” includes patient discharge, thereby increasing, not decreasing, availability for incoming patients, making this explanation less likely. Alternatively, it is possible that this finding is reflective of reverse causation, ie, that teams have less ability to discharge/admit new patients when caring for particularly sick/unstable patient transfers, though this assumes that transferred patients arrive earlier in the day, (eg, in time to influence discharge decisions), which infrequently occurs (Table 1). Lastly, it is possible that this subset of patients will be more vulnerable to the workload of the team that is caring for them at the time of their arrival. With high patient turnover (admissions/discharges), the time allocated to each patient’s care may be diminished (ie, “work compression,” trying to do the same amount of work in less time), and may result in decreased time to care for the transferred patient. This has been shown to influence patient outcomes at the time of patient discharge.10
In trying to understand why we observed an inverse relationship between admitting team busyness and odds of ICU transfer within 48 hours, we believe this finding is largely driven by cardiology service transfers, which comprise the highest volume of transferred patients in our cohort (Table 1), and are low acuity patients. Within this population of patients, admitting team busyness is likely a surrogate variable for high turnover/low acuity. This idea is supported by our findings that admitting team busyness is associated with decreased adjusted odds of 30-day mortality in this group (and only in this group).
Similarly, our observed inverse relationship between increased time delay and 30-day mortality among CT and GI surgical service patients is also likely reflective of lower acuity patients. We anticipated that decreased time delay (0-12 hours) would be reflective of greater patient acuity (supported by our findings that decreased time delay is associated with increased odds of ICU transfer and 30-day mortality). However, our findings also suggest that increased time delay (>48 hours) is similarly representative of lower patient acuity and therefore an imperfect measure of discontinuity and/or harmful delays in care during IHT (see limitations below).
Our study is subject to several limitations. This is a single site study; given known variation in transfer practices between hospitals,3 it is possible that our findings are not generalizable. However, given similar existing data on patients admitted through the ER, it is likely our findings may be reflective of IHT to similar tertiary referral hospitals. Second, although we adjusted for patient characteristics, there remains the possibility of unmeasured confounding and other bias that account for our results, as discussed. Third, although the definition of “busyness” used in this study was chosen based on prior data demonstrating an effect on patient outcomes,10 we did not include other measures of busyness that may influence outcomes of transferred patients such as overall team census or hospital busyness. However, the workload associated with a high volume of patient admissions and discharges is arguably a greater reflection of “work compression” for the admitting team compared with overall team census, which may reflect a more static workload with less impact on the care of a newly transferred patient. Also, although hospital census may influence the ability to transfer (ie, lower volume of transferred patients during times of high hospital census), this likely has less of an impact on the direct care of transferred patients than the admitting team’s workload. It is more likely that it would serve as a confounder (eg, sicker patients are accepted for transfer despite high hospital census, while lower risk patients are not).
Nevertheless, future studies should further evaluate the association with other measures of busyness/workload and outcomes of transferred patients. Lastly, though we anticipated time delay between transfer acceptance and arrival would be correlated with patient acuity, we hypothesized that longer delay might affect patient continuity and communication and impact patient outcomes. However, our results demonstrate that our measurement of this variable was unsuccessful in unraveling patient acuity from our intended evaluation of these vulnerable aspects of IHT. It is likely that a more detailed evaluation is required to explore potential challenges more fully that may occur with greater time delays (eg, suboptimal communication regarding changes in clinical status during this time period, delays in treatment). Similarly, though our study evaluates the association between nighttime and weekend transfer (and the interaction between these) with patient outcomes, we did not evaluate other intermediate outcomes that may be more affected by the timing of transfer, such as diagnostic errors or delays in procedural care, which warrant further investigation. We do not directly examine the underlying reasons that explain our observed associations, and thus more research is needed to identify these as well as design and evaluate solutions.
Collectively, our findings suggest that high acuity patients in need of procedural care experience worse outcomes during off-peak times of transfer, and during times of high care-team workload. Though further research is needed to identify underlying reasons to explain our findings, both the timing of patient transfer (when modifiable) and workload of the team caring for the patient on arrival may serve as potential targets for interventions to improve the quality and safety of IHT for patients at greatest risk.
Disclosures
Dr. Mueller and Dr. Schnipper have nothing to disclose. Ms. Fiskio has nothing to disclose. Dr. Schnipper is the recipient of grant funding from Mallinckrodt Pharmaceuticals to conduct an investigator-initiated study of predictors and impact of opioid-related adverse drug events.
1. Iwashyna TJ. The incomplete infrastructure for interhospital patient transfer. Crit Care Med. 2 012;40(8):2470-2478. https://doi.org/10.1097/CCM.0b013e318254516f.
2. Mueller SK, Shannon E, Dalal A, Schnipper JL, Dykes P. Patient and physician experience with interhospital transfer: a qualitative study. J Patient Saf. 2018. https://doi.org/10.1097/PTS.0000000000000501
3. Mueller SK, Zheng J, Orav EJ, Schnipper JL. Rates, predictors and variability of interhospital transfers: a national evaluation. J Hosp Med. 2017;12(6):435-442.https://doi.org/10.12788/jhm.2747.
4. Bosk EA, Veinot T, Iwashyna TJ. Which patients and where: a qualitative study of patient transfers from community hospitals. Med Care. 2011;49(6):592-598. https://doi.org/10.1097/MLR.0b013e31820fb71b.
5. Sokol-Hessner L, White AA, Davis KF, Herzig SJ, Hohmann SF. Interhospital transfer patients discharged by academic hospitalists and general internists: characteristics and outcomes. J Hosp Med. 2016;11(4):245-50. https://doi.org/10.1002/jhm.2515.
6. Mueller S, Zheng J, Orav EJP, Schnipper JL. Inter-hospital transfer and patient outcomes: a retrospective cohort study. BMJ Qual Saf. 2018. https://doi.org/10.1136/bmjqs-2018-008087.
7. Mueller SK, Schnipper JL. Physician perspectives on interhospital transfers. J Patient Saf. 2016. https://doi.org/10.1097/PTS.0000000000000312.
8. Research Patient Data Registry (RPDR). http://rc.partners.org/rpdr. Accessed April 20, 2018.
9. Bell CM, Redelmeier DA. Mortality among patients admitted to hospitals on weekends as compared with weekdays. N Engl J Med. 2001;345(9):663-668. https://doi.org/10.1056/NEJMsa003376
10. Mueller SK, Donze J, Schnipper JL. Intern workload and discontinuity of care on 30-day readmission. Am J Med. 2013;126(1):81-88. https://doi.org/10.1016/j.amjmed.2012.09.003.
11. Elixhauser A, Steiner C, Harris DR, Coffey RM. Comorbidity measures for use with administrative data. Med Care. 1998;36(1):8-27. PubMed
12. Ananthakrishnan AN, McGinley EL, Saeian K. Outcomes of weekend admissions for upper gastrointestinal hemorrhage: a nationwide analysis. Clin Gastroenterol Hepatol. 2009;7(3):296-302e1. https://doi.org/10.1016/j.cgh.2008.08.013.
13. Deshmukh A, Pant S, Kumar G, Bursac Z, Paydak H, Mehta JL. Comparison of outcomes of weekend versus weekday admissions for atrial fibrillation. Am J Cardiol. 2012;110(2):208-211. https://doi.org/10.1016/j.amjcard.2012.03.011.
14. Clarke MS, Wills RA, Bowman RV, et al. Exploratory study of the ‘weekend effect’ for acute medical admissions to public hospitals in Queensland, Australia. Intern Med J. 2010;40(11):777-783. https://doi.org/-10.1111/j.1445-5994.2009.02067.x.
© 2019 Society of Hospital Medicine
Hospitalist Effects on Acute IGIH Patients
Acute upper gastrointestinal hemorrhage (UGIH) is one of the most common hospital admissions for acute care. Estimates indicate that 300,000 patients (100‐150 cases per 100,000 adults) are admitted annually with an associated economic impact of $2.5 billion.15 The current standard management of UGIH requires hospital admission and esophagogastroduodenoscopy (EGD) by a gastroenterologist for diagnosis and/or treatment. This management strategy results in a high consumption of hospital resources and costs.
Simultaneously, hospitalists have dramatically changed the delivery of inpatient care in the United States and are recognized as a location‐driven subspecialty for the care of acute hospitalized patients, similar to emergency medicine. Currently there are 20,000 hospitalists, and more than one‐third of general medicine inpatients are cared for by hospitalists.6, 7
Previous studies have shown that hospitalist care offers better or comparable outcomes, with lower overall length of stay (LOS) and costs compared to traditional providers.810 However, most of these studies were performed in single institutions, had weak designs or little‐to‐no adjustment for severity of illness, or were limited to 7 specific diseases (pneumonia, congestive heart failure [CHF], chest pain, ischemic stroke, urinary tract infection, chronic obstructive lung disease [COPD], and acute myocardial infarction [AMI]).8
Furthermore, less is known about the effect of hospitalists on conditions that may be dependent upon specialist consultation for procedures and/or treatment plans. In this study, gastroenterologists performed diagnostic and/or therapeutic endoscopy work as consultants to the attending physicians in the management of acute inpatient UGIH.
To explore the effects of hospitalists on care of patients with acute UGIH, we examined data from the Multicenter Hospitalist (MCH) trial. The objectives of our study were to compare clinical outcomesin‐hospital mortality and complications (ie, recurrent bleeding, intensive care unit [ICU] transfer, decompensation, transfusion, reendoscopy, 30‐day readmission)and efficiency (LOS and costs) in hospitalized acute UGIH patients cared for by hospitalists and nonhospitalists in 6 academic centers in the United States during a 2‐year period.
Patients and Methods
Study Sites
From July 1, 2001 to June 30, 2003, the MCH trial1113 was a prospective, multicenter, observational trial of the care provided by hospitalists to patients admitted to general medical services at 6 academic medical institutions. There were 31,000 consecutive admissions to the general medical services of these participating sites: University of Chicago (Chicago, IL), University of Wisconsin Hospital (Madison, WI), University of Iowa (Iowa City, IA), University of California at San Francisco (San Francisco, CA), University of New Mexico (Albuquerque, NM), and Brigham and Women's Hospital (Boston, MA). The study was approved by the institutional review boards (IRBs) at each of the 6 participating institutions.
MCH Study Patients
Patients were eligible if they were admitted to the general medical services under the care of a hospitalist or nonhospitalist physician. Regardless of the admitting provider, each medical service was composed of rotating senior and junior resident physicians in all 6 sites. Furthermore, patients were 18 years of age or older, and were able to give consent themselves or had an appropriate proxy. Patients with mini‐mental status score of 17 (out of 22), admitted under their primary care physician or to an inpatient gastroenterology service, or transferred from another hospital, were excluded. The MCH study was designed to study the outcomes and efficiency in patients admitted for CHF, pneumonia, UGIH, and end‐of‐life care.
Acute UGIH Patients
Within the MCH‐eligible patients, we identified those with acute UGIH using the following International Classification of Diseases, 9th edition (ICD‐9) codes assigned at discharge: esophageal varices with hemorrhage (456.0, 456.20); Mallory‐Weiss syndrome (530.7); gastric ulcer with hemorrhage (531.00531.61); duodenal ulcer with hemorrhage (532.00532.61); peptic ulcer, site unspecified, with hemorrhage (533.00533.61); gastrojejunal ulcer with hemorrhage (534.00534.61); gastritis with hemorrhage (535.61); angiodysplasia of stomach/duodenum with hemorrhage (537.83); and hematemesis (578.0, 578.9). We also confirmed the diagnosis of UGIH by reviewing patient medical records for observed hematemesis, nasogastric tube aspirate with gross or hemoccult blood, or clinical history of hematemesis, melena, or hematochezia.14, 15
Data
All data were obtained from the 6 hospitals' administrative records, patient interviews, and medical chart abstractions. Dates of admission and discharge, ICD‐9 diagnosis codes, insurance type, age, race, and gender were obtained from administrative data. One‐month follow‐up telephone interviews assessed whether or not patient had any follow‐up appointment or hospital readmissions. Trained abstractors from each site performed manual chart reviews using a standard data collection sheet. The ICD‐9 code designation and chart abstraction methodology were developed prior to the initiation of the study to ensure consistent data collection and reduce bias.
The following data elements were collected: comorbidities, endoscopic findings, inpatient mortality, clinical evidence of rebleeding, endoscopic treatment or gastrointestinal (GI) surgery to control bleeding, repeat EGD, ICU transfer, decompensated comorbid illness requiring continued hospitalization, and blood transfusion (packed red cells, plasma, platelets). Clinical evidence of rebleeding was defined as either hematemesis or melena with decrease in hemoglobin of 2 g in 24 hours with or without hemodynamic compromise.14, 15 For the purpose of this study, recurrent bleeding was defined as clinical evidence of rebleeding, emergency GI surgery for control of UGIH, or repeat EGD before discharge. Furthermore, a composite endpoint termed total complications encompassed all adverse outcomes related to the UGIH hospitalization. The 30‐day readmission variable was defined using readmission identified in administrative records and a 30‐day follow‐up phone call. To guard against recall bias, self‐report data was only included for nonsite admissions.
We defined efficiency in terms of costs and LOS. Total hospital costs were measured using the TSI cost accounting system (Transition Systems, Inc., Boston, MA; now Eclipsys Corporation)16, 17 at 5 out of the 6 participating sites. TSI is a hospital cost accounting software system that integrates resource utilization and financial data already recorded in other hospital databases (such as the billing system, payroll system, and general ledger system).17 Hospital LOS was defined as the number of days from patient admission to the general medicine service until patient discharge.
Provider Specialization: Hospitalists vs. Nonhospitalists
The study was designed as a natural experiment based on a call cycle. The hospitalist‐led teams at each institution alternated in a 4‐day or 5‐day general medicine call cycle with teams led by traditional academic internal medicine attending physicians. All patients were assigned to teams according to their position in the call cycle without regard to whether the attending physician was a hospitalist or a nonhospitalist. Hospitalists are physicians whose primary professional focus is the general medical care of hospitalized patients.18, 19 As previously reported in a related MCH work,11 a hospitalist was also defined as a provider who spends at least 25% of his or her time on an academic inpatient general medicine service. Nonhospitalist physicians were most often outpatient general internal medicine faculty or subspecialists, who attended 1 month per year. Physicians were classified as hospitalists or nonhospitalists according to the designations provided by each site.
UGIH‐specific Confounders
From chart abstraction, we captured severity of illness, comorbidity, and performance of early EGD, variables that can confound analysis in UGIH. To capture severity of illness, a complete Rockall risk score was calculated for each patient. The complete Rockall uses 3 clinical variables (age, shock, and comorbidity) and 2 endoscopic variables (endoscopic diagnosis and stigmata of recent hemorrhage).5, 20 A complete Rockall score of 2 is considered low‐risk for rebleeding or death following admission.21, 22 The accepted definition of low‐risk is <5% recurrent bleeding and <1% mortality risk. A complete Rockall score of 3 to 5 is considered moderate‐risk while 6 is considered high‐risk. Comorbidity was measured using the Charlson comorbidity index.23 Performance of early endoscopy, usually defined as endoscopy performed within 24 hours from presentation, was previously shown to decrease LOS and need for surgical intervention in patients with acute UGIH.24, 25 Documented times of presentation to the emergency department and time of endoscopy performance were collected to calculate for the rate of early endoscopy in our study population.
Statistical Analysis
All statistical analyses were performed using SAS Version 9.1 for Windows (SAS Institute, Cary, NC).
Differences in baseline demographic characteristics of patients and their endoscopic findings were compared between the 2 types of providers. Univariate analyses were also performed to compare the differences in adverse outcomes, LOS, and costs between patients cared for by hospitalists and nonhospitalists. Chi‐square tests were used for categorical variables; while both Wilcoxon rank sum test and Student's t test were used in the analysis of continuous variables.
Next, we performed multivariable analyses to determine the independent association between hospitalist care and the odds of the patients having certain outcomes. However, to prevent overfitting, we only developed regression models for adverse outcomes that have at least 20% event rate.
Multivariable regression models were developed separately for LOS and costs. In contrast with the models on outcomes, analyses of LOS and costs were restricted to: (1) patients who were discharged alive; and (2) to cases with LOS and costs values within 3 standard deviations (SDs) of the mean because of the skewed nature of these data.
All models were adjusted for age, gender, race, insurance type, complete Rockall risk score, performance of early EGD, Charlson comorbidity index, and study site. Final candidate variables in the models were chosen based on stepwise selection, a method very similar to forward selection except that variables selected for the model do not necessarily remain in the model. Effects were entered into and then removed from the model in such a way that each forward selection step can be followed by 1 or more backward elimination steps. The stepwise selection was terminated if no further effect can be added to the model or if the current model was identical to the previous model. The stepwise selection model was generated using statistical criterion of alpha = 0.05 for entry and elimination from the model. Variables that can be a profound source of variation, such as study site and treating physician, were included in the model irrespective of their statistical significance.
To account for clustering of patients treated by the same physician, we used multilevel modeling with SAS PROC GLIMMIX (with random effects). For outcomes (categorical variables), we utilized models with logit‐link and binomial‐distributed errors. As for efficiency (continuous variables with skewed distribution), the multivariable analyses used a generalized linear model with log‐link and assuming gamma‐distributed errors.
Results
Patient Characteristics and Endoscopic Diagnoses
Out of 31,000 patients, the study identified a total of 566 patients (1.8%) with acute UGIH (Table 1). However, 116 patients transferred from another hospital were excluded as their initial management was provided elsewhere, giving a final study sample of 450 patients. Overall, there are 163 admitting physicians from 6 sites, with 39 (24%) classified as hospitalists and 124 (76%) as nonhospitalists. Forty‐two percent (177/450) of patients were cared for by hospitalists. Compared to nonhospitalists, patients admitted to the hospitalist service were older (62.8 vs. 57.7 years, P < 0.01) and with third‐party payor mix differences (P < 0.01). However, there were no statistical differences between patients attended by hospitalists and nonhospitalists with regard to Complete Rockall risk score, Charlson comorbidity index, performance of early endoscopy, and mean hemoglobin values on admission. Upper endoscopy was performed in all patients with distribution of the 3 most common diagnoses being similar (P > 0.05) between hospitalists and nonhospitalists: erosive disease (49.7% vs. 54.6%), peptic ulcer disease (PUD) (48% vs. 46.9%), and varices (18.6% vs. 14.7%).
| Variable | Admitting Service | P | |
|---|---|---|---|
| Hospitalist (n = 177) | Nonhospitalist (n = 273) | ||
| |||
| Age, years (meanSD) | 62.817.4 | 57.718.5 | <0.01 |
| Male sex, n (%) | 104 (58.8) | 169 (61.9) | 0.50 |
| Ethnicity, n (%) | 0.13 | ||
| White | 83 (46.9) | 102 (37.4) | |
| African‐American | 34 (19.2) | 75 (27.5) | |
| Hispanic | 21 (11.9) | 40 (14.7) | |
| Asian/Pacific Islander | 24 (13.6) | 29 (10.6) | |
| Others/unknown | 15 (8.5) | 27 (9.9) | |
| Insurance, n (%) | <0.01 | ||
| Medicare | 86 (48.6) | 104 (38.1) | |
| Medicaid | 15 (8.5) | 33 (12.1) | |
| No payer | 18 (10.2) | 36 (13.2) | |
| Private | 46 (26) | 52 (19.1) | |
| Unknown | 12 (6.8) | 48 (17.5) | |
| Charlson Comorbidity Index (meanSD) | 1.91.6 | 1.81.7 | 0.51 |
| Complete Rockall, n (%) | 0.11 | ||
| Low‐risk (0‐2) | 82 (46.3) | 103 (37.7) | |
| Moderate‐risk (3‐5) | 71 (40.1) | 137 (50.2) | |
| High‐risk (6) | 24 (14.6) | 33 (12.1) | |
| Early endoscopy (<24 hours) | 82 (46.3) | 133 (48.7) | 0.62 |
| Endoscopic diagnosis, n (%)* | |||
| Erosive disease | 88 (49.7) | 149 (54.6) | 0.31 |
| Peptic ulcer disease | 85 (48.0) | 128 (46.9) | 0.81 |
| Varices | 33 (18.6) | 40 (14.7) | 0.26 |
| Mallory‐Weiss tear | 9 (5.1) | 21 (7.7) | 0.28 |
| Angiodysplasia | 9 (5.1) | 13 (4.8) | 0.88 |
| GI mass | 1 (0.6) | 4 (1.5) | 0.65 |
| Normal | 7 (4.0) | 8 (2.9) | 0.55 |
| Admission hemoglobin values (meanSD) | 10.22.9 | 10.22.9 | 0.78 |
Clinical Outcomes
Between hospitalists and nonhospitalists, unadjusted outcomes were similar (P > 0.05) for mortality (2.3% vs. 0.4%), recurrent bleeding (11% vs. 11%), need for endoscopic therapy (24% vs. 22%), ICU‐transfer and decompensation (15% vs. 15%), as well as an overall composite measure of any complication (79% vs. 72%) (Table 2). However, the hospitalist‐led teams performed more blood transfusions (74% vs. 63%, P = 0.02) and readmission rates were higher (7.3% vs. 3.3%, P = 0.05).
| Outcomes, n (%) | Admitting Service | P | |
|---|---|---|---|
| Hospitalist (n = 177) | Nonhospitalist (n = 273) | ||
| |||
| Inpatient mortality | 4 (2.3) | 1 (0.4) | 0.08 |
| Recurrent bleeding* | 20 (11.3) | 29 (10.6) | 0.88 |
| Endoscopic therapy | 43 (24.3) | 60 (22.0) | 0.57 |
| ICU transfers | 23 (13) | 24 (8.8) | 0.20 |
| Decompensated comorbidities that required continued hospitalization | 26 (14.7) | 41 (15.0) | 0.92 |
| Any transfusion | 131 (74.0) | 172 (63.0) | 0.02 |
| Total complications | 139 (78.5) | 196 (71.8) | 0.11 |
| 30‐day all‐cause readmissions | 13 (7.3) | 9 (3.3) | 0.05 |
| Efficiency | Hospitalist (n = 164) | Nonhospitalist (n = 259) | P |
| LOS, days | |||
| MeanSD | 4.83.5 | 4.53.0 | 0.30 |
| Median (interquartile range) | 4 (36) | 4 (26) | 0.69 |
| Total costs, U.S. $ | |||
| MeanSD | 10,466.669191.00 | 7926.716065.00 | <0.01 |
| Median (interquartile range) | 7359.00 (4,698.0012,550.00) | 6181.00 (3744.0010,344.00) | <0.01 |
Because of the low event rate of certain adverse outcomes (<20%), we were only able to perform adjusted analyses on 4 outcomes: need for endoscopic therapy (odds ratio [OR], 0.82; 95% confidence interval [CI], 0.491.37), ICU transfer and decompensation (OR, 0.82; 95% CI, 0.451.52), blood transfusion (OR, 1.30; 95% CI, 0.822.04), and any complication (OR, 1.18; 95% CI, 0.711.96). Since outcome differences disappeared after controlling for confounders, the data suggest that overall care provided by hospitalists and nonhospitalists might be equivalenteven in certain outcomes that we were unable to substantiate using multivariable methods.
Efficiency
Efficiency, as measured by LOS and costs, are presented both as means and medians in univariate analyses in Table 2. Median LOS was similar for hospitalist‐led and nonhospitalist‐led teams (4 days). Despite having similar LOS, the median costs of acute UGIH in patients cared for by hospitalists were higher ($7,359.00 vs. $6,181.00; P < 0.01).
After adjusting for demographic factors, Rockall risk score, comorbidity, early EGD, and hospital site, LOS remained similar between the 2 groups. On the other hand, the adjusted cost for UGIH patients cared for by hospitalists and nonhospitalists persisted, with hospitalist care costs $1,502.40 more than their nonhospitalist counterparts (Table 3).
| Efficiency | Treatment Provider | P | |
|---|---|---|---|
| Hospitalist (n = 164) | Nonhospitalist (n = 259) | ||
| |||
| Adjusted length of stay, days (mean SD) | 5.2 (4.95.6) | 4.7 (4.55.0) | 0.15 |
| Adjusted total cost, U.S. $ (mean SD) | 9006.50 (8366.609693.60) | 7504.10 (7069.907964.20) | 0.03 |
Discussion
This is the first study that has looked at the effect of hospitalists on clinical outcomes and efficiency in patients admitted for acute UGIH, a condition highly dependent upon another specialty for procedures and management. This is also one of only a few studies on UGIH that adjusted for severity of illness (Rockall score), comorbidity, performance of early endoscopypatient‐level confounders usually unaccounted for in prior research.
We show that hospitalists and nonhospitalists caring for acute UGIH patients had overall similar unadjusted outcomes; except for blood transfusion and 30‐day readmission rates. Unfortunately, due to the small number of events for readmissions, we were unable to perform adjusted analysis for readmission. Differences between hospitalists and nonhospitalists on blood transfusion rates were not substantiated on multivariable adjustments.
As for efficiency, univariable and multivariable analyses revealed that LOS was similar between provider types while costs were greater in UGIH patients attended by hospitalists.
Reductions in resource use, particularly costs, may be achieved by increasing throughput (eg, reducing LOS) or by decreasing service intensity (eg, using fewer ancillary services and specialty consultations).26 Specifically in acute UGIH, LOS is significantly affected by performance of early EGD.27, 28 In these studies, gastroenterologist‐led teams, compared to internists and surgeons, have easier access to endoscopy, thus reducing LOS and overall costs.27, 28
Similarly, prior studies have shown that the mechanism by which hospitalists lower costs is by decreasing LOS.810, 29 There are several hypotheses on how hospitalists affect LOS. Hospitalists, by being available all day, are thought to respond quickly to acute symptoms or new test results, are more efficient in navigating the complex hospital environment, or develop greater expertise as a result of added inpatient experience.8 On the downside, although the hospitalist model reduces overall LOS and costs, they also provide higher intensity of care as reflected by greater costs when broken down per hospital day.29 Thus, the cost differential we found may represent higher intensity of care by hospitalists in their management of acute UGIH, as higher intensity care without decreasing LOS can translate to higher costs.
In addition, patients with acute UGIH are unique in several respects. In contrast to diseases like heart failure, COPD, and pneumonia, in which the admitting provider has the option to request a subspecialist consultation, all patients with acute UGIH need a gastroenterologist to perform endoscopy as part of the management. These patients are usually admitted to general medicine wards, aggressively resuscitated with intravenous fluids, with a nonurgent gastroenterology consult or EGD performed on the next available schedule.
Aside from LOS being greatly affected by performance of early EGD and/or delay in consulting gastroenterology, sicker patients require longer hospitalization and drive LOS and healthcare costs up. It was therefore crucial that we accounted for severity of illness, comorbidity, and performance of early EGD in our regression models for LOS and costs. This approach allows us to acquire a more accurate estimate on the effects of hospitalist on LOS and costs in patients admitted with acute UGIH.
Our findings suggest that the academic hospitalist model of care may not have as great of an impact on hospital efficiency in certain patient groups that require nonurgent subspecialty consultations. Future studies should focus on elucidating these relationships.
Limitations
This study has several limitations. First, clinical data were abstracted at 6 sites by different abstractors so it is possible there were variations in how data were collected. To reduce variation, a standardized abstraction form with instructions was developed and the primary investigator (PI) was available for specific questions during the abstraction process. Second, only 5 out of the 6 sites used TSI accounting systems. Although similar, interhospital costs captured by TSI may vary among sites in terms of classifying direct and indirect costs, potentially resulting in misclassification bias in our cost estimates.17 We addressed these issues by including the hospital site variable in our regression models, regardless of its significance. Third, consent rates across sites vary from 70% to 85%. It is possible that patients who refused enrollment in the MCH trial are systematically different and may introduce bias in our analysis.
Furthermore, the study was designed as a natural experiment based on a rotational call cycle between hospitalist‐led and nonhospitalist‐led teams. It is possible that the order of patient assignment might not be completely naturally random as we intended. However, the study period was for 2 years and we expect the effect of order would have averaged out in time.
There are many hospitalist models of care. In terms of generalizability, the study pertains only to academic hospitalists and may not be applicable to hospitalists practicing in community hospitals. For example, the nonhospitalist comparison group is likely different in the community and academic settings. Community nonhospitalists (traditional practitioners) are usually internists covering both inpatient and outpatient responsibilities at the same time. In contrast, academic nonhospitalists are internists or subspecialists serving as ward attendings for a limited period (usually 1 month) with considerable variation in their nonattending responsibilities (eg, research, clinic, administration). Furthermore, academic nonhospitalist providers might be a self‐selected group by their willingness to serve as a ward attending, making them more hospitalist‐like. Changes and variability of inpatient attendings may also affect our findings when compared to prior work. Finally, it is also possible that having residents at academic medical centers may attenuate the effect of hospitalists more than in community‐based models.
Conclusions/Implications
Compared to nonhospitalists, academic hospitalist care of acute UGIH patients had similar overall clinical outcomes. However, our finding of similar LOS yet higher costs for patients cared for by hospitalists support 1 proposed mechanism in which hospitalists decrease healthcare costs: providing higher intensity of care per day of hospitalization. However, in academic hospitalist models, this higher intensity hypothesis should be revisited, especially in certain patient groups in which timing and involvement of subspecialists may influence discharge decisions, affecting LOS and overall costs.
Due to inherent limitations in this observational study, future studies should focus on verifying and elucidating these relationships further. Lastly, understanding which patient groups receive the greatest potential benefit from this model will help guide both organizational efforts and quality improvement strategies.
- ,.Bleeding peptic ulcer.N Engl J Med.1994;331(11):717–727.
- .Epidemiology of hospitalization for acute upper gastrointestinal hemorrhage: a population‐based study.Am J Gastroenterol.1995;90(2):206–210.
- ,,, et al.Variation in outcome after acute upper gastrointestinal haemorrhage. the national audit of acute upper gastrointestinal haemorrhage.Lancet.1995;346(8971):346–350.
- ,,, et al.Influencing the practice and outcome in acute upper gastrointestinal haemorrhage. Steering committee of the National Audit of Acute Upper Gastrointestinal Haemorrhage.Gut.1997;41(5):606–611.
- ,,, et al.Risk assessment after acute upper gastrointestinal haemorrhage.Gut.1996;38(3):316–321.
- ,,, et al.The potential size of the hospitalist workforce in the united states.Am J Med.1999;106(4):441–445.
- Society of Hospital Medicine. About SHM. Available at: http://www.hospitalmedicine.org/AM/Template.cfm?Section=General_Information357(25):2589–2600.
- ,,, et al.Effects of physician experience on costs and outcomes on an academic general medicine service: results of a trial of hospitalists.Ann Intern Med.2002;137(11):866–874.
- .A systematic review of outcomes and quality measures in adult patients cared for by hospitalists vs nonhospitalists.Mayo Clin Proc.2009;84(3):248–254.
- ,,, et al.Do hospitalists or physicians with greater inpatient HIV experience improve HIV care in the era of highly active antiretroviral therapy? Results from a multicenter trial of academic hospitalists.Clin Infect Dis.2008;46(7):1085–1092.
- ,,, et al.Quality of care for decompensated heart failure: comparable performance between academic hospitalists and non‐hospitalists. J Gen Intern Med.2008;23(9):1399–1406.
- ,,, et al.Factors associated with discussion of care plans and code status at the time of hospital admission: results from the Multicenter Hospitalist Study.J Hosp Med.2008;3(6):437–445.
- ,,, et al.Upper gastrointestinal hemorrhage clinical guideline determining the optimal hospital length of stay.Am J Med.1996;100(3):313–322.
- ,,, et al.Prospective evaluation of a clinical guideline recommending hospital length of stay in upper gastrointestinal tract hemorrhage.JAMA.1997;278(24):2151–2156.
- ,,, et al.In‐hospital cost of abdominal aortic aneurysm repair in Canada and the United States.Arch Intern Med.2003;163(20):2500–2504.
- ,,, et al.The use of transition cost accounting system in health services research.Cost Eff Resour Alloc.2007;5:11.
- Society of Hospital Medicine. Definition of a Hospitalist. Available at: http://www.hospitalmedicine.org/AM/Template.cfm?Section=General_Information335(7):514–517.
- ,,, et al.Selection of patients for early discharge or outpatient care after acute upper gastrointestinal haemorrhage. National Audit of Acute Upper Gastrointestinal Haemorrhage.Lancet.1996;347(9009):1138–1140.
- ,,, et al.Utilization of health care resources for low‐risk patients with acute, nonvariceal upper GI hemorrhage: an historical cohort study.Gastrointest Endosc.2002;55(3):321–327.
- ,.Incremental value of upper endoscopy for triage of patients with acute non‐variceal upper‐GI hemorrhage.Gastrointest Endosc.2004;60(1):9–14.
- ,,, et al.The Charlson comorbidity index is adapted to predict costs of chronic disease in primary care patients.J Clin Epidemiol.2008;61(12):1234–1240.
- ,,, et al.The effectiveness of early endoscopy for upper gastrointestinal hemorrhage: a community‐based analysis.Med Care.1998;36(4):462–474.
- ,,, et al.Early endoscopy in upper gastrointestinal hemorrhage: associations with recurrent bleeding, surgery, and length of hospital stay.Gastrointest Endosc.1999;49(2):145–152.
- ,.The impact of hospitalists on the cost and quality of inpatient care in the united states: a research synthesis.Med Care Res Rev.2005;62(4):379–406.
- ,,, et al.Physician specialty and variations in the cost of treating patients with acute upper gastrointestinal bleeding.Gastroenterology.1997;113(5):1443–1448.
- ,,, et al.Impact of physician specialty on the cost of nonvariceal upper GI bleeding care.Am J Gastroenterol.2002;97(6):1535–1542.
- ,,.Associations with reduced length of stay and costs on an academic hospitalist service.Am J Manag Care.2004;10(8):561–568.
Acute upper gastrointestinal hemorrhage (UGIH) is one of the most common hospital admissions for acute care. Estimates indicate that 300,000 patients (100‐150 cases per 100,000 adults) are admitted annually with an associated economic impact of $2.5 billion.15 The current standard management of UGIH requires hospital admission and esophagogastroduodenoscopy (EGD) by a gastroenterologist for diagnosis and/or treatment. This management strategy results in a high consumption of hospital resources and costs.
Simultaneously, hospitalists have dramatically changed the delivery of inpatient care in the United States and are recognized as a location‐driven subspecialty for the care of acute hospitalized patients, similar to emergency medicine. Currently there are 20,000 hospitalists, and more than one‐third of general medicine inpatients are cared for by hospitalists.6, 7
Previous studies have shown that hospitalist care offers better or comparable outcomes, with lower overall length of stay (LOS) and costs compared to traditional providers.810 However, most of these studies were performed in single institutions, had weak designs or little‐to‐no adjustment for severity of illness, or were limited to 7 specific diseases (pneumonia, congestive heart failure [CHF], chest pain, ischemic stroke, urinary tract infection, chronic obstructive lung disease [COPD], and acute myocardial infarction [AMI]).8
Furthermore, less is known about the effect of hospitalists on conditions that may be dependent upon specialist consultation for procedures and/or treatment plans. In this study, gastroenterologists performed diagnostic and/or therapeutic endoscopy work as consultants to the attending physicians in the management of acute inpatient UGIH.
To explore the effects of hospitalists on care of patients with acute UGIH, we examined data from the Multicenter Hospitalist (MCH) trial. The objectives of our study were to compare clinical outcomesin‐hospital mortality and complications (ie, recurrent bleeding, intensive care unit [ICU] transfer, decompensation, transfusion, reendoscopy, 30‐day readmission)and efficiency (LOS and costs) in hospitalized acute UGIH patients cared for by hospitalists and nonhospitalists in 6 academic centers in the United States during a 2‐year period.
Patients and Methods
Study Sites
From July 1, 2001 to June 30, 2003, the MCH trial1113 was a prospective, multicenter, observational trial of the care provided by hospitalists to patients admitted to general medical services at 6 academic medical institutions. There were 31,000 consecutive admissions to the general medical services of these participating sites: University of Chicago (Chicago, IL), University of Wisconsin Hospital (Madison, WI), University of Iowa (Iowa City, IA), University of California at San Francisco (San Francisco, CA), University of New Mexico (Albuquerque, NM), and Brigham and Women's Hospital (Boston, MA). The study was approved by the institutional review boards (IRBs) at each of the 6 participating institutions.
MCH Study Patients
Patients were eligible if they were admitted to the general medical services under the care of a hospitalist or nonhospitalist physician. Regardless of the admitting provider, each medical service was composed of rotating senior and junior resident physicians in all 6 sites. Furthermore, patients were 18 years of age or older, and were able to give consent themselves or had an appropriate proxy. Patients with mini‐mental status score of 17 (out of 22), admitted under their primary care physician or to an inpatient gastroenterology service, or transferred from another hospital, were excluded. The MCH study was designed to study the outcomes and efficiency in patients admitted for CHF, pneumonia, UGIH, and end‐of‐life care.
Acute UGIH Patients
Within the MCH‐eligible patients, we identified those with acute UGIH using the following International Classification of Diseases, 9th edition (ICD‐9) codes assigned at discharge: esophageal varices with hemorrhage (456.0, 456.20); Mallory‐Weiss syndrome (530.7); gastric ulcer with hemorrhage (531.00531.61); duodenal ulcer with hemorrhage (532.00532.61); peptic ulcer, site unspecified, with hemorrhage (533.00533.61); gastrojejunal ulcer with hemorrhage (534.00534.61); gastritis with hemorrhage (535.61); angiodysplasia of stomach/duodenum with hemorrhage (537.83); and hematemesis (578.0, 578.9). We also confirmed the diagnosis of UGIH by reviewing patient medical records for observed hematemesis, nasogastric tube aspirate with gross or hemoccult blood, or clinical history of hematemesis, melena, or hematochezia.14, 15
Data
All data were obtained from the 6 hospitals' administrative records, patient interviews, and medical chart abstractions. Dates of admission and discharge, ICD‐9 diagnosis codes, insurance type, age, race, and gender were obtained from administrative data. One‐month follow‐up telephone interviews assessed whether or not patient had any follow‐up appointment or hospital readmissions. Trained abstractors from each site performed manual chart reviews using a standard data collection sheet. The ICD‐9 code designation and chart abstraction methodology were developed prior to the initiation of the study to ensure consistent data collection and reduce bias.
The following data elements were collected: comorbidities, endoscopic findings, inpatient mortality, clinical evidence of rebleeding, endoscopic treatment or gastrointestinal (GI) surgery to control bleeding, repeat EGD, ICU transfer, decompensated comorbid illness requiring continued hospitalization, and blood transfusion (packed red cells, plasma, platelets). Clinical evidence of rebleeding was defined as either hematemesis or melena with decrease in hemoglobin of 2 g in 24 hours with or without hemodynamic compromise.14, 15 For the purpose of this study, recurrent bleeding was defined as clinical evidence of rebleeding, emergency GI surgery for control of UGIH, or repeat EGD before discharge. Furthermore, a composite endpoint termed total complications encompassed all adverse outcomes related to the UGIH hospitalization. The 30‐day readmission variable was defined using readmission identified in administrative records and a 30‐day follow‐up phone call. To guard against recall bias, self‐report data was only included for nonsite admissions.
We defined efficiency in terms of costs and LOS. Total hospital costs were measured using the TSI cost accounting system (Transition Systems, Inc., Boston, MA; now Eclipsys Corporation)16, 17 at 5 out of the 6 participating sites. TSI is a hospital cost accounting software system that integrates resource utilization and financial data already recorded in other hospital databases (such as the billing system, payroll system, and general ledger system).17 Hospital LOS was defined as the number of days from patient admission to the general medicine service until patient discharge.
Provider Specialization: Hospitalists vs. Nonhospitalists
The study was designed as a natural experiment based on a call cycle. The hospitalist‐led teams at each institution alternated in a 4‐day or 5‐day general medicine call cycle with teams led by traditional academic internal medicine attending physicians. All patients were assigned to teams according to their position in the call cycle without regard to whether the attending physician was a hospitalist or a nonhospitalist. Hospitalists are physicians whose primary professional focus is the general medical care of hospitalized patients.18, 19 As previously reported in a related MCH work,11 a hospitalist was also defined as a provider who spends at least 25% of his or her time on an academic inpatient general medicine service. Nonhospitalist physicians were most often outpatient general internal medicine faculty or subspecialists, who attended 1 month per year. Physicians were classified as hospitalists or nonhospitalists according to the designations provided by each site.
UGIH‐specific Confounders
From chart abstraction, we captured severity of illness, comorbidity, and performance of early EGD, variables that can confound analysis in UGIH. To capture severity of illness, a complete Rockall risk score was calculated for each patient. The complete Rockall uses 3 clinical variables (age, shock, and comorbidity) and 2 endoscopic variables (endoscopic diagnosis and stigmata of recent hemorrhage).5, 20 A complete Rockall score of 2 is considered low‐risk for rebleeding or death following admission.21, 22 The accepted definition of low‐risk is <5% recurrent bleeding and <1% mortality risk. A complete Rockall score of 3 to 5 is considered moderate‐risk while 6 is considered high‐risk. Comorbidity was measured using the Charlson comorbidity index.23 Performance of early endoscopy, usually defined as endoscopy performed within 24 hours from presentation, was previously shown to decrease LOS and need for surgical intervention in patients with acute UGIH.24, 25 Documented times of presentation to the emergency department and time of endoscopy performance were collected to calculate for the rate of early endoscopy in our study population.
Statistical Analysis
All statistical analyses were performed using SAS Version 9.1 for Windows (SAS Institute, Cary, NC).
Differences in baseline demographic characteristics of patients and their endoscopic findings were compared between the 2 types of providers. Univariate analyses were also performed to compare the differences in adverse outcomes, LOS, and costs between patients cared for by hospitalists and nonhospitalists. Chi‐square tests were used for categorical variables; while both Wilcoxon rank sum test and Student's t test were used in the analysis of continuous variables.
Next, we performed multivariable analyses to determine the independent association between hospitalist care and the odds of the patients having certain outcomes. However, to prevent overfitting, we only developed regression models for adverse outcomes that have at least 20% event rate.
Multivariable regression models were developed separately for LOS and costs. In contrast with the models on outcomes, analyses of LOS and costs were restricted to: (1) patients who were discharged alive; and (2) to cases with LOS and costs values within 3 standard deviations (SDs) of the mean because of the skewed nature of these data.
All models were adjusted for age, gender, race, insurance type, complete Rockall risk score, performance of early EGD, Charlson comorbidity index, and study site. Final candidate variables in the models were chosen based on stepwise selection, a method very similar to forward selection except that variables selected for the model do not necessarily remain in the model. Effects were entered into and then removed from the model in such a way that each forward selection step can be followed by 1 or more backward elimination steps. The stepwise selection was terminated if no further effect can be added to the model or if the current model was identical to the previous model. The stepwise selection model was generated using statistical criterion of alpha = 0.05 for entry and elimination from the model. Variables that can be a profound source of variation, such as study site and treating physician, were included in the model irrespective of their statistical significance.
To account for clustering of patients treated by the same physician, we used multilevel modeling with SAS PROC GLIMMIX (with random effects). For outcomes (categorical variables), we utilized models with logit‐link and binomial‐distributed errors. As for efficiency (continuous variables with skewed distribution), the multivariable analyses used a generalized linear model with log‐link and assuming gamma‐distributed errors.
Results
Patient Characteristics and Endoscopic Diagnoses
Out of 31,000 patients, the study identified a total of 566 patients (1.8%) with acute UGIH (Table 1). However, 116 patients transferred from another hospital were excluded as their initial management was provided elsewhere, giving a final study sample of 450 patients. Overall, there are 163 admitting physicians from 6 sites, with 39 (24%) classified as hospitalists and 124 (76%) as nonhospitalists. Forty‐two percent (177/450) of patients were cared for by hospitalists. Compared to nonhospitalists, patients admitted to the hospitalist service were older (62.8 vs. 57.7 years, P < 0.01) and with third‐party payor mix differences (P < 0.01). However, there were no statistical differences between patients attended by hospitalists and nonhospitalists with regard to Complete Rockall risk score, Charlson comorbidity index, performance of early endoscopy, and mean hemoglobin values on admission. Upper endoscopy was performed in all patients with distribution of the 3 most common diagnoses being similar (P > 0.05) between hospitalists and nonhospitalists: erosive disease (49.7% vs. 54.6%), peptic ulcer disease (PUD) (48% vs. 46.9%), and varices (18.6% vs. 14.7%).
| Variable | Admitting Service | P | |
|---|---|---|---|
| Hospitalist (n = 177) | Nonhospitalist (n = 273) | ||
| |||
| Age, years (meanSD) | 62.817.4 | 57.718.5 | <0.01 |
| Male sex, n (%) | 104 (58.8) | 169 (61.9) | 0.50 |
| Ethnicity, n (%) | 0.13 | ||
| White | 83 (46.9) | 102 (37.4) | |
| African‐American | 34 (19.2) | 75 (27.5) | |
| Hispanic | 21 (11.9) | 40 (14.7) | |
| Asian/Pacific Islander | 24 (13.6) | 29 (10.6) | |
| Others/unknown | 15 (8.5) | 27 (9.9) | |
| Insurance, n (%) | <0.01 | ||
| Medicare | 86 (48.6) | 104 (38.1) | |
| Medicaid | 15 (8.5) | 33 (12.1) | |
| No payer | 18 (10.2) | 36 (13.2) | |
| Private | 46 (26) | 52 (19.1) | |
| Unknown | 12 (6.8) | 48 (17.5) | |
| Charlson Comorbidity Index (meanSD) | 1.91.6 | 1.81.7 | 0.51 |
| Complete Rockall, n (%) | 0.11 | ||
| Low‐risk (0‐2) | 82 (46.3) | 103 (37.7) | |
| Moderate‐risk (3‐5) | 71 (40.1) | 137 (50.2) | |
| High‐risk (6) | 24 (14.6) | 33 (12.1) | |
| Early endoscopy (<24 hours) | 82 (46.3) | 133 (48.7) | 0.62 |
| Endoscopic diagnosis, n (%)* | |||
| Erosive disease | 88 (49.7) | 149 (54.6) | 0.31 |
| Peptic ulcer disease | 85 (48.0) | 128 (46.9) | 0.81 |
| Varices | 33 (18.6) | 40 (14.7) | 0.26 |
| Mallory‐Weiss tear | 9 (5.1) | 21 (7.7) | 0.28 |
| Angiodysplasia | 9 (5.1) | 13 (4.8) | 0.88 |
| GI mass | 1 (0.6) | 4 (1.5) | 0.65 |
| Normal | 7 (4.0) | 8 (2.9) | 0.55 |
| Admission hemoglobin values (meanSD) | 10.22.9 | 10.22.9 | 0.78 |
Clinical Outcomes
Between hospitalists and nonhospitalists, unadjusted outcomes were similar (P > 0.05) for mortality (2.3% vs. 0.4%), recurrent bleeding (11% vs. 11%), need for endoscopic therapy (24% vs. 22%), ICU‐transfer and decompensation (15% vs. 15%), as well as an overall composite measure of any complication (79% vs. 72%) (Table 2). However, the hospitalist‐led teams performed more blood transfusions (74% vs. 63%, P = 0.02) and readmission rates were higher (7.3% vs. 3.3%, P = 0.05).
| Outcomes, n (%) | Admitting Service | P | |
|---|---|---|---|
| Hospitalist (n = 177) | Nonhospitalist (n = 273) | ||
| |||
| Inpatient mortality | 4 (2.3) | 1 (0.4) | 0.08 |
| Recurrent bleeding* | 20 (11.3) | 29 (10.6) | 0.88 |
| Endoscopic therapy | 43 (24.3) | 60 (22.0) | 0.57 |
| ICU transfers | 23 (13) | 24 (8.8) | 0.20 |
| Decompensated comorbidities that required continued hospitalization | 26 (14.7) | 41 (15.0) | 0.92 |
| Any transfusion | 131 (74.0) | 172 (63.0) | 0.02 |
| Total complications | 139 (78.5) | 196 (71.8) | 0.11 |
| 30‐day all‐cause readmissions | 13 (7.3) | 9 (3.3) | 0.05 |
| Efficiency | Hospitalist (n = 164) | Nonhospitalist (n = 259) | P |
| LOS, days | |||
| MeanSD | 4.83.5 | 4.53.0 | 0.30 |
| Median (interquartile range) | 4 (36) | 4 (26) | 0.69 |
| Total costs, U.S. $ | |||
| MeanSD | 10,466.669191.00 | 7926.716065.00 | <0.01 |
| Median (interquartile range) | 7359.00 (4,698.0012,550.00) | 6181.00 (3744.0010,344.00) | <0.01 |
Because of the low event rate of certain adverse outcomes (<20%), we were only able to perform adjusted analyses on 4 outcomes: need for endoscopic therapy (odds ratio [OR], 0.82; 95% confidence interval [CI], 0.491.37), ICU transfer and decompensation (OR, 0.82; 95% CI, 0.451.52), blood transfusion (OR, 1.30; 95% CI, 0.822.04), and any complication (OR, 1.18; 95% CI, 0.711.96). Since outcome differences disappeared after controlling for confounders, the data suggest that overall care provided by hospitalists and nonhospitalists might be equivalenteven in certain outcomes that we were unable to substantiate using multivariable methods.
Efficiency
Efficiency, as measured by LOS and costs, are presented both as means and medians in univariate analyses in Table 2. Median LOS was similar for hospitalist‐led and nonhospitalist‐led teams (4 days). Despite having similar LOS, the median costs of acute UGIH in patients cared for by hospitalists were higher ($7,359.00 vs. $6,181.00; P < 0.01).
After adjusting for demographic factors, Rockall risk score, comorbidity, early EGD, and hospital site, LOS remained similar between the 2 groups. On the other hand, the adjusted cost for UGIH patients cared for by hospitalists and nonhospitalists persisted, with hospitalist care costs $1,502.40 more than their nonhospitalist counterparts (Table 3).
| Efficiency | Treatment Provider | P | |
|---|---|---|---|
| Hospitalist (n = 164) | Nonhospitalist (n = 259) | ||
| |||
| Adjusted length of stay, days (mean SD) | 5.2 (4.95.6) | 4.7 (4.55.0) | 0.15 |
| Adjusted total cost, U.S. $ (mean SD) | 9006.50 (8366.609693.60) | 7504.10 (7069.907964.20) | 0.03 |
Discussion
This is the first study that has looked at the effect of hospitalists on clinical outcomes and efficiency in patients admitted for acute UGIH, a condition highly dependent upon another specialty for procedures and management. This is also one of only a few studies on UGIH that adjusted for severity of illness (Rockall score), comorbidity, performance of early endoscopypatient‐level confounders usually unaccounted for in prior research.
We show that hospitalists and nonhospitalists caring for acute UGIH patients had overall similar unadjusted outcomes; except for blood transfusion and 30‐day readmission rates. Unfortunately, due to the small number of events for readmissions, we were unable to perform adjusted analysis for readmission. Differences between hospitalists and nonhospitalists on blood transfusion rates were not substantiated on multivariable adjustments.
As for efficiency, univariable and multivariable analyses revealed that LOS was similar between provider types while costs were greater in UGIH patients attended by hospitalists.
Reductions in resource use, particularly costs, may be achieved by increasing throughput (eg, reducing LOS) or by decreasing service intensity (eg, using fewer ancillary services and specialty consultations).26 Specifically in acute UGIH, LOS is significantly affected by performance of early EGD.27, 28 In these studies, gastroenterologist‐led teams, compared to internists and surgeons, have easier access to endoscopy, thus reducing LOS and overall costs.27, 28
Similarly, prior studies have shown that the mechanism by which hospitalists lower costs is by decreasing LOS.810, 29 There are several hypotheses on how hospitalists affect LOS. Hospitalists, by being available all day, are thought to respond quickly to acute symptoms or new test results, are more efficient in navigating the complex hospital environment, or develop greater expertise as a result of added inpatient experience.8 On the downside, although the hospitalist model reduces overall LOS and costs, they also provide higher intensity of care as reflected by greater costs when broken down per hospital day.29 Thus, the cost differential we found may represent higher intensity of care by hospitalists in their management of acute UGIH, as higher intensity care without decreasing LOS can translate to higher costs.
In addition, patients with acute UGIH are unique in several respects. In contrast to diseases like heart failure, COPD, and pneumonia, in which the admitting provider has the option to request a subspecialist consultation, all patients with acute UGIH need a gastroenterologist to perform endoscopy as part of the management. These patients are usually admitted to general medicine wards, aggressively resuscitated with intravenous fluids, with a nonurgent gastroenterology consult or EGD performed on the next available schedule.
Aside from LOS being greatly affected by performance of early EGD and/or delay in consulting gastroenterology, sicker patients require longer hospitalization and drive LOS and healthcare costs up. It was therefore crucial that we accounted for severity of illness, comorbidity, and performance of early EGD in our regression models for LOS and costs. This approach allows us to acquire a more accurate estimate on the effects of hospitalist on LOS and costs in patients admitted with acute UGIH.
Our findings suggest that the academic hospitalist model of care may not have as great of an impact on hospital efficiency in certain patient groups that require nonurgent subspecialty consultations. Future studies should focus on elucidating these relationships.
Limitations
This study has several limitations. First, clinical data were abstracted at 6 sites by different abstractors so it is possible there were variations in how data were collected. To reduce variation, a standardized abstraction form with instructions was developed and the primary investigator (PI) was available for specific questions during the abstraction process. Second, only 5 out of the 6 sites used TSI accounting systems. Although similar, interhospital costs captured by TSI may vary among sites in terms of classifying direct and indirect costs, potentially resulting in misclassification bias in our cost estimates.17 We addressed these issues by including the hospital site variable in our regression models, regardless of its significance. Third, consent rates across sites vary from 70% to 85%. It is possible that patients who refused enrollment in the MCH trial are systematically different and may introduce bias in our analysis.
Furthermore, the study was designed as a natural experiment based on a rotational call cycle between hospitalist‐led and nonhospitalist‐led teams. It is possible that the order of patient assignment might not be completely naturally random as we intended. However, the study period was for 2 years and we expect the effect of order would have averaged out in time.
There are many hospitalist models of care. In terms of generalizability, the study pertains only to academic hospitalists and may not be applicable to hospitalists practicing in community hospitals. For example, the nonhospitalist comparison group is likely different in the community and academic settings. Community nonhospitalists (traditional practitioners) are usually internists covering both inpatient and outpatient responsibilities at the same time. In contrast, academic nonhospitalists are internists or subspecialists serving as ward attendings for a limited period (usually 1 month) with considerable variation in their nonattending responsibilities (eg, research, clinic, administration). Furthermore, academic nonhospitalist providers might be a self‐selected group by their willingness to serve as a ward attending, making them more hospitalist‐like. Changes and variability of inpatient attendings may also affect our findings when compared to prior work. Finally, it is also possible that having residents at academic medical centers may attenuate the effect of hospitalists more than in community‐based models.
Conclusions/Implications
Compared to nonhospitalists, academic hospitalist care of acute UGIH patients had similar overall clinical outcomes. However, our finding of similar LOS yet higher costs for patients cared for by hospitalists support 1 proposed mechanism in which hospitalists decrease healthcare costs: providing higher intensity of care per day of hospitalization. However, in academic hospitalist models, this higher intensity hypothesis should be revisited, especially in certain patient groups in which timing and involvement of subspecialists may influence discharge decisions, affecting LOS and overall costs.
Due to inherent limitations in this observational study, future studies should focus on verifying and elucidating these relationships further. Lastly, understanding which patient groups receive the greatest potential benefit from this model will help guide both organizational efforts and quality improvement strategies.
- ,.Bleeding peptic ulcer.N Engl J Med.1994;331(11):717–727.
- .Epidemiology of hospitalization for acute upper gastrointestinal hemorrhage: a population‐based study.Am J Gastroenterol.1995;90(2):206–210.
- ,,, et al.Variation in outcome after acute upper gastrointestinal haemorrhage. the national audit of acute upper gastrointestinal haemorrhage.Lancet.1995;346(8971):346–350.
- ,,, et al.Influencing the practice and outcome in acute upper gastrointestinal haemorrhage. Steering committee of the National Audit of Acute Upper Gastrointestinal Haemorrhage.Gut.1997;41(5):606–611.
- ,,, et al.Risk assessment after acute upper gastrointestinal haemorrhage.Gut.1996;38(3):316–321.
- ,,, et al.The potential size of the hospitalist workforce in the united states.Am J Med.1999;106(4):441–445.
- Society of Hospital Medicine. About SHM. Available at: http://www.hospitalmedicine.org/AM/Template.cfm?Section=General_Information357(25):2589–2600.
- ,,, et al.Effects of physician experience on costs and outcomes on an academic general medicine service: results of a trial of hospitalists.Ann Intern Med.2002;137(11):866–874.
- .A systematic review of outcomes and quality measures in adult patients cared for by hospitalists vs nonhospitalists.Mayo Clin Proc.2009;84(3):248–254.
- ,,, et al.Do hospitalists or physicians with greater inpatient HIV experience improve HIV care in the era of highly active antiretroviral therapy? Results from a multicenter trial of academic hospitalists.Clin Infect Dis.2008;46(7):1085–1092.
- ,,, et al.Quality of care for decompensated heart failure: comparable performance between academic hospitalists and non‐hospitalists. J Gen Intern Med.2008;23(9):1399–1406.
- ,,, et al.Factors associated with discussion of care plans and code status at the time of hospital admission: results from the Multicenter Hospitalist Study.J Hosp Med.2008;3(6):437–445.
- ,,, et al.Upper gastrointestinal hemorrhage clinical guideline determining the optimal hospital length of stay.Am J Med.1996;100(3):313–322.
- ,,, et al.Prospective evaluation of a clinical guideline recommending hospital length of stay in upper gastrointestinal tract hemorrhage.JAMA.1997;278(24):2151–2156.
- ,,, et al.In‐hospital cost of abdominal aortic aneurysm repair in Canada and the United States.Arch Intern Med.2003;163(20):2500–2504.
- ,,, et al.The use of transition cost accounting system in health services research.Cost Eff Resour Alloc.2007;5:11.
- Society of Hospital Medicine. Definition of a Hospitalist. Available at: http://www.hospitalmedicine.org/AM/Template.cfm?Section=General_Information335(7):514–517.
- ,,, et al.Selection of patients for early discharge or outpatient care after acute upper gastrointestinal haemorrhage. National Audit of Acute Upper Gastrointestinal Haemorrhage.Lancet.1996;347(9009):1138–1140.
- ,,, et al.Utilization of health care resources for low‐risk patients with acute, nonvariceal upper GI hemorrhage: an historical cohort study.Gastrointest Endosc.2002;55(3):321–327.
- ,.Incremental value of upper endoscopy for triage of patients with acute non‐variceal upper‐GI hemorrhage.Gastrointest Endosc.2004;60(1):9–14.
- ,,, et al.The Charlson comorbidity index is adapted to predict costs of chronic disease in primary care patients.J Clin Epidemiol.2008;61(12):1234–1240.
- ,,, et al.The effectiveness of early endoscopy for upper gastrointestinal hemorrhage: a community‐based analysis.Med Care.1998;36(4):462–474.
- ,,, et al.Early endoscopy in upper gastrointestinal hemorrhage: associations with recurrent bleeding, surgery, and length of hospital stay.Gastrointest Endosc.1999;49(2):145–152.
- ,.The impact of hospitalists on the cost and quality of inpatient care in the united states: a research synthesis.Med Care Res Rev.2005;62(4):379–406.
- ,,, et al.Physician specialty and variations in the cost of treating patients with acute upper gastrointestinal bleeding.Gastroenterology.1997;113(5):1443–1448.
- ,,, et al.Impact of physician specialty on the cost of nonvariceal upper GI bleeding care.Am J Gastroenterol.2002;97(6):1535–1542.
- ,,.Associations with reduced length of stay and costs on an academic hospitalist service.Am J Manag Care.2004;10(8):561–568.
Copyright © 2010 Society of Hospital Medicine
Factors of Care Plan Discussions at Admission
Despite an ideal of dying at home, most Americans die in hospitals.1 Patients and families are clear about what they need from the healthcare system at the end of life: relief of distressing symptoms, the opportunity to communicate with physicians and others about death and dying, and the assurance that they will be attended to and comforted by their physicians as they approach death.2, 3 However, discussions about patient preferences for care occur infrequently,47 even though patients want to discuss care with their doctor,68 and physicians believe these discussions are their responsibility.9
The most prominent work in this area occurred in the Study to Understand Prognoses and Preferences for Outcomes and Risks of Treatments (SUPPORT) study, which focused on patients with advanced disease, often in the intensive care unit.4 Furthermore, few studies have focused on general medical patients, and healthcare has changed in important ways since SUPPORT's publication. First, the Patient Self‐Determination Act (PSDA) requires that all patients be asked about their care wishes at the time of admission and document the presence of an advanced directive.10, 11 Second, there is growing awareness of the need to improve palliative care for all hospitalized patients, with many advocating that hospitalization itself is a reason to ask about patient's preferences for care regardless of a patient's level of chronic or acute illness.12 Finally, emergence of hospitalists,1316 movement toward closed intensive care units,17, 18 and changes in residency training have increased segmentation in care of hospitalized patients.15, 18
To overcome limitations of previous literature and update our knowledge of how care discussions take place in the current healthcare environment, we analyzed data from a large study of patients admitted to general medicine services at 6 academic centers. Using this robust dataset, which included prospectively collected information about preferences for communication with their physician, we performed statistical analyses to understand which patient clinical, sociodemographic, and preference‐related factors, as well as factors related to their site of care, were associated with documentation that a code status discussion took place at the time of hospital admission.
PATIENTS AND METHODS
Sites
The Multicenter Hospitalist Study (MCHS) was a multicenter trial of general medical services that enrolled patients at 6 geographically diverse centers: The University of Chicago (which also served as the coordinating center), University of Iowa Hospitals and Clinics, University of California San Francisco, University of Wisconsin, University of New Mexico, and Brigham and Women's Hospital.19
Each site was selected to participate in the MCHS because patients on their general medicine service were admitted to hospitalist and nonhospitalist physicians in a random fashion (eg, based on predetermined call schedule based on day of the week). As teaching hospitals, house officers provided direct care to patients hospitalized at each center; nonteaching services were not present at the sites during the period of this study.
During the period of this study, each site complied with PSDA requirements for noting that patients had been informed about their right to create an advance directive, but no sites had a guideline or other program in place specifically intended to facilitate physician‐patient communication about care wishes. Two sites had active Hospice or Palliative Care services, and another 2 had Geriatrics Consultation services, but none had standard protocols mandating involvement of these consultants at the time of admission, the time when our key outcomes were documented.
Patients
Patients were eligible for inclusion in the MCHS if they were older than 18 years of age and were admitted at random to a hospitalist or nonhospitalist physician; we excluded patients from MCHS if they were admitted specifically under the care of their primary care physician or subspecialist (eg, admitted for chemotherapy) or were a prison inmate. Patients meeting these eligibility criteria were then approached for purposes of informed consent.
Data Collection
Data for this study were obtained from administrative data, patient interview, and chart abstraction as in previous work.14 Administrative data were drawn from cost‐accounting databases at each participating hospital; administrative data were used to provide cost and length of stay data, as well as information about patient insurance type, age, and sex.
We interviewed patients immediately after informed consent was obtained, with both taking place generally within 24 hours of admission. Interviews collected data about patient preferences for care and functional status,20 and other data not reliably available from administrative sources (such as housing situation).
Patient care plan before admission was taken from notes and orders written in the first 24 hours of hospitalization, as mentioned above. Using criteria we employed in previous work,21 a care discussion (CD) was defined as documentation of a discussion between patients (or family) and at least 1 physician (primary physician, hospitalist, consulting physician, or house officer) during the first 24 hours of hospitalization. CDs needed to specify that the person who wrote the note had actually spoken with the patient or their family for the purposes of determining preferences for care, and that this discussion resulted in a specific care plan. Thus, notations such as do not resuscitate/do not intubate, or spoke with family, questions answered, did not qualify as CDs, but a note stating the patient continues to want full efforts was counted as a CD.
Principal investigators at each site were responsible for training and overseeing interviewing and chart abstraction activities at each site, with central oversight of data quality provided by the central coordinating center. Upon receipt at the data coordinating center, all data were examined for missing, nonsensical, or outlier data with errors referred back to the participating sites for correction.
Statistical Analysis
For bivariable comparisons of patients with and without CDs, we used chi‐squared or Mann‐Whitney U‐tests, as appropriate.
Variables with P < 0.20 in bivariable comparisons were selected for initial inclusion in models. Then, using automated forward and stepwise selection techniques as well as manually entered variables, we fit multivariable generalized estimating equations permitting clustering of effects at the physician level to determine the independent association between the multiple factors tested and presence of a CD. In order to guard against the threat of multiple testing, we retained variables at a significance level of P < 0.01; variables were also retained because of observed confounding with other independent variables, or to maintain face validity of the model. All analyses were performed using SAS 9.0 for Windows (SAS Institute Inc., Cary, NC).
RESULTS
Patient Sociodemographics (Table 1)
A total of 17,097 of 33,638 patients (50.8%) were interviewed and gave consent for chart abstraction. Of these patients, 1776 (10.3%) had a CD documented in the first 24 hours of hospitalization. Patients with documented CDs were older, more often white, had completed more years of education, were more likely to have lived in a nursing home prior to admission, and more likely to have been hospitalized in the last 12 months. The proportion of patients with CDs was highly variable across site of enrollment, from 2.8%‐24.9%.
| Value | No Documented CD (n = 15321, 89.7%) | Documented CD (n = 1776, 10.3%) | P* |
|---|---|---|---|
| |||
| Age (Median, 95%CI)* | 56 (55, 56) | 69 (67, 71) | < 0.0001 |
| Female (n, %) | 8390 (54.8%) | 990 (55.7%) | 0.4312 |
| Race (n, %) | |||
| White | 6640 (43.3%) | 938 (52.8%) | < 0.0001 |
| African American | 4673 (30.5%) | 280 (15.8%) | |
| Asian | 532 (3.5%) | 167 (9.4%) | |
| American Indian | 325 (2.1%) | 26 (1.5%) | |
| Other | 1951 (12.7%) | 241 (13.6%) | |
| Refused/Don't know | 1200 (7.8%) | 124 (7.0%) | |
| Ethnicity (n, %) | |||
| Hispanic or Latino Ethnicity | 1724 (11.3%) | 183 (10.3%) | 0.0039 |
| Insurance type (n, %) | |||
| Charity | 481 (3.4%) | 14 (0.8%) | < 0.0001 |
| Indemnity | 3983 (28.2%) | 327 (19.3%) | |
| Medicaid | 2487 (17.6%) | 195 (11.5%) | |
| Medicare | 6418 (45.5%) | 1114 (65.9%) | |
| Other | 105 (0.7%) | 4 (0.2%) | |
| Self pay | 628 (4.5%) | 36 (2.1%) | |
| Self‐reported education (n, %) | |||
| Junior high school or less | 1297 (8.5%) | 217 (12.2%) | < 0.0001 |
| Some high school | 2146 (14.0%) | 182 (10.2%) | |
| High school graduate | 4435 (28.9%) | 465 (26.2%) | |
| Some college or junior college | 3521 (23.0%) | 347 (19.5%) | |
| College graduate | 1729 (11.3%) | 255 (14.4%) | |
| Post‐graduate | 1191 (7.8%) | 173 (9.7%) | |
| Refused/Don't know | 1002 (6.5%) | 137 (7.7%) | |
| Self reported income (n, %) | |||
| $2,500 or less | 1079 (7.0%) | 108 (6.1%) | 0.0002 |
| $2,501 to $5,000 | 424 (2.8%) | 33 (1.9%) | |
| $5,001 to $10,000 | 1436 (9.4%) | 211 (11.9%) | |
| $10,001 to $15,000 | 1080 (7.0%) | 141 (7.9%) | |
| $15,001 to $25,000 | 1054 (6.9%) | 134 (7.5%) | |
| $25,001 to $35,000 | 837 (5.5%) | 74 (4.2%) | |
| $35,001 to $50,000 | 882 (5.8%) | 94 (5.3%) | |
| $50,001 to $100,000 | 1027 (6.7%) | 125 (7.0%) | |
| $100,001 to $200,000 | 357 (2.3%) | 57 (3.2%) | |
| Over $200,000 | 245 (1.6%) | 34 (1.9%) | |
| Don't know/refused | 6900 (45.0%) | 765 (43.1%) | |
| Housing situation (n, %) | |||
| Own apartment or house | 11887 (77.6%) | 1264 (71.2%) | < 0.0001 |
| A relative or friend's apartment or house | 1804 (11.8%) | 217 (12.2%) | |
| A nursing home, group home, or long‐term care facility | 663 (4.3%) | 204 (11.5%) | |
| A homeless shelter | 258 (1.7%) | 27 (1.5%) | |
| Other | 709 (4.6%) | 64 (3.6%) | |
| Marital status (n, %) | |||
| Married | 4992 (32.6%) | 603 (34.0%) | < 0.0001 |
| Living as if married | 440 (2.9%) | 32 (1.8%) | |
| Divorced | 2027 (13.2%) | 199 (11.2%) | |
| Separated | 569 (3.7%) | 30 (1.7%) | |
| Widowed | 2577 (16.8%) | 487 (27.4%) | |
| Single | 4074 (26.6%) | 364 (20.5%) | |
| Refused | 642 (4.2%) | 61 (3.4%) | |
| Hospitalized in the last 12 months (n, %) | 7602 (49.6%) | 1011 (56.9%) | < 0.0001 |
| Site of enrollment (n, %) | |||
| A | 4602 (30.0%) | 135 (7.6%) | < 0.0001 |
| B | 1595 (10.4%) | 158 (8.9%) | |
| C | 3017 (19.7%) | 998 (56.2%) | |
| D | 2387 (15.6%) | 212 (11.9%) | |
| E | 2057 (13.4%) | 131 (7.4%) | |
| F | 1663 (10.9%) | 142 (8.0%) | |
Patient Self‐Reported Health Status and Comorbid Illness (Table 2)
Patients with CDs more often reported a lot of difficulties with bathing, eating, or dressing; household chores; and moderate activities. Patients with CDs were more likely to report accomplishing less than they would like due to their health. They were more likely to have cancer, depression, a history of stroke, and heart disease, but less likely to have diabetes or human immunodeficiency virus.
| Value | No Documented CD (n = 15321, 89.7%) | Documented CD (n = 1776, 10.3%) | P** |
|---|---|---|---|
| |||
| Thinking back again to one month ago, did any impairment or health problem cause you to need help of other persons with personal care needs, such as eating, bathing, dressing, or getting around the home? (n, %) | |||
| No | 10673 (69.7%) | 973 (54.8%) | < 0.0001 |
| Yes, a little | 1933 (12.6%) | 268 (15.1%) | |
| Yes, a lot | 2127 (13.9%) | 487 (27.4%) | |
| Don't know | 588 (3.8%) | 48 (2.7%) | |
| Thinking back to one month ago, did any impairment or health problem cause you to need help in handling everyday household chores, necessary business, shopping, or getting around for other purposes? (n, %) | |||
| No | 7262 (47.4%) | 566 (31.9%) | < 0.0001 |
| Yes, a little | 2692 (17.6%) | 324 (18.2%) | |
| Yes, a lot | 4126 (26.9%) | 825 (46.5%) | |
| Don't know | 1241 (8.1%) | 61 (3.4%) | |
| As far as you know do you have any of the following health conditions at the present time? (n, %) | |||
| Cancer | |||
| No | 13281 (86.7%) | 1376 (77.5%) | < 0.0001 |
| Yes | 1751 (11.4%) | 351 (19.8%) | |
| Not sure | 289 (1.9%) | 49 (2.8%) | |
| Depression | |||
| No | 10269 (67.0%) | 1099 (61.9%) | < 0.0001 |
| Yes | 4730 (30.9%) | 624 (35.1%) | |
| Not sure | 322 (2.1%) | 53 (3.0%) | |
| Diabetes | |||
| No | 10902 (71.2%) | 1356 (76.4%) | < 0.0001 |
| Yes | 4132 (27.0%) | 394 (22.2%) | |
| Not sure | 287 (1.9%) | 26 (1.5%) | |
| Heart trouble | |||
| No | 10251 (66.9%) | 1080 (60.8%) | < 0.0001 |
| Yes | 4491 (29.3%) | 627 (35.3%) | |
| Not sure | 579 (3.8%) | 69 (3.9%) | |
| HIV or AIDS | |||
| No | 14300 (93.3%) | 1679 (94.5%) | 0.026 |
| Yes | 912 (6.0%) | 80 (4.5%) | |
| Not sure | 109 (0.7%) | 17 (1.0%) | |
| Stroke | |||
| No | 13344 (87.1%) | 1494 (84.1%) | 0.0005 |
| Yes | 1722 (11.2%) | 236 (13.3%) | |
| Not sure | 255 (1.7%) | 46 (2.6%) | |
Patient Preferences, Care Plan Documentation, and Care Coordination at Admission (Table 3)
Patients who had documented CDs were less likely to prefer my doctor give me choices regarding my care, and more often disagreed with the statement I prefer to leave care decisions to my physician. These patients were also more likely to have a durable power of attorney or living will in their chart, or have an alternate decision‐maker noted. The majority of patients without a documented CD (79.9%) had no notation of their care wishes, compared to 29.7% in patients with a documented CD. Patients with a documented CD were more likely to have a regular medical provider and a note in the chart from their primary care physician.
| Value | No Documented CD (n = 15321, 89.7%) | Documented CD (n = 1776, 10.3%) | P* |
|---|---|---|---|
| |||
| I prefer my doctor give me choices regarding my care** (n, %) | |||
| Definitely agree | 11619 (75.8%) | 1247 (70.2%) | < 0.0001 |
| Somewhat agree | 1912 (12.5%) | 252 (14.2%) | |
| Somewhat disagree | 488 (3.2%) | 76 (4.3%) | |
| Definitely disagree | 414 (2.7%) | 87 (4.9%) | |
| Don't know | 888 (5.8%) | 114 (6.4%) | |
| I prefer to leave care decisions to my physician** (n, %) | |||
| Definitely agree | 5660 (36.9%) | 613 (34.5%) | < 0.0001 |
| Somewhat agree | 4539 (29.6%) | 493 (27.8%) | |
| Somewhat disagree | 2265 (14.8%) | 257 (14.5%) | |
| Definitely disagree | 1956 (12.8%) | 304 (17.1%) | |
| Don't know | 901 (5.9%) | 109 (6.1%) | |
| Documentation of care wishes before hospitalization (n, %) | |||
| No documentation | 12238 (79.9%) | 527 (29.7%) | < 0.0001 |
| Full support | 2624 (17.1%) | 742 (41.8%) | |
| Do not resuscitate or intubate (DNR/DNI) | 264 (1.7%) | 370 (20.8%) | |
| Hospice | 53 (0.3%) | 22 (1.2%) | |
| Other limitation (eg, no pressors) | 142 (0.9%) | 115 (6.5%) | |
| Had durable power of attorney in chart (n, %) | 286 (1.9%) | 133 (7.5%) | < 0.0001 |
| Had a living will in chart (n, %) | 266 (1.7%) | 142 (8.0%) | < 0.0001 |
| Alternate decision maker named in chart (n, %) | 2770 (18.1%) | 638 (35.9%) | < 0.0001 |
| Patient noted to be unable to participate in their care at admission (eg, confused, unable to respond) (n, %) | 1227 (8.0%) | 431 (24.3%) | < 0.0001 |
| Inpatient team documented discussion with primary care physician (n, %) | 627 (4.1%) | 136 (7.7%) | < 0.0001 |
| Do not have a regular medical provider** (n, %) | 3836 (25.0%) | 254 (14.3%) | < 0.0001 |
| Note from primary care physician in chart (n, %) | 148 (1.0%) | 39 (2.2%) | < 0.0001 |
Factors Associated with Documented Care Discussions (Table 4)
Using predictor variables presented in Tables 1‐3, we then constructed multivariable models seeking to understand factors independently associated with documentation of code status in the entire cohort, as well as among patients who had no preexisting care wishes.
| Entire Cohort (n = 17097) | Patients with No Documentation of Preadmission Wishes (n = 12765) | |||
|---|---|---|---|---|
| Adjusted Odds Ratio (95% CI) | P Value | Adjusted Odds Ratio (95% CI) | P Value | |
| Preadmission Code Status | ||||
| No documentation | Referent | NA | ||
| Full support | 3.22 (2.28, 4.55) | < 0.0001 | NA | |
| Do not resuscitate or intubate (DNR/DNI) | 11.32 (8.52, 15.04) | < 0.0001 | NA | |
| Hospice | 4.02 (2.33, 6.94) | < 0.0001 | NA | |
| Other limitation (eg, no pressors) | 10.13 (7.35, 13.96) | < 0.0001 | NA | |
| Insurance type | ||||
| Medicare | Referent | Referent | ||
| Charity care | 0.50 (0.30, 0.85) | 0.0099 | 0.56 (0.25, 1.25) | 0.1589 |
| Commercial | 0.81 (0.69, 0.95) | 0.0090 | 0.66 (0.52, 0.85) | 0.0009 |
| Medicaid | 0.69 (0.57, 0.82) | < 0.0001 | 0.49 (0.36, 0.67) | < 0.0001 |
| Other | 0.46 (0.18, 1.13) | 0.0912 | 0.60 (0.17, 2.12) | 0.4302 |
| Self pay | 0.70 (0.52, 0.95) | 0.0203 | 0.49 (0.29, 0.81) | 0.0060 |
| Any limitations in bathing, toileting, dressing or feeding self? | ||||
| No | Referent | Referent | ||
| Yes, a little | 1.25 (1.10, 1.42) | 0.0007 | 1.31 (1.03, 1.67) | 0.0272 |
| Yes, a lot | 1.25 (1.09, 1.43) | 0.0015 | 1.42 (1.11, 1.81) | 0.0055 |
| Unable to respond | 0.81 (0.59, 1.12) | 0.2006 | 0.80 (0.45, 1.41) | 0.4299 |
| Patient has a documented surrogate decision maker | 1.72 (1.47, 2.02) | < 0.0001 | 2.08 (1.62, 2.66) | < 0.0001 |
| Patient noted to be unable to participate in their care at admission (eg, confused, unable to respond) | 1.63 (1.37, 1.94) | < 0.0001 | 2.20 (1.60, 3.02) | < 0.0001 |
| Notation that team had spoken to primary care physician at admission | 1.65 (1.29, 2.11) | < 0.0001 | 1.45 (0.92, 2.28) | 0.1116 |
| History of cancer | ||||
| No | Referent | Referent | ||
| Yes | 1.31 (1.13, 1.51) | 0.0003 | 1.26 (0.96, 1.65) | 0.0960 |
| Not sure | 1.26 (0.87, 1.82) | 0.2162 | 1.80 (1.03, 3.15) | 0.0396 |
| History of diabetes | ||||
| No | Referent | Referent | ||
| Yes | 0.87 (0.75, 1.003) | 0.0543 | 0.79 (0.62, 0.997) | 0.0467 |
| Not sure | 0.61 (0.38, 0.99) | 0.0445 | 0.84 (0.43, 1.65) | 0.6183 |
| Housing situation | ||||
| Own house or apartment | Referent | Referent | ||
| Relative or friend's apartment or house | 1.22 (1.03, 1.45) | 0.0229 | 1.29 (0.97, 1.71) | 0.0783 |
| Nursing home, group home, or long‐term care facility | 1.42 (1.16, 1.74) | 0.0006 | 1.74 (1.27, 2.40) | 0.0007 |
| Homeless shelter | 1.12 (0.72, 1.73) | 0.6204 | 0.87 (0.46, 1.63) | 0.6559 |
| Other/Don't know | 1.02 (0.75, 1.40) | 0.8987 | 1.35 (0.78, 2.36) | 0.2859 |
| Age Group | ||||
| <50 | Referent | Referent | ||
| 5059 | 1.19 (0.99, 1.43) | 0.0647 | 1.18 (0.88, 1.59) | 0.2583 |
| 6069 | 1.18 (0.99, 1.40) | 0.0585 | 1.20 (0.88, 1.66) | 0.2549 |
| 7079 | 1.10 (0.91, 1.33) | 0.3178 | 1.19 (0.85, 1.67) | 0.3033 |
| 8089 | 1.23 (1.03, 1.47) | 0.0207 | 1.34 (0.96, 1.88) | 0.0879 |
| 90+ | 1.45 (1.12, 1.88) | 0.0045 | 1.44 (0.94, 2.20) | 0.0934 |
| Site of Enrollment | ||||
| A | Referent | Referent | ||
| B | 1.74 (1.16, 2.61) | 0.007 | 4.95 (2.90, 8.45) | < 0.0001 |
| C | 5.14 (3.42, 7.74) | < 0.0001 | 26.36 (17.28, 40.23) | < 0.0001 |
| D | 4.19 (2.64, 6.66) | < 0.0001 | 8.06 (4.63, 14.03) | < 0.0001 |
| E | 3.00 (1.82, 4.9) | < 0.0001 | 5.30 (2.71, 10.38) | < 0.0001 |
| F | 4.09 (2.69, 6.23) | < 0.0001 | 2.32 (1.32, 4.08) | 0.0037 |
In the entire cohort, insurance type was independently associated with likelihood of a care discussion, with patients with Medicare having greater adjusted odds ratio for a CD than patients with all other forms of insurance, even after adjusting for age. Patients who had functional limitations with bathing, toileting, and feeding; had a documented surrogate decision maker; were unable to participate in their care; had cancer; or did not live in their own home were more likely to have a documented CD. Subjects with diabetes were less likely to have a CD, although this was of borderline significance. Patients whose team had documented a CD with the patients' primary physician were also more likely to have a discussion noted. However, the magnitude of these predictors was small compared to the independent effects attributable to the site the patient was enrolled or whether the patient had any preexisting documentation. Whereas the adjusted odds ratio associated with clinical or functional measures (such as age, cancer) were generally between 1.5 and 2.5, the range of odds ratios associated with having any documentation of care wishes (compared to no documentation) were all greater than 3, and the odds ratios associated with site of enrollment were 1.7 or higher.
We observed similar findings in analyses limited to patients with no preexisting care documentation. While clinical, sociodemographic, and functional factors remained statistically associated with a CD (albeit with wider confidence intervals due to smaller sample sizes), the effect of the patient's site of enrollment became even more striking (Table 4).
DISCUSSION
In this multicenter study of hospitalized general medical patients, documentation of CDs were highly dependent on where patients received care and whether patients had previous documentation of a care plan. In contrast, although clinical, prognostic, and socioeconomic factors were also associated with whether physicians documented asking patients about their wishes for care, the influence of these factors was modest.
Improving communication between patients and their physicians during an episode of acute illness has been a long‐standing goal, with the Study to Understand Prognoses and Preferences for Outcomes of Treatment (SUPPORT) trial providing the most notable example of an effort to improve patient care through aligning patient wishes, prognosis, and aggressiveness for care. However, even the SUPPORT interventiona robust, well‐implemented, and highly labor‐intensive strategywas not able to achieve this goal. In their summary of SUPPORT study findings, the authors suggested that the likelihood of and effectiveness of communication in seriously ill patients may be powerfully influenced by patient and caregiver culture4; our findings may partially confirm SUPPORT's conclusions.
Preexisting documentation in our study would not have included mandated documentation that someone had given the patient information about advance directives (as mandated by the PSDA), but rather a specification for that advance care plan. This distinction means that preexisting documentation in our study represented a previous decision by the patient (or the patient and their physician) to have made a plan, and an association with hospital discussions may be because the first conversation is the hardest to undertake; subsequent discussions then represent confirmatory or clarifying discussions that may be less difficult to broach (particularly for less experienced trainees). A CD may have also been prompted when documentation was unclear, or when a change in prognosis took place (eg, a new diagnosis of metastatic cancer).22 Alternatively, a preexisting plan may serve as a reminder for clinicians to discuss code status, signify patients who are more willing to broach this subject, and either seem more approachable or bring up the topic themselves.
The influence of site on documentation and CD provides additional evidence that caregiver culture played a role in CDs. Although this variation may have been in part due to culture around documentation practices more generally, it is important to note that none of our participating centers had a policy for documentation of care wishes or patient‐doctor communication, or a policy mandating these discussions in any specific patient group. Furthermore, site‐related differences were seen even in patients with no preexisting documentation, and were seen after adjustment for other documentation or communication practices (eg, documenting a discussion with the patient's primary care provider), making it unlikely that documentation practices are solely responsible for our results. Persistence of variations in care documentation raises interesting questions, particularly when one considers recent data describing variations in end‐of‐life care between similar academic centers (one of which was a participating site in this trial).23 Given that the sites in our study represent diverse institutions yet share a number of characteristics, understanding the specific practices or aspects of medical culture that promote conversations may provide insights in how to improve this promotion elsewhere.
Our results would argue that mandates to document code status on admission may be unlikely to improve communication unless sites also develop an approach to using this newly documented information as a prompt for subsequent discussions. In nursing home settings, documentation of advance directives may reduce resource use, but it is unclear whether similar effects will be seen in hospital settings.24 It is also a challenge to insure that documentation of a care plan in the nursing home is communicated to the providers in the hospital.25 The PSDA was a first step in this direction, but its effects on improving communication are uncertain.26 Our results would confirm that the PSDA or systems to mandate documentation are not solutions in themselves, but are 2 steps in a larger process.
We do not want to discount our findings of less frequent CDs among patients of lower socioeconomic status, where gaps in quality of care, communication, and outcomes are well‐recognized.27 As such, our results delineate yet another area where practice can and should be improved for vulnerable patients. However, factors related to site of care and documentation may provide opportunities to improve care even more profoundly and within a fairly discrete (if complex) acute episode of care. Having said this, our results also demonstrate a potential pitfall of using code status documentation for risk‐adjustment, because such notation may be more dependent on local documentation patterns than clinical appropriateness.
Our study has a number of limitations. As an observational study, our findings are likely prone to biases related to unadjusted confounding due to comorbidity. The influence of comorbidity would seem to have been most important in biasing the effects of preexisting documentation, where documentation would be associated with more unaccounted comorbidity. However, there were no differences in documentation even after accounting for prognosis by adjusting for age, functional status, and a valid comorbidity score.28 As we have pointed out, our key outcome is based on documentation of communication and not actual communication, and as such may be biased in subtle ways not related to site of care or the items tested in our model. While we cannot directly eliminate the possibility of documentation biases in our results using statistical methods, it is important to point out that our chart abstraction protocol used highly specific criteria to detect these discussions, and therefore may under‐detect discussions which may have been documented in less detail. Our study did not examine whether documentation of CDs influenced subsequent care. However, previous studies have shown that advance care planning has only a minor influence on care.29 However, communication about preferences at the time of admission, when the need for specific care decisions may be more evident, may be more likely to influence hospital care. Our results show that previous documentation is associated with discussions early in an admission. Such discussion may affect care, even if the decision made is different than what was previously documented. In addition, patients who were included in our study (those able to provide consent and participate in an interview) may be healthier or more cognitively intact than a general population of hospitalized patients. However, how this would have affected our results is unclear. Being able to speak and consent for oneself are key facilitators to communication, but sicker patients who cannot consent or speak for themselves might also be more likely to have care planning decisions made based on illness severity; documentation in these patients may be more driven by whether such notes were required because of the involvement of home health services (or skilled nursing facilities). Finally, although our study is one of the largest examinations of in‐hospital communication to date and its implications for resident education are worth noting, the sites involved in the MCHS may not be representative of nonteaching hospitals, or community‐based teaching hospitals.
Our results suggest that, although comorbid illness and socioeconomic status play an important role in determining which patients receive CDs at the time of admission, these factors are substantially less powerful than preexisting documentation practices and culture or care practices specific to their site of care. These results suggest that future work should consider organizational characteristics and culture as important targets for interventions to improve care planning in hospitalized patients.
- Committee on Care at the End of Life, Institute of Medicine.Approaching Death: Improving Care at the End of Life.Field MJ,Cassel CK, eds.Washington, DC:National Academy Press;1997.
- ,,,,,.Factors considered important at the end of life by patients, family, physicians, and other care providers.JAMA.2000;284(19):2476–2482.
- ,,,,,.In search of a good death: observations of patients, families, and providers.Ann Intern Med.2000;132(10):825–832.
- The SUPPORT Principal Investigators.A controlled trial to improve care for seriously ill hospitalized patients. The study to understand prognoses and preferences for outcomes and risks of treatments (SUPPORT).JAMA.1995;274(20):1591–1598.
- ,.Choices about cardiopulmonary resuscitation in the hospital. When do physicians talk with patients?N Engl J Med.1984;310(17):1089–1093.
- ,,, et al.Patient preferences for communication with physicians about end‐of‐life decisions. SUPPORT Investigators. Study to Understand Prognoses and Preference for Outcomes and Risks of Treatment.Ann Intern Med.1997;127(1):1–12.
- ,,,.Discussing cardiopulmonary resuscitation: a study of elderly outpatients.J Gen Intern Med.1988;3(4):317–321.
- ,,,,.Educating the elderly: cardiopulmonary resuscitation decisions before and after intervention.J Am Geriatr Soc.1991;39(4):372–377.
- ,,,.Factors influencing physicians in recommending in‐hospital cardiopulmonary resuscitation.Arch Intern Med.1993;153(17):1999–2003.
- Federal Register. 42 USC 1395‐1396. Patient Self‐Determination Act1990.
- ,,.Advance directives on admission. Clinical implications and analysis of the Patient Self‐Determination Act of 1990.JAMA.1991;266(3):402–405.
- ,,.A new doctor in the house: ethical issues in hospitalist systems.JAMA.1999;282(2):171–174.
- ,,,,,.Implementation of a hospitalist service at a community teaching hospital: improving clinical efficiency and patient outcomes.Ann Intern Med.2002;137:859–865.
- ,,, et al.Effects of hospitalist physicians on an academic general medical service: results of a randomized trial.Ann Intern Med.2002;137:866–874.
- ,.The hospitalist movement 5 years later.JAMA.2002;287(4):487–494.
- ,,,,.Reorganizing an academic medical service: impact on cost, quality, patient satisfaction, and education.JAMA.1998;279(19):1560–1565.
- ,,,,,.Physician staffing patterns and clinical outcomes in critically ill patients: a systematic review.JAMA.2002;288(17):2151–2162.
- ,,, et al.Organizational characteristics of intensive care units related to outcomes of abdominal aortic surgery.JAMA.1999;281(14):1310–1317.
- ,,, et al.Effects of inpatient experience on outcomes and costs in a multicenter trial of academic hospitalists.J Gen Intern Med.2005;20(Suppl 1):141–142.
- ,,.SF‐12: How to Score the SF‐12 Physical and Mental Health Summary Scales.2nd ed.Boston, MA:New England Medical Center, The Health Institute;1995.
- ,.End‐of‐life care in a voluntary hospitalist model: effects on communication, processes of care, and patient symptoms.Am J Med.2004;116(10):669–675.
- ,,,.Role of written advance directives in decision making: insights from qualitative and quantitative data.J Gen Intern Med.1998;13(7):439–446.
- ,,,,.Evaluating the efficiency of California providers in caring for patients with chronic illnesses.Health Aff (Millwood).2005 Jul‐Dec;Suppl Web Exclusives:W5–526–43.
- ,,, et al.Systematic implementation of an advance directive program in nursing homes: a randomized controlled trial.JAMA.2000;283(11):1437–1444.
- ,.Meeting palliative care needs in post‐acute care settings: “to help them live until they die”.JAMA.2006;295(6):681–686.
- ,,, et al.Advance directives for seriously ill hospitalized patients: effectiveness with the patient self‐determination act and the SUPPORT intervention. SUPPORT Investigators. Study to Understand Prognoses and Preferences for Outcomes and Risks of Treatment.J Am Geriatr Soc.1997;45(4):500–507.
- Institute of Medicine.Unequal Treatment: Confronting Racial and Ethnic Disparities in Health Care.Smedley BD,Stith AY,Nelson AR, eds.Washington, DC:National Academies Press;2003.
- ,,.Use of a self‐report‐generated Charlson Comorbidity Index for predicting mortality.Med Care.2005;43(6):607–615.
- ,,.Can clinical interventions change care at the end of life?Ann Intern Med.1997;126(5):381–388.
Despite an ideal of dying at home, most Americans die in hospitals.1 Patients and families are clear about what they need from the healthcare system at the end of life: relief of distressing symptoms, the opportunity to communicate with physicians and others about death and dying, and the assurance that they will be attended to and comforted by their physicians as they approach death.2, 3 However, discussions about patient preferences for care occur infrequently,47 even though patients want to discuss care with their doctor,68 and physicians believe these discussions are their responsibility.9
The most prominent work in this area occurred in the Study to Understand Prognoses and Preferences for Outcomes and Risks of Treatments (SUPPORT) study, which focused on patients with advanced disease, often in the intensive care unit.4 Furthermore, few studies have focused on general medical patients, and healthcare has changed in important ways since SUPPORT's publication. First, the Patient Self‐Determination Act (PSDA) requires that all patients be asked about their care wishes at the time of admission and document the presence of an advanced directive.10, 11 Second, there is growing awareness of the need to improve palliative care for all hospitalized patients, with many advocating that hospitalization itself is a reason to ask about patient's preferences for care regardless of a patient's level of chronic or acute illness.12 Finally, emergence of hospitalists,1316 movement toward closed intensive care units,17, 18 and changes in residency training have increased segmentation in care of hospitalized patients.15, 18
To overcome limitations of previous literature and update our knowledge of how care discussions take place in the current healthcare environment, we analyzed data from a large study of patients admitted to general medicine services at 6 academic centers. Using this robust dataset, which included prospectively collected information about preferences for communication with their physician, we performed statistical analyses to understand which patient clinical, sociodemographic, and preference‐related factors, as well as factors related to their site of care, were associated with documentation that a code status discussion took place at the time of hospital admission.
PATIENTS AND METHODS
Sites
The Multicenter Hospitalist Study (MCHS) was a multicenter trial of general medical services that enrolled patients at 6 geographically diverse centers: The University of Chicago (which also served as the coordinating center), University of Iowa Hospitals and Clinics, University of California San Francisco, University of Wisconsin, University of New Mexico, and Brigham and Women's Hospital.19
Each site was selected to participate in the MCHS because patients on their general medicine service were admitted to hospitalist and nonhospitalist physicians in a random fashion (eg, based on predetermined call schedule based on day of the week). As teaching hospitals, house officers provided direct care to patients hospitalized at each center; nonteaching services were not present at the sites during the period of this study.
During the period of this study, each site complied with PSDA requirements for noting that patients had been informed about their right to create an advance directive, but no sites had a guideline or other program in place specifically intended to facilitate physician‐patient communication about care wishes. Two sites had active Hospice or Palliative Care services, and another 2 had Geriatrics Consultation services, but none had standard protocols mandating involvement of these consultants at the time of admission, the time when our key outcomes were documented.
Patients
Patients were eligible for inclusion in the MCHS if they were older than 18 years of age and were admitted at random to a hospitalist or nonhospitalist physician; we excluded patients from MCHS if they were admitted specifically under the care of their primary care physician or subspecialist (eg, admitted for chemotherapy) or were a prison inmate. Patients meeting these eligibility criteria were then approached for purposes of informed consent.
Data Collection
Data for this study were obtained from administrative data, patient interview, and chart abstraction as in previous work.14 Administrative data were drawn from cost‐accounting databases at each participating hospital; administrative data were used to provide cost and length of stay data, as well as information about patient insurance type, age, and sex.
We interviewed patients immediately after informed consent was obtained, with both taking place generally within 24 hours of admission. Interviews collected data about patient preferences for care and functional status,20 and other data not reliably available from administrative sources (such as housing situation).
Patient care plan before admission was taken from notes and orders written in the first 24 hours of hospitalization, as mentioned above. Using criteria we employed in previous work,21 a care discussion (CD) was defined as documentation of a discussion between patients (or family) and at least 1 physician (primary physician, hospitalist, consulting physician, or house officer) during the first 24 hours of hospitalization. CDs needed to specify that the person who wrote the note had actually spoken with the patient or their family for the purposes of determining preferences for care, and that this discussion resulted in a specific care plan. Thus, notations such as do not resuscitate/do not intubate, or spoke with family, questions answered, did not qualify as CDs, but a note stating the patient continues to want full efforts was counted as a CD.
Principal investigators at each site were responsible for training and overseeing interviewing and chart abstraction activities at each site, with central oversight of data quality provided by the central coordinating center. Upon receipt at the data coordinating center, all data were examined for missing, nonsensical, or outlier data with errors referred back to the participating sites for correction.
Statistical Analysis
For bivariable comparisons of patients with and without CDs, we used chi‐squared or Mann‐Whitney U‐tests, as appropriate.
Variables with P < 0.20 in bivariable comparisons were selected for initial inclusion in models. Then, using automated forward and stepwise selection techniques as well as manually entered variables, we fit multivariable generalized estimating equations permitting clustering of effects at the physician level to determine the independent association between the multiple factors tested and presence of a CD. In order to guard against the threat of multiple testing, we retained variables at a significance level of P < 0.01; variables were also retained because of observed confounding with other independent variables, or to maintain face validity of the model. All analyses were performed using SAS 9.0 for Windows (SAS Institute Inc., Cary, NC).
RESULTS
Patient Sociodemographics (Table 1)
A total of 17,097 of 33,638 patients (50.8%) were interviewed and gave consent for chart abstraction. Of these patients, 1776 (10.3%) had a CD documented in the first 24 hours of hospitalization. Patients with documented CDs were older, more often white, had completed more years of education, were more likely to have lived in a nursing home prior to admission, and more likely to have been hospitalized in the last 12 months. The proportion of patients with CDs was highly variable across site of enrollment, from 2.8%‐24.9%.
| Value | No Documented CD (n = 15321, 89.7%) | Documented CD (n = 1776, 10.3%) | P* |
|---|---|---|---|
| |||
| Age (Median, 95%CI)* | 56 (55, 56) | 69 (67, 71) | < 0.0001 |
| Female (n, %) | 8390 (54.8%) | 990 (55.7%) | 0.4312 |
| Race (n, %) | |||
| White | 6640 (43.3%) | 938 (52.8%) | < 0.0001 |
| African American | 4673 (30.5%) | 280 (15.8%) | |
| Asian | 532 (3.5%) | 167 (9.4%) | |
| American Indian | 325 (2.1%) | 26 (1.5%) | |
| Other | 1951 (12.7%) | 241 (13.6%) | |
| Refused/Don't know | 1200 (7.8%) | 124 (7.0%) | |
| Ethnicity (n, %) | |||
| Hispanic or Latino Ethnicity | 1724 (11.3%) | 183 (10.3%) | 0.0039 |
| Insurance type (n, %) | |||
| Charity | 481 (3.4%) | 14 (0.8%) | < 0.0001 |
| Indemnity | 3983 (28.2%) | 327 (19.3%) | |
| Medicaid | 2487 (17.6%) | 195 (11.5%) | |
| Medicare | 6418 (45.5%) | 1114 (65.9%) | |
| Other | 105 (0.7%) | 4 (0.2%) | |
| Self pay | 628 (4.5%) | 36 (2.1%) | |
| Self‐reported education (n, %) | |||
| Junior high school or less | 1297 (8.5%) | 217 (12.2%) | < 0.0001 |
| Some high school | 2146 (14.0%) | 182 (10.2%) | |
| High school graduate | 4435 (28.9%) | 465 (26.2%) | |
| Some college or junior college | 3521 (23.0%) | 347 (19.5%) | |
| College graduate | 1729 (11.3%) | 255 (14.4%) | |
| Post‐graduate | 1191 (7.8%) | 173 (9.7%) | |
| Refused/Don't know | 1002 (6.5%) | 137 (7.7%) | |
| Self reported income (n, %) | |||
| $2,500 or less | 1079 (7.0%) | 108 (6.1%) | 0.0002 |
| $2,501 to $5,000 | 424 (2.8%) | 33 (1.9%) | |
| $5,001 to $10,000 | 1436 (9.4%) | 211 (11.9%) | |
| $10,001 to $15,000 | 1080 (7.0%) | 141 (7.9%) | |
| $15,001 to $25,000 | 1054 (6.9%) | 134 (7.5%) | |
| $25,001 to $35,000 | 837 (5.5%) | 74 (4.2%) | |
| $35,001 to $50,000 | 882 (5.8%) | 94 (5.3%) | |
| $50,001 to $100,000 | 1027 (6.7%) | 125 (7.0%) | |
| $100,001 to $200,000 | 357 (2.3%) | 57 (3.2%) | |
| Over $200,000 | 245 (1.6%) | 34 (1.9%) | |
| Don't know/refused | 6900 (45.0%) | 765 (43.1%) | |
| Housing situation (n, %) | |||
| Own apartment or house | 11887 (77.6%) | 1264 (71.2%) | < 0.0001 |
| A relative or friend's apartment or house | 1804 (11.8%) | 217 (12.2%) | |
| A nursing home, group home, or long‐term care facility | 663 (4.3%) | 204 (11.5%) | |
| A homeless shelter | 258 (1.7%) | 27 (1.5%) | |
| Other | 709 (4.6%) | 64 (3.6%) | |
| Marital status (n, %) | |||
| Married | 4992 (32.6%) | 603 (34.0%) | < 0.0001 |
| Living as if married | 440 (2.9%) | 32 (1.8%) | |
| Divorced | 2027 (13.2%) | 199 (11.2%) | |
| Separated | 569 (3.7%) | 30 (1.7%) | |
| Widowed | 2577 (16.8%) | 487 (27.4%) | |
| Single | 4074 (26.6%) | 364 (20.5%) | |
| Refused | 642 (4.2%) | 61 (3.4%) | |
| Hospitalized in the last 12 months (n, %) | 7602 (49.6%) | 1011 (56.9%) | < 0.0001 |
| Site of enrollment (n, %) | |||
| A | 4602 (30.0%) | 135 (7.6%) | < 0.0001 |
| B | 1595 (10.4%) | 158 (8.9%) | |
| C | 3017 (19.7%) | 998 (56.2%) | |
| D | 2387 (15.6%) | 212 (11.9%) | |
| E | 2057 (13.4%) | 131 (7.4%) | |
| F | 1663 (10.9%) | 142 (8.0%) | |
Patient Self‐Reported Health Status and Comorbid Illness (Table 2)
Patients with CDs more often reported a lot of difficulties with bathing, eating, or dressing; household chores; and moderate activities. Patients with CDs were more likely to report accomplishing less than they would like due to their health. They were more likely to have cancer, depression, a history of stroke, and heart disease, but less likely to have diabetes or human immunodeficiency virus.
| Value | No Documented CD (n = 15321, 89.7%) | Documented CD (n = 1776, 10.3%) | P** |
|---|---|---|---|
| |||
| Thinking back again to one month ago, did any impairment or health problem cause you to need help of other persons with personal care needs, such as eating, bathing, dressing, or getting around the home? (n, %) | |||
| No | 10673 (69.7%) | 973 (54.8%) | < 0.0001 |
| Yes, a little | 1933 (12.6%) | 268 (15.1%) | |
| Yes, a lot | 2127 (13.9%) | 487 (27.4%) | |
| Don't know | 588 (3.8%) | 48 (2.7%) | |
| Thinking back to one month ago, did any impairment or health problem cause you to need help in handling everyday household chores, necessary business, shopping, or getting around for other purposes? (n, %) | |||
| No | 7262 (47.4%) | 566 (31.9%) | < 0.0001 |
| Yes, a little | 2692 (17.6%) | 324 (18.2%) | |
| Yes, a lot | 4126 (26.9%) | 825 (46.5%) | |
| Don't know | 1241 (8.1%) | 61 (3.4%) | |
| As far as you know do you have any of the following health conditions at the present time? (n, %) | |||
| Cancer | |||
| No | 13281 (86.7%) | 1376 (77.5%) | < 0.0001 |
| Yes | 1751 (11.4%) | 351 (19.8%) | |
| Not sure | 289 (1.9%) | 49 (2.8%) | |
| Depression | |||
| No | 10269 (67.0%) | 1099 (61.9%) | < 0.0001 |
| Yes | 4730 (30.9%) | 624 (35.1%) | |
| Not sure | 322 (2.1%) | 53 (3.0%) | |
| Diabetes | |||
| No | 10902 (71.2%) | 1356 (76.4%) | < 0.0001 |
| Yes | 4132 (27.0%) | 394 (22.2%) | |
| Not sure | 287 (1.9%) | 26 (1.5%) | |
| Heart trouble | |||
| No | 10251 (66.9%) | 1080 (60.8%) | < 0.0001 |
| Yes | 4491 (29.3%) | 627 (35.3%) | |
| Not sure | 579 (3.8%) | 69 (3.9%) | |
| HIV or AIDS | |||
| No | 14300 (93.3%) | 1679 (94.5%) | 0.026 |
| Yes | 912 (6.0%) | 80 (4.5%) | |
| Not sure | 109 (0.7%) | 17 (1.0%) | |
| Stroke | |||
| No | 13344 (87.1%) | 1494 (84.1%) | 0.0005 |
| Yes | 1722 (11.2%) | 236 (13.3%) | |
| Not sure | 255 (1.7%) | 46 (2.6%) | |
Patient Preferences, Care Plan Documentation, and Care Coordination at Admission (Table 3)
Patients who had documented CDs were less likely to prefer my doctor give me choices regarding my care, and more often disagreed with the statement I prefer to leave care decisions to my physician. These patients were also more likely to have a durable power of attorney or living will in their chart, or have an alternate decision‐maker noted. The majority of patients without a documented CD (79.9%) had no notation of their care wishes, compared to 29.7% in patients with a documented CD. Patients with a documented CD were more likely to have a regular medical provider and a note in the chart from their primary care physician.
| Value | No Documented CD (n = 15321, 89.7%) | Documented CD (n = 1776, 10.3%) | P* |
|---|---|---|---|
| |||
| I prefer my doctor give me choices regarding my care** (n, %) | |||
| Definitely agree | 11619 (75.8%) | 1247 (70.2%) | < 0.0001 |
| Somewhat agree | 1912 (12.5%) | 252 (14.2%) | |
| Somewhat disagree | 488 (3.2%) | 76 (4.3%) | |
| Definitely disagree | 414 (2.7%) | 87 (4.9%) | |
| Don't know | 888 (5.8%) | 114 (6.4%) | |
| I prefer to leave care decisions to my physician** (n, %) | |||
| Definitely agree | 5660 (36.9%) | 613 (34.5%) | < 0.0001 |
| Somewhat agree | 4539 (29.6%) | 493 (27.8%) | |
| Somewhat disagree | 2265 (14.8%) | 257 (14.5%) | |
| Definitely disagree | 1956 (12.8%) | 304 (17.1%) | |
| Don't know | 901 (5.9%) | 109 (6.1%) | |
| Documentation of care wishes before hospitalization (n, %) | |||
| No documentation | 12238 (79.9%) | 527 (29.7%) | < 0.0001 |
| Full support | 2624 (17.1%) | 742 (41.8%) | |
| Do not resuscitate or intubate (DNR/DNI) | 264 (1.7%) | 370 (20.8%) | |
| Hospice | 53 (0.3%) | 22 (1.2%) | |
| Other limitation (eg, no pressors) | 142 (0.9%) | 115 (6.5%) | |
| Had durable power of attorney in chart (n, %) | 286 (1.9%) | 133 (7.5%) | < 0.0001 |
| Had a living will in chart (n, %) | 266 (1.7%) | 142 (8.0%) | < 0.0001 |
| Alternate decision maker named in chart (n, %) | 2770 (18.1%) | 638 (35.9%) | < 0.0001 |
| Patient noted to be unable to participate in their care at admission (eg, confused, unable to respond) (n, %) | 1227 (8.0%) | 431 (24.3%) | < 0.0001 |
| Inpatient team documented discussion with primary care physician (n, %) | 627 (4.1%) | 136 (7.7%) | < 0.0001 |
| Do not have a regular medical provider** (n, %) | 3836 (25.0%) | 254 (14.3%) | < 0.0001 |
| Note from primary care physician in chart (n, %) | 148 (1.0%) | 39 (2.2%) | < 0.0001 |
Factors Associated with Documented Care Discussions (Table 4)
Using predictor variables presented in Tables 1‐3, we then constructed multivariable models seeking to understand factors independently associated with documentation of code status in the entire cohort, as well as among patients who had no preexisting care wishes.
| Entire Cohort (n = 17097) | Patients with No Documentation of Preadmission Wishes (n = 12765) | |||
|---|---|---|---|---|
| Adjusted Odds Ratio (95% CI) | P Value | Adjusted Odds Ratio (95% CI) | P Value | |
| Preadmission Code Status | ||||
| No documentation | Referent | NA | ||
| Full support | 3.22 (2.28, 4.55) | < 0.0001 | NA | |
| Do not resuscitate or intubate (DNR/DNI) | 11.32 (8.52, 15.04) | < 0.0001 | NA | |
| Hospice | 4.02 (2.33, 6.94) | < 0.0001 | NA | |
| Other limitation (eg, no pressors) | 10.13 (7.35, 13.96) | < 0.0001 | NA | |
| Insurance type | ||||
| Medicare | Referent | Referent | ||
| Charity care | 0.50 (0.30, 0.85) | 0.0099 | 0.56 (0.25, 1.25) | 0.1589 |
| Commercial | 0.81 (0.69, 0.95) | 0.0090 | 0.66 (0.52, 0.85) | 0.0009 |
| Medicaid | 0.69 (0.57, 0.82) | < 0.0001 | 0.49 (0.36, 0.67) | < 0.0001 |
| Other | 0.46 (0.18, 1.13) | 0.0912 | 0.60 (0.17, 2.12) | 0.4302 |
| Self pay | 0.70 (0.52, 0.95) | 0.0203 | 0.49 (0.29, 0.81) | 0.0060 |
| Any limitations in bathing, toileting, dressing or feeding self? | ||||
| No | Referent | Referent | ||
| Yes, a little | 1.25 (1.10, 1.42) | 0.0007 | 1.31 (1.03, 1.67) | 0.0272 |
| Yes, a lot | 1.25 (1.09, 1.43) | 0.0015 | 1.42 (1.11, 1.81) | 0.0055 |
| Unable to respond | 0.81 (0.59, 1.12) | 0.2006 | 0.80 (0.45, 1.41) | 0.4299 |
| Patient has a documented surrogate decision maker | 1.72 (1.47, 2.02) | < 0.0001 | 2.08 (1.62, 2.66) | < 0.0001 |
| Patient noted to be unable to participate in their care at admission (eg, confused, unable to respond) | 1.63 (1.37, 1.94) | < 0.0001 | 2.20 (1.60, 3.02) | < 0.0001 |
| Notation that team had spoken to primary care physician at admission | 1.65 (1.29, 2.11) | < 0.0001 | 1.45 (0.92, 2.28) | 0.1116 |
| History of cancer | ||||
| No | Referent | Referent | ||
| Yes | 1.31 (1.13, 1.51) | 0.0003 | 1.26 (0.96, 1.65) | 0.0960 |
| Not sure | 1.26 (0.87, 1.82) | 0.2162 | 1.80 (1.03, 3.15) | 0.0396 |
| History of diabetes | ||||
| No | Referent | Referent | ||
| Yes | 0.87 (0.75, 1.003) | 0.0543 | 0.79 (0.62, 0.997) | 0.0467 |
| Not sure | 0.61 (0.38, 0.99) | 0.0445 | 0.84 (0.43, 1.65) | 0.6183 |
| Housing situation | ||||
| Own house or apartment | Referent | Referent | ||
| Relative or friend's apartment or house | 1.22 (1.03, 1.45) | 0.0229 | 1.29 (0.97, 1.71) | 0.0783 |
| Nursing home, group home, or long‐term care facility | 1.42 (1.16, 1.74) | 0.0006 | 1.74 (1.27, 2.40) | 0.0007 |
| Homeless shelter | 1.12 (0.72, 1.73) | 0.6204 | 0.87 (0.46, 1.63) | 0.6559 |
| Other/Don't know | 1.02 (0.75, 1.40) | 0.8987 | 1.35 (0.78, 2.36) | 0.2859 |
| Age Group | ||||
| <50 | Referent | Referent | ||
| 5059 | 1.19 (0.99, 1.43) | 0.0647 | 1.18 (0.88, 1.59) | 0.2583 |
| 6069 | 1.18 (0.99, 1.40) | 0.0585 | 1.20 (0.88, 1.66) | 0.2549 |
| 7079 | 1.10 (0.91, 1.33) | 0.3178 | 1.19 (0.85, 1.67) | 0.3033 |
| 8089 | 1.23 (1.03, 1.47) | 0.0207 | 1.34 (0.96, 1.88) | 0.0879 |
| 90+ | 1.45 (1.12, 1.88) | 0.0045 | 1.44 (0.94, 2.20) | 0.0934 |
| Site of Enrollment | ||||
| A | Referent | Referent | ||
| B | 1.74 (1.16, 2.61) | 0.007 | 4.95 (2.90, 8.45) | < 0.0001 |
| C | 5.14 (3.42, 7.74) | < 0.0001 | 26.36 (17.28, 40.23) | < 0.0001 |
| D | 4.19 (2.64, 6.66) | < 0.0001 | 8.06 (4.63, 14.03) | < 0.0001 |
| E | 3.00 (1.82, 4.9) | < 0.0001 | 5.30 (2.71, 10.38) | < 0.0001 |
| F | 4.09 (2.69, 6.23) | < 0.0001 | 2.32 (1.32, 4.08) | 0.0037 |
In the entire cohort, insurance type was independently associated with likelihood of a care discussion, with patients with Medicare having greater adjusted odds ratio for a CD than patients with all other forms of insurance, even after adjusting for age. Patients who had functional limitations with bathing, toileting, and feeding; had a documented surrogate decision maker; were unable to participate in their care; had cancer; or did not live in their own home were more likely to have a documented CD. Subjects with diabetes were less likely to have a CD, although this was of borderline significance. Patients whose team had documented a CD with the patients' primary physician were also more likely to have a discussion noted. However, the magnitude of these predictors was small compared to the independent effects attributable to the site the patient was enrolled or whether the patient had any preexisting documentation. Whereas the adjusted odds ratio associated with clinical or functional measures (such as age, cancer) were generally between 1.5 and 2.5, the range of odds ratios associated with having any documentation of care wishes (compared to no documentation) were all greater than 3, and the odds ratios associated with site of enrollment were 1.7 or higher.
We observed similar findings in analyses limited to patients with no preexisting care documentation. While clinical, sociodemographic, and functional factors remained statistically associated with a CD (albeit with wider confidence intervals due to smaller sample sizes), the effect of the patient's site of enrollment became even more striking (Table 4).
DISCUSSION
In this multicenter study of hospitalized general medical patients, documentation of CDs were highly dependent on where patients received care and whether patients had previous documentation of a care plan. In contrast, although clinical, prognostic, and socioeconomic factors were also associated with whether physicians documented asking patients about their wishes for care, the influence of these factors was modest.
Improving communication between patients and their physicians during an episode of acute illness has been a long‐standing goal, with the Study to Understand Prognoses and Preferences for Outcomes of Treatment (SUPPORT) trial providing the most notable example of an effort to improve patient care through aligning patient wishes, prognosis, and aggressiveness for care. However, even the SUPPORT interventiona robust, well‐implemented, and highly labor‐intensive strategywas not able to achieve this goal. In their summary of SUPPORT study findings, the authors suggested that the likelihood of and effectiveness of communication in seriously ill patients may be powerfully influenced by patient and caregiver culture4; our findings may partially confirm SUPPORT's conclusions.
Preexisting documentation in our study would not have included mandated documentation that someone had given the patient information about advance directives (as mandated by the PSDA), but rather a specification for that advance care plan. This distinction means that preexisting documentation in our study represented a previous decision by the patient (or the patient and their physician) to have made a plan, and an association with hospital discussions may be because the first conversation is the hardest to undertake; subsequent discussions then represent confirmatory or clarifying discussions that may be less difficult to broach (particularly for less experienced trainees). A CD may have also been prompted when documentation was unclear, or when a change in prognosis took place (eg, a new diagnosis of metastatic cancer).22 Alternatively, a preexisting plan may serve as a reminder for clinicians to discuss code status, signify patients who are more willing to broach this subject, and either seem more approachable or bring up the topic themselves.
The influence of site on documentation and CD provides additional evidence that caregiver culture played a role in CDs. Although this variation may have been in part due to culture around documentation practices more generally, it is important to note that none of our participating centers had a policy for documentation of care wishes or patient‐doctor communication, or a policy mandating these discussions in any specific patient group. Furthermore, site‐related differences were seen even in patients with no preexisting documentation, and were seen after adjustment for other documentation or communication practices (eg, documenting a discussion with the patient's primary care provider), making it unlikely that documentation practices are solely responsible for our results. Persistence of variations in care documentation raises interesting questions, particularly when one considers recent data describing variations in end‐of‐life care between similar academic centers (one of which was a participating site in this trial).23 Given that the sites in our study represent diverse institutions yet share a number of characteristics, understanding the specific practices or aspects of medical culture that promote conversations may provide insights in how to improve this promotion elsewhere.
Our results would argue that mandates to document code status on admission may be unlikely to improve communication unless sites also develop an approach to using this newly documented information as a prompt for subsequent discussions. In nursing home settings, documentation of advance directives may reduce resource use, but it is unclear whether similar effects will be seen in hospital settings.24 It is also a challenge to insure that documentation of a care plan in the nursing home is communicated to the providers in the hospital.25 The PSDA was a first step in this direction, but its effects on improving communication are uncertain.26 Our results would confirm that the PSDA or systems to mandate documentation are not solutions in themselves, but are 2 steps in a larger process.
We do not want to discount our findings of less frequent CDs among patients of lower socioeconomic status, where gaps in quality of care, communication, and outcomes are well‐recognized.27 As such, our results delineate yet another area where practice can and should be improved for vulnerable patients. However, factors related to site of care and documentation may provide opportunities to improve care even more profoundly and within a fairly discrete (if complex) acute episode of care. Having said this, our results also demonstrate a potential pitfall of using code status documentation for risk‐adjustment, because such notation may be more dependent on local documentation patterns than clinical appropriateness.
Our study has a number of limitations. As an observational study, our findings are likely prone to biases related to unadjusted confounding due to comorbidity. The influence of comorbidity would seem to have been most important in biasing the effects of preexisting documentation, where documentation would be associated with more unaccounted comorbidity. However, there were no differences in documentation even after accounting for prognosis by adjusting for age, functional status, and a valid comorbidity score.28 As we have pointed out, our key outcome is based on documentation of communication and not actual communication, and as such may be biased in subtle ways not related to site of care or the items tested in our model. While we cannot directly eliminate the possibility of documentation biases in our results using statistical methods, it is important to point out that our chart abstraction protocol used highly specific criteria to detect these discussions, and therefore may under‐detect discussions which may have been documented in less detail. Our study did not examine whether documentation of CDs influenced subsequent care. However, previous studies have shown that advance care planning has only a minor influence on care.29 However, communication about preferences at the time of admission, when the need for specific care decisions may be more evident, may be more likely to influence hospital care. Our results show that previous documentation is associated with discussions early in an admission. Such discussion may affect care, even if the decision made is different than what was previously documented. In addition, patients who were included in our study (those able to provide consent and participate in an interview) may be healthier or more cognitively intact than a general population of hospitalized patients. However, how this would have affected our results is unclear. Being able to speak and consent for oneself are key facilitators to communication, but sicker patients who cannot consent or speak for themselves might also be more likely to have care planning decisions made based on illness severity; documentation in these patients may be more driven by whether such notes were required because of the involvement of home health services (or skilled nursing facilities). Finally, although our study is one of the largest examinations of in‐hospital communication to date and its implications for resident education are worth noting, the sites involved in the MCHS may not be representative of nonteaching hospitals, or community‐based teaching hospitals.
Our results suggest that, although comorbid illness and socioeconomic status play an important role in determining which patients receive CDs at the time of admission, these factors are substantially less powerful than preexisting documentation practices and culture or care practices specific to their site of care. These results suggest that future work should consider organizational characteristics and culture as important targets for interventions to improve care planning in hospitalized patients.
- Committee on Care at the End of Life, Institute of Medicine.Approaching Death: Improving Care at the End of Life.Field MJ,Cassel CK, eds.Washington, DC:National Academy Press;1997.
- ,,,,,.Factors considered important at the end of life by patients, family, physicians, and other care providers.JAMA.2000;284(19):2476–2482.
- ,,,,,.In search of a good death: observations of patients, families, and providers.Ann Intern Med.2000;132(10):825–832.
- The SUPPORT Principal Investigators.A controlled trial to improve care for seriously ill hospitalized patients. The study to understand prognoses and preferences for outcomes and risks of treatments (SUPPORT).JAMA.1995;274(20):1591–1598.
- ,.Choices about cardiopulmonary resuscitation in the hospital. When do physicians talk with patients?N Engl J Med.1984;310(17):1089–1093.
- ,,, et al.Patient preferences for communication with physicians about end‐of‐life decisions. SUPPORT Investigators. Study to Understand Prognoses and Preference for Outcomes and Risks of Treatment.Ann Intern Med.1997;127(1):1–12.
- ,,,.Discussing cardiopulmonary resuscitation: a study of elderly outpatients.J Gen Intern Med.1988;3(4):317–321.
- ,,,,.Educating the elderly: cardiopulmonary resuscitation decisions before and after intervention.J Am Geriatr Soc.1991;39(4):372–377.
- ,,,.Factors influencing physicians in recommending in‐hospital cardiopulmonary resuscitation.Arch Intern Med.1993;153(17):1999–2003.
- Federal Register. 42 USC 1395‐1396. Patient Self‐Determination Act1990.
- ,,.Advance directives on admission. Clinical implications and analysis of the Patient Self‐Determination Act of 1990.JAMA.1991;266(3):402–405.
- ,,.A new doctor in the house: ethical issues in hospitalist systems.JAMA.1999;282(2):171–174.
- ,,,,,.Implementation of a hospitalist service at a community teaching hospital: improving clinical efficiency and patient outcomes.Ann Intern Med.2002;137:859–865.
- ,,, et al.Effects of hospitalist physicians on an academic general medical service: results of a randomized trial.Ann Intern Med.2002;137:866–874.
- ,.The hospitalist movement 5 years later.JAMA.2002;287(4):487–494.
- ,,,,.Reorganizing an academic medical service: impact on cost, quality, patient satisfaction, and education.JAMA.1998;279(19):1560–1565.
- ,,,,,.Physician staffing patterns and clinical outcomes in critically ill patients: a systematic review.JAMA.2002;288(17):2151–2162.
- ,,, et al.Organizational characteristics of intensive care units related to outcomes of abdominal aortic surgery.JAMA.1999;281(14):1310–1317.
- ,,, et al.Effects of inpatient experience on outcomes and costs in a multicenter trial of academic hospitalists.J Gen Intern Med.2005;20(Suppl 1):141–142.
- ,,.SF‐12: How to Score the SF‐12 Physical and Mental Health Summary Scales.2nd ed.Boston, MA:New England Medical Center, The Health Institute;1995.
- ,.End‐of‐life care in a voluntary hospitalist model: effects on communication, processes of care, and patient symptoms.Am J Med.2004;116(10):669–675.
- ,,,.Role of written advance directives in decision making: insights from qualitative and quantitative data.J Gen Intern Med.1998;13(7):439–446.
- ,,,,.Evaluating the efficiency of California providers in caring for patients with chronic illnesses.Health Aff (Millwood).2005 Jul‐Dec;Suppl Web Exclusives:W5–526–43.
- ,,, et al.Systematic implementation of an advance directive program in nursing homes: a randomized controlled trial.JAMA.2000;283(11):1437–1444.
- ,.Meeting palliative care needs in post‐acute care settings: “to help them live until they die”.JAMA.2006;295(6):681–686.
- ,,, et al.Advance directives for seriously ill hospitalized patients: effectiveness with the patient self‐determination act and the SUPPORT intervention. SUPPORT Investigators. Study to Understand Prognoses and Preferences for Outcomes and Risks of Treatment.J Am Geriatr Soc.1997;45(4):500–507.
- Institute of Medicine.Unequal Treatment: Confronting Racial and Ethnic Disparities in Health Care.Smedley BD,Stith AY,Nelson AR, eds.Washington, DC:National Academies Press;2003.
- ,,.Use of a self‐report‐generated Charlson Comorbidity Index for predicting mortality.Med Care.2005;43(6):607–615.
- ,,.Can clinical interventions change care at the end of life?Ann Intern Med.1997;126(5):381–388.
Copyright © 2008 Society of Hospital Medicine