User login
Focusing on Inattention: The Diagnostic Accuracy of Brief Measures of Inattention for Detecting Delirium
Delirium is an acute neurocognitive disorder1 that affects up to 25% of older emergency department (ED) and hospitalized patients.2-4 The relationship between delirium and adverse outcomes is well documented.5-7 Delirium is a strong predictor of increased length of mechanical ventilation, longer intensive care unit and hospital stays, increased risk of falls, long-term cognitive impairment, and mortality.8-13 Delirium is frequently missed by healthcare professionals2,14-16 and goes undetected in up to 3 out of 4 patients by bedside nurses and medical practitioners in many hospital settings.14,17-22 A significant barrier to recognizing delirium is the absence of brief delirium assessments.
In an effort to improve delirium recognition in the acute care setting, there has been a concerted effort to develop and validate brief delirium assessments. To address this unmet need, 4 ‘A’s Test (4AT), the Brief Confusion Assessment Method (bCAM), and the 3-minute diagnostic assessment for CAM-defined delirium (3D-CAM) are 1- to 3-minute delirium assessments that were validated in acutely ill older patients.23 However, 1 to 3 minutes may still be too long in busy clinical environments, and briefer (<30 seconds) delirium assessments may be needed.
One potential more-rapid method to screen for delirium is to specifically test for the presence of inattention, which is a cardinal feature of delirium.24,25 Inattention can be ascertained by having the patient recite the months backwards, recite the days of the week backwards, or spell a word backwards.26 Recent studies have evaluated the diagnostic accuracy of reciting the months of the year backwards for delirium. O’Regan et al.27 evaluated the diagnostic accuracy of the month of the year backwards from December to July (MOTYB-6) and observed that this task was 84% sensitive and 90% specific for delirium in older patients. However, they performed the reference standard delirium assessments in patients who had a positive MOTYB-6, which can overestimate sensitivity and underestimate specificity (verification bias).28 Fick et al.29 examined the diagnostic accuracy of 20 individual elements of the 3D-CAM and observed that reciting the months of the year backwards from December to January (MOTYB-12) was 83% sensitive and 69% specific for delirium. However, this was an exploratory study that was designed to identify an element of the 3D-CAM that had the best diagnostic accuracy.
To address these limitations, we sought to evaluate the diagnostic performance of the MOTYB-6 and MOTYB-12 for delirium as diagnosed by a reference standard. We also explored other brief tests of inattention such as spelling a word (“LUNCH”) backwards, reciting the days of the week backwards, 10-letter vigilance “A” task, and 5 picture recognition task.
METHODS
Study Design and Setting
This was a preplanned secondary analysis of a prospective observational study that validated 3 delirium assessments.30,31 This study was conducted at a tertiary care, academic ED. The local institutional review board (IRB) reviewed and approved this study. Informed consent from the patient or an authorized surrogate was obtained whenever possible. Because this was an observational study and posed minimal risk to the patient, the IRB granted a waiver of consent for patients who were both unable to provide consent and were without an authorized surrogate available in the ED or by phone.
Selection of Participants
We enrolled a convenience sample of patients between June 2010 and February 2012 Monday through Friday from 8
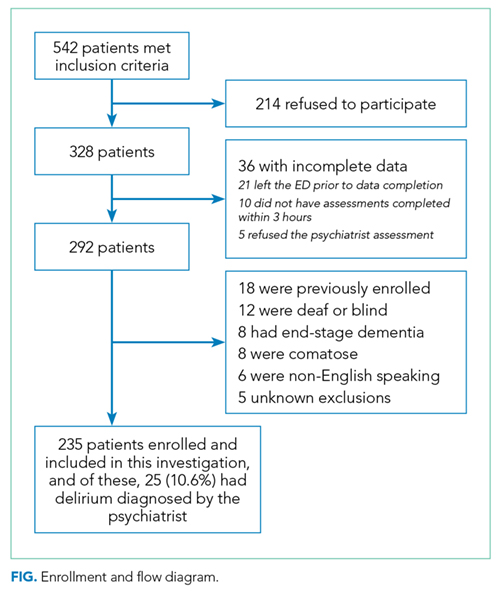
Research assistants approached patients who met inclusion criteria and determined if any exclusion criteria were present. If none of the exclusion criteria were present, then the research assistant reviewed the informed consent document with the patient or authorized surrogate if the patient was not capable of providing consent. If a patient was not capable of providing consent and no authorized surrogate was available, then the patient was enrolled (under the waiver of consent) as long as the patient assented to be a part of the study. Once the patient was enrolled, the research assistant contacted the physician rater and reference standard psychiatrists to approach the patient.
Measures of Inattention
An emergency physician (JHH) who had no formal training in the mental status assessment of elders administered a cognitive battery to the patient, including tests of inattention. The following inattention tasks were administered:
- Spell the word “LUNCH” backwards.30 Patients were initially allowed to spell the word “LUNCH” forwards. Patients who were unable to perform the task were assigned 5 errors.
- Recite the months of the year backwards from December to July.23,26,27,30,32 Patients who were unable to perform the task were assigned 6 errors.
- Recite the days of the week backwards.23,26,33 Patients who were unable to perform the task were assigned 7 errors.
- Ten-letter vigilance “A” task.34 The patient was given a series of 10 letters (“S-A-V-E-A-H-A-A-R-T”) every 3 seconds and was asked to squeeze the rater’s hand every time the patient heard the letter “A.” Patients who were unable to perform the task were assigned 10 errors.
- Five picture recognition task.34 Patients were shown 5 objects on picture cards. Afterwards, patients were shown 10 pictures with the previously shown objects intermingled. The patient had to identify which objects were seen previously in the first 5 pictures. Patients who were unable to perform the task were assigned 10 errors.
- Recite the months of the year backwards from December to January.29 Patients who were unable to perform the task were assigned 12 errors.
Reference Standard for Delirium
A comprehensive consultation-liaison psychiatrist assessment was the reference standard for delirium; the diagnosis of delirium was based on Diagnostic and Statistical Manual of Mental Disorders, Fourth Edition, Text Revision (DSM-IV-TR) criteria.35 Three psychiatrists who each had an average of 11 years of clinical experience and regularly diagnosed delirium as part of their daily clinical practice were available to perform these assessments. To arrive at the diagnosis of delirium, they interviewed those who best understood the patient’s mental status (eg, the patient’s family members or caregivers, physician, and nurses). They also reviewed the patient’s medical record and radiology and laboratory test results. They performed bedside cognitive testing that included, but was not limited to, the Mini-Mental State Examination, Clock Drawing Test, Luria hand sequencing task, and tests for verbal fluency. A focused neurological examination was also performed (ie, screening for paraphasic errors, tremors, tone, asterixis, frontal release signs, etc.), and they also evaluated the patient for affective lability, hallucinations, and level of alertness. If the presence of delirium was still questionable, then confrontational naming, proverb interpretation or similarities, and assessments for apraxias were performed at the discretion of the psychiatrist. The psychiatrists were blinded to the physician’s assessments, and the assessments were conducted within 3 hours of each other.
Additional Variables Collected
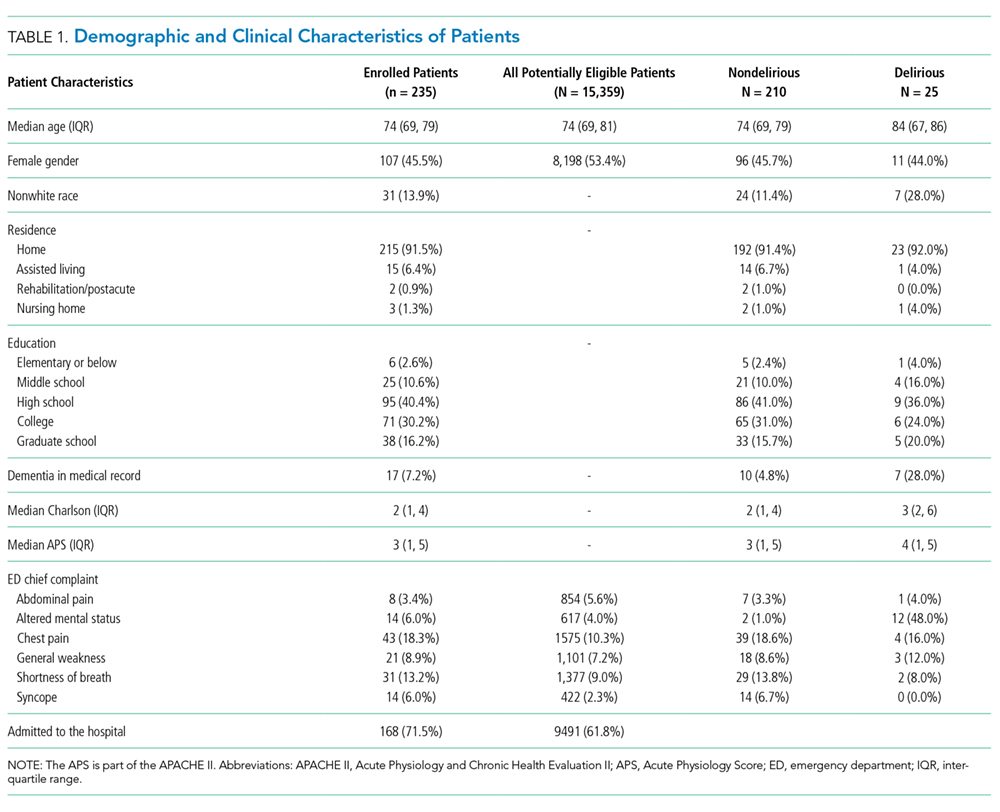
Using medical record review, comorbidity burden, severity of illness, and premorbid cognition were ascertained. The Charlson Comorbidity Index, a weighted index that takes into account the number and seriousness of 19 preexisting comorbid conditions, was used to quantify comorbidity burden; higher scores indicate higher comorbid burden.36,37 The Acute Physiology Score of the Acute Physiology and Chronic Health Evaluation II was used to quantify severity of illness.38 This score is based upon the initial values of 12 routine physiologic measurements such as vital sign and laboratory abnormalities; higher scores represent higher severities of illness.38 The medical record was reviewed to ascertain the presence of premorbid cognitive impairment; any documentation of dementia in the patient’s clinical problem list or physician history and physical examination from the outpatient or inpatient settings was considered positive. The medical record review was performed by a research assistant and was double-checked for accuracy by one of the investigators (JHH).
Data Analyses
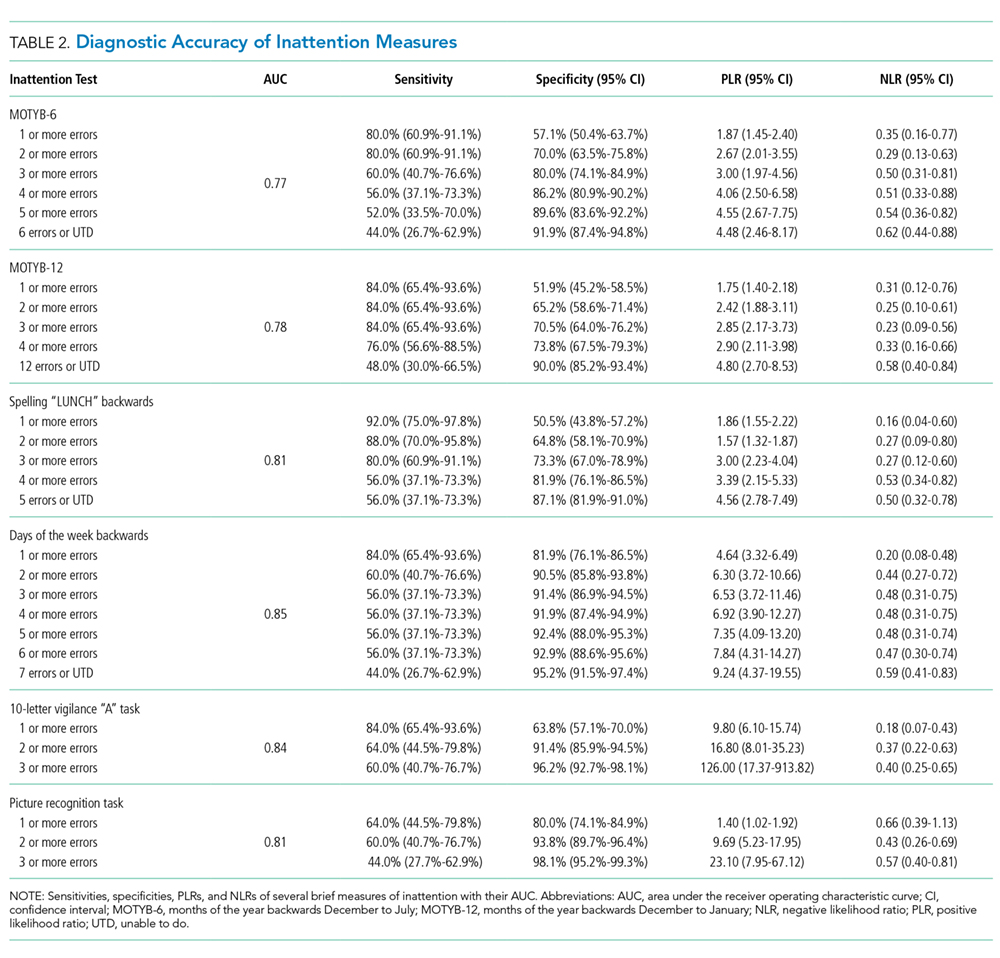
Measures of central tendency and dispersion for continuous variables were reported as medians and interquartile ranges. Categorical variables were reported as proportions. Receiver operating characteristic curves were constructed for each inattention task. Area under the receiver operating characteristic curves (AUC) was reported to provide a global measure of diagnostic accuracy. Sensitivities, specificities, positive likelihood ratios (PLRs), and negative likelihood ratios (NLRs) with their 95% CIs were calculated using the psychiatrist’s assessment as the reference standard.39 Cut-points with PLRs greater than 10 (strongly increased the likelihood of delirium) or NLRs less than 0.1 (strongly decreased the likelihood of delirium) were preferentially reported whenever possible.
All statistical analyses were performed with open source R statistical software version 3.0.1 (http://www.r-project.org/), SAS 9.4 (SAS Institute, Cary, NC), and Microsoft Excel 2010 (Microsoft Inc., Redmond, WA).
RESULTS
DISCUSSION
Delirium is frequently missed by healthcare providers because it is not routinely screened for in the acute care setting. To help address this deficiency of care, we evaluated several brief measures of inattention that take less than 30 seconds to complete. We observed that any errors made on the MOTYB-6 and MOTYB-12 tasks had very good sensitivities (80% and 84%) but were limited by their modest specificities (approximately 50%) for delirium. As a result, these assessments have limited clinical utility as standalone delirium screens. We also explored other commonly used brief measures of inattention and at a variety of error cutoffs. Reciting the days of the week backwards appeared to best balance sensitivity and specificity. None of the inattention measures could convincingly rule out delirium (NLR < 0.10), but the vigilance “A” and picture recognition tasks may have clinical utility in ruling in delirium (PLR > 10). Overall, all the inattention tasks, including MOTYB-6 and MOTYB-12, had very good diagnostic performances based upon their AUC. However, achieving a high sensitivity often had to be sacrificed for specificity or, alternatively, achieving a high specificity had to be sacrificed for sensitivity.
Inattention has been shown to be the cardinal feature for delirium,40 and its assessment using cognitive testing has been recommended to help identify the presence of delirium according to an expert consensus panel.26 The diagnostic performance of the MOTYB-12 observed in our study is similar to a study by Fick et al., who reported that MOTYB-12 had very good sensitivity (83%) but had modest specificity (69%) with a cutoff of 1 or more errors. Hendry et al. observed that the MOTYB-12 was 91% sensitive and 50% specific using a cutoff of 4 or more errors. With regard to the MOTYB-6, our reported specificity was different from what was observed by O’Regan et al.27 Using 1 or more errors as a cutoff, they observed a much higher specificity for delirium than we did (90% vs 57%). Discordant observations regarding the diagnostic accuracy for other inattention tasks also exist. We observed that making any error on the days of the week backwards task was 84% sensitive and 82% specific for delirium, whereas Fick et al. observed a sensitivity and specificity of 50% and 94%, respectively. For the vigilance “A” task, we observed that making 2 or more errors over a series of 10 letters was 64.0% sensitive and 91.4% specific for delirium, whereas Pompei et al.41 observed that making 2 or more errors over a series of 60 letters was 51% sensitive and 77% specific for delirium.
The abovementioned discordant findings may be driven by spectrum bias, wherein the sensitivities and specificities for each inattention task may differ in different subgroups. As a result, differences in the age distribution, proportion of college graduates, history of dementia, and susceptibility to delirium can influence overall sensitivity and specificity. Objective measures of delirium, including the inattention screens studied, are particularly prone to spectrum bias.31,34 However, the strength of this approach is that the assessment of inattention becomes less reliant upon clinical judgment and allows it to be used by raters from a wide range of clinical backgrounds. On the other hand, a subjective interpretation of these inattention tasks may allow the rater to capture the subtleties of inattention (ie, decreased speed of performance in a highly intelligent and well-educated patient without dementia). The disadvantage of this approach, however, is that it is more dependent on clinical judgment and may have decreased diagnostic accuracy in those with less clinical experience or with limited training.14,42,43 These factors must be carefully considered when determining which delirium assessment to use.
Additional research is required to determine the clinical utility of these brief inattention assessments. These findings need to be further validated in larger studies, and the optimal cutoff of each task for different subgroup of patients (eg, demented vs nondemented) needs to be further clarified. It is not completely clear whether these inattention tests can serve as standalone assessments. Depending on the cutoff used, some of these assessments may have unacceptable false negative or false positive rates that may lead to increased adverse patient outcomes or increased resource utilization, respectively. Additional components or assessments may be needed to improve the diagnostic accuracy of these assessments. In addition to understanding these inattention assessments’ diagnostic accuracies, their ability to predict adverse outcomes also needs to be investigated. While a previous study observed that making any error on the MOTYB-12 task was associated with increased physical restraint use and prolonged hospital length of stay,44 these assessments’ ability to prognosticate long-term outcomes such as mortality or long-term cognition or function need to be studied. Lastly, studies should also evaluate how easily implementable these assessments are and whether improved delirium recognition leads to improved patient outcomes.
This study has several notable limitations. Though planned a priori, this was a secondary analysis of a larger investigation designed to validate 3 delirium assessments. Our sample size was also relatively small, causing our 95% CIs to overlap in most cases and limiting the statistical power to truly determine whether one measure is better than the other. We also asked the patient to recite the months backwards from December to July as well as recite the months backwards from December to January. It is possible that the patient may have performed better at going from December to January because of learning effect. Our reference standard for delirium was based upon DSM-IV-TR criteria. The new DSM-V criteria may be more restrictive and may slightly change the sensitivities and specificities of the inattention tasks. We enrolled a convenience sample and enrolled patients who were more likely to be male, have cardiovascular chief complaints, and be admitted to the hospital; as a result, selection bias may have been introduced. Lastly, this study was conducted in a single center and enrolled patients who were 65 years and older. Our findings may not be generalizable to other settings and in those who are less than 65 years of age.
CONCLUSIONS
The MOTYB-6 and MOTYB-12 tasks had very good sensitivities but modest specificities (approximately 50%) using any error made as a cutoff; increasing cutoff to 2 errors and 3 errors, respectively, improved their specificities (approximately 70%) with minimal impact to their sensitivities. Reciting the days of the week backwards, spelling the word “LUNCH” backwards, and the 10-letter vigilance “A” task appeared to perform the best in ruling out delirium but only moderately decreased the likelihood of delirium. The 10-letter Vigilance “A” and picture recognition task
Disclosure
This study was funded by the Emergency Medicine Foundation Career Development Award, National Institutes of Health K23AG032355, and National Center for Research Resources, Grant UL1 RR024975-01. The authors report no financial conflicts of interest.
1. American Psychiatric Association. Diagnostic and statistical manual of mental disorders: DSM-5. Washington, DC: American Psychiatric Association; 2013.
33. Hamrick I, Hafiz R, Cummings DM. Use of days of the week in a modified mini-mental state exam (M-MMSE) for detecting geriatric cognitive impairment. J Am Board Fam Med. 2013;26(4):429-435.
Delirium is an acute neurocognitive disorder1 that affects up to 25% of older emergency department (ED) and hospitalized patients.2-4 The relationship between delirium and adverse outcomes is well documented.5-7 Delirium is a strong predictor of increased length of mechanical ventilation, longer intensive care unit and hospital stays, increased risk of falls, long-term cognitive impairment, and mortality.8-13 Delirium is frequently missed by healthcare professionals2,14-16 and goes undetected in up to 3 out of 4 patients by bedside nurses and medical practitioners in many hospital settings.14,17-22 A significant barrier to recognizing delirium is the absence of brief delirium assessments.
In an effort to improve delirium recognition in the acute care setting, there has been a concerted effort to develop and validate brief delirium assessments. To address this unmet need, 4 ‘A’s Test (4AT), the Brief Confusion Assessment Method (bCAM), and the 3-minute diagnostic assessment for CAM-defined delirium (3D-CAM) are 1- to 3-minute delirium assessments that were validated in acutely ill older patients.23 However, 1 to 3 minutes may still be too long in busy clinical environments, and briefer (<30 seconds) delirium assessments may be needed.
One potential more-rapid method to screen for delirium is to specifically test for the presence of inattention, which is a cardinal feature of delirium.24,25 Inattention can be ascertained by having the patient recite the months backwards, recite the days of the week backwards, or spell a word backwards.26 Recent studies have evaluated the diagnostic accuracy of reciting the months of the year backwards for delirium. O’Regan et al.27 evaluated the diagnostic accuracy of the month of the year backwards from December to July (MOTYB-6) and observed that this task was 84% sensitive and 90% specific for delirium in older patients. However, they performed the reference standard delirium assessments in patients who had a positive MOTYB-6, which can overestimate sensitivity and underestimate specificity (verification bias).28 Fick et al.29 examined the diagnostic accuracy of 20 individual elements of the 3D-CAM and observed that reciting the months of the year backwards from December to January (MOTYB-12) was 83% sensitive and 69% specific for delirium. However, this was an exploratory study that was designed to identify an element of the 3D-CAM that had the best diagnostic accuracy.
To address these limitations, we sought to evaluate the diagnostic performance of the MOTYB-6 and MOTYB-12 for delirium as diagnosed by a reference standard. We also explored other brief tests of inattention such as spelling a word (“LUNCH”) backwards, reciting the days of the week backwards, 10-letter vigilance “A” task, and 5 picture recognition task.
METHODS
Study Design and Setting
This was a preplanned secondary analysis of a prospective observational study that validated 3 delirium assessments.30,31 This study was conducted at a tertiary care, academic ED. The local institutional review board (IRB) reviewed and approved this study. Informed consent from the patient or an authorized surrogate was obtained whenever possible. Because this was an observational study and posed minimal risk to the patient, the IRB granted a waiver of consent for patients who were both unable to provide consent and were without an authorized surrogate available in the ED or by phone.
Selection of Participants
We enrolled a convenience sample of patients between June 2010 and February 2012 Monday through Friday from 8
Research assistants approached patients who met inclusion criteria and determined if any exclusion criteria were present. If none of the exclusion criteria were present, then the research assistant reviewed the informed consent document with the patient or authorized surrogate if the patient was not capable of providing consent. If a patient was not capable of providing consent and no authorized surrogate was available, then the patient was enrolled (under the waiver of consent) as long as the patient assented to be a part of the study. Once the patient was enrolled, the research assistant contacted the physician rater and reference standard psychiatrists to approach the patient.
Measures of Inattention
An emergency physician (JHH) who had no formal training in the mental status assessment of elders administered a cognitive battery to the patient, including tests of inattention. The following inattention tasks were administered:
- Spell the word “LUNCH” backwards.30 Patients were initially allowed to spell the word “LUNCH” forwards. Patients who were unable to perform the task were assigned 5 errors.
- Recite the months of the year backwards from December to July.23,26,27,30,32 Patients who were unable to perform the task were assigned 6 errors.
- Recite the days of the week backwards.23,26,33 Patients who were unable to perform the task were assigned 7 errors.
- Ten-letter vigilance “A” task.34 The patient was given a series of 10 letters (“S-A-V-E-A-H-A-A-R-T”) every 3 seconds and was asked to squeeze the rater’s hand every time the patient heard the letter “A.” Patients who were unable to perform the task were assigned 10 errors.
- Five picture recognition task.34 Patients were shown 5 objects on picture cards. Afterwards, patients were shown 10 pictures with the previously shown objects intermingled. The patient had to identify which objects were seen previously in the first 5 pictures. Patients who were unable to perform the task were assigned 10 errors.
- Recite the months of the year backwards from December to January.29 Patients who were unable to perform the task were assigned 12 errors.
Reference Standard for Delirium
A comprehensive consultation-liaison psychiatrist assessment was the reference standard for delirium; the diagnosis of delirium was based on Diagnostic and Statistical Manual of Mental Disorders, Fourth Edition, Text Revision (DSM-IV-TR) criteria.35 Three psychiatrists who each had an average of 11 years of clinical experience and regularly diagnosed delirium as part of their daily clinical practice were available to perform these assessments. To arrive at the diagnosis of delirium, they interviewed those who best understood the patient’s mental status (eg, the patient’s family members or caregivers, physician, and nurses). They also reviewed the patient’s medical record and radiology and laboratory test results. They performed bedside cognitive testing that included, but was not limited to, the Mini-Mental State Examination, Clock Drawing Test, Luria hand sequencing task, and tests for verbal fluency. A focused neurological examination was also performed (ie, screening for paraphasic errors, tremors, tone, asterixis, frontal release signs, etc.), and they also evaluated the patient for affective lability, hallucinations, and level of alertness. If the presence of delirium was still questionable, then confrontational naming, proverb interpretation or similarities, and assessments for apraxias were performed at the discretion of the psychiatrist. The psychiatrists were blinded to the physician’s assessments, and the assessments were conducted within 3 hours of each other.
Additional Variables Collected
Using medical record review, comorbidity burden, severity of illness, and premorbid cognition were ascertained. The Charlson Comorbidity Index, a weighted index that takes into account the number and seriousness of 19 preexisting comorbid conditions, was used to quantify comorbidity burden; higher scores indicate higher comorbid burden.36,37 The Acute Physiology Score of the Acute Physiology and Chronic Health Evaluation II was used to quantify severity of illness.38 This score is based upon the initial values of 12 routine physiologic measurements such as vital sign and laboratory abnormalities; higher scores represent higher severities of illness.38 The medical record was reviewed to ascertain the presence of premorbid cognitive impairment; any documentation of dementia in the patient’s clinical problem list or physician history and physical examination from the outpatient or inpatient settings was considered positive. The medical record review was performed by a research assistant and was double-checked for accuracy by one of the investigators (JHH).
Data Analyses
Measures of central tendency and dispersion for continuous variables were reported as medians and interquartile ranges. Categorical variables were reported as proportions. Receiver operating characteristic curves were constructed for each inattention task. Area under the receiver operating characteristic curves (AUC) was reported to provide a global measure of diagnostic accuracy. Sensitivities, specificities, positive likelihood ratios (PLRs), and negative likelihood ratios (NLRs) with their 95% CIs were calculated using the psychiatrist’s assessment as the reference standard.39 Cut-points with PLRs greater than 10 (strongly increased the likelihood of delirium) or NLRs less than 0.1 (strongly decreased the likelihood of delirium) were preferentially reported whenever possible.
All statistical analyses were performed with open source R statistical software version 3.0.1 (http://www.r-project.org/), SAS 9.4 (SAS Institute, Cary, NC), and Microsoft Excel 2010 (Microsoft Inc., Redmond, WA).
RESULTS
DISCUSSION
Delirium is frequently missed by healthcare providers because it is not routinely screened for in the acute care setting. To help address this deficiency of care, we evaluated several brief measures of inattention that take less than 30 seconds to complete. We observed that any errors made on the MOTYB-6 and MOTYB-12 tasks had very good sensitivities (80% and 84%) but were limited by their modest specificities (approximately 50%) for delirium. As a result, these assessments have limited clinical utility as standalone delirium screens. We also explored other commonly used brief measures of inattention and at a variety of error cutoffs. Reciting the days of the week backwards appeared to best balance sensitivity and specificity. None of the inattention measures could convincingly rule out delirium (NLR < 0.10), but the vigilance “A” and picture recognition tasks may have clinical utility in ruling in delirium (PLR > 10). Overall, all the inattention tasks, including MOTYB-6 and MOTYB-12, had very good diagnostic performances based upon their AUC. However, achieving a high sensitivity often had to be sacrificed for specificity or, alternatively, achieving a high specificity had to be sacrificed for sensitivity.
Inattention has been shown to be the cardinal feature for delirium,40 and its assessment using cognitive testing has been recommended to help identify the presence of delirium according to an expert consensus panel.26 The diagnostic performance of the MOTYB-12 observed in our study is similar to a study by Fick et al., who reported that MOTYB-12 had very good sensitivity (83%) but had modest specificity (69%) with a cutoff of 1 or more errors. Hendry et al. observed that the MOTYB-12 was 91% sensitive and 50% specific using a cutoff of 4 or more errors. With regard to the MOTYB-6, our reported specificity was different from what was observed by O’Regan et al.27 Using 1 or more errors as a cutoff, they observed a much higher specificity for delirium than we did (90% vs 57%). Discordant observations regarding the diagnostic accuracy for other inattention tasks also exist. We observed that making any error on the days of the week backwards task was 84% sensitive and 82% specific for delirium, whereas Fick et al. observed a sensitivity and specificity of 50% and 94%, respectively. For the vigilance “A” task, we observed that making 2 or more errors over a series of 10 letters was 64.0% sensitive and 91.4% specific for delirium, whereas Pompei et al.41 observed that making 2 or more errors over a series of 60 letters was 51% sensitive and 77% specific for delirium.
The abovementioned discordant findings may be driven by spectrum bias, wherein the sensitivities and specificities for each inattention task may differ in different subgroups. As a result, differences in the age distribution, proportion of college graduates, history of dementia, and susceptibility to delirium can influence overall sensitivity and specificity. Objective measures of delirium, including the inattention screens studied, are particularly prone to spectrum bias.31,34 However, the strength of this approach is that the assessment of inattention becomes less reliant upon clinical judgment and allows it to be used by raters from a wide range of clinical backgrounds. On the other hand, a subjective interpretation of these inattention tasks may allow the rater to capture the subtleties of inattention (ie, decreased speed of performance in a highly intelligent and well-educated patient without dementia). The disadvantage of this approach, however, is that it is more dependent on clinical judgment and may have decreased diagnostic accuracy in those with less clinical experience or with limited training.14,42,43 These factors must be carefully considered when determining which delirium assessment to use.
Additional research is required to determine the clinical utility of these brief inattention assessments. These findings need to be further validated in larger studies, and the optimal cutoff of each task for different subgroup of patients (eg, demented vs nondemented) needs to be further clarified. It is not completely clear whether these inattention tests can serve as standalone assessments. Depending on the cutoff used, some of these assessments may have unacceptable false negative or false positive rates that may lead to increased adverse patient outcomes or increased resource utilization, respectively. Additional components or assessments may be needed to improve the diagnostic accuracy of these assessments. In addition to understanding these inattention assessments’ diagnostic accuracies, their ability to predict adverse outcomes also needs to be investigated. While a previous study observed that making any error on the MOTYB-12 task was associated with increased physical restraint use and prolonged hospital length of stay,44 these assessments’ ability to prognosticate long-term outcomes such as mortality or long-term cognition or function need to be studied. Lastly, studies should also evaluate how easily implementable these assessments are and whether improved delirium recognition leads to improved patient outcomes.
This study has several notable limitations. Though planned a priori, this was a secondary analysis of a larger investigation designed to validate 3 delirium assessments. Our sample size was also relatively small, causing our 95% CIs to overlap in most cases and limiting the statistical power to truly determine whether one measure is better than the other. We also asked the patient to recite the months backwards from December to July as well as recite the months backwards from December to January. It is possible that the patient may have performed better at going from December to January because of learning effect. Our reference standard for delirium was based upon DSM-IV-TR criteria. The new DSM-V criteria may be more restrictive and may slightly change the sensitivities and specificities of the inattention tasks. We enrolled a convenience sample and enrolled patients who were more likely to be male, have cardiovascular chief complaints, and be admitted to the hospital; as a result, selection bias may have been introduced. Lastly, this study was conducted in a single center and enrolled patients who were 65 years and older. Our findings may not be generalizable to other settings and in those who are less than 65 years of age.
CONCLUSIONS
The MOTYB-6 and MOTYB-12 tasks had very good sensitivities but modest specificities (approximately 50%) using any error made as a cutoff; increasing cutoff to 2 errors and 3 errors, respectively, improved their specificities (approximately 70%) with minimal impact to their sensitivities. Reciting the days of the week backwards, spelling the word “LUNCH” backwards, and the 10-letter vigilance “A” task appeared to perform the best in ruling out delirium but only moderately decreased the likelihood of delirium. The 10-letter Vigilance “A” and picture recognition task
Disclosure
This study was funded by the Emergency Medicine Foundation Career Development Award, National Institutes of Health K23AG032355, and National Center for Research Resources, Grant UL1 RR024975-01. The authors report no financial conflicts of interest.
1. American Psychiatric Association. Diagnostic and statistical manual of mental disorders: DSM-5. Washington, DC: American Psychiatric Association; 2013.
33. Hamrick I, Hafiz R, Cummings DM. Use of days of the week in a modified mini-mental state exam (M-MMSE) for detecting geriatric cognitive impairment. J Am Board Fam Med. 2013;26(4):429-435.
© 2018 Society of Hospital Medicine
Low Health Literacy Is Associated with Increased Transitional Care Needs in Hospitalized Patients
A special concern since the institution of hospital readmission penalties1 is the transitions in care of a patient from one care setting to another, often at hospital discharge. Burke et al.2 proposed a framework for an ideal transition in care (ITC) to study and improve transitions from the hospital to home. The features in the ITC were identified based upon their inclusion in the interventions that improved discharge outcomes.3-5 Inspired by the ITC and other patient risk tools,6 we identified 10 domains of transitional care needs ([TCN] specified below), which we define as patient-centered risk factors that should be addressed to foster a safe and effective transition in care.7
One particularly important risk factor in patient self-management at transition points is health literacy, a patient’s ability to obtain, understand, and use basic health information and services. Low health literacy affects approximately 26% to 36% of adults in the United States.8,9 Health literacy is associated with many factors that may affect successful navigation of care transitions, including doctor-patient communication,10,11 understanding of the medication regimen,12 and self-management.13-15 Research has also demonstrated an association between low health literacy and poor outcomes after hospital discharge, including medication errors,16 30-day hospital readmission,17 and mortality.18 Transitional care initiatives have begun to incorporate health literacy into patient risk assessments6 and provide specific attention to low health literacy in interventions to reduce adverse drug events and readmission.4,19 Training programs for medical students and nurses advise teaching skills in health literacy as part of fostering effective transitions in care.20,21
Although low health literacy is generally recognized as a barrier to patient education and self-management, little is known about whether patients with low health literacy are more likely to have other risk factors that could further increase their risk for poor transitions in care. A better understanding of associated risks would inform and improve patient care. We hypothesized that TCNs are more common among patients with low health literacy, as compared with those with adequate health literacy. We also aimed to describe the relationship between low health literacy and specific TCNs in order to guide clinical care and future interventions.
METHODS
Setting
The present study is a cross-sectional analysis of data from a quality improvement (QI) intervention that was performed at Vanderbilt University Medical Center, a tertiary care facility in Nashville, Tennessee. The QI intervention, My Health Team (MHT), was funded by the Centers for Medicare and Medicaid Services Innovation Award program. The overall MHT program included outpatient care coordination for chronic disease management as well as a transitional care program that was designed to reduce hospital readmission. The latter included an inpatient needs assessment (which provided data for the present analysis), inpatient intervention, and postdischarge phone follow-up. The MHT initiative was reviewed by the institutional review board (IRB), which deemed it a QI program and granted a waiver of informed consent. The present secondary data analysis was reviewed and approved by the IRB.
Sample
Patients were identified for inclusion in the MHT transitions of care program if the presenting problem for hospital admission was pneumonia, chronic obstructive pulmonary disease (COPD) exacerbation, or decompensated heart failure, as determined by the review of clinical documentation by nurse transition care coordinators (TCCs). Adults over the age of 18 years were eligible, though priority was given to patients aged 65 years or older. This study includes the first inpatient encounter between June 2013 and December 31, 2014, for patients having a completed needs assessment and documentation of health literacy data in the medical record.
Data Collection
TCN assessment was developed from published patient risk tools and the ITC framework.2,6,22 The assessment has 10 domains composed of 49 individual items as follows: (1) caregiver support (caregiver support not sufficient for patient needs), (2) transportation (relies on public or others for transportation and misses medical care because of transportation), (3) health care utilization (no primary care physician, unplanned hospitalization in the last year, emergency department [ED] visit in the last 6 months, or home health services in the last 60 days), (4) high-risk medical comorbidities (malnutrition or body mass index <18.5, renal failure, chronic pain, diabetes, heart failure, COPD, or stroke), (5) medication management provider or caregiver concern (cannot provide medication list, >10 preadmission medications, high-risk medications [eg, insulin, warfarin], poor medication understanding, or adherence issue identified), (6) medical devices (vascular access, urinary catheter, wounds, or home supplemental oxygen), (7) functional status (weakness of extremities, limited extremity range of motion, difficulty with mobility, falls at home, or activities of daily living challenges), (8) mental health comorbidities (over the past month has felt down, depressed, or hopeless or over the past month has felt little interest or pleasure in doing things, high-risk alcohol use, or high-risk substance use), (9) communication (limited English proficiency or at risk for limited health literacy), and (10) financial resources (no health insurance, skips or rations medicines because of cost, misses medical care because of cost, or misses medical care because of job).
The 49 items of the TCN assessment were documented as being present or absent by nurse TCCs at the time patients were enrolled in the transitional care program, based on patient and family interview and chart review, and the items were later extracted for analysis. Patients were determined to have a domain-level need if they reported a need on any individual item within that domain, resulting in a binary score (any need present, absent) for each of the 10 TCN domains.
Health literacy was assessed by using the Brief Health Literacy Screen (BHLS), which is administered routinely by nurses at hospital intake and documented in the medical record, with completion rates of approximately 90%.23 The BHLS is a 3-question subjective health literacy assessment (scoring range 3-15) that has been validated against longer objective measures24 and shown to predict disease control and mortality.18,25 To improve the stability of scores (for patients who completed the BHLS more than once because of repeat hospitalizations) and to reduce missing values, we calculated the patient’s mean BHLS score for assessments obtained between January 1, 2013, and December 31, 2014. Patients were then categorized as having inadequate health literacy (BHLS ≤ 9) or adequate health literacy (BHLS > 9).18,25 Demographic information was extracted from patient records and included age, sex (male/female), marital status (married/without a partner), race (white/nonwhite), and years of education. Income level and primary language were not available for analysis.
Statistical Analysis
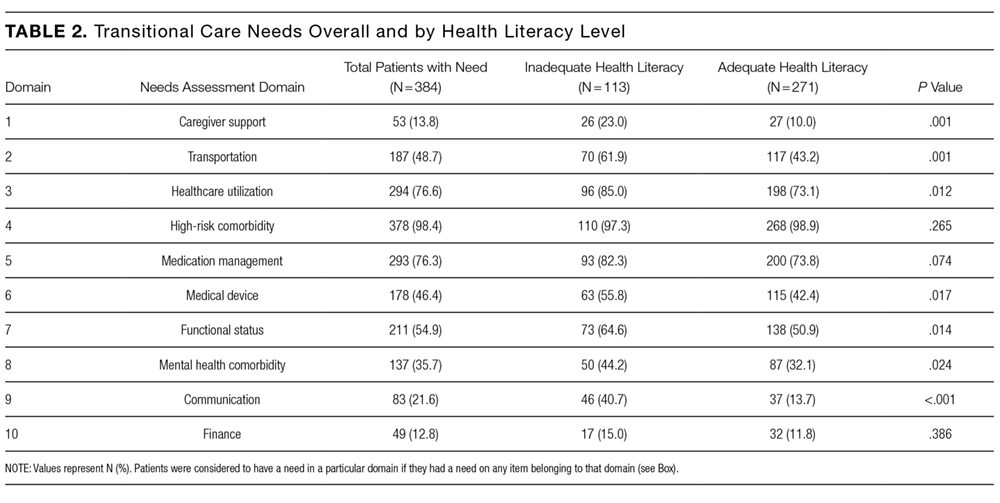
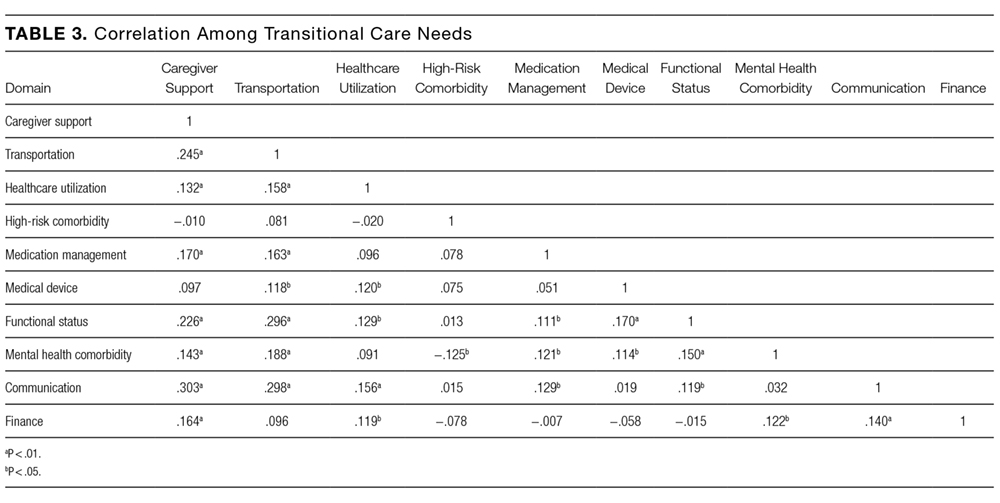
Patient characteristics and TCNs were summarized by using the frequency and percentages for categorical variables and the mean and standard deviation (SD) for continuous variables. We compared patient characteristics (age, sex, marital status, race, and education) between health literacy groups (inadequate vs adequate) by using χ2 or analysis of variance as appropriate. We assessed Pearson correlations among the 10 TCN domains, and we examined differences in reported needs for each of 10 TCN domains by the level of health literacy by using the χ2 test. Because the TCN domain of communication included low health literacy as one of its items, we excluded this domain from subsequent analyses. We then compared differences in the number of TCNs documented (scoring range 0-9) by using an independent samples Student t test.
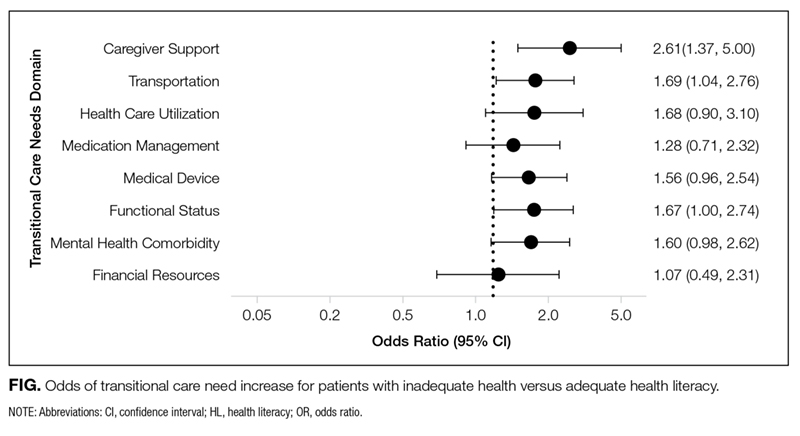
Multivariate logistic regression models were then constructed to examine the independent association of inadequate health literacy with 8 TCN domains while controlling for age, sex, marital status, race, and education. Patients with incomplete demographic data were excluded from these models. Additionally, these analyses excluded 2 TCN domains: the communication domain for reasons noted above and the high-risk medical comorbidity domain because it ended up being positive in 98.4% of patients. Statistical significance was set at an alpha of 0.05. All analyses were performed by using SPSS Statistics for Mac, version 23.0 (IBM Corp., Armonk, New York)
RESULTS

Older age was independently associated with more needs related to medical devices (OR, 1.02; 95% CI, 1.00-1.04), functional status (OR, 1.03; 95% CI, 1.02-1.05), and fewer financial needs (OR, 0.93; 95% CI, 0.91-0.96). Being married or living with a partner was associated with fewer needs related to caregiver support (OR, 0.37; 95% CI, 0.19-0.75) and more device-related needs (OR, 1.60; 95% CI, 1.03-2.49). A higher level of education was associated with fewer transportation needs (OR, 0.89; 95% CI, 0.82-0.97).
DISCUSSION
A structured patient risk factor assessment derived from literature was used to record TCNs in preparation for hospital discharge. On average, patients had needs in about half of the TCN domains (4.6 of 9). The most common areas identified were related to the presence of high-risk comorbidities (98.4%), frequent or prior healthcare utilization (76.6%), medication management (76.3%), functional status (54.9%), and transportation (48.7%). Many of the TCNs were significantly correlated with one another. The prevalence of these needs highlights the importance of using a structured assessment to identify patient concerns so that they may be addressed through discharge planning and follow-up. In addition, using a standardized TCN instrument based on a framework for ITC promotes further research in understanding patient needs and in developing personalized interventions to address them.
As hypothesized, we found that TCNs were more common in patients with inadequate health literacy. After adjustment for demographic factors, inadequate health literacy was significantly associated with transportation barriers and inadequate caregiver support. Analyses also suggested a relationship with needs related to medical devices, functional status, and mental health comorbidities. A review of the literature substantiates a link between inadequate health literacy and these needs and also suggests solutions to address these barriers.
The association with inadequate caregiver support is concerning because there is often a high degree of reliance on caregivers at transitions in care.3-5 Caregivers are routinely called upon to provide assistance with activities that may be difficult for patients with low health literacy, including medication adherence, provider communication, and self-care activities.26,27 Our finding that patients with inadequate health literacy are more likely to have inadequate caregiver support indicates additional vulnerability. This may be because of the absence of a caregiver, or in many cases, the presence of a caregiver who is underprepared to assist with care. Prior research has shown that when caregivers are present, up to 33% have low health literacy, even when they are paid nonfamilial caregivers.26,28 Other studies have noted the inadequacy of information and patient training for caregivers.29,30 Transitional care programs to improve caregiver understanding have been developed31 and have been demonstrated to lower rehospitalization and ED visits.32
Patients with inadequate health literacy were also more likely to have transportation barriers. Lack of transportation has been recorded as a factor in early hospital readmission in patients with chronic disease,33 and it has been shown to have a negative effect on a variety of health outcomes.34 A likely link between readmission and lack of transportation is poor follow-up care. Wheeler et al.35 found that 59% of patients expected difficulty keeping postdischarge appointments because of transportation needs. Instead of expecting patients to navigate their own transportation, the Agency for Healthcare Research and Quality recommends identifying community resources for patients with low health literacy.36
In this sample, inadequate health literacy also had near significant associations with TCNs in the use of medical devices, lower functional status, and mental health comorbidities. The use of a medical device, such as home oxygen, is a risk factor for readmission,37 and early reports suggest that interventions, including education related to home oxygen use, can dramatically reduce these readmissions.38 Lower functional capacity and faster functional decline are associated with inadequate health literacy,39 which may have to do with the inability to appropriately utilize health resources.40 If so, structured discharge planning could alleviate the known connection between functional impairment and hospital readmissions.41 A relationship between low health literacy and depression has been demonstrated repeatedly,42 with worsened symptoms in those with addiction.43 As has been shown in other domains where health literacy is a factor, literacy-focused interventions provide greater benefits to these depressed patients.44
The TCN assessment worked well overall, but certain domains proved less valuable and could be removed in the future. First, it was not useful to separately identify communication barriers, because doing so did not add to information beyond the measurement of health literacy. Second, high-risk comorbidities were ubiquitous within the sample and therefore unhelpful for group comparisons. In hindsight, this is unsurprising because the sample was comprised primarily of elderly patients admitted to medical services. Still, in a younger population or a surgical setting, identifying patients with high-risk medical comorbidities may be more useful.
We acknowledge several limitations of this study. First, the study was performed at a single center, and the TCN assessments were conducted by a small number of registered nurses who received training. Therefore, the results may not generalize to the profile of patient needs at other settings, and the instrument may perform differently when scaled across an organization. Second, the needs assessment was developed for this QI initiative and did not undergo formal validation, although it was developed from published frameworks and similar assessments. Third, for the measure of health literacy, we relied on data collected by nurses as part of their normal workflow. As is often the case with data collected during routine care, the scores are imperfect,45 but they have proven to be a valuable and valid indicator of health literacy in our previous research.18,24,25,46 Fourth, we chose to declare a domain as positive if any item in that domain was positive and to perform a domain-level analysis (for greater clarity). We did not take into account the variable number of items within each domain or attempt to grade their severity, as this would be a subjective exercise and impractical in the discharge planning process. Finally, we were unable to address associations among socioeconomic status,47 primary language,48 and health literacy, because relevant data were not available for this analysis.
CONCLUSION
In this sample of hospitalized patients who were administered a structured needs assessment, patients commonly had needs that placed them at a higher risk of adverse outcomes, such as hospital readmission. Patients with low health literacy had more TCNs that extended beyond the areas that we normally associate with low health literacy, namely patient education and self-management. Healthcare professionals should be aware of the greater likelihood of transportation barriers and inadequate caregiver support among patients with low health literacy. Screening for health literacy and TCN at admission or as part of the discharge planning process will elevate such risks, better positioning clinicians and hospitals to address them as a part of the efforts to ensure a quality transition of care.
Disclosure
This work was funded by the Centers for Medicare and Medicaid Services (1C1CMS330979) and in part by the National Center for Advancing Translational Sciences (2 UL1 TR000445-06). The content is solely the responsibility of the authors and does not necessarily represent official views of the funding agencies, which did not participate in the planning, collection, analysis, or interpretation of data or in the decision to submit for publication.
Dr. Dittus reports personal fees as a board member of the Robert Wood Johnson Foundation Medical Faculty Scholars Program National Advisory Committee; consultancy fees from the University of Virginia, Indiana University, University of Michigan, Northwestern University, Montana State University, and Purdue University; has grants/grants pending from NIH (research grants), PCORI (research grant), CME (innovation award), VA (training grant); payment for lectures including service on speakers bureaus from Corporate Parity (conference organizer) for the Global Hospital Management & Innovation Summit; and other from Medical Decision Making, Inc. (passive owner); all outside the submitted work. Dr. Kripalani has grants from NIH (research grant), PCORI (research grant), and CMS (QI grant); outside the submitted work. All other authors have nothing to disclose.
1. Rau J. Medicare to penalize 2,211 hospitals for excess readmissions. Kaiser Heal News. 2012;13(6):48-49.
2. Burke RE, Kripalani S, Vasilevskis EE, Schnipper JL. Moving beyond readmission penalties: creating an ideal process to improve transitional care. J Hosp Med. 2013;8(2):102-109. PubMed
3. Naylor MD, Brooten D, Campbell R, et al. Comprehensive discharge planning and home follow-up of hospitalized elders. JAMA. 1999;281(7):613-620. PubMed
4. Jack BW, Chetty VK, Anthony D, et al. A reengineered hospital discharge program to decrease rehospitalization. Ann Intern Med. 2009;150(3):178-187. PubMed
5. Coleman EA, Parry C, Chalmers S, Min S. The Care Transitions Intervention. Arch Intern Med. 2006;166(17):1822-1828. PubMed
6. Hansen LO, Greenwald JL, Budnitz T, et al. Project BOOST: effectiveness of a multihospital effort to reduce rehospitalization. J Hosp Med. 2013;8(8):421-427. PubMed
7. Hatch M, Bruce P, Mansolino A, Kripalani S. Transition care coordinators deliver personalized approach. Readmissions News. 2014;3(9):1-4.
8. Paasche-Orlow MK, Parker RM, Gazmararian JA, Nielsen-Bohlman LT, Rudd RR. The prevalence of limited health literacy. J Gen Intern Med. 2005;20(2):175-184. PubMed
9. Kutner M, Greenburg E, Jin Y, et al. The Health Literacy of America’s Adults: Results from the 2003 National Assessment of Adult Literacy. NCES 2006-483. Natl Cent Educ Stat. 2006;6:1-59.
10. Kripalani S, Jacobson TA, Mugalla IC, Cawthon CR, Niesner KJ, Vaccarino V. Health literacy and the quality of physician-patient communication during hospitalization. J Hosp Med. 2010;5(5):269-275. PubMed
11. Goggins KM, Wallston KA., Nwosu S, et al. Health literacy, numeracy, and other characteristics associated with hospitalized patients’ preferences for involvement in decision making. J Health Commun. 2014;19(sup2):29-43. PubMed
12. Marvanova M, Roumie CL, Eden SK, Cawthon C, Schnipper JL, Kripalani S. Health literacy and medication understanding among hospitalized adults. J Hosp Med. 2011;6(9):488-493. PubMed
13. Evangelista LS, Rasmusson KD, Laramee AS, et al. Health literacy and the patient with heart failure—implications for patient care and research: a consensus statement of the Heart Failure Society of America. J Card Fail. 2010;16(1):9-16. PubMed
14. Lindquist LA, Go L, Fleisher J, Jain N, Friesema E, Baker DW. Relationship of health literacy to intentional and unintentional non-adherence of hospital discharge medications. J Gen Intern Med. 2012;27(2):173-178. PubMed
15. Coleman EA, Chugh A, Williams MV, et al. Understanding and execution of discharge instructions. Am J Med Qual. 2013;28(5):383-391. PubMed
16. Mixon AS, Myers AP, Leak CL, et al. Characteristics associated with postdischarge medication errors. Mayo Clin Proc. 2014;89(8):1042-1051. PubMed
17. Mitchell SE, Sadikova E, Jack BW, Paasche-Orlow MK. Health literacy and 30-day postdischarge hospital utilization. J Health Commun. 2012;17(sup3):325-338. PubMed
18. McNaughton CD, Cawthon C, Kripalani S, Liu D, Storrow AB, Roumie CL. Health literacy and mortality: a cohort study of patients hospitalized for acute heart failure. J Am Heart Assoc. 2015;4(5):e001799. PubMed
19. Kripalani S, Roumie CL, Dalal AK, et al. Effect of a pharmacist intervention on clinically important medication errors after hospital discharge: a randomized trial. Ann Intern Med. 2012;157(1):1-10. PubMed
20. Polster D. Patient discharge information: Tools for success. Nursing (Lond). 2015;45(5):42-49. PubMed
21. Bradley SM, Chang D, Fallar R, Karani R. A patient safety and transitions of care curriculum for third-year medical students. Gerontol Geriatr Educ. 2015;36(1):45-57. PubMed
22. Kripalani S, Theobald CN, Anctil B, Vasilevskis EE. Reducing hospital readmission rates: current strategies and future directions. Annu Rev Med. 2014;65:471-485. PubMed
23. Cawthon C, Mion LC, Willens DE, Roumie CL, Kripalani S. Implementing routine health literacy assessment in hospital and primary care patients. Jt Comm J Qual Patient Saf. 2014;40(2):68-76. PubMed
24. Wallston KA, Cawthon C, McNaughton CD, Rothman RL, Osborn CY, Kripalani S. Psychometric properties of the brief health literacy screen in clinical practice. J Gen Intern Med. 2013:1-8. PubMed
25. McNaughton CD, Kripalani S, Cawthon C, Mion LC, Wallston KA, Roumie CL. Association of health literacy with elevated blood pressure: a cohort study of hospitalized patients. Med Care. 2014;52(4):346-353. PubMed
26. Garcia CH, Espinoza SE, Lichtenstein M, Hazuda HP. Health literacy associations between Hispanic elderly patients and their caregivers. J Health Commun. 2013;18 Suppl 1:256-272. PubMed
27. Levin JB, Peterson PN, Dolansky MA, Boxer RS. Health literacy and heart failure management in patient-caregiver dyads. J Card Fail. 2014;20(10):755-761. PubMed
28. Lindquist LA, Jain N, Tam K, Martin GJ, Baker DW. Inadequate health literacy among paid caregivers of seniors. J Gen Intern Med. 2011;26(5):474-479. PubMed
29. Graham CL, Ivey SL, Neuhauser L. From hospital to home: assessing the transitional care needs of vulnerable seniors. Gerontologist. 2009;49(1):23-33. PubMed
30. Foust JB, Vuckovic N, Henriquez E. Hospital to home health care transition: patient, caregiver, and clinician perspectives. West J Nurs Res. 2012;34(2):194-212. PubMed
31. Hahn-Goldberg S, Okrainec K, Huynh T, Zahr N, Abrams H. Co-creating patient-oriented discharge instructions with patients, caregivers, and healthcare providers. J Hosp Med. 2015;10(12):804-807. PubMed
32. Hendrix C, Tepfer S, Forest S, et al. Transitional care partners: a hospital-to-home support for older adults and their caregivers. J Am Assoc Nurse Pract. 2013;25(8):407-414. PubMed
33. Rubin DJ, Donnell-Jackson K, Jhingan R, Golden SH, Paranjape A. Early readmission among patients with diabetes: a qualitative assessment of contributing factors. J Diabetes Complications. 2014;28(6):869-873. PubMed
34. Syed ST, Gerber BS, Sharp LK. Traveling towards disease: transportation barriers to health care access. J Community Health. 2013;38(5):976-993. PubMed
35. Wheeler K, Crawford R, McAdams D, et al. Inpatient to outpatient transfer of diabetes care: perceptions of barriers to postdischarge followup in urban African American patients. Ethn Dis. 2007;17(2):238-243. PubMed
36. Brega A, Barnard J, Mabachi N, et al. AHRQ Health Literacy Universal Precautions Toolkit, Second Edition. Rockville: Agency for Healthcare Research and Qualiy; 2015. https://www.ahrq.gov/professionals/quality-patient-safety/quality-resources/tools/literacy-toolkit/index.html. Accessed August 21, 2017.
37. Sharif R, Parekh TM, Pierson KS, Kuo YF, Sharma G. Predictors of early readmission among patients 40 to 64 years of age hospitalized for chronic obstructive pulmonary disease. Ann Am Thorac Soc. 2014;11(5):685-694. PubMed
38. Carlin B, Wiles K, Easley D, Dskonerwpahsorg DS, Prenner B. Transition of care and rehospitalization rates for patients who require home oxygen therapy following hospitalization. Eur Respir J. 2012;40(Suppl 56):P617.
39. Wolf MS, Gazmararian JA, Baker DW. Health literacy and functional health status among older adults. Arch Intern Med. 2005;165(17):1946-1952. PubMed
40. Smith SG, O’Conor R, Curtis LM, et al. Low health literacy predicts decline in physical function among older adults: findings from the LitCog cohort study. J Epidemiol Community Health. 2015;69(5):474-480. PubMed
41. Greysen SR, Stijacic Cenzer I, Auerbach AD, Covinsky KE. Functional impairment and hospital readmission in medicare seniors. JAMA Intern Med. 2015;175(4):559-565. PubMed
42. Berkman ND, Sheridan SL, Donahue KE, et al. Health literacy interventions and outcomes: an updated systematic review. Evid Rep Technol Assess (Full Rep). 2011;199:1-941. PubMed
43. Lincoln A, Paasche-Orlow M, Cheng D, et al. Impact of health literacy on depressive symptoms and mental health-related quality of life among adults with addiction. J Gen Intern Med. 2006;21(8):818-822. PubMed
44. Weiss BD, Francis L, Senf JH, et al. Literacy education as treatment for depression in patients with limited literacy and depression: a randomized controlled trial. J Gen Intern Med. 2006;21(8):823-828. PubMed
45. Goggins K, Wallston KA, Mion L, Cawthon C, Kripalani S. What patient characteristics influence nurses’ assessment of health literacy? J Health Commun. 2016;21(sup2):105-108. PubMed
46. Scarpato KR, Kappa SF, Goggins KM, et al. The impact of health literacy on surgical outcomes following radical cystectomy. J Health Commun. 2016;21(sup2):99-104.
PubMed
47. Sudore RL, Mehta KM, Simonsick EM, et al. Limited literacy in older people and disparities in health and healthcare access. J Am Geriatr Soc. 2006;54(5):770-776. PubMed
48. Jacobson HE, Hund L, Mas FS. Predictors of English health literacy among US Hispanic immigrants: the importance of language, bilingualism and sociolinguistic environment
A special concern since the institution of hospital readmission penalties1 is the transitions in care of a patient from one care setting to another, often at hospital discharge. Burke et al.2 proposed a framework for an ideal transition in care (ITC) to study and improve transitions from the hospital to home. The features in the ITC were identified based upon their inclusion in the interventions that improved discharge outcomes.3-5 Inspired by the ITC and other patient risk tools,6 we identified 10 domains of transitional care needs ([TCN] specified below), which we define as patient-centered risk factors that should be addressed to foster a safe and effective transition in care.7
One particularly important risk factor in patient self-management at transition points is health literacy, a patient’s ability to obtain, understand, and use basic health information and services. Low health literacy affects approximately 26% to 36% of adults in the United States.8,9 Health literacy is associated with many factors that may affect successful navigation of care transitions, including doctor-patient communication,10,11 understanding of the medication regimen,12 and self-management.13-15 Research has also demonstrated an association between low health literacy and poor outcomes after hospital discharge, including medication errors,16 30-day hospital readmission,17 and mortality.18 Transitional care initiatives have begun to incorporate health literacy into patient risk assessments6 and provide specific attention to low health literacy in interventions to reduce adverse drug events and readmission.4,19 Training programs for medical students and nurses advise teaching skills in health literacy as part of fostering effective transitions in care.20,21
Although low health literacy is generally recognized as a barrier to patient education and self-management, little is known about whether patients with low health literacy are more likely to have other risk factors that could further increase their risk for poor transitions in care. A better understanding of associated risks would inform and improve patient care. We hypothesized that TCNs are more common among patients with low health literacy, as compared with those with adequate health literacy. We also aimed to describe the relationship between low health literacy and specific TCNs in order to guide clinical care and future interventions.
METHODS
Setting
The present study is a cross-sectional analysis of data from a quality improvement (QI) intervention that was performed at Vanderbilt University Medical Center, a tertiary care facility in Nashville, Tennessee. The QI intervention, My Health Team (MHT), was funded by the Centers for Medicare and Medicaid Services Innovation Award program. The overall MHT program included outpatient care coordination for chronic disease management as well as a transitional care program that was designed to reduce hospital readmission. The latter included an inpatient needs assessment (which provided data for the present analysis), inpatient intervention, and postdischarge phone follow-up. The MHT initiative was reviewed by the institutional review board (IRB), which deemed it a QI program and granted a waiver of informed consent. The present secondary data analysis was reviewed and approved by the IRB.
Sample
Patients were identified for inclusion in the MHT transitions of care program if the presenting problem for hospital admission was pneumonia, chronic obstructive pulmonary disease (COPD) exacerbation, or decompensated heart failure, as determined by the review of clinical documentation by nurse transition care coordinators (TCCs). Adults over the age of 18 years were eligible, though priority was given to patients aged 65 years or older. This study includes the first inpatient encounter between June 2013 and December 31, 2014, for patients having a completed needs assessment and documentation of health literacy data in the medical record.
Data Collection
TCN assessment was developed from published patient risk tools and the ITC framework.2,6,22 The assessment has 10 domains composed of 49 individual items as follows: (1) caregiver support (caregiver support not sufficient for patient needs), (2) transportation (relies on public or others for transportation and misses medical care because of transportation), (3) health care utilization (no primary care physician, unplanned hospitalization in the last year, emergency department [ED] visit in the last 6 months, or home health services in the last 60 days), (4) high-risk medical comorbidities (malnutrition or body mass index <18.5, renal failure, chronic pain, diabetes, heart failure, COPD, or stroke), (5) medication management provider or caregiver concern (cannot provide medication list, >10 preadmission medications, high-risk medications [eg, insulin, warfarin], poor medication understanding, or adherence issue identified), (6) medical devices (vascular access, urinary catheter, wounds, or home supplemental oxygen), (7) functional status (weakness of extremities, limited extremity range of motion, difficulty with mobility, falls at home, or activities of daily living challenges), (8) mental health comorbidities (over the past month has felt down, depressed, or hopeless or over the past month has felt little interest or pleasure in doing things, high-risk alcohol use, or high-risk substance use), (9) communication (limited English proficiency or at risk for limited health literacy), and (10) financial resources (no health insurance, skips or rations medicines because of cost, misses medical care because of cost, or misses medical care because of job).
The 49 items of the TCN assessment were documented as being present or absent by nurse TCCs at the time patients were enrolled in the transitional care program, based on patient and family interview and chart review, and the items were later extracted for analysis. Patients were determined to have a domain-level need if they reported a need on any individual item within that domain, resulting in a binary score (any need present, absent) for each of the 10 TCN domains.
Health literacy was assessed by using the Brief Health Literacy Screen (BHLS), which is administered routinely by nurses at hospital intake and documented in the medical record, with completion rates of approximately 90%.23 The BHLS is a 3-question subjective health literacy assessment (scoring range 3-15) that has been validated against longer objective measures24 and shown to predict disease control and mortality.18,25 To improve the stability of scores (for patients who completed the BHLS more than once because of repeat hospitalizations) and to reduce missing values, we calculated the patient’s mean BHLS score for assessments obtained between January 1, 2013, and December 31, 2014. Patients were then categorized as having inadequate health literacy (BHLS ≤ 9) or adequate health literacy (BHLS > 9).18,25 Demographic information was extracted from patient records and included age, sex (male/female), marital status (married/without a partner), race (white/nonwhite), and years of education. Income level and primary language were not available for analysis.
Statistical Analysis
Patient characteristics and TCNs were summarized by using the frequency and percentages for categorical variables and the mean and standard deviation (SD) for continuous variables. We compared patient characteristics (age, sex, marital status, race, and education) between health literacy groups (inadequate vs adequate) by using χ2 or analysis of variance as appropriate. We assessed Pearson correlations among the 10 TCN domains, and we examined differences in reported needs for each of 10 TCN domains by the level of health literacy by using the χ2 test. Because the TCN domain of communication included low health literacy as one of its items, we excluded this domain from subsequent analyses. We then compared differences in the number of TCNs documented (scoring range 0-9) by using an independent samples Student t test.
Multivariate logistic regression models were then constructed to examine the independent association of inadequate health literacy with 8 TCN domains while controlling for age, sex, marital status, race, and education. Patients with incomplete demographic data were excluded from these models. Additionally, these analyses excluded 2 TCN domains: the communication domain for reasons noted above and the high-risk medical comorbidity domain because it ended up being positive in 98.4% of patients. Statistical significance was set at an alpha of 0.05. All analyses were performed by using SPSS Statistics for Mac, version 23.0 (IBM Corp., Armonk, New York)
RESULTS
Older age was independently associated with more needs related to medical devices (OR, 1.02; 95% CI, 1.00-1.04), functional status (OR, 1.03; 95% CI, 1.02-1.05), and fewer financial needs (OR, 0.93; 95% CI, 0.91-0.96). Being married or living with a partner was associated with fewer needs related to caregiver support (OR, 0.37; 95% CI, 0.19-0.75) and more device-related needs (OR, 1.60; 95% CI, 1.03-2.49). A higher level of education was associated with fewer transportation needs (OR, 0.89; 95% CI, 0.82-0.97).
DISCUSSION
A structured patient risk factor assessment derived from literature was used to record TCNs in preparation for hospital discharge. On average, patients had needs in about half of the TCN domains (4.6 of 9). The most common areas identified were related to the presence of high-risk comorbidities (98.4%), frequent or prior healthcare utilization (76.6%), medication management (76.3%), functional status (54.9%), and transportation (48.7%). Many of the TCNs were significantly correlated with one another. The prevalence of these needs highlights the importance of using a structured assessment to identify patient concerns so that they may be addressed through discharge planning and follow-up. In addition, using a standardized TCN instrument based on a framework for ITC promotes further research in understanding patient needs and in developing personalized interventions to address them.
As hypothesized, we found that TCNs were more common in patients with inadequate health literacy. After adjustment for demographic factors, inadequate health literacy was significantly associated with transportation barriers and inadequate caregiver support. Analyses also suggested a relationship with needs related to medical devices, functional status, and mental health comorbidities. A review of the literature substantiates a link between inadequate health literacy and these needs and also suggests solutions to address these barriers.
The association with inadequate caregiver support is concerning because there is often a high degree of reliance on caregivers at transitions in care.3-5 Caregivers are routinely called upon to provide assistance with activities that may be difficult for patients with low health literacy, including medication adherence, provider communication, and self-care activities.26,27 Our finding that patients with inadequate health literacy are more likely to have inadequate caregiver support indicates additional vulnerability. This may be because of the absence of a caregiver, or in many cases, the presence of a caregiver who is underprepared to assist with care. Prior research has shown that when caregivers are present, up to 33% have low health literacy, even when they are paid nonfamilial caregivers.26,28 Other studies have noted the inadequacy of information and patient training for caregivers.29,30 Transitional care programs to improve caregiver understanding have been developed31 and have been demonstrated to lower rehospitalization and ED visits.32
Patients with inadequate health literacy were also more likely to have transportation barriers. Lack of transportation has been recorded as a factor in early hospital readmission in patients with chronic disease,33 and it has been shown to have a negative effect on a variety of health outcomes.34 A likely link between readmission and lack of transportation is poor follow-up care. Wheeler et al.35 found that 59% of patients expected difficulty keeping postdischarge appointments because of transportation needs. Instead of expecting patients to navigate their own transportation, the Agency for Healthcare Research and Quality recommends identifying community resources for patients with low health literacy.36
In this sample, inadequate health literacy also had near significant associations with TCNs in the use of medical devices, lower functional status, and mental health comorbidities. The use of a medical device, such as home oxygen, is a risk factor for readmission,37 and early reports suggest that interventions, including education related to home oxygen use, can dramatically reduce these readmissions.38 Lower functional capacity and faster functional decline are associated with inadequate health literacy,39 which may have to do with the inability to appropriately utilize health resources.40 If so, structured discharge planning could alleviate the known connection between functional impairment and hospital readmissions.41 A relationship between low health literacy and depression has been demonstrated repeatedly,42 with worsened symptoms in those with addiction.43 As has been shown in other domains where health literacy is a factor, literacy-focused interventions provide greater benefits to these depressed patients.44
The TCN assessment worked well overall, but certain domains proved less valuable and could be removed in the future. First, it was not useful to separately identify communication barriers, because doing so did not add to information beyond the measurement of health literacy. Second, high-risk comorbidities were ubiquitous within the sample and therefore unhelpful for group comparisons. In hindsight, this is unsurprising because the sample was comprised primarily of elderly patients admitted to medical services. Still, in a younger population or a surgical setting, identifying patients with high-risk medical comorbidities may be more useful.
We acknowledge several limitations of this study. First, the study was performed at a single center, and the TCN assessments were conducted by a small number of registered nurses who received training. Therefore, the results may not generalize to the profile of patient needs at other settings, and the instrument may perform differently when scaled across an organization. Second, the needs assessment was developed for this QI initiative and did not undergo formal validation, although it was developed from published frameworks and similar assessments. Third, for the measure of health literacy, we relied on data collected by nurses as part of their normal workflow. As is often the case with data collected during routine care, the scores are imperfect,45 but they have proven to be a valuable and valid indicator of health literacy in our previous research.18,24,25,46 Fourth, we chose to declare a domain as positive if any item in that domain was positive and to perform a domain-level analysis (for greater clarity). We did not take into account the variable number of items within each domain or attempt to grade their severity, as this would be a subjective exercise and impractical in the discharge planning process. Finally, we were unable to address associations among socioeconomic status,47 primary language,48 and health literacy, because relevant data were not available for this analysis.
CONCLUSION
In this sample of hospitalized patients who were administered a structured needs assessment, patients commonly had needs that placed them at a higher risk of adverse outcomes, such as hospital readmission. Patients with low health literacy had more TCNs that extended beyond the areas that we normally associate with low health literacy, namely patient education and self-management. Healthcare professionals should be aware of the greater likelihood of transportation barriers and inadequate caregiver support among patients with low health literacy. Screening for health literacy and TCN at admission or as part of the discharge planning process will elevate such risks, better positioning clinicians and hospitals to address them as a part of the efforts to ensure a quality transition of care.
Disclosure
This work was funded by the Centers for Medicare and Medicaid Services (1C1CMS330979) and in part by the National Center for Advancing Translational Sciences (2 UL1 TR000445-06). The content is solely the responsibility of the authors and does not necessarily represent official views of the funding agencies, which did not participate in the planning, collection, analysis, or interpretation of data or in the decision to submit for publication.
Dr. Dittus reports personal fees as a board member of the Robert Wood Johnson Foundation Medical Faculty Scholars Program National Advisory Committee; consultancy fees from the University of Virginia, Indiana University, University of Michigan, Northwestern University, Montana State University, and Purdue University; has grants/grants pending from NIH (research grants), PCORI (research grant), CME (innovation award), VA (training grant); payment for lectures including service on speakers bureaus from Corporate Parity (conference organizer) for the Global Hospital Management & Innovation Summit; and other from Medical Decision Making, Inc. (passive owner); all outside the submitted work. Dr. Kripalani has grants from NIH (research grant), PCORI (research grant), and CMS (QI grant); outside the submitted work. All other authors have nothing to disclose.
1. Rau J. Medicare to penalize 2,211 hospitals for excess readmissions. Kaiser Heal News. 2012;13(6):48-49.
2. Burke RE, Kripalani S, Vasilevskis EE, Schnipper JL. Moving beyond readmission penalties: creating an ideal process to improve transitional care. J Hosp Med. 2013;8(2):102-109. PubMed
3. Naylor MD, Brooten D, Campbell R, et al. Comprehensive discharge planning and home follow-up of hospitalized elders. JAMA. 1999;281(7):613-620. PubMed
4. Jack BW, Chetty VK, Anthony D, et al. A reengineered hospital discharge program to decrease rehospitalization. Ann Intern Med. 2009;150(3):178-187. PubMed
5. Coleman EA, Parry C, Chalmers S, Min S. The Care Transitions Intervention. Arch Intern Med. 2006;166(17):1822-1828. PubMed
6. Hansen LO, Greenwald JL, Budnitz T, et al. Project BOOST: effectiveness of a multihospital effort to reduce rehospitalization. J Hosp Med. 2013;8(8):421-427. PubMed
7. Hatch M, Bruce P, Mansolino A, Kripalani S. Transition care coordinators deliver personalized approach. Readmissions News. 2014;3(9):1-4.
8. Paasche-Orlow MK, Parker RM, Gazmararian JA, Nielsen-Bohlman LT, Rudd RR. The prevalence of limited health literacy. J Gen Intern Med. 2005;20(2):175-184. PubMed
9. Kutner M, Greenburg E, Jin Y, et al. The Health Literacy of America’s Adults: Results from the 2003 National Assessment of Adult Literacy. NCES 2006-483. Natl Cent Educ Stat. 2006;6:1-59.
10. Kripalani S, Jacobson TA, Mugalla IC, Cawthon CR, Niesner KJ, Vaccarino V. Health literacy and the quality of physician-patient communication during hospitalization. J Hosp Med. 2010;5(5):269-275. PubMed
11. Goggins KM, Wallston KA., Nwosu S, et al. Health literacy, numeracy, and other characteristics associated with hospitalized patients’ preferences for involvement in decision making. J Health Commun. 2014;19(sup2):29-43. PubMed
12. Marvanova M, Roumie CL, Eden SK, Cawthon C, Schnipper JL, Kripalani S. Health literacy and medication understanding among hospitalized adults. J Hosp Med. 2011;6(9):488-493. PubMed
13. Evangelista LS, Rasmusson KD, Laramee AS, et al. Health literacy and the patient with heart failure—implications for patient care and research: a consensus statement of the Heart Failure Society of America. J Card Fail. 2010;16(1):9-16. PubMed
14. Lindquist LA, Go L, Fleisher J, Jain N, Friesema E, Baker DW. Relationship of health literacy to intentional and unintentional non-adherence of hospital discharge medications. J Gen Intern Med. 2012;27(2):173-178. PubMed
15. Coleman EA, Chugh A, Williams MV, et al. Understanding and execution of discharge instructions. Am J Med Qual. 2013;28(5):383-391. PubMed
16. Mixon AS, Myers AP, Leak CL, et al. Characteristics associated with postdischarge medication errors. Mayo Clin Proc. 2014;89(8):1042-1051. PubMed
17. Mitchell SE, Sadikova E, Jack BW, Paasche-Orlow MK. Health literacy and 30-day postdischarge hospital utilization. J Health Commun. 2012;17(sup3):325-338. PubMed
18. McNaughton CD, Cawthon C, Kripalani S, Liu D, Storrow AB, Roumie CL. Health literacy and mortality: a cohort study of patients hospitalized for acute heart failure. J Am Heart Assoc. 2015;4(5):e001799. PubMed
19. Kripalani S, Roumie CL, Dalal AK, et al. Effect of a pharmacist intervention on clinically important medication errors after hospital discharge: a randomized trial. Ann Intern Med. 2012;157(1):1-10. PubMed
20. Polster D. Patient discharge information: Tools for success. Nursing (Lond). 2015;45(5):42-49. PubMed
21. Bradley SM, Chang D, Fallar R, Karani R. A patient safety and transitions of care curriculum for third-year medical students. Gerontol Geriatr Educ. 2015;36(1):45-57. PubMed
22. Kripalani S, Theobald CN, Anctil B, Vasilevskis EE. Reducing hospital readmission rates: current strategies and future directions. Annu Rev Med. 2014;65:471-485. PubMed
23. Cawthon C, Mion LC, Willens DE, Roumie CL, Kripalani S. Implementing routine health literacy assessment in hospital and primary care patients. Jt Comm J Qual Patient Saf. 2014;40(2):68-76. PubMed
24. Wallston KA, Cawthon C, McNaughton CD, Rothman RL, Osborn CY, Kripalani S. Psychometric properties of the brief health literacy screen in clinical practice. J Gen Intern Med. 2013:1-8. PubMed
25. McNaughton CD, Kripalani S, Cawthon C, Mion LC, Wallston KA, Roumie CL. Association of health literacy with elevated blood pressure: a cohort study of hospitalized patients. Med Care. 2014;52(4):346-353. PubMed
26. Garcia CH, Espinoza SE, Lichtenstein M, Hazuda HP. Health literacy associations between Hispanic elderly patients and their caregivers. J Health Commun. 2013;18 Suppl 1:256-272. PubMed
27. Levin JB, Peterson PN, Dolansky MA, Boxer RS. Health literacy and heart failure management in patient-caregiver dyads. J Card Fail. 2014;20(10):755-761. PubMed
28. Lindquist LA, Jain N, Tam K, Martin GJ, Baker DW. Inadequate health literacy among paid caregivers of seniors. J Gen Intern Med. 2011;26(5):474-479. PubMed
29. Graham CL, Ivey SL, Neuhauser L. From hospital to home: assessing the transitional care needs of vulnerable seniors. Gerontologist. 2009;49(1):23-33. PubMed
30. Foust JB, Vuckovic N, Henriquez E. Hospital to home health care transition: patient, caregiver, and clinician perspectives. West J Nurs Res. 2012;34(2):194-212. PubMed
31. Hahn-Goldberg S, Okrainec K, Huynh T, Zahr N, Abrams H. Co-creating patient-oriented discharge instructions with patients, caregivers, and healthcare providers. J Hosp Med. 2015;10(12):804-807. PubMed
32. Hendrix C, Tepfer S, Forest S, et al. Transitional care partners: a hospital-to-home support for older adults and their caregivers. J Am Assoc Nurse Pract. 2013;25(8):407-414. PubMed
33. Rubin DJ, Donnell-Jackson K, Jhingan R, Golden SH, Paranjape A. Early readmission among patients with diabetes: a qualitative assessment of contributing factors. J Diabetes Complications. 2014;28(6):869-873. PubMed
34. Syed ST, Gerber BS, Sharp LK. Traveling towards disease: transportation barriers to health care access. J Community Health. 2013;38(5):976-993. PubMed
35. Wheeler K, Crawford R, McAdams D, et al. Inpatient to outpatient transfer of diabetes care: perceptions of barriers to postdischarge followup in urban African American patients. Ethn Dis. 2007;17(2):238-243. PubMed
36. Brega A, Barnard J, Mabachi N, et al. AHRQ Health Literacy Universal Precautions Toolkit, Second Edition. Rockville: Agency for Healthcare Research and Qualiy; 2015. https://www.ahrq.gov/professionals/quality-patient-safety/quality-resources/tools/literacy-toolkit/index.html. Accessed August 21, 2017.
37. Sharif R, Parekh TM, Pierson KS, Kuo YF, Sharma G. Predictors of early readmission among patients 40 to 64 years of age hospitalized for chronic obstructive pulmonary disease. Ann Am Thorac Soc. 2014;11(5):685-694. PubMed
38. Carlin B, Wiles K, Easley D, Dskonerwpahsorg DS, Prenner B. Transition of care and rehospitalization rates for patients who require home oxygen therapy following hospitalization. Eur Respir J. 2012;40(Suppl 56):P617.
39. Wolf MS, Gazmararian JA, Baker DW. Health literacy and functional health status among older adults. Arch Intern Med. 2005;165(17):1946-1952. PubMed
40. Smith SG, O’Conor R, Curtis LM, et al. Low health literacy predicts decline in physical function among older adults: findings from the LitCog cohort study. J Epidemiol Community Health. 2015;69(5):474-480. PubMed
41. Greysen SR, Stijacic Cenzer I, Auerbach AD, Covinsky KE. Functional impairment and hospital readmission in medicare seniors. JAMA Intern Med. 2015;175(4):559-565. PubMed
42. Berkman ND, Sheridan SL, Donahue KE, et al. Health literacy interventions and outcomes: an updated systematic review. Evid Rep Technol Assess (Full Rep). 2011;199:1-941. PubMed
43. Lincoln A, Paasche-Orlow M, Cheng D, et al. Impact of health literacy on depressive symptoms and mental health-related quality of life among adults with addiction. J Gen Intern Med. 2006;21(8):818-822. PubMed
44. Weiss BD, Francis L, Senf JH, et al. Literacy education as treatment for depression in patients with limited literacy and depression: a randomized controlled trial. J Gen Intern Med. 2006;21(8):823-828. PubMed
45. Goggins K, Wallston KA, Mion L, Cawthon C, Kripalani S. What patient characteristics influence nurses’ assessment of health literacy? J Health Commun. 2016;21(sup2):105-108. PubMed
46. Scarpato KR, Kappa SF, Goggins KM, et al. The impact of health literacy on surgical outcomes following radical cystectomy. J Health Commun. 2016;21(sup2):99-104.
PubMed
47. Sudore RL, Mehta KM, Simonsick EM, et al. Limited literacy in older people and disparities in health and healthcare access. J Am Geriatr Soc. 2006;54(5):770-776. PubMed
48. Jacobson HE, Hund L, Mas FS. Predictors of English health literacy among US Hispanic immigrants: the importance of language, bilingualism and sociolinguistic environment
© 2017 Society of Hospital Medicine
Primary Medication Nonadherence
Medication nonadherence after hospital discharge impacts morbidity and mortality in patients with cardiovascular disease.[1] Primary nonadherence, part of the spectrum of medication underuse, occurs when a patient receives a prescription but does not fill it.[1] Prior studies utilizing retrospective administrative data have found a prevalence of postdischarge primary nonadherence between 24% and 28%,[1, 2] similar to findings in a variety of outpatient populations.[3, 4]
One strategy for reduction in nonadherence is discharge medication counseling, which has been associated with improved postdischarge outcomes.[1] We evaluated the prevalence and predictors of refractory primary nonadherence in a cohort of patients hospitalized for acute cardiovascular conditions who received pharmacist counseling prior to discharge to guide future adherence interventions.
METHODS
Setting and Participants
The present study represents a secondary analysis of data from the Pharmacist Intervention for Low Literacy in Cardiovascular Disease (PILL‐CVD) study. PILL‐CVD was a randomized controlled trial that evaluated the effect of a tailored intervention consisting of pharmacist‐assisted medication reconciliation, discharge counseling, low‐literacy adherence aids, and follow‐up phone calls in adults hospitalized for acute coronary syndromes or acute decompensated heart failure. Patients likely to be discharged home taking primary responsibility for their medication management were eligible. Full study methods and results, including inclusion and exclusion criteria, can be found elsewhere.[5] The institutional review boards of each site approved the study.
For the present analysis, patients were included if they had any new discharge prescriptions to fill and received the study intervention, including a postdischarge follow‐up phone call with questions about filling discharge prescriptions.
Baseline Measures
Baseline data were obtained from medical records and patient interviews, including demographic information as well as survey data for cognitive impairment (Mini‐Cog) and health literacy (Short Test of Functional Health Literacy in Adults).[6, 7]
Data were also collected related to medication use, including the number of scheduled and as‐needed medications listed at discharge, self‐reported preadmission adherence, medication understanding, and medication management practices (eg, use of a pillbox, refill reminders). Self‐reported medication adherence was measured with the 4‐item Morisky scale.[8] Medication understanding was assessed with a tool previously developed by Marvanova et al.[9]
Outcome Measures
The primary outcome was the percentage of patients who reported not filling at least 1 discharge prescription on a telephone call that was conducted 1 to 4 days postdischarge. Patients were asked a dichotomous question about whether or not they filled all of their discharge prescriptions. Further characterization of the class or number of medications not filled was not performed. Patients were asked to provide a reason for not filling the prescriptions.
Analysis
We evaluated the prevalence and possible predictors of primary nonadherence including age, gender, race, marital status, education and income levels, insurance type, health literacy, cognition, presence of a primary care physician, number of listed discharge medications, prehospital medication adherence, medication understanding, and medication management practices using Pearson 2, Fisher exact, or Wilcoxon rank sum tests as appropriate. Multiple logistic regression with backward elimination was performed to identify independent predictors, selected with P values<0.1. We also evaluated reasons that patients cited for not filling prescriptions. Two‐sided P values<0.05 were considered statistically significant. All analyses were conducted using Stata version 13.1 (StataCorp LP, College Station, TX).
RESULTS
Of 851 patients in the PILL‐CVD study, the present sample includes 341 patients who received the intervention, completed the postdischarge follow‐up call, and had new discharge prescriptions to be filled. This represents 85% of patients who received the intervention.
The mean age of participants was 61.3 years, and 59.5% were male (Table 1). The majority were white (75.1%), and 88% had at least a high school education. Married or cohabitating patients represented 54.3% of the group. Just over half of the patients (54%) had an income of $35K or greater. The primary source of insurance for 82.5% of patients was either Medicare or private insurance, and 7.4% of patients were self‐pay. Most patients (80%) had adequate health literacy. The median Mini‐Cog score was 4 out of 5 (interquartile range [IQR]=35), and 11% of patients had scores indicating cognitive impairment. Just less than one‐fourth of the patients (24.1%) had a Morisky score of 8, indicating high self‐reported adherence, and the median score of patients' understanding of medications (range of 03) was 2.5 (IQR=2.22.8), reflecting relatively high understanding. The median number of prescriptions on patients' discharge medications lists was 10 (IQR=813).
| Variable | Overall 341 (100.0%) | Filled Prescription309 (90.6%) | Did Not Fill 32 (9.4%) | P Value |
|---|---|---|---|---|
| ||||
| Age, y, N (%) | 0.745a | |||
| 1849 | 69 | 63 (91.3) | 6 (8.7) | |
| 5064 | 128 | 114 (89.1) | 14 (10.9) | |
| 65+ | 144 | 132 (91.7) | 12 (8.3) | |
| Gender, N (%) | 0.056a | |||
| Male | 203 | 189 (93.1) | 14 (6.9) | |
| Female | 138 | 120 (87.0) | 18 (13.0) | |
| Race, N (%) | 0.712a | |||
| White | 256 | 234 (91.4) | 22 (8.6) | |
| African American | 60 | 54 (90.0) | 6 (10.0) | |
| Other | 22 | 19 (86.4) | 3 (13.6) | |
| Education, N (%) | 0.054a | |||
| Less than high school | 40 | 32 (80.0) | 8 (20.0) | |
| High school | 99 | 91 (91.9) | 8 (8.1) | |
| 1315 years | 93 | 83 (89.2) | 10 (10.8) | |
| 16 years | 109 | 103 (94.5) | 6 (5.5) | |
| Marital status, N (%) | ||||
| Separated/divorced/widowed/never married | 156 | 135 (86.5) | 21 (13.5) | 0.018a, b |
| Married/cohabitating | 185 | 174 (94.1) | 11 (5.9) | |
| Income, N (%) | 0.040a, b | |||
| <10K<20K | 58 | 48 (82.8) | 10 (17.2) | |
| 20K35K | 86 | 76 (88.4) | 10 (11.6) | |
| 35K<50K | 40 | 36 (90.0) | 4 (10.0) | |
| 50K<75K | 46 | 43 (93.5) | 3 (6.5) | |
| 75K+ | 83 | 81 (97.6) | 2 (2.4) | |
| Primary source of payment, N (%) | 0.272a | |||
| Medicaid | 34 | 28 (82.4) | 6 (17.6) | |
| Medicare | 145 | 131 (90.3) | 14 (9.7) | |
| Private | 132 | 123 (93.2) | 9 (6.8) | |
| Self‐pay | 25 | 22 (88.0) | 3 (12.0) | |
| Primary care physician, N (%) | 1.000c | |||
| None/do not know | 28 | 26 (92.9) | 2 (7.1) | |
| Yes | 313 | 283 (90.4) | 30 (9.6) | |
| Site, N (%) | 0.071a | |||
| Nashville, TN | 172 | 151 (87.8) | 21 (12.2) | |
| Boston, MA | 169 | 158 (93.5) | 11 (6.5) | |
The prevalence of refractory primary nonadherence was 9.4%. In univariate analysis, single marital status, lower income, and having more than 10 total discharge medications were significantly associated with not filling medications (P=0.018, 0.04, 0.016, respectively; Table 1). In multivariable analysis, single marital status and having more than 10 total discharge medications maintained significance when controlling for other patient characteristics. Patients who were single had higher odds of failing to fill discharge prescriptions compared to married or cohabitating individuals (odds ratio [OR]: 2.2, 95% confidence interval [CI]: 1.014.8, P=0.047). Patients with more than 10 discharge medications also had higher odds of failing to fill compared with patients who had fewer total medications (OR: 2.3, 95% CI: 1.054.98, P=0.036).
Filling discharge prescriptions was not associated with health literacy, cognition, prehospital adherence, patients' medication understanding, or any of the surveyed medication management practices (Table 2). Patients' reasons for not filling included lack of time to go to the pharmacy, medications not being delivered or dispensed, or inability to afford prescriptions. Prescription cost was cited by 23.5% of patients who did not fill their prescriptions and provided a reason.
| Variable | Overall 341 (100.0%) | Filled Prescription 309 (90.6%) | Did Not Fill 32 (9.4%) | P Value |
|---|---|---|---|---|
| ||||
| s‐TOFHLA score, range 036, N (%) | 0.443a | |||
| Inadequate, 016 | 40 | 34 (85.0) | 6 (15.0) | |
| Marginal, 1722 | 27 | 25 (92.6) | 2 (7.4) | |
| Adequate, 2336 | 268 | 244 (91.0) | 24 (9.0) | |
| MiniCog score, range 05, N (%) | 0.764b | |||
| Not impaired, 35 | 304 | 276 (90.8) | 28 (9.2) | |
| Impaired, 02 | 37 | 33 (89.2) | 4 (10.8) | |
| Morisky score, range 48, N (%) | 0.517a | |||
| Low/moderate self‐reported adherence, 47 | 249 | 224 (90.0) | 25 (10.0) | |
| High self‐reported adherence, 8 | 79 | 73 (92.4) | 6 (7.6) | |
| No. of discharge medications, range 126, N (%)c | 0.016a | |||
| 010 medications | 186 | 175 (94.1) | 11 (5.9) | |
| 11+medications | 155 | 134 (86.5) | 21 (13.5) | |
| Patient responses to medication behavior questions | ||||
| Patient associates medication taking time with daily events | 253 | 229 (90.5) | 24 (9.5) | 0.913a |
| Patient uses a pillbox to organize medicine | 180 | 162 (90.0) | 18 (10.0) | 0.680a |
| Friends of family help remind patient when it is time to take medicine | 89 | 79 (88.8) | 10 (11.2) | 0.486a |
| Patient writes down instructions for when to take medicine | 60 | 55 (91.7) | 5 (8.3) | 0.758a |
| Patient uses an alarm or a reminder that beeps when it is time to take medicine | 8 | 6 (75.0) | 2 (25.0) | 0.167a |
| Patient marks refill date on calendar | 38 | 35 (92.1) | 3 (7.9) | 1.000b |
| Pharmacy gives or sends patient a reminder when it is time to refill medicine | 94 | 84 (89.4) | 10 (10.6) | 0.624a |
| Friends or family help patient to refill medicine | 60 | 53 (88.3) | 7 (11.7) | 0.504a |
DISCUSSION
Almost 1 in 10 patients hospitalized with cardiovascular disease demonstrated primary nonadherence refractory to an intervention including pharmacist discharge medication counseling. Being unmarried and having greater than 10 medications at discharge were significantly associated with higher primary nonadherence when controlling for other patient factors.
Patients with a cohabitant partner were significantly less likely to exhibit primary nonadherence, which may reflect higher levels of social support, including encouragement for disease self‐management and/or support with tasks such as picking up medications from the pharmacy. Previous research has demonstrated that social support mediates outpatient medication adherence for heart failure patients.[10]
Similar to Jackevicius et al., we found that patients with more medications at discharge were less likely to fill their prescriptions.[1] These findings may reflect the challenges that patients face in adhering to complex treatment plans, which are associated with increased coordination and cost. Conversely, some prior studies have found that patients with fewer prescriptions were less likely to fill.[11, 12] These patients were often younger, thus potentially less conditioned to fill prescriptions, and unlike our cohort, these populations had consistent prescription coverage. Interventions for polypharmacy, which have been shown to improve outcomes and decrease costs, especially in the geriatric population, may be of benefit for primary nonadherence as well.[13]
Additionally, patients with lower household incomes had higher rates of primary nonadherence, at least in univariate analysis. Medication cost and transportation limitations, which are more pronounced in lower‐income patients, likely play influential roles in this group. These findings build on prior literature that has found lower prescription cost to be associated with better medication adherence in a variety of settings.[3, 4, 14]
Because the prevalence of primary nonadherence in this cohort is less than half of historical rates, we suspect the intervention did reduce unintentional nonadherence. However, regimen cost and complexity, transportation challenges, and ingrained medication beliefs likely remained barriers. It may be that a postdischarge phone call is able address unintended primary nonadherence in many cases. Meds to beds programs, where a supply of medications is provided to patients prior to discharge, could assist patients with limited transportation. Prior studies have also found reduced primary nonadherence when e‐prescriptions are utilized.[3]
Establishing outpatient follow‐up at discharge provides additional opportunities to address unanticipated adherence barriers. Because the efficacy of any adherence intervention depends on individual patient barriers, we recommend combining medication counseling with a targeted approach for patient‐specific needs.
We note several limitations to our study. First, because we studied primary nonadherence that persisted despite an intervention, this cohort likely underestimates the prevalence of primary nonadherence and alters the associated patient characteristics found in routine practice (although counseling is becoming more common). Second, patient reporting is subject to biases that underestimate nonadherence, although this approach has been validated previously.[15] Third, our outcome measure was unable to capture the spectrum of non‐adherence that could provide a more nuanced look at predictors of postdischarge nonadherence. Fourth, we did not have patient copayment data to better characterize whether out of pocket costs or pharmacologic classes drove nonadherence. Finally, sample size may have limited the detection of other important factors, and the university setting may limit generalizability to cardiovascular patients in other practice environments. Future research should focus on intervention strategies that assess patients' individual adherence barriers for a targeted or multimodal approach to improve adherence.
In conclusion, we found a prevalence of primary nonadherence of almost 1 in 10 patients who received pharmacist counseling. Nonadherence was associated with being single and those discharged with longer medication lists. Our results support existing literature that primary nonadherence is a significant problem in the postdischarge setting and substantiate the need for ongoing efforts to study and implement interventions for adherence after hospital discharge.
Disclosures
This material is based on work supported by the Office of Academic Affiliations, Department of Veterans Affairs, Veterans Affairs National Quality Scholars Program, and with use of facilities at Veterans Affairs Tennessee Valley Healthcare System, Nashville, Tennessee (Dr. Wooldridge). The funding agency supported the work indirectly through provision of salary support and training for the primary author, but had no specific role in the design and conduct of the study; collection, management, analysis, and interpretation of the data; preparation, review, or approval of the manuscript; or decision to submit the manuscript for publication. This work was also supported by R01 HL089755 (Dr. Kripalani) and in part by K23 HL077597 (Dr. Kripalani), K08 HL072806 (Dr. Schnipper), and the Center for Clinical Quality and Implementation Research at Vanderbilt University Medical Center. A preliminary version of this research was presented at the AcademyHealth Annual Research Meeting, June 16, 2015, Minneapolis, Minnesota. The authors report the following potential conflicts of interest: Jeffrey Schnipper: PI, investigator‐initiated study funded by Sanofi‐Aventis to develop, implement, and evaluate a multifaceted intervention to improve transitions of care in patients with diabetes mellitus discharged on insulin. Robert Dittus: passive co‐owner, Medical Decision Modeling, Inc.; Bayer HealthCare. One‐day consultation and panelist on educational video for population health (consultant fee); GlaxoSmithKline. One‐day consultant for population health, envisioning the future (consultant fee). Sunil Kripalani: Bioscape Digital, stock ownership
- , , . Prevalence, predictors, and outcomes of primary nonadherence after acute myocardial infarction. Circulation. 2008;117(8):1028–1036.
- , , , . Primary medication non‐adherence after discharge from a general internal medicine service. PloS One. 2013;8(5):e61735.
- , , , et al. Trouble getting started: predictors of primary medication nonadherence. Am J Med. 2011;124(11):1081.e9–22.
- , , , , . The incidence and determinants of primary nonadherence with prescribed medication in primary care: a cohort study. Ann Intern Med. 2014;160(7):441–450.
- , , , et al. Effect of a pharmacist intervention on clinically important medication errors after hospital discharge: a randomized trial. Ann Intern Med. 2012;157(1):1–10.
- , , , . Short Test of Functional Health Literacy in Adults. Snow Camp, NC: Peppercorn Books and Press; 1998.
- , , , , . Simplifying detection of cognitive impairment: comparison of the Mini‐Cog and Mini‐Mental State Examination in a multiethnic sample. J Am Geriatr Soc. 2005;53(5):871–874.
- , , . Concurrent and predictive validity of a self‐reported measure of medication adherence. Med Care. 1986;24(1):67–74.
- , , , , , . Health literacy and medication understanding among hospitalized adults. J Hosp Med. 2011;6(9):488–493.
- , , , , , . Medication adherence, social support, and event‐free survival in patients with heart failure. Health Psychol. 2013;32(6):637–646.
- , , , , , . Effect of patient comorbidities on filling of antihypertensive prescriptions. Am J Manag Care. 2009;15(1):24–30.
- , , , et al. Primary nonadherence to statin medications in a managed care organization. J Manag Care Pharm. 2013;19(5):367–373.
- , , , et al. Reducing cost by reducing polypharmacy: the polypharmacy outcomes project. J Am Med Dir Assoc. 2012;13(9):818.e811–815.
- , , , et al. The epidemiology of prescriptions abandoned at the pharmacy. Ann Intern Med. 2010;153(10):633–640.
- , , , , , . Can simple clinical measurements detect patient noncompliance? Hypertension. 1980;2(6):757–764.
Medication nonadherence after hospital discharge impacts morbidity and mortality in patients with cardiovascular disease.[1] Primary nonadherence, part of the spectrum of medication underuse, occurs when a patient receives a prescription but does not fill it.[1] Prior studies utilizing retrospective administrative data have found a prevalence of postdischarge primary nonadherence between 24% and 28%,[1, 2] similar to findings in a variety of outpatient populations.[3, 4]
One strategy for reduction in nonadherence is discharge medication counseling, which has been associated with improved postdischarge outcomes.[1] We evaluated the prevalence and predictors of refractory primary nonadherence in a cohort of patients hospitalized for acute cardiovascular conditions who received pharmacist counseling prior to discharge to guide future adherence interventions.
METHODS
Setting and Participants
The present study represents a secondary analysis of data from the Pharmacist Intervention for Low Literacy in Cardiovascular Disease (PILL‐CVD) study. PILL‐CVD was a randomized controlled trial that evaluated the effect of a tailored intervention consisting of pharmacist‐assisted medication reconciliation, discharge counseling, low‐literacy adherence aids, and follow‐up phone calls in adults hospitalized for acute coronary syndromes or acute decompensated heart failure. Patients likely to be discharged home taking primary responsibility for their medication management were eligible. Full study methods and results, including inclusion and exclusion criteria, can be found elsewhere.[5] The institutional review boards of each site approved the study.
For the present analysis, patients were included if they had any new discharge prescriptions to fill and received the study intervention, including a postdischarge follow‐up phone call with questions about filling discharge prescriptions.
Baseline Measures
Baseline data were obtained from medical records and patient interviews, including demographic information as well as survey data for cognitive impairment (Mini‐Cog) and health literacy (Short Test of Functional Health Literacy in Adults).[6, 7]
Data were also collected related to medication use, including the number of scheduled and as‐needed medications listed at discharge, self‐reported preadmission adherence, medication understanding, and medication management practices (eg, use of a pillbox, refill reminders). Self‐reported medication adherence was measured with the 4‐item Morisky scale.[8] Medication understanding was assessed with a tool previously developed by Marvanova et al.[9]
Outcome Measures
The primary outcome was the percentage of patients who reported not filling at least 1 discharge prescription on a telephone call that was conducted 1 to 4 days postdischarge. Patients were asked a dichotomous question about whether or not they filled all of their discharge prescriptions. Further characterization of the class or number of medications not filled was not performed. Patients were asked to provide a reason for not filling the prescriptions.
Analysis
We evaluated the prevalence and possible predictors of primary nonadherence including age, gender, race, marital status, education and income levels, insurance type, health literacy, cognition, presence of a primary care physician, number of listed discharge medications, prehospital medication adherence, medication understanding, and medication management practices using Pearson 2, Fisher exact, or Wilcoxon rank sum tests as appropriate. Multiple logistic regression with backward elimination was performed to identify independent predictors, selected with P values<0.1. We also evaluated reasons that patients cited for not filling prescriptions. Two‐sided P values<0.05 were considered statistically significant. All analyses were conducted using Stata version 13.1 (StataCorp LP, College Station, TX).
RESULTS
Of 851 patients in the PILL‐CVD study, the present sample includes 341 patients who received the intervention, completed the postdischarge follow‐up call, and had new discharge prescriptions to be filled. This represents 85% of patients who received the intervention.
The mean age of participants was 61.3 years, and 59.5% were male (Table 1). The majority were white (75.1%), and 88% had at least a high school education. Married or cohabitating patients represented 54.3% of the group. Just over half of the patients (54%) had an income of $35K or greater. The primary source of insurance for 82.5% of patients was either Medicare or private insurance, and 7.4% of patients were self‐pay. Most patients (80%) had adequate health literacy. The median Mini‐Cog score was 4 out of 5 (interquartile range [IQR]=35), and 11% of patients had scores indicating cognitive impairment. Just less than one‐fourth of the patients (24.1%) had a Morisky score of 8, indicating high self‐reported adherence, and the median score of patients' understanding of medications (range of 03) was 2.5 (IQR=2.22.8), reflecting relatively high understanding. The median number of prescriptions on patients' discharge medications lists was 10 (IQR=813).
| Variable | Overall 341 (100.0%) | Filled Prescription309 (90.6%) | Did Not Fill 32 (9.4%) | P Value |
|---|---|---|---|---|
| ||||
| Age, y, N (%) | 0.745a | |||
| 1849 | 69 | 63 (91.3) | 6 (8.7) | |
| 5064 | 128 | 114 (89.1) | 14 (10.9) | |
| 65+ | 144 | 132 (91.7) | 12 (8.3) | |
| Gender, N (%) | 0.056a | |||
| Male | 203 | 189 (93.1) | 14 (6.9) | |
| Female | 138 | 120 (87.0) | 18 (13.0) | |
| Race, N (%) | 0.712a | |||
| White | 256 | 234 (91.4) | 22 (8.6) | |
| African American | 60 | 54 (90.0) | 6 (10.0) | |
| Other | 22 | 19 (86.4) | 3 (13.6) | |
| Education, N (%) | 0.054a | |||
| Less than high school | 40 | 32 (80.0) | 8 (20.0) | |
| High school | 99 | 91 (91.9) | 8 (8.1) | |
| 1315 years | 93 | 83 (89.2) | 10 (10.8) | |
| 16 years | 109 | 103 (94.5) | 6 (5.5) | |
| Marital status, N (%) | ||||
| Separated/divorced/widowed/never married | 156 | 135 (86.5) | 21 (13.5) | 0.018a, b |
| Married/cohabitating | 185 | 174 (94.1) | 11 (5.9) | |
| Income, N (%) | 0.040a, b | |||
| <10K<20K | 58 | 48 (82.8) | 10 (17.2) | |
| 20K35K | 86 | 76 (88.4) | 10 (11.6) | |
| 35K<50K | 40 | 36 (90.0) | 4 (10.0) | |
| 50K<75K | 46 | 43 (93.5) | 3 (6.5) | |
| 75K+ | 83 | 81 (97.6) | 2 (2.4) | |
| Primary source of payment, N (%) | 0.272a | |||
| Medicaid | 34 | 28 (82.4) | 6 (17.6) | |
| Medicare | 145 | 131 (90.3) | 14 (9.7) | |
| Private | 132 | 123 (93.2) | 9 (6.8) | |
| Self‐pay | 25 | 22 (88.0) | 3 (12.0) | |
| Primary care physician, N (%) | 1.000c | |||
| None/do not know | 28 | 26 (92.9) | 2 (7.1) | |
| Yes | 313 | 283 (90.4) | 30 (9.6) | |
| Site, N (%) | 0.071a | |||
| Nashville, TN | 172 | 151 (87.8) | 21 (12.2) | |
| Boston, MA | 169 | 158 (93.5) | 11 (6.5) | |
The prevalence of refractory primary nonadherence was 9.4%. In univariate analysis, single marital status, lower income, and having more than 10 total discharge medications were significantly associated with not filling medications (P=0.018, 0.04, 0.016, respectively; Table 1). In multivariable analysis, single marital status and having more than 10 total discharge medications maintained significance when controlling for other patient characteristics. Patients who were single had higher odds of failing to fill discharge prescriptions compared to married or cohabitating individuals (odds ratio [OR]: 2.2, 95% confidence interval [CI]: 1.014.8, P=0.047). Patients with more than 10 discharge medications also had higher odds of failing to fill compared with patients who had fewer total medications (OR: 2.3, 95% CI: 1.054.98, P=0.036).
Filling discharge prescriptions was not associated with health literacy, cognition, prehospital adherence, patients' medication understanding, or any of the surveyed medication management practices (Table 2). Patients' reasons for not filling included lack of time to go to the pharmacy, medications not being delivered or dispensed, or inability to afford prescriptions. Prescription cost was cited by 23.5% of patients who did not fill their prescriptions and provided a reason.
| Variable | Overall 341 (100.0%) | Filled Prescription 309 (90.6%) | Did Not Fill 32 (9.4%) | P Value |
|---|---|---|---|---|
| ||||
| s‐TOFHLA score, range 036, N (%) | 0.443a | |||
| Inadequate, 016 | 40 | 34 (85.0) | 6 (15.0) | |
| Marginal, 1722 | 27 | 25 (92.6) | 2 (7.4) | |
| Adequate, 2336 | 268 | 244 (91.0) | 24 (9.0) | |
| MiniCog score, range 05, N (%) | 0.764b | |||
| Not impaired, 35 | 304 | 276 (90.8) | 28 (9.2) | |
| Impaired, 02 | 37 | 33 (89.2) | 4 (10.8) | |
| Morisky score, range 48, N (%) | 0.517a | |||
| Low/moderate self‐reported adherence, 47 | 249 | 224 (90.0) | 25 (10.0) | |
| High self‐reported adherence, 8 | 79 | 73 (92.4) | 6 (7.6) | |
| No. of discharge medications, range 126, N (%)c | 0.016a | |||
| 010 medications | 186 | 175 (94.1) | 11 (5.9) | |
| 11+medications | 155 | 134 (86.5) | 21 (13.5) | |
| Patient responses to medication behavior questions | ||||
| Patient associates medication taking time with daily events | 253 | 229 (90.5) | 24 (9.5) | 0.913a |
| Patient uses a pillbox to organize medicine | 180 | 162 (90.0) | 18 (10.0) | 0.680a |
| Friends of family help remind patient when it is time to take medicine | 89 | 79 (88.8) | 10 (11.2) | 0.486a |
| Patient writes down instructions for when to take medicine | 60 | 55 (91.7) | 5 (8.3) | 0.758a |
| Patient uses an alarm or a reminder that beeps when it is time to take medicine | 8 | 6 (75.0) | 2 (25.0) | 0.167a |
| Patient marks refill date on calendar | 38 | 35 (92.1) | 3 (7.9) | 1.000b |
| Pharmacy gives or sends patient a reminder when it is time to refill medicine | 94 | 84 (89.4) | 10 (10.6) | 0.624a |
| Friends or family help patient to refill medicine | 60 | 53 (88.3) | 7 (11.7) | 0.504a |
DISCUSSION
Almost 1 in 10 patients hospitalized with cardiovascular disease demonstrated primary nonadherence refractory to an intervention including pharmacist discharge medication counseling. Being unmarried and having greater than 10 medications at discharge were significantly associated with higher primary nonadherence when controlling for other patient factors.
Patients with a cohabitant partner were significantly less likely to exhibit primary nonadherence, which may reflect higher levels of social support, including encouragement for disease self‐management and/or support with tasks such as picking up medications from the pharmacy. Previous research has demonstrated that social support mediates outpatient medication adherence for heart failure patients.[10]
Similar to Jackevicius et al., we found that patients with more medications at discharge were less likely to fill their prescriptions.[1] These findings may reflect the challenges that patients face in adhering to complex treatment plans, which are associated with increased coordination and cost. Conversely, some prior studies have found that patients with fewer prescriptions were less likely to fill.[11, 12] These patients were often younger, thus potentially less conditioned to fill prescriptions, and unlike our cohort, these populations had consistent prescription coverage. Interventions for polypharmacy, which have been shown to improve outcomes and decrease costs, especially in the geriatric population, may be of benefit for primary nonadherence as well.[13]
Additionally, patients with lower household incomes had higher rates of primary nonadherence, at least in univariate analysis. Medication cost and transportation limitations, which are more pronounced in lower‐income patients, likely play influential roles in this group. These findings build on prior literature that has found lower prescription cost to be associated with better medication adherence in a variety of settings.[3, 4, 14]
Because the prevalence of primary nonadherence in this cohort is less than half of historical rates, we suspect the intervention did reduce unintentional nonadherence. However, regimen cost and complexity, transportation challenges, and ingrained medication beliefs likely remained barriers. It may be that a postdischarge phone call is able address unintended primary nonadherence in many cases. Meds to beds programs, where a supply of medications is provided to patients prior to discharge, could assist patients with limited transportation. Prior studies have also found reduced primary nonadherence when e‐prescriptions are utilized.[3]
Establishing outpatient follow‐up at discharge provides additional opportunities to address unanticipated adherence barriers. Because the efficacy of any adherence intervention depends on individual patient barriers, we recommend combining medication counseling with a targeted approach for patient‐specific needs.
We note several limitations to our study. First, because we studied primary nonadherence that persisted despite an intervention, this cohort likely underestimates the prevalence of primary nonadherence and alters the associated patient characteristics found in routine practice (although counseling is becoming more common). Second, patient reporting is subject to biases that underestimate nonadherence, although this approach has been validated previously.[15] Third, our outcome measure was unable to capture the spectrum of non‐adherence that could provide a more nuanced look at predictors of postdischarge nonadherence. Fourth, we did not have patient copayment data to better characterize whether out of pocket costs or pharmacologic classes drove nonadherence. Finally, sample size may have limited the detection of other important factors, and the university setting may limit generalizability to cardiovascular patients in other practice environments. Future research should focus on intervention strategies that assess patients' individual adherence barriers for a targeted or multimodal approach to improve adherence.
In conclusion, we found a prevalence of primary nonadherence of almost 1 in 10 patients who received pharmacist counseling. Nonadherence was associated with being single and those discharged with longer medication lists. Our results support existing literature that primary nonadherence is a significant problem in the postdischarge setting and substantiate the need for ongoing efforts to study and implement interventions for adherence after hospital discharge.
Disclosures
This material is based on work supported by the Office of Academic Affiliations, Department of Veterans Affairs, Veterans Affairs National Quality Scholars Program, and with use of facilities at Veterans Affairs Tennessee Valley Healthcare System, Nashville, Tennessee (Dr. Wooldridge). The funding agency supported the work indirectly through provision of salary support and training for the primary author, but had no specific role in the design and conduct of the study; collection, management, analysis, and interpretation of the data; preparation, review, or approval of the manuscript; or decision to submit the manuscript for publication. This work was also supported by R01 HL089755 (Dr. Kripalani) and in part by K23 HL077597 (Dr. Kripalani), K08 HL072806 (Dr. Schnipper), and the Center for Clinical Quality and Implementation Research at Vanderbilt University Medical Center. A preliminary version of this research was presented at the AcademyHealth Annual Research Meeting, June 16, 2015, Minneapolis, Minnesota. The authors report the following potential conflicts of interest: Jeffrey Schnipper: PI, investigator‐initiated study funded by Sanofi‐Aventis to develop, implement, and evaluate a multifaceted intervention to improve transitions of care in patients with diabetes mellitus discharged on insulin. Robert Dittus: passive co‐owner, Medical Decision Modeling, Inc.; Bayer HealthCare. One‐day consultation and panelist on educational video for population health (consultant fee); GlaxoSmithKline. One‐day consultant for population health, envisioning the future (consultant fee). Sunil Kripalani: Bioscape Digital, stock ownership
- , , . Prevalence, predictors, and outcomes of primary nonadherence after acute myocardial infarction. Circulation. 2008;117(8):1028–1036.
- , , , . Primary medication non‐adherence after discharge from a general internal medicine service. PloS One. 2013;8(5):e61735.
- , , , et al. Trouble getting started: predictors of primary medication nonadherence. Am J Med. 2011;124(11):1081.e9–22.
- , , , , . The incidence and determinants of primary nonadherence with prescribed medication in primary care: a cohort study. Ann Intern Med. 2014;160(7):441–450.
- , , , et al. Effect of a pharmacist intervention on clinically important medication errors after hospital discharge: a randomized trial. Ann Intern Med. 2012;157(1):1–10.
- , , , . Short Test of Functional Health Literacy in Adults. Snow Camp, NC: Peppercorn Books and Press; 1998.
- , , , , . Simplifying detection of cognitive impairment: comparison of the Mini‐Cog and Mini‐Mental State Examination in a multiethnic sample. J Am Geriatr Soc. 2005;53(5):871–874.
- , , . Concurrent and predictive validity of a self‐reported measure of medication adherence. Med Care. 1986;24(1):67–74.
- , , , , , . Health literacy and medication understanding among hospitalized adults. J Hosp Med. 2011;6(9):488–493.
- , , , , , . Medication adherence, social support, and event‐free survival in patients with heart failure. Health Psychol. 2013;32(6):637–646.
- , , , , , . Effect of patient comorbidities on filling of antihypertensive prescriptions. Am J Manag Care. 2009;15(1):24–30.
- , , , et al. Primary nonadherence to statin medications in a managed care organization. J Manag Care Pharm. 2013;19(5):367–373.
- , , , et al. Reducing cost by reducing polypharmacy: the polypharmacy outcomes project. J Am Med Dir Assoc. 2012;13(9):818.e811–815.
- , , , et al. The epidemiology of prescriptions abandoned at the pharmacy. Ann Intern Med. 2010;153(10):633–640.
- , , , , , . Can simple clinical measurements detect patient noncompliance? Hypertension. 1980;2(6):757–764.
Impaired Arousal and Mortality
Arousal is defined as the patient's overall level of responsiveness to the environment. Its assessment is standard of care in most intensive care units (ICUs) to monitor depth of sedation and underlying brain dysfunction. There has been recent interest in expanding the role of arousal assessment beyond the ICU. Specifically, the Veterans Affairs Delirium Working Group proposed that simple arousal assessment be a vital sign to quantify underlying brain dysfunction.[1] The rationale is that impaired arousal is closely linked with delirium,[2] and is an integral component of multiple delirium assessments.[3, 4, 5] Chester et al. observed that the presence of impaired arousal was 64% sensitive and 93% specific for delirium diagnosed by a psychiatrist.[2] Delirium is an under‐recognized public health problem that affects up to 25% of older hospitalized patients,[6, 7] is associated with a multitude of adverse outcomes such as death and accelerated cognitive decline,[8] and costs the US healthcare system an excess of $152 billion dollars.[9]
Most delirium assessments require the patient to undergo additional cognitive testing. The assessment of arousal, however, requires the rater to merely observe the patient during routine clinical care and can be easily integrated into the clinical workflow.[10] Because of its simplicity and brevity, assessing arousal alone using validated scales such as the Richmond Agitation‐Sedation Scale (RASS) may be a more appealing alternative to traditional, more complex delirium screening in the acute care setting. Its clinical utility would be further strengthened if impaired arousal was also associated with mortality, and conferred risk even in the absence of delirium. As a result, we sought to determine if impaired arousal at initial presentation in older acutely ill patients predicted 6‐month mortality and whether this relationship was present in the absence of delirium.
METHODS
Design Overview
We performed a planned secondary analysis of 2 prospective cohorts that enrolled patients from May 2007 to August 2008 between 8 am and 10 pm during the weekdays, and July 2009 to February 2012 between 8 am and 4 pm during the weekdays. The first cohort was designed to evaluate the relationship between delirium and patient outcomes.[11, 12] The second cohort was used to validate brief delirium assessments using a psychiatrist's assessment as the reference standard.[5, 13] The local institutional review board approved these studies.
Setting and Participants
These studies were conducted in an urban emergency department located within an academic, tertiary care hospital with over 57,000 visits annually. Patients were included if they were 65 years or older and in the emergency department for <12 hours at the time of enrollment. The 12‐hour cutoff was used to include patients who presented to the emergency department in the evening and early morning hours. Patients were excluded if they were previously enrolled, non‐English speaking, comatose, or were nonverbal and unable to follow simple commands prior to the acute illness. Because the July 2009 to February 2012 cohort was designed to validate delirium assessments with auditory and visual components, patients were also excluded if they were deaf or blind.
Measurement of Arousal
RASS is an arousal scale commonly used in ICUs to assess depth of sedation and ranges from 5 (unarousable) to +4 (combative); 0 represents normal arousal.[10, 14] The RASS simply requires the rater to observe the patient during their routine interactions and does not require any additional cognitive testing. The RASS terms sedation was modified to drowsy (Table 1), because we wanted to capture impaired arousal regardless of sedation administration. We did not use the modified RASS (mRASS) proposed by the Veteran's Affairs Delirium Working Group, because it was published after data collection began.[1] The mRASS is very similar to the RASS, except it also incorporates a very informal inattention assessment. The RASS was ascertained by research assistants who were college students and graduates, and emergency medical technician basics and paramedics. The principal investigator gave them a 5‐minute didactic lecture about the RASS and observed them perform the RASS in at least 5 patients prior to the start of the study. Inter‐rater reliability between trained research assistants and a physician was assessed for 456 (42.0%) patients of the study sample. The weighted kappa of the RASS was 0.61, indicating very good inter‐rater reliability. Because the 81.7% of patients with impaired arousal had a RASS of 1, the RASS dichotomized as normal (RASS=0) or impaired (RASS other than 0).
| Score | Term | Description |
|---|---|---|
| ||
| +4 | Combative | Overtly combative, violent, immediate danger to staff |
| +3 | Very agitated | Pulls or removes tube(s) or catheter(s), aggressive |
| +2 | Agitated | Frequent nonpurposeful movement |
| +1 | Restless | Anxious but movements not aggressive or vigorous |
| 0 | Alert and calm | |
| 1 | Slight drowsy | Not fully alert, but has sustained awakening (eye opening/eye contact) to voice (>10 seconds) |
| 2 | Moderately drowsy | Briefly awakens with eye contact to voice (<10 seconds) |
| 3 | Very drowsy | Movement or eye opening to voice (but no eye contact) |
| 4 | Awakens to pain only | No response to voice, but movement or eye opening to physical stimulation |
| 5 | Unarousable | No response to voice or physical stimulation |
Death Ascertainment
Death within 6 months was ascertained using the following algorithm: (1) The electronic medical record was searched to determine the patient's death status. (2) Patients who had a documented emergency department visit, outpatient clinic visit, or hospitalization after 6 months were considered to be alive at 6 months. (3) For the remaining patients, date of death was searched in the Social Security Death Index (SSDI). (4) Patients without a death recorded in the SSDI 1 year after the index visit was considered to be alive at 6 months. Nine hundred thirty‐one (85.9%) out of 1084 patients had a recorded death in the medical record or SSDI, or had an emergency department or hospital visit documented in their record 6 months after the index visit.
Additional Variables Collected
Patients were considered to have dementia if they had: (1) documented dementia in the medical record, (2) a short form Informant Questionnaire on Cognitive Decline in the Elderly score (IQCODE) greater than 3.38,[15] or (3) prescribed cholinesterase inhibitors prior to admission. The short form IQCODE is an informant questionnaire with 16 items; a cutoff of 3.38 out of 5.00 is 79% sensitive and 82% specific for dementia.[16] Premorbid functional status was determined by the Katz Activities of Daily Living (Katz ADL) and ranges from 0 (completely dependent) to 6 (completely independent).[17] Patients with a score <5 were considered to be functionally dependent. Both the IQCODE and Katz ADL were prospectively collected in the emergency department at the time of enrollment.
The Charlson Comorbidity Index was used to measure comorbid burden.[18] The Acute Physiology Score (APS) of the Acute Physiology and Chronic Health Evaluation II score was used to quantify severity of illness.[19] The Glasgow Coma Scale was not included in the APS because it was not collected. Intravenous, intramuscular, and oral benzodiazepine and opioids given in the prehospital and emergency department were also recorded. The Charlson Comorbidity Index, APS, and benzodiazepine and opioid administration were collected after patient enrollment using the electronic medical record.
Within 3 hours of the RASS, a subset of 406 patients was evaluated by a consultation‐liaison psychiatrist who determined the patient's delirium status using Diagnostic and Statistical Manual of Mental Disorders, Fourth Edition, Text Revision (DSM‐IV‐TR) criteria.[20] Details of their comprehensive assessments have been described in a previous report.[5]
Statistical Analysis
Measures of central tendency and dispersion for continuous variables were reported as medians and interquartile ranges. Categorical variables were reported as proportions. For simple comparisons, Wilcoxon rank sum tests were performed for continuous data, and 2 analyses or Fisher exact test were performed for categorical data. To evaluate the predictive validity of impaired arousal on 6‐month mortality, the cumulative probability of survival was estimated within 6 months from the study enrollment date using the Kaplan‐Meier method. Cox proportional hazards regression was performed to assess if impaired arousal was independently associated with 6‐month mortality after adjusting for age, gender, nonwhite race, comorbidity burden (Charlson Comorbidity Index), severity of illness (APS), dementia, functional dependence (Katz ADL <5), nursing home residence, admission status, and benzodiazepine or opioid medication administration. Patients were censored at the end of 6 months. The selection of covariates was based upon expert opinion and literature review. The number of covariates used for the model was limited by the number of events to minimize overfitting; 1 df was allowed for every 10 to 15 events.[21] Because severity of illness, psychoactive medication administration, and admission status might modify the relationship between 6‐month mortality and impaired arousal, 2‐way interaction terms were incorporated. To maintain parsimony and minimize overfitting and collinearity, nonsignificant interaction terms (P>0.20) were removed in the final model.[22] Hazard ratios (HR) with their 95% confidence interval (95% CI) were reported.
To determine if arousal was associated with 6‐month mortality in the absence of delirium, we performed another Cox proportional hazard regression in a subset of 406 patients who received a psychiatrist assessment. Six‐month mortality was the dependent variable, and the independent variable was a 3‐level categorical variable of different arousal/delirium combinations: (1) impaired arousal/delirium positive, (2) impaired arousal/delirium negative, and (3) normal arousal (with or without delirium). Because there were only 8 patients who had normal arousal with delirium, this group was collapsed into the normal arousal without delirium group. Because there were 55 deaths, the number of covariates that could be entered into the Cox proportional hazard regression model was limited. We used the inverse weighted propensity score method to help minimize residual confounding.[23] Traditional propensity score adjustment could not be performed because there were 3 arousal/delirium categories. Similar to propensity score adjustment, inverse weighted propensity score method was used to help balance the distribution of patient characteristics among the exposure groups and also allow adjustment for multiple confounders while minimizing the degrees of freedom expended. A propensity score was the probability of having a particular arousal/delirium category based upon baseline patient characteristics. Multinomial logistic regression was performed to calculate the propensity score, and the baseline covariates used were age, gender, nonwhite race, comorbidity burden, severity of illness, dementia, functional dependence, and nursing home residence. For the Cox proportional hazard regression model, each observation was weighted by the inverse of the propensity score for their given arousal/delirium category; propensity scores exceeding the 95th percentile were trimmed to avoid overly influential weighting. Benzodiazepine and opioid medications given in the emergency department and admission status were adjusted as covariates in the weighted Cox proportional hazard regression model.
Nineteen patients (1.8%) had missing Katz ADL; these missing values were imputed using multiple imputation. The reliability of the final regression models were internally validated using the bootstrap method.[21] Two thousand sets of bootstrap samples were generated by resampling the original data, and the optimism was estimated to determine the degree of overfitting.[21] An optimism value >0.85 indicated no evidence of substantial overfitting.[21] Variance inflation factors were used to check multicollinearity. Schoenfeld residuals were also analyzed to determine goodness‐of‐fit and assess for outliers. P values <0.05 were considered statistically significant. All statistical analyses were performed using SAS version 9.4 (SAS Institute, Cary, NC) and open source R statistical software version 3.0.1 (
RESULTS
A total of 1903 patients were screened, and 1084 patients met enrollment criteria (Figure 1). Of these, 1051 (97.0%) were non‐ICU patients. Patient characteristics of this cohort can be seen in Table 2. Enrolled patients and potentially eligible patients who presented to the emergency department during the enrollment window were similar in age, gender, and severity of illness, but enrolled patients were slightly more likely to have a chief complaint of chest pain and syncope (unpublished data).

| Variables | Normal Arousal, n=835 | Impaired Arousal, n=249 | P Value |
|---|---|---|---|
| |||
| Median age, y (IQR) | 74 (6980) | 75 (7083) | 0.005 |
| Female gender | 459 (55.0%) | 132 (53.0%) | 0.586 |
| Nonwhite race | 122 (14.6%) | 51 (20.5%) | 0.027 |
| Residence | <0.001 | ||
| Home | 752 (90.1%) | 204 (81.9%) | |
| Assisted living | 29 (3.5%) | 13 (5.2%) | |
| Rehabilitation | 8 (1.0%) | 5 (2.0%) | |
| Nursing home | 42 (5.0%) | 27 (10.8%) | |
| Dementia* | 175 (21.0%) | 119 (47.8%) | <0.001 |
| Dependent | 120 (14.4%) | 99 (39.8%) | <0.001 |
| Median Charlson (IQR) | 2 (1, 4) | 3 (2, 5) | <0.001 |
| Median APS (IQR) | 2 (1, 4) | 2 (1, 5) | <0.001 |
| Primary complaint | <0.001 | ||
| Abdominal pain | 45 (5.4%) | 13 (5.2%) | |
| Altered mental status | 12 (1.4%) | 36 (14.5%) | |
| Chest pain | 128 (15.3%) | 31 (12.5%) | |
| Disturbances of sensation | 17 (2.0%) | 2 (0.8%) | |
| Dizziness | 16 (1.9%) | 2 (0.8%) | |
| Fever | 11 (1.3%) | 7 (2.8%) | |
| General illness, malaise | 26 (3.1%) | 5 (2.0%) | |
| General weakness | 68 (8.1%) | 29 (11.7%) | |
| Nausea/vomiting | 29 (3.5%) | 4 (1.6%) | |
| Shortness of breath | 85 (10.2%) | 21 (8.4%) | |
| Syncope | 46 (5.5%) | 10 (4.0%) | |
| Trauma, multiple organs | 19 (2.3%) | 8 (3.2%) | |
| Other | 333 (39.9%) | 81 (32.5%) | |
| Benzodiazepines or opioid medications administration | 188 (22.5%) | 67 (26.9%) | 0.152 |
| Admitted to the hospital | 478 (57.3%) | 191 (76.7%) | 0.002 |
| Internal medicine | 411 (86.0%) | 153 (80.1%) | |
| Surgery | 38 (8.0%) | 21 (11.0%) | |
| Neurology | 19 (4.0%) | 13 (6.8%) | |
| Psychiatry | 1 (0.2%) | 2 (1.1%) | |
| Unknown/missing | 9 (1.9%) | 2 (1.1%) | |
| Death within 6 months | 81 (9.7%) | 59 (23.7%) | <0.001 |
Of those enrolled, 249 (23.0%) had an abnormal RASS at initial presentation, and their distribution can be seen in Figure 2. Within 6 months, patients with an abnormal RASS were more likely to die compared with patients with a RASS of 0 (23.7% vs 9.7%, P<0.001). The Kaplan‐Meier survival curves for all enrolled patients with impaired and normal RASS can be seen in Figure 3; the survival curve declined more slowly in patients with a normal RASS compared with those with an abnormal RASS.
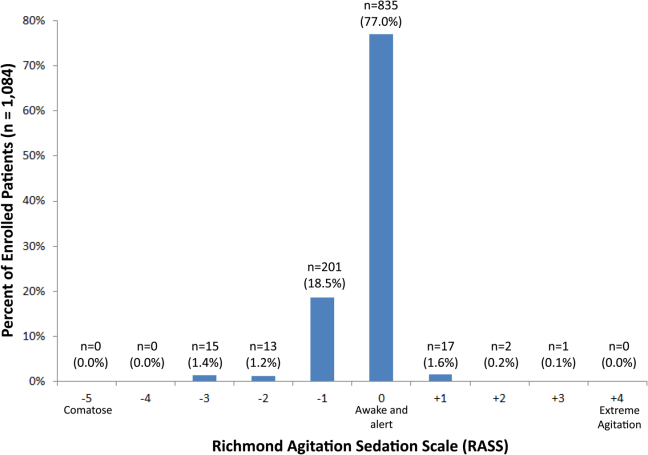
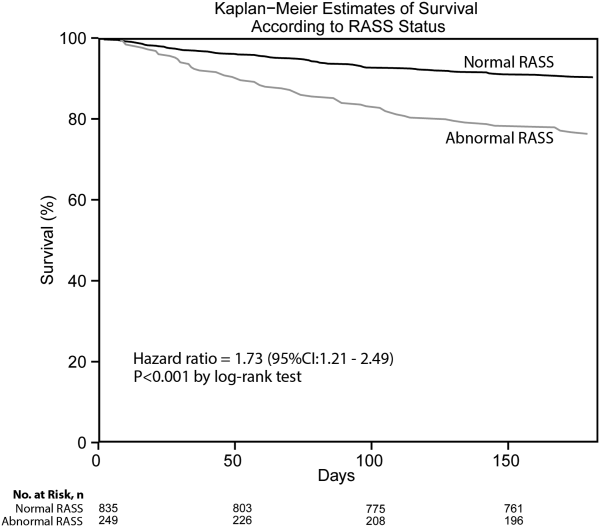
Using Cox proportional hazards regression, the relationship between an abnormal RASS at initial presentation and 6‐month mortality persisted (HR: 1.73, 95% CI: 1.21‐2.49) after adjusting for age, sex, nonwhite race, comorbidity burden, severity of illness, dementia, functional dependence, nursing home residence, psychoactive medications given, and admission status. The interaction between an abnormal RASS and APS (severity of illness) had a P value of 0.52. The interaction between an abnormal RASS and benzodiazepine or opioid medication administration had a P value of 0.38. The interaction between an abnormal RASS and admission status had a P value of 0.57. This indicated that severity of illness, psychoactive medication administration, and admission status did not modify the relationship between an abnormal RASS and 6‐month mortality.
We analyzed a subset of 406 patients who received a psychiatrist's assessment to determine if an abnormal RASS was associated with 6‐month mortality regardless of delirium status using Cox proportional hazard regression weighted by the inverse of the propensity score. Patients with an abnormal RASS and no delirium were significantly associated with higher mortality compared to those with a normal RASS (HR: 2.20, 95% CI: 1.10‐4.41). Patients with an abnormal RASS with delirium also had an increased risk for 6‐month mortality (HR: 2.86, 95% CI: 1.29‐6.34).
All regression models were internally validated. There was no evidence of substantial overfitting or collinearity. The Schoenfeld residuals for each model were examined graphically and there was good model fit overall, and no significant outliers were observed.
DISCUSSION
Vital sign measurements are a fundamental component of patient care, and abnormalities can serve as an early warning signal of the patient's clinical deterioration. However, traditional vital signs do not include an assessment of the patient's brain function. Our chief finding is that impaired arousal at initial presentation, as determined by the nonphysician research staff, increased the risk of 6‐month mortality by 73% after adjusting for confounders in a diverse group of acutely ill older patients. This relationship existed regardless of severity of illness, administration of psychoactive medications, and admission status. Though impaired arousal is closely linked with delirium,[2, 24] which is another well‐known predictor of mortality,[11, 25, 26] the prognostic significance of impaired arousal appeared to extend beyond delirium. We observed that the relationship between 6‐month mortality and impaired arousal in the absence of delirium was remarkably similar to that observed with impaired arousal with delirium. Arousal can be assessed for by simply observing the patient during routine clinical care and can be performed by nonphysician and physician healthcare providers. Its assessment should be performed and communicated in conjunction with traditional vital sign measurements in the emergency department and inpatient settings.[1]
Most of the data linking impaired arousal to death have been collected in the ICU. Coma, which represents the most severe form of depressed arousal, has been shown to increase the likelihood of death regardless of underlying etiology.[27, 28, 29, 30, 31] This includes patients who have impaired arousal because they received sedative medications during mechanical ventilation.[32] Few studies have investigated the effect of impaired arousal in a non‐ICU patient population. Zuliani et al. observed that impaired arousal was associated with 30‐day mortality, but their study was conducted in 469 older stroke patients, limiting the study's external validity to a more general patient population.[33] Our data advance the current stage of knowledge; we observed a similar relationship between impaired arousal and 6‐month mortality in a much broader clinical population who were predominantly not critically ill regardless of delirium status. Additionally, most of our impaired arousal cohort had a RASS of 1, indicating that even subtle abnormalities portended adverse outcomes.
In addition to long‐term prognosis, the presence of impaired arousal has immediate clinical implications. Using arousal scales like the RASS can serve as a way for healthcare providers to succinctly communicate the patient's mental status in a standardized manner during transitions of care (eg, emergency physician to inpatient team). Regardless of which clinical setting they are in, older acutely ill patients with an impaired arousal may also require close monitoring, especially if the impairment is acute. Because of its close relationship with delirium, these patients likely have an underlying acute medical illness that precipitated their impaired arousal.
Understanding the true clinical significance of impaired arousal in the absence of delirium requires further study. Because of the fluctuating nature of delirium, it is possible that these patients may have initially been delirious and then became nondelirious during the psychiatrist's evaluation. Conversely, it is also possible that these patients may have eventually transitioned into delirium at later point in time; the presence of impaired arousal alone may be a precursor to delirium. Last, these patients may have had subsyndromal delirium, which is defined as having 1 or more delirium symptoms without ever meeting full DSM‐IV‐TR criteria for delirium.[34] Patients with subsyndromal delirium have poorer outcomes, such as prolonged hospitalizations, and higher mortality than patients without delirium symptoms.[34]
Additional studies are also needed to further clarify the impact of impaired arousal on nonmortality outcomes such as functional and cognitive decline. The prognostic significance of serial arousal measurements also requires further study. It is possible that patients whose impaired arousal rapidly resolves after an intervention may have better prognoses than those who have persistent impairment. The measurement of arousal may have additional clinical applications in disease prognosis models. The presence of altered mental status is incorporated in various disease‐specific risk scores such as the CURB‐65 or Pneumonia Severity Index for pneumonia,[35, 36] and the Pulmonary Embolism Severity Index for pulmonary embolism.[37] However, the definition of altered mental status is highly variable; it ranges from subjective impressions that can be unreliable to formal cognitive testing, which can be time consuming. Arousal scales such as the RASS may allow for more feasible, reliable, and standardized assessment of mental status. Future studies should investigate if incorporating the RASS would improve the discrimination of these disease‐severity indices.
This study has several notable limitations. We excluded patients with a RASS of 4 and 5, which represented comatose patients. This exclusion, however, likely biased our findings toward the null. We enrolled a convenience sample that may have introduced selection bias. However, our enrolled cohort was similar to all potentially eligible patients who presented to the emergency department during the study period. We also attempted to mitigate this selection bias by using multivariable regression and adjusting for factors that may have confounded the relationship between RASS and 6‐month mortality. This study was performed at a single, urban, academic hospital and enrolled patients who were aged 65 years and older. Our findings may not be generalizable to other settings and to those who are under 65 years of age. Because 406 patients received a psychiatric evaluation, this limited the number of covariates that could be incorporated into the multivariable model to evaluate if impaired arousal in the absence of delirium is associated with 6‐month mortality. To minimize residual confounding, we used the inverse weighted propensity score, but we acknowledge that this bias may still exist. Larger studies are needed to clarify the relationships between arousal, delirium, and mortality.
CONCLUSION
In conclusion, impaired arousal at initial presentation is an independent predictor for 6‐month mortality in a diverse group of acutely ill older patients, and this risk appears to be present even in the absence of delirium. Because of its ease of use and prognostic significance, it may be a useful vital sign for underlying brain dysfunction. Routine standardized assessment and communication of arousal during routine clinical care may be warranted.
Disclosures: Research reported in this publication was supported by the Vanderbilt Physician Scientist Development Award, Emergency Medicine Foundation, and National Institute on Aging of the National Institutes of Health under award number K23AG032355. This study was also supported by the National Center for Research Resources, grant UL1 RR024975‐01, and is now at the National Center for Advancing Translational Sciences, grant 2 UL1 TR000445‐06. Dr. Vasilevskis was supported in part by the National Institute on Aging of the National Institutes of Health under award number K23AG040157. Dr. Powers was supported by Health Resources and Services Administration Geriatric Education Centers, grant 1D31HP08823‐01‐00. Dr. Storrow was supported by the National Heart, Lung, and Blood Institute of the National Institutes of Health under award number K12HL1090 and the National Center for Advancing Translational Sciences under award number UL1TR000445. Dr. Ely was supported in part by the National Institute on Aging of the National Institutes of Health under award numbers R01AG027472 and R01AG035117, and a Veteran Affairs MERIT award. Drs. Vasilevskis, Schnelle, Dittus, Powers, and Ely were supported by the Veteran Affairs Geriatric Research, Education, and Clinical Center. The content is solely the responsibility of the authors and does not necessarily represent the official views of Vanderbilt University, Emergency Medicine Foundation, National Institutes of Health, and Veterans Affairs. The funding agencies did not have any role in the design and conduct of the study; collection, management, analysis, and interpretation of the data; and preparation, review, or approval of the manuscript.
J.H.H., E.W.E., J.F.S., A.B.S., and R.D.S. conceived the trial. J.H.H., E.W.E., A.B.S., J.F.S., R.D.S., A.S., and A.W. participated in the study design. J.H.H. and A.W. recruited patients and collected the data. J.H.H., A.J.G., and A.S. analyzed the data. All authors participated in the interpretation of results. J.H.H. drafted the manuscript, and all authors contributed to the critical review and revision of the manuscript.
The authors report no conflicts of interest.
- , , , et al. The development of a mental status vital sign for use across the spectrum of care. J Am Med Dir Assoc. 2009;10:379–380.
- , , , . Serial administration of a modified Richmond Agitation and Sedation Scale for delirium screening. J Hosp Med. 2012;7:450–453.
- , , , , , . Clarifying confusion: the confusion assessment method. A new method for detection of delirium. Ann Intern Med. 1990;113:941–948.
- , , , et al. Delirium in mechanically ventilated patients: validity and reliability of the confusion assessment method for the intensive care unit (CAM‐ICU). JAMA. 2001;286:2703–2710.
- , , , et al. Diagnosing delirium in older emergency department patients: validity and reliability of the Delirium Triage Screen And The Brief Confusion Assessment Method. Ann Emerg Med. 2013;62:457–465.
- , , , , . Does delirium contribute to poor hospital outcomes? A three‐site epidemiologic study. J Gen Intern Med. 1998;13:234–242.
- , , , . Prognostic significance of delirium in frail older people. Dement Geriatr Cogn Disord. 2005;19:158–163.
- , , , , , . Delirium in elderly patients and the risk of postdischarge mortality, institutionalization, and dementia: a meta‐analysis. JAMA. 2010;304:443–451.
- , , , , . One‐year health care costs associated with delirium in the elderly population. Arch Intern Med. 2008;168:27–32.
- , , , et al. The Richmond Agitation‐Sedation Scale: validity and reliability in adult intensive care unit patients. Am J Respir Crit Care Med. 2002;166:1338–1344.
- , , , et al. Delirium in the emergency department: an independent predictor of death within 6 months. Ann Emerg Med. 2010;56:244–252.
- , , , et al. Delirium in older emergency department patients is an independent predictor of hospital length of stay. Acad Emerg Med. 2011;18:451–457.
- , , , et al. Validation of the Confusion Assessment Method For The Intensive Care Unit in older emergency department patients. Acad Emerg Med. 2014;21:180–187.
- , , , et al. Monitoring sedation status over time in ICU patients: reliability and validity of the Richmond Agitation‐Sedation Scale (RASS). JAMA. 2003;289:2983–2991.
- , , , . Does this patient have dementia? JAMA. 2007;297:2391–2404.
- . A short form of the Informant Questionnaire on Cognitive Decline in the Elderly (IQCODE): development and cross‐validation. Psychol Med. 1994;24:145–153.
- . Assessing self‐maintenance: activities of daily living, mobility, and instrumental activities of daily living. J Am Geriatr Soc. 1983;31:721–727.
- , , , , . Charlson Index is associated with one‐year mortality in emergency department patients with suspected infection. Acad Emerg Med. 2006;13:530–536.
- , , , . APACHE II: a severity of disease classification system. Crit Care Med. 1985;13:818–829.
- American Psychiatric Association. Task Force on DSM‐IV. Diagnostic and Statistical Manual of Mental Disorders: DSM‐IV‐TR. 4th ed. Washington, DC: American Psychiatric Association; 2000.
- . Regression Modeling Strategies: With Applications to Linear Models, Logistic Regression, and Survival Analysis. New York, NY: Springer; 2001.
- . Power for tests of interaction: effect of raising the Type I error rate. Epidemiol Perspect Innov. 2007;4:4.
- . An Introduction to Propensity Score Methods for Reducing the Effects of Confounding in Observational Studies. Multivariate Behav Res. 2011;46:399–424.
- , , . Defining delirium for the International Classification of Diseases, 11th Revision. J Psychosom Res. 2008;65:207–214.
- , , , , . Delirium predicts 12‐month mortality. Arch Intern Med. 2002;162:457–463.
- , , , et al. Delirium as a predictor of mortality in mechanically ventilated patients in the intensive care unit. JAMA. 2004;291:1753–1762.
- , , . Predicting mortality of intensive care unit patients. The importance of coma. Crit Care Med. 1982;10:86–95.
- , . Assessment of outcome after severe brain damage. Lancet. 1975;1:480–484.
- , , , , , . Predicting outcome from hypoxic‐ischemic coma. JAMA. 1985;253:1420–1426.
- , , , et al. Prediction of intracerebral hemorrhage survival. Ann Neurol. 1988;24:258–263.
- , , , . Is this patient dead, vegetative, or severely neurologically impaired? Assessing outcome for comatose survivors of cardiac arrest. JAMA. 2004;291:870–879.
- , , , et al. Early intensive care sedation predicts long‐term mortality in ventilated critically ill patients. Am J Respir Crit Care Med. 2012;186:724–731.
- , , , , , . Risk factors for short‐term mortality in older subjects with acute ischemic stroke. Gerontology. 2006;52:231–236.
- , , , . The prognostic significance of subsyndromal delirium in elderly medical inpatients. J Am Geriatr Soc. 2003;51:754–760.
- , , , et al. Defining community acquired pneumonia severity on presentation to hospital: an international derivation and validation study. Thorax. 2003;58:377–382.
- , , , et al. A prediction rule to identify low‐risk patients with community‐acquired pneumonia. N Engl J Med. 1997;336:243–250.
- , , , et al. Derivation and validation of a prognostic model for pulmonary embolism. Am J Respir Crit Care Med. 2005;172:1041–1046.
Arousal is defined as the patient's overall level of responsiveness to the environment. Its assessment is standard of care in most intensive care units (ICUs) to monitor depth of sedation and underlying brain dysfunction. There has been recent interest in expanding the role of arousal assessment beyond the ICU. Specifically, the Veterans Affairs Delirium Working Group proposed that simple arousal assessment be a vital sign to quantify underlying brain dysfunction.[1] The rationale is that impaired arousal is closely linked with delirium,[2] and is an integral component of multiple delirium assessments.[3, 4, 5] Chester et al. observed that the presence of impaired arousal was 64% sensitive and 93% specific for delirium diagnosed by a psychiatrist.[2] Delirium is an under‐recognized public health problem that affects up to 25% of older hospitalized patients,[6, 7] is associated with a multitude of adverse outcomes such as death and accelerated cognitive decline,[8] and costs the US healthcare system an excess of $152 billion dollars.[9]
Most delirium assessments require the patient to undergo additional cognitive testing. The assessment of arousal, however, requires the rater to merely observe the patient during routine clinical care and can be easily integrated into the clinical workflow.[10] Because of its simplicity and brevity, assessing arousal alone using validated scales such as the Richmond Agitation‐Sedation Scale (RASS) may be a more appealing alternative to traditional, more complex delirium screening in the acute care setting. Its clinical utility would be further strengthened if impaired arousal was also associated with mortality, and conferred risk even in the absence of delirium. As a result, we sought to determine if impaired arousal at initial presentation in older acutely ill patients predicted 6‐month mortality and whether this relationship was present in the absence of delirium.
METHODS
Design Overview
We performed a planned secondary analysis of 2 prospective cohorts that enrolled patients from May 2007 to August 2008 between 8 am and 10 pm during the weekdays, and July 2009 to February 2012 between 8 am and 4 pm during the weekdays. The first cohort was designed to evaluate the relationship between delirium and patient outcomes.[11, 12] The second cohort was used to validate brief delirium assessments using a psychiatrist's assessment as the reference standard.[5, 13] The local institutional review board approved these studies.
Setting and Participants
These studies were conducted in an urban emergency department located within an academic, tertiary care hospital with over 57,000 visits annually. Patients were included if they were 65 years or older and in the emergency department for <12 hours at the time of enrollment. The 12‐hour cutoff was used to include patients who presented to the emergency department in the evening and early morning hours. Patients were excluded if they were previously enrolled, non‐English speaking, comatose, or were nonverbal and unable to follow simple commands prior to the acute illness. Because the July 2009 to February 2012 cohort was designed to validate delirium assessments with auditory and visual components, patients were also excluded if they were deaf or blind.
Measurement of Arousal
RASS is an arousal scale commonly used in ICUs to assess depth of sedation and ranges from 5 (unarousable) to +4 (combative); 0 represents normal arousal.[10, 14] The RASS simply requires the rater to observe the patient during their routine interactions and does not require any additional cognitive testing. The RASS terms sedation was modified to drowsy (Table 1), because we wanted to capture impaired arousal regardless of sedation administration. We did not use the modified RASS (mRASS) proposed by the Veteran's Affairs Delirium Working Group, because it was published after data collection began.[1] The mRASS is very similar to the RASS, except it also incorporates a very informal inattention assessment. The RASS was ascertained by research assistants who were college students and graduates, and emergency medical technician basics and paramedics. The principal investigator gave them a 5‐minute didactic lecture about the RASS and observed them perform the RASS in at least 5 patients prior to the start of the study. Inter‐rater reliability between trained research assistants and a physician was assessed for 456 (42.0%) patients of the study sample. The weighted kappa of the RASS was 0.61, indicating very good inter‐rater reliability. Because the 81.7% of patients with impaired arousal had a RASS of 1, the RASS dichotomized as normal (RASS=0) or impaired (RASS other than 0).
| Score | Term | Description |
|---|---|---|
| ||
| +4 | Combative | Overtly combative, violent, immediate danger to staff |
| +3 | Very agitated | Pulls or removes tube(s) or catheter(s), aggressive |
| +2 | Agitated | Frequent nonpurposeful movement |
| +1 | Restless | Anxious but movements not aggressive or vigorous |
| 0 | Alert and calm | |
| 1 | Slight drowsy | Not fully alert, but has sustained awakening (eye opening/eye contact) to voice (>10 seconds) |
| 2 | Moderately drowsy | Briefly awakens with eye contact to voice (<10 seconds) |
| 3 | Very drowsy | Movement or eye opening to voice (but no eye contact) |
| 4 | Awakens to pain only | No response to voice, but movement or eye opening to physical stimulation |
| 5 | Unarousable | No response to voice or physical stimulation |
Death Ascertainment
Death within 6 months was ascertained using the following algorithm: (1) The electronic medical record was searched to determine the patient's death status. (2) Patients who had a documented emergency department visit, outpatient clinic visit, or hospitalization after 6 months were considered to be alive at 6 months. (3) For the remaining patients, date of death was searched in the Social Security Death Index (SSDI). (4) Patients without a death recorded in the SSDI 1 year after the index visit was considered to be alive at 6 months. Nine hundred thirty‐one (85.9%) out of 1084 patients had a recorded death in the medical record or SSDI, or had an emergency department or hospital visit documented in their record 6 months after the index visit.
Additional Variables Collected
Patients were considered to have dementia if they had: (1) documented dementia in the medical record, (2) a short form Informant Questionnaire on Cognitive Decline in the Elderly score (IQCODE) greater than 3.38,[15] or (3) prescribed cholinesterase inhibitors prior to admission. The short form IQCODE is an informant questionnaire with 16 items; a cutoff of 3.38 out of 5.00 is 79% sensitive and 82% specific for dementia.[16] Premorbid functional status was determined by the Katz Activities of Daily Living (Katz ADL) and ranges from 0 (completely dependent) to 6 (completely independent).[17] Patients with a score <5 were considered to be functionally dependent. Both the IQCODE and Katz ADL were prospectively collected in the emergency department at the time of enrollment.
The Charlson Comorbidity Index was used to measure comorbid burden.[18] The Acute Physiology Score (APS) of the Acute Physiology and Chronic Health Evaluation II score was used to quantify severity of illness.[19] The Glasgow Coma Scale was not included in the APS because it was not collected. Intravenous, intramuscular, and oral benzodiazepine and opioids given in the prehospital and emergency department were also recorded. The Charlson Comorbidity Index, APS, and benzodiazepine and opioid administration were collected after patient enrollment using the electronic medical record.
Within 3 hours of the RASS, a subset of 406 patients was evaluated by a consultation‐liaison psychiatrist who determined the patient's delirium status using Diagnostic and Statistical Manual of Mental Disorders, Fourth Edition, Text Revision (DSM‐IV‐TR) criteria.[20] Details of their comprehensive assessments have been described in a previous report.[5]
Statistical Analysis
Measures of central tendency and dispersion for continuous variables were reported as medians and interquartile ranges. Categorical variables were reported as proportions. For simple comparisons, Wilcoxon rank sum tests were performed for continuous data, and 2 analyses or Fisher exact test were performed for categorical data. To evaluate the predictive validity of impaired arousal on 6‐month mortality, the cumulative probability of survival was estimated within 6 months from the study enrollment date using the Kaplan‐Meier method. Cox proportional hazards regression was performed to assess if impaired arousal was independently associated with 6‐month mortality after adjusting for age, gender, nonwhite race, comorbidity burden (Charlson Comorbidity Index), severity of illness (APS), dementia, functional dependence (Katz ADL <5), nursing home residence, admission status, and benzodiazepine or opioid medication administration. Patients were censored at the end of 6 months. The selection of covariates was based upon expert opinion and literature review. The number of covariates used for the model was limited by the number of events to minimize overfitting; 1 df was allowed for every 10 to 15 events.[21] Because severity of illness, psychoactive medication administration, and admission status might modify the relationship between 6‐month mortality and impaired arousal, 2‐way interaction terms were incorporated. To maintain parsimony and minimize overfitting and collinearity, nonsignificant interaction terms (P>0.20) were removed in the final model.[22] Hazard ratios (HR) with their 95% confidence interval (95% CI) were reported.
To determine if arousal was associated with 6‐month mortality in the absence of delirium, we performed another Cox proportional hazard regression in a subset of 406 patients who received a psychiatrist assessment. Six‐month mortality was the dependent variable, and the independent variable was a 3‐level categorical variable of different arousal/delirium combinations: (1) impaired arousal/delirium positive, (2) impaired arousal/delirium negative, and (3) normal arousal (with or without delirium). Because there were only 8 patients who had normal arousal with delirium, this group was collapsed into the normal arousal without delirium group. Because there were 55 deaths, the number of covariates that could be entered into the Cox proportional hazard regression model was limited. We used the inverse weighted propensity score method to help minimize residual confounding.[23] Traditional propensity score adjustment could not be performed because there were 3 arousal/delirium categories. Similar to propensity score adjustment, inverse weighted propensity score method was used to help balance the distribution of patient characteristics among the exposure groups and also allow adjustment for multiple confounders while minimizing the degrees of freedom expended. A propensity score was the probability of having a particular arousal/delirium category based upon baseline patient characteristics. Multinomial logistic regression was performed to calculate the propensity score, and the baseline covariates used were age, gender, nonwhite race, comorbidity burden, severity of illness, dementia, functional dependence, and nursing home residence. For the Cox proportional hazard regression model, each observation was weighted by the inverse of the propensity score for their given arousal/delirium category; propensity scores exceeding the 95th percentile were trimmed to avoid overly influential weighting. Benzodiazepine and opioid medications given in the emergency department and admission status were adjusted as covariates in the weighted Cox proportional hazard regression model.
Nineteen patients (1.8%) had missing Katz ADL; these missing values were imputed using multiple imputation. The reliability of the final regression models were internally validated using the bootstrap method.[21] Two thousand sets of bootstrap samples were generated by resampling the original data, and the optimism was estimated to determine the degree of overfitting.[21] An optimism value >0.85 indicated no evidence of substantial overfitting.[21] Variance inflation factors were used to check multicollinearity. Schoenfeld residuals were also analyzed to determine goodness‐of‐fit and assess for outliers. P values <0.05 were considered statistically significant. All statistical analyses were performed using SAS version 9.4 (SAS Institute, Cary, NC) and open source R statistical software version 3.0.1 (
RESULTS
A total of 1903 patients were screened, and 1084 patients met enrollment criteria (Figure 1). Of these, 1051 (97.0%) were non‐ICU patients. Patient characteristics of this cohort can be seen in Table 2. Enrolled patients and potentially eligible patients who presented to the emergency department during the enrollment window were similar in age, gender, and severity of illness, but enrolled patients were slightly more likely to have a chief complaint of chest pain and syncope (unpublished data).
| Variables | Normal Arousal, n=835 | Impaired Arousal, n=249 | P Value |
|---|---|---|---|
| |||
| Median age, y (IQR) | 74 (6980) | 75 (7083) | 0.005 |
| Female gender | 459 (55.0%) | 132 (53.0%) | 0.586 |
| Nonwhite race | 122 (14.6%) | 51 (20.5%) | 0.027 |
| Residence | <0.001 | ||
| Home | 752 (90.1%) | 204 (81.9%) | |
| Assisted living | 29 (3.5%) | 13 (5.2%) | |
| Rehabilitation | 8 (1.0%) | 5 (2.0%) | |
| Nursing home | 42 (5.0%) | 27 (10.8%) | |
| Dementia* | 175 (21.0%) | 119 (47.8%) | <0.001 |
| Dependent | 120 (14.4%) | 99 (39.8%) | <0.001 |
| Median Charlson (IQR) | 2 (1, 4) | 3 (2, 5) | <0.001 |
| Median APS (IQR) | 2 (1, 4) | 2 (1, 5) | <0.001 |
| Primary complaint | <0.001 | ||
| Abdominal pain | 45 (5.4%) | 13 (5.2%) | |
| Altered mental status | 12 (1.4%) | 36 (14.5%) | |
| Chest pain | 128 (15.3%) | 31 (12.5%) | |
| Disturbances of sensation | 17 (2.0%) | 2 (0.8%) | |
| Dizziness | 16 (1.9%) | 2 (0.8%) | |
| Fever | 11 (1.3%) | 7 (2.8%) | |
| General illness, malaise | 26 (3.1%) | 5 (2.0%) | |
| General weakness | 68 (8.1%) | 29 (11.7%) | |
| Nausea/vomiting | 29 (3.5%) | 4 (1.6%) | |
| Shortness of breath | 85 (10.2%) | 21 (8.4%) | |
| Syncope | 46 (5.5%) | 10 (4.0%) | |
| Trauma, multiple organs | 19 (2.3%) | 8 (3.2%) | |
| Other | 333 (39.9%) | 81 (32.5%) | |
| Benzodiazepines or opioid medications administration | 188 (22.5%) | 67 (26.9%) | 0.152 |
| Admitted to the hospital | 478 (57.3%) | 191 (76.7%) | 0.002 |
| Internal medicine | 411 (86.0%) | 153 (80.1%) | |
| Surgery | 38 (8.0%) | 21 (11.0%) | |
| Neurology | 19 (4.0%) | 13 (6.8%) | |
| Psychiatry | 1 (0.2%) | 2 (1.1%) | |
| Unknown/missing | 9 (1.9%) | 2 (1.1%) | |
| Death within 6 months | 81 (9.7%) | 59 (23.7%) | <0.001 |
Of those enrolled, 249 (23.0%) had an abnormal RASS at initial presentation, and their distribution can be seen in Figure 2. Within 6 months, patients with an abnormal RASS were more likely to die compared with patients with a RASS of 0 (23.7% vs 9.7%, P<0.001). The Kaplan‐Meier survival curves for all enrolled patients with impaired and normal RASS can be seen in Figure 3; the survival curve declined more slowly in patients with a normal RASS compared with those with an abnormal RASS.
Using Cox proportional hazards regression, the relationship between an abnormal RASS at initial presentation and 6‐month mortality persisted (HR: 1.73, 95% CI: 1.21‐2.49) after adjusting for age, sex, nonwhite race, comorbidity burden, severity of illness, dementia, functional dependence, nursing home residence, psychoactive medications given, and admission status. The interaction between an abnormal RASS and APS (severity of illness) had a P value of 0.52. The interaction between an abnormal RASS and benzodiazepine or opioid medication administration had a P value of 0.38. The interaction between an abnormal RASS and admission status had a P value of 0.57. This indicated that severity of illness, psychoactive medication administration, and admission status did not modify the relationship between an abnormal RASS and 6‐month mortality.
We analyzed a subset of 406 patients who received a psychiatrist's assessment to determine if an abnormal RASS was associated with 6‐month mortality regardless of delirium status using Cox proportional hazard regression weighted by the inverse of the propensity score. Patients with an abnormal RASS and no delirium were significantly associated with higher mortality compared to those with a normal RASS (HR: 2.20, 95% CI: 1.10‐4.41). Patients with an abnormal RASS with delirium also had an increased risk for 6‐month mortality (HR: 2.86, 95% CI: 1.29‐6.34).
All regression models were internally validated. There was no evidence of substantial overfitting or collinearity. The Schoenfeld residuals for each model were examined graphically and there was good model fit overall, and no significant outliers were observed.
DISCUSSION
Vital sign measurements are a fundamental component of patient care, and abnormalities can serve as an early warning signal of the patient's clinical deterioration. However, traditional vital signs do not include an assessment of the patient's brain function. Our chief finding is that impaired arousal at initial presentation, as determined by the nonphysician research staff, increased the risk of 6‐month mortality by 73% after adjusting for confounders in a diverse group of acutely ill older patients. This relationship existed regardless of severity of illness, administration of psychoactive medications, and admission status. Though impaired arousal is closely linked with delirium,[2, 24] which is another well‐known predictor of mortality,[11, 25, 26] the prognostic significance of impaired arousal appeared to extend beyond delirium. We observed that the relationship between 6‐month mortality and impaired arousal in the absence of delirium was remarkably similar to that observed with impaired arousal with delirium. Arousal can be assessed for by simply observing the patient during routine clinical care and can be performed by nonphysician and physician healthcare providers. Its assessment should be performed and communicated in conjunction with traditional vital sign measurements in the emergency department and inpatient settings.[1]
Most of the data linking impaired arousal to death have been collected in the ICU. Coma, which represents the most severe form of depressed arousal, has been shown to increase the likelihood of death regardless of underlying etiology.[27, 28, 29, 30, 31] This includes patients who have impaired arousal because they received sedative medications during mechanical ventilation.[32] Few studies have investigated the effect of impaired arousal in a non‐ICU patient population. Zuliani et al. observed that impaired arousal was associated with 30‐day mortality, but their study was conducted in 469 older stroke patients, limiting the study's external validity to a more general patient population.[33] Our data advance the current stage of knowledge; we observed a similar relationship between impaired arousal and 6‐month mortality in a much broader clinical population who were predominantly not critically ill regardless of delirium status. Additionally, most of our impaired arousal cohort had a RASS of 1, indicating that even subtle abnormalities portended adverse outcomes.
In addition to long‐term prognosis, the presence of impaired arousal has immediate clinical implications. Using arousal scales like the RASS can serve as a way for healthcare providers to succinctly communicate the patient's mental status in a standardized manner during transitions of care (eg, emergency physician to inpatient team). Regardless of which clinical setting they are in, older acutely ill patients with an impaired arousal may also require close monitoring, especially if the impairment is acute. Because of its close relationship with delirium, these patients likely have an underlying acute medical illness that precipitated their impaired arousal.
Understanding the true clinical significance of impaired arousal in the absence of delirium requires further study. Because of the fluctuating nature of delirium, it is possible that these patients may have initially been delirious and then became nondelirious during the psychiatrist's evaluation. Conversely, it is also possible that these patients may have eventually transitioned into delirium at later point in time; the presence of impaired arousal alone may be a precursor to delirium. Last, these patients may have had subsyndromal delirium, which is defined as having 1 or more delirium symptoms without ever meeting full DSM‐IV‐TR criteria for delirium.[34] Patients with subsyndromal delirium have poorer outcomes, such as prolonged hospitalizations, and higher mortality than patients without delirium symptoms.[34]
Additional studies are also needed to further clarify the impact of impaired arousal on nonmortality outcomes such as functional and cognitive decline. The prognostic significance of serial arousal measurements also requires further study. It is possible that patients whose impaired arousal rapidly resolves after an intervention may have better prognoses than those who have persistent impairment. The measurement of arousal may have additional clinical applications in disease prognosis models. The presence of altered mental status is incorporated in various disease‐specific risk scores such as the CURB‐65 or Pneumonia Severity Index for pneumonia,[35, 36] and the Pulmonary Embolism Severity Index for pulmonary embolism.[37] However, the definition of altered mental status is highly variable; it ranges from subjective impressions that can be unreliable to formal cognitive testing, which can be time consuming. Arousal scales such as the RASS may allow for more feasible, reliable, and standardized assessment of mental status. Future studies should investigate if incorporating the RASS would improve the discrimination of these disease‐severity indices.
This study has several notable limitations. We excluded patients with a RASS of 4 and 5, which represented comatose patients. This exclusion, however, likely biased our findings toward the null. We enrolled a convenience sample that may have introduced selection bias. However, our enrolled cohort was similar to all potentially eligible patients who presented to the emergency department during the study period. We also attempted to mitigate this selection bias by using multivariable regression and adjusting for factors that may have confounded the relationship between RASS and 6‐month mortality. This study was performed at a single, urban, academic hospital and enrolled patients who were aged 65 years and older. Our findings may not be generalizable to other settings and to those who are under 65 years of age. Because 406 patients received a psychiatric evaluation, this limited the number of covariates that could be incorporated into the multivariable model to evaluate if impaired arousal in the absence of delirium is associated with 6‐month mortality. To minimize residual confounding, we used the inverse weighted propensity score, but we acknowledge that this bias may still exist. Larger studies are needed to clarify the relationships between arousal, delirium, and mortality.
CONCLUSION
In conclusion, impaired arousal at initial presentation is an independent predictor for 6‐month mortality in a diverse group of acutely ill older patients, and this risk appears to be present even in the absence of delirium. Because of its ease of use and prognostic significance, it may be a useful vital sign for underlying brain dysfunction. Routine standardized assessment and communication of arousal during routine clinical care may be warranted.
Disclosures: Research reported in this publication was supported by the Vanderbilt Physician Scientist Development Award, Emergency Medicine Foundation, and National Institute on Aging of the National Institutes of Health under award number K23AG032355. This study was also supported by the National Center for Research Resources, grant UL1 RR024975‐01, and is now at the National Center for Advancing Translational Sciences, grant 2 UL1 TR000445‐06. Dr. Vasilevskis was supported in part by the National Institute on Aging of the National Institutes of Health under award number K23AG040157. Dr. Powers was supported by Health Resources and Services Administration Geriatric Education Centers, grant 1D31HP08823‐01‐00. Dr. Storrow was supported by the National Heart, Lung, and Blood Institute of the National Institutes of Health under award number K12HL1090 and the National Center for Advancing Translational Sciences under award number UL1TR000445. Dr. Ely was supported in part by the National Institute on Aging of the National Institutes of Health under award numbers R01AG027472 and R01AG035117, and a Veteran Affairs MERIT award. Drs. Vasilevskis, Schnelle, Dittus, Powers, and Ely were supported by the Veteran Affairs Geriatric Research, Education, and Clinical Center. The content is solely the responsibility of the authors and does not necessarily represent the official views of Vanderbilt University, Emergency Medicine Foundation, National Institutes of Health, and Veterans Affairs. The funding agencies did not have any role in the design and conduct of the study; collection, management, analysis, and interpretation of the data; and preparation, review, or approval of the manuscript.
J.H.H., E.W.E., J.F.S., A.B.S., and R.D.S. conceived the trial. J.H.H., E.W.E., A.B.S., J.F.S., R.D.S., A.S., and A.W. participated in the study design. J.H.H. and A.W. recruited patients and collected the data. J.H.H., A.J.G., and A.S. analyzed the data. All authors participated in the interpretation of results. J.H.H. drafted the manuscript, and all authors contributed to the critical review and revision of the manuscript.
The authors report no conflicts of interest.
- , , , et al. The development of a mental status vital sign for use across the spectrum of care. J Am Med Dir Assoc. 2009;10:379–380.
- , , , . Serial administration of a modified Richmond Agitation and Sedation Scale for delirium screening. J Hosp Med. 2012;7:450–453.
- , , , , , . Clarifying confusion: the confusion assessment method. A new method for detection of delirium. Ann Intern Med. 1990;113:941–948.
- , , , et al. Delirium in mechanically ventilated patients: validity and reliability of the confusion assessment method for the intensive care unit (CAM‐ICU). JAMA. 2001;286:2703–2710.
- , , , et al. Diagnosing delirium in older emergency department patients: validity and reliability of the Delirium Triage Screen And The Brief Confusion Assessment Method. Ann Emerg Med. 2013;62:457–465.
- , , , , . Does delirium contribute to poor hospital outcomes? A three‐site epidemiologic study. J Gen Intern Med. 1998;13:234–242.
- , , , . Prognostic significance of delirium in frail older people. Dement Geriatr Cogn Disord. 2005;19:158–163.
- , , , , , . Delirium in elderly patients and the risk of postdischarge mortality, institutionalization, and dementia: a meta‐analysis. JAMA. 2010;304:443–451.
- , , , , . One‐year health care costs associated with delirium in the elderly population. Arch Intern Med. 2008;168:27–32.
- , , , et al. The Richmond Agitation‐Sedation Scale: validity and reliability in adult intensive care unit patients. Am J Respir Crit Care Med. 2002;166:1338–1344.
- , , , et al. Delirium in the emergency department: an independent predictor of death within 6 months. Ann Emerg Med. 2010;56:244–252.
- , , , et al. Delirium in older emergency department patients is an independent predictor of hospital length of stay. Acad Emerg Med. 2011;18:451–457.
- , , , et al. Validation of the Confusion Assessment Method For The Intensive Care Unit in older emergency department patients. Acad Emerg Med. 2014;21:180–187.
- , , , et al. Monitoring sedation status over time in ICU patients: reliability and validity of the Richmond Agitation‐Sedation Scale (RASS). JAMA. 2003;289:2983–2991.
- , , , . Does this patient have dementia? JAMA. 2007;297:2391–2404.
- . A short form of the Informant Questionnaire on Cognitive Decline in the Elderly (IQCODE): development and cross‐validation. Psychol Med. 1994;24:145–153.
- . Assessing self‐maintenance: activities of daily living, mobility, and instrumental activities of daily living. J Am Geriatr Soc. 1983;31:721–727.
- , , , , . Charlson Index is associated with one‐year mortality in emergency department patients with suspected infection. Acad Emerg Med. 2006;13:530–536.
- , , , . APACHE II: a severity of disease classification system. Crit Care Med. 1985;13:818–829.
- American Psychiatric Association. Task Force on DSM‐IV. Diagnostic and Statistical Manual of Mental Disorders: DSM‐IV‐TR. 4th ed. Washington, DC: American Psychiatric Association; 2000.
- . Regression Modeling Strategies: With Applications to Linear Models, Logistic Regression, and Survival Analysis. New York, NY: Springer; 2001.
- . Power for tests of interaction: effect of raising the Type I error rate. Epidemiol Perspect Innov. 2007;4:4.
- . An Introduction to Propensity Score Methods for Reducing the Effects of Confounding in Observational Studies. Multivariate Behav Res. 2011;46:399–424.
- , , . Defining delirium for the International Classification of Diseases, 11th Revision. J Psychosom Res. 2008;65:207–214.
- , , , , . Delirium predicts 12‐month mortality. Arch Intern Med. 2002;162:457–463.
- , , , et al. Delirium as a predictor of mortality in mechanically ventilated patients in the intensive care unit. JAMA. 2004;291:1753–1762.
- , , . Predicting mortality of intensive care unit patients. The importance of coma. Crit Care Med. 1982;10:86–95.
- , . Assessment of outcome after severe brain damage. Lancet. 1975;1:480–484.
- , , , , , . Predicting outcome from hypoxic‐ischemic coma. JAMA. 1985;253:1420–1426.
- , , , et al. Prediction of intracerebral hemorrhage survival. Ann Neurol. 1988;24:258–263.
- , , , . Is this patient dead, vegetative, or severely neurologically impaired? Assessing outcome for comatose survivors of cardiac arrest. JAMA. 2004;291:870–879.
- , , , et al. Early intensive care sedation predicts long‐term mortality in ventilated critically ill patients. Am J Respir Crit Care Med. 2012;186:724–731.
- , , , , , . Risk factors for short‐term mortality in older subjects with acute ischemic stroke. Gerontology. 2006;52:231–236.
- , , , . The prognostic significance of subsyndromal delirium in elderly medical inpatients. J Am Geriatr Soc. 2003;51:754–760.
- , , , et al. Defining community acquired pneumonia severity on presentation to hospital: an international derivation and validation study. Thorax. 2003;58:377–382.
- , , , et al. A prediction rule to identify low‐risk patients with community‐acquired pneumonia. N Engl J Med. 1997;336:243–250.
- , , , et al. Derivation and validation of a prognostic model for pulmonary embolism. Am J Respir Crit Care Med. 2005;172:1041–1046.
© 2014 Society of Hospital Medicine
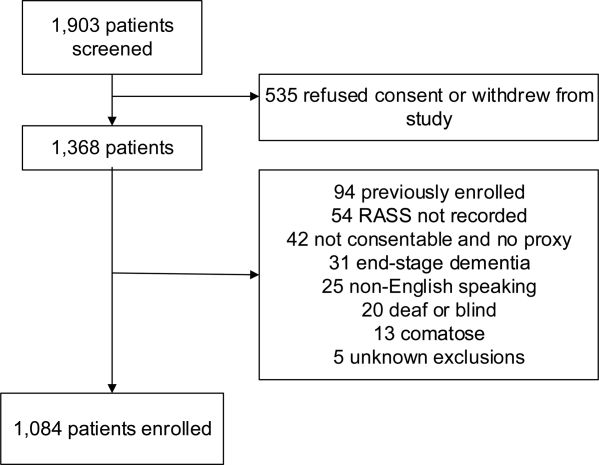
Comparing Collaborative and Toolkit QI
Continuous quality improvement (CQI) methodologies provide a framework for initiating and sustaining improvements in complex systems.1 By definition, CQI engages frontline staff in iterative problem solving using plandostudyact cycles of learning, with decision‐making based on real‐time process measurements.2 The Institute for Healthcare Improvement (IHI) has sponsored Breakthrough Series Collaboratives since 1996 to accelerate the uptake and impact of quality improvement (QI).3, 4 These collaboratives are typically guided by evidence‐based clinical practice guidelines, incorporate change methodologies, and rely on clinical and process improvement subject matter experts. Through the collaborative network, teams share knowledge and ideas about effective and ineffective interventions as well as strategies for overcoming barriers. The collaborative curriculum includes CQI methodology, multidisciplinary teamwork, leadership support, and tools for measurement. Participants are typically required to invest resources and send teams to face‐to‐face goal‐oriented meetings. It is costly for a large healthcare organization to incorporate travel to a learning session conference into its collaborative model. Thus, we attempted virtual learning sessions that make use of webcasts, a Web site, and teleconference calls for tools and networking.5
A recent derivative of collaboratives has been deployment of toolkits for QI. Intuition suggests that such toolkits may help to enable change, and thus some agencies advocate the simpler approach of disseminating toolkits as a change strategy.6 Toolkit dissemination is a passive approach in contrast to collaborative participation, and its effectiveness has not been critically examined in evidence‐based literature.
We sought to compare the virtual collaborative model with the toolkit model for improving care. Recommendations and guidelines for central lineassociated bloodstream infection (CLABSI) and ventilator‐associated pneumonia (VAP) prevention have not been implemented reliably, resulting in unnecessary intensive care unit (ICU) morbidity and mortality and fostering a national call for improvement.7 Our aim was to compare the effectiveness of the virtual collaborative and toolkit approaches on preventing CLABSI and VAP in the ICU.
Methods
This cluster randomized trial included medical centers within the Hospital Corporation of America (HCA), a network of hospitals located primarily in the southern United States. To minimize contamination bias between study groups within the same facility, the unit of randomization was the hospital and implementation was at the level of the ICU. The project received approval from the Vanderbilt University Institutional Review Board.
Leaders of all medical centers with at least 1 adult or pediatric ICU received an invitation from HCA leadership to participate in a QI initiative. Facility clinicians and managers completed baseline surveys (shown in the Supporting Information) on hospital characteristics, types of ICUs, patient safety climate, and QI resources between July and November 2005. Hospital‐level data were extracted from the enterprise‐wide data warehouse. Hospitals willing to participate were matched on geographic location and ICU volume and then randomized into either the Virtual Collaborative (n = 31) or Toolkit (n = 30) groups in December 20058; 1 of the hospitals was sold, yielding 29 hospitals in the Toolkit (n = 29) group. The study lasted 18 months from January 2006 through September 2007, with health careassociated infection data collected through December 2007, and follow‐up data collection through April 2008.
The QI initiative included educational opportunities, evidence‐based clinical prevention interventions, and processes and tools to implement and measure the impact of these interventions. Participants in both groups were offered interactive Web seminars during the study period; 5 of these seminars were on clinical subject matter, and 5 seminars were on patient safety, charting use of statistical process control and QI methods. The interventions were evidence‐based care bundles.9 The key interventions for preventing CLABSI were routine hand hygiene, use of chlorhexidine skin antisepsis, maximal barrier precautions during catheter insertion, catheter site and care, and avoidance of routine replacement of catheters. The key interventions to prevent VAP were routine elevation of head of the bed, regular oral care, daily sedation vacations, daily assessment of readiness to extubate, secretion cleaning, peptic ulcer disease prophylaxis, and deep vein thrombosis prophylaxis.
Toolkit Group
Hospitals randomized to this arm received a toolkit during study month 1 containing a set of evidence‐based guidelines and fact sheets for preventing CLABSI and VAP, a review of QI and teamwork methods, standardized data collection tools, and standardized charting tools. The nurse and quality managers for the Toolkit ICUs were provided ad libitum access to the HCA intranet toolkit Web site containing all of the educational seminars, clinical tools, and QI tools. Otherwise, ICUs in this group were on their own to initiate and implement a local hospital QI initiative to prevent CLABSI and VAP.
Virtual Collaborative Group
In addition to the materials and Web site support described above, facility leaders and managers in this Virtual Collaborative group agreed to participate in a virtual collaborative to develop processes to more reliably implement evidence‐based interventions to prevent CLABSI and VAP. The collaboration differed from the Breakthrough Series model3, 4 in that teams did not come together for face‐to‐face educational and planning sessions but instead attended Web seminars and teleconferences for reporting back to the larger group.5 Teams were supported through monthly educational and troubleshooting conference calls, individual coaching coordinated by the HCA corporate office of quality, safety, and performance improvement, and an e‐mail listserv designed to stimulate interaction among teams.
Clinical Outcome Measures
Although most participating hospitals defined CLABSI and VAP using the Centers for Disease Control and Prevention definitions, data collection and surveillance methods varied across hospitals.10 Education was provided to standardize outcome measurement. A data registry Web application was created as a new tool for infection control data entry, and healthcare‐associated infection data reporting by the infection control personnel was mandated starting the first quarter of 2006. To verify electronic data and correct missing information, the infection control personnel were requested to complete a retrospective data collection sheet providing quarterly reports from January 2005 through December 2007 on ICU infection events as well as total catheter days and ventilator days to allow calculation of event rates. Outcome measures of CLABSI and VAP were at the level of the hospital.
Follow‐Up
The HCA e‐mail distribution and collection routine was employed for the follow‐up survey of ICU nurse and quality managers for all participating medical centers from January 2008 through April 2008. A single survey (shown in the Supporting Information) was requested from each participating ICU. The ICU‐level surveys included questions about the implementation of the CLABSI and VAP process interventions, access of tools, participation in Web seminars, and use of QI strategies.11, 12 The postintervention survey also assessed the character and amount of implementation and teamwork activity expended.
Median CLABSI and VAP rates for a 3‐month baseline and quarterly postintervention periods were compared between the 2 study groups. The CLABSI and VAP infection rates were also analyzed using hierarchical negative binomial regression models to model infection rate changes over time (time in months and group by time interaction effects) and account for clustering of ICUs within hospitals and adjusting for baseline covariates. Baseline and process variables at the hospital and ICU level were compared using chi‐square tests and t tests according to the type of measurement. Time‐to‐event analyses were conducted to compare the groups on time to initiation of a care process. All analyses were conducted using the (R: A Language and Environment for Statistical Computing. R Foundation for Statistical Computing, Vienna, Austria, 2010).
The power of the study was calculated a priori with a 1‐tailed alpha of 0.05 and group size of 30. We hypothesized a 50% decrease in hospital‐associated infection rates for the Collaborative group vs. a 10% to 15% decrease for the Toolkit group. The calculations yielded power ranging from a low of 82% to a high of 91% for testing group differences.13
Results
Participating facilities included rural (11%), inner city (28%), and suburban (61%) medical centers. The 60 participating sites did not differ in administrative variables from the 113 nonparticipating HCA sites (results not shown). The median hospital size was 177 beds and the median ICU size was 16 beds. The hospitals did not differ between study groups (Table 1). At baseline, 45% of the facilities reported having a CLABSI program and 62% a VAP program.
| Hospital Factors at Baseline | Virtual Collaborative | Toolkit | P Value |
|---|---|---|---|
| |||
| Number of hospitals | 31 | 29* | |
| ICU annual patient volume, median (IQR) | 568 (294, 904) | 578 (244, 1077) | 0.93 |
| ICU patient length of stay days, median (IQR) | 3882 (1758, 5718) | 4228 (1645, 6725) | 0.95 |
| ICU mortality rate, percent (SD) | 5.7% (3.1%) | 7.1% (3.6%) | 0.13 |
| Medicare/Medicaid, percent (SD) | 68.6% (9.5%) | 68.5% (10.1%) | 0.95 |
| Percent admitted to ICU from the Emergency Department (SD) | 71% (15%) | 67% (20%) | 0.27 |
| Percent female (SD) | 49.7% (5.7%) | 50.3% (7.7%) | 0.79 |
| Medicare case‐mix weight, mean (SD) | 1221 (1007) | 1295 (1110) | 0.82 |
| Percent hospitalist ICU management | 47% | 40% | 0.61 |
The baseline and quarterly median and pooled infection rates for the Toolkit and Collaboration groups are shown in Table 2 for CLABSI and in Table 3 for VAP. There were no significant differences in the baseline rates for either CLABSI (P = 0.24) or VAP (P = 0.72) between the Collaborative and Toolkit groups. There was no significant change for either CLABSI or VAP outcomes at either 12 or 18 months of follow‐up. The median bloodstream infection rate for all participating hospitals was 2.27 at baseline, 1.18 at 12 months (P = 0.13), and 2.23 per 1000 catheter days 18 months later (P = 0.95). The median VAP rate for participating hospitals was 2.90 at baseline, 2.67 at 12 months (P = 0.44), and 2.52 per 1000 ventilator days 18 months later (P = 0.84). The hierarchical regression analysis found that neither the Collaborative nor Toolkit groups improved CLABSI (P = 0.75 and P = 0.83, respectively) or VAP (P = 0.61 and P = 0.37, respectively) rates over time, and there was no differential performance between the 2 groups for either outcome (bloodstream infection, P = 0.71; VAP, P = 0.80).
| Overall | Virtual Collaborative | Toolkit | ||||
|---|---|---|---|---|---|---|
| N = 59 Hospitals | N = 30 Hospitals | N = 29 Hospitals | ||||
| Study Period | Hospital Median (IQR) | Rate Pooled Across Hospitals | Hospital Median (IQR) | Rate Pooled Across Hospitals | Hospital Median (IQR) | Rate Pooled Across Hospitals |
| ||||||
| Baseline | 2.27 (0.00‐3.98) | 2.42 | 1.84 (0.00‐3.83) | 1.67 | 2.42 (0.65‐6.80) | 3.05 |
| 3 Month | 2.27 (1.30‐4.69) | 2.61 | 2.24 (0.54‐4.69) | 2.34 | 2.47 (1.48‐5.35) | 2.85 |
| 6 Month | 2.37 (0.00‐4.29) | 2.73 | 2.28 (0.00‐3.73) | 2.35 | 2.54 (0.00‐4.98) | 3.09 |
| 9 Month | 1.66 (0.00‐3.84) | 2.45 | 1.76 (0.00‐3.74) | 2.28 | 1.23 (0.00‐3.93) | 2.59 |
| 12 Month | 1.18 (0.00‐3.10) | 2.17 | 1.18 (0.00‐2.71) | 1.72 | 1.17 (0.00‐3.61) | 2.58 |
| 15 Month | 1.93 (0.00‐4.25) | 2.29 | 2.04 (0.00‐4.91) | 2.53 | 1.77 (0.00‐3.30) | 2.08 |
| 18 Month | 2.23 (0.00‐4.97) | 2.73 | 2.76 (0.00‐4.67) | 2.75 | 1.16 (0.00‐5.46) | 2.72 |
| Study Period | Overall | Virtual Collaborative | Toolkit | |||
|---|---|---|---|---|---|---|
| N = 59 Hospitals | N = 30 Hospitals | N = 29 Hospitals | ||||
| Hospital Median (IQR) | Rate Pooled Across Hospitals | Hospital Median (IQR) | Rate Pooled Across Hospitals | Hospital Median (IQR) | Rate Pooled Across Hospitals | |
| ||||||
| Baseline | 2.90 (0.00‐6.14) | 3.97 | 2.14 (0.00‐6.09) | 3.43 | 3.49 (0.00‐7.04) | 4.36 |
| 3 Month | 3.12 (0.00‐8.40) | 4.46 | 3.01 (0.00‐9.11) | 4.22 | 3.32 (0.00‐8.25) | 4.62 |
| 6 Month | 3.40 (0.00‐7.53) | 4.97 | 2.72 (0.00‐7.09) | 4.81 | 4.61 (0.00‐9.37) | 5.10 |
| 9 Month | 1.49 (0.00‐4.87) | 2.99 | 0 (0.00‐3.94) | 2.51 | 2.27 (0.00‐6.27) | 3.36 |
| 12 Month | 2.67 (0.00‐4.60) | 4.39 | 2.67 (0.00‐4.47) | 3.82 | 2.66 (0.00‐4.82) | 4.95 |
| 15 Month | 3.06 (0.00‐5.10) | 4.03 | 2.40 (0.00‐3.94) | 3.57 | 3.65 (1.15‐6.57) | 4.45 |
| 18 Month | 2.52 (0.00‐7.45) | 4.61 | 2.93 (0.00‐7.63) | 5.02 | 2.06 (0.00‐6.59) | 4.31 |
The poststudy survey was completed by 27 of 31 (87%) of Collaborative group hospitals and 19 of the 29 (66%) Toolkit hospitals. Both groups reported QI improvement efforts to prevent CLABSI (Collaborative 97% vs. Toolkit 88%, P = 0.29) and VAP (Collaborative 97% vs. Toolkit 96%, P = 0.99). Eighty‐three percent of the Collaborative group implemented all components of the bloodstream infection prevention interventions compared with 64% for the Toolkit group (P = 0.13; Figure 1). The Collaborative group implemented daily catheter review more often than the Toolkit group (P = 0.04) and began the process implementation sooner following study implementation (P = 0.006 vs. Toolkit; see Supporting Information Figure). Eighty‐six percent of the Collaborative group implemented the complete VAP prevention interventions vs. 64% of the Toolkit group (P = 0.06; Figure 1) and the Collaborative group conducted the sedation vacation intervention more often (P = 0.03).
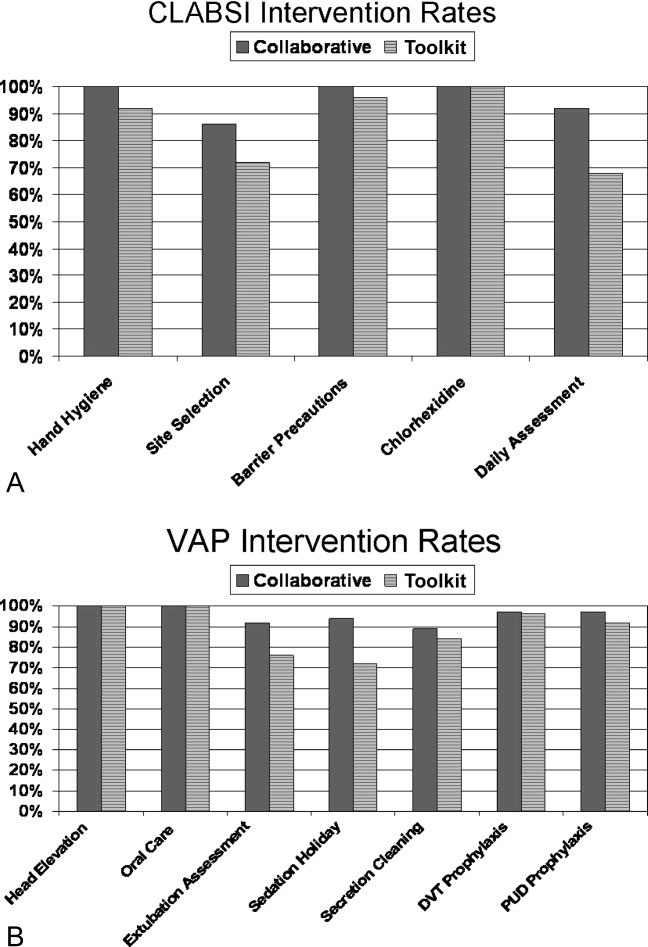
The Collaborative group participated in 57% of the seminars, whereas the Toolkit group participated in 39% (P = 0.014). Members of both groups attended more than half the clinical topics (Collaborative 64% vs. Toolkit 56%, P = 0.37). The Collaborative group had greater participation in the data and method topics (Collaborative 50% vs. Toolkit 22%, P < 0.001). The proportion of hospitals finding the seminars useful to their QI efforts was 49% for the Collaborative and 30% for the Toolkit group (P = 0.017). When restricted to hospitals that participated in the seminars, the usefulness rating was higher for both clinical (91% for the Collaborative and 86% for Toolkit) and Data/Methods (79% for Collaborative and 55% for Toolkit) topics.
A set of 14 tools were produced during the study period (Table 4); 9 clinically related tools (eg, checklists, algorithms, protocols, and flowsheets) and 5 data monitoring and quality improvement tools (eg, easy‐to‐use statistical process control spreadsheet templates, quality improvement tools, and computer tools). The Collaborative group downloaded a median of 10 tools and the Toolkit group a median of 7 (P = 0.051). The groups did not differ in their access to the clinical tools (P = 0.23) but the Collaborative group accessed a greater proportion of the data/methods tools (P = 0.004).
| Tool Access and Strategies | Collaborative Hospitalsa | Tool Kit Hospitalsa | P‐value |
|---|---|---|---|
| N = 36 ICUs | N = 25 ICUs | ||
| |||
| Clinical Tool Use | 61% | 49% | 0.23 |
| BSI Surveillance Guide | 22/36 (61%) | 13/25 (52%) | 0.60 |
| BSI Checklist | 31/36 (86%) | 16/25 (64%) | 0.06 |
| VAP Diagnosis Algorithm | 24/36 (67%) | 15/25 (60%) | 0.60 |
| Ventilator Weaning Protocol | 23/36 (64%) | 11/25 (44%) | 0.18 |
| VAP Surveillance Guide | 21/36 (58%) | 12/25 (48%) | 0.44 |
| VAP Daily Assessment | 17/36 (47%) | 6/25 (24%) | 0.10 |
| Ventilator Weaning Protocol (Flowsheet) | 15/36 (42%) | 11/25 (44%) | 0.99 |
| Data Tools | 56% | 30% | 0.004 |
| QI Implementation Tools | 19/36 (53%) | 6/25 (24%) | 0.03 |
| BSI Statistical Process Control | 23/36 (64%) | 5/25 (20%) | 0.001 |
| VAP Bundle | 23/36 (64%) | 11/25 (44%) | 0.18 |
| VAP Statistical Process Control | 21/36 (58%) | 3/25 (12%) | 0.001 |
| Strategies | 69% | 54% | 0.017 |
| Protocols for BSI | 24/36 (67%) | 19/25 (76%) | 0.57 |
| Protocols for VAP | 22/36 (61%) | 9/25 (36%) | 0.07 |
| Computer Documentation for BSI | 24/36 (67%) | 13/25 (52%) | 0.29 |
| Computer Documentation for VAP | 25/36 (69%) | 15/25 (60%) | 0.58 |
| Increased Staffing | 3/36 (8%) | 0/25 (0%) | 0.26 |
| Written Education for BSI | 31/36 (86%) | 19/25 (76%) | 0.33 |
| Written Education for VAP | 30/36 (83%) | 19/25 (76%) | 0.52 |
| Continuing Education Classes for BSI | 28/36 (78%) | 16/25 (64%) | 0.26 |
| Continuing Education Classes for VAP | 30/36 (83%) | 17/25 (68%) | 0.21 |
| QI teams | 27/36 (75%) | 14/25 (56%) | 0.16 |
| Provider Performance Feedback for BSI | 23/36 (64%) | 11/25 (44%) | 0.18 |
| Provider Performance Feedback for VAP | 24/36 (67%) | 11/25 (44%) | 0.11 |
| Implementation of BSI Checklist | 28/36 (78%) | 15/25 (60%) | 0.16 |
| Implementation of VAP Checklist | 31/36 (86%) | 13/25 (52%) | 0.007 |
Both groups relied primarily on implementation of protocols and informatics approaches (Table 4) without increasing staff levels. The predominant strategy was education; both groups provided written educational materials and classes to their providers. There was a trend for more Collaborative group members to implement QI teams (Table 4, P = 0.16 compared with the Toolkit group). Although the preponderance of both groups provided feedback reports to their hospital leaders and unit managers, Collaborative group hospitals showed a trend for providing feedback to front‐line providers (P = 0.11). With respect to self‐reported interventions, 78% of the Collaborative ICUs reported implementing a CLABSI checklist and 86% a VAP checklist, whereas only 60% of the Toolkit group reported implementation of a CLABSI checklist (P = 0.16) and 52% a VAP checklist (P = 0.007). Once a tool was implemented, both groups reported a high rate of sustaining the implementation (ranging from 86% to 100%). There also seemed to be a pattern of sequencing the interventions. Initial efforts tend to focus on provider education and evidence‐based protocols. Later efforts include more formal formation of QI teams followed by implementation of checklists. The evidence for sequencing of interventions is qualitative; we lacked subgroup sample size to substantiate these results with statistical analysis.
Discussion
In our investigation of Virtual Collaborative and Toolkit strategies for spreading the implementation of safe practices for CLABSI and VAP, ICUs in the Collaborative group had more complete implementation of the processes for prevention of hospital‐associated infections. Although both groups accessed clinical resources consistent with surveillance and clinical education, the Virtual Collaborative group attended to data and implementation methods more likely to lead to systemic CQI and organizational changes. ICUs that engaged these resources believed them useful in implementing QI, and more than 85% of the practices were sustained once integrated into routine care. Although the Collaborative ICUs were about 50% more likely to implement improvement strategies, these differences in implementation and process of care did not translate into group differences or longitudinal changes in infection rates.
In contrast to the context of our investigation, most published QI studies on health careassociated infection prevention report high baseline rates followed by a significant decline in infection rates.1419 The baseline infection rates in our study hospitals were actually below the endpoint found in many prior studies, suggesting that any marginal effects from our intervention would be more difficult to detect. Our study was implemented during the IHI's 100,000 Lives Campaign,20 a trend that may have brought about these lower baseline rates and thus a tighter margin for improvement.
The median CLABSI baseline rate in the well‐publicized Michigan hospital study was 2.7 per 1000 catheter days.21, 22 Although our baseline rate was similar (2.27 per 1000 catheter days), their reported postintervention rate was near zero, inferring nearly total elimination of the risk for CLABSI within 3‐18 months of study implementation. Several other studies using a collaborative approach have similarly reported high‐performance near‐zero results in reducing VAP23, 24 and CLABSI2528 rates. The difference between the present and previously published near‐zero result outcomes raises questions about collaboration‐based studies. We noticed 2 phenomena. First, there was slow uptake of data‐driven QI, and second, there was a differential uptake between general knowledge (clinical evidence and education) and QI implementation knowledge.29, 30
Lack of infrastructure to support data‐driven QI remains a significant barrier throughout the health care system, and teams in collaboratives often must work intensively toward improving their information systems' capability for the purpose of data‐driven decision support.1, 15, 31, 32 Systematic, standardized collection of CLABSI and VAP outcomes was initially lacking in many of our study hospitals,10 and our project expended early effort to deploy a system‐wide standardized infection control database registry.
Both of our study groups gravitated toward educational training and evidence‐based protocol decision‐support strategies. A focus only on established surveillance and education‐based fixes (eg, asking clinicians to follow a protocol within their existing care processes) have produced 32% to 57% reductions in health careacquired infections.3335 These early gains, however, are unlikely to produce the sustained near‐zero results that some collaborative teams have reported.22, 25
The ability to achieve sustained high‐performance results depends on organizational context and requires time.31 A potential benefit of collaboratives might be the return on investment attained by organizational change in quality and safety climate and its influence across the whole organization.19, 31, 36 Participants requiring systems training in the CQI process may not gain these benefits until well into their collaborative.31 For example, accumulating evidence demonstrates that the use of checklists can reduce errors of omission. Although a checklist seems a simple intervention, its effective implementation into routine care processes actually requires time for system redesign that addresses changes in multidisciplinary roles and responsibilities, frontline clinician and mid‐level management buy‐in, new methods of data collection and feedback, unanticipated involvement of ancillary services (eg, medical records, housekeeping), as well as changes to organizational policies, expectations, and priorities that connect silos of care and integrate hierarchical operations. Wall et al.37 and Pronovost and colleagues19, 21, 22, 25 highlighted the strategic effectiveness of embedding a checklist as a behavioral and data collection tool into frontline care process, leading to a redefined role of nursing, as well as new data for further cycles of improvement that collectively reduced infection rates. In our study, the Virtual Collaborative group did not have greater use of CLABSI and VAP checklists until the QI teams had been formed months into the project, consistent with the hypothesis that beneficial translation of desired changes in process of care to observed improvements in patient outcomes may take longer than 18 months to achieve19, 25, 27, 38 as opposed to the remarkable 3 months reported in the Keystone ICU project.21
Our study has several limitations. Our intervention did not mandate fixed specific components of intervention or QI methods. Each medical center was free to tailor its use of tools and change ideas, producing site variation in implementation methods and investment in support of QI. Like other multicomponent, multidimensional intervention studies, we were not able to test the effectiveness of particular QI components or the thoroughness of surveillance for CLABSI and VAP related to efforts to standardize the approach, and we did not have the resources to monitor the intensity with which participants approached QI. Furthermore, our data were dependent on self‐reports and were not verified by independent assessment of the fidelity with which the interventions were implemented, a checklist was embedded into usual care, or practices were enforced by nurses. In addition, the virtual collaborative circumvents the face‐to‐face learning sessions that might play a role in collaborative social networking, peer pressure, and acculturation.31, 36
Despite these limitations, we found that the Virtual Collaborative performed just like a Breakthrough Collaborative with a gradual uptake of implementation science using QI methods, team management, and statistical process control tools. The Toolkit condition had an even slower uptake. From an organization's perspective, the bottom‐line decision is whether a greater and meaningful proportion of collaborative participants will be successful to justify the investment of effort compared to a toolkit‐only approach. Our findings suggest that organizations engaged in change but lacking expertise in implementation science can potentially benefit from the acculturation, experiential learning, and uptake of QI provided by a collaborative.
In summary, although our Virtual Collaborative intervention was more likely to produce changes in ICU processes of care, there were no improvements in patient outcomes over this 18‐month study. The current popularity of evidence‐based guidelines, care protocols, prevention awareness, and surveillance may have produced a background of secular trend, making it difficult to ascertain effects of our QI intervention. Nonetheless, important lessons can be gleaned from this randomized controlled trial. Our study supports the proposition that as long as organizations vary in their capacity for and commitment to the science of QI and systems engineering, we should anticipate variation, uncertainty, and mixed results from short‐term, rapid cycle initiatives.27, 28, 31, 32, 39, 40 The untested, longer‐term benefit produced by a collaborative may be its stimulation of enduring systems engineering that optimizes an environment for QI of health care processes focused on desired outcomes.
Acknowledgements
The authors thank the Agency for Healthcare Research and Quality collaborative investigators for their work in this study: Xu Lei Liu, MS, at Vanderbilt; Laurie Brewer, RN MBA, Jason Hickok, Steve Horner, Susan Littleton, Patsy McFadden, RN BSN MPA CIC, Steve Mok, PharmD, Jonathan Perlin, MD PhD, Joan Reischel, RN BSN CCRN, and Sheri G. Chernestky Tejedor, MD, and all the HCA medical centers that participated in this project.
- ,,.Assessing the impact of continuous quality improvement on clinical practice: What it will take to accelerate progress.Milbank Q.1998;76:593–624.
- .Continuous improvement as an ideal in health care.N Engl J Med.1989;320:53–56.
- .A framework for collaborative improvement: Lessons from the Institute for Healthcare Improvement's Breakthrough Series.Qual Manag Health Care.1998;6(4):1–13.
- ,,,,,.Quality improvement learning collaboratives.Qual Manag Health Care.2005;14:234–237.
- ,,,.Using a virtual breakthrough series collaborative to improve access in primary care.Jt Comm J Qual Patient Saf.2006;32:573–584.
- ,,, et al.Taking the national guideline for care of acute myocardial infarction to the bedside: Developing the guideline applied in practice (GAP) initiative in Southeast Michigan.Jt Comm J Qual Improv.2002;28:5–19.
- ,.Priority Areas for National Action: Transforming Health Care Quality.Washington, DC:The National Academies Press;2003.
- ,,,.Optimal multivariate matching before randomization.Biostatistics.2004;5:263–275.
- Institute for Healthcare Improvement. The 100,000 lives campaign. http://www.ihi.org/IHI/Programs/Campaign.htm;2005.
- ,,, et al.Survey of infection control programs in a large, national healthcare system.Infect Control Hosp Epidemiol.2007;28:1401–1403.
- ,,,. Closing the quality gap: A critical analysis of quality improvement strategies, Volume 1‐Series overview and methodology. Technical Review 9 (Contract No 290–02‐0017 to the Stanford University‐UCSF Evidence‐based Practices Center), 2004. www.ahrq.gov/clinic/tp/qgap1tp.htm. Accessed November 11,2010.
- ,.Improving safety on the front lines: the role of clinical microsystems.Qual Saf Health Care.2002;11:45–50.
- ,,.SamplePower 2.0.Chicago, IL:SPSS Inc.;2001.
- ,,,.Eliminating nosocomial infections at Ascension Health.Jt Comm J Qual Patient Saf.2006;32:612–620.
- ,,, et al.An intensive care unit quality improvement collaborative in nine department of Veterans Affairs hospitals: reducing ventilator‐associated pneumonia and catheter‐related bloodstream infection rates.Jt Comm J Qual Patient Saf.2008;34:639–645.
- ,,, et al.Decreasing ventilator‐associated pneumonia in a trauma ICU.J Trauma.2006;61:122–130.
- ,,,,,.Use of corporate six sigma performance‐improvement strategies to reduce incidence of catheter‐related bloodstream infections in a surgical ICU.J Am Coll Surg.2005;201:349–358.
- ,,,,.Decline in ICU adverse events, nosocomial infections and cost through a quality improvement initiative focusing on teamwork and culture change.Qual Saf Health Care.2006;15:235–239.
- ,,,,,.Using a bundle approach to improve ventilator care processes and reduce ventilator‐associated pneumonia.Jt Comm J Qual Patient Saf.2005;31:243–248.
- ,,,.The 100000 lives campaign: Setting a goal and a deadline for improving health care quality.JAMA.2006;295:324–327.
- ,,.An intervention to decrease catheter‐related bloodstream infections in the ICU.N Engl J Med.2006;355:2725–2732.
- ,,, et al.Improving patient safety units in Michigan.J Crit Care.2008;23:207–221.
- .Toward a zero VAP rate: Personal and team approaches in the ICU.Crit Care Nurs Q.2006;29:108–114.
- ,,, et al.Implementing a ventilator bundle in a community hospital.Jt Comm J Qual Patient Saf.2007;33:219–225.
- ,,, et al.Eliminating catheter‐realted bloodstream infections in the intensive care unit.Crit Care Med.2004;32:2014–2020.
- .Innovative bundle wipes out catheter‐related bloodstream infections.Nursing.2008;38:17–18.
- ,,,,,.The CLABs collaborative: a regionwide effort to improve the quality of care in hospitals.Jt Comm J Qual Patient Saf.2008;34:713–723.
- ,,, et al.Evidence‐based practice to reduce central line infections.Jt Comm J Qual Patient Saf.2006;32:253–260.
- .Learning and improving in quality improvement collaboratives: which collaborative features do participants value most?Health Serv Res.2009;44(2 Pt 1):359–378.
- ,,, et al.Inside the health disparities collaboratives: a detailed exploration of quality improvement at community health centers.Med Care.2008;46:489–496.
- ,,, et al.Quality collaboratives: lessons from research.Qual Saf Health Care.2002;11:345–351.
- ,,, et al.Assessing the implementation of the chronic care model in quality improvement collaboratives.Health Serv Res.2005;40:978–996.
- ,.Prevention of ventilator‐associated pneumonia: Analysis of studies published since 2004.J Hosp Infect.2007;67:1–8.
- ,,,.Effect of comparative data feedback on intensive care unit infection rates in a Veterans Administration Hospital network system.Am J Infect Control.2003;31:397–404.
- ,,, et al.Reducing ventilator‐associated pneumonia rates through a staff education programme.J Hosp Infect.2004;57:223–227.
- ,,,.Does quality improvement implementation affect hospital quality of care?Hosp Top.2007;85:3–12.
- ,,,,,.Using real‐time process measurements to reduce catheter‐related bloodstream infections in the intensive care unit.Qual Saf Health Care.2005;14:295–302.
- ,,,,,.Prevention of ventilator‐associated pneumonia in the Calgary health region: a Canadian success story!Healthcare Qual.2008;11(3 Spec No):129–136.
- .Creating the evidence base for quality improvement collaboratives.Ann Intern Med.2004;140:897–901.
- ,,,,.Evidence for the impact of quality improvement collaboratives: systematic review.Br Med J.2008;336:1491–1494.
Continuous quality improvement (CQI) methodologies provide a framework for initiating and sustaining improvements in complex systems.1 By definition, CQI engages frontline staff in iterative problem solving using plandostudyact cycles of learning, with decision‐making based on real‐time process measurements.2 The Institute for Healthcare Improvement (IHI) has sponsored Breakthrough Series Collaboratives since 1996 to accelerate the uptake and impact of quality improvement (QI).3, 4 These collaboratives are typically guided by evidence‐based clinical practice guidelines, incorporate change methodologies, and rely on clinical and process improvement subject matter experts. Through the collaborative network, teams share knowledge and ideas about effective and ineffective interventions as well as strategies for overcoming barriers. The collaborative curriculum includes CQI methodology, multidisciplinary teamwork, leadership support, and tools for measurement. Participants are typically required to invest resources and send teams to face‐to‐face goal‐oriented meetings. It is costly for a large healthcare organization to incorporate travel to a learning session conference into its collaborative model. Thus, we attempted virtual learning sessions that make use of webcasts, a Web site, and teleconference calls for tools and networking.5
A recent derivative of collaboratives has been deployment of toolkits for QI. Intuition suggests that such toolkits may help to enable change, and thus some agencies advocate the simpler approach of disseminating toolkits as a change strategy.6 Toolkit dissemination is a passive approach in contrast to collaborative participation, and its effectiveness has not been critically examined in evidence‐based literature.
We sought to compare the virtual collaborative model with the toolkit model for improving care. Recommendations and guidelines for central lineassociated bloodstream infection (CLABSI) and ventilator‐associated pneumonia (VAP) prevention have not been implemented reliably, resulting in unnecessary intensive care unit (ICU) morbidity and mortality and fostering a national call for improvement.7 Our aim was to compare the effectiveness of the virtual collaborative and toolkit approaches on preventing CLABSI and VAP in the ICU.
Methods
This cluster randomized trial included medical centers within the Hospital Corporation of America (HCA), a network of hospitals located primarily in the southern United States. To minimize contamination bias between study groups within the same facility, the unit of randomization was the hospital and implementation was at the level of the ICU. The project received approval from the Vanderbilt University Institutional Review Board.
Leaders of all medical centers with at least 1 adult or pediatric ICU received an invitation from HCA leadership to participate in a QI initiative. Facility clinicians and managers completed baseline surveys (shown in the Supporting Information) on hospital characteristics, types of ICUs, patient safety climate, and QI resources between July and November 2005. Hospital‐level data were extracted from the enterprise‐wide data warehouse. Hospitals willing to participate were matched on geographic location and ICU volume and then randomized into either the Virtual Collaborative (n = 31) or Toolkit (n = 30) groups in December 20058; 1 of the hospitals was sold, yielding 29 hospitals in the Toolkit (n = 29) group. The study lasted 18 months from January 2006 through September 2007, with health careassociated infection data collected through December 2007, and follow‐up data collection through April 2008.
The QI initiative included educational opportunities, evidence‐based clinical prevention interventions, and processes and tools to implement and measure the impact of these interventions. Participants in both groups were offered interactive Web seminars during the study period; 5 of these seminars were on clinical subject matter, and 5 seminars were on patient safety, charting use of statistical process control and QI methods. The interventions were evidence‐based care bundles.9 The key interventions for preventing CLABSI were routine hand hygiene, use of chlorhexidine skin antisepsis, maximal barrier precautions during catheter insertion, catheter site and care, and avoidance of routine replacement of catheters. The key interventions to prevent VAP were routine elevation of head of the bed, regular oral care, daily sedation vacations, daily assessment of readiness to extubate, secretion cleaning, peptic ulcer disease prophylaxis, and deep vein thrombosis prophylaxis.
Toolkit Group
Hospitals randomized to this arm received a toolkit during study month 1 containing a set of evidence‐based guidelines and fact sheets for preventing CLABSI and VAP, a review of QI and teamwork methods, standardized data collection tools, and standardized charting tools. The nurse and quality managers for the Toolkit ICUs were provided ad libitum access to the HCA intranet toolkit Web site containing all of the educational seminars, clinical tools, and QI tools. Otherwise, ICUs in this group were on their own to initiate and implement a local hospital QI initiative to prevent CLABSI and VAP.
Virtual Collaborative Group
In addition to the materials and Web site support described above, facility leaders and managers in this Virtual Collaborative group agreed to participate in a virtual collaborative to develop processes to more reliably implement evidence‐based interventions to prevent CLABSI and VAP. The collaboration differed from the Breakthrough Series model3, 4 in that teams did not come together for face‐to‐face educational and planning sessions but instead attended Web seminars and teleconferences for reporting back to the larger group.5 Teams were supported through monthly educational and troubleshooting conference calls, individual coaching coordinated by the HCA corporate office of quality, safety, and performance improvement, and an e‐mail listserv designed to stimulate interaction among teams.
Clinical Outcome Measures
Although most participating hospitals defined CLABSI and VAP using the Centers for Disease Control and Prevention definitions, data collection and surveillance methods varied across hospitals.10 Education was provided to standardize outcome measurement. A data registry Web application was created as a new tool for infection control data entry, and healthcare‐associated infection data reporting by the infection control personnel was mandated starting the first quarter of 2006. To verify electronic data and correct missing information, the infection control personnel were requested to complete a retrospective data collection sheet providing quarterly reports from January 2005 through December 2007 on ICU infection events as well as total catheter days and ventilator days to allow calculation of event rates. Outcome measures of CLABSI and VAP were at the level of the hospital.
Follow‐Up
The HCA e‐mail distribution and collection routine was employed for the follow‐up survey of ICU nurse and quality managers for all participating medical centers from January 2008 through April 2008. A single survey (shown in the Supporting Information) was requested from each participating ICU. The ICU‐level surveys included questions about the implementation of the CLABSI and VAP process interventions, access of tools, participation in Web seminars, and use of QI strategies.11, 12 The postintervention survey also assessed the character and amount of implementation and teamwork activity expended.
Median CLABSI and VAP rates for a 3‐month baseline and quarterly postintervention periods were compared between the 2 study groups. The CLABSI and VAP infection rates were also analyzed using hierarchical negative binomial regression models to model infection rate changes over time (time in months and group by time interaction effects) and account for clustering of ICUs within hospitals and adjusting for baseline covariates. Baseline and process variables at the hospital and ICU level were compared using chi‐square tests and t tests according to the type of measurement. Time‐to‐event analyses were conducted to compare the groups on time to initiation of a care process. All analyses were conducted using the (R: A Language and Environment for Statistical Computing. R Foundation for Statistical Computing, Vienna, Austria, 2010).
The power of the study was calculated a priori with a 1‐tailed alpha of 0.05 and group size of 30. We hypothesized a 50% decrease in hospital‐associated infection rates for the Collaborative group vs. a 10% to 15% decrease for the Toolkit group. The calculations yielded power ranging from a low of 82% to a high of 91% for testing group differences.13
Results
Participating facilities included rural (11%), inner city (28%), and suburban (61%) medical centers. The 60 participating sites did not differ in administrative variables from the 113 nonparticipating HCA sites (results not shown). The median hospital size was 177 beds and the median ICU size was 16 beds. The hospitals did not differ between study groups (Table 1). At baseline, 45% of the facilities reported having a CLABSI program and 62% a VAP program.
| Hospital Factors at Baseline | Virtual Collaborative | Toolkit | P Value |
|---|---|---|---|
| |||
| Number of hospitals | 31 | 29* | |
| ICU annual patient volume, median (IQR) | 568 (294, 904) | 578 (244, 1077) | 0.93 |
| ICU patient length of stay days, median (IQR) | 3882 (1758, 5718) | 4228 (1645, 6725) | 0.95 |
| ICU mortality rate, percent (SD) | 5.7% (3.1%) | 7.1% (3.6%) | 0.13 |
| Medicare/Medicaid, percent (SD) | 68.6% (9.5%) | 68.5% (10.1%) | 0.95 |
| Percent admitted to ICU from the Emergency Department (SD) | 71% (15%) | 67% (20%) | 0.27 |
| Percent female (SD) | 49.7% (5.7%) | 50.3% (7.7%) | 0.79 |
| Medicare case‐mix weight, mean (SD) | 1221 (1007) | 1295 (1110) | 0.82 |
| Percent hospitalist ICU management | 47% | 40% | 0.61 |
The baseline and quarterly median and pooled infection rates for the Toolkit and Collaboration groups are shown in Table 2 for CLABSI and in Table 3 for VAP. There were no significant differences in the baseline rates for either CLABSI (P = 0.24) or VAP (P = 0.72) between the Collaborative and Toolkit groups. There was no significant change for either CLABSI or VAP outcomes at either 12 or 18 months of follow‐up. The median bloodstream infection rate for all participating hospitals was 2.27 at baseline, 1.18 at 12 months (P = 0.13), and 2.23 per 1000 catheter days 18 months later (P = 0.95). The median VAP rate for participating hospitals was 2.90 at baseline, 2.67 at 12 months (P = 0.44), and 2.52 per 1000 ventilator days 18 months later (P = 0.84). The hierarchical regression analysis found that neither the Collaborative nor Toolkit groups improved CLABSI (P = 0.75 and P = 0.83, respectively) or VAP (P = 0.61 and P = 0.37, respectively) rates over time, and there was no differential performance between the 2 groups for either outcome (bloodstream infection, P = 0.71; VAP, P = 0.80).
| Overall | Virtual Collaborative | Toolkit | ||||
|---|---|---|---|---|---|---|
| N = 59 Hospitals | N = 30 Hospitals | N = 29 Hospitals | ||||
| Study Period | Hospital Median (IQR) | Rate Pooled Across Hospitals | Hospital Median (IQR) | Rate Pooled Across Hospitals | Hospital Median (IQR) | Rate Pooled Across Hospitals |
| ||||||
| Baseline | 2.27 (0.00‐3.98) | 2.42 | 1.84 (0.00‐3.83) | 1.67 | 2.42 (0.65‐6.80) | 3.05 |
| 3 Month | 2.27 (1.30‐4.69) | 2.61 | 2.24 (0.54‐4.69) | 2.34 | 2.47 (1.48‐5.35) | 2.85 |
| 6 Month | 2.37 (0.00‐4.29) | 2.73 | 2.28 (0.00‐3.73) | 2.35 | 2.54 (0.00‐4.98) | 3.09 |
| 9 Month | 1.66 (0.00‐3.84) | 2.45 | 1.76 (0.00‐3.74) | 2.28 | 1.23 (0.00‐3.93) | 2.59 |
| 12 Month | 1.18 (0.00‐3.10) | 2.17 | 1.18 (0.00‐2.71) | 1.72 | 1.17 (0.00‐3.61) | 2.58 |
| 15 Month | 1.93 (0.00‐4.25) | 2.29 | 2.04 (0.00‐4.91) | 2.53 | 1.77 (0.00‐3.30) | 2.08 |
| 18 Month | 2.23 (0.00‐4.97) | 2.73 | 2.76 (0.00‐4.67) | 2.75 | 1.16 (0.00‐5.46) | 2.72 |
| Study Period | Overall | Virtual Collaborative | Toolkit | |||
|---|---|---|---|---|---|---|
| N = 59 Hospitals | N = 30 Hospitals | N = 29 Hospitals | ||||
| Hospital Median (IQR) | Rate Pooled Across Hospitals | Hospital Median (IQR) | Rate Pooled Across Hospitals | Hospital Median (IQR) | Rate Pooled Across Hospitals | |
| ||||||
| Baseline | 2.90 (0.00‐6.14) | 3.97 | 2.14 (0.00‐6.09) | 3.43 | 3.49 (0.00‐7.04) | 4.36 |
| 3 Month | 3.12 (0.00‐8.40) | 4.46 | 3.01 (0.00‐9.11) | 4.22 | 3.32 (0.00‐8.25) | 4.62 |
| 6 Month | 3.40 (0.00‐7.53) | 4.97 | 2.72 (0.00‐7.09) | 4.81 | 4.61 (0.00‐9.37) | 5.10 |
| 9 Month | 1.49 (0.00‐4.87) | 2.99 | 0 (0.00‐3.94) | 2.51 | 2.27 (0.00‐6.27) | 3.36 |
| 12 Month | 2.67 (0.00‐4.60) | 4.39 | 2.67 (0.00‐4.47) | 3.82 | 2.66 (0.00‐4.82) | 4.95 |
| 15 Month | 3.06 (0.00‐5.10) | 4.03 | 2.40 (0.00‐3.94) | 3.57 | 3.65 (1.15‐6.57) | 4.45 |
| 18 Month | 2.52 (0.00‐7.45) | 4.61 | 2.93 (0.00‐7.63) | 5.02 | 2.06 (0.00‐6.59) | 4.31 |
The poststudy survey was completed by 27 of 31 (87%) of Collaborative group hospitals and 19 of the 29 (66%) Toolkit hospitals. Both groups reported QI improvement efforts to prevent CLABSI (Collaborative 97% vs. Toolkit 88%, P = 0.29) and VAP (Collaborative 97% vs. Toolkit 96%, P = 0.99). Eighty‐three percent of the Collaborative group implemented all components of the bloodstream infection prevention interventions compared with 64% for the Toolkit group (P = 0.13; Figure 1). The Collaborative group implemented daily catheter review more often than the Toolkit group (P = 0.04) and began the process implementation sooner following study implementation (P = 0.006 vs. Toolkit; see Supporting Information Figure). Eighty‐six percent of the Collaborative group implemented the complete VAP prevention interventions vs. 64% of the Toolkit group (P = 0.06; Figure 1) and the Collaborative group conducted the sedation vacation intervention more often (P = 0.03).
The Collaborative group participated in 57% of the seminars, whereas the Toolkit group participated in 39% (P = 0.014). Members of both groups attended more than half the clinical topics (Collaborative 64% vs. Toolkit 56%, P = 0.37). The Collaborative group had greater participation in the data and method topics (Collaborative 50% vs. Toolkit 22%, P < 0.001). The proportion of hospitals finding the seminars useful to their QI efforts was 49% for the Collaborative and 30% for the Toolkit group (P = 0.017). When restricted to hospitals that participated in the seminars, the usefulness rating was higher for both clinical (91% for the Collaborative and 86% for Toolkit) and Data/Methods (79% for Collaborative and 55% for Toolkit) topics.
A set of 14 tools were produced during the study period (Table 4); 9 clinically related tools (eg, checklists, algorithms, protocols, and flowsheets) and 5 data monitoring and quality improvement tools (eg, easy‐to‐use statistical process control spreadsheet templates, quality improvement tools, and computer tools). The Collaborative group downloaded a median of 10 tools and the Toolkit group a median of 7 (P = 0.051). The groups did not differ in their access to the clinical tools (P = 0.23) but the Collaborative group accessed a greater proportion of the data/methods tools (P = 0.004).
| Tool Access and Strategies | Collaborative Hospitalsa | Tool Kit Hospitalsa | P‐value |
|---|---|---|---|
| N = 36 ICUs | N = 25 ICUs | ||
| |||
| Clinical Tool Use | 61% | 49% | 0.23 |
| BSI Surveillance Guide | 22/36 (61%) | 13/25 (52%) | 0.60 |
| BSI Checklist | 31/36 (86%) | 16/25 (64%) | 0.06 |
| VAP Diagnosis Algorithm | 24/36 (67%) | 15/25 (60%) | 0.60 |
| Ventilator Weaning Protocol | 23/36 (64%) | 11/25 (44%) | 0.18 |
| VAP Surveillance Guide | 21/36 (58%) | 12/25 (48%) | 0.44 |
| VAP Daily Assessment | 17/36 (47%) | 6/25 (24%) | 0.10 |
| Ventilator Weaning Protocol (Flowsheet) | 15/36 (42%) | 11/25 (44%) | 0.99 |
| Data Tools | 56% | 30% | 0.004 |
| QI Implementation Tools | 19/36 (53%) | 6/25 (24%) | 0.03 |
| BSI Statistical Process Control | 23/36 (64%) | 5/25 (20%) | 0.001 |
| VAP Bundle | 23/36 (64%) | 11/25 (44%) | 0.18 |
| VAP Statistical Process Control | 21/36 (58%) | 3/25 (12%) | 0.001 |
| Strategies | 69% | 54% | 0.017 |
| Protocols for BSI | 24/36 (67%) | 19/25 (76%) | 0.57 |
| Protocols for VAP | 22/36 (61%) | 9/25 (36%) | 0.07 |
| Computer Documentation for BSI | 24/36 (67%) | 13/25 (52%) | 0.29 |
| Computer Documentation for VAP | 25/36 (69%) | 15/25 (60%) | 0.58 |
| Increased Staffing | 3/36 (8%) | 0/25 (0%) | 0.26 |
| Written Education for BSI | 31/36 (86%) | 19/25 (76%) | 0.33 |
| Written Education for VAP | 30/36 (83%) | 19/25 (76%) | 0.52 |
| Continuing Education Classes for BSI | 28/36 (78%) | 16/25 (64%) | 0.26 |
| Continuing Education Classes for VAP | 30/36 (83%) | 17/25 (68%) | 0.21 |
| QI teams | 27/36 (75%) | 14/25 (56%) | 0.16 |
| Provider Performance Feedback for BSI | 23/36 (64%) | 11/25 (44%) | 0.18 |
| Provider Performance Feedback for VAP | 24/36 (67%) | 11/25 (44%) | 0.11 |
| Implementation of BSI Checklist | 28/36 (78%) | 15/25 (60%) | 0.16 |
| Implementation of VAP Checklist | 31/36 (86%) | 13/25 (52%) | 0.007 |
Both groups relied primarily on implementation of protocols and informatics approaches (Table 4) without increasing staff levels. The predominant strategy was education; both groups provided written educational materials and classes to their providers. There was a trend for more Collaborative group members to implement QI teams (Table 4, P = 0.16 compared with the Toolkit group). Although the preponderance of both groups provided feedback reports to their hospital leaders and unit managers, Collaborative group hospitals showed a trend for providing feedback to front‐line providers (P = 0.11). With respect to self‐reported interventions, 78% of the Collaborative ICUs reported implementing a CLABSI checklist and 86% a VAP checklist, whereas only 60% of the Toolkit group reported implementation of a CLABSI checklist (P = 0.16) and 52% a VAP checklist (P = 0.007). Once a tool was implemented, both groups reported a high rate of sustaining the implementation (ranging from 86% to 100%). There also seemed to be a pattern of sequencing the interventions. Initial efforts tend to focus on provider education and evidence‐based protocols. Later efforts include more formal formation of QI teams followed by implementation of checklists. The evidence for sequencing of interventions is qualitative; we lacked subgroup sample size to substantiate these results with statistical analysis.
Discussion
In our investigation of Virtual Collaborative and Toolkit strategies for spreading the implementation of safe practices for CLABSI and VAP, ICUs in the Collaborative group had more complete implementation of the processes for prevention of hospital‐associated infections. Although both groups accessed clinical resources consistent with surveillance and clinical education, the Virtual Collaborative group attended to data and implementation methods more likely to lead to systemic CQI and organizational changes. ICUs that engaged these resources believed them useful in implementing QI, and more than 85% of the practices were sustained once integrated into routine care. Although the Collaborative ICUs were about 50% more likely to implement improvement strategies, these differences in implementation and process of care did not translate into group differences or longitudinal changes in infection rates.
In contrast to the context of our investigation, most published QI studies on health careassociated infection prevention report high baseline rates followed by a significant decline in infection rates.1419 The baseline infection rates in our study hospitals were actually below the endpoint found in many prior studies, suggesting that any marginal effects from our intervention would be more difficult to detect. Our study was implemented during the IHI's 100,000 Lives Campaign,20 a trend that may have brought about these lower baseline rates and thus a tighter margin for improvement.
The median CLABSI baseline rate in the well‐publicized Michigan hospital study was 2.7 per 1000 catheter days.21, 22 Although our baseline rate was similar (2.27 per 1000 catheter days), their reported postintervention rate was near zero, inferring nearly total elimination of the risk for CLABSI within 3‐18 months of study implementation. Several other studies using a collaborative approach have similarly reported high‐performance near‐zero results in reducing VAP23, 24 and CLABSI2528 rates. The difference between the present and previously published near‐zero result outcomes raises questions about collaboration‐based studies. We noticed 2 phenomena. First, there was slow uptake of data‐driven QI, and second, there was a differential uptake between general knowledge (clinical evidence and education) and QI implementation knowledge.29, 30
Lack of infrastructure to support data‐driven QI remains a significant barrier throughout the health care system, and teams in collaboratives often must work intensively toward improving their information systems' capability for the purpose of data‐driven decision support.1, 15, 31, 32 Systematic, standardized collection of CLABSI and VAP outcomes was initially lacking in many of our study hospitals,10 and our project expended early effort to deploy a system‐wide standardized infection control database registry.
Both of our study groups gravitated toward educational training and evidence‐based protocol decision‐support strategies. A focus only on established surveillance and education‐based fixes (eg, asking clinicians to follow a protocol within their existing care processes) have produced 32% to 57% reductions in health careacquired infections.3335 These early gains, however, are unlikely to produce the sustained near‐zero results that some collaborative teams have reported.22, 25
The ability to achieve sustained high‐performance results depends on organizational context and requires time.31 A potential benefit of collaboratives might be the return on investment attained by organizational change in quality and safety climate and its influence across the whole organization.19, 31, 36 Participants requiring systems training in the CQI process may not gain these benefits until well into their collaborative.31 For example, accumulating evidence demonstrates that the use of checklists can reduce errors of omission. Although a checklist seems a simple intervention, its effective implementation into routine care processes actually requires time for system redesign that addresses changes in multidisciplinary roles and responsibilities, frontline clinician and mid‐level management buy‐in, new methods of data collection and feedback, unanticipated involvement of ancillary services (eg, medical records, housekeeping), as well as changes to organizational policies, expectations, and priorities that connect silos of care and integrate hierarchical operations. Wall et al.37 and Pronovost and colleagues19, 21, 22, 25 highlighted the strategic effectiveness of embedding a checklist as a behavioral and data collection tool into frontline care process, leading to a redefined role of nursing, as well as new data for further cycles of improvement that collectively reduced infection rates. In our study, the Virtual Collaborative group did not have greater use of CLABSI and VAP checklists until the QI teams had been formed months into the project, consistent with the hypothesis that beneficial translation of desired changes in process of care to observed improvements in patient outcomes may take longer than 18 months to achieve19, 25, 27, 38 as opposed to the remarkable 3 months reported in the Keystone ICU project.21
Our study has several limitations. Our intervention did not mandate fixed specific components of intervention or QI methods. Each medical center was free to tailor its use of tools and change ideas, producing site variation in implementation methods and investment in support of QI. Like other multicomponent, multidimensional intervention studies, we were not able to test the effectiveness of particular QI components or the thoroughness of surveillance for CLABSI and VAP related to efforts to standardize the approach, and we did not have the resources to monitor the intensity with which participants approached QI. Furthermore, our data were dependent on self‐reports and were not verified by independent assessment of the fidelity with which the interventions were implemented, a checklist was embedded into usual care, or practices were enforced by nurses. In addition, the virtual collaborative circumvents the face‐to‐face learning sessions that might play a role in collaborative social networking, peer pressure, and acculturation.31, 36
Despite these limitations, we found that the Virtual Collaborative performed just like a Breakthrough Collaborative with a gradual uptake of implementation science using QI methods, team management, and statistical process control tools. The Toolkit condition had an even slower uptake. From an organization's perspective, the bottom‐line decision is whether a greater and meaningful proportion of collaborative participants will be successful to justify the investment of effort compared to a toolkit‐only approach. Our findings suggest that organizations engaged in change but lacking expertise in implementation science can potentially benefit from the acculturation, experiential learning, and uptake of QI provided by a collaborative.
In summary, although our Virtual Collaborative intervention was more likely to produce changes in ICU processes of care, there were no improvements in patient outcomes over this 18‐month study. The current popularity of evidence‐based guidelines, care protocols, prevention awareness, and surveillance may have produced a background of secular trend, making it difficult to ascertain effects of our QI intervention. Nonetheless, important lessons can be gleaned from this randomized controlled trial. Our study supports the proposition that as long as organizations vary in their capacity for and commitment to the science of QI and systems engineering, we should anticipate variation, uncertainty, and mixed results from short‐term, rapid cycle initiatives.27, 28, 31, 32, 39, 40 The untested, longer‐term benefit produced by a collaborative may be its stimulation of enduring systems engineering that optimizes an environment for QI of health care processes focused on desired outcomes.
Acknowledgements
The authors thank the Agency for Healthcare Research and Quality collaborative investigators for their work in this study: Xu Lei Liu, MS, at Vanderbilt; Laurie Brewer, RN MBA, Jason Hickok, Steve Horner, Susan Littleton, Patsy McFadden, RN BSN MPA CIC, Steve Mok, PharmD, Jonathan Perlin, MD PhD, Joan Reischel, RN BSN CCRN, and Sheri G. Chernestky Tejedor, MD, and all the HCA medical centers that participated in this project.
- ,,.Assessing the impact of continuous quality improvement on clinical practice: What it will take to accelerate progress.Milbank Q.1998;76:593–624.
- .Continuous improvement as an ideal in health care.N Engl J Med.1989;320:53–56.
- .A framework for collaborative improvement: Lessons from the Institute for Healthcare Improvement's Breakthrough Series.Qual Manag Health Care.1998;6(4):1–13.
- ,,,,,.Quality improvement learning collaboratives.Qual Manag Health Care.2005;14:234–237.
- ,,,.Using a virtual breakthrough series collaborative to improve access in primary care.Jt Comm J Qual Patient Saf.2006;32:573–584.
- ,,, et al.Taking the national guideline for care of acute myocardial infarction to the bedside: Developing the guideline applied in practice (GAP) initiative in Southeast Michigan.Jt Comm J Qual Improv.2002;28:5–19.
- ,.Priority Areas for National Action: Transforming Health Care Quality.Washington, DC:The National Academies Press;2003.
- ,,,.Optimal multivariate matching before randomization.Biostatistics.2004;5:263–275.
- Institute for Healthcare Improvement. The 100,000 lives campaign. http://www.ihi.org/IHI/Programs/Campaign.htm;2005.
- ,,, et al.Survey of infection control programs in a large, national healthcare system.Infect Control Hosp Epidemiol.2007;28:1401–1403.
- ,,,. Closing the quality gap: A critical analysis of quality improvement strategies, Volume 1‐Series overview and methodology. Technical Review 9 (Contract No 290–02‐0017 to the Stanford University‐UCSF Evidence‐based Practices Center), 2004. www.ahrq.gov/clinic/tp/qgap1tp.htm. Accessed November 11,2010.
- ,.Improving safety on the front lines: the role of clinical microsystems.Qual Saf Health Care.2002;11:45–50.
- ,,.SamplePower 2.0.Chicago, IL:SPSS Inc.;2001.
- ,,,.Eliminating nosocomial infections at Ascension Health.Jt Comm J Qual Patient Saf.2006;32:612–620.
- ,,, et al.An intensive care unit quality improvement collaborative in nine department of Veterans Affairs hospitals: reducing ventilator‐associated pneumonia and catheter‐related bloodstream infection rates.Jt Comm J Qual Patient Saf.2008;34:639–645.
- ,,, et al.Decreasing ventilator‐associated pneumonia in a trauma ICU.J Trauma.2006;61:122–130.
- ,,,,,.Use of corporate six sigma performance‐improvement strategies to reduce incidence of catheter‐related bloodstream infections in a surgical ICU.J Am Coll Surg.2005;201:349–358.
- ,,,,.Decline in ICU adverse events, nosocomial infections and cost through a quality improvement initiative focusing on teamwork and culture change.Qual Saf Health Care.2006;15:235–239.
- ,,,,,.Using a bundle approach to improve ventilator care processes and reduce ventilator‐associated pneumonia.Jt Comm J Qual Patient Saf.2005;31:243–248.
- ,,,.The 100000 lives campaign: Setting a goal and a deadline for improving health care quality.JAMA.2006;295:324–327.
- ,,.An intervention to decrease catheter‐related bloodstream infections in the ICU.N Engl J Med.2006;355:2725–2732.
- ,,, et al.Improving patient safety units in Michigan.J Crit Care.2008;23:207–221.
- .Toward a zero VAP rate: Personal and team approaches in the ICU.Crit Care Nurs Q.2006;29:108–114.
- ,,, et al.Implementing a ventilator bundle in a community hospital.Jt Comm J Qual Patient Saf.2007;33:219–225.
- ,,, et al.Eliminating catheter‐realted bloodstream infections in the intensive care unit.Crit Care Med.2004;32:2014–2020.
- .Innovative bundle wipes out catheter‐related bloodstream infections.Nursing.2008;38:17–18.
- ,,,,,.The CLABs collaborative: a regionwide effort to improve the quality of care in hospitals.Jt Comm J Qual Patient Saf.2008;34:713–723.
- ,,, et al.Evidence‐based practice to reduce central line infections.Jt Comm J Qual Patient Saf.2006;32:253–260.
- .Learning and improving in quality improvement collaboratives: which collaborative features do participants value most?Health Serv Res.2009;44(2 Pt 1):359–378.
- ,,, et al.Inside the health disparities collaboratives: a detailed exploration of quality improvement at community health centers.Med Care.2008;46:489–496.
- ,,, et al.Quality collaboratives: lessons from research.Qual Saf Health Care.2002;11:345–351.
- ,,, et al.Assessing the implementation of the chronic care model in quality improvement collaboratives.Health Serv Res.2005;40:978–996.
- ,.Prevention of ventilator‐associated pneumonia: Analysis of studies published since 2004.J Hosp Infect.2007;67:1–8.
- ,,,.Effect of comparative data feedback on intensive care unit infection rates in a Veterans Administration Hospital network system.Am J Infect Control.2003;31:397–404.
- ,,, et al.Reducing ventilator‐associated pneumonia rates through a staff education programme.J Hosp Infect.2004;57:223–227.
- ,,,.Does quality improvement implementation affect hospital quality of care?Hosp Top.2007;85:3–12.
- ,,,,,.Using real‐time process measurements to reduce catheter‐related bloodstream infections in the intensive care unit.Qual Saf Health Care.2005;14:295–302.
- ,,,,,.Prevention of ventilator‐associated pneumonia in the Calgary health region: a Canadian success story!Healthcare Qual.2008;11(3 Spec No):129–136.
- .Creating the evidence base for quality improvement collaboratives.Ann Intern Med.2004;140:897–901.
- ,,,,.Evidence for the impact of quality improvement collaboratives: systematic review.Br Med J.2008;336:1491–1494.
Copyright © 2011 Society of Hospital Medicine
