User login
Focusing on Inattention: The Diagnostic Accuracy of Brief Measures of Inattention for Detecting Delirium
Delirium is an acute neurocognitive disorder1 that affects up to 25% of older emergency department (ED) and hospitalized patients.2-4 The relationship between delirium and adverse outcomes is well documented.5-7 Delirium is a strong predictor of increased length of mechanical ventilation, longer intensive care unit and hospital stays, increased risk of falls, long-term cognitive impairment, and mortality.8-13 Delirium is frequently missed by healthcare professionals2,14-16 and goes undetected in up to 3 out of 4 patients by bedside nurses and medical practitioners in many hospital settings.14,17-22 A significant barrier to recognizing delirium is the absence of brief delirium assessments.
In an effort to improve delirium recognition in the acute care setting, there has been a concerted effort to develop and validate brief delirium assessments. To address this unmet need, 4 ‘A’s Test (4AT), the Brief Confusion Assessment Method (bCAM), and the 3-minute diagnostic assessment for CAM-defined delirium (3D-CAM) are 1- to 3-minute delirium assessments that were validated in acutely ill older patients.23 However, 1 to 3 minutes may still be too long in busy clinical environments, and briefer (<30 seconds) delirium assessments may be needed.
One potential more-rapid method to screen for delirium is to specifically test for the presence of inattention, which is a cardinal feature of delirium.24,25 Inattention can be ascertained by having the patient recite the months backwards, recite the days of the week backwards, or spell a word backwards.26 Recent studies have evaluated the diagnostic accuracy of reciting the months of the year backwards for delirium. O’Regan et al.27 evaluated the diagnostic accuracy of the month of the year backwards from December to July (MOTYB-6) and observed that this task was 84% sensitive and 90% specific for delirium in older patients. However, they performed the reference standard delirium assessments in patients who had a positive MOTYB-6, which can overestimate sensitivity and underestimate specificity (verification bias).28 Fick et al.29 examined the diagnostic accuracy of 20 individual elements of the 3D-CAM and observed that reciting the months of the year backwards from December to January (MOTYB-12) was 83% sensitive and 69% specific for delirium. However, this was an exploratory study that was designed to identify an element of the 3D-CAM that had the best diagnostic accuracy.
To address these limitations, we sought to evaluate the diagnostic performance of the MOTYB-6 and MOTYB-12 for delirium as diagnosed by a reference standard. We also explored other brief tests of inattention such as spelling a word (“LUNCH”) backwards, reciting the days of the week backwards, 10-letter vigilance “A” task, and 5 picture recognition task.
METHODS
Study Design and Setting
This was a preplanned secondary analysis of a prospective observational study that validated 3 delirium assessments.30,31 This study was conducted at a tertiary care, academic ED. The local institutional review board (IRB) reviewed and approved this study. Informed consent from the patient or an authorized surrogate was obtained whenever possible. Because this was an observational study and posed minimal risk to the patient, the IRB granted a waiver of consent for patients who were both unable to provide consent and were without an authorized surrogate available in the ED or by phone.
Selection of Participants
We enrolled a convenience sample of patients between June 2010 and February 2012 Monday through Friday from 8
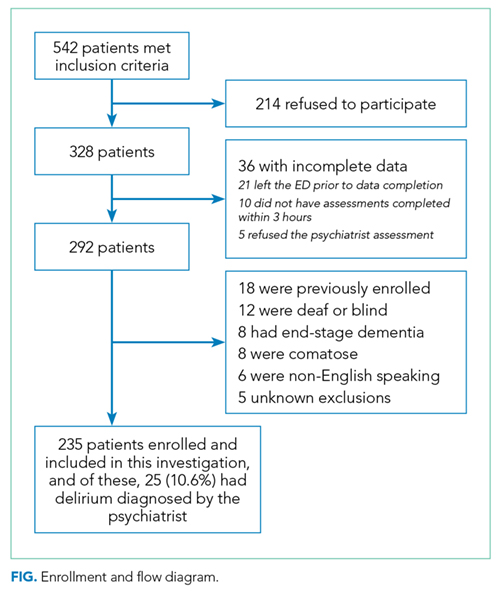
Research assistants approached patients who met inclusion criteria and determined if any exclusion criteria were present. If none of the exclusion criteria were present, then the research assistant reviewed the informed consent document with the patient or authorized surrogate if the patient was not capable of providing consent. If a patient was not capable of providing consent and no authorized surrogate was available, then the patient was enrolled (under the waiver of consent) as long as the patient assented to be a part of the study. Once the patient was enrolled, the research assistant contacted the physician rater and reference standard psychiatrists to approach the patient.
Measures of Inattention
An emergency physician (JHH) who had no formal training in the mental status assessment of elders administered a cognitive battery to the patient, including tests of inattention. The following inattention tasks were administered:
- Spell the word “LUNCH” backwards.30 Patients were initially allowed to spell the word “LUNCH” forwards. Patients who were unable to perform the task were assigned 5 errors.
- Recite the months of the year backwards from December to July.23,26,27,30,32 Patients who were unable to perform the task were assigned 6 errors.
- Recite the days of the week backwards.23,26,33 Patients who were unable to perform the task were assigned 7 errors.
- Ten-letter vigilance “A” task.34 The patient was given a series of 10 letters (“S-A-V-E-A-H-A-A-R-T”) every 3 seconds and was asked to squeeze the rater’s hand every time the patient heard the letter “A.” Patients who were unable to perform the task were assigned 10 errors.
- Five picture recognition task.34 Patients were shown 5 objects on picture cards. Afterwards, patients were shown 10 pictures with the previously shown objects intermingled. The patient had to identify which objects were seen previously in the first 5 pictures. Patients who were unable to perform the task were assigned 10 errors.
- Recite the months of the year backwards from December to January.29 Patients who were unable to perform the task were assigned 12 errors.
Reference Standard for Delirium
A comprehensive consultation-liaison psychiatrist assessment was the reference standard for delirium; the diagnosis of delirium was based on Diagnostic and Statistical Manual of Mental Disorders, Fourth Edition, Text Revision (DSM-IV-TR) criteria.35 Three psychiatrists who each had an average of 11 years of clinical experience and regularly diagnosed delirium as part of their daily clinical practice were available to perform these assessments. To arrive at the diagnosis of delirium, they interviewed those who best understood the patient’s mental status (eg, the patient’s family members or caregivers, physician, and nurses). They also reviewed the patient’s medical record and radiology and laboratory test results. They performed bedside cognitive testing that included, but was not limited to, the Mini-Mental State Examination, Clock Drawing Test, Luria hand sequencing task, and tests for verbal fluency. A focused neurological examination was also performed (ie, screening for paraphasic errors, tremors, tone, asterixis, frontal release signs, etc.), and they also evaluated the patient for affective lability, hallucinations, and level of alertness. If the presence of delirium was still questionable, then confrontational naming, proverb interpretation or similarities, and assessments for apraxias were performed at the discretion of the psychiatrist. The psychiatrists were blinded to the physician’s assessments, and the assessments were conducted within 3 hours of each other.
Additional Variables Collected
Using medical record review, comorbidity burden, severity of illness, and premorbid cognition were ascertained. The Charlson Comorbidity Index, a weighted index that takes into account the number and seriousness of 19 preexisting comorbid conditions, was used to quantify comorbidity burden; higher scores indicate higher comorbid burden.36,37 The Acute Physiology Score of the Acute Physiology and Chronic Health Evaluation II was used to quantify severity of illness.38 This score is based upon the initial values of 12 routine physiologic measurements such as vital sign and laboratory abnormalities; higher scores represent higher severities of illness.38 The medical record was reviewed to ascertain the presence of premorbid cognitive impairment; any documentation of dementia in the patient’s clinical problem list or physician history and physical examination from the outpatient or inpatient settings was considered positive. The medical record review was performed by a research assistant and was double-checked for accuracy by one of the investigators (JHH).
Data Analyses
Measures of central tendency and dispersion for continuous variables were reported as medians and interquartile ranges. Categorical variables were reported as proportions. Receiver operating characteristic curves were constructed for each inattention task. Area under the receiver operating characteristic curves (AUC) was reported to provide a global measure of diagnostic accuracy. Sensitivities, specificities, positive likelihood ratios (PLRs), and negative likelihood ratios (NLRs) with their 95% CIs were calculated using the psychiatrist’s assessment as the reference standard.39 Cut-points with PLRs greater than 10 (strongly increased the likelihood of delirium) or NLRs less than 0.1 (strongly decreased the likelihood of delirium) were preferentially reported whenever possible.
All statistical analyses were performed with open source R statistical software version 3.0.1 (http://www.r-project.org/), SAS 9.4 (SAS Institute, Cary, NC), and Microsoft Excel 2010 (Microsoft Inc., Redmond, WA).
RESULTS
DISCUSSION
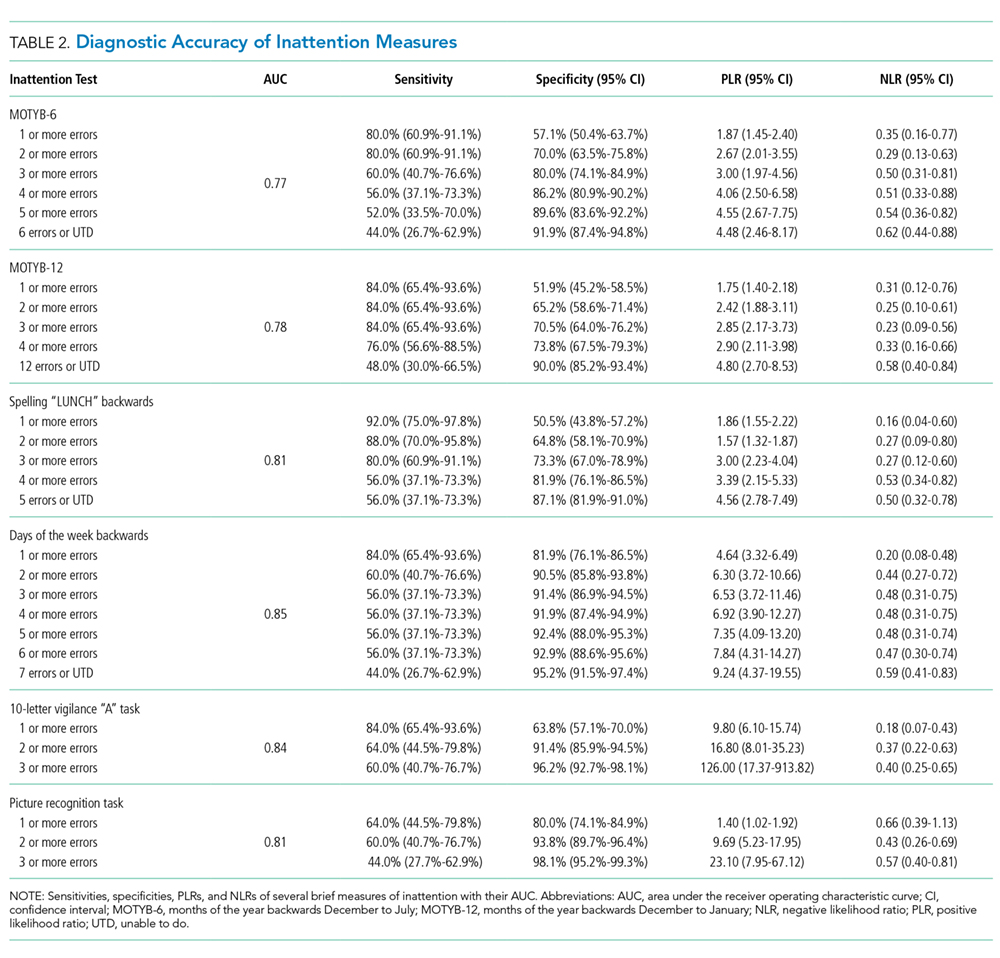
Delirium is frequently missed by healthcare providers because it is not routinely screened for in the acute care setting. To help address this deficiency of care, we evaluated several brief measures of inattention that take less than 30 seconds to complete. We observed that any errors made on the MOTYB-6 and MOTYB-12 tasks had very good sensitivities (80% and 84%) but were limited by their modest specificities (approximately 50%) for delirium. As a result, these assessments have limited clinical utility as standalone delirium screens. We also explored other commonly used brief measures of inattention and at a variety of error cutoffs. Reciting the days of the week backwards appeared to best balance sensitivity and specificity. None of the inattention measures could convincingly rule out delirium (NLR < 0.10), but the vigilance “A” and picture recognition tasks may have clinical utility in ruling in delirium (PLR > 10). Overall, all the inattention tasks, including MOTYB-6 and MOTYB-12, had very good diagnostic performances based upon their AUC. However, achieving a high sensitivity often had to be sacrificed for specificity or, alternatively, achieving a high specificity had to be sacrificed for sensitivity.
Inattention has been shown to be the cardinal feature for delirium,40 and its assessment using cognitive testing has been recommended to help identify the presence of delirium according to an expert consensus panel.26 The diagnostic performance of the MOTYB-12 observed in our study is similar to a study by Fick et al., who reported that MOTYB-12 had very good sensitivity (83%) but had modest specificity (69%) with a cutoff of 1 or more errors. Hendry et al. observed that the MOTYB-12 was 91% sensitive and 50% specific using a cutoff of 4 or more errors. With regard to the MOTYB-6, our reported specificity was different from what was observed by O’Regan et al.27 Using 1 or more errors as a cutoff, they observed a much higher specificity for delirium than we did (90% vs 57%). Discordant observations regarding the diagnostic accuracy for other inattention tasks also exist. We observed that making any error on the days of the week backwards task was 84% sensitive and 82% specific for delirium, whereas Fick et al. observed a sensitivity and specificity of 50% and 94%, respectively. For the vigilance “A” task, we observed that making 2 or more errors over a series of 10 letters was 64.0% sensitive and 91.4% specific for delirium, whereas Pompei et al.41 observed that making 2 or more errors over a series of 60 letters was 51% sensitive and 77% specific for delirium.
The abovementioned discordant findings may be driven by spectrum bias, wherein the sensitivities and specificities for each inattention task may differ in different subgroups. As a result, differences in the age distribution, proportion of college graduates, history of dementia, and susceptibility to delirium can influence overall sensitivity and specificity. Objective measures of delirium, including the inattention screens studied, are particularly prone to spectrum bias.31,34 However, the strength of this approach is that the assessment of inattention becomes less reliant upon clinical judgment and allows it to be used by raters from a wide range of clinical backgrounds. On the other hand, a subjective interpretation of these inattention tasks may allow the rater to capture the subtleties of inattention (ie, decreased speed of performance in a highly intelligent and well-educated patient without dementia). The disadvantage of this approach, however, is that it is more dependent on clinical judgment and may have decreased diagnostic accuracy in those with less clinical experience or with limited training.14,42,43 These factors must be carefully considered when determining which delirium assessment to use.
Additional research is required to determine the clinical utility of these brief inattention assessments. These findings need to be further validated in larger studies, and the optimal cutoff of each task for different subgroup of patients (eg, demented vs nondemented) needs to be further clarified. It is not completely clear whether these inattention tests can serve as standalone assessments. Depending on the cutoff used, some of these assessments may have unacceptable false negative or false positive rates that may lead to increased adverse patient outcomes or increased resource utilization, respectively. Additional components or assessments may be needed to improve the diagnostic accuracy of these assessments. In addition to understanding these inattention assessments’ diagnostic accuracies, their ability to predict adverse outcomes also needs to be investigated. While a previous study observed that making any error on the MOTYB-12 task was associated with increased physical restraint use and prolonged hospital length of stay,44 these assessments’ ability to prognosticate long-term outcomes such as mortality or long-term cognition or function need to be studied. Lastly, studies should also evaluate how easily implementable these assessments are and whether improved delirium recognition leads to improved patient outcomes.
This study has several notable limitations. Though planned a priori, this was a secondary analysis of a larger investigation designed to validate 3 delirium assessments. Our sample size was also relatively small, causing our 95% CIs to overlap in most cases and limiting the statistical power to truly determine whether one measure is better than the other. We also asked the patient to recite the months backwards from December to July as well as recite the months backwards from December to January. It is possible that the patient may have performed better at going from December to January because of learning effect. Our reference standard for delirium was based upon DSM-IV-TR criteria. The new DSM-V criteria may be more restrictive and may slightly change the sensitivities and specificities of the inattention tasks. We enrolled a convenience sample and enrolled patients who were more likely to be male, have cardiovascular chief complaints, and be admitted to the hospital; as a result, selection bias may have been introduced. Lastly, this study was conducted in a single center and enrolled patients who were 65 years and older. Our findings may not be generalizable to other settings and in those who are less than 65 years of age.
CONCLUSIONS
The MOTYB-6 and MOTYB-12 tasks had very good sensitivities but modest specificities (approximately 50%) using any error made as a cutoff; increasing cutoff to 2 errors and 3 errors, respectively, improved their specificities (approximately 70%) with minimal impact to their sensitivities. Reciting the days of the week backwards, spelling the word “LUNCH” backwards, and the 10-letter vigilance “A” task appeared to perform the best in ruling out delirium but only moderately decreased the likelihood of delirium. The 10-letter Vigilance “A” and picture recognition task
Disclosure
This study was funded by the Emergency Medicine Foundation Career Development Award, National Institutes of Health K23AG032355, and National Center for Research Resources, Grant UL1 RR024975-01. The authors report no financial conflicts of interest.
1. American Psychiatric Association. Diagnostic and statistical manual of mental disorders: DSM-5. Washington, DC: American Psychiatric Association; 2013.
33. Hamrick I, Hafiz R, Cummings DM. Use of days of the week in a modified mini-mental state exam (M-MMSE) for detecting geriatric cognitive impairment. J Am Board Fam Med. 2013;26(4):429-435.
Delirium is an acute neurocognitive disorder1 that affects up to 25% of older emergency department (ED) and hospitalized patients.2-4 The relationship between delirium and adverse outcomes is well documented.5-7 Delirium is a strong predictor of increased length of mechanical ventilation, longer intensive care unit and hospital stays, increased risk of falls, long-term cognitive impairment, and mortality.8-13 Delirium is frequently missed by healthcare professionals2,14-16 and goes undetected in up to 3 out of 4 patients by bedside nurses and medical practitioners in many hospital settings.14,17-22 A significant barrier to recognizing delirium is the absence of brief delirium assessments.
In an effort to improve delirium recognition in the acute care setting, there has been a concerted effort to develop and validate brief delirium assessments. To address this unmet need, 4 ‘A’s Test (4AT), the Brief Confusion Assessment Method (bCAM), and the 3-minute diagnostic assessment for CAM-defined delirium (3D-CAM) are 1- to 3-minute delirium assessments that were validated in acutely ill older patients.23 However, 1 to 3 minutes may still be too long in busy clinical environments, and briefer (<30 seconds) delirium assessments may be needed.
One potential more-rapid method to screen for delirium is to specifically test for the presence of inattention, which is a cardinal feature of delirium.24,25 Inattention can be ascertained by having the patient recite the months backwards, recite the days of the week backwards, or spell a word backwards.26 Recent studies have evaluated the diagnostic accuracy of reciting the months of the year backwards for delirium. O’Regan et al.27 evaluated the diagnostic accuracy of the month of the year backwards from December to July (MOTYB-6) and observed that this task was 84% sensitive and 90% specific for delirium in older patients. However, they performed the reference standard delirium assessments in patients who had a positive MOTYB-6, which can overestimate sensitivity and underestimate specificity (verification bias).28 Fick et al.29 examined the diagnostic accuracy of 20 individual elements of the 3D-CAM and observed that reciting the months of the year backwards from December to January (MOTYB-12) was 83% sensitive and 69% specific for delirium. However, this was an exploratory study that was designed to identify an element of the 3D-CAM that had the best diagnostic accuracy.
To address these limitations, we sought to evaluate the diagnostic performance of the MOTYB-6 and MOTYB-12 for delirium as diagnosed by a reference standard. We also explored other brief tests of inattention such as spelling a word (“LUNCH”) backwards, reciting the days of the week backwards, 10-letter vigilance “A” task, and 5 picture recognition task.
METHODS
Study Design and Setting
This was a preplanned secondary analysis of a prospective observational study that validated 3 delirium assessments.30,31 This study was conducted at a tertiary care, academic ED. The local institutional review board (IRB) reviewed and approved this study. Informed consent from the patient or an authorized surrogate was obtained whenever possible. Because this was an observational study and posed minimal risk to the patient, the IRB granted a waiver of consent for patients who were both unable to provide consent and were without an authorized surrogate available in the ED or by phone.
Selection of Participants
We enrolled a convenience sample of patients between June 2010 and February 2012 Monday through Friday from 8
Research assistants approached patients who met inclusion criteria and determined if any exclusion criteria were present. If none of the exclusion criteria were present, then the research assistant reviewed the informed consent document with the patient or authorized surrogate if the patient was not capable of providing consent. If a patient was not capable of providing consent and no authorized surrogate was available, then the patient was enrolled (under the waiver of consent) as long as the patient assented to be a part of the study. Once the patient was enrolled, the research assistant contacted the physician rater and reference standard psychiatrists to approach the patient.
Measures of Inattention
An emergency physician (JHH) who had no formal training in the mental status assessment of elders administered a cognitive battery to the patient, including tests of inattention. The following inattention tasks were administered:
- Spell the word “LUNCH” backwards.30 Patients were initially allowed to spell the word “LUNCH” forwards. Patients who were unable to perform the task were assigned 5 errors.
- Recite the months of the year backwards from December to July.23,26,27,30,32 Patients who were unable to perform the task were assigned 6 errors.
- Recite the days of the week backwards.23,26,33 Patients who were unable to perform the task were assigned 7 errors.
- Ten-letter vigilance “A” task.34 The patient was given a series of 10 letters (“S-A-V-E-A-H-A-A-R-T”) every 3 seconds and was asked to squeeze the rater’s hand every time the patient heard the letter “A.” Patients who were unable to perform the task were assigned 10 errors.
- Five picture recognition task.34 Patients were shown 5 objects on picture cards. Afterwards, patients were shown 10 pictures with the previously shown objects intermingled. The patient had to identify which objects were seen previously in the first 5 pictures. Patients who were unable to perform the task were assigned 10 errors.
- Recite the months of the year backwards from December to January.29 Patients who were unable to perform the task were assigned 12 errors.
Reference Standard for Delirium
A comprehensive consultation-liaison psychiatrist assessment was the reference standard for delirium; the diagnosis of delirium was based on Diagnostic and Statistical Manual of Mental Disorders, Fourth Edition, Text Revision (DSM-IV-TR) criteria.35 Three psychiatrists who each had an average of 11 years of clinical experience and regularly diagnosed delirium as part of their daily clinical practice were available to perform these assessments. To arrive at the diagnosis of delirium, they interviewed those who best understood the patient’s mental status (eg, the patient’s family members or caregivers, physician, and nurses). They also reviewed the patient’s medical record and radiology and laboratory test results. They performed bedside cognitive testing that included, but was not limited to, the Mini-Mental State Examination, Clock Drawing Test, Luria hand sequencing task, and tests for verbal fluency. A focused neurological examination was also performed (ie, screening for paraphasic errors, tremors, tone, asterixis, frontal release signs, etc.), and they also evaluated the patient for affective lability, hallucinations, and level of alertness. If the presence of delirium was still questionable, then confrontational naming, proverb interpretation or similarities, and assessments for apraxias were performed at the discretion of the psychiatrist. The psychiatrists were blinded to the physician’s assessments, and the assessments were conducted within 3 hours of each other.
Additional Variables Collected
Using medical record review, comorbidity burden, severity of illness, and premorbid cognition were ascertained. The Charlson Comorbidity Index, a weighted index that takes into account the number and seriousness of 19 preexisting comorbid conditions, was used to quantify comorbidity burden; higher scores indicate higher comorbid burden.36,37 The Acute Physiology Score of the Acute Physiology and Chronic Health Evaluation II was used to quantify severity of illness.38 This score is based upon the initial values of 12 routine physiologic measurements such as vital sign and laboratory abnormalities; higher scores represent higher severities of illness.38 The medical record was reviewed to ascertain the presence of premorbid cognitive impairment; any documentation of dementia in the patient’s clinical problem list or physician history and physical examination from the outpatient or inpatient settings was considered positive. The medical record review was performed by a research assistant and was double-checked for accuracy by one of the investigators (JHH).
Data Analyses
Measures of central tendency and dispersion for continuous variables were reported as medians and interquartile ranges. Categorical variables were reported as proportions. Receiver operating characteristic curves were constructed for each inattention task. Area under the receiver operating characteristic curves (AUC) was reported to provide a global measure of diagnostic accuracy. Sensitivities, specificities, positive likelihood ratios (PLRs), and negative likelihood ratios (NLRs) with their 95% CIs were calculated using the psychiatrist’s assessment as the reference standard.39 Cut-points with PLRs greater than 10 (strongly increased the likelihood of delirium) or NLRs less than 0.1 (strongly decreased the likelihood of delirium) were preferentially reported whenever possible.
All statistical analyses were performed with open source R statistical software version 3.0.1 (http://www.r-project.org/), SAS 9.4 (SAS Institute, Cary, NC), and Microsoft Excel 2010 (Microsoft Inc., Redmond, WA).
RESULTS
DISCUSSION
Delirium is frequently missed by healthcare providers because it is not routinely screened for in the acute care setting. To help address this deficiency of care, we evaluated several brief measures of inattention that take less than 30 seconds to complete. We observed that any errors made on the MOTYB-6 and MOTYB-12 tasks had very good sensitivities (80% and 84%) but were limited by their modest specificities (approximately 50%) for delirium. As a result, these assessments have limited clinical utility as standalone delirium screens. We also explored other commonly used brief measures of inattention and at a variety of error cutoffs. Reciting the days of the week backwards appeared to best balance sensitivity and specificity. None of the inattention measures could convincingly rule out delirium (NLR < 0.10), but the vigilance “A” and picture recognition tasks may have clinical utility in ruling in delirium (PLR > 10). Overall, all the inattention tasks, including MOTYB-6 and MOTYB-12, had very good diagnostic performances based upon their AUC. However, achieving a high sensitivity often had to be sacrificed for specificity or, alternatively, achieving a high specificity had to be sacrificed for sensitivity.
Inattention has been shown to be the cardinal feature for delirium,40 and its assessment using cognitive testing has been recommended to help identify the presence of delirium according to an expert consensus panel.26 The diagnostic performance of the MOTYB-12 observed in our study is similar to a study by Fick et al., who reported that MOTYB-12 had very good sensitivity (83%) but had modest specificity (69%) with a cutoff of 1 or more errors. Hendry et al. observed that the MOTYB-12 was 91% sensitive and 50% specific using a cutoff of 4 or more errors. With regard to the MOTYB-6, our reported specificity was different from what was observed by O’Regan et al.27 Using 1 or more errors as a cutoff, they observed a much higher specificity for delirium than we did (90% vs 57%). Discordant observations regarding the diagnostic accuracy for other inattention tasks also exist. We observed that making any error on the days of the week backwards task was 84% sensitive and 82% specific for delirium, whereas Fick et al. observed a sensitivity and specificity of 50% and 94%, respectively. For the vigilance “A” task, we observed that making 2 or more errors over a series of 10 letters was 64.0% sensitive and 91.4% specific for delirium, whereas Pompei et al.41 observed that making 2 or more errors over a series of 60 letters was 51% sensitive and 77% specific for delirium.
The abovementioned discordant findings may be driven by spectrum bias, wherein the sensitivities and specificities for each inattention task may differ in different subgroups. As a result, differences in the age distribution, proportion of college graduates, history of dementia, and susceptibility to delirium can influence overall sensitivity and specificity. Objective measures of delirium, including the inattention screens studied, are particularly prone to spectrum bias.31,34 However, the strength of this approach is that the assessment of inattention becomes less reliant upon clinical judgment and allows it to be used by raters from a wide range of clinical backgrounds. On the other hand, a subjective interpretation of these inattention tasks may allow the rater to capture the subtleties of inattention (ie, decreased speed of performance in a highly intelligent and well-educated patient without dementia). The disadvantage of this approach, however, is that it is more dependent on clinical judgment and may have decreased diagnostic accuracy in those with less clinical experience or with limited training.14,42,43 These factors must be carefully considered when determining which delirium assessment to use.
Additional research is required to determine the clinical utility of these brief inattention assessments. These findings need to be further validated in larger studies, and the optimal cutoff of each task for different subgroup of patients (eg, demented vs nondemented) needs to be further clarified. It is not completely clear whether these inattention tests can serve as standalone assessments. Depending on the cutoff used, some of these assessments may have unacceptable false negative or false positive rates that may lead to increased adverse patient outcomes or increased resource utilization, respectively. Additional components or assessments may be needed to improve the diagnostic accuracy of these assessments. In addition to understanding these inattention assessments’ diagnostic accuracies, their ability to predict adverse outcomes also needs to be investigated. While a previous study observed that making any error on the MOTYB-12 task was associated with increased physical restraint use and prolonged hospital length of stay,44 these assessments’ ability to prognosticate long-term outcomes such as mortality or long-term cognition or function need to be studied. Lastly, studies should also evaluate how easily implementable these assessments are and whether improved delirium recognition leads to improved patient outcomes.
This study has several notable limitations. Though planned a priori, this was a secondary analysis of a larger investigation designed to validate 3 delirium assessments. Our sample size was also relatively small, causing our 95% CIs to overlap in most cases and limiting the statistical power to truly determine whether one measure is better than the other. We also asked the patient to recite the months backwards from December to July as well as recite the months backwards from December to January. It is possible that the patient may have performed better at going from December to January because of learning effect. Our reference standard for delirium was based upon DSM-IV-TR criteria. The new DSM-V criteria may be more restrictive and may slightly change the sensitivities and specificities of the inattention tasks. We enrolled a convenience sample and enrolled patients who were more likely to be male, have cardiovascular chief complaints, and be admitted to the hospital; as a result, selection bias may have been introduced. Lastly, this study was conducted in a single center and enrolled patients who were 65 years and older. Our findings may not be generalizable to other settings and in those who are less than 65 years of age.
CONCLUSIONS
The MOTYB-6 and MOTYB-12 tasks had very good sensitivities but modest specificities (approximately 50%) using any error made as a cutoff; increasing cutoff to 2 errors and 3 errors, respectively, improved their specificities (approximately 70%) with minimal impact to their sensitivities. Reciting the days of the week backwards, spelling the word “LUNCH” backwards, and the 10-letter vigilance “A” task appeared to perform the best in ruling out delirium but only moderately decreased the likelihood of delirium. The 10-letter Vigilance “A” and picture recognition task
Disclosure
This study was funded by the Emergency Medicine Foundation Career Development Award, National Institutes of Health K23AG032355, and National Center for Research Resources, Grant UL1 RR024975-01. The authors report no financial conflicts of interest.
1. American Psychiatric Association. Diagnostic and statistical manual of mental disorders: DSM-5. Washington, DC: American Psychiatric Association; 2013.
33. Hamrick I, Hafiz R, Cummings DM. Use of days of the week in a modified mini-mental state exam (M-MMSE) for detecting geriatric cognitive impairment. J Am Board Fam Med. 2013;26(4):429-435.
© 2018 Society of Hospital Medicine
Impaired Arousal and Mortality
Arousal is defined as the patient's overall level of responsiveness to the environment. Its assessment is standard of care in most intensive care units (ICUs) to monitor depth of sedation and underlying brain dysfunction. There has been recent interest in expanding the role of arousal assessment beyond the ICU. Specifically, the Veterans Affairs Delirium Working Group proposed that simple arousal assessment be a vital sign to quantify underlying brain dysfunction.[1] The rationale is that impaired arousal is closely linked with delirium,[2] and is an integral component of multiple delirium assessments.[3, 4, 5] Chester et al. observed that the presence of impaired arousal was 64% sensitive and 93% specific for delirium diagnosed by a psychiatrist.[2] Delirium is an under‐recognized public health problem that affects up to 25% of older hospitalized patients,[6, 7] is associated with a multitude of adverse outcomes such as death and accelerated cognitive decline,[8] and costs the US healthcare system an excess of $152 billion dollars.[9]
Most delirium assessments require the patient to undergo additional cognitive testing. The assessment of arousal, however, requires the rater to merely observe the patient during routine clinical care and can be easily integrated into the clinical workflow.[10] Because of its simplicity and brevity, assessing arousal alone using validated scales such as the Richmond Agitation‐Sedation Scale (RASS) may be a more appealing alternative to traditional, more complex delirium screening in the acute care setting. Its clinical utility would be further strengthened if impaired arousal was also associated with mortality, and conferred risk even in the absence of delirium. As a result, we sought to determine if impaired arousal at initial presentation in older acutely ill patients predicted 6‐month mortality and whether this relationship was present in the absence of delirium.
METHODS
Design Overview
We performed a planned secondary analysis of 2 prospective cohorts that enrolled patients from May 2007 to August 2008 between 8 am and 10 pm during the weekdays, and July 2009 to February 2012 between 8 am and 4 pm during the weekdays. The first cohort was designed to evaluate the relationship between delirium and patient outcomes.[11, 12] The second cohort was used to validate brief delirium assessments using a psychiatrist's assessment as the reference standard.[5, 13] The local institutional review board approved these studies.
Setting and Participants
These studies were conducted in an urban emergency department located within an academic, tertiary care hospital with over 57,000 visits annually. Patients were included if they were 65 years or older and in the emergency department for <12 hours at the time of enrollment. The 12‐hour cutoff was used to include patients who presented to the emergency department in the evening and early morning hours. Patients were excluded if they were previously enrolled, non‐English speaking, comatose, or were nonverbal and unable to follow simple commands prior to the acute illness. Because the July 2009 to February 2012 cohort was designed to validate delirium assessments with auditory and visual components, patients were also excluded if they were deaf or blind.
Measurement of Arousal
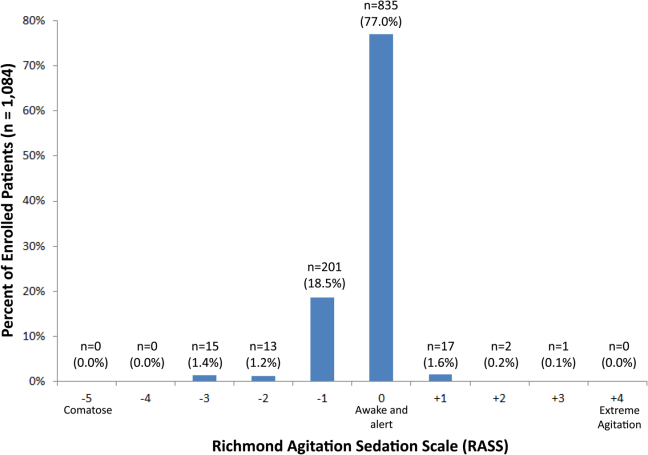
RASS is an arousal scale commonly used in ICUs to assess depth of sedation and ranges from 5 (unarousable) to +4 (combative); 0 represents normal arousal.[10, 14] The RASS simply requires the rater to observe the patient during their routine interactions and does not require any additional cognitive testing. The RASS terms sedation was modified to drowsy (Table 1), because we wanted to capture impaired arousal regardless of sedation administration. We did not use the modified RASS (mRASS) proposed by the Veteran's Affairs Delirium Working Group, because it was published after data collection began.[1] The mRASS is very similar to the RASS, except it also incorporates a very informal inattention assessment. The RASS was ascertained by research assistants who were college students and graduates, and emergency medical technician basics and paramedics. The principal investigator gave them a 5‐minute didactic lecture about the RASS and observed them perform the RASS in at least 5 patients prior to the start of the study. Inter‐rater reliability between trained research assistants and a physician was assessed for 456 (42.0%) patients of the study sample. The weighted kappa of the RASS was 0.61, indicating very good inter‐rater reliability. Because the 81.7% of patients with impaired arousal had a RASS of 1, the RASS dichotomized as normal (RASS=0) or impaired (RASS other than 0).
| Score | Term | Description |
|---|---|---|
| ||
| +4 | Combative | Overtly combative, violent, immediate danger to staff |
| +3 | Very agitated | Pulls or removes tube(s) or catheter(s), aggressive |
| +2 | Agitated | Frequent nonpurposeful movement |
| +1 | Restless | Anxious but movements not aggressive or vigorous |
| 0 | Alert and calm | |
| 1 | Slight drowsy | Not fully alert, but has sustained awakening (eye opening/eye contact) to voice (>10 seconds) |
| 2 | Moderately drowsy | Briefly awakens with eye contact to voice (<10 seconds) |
| 3 | Very drowsy | Movement or eye opening to voice (but no eye contact) |
| 4 | Awakens to pain only | No response to voice, but movement or eye opening to physical stimulation |
| 5 | Unarousable | No response to voice or physical stimulation |
Death Ascertainment
Death within 6 months was ascertained using the following algorithm: (1) The electronic medical record was searched to determine the patient's death status. (2) Patients who had a documented emergency department visit, outpatient clinic visit, or hospitalization after 6 months were considered to be alive at 6 months. (3) For the remaining patients, date of death was searched in the Social Security Death Index (SSDI). (4) Patients without a death recorded in the SSDI 1 year after the index visit was considered to be alive at 6 months. Nine hundred thirty‐one (85.9%) out of 1084 patients had a recorded death in the medical record or SSDI, or had an emergency department or hospital visit documented in their record 6 months after the index visit.
Additional Variables Collected
Patients were considered to have dementia if they had: (1) documented dementia in the medical record, (2) a short form Informant Questionnaire on Cognitive Decline in the Elderly score (IQCODE) greater than 3.38,[15] or (3) prescribed cholinesterase inhibitors prior to admission. The short form IQCODE is an informant questionnaire with 16 items; a cutoff of 3.38 out of 5.00 is 79% sensitive and 82% specific for dementia.[16] Premorbid functional status was determined by the Katz Activities of Daily Living (Katz ADL) and ranges from 0 (completely dependent) to 6 (completely independent).[17] Patients with a score <5 were considered to be functionally dependent. Both the IQCODE and Katz ADL were prospectively collected in the emergency department at the time of enrollment.
The Charlson Comorbidity Index was used to measure comorbid burden.[18] The Acute Physiology Score (APS) of the Acute Physiology and Chronic Health Evaluation II score was used to quantify severity of illness.[19] The Glasgow Coma Scale was not included in the APS because it was not collected. Intravenous, intramuscular, and oral benzodiazepine and opioids given in the prehospital and emergency department were also recorded. The Charlson Comorbidity Index, APS, and benzodiazepine and opioid administration were collected after patient enrollment using the electronic medical record.
Within 3 hours of the RASS, a subset of 406 patients was evaluated by a consultation‐liaison psychiatrist who determined the patient's delirium status using Diagnostic and Statistical Manual of Mental Disorders, Fourth Edition, Text Revision (DSM‐IV‐TR) criteria.[20] Details of their comprehensive assessments have been described in a previous report.[5]
Statistical Analysis
Measures of central tendency and dispersion for continuous variables were reported as medians and interquartile ranges. Categorical variables were reported as proportions. For simple comparisons, Wilcoxon rank sum tests were performed for continuous data, and 2 analyses or Fisher exact test were performed for categorical data. To evaluate the predictive validity of impaired arousal on 6‐month mortality, the cumulative probability of survival was estimated within 6 months from the study enrollment date using the Kaplan‐Meier method. Cox proportional hazards regression was performed to assess if impaired arousal was independently associated with 6‐month mortality after adjusting for age, gender, nonwhite race, comorbidity burden (Charlson Comorbidity Index), severity of illness (APS), dementia, functional dependence (Katz ADL <5), nursing home residence, admission status, and benzodiazepine or opioid medication administration. Patients were censored at the end of 6 months. The selection of covariates was based upon expert opinion and literature review. The number of covariates used for the model was limited by the number of events to minimize overfitting; 1 df was allowed for every 10 to 15 events.[21] Because severity of illness, psychoactive medication administration, and admission status might modify the relationship between 6‐month mortality and impaired arousal, 2‐way interaction terms were incorporated. To maintain parsimony and minimize overfitting and collinearity, nonsignificant interaction terms (P>0.20) were removed in the final model.[22] Hazard ratios (HR) with their 95% confidence interval (95% CI) were reported.
To determine if arousal was associated with 6‐month mortality in the absence of delirium, we performed another Cox proportional hazard regression in a subset of 406 patients who received a psychiatrist assessment. Six‐month mortality was the dependent variable, and the independent variable was a 3‐level categorical variable of different arousal/delirium combinations: (1) impaired arousal/delirium positive, (2) impaired arousal/delirium negative, and (3) normal arousal (with or without delirium). Because there were only 8 patients who had normal arousal with delirium, this group was collapsed into the normal arousal without delirium group. Because there were 55 deaths, the number of covariates that could be entered into the Cox proportional hazard regression model was limited. We used the inverse weighted propensity score method to help minimize residual confounding.[23] Traditional propensity score adjustment could not be performed because there were 3 arousal/delirium categories. Similar to propensity score adjustment, inverse weighted propensity score method was used to help balance the distribution of patient characteristics among the exposure groups and also allow adjustment for multiple confounders while minimizing the degrees of freedom expended. A propensity score was the probability of having a particular arousal/delirium category based upon baseline patient characteristics. Multinomial logistic regression was performed to calculate the propensity score, and the baseline covariates used were age, gender, nonwhite race, comorbidity burden, severity of illness, dementia, functional dependence, and nursing home residence. For the Cox proportional hazard regression model, each observation was weighted by the inverse of the propensity score for their given arousal/delirium category; propensity scores exceeding the 95th percentile were trimmed to avoid overly influential weighting. Benzodiazepine and opioid medications given in the emergency department and admission status were adjusted as covariates in the weighted Cox proportional hazard regression model.
Nineteen patients (1.8%) had missing Katz ADL; these missing values were imputed using multiple imputation. The reliability of the final regression models were internally validated using the bootstrap method.[21] Two thousand sets of bootstrap samples were generated by resampling the original data, and the optimism was estimated to determine the degree of overfitting.[21] An optimism value >0.85 indicated no evidence of substantial overfitting.[21] Variance inflation factors were used to check multicollinearity. Schoenfeld residuals were also analyzed to determine goodness‐of‐fit and assess for outliers. P values <0.05 were considered statistically significant. All statistical analyses were performed using SAS version 9.4 (SAS Institute, Cary, NC) and open source R statistical software version 3.0.1 (
RESULTS
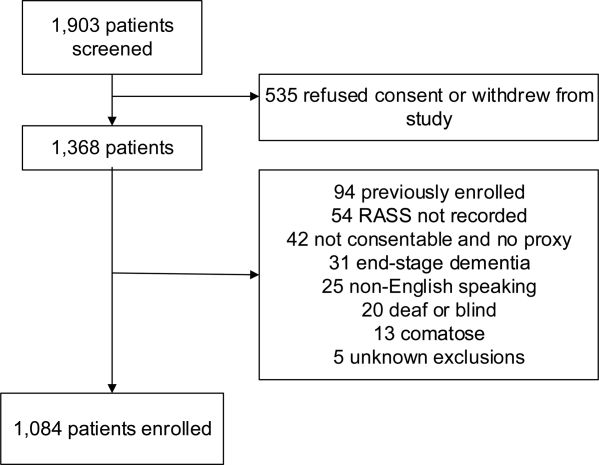
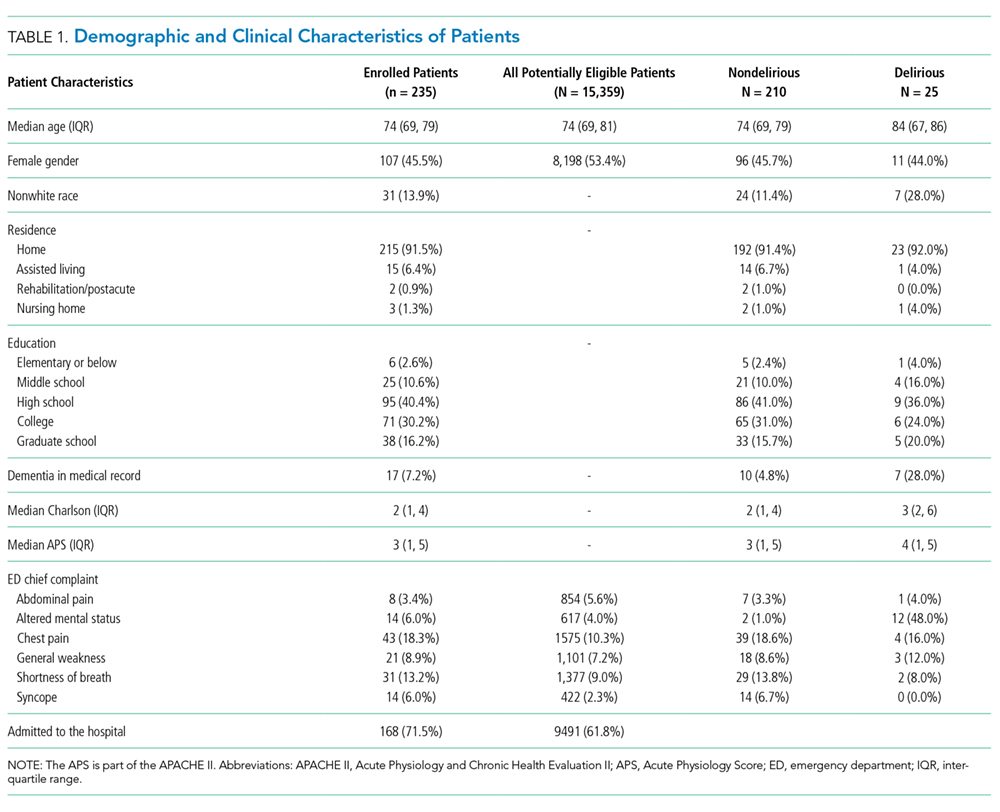
A total of 1903 patients were screened, and 1084 patients met enrollment criteria (Figure 1). Of these, 1051 (97.0%) were non‐ICU patients. Patient characteristics of this cohort can be seen in Table 2. Enrolled patients and potentially eligible patients who presented to the emergency department during the enrollment window were similar in age, gender, and severity of illness, but enrolled patients were slightly more likely to have a chief complaint of chest pain and syncope (unpublished data).

| Variables | Normal Arousal, n=835 | Impaired Arousal, n=249 | P Value |
|---|---|---|---|
| |||
| Median age, y (IQR) | 74 (6980) | 75 (7083) | 0.005 |
| Female gender | 459 (55.0%) | 132 (53.0%) | 0.586 |
| Nonwhite race | 122 (14.6%) | 51 (20.5%) | 0.027 |
| Residence | <0.001 | ||
| Home | 752 (90.1%) | 204 (81.9%) | |
| Assisted living | 29 (3.5%) | 13 (5.2%) | |
| Rehabilitation | 8 (1.0%) | 5 (2.0%) | |
| Nursing home | 42 (5.0%) | 27 (10.8%) | |
| Dementia* | 175 (21.0%) | 119 (47.8%) | <0.001 |
| Dependent | 120 (14.4%) | 99 (39.8%) | <0.001 |
| Median Charlson (IQR) | 2 (1, 4) | 3 (2, 5) | <0.001 |
| Median APS (IQR) | 2 (1, 4) | 2 (1, 5) | <0.001 |
| Primary complaint | <0.001 | ||
| Abdominal pain | 45 (5.4%) | 13 (5.2%) | |
| Altered mental status | 12 (1.4%) | 36 (14.5%) | |
| Chest pain | 128 (15.3%) | 31 (12.5%) | |
| Disturbances of sensation | 17 (2.0%) | 2 (0.8%) | |
| Dizziness | 16 (1.9%) | 2 (0.8%) | |
| Fever | 11 (1.3%) | 7 (2.8%) | |
| General illness, malaise | 26 (3.1%) | 5 (2.0%) | |
| General weakness | 68 (8.1%) | 29 (11.7%) | |
| Nausea/vomiting | 29 (3.5%) | 4 (1.6%) | |
| Shortness of breath | 85 (10.2%) | 21 (8.4%) | |
| Syncope | 46 (5.5%) | 10 (4.0%) | |
| Trauma, multiple organs | 19 (2.3%) | 8 (3.2%) | |
| Other | 333 (39.9%) | 81 (32.5%) | |
| Benzodiazepines or opioid medications administration | 188 (22.5%) | 67 (26.9%) | 0.152 |
| Admitted to the hospital | 478 (57.3%) | 191 (76.7%) | 0.002 |
| Internal medicine | 411 (86.0%) | 153 (80.1%) | |
| Surgery | 38 (8.0%) | 21 (11.0%) | |
| Neurology | 19 (4.0%) | 13 (6.8%) | |
| Psychiatry | 1 (0.2%) | 2 (1.1%) | |
| Unknown/missing | 9 (1.9%) | 2 (1.1%) | |
| Death within 6 months | 81 (9.7%) | 59 (23.7%) | <0.001 |
Of those enrolled, 249 (23.0%) had an abnormal RASS at initial presentation, and their distribution can be seen in Figure 2. Within 6 months, patients with an abnormal RASS were more likely to die compared with patients with a RASS of 0 (23.7% vs 9.7%, P<0.001). The Kaplan‐Meier survival curves for all enrolled patients with impaired and normal RASS can be seen in Figure 3; the survival curve declined more slowly in patients with a normal RASS compared with those with an abnormal RASS.
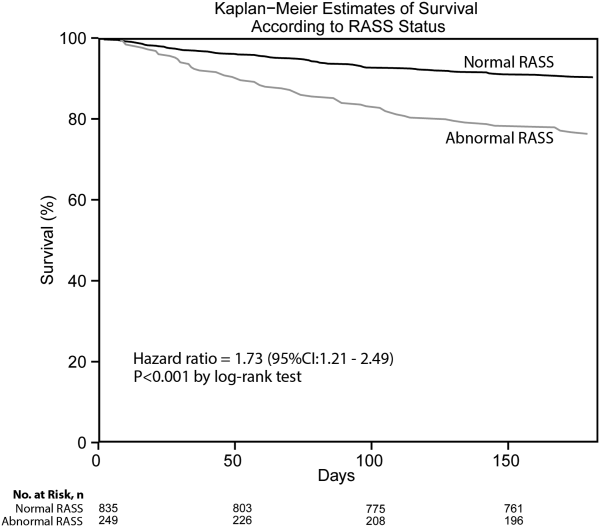
Using Cox proportional hazards regression, the relationship between an abnormal RASS at initial presentation and 6‐month mortality persisted (HR: 1.73, 95% CI: 1.21‐2.49) after adjusting for age, sex, nonwhite race, comorbidity burden, severity of illness, dementia, functional dependence, nursing home residence, psychoactive medications given, and admission status. The interaction between an abnormal RASS and APS (severity of illness) had a P value of 0.52. The interaction between an abnormal RASS and benzodiazepine or opioid medication administration had a P value of 0.38. The interaction between an abnormal RASS and admission status had a P value of 0.57. This indicated that severity of illness, psychoactive medication administration, and admission status did not modify the relationship between an abnormal RASS and 6‐month mortality.
We analyzed a subset of 406 patients who received a psychiatrist's assessment to determine if an abnormal RASS was associated with 6‐month mortality regardless of delirium status using Cox proportional hazard regression weighted by the inverse of the propensity score. Patients with an abnormal RASS and no delirium were significantly associated with higher mortality compared to those with a normal RASS (HR: 2.20, 95% CI: 1.10‐4.41). Patients with an abnormal RASS with delirium also had an increased risk for 6‐month mortality (HR: 2.86, 95% CI: 1.29‐6.34).
All regression models were internally validated. There was no evidence of substantial overfitting or collinearity. The Schoenfeld residuals for each model were examined graphically and there was good model fit overall, and no significant outliers were observed.
DISCUSSION
Vital sign measurements are a fundamental component of patient care, and abnormalities can serve as an early warning signal of the patient's clinical deterioration. However, traditional vital signs do not include an assessment of the patient's brain function. Our chief finding is that impaired arousal at initial presentation, as determined by the nonphysician research staff, increased the risk of 6‐month mortality by 73% after adjusting for confounders in a diverse group of acutely ill older patients. This relationship existed regardless of severity of illness, administration of psychoactive medications, and admission status. Though impaired arousal is closely linked with delirium,[2, 24] which is another well‐known predictor of mortality,[11, 25, 26] the prognostic significance of impaired arousal appeared to extend beyond delirium. We observed that the relationship between 6‐month mortality and impaired arousal in the absence of delirium was remarkably similar to that observed with impaired arousal with delirium. Arousal can be assessed for by simply observing the patient during routine clinical care and can be performed by nonphysician and physician healthcare providers. Its assessment should be performed and communicated in conjunction with traditional vital sign measurements in the emergency department and inpatient settings.[1]
Most of the data linking impaired arousal to death have been collected in the ICU. Coma, which represents the most severe form of depressed arousal, has been shown to increase the likelihood of death regardless of underlying etiology.[27, 28, 29, 30, 31] This includes patients who have impaired arousal because they received sedative medications during mechanical ventilation.[32] Few studies have investigated the effect of impaired arousal in a non‐ICU patient population. Zuliani et al. observed that impaired arousal was associated with 30‐day mortality, but their study was conducted in 469 older stroke patients, limiting the study's external validity to a more general patient population.[33] Our data advance the current stage of knowledge; we observed a similar relationship between impaired arousal and 6‐month mortality in a much broader clinical population who were predominantly not critically ill regardless of delirium status. Additionally, most of our impaired arousal cohort had a RASS of 1, indicating that even subtle abnormalities portended adverse outcomes.
In addition to long‐term prognosis, the presence of impaired arousal has immediate clinical implications. Using arousal scales like the RASS can serve as a way for healthcare providers to succinctly communicate the patient's mental status in a standardized manner during transitions of care (eg, emergency physician to inpatient team). Regardless of which clinical setting they are in, older acutely ill patients with an impaired arousal may also require close monitoring, especially if the impairment is acute. Because of its close relationship with delirium, these patients likely have an underlying acute medical illness that precipitated their impaired arousal.
Understanding the true clinical significance of impaired arousal in the absence of delirium requires further study. Because of the fluctuating nature of delirium, it is possible that these patients may have initially been delirious and then became nondelirious during the psychiatrist's evaluation. Conversely, it is also possible that these patients may have eventually transitioned into delirium at later point in time; the presence of impaired arousal alone may be a precursor to delirium. Last, these patients may have had subsyndromal delirium, which is defined as having 1 or more delirium symptoms without ever meeting full DSM‐IV‐TR criteria for delirium.[34] Patients with subsyndromal delirium have poorer outcomes, such as prolonged hospitalizations, and higher mortality than patients without delirium symptoms.[34]
Additional studies are also needed to further clarify the impact of impaired arousal on nonmortality outcomes such as functional and cognitive decline. The prognostic significance of serial arousal measurements also requires further study. It is possible that patients whose impaired arousal rapidly resolves after an intervention may have better prognoses than those who have persistent impairment. The measurement of arousal may have additional clinical applications in disease prognosis models. The presence of altered mental status is incorporated in various disease‐specific risk scores such as the CURB‐65 or Pneumonia Severity Index for pneumonia,[35, 36] and the Pulmonary Embolism Severity Index for pulmonary embolism.[37] However, the definition of altered mental status is highly variable; it ranges from subjective impressions that can be unreliable to formal cognitive testing, which can be time consuming. Arousal scales such as the RASS may allow for more feasible, reliable, and standardized assessment of mental status. Future studies should investigate if incorporating the RASS would improve the discrimination of these disease‐severity indices.
This study has several notable limitations. We excluded patients with a RASS of 4 and 5, which represented comatose patients. This exclusion, however, likely biased our findings toward the null. We enrolled a convenience sample that may have introduced selection bias. However, our enrolled cohort was similar to all potentially eligible patients who presented to the emergency department during the study period. We also attempted to mitigate this selection bias by using multivariable regression and adjusting for factors that may have confounded the relationship between RASS and 6‐month mortality. This study was performed at a single, urban, academic hospital and enrolled patients who were aged 65 years and older. Our findings may not be generalizable to other settings and to those who are under 65 years of age. Because 406 patients received a psychiatric evaluation, this limited the number of covariates that could be incorporated into the multivariable model to evaluate if impaired arousal in the absence of delirium is associated with 6‐month mortality. To minimize residual confounding, we used the inverse weighted propensity score, but we acknowledge that this bias may still exist. Larger studies are needed to clarify the relationships between arousal, delirium, and mortality.
CONCLUSION
In conclusion, impaired arousal at initial presentation is an independent predictor for 6‐month mortality in a diverse group of acutely ill older patients, and this risk appears to be present even in the absence of delirium. Because of its ease of use and prognostic significance, it may be a useful vital sign for underlying brain dysfunction. Routine standardized assessment and communication of arousal during routine clinical care may be warranted.
Disclosures: Research reported in this publication was supported by the Vanderbilt Physician Scientist Development Award, Emergency Medicine Foundation, and National Institute on Aging of the National Institutes of Health under award number K23AG032355. This study was also supported by the National Center for Research Resources, grant UL1 RR024975‐01, and is now at the National Center for Advancing Translational Sciences, grant 2 UL1 TR000445‐06. Dr. Vasilevskis was supported in part by the National Institute on Aging of the National Institutes of Health under award number K23AG040157. Dr. Powers was supported by Health Resources and Services Administration Geriatric Education Centers, grant 1D31HP08823‐01‐00. Dr. Storrow was supported by the National Heart, Lung, and Blood Institute of the National Institutes of Health under award number K12HL1090 and the National Center for Advancing Translational Sciences under award number UL1TR000445. Dr. Ely was supported in part by the National Institute on Aging of the National Institutes of Health under award numbers R01AG027472 and R01AG035117, and a Veteran Affairs MERIT award. Drs. Vasilevskis, Schnelle, Dittus, Powers, and Ely were supported by the Veteran Affairs Geriatric Research, Education, and Clinical Center. The content is solely the responsibility of the authors and does not necessarily represent the official views of Vanderbilt University, Emergency Medicine Foundation, National Institutes of Health, and Veterans Affairs. The funding agencies did not have any role in the design and conduct of the study; collection, management, analysis, and interpretation of the data; and preparation, review, or approval of the manuscript.
J.H.H., E.W.E., J.F.S., A.B.S., and R.D.S. conceived the trial. J.H.H., E.W.E., A.B.S., J.F.S., R.D.S., A.S., and A.W. participated in the study design. J.H.H. and A.W. recruited patients and collected the data. J.H.H., A.J.G., and A.S. analyzed the data. All authors participated in the interpretation of results. J.H.H. drafted the manuscript, and all authors contributed to the critical review and revision of the manuscript.
The authors report no conflicts of interest.
- , , , et al. The development of a mental status vital sign for use across the spectrum of care. J Am Med Dir Assoc. 2009;10:379–380.
- , , , . Serial administration of a modified Richmond Agitation and Sedation Scale for delirium screening. J Hosp Med. 2012;7:450–453.
- , , , , , . Clarifying confusion: the confusion assessment method. A new method for detection of delirium. Ann Intern Med. 1990;113:941–948.
- , , , et al. Delirium in mechanically ventilated patients: validity and reliability of the confusion assessment method for the intensive care unit (CAM‐ICU). JAMA. 2001;286:2703–2710.
- , , , et al. Diagnosing delirium in older emergency department patients: validity and reliability of the Delirium Triage Screen And The Brief Confusion Assessment Method. Ann Emerg Med. 2013;62:457–465.
- , , , , . Does delirium contribute to poor hospital outcomes? A three‐site epidemiologic study. J Gen Intern Med. 1998;13:234–242.
- , , , . Prognostic significance of delirium in frail older people. Dement Geriatr Cogn Disord. 2005;19:158–163.
- , , , , , . Delirium in elderly patients and the risk of postdischarge mortality, institutionalization, and dementia: a meta‐analysis. JAMA. 2010;304:443–451.
- , , , , . One‐year health care costs associated with delirium in the elderly population. Arch Intern Med. 2008;168:27–32.
- , , , et al. The Richmond Agitation‐Sedation Scale: validity and reliability in adult intensive care unit patients. Am J Respir Crit Care Med. 2002;166:1338–1344.
- , , , et al. Delirium in the emergency department: an independent predictor of death within 6 months. Ann Emerg Med. 2010;56:244–252.
- , , , et al. Delirium in older emergency department patients is an independent predictor of hospital length of stay. Acad Emerg Med. 2011;18:451–457.
- , , , et al. Validation of the Confusion Assessment Method For The Intensive Care Unit in older emergency department patients. Acad Emerg Med. 2014;21:180–187.
- , , , et al. Monitoring sedation status over time in ICU patients: reliability and validity of the Richmond Agitation‐Sedation Scale (RASS). JAMA. 2003;289:2983–2991.
- , , , . Does this patient have dementia? JAMA. 2007;297:2391–2404.
- . A short form of the Informant Questionnaire on Cognitive Decline in the Elderly (IQCODE): development and cross‐validation. Psychol Med. 1994;24:145–153.
- . Assessing self‐maintenance: activities of daily living, mobility, and instrumental activities of daily living. J Am Geriatr Soc. 1983;31:721–727.
- , , , , . Charlson Index is associated with one‐year mortality in emergency department patients with suspected infection. Acad Emerg Med. 2006;13:530–536.
- , , , . APACHE II: a severity of disease classification system. Crit Care Med. 1985;13:818–829.
- American Psychiatric Association. Task Force on DSM‐IV. Diagnostic and Statistical Manual of Mental Disorders: DSM‐IV‐TR. 4th ed. Washington, DC: American Psychiatric Association; 2000.
- . Regression Modeling Strategies: With Applications to Linear Models, Logistic Regression, and Survival Analysis. New York, NY: Springer; 2001.
- . Power for tests of interaction: effect of raising the Type I error rate. Epidemiol Perspect Innov. 2007;4:4.
- . An Introduction to Propensity Score Methods for Reducing the Effects of Confounding in Observational Studies. Multivariate Behav Res. 2011;46:399–424.
- , , . Defining delirium for the International Classification of Diseases, 11th Revision. J Psychosom Res. 2008;65:207–214.
- , , , , . Delirium predicts 12‐month mortality. Arch Intern Med. 2002;162:457–463.
- , , , et al. Delirium as a predictor of mortality in mechanically ventilated patients in the intensive care unit. JAMA. 2004;291:1753–1762.
- , , . Predicting mortality of intensive care unit patients. The importance of coma. Crit Care Med. 1982;10:86–95.
- , . Assessment of outcome after severe brain damage. Lancet. 1975;1:480–484.
- , , , , , . Predicting outcome from hypoxic‐ischemic coma. JAMA. 1985;253:1420–1426.
- , , , et al. Prediction of intracerebral hemorrhage survival. Ann Neurol. 1988;24:258–263.
- , , , . Is this patient dead, vegetative, or severely neurologically impaired? Assessing outcome for comatose survivors of cardiac arrest. JAMA. 2004;291:870–879.
- , , , et al. Early intensive care sedation predicts long‐term mortality in ventilated critically ill patients. Am J Respir Crit Care Med. 2012;186:724–731.
- , , , , , . Risk factors for short‐term mortality in older subjects with acute ischemic stroke. Gerontology. 2006;52:231–236.
- , , , . The prognostic significance of subsyndromal delirium in elderly medical inpatients. J Am Geriatr Soc. 2003;51:754–760.
- , , , et al. Defining community acquired pneumonia severity on presentation to hospital: an international derivation and validation study. Thorax. 2003;58:377–382.
- , , , et al. A prediction rule to identify low‐risk patients with community‐acquired pneumonia. N Engl J Med. 1997;336:243–250.
- , , , et al. Derivation and validation of a prognostic model for pulmonary embolism. Am J Respir Crit Care Med. 2005;172:1041–1046.
Arousal is defined as the patient's overall level of responsiveness to the environment. Its assessment is standard of care in most intensive care units (ICUs) to monitor depth of sedation and underlying brain dysfunction. There has been recent interest in expanding the role of arousal assessment beyond the ICU. Specifically, the Veterans Affairs Delirium Working Group proposed that simple arousal assessment be a vital sign to quantify underlying brain dysfunction.[1] The rationale is that impaired arousal is closely linked with delirium,[2] and is an integral component of multiple delirium assessments.[3, 4, 5] Chester et al. observed that the presence of impaired arousal was 64% sensitive and 93% specific for delirium diagnosed by a psychiatrist.[2] Delirium is an under‐recognized public health problem that affects up to 25% of older hospitalized patients,[6, 7] is associated with a multitude of adverse outcomes such as death and accelerated cognitive decline,[8] and costs the US healthcare system an excess of $152 billion dollars.[9]
Most delirium assessments require the patient to undergo additional cognitive testing. The assessment of arousal, however, requires the rater to merely observe the patient during routine clinical care and can be easily integrated into the clinical workflow.[10] Because of its simplicity and brevity, assessing arousal alone using validated scales such as the Richmond Agitation‐Sedation Scale (RASS) may be a more appealing alternative to traditional, more complex delirium screening in the acute care setting. Its clinical utility would be further strengthened if impaired arousal was also associated with mortality, and conferred risk even in the absence of delirium. As a result, we sought to determine if impaired arousal at initial presentation in older acutely ill patients predicted 6‐month mortality and whether this relationship was present in the absence of delirium.
METHODS
Design Overview
We performed a planned secondary analysis of 2 prospective cohorts that enrolled patients from May 2007 to August 2008 between 8 am and 10 pm during the weekdays, and July 2009 to February 2012 between 8 am and 4 pm during the weekdays. The first cohort was designed to evaluate the relationship between delirium and patient outcomes.[11, 12] The second cohort was used to validate brief delirium assessments using a psychiatrist's assessment as the reference standard.[5, 13] The local institutional review board approved these studies.
Setting and Participants
These studies were conducted in an urban emergency department located within an academic, tertiary care hospital with over 57,000 visits annually. Patients were included if they were 65 years or older and in the emergency department for <12 hours at the time of enrollment. The 12‐hour cutoff was used to include patients who presented to the emergency department in the evening and early morning hours. Patients were excluded if they were previously enrolled, non‐English speaking, comatose, or were nonverbal and unable to follow simple commands prior to the acute illness. Because the July 2009 to February 2012 cohort was designed to validate delirium assessments with auditory and visual components, patients were also excluded if they were deaf or blind.
Measurement of Arousal
RASS is an arousal scale commonly used in ICUs to assess depth of sedation and ranges from 5 (unarousable) to +4 (combative); 0 represents normal arousal.[10, 14] The RASS simply requires the rater to observe the patient during their routine interactions and does not require any additional cognitive testing. The RASS terms sedation was modified to drowsy (Table 1), because we wanted to capture impaired arousal regardless of sedation administration. We did not use the modified RASS (mRASS) proposed by the Veteran's Affairs Delirium Working Group, because it was published after data collection began.[1] The mRASS is very similar to the RASS, except it also incorporates a very informal inattention assessment. The RASS was ascertained by research assistants who were college students and graduates, and emergency medical technician basics and paramedics. The principal investigator gave them a 5‐minute didactic lecture about the RASS and observed them perform the RASS in at least 5 patients prior to the start of the study. Inter‐rater reliability between trained research assistants and a physician was assessed for 456 (42.0%) patients of the study sample. The weighted kappa of the RASS was 0.61, indicating very good inter‐rater reliability. Because the 81.7% of patients with impaired arousal had a RASS of 1, the RASS dichotomized as normal (RASS=0) or impaired (RASS other than 0).
| Score | Term | Description |
|---|---|---|
| ||
| +4 | Combative | Overtly combative, violent, immediate danger to staff |
| +3 | Very agitated | Pulls or removes tube(s) or catheter(s), aggressive |
| +2 | Agitated | Frequent nonpurposeful movement |
| +1 | Restless | Anxious but movements not aggressive or vigorous |
| 0 | Alert and calm | |
| 1 | Slight drowsy | Not fully alert, but has sustained awakening (eye opening/eye contact) to voice (>10 seconds) |
| 2 | Moderately drowsy | Briefly awakens with eye contact to voice (<10 seconds) |
| 3 | Very drowsy | Movement or eye opening to voice (but no eye contact) |
| 4 | Awakens to pain only | No response to voice, but movement or eye opening to physical stimulation |
| 5 | Unarousable | No response to voice or physical stimulation |
Death Ascertainment
Death within 6 months was ascertained using the following algorithm: (1) The electronic medical record was searched to determine the patient's death status. (2) Patients who had a documented emergency department visit, outpatient clinic visit, or hospitalization after 6 months were considered to be alive at 6 months. (3) For the remaining patients, date of death was searched in the Social Security Death Index (SSDI). (4) Patients without a death recorded in the SSDI 1 year after the index visit was considered to be alive at 6 months. Nine hundred thirty‐one (85.9%) out of 1084 patients had a recorded death in the medical record or SSDI, or had an emergency department or hospital visit documented in their record 6 months after the index visit.
Additional Variables Collected
Patients were considered to have dementia if they had: (1) documented dementia in the medical record, (2) a short form Informant Questionnaire on Cognitive Decline in the Elderly score (IQCODE) greater than 3.38,[15] or (3) prescribed cholinesterase inhibitors prior to admission. The short form IQCODE is an informant questionnaire with 16 items; a cutoff of 3.38 out of 5.00 is 79% sensitive and 82% specific for dementia.[16] Premorbid functional status was determined by the Katz Activities of Daily Living (Katz ADL) and ranges from 0 (completely dependent) to 6 (completely independent).[17] Patients with a score <5 were considered to be functionally dependent. Both the IQCODE and Katz ADL were prospectively collected in the emergency department at the time of enrollment.
The Charlson Comorbidity Index was used to measure comorbid burden.[18] The Acute Physiology Score (APS) of the Acute Physiology and Chronic Health Evaluation II score was used to quantify severity of illness.[19] The Glasgow Coma Scale was not included in the APS because it was not collected. Intravenous, intramuscular, and oral benzodiazepine and opioids given in the prehospital and emergency department were also recorded. The Charlson Comorbidity Index, APS, and benzodiazepine and opioid administration were collected after patient enrollment using the electronic medical record.
Within 3 hours of the RASS, a subset of 406 patients was evaluated by a consultation‐liaison psychiatrist who determined the patient's delirium status using Diagnostic and Statistical Manual of Mental Disorders, Fourth Edition, Text Revision (DSM‐IV‐TR) criteria.[20] Details of their comprehensive assessments have been described in a previous report.[5]
Statistical Analysis
Measures of central tendency and dispersion for continuous variables were reported as medians and interquartile ranges. Categorical variables were reported as proportions. For simple comparisons, Wilcoxon rank sum tests were performed for continuous data, and 2 analyses or Fisher exact test were performed for categorical data. To evaluate the predictive validity of impaired arousal on 6‐month mortality, the cumulative probability of survival was estimated within 6 months from the study enrollment date using the Kaplan‐Meier method. Cox proportional hazards regression was performed to assess if impaired arousal was independently associated with 6‐month mortality after adjusting for age, gender, nonwhite race, comorbidity burden (Charlson Comorbidity Index), severity of illness (APS), dementia, functional dependence (Katz ADL <5), nursing home residence, admission status, and benzodiazepine or opioid medication administration. Patients were censored at the end of 6 months. The selection of covariates was based upon expert opinion and literature review. The number of covariates used for the model was limited by the number of events to minimize overfitting; 1 df was allowed for every 10 to 15 events.[21] Because severity of illness, psychoactive medication administration, and admission status might modify the relationship between 6‐month mortality and impaired arousal, 2‐way interaction terms were incorporated. To maintain parsimony and minimize overfitting and collinearity, nonsignificant interaction terms (P>0.20) were removed in the final model.[22] Hazard ratios (HR) with their 95% confidence interval (95% CI) were reported.
To determine if arousal was associated with 6‐month mortality in the absence of delirium, we performed another Cox proportional hazard regression in a subset of 406 patients who received a psychiatrist assessment. Six‐month mortality was the dependent variable, and the independent variable was a 3‐level categorical variable of different arousal/delirium combinations: (1) impaired arousal/delirium positive, (2) impaired arousal/delirium negative, and (3) normal arousal (with or without delirium). Because there were only 8 patients who had normal arousal with delirium, this group was collapsed into the normal arousal without delirium group. Because there were 55 deaths, the number of covariates that could be entered into the Cox proportional hazard regression model was limited. We used the inverse weighted propensity score method to help minimize residual confounding.[23] Traditional propensity score adjustment could not be performed because there were 3 arousal/delirium categories. Similar to propensity score adjustment, inverse weighted propensity score method was used to help balance the distribution of patient characteristics among the exposure groups and also allow adjustment for multiple confounders while minimizing the degrees of freedom expended. A propensity score was the probability of having a particular arousal/delirium category based upon baseline patient characteristics. Multinomial logistic regression was performed to calculate the propensity score, and the baseline covariates used were age, gender, nonwhite race, comorbidity burden, severity of illness, dementia, functional dependence, and nursing home residence. For the Cox proportional hazard regression model, each observation was weighted by the inverse of the propensity score for their given arousal/delirium category; propensity scores exceeding the 95th percentile were trimmed to avoid overly influential weighting. Benzodiazepine and opioid medications given in the emergency department and admission status were adjusted as covariates in the weighted Cox proportional hazard regression model.
Nineteen patients (1.8%) had missing Katz ADL; these missing values were imputed using multiple imputation. The reliability of the final regression models were internally validated using the bootstrap method.[21] Two thousand sets of bootstrap samples were generated by resampling the original data, and the optimism was estimated to determine the degree of overfitting.[21] An optimism value >0.85 indicated no evidence of substantial overfitting.[21] Variance inflation factors were used to check multicollinearity. Schoenfeld residuals were also analyzed to determine goodness‐of‐fit and assess for outliers. P values <0.05 were considered statistically significant. All statistical analyses were performed using SAS version 9.4 (SAS Institute, Cary, NC) and open source R statistical software version 3.0.1 (
RESULTS
A total of 1903 patients were screened, and 1084 patients met enrollment criteria (Figure 1). Of these, 1051 (97.0%) were non‐ICU patients. Patient characteristics of this cohort can be seen in Table 2. Enrolled patients and potentially eligible patients who presented to the emergency department during the enrollment window were similar in age, gender, and severity of illness, but enrolled patients were slightly more likely to have a chief complaint of chest pain and syncope (unpublished data).
| Variables | Normal Arousal, n=835 | Impaired Arousal, n=249 | P Value |
|---|---|---|---|
| |||
| Median age, y (IQR) | 74 (6980) | 75 (7083) | 0.005 |
| Female gender | 459 (55.0%) | 132 (53.0%) | 0.586 |
| Nonwhite race | 122 (14.6%) | 51 (20.5%) | 0.027 |
| Residence | <0.001 | ||
| Home | 752 (90.1%) | 204 (81.9%) | |
| Assisted living | 29 (3.5%) | 13 (5.2%) | |
| Rehabilitation | 8 (1.0%) | 5 (2.0%) | |
| Nursing home | 42 (5.0%) | 27 (10.8%) | |
| Dementia* | 175 (21.0%) | 119 (47.8%) | <0.001 |
| Dependent | 120 (14.4%) | 99 (39.8%) | <0.001 |
| Median Charlson (IQR) | 2 (1, 4) | 3 (2, 5) | <0.001 |
| Median APS (IQR) | 2 (1, 4) | 2 (1, 5) | <0.001 |
| Primary complaint | <0.001 | ||
| Abdominal pain | 45 (5.4%) | 13 (5.2%) | |
| Altered mental status | 12 (1.4%) | 36 (14.5%) | |
| Chest pain | 128 (15.3%) | 31 (12.5%) | |
| Disturbances of sensation | 17 (2.0%) | 2 (0.8%) | |
| Dizziness | 16 (1.9%) | 2 (0.8%) | |
| Fever | 11 (1.3%) | 7 (2.8%) | |
| General illness, malaise | 26 (3.1%) | 5 (2.0%) | |
| General weakness | 68 (8.1%) | 29 (11.7%) | |
| Nausea/vomiting | 29 (3.5%) | 4 (1.6%) | |
| Shortness of breath | 85 (10.2%) | 21 (8.4%) | |
| Syncope | 46 (5.5%) | 10 (4.0%) | |
| Trauma, multiple organs | 19 (2.3%) | 8 (3.2%) | |
| Other | 333 (39.9%) | 81 (32.5%) | |
| Benzodiazepines or opioid medications administration | 188 (22.5%) | 67 (26.9%) | 0.152 |
| Admitted to the hospital | 478 (57.3%) | 191 (76.7%) | 0.002 |
| Internal medicine | 411 (86.0%) | 153 (80.1%) | |
| Surgery | 38 (8.0%) | 21 (11.0%) | |
| Neurology | 19 (4.0%) | 13 (6.8%) | |
| Psychiatry | 1 (0.2%) | 2 (1.1%) | |
| Unknown/missing | 9 (1.9%) | 2 (1.1%) | |
| Death within 6 months | 81 (9.7%) | 59 (23.7%) | <0.001 |
Of those enrolled, 249 (23.0%) had an abnormal RASS at initial presentation, and their distribution can be seen in Figure 2. Within 6 months, patients with an abnormal RASS were more likely to die compared with patients with a RASS of 0 (23.7% vs 9.7%, P<0.001). The Kaplan‐Meier survival curves for all enrolled patients with impaired and normal RASS can be seen in Figure 3; the survival curve declined more slowly in patients with a normal RASS compared with those with an abnormal RASS.
Using Cox proportional hazards regression, the relationship between an abnormal RASS at initial presentation and 6‐month mortality persisted (HR: 1.73, 95% CI: 1.21‐2.49) after adjusting for age, sex, nonwhite race, comorbidity burden, severity of illness, dementia, functional dependence, nursing home residence, psychoactive medications given, and admission status. The interaction between an abnormal RASS and APS (severity of illness) had a P value of 0.52. The interaction between an abnormal RASS and benzodiazepine or opioid medication administration had a P value of 0.38. The interaction between an abnormal RASS and admission status had a P value of 0.57. This indicated that severity of illness, psychoactive medication administration, and admission status did not modify the relationship between an abnormal RASS and 6‐month mortality.
We analyzed a subset of 406 patients who received a psychiatrist's assessment to determine if an abnormal RASS was associated with 6‐month mortality regardless of delirium status using Cox proportional hazard regression weighted by the inverse of the propensity score. Patients with an abnormal RASS and no delirium were significantly associated with higher mortality compared to those with a normal RASS (HR: 2.20, 95% CI: 1.10‐4.41). Patients with an abnormal RASS with delirium also had an increased risk for 6‐month mortality (HR: 2.86, 95% CI: 1.29‐6.34).
All regression models were internally validated. There was no evidence of substantial overfitting or collinearity. The Schoenfeld residuals for each model were examined graphically and there was good model fit overall, and no significant outliers were observed.
DISCUSSION
Vital sign measurements are a fundamental component of patient care, and abnormalities can serve as an early warning signal of the patient's clinical deterioration. However, traditional vital signs do not include an assessment of the patient's brain function. Our chief finding is that impaired arousal at initial presentation, as determined by the nonphysician research staff, increased the risk of 6‐month mortality by 73% after adjusting for confounders in a diverse group of acutely ill older patients. This relationship existed regardless of severity of illness, administration of psychoactive medications, and admission status. Though impaired arousal is closely linked with delirium,[2, 24] which is another well‐known predictor of mortality,[11, 25, 26] the prognostic significance of impaired arousal appeared to extend beyond delirium. We observed that the relationship between 6‐month mortality and impaired arousal in the absence of delirium was remarkably similar to that observed with impaired arousal with delirium. Arousal can be assessed for by simply observing the patient during routine clinical care and can be performed by nonphysician and physician healthcare providers. Its assessment should be performed and communicated in conjunction with traditional vital sign measurements in the emergency department and inpatient settings.[1]
Most of the data linking impaired arousal to death have been collected in the ICU. Coma, which represents the most severe form of depressed arousal, has been shown to increase the likelihood of death regardless of underlying etiology.[27, 28, 29, 30, 31] This includes patients who have impaired arousal because they received sedative medications during mechanical ventilation.[32] Few studies have investigated the effect of impaired arousal in a non‐ICU patient population. Zuliani et al. observed that impaired arousal was associated with 30‐day mortality, but their study was conducted in 469 older stroke patients, limiting the study's external validity to a more general patient population.[33] Our data advance the current stage of knowledge; we observed a similar relationship between impaired arousal and 6‐month mortality in a much broader clinical population who were predominantly not critically ill regardless of delirium status. Additionally, most of our impaired arousal cohort had a RASS of 1, indicating that even subtle abnormalities portended adverse outcomes.
In addition to long‐term prognosis, the presence of impaired arousal has immediate clinical implications. Using arousal scales like the RASS can serve as a way for healthcare providers to succinctly communicate the patient's mental status in a standardized manner during transitions of care (eg, emergency physician to inpatient team). Regardless of which clinical setting they are in, older acutely ill patients with an impaired arousal may also require close monitoring, especially if the impairment is acute. Because of its close relationship with delirium, these patients likely have an underlying acute medical illness that precipitated their impaired arousal.
Understanding the true clinical significance of impaired arousal in the absence of delirium requires further study. Because of the fluctuating nature of delirium, it is possible that these patients may have initially been delirious and then became nondelirious during the psychiatrist's evaluation. Conversely, it is also possible that these patients may have eventually transitioned into delirium at later point in time; the presence of impaired arousal alone may be a precursor to delirium. Last, these patients may have had subsyndromal delirium, which is defined as having 1 or more delirium symptoms without ever meeting full DSM‐IV‐TR criteria for delirium.[34] Patients with subsyndromal delirium have poorer outcomes, such as prolonged hospitalizations, and higher mortality than patients without delirium symptoms.[34]
Additional studies are also needed to further clarify the impact of impaired arousal on nonmortality outcomes such as functional and cognitive decline. The prognostic significance of serial arousal measurements also requires further study. It is possible that patients whose impaired arousal rapidly resolves after an intervention may have better prognoses than those who have persistent impairment. The measurement of arousal may have additional clinical applications in disease prognosis models. The presence of altered mental status is incorporated in various disease‐specific risk scores such as the CURB‐65 or Pneumonia Severity Index for pneumonia,[35, 36] and the Pulmonary Embolism Severity Index for pulmonary embolism.[37] However, the definition of altered mental status is highly variable; it ranges from subjective impressions that can be unreliable to formal cognitive testing, which can be time consuming. Arousal scales such as the RASS may allow for more feasible, reliable, and standardized assessment of mental status. Future studies should investigate if incorporating the RASS would improve the discrimination of these disease‐severity indices.
This study has several notable limitations. We excluded patients with a RASS of 4 and 5, which represented comatose patients. This exclusion, however, likely biased our findings toward the null. We enrolled a convenience sample that may have introduced selection bias. However, our enrolled cohort was similar to all potentially eligible patients who presented to the emergency department during the study period. We also attempted to mitigate this selection bias by using multivariable regression and adjusting for factors that may have confounded the relationship between RASS and 6‐month mortality. This study was performed at a single, urban, academic hospital and enrolled patients who were aged 65 years and older. Our findings may not be generalizable to other settings and to those who are under 65 years of age. Because 406 patients received a psychiatric evaluation, this limited the number of covariates that could be incorporated into the multivariable model to evaluate if impaired arousal in the absence of delirium is associated with 6‐month mortality. To minimize residual confounding, we used the inverse weighted propensity score, but we acknowledge that this bias may still exist. Larger studies are needed to clarify the relationships between arousal, delirium, and mortality.
CONCLUSION
In conclusion, impaired arousal at initial presentation is an independent predictor for 6‐month mortality in a diverse group of acutely ill older patients, and this risk appears to be present even in the absence of delirium. Because of its ease of use and prognostic significance, it may be a useful vital sign for underlying brain dysfunction. Routine standardized assessment and communication of arousal during routine clinical care may be warranted.
Disclosures: Research reported in this publication was supported by the Vanderbilt Physician Scientist Development Award, Emergency Medicine Foundation, and National Institute on Aging of the National Institutes of Health under award number K23AG032355. This study was also supported by the National Center for Research Resources, grant UL1 RR024975‐01, and is now at the National Center for Advancing Translational Sciences, grant 2 UL1 TR000445‐06. Dr. Vasilevskis was supported in part by the National Institute on Aging of the National Institutes of Health under award number K23AG040157. Dr. Powers was supported by Health Resources and Services Administration Geriatric Education Centers, grant 1D31HP08823‐01‐00. Dr. Storrow was supported by the National Heart, Lung, and Blood Institute of the National Institutes of Health under award number K12HL1090 and the National Center for Advancing Translational Sciences under award number UL1TR000445. Dr. Ely was supported in part by the National Institute on Aging of the National Institutes of Health under award numbers R01AG027472 and R01AG035117, and a Veteran Affairs MERIT award. Drs. Vasilevskis, Schnelle, Dittus, Powers, and Ely were supported by the Veteran Affairs Geriatric Research, Education, and Clinical Center. The content is solely the responsibility of the authors and does not necessarily represent the official views of Vanderbilt University, Emergency Medicine Foundation, National Institutes of Health, and Veterans Affairs. The funding agencies did not have any role in the design and conduct of the study; collection, management, analysis, and interpretation of the data; and preparation, review, or approval of the manuscript.
J.H.H., E.W.E., J.F.S., A.B.S., and R.D.S. conceived the trial. J.H.H., E.W.E., A.B.S., J.F.S., R.D.S., A.S., and A.W. participated in the study design. J.H.H. and A.W. recruited patients and collected the data. J.H.H., A.J.G., and A.S. analyzed the data. All authors participated in the interpretation of results. J.H.H. drafted the manuscript, and all authors contributed to the critical review and revision of the manuscript.
The authors report no conflicts of interest.
- , , , et al. The development of a mental status vital sign for use across the spectrum of care. J Am Med Dir Assoc. 2009;10:379–380.
- , , , . Serial administration of a modified Richmond Agitation and Sedation Scale for delirium screening. J Hosp Med. 2012;7:450–453.
- , , , , , . Clarifying confusion: the confusion assessment method. A new method for detection of delirium. Ann Intern Med. 1990;113:941–948.
- , , , et al. Delirium in mechanically ventilated patients: validity and reliability of the confusion assessment method for the intensive care unit (CAM‐ICU). JAMA. 2001;286:2703–2710.
- , , , et al. Diagnosing delirium in older emergency department patients: validity and reliability of the Delirium Triage Screen And The Brief Confusion Assessment Method. Ann Emerg Med. 2013;62:457–465.
- , , , , . Does delirium contribute to poor hospital outcomes? A three‐site epidemiologic study. J Gen Intern Med. 1998;13:234–242.
- , , , . Prognostic significance of delirium in frail older people. Dement Geriatr Cogn Disord. 2005;19:158–163.
- , , , , , . Delirium in elderly patients and the risk of postdischarge mortality, institutionalization, and dementia: a meta‐analysis. JAMA. 2010;304:443–451.
- , , , , . One‐year health care costs associated with delirium in the elderly population. Arch Intern Med. 2008;168:27–32.
- , , , et al. The Richmond Agitation‐Sedation Scale: validity and reliability in adult intensive care unit patients. Am J Respir Crit Care Med. 2002;166:1338–1344.
- , , , et al. Delirium in the emergency department: an independent predictor of death within 6 months. Ann Emerg Med. 2010;56:244–252.
- , , , et al. Delirium in older emergency department patients is an independent predictor of hospital length of stay. Acad Emerg Med. 2011;18:451–457.
- , , , et al. Validation of the Confusion Assessment Method For The Intensive Care Unit in older emergency department patients. Acad Emerg Med. 2014;21:180–187.
- , , , et al. Monitoring sedation status over time in ICU patients: reliability and validity of the Richmond Agitation‐Sedation Scale (RASS). JAMA. 2003;289:2983–2991.
- , , , . Does this patient have dementia? JAMA. 2007;297:2391–2404.
- . A short form of the Informant Questionnaire on Cognitive Decline in the Elderly (IQCODE): development and cross‐validation. Psychol Med. 1994;24:145–153.
- . Assessing self‐maintenance: activities of daily living, mobility, and instrumental activities of daily living. J Am Geriatr Soc. 1983;31:721–727.
- , , , , . Charlson Index is associated with one‐year mortality in emergency department patients with suspected infection. Acad Emerg Med. 2006;13:530–536.
- , , , . APACHE II: a severity of disease classification system. Crit Care Med. 1985;13:818–829.
- American Psychiatric Association. Task Force on DSM‐IV. Diagnostic and Statistical Manual of Mental Disorders: DSM‐IV‐TR. 4th ed. Washington, DC: American Psychiatric Association; 2000.
- . Regression Modeling Strategies: With Applications to Linear Models, Logistic Regression, and Survival Analysis. New York, NY: Springer; 2001.
- . Power for tests of interaction: effect of raising the Type I error rate. Epidemiol Perspect Innov. 2007;4:4.
- . An Introduction to Propensity Score Methods for Reducing the Effects of Confounding in Observational Studies. Multivariate Behav Res. 2011;46:399–424.
- , , . Defining delirium for the International Classification of Diseases, 11th Revision. J Psychosom Res. 2008;65:207–214.
- , , , , . Delirium predicts 12‐month mortality. Arch Intern Med. 2002;162:457–463.
- , , , et al. Delirium as a predictor of mortality in mechanically ventilated patients in the intensive care unit. JAMA. 2004;291:1753–1762.
- , , . Predicting mortality of intensive care unit patients. The importance of coma. Crit Care Med. 1982;10:86–95.
- , . Assessment of outcome after severe brain damage. Lancet. 1975;1:480–484.
- , , , , , . Predicting outcome from hypoxic‐ischemic coma. JAMA. 1985;253:1420–1426.
- , , , et al. Prediction of intracerebral hemorrhage survival. Ann Neurol. 1988;24:258–263.
- , , , . Is this patient dead, vegetative, or severely neurologically impaired? Assessing outcome for comatose survivors of cardiac arrest. JAMA. 2004;291:870–879.
- , , , et al. Early intensive care sedation predicts long‐term mortality in ventilated critically ill patients. Am J Respir Crit Care Med. 2012;186:724–731.
- , , , , , . Risk factors for short‐term mortality in older subjects with acute ischemic stroke. Gerontology. 2006;52:231–236.
- , , , . The prognostic significance of subsyndromal delirium in elderly medical inpatients. J Am Geriatr Soc. 2003;51:754–760.
- , , , et al. Defining community acquired pneumonia severity on presentation to hospital: an international derivation and validation study. Thorax. 2003;58:377–382.
- , , , et al. A prediction rule to identify low‐risk patients with community‐acquired pneumonia. N Engl J Med. 1997;336:243–250.
- , , , et al. Derivation and validation of a prognostic model for pulmonary embolism. Am J Respir Crit Care Med. 2005;172:1041–1046.
© 2014 Society of Hospital Medicine