User login
Low Health Literacy Is Associated with Increased Transitional Care Needs in Hospitalized Patients
A special concern since the institution of hospital readmission penalties1 is the transitions in care of a patient from one care setting to another, often at hospital discharge. Burke et al.2 proposed a framework for an ideal transition in care (ITC) to study and improve transitions from the hospital to home. The features in the ITC were identified based upon their inclusion in the interventions that improved discharge outcomes.3-5 Inspired by the ITC and other patient risk tools,6 we identified 10 domains of transitional care needs ([TCN] specified below), which we define as patient-centered risk factors that should be addressed to foster a safe and effective transition in care.7
One particularly important risk factor in patient self-management at transition points is health literacy, a patient’s ability to obtain, understand, and use basic health information and services. Low health literacy affects approximately 26% to 36% of adults in the United States.8,9 Health literacy is associated with many factors that may affect successful navigation of care transitions, including doctor-patient communication,10,11 understanding of the medication regimen,12 and self-management.13-15 Research has also demonstrated an association between low health literacy and poor outcomes after hospital discharge, including medication errors,16 30-day hospital readmission,17 and mortality.18 Transitional care initiatives have begun to incorporate health literacy into patient risk assessments6 and provide specific attention to low health literacy in interventions to reduce adverse drug events and readmission.4,19 Training programs for medical students and nurses advise teaching skills in health literacy as part of fostering effective transitions in care.20,21
Although low health literacy is generally recognized as a barrier to patient education and self-management, little is known about whether patients with low health literacy are more likely to have other risk factors that could further increase their risk for poor transitions in care. A better understanding of associated risks would inform and improve patient care. We hypothesized that TCNs are more common among patients with low health literacy, as compared with those with adequate health literacy. We also aimed to describe the relationship between low health literacy and specific TCNs in order to guide clinical care and future interventions.
METHODS
Setting
The present study is a cross-sectional analysis of data from a quality improvement (QI) intervention that was performed at Vanderbilt University Medical Center, a tertiary care facility in Nashville, Tennessee. The QI intervention, My Health Team (MHT), was funded by the Centers for Medicare and Medicaid Services Innovation Award program. The overall MHT program included outpatient care coordination for chronic disease management as well as a transitional care program that was designed to reduce hospital readmission. The latter included an inpatient needs assessment (which provided data for the present analysis), inpatient intervention, and postdischarge phone follow-up. The MHT initiative was reviewed by the institutional review board (IRB), which deemed it a QI program and granted a waiver of informed consent. The present secondary data analysis was reviewed and approved by the IRB.
Sample
Patients were identified for inclusion in the MHT transitions of care program if the presenting problem for hospital admission was pneumonia, chronic obstructive pulmonary disease (COPD) exacerbation, or decompensated heart failure, as determined by the review of clinical documentation by nurse transition care coordinators (TCCs). Adults over the age of 18 years were eligible, though priority was given to patients aged 65 years or older. This study includes the first inpatient encounter between June 2013 and December 31, 2014, for patients having a completed needs assessment and documentation of health literacy data in the medical record.
Data Collection
TCN assessment was developed from published patient risk tools and the ITC framework.2,6,22 The assessment has 10 domains composed of 49 individual items as follows: (1) caregiver support (caregiver support not sufficient for patient needs), (2) transportation (relies on public or others for transportation and misses medical care because of transportation), (3) health care utilization (no primary care physician, unplanned hospitalization in the last year, emergency department [ED] visit in the last 6 months, or home health services in the last 60 days), (4) high-risk medical comorbidities (malnutrition or body mass index <18.5, renal failure, chronic pain, diabetes, heart failure, COPD, or stroke), (5) medication management provider or caregiver concern (cannot provide medication list, >10 preadmission medications, high-risk medications [eg, insulin, warfarin], poor medication understanding, or adherence issue identified), (6) medical devices (vascular access, urinary catheter, wounds, or home supplemental oxygen), (7) functional status (weakness of extremities, limited extremity range of motion, difficulty with mobility, falls at home, or activities of daily living challenges), (8) mental health comorbidities (over the past month has felt down, depressed, or hopeless or over the past month has felt little interest or pleasure in doing things, high-risk alcohol use, or high-risk substance use), (9) communication (limited English proficiency or at risk for limited health literacy), and (10) financial resources (no health insurance, skips or rations medicines because of cost, misses medical care because of cost, or misses medical care because of job).
The 49 items of the TCN assessment were documented as being present or absent by nurse TCCs at the time patients were enrolled in the transitional care program, based on patient and family interview and chart review, and the items were later extracted for analysis. Patients were determined to have a domain-level need if they reported a need on any individual item within that domain, resulting in a binary score (any need present, absent) for each of the 10 TCN domains.
Health literacy was assessed by using the Brief Health Literacy Screen (BHLS), which is administered routinely by nurses at hospital intake and documented in the medical record, with completion rates of approximately 90%.23 The BHLS is a 3-question subjective health literacy assessment (scoring range 3-15) that has been validated against longer objective measures24 and shown to predict disease control and mortality.18,25 To improve the stability of scores (for patients who completed the BHLS more than once because of repeat hospitalizations) and to reduce missing values, we calculated the patient’s mean BHLS score for assessments obtained between January 1, 2013, and December 31, 2014. Patients were then categorized as having inadequate health literacy (BHLS ≤ 9) or adequate health literacy (BHLS > 9).18,25 Demographic information was extracted from patient records and included age, sex (male/female), marital status (married/without a partner), race (white/nonwhite), and years of education. Income level and primary language were not available for analysis.
Statistical Analysis
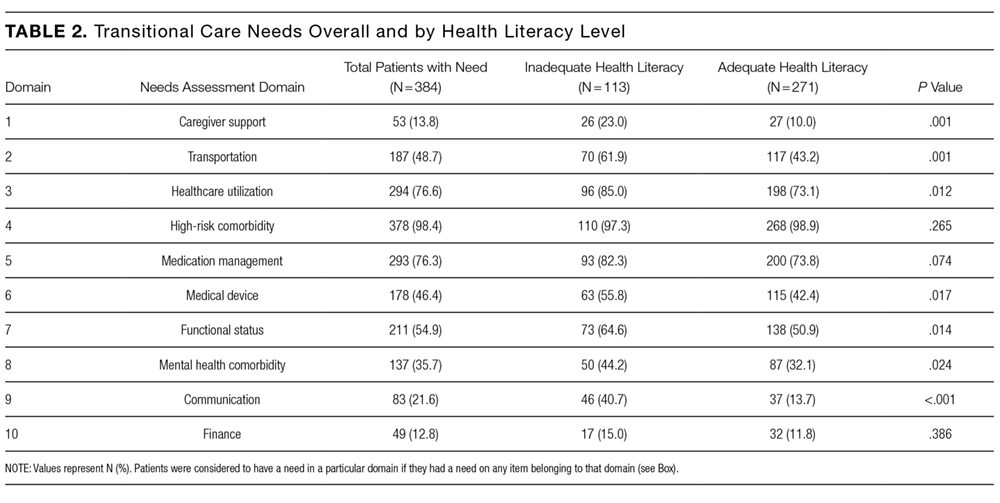
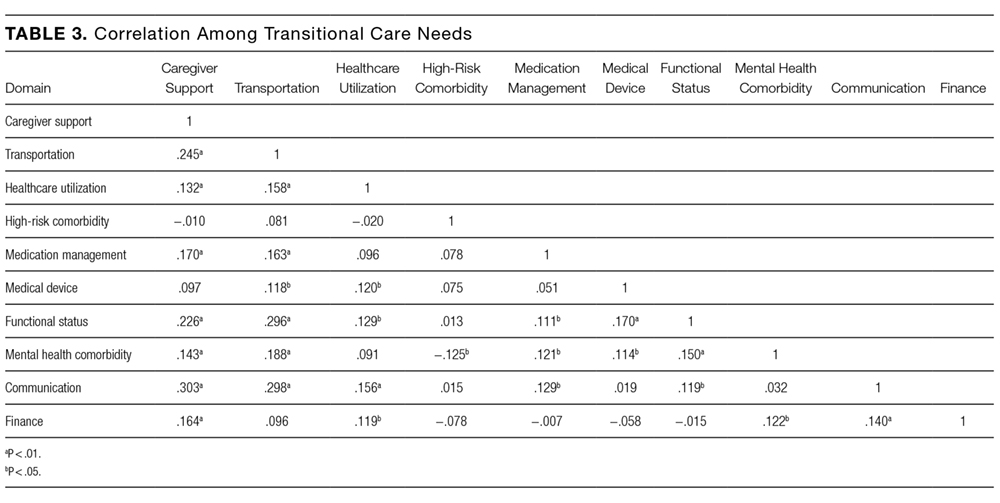
Patient characteristics and TCNs were summarized by using the frequency and percentages for categorical variables and the mean and standard deviation (SD) for continuous variables. We compared patient characteristics (age, sex, marital status, race, and education) between health literacy groups (inadequate vs adequate) by using χ2 or analysis of variance as appropriate. We assessed Pearson correlations among the 10 TCN domains, and we examined differences in reported needs for each of 10 TCN domains by the level of health literacy by using the χ2 test. Because the TCN domain of communication included low health literacy as one of its items, we excluded this domain from subsequent analyses. We then compared differences in the number of TCNs documented (scoring range 0-9) by using an independent samples Student t test.
Multivariate logistic regression models were then constructed to examine the independent association of inadequate health literacy with 8 TCN domains while controlling for age, sex, marital status, race, and education. Patients with incomplete demographic data were excluded from these models. Additionally, these analyses excluded 2 TCN domains: the communication domain for reasons noted above and the high-risk medical comorbidity domain because it ended up being positive in 98.4% of patients. Statistical significance was set at an alpha of 0.05. All analyses were performed by using SPSS Statistics for Mac, version 23.0 (IBM Corp., Armonk, New York)
RESULTS

Older age was independently associated with more needs related to medical devices (OR, 1.02; 95% CI, 1.00-1.04), functional status (OR, 1.03; 95% CI, 1.02-1.05), and fewer financial needs (OR, 0.93; 95% CI, 0.91-0.96). Being married or living with a partner was associated with fewer needs related to caregiver support (OR, 0.37; 95% CI, 0.19-0.75) and more device-related needs (OR, 1.60; 95% CI, 1.03-2.49). A higher level of education was associated with fewer transportation needs (OR, 0.89; 95% CI, 0.82-0.97).
DISCUSSION
A structured patient risk factor assessment derived from literature was used to record TCNs in preparation for hospital discharge. On average, patients had needs in about half of the TCN domains (4.6 of 9). The most common areas identified were related to the presence of high-risk comorbidities (98.4%), frequent or prior healthcare utilization (76.6%), medication management (76.3%), functional status (54.9%), and transportation (48.7%). Many of the TCNs were significantly correlated with one another. The prevalence of these needs highlights the importance of using a structured assessment to identify patient concerns so that they may be addressed through discharge planning and follow-up. In addition, using a standardized TCN instrument based on a framework for ITC promotes further research in understanding patient needs and in developing personalized interventions to address them.
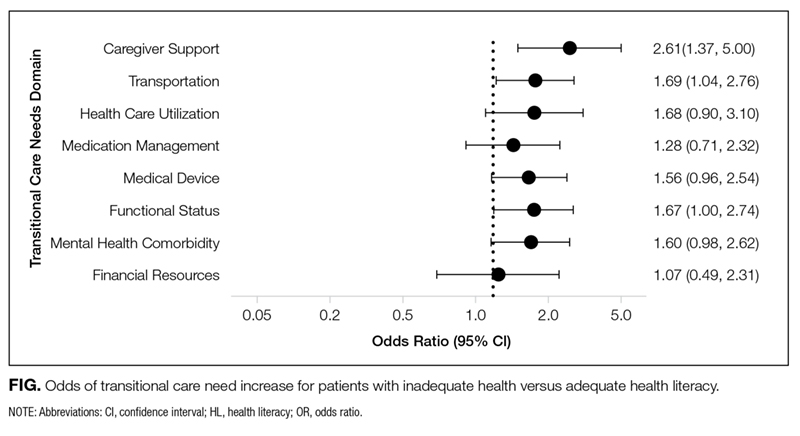
As hypothesized, we found that TCNs were more common in patients with inadequate health literacy. After adjustment for demographic factors, inadequate health literacy was significantly associated with transportation barriers and inadequate caregiver support. Analyses also suggested a relationship with needs related to medical devices, functional status, and mental health comorbidities. A review of the literature substantiates a link between inadequate health literacy and these needs and also suggests solutions to address these barriers.
The association with inadequate caregiver support is concerning because there is often a high degree of reliance on caregivers at transitions in care.3-5 Caregivers are routinely called upon to provide assistance with activities that may be difficult for patients with low health literacy, including medication adherence, provider communication, and self-care activities.26,27 Our finding that patients with inadequate health literacy are more likely to have inadequate caregiver support indicates additional vulnerability. This may be because of the absence of a caregiver, or in many cases, the presence of a caregiver who is underprepared to assist with care. Prior research has shown that when caregivers are present, up to 33% have low health literacy, even when they are paid nonfamilial caregivers.26,28 Other studies have noted the inadequacy of information and patient training for caregivers.29,30 Transitional care programs to improve caregiver understanding have been developed31 and have been demonstrated to lower rehospitalization and ED visits.32
Patients with inadequate health literacy were also more likely to have transportation barriers. Lack of transportation has been recorded as a factor in early hospital readmission in patients with chronic disease,33 and it has been shown to have a negative effect on a variety of health outcomes.34 A likely link between readmission and lack of transportation is poor follow-up care. Wheeler et al.35 found that 59% of patients expected difficulty keeping postdischarge appointments because of transportation needs. Instead of expecting patients to navigate their own transportation, the Agency for Healthcare Research and Quality recommends identifying community resources for patients with low health literacy.36
In this sample, inadequate health literacy also had near significant associations with TCNs in the use of medical devices, lower functional status, and mental health comorbidities. The use of a medical device, such as home oxygen, is a risk factor for readmission,37 and early reports suggest that interventions, including education related to home oxygen use, can dramatically reduce these readmissions.38 Lower functional capacity and faster functional decline are associated with inadequate health literacy,39 which may have to do with the inability to appropriately utilize health resources.40 If so, structured discharge planning could alleviate the known connection between functional impairment and hospital readmissions.41 A relationship between low health literacy and depression has been demonstrated repeatedly,42 with worsened symptoms in those with addiction.43 As has been shown in other domains where health literacy is a factor, literacy-focused interventions provide greater benefits to these depressed patients.44
The TCN assessment worked well overall, but certain domains proved less valuable and could be removed in the future. First, it was not useful to separately identify communication barriers, because doing so did not add to information beyond the measurement of health literacy. Second, high-risk comorbidities were ubiquitous within the sample and therefore unhelpful for group comparisons. In hindsight, this is unsurprising because the sample was comprised primarily of elderly patients admitted to medical services. Still, in a younger population or a surgical setting, identifying patients with high-risk medical comorbidities may be more useful.
We acknowledge several limitations of this study. First, the study was performed at a single center, and the TCN assessments were conducted by a small number of registered nurses who received training. Therefore, the results may not generalize to the profile of patient needs at other settings, and the instrument may perform differently when scaled across an organization. Second, the needs assessment was developed for this QI initiative and did not undergo formal validation, although it was developed from published frameworks and similar assessments. Third, for the measure of health literacy, we relied on data collected by nurses as part of their normal workflow. As is often the case with data collected during routine care, the scores are imperfect,45 but they have proven to be a valuable and valid indicator of health literacy in our previous research.18,24,25,46 Fourth, we chose to declare a domain as positive if any item in that domain was positive and to perform a domain-level analysis (for greater clarity). We did not take into account the variable number of items within each domain or attempt to grade their severity, as this would be a subjective exercise and impractical in the discharge planning process. Finally, we were unable to address associations among socioeconomic status,47 primary language,48 and health literacy, because relevant data were not available for this analysis.
CONCLUSION
In this sample of hospitalized patients who were administered a structured needs assessment, patients commonly had needs that placed them at a higher risk of adverse outcomes, such as hospital readmission. Patients with low health literacy had more TCNs that extended beyond the areas that we normally associate with low health literacy, namely patient education and self-management. Healthcare professionals should be aware of the greater likelihood of transportation barriers and inadequate caregiver support among patients with low health literacy. Screening for health literacy and TCN at admission or as part of the discharge planning process will elevate such risks, better positioning clinicians and hospitals to address them as a part of the efforts to ensure a quality transition of care.
Disclosure
This work was funded by the Centers for Medicare and Medicaid Services (1C1CMS330979) and in part by the National Center for Advancing Translational Sciences (2 UL1 TR000445-06). The content is solely the responsibility of the authors and does not necessarily represent official views of the funding agencies, which did not participate in the planning, collection, analysis, or interpretation of data or in the decision to submit for publication.
Dr. Dittus reports personal fees as a board member of the Robert Wood Johnson Foundation Medical Faculty Scholars Program National Advisory Committee; consultancy fees from the University of Virginia, Indiana University, University of Michigan, Northwestern University, Montana State University, and Purdue University; has grants/grants pending from NIH (research grants), PCORI (research grant), CME (innovation award), VA (training grant); payment for lectures including service on speakers bureaus from Corporate Parity (conference organizer) for the Global Hospital Management & Innovation Summit; and other from Medical Decision Making, Inc. (passive owner); all outside the submitted work. Dr. Kripalani has grants from NIH (research grant), PCORI (research grant), and CMS (QI grant); outside the submitted work. All other authors have nothing to disclose.
1. Rau J. Medicare to penalize 2,211 hospitals for excess readmissions. Kaiser Heal News. 2012;13(6):48-49.
2. Burke RE, Kripalani S, Vasilevskis EE, Schnipper JL. Moving beyond readmission penalties: creating an ideal process to improve transitional care. J Hosp Med. 2013;8(2):102-109. PubMed
3. Naylor MD, Brooten D, Campbell R, et al. Comprehensive discharge planning and home follow-up of hospitalized elders. JAMA. 1999;281(7):613-620. PubMed
4. Jack BW, Chetty VK, Anthony D, et al. A reengineered hospital discharge program to decrease rehospitalization. Ann Intern Med. 2009;150(3):178-187. PubMed
5. Coleman EA, Parry C, Chalmers S, Min S. The Care Transitions Intervention. Arch Intern Med. 2006;166(17):1822-1828. PubMed
6. Hansen LO, Greenwald JL, Budnitz T, et al. Project BOOST: effectiveness of a multihospital effort to reduce rehospitalization. J Hosp Med. 2013;8(8):421-427. PubMed
7. Hatch M, Bruce P, Mansolino A, Kripalani S. Transition care coordinators deliver personalized approach. Readmissions News. 2014;3(9):1-4.
8. Paasche-Orlow MK, Parker RM, Gazmararian JA, Nielsen-Bohlman LT, Rudd RR. The prevalence of limited health literacy. J Gen Intern Med. 2005;20(2):175-184. PubMed
9. Kutner M, Greenburg E, Jin Y, et al. The Health Literacy of America’s Adults: Results from the 2003 National Assessment of Adult Literacy. NCES 2006-483. Natl Cent Educ Stat. 2006;6:1-59.
10. Kripalani S, Jacobson TA, Mugalla IC, Cawthon CR, Niesner KJ, Vaccarino V. Health literacy and the quality of physician-patient communication during hospitalization. J Hosp Med. 2010;5(5):269-275. PubMed
11. Goggins KM, Wallston KA., Nwosu S, et al. Health literacy, numeracy, and other characteristics associated with hospitalized patients’ preferences for involvement in decision making. J Health Commun. 2014;19(sup2):29-43. PubMed
12. Marvanova M, Roumie CL, Eden SK, Cawthon C, Schnipper JL, Kripalani S. Health literacy and medication understanding among hospitalized adults. J Hosp Med. 2011;6(9):488-493. PubMed
13. Evangelista LS, Rasmusson KD, Laramee AS, et al. Health literacy and the patient with heart failure—implications for patient care and research: a consensus statement of the Heart Failure Society of America. J Card Fail. 2010;16(1):9-16. PubMed
14. Lindquist LA, Go L, Fleisher J, Jain N, Friesema E, Baker DW. Relationship of health literacy to intentional and unintentional non-adherence of hospital discharge medications. J Gen Intern Med. 2012;27(2):173-178. PubMed
15. Coleman EA, Chugh A, Williams MV, et al. Understanding and execution of discharge instructions. Am J Med Qual. 2013;28(5):383-391. PubMed
16. Mixon AS, Myers AP, Leak CL, et al. Characteristics associated with postdischarge medication errors. Mayo Clin Proc. 2014;89(8):1042-1051. PubMed
17. Mitchell SE, Sadikova E, Jack BW, Paasche-Orlow MK. Health literacy and 30-day postdischarge hospital utilization. J Health Commun. 2012;17(sup3):325-338. PubMed
18. McNaughton CD, Cawthon C, Kripalani S, Liu D, Storrow AB, Roumie CL. Health literacy and mortality: a cohort study of patients hospitalized for acute heart failure. J Am Heart Assoc. 2015;4(5):e001799. PubMed
19. Kripalani S, Roumie CL, Dalal AK, et al. Effect of a pharmacist intervention on clinically important medication errors after hospital discharge: a randomized trial. Ann Intern Med. 2012;157(1):1-10. PubMed
20. Polster D. Patient discharge information: Tools for success. Nursing (Lond). 2015;45(5):42-49. PubMed
21. Bradley SM, Chang D, Fallar R, Karani R. A patient safety and transitions of care curriculum for third-year medical students. Gerontol Geriatr Educ. 2015;36(1):45-57. PubMed
22. Kripalani S, Theobald CN, Anctil B, Vasilevskis EE. Reducing hospital readmission rates: current strategies and future directions. Annu Rev Med. 2014;65:471-485. PubMed
23. Cawthon C, Mion LC, Willens DE, Roumie CL, Kripalani S. Implementing routine health literacy assessment in hospital and primary care patients. Jt Comm J Qual Patient Saf. 2014;40(2):68-76. PubMed
24. Wallston KA, Cawthon C, McNaughton CD, Rothman RL, Osborn CY, Kripalani S. Psychometric properties of the brief health literacy screen in clinical practice. J Gen Intern Med. 2013:1-8. PubMed
25. McNaughton CD, Kripalani S, Cawthon C, Mion LC, Wallston KA, Roumie CL. Association of health literacy with elevated blood pressure: a cohort study of hospitalized patients. Med Care. 2014;52(4):346-353. PubMed
26. Garcia CH, Espinoza SE, Lichtenstein M, Hazuda HP. Health literacy associations between Hispanic elderly patients and their caregivers. J Health Commun. 2013;18 Suppl 1:256-272. PubMed
27. Levin JB, Peterson PN, Dolansky MA, Boxer RS. Health literacy and heart failure management in patient-caregiver dyads. J Card Fail. 2014;20(10):755-761. PubMed
28. Lindquist LA, Jain N, Tam K, Martin GJ, Baker DW. Inadequate health literacy among paid caregivers of seniors. J Gen Intern Med. 2011;26(5):474-479. PubMed
29. Graham CL, Ivey SL, Neuhauser L. From hospital to home: assessing the transitional care needs of vulnerable seniors. Gerontologist. 2009;49(1):23-33. PubMed
30. Foust JB, Vuckovic N, Henriquez E. Hospital to home health care transition: patient, caregiver, and clinician perspectives. West J Nurs Res. 2012;34(2):194-212. PubMed
31. Hahn-Goldberg S, Okrainec K, Huynh T, Zahr N, Abrams H. Co-creating patient-oriented discharge instructions with patients, caregivers, and healthcare providers. J Hosp Med. 2015;10(12):804-807. PubMed
32. Hendrix C, Tepfer S, Forest S, et al. Transitional care partners: a hospital-to-home support for older adults and their caregivers. J Am Assoc Nurse Pract. 2013;25(8):407-414. PubMed
33. Rubin DJ, Donnell-Jackson K, Jhingan R, Golden SH, Paranjape A. Early readmission among patients with diabetes: a qualitative assessment of contributing factors. J Diabetes Complications. 2014;28(6):869-873. PubMed
34. Syed ST, Gerber BS, Sharp LK. Traveling towards disease: transportation barriers to health care access. J Community Health. 2013;38(5):976-993. PubMed
35. Wheeler K, Crawford R, McAdams D, et al. Inpatient to outpatient transfer of diabetes care: perceptions of barriers to postdischarge followup in urban African American patients. Ethn Dis. 2007;17(2):238-243. PubMed
36. Brega A, Barnard J, Mabachi N, et al. AHRQ Health Literacy Universal Precautions Toolkit, Second Edition. Rockville: Agency for Healthcare Research and Qualiy; 2015. https://www.ahrq.gov/professionals/quality-patient-safety/quality-resources/tools/literacy-toolkit/index.html. Accessed August 21, 2017.
37. Sharif R, Parekh TM, Pierson KS, Kuo YF, Sharma G. Predictors of early readmission among patients 40 to 64 years of age hospitalized for chronic obstructive pulmonary disease. Ann Am Thorac Soc. 2014;11(5):685-694. PubMed
38. Carlin B, Wiles K, Easley D, Dskonerwpahsorg DS, Prenner B. Transition of care and rehospitalization rates for patients who require home oxygen therapy following hospitalization. Eur Respir J. 2012;40(Suppl 56):P617.
39. Wolf MS, Gazmararian JA, Baker DW. Health literacy and functional health status among older adults. Arch Intern Med. 2005;165(17):1946-1952. PubMed
40. Smith SG, O’Conor R, Curtis LM, et al. Low health literacy predicts decline in physical function among older adults: findings from the LitCog cohort study. J Epidemiol Community Health. 2015;69(5):474-480. PubMed
41. Greysen SR, Stijacic Cenzer I, Auerbach AD, Covinsky KE. Functional impairment and hospital readmission in medicare seniors. JAMA Intern Med. 2015;175(4):559-565. PubMed
42. Berkman ND, Sheridan SL, Donahue KE, et al. Health literacy interventions and outcomes: an updated systematic review. Evid Rep Technol Assess (Full Rep). 2011;199:1-941. PubMed
43. Lincoln A, Paasche-Orlow M, Cheng D, et al. Impact of health literacy on depressive symptoms and mental health-related quality of life among adults with addiction. J Gen Intern Med. 2006;21(8):818-822. PubMed
44. Weiss BD, Francis L, Senf JH, et al. Literacy education as treatment for depression in patients with limited literacy and depression: a randomized controlled trial. J Gen Intern Med. 2006;21(8):823-828. PubMed
45. Goggins K, Wallston KA, Mion L, Cawthon C, Kripalani S. What patient characteristics influence nurses’ assessment of health literacy? J Health Commun. 2016;21(sup2):105-108. PubMed
46. Scarpato KR, Kappa SF, Goggins KM, et al. The impact of health literacy on surgical outcomes following radical cystectomy. J Health Commun. 2016;21(sup2):99-104.
PubMed
47. Sudore RL, Mehta KM, Simonsick EM, et al. Limited literacy in older people and disparities in health and healthcare access. J Am Geriatr Soc. 2006;54(5):770-776. PubMed
48. Jacobson HE, Hund L, Mas FS. Predictors of English health literacy among US Hispanic immigrants: the importance of language, bilingualism and sociolinguistic environment
A special concern since the institution of hospital readmission penalties1 is the transitions in care of a patient from one care setting to another, often at hospital discharge. Burke et al.2 proposed a framework for an ideal transition in care (ITC) to study and improve transitions from the hospital to home. The features in the ITC were identified based upon their inclusion in the interventions that improved discharge outcomes.3-5 Inspired by the ITC and other patient risk tools,6 we identified 10 domains of transitional care needs ([TCN] specified below), which we define as patient-centered risk factors that should be addressed to foster a safe and effective transition in care.7
One particularly important risk factor in patient self-management at transition points is health literacy, a patient’s ability to obtain, understand, and use basic health information and services. Low health literacy affects approximately 26% to 36% of adults in the United States.8,9 Health literacy is associated with many factors that may affect successful navigation of care transitions, including doctor-patient communication,10,11 understanding of the medication regimen,12 and self-management.13-15 Research has also demonstrated an association between low health literacy and poor outcomes after hospital discharge, including medication errors,16 30-day hospital readmission,17 and mortality.18 Transitional care initiatives have begun to incorporate health literacy into patient risk assessments6 and provide specific attention to low health literacy in interventions to reduce adverse drug events and readmission.4,19 Training programs for medical students and nurses advise teaching skills in health literacy as part of fostering effective transitions in care.20,21
Although low health literacy is generally recognized as a barrier to patient education and self-management, little is known about whether patients with low health literacy are more likely to have other risk factors that could further increase their risk for poor transitions in care. A better understanding of associated risks would inform and improve patient care. We hypothesized that TCNs are more common among patients with low health literacy, as compared with those with adequate health literacy. We also aimed to describe the relationship between low health literacy and specific TCNs in order to guide clinical care and future interventions.
METHODS
Setting
The present study is a cross-sectional analysis of data from a quality improvement (QI) intervention that was performed at Vanderbilt University Medical Center, a tertiary care facility in Nashville, Tennessee. The QI intervention, My Health Team (MHT), was funded by the Centers for Medicare and Medicaid Services Innovation Award program. The overall MHT program included outpatient care coordination for chronic disease management as well as a transitional care program that was designed to reduce hospital readmission. The latter included an inpatient needs assessment (which provided data for the present analysis), inpatient intervention, and postdischarge phone follow-up. The MHT initiative was reviewed by the institutional review board (IRB), which deemed it a QI program and granted a waiver of informed consent. The present secondary data analysis was reviewed and approved by the IRB.
Sample
Patients were identified for inclusion in the MHT transitions of care program if the presenting problem for hospital admission was pneumonia, chronic obstructive pulmonary disease (COPD) exacerbation, or decompensated heart failure, as determined by the review of clinical documentation by nurse transition care coordinators (TCCs). Adults over the age of 18 years were eligible, though priority was given to patients aged 65 years or older. This study includes the first inpatient encounter between June 2013 and December 31, 2014, for patients having a completed needs assessment and documentation of health literacy data in the medical record.
Data Collection
TCN assessment was developed from published patient risk tools and the ITC framework.2,6,22 The assessment has 10 domains composed of 49 individual items as follows: (1) caregiver support (caregiver support not sufficient for patient needs), (2) transportation (relies on public or others for transportation and misses medical care because of transportation), (3) health care utilization (no primary care physician, unplanned hospitalization in the last year, emergency department [ED] visit in the last 6 months, or home health services in the last 60 days), (4) high-risk medical comorbidities (malnutrition or body mass index <18.5, renal failure, chronic pain, diabetes, heart failure, COPD, or stroke), (5) medication management provider or caregiver concern (cannot provide medication list, >10 preadmission medications, high-risk medications [eg, insulin, warfarin], poor medication understanding, or adherence issue identified), (6) medical devices (vascular access, urinary catheter, wounds, or home supplemental oxygen), (7) functional status (weakness of extremities, limited extremity range of motion, difficulty with mobility, falls at home, or activities of daily living challenges), (8) mental health comorbidities (over the past month has felt down, depressed, or hopeless or over the past month has felt little interest or pleasure in doing things, high-risk alcohol use, or high-risk substance use), (9) communication (limited English proficiency or at risk for limited health literacy), and (10) financial resources (no health insurance, skips or rations medicines because of cost, misses medical care because of cost, or misses medical care because of job).
The 49 items of the TCN assessment were documented as being present or absent by nurse TCCs at the time patients were enrolled in the transitional care program, based on patient and family interview and chart review, and the items were later extracted for analysis. Patients were determined to have a domain-level need if they reported a need on any individual item within that domain, resulting in a binary score (any need present, absent) for each of the 10 TCN domains.
Health literacy was assessed by using the Brief Health Literacy Screen (BHLS), which is administered routinely by nurses at hospital intake and documented in the medical record, with completion rates of approximately 90%.23 The BHLS is a 3-question subjective health literacy assessment (scoring range 3-15) that has been validated against longer objective measures24 and shown to predict disease control and mortality.18,25 To improve the stability of scores (for patients who completed the BHLS more than once because of repeat hospitalizations) and to reduce missing values, we calculated the patient’s mean BHLS score for assessments obtained between January 1, 2013, and December 31, 2014. Patients were then categorized as having inadequate health literacy (BHLS ≤ 9) or adequate health literacy (BHLS > 9).18,25 Demographic information was extracted from patient records and included age, sex (male/female), marital status (married/without a partner), race (white/nonwhite), and years of education. Income level and primary language were not available for analysis.
Statistical Analysis
Patient characteristics and TCNs were summarized by using the frequency and percentages for categorical variables and the mean and standard deviation (SD) for continuous variables. We compared patient characteristics (age, sex, marital status, race, and education) between health literacy groups (inadequate vs adequate) by using χ2 or analysis of variance as appropriate. We assessed Pearson correlations among the 10 TCN domains, and we examined differences in reported needs for each of 10 TCN domains by the level of health literacy by using the χ2 test. Because the TCN domain of communication included low health literacy as one of its items, we excluded this domain from subsequent analyses. We then compared differences in the number of TCNs documented (scoring range 0-9) by using an independent samples Student t test.
Multivariate logistic regression models were then constructed to examine the independent association of inadequate health literacy with 8 TCN domains while controlling for age, sex, marital status, race, and education. Patients with incomplete demographic data were excluded from these models. Additionally, these analyses excluded 2 TCN domains: the communication domain for reasons noted above and the high-risk medical comorbidity domain because it ended up being positive in 98.4% of patients. Statistical significance was set at an alpha of 0.05. All analyses were performed by using SPSS Statistics for Mac, version 23.0 (IBM Corp., Armonk, New York)
RESULTS
Older age was independently associated with more needs related to medical devices (OR, 1.02; 95% CI, 1.00-1.04), functional status (OR, 1.03; 95% CI, 1.02-1.05), and fewer financial needs (OR, 0.93; 95% CI, 0.91-0.96). Being married or living with a partner was associated with fewer needs related to caregiver support (OR, 0.37; 95% CI, 0.19-0.75) and more device-related needs (OR, 1.60; 95% CI, 1.03-2.49). A higher level of education was associated with fewer transportation needs (OR, 0.89; 95% CI, 0.82-0.97).
DISCUSSION
A structured patient risk factor assessment derived from literature was used to record TCNs in preparation for hospital discharge. On average, patients had needs in about half of the TCN domains (4.6 of 9). The most common areas identified were related to the presence of high-risk comorbidities (98.4%), frequent or prior healthcare utilization (76.6%), medication management (76.3%), functional status (54.9%), and transportation (48.7%). Many of the TCNs were significantly correlated with one another. The prevalence of these needs highlights the importance of using a structured assessment to identify patient concerns so that they may be addressed through discharge planning and follow-up. In addition, using a standardized TCN instrument based on a framework for ITC promotes further research in understanding patient needs and in developing personalized interventions to address them.
As hypothesized, we found that TCNs were more common in patients with inadequate health literacy. After adjustment for demographic factors, inadequate health literacy was significantly associated with transportation barriers and inadequate caregiver support. Analyses also suggested a relationship with needs related to medical devices, functional status, and mental health comorbidities. A review of the literature substantiates a link between inadequate health literacy and these needs and also suggests solutions to address these barriers.
The association with inadequate caregiver support is concerning because there is often a high degree of reliance on caregivers at transitions in care.3-5 Caregivers are routinely called upon to provide assistance with activities that may be difficult for patients with low health literacy, including medication adherence, provider communication, and self-care activities.26,27 Our finding that patients with inadequate health literacy are more likely to have inadequate caregiver support indicates additional vulnerability. This may be because of the absence of a caregiver, or in many cases, the presence of a caregiver who is underprepared to assist with care. Prior research has shown that when caregivers are present, up to 33% have low health literacy, even when they are paid nonfamilial caregivers.26,28 Other studies have noted the inadequacy of information and patient training for caregivers.29,30 Transitional care programs to improve caregiver understanding have been developed31 and have been demonstrated to lower rehospitalization and ED visits.32
Patients with inadequate health literacy were also more likely to have transportation barriers. Lack of transportation has been recorded as a factor in early hospital readmission in patients with chronic disease,33 and it has been shown to have a negative effect on a variety of health outcomes.34 A likely link between readmission and lack of transportation is poor follow-up care. Wheeler et al.35 found that 59% of patients expected difficulty keeping postdischarge appointments because of transportation needs. Instead of expecting patients to navigate their own transportation, the Agency for Healthcare Research and Quality recommends identifying community resources for patients with low health literacy.36
In this sample, inadequate health literacy also had near significant associations with TCNs in the use of medical devices, lower functional status, and mental health comorbidities. The use of a medical device, such as home oxygen, is a risk factor for readmission,37 and early reports suggest that interventions, including education related to home oxygen use, can dramatically reduce these readmissions.38 Lower functional capacity and faster functional decline are associated with inadequate health literacy,39 which may have to do with the inability to appropriately utilize health resources.40 If so, structured discharge planning could alleviate the known connection between functional impairment and hospital readmissions.41 A relationship between low health literacy and depression has been demonstrated repeatedly,42 with worsened symptoms in those with addiction.43 As has been shown in other domains where health literacy is a factor, literacy-focused interventions provide greater benefits to these depressed patients.44
The TCN assessment worked well overall, but certain domains proved less valuable and could be removed in the future. First, it was not useful to separately identify communication barriers, because doing so did not add to information beyond the measurement of health literacy. Second, high-risk comorbidities were ubiquitous within the sample and therefore unhelpful for group comparisons. In hindsight, this is unsurprising because the sample was comprised primarily of elderly patients admitted to medical services. Still, in a younger population or a surgical setting, identifying patients with high-risk medical comorbidities may be more useful.
We acknowledge several limitations of this study. First, the study was performed at a single center, and the TCN assessments were conducted by a small number of registered nurses who received training. Therefore, the results may not generalize to the profile of patient needs at other settings, and the instrument may perform differently when scaled across an organization. Second, the needs assessment was developed for this QI initiative and did not undergo formal validation, although it was developed from published frameworks and similar assessments. Third, for the measure of health literacy, we relied on data collected by nurses as part of their normal workflow. As is often the case with data collected during routine care, the scores are imperfect,45 but they have proven to be a valuable and valid indicator of health literacy in our previous research.18,24,25,46 Fourth, we chose to declare a domain as positive if any item in that domain was positive and to perform a domain-level analysis (for greater clarity). We did not take into account the variable number of items within each domain or attempt to grade their severity, as this would be a subjective exercise and impractical in the discharge planning process. Finally, we were unable to address associations among socioeconomic status,47 primary language,48 and health literacy, because relevant data were not available for this analysis.
CONCLUSION
In this sample of hospitalized patients who were administered a structured needs assessment, patients commonly had needs that placed them at a higher risk of adverse outcomes, such as hospital readmission. Patients with low health literacy had more TCNs that extended beyond the areas that we normally associate with low health literacy, namely patient education and self-management. Healthcare professionals should be aware of the greater likelihood of transportation barriers and inadequate caregiver support among patients with low health literacy. Screening for health literacy and TCN at admission or as part of the discharge planning process will elevate such risks, better positioning clinicians and hospitals to address them as a part of the efforts to ensure a quality transition of care.
Disclosure
This work was funded by the Centers for Medicare and Medicaid Services (1C1CMS330979) and in part by the National Center for Advancing Translational Sciences (2 UL1 TR000445-06). The content is solely the responsibility of the authors and does not necessarily represent official views of the funding agencies, which did not participate in the planning, collection, analysis, or interpretation of data or in the decision to submit for publication.
Dr. Dittus reports personal fees as a board member of the Robert Wood Johnson Foundation Medical Faculty Scholars Program National Advisory Committee; consultancy fees from the University of Virginia, Indiana University, University of Michigan, Northwestern University, Montana State University, and Purdue University; has grants/grants pending from NIH (research grants), PCORI (research grant), CME (innovation award), VA (training grant); payment for lectures including service on speakers bureaus from Corporate Parity (conference organizer) for the Global Hospital Management & Innovation Summit; and other from Medical Decision Making, Inc. (passive owner); all outside the submitted work. Dr. Kripalani has grants from NIH (research grant), PCORI (research grant), and CMS (QI grant); outside the submitted work. All other authors have nothing to disclose.
1. Rau J. Medicare to penalize 2,211 hospitals for excess readmissions. Kaiser Heal News. 2012;13(6):48-49.
2. Burke RE, Kripalani S, Vasilevskis EE, Schnipper JL. Moving beyond readmission penalties: creating an ideal process to improve transitional care. J Hosp Med. 2013;8(2):102-109. PubMed
3. Naylor MD, Brooten D, Campbell R, et al. Comprehensive discharge planning and home follow-up of hospitalized elders. JAMA. 1999;281(7):613-620. PubMed
4. Jack BW, Chetty VK, Anthony D, et al. A reengineered hospital discharge program to decrease rehospitalization. Ann Intern Med. 2009;150(3):178-187. PubMed
5. Coleman EA, Parry C, Chalmers S, Min S. The Care Transitions Intervention. Arch Intern Med. 2006;166(17):1822-1828. PubMed
6. Hansen LO, Greenwald JL, Budnitz T, et al. Project BOOST: effectiveness of a multihospital effort to reduce rehospitalization. J Hosp Med. 2013;8(8):421-427. PubMed
7. Hatch M, Bruce P, Mansolino A, Kripalani S. Transition care coordinators deliver personalized approach. Readmissions News. 2014;3(9):1-4.
8. Paasche-Orlow MK, Parker RM, Gazmararian JA, Nielsen-Bohlman LT, Rudd RR. The prevalence of limited health literacy. J Gen Intern Med. 2005;20(2):175-184. PubMed
9. Kutner M, Greenburg E, Jin Y, et al. The Health Literacy of America’s Adults: Results from the 2003 National Assessment of Adult Literacy. NCES 2006-483. Natl Cent Educ Stat. 2006;6:1-59.
10. Kripalani S, Jacobson TA, Mugalla IC, Cawthon CR, Niesner KJ, Vaccarino V. Health literacy and the quality of physician-patient communication during hospitalization. J Hosp Med. 2010;5(5):269-275. PubMed
11. Goggins KM, Wallston KA., Nwosu S, et al. Health literacy, numeracy, and other characteristics associated with hospitalized patients’ preferences for involvement in decision making. J Health Commun. 2014;19(sup2):29-43. PubMed
12. Marvanova M, Roumie CL, Eden SK, Cawthon C, Schnipper JL, Kripalani S. Health literacy and medication understanding among hospitalized adults. J Hosp Med. 2011;6(9):488-493. PubMed
13. Evangelista LS, Rasmusson KD, Laramee AS, et al. Health literacy and the patient with heart failure—implications for patient care and research: a consensus statement of the Heart Failure Society of America. J Card Fail. 2010;16(1):9-16. PubMed
14. Lindquist LA, Go L, Fleisher J, Jain N, Friesema E, Baker DW. Relationship of health literacy to intentional and unintentional non-adherence of hospital discharge medications. J Gen Intern Med. 2012;27(2):173-178. PubMed
15. Coleman EA, Chugh A, Williams MV, et al. Understanding and execution of discharge instructions. Am J Med Qual. 2013;28(5):383-391. PubMed
16. Mixon AS, Myers AP, Leak CL, et al. Characteristics associated with postdischarge medication errors. Mayo Clin Proc. 2014;89(8):1042-1051. PubMed
17. Mitchell SE, Sadikova E, Jack BW, Paasche-Orlow MK. Health literacy and 30-day postdischarge hospital utilization. J Health Commun. 2012;17(sup3):325-338. PubMed
18. McNaughton CD, Cawthon C, Kripalani S, Liu D, Storrow AB, Roumie CL. Health literacy and mortality: a cohort study of patients hospitalized for acute heart failure. J Am Heart Assoc. 2015;4(5):e001799. PubMed
19. Kripalani S, Roumie CL, Dalal AK, et al. Effect of a pharmacist intervention on clinically important medication errors after hospital discharge: a randomized trial. Ann Intern Med. 2012;157(1):1-10. PubMed
20. Polster D. Patient discharge information: Tools for success. Nursing (Lond). 2015;45(5):42-49. PubMed
21. Bradley SM, Chang D, Fallar R, Karani R. A patient safety and transitions of care curriculum for third-year medical students. Gerontol Geriatr Educ. 2015;36(1):45-57. PubMed
22. Kripalani S, Theobald CN, Anctil B, Vasilevskis EE. Reducing hospital readmission rates: current strategies and future directions. Annu Rev Med. 2014;65:471-485. PubMed
23. Cawthon C, Mion LC, Willens DE, Roumie CL, Kripalani S. Implementing routine health literacy assessment in hospital and primary care patients. Jt Comm J Qual Patient Saf. 2014;40(2):68-76. PubMed
24. Wallston KA, Cawthon C, McNaughton CD, Rothman RL, Osborn CY, Kripalani S. Psychometric properties of the brief health literacy screen in clinical practice. J Gen Intern Med. 2013:1-8. PubMed
25. McNaughton CD, Kripalani S, Cawthon C, Mion LC, Wallston KA, Roumie CL. Association of health literacy with elevated blood pressure: a cohort study of hospitalized patients. Med Care. 2014;52(4):346-353. PubMed
26. Garcia CH, Espinoza SE, Lichtenstein M, Hazuda HP. Health literacy associations between Hispanic elderly patients and their caregivers. J Health Commun. 2013;18 Suppl 1:256-272. PubMed
27. Levin JB, Peterson PN, Dolansky MA, Boxer RS. Health literacy and heart failure management in patient-caregiver dyads. J Card Fail. 2014;20(10):755-761. PubMed
28. Lindquist LA, Jain N, Tam K, Martin GJ, Baker DW. Inadequate health literacy among paid caregivers of seniors. J Gen Intern Med. 2011;26(5):474-479. PubMed
29. Graham CL, Ivey SL, Neuhauser L. From hospital to home: assessing the transitional care needs of vulnerable seniors. Gerontologist. 2009;49(1):23-33. PubMed
30. Foust JB, Vuckovic N, Henriquez E. Hospital to home health care transition: patient, caregiver, and clinician perspectives. West J Nurs Res. 2012;34(2):194-212. PubMed
31. Hahn-Goldberg S, Okrainec K, Huynh T, Zahr N, Abrams H. Co-creating patient-oriented discharge instructions with patients, caregivers, and healthcare providers. J Hosp Med. 2015;10(12):804-807. PubMed
32. Hendrix C, Tepfer S, Forest S, et al. Transitional care partners: a hospital-to-home support for older adults and their caregivers. J Am Assoc Nurse Pract. 2013;25(8):407-414. PubMed
33. Rubin DJ, Donnell-Jackson K, Jhingan R, Golden SH, Paranjape A. Early readmission among patients with diabetes: a qualitative assessment of contributing factors. J Diabetes Complications. 2014;28(6):869-873. PubMed
34. Syed ST, Gerber BS, Sharp LK. Traveling towards disease: transportation barriers to health care access. J Community Health. 2013;38(5):976-993. PubMed
35. Wheeler K, Crawford R, McAdams D, et al. Inpatient to outpatient transfer of diabetes care: perceptions of barriers to postdischarge followup in urban African American patients. Ethn Dis. 2007;17(2):238-243. PubMed
36. Brega A, Barnard J, Mabachi N, et al. AHRQ Health Literacy Universal Precautions Toolkit, Second Edition. Rockville: Agency for Healthcare Research and Qualiy; 2015. https://www.ahrq.gov/professionals/quality-patient-safety/quality-resources/tools/literacy-toolkit/index.html. Accessed August 21, 2017.
37. Sharif R, Parekh TM, Pierson KS, Kuo YF, Sharma G. Predictors of early readmission among patients 40 to 64 years of age hospitalized for chronic obstructive pulmonary disease. Ann Am Thorac Soc. 2014;11(5):685-694. PubMed
38. Carlin B, Wiles K, Easley D, Dskonerwpahsorg DS, Prenner B. Transition of care and rehospitalization rates for patients who require home oxygen therapy following hospitalization. Eur Respir J. 2012;40(Suppl 56):P617.
39. Wolf MS, Gazmararian JA, Baker DW. Health literacy and functional health status among older adults. Arch Intern Med. 2005;165(17):1946-1952. PubMed
40. Smith SG, O’Conor R, Curtis LM, et al. Low health literacy predicts decline in physical function among older adults: findings from the LitCog cohort study. J Epidemiol Community Health. 2015;69(5):474-480. PubMed
41. Greysen SR, Stijacic Cenzer I, Auerbach AD, Covinsky KE. Functional impairment and hospital readmission in medicare seniors. JAMA Intern Med. 2015;175(4):559-565. PubMed
42. Berkman ND, Sheridan SL, Donahue KE, et al. Health literacy interventions and outcomes: an updated systematic review. Evid Rep Technol Assess (Full Rep). 2011;199:1-941. PubMed
43. Lincoln A, Paasche-Orlow M, Cheng D, et al. Impact of health literacy on depressive symptoms and mental health-related quality of life among adults with addiction. J Gen Intern Med. 2006;21(8):818-822. PubMed
44. Weiss BD, Francis L, Senf JH, et al. Literacy education as treatment for depression in patients with limited literacy and depression: a randomized controlled trial. J Gen Intern Med. 2006;21(8):823-828. PubMed
45. Goggins K, Wallston KA, Mion L, Cawthon C, Kripalani S. What patient characteristics influence nurses’ assessment of health literacy? J Health Commun. 2016;21(sup2):105-108. PubMed
46. Scarpato KR, Kappa SF, Goggins KM, et al. The impact of health literacy on surgical outcomes following radical cystectomy. J Health Commun. 2016;21(sup2):99-104.
PubMed
47. Sudore RL, Mehta KM, Simonsick EM, et al. Limited literacy in older people and disparities in health and healthcare access. J Am Geriatr Soc. 2006;54(5):770-776. PubMed
48. Jacobson HE, Hund L, Mas FS. Predictors of English health literacy among US Hispanic immigrants: the importance of language, bilingualism and sociolinguistic environment
© 2017 Society of Hospital Medicine
Comparing Collaborative and Toolkit QI
Continuous quality improvement (CQI) methodologies provide a framework for initiating and sustaining improvements in complex systems.1 By definition, CQI engages frontline staff in iterative problem solving using plandostudyact cycles of learning, with decision‐making based on real‐time process measurements.2 The Institute for Healthcare Improvement (IHI) has sponsored Breakthrough Series Collaboratives since 1996 to accelerate the uptake and impact of quality improvement (QI).3, 4 These collaboratives are typically guided by evidence‐based clinical practice guidelines, incorporate change methodologies, and rely on clinical and process improvement subject matter experts. Through the collaborative network, teams share knowledge and ideas about effective and ineffective interventions as well as strategies for overcoming barriers. The collaborative curriculum includes CQI methodology, multidisciplinary teamwork, leadership support, and tools for measurement. Participants are typically required to invest resources and send teams to face‐to‐face goal‐oriented meetings. It is costly for a large healthcare organization to incorporate travel to a learning session conference into its collaborative model. Thus, we attempted virtual learning sessions that make use of webcasts, a Web site, and teleconference calls for tools and networking.5
A recent derivative of collaboratives has been deployment of toolkits for QI. Intuition suggests that such toolkits may help to enable change, and thus some agencies advocate the simpler approach of disseminating toolkits as a change strategy.6 Toolkit dissemination is a passive approach in contrast to collaborative participation, and its effectiveness has not been critically examined in evidence‐based literature.
We sought to compare the virtual collaborative model with the toolkit model for improving care. Recommendations and guidelines for central lineassociated bloodstream infection (CLABSI) and ventilator‐associated pneumonia (VAP) prevention have not been implemented reliably, resulting in unnecessary intensive care unit (ICU) morbidity and mortality and fostering a national call for improvement.7 Our aim was to compare the effectiveness of the virtual collaborative and toolkit approaches on preventing CLABSI and VAP in the ICU.
Methods
This cluster randomized trial included medical centers within the Hospital Corporation of America (HCA), a network of hospitals located primarily in the southern United States. To minimize contamination bias between study groups within the same facility, the unit of randomization was the hospital and implementation was at the level of the ICU. The project received approval from the Vanderbilt University Institutional Review Board.
Leaders of all medical centers with at least 1 adult or pediatric ICU received an invitation from HCA leadership to participate in a QI initiative. Facility clinicians and managers completed baseline surveys (shown in the Supporting Information) on hospital characteristics, types of ICUs, patient safety climate, and QI resources between July and November 2005. Hospital‐level data were extracted from the enterprise‐wide data warehouse. Hospitals willing to participate were matched on geographic location and ICU volume and then randomized into either the Virtual Collaborative (n = 31) or Toolkit (n = 30) groups in December 20058; 1 of the hospitals was sold, yielding 29 hospitals in the Toolkit (n = 29) group. The study lasted 18 months from January 2006 through September 2007, with health careassociated infection data collected through December 2007, and follow‐up data collection through April 2008.
The QI initiative included educational opportunities, evidence‐based clinical prevention interventions, and processes and tools to implement and measure the impact of these interventions. Participants in both groups were offered interactive Web seminars during the study period; 5 of these seminars were on clinical subject matter, and 5 seminars were on patient safety, charting use of statistical process control and QI methods. The interventions were evidence‐based care bundles.9 The key interventions for preventing CLABSI were routine hand hygiene, use of chlorhexidine skin antisepsis, maximal barrier precautions during catheter insertion, catheter site and care, and avoidance of routine replacement of catheters. The key interventions to prevent VAP were routine elevation of head of the bed, regular oral care, daily sedation vacations, daily assessment of readiness to extubate, secretion cleaning, peptic ulcer disease prophylaxis, and deep vein thrombosis prophylaxis.
Toolkit Group
Hospitals randomized to this arm received a toolkit during study month 1 containing a set of evidence‐based guidelines and fact sheets for preventing CLABSI and VAP, a review of QI and teamwork methods, standardized data collection tools, and standardized charting tools. The nurse and quality managers for the Toolkit ICUs were provided ad libitum access to the HCA intranet toolkit Web site containing all of the educational seminars, clinical tools, and QI tools. Otherwise, ICUs in this group were on their own to initiate and implement a local hospital QI initiative to prevent CLABSI and VAP.
Virtual Collaborative Group
In addition to the materials and Web site support described above, facility leaders and managers in this Virtual Collaborative group agreed to participate in a virtual collaborative to develop processes to more reliably implement evidence‐based interventions to prevent CLABSI and VAP. The collaboration differed from the Breakthrough Series model3, 4 in that teams did not come together for face‐to‐face educational and planning sessions but instead attended Web seminars and teleconferences for reporting back to the larger group.5 Teams were supported through monthly educational and troubleshooting conference calls, individual coaching coordinated by the HCA corporate office of quality, safety, and performance improvement, and an e‐mail listserv designed to stimulate interaction among teams.
Clinical Outcome Measures
Although most participating hospitals defined CLABSI and VAP using the Centers for Disease Control and Prevention definitions, data collection and surveillance methods varied across hospitals.10 Education was provided to standardize outcome measurement. A data registry Web application was created as a new tool for infection control data entry, and healthcare‐associated infection data reporting by the infection control personnel was mandated starting the first quarter of 2006. To verify electronic data and correct missing information, the infection control personnel were requested to complete a retrospective data collection sheet providing quarterly reports from January 2005 through December 2007 on ICU infection events as well as total catheter days and ventilator days to allow calculation of event rates. Outcome measures of CLABSI and VAP were at the level of the hospital.
Follow‐Up
The HCA e‐mail distribution and collection routine was employed for the follow‐up survey of ICU nurse and quality managers for all participating medical centers from January 2008 through April 2008. A single survey (shown in the Supporting Information) was requested from each participating ICU. The ICU‐level surveys included questions about the implementation of the CLABSI and VAP process interventions, access of tools, participation in Web seminars, and use of QI strategies.11, 12 The postintervention survey also assessed the character and amount of implementation and teamwork activity expended.
Median CLABSI and VAP rates for a 3‐month baseline and quarterly postintervention periods were compared between the 2 study groups. The CLABSI and VAP infection rates were also analyzed using hierarchical negative binomial regression models to model infection rate changes over time (time in months and group by time interaction effects) and account for clustering of ICUs within hospitals and adjusting for baseline covariates. Baseline and process variables at the hospital and ICU level were compared using chi‐square tests and t tests according to the type of measurement. Time‐to‐event analyses were conducted to compare the groups on time to initiation of a care process. All analyses were conducted using the (R: A Language and Environment for Statistical Computing. R Foundation for Statistical Computing, Vienna, Austria, 2010).
The power of the study was calculated a priori with a 1‐tailed alpha of 0.05 and group size of 30. We hypothesized a 50% decrease in hospital‐associated infection rates for the Collaborative group vs. a 10% to 15% decrease for the Toolkit group. The calculations yielded power ranging from a low of 82% to a high of 91% for testing group differences.13
Results
Participating facilities included rural (11%), inner city (28%), and suburban (61%) medical centers. The 60 participating sites did not differ in administrative variables from the 113 nonparticipating HCA sites (results not shown). The median hospital size was 177 beds and the median ICU size was 16 beds. The hospitals did not differ between study groups (Table 1). At baseline, 45% of the facilities reported having a CLABSI program and 62% a VAP program.
| Hospital Factors at Baseline | Virtual Collaborative | Toolkit | P Value |
|---|---|---|---|
| |||
| Number of hospitals | 31 | 29* | |
| ICU annual patient volume, median (IQR) | 568 (294, 904) | 578 (244, 1077) | 0.93 |
| ICU patient length of stay days, median (IQR) | 3882 (1758, 5718) | 4228 (1645, 6725) | 0.95 |
| ICU mortality rate, percent (SD) | 5.7% (3.1%) | 7.1% (3.6%) | 0.13 |
| Medicare/Medicaid, percent (SD) | 68.6% (9.5%) | 68.5% (10.1%) | 0.95 |
| Percent admitted to ICU from the Emergency Department (SD) | 71% (15%) | 67% (20%) | 0.27 |
| Percent female (SD) | 49.7% (5.7%) | 50.3% (7.7%) | 0.79 |
| Medicare case‐mix weight, mean (SD) | 1221 (1007) | 1295 (1110) | 0.82 |
| Percent hospitalist ICU management | 47% | 40% | 0.61 |
The baseline and quarterly median and pooled infection rates for the Toolkit and Collaboration groups are shown in Table 2 for CLABSI and in Table 3 for VAP. There were no significant differences in the baseline rates for either CLABSI (P = 0.24) or VAP (P = 0.72) between the Collaborative and Toolkit groups. There was no significant change for either CLABSI or VAP outcomes at either 12 or 18 months of follow‐up. The median bloodstream infection rate for all participating hospitals was 2.27 at baseline, 1.18 at 12 months (P = 0.13), and 2.23 per 1000 catheter days 18 months later (P = 0.95). The median VAP rate for participating hospitals was 2.90 at baseline, 2.67 at 12 months (P = 0.44), and 2.52 per 1000 ventilator days 18 months later (P = 0.84). The hierarchical regression analysis found that neither the Collaborative nor Toolkit groups improved CLABSI (P = 0.75 and P = 0.83, respectively) or VAP (P = 0.61 and P = 0.37, respectively) rates over time, and there was no differential performance between the 2 groups for either outcome (bloodstream infection, P = 0.71; VAP, P = 0.80).
| Overall | Virtual Collaborative | Toolkit | ||||
|---|---|---|---|---|---|---|
| N = 59 Hospitals | N = 30 Hospitals | N = 29 Hospitals | ||||
| Study Period | Hospital Median (IQR) | Rate Pooled Across Hospitals | Hospital Median (IQR) | Rate Pooled Across Hospitals | Hospital Median (IQR) | Rate Pooled Across Hospitals |
| ||||||
| Baseline | 2.27 (0.00‐3.98) | 2.42 | 1.84 (0.00‐3.83) | 1.67 | 2.42 (0.65‐6.80) | 3.05 |
| 3 Month | 2.27 (1.30‐4.69) | 2.61 | 2.24 (0.54‐4.69) | 2.34 | 2.47 (1.48‐5.35) | 2.85 |
| 6 Month | 2.37 (0.00‐4.29) | 2.73 | 2.28 (0.00‐3.73) | 2.35 | 2.54 (0.00‐4.98) | 3.09 |
| 9 Month | 1.66 (0.00‐3.84) | 2.45 | 1.76 (0.00‐3.74) | 2.28 | 1.23 (0.00‐3.93) | 2.59 |
| 12 Month | 1.18 (0.00‐3.10) | 2.17 | 1.18 (0.00‐2.71) | 1.72 | 1.17 (0.00‐3.61) | 2.58 |
| 15 Month | 1.93 (0.00‐4.25) | 2.29 | 2.04 (0.00‐4.91) | 2.53 | 1.77 (0.00‐3.30) | 2.08 |
| 18 Month | 2.23 (0.00‐4.97) | 2.73 | 2.76 (0.00‐4.67) | 2.75 | 1.16 (0.00‐5.46) | 2.72 |
| Study Period | Overall | Virtual Collaborative | Toolkit | |||
|---|---|---|---|---|---|---|
| N = 59 Hospitals | N = 30 Hospitals | N = 29 Hospitals | ||||
| Hospital Median (IQR) | Rate Pooled Across Hospitals | Hospital Median (IQR) | Rate Pooled Across Hospitals | Hospital Median (IQR) | Rate Pooled Across Hospitals | |
| ||||||
| Baseline | 2.90 (0.00‐6.14) | 3.97 | 2.14 (0.00‐6.09) | 3.43 | 3.49 (0.00‐7.04) | 4.36 |
| 3 Month | 3.12 (0.00‐8.40) | 4.46 | 3.01 (0.00‐9.11) | 4.22 | 3.32 (0.00‐8.25) | 4.62 |
| 6 Month | 3.40 (0.00‐7.53) | 4.97 | 2.72 (0.00‐7.09) | 4.81 | 4.61 (0.00‐9.37) | 5.10 |
| 9 Month | 1.49 (0.00‐4.87) | 2.99 | 0 (0.00‐3.94) | 2.51 | 2.27 (0.00‐6.27) | 3.36 |
| 12 Month | 2.67 (0.00‐4.60) | 4.39 | 2.67 (0.00‐4.47) | 3.82 | 2.66 (0.00‐4.82) | 4.95 |
| 15 Month | 3.06 (0.00‐5.10) | 4.03 | 2.40 (0.00‐3.94) | 3.57 | 3.65 (1.15‐6.57) | 4.45 |
| 18 Month | 2.52 (0.00‐7.45) | 4.61 | 2.93 (0.00‐7.63) | 5.02 | 2.06 (0.00‐6.59) | 4.31 |
The poststudy survey was completed by 27 of 31 (87%) of Collaborative group hospitals and 19 of the 29 (66%) Toolkit hospitals. Both groups reported QI improvement efforts to prevent CLABSI (Collaborative 97% vs. Toolkit 88%, P = 0.29) and VAP (Collaborative 97% vs. Toolkit 96%, P = 0.99). Eighty‐three percent of the Collaborative group implemented all components of the bloodstream infection prevention interventions compared with 64% for the Toolkit group (P = 0.13; Figure 1). The Collaborative group implemented daily catheter review more often than the Toolkit group (P = 0.04) and began the process implementation sooner following study implementation (P = 0.006 vs. Toolkit; see Supporting Information Figure). Eighty‐six percent of the Collaborative group implemented the complete VAP prevention interventions vs. 64% of the Toolkit group (P = 0.06; Figure 1) and the Collaborative group conducted the sedation vacation intervention more often (P = 0.03).
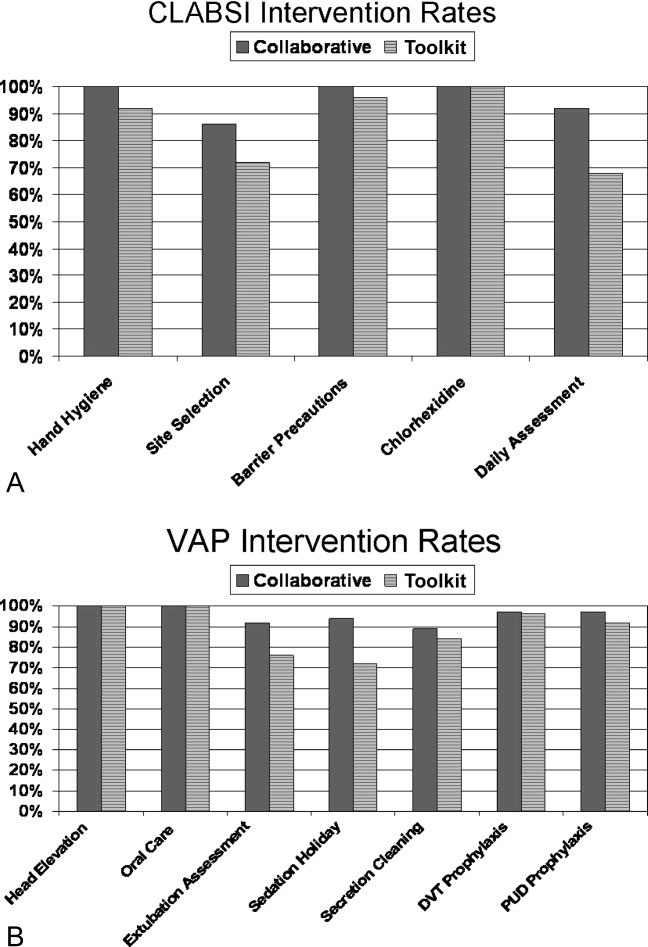
The Collaborative group participated in 57% of the seminars, whereas the Toolkit group participated in 39% (P = 0.014). Members of both groups attended more than half the clinical topics (Collaborative 64% vs. Toolkit 56%, P = 0.37). The Collaborative group had greater participation in the data and method topics (Collaborative 50% vs. Toolkit 22%, P < 0.001). The proportion of hospitals finding the seminars useful to their QI efforts was 49% for the Collaborative and 30% for the Toolkit group (P = 0.017). When restricted to hospitals that participated in the seminars, the usefulness rating was higher for both clinical (91% for the Collaborative and 86% for Toolkit) and Data/Methods (79% for Collaborative and 55% for Toolkit) topics.
A set of 14 tools were produced during the study period (Table 4); 9 clinically related tools (eg, checklists, algorithms, protocols, and flowsheets) and 5 data monitoring and quality improvement tools (eg, easy‐to‐use statistical process control spreadsheet templates, quality improvement tools, and computer tools). The Collaborative group downloaded a median of 10 tools and the Toolkit group a median of 7 (P = 0.051). The groups did not differ in their access to the clinical tools (P = 0.23) but the Collaborative group accessed a greater proportion of the data/methods tools (P = 0.004).
| Tool Access and Strategies | Collaborative Hospitalsa | Tool Kit Hospitalsa | P‐value |
|---|---|---|---|
| N = 36 ICUs | N = 25 ICUs | ||
| |||
| Clinical Tool Use | 61% | 49% | 0.23 |
| BSI Surveillance Guide | 22/36 (61%) | 13/25 (52%) | 0.60 |
| BSI Checklist | 31/36 (86%) | 16/25 (64%) | 0.06 |
| VAP Diagnosis Algorithm | 24/36 (67%) | 15/25 (60%) | 0.60 |
| Ventilator Weaning Protocol | 23/36 (64%) | 11/25 (44%) | 0.18 |
| VAP Surveillance Guide | 21/36 (58%) | 12/25 (48%) | 0.44 |
| VAP Daily Assessment | 17/36 (47%) | 6/25 (24%) | 0.10 |
| Ventilator Weaning Protocol (Flowsheet) | 15/36 (42%) | 11/25 (44%) | 0.99 |
| Data Tools | 56% | 30% | 0.004 |
| QI Implementation Tools | 19/36 (53%) | 6/25 (24%) | 0.03 |
| BSI Statistical Process Control | 23/36 (64%) | 5/25 (20%) | 0.001 |
| VAP Bundle | 23/36 (64%) | 11/25 (44%) | 0.18 |
| VAP Statistical Process Control | 21/36 (58%) | 3/25 (12%) | 0.001 |
| Strategies | 69% | 54% | 0.017 |
| Protocols for BSI | 24/36 (67%) | 19/25 (76%) | 0.57 |
| Protocols for VAP | 22/36 (61%) | 9/25 (36%) | 0.07 |
| Computer Documentation for BSI | 24/36 (67%) | 13/25 (52%) | 0.29 |
| Computer Documentation for VAP | 25/36 (69%) | 15/25 (60%) | 0.58 |
| Increased Staffing | 3/36 (8%) | 0/25 (0%) | 0.26 |
| Written Education for BSI | 31/36 (86%) | 19/25 (76%) | 0.33 |
| Written Education for VAP | 30/36 (83%) | 19/25 (76%) | 0.52 |
| Continuing Education Classes for BSI | 28/36 (78%) | 16/25 (64%) | 0.26 |
| Continuing Education Classes for VAP | 30/36 (83%) | 17/25 (68%) | 0.21 |
| QI teams | 27/36 (75%) | 14/25 (56%) | 0.16 |
| Provider Performance Feedback for BSI | 23/36 (64%) | 11/25 (44%) | 0.18 |
| Provider Performance Feedback for VAP | 24/36 (67%) | 11/25 (44%) | 0.11 |
| Implementation of BSI Checklist | 28/36 (78%) | 15/25 (60%) | 0.16 |
| Implementation of VAP Checklist | 31/36 (86%) | 13/25 (52%) | 0.007 |
Both groups relied primarily on implementation of protocols and informatics approaches (Table 4) without increasing staff levels. The predominant strategy was education; both groups provided written educational materials and classes to their providers. There was a trend for more Collaborative group members to implement QI teams (Table 4, P = 0.16 compared with the Toolkit group). Although the preponderance of both groups provided feedback reports to their hospital leaders and unit managers, Collaborative group hospitals showed a trend for providing feedback to front‐line providers (P = 0.11). With respect to self‐reported interventions, 78% of the Collaborative ICUs reported implementing a CLABSI checklist and 86% a VAP checklist, whereas only 60% of the Toolkit group reported implementation of a CLABSI checklist (P = 0.16) and 52% a VAP checklist (P = 0.007). Once a tool was implemented, both groups reported a high rate of sustaining the implementation (ranging from 86% to 100%). There also seemed to be a pattern of sequencing the interventions. Initial efforts tend to focus on provider education and evidence‐based protocols. Later efforts include more formal formation of QI teams followed by implementation of checklists. The evidence for sequencing of interventions is qualitative; we lacked subgroup sample size to substantiate these results with statistical analysis.
Discussion
In our investigation of Virtual Collaborative and Toolkit strategies for spreading the implementation of safe practices for CLABSI and VAP, ICUs in the Collaborative group had more complete implementation of the processes for prevention of hospital‐associated infections. Although both groups accessed clinical resources consistent with surveillance and clinical education, the Virtual Collaborative group attended to data and implementation methods more likely to lead to systemic CQI and organizational changes. ICUs that engaged these resources believed them useful in implementing QI, and more than 85% of the practices were sustained once integrated into routine care. Although the Collaborative ICUs were about 50% more likely to implement improvement strategies, these differences in implementation and process of care did not translate into group differences or longitudinal changes in infection rates.
In contrast to the context of our investigation, most published QI studies on health careassociated infection prevention report high baseline rates followed by a significant decline in infection rates.1419 The baseline infection rates in our study hospitals were actually below the endpoint found in many prior studies, suggesting that any marginal effects from our intervention would be more difficult to detect. Our study was implemented during the IHI's 100,000 Lives Campaign,20 a trend that may have brought about these lower baseline rates and thus a tighter margin for improvement.
The median CLABSI baseline rate in the well‐publicized Michigan hospital study was 2.7 per 1000 catheter days.21, 22 Although our baseline rate was similar (2.27 per 1000 catheter days), their reported postintervention rate was near zero, inferring nearly total elimination of the risk for CLABSI within 3‐18 months of study implementation. Several other studies using a collaborative approach have similarly reported high‐performance near‐zero results in reducing VAP23, 24 and CLABSI2528 rates. The difference between the present and previously published near‐zero result outcomes raises questions about collaboration‐based studies. We noticed 2 phenomena. First, there was slow uptake of data‐driven QI, and second, there was a differential uptake between general knowledge (clinical evidence and education) and QI implementation knowledge.29, 30
Lack of infrastructure to support data‐driven QI remains a significant barrier throughout the health care system, and teams in collaboratives often must work intensively toward improving their information systems' capability for the purpose of data‐driven decision support.1, 15, 31, 32 Systematic, standardized collection of CLABSI and VAP outcomes was initially lacking in many of our study hospitals,10 and our project expended early effort to deploy a system‐wide standardized infection control database registry.
Both of our study groups gravitated toward educational training and evidence‐based protocol decision‐support strategies. A focus only on established surveillance and education‐based fixes (eg, asking clinicians to follow a protocol within their existing care processes) have produced 32% to 57% reductions in health careacquired infections.3335 These early gains, however, are unlikely to produce the sustained near‐zero results that some collaborative teams have reported.22, 25
The ability to achieve sustained high‐performance results depends on organizational context and requires time.31 A potential benefit of collaboratives might be the return on investment attained by organizational change in quality and safety climate and its influence across the whole organization.19, 31, 36 Participants requiring systems training in the CQI process may not gain these benefits until well into their collaborative.31 For example, accumulating evidence demonstrates that the use of checklists can reduce errors of omission. Although a checklist seems a simple intervention, its effective implementation into routine care processes actually requires time for system redesign that addresses changes in multidisciplinary roles and responsibilities, frontline clinician and mid‐level management buy‐in, new methods of data collection and feedback, unanticipated involvement of ancillary services (eg, medical records, housekeeping), as well as changes to organizational policies, expectations, and priorities that connect silos of care and integrate hierarchical operations. Wall et al.37 and Pronovost and colleagues19, 21, 22, 25 highlighted the strategic effectiveness of embedding a checklist as a behavioral and data collection tool into frontline care process, leading to a redefined role of nursing, as well as new data for further cycles of improvement that collectively reduced infection rates. In our study, the Virtual Collaborative group did not have greater use of CLABSI and VAP checklists until the QI teams had been formed months into the project, consistent with the hypothesis that beneficial translation of desired changes in process of care to observed improvements in patient outcomes may take longer than 18 months to achieve19, 25, 27, 38 as opposed to the remarkable 3 months reported in the Keystone ICU project.21
Our study has several limitations. Our intervention did not mandate fixed specific components of intervention or QI methods. Each medical center was free to tailor its use of tools and change ideas, producing site variation in implementation methods and investment in support of QI. Like other multicomponent, multidimensional intervention studies, we were not able to test the effectiveness of particular QI components or the thoroughness of surveillance for CLABSI and VAP related to efforts to standardize the approach, and we did not have the resources to monitor the intensity with which participants approached QI. Furthermore, our data were dependent on self‐reports and were not verified by independent assessment of the fidelity with which the interventions were implemented, a checklist was embedded into usual care, or practices were enforced by nurses. In addition, the virtual collaborative circumvents the face‐to‐face learning sessions that might play a role in collaborative social networking, peer pressure, and acculturation.31, 36
Despite these limitations, we found that the Virtual Collaborative performed just like a Breakthrough Collaborative with a gradual uptake of implementation science using QI methods, team management, and statistical process control tools. The Toolkit condition had an even slower uptake. From an organization's perspective, the bottom‐line decision is whether a greater and meaningful proportion of collaborative participants will be successful to justify the investment of effort compared to a toolkit‐only approach. Our findings suggest that organizations engaged in change but lacking expertise in implementation science can potentially benefit from the acculturation, experiential learning, and uptake of QI provided by a collaborative.
In summary, although our Virtual Collaborative intervention was more likely to produce changes in ICU processes of care, there were no improvements in patient outcomes over this 18‐month study. The current popularity of evidence‐based guidelines, care protocols, prevention awareness, and surveillance may have produced a background of secular trend, making it difficult to ascertain effects of our QI intervention. Nonetheless, important lessons can be gleaned from this randomized controlled trial. Our study supports the proposition that as long as organizations vary in their capacity for and commitment to the science of QI and systems engineering, we should anticipate variation, uncertainty, and mixed results from short‐term, rapid cycle initiatives.27, 28, 31, 32, 39, 40 The untested, longer‐term benefit produced by a collaborative may be its stimulation of enduring systems engineering that optimizes an environment for QI of health care processes focused on desired outcomes.
Acknowledgements
The authors thank the Agency for Healthcare Research and Quality collaborative investigators for their work in this study: Xu Lei Liu, MS, at Vanderbilt; Laurie Brewer, RN MBA, Jason Hickok, Steve Horner, Susan Littleton, Patsy McFadden, RN BSN MPA CIC, Steve Mok, PharmD, Jonathan Perlin, MD PhD, Joan Reischel, RN BSN CCRN, and Sheri G. Chernestky Tejedor, MD, and all the HCA medical centers that participated in this project.
- ,,.Assessing the impact of continuous quality improvement on clinical practice: What it will take to accelerate progress.Milbank Q.1998;76:593–624.
- .Continuous improvement as an ideal in health care.N Engl J Med.1989;320:53–56.
- .A framework for collaborative improvement: Lessons from the Institute for Healthcare Improvement's Breakthrough Series.Qual Manag Health Care.1998;6(4):1–13.
- ,,,,,.Quality improvement learning collaboratives.Qual Manag Health Care.2005;14:234–237.
- ,,,.Using a virtual breakthrough series collaborative to improve access in primary care.Jt Comm J Qual Patient Saf.2006;32:573–584.
- ,,, et al.Taking the national guideline for care of acute myocardial infarction to the bedside: Developing the guideline applied in practice (GAP) initiative in Southeast Michigan.Jt Comm J Qual Improv.2002;28:5–19.
- ,.Priority Areas for National Action: Transforming Health Care Quality.Washington, DC:The National Academies Press;2003.
- ,,,.Optimal multivariate matching before randomization.Biostatistics.2004;5:263–275.
- Institute for Healthcare Improvement. The 100,000 lives campaign. http://www.ihi.org/IHI/Programs/Campaign.htm;2005.
- ,,, et al.Survey of infection control programs in a large, national healthcare system.Infect Control Hosp Epidemiol.2007;28:1401–1403.
- ,,,. Closing the quality gap: A critical analysis of quality improvement strategies, Volume 1‐Series overview and methodology. Technical Review 9 (Contract No 290–02‐0017 to the Stanford University‐UCSF Evidence‐based Practices Center), 2004. www.ahrq.gov/clinic/tp/qgap1tp.htm. Accessed November 11,2010.
- ,.Improving safety on the front lines: the role of clinical microsystems.Qual Saf Health Care.2002;11:45–50.
- ,,.SamplePower 2.0.Chicago, IL:SPSS Inc.;2001.
- ,,,.Eliminating nosocomial infections at Ascension Health.Jt Comm J Qual Patient Saf.2006;32:612–620.
- ,,, et al.An intensive care unit quality improvement collaborative in nine department of Veterans Affairs hospitals: reducing ventilator‐associated pneumonia and catheter‐related bloodstream infection rates.Jt Comm J Qual Patient Saf.2008;34:639–645.
- ,,, et al.Decreasing ventilator‐associated pneumonia in a trauma ICU.J Trauma.2006;61:122–130.
- ,,,,,.Use of corporate six sigma performance‐improvement strategies to reduce incidence of catheter‐related bloodstream infections in a surgical ICU.J Am Coll Surg.2005;201:349–358.
- ,,,,.Decline in ICU adverse events, nosocomial infections and cost through a quality improvement initiative focusing on teamwork and culture change.Qual Saf Health Care.2006;15:235–239.
- ,,,,,.Using a bundle approach to improve ventilator care processes and reduce ventilator‐associated pneumonia.Jt Comm J Qual Patient Saf.2005;31:243–248.
- ,,,.The 100000 lives campaign: Setting a goal and a deadline for improving health care quality.JAMA.2006;295:324–327.
- ,,.An intervention to decrease catheter‐related bloodstream infections in the ICU.N Engl J Med.2006;355:2725–2732.
- ,,, et al.Improving patient safety units in Michigan.J Crit Care.2008;23:207–221.
- .Toward a zero VAP rate: Personal and team approaches in the ICU.Crit Care Nurs Q.2006;29:108–114.
- ,,, et al.Implementing a ventilator bundle in a community hospital.Jt Comm J Qual Patient Saf.2007;33:219–225.
- ,,, et al.Eliminating catheter‐realted bloodstream infections in the intensive care unit.Crit Care Med.2004;32:2014–2020.
- .Innovative bundle wipes out catheter‐related bloodstream infections.Nursing.2008;38:17–18.
- ,,,,,.The CLABs collaborative: a regionwide effort to improve the quality of care in hospitals.Jt Comm J Qual Patient Saf.2008;34:713–723.
- ,,, et al.Evidence‐based practice to reduce central line infections.Jt Comm J Qual Patient Saf.2006;32:253–260.
- .Learning and improving in quality improvement collaboratives: which collaborative features do participants value most?Health Serv Res.2009;44(2 Pt 1):359–378.
- ,,, et al.Inside the health disparities collaboratives: a detailed exploration of quality improvement at community health centers.Med Care.2008;46:489–496.
- ,,, et al.Quality collaboratives: lessons from research.Qual Saf Health Care.2002;11:345–351.
- ,,, et al.Assessing the implementation of the chronic care model in quality improvement collaboratives.Health Serv Res.2005;40:978–996.
- ,.Prevention of ventilator‐associated pneumonia: Analysis of studies published since 2004.J Hosp Infect.2007;67:1–8.
- ,,,.Effect of comparative data feedback on intensive care unit infection rates in a Veterans Administration Hospital network system.Am J Infect Control.2003;31:397–404.
- ,,, et al.Reducing ventilator‐associated pneumonia rates through a staff education programme.J Hosp Infect.2004;57:223–227.
- ,,,.Does quality improvement implementation affect hospital quality of care?Hosp Top.2007;85:3–12.
- ,,,,,.Using real‐time process measurements to reduce catheter‐related bloodstream infections in the intensive care unit.Qual Saf Health Care.2005;14:295–302.
- ,,,,,.Prevention of ventilator‐associated pneumonia in the Calgary health region: a Canadian success story!Healthcare Qual.2008;11(3 Spec No):129–136.
- .Creating the evidence base for quality improvement collaboratives.Ann Intern Med.2004;140:897–901.
- ,,,,.Evidence for the impact of quality improvement collaboratives: systematic review.Br Med J.2008;336:1491–1494.
Continuous quality improvement (CQI) methodologies provide a framework for initiating and sustaining improvements in complex systems.1 By definition, CQI engages frontline staff in iterative problem solving using plandostudyact cycles of learning, with decision‐making based on real‐time process measurements.2 The Institute for Healthcare Improvement (IHI) has sponsored Breakthrough Series Collaboratives since 1996 to accelerate the uptake and impact of quality improvement (QI).3, 4 These collaboratives are typically guided by evidence‐based clinical practice guidelines, incorporate change methodologies, and rely on clinical and process improvement subject matter experts. Through the collaborative network, teams share knowledge and ideas about effective and ineffective interventions as well as strategies for overcoming barriers. The collaborative curriculum includes CQI methodology, multidisciplinary teamwork, leadership support, and tools for measurement. Participants are typically required to invest resources and send teams to face‐to‐face goal‐oriented meetings. It is costly for a large healthcare organization to incorporate travel to a learning session conference into its collaborative model. Thus, we attempted virtual learning sessions that make use of webcasts, a Web site, and teleconference calls for tools and networking.5
A recent derivative of collaboratives has been deployment of toolkits for QI. Intuition suggests that such toolkits may help to enable change, and thus some agencies advocate the simpler approach of disseminating toolkits as a change strategy.6 Toolkit dissemination is a passive approach in contrast to collaborative participation, and its effectiveness has not been critically examined in evidence‐based literature.
We sought to compare the virtual collaborative model with the toolkit model for improving care. Recommendations and guidelines for central lineassociated bloodstream infection (CLABSI) and ventilator‐associated pneumonia (VAP) prevention have not been implemented reliably, resulting in unnecessary intensive care unit (ICU) morbidity and mortality and fostering a national call for improvement.7 Our aim was to compare the effectiveness of the virtual collaborative and toolkit approaches on preventing CLABSI and VAP in the ICU.
Methods
This cluster randomized trial included medical centers within the Hospital Corporation of America (HCA), a network of hospitals located primarily in the southern United States. To minimize contamination bias between study groups within the same facility, the unit of randomization was the hospital and implementation was at the level of the ICU. The project received approval from the Vanderbilt University Institutional Review Board.
Leaders of all medical centers with at least 1 adult or pediatric ICU received an invitation from HCA leadership to participate in a QI initiative. Facility clinicians and managers completed baseline surveys (shown in the Supporting Information) on hospital characteristics, types of ICUs, patient safety climate, and QI resources between July and November 2005. Hospital‐level data were extracted from the enterprise‐wide data warehouse. Hospitals willing to participate were matched on geographic location and ICU volume and then randomized into either the Virtual Collaborative (n = 31) or Toolkit (n = 30) groups in December 20058; 1 of the hospitals was sold, yielding 29 hospitals in the Toolkit (n = 29) group. The study lasted 18 months from January 2006 through September 2007, with health careassociated infection data collected through December 2007, and follow‐up data collection through April 2008.
The QI initiative included educational opportunities, evidence‐based clinical prevention interventions, and processes and tools to implement and measure the impact of these interventions. Participants in both groups were offered interactive Web seminars during the study period; 5 of these seminars were on clinical subject matter, and 5 seminars were on patient safety, charting use of statistical process control and QI methods. The interventions were evidence‐based care bundles.9 The key interventions for preventing CLABSI were routine hand hygiene, use of chlorhexidine skin antisepsis, maximal barrier precautions during catheter insertion, catheter site and care, and avoidance of routine replacement of catheters. The key interventions to prevent VAP were routine elevation of head of the bed, regular oral care, daily sedation vacations, daily assessment of readiness to extubate, secretion cleaning, peptic ulcer disease prophylaxis, and deep vein thrombosis prophylaxis.
Toolkit Group
Hospitals randomized to this arm received a toolkit during study month 1 containing a set of evidence‐based guidelines and fact sheets for preventing CLABSI and VAP, a review of QI and teamwork methods, standardized data collection tools, and standardized charting tools. The nurse and quality managers for the Toolkit ICUs were provided ad libitum access to the HCA intranet toolkit Web site containing all of the educational seminars, clinical tools, and QI tools. Otherwise, ICUs in this group were on their own to initiate and implement a local hospital QI initiative to prevent CLABSI and VAP.
Virtual Collaborative Group
In addition to the materials and Web site support described above, facility leaders and managers in this Virtual Collaborative group agreed to participate in a virtual collaborative to develop processes to more reliably implement evidence‐based interventions to prevent CLABSI and VAP. The collaboration differed from the Breakthrough Series model3, 4 in that teams did not come together for face‐to‐face educational and planning sessions but instead attended Web seminars and teleconferences for reporting back to the larger group.5 Teams were supported through monthly educational and troubleshooting conference calls, individual coaching coordinated by the HCA corporate office of quality, safety, and performance improvement, and an e‐mail listserv designed to stimulate interaction among teams.
Clinical Outcome Measures
Although most participating hospitals defined CLABSI and VAP using the Centers for Disease Control and Prevention definitions, data collection and surveillance methods varied across hospitals.10 Education was provided to standardize outcome measurement. A data registry Web application was created as a new tool for infection control data entry, and healthcare‐associated infection data reporting by the infection control personnel was mandated starting the first quarter of 2006. To verify electronic data and correct missing information, the infection control personnel were requested to complete a retrospective data collection sheet providing quarterly reports from January 2005 through December 2007 on ICU infection events as well as total catheter days and ventilator days to allow calculation of event rates. Outcome measures of CLABSI and VAP were at the level of the hospital.
Follow‐Up
The HCA e‐mail distribution and collection routine was employed for the follow‐up survey of ICU nurse and quality managers for all participating medical centers from January 2008 through April 2008. A single survey (shown in the Supporting Information) was requested from each participating ICU. The ICU‐level surveys included questions about the implementation of the CLABSI and VAP process interventions, access of tools, participation in Web seminars, and use of QI strategies.11, 12 The postintervention survey also assessed the character and amount of implementation and teamwork activity expended.
Median CLABSI and VAP rates for a 3‐month baseline and quarterly postintervention periods were compared between the 2 study groups. The CLABSI and VAP infection rates were also analyzed using hierarchical negative binomial regression models to model infection rate changes over time (time in months and group by time interaction effects) and account for clustering of ICUs within hospitals and adjusting for baseline covariates. Baseline and process variables at the hospital and ICU level were compared using chi‐square tests and t tests according to the type of measurement. Time‐to‐event analyses were conducted to compare the groups on time to initiation of a care process. All analyses were conducted using the (R: A Language and Environment for Statistical Computing. R Foundation for Statistical Computing, Vienna, Austria, 2010).
The power of the study was calculated a priori with a 1‐tailed alpha of 0.05 and group size of 30. We hypothesized a 50% decrease in hospital‐associated infection rates for the Collaborative group vs. a 10% to 15% decrease for the Toolkit group. The calculations yielded power ranging from a low of 82% to a high of 91% for testing group differences.13
Results
Participating facilities included rural (11%), inner city (28%), and suburban (61%) medical centers. The 60 participating sites did not differ in administrative variables from the 113 nonparticipating HCA sites (results not shown). The median hospital size was 177 beds and the median ICU size was 16 beds. The hospitals did not differ between study groups (Table 1). At baseline, 45% of the facilities reported having a CLABSI program and 62% a VAP program.
| Hospital Factors at Baseline | Virtual Collaborative | Toolkit | P Value |
|---|---|---|---|
| |||
| Number of hospitals | 31 | 29* | |
| ICU annual patient volume, median (IQR) | 568 (294, 904) | 578 (244, 1077) | 0.93 |
| ICU patient length of stay days, median (IQR) | 3882 (1758, 5718) | 4228 (1645, 6725) | 0.95 |
| ICU mortality rate, percent (SD) | 5.7% (3.1%) | 7.1% (3.6%) | 0.13 |
| Medicare/Medicaid, percent (SD) | 68.6% (9.5%) | 68.5% (10.1%) | 0.95 |
| Percent admitted to ICU from the Emergency Department (SD) | 71% (15%) | 67% (20%) | 0.27 |
| Percent female (SD) | 49.7% (5.7%) | 50.3% (7.7%) | 0.79 |
| Medicare case‐mix weight, mean (SD) | 1221 (1007) | 1295 (1110) | 0.82 |
| Percent hospitalist ICU management | 47% | 40% | 0.61 |
The baseline and quarterly median and pooled infection rates for the Toolkit and Collaboration groups are shown in Table 2 for CLABSI and in Table 3 for VAP. There were no significant differences in the baseline rates for either CLABSI (P = 0.24) or VAP (P = 0.72) between the Collaborative and Toolkit groups. There was no significant change for either CLABSI or VAP outcomes at either 12 or 18 months of follow‐up. The median bloodstream infection rate for all participating hospitals was 2.27 at baseline, 1.18 at 12 months (P = 0.13), and 2.23 per 1000 catheter days 18 months later (P = 0.95). The median VAP rate for participating hospitals was 2.90 at baseline, 2.67 at 12 months (P = 0.44), and 2.52 per 1000 ventilator days 18 months later (P = 0.84). The hierarchical regression analysis found that neither the Collaborative nor Toolkit groups improved CLABSI (P = 0.75 and P = 0.83, respectively) or VAP (P = 0.61 and P = 0.37, respectively) rates over time, and there was no differential performance between the 2 groups for either outcome (bloodstream infection, P = 0.71; VAP, P = 0.80).
| Overall | Virtual Collaborative | Toolkit | ||||
|---|---|---|---|---|---|---|
| N = 59 Hospitals | N = 30 Hospitals | N = 29 Hospitals | ||||
| Study Period | Hospital Median (IQR) | Rate Pooled Across Hospitals | Hospital Median (IQR) | Rate Pooled Across Hospitals | Hospital Median (IQR) | Rate Pooled Across Hospitals |
| ||||||
| Baseline | 2.27 (0.00‐3.98) | 2.42 | 1.84 (0.00‐3.83) | 1.67 | 2.42 (0.65‐6.80) | 3.05 |
| 3 Month | 2.27 (1.30‐4.69) | 2.61 | 2.24 (0.54‐4.69) | 2.34 | 2.47 (1.48‐5.35) | 2.85 |
| 6 Month | 2.37 (0.00‐4.29) | 2.73 | 2.28 (0.00‐3.73) | 2.35 | 2.54 (0.00‐4.98) | 3.09 |
| 9 Month | 1.66 (0.00‐3.84) | 2.45 | 1.76 (0.00‐3.74) | 2.28 | 1.23 (0.00‐3.93) | 2.59 |
| 12 Month | 1.18 (0.00‐3.10) | 2.17 | 1.18 (0.00‐2.71) | 1.72 | 1.17 (0.00‐3.61) | 2.58 |
| 15 Month | 1.93 (0.00‐4.25) | 2.29 | 2.04 (0.00‐4.91) | 2.53 | 1.77 (0.00‐3.30) | 2.08 |
| 18 Month | 2.23 (0.00‐4.97) | 2.73 | 2.76 (0.00‐4.67) | 2.75 | 1.16 (0.00‐5.46) | 2.72 |
| Study Period | Overall | Virtual Collaborative | Toolkit | |||
|---|---|---|---|---|---|---|
| N = 59 Hospitals | N = 30 Hospitals | N = 29 Hospitals | ||||
| Hospital Median (IQR) | Rate Pooled Across Hospitals | Hospital Median (IQR) | Rate Pooled Across Hospitals | Hospital Median (IQR) | Rate Pooled Across Hospitals | |
| ||||||
| Baseline | 2.90 (0.00‐6.14) | 3.97 | 2.14 (0.00‐6.09) | 3.43 | 3.49 (0.00‐7.04) | 4.36 |
| 3 Month | 3.12 (0.00‐8.40) | 4.46 | 3.01 (0.00‐9.11) | 4.22 | 3.32 (0.00‐8.25) | 4.62 |
| 6 Month | 3.40 (0.00‐7.53) | 4.97 | 2.72 (0.00‐7.09) | 4.81 | 4.61 (0.00‐9.37) | 5.10 |
| 9 Month | 1.49 (0.00‐4.87) | 2.99 | 0 (0.00‐3.94) | 2.51 | 2.27 (0.00‐6.27) | 3.36 |
| 12 Month | 2.67 (0.00‐4.60) | 4.39 | 2.67 (0.00‐4.47) | 3.82 | 2.66 (0.00‐4.82) | 4.95 |
| 15 Month | 3.06 (0.00‐5.10) | 4.03 | 2.40 (0.00‐3.94) | 3.57 | 3.65 (1.15‐6.57) | 4.45 |
| 18 Month | 2.52 (0.00‐7.45) | 4.61 | 2.93 (0.00‐7.63) | 5.02 | 2.06 (0.00‐6.59) | 4.31 |
The poststudy survey was completed by 27 of 31 (87%) of Collaborative group hospitals and 19 of the 29 (66%) Toolkit hospitals. Both groups reported QI improvement efforts to prevent CLABSI (Collaborative 97% vs. Toolkit 88%, P = 0.29) and VAP (Collaborative 97% vs. Toolkit 96%, P = 0.99). Eighty‐three percent of the Collaborative group implemented all components of the bloodstream infection prevention interventions compared with 64% for the Toolkit group (P = 0.13; Figure 1). The Collaborative group implemented daily catheter review more often than the Toolkit group (P = 0.04) and began the process implementation sooner following study implementation (P = 0.006 vs. Toolkit; see Supporting Information Figure). Eighty‐six percent of the Collaborative group implemented the complete VAP prevention interventions vs. 64% of the Toolkit group (P = 0.06; Figure 1) and the Collaborative group conducted the sedation vacation intervention more often (P = 0.03).
The Collaborative group participated in 57% of the seminars, whereas the Toolkit group participated in 39% (P = 0.014). Members of both groups attended more than half the clinical topics (Collaborative 64% vs. Toolkit 56%, P = 0.37). The Collaborative group had greater participation in the data and method topics (Collaborative 50% vs. Toolkit 22%, P < 0.001). The proportion of hospitals finding the seminars useful to their QI efforts was 49% for the Collaborative and 30% for the Toolkit group (P = 0.017). When restricted to hospitals that participated in the seminars, the usefulness rating was higher for both clinical (91% for the Collaborative and 86% for Toolkit) and Data/Methods (79% for Collaborative and 55% for Toolkit) topics.
A set of 14 tools were produced during the study period (Table 4); 9 clinically related tools (eg, checklists, algorithms, protocols, and flowsheets) and 5 data monitoring and quality improvement tools (eg, easy‐to‐use statistical process control spreadsheet templates, quality improvement tools, and computer tools). The Collaborative group downloaded a median of 10 tools and the Toolkit group a median of 7 (P = 0.051). The groups did not differ in their access to the clinical tools (P = 0.23) but the Collaborative group accessed a greater proportion of the data/methods tools (P = 0.004).
| Tool Access and Strategies | Collaborative Hospitalsa | Tool Kit Hospitalsa | P‐value |
|---|---|---|---|
| N = 36 ICUs | N = 25 ICUs | ||
| |||
| Clinical Tool Use | 61% | 49% | 0.23 |
| BSI Surveillance Guide | 22/36 (61%) | 13/25 (52%) | 0.60 |
| BSI Checklist | 31/36 (86%) | 16/25 (64%) | 0.06 |
| VAP Diagnosis Algorithm | 24/36 (67%) | 15/25 (60%) | 0.60 |
| Ventilator Weaning Protocol | 23/36 (64%) | 11/25 (44%) | 0.18 |
| VAP Surveillance Guide | 21/36 (58%) | 12/25 (48%) | 0.44 |
| VAP Daily Assessment | 17/36 (47%) | 6/25 (24%) | 0.10 |
| Ventilator Weaning Protocol (Flowsheet) | 15/36 (42%) | 11/25 (44%) | 0.99 |
| Data Tools | 56% | 30% | 0.004 |
| QI Implementation Tools | 19/36 (53%) | 6/25 (24%) | 0.03 |
| BSI Statistical Process Control | 23/36 (64%) | 5/25 (20%) | 0.001 |
| VAP Bundle | 23/36 (64%) | 11/25 (44%) | 0.18 |
| VAP Statistical Process Control | 21/36 (58%) | 3/25 (12%) | 0.001 |
| Strategies | 69% | 54% | 0.017 |
| Protocols for BSI | 24/36 (67%) | 19/25 (76%) | 0.57 |
| Protocols for VAP | 22/36 (61%) | 9/25 (36%) | 0.07 |
| Computer Documentation for BSI | 24/36 (67%) | 13/25 (52%) | 0.29 |
| Computer Documentation for VAP | 25/36 (69%) | 15/25 (60%) | 0.58 |
| Increased Staffing | 3/36 (8%) | 0/25 (0%) | 0.26 |
| Written Education for BSI | 31/36 (86%) | 19/25 (76%) | 0.33 |
| Written Education for VAP | 30/36 (83%) | 19/25 (76%) | 0.52 |
| Continuing Education Classes for BSI | 28/36 (78%) | 16/25 (64%) | 0.26 |
| Continuing Education Classes for VAP | 30/36 (83%) | 17/25 (68%) | 0.21 |
| QI teams | 27/36 (75%) | 14/25 (56%) | 0.16 |
| Provider Performance Feedback for BSI | 23/36 (64%) | 11/25 (44%) | 0.18 |
| Provider Performance Feedback for VAP | 24/36 (67%) | 11/25 (44%) | 0.11 |
| Implementation of BSI Checklist | 28/36 (78%) | 15/25 (60%) | 0.16 |
| Implementation of VAP Checklist | 31/36 (86%) | 13/25 (52%) | 0.007 |
Both groups relied primarily on implementation of protocols and informatics approaches (Table 4) without increasing staff levels. The predominant strategy was education; both groups provided written educational materials and classes to their providers. There was a trend for more Collaborative group members to implement QI teams (Table 4, P = 0.16 compared with the Toolkit group). Although the preponderance of both groups provided feedback reports to their hospital leaders and unit managers, Collaborative group hospitals showed a trend for providing feedback to front‐line providers (P = 0.11). With respect to self‐reported interventions, 78% of the Collaborative ICUs reported implementing a CLABSI checklist and 86% a VAP checklist, whereas only 60% of the Toolkit group reported implementation of a CLABSI checklist (P = 0.16) and 52% a VAP checklist (P = 0.007). Once a tool was implemented, both groups reported a high rate of sustaining the implementation (ranging from 86% to 100%). There also seemed to be a pattern of sequencing the interventions. Initial efforts tend to focus on provider education and evidence‐based protocols. Later efforts include more formal formation of QI teams followed by implementation of checklists. The evidence for sequencing of interventions is qualitative; we lacked subgroup sample size to substantiate these results with statistical analysis.
Discussion
In our investigation of Virtual Collaborative and Toolkit strategies for spreading the implementation of safe practices for CLABSI and VAP, ICUs in the Collaborative group had more complete implementation of the processes for prevention of hospital‐associated infections. Although both groups accessed clinical resources consistent with surveillance and clinical education, the Virtual Collaborative group attended to data and implementation methods more likely to lead to systemic CQI and organizational changes. ICUs that engaged these resources believed them useful in implementing QI, and more than 85% of the practices were sustained once integrated into routine care. Although the Collaborative ICUs were about 50% more likely to implement improvement strategies, these differences in implementation and process of care did not translate into group differences or longitudinal changes in infection rates.
In contrast to the context of our investigation, most published QI studies on health careassociated infection prevention report high baseline rates followed by a significant decline in infection rates.1419 The baseline infection rates in our study hospitals were actually below the endpoint found in many prior studies, suggesting that any marginal effects from our intervention would be more difficult to detect. Our study was implemented during the IHI's 100,000 Lives Campaign,20 a trend that may have brought about these lower baseline rates and thus a tighter margin for improvement.
The median CLABSI baseline rate in the well‐publicized Michigan hospital study was 2.7 per 1000 catheter days.21, 22 Although our baseline rate was similar (2.27 per 1000 catheter days), their reported postintervention rate was near zero, inferring nearly total elimination of the risk for CLABSI within 3‐18 months of study implementation. Several other studies using a collaborative approach have similarly reported high‐performance near‐zero results in reducing VAP23, 24 and CLABSI2528 rates. The difference between the present and previously published near‐zero result outcomes raises questions about collaboration‐based studies. We noticed 2 phenomena. First, there was slow uptake of data‐driven QI, and second, there was a differential uptake between general knowledge (clinical evidence and education) and QI implementation knowledge.29, 30
Lack of infrastructure to support data‐driven QI remains a significant barrier throughout the health care system, and teams in collaboratives often must work intensively toward improving their information systems' capability for the purpose of data‐driven decision support.1, 15, 31, 32 Systematic, standardized collection of CLABSI and VAP outcomes was initially lacking in many of our study hospitals,10 and our project expended early effort to deploy a system‐wide standardized infection control database registry.
Both of our study groups gravitated toward educational training and evidence‐based protocol decision‐support strategies. A focus only on established surveillance and education‐based fixes (eg, asking clinicians to follow a protocol within their existing care processes) have produced 32% to 57% reductions in health careacquired infections.3335 These early gains, however, are unlikely to produce the sustained near‐zero results that some collaborative teams have reported.22, 25
The ability to achieve sustained high‐performance results depends on organizational context and requires time.31 A potential benefit of collaboratives might be the return on investment attained by organizational change in quality and safety climate and its influence across the whole organization.19, 31, 36 Participants requiring systems training in the CQI process may not gain these benefits until well into their collaborative.31 For example, accumulating evidence demonstrates that the use of checklists can reduce errors of omission. Although a checklist seems a simple intervention, its effective implementation into routine care processes actually requires time for system redesign that addresses changes in multidisciplinary roles and responsibilities, frontline clinician and mid‐level management buy‐in, new methods of data collection and feedback, unanticipated involvement of ancillary services (eg, medical records, housekeeping), as well as changes to organizational policies, expectations, and priorities that connect silos of care and integrate hierarchical operations. Wall et al.37 and Pronovost and colleagues19, 21, 22, 25 highlighted the strategic effectiveness of embedding a checklist as a behavioral and data collection tool into frontline care process, leading to a redefined role of nursing, as well as new data for further cycles of improvement that collectively reduced infection rates. In our study, the Virtual Collaborative group did not have greater use of CLABSI and VAP checklists until the QI teams had been formed months into the project, consistent with the hypothesis that beneficial translation of desired changes in process of care to observed improvements in patient outcomes may take longer than 18 months to achieve19, 25, 27, 38 as opposed to the remarkable 3 months reported in the Keystone ICU project.21
Our study has several limitations. Our intervention did not mandate fixed specific components of intervention or QI methods. Each medical center was free to tailor its use of tools and change ideas, producing site variation in implementation methods and investment in support of QI. Like other multicomponent, multidimensional intervention studies, we were not able to test the effectiveness of particular QI components or the thoroughness of surveillance for CLABSI and VAP related to efforts to standardize the approach, and we did not have the resources to monitor the intensity with which participants approached QI. Furthermore, our data were dependent on self‐reports and were not verified by independent assessment of the fidelity with which the interventions were implemented, a checklist was embedded into usual care, or practices were enforced by nurses. In addition, the virtual collaborative circumvents the face‐to‐face learning sessions that might play a role in collaborative social networking, peer pressure, and acculturation.31, 36
Despite these limitations, we found that the Virtual Collaborative performed just like a Breakthrough Collaborative with a gradual uptake of implementation science using QI methods, team management, and statistical process control tools. The Toolkit condition had an even slower uptake. From an organization's perspective, the bottom‐line decision is whether a greater and meaningful proportion of collaborative participants will be successful to justify the investment of effort compared to a toolkit‐only approach. Our findings suggest that organizations engaged in change but lacking expertise in implementation science can potentially benefit from the acculturation, experiential learning, and uptake of QI provided by a collaborative.
In summary, although our Virtual Collaborative intervention was more likely to produce changes in ICU processes of care, there were no improvements in patient outcomes over this 18‐month study. The current popularity of evidence‐based guidelines, care protocols, prevention awareness, and surveillance may have produced a background of secular trend, making it difficult to ascertain effects of our QI intervention. Nonetheless, important lessons can be gleaned from this randomized controlled trial. Our study supports the proposition that as long as organizations vary in their capacity for and commitment to the science of QI and systems engineering, we should anticipate variation, uncertainty, and mixed results from short‐term, rapid cycle initiatives.27, 28, 31, 32, 39, 40 The untested, longer‐term benefit produced by a collaborative may be its stimulation of enduring systems engineering that optimizes an environment for QI of health care processes focused on desired outcomes.
Acknowledgements
The authors thank the Agency for Healthcare Research and Quality collaborative investigators for their work in this study: Xu Lei Liu, MS, at Vanderbilt; Laurie Brewer, RN MBA, Jason Hickok, Steve Horner, Susan Littleton, Patsy McFadden, RN BSN MPA CIC, Steve Mok, PharmD, Jonathan Perlin, MD PhD, Joan Reischel, RN BSN CCRN, and Sheri G. Chernestky Tejedor, MD, and all the HCA medical centers that participated in this project.
- ,,.Assessing the impact of continuous quality improvement on clinical practice: What it will take to accelerate progress.Milbank Q.1998;76:593–624.
- .Continuous improvement as an ideal in health care.N Engl J Med.1989;320:53–56.
- .A framework for collaborative improvement: Lessons from the Institute for Healthcare Improvement's Breakthrough Series.Qual Manag Health Care.1998;6(4):1–13.
- ,,,,,.Quality improvement learning collaboratives.Qual Manag Health Care.2005;14:234–237.
- ,,,.Using a virtual breakthrough series collaborative to improve access in primary care.Jt Comm J Qual Patient Saf.2006;32:573–584.
- ,,, et al.Taking the national guideline for care of acute myocardial infarction to the bedside: Developing the guideline applied in practice (GAP) initiative in Southeast Michigan.Jt Comm J Qual Improv.2002;28:5–19.
- ,.Priority Areas for National Action: Transforming Health Care Quality.Washington, DC:The National Academies Press;2003.
- ,,,.Optimal multivariate matching before randomization.Biostatistics.2004;5:263–275.
- Institute for Healthcare Improvement. The 100,000 lives campaign. http://www.ihi.org/IHI/Programs/Campaign.htm;2005.
- ,,, et al.Survey of infection control programs in a large, national healthcare system.Infect Control Hosp Epidemiol.2007;28:1401–1403.
- ,,,. Closing the quality gap: A critical analysis of quality improvement strategies, Volume 1‐Series overview and methodology. Technical Review 9 (Contract No 290–02‐0017 to the Stanford University‐UCSF Evidence‐based Practices Center), 2004. www.ahrq.gov/clinic/tp/qgap1tp.htm. Accessed November 11,2010.
- ,.Improving safety on the front lines: the role of clinical microsystems.Qual Saf Health Care.2002;11:45–50.
- ,,.SamplePower 2.0.Chicago, IL:SPSS Inc.;2001.
- ,,,.Eliminating nosocomial infections at Ascension Health.Jt Comm J Qual Patient Saf.2006;32:612–620.
- ,,, et al.An intensive care unit quality improvement collaborative in nine department of Veterans Affairs hospitals: reducing ventilator‐associated pneumonia and catheter‐related bloodstream infection rates.Jt Comm J Qual Patient Saf.2008;34:639–645.
- ,,, et al.Decreasing ventilator‐associated pneumonia in a trauma ICU.J Trauma.2006;61:122–130.
- ,,,,,.Use of corporate six sigma performance‐improvement strategies to reduce incidence of catheter‐related bloodstream infections in a surgical ICU.J Am Coll Surg.2005;201:349–358.
- ,,,,.Decline in ICU adverse events, nosocomial infections and cost through a quality improvement initiative focusing on teamwork and culture change.Qual Saf Health Care.2006;15:235–239.
- ,,,,,.Using a bundle approach to improve ventilator care processes and reduce ventilator‐associated pneumonia.Jt Comm J Qual Patient Saf.2005;31:243–248.
- ,,,.The 100000 lives campaign: Setting a goal and a deadline for improving health care quality.JAMA.2006;295:324–327.
- ,,.An intervention to decrease catheter‐related bloodstream infections in the ICU.N Engl J Med.2006;355:2725–2732.
- ,,, et al.Improving patient safety units in Michigan.J Crit Care.2008;23:207–221.
- .Toward a zero VAP rate: Personal and team approaches in the ICU.Crit Care Nurs Q.2006;29:108–114.
- ,,, et al.Implementing a ventilator bundle in a community hospital.Jt Comm J Qual Patient Saf.2007;33:219–225.
- ,,, et al.Eliminating catheter‐realted bloodstream infections in the intensive care unit.Crit Care Med.2004;32:2014–2020.
- .Innovative bundle wipes out catheter‐related bloodstream infections.Nursing.2008;38:17–18.
- ,,,,,.The CLABs collaborative: a regionwide effort to improve the quality of care in hospitals.Jt Comm J Qual Patient Saf.2008;34:713–723.
- ,,, et al.Evidence‐based practice to reduce central line infections.Jt Comm J Qual Patient Saf.2006;32:253–260.
- .Learning and improving in quality improvement collaboratives: which collaborative features do participants value most?Health Serv Res.2009;44(2 Pt 1):359–378.
- ,,, et al.Inside the health disparities collaboratives: a detailed exploration of quality improvement at community health centers.Med Care.2008;46:489–496.
- ,,, et al.Quality collaboratives: lessons from research.Qual Saf Health Care.2002;11:345–351.
- ,,, et al.Assessing the implementation of the chronic care model in quality improvement collaboratives.Health Serv Res.2005;40:978–996.
- ,.Prevention of ventilator‐associated pneumonia: Analysis of studies published since 2004.J Hosp Infect.2007;67:1–8.
- ,,,.Effect of comparative data feedback on intensive care unit infection rates in a Veterans Administration Hospital network system.Am J Infect Control.2003;31:397–404.
- ,,, et al.Reducing ventilator‐associated pneumonia rates through a staff education programme.J Hosp Infect.2004;57:223–227.
- ,,,.Does quality improvement implementation affect hospital quality of care?Hosp Top.2007;85:3–12.
- ,,,,,.Using real‐time process measurements to reduce catheter‐related bloodstream infections in the intensive care unit.Qual Saf Health Care.2005;14:295–302.
- ,,,,,.Prevention of ventilator‐associated pneumonia in the Calgary health region: a Canadian success story!Healthcare Qual.2008;11(3 Spec No):129–136.
- .Creating the evidence base for quality improvement collaboratives.Ann Intern Med.2004;140:897–901.
- ,,,,.Evidence for the impact of quality improvement collaboratives: systematic review.Br Med J.2008;336:1491–1494.
Copyright © 2011 Society of Hospital Medicine

Algorithms for Diagnosing and Treating VAP
Ventilator‐associated pneumonia (VAP) is a serious and common complication for patients in the intensive care unit (ICU).1 VAP is defined as a pulmonary infection occurring after hospital admission in a mechanically‐ventilated patient with a tracheostomy or endotracheal tube.2, 3 With an attributable mortality that may exceed 20% and an estimated cost of $5000‐$20,000 per episode,49 the management of VAP is an important issue for both patient safety and cost of care.
The diagnosis of VAP is a controversial topic in critical care, primarily because of the difficulty distinguishing between airway colonization, upper respiratory tract infection (eg, tracheobronchitis), and early‐onset pneumonia. Some clinicians insist that an invasive sampling technique (eg, bronchoalveolar lavage) with quantitative cultures is essential for determining the presence of VAP.10 However, other clinicians suggest that a noninvasive approach using qualitative cultures (eg, tracheal suctioning) is an acceptable alternative.11 Regardless, nearly all experts agree that a specimen for microbiologic culture should be obtained prior to initiating antibiotics. Subsequent therapy should then be adjusted according to culture results.
Studies from both Europe and North America have demonstrated considerable variation in the diagnostic approaches used for patients with suspected VAP.12, 13 This variation is likely a result of several factors including controversy about the best diagnostic approach, variation in clinician knowledge and experience, and variation in ICU management protocols. Such practice variability is common for many ICU behaviors.1416 Quality‐of‐care proponents view this variation as an important opportunity for improvement.17
During a recent national collaborative aimed at reducing health careassociated infections in the ICU, we discovered many participants were uncertain about how to diagnose and manage VAP, and considerable practice variability existed among participating hospitals. This uncertainty provided an important opportunity for developing consensus on VAP management. On the basis of diagnostic criteria outlined by the Centers for Disease Control and Prevention (CDC), we developed algorithms as tools for diagnosing VAP in 4 ICU populations: infant, pediatric, immunocompromised, and adult ICU patients. We also developed an algorithm for initial VAP treatment. An interdisciplinary team of experts reviewed the current literature and developed these evidence‐based consensus guidelines. Our intent is that the algorithms provide guidance to clinicians looking for a standardized approach to the diagnosis and management of this complicated clinical situation.
METHODS
Our primary goal was to develop practical algorithms that assist ICU clinicians in the diagnosis and management of VAP during daily practice. To improve the quality and credibility of these algorithms, the development process used a stepwise approach that included assembling an interdisciplinary team of experts, appraising the published evidence, and formulating the algorithms through a consensus process.18
AHRQ National Collaborative
We developed these diagnostic algorithms as part of a national collaborative effort aimed at reducing VAP and central venous catheterrelated bloodstream infections in the ICU. This effort was possible through a 2‐year Partnerships in Implementing Patient Safety grant funded by the Agency for Healthcare Research and Quality (AHRQ).19 The voluntary collaborative was conducted in 61 medical/surgical and children's hospitals across the Hospital Corporation of America (HCA), a company that owns and/or operates 173 hospitals and 107 freestanding surgery centers in 20 states, England, and Switzerland. HCA is one of the largest providers of health care in the United States. All participating hospitals had at least 1 ICU, and a total of 110 ICUs were included in the project. Most hospitals were in the southern or southeastern regions of the United States.
Interdisciplinary Team
We assembled an interdisciplinary team to develop the diagnostic algorithms. Individuals on the team represented the specialties of infectious diseases, infection control, anesthesia, critical care medicine, hospital medicine, critical care nursing, pharmacy, and biostatistics. The development phase occurred over 34 months and used an iterative process that consisted of both group conference calls and in‐person meetings.
Our goal was not to conduct a systematic review but rather to develop practical algorithms for collaborative participants in a timely manner. Our literature search strategy included MEDLINE and the Cochrane Library. We focused on articles that addressed key diagnostic issues, proposed an algorithm, or summarized a topic relevant to practicing clinicians. Extra attention was given to articles that were randomized trials, meta‐analyses, or systematic reviews. No explicit grading of articles was performed. We examined studies with outcomes of interest to clinicians, including mortality, number of ventilator days, length of stay, antibiotic utilization, and antibiotic resistance.
We screened potentially relevant articles and the references of these articles. The search results were reviewed by all members of the team, and an iterative consensus process was used to derive the current algorithms. Preliminary versions of the algorithms were shown to other AHRQ investigators and outside experts in the field, and additional modifications were made based on their feedback. The final algorithms were approved by all study investigators.
RESULTS
Literature Overview
Overall, there is an enormous body of published literature on diagnosing and managing VAP. The Medline database has listed more than 500 articles on VAP diagnosis in the past decade. Nonetheless, the best diagnostic approach remains unclear. The gold standard for diagnosing VAP is lung biopsy with histopathologic examination and tissue culture. However, this procedure is fraught with potential dangers and impractical for most critically ill patients.20 Therefore, practitioners traditionally combine their clinical suspicion (based on fever, leukocytosis, character of sputum, and radiographic changes), epidemiologic data (eg, patient demographics, medical history, and ICU infection surveillance data), and microbiologic data.
Several issues relevant to practicing clinicians deserve further mention.
Definition of VAP
Although early articles used variable criteria for diagnosing VAP, recent studies have traditionally defined VAP as an infection occurring more than 48 hours after hospital admission in a mechanically ventilated patient with a tracheostomy or endotracheal tube.2 In early 2007, the CDC revised their definition for diagnosing VAP.3 These latest criteria state there is no minimum period that the ventilator must be in place in order to diagnose VAP. This important change must be kept in mind when examining future studies.
The term VAP is more specific than the term health careassociated pneumonia. The latter encompasses patients residing in a nursing home or long‐term care facility; hospitalized in an acute care hospital for more than 48 hours in the past 90 days; receiving antibiotics, chemotherapy, or wound care within the past 30 days; or attending a hospital or hemodialysis clinic.
The CDC published detailed criteria for diagnosing VAP in its member hospitals (Tables 1 and 2).3 Because diagnosing VAP in infants, children, elderly, and immunocompromised patients is often confusing because of other conditions with similar signs and symptoms, the CDC published alternate criteria for these populations. A key objective during development of our algorithms was to consolidate and simplify these diagnostic criteria for ICU clinicians.
| Radiology | Signs/symptoms/laboratory |
|---|---|
| |
| Two or more serial chest radiographs with at least 1 of the following*: | CRITERIA FOR ANY PATIENT |
| New or progressive and persistent infiltrate | At least 1 of the following: |
| Consolidation | Fever (>38C or >100.4F) with no other recognized cause |
| Cavitation | Leukopenia (<4000 WBC/mm3) or leukocytosis (12,000 WBC/mm3) |
| Pneumatoceles, in infants 1 year old | For adults 70 years old, altered mental status with no other recognized causeand |
| Note: In patients without underlying pulmonary or cardiac disease (eg, respiratory distress syndrome, bronchopulmonary dysplasia, pulmonary edema, or chronic obstructive pulmonary disease), 1 definitive chest radiograph is acceptable.* | |
| At least 2 of the following: | |
| New onset of purulent sputum, or change in character of sputum, or increased respiratory secretions, or increased suctioning requirements | |
| New‐onset or worsening cough or dyspnea or tachypnea‖ | |
| Rales or bronchial breath sounds | |
| Worsening gas exchange (eg, O2 desaturation [eg, PaO2/FiO2 240],** increased oxygen requirement, or increased ventilation demand) | |
|
Any laboratory criterion from Table 2 |
|
| ALTERNATE CRITERIA FOR INFANTS 1 YEAR OLD | |
| Worsening gas exchange (eg, O2 desaturation, increased ventilation demand or O2 requirement) | |
| and | |
| At least 3 of the following: | |
| Temperature instability with no other recognized cause | |
| Leukopenia (<4000 WBC/mm3) or leukocytosis (15,000 WBC/mm3) and left shift (10% bands) | |
| New‐onset purulent sputum, change in character of sputum, increased respiratory secretions, or increased suctioning requirements | |
| Apnea, tachypnea,‖ nasal flaring with retraction of chest wall, or grunting | |
| Wheezing, rales, or rhonchi | |
| Cough | |
| Bradycadia (<100 beats/min) or tachycardia (>170 beats/min) | |
| ALTERNATE CRITERIA FOR CHILD >1 OR 12 YEARS OLD | |
| At least 3 of the following: | |
| Fever (>38.4C or >101.1F) or hypothermia (<36.5C or <97.7F) with no other recognized cause | |
| Leukopenia (<4000 WBC/mm3) or leukocytosis (15,000 WBC/mm3) | |
| New‐onset purulent sputum, change in character of sputum, increased respiratory secretions, or increased suctioning requirements | |
| New‐onset or worsening cough or dyspnea, apnea, or tachypnea‖ | |
| Rales or bronchial breath sounds | |
| Worsening gas exchange (eg, O2 desaturation <94%, increased ventilation demand or O2 requirement) | |
|
Any laboratory criterion from Table 2 |
|
| ALTERNATE CRITERIA FOR IMMUNOCOMPROMISED PATIENTS*** | |
| At least 1 of the following: | |
| Fever (>38.4C or >101.1F) with no other recognized cause | |
| For adults > 70 years old, altered mental status with no other recognized cause | |
| New‐onset purulent sputum, change in character of sputum, increased respiratory secretions, or increased suctioning requirements | |
| New‐onset or worsening cough, dyspnea, or tachypnea‖ | |
| Rales or bronchial breath sounds | |
| Worsening gas exchange (eg, O2 desaturation [eg, PaO2/FiO2 240],** increased oxygen requirement, or increased ventilation demand) | |
| Hemoptysis | |
| Pleuritic chest pain | |
| Matching positive blood and sputum cultures with Candida spp. | |
| Evidence of fungi or Pneumocytis from minimally contaminated LRT specimen (eg, BAL or protected specimen brushing) from 1 of the following: | |
| Direct microscopic exam | |
| Positive culture of fungi | |
|
Any laboratory criterion from Table 2 |
|
|
| Positive growth in blood culture* not related to another source of infection |
| Positive growth in culture of pleural fluid |
| Positive quantitative culture from minimally contaminated LRT specimen (eg, BAL) |
| 5% BAL‐obtained cells contain intracellular bacteria on direct microscopic exam (eg, gram stain) |
| Histopathologic exam shows at least 1 of the following: |
| Abscess formation or foci of consolidation with intense PMN accumulation in bronchioles and alveoli |
| Positive quantitative culture of lung parenchyma |
| Evidence of lung parenchyma invasion by fungal hyphae or pseudohyphae |
| Positive culture of virus or Chlamydia from respiratory secretions |
| Positive detection of viral antigen or antibody from respiratory secretions (eg, EIA, FAMA, shell vial assay, PCR) |
| Fourfold rise in paired sera (IgG) for pathogen (eg, influenza viruses, Chlamydia) |
| Positive PCR for Chlamydia or Mycoplasma |
| Positive micro‐IF test for Chlamydia |
| Positive culture or visualization by micro‐IF of Legionella spp. from respiratory secretions or tissue |
| Detection of Legionella pneumophila serogroup 1 antigens in urine by RIA or EIA |
| Fourfold rise in L. pneumophila serogroup 1 antibody titer to 1:128 in paired acute and convalescent sera by indirect IFA |
Etiology
The most commonly isolated VAP pathogens in all patients are bacteria.21 Most of these organisms normally colonize the respiratory and gastrointestinal tracts, but some are unique to health care settings. Tracheal intubation disrupts the body's natural anatomic and physiologic defenses and facilitates easier entry of these pathogens. Typical organisms include Staphylococcus aureus, Pseudomonas aeruginosa, Enterobacter species, Klebsiella pneumoniae, Acinetobacter species, Escherichia coli, and Haemophilus influenzae.22, 23 Unfortunately, the prevalence of antimicrobial resistance among VAP pathogens is increasing.24 Risk factors for antibiotic resistance are common to ICU patients and include recent antibiotics, hemodialysis, nursing home residence, immunosuppression, and chronic wound care.5 Polymicrobial infections are frequently seen in VAP, with up to 50% of all VAP episodes caused by more than 1 organism.25
Viral VAP is rare in immunocompetent hosts, and seasonal outbreaks of influenza and other similar viruses are usually limited to nonventilated patients.26 However, influenza is underrecognized as a potential nosocomial pathogen, and numerous nosocomial outbreaks because of influenza have been reported.2731 Although herpes simplex virus is often detected in the respiratory tract of critically ill patients, its clinical importance remains unclear.32
Fungal VAP is also rare in immunocompetent hosts. On the other hand, pulmonary fungal infections are common in immunocompromised patients, especially following chemotherapy and transplantation. Candida species are often isolated from the airways of normal hosts, but most cases traditionally have been considered clinically unimportant because these organisms are normal oropharyngeal flora and rarely invade lung tissue.33, 34 It is unclear whether recent studies suggesting Candida colonization is associated with a higher risk for Pseudomonas VAP will change this conventional wisdom.3537
Immunocompromised patients with suspected VAP are unique because they are at risk not only for typical bacteria (which are the most common causes of VAP) but also for rarer opportunistic infections and noninfectious processes that mimic pneumonia.3840 While assessing these patients, clinicians must consider the status of the underlying disease, duration and type of immunosuppression, prophylactic regimens, and risk factors for noninfectious causes of pulmonary infiltrates.41 Common opportunistic infections include viruses, mycobacteria, fungi, and Pneumocystis. Noninfectious processes include pulmonary edema, drug toxicity, radiation pneumonitis, engraftment syndrome, bronchiolitis obliterans organizing pneumonia, alveolar proteinosis, transfusion‐related lung injury, alveolar hemorrhage, and progression of underlying disease. In general, diagnosing VAP in the immunocompromised patient requires a prompt, comprehensive, and multidisciplinary approach.38
In preterm and term infants, the most common VAP pathogens are gram‐negative organisms such as E. coli and P. aeruginosa. Other less common pathogens are Enterobacter, Klebsiella, Acinetobacter, Proteus, Citrobacter, and Stenotrophomonas maltophilia.42, 43 Infants with a preceding bloodstream infection or prolonged intubation are more likely to develop VAP.43, 44 Unfortunately, gram‐negative bacteria often colonize the airways of mechanically ventilated infants, and tracheal aspirate culture data are difficult to interpret in this population.42
Children are more likely to develop VAP if they are intubated for more than 48 hours. The most common pathogens isolated from tracheal aspirates in mechanically ventilated children are enteric gram‐negative bacteria, P. aeruginosa, and S. aureus.45, 46 Few studies have precisely delineated the pathogenesis of VAP in the pediatric ICU population.
Overall, the causes of VAP vary by hospital, patient population, and ICU type. Therefore, it is essential that ICU clinicians remain knowledgeable about their local surveillance data.21 Awareness of VAP microbiology is essential for optimizing initial antibiotic therapy and improving outcomes.
Early Versus Late VAP
Distinguishing between early and late VAP is important for initial antibiotic selection because the etiologic pathogens vary between these 2 periods.4749 Early VAP (days 14 of hospitalization) usually involves antibiotic‐sensitive community‐acquired bacteria and carries a better prognosis. In contrast, late VAP (5 days after hospital admission) is more likely to be caused by antibiotic‐resistant nosocomial bacteria that lead to increased morbidity and mortality. All patients who have been hospitalized or have received antibiotics during the prior 90 days should be treated as having late VAP because they are at much higher risk for colonization and infection with antibiotic‐resistant bacteria.47 Of note, 2 recent studies suggest that pathogens in the early and late periods are becoming similar at some institutions.50, 51 Overall, the distinction between early and late VAP is important because it affects the likelihood that a patient has antibiotic‐resistant bacteria. If antibiotic‐resistant pathogens are suspected, initial therapy should include empiric triple antibiotics until culture data are available.
Culturing Approaches
Because clinical criteria alone are rarely able to accurately diagnose VAP,52, 53 clinicians should also obtain a respiratory specimen for microbiologic culture. Despite the convenience of blood cultures, their sensitivity for diagnosing VAP is poor, and they rarely make the diagnosis alone.54 Two methods are available for culturing the lungsan invasive approach (eg, bronchoscopy with bronchoalveolar lavage) and a noninvasive approach (eg, tracheal aspirate).
Some investigators believe that adult patients with suspected VAP should always undergo an invasive sampling of lower‐respiratory‐tract secretions.55 Proponents of the invasive approach cite the frequency with which potential pathogens colonize the trachea of ICU patients and create spurious results on tracheal aspirates.22 In addition, several studies have shown that clinicians are more likely to narrow the spectrum of antibiotics after obtaining an invasive diagnostic sample.56 In other words, the invasive approach has been associated with better antimicrobial stewardship.
Other investigators believe that a noninvasive approach is equally safe and effective for diagnosing VAP.57 This clinical approach involves culturing a tracheal aspirate and using a pneumonia prediction score such as the clinical pulmonary infection score (CPIS; Table 3). The CPIS assigns 012 points based on 6 clinical criteria: fever, leukocyte count, oxygenation, quantity and purulence of secretions, type of radiographic abnormality, and results of sputum gram stain and culture.58 As developed, a CPIS > 6 has a sensitivity of 93% and a specificity of 100% for diagnosing VAP.58 However, the CPIS requires that nurses record sputum volume and that the laboratory stains the specimen. When the CPIS has been modified based on the unavailability of such resources, the results have been less impressive.5961 Despite studies showing that a noninvasive clinical approach can achieve adequate initial antibiotic coverage and reduce overuse of broad‐spectrum agents,62, 63 clinicians who use the CPIS must understand its inherent limitations.
| Criterion | Range | Score |
|---|---|---|
| ||
| Temperature (C) | 36.138.4 | 0 |
| 38.538.9 | 1 | |
| 39 or 36 | 2 | |
| Blood leukocytes (/mm3) | 4000 and 11,000 | 0 |
| <4000 or >11,000 | 1 | |
| + band forms 500 | 2 | |
| Oxygenation: PaO2/FiO2 (mmHg) | >240 or ARDS | 0 |
| 240 and no evidence of ARDS | 2 | |
| Chest radiograph | No infiltrate | 0 |
| Diffuse (or patchy) infiltrate | 1 | |
| Localized infiltrate | 2 | |
| Tracheal secretions | Absence of tracheal secretions | 0 |
| Nonpurulent tracheal secretions | 1 | |
| Purulent tracheal secretions | 2 | |
| Culture of tracheal aspirate | Pathogenic bacteria culture: no growth or light growth | 0 |
| Pathogenic bacteria culture: moderate/heavy growth | 1 | |
| Same pathogenic bacteria seen on gram stain (add 1 point) | 2 | |
A meta‐analysis56 comparing the utility of an invasive versus a noninvasive culturing approach identified 4 randomized trials examining this issue.6669 Overall, an invasive approach did not alter mortality, but patients undergoing bronchoscopy were much more likely to have their antibiotic regimens modified by clinicians. This suggests that the invasive approach may allow more directed use of antibiotics. Recently, the Canadian Critical Care Trials Group conducted a multicenter randomized trial looking at this issue.11 There was no difference between the 2 approaches in mortality, number of ventilator days, and antibiotic usage. However, all patients in this study were immediately treated with empiric broad‐spectrum antibiotics until culture results were available, and the investigators did not have a protocol for stopping antibiotics after culture data were available.
In summary, both invasive and noninvasive culturing approaches are considered acceptable options for diagnosing VAP. Readers interested in learning more about this topic should read the worthwhile Expert Discussion70 by Chastre and colleagues55 at the end of this article. In general, we recommend that ICU clinicians use a combination of clinical suspicion (based on the CPIS or other objective data) and cultures ideally obtained prior to antibiotics. Regardless of the chosen culturing approach, clinicians must recognize that 1 of the most important determinants of patient outcome is prompt administration of adequate initial antibiotics.7175
Initial Antibiotic Administration
Delaying initial antibiotics in VAP increases the risk of death.7175 If a patient receives ineffective initial therapy, a later switch to appropriate therapy does not eliminate the increased mortality risk. Therefore, a comprehensive approach to VAP diagnosis requires consideration of initial empiric antibiotic administration.
Whenever possible, clinicians should obtain a lower respiratory tract sample for microscopy and culture before administering antibiotics because performing cultures after antibiotics have been recently started will lead to a higher rate of false‐negative results.76 Unless the patient has no signs of sepsis and microscopy is completely negative, clinicians should then immediately start empiric broad‐spectrum antibiotics.57 Once the culture sensitivities are known, therapy can be deescalated to a narrower spectrum.77 Recent studies suggest that shorter durations of therapy (8 days) are as effective as longer courses and are associated with lower colonization rates by antibiotic‐resistant bacteria.62, 78
Initial broad‐spectrum antibiotics should be chosen based on local bacteriology and resistance patterns. Clinicians must remain aware of the most common bacterial pathogens in their local community, hospital, and ICU. This is essential for both ensuring adequate initial antibiotic coverage and reducing overall antibiotic days.65 Unrestrained use of broad‐spectrum antibiotics increases the risk of resistant pathogens. Clinicians must continually deescalate therapy and use narrow‐spectrum drugs as pathogens are identified.79
Prevention of VAP
In 2005, the American Thoracic Society published guidelines for the management of adults with VAP.5 These guidelines included a discussion of modifiable risk factors for preventing VAP and used an evidence‐based grading system to rank the various recommendations. The highest evidence (level 1) comes from randomized clinical trials, moderate evidence (level 2) comes from nonrandomized studies, and the lowest evidence (level 3) comes from case studies or expert opinion. Others have also published their own guidelines and recommendations for preventing VAP.8082 Table 4 shows the key VAP preventive strategies.
| Strategy | Level of evidence | References |
|---|---|---|
| ||
| General infection control measures (hand hygiene, staff education, isolate MDR pathogens, etc.) | 1 | 2,83,84 |
| ICU infection surveillance | 2 | 2,8385 |
| Avoid reintubation if possible, but promptly reintubate if a patients inexorably fails extubation | 1 | 2,83,86,87 |
| Use NPPV when appropriate (in selected patients) | 1 | 88 |
| Use oral route for endotracheal and gastric tubes (vs. nasal route) | 2 | 89 |
| Continuous suctioning of subglottic secretions (to avoid pooling on cuff and leakage into LRT) | 1 | 9092 |
| Maintain endotracheal cuff pressure > 20 cm H2O (to prevent secretion leakage into LRT) | 2 | 93 |
| Avoid unnecessary ventilator circuit changes | 1 | 94 |
| Routinely empty condensate in ventilator circuit | 2 | 95 |
| Maintain adequate nursing and therapist staffing | 2 | 9698 |
| Implement ventilator weaning and sedation protocols | 2 | 99101 |
| Semierect patient positioning (vs. supine) | 1 | 102 |
| Avoid aspiration when using enteral nutrition | 1 | 103,104 |
| Topical oral antisepsis (eg, chlorhexidine) | 1 | 105108 |
| Control blood sugar with insulin | 1 | 109 |
| Use heat‐moisture exchanger (vs. conventional humidifier) to reduce tubing condensate | 1 | 95 |
| Avoid unnecessary red blood cell transfusions | 1 | 110 |
| Use of sucralfate for GI prophylaxis | 1 | 111,112 |
| Influenza vaccination for health care workers | 2 | 2 |
Some strategies are not recommended for VAP prevention in general ICU patients. Selective decontamination of the digestive tract (ie, prophylactic oral antibiotics) has been shown to reduce respiratory infections in ICU patients,113 but its overall role remains controversial because of concerns it may increase the incidence of multi‐drug‐resistant pathogens.114 Similarly, prophylactic intravenous antibiotics administered at the time of intubation can reduce VAP in certain patient populations,115 but this strategy is also associated with an increased risk of antibiotic‐resistant nosocomial infections.116 Using kinetic beds and scheduled chest physiotherapy to reduce VAP is based on the premise that critically ill patients often develop atelectasis and cannot effectively clear their secretions. Unfortunately, neither of these modalities has been shown to consistently reduce VAP in medical ICU patients.117119
Algorithms for Diagnosis and Treatment of VAP
We present algorithms for diagnosing VAP in 4 ICU populations: infant (1 year old), pediatric (1‐12 years old), immunocompromised, and adult ICU patients (Figs. 14). Because clinicians face considerable uncertainty when diagnosing VAP, we sought to develop practical algorithms for use in daily ICU practice. Although we provided the algorithms to collaborative participants as a tool for improving care, we never mandated use, and we did not monitor levels of adherence.
Five teaching cases are presented in the Appendix. We demonstrate how to utilize the diagnostic algorithms in these clinical scenarios and offer tips for clinicians wishing to employ these tools in their daily practice. These cases are useful for educating residents, nurses, and hospitalists.
Overall, our intent is that the combined use of these VAP algorithms facilitate a streamlined diagnostic approach and minimize delays in initial antibiotic administration. A primary focus of any VAP guideline should be early and appropriate antibiotics in adequate doses, with deescalation of therapy as culture data permit.5 In general, the greatest risk to a patient with VAP is delaying initial adequate antibiotic coverage, and for this reason, antibiotics must always be administered promptly. However, if culture data are negative, the clinician should consider withdrawing unnecessary antibiotics. For example, the absence of gram‐positive organisms on BAL after 72 hours would strongly suggest that MRSA is not playing a role and that vancomycin can be safely stopped. We agree with Neiderman that the decision point is not whether to start antibiotics, but whether to continue them at day 23.57
DISCUSSION
In this article, we introduce algorithms for diagnosing and managing VAP in infant, pediatric, immunocompromised, and adult ICU patients. We developed 4 algorithms because the hospitals in our system care for a wide range of patients. Our definitions for VAP were based on criteria outlined by the CDC because these rigorously developed criteria have been widely disseminated as components of the Institute for Healthcare Improvement's ventilator bundle.120 Clinicians should be able to easily incorporate these practical algorithms into their current practice.
The algorithms were developed during a collaborative across a large national health care system. We undertook this task because many clinicians were uncertain how to integrate the enormous volume of VAP literature into their daily practice, and we suspected there was large variation in practice in our ICUs. Recent studies from other health care systems provided empiric evidence to support this notion.12, 13
We offer these algorithms as practical tools to assist ICU clinicians and not as proscriptive mandates. We realize that the algorithms may need modification based on a hospital's unique bacteriology and patient populations. We also anticipate that the algorithms will adapt to future changes in VAP epidemiology, preventive strategies, emerging pathogens, and new antibiotics.
Numerous resources are available to learn more about VAP management. An excellent guideline from the Infectious Diseases Society of America and the American Thoracic Society discusses VAP issues in detail,5 although this guideline only focuses on immunocompetent adult patients. The journal Respiratory Care organized an international conference with numerous VAP experts in 2005 and subsequently devoted an entire issue to this topic.81 The Canadian Critical Care Trials Group and the Canadian Critical Care Society conducted systematic reviews and developed separate guidelines for the prevention, diagnosis, and treatment of VAP.80, 121
In summary, we present diagnostic and treatment algorithms for VAP. Our intent is that these algorithms may provide evidence‐based practical guidance to clinicians seeking a standardized approach to diagnosing and managing this challenging problem.
- ,,,.Nosocomial infections in combined medical‐surgical intensive care units in the United States.Infect Control Hosp Epidemiol.2000;21:510–515.
- Centers for Disease Control and Prevention.Guidelines for preventing health‐care—associated pneumonia, 2003: recommendations of CDC and the Healthcare Infection Control Practices Advisory Committee.MMWR Recomm Rep.2004;53:1–36.
- Centers for Disease Control and Prevention. The National Healthcare Safety Network (NHSN) manual: patient safety component protocol (updated May 24,2007). Available at: http://www.cdc.gov/ncidod/dhqp/pdf/nhsn/NHSN_Manual_Patient_Safety_Protocol052407.pdf. Accessed October 1, 2007.
- ,,, et al.Outcome and attributable cost of ventilator‐associated pneumonia among intensive care unit patients in a suburban medical center.Crit Care Med.2003;31:1312–1317.
- ATS.Guidelines for the management of adults with hospital‐acquired, ventilator‐associated, and healthcare‐associated pneumonia.Am J Respir Crit Care Med.2005;171:388–416.
- ,,,.Nosocomial pneumonia in Medicare patients. Hospital costs and reimbursement patterns under the prospective payment system.Arch Intern Med.1991;151:1109–1114.
- ,,,,,.Oral decontamination is cost‐saving in the prevention of ventilator‐associated pneumonia in intensive care units.Crit Care Med.2004;32:126–130.
- ,,,.Clinical and economic consequences of ventilator‐associated pneumonia: a systematic review.Crit Care Med.2005;33:2184–2193.
- .Cost‐effectiveness issues in ventilator‐associated pneumonia.Respir Care.2005;50:956–963; discussion 963–964.
- .Diagnosis and treatment of ventilator‐associated pneumonia: fiberoptic bronchoscopy with bronchoalveolar lavage is essential.Semin Respir Crit Care Med.2006;27:34–44.
- ,,,.A randomized trial of diagnostic techniques for ventilator‐associated pneumonia.N Engl J Med.2006;355:2619–2630.
- ,,, et al.Clinical characteristics and treatment patterns among patients with ventilator‐associated pneumonia.Chest.2006;129:1210–1218.
- ,,,.Prevention and diagnosis of ventilator‐associated pneumonia: a survey on current practices in Southern Spanish ICUs.Chest.2005;128:1667–1673.
- ,,, et al.Why don't physicians follow clinical practice guidelines? A framework for improvement.JAMA.1999;282:1458–1465.
- ,,,,,.Why do physicians not follow evidence‐based guidelines for preventing ventilator‐associated pneumonia?: a survey based on the opinions of an international panel of intensivists.Chest.2002;122:656–661.
- ,,, et al.Invitation to a dialogue between researchers and clinicians about evidence‐based behavioral medicine.Ann Behav Med.2005;30:125–137.
- ,,.Connections between quality measurement and improvement.Med Care.2003;41:I30–I38.
- ,,,,.Practice guidelines developed by specialty societies: the need for a critical appraisal.Lancet.2000;355:103–106.
- Agency for Healthcare Research and Quality (AHRQ). Partnerships in Implementing Patient Safety. Online at http://www.ahrq.gov/qual/pips.htm. Accessed March 1,2007.
- ,.The utility of open lung biopsy in patients requiring mechanical ventilation.Chest.1999;115:811–817.
- .The microbiology of ventilator‐associated pneumonia.Respir Care.2005;50:742–763; discussion 763–765.
- ,.Ventilator‐associated pneumonia.Am J Respir Crit Care Med.2002;165:867–903.
- ,.Overview of nosocomial infections caused by gram‐negative bacilli.Clin Infect Dis.2005;41:848–854.
- .Increasing prevalence of antimicrobial resistance in intensive care units.Crit Care Med.2001;29:N64–N68.
- ,,, et al.Incidence and outcome of polymicrobial ventilator‐associated pneumonia.Chest.2002;121:1618–1623.
- ,,.Nosocomial transmission of influenza.Occup Med (Lond).2002;52:249–253.
- ,.Nosocomial influenza at a Canadian pediatric hospital from 1995 to 1999: opportunities for prevention.Infect Control Hosp Epidemiol.2002;23:627–629.
- ,Nosocomial influenza infection as a cause of intercurrent fevers in infants.Pediatrics.1975;55:673–677.
- ,.Nosocomial influenza infection.Lancet.2000;355:1187.
- ,,.Nosocomial influenza B virus infection in the elderly.Ann Intern Med.1982;96:153–158.
- ,,,,,.Influenza vaccination of healthcare workers and vaccine allocation for healthcare workers during vaccine shortages.Infect Control Hosp Epidemiol.2005;26:882–890.
- ,,, et al.Herpes simplex virus in the respiratory tract of critical care patients: a prospective study.Lancet.2003;362:1536–1541.
- ,,, et al.Significance of the isolation of Candida species from respiratory samples in critically ill, non‐neutropenic patients. An immediate postmortem histologic study.Am J Respir Crit Care Med.1997;156:583–590.
- ,,,,,.The role of Candida sp isolated from bronchoscopic samples in nonneutropenic patients.Chest.1998;114:146– 149.
- ,.Pseudomonas‐Candida interactions: an ecological role for virulence factors.Science.2002;296:2229–2232.
- ,,, et al.Candida colonization of the respiratory tract and subsequent pseudomonas ventilator‐associated pneumonia.Chest.2006;129:110–117.
- ,,, et al.Impact of antifungal treatment on Candida‐Pseudomonas interaction: a preliminary retrospective case‐control study.Intensive Care Med.2007;33:137–142.
- ,,.Pulmonary infiltrates in the non‐HIV‐infected immunocompromised patient: etiologies, diagnostic strategies, and outcomes.Chest.2004;125:260–271.
- ,,.Pulmonary complications of solid organ and hematopoietic stem cell transplantation.Am J Respir Crit Care Med.2004;170:22–48.
- ,,, et al.Incidence, outcome, and risk factors of late‐onset noninfectious pulmonary complications after unrelated donor stem cell transplantation.Bone Marrow Transplant.2004;33:751–758.
- ,.Infection in organ‐transplant recipients.N Engl J Med.1998;338:1741–1751.
- ,,,,.Surveillance of ventilator‐associated pneumonia in very‐low‐birth‐weight infants.Am J Infect Control.2002;30:32–39.
- ,,,,.Ventilator‐associated pneumonia in extremely preterm neonates in a neonatal intensive care unit: characteristics, risk factors, and outcomes.Pediatrics.2003;112:1283–1289.
- ,,.Risk factors for nosocomial infection in a high‐risk nursery.Infect Control Hosp Epidemiol.2000;21:250–251.
- .Pediatric ventilator‐associated pneumonia.Pediatr Infect Dis J.2003;22:445–446.
- ,,.Ventilator‐associated pneumonia in pediatric intensive care unit patients: risk factors and outcomes.Pediatrics.2002;109:758–764.
- ,,, et al.Ventilator‐associated pneumonia caused by potentially drug‐resistant bacteria.Am J Respir Crit Care Med.1998;157:531–539.
- ,,.Pneumonia in intubated trauma patients. Microbiology and outcomes.Am J Respir Crit Care Med.1996;153:343–349.
- ,,,,.Pneumonia due to Haemophilus influenzae among mechanically ventilated patients. Incidence, outcome, and risk factors.Chest.1992;102:1562–1565.
- ,,, et al.Both early‐onset and late‐onset ventilator‐associated pneumonia are caused mainly by potentially multiresistant bacteria.Intensive Care Med2005;31:1488–1494.
- ,,,.A comparative analysis of patients with early‐onset vs late‐onset nosocomial pneumonia in the ICU setting.Chest.2000;117:1434–1442.
- .Diagnosis of ventilator‐associated pneumonia.Curr Opin Crit Care.2003;9:397–402.
- ,.Use and limitations of clinical and radiologic diagnosis of pneumonia.Semin Respir Infect.2003;18:72–79.
- ,,, et al.Blood cultures have limited value in predicting severity of illness and as a diagnostic tool in ventilator‐associated pneumonia.Chest.1999;116:1075–1084.
- ,,.The invasive (quantitative) diagnosis of ventilator‐associated pneumonia.Respir Care.2005;50:797–807.
- ,,,.Invasive approaches to the diagnosis of ventilator‐associated pneumonia: a meta‐analysis.Crit Care Med.2005;33:46– 53.
- .The clinical diagnosis of ventilator‐associated pneumonia.Respir Care.2005;50:788–796; discussion 807–812.
- ,,,,,.Diagnosis of ventilator‐associated pneumonia by bacteriologic analysis of bronchoscopic and nonbronchoscopic “blind” bronchoalveolar lavage fluid.Am Rev Respir Dis.1991;143:1121–1129.
- ,,,,,.Diagnosing pneumonia during mechanical ventilation: the clinical pulmonary infection score revisited.Am J Respir Crit Care Med.2003;168:173–179.
- ,,,,,.The diagnosis of ventilator‐associated pneumonia using non‐bronchoscopic, non‐directed lung lavages.Intensive Care Med.2000;26:20–30.
- ,,, et al.Clinical pulmonary infection score for ventilator‐associated pneumonia: accuracy and inter‐observer variability.Intensive Care Med.2004;30:217–224.
- ,,,.A randomized controlled trial of an antibiotic discontinuation policy for clinically suspected ventilator‐associated pneumonia.Chest.2004;125:1791–1799.
- ,,, et al.Early antibiotic treatment for BAL‐confirmed ventilator‐associated pneumonia: a role for routine endotracheal aspirate cultures.Chest.2005;127:589–597.
- ,,,,.Short‐course empiric antibiotic therapy for patients with pulmonary infiltrates in the intensive care unit. A proposed solution for indiscriminate antibiotic prescription.Am J Respir Crit Care Med.2000;162:505–511.
- ,,,,,.Experience with a clinical guideline for the treatment of ventilator‐associated pneumonia.Crit Care Med.2001;29:1109–1115.
- ,,, et al.Impact of invasive and noninvasive quantitative culture sampling on outcome of ventilator‐associated pneumonia: a pilot study.Am J Respir Crit Care Med.1998;157:371–376.
- ,,, et al.Noninvasive versus invasive microbial investigation in ventilator‐associated pneumonia: evaluation of outcome.Am J Respir Crit Care Med.2000;162:119–125.
- ,,,,.Impact of quantitative invasive diagnostic techniques in the management and outcome of mechanically ventilated patients with suspected pneumonia.Crit Care Med.2000;28:2737–2741.
- ,,, et al.Invasive and noninvasive strategies for management of suspected ventilator‐associated pneumonia. A randomized trial.Ann Intern Med.2000;132:621–630.
- ,,.Expert discussion: The invasive (quantitative) diagnosis of ventilator‐associated pneumonia.Respir Care.2005;50:807–812.
- ,,, et al.Impact of BAL data on the therapy and outcome of ventilator‐associated pneumonia.Chest.1997;111:676–685.
- ,,,.Impact of appropriateness of initial antibiotic therapy on the outcome of ventilator‐associated pneumonia.Intensive Care Med.2001;27:355–362.
- ,,,,.Clinical importance of delays in the initiation of appropriate antibiotic treatment for ventilator‐associated pneumonia.Chest.2002;122:262–268.
- ,,, et al.Appropriateness and delay to initiate therapy in ventilator‐associated pneumonia.Eur Respir J.2006;27:158–164.
- .The importance of appropriate initial antibiotic therapy for hospital‐acquired infections.Am J Med.2003;115:582–584.
- ,,, et al.Diagnostic accuracy of protected specimen brush and bronchoalveolar lavage in nosocomial pneumonia: impact of previous antimicrobial treatments.Crit Care Med.1998;26:236–244.
- ,,, et al.De‐escalation therapy in ventilator‐associated pneumonia.Crit Care Med.2004;32:2183–2190.
- ,,, et al.Comparison of 8 vs 15 days of antibiotic therapy for ventilator‐associated pneumonia in adults: a randomized trial.JAMA.2003;290:2588–2598.
- .De‐escalation therapy in ventilator‐associated pneumonia.Curr Opin Crit Care.2006;12:452–457.
- ,,, et al.Evidence‐based clinical practice guideline for the prevention of ventilator‐associated pneumonia.Ann Intern Med.2004;141:305–313.
- .Conference summary: ventilator‐associated pneumonia.Respir Care.2005;50:975–983.
- ,,.Prevention of ventilator‐associated pneumonia: an evidence‐based systematic review.Ann Intern Med.2003;138:494–501.
- .The prevention of ventilator‐associated pneumonia.N Engl J Med.1999;340:627–634.
- .Epidemiology and control of nosocomial infections in adult intensive care units.Am J Med.1991;91:179S–184S.
- ,,, et al.Effectiveness of a hospital‐wide programme to improve compliance with hand hygiene. Infection Control Programme.Lancet.2000;356:1307–1312.
- ,,, et al.Re‐intubation increases the risk of nosocomial pneumonia in patients needing mechanical ventilation.Am J Respir Crit Care Med.1995;152:137–41.
- ,,,,,.Nosocomial pneumonia. A multivariate analysis of risk and prognosis.Chest.1988;93:318–324.
- ,,, et al.Association of noninvasive ventilation with nosocomial infections and survival in critically ill patients.JAMA.2000;284:2361–2367.
- ,,, et al.Risk factors and clinical relevance of nosocomial maxillary sinusitis in the critically ill.Am J Respir Crit Care Med.1994;150:776–783.
- ,,.Prevention measures for ventilator‐associated pneumonia: a new focus on the endotracheal tube.Curr Opin Infect Dis.2007;20:190–197.
- ,,,.A randomized clinical trial of intermittent subglottic secretion drainage in patients receiving mechanical ventilation.Chest.2002;121:858–862.
- ,,, et al.Continuous aspiration of subglottic secretions in preventing ventilator‐associated pneumonia.Ann Intern Med.1995;122:179–186.
- ,,,,,.Pneumonia in intubated patients: role of respiratory airway care.Am J Respir Crit Care Med.1996;154:111–115.
- ,,, et al.Mechanical ventilation with or without 7‐day circuit changes. A randomized controlled trial.Ann Intern Med.1995;123:168–174.
- ,,.Contaminated condensate in mechanical ventilator circuits. A risk factor for nosocomial pneumonia?Am Rev Respir Dis.1984;129:625–628.
- ,,,,.Outbreak of Enterobacter cloacae related to understaffing, overcrowding, and poor hygiene practices.Infect Control Hosp. Epidemiol.1999;20:598–603.
- ,,,,.Nursing resources: a major determinant of nosocomial infection?Curr Opin Infect Dis.2004;17:329–333.
- ,,,,.Nurse‐staffing levels and the quality of care in hospitals.N Engl J Med.2002;346:1715–1722.
- ,,, et al.Effect on the duration of mechanical ventilation of identifying patients capable of breathing spontaneously.N Engl J Med.1996;335:1864–1869.
- ,,, et al.A randomized, controlled trial of protocol‐directed versus physician‐directed weaning from mechanical ventilation.Crit Care Med.1997;25:567–574.
- ,,,.Daily interruption of sedative infusions in critically ill patients undergoing mechanical ventilation.N Engl J Med.2000;342:1471–1477.
- ,,,,,.Supine body position as a risk factor for nosocomial pneumonia in mechanically ventilated patients: a randomised trial.Lancet.1999;354:1851–1858.
- ,,, et al.Early versus late enteral feeding of mechanically ventilated patients: results of a clinical trial.JPEN J Parenter Enteral Nutr.2002;26:174–181.
- ,,,.Optimizing the benefits and minimizing the risks of enteral nutrition in the critically ill: role of small bowel feeding.JPEN J Parenter Enteral Nutr.2002;26:S51–S55; discussion S56–S57.
- ,,,.Oral decontamination for prevention of pneumonia in mechanically ventilated adults: systematic review and meta‐analysis.BMJ.2007;334:889.
- ,.Topical chlorhexidine for prevention of ventilator‐associated pneumonia: a meta‐analysis.Crit Care Med.2007;35:595–602.
- ,,, et al.Oral decontamination with chlorhexidine reduces the incidence of ventilator‐associated pneumonia.Am J Respir Crit Care Med.2006;173:1348–1355.
- ,.Efficacy of oral chlorhexidine in preventing lower respiratory tract infections. Meta‐analysis of randomized controlled trials.J Hosp Infect.2007;66:207– 216.
- ,,, et al.Intensive insulin therapy in the critically ill patients.N Engl J Med.2001;345:1359–1367.
- ,,,.Red blood cell transfusion and ventilator‐associated pneumonia: A potential link?Crit Care Med.2004;32:666–674.
- ,,, et al.A comparison of sucralfate and ranitidine for the prevention of upper gastrointestinal bleeding in patients requiring mechanical ventilation. Canadian Critical Care Trials Group.N Engl J Med.1998;338:791–797.
- ,,, et al.Nosocomial pneumonia in intubated patients given sucralfate as compared with antacids or histamine type 2 blockers. The role of gastric colonization.N Engl J Med.1987;317:1376–1382.
- ,,,,.Antibiotic prophylaxis to reduce respiratory tract infections and mortality in adults receiving intensive care.Cochrane Database Syst Rev.2004:CD000022.
- ,.Selective decontamination of the digestive tract: cumulating evidence, at last?Semin Respir Crit Care Med.2006;27:18–22.
- ,,,,,.Protective effect of intravenously administered cefuroxime against nosocomial pneumonia in patients with structural coma.Am J Respir Crit Care Med.1997;155:1729–1734.
- ,,,,,.Prophylactic antibiotics adversely affect nosocomial pneumonia in trauma patients.J Trauma.2003;55:249–254.
- ,.Kinetic therapy in critically ill trauma patients.Clin Intensive Care.1992;3:248–252.
- ,,,,.Continuous oscillation: outcome in critically ill patients.JCrit Care.1995;10:97–103.
- ,,,.Kinetic bed therapy to prevent nosocomial pneumonia in mechanically ventilated patients: a systematic review and meta‐analysis.Crit Care.2006;10:R70.
- ,,,.The 100,000 lives campaign: setting a goal and a deadline for improving health care quality.JAMA.2006;295:324–327.
- Zap the VAP. Available at: http://www.zapthevap.com. Accessed March 1,2007.
- .Aspiration pneumonitis and aspiration pneumonia.N Engl J Med.2001;344:665–671.
Ventilator‐associated pneumonia (VAP) is a serious and common complication for patients in the intensive care unit (ICU).1 VAP is defined as a pulmonary infection occurring after hospital admission in a mechanically‐ventilated patient with a tracheostomy or endotracheal tube.2, 3 With an attributable mortality that may exceed 20% and an estimated cost of $5000‐$20,000 per episode,49 the management of VAP is an important issue for both patient safety and cost of care.
The diagnosis of VAP is a controversial topic in critical care, primarily because of the difficulty distinguishing between airway colonization, upper respiratory tract infection (eg, tracheobronchitis), and early‐onset pneumonia. Some clinicians insist that an invasive sampling technique (eg, bronchoalveolar lavage) with quantitative cultures is essential for determining the presence of VAP.10 However, other clinicians suggest that a noninvasive approach using qualitative cultures (eg, tracheal suctioning) is an acceptable alternative.11 Regardless, nearly all experts agree that a specimen for microbiologic culture should be obtained prior to initiating antibiotics. Subsequent therapy should then be adjusted according to culture results.
Studies from both Europe and North America have demonstrated considerable variation in the diagnostic approaches used for patients with suspected VAP.12, 13 This variation is likely a result of several factors including controversy about the best diagnostic approach, variation in clinician knowledge and experience, and variation in ICU management protocols. Such practice variability is common for many ICU behaviors.1416 Quality‐of‐care proponents view this variation as an important opportunity for improvement.17
During a recent national collaborative aimed at reducing health careassociated infections in the ICU, we discovered many participants were uncertain about how to diagnose and manage VAP, and considerable practice variability existed among participating hospitals. This uncertainty provided an important opportunity for developing consensus on VAP management. On the basis of diagnostic criteria outlined by the Centers for Disease Control and Prevention (CDC), we developed algorithms as tools for diagnosing VAP in 4 ICU populations: infant, pediatric, immunocompromised, and adult ICU patients. We also developed an algorithm for initial VAP treatment. An interdisciplinary team of experts reviewed the current literature and developed these evidence‐based consensus guidelines. Our intent is that the algorithms provide guidance to clinicians looking for a standardized approach to the diagnosis and management of this complicated clinical situation.
METHODS
Our primary goal was to develop practical algorithms that assist ICU clinicians in the diagnosis and management of VAP during daily practice. To improve the quality and credibility of these algorithms, the development process used a stepwise approach that included assembling an interdisciplinary team of experts, appraising the published evidence, and formulating the algorithms through a consensus process.18
AHRQ National Collaborative
We developed these diagnostic algorithms as part of a national collaborative effort aimed at reducing VAP and central venous catheterrelated bloodstream infections in the ICU. This effort was possible through a 2‐year Partnerships in Implementing Patient Safety grant funded by the Agency for Healthcare Research and Quality (AHRQ).19 The voluntary collaborative was conducted in 61 medical/surgical and children's hospitals across the Hospital Corporation of America (HCA), a company that owns and/or operates 173 hospitals and 107 freestanding surgery centers in 20 states, England, and Switzerland. HCA is one of the largest providers of health care in the United States. All participating hospitals had at least 1 ICU, and a total of 110 ICUs were included in the project. Most hospitals were in the southern or southeastern regions of the United States.
Interdisciplinary Team
We assembled an interdisciplinary team to develop the diagnostic algorithms. Individuals on the team represented the specialties of infectious diseases, infection control, anesthesia, critical care medicine, hospital medicine, critical care nursing, pharmacy, and biostatistics. The development phase occurred over 34 months and used an iterative process that consisted of both group conference calls and in‐person meetings.
Our goal was not to conduct a systematic review but rather to develop practical algorithms for collaborative participants in a timely manner. Our literature search strategy included MEDLINE and the Cochrane Library. We focused on articles that addressed key diagnostic issues, proposed an algorithm, or summarized a topic relevant to practicing clinicians. Extra attention was given to articles that were randomized trials, meta‐analyses, or systematic reviews. No explicit grading of articles was performed. We examined studies with outcomes of interest to clinicians, including mortality, number of ventilator days, length of stay, antibiotic utilization, and antibiotic resistance.
We screened potentially relevant articles and the references of these articles. The search results were reviewed by all members of the team, and an iterative consensus process was used to derive the current algorithms. Preliminary versions of the algorithms were shown to other AHRQ investigators and outside experts in the field, and additional modifications were made based on their feedback. The final algorithms were approved by all study investigators.
RESULTS
Literature Overview
Overall, there is an enormous body of published literature on diagnosing and managing VAP. The Medline database has listed more than 500 articles on VAP diagnosis in the past decade. Nonetheless, the best diagnostic approach remains unclear. The gold standard for diagnosing VAP is lung biopsy with histopathologic examination and tissue culture. However, this procedure is fraught with potential dangers and impractical for most critically ill patients.20 Therefore, practitioners traditionally combine their clinical suspicion (based on fever, leukocytosis, character of sputum, and radiographic changes), epidemiologic data (eg, patient demographics, medical history, and ICU infection surveillance data), and microbiologic data.
Several issues relevant to practicing clinicians deserve further mention.
Definition of VAP
Although early articles used variable criteria for diagnosing VAP, recent studies have traditionally defined VAP as an infection occurring more than 48 hours after hospital admission in a mechanically ventilated patient with a tracheostomy or endotracheal tube.2 In early 2007, the CDC revised their definition for diagnosing VAP.3 These latest criteria state there is no minimum period that the ventilator must be in place in order to diagnose VAP. This important change must be kept in mind when examining future studies.
The term VAP is more specific than the term health careassociated pneumonia. The latter encompasses patients residing in a nursing home or long‐term care facility; hospitalized in an acute care hospital for more than 48 hours in the past 90 days; receiving antibiotics, chemotherapy, or wound care within the past 30 days; or attending a hospital or hemodialysis clinic.
The CDC published detailed criteria for diagnosing VAP in its member hospitals (Tables 1 and 2).3 Because diagnosing VAP in infants, children, elderly, and immunocompromised patients is often confusing because of other conditions with similar signs and symptoms, the CDC published alternate criteria for these populations. A key objective during development of our algorithms was to consolidate and simplify these diagnostic criteria for ICU clinicians.
| Radiology | Signs/symptoms/laboratory |
|---|---|
| |
| Two or more serial chest radiographs with at least 1 of the following*: | CRITERIA FOR ANY PATIENT |
| New or progressive and persistent infiltrate | At least 1 of the following: |
| Consolidation | Fever (>38C or >100.4F) with no other recognized cause |
| Cavitation | Leukopenia (<4000 WBC/mm3) or leukocytosis (12,000 WBC/mm3) |
| Pneumatoceles, in infants 1 year old | For adults 70 years old, altered mental status with no other recognized causeand |
| Note: In patients without underlying pulmonary or cardiac disease (eg, respiratory distress syndrome, bronchopulmonary dysplasia, pulmonary edema, or chronic obstructive pulmonary disease), 1 definitive chest radiograph is acceptable.* | |
| At least 2 of the following: | |
| New onset of purulent sputum, or change in character of sputum, or increased respiratory secretions, or increased suctioning requirements | |
| New‐onset or worsening cough or dyspnea or tachypnea‖ | |
| Rales or bronchial breath sounds | |
| Worsening gas exchange (eg, O2 desaturation [eg, PaO2/FiO2 240],** increased oxygen requirement, or increased ventilation demand) | |
|
Any laboratory criterion from Table 2 |
|
| ALTERNATE CRITERIA FOR INFANTS 1 YEAR OLD | |
| Worsening gas exchange (eg, O2 desaturation, increased ventilation demand or O2 requirement) | |
| and | |
| At least 3 of the following: | |
| Temperature instability with no other recognized cause | |
| Leukopenia (<4000 WBC/mm3) or leukocytosis (15,000 WBC/mm3) and left shift (10% bands) | |
| New‐onset purulent sputum, change in character of sputum, increased respiratory secretions, or increased suctioning requirements | |
| Apnea, tachypnea,‖ nasal flaring with retraction of chest wall, or grunting | |
| Wheezing, rales, or rhonchi | |
| Cough | |
| Bradycadia (<100 beats/min) or tachycardia (>170 beats/min) | |
| ALTERNATE CRITERIA FOR CHILD >1 OR 12 YEARS OLD | |
| At least 3 of the following: | |
| Fever (>38.4C or >101.1F) or hypothermia (<36.5C or <97.7F) with no other recognized cause | |
| Leukopenia (<4000 WBC/mm3) or leukocytosis (15,000 WBC/mm3) | |
| New‐onset purulent sputum, change in character of sputum, increased respiratory secretions, or increased suctioning requirements | |
| New‐onset or worsening cough or dyspnea, apnea, or tachypnea‖ | |
| Rales or bronchial breath sounds | |
| Worsening gas exchange (eg, O2 desaturation <94%, increased ventilation demand or O2 requirement) | |
|
Any laboratory criterion from Table 2 |
|
| ALTERNATE CRITERIA FOR IMMUNOCOMPROMISED PATIENTS*** | |
| At least 1 of the following: | |
| Fever (>38.4C or >101.1F) with no other recognized cause | |
| For adults > 70 years old, altered mental status with no other recognized cause | |
| New‐onset purulent sputum, change in character of sputum, increased respiratory secretions, or increased suctioning requirements | |
| New‐onset or worsening cough, dyspnea, or tachypnea‖ | |
| Rales or bronchial breath sounds | |
| Worsening gas exchange (eg, O2 desaturation [eg, PaO2/FiO2 240],** increased oxygen requirement, or increased ventilation demand) | |
| Hemoptysis | |
| Pleuritic chest pain | |
| Matching positive blood and sputum cultures with Candida spp. | |
| Evidence of fungi or Pneumocytis from minimally contaminated LRT specimen (eg, BAL or protected specimen brushing) from 1 of the following: | |
| Direct microscopic exam | |
| Positive culture of fungi | |
|
Any laboratory criterion from Table 2 |
|
|
| Positive growth in blood culture* not related to another source of infection |
| Positive growth in culture of pleural fluid |
| Positive quantitative culture from minimally contaminated LRT specimen (eg, BAL) |
| 5% BAL‐obtained cells contain intracellular bacteria on direct microscopic exam (eg, gram stain) |
| Histopathologic exam shows at least 1 of the following: |
| Abscess formation or foci of consolidation with intense PMN accumulation in bronchioles and alveoli |
| Positive quantitative culture of lung parenchyma |
| Evidence of lung parenchyma invasion by fungal hyphae or pseudohyphae |
| Positive culture of virus or Chlamydia from respiratory secretions |
| Positive detection of viral antigen or antibody from respiratory secretions (eg, EIA, FAMA, shell vial assay, PCR) |
| Fourfold rise in paired sera (IgG) for pathogen (eg, influenza viruses, Chlamydia) |
| Positive PCR for Chlamydia or Mycoplasma |
| Positive micro‐IF test for Chlamydia |
| Positive culture or visualization by micro‐IF of Legionella spp. from respiratory secretions or tissue |
| Detection of Legionella pneumophila serogroup 1 antigens in urine by RIA or EIA |
| Fourfold rise in L. pneumophila serogroup 1 antibody titer to 1:128 in paired acute and convalescent sera by indirect IFA |
Etiology
The most commonly isolated VAP pathogens in all patients are bacteria.21 Most of these organisms normally colonize the respiratory and gastrointestinal tracts, but some are unique to health care settings. Tracheal intubation disrupts the body's natural anatomic and physiologic defenses and facilitates easier entry of these pathogens. Typical organisms include Staphylococcus aureus, Pseudomonas aeruginosa, Enterobacter species, Klebsiella pneumoniae, Acinetobacter species, Escherichia coli, and Haemophilus influenzae.22, 23 Unfortunately, the prevalence of antimicrobial resistance among VAP pathogens is increasing.24 Risk factors for antibiotic resistance are common to ICU patients and include recent antibiotics, hemodialysis, nursing home residence, immunosuppression, and chronic wound care.5 Polymicrobial infections are frequently seen in VAP, with up to 50% of all VAP episodes caused by more than 1 organism.25
Viral VAP is rare in immunocompetent hosts, and seasonal outbreaks of influenza and other similar viruses are usually limited to nonventilated patients.26 However, influenza is underrecognized as a potential nosocomial pathogen, and numerous nosocomial outbreaks because of influenza have been reported.2731 Although herpes simplex virus is often detected in the respiratory tract of critically ill patients, its clinical importance remains unclear.32
Fungal VAP is also rare in immunocompetent hosts. On the other hand, pulmonary fungal infections are common in immunocompromised patients, especially following chemotherapy and transplantation. Candida species are often isolated from the airways of normal hosts, but most cases traditionally have been considered clinically unimportant because these organisms are normal oropharyngeal flora and rarely invade lung tissue.33, 34 It is unclear whether recent studies suggesting Candida colonization is associated with a higher risk for Pseudomonas VAP will change this conventional wisdom.3537
Immunocompromised patients with suspected VAP are unique because they are at risk not only for typical bacteria (which are the most common causes of VAP) but also for rarer opportunistic infections and noninfectious processes that mimic pneumonia.3840 While assessing these patients, clinicians must consider the status of the underlying disease, duration and type of immunosuppression, prophylactic regimens, and risk factors for noninfectious causes of pulmonary infiltrates.41 Common opportunistic infections include viruses, mycobacteria, fungi, and Pneumocystis. Noninfectious processes include pulmonary edema, drug toxicity, radiation pneumonitis, engraftment syndrome, bronchiolitis obliterans organizing pneumonia, alveolar proteinosis, transfusion‐related lung injury, alveolar hemorrhage, and progression of underlying disease. In general, diagnosing VAP in the immunocompromised patient requires a prompt, comprehensive, and multidisciplinary approach.38
In preterm and term infants, the most common VAP pathogens are gram‐negative organisms such as E. coli and P. aeruginosa. Other less common pathogens are Enterobacter, Klebsiella, Acinetobacter, Proteus, Citrobacter, and Stenotrophomonas maltophilia.42, 43 Infants with a preceding bloodstream infection or prolonged intubation are more likely to develop VAP.43, 44 Unfortunately, gram‐negative bacteria often colonize the airways of mechanically ventilated infants, and tracheal aspirate culture data are difficult to interpret in this population.42
Children are more likely to develop VAP if they are intubated for more than 48 hours. The most common pathogens isolated from tracheal aspirates in mechanically ventilated children are enteric gram‐negative bacteria, P. aeruginosa, and S. aureus.45, 46 Few studies have precisely delineated the pathogenesis of VAP in the pediatric ICU population.
Overall, the causes of VAP vary by hospital, patient population, and ICU type. Therefore, it is essential that ICU clinicians remain knowledgeable about their local surveillance data.21 Awareness of VAP microbiology is essential for optimizing initial antibiotic therapy and improving outcomes.
Early Versus Late VAP
Distinguishing between early and late VAP is important for initial antibiotic selection because the etiologic pathogens vary between these 2 periods.4749 Early VAP (days 14 of hospitalization) usually involves antibiotic‐sensitive community‐acquired bacteria and carries a better prognosis. In contrast, late VAP (5 days after hospital admission) is more likely to be caused by antibiotic‐resistant nosocomial bacteria that lead to increased morbidity and mortality. All patients who have been hospitalized or have received antibiotics during the prior 90 days should be treated as having late VAP because they are at much higher risk for colonization and infection with antibiotic‐resistant bacteria.47 Of note, 2 recent studies suggest that pathogens in the early and late periods are becoming similar at some institutions.50, 51 Overall, the distinction between early and late VAP is important because it affects the likelihood that a patient has antibiotic‐resistant bacteria. If antibiotic‐resistant pathogens are suspected, initial therapy should include empiric triple antibiotics until culture data are available.
Culturing Approaches
Because clinical criteria alone are rarely able to accurately diagnose VAP,52, 53 clinicians should also obtain a respiratory specimen for microbiologic culture. Despite the convenience of blood cultures, their sensitivity for diagnosing VAP is poor, and they rarely make the diagnosis alone.54 Two methods are available for culturing the lungsan invasive approach (eg, bronchoscopy with bronchoalveolar lavage) and a noninvasive approach (eg, tracheal aspirate).
Some investigators believe that adult patients with suspected VAP should always undergo an invasive sampling of lower‐respiratory‐tract secretions.55 Proponents of the invasive approach cite the frequency with which potential pathogens colonize the trachea of ICU patients and create spurious results on tracheal aspirates.22 In addition, several studies have shown that clinicians are more likely to narrow the spectrum of antibiotics after obtaining an invasive diagnostic sample.56 In other words, the invasive approach has been associated with better antimicrobial stewardship.
Other investigators believe that a noninvasive approach is equally safe and effective for diagnosing VAP.57 This clinical approach involves culturing a tracheal aspirate and using a pneumonia prediction score such as the clinical pulmonary infection score (CPIS; Table 3). The CPIS assigns 012 points based on 6 clinical criteria: fever, leukocyte count, oxygenation, quantity and purulence of secretions, type of radiographic abnormality, and results of sputum gram stain and culture.58 As developed, a CPIS > 6 has a sensitivity of 93% and a specificity of 100% for diagnosing VAP.58 However, the CPIS requires that nurses record sputum volume and that the laboratory stains the specimen. When the CPIS has been modified based on the unavailability of such resources, the results have been less impressive.5961 Despite studies showing that a noninvasive clinical approach can achieve adequate initial antibiotic coverage and reduce overuse of broad‐spectrum agents,62, 63 clinicians who use the CPIS must understand its inherent limitations.
| Criterion | Range | Score |
|---|---|---|
| ||
| Temperature (C) | 36.138.4 | 0 |
| 38.538.9 | 1 | |
| 39 or 36 | 2 | |
| Blood leukocytes (/mm3) | 4000 and 11,000 | 0 |
| <4000 or >11,000 | 1 | |
| + band forms 500 | 2 | |
| Oxygenation: PaO2/FiO2 (mmHg) | >240 or ARDS | 0 |
| 240 and no evidence of ARDS | 2 | |
| Chest radiograph | No infiltrate | 0 |
| Diffuse (or patchy) infiltrate | 1 | |
| Localized infiltrate | 2 | |
| Tracheal secretions | Absence of tracheal secretions | 0 |
| Nonpurulent tracheal secretions | 1 | |
| Purulent tracheal secretions | 2 | |
| Culture of tracheal aspirate | Pathogenic bacteria culture: no growth or light growth | 0 |
| Pathogenic bacteria culture: moderate/heavy growth | 1 | |
| Same pathogenic bacteria seen on gram stain (add 1 point) | 2 | |
A meta‐analysis56 comparing the utility of an invasive versus a noninvasive culturing approach identified 4 randomized trials examining this issue.6669 Overall, an invasive approach did not alter mortality, but patients undergoing bronchoscopy were much more likely to have their antibiotic regimens modified by clinicians. This suggests that the invasive approach may allow more directed use of antibiotics. Recently, the Canadian Critical Care Trials Group conducted a multicenter randomized trial looking at this issue.11 There was no difference between the 2 approaches in mortality, number of ventilator days, and antibiotic usage. However, all patients in this study were immediately treated with empiric broad‐spectrum antibiotics until culture results were available, and the investigators did not have a protocol for stopping antibiotics after culture data were available.
In summary, both invasive and noninvasive culturing approaches are considered acceptable options for diagnosing VAP. Readers interested in learning more about this topic should read the worthwhile Expert Discussion70 by Chastre and colleagues55 at the end of this article. In general, we recommend that ICU clinicians use a combination of clinical suspicion (based on the CPIS or other objective data) and cultures ideally obtained prior to antibiotics. Regardless of the chosen culturing approach, clinicians must recognize that 1 of the most important determinants of patient outcome is prompt administration of adequate initial antibiotics.7175
Initial Antibiotic Administration
Delaying initial antibiotics in VAP increases the risk of death.7175 If a patient receives ineffective initial therapy, a later switch to appropriate therapy does not eliminate the increased mortality risk. Therefore, a comprehensive approach to VAP diagnosis requires consideration of initial empiric antibiotic administration.
Whenever possible, clinicians should obtain a lower respiratory tract sample for microscopy and culture before administering antibiotics because performing cultures after antibiotics have been recently started will lead to a higher rate of false‐negative results.76 Unless the patient has no signs of sepsis and microscopy is completely negative, clinicians should then immediately start empiric broad‐spectrum antibiotics.57 Once the culture sensitivities are known, therapy can be deescalated to a narrower spectrum.77 Recent studies suggest that shorter durations of therapy (8 days) are as effective as longer courses and are associated with lower colonization rates by antibiotic‐resistant bacteria.62, 78
Initial broad‐spectrum antibiotics should be chosen based on local bacteriology and resistance patterns. Clinicians must remain aware of the most common bacterial pathogens in their local community, hospital, and ICU. This is essential for both ensuring adequate initial antibiotic coverage and reducing overall antibiotic days.65 Unrestrained use of broad‐spectrum antibiotics increases the risk of resistant pathogens. Clinicians must continually deescalate therapy and use narrow‐spectrum drugs as pathogens are identified.79
Prevention of VAP
In 2005, the American Thoracic Society published guidelines for the management of adults with VAP.5 These guidelines included a discussion of modifiable risk factors for preventing VAP and used an evidence‐based grading system to rank the various recommendations. The highest evidence (level 1) comes from randomized clinical trials, moderate evidence (level 2) comes from nonrandomized studies, and the lowest evidence (level 3) comes from case studies or expert opinion. Others have also published their own guidelines and recommendations for preventing VAP.8082 Table 4 shows the key VAP preventive strategies.
| Strategy | Level of evidence | References |
|---|---|---|
| ||
| General infection control measures (hand hygiene, staff education, isolate MDR pathogens, etc.) | 1 | 2,83,84 |
| ICU infection surveillance | 2 | 2,8385 |
| Avoid reintubation if possible, but promptly reintubate if a patients inexorably fails extubation | 1 | 2,83,86,87 |
| Use NPPV when appropriate (in selected patients) | 1 | 88 |
| Use oral route for endotracheal and gastric tubes (vs. nasal route) | 2 | 89 |
| Continuous suctioning of subglottic secretions (to avoid pooling on cuff and leakage into LRT) | 1 | 9092 |
| Maintain endotracheal cuff pressure > 20 cm H2O (to prevent secretion leakage into LRT) | 2 | 93 |
| Avoid unnecessary ventilator circuit changes | 1 | 94 |
| Routinely empty condensate in ventilator circuit | 2 | 95 |
| Maintain adequate nursing and therapist staffing | 2 | 9698 |
| Implement ventilator weaning and sedation protocols | 2 | 99101 |
| Semierect patient positioning (vs. supine) | 1 | 102 |
| Avoid aspiration when using enteral nutrition | 1 | 103,104 |
| Topical oral antisepsis (eg, chlorhexidine) | 1 | 105108 |
| Control blood sugar with insulin | 1 | 109 |
| Use heat‐moisture exchanger (vs. conventional humidifier) to reduce tubing condensate | 1 | 95 |
| Avoid unnecessary red blood cell transfusions | 1 | 110 |
| Use of sucralfate for GI prophylaxis | 1 | 111,112 |
| Influenza vaccination for health care workers | 2 | 2 |
Some strategies are not recommended for VAP prevention in general ICU patients. Selective decontamination of the digestive tract (ie, prophylactic oral antibiotics) has been shown to reduce respiratory infections in ICU patients,113 but its overall role remains controversial because of concerns it may increase the incidence of multi‐drug‐resistant pathogens.114 Similarly, prophylactic intravenous antibiotics administered at the time of intubation can reduce VAP in certain patient populations,115 but this strategy is also associated with an increased risk of antibiotic‐resistant nosocomial infections.116 Using kinetic beds and scheduled chest physiotherapy to reduce VAP is based on the premise that critically ill patients often develop atelectasis and cannot effectively clear their secretions. Unfortunately, neither of these modalities has been shown to consistently reduce VAP in medical ICU patients.117119
Algorithms for Diagnosis and Treatment of VAP
We present algorithms for diagnosing VAP in 4 ICU populations: infant (1 year old), pediatric (1‐12 years old), immunocompromised, and adult ICU patients (Figs. 14). Because clinicians face considerable uncertainty when diagnosing VAP, we sought to develop practical algorithms for use in daily ICU practice. Although we provided the algorithms to collaborative participants as a tool for improving care, we never mandated use, and we did not monitor levels of adherence.
Five teaching cases are presented in the Appendix. We demonstrate how to utilize the diagnostic algorithms in these clinical scenarios and offer tips for clinicians wishing to employ these tools in their daily practice. These cases are useful for educating residents, nurses, and hospitalists.
Overall, our intent is that the combined use of these VAP algorithms facilitate a streamlined diagnostic approach and minimize delays in initial antibiotic administration. A primary focus of any VAP guideline should be early and appropriate antibiotics in adequate doses, with deescalation of therapy as culture data permit.5 In general, the greatest risk to a patient with VAP is delaying initial adequate antibiotic coverage, and for this reason, antibiotics must always be administered promptly. However, if culture data are negative, the clinician should consider withdrawing unnecessary antibiotics. For example, the absence of gram‐positive organisms on BAL after 72 hours would strongly suggest that MRSA is not playing a role and that vancomycin can be safely stopped. We agree with Neiderman that the decision point is not whether to start antibiotics, but whether to continue them at day 23.57
DISCUSSION
In this article, we introduce algorithms for diagnosing and managing VAP in infant, pediatric, immunocompromised, and adult ICU patients. We developed 4 algorithms because the hospitals in our system care for a wide range of patients. Our definitions for VAP were based on criteria outlined by the CDC because these rigorously developed criteria have been widely disseminated as components of the Institute for Healthcare Improvement's ventilator bundle.120 Clinicians should be able to easily incorporate these practical algorithms into their current practice.
The algorithms were developed during a collaborative across a large national health care system. We undertook this task because many clinicians were uncertain how to integrate the enormous volume of VAP literature into their daily practice, and we suspected there was large variation in practice in our ICUs. Recent studies from other health care systems provided empiric evidence to support this notion.12, 13
We offer these algorithms as practical tools to assist ICU clinicians and not as proscriptive mandates. We realize that the algorithms may need modification based on a hospital's unique bacteriology and patient populations. We also anticipate that the algorithms will adapt to future changes in VAP epidemiology, preventive strategies, emerging pathogens, and new antibiotics.
Numerous resources are available to learn more about VAP management. An excellent guideline from the Infectious Diseases Society of America and the American Thoracic Society discusses VAP issues in detail,5 although this guideline only focuses on immunocompetent adult patients. The journal Respiratory Care organized an international conference with numerous VAP experts in 2005 and subsequently devoted an entire issue to this topic.81 The Canadian Critical Care Trials Group and the Canadian Critical Care Society conducted systematic reviews and developed separate guidelines for the prevention, diagnosis, and treatment of VAP.80, 121
In summary, we present diagnostic and treatment algorithms for VAP. Our intent is that these algorithms may provide evidence‐based practical guidance to clinicians seeking a standardized approach to diagnosing and managing this challenging problem.
- ,,,.Nosocomial infections in combined medical‐surgical intensive care units in the United States.Infect Control Hosp Epidemiol.2000;21:510–515.
- Centers for Disease Control and Prevention.Guidelines for preventing health‐care—associated pneumonia, 2003: recommendations of CDC and the Healthcare Infection Control Practices Advisory Committee.MMWR Recomm Rep.2004;53:1–36.
- Centers for Disease Control and Prevention. The National Healthcare Safety Network (NHSN) manual: patient safety component protocol (updated May 24,2007). Available at: http://www.cdc.gov/ncidod/dhqp/pdf/nhsn/NHSN_Manual_Patient_Safety_Protocol052407.pdf. Accessed October 1, 2007.
- ,,, et al.Outcome and attributable cost of ventilator‐associated pneumonia among intensive care unit patients in a suburban medical center.Crit Care Med.2003;31:1312–1317.
- ATS.Guidelines for the management of adults with hospital‐acquired, ventilator‐associated, and healthcare‐associated pneumonia.Am J Respir Crit Care Med.2005;171:388–416.
- ,,,.Nosocomial pneumonia in Medicare patients. Hospital costs and reimbursement patterns under the prospective payment system.Arch Intern Med.1991;151:1109–1114.
- ,,,,,.Oral decontamination is cost‐saving in the prevention of ventilator‐associated pneumonia in intensive care units.Crit Care Med.2004;32:126–130.
- ,,,.Clinical and economic consequences of ventilator‐associated pneumonia: a systematic review.Crit Care Med.2005;33:2184–2193.
- .Cost‐effectiveness issues in ventilator‐associated pneumonia.Respir Care.2005;50:956–963; discussion 963–964.
- .Diagnosis and treatment of ventilator‐associated pneumonia: fiberoptic bronchoscopy with bronchoalveolar lavage is essential.Semin Respir Crit Care Med.2006;27:34–44.
- ,,,.A randomized trial of diagnostic techniques for ventilator‐associated pneumonia.N Engl J Med.2006;355:2619–2630.
- ,,, et al.Clinical characteristics and treatment patterns among patients with ventilator‐associated pneumonia.Chest.2006;129:1210–1218.
- ,,,.Prevention and diagnosis of ventilator‐associated pneumonia: a survey on current practices in Southern Spanish ICUs.Chest.2005;128:1667–1673.
- ,,, et al.Why don't physicians follow clinical practice guidelines? A framework for improvement.JAMA.1999;282:1458–1465.
- ,,,,,.Why do physicians not follow evidence‐based guidelines for preventing ventilator‐associated pneumonia?: a survey based on the opinions of an international panel of intensivists.Chest.2002;122:656–661.
- ,,, et al.Invitation to a dialogue between researchers and clinicians about evidence‐based behavioral medicine.Ann Behav Med.2005;30:125–137.
- ,,.Connections between quality measurement and improvement.Med Care.2003;41:I30–I38.
- ,,,,.Practice guidelines developed by specialty societies: the need for a critical appraisal.Lancet.2000;355:103–106.
- Agency for Healthcare Research and Quality (AHRQ). Partnerships in Implementing Patient Safety. Online at http://www.ahrq.gov/qual/pips.htm. Accessed March 1,2007.
- ,.The utility of open lung biopsy in patients requiring mechanical ventilation.Chest.1999;115:811–817.
- .The microbiology of ventilator‐associated pneumonia.Respir Care.2005;50:742–763; discussion 763–765.
- ,.Ventilator‐associated pneumonia.Am J Respir Crit Care Med.2002;165:867–903.
- ,.Overview of nosocomial infections caused by gram‐negative bacilli.Clin Infect Dis.2005;41:848–854.
- .Increasing prevalence of antimicrobial resistance in intensive care units.Crit Care Med.2001;29:N64–N68.
- ,,, et al.Incidence and outcome of polymicrobial ventilator‐associated pneumonia.Chest.2002;121:1618–1623.
- ,,.Nosocomial transmission of influenza.Occup Med (Lond).2002;52:249–253.
- ,.Nosocomial influenza at a Canadian pediatric hospital from 1995 to 1999: opportunities for prevention.Infect Control Hosp Epidemiol.2002;23:627–629.
- ,Nosocomial influenza infection as a cause of intercurrent fevers in infants.Pediatrics.1975;55:673–677.
- ,.Nosocomial influenza infection.Lancet.2000;355:1187.
- ,,.Nosocomial influenza B virus infection in the elderly.Ann Intern Med.1982;96:153–158.
- ,,,,,.Influenza vaccination of healthcare workers and vaccine allocation for healthcare workers during vaccine shortages.Infect Control Hosp Epidemiol.2005;26:882–890.
- ,,, et al.Herpes simplex virus in the respiratory tract of critical care patients: a prospective study.Lancet.2003;362:1536–1541.
- ,,, et al.Significance of the isolation of Candida species from respiratory samples in critically ill, non‐neutropenic patients. An immediate postmortem histologic study.Am J Respir Crit Care Med.1997;156:583–590.
- ,,,,,.The role of Candida sp isolated from bronchoscopic samples in nonneutropenic patients.Chest.1998;114:146– 149.
- ,.Pseudomonas‐Candida interactions: an ecological role for virulence factors.Science.2002;296:2229–2232.
- ,,, et al.Candida colonization of the respiratory tract and subsequent pseudomonas ventilator‐associated pneumonia.Chest.2006;129:110–117.
- ,,, et al.Impact of antifungal treatment on Candida‐Pseudomonas interaction: a preliminary retrospective case‐control study.Intensive Care Med.2007;33:137–142.
- ,,.Pulmonary infiltrates in the non‐HIV‐infected immunocompromised patient: etiologies, diagnostic strategies, and outcomes.Chest.2004;125:260–271.
- ,,.Pulmonary complications of solid organ and hematopoietic stem cell transplantation.Am J Respir Crit Care Med.2004;170:22–48.
- ,,, et al.Incidence, outcome, and risk factors of late‐onset noninfectious pulmonary complications after unrelated donor stem cell transplantation.Bone Marrow Transplant.2004;33:751–758.
- ,.Infection in organ‐transplant recipients.N Engl J Med.1998;338:1741–1751.
- ,,,,.Surveillance of ventilator‐associated pneumonia in very‐low‐birth‐weight infants.Am J Infect Control.2002;30:32–39.
- ,,,,.Ventilator‐associated pneumonia in extremely preterm neonates in a neonatal intensive care unit: characteristics, risk factors, and outcomes.Pediatrics.2003;112:1283–1289.
- ,,.Risk factors for nosocomial infection in a high‐risk nursery.Infect Control Hosp Epidemiol.2000;21:250–251.
- .Pediatric ventilator‐associated pneumonia.Pediatr Infect Dis J.2003;22:445–446.
- ,,.Ventilator‐associated pneumonia in pediatric intensive care unit patients: risk factors and outcomes.Pediatrics.2002;109:758–764.
- ,,, et al.Ventilator‐associated pneumonia caused by potentially drug‐resistant bacteria.Am J Respir Crit Care Med.1998;157:531–539.
- ,,.Pneumonia in intubated trauma patients. Microbiology and outcomes.Am J Respir Crit Care Med.1996;153:343–349.
- ,,,,.Pneumonia due to Haemophilus influenzae among mechanically ventilated patients. Incidence, outcome, and risk factors.Chest.1992;102:1562–1565.
- ,,, et al.Both early‐onset and late‐onset ventilator‐associated pneumonia are caused mainly by potentially multiresistant bacteria.Intensive Care Med2005;31:1488–1494.
- ,,,.A comparative analysis of patients with early‐onset vs late‐onset nosocomial pneumonia in the ICU setting.Chest.2000;117:1434–1442.
- .Diagnosis of ventilator‐associated pneumonia.Curr Opin Crit Care.2003;9:397–402.
- ,.Use and limitations of clinical and radiologic diagnosis of pneumonia.Semin Respir Infect.2003;18:72–79.
- ,,, et al.Blood cultures have limited value in predicting severity of illness and as a diagnostic tool in ventilator‐associated pneumonia.Chest.1999;116:1075–1084.
- ,,.The invasive (quantitative) diagnosis of ventilator‐associated pneumonia.Respir Care.2005;50:797–807.
- ,,,.Invasive approaches to the diagnosis of ventilator‐associated pneumonia: a meta‐analysis.Crit Care Med.2005;33:46– 53.
- .The clinical diagnosis of ventilator‐associated pneumonia.Respir Care.2005;50:788–796; discussion 807–812.
- ,,,,,.Diagnosis of ventilator‐associated pneumonia by bacteriologic analysis of bronchoscopic and nonbronchoscopic “blind” bronchoalveolar lavage fluid.Am Rev Respir Dis.1991;143:1121–1129.
- ,,,,,.Diagnosing pneumonia during mechanical ventilation: the clinical pulmonary infection score revisited.Am J Respir Crit Care Med.2003;168:173–179.
- ,,,,,.The diagnosis of ventilator‐associated pneumonia using non‐bronchoscopic, non‐directed lung lavages.Intensive Care Med.2000;26:20–30.
- ,,, et al.Clinical pulmonary infection score for ventilator‐associated pneumonia: accuracy and inter‐observer variability.Intensive Care Med.2004;30:217–224.
- ,,,.A randomized controlled trial of an antibiotic discontinuation policy for clinically suspected ventilator‐associated pneumonia.Chest.2004;125:1791–1799.
- ,,, et al.Early antibiotic treatment for BAL‐confirmed ventilator‐associated pneumonia: a role for routine endotracheal aspirate cultures.Chest.2005;127:589–597.
- ,,,,.Short‐course empiric antibiotic therapy for patients with pulmonary infiltrates in the intensive care unit. A proposed solution for indiscriminate antibiotic prescription.Am J Respir Crit Care Med.2000;162:505–511.
- ,,,,,.Experience with a clinical guideline for the treatment of ventilator‐associated pneumonia.Crit Care Med.2001;29:1109–1115.
- ,,, et al.Impact of invasive and noninvasive quantitative culture sampling on outcome of ventilator‐associated pneumonia: a pilot study.Am J Respir Crit Care Med.1998;157:371–376.
- ,,, et al.Noninvasive versus invasive microbial investigation in ventilator‐associated pneumonia: evaluation of outcome.Am J Respir Crit Care Med.2000;162:119–125.
- ,,,,.Impact of quantitative invasive diagnostic techniques in the management and outcome of mechanically ventilated patients with suspected pneumonia.Crit Care Med.2000;28:2737–2741.
- ,,, et al.Invasive and noninvasive strategies for management of suspected ventilator‐associated pneumonia. A randomized trial.Ann Intern Med.2000;132:621–630.
- ,,.Expert discussion: The invasive (quantitative) diagnosis of ventilator‐associated pneumonia.Respir Care.2005;50:807–812.
- ,,, et al.Impact of BAL data on the therapy and outcome of ventilator‐associated pneumonia.Chest.1997;111:676–685.
- ,,,.Impact of appropriateness of initial antibiotic therapy on the outcome of ventilator‐associated pneumonia.Intensive Care Med.2001;27:355–362.
- ,,,,.Clinical importance of delays in the initiation of appropriate antibiotic treatment for ventilator‐associated pneumonia.Chest.2002;122:262–268.
- ,,, et al.Appropriateness and delay to initiate therapy in ventilator‐associated pneumonia.Eur Respir J.2006;27:158–164.
- .The importance of appropriate initial antibiotic therapy for hospital‐acquired infections.Am J Med.2003;115:582–584.
- ,,, et al.Diagnostic accuracy of protected specimen brush and bronchoalveolar lavage in nosocomial pneumonia: impact of previous antimicrobial treatments.Crit Care Med.1998;26:236–244.
- ,,, et al.De‐escalation therapy in ventilator‐associated pneumonia.Crit Care Med.2004;32:2183–2190.
- ,,, et al.Comparison of 8 vs 15 days of antibiotic therapy for ventilator‐associated pneumonia in adults: a randomized trial.JAMA.2003;290:2588–2598.
- .De‐escalation therapy in ventilator‐associated pneumonia.Curr Opin Crit Care.2006;12:452–457.
- ,,, et al.Evidence‐based clinical practice guideline for the prevention of ventilator‐associated pneumonia.Ann Intern Med.2004;141:305–313.
- .Conference summary: ventilator‐associated pneumonia.Respir Care.2005;50:975–983.
- ,,.Prevention of ventilator‐associated pneumonia: an evidence‐based systematic review.Ann Intern Med.2003;138:494–501.
- .The prevention of ventilator‐associated pneumonia.N Engl J Med.1999;340:627–634.
- .Epidemiology and control of nosocomial infections in adult intensive care units.Am J Med.1991;91:179S–184S.
- ,,, et al.Effectiveness of a hospital‐wide programme to improve compliance with hand hygiene. Infection Control Programme.Lancet.2000;356:1307–1312.
- ,,, et al.Re‐intubation increases the risk of nosocomial pneumonia in patients needing mechanical ventilation.Am J Respir Crit Care Med.1995;152:137–41.
- ,,,,,.Nosocomial pneumonia. A multivariate analysis of risk and prognosis.Chest.1988;93:318–324.
- ,,, et al.Association of noninvasive ventilation with nosocomial infections and survival in critically ill patients.JAMA.2000;284:2361–2367.
- ,,, et al.Risk factors and clinical relevance of nosocomial maxillary sinusitis in the critically ill.Am J Respir Crit Care Med.1994;150:776–783.
- ,,.Prevention measures for ventilator‐associated pneumonia: a new focus on the endotracheal tube.Curr Opin Infect Dis.2007;20:190–197.
- ,,,.A randomized clinical trial of intermittent subglottic secretion drainage in patients receiving mechanical ventilation.Chest.2002;121:858–862.
- ,,, et al.Continuous aspiration of subglottic secretions in preventing ventilator‐associated pneumonia.Ann Intern Med.1995;122:179–186.
- ,,,,,.Pneumonia in intubated patients: role of respiratory airway care.Am J Respir Crit Care Med.1996;154:111–115.
- ,,, et al.Mechanical ventilation with or without 7‐day circuit changes. A randomized controlled trial.Ann Intern Med.1995;123:168–174.
- ,,.Contaminated condensate in mechanical ventilator circuits. A risk factor for nosocomial pneumonia?Am Rev Respir Dis.1984;129:625–628.
- ,,,,.Outbreak of Enterobacter cloacae related to understaffing, overcrowding, and poor hygiene practices.Infect Control Hosp. Epidemiol.1999;20:598–603.
- ,,,,.Nursing resources: a major determinant of nosocomial infection?Curr Opin Infect Dis.2004;17:329–333.
- ,,,,.Nurse‐staffing levels and the quality of care in hospitals.N Engl J Med.2002;346:1715–1722.
- ,,, et al.Effect on the duration of mechanical ventilation of identifying patients capable of breathing spontaneously.N Engl J Med.1996;335:1864–1869.
- ,,, et al.A randomized, controlled trial of protocol‐directed versus physician‐directed weaning from mechanical ventilation.Crit Care Med.1997;25:567–574.
- ,,,.Daily interruption of sedative infusions in critically ill patients undergoing mechanical ventilation.N Engl J Med.2000;342:1471–1477.
- ,,,,,.Supine body position as a risk factor for nosocomial pneumonia in mechanically ventilated patients: a randomised trial.Lancet.1999;354:1851–1858.
- ,,, et al.Early versus late enteral feeding of mechanically ventilated patients: results of a clinical trial.JPEN J Parenter Enteral Nutr.2002;26:174–181.
- ,,,.Optimizing the benefits and minimizing the risks of enteral nutrition in the critically ill: role of small bowel feeding.JPEN J Parenter Enteral Nutr.2002;26:S51–S55; discussion S56–S57.
- ,,,.Oral decontamination for prevention of pneumonia in mechanically ventilated adults: systematic review and meta‐analysis.BMJ.2007;334:889.
- ,.Topical chlorhexidine for prevention of ventilator‐associated pneumonia: a meta‐analysis.Crit Care Med.2007;35:595–602.
- ,,, et al.Oral decontamination with chlorhexidine reduces the incidence of ventilator‐associated pneumonia.Am J Respir Crit Care Med.2006;173:1348–1355.
- ,.Efficacy of oral chlorhexidine in preventing lower respiratory tract infections. Meta‐analysis of randomized controlled trials.J Hosp Infect.2007;66:207– 216.
- ,,, et al.Intensive insulin therapy in the critically ill patients.N Engl J Med.2001;345:1359–1367.
- ,,,.Red blood cell transfusion and ventilator‐associated pneumonia: A potential link?Crit Care Med.2004;32:666–674.
- ,,, et al.A comparison of sucralfate and ranitidine for the prevention of upper gastrointestinal bleeding in patients requiring mechanical ventilation. Canadian Critical Care Trials Group.N Engl J Med.1998;338:791–797.
- ,,, et al.Nosocomial pneumonia in intubated patients given sucralfate as compared with antacids or histamine type 2 blockers. The role of gastric colonization.N Engl J Med.1987;317:1376–1382.
- ,,,,.Antibiotic prophylaxis to reduce respiratory tract infections and mortality in adults receiving intensive care.Cochrane Database Syst Rev.2004:CD000022.
- ,.Selective decontamination of the digestive tract: cumulating evidence, at last?Semin Respir Crit Care Med.2006;27:18–22.
- ,,,,,.Protective effect of intravenously administered cefuroxime against nosocomial pneumonia in patients with structural coma.Am J Respir Crit Care Med.1997;155:1729–1734.
- ,,,,,.Prophylactic antibiotics adversely affect nosocomial pneumonia in trauma patients.J Trauma.2003;55:249–254.
- ,.Kinetic therapy in critically ill trauma patients.Clin Intensive Care.1992;3:248–252.
- ,,,,.Continuous oscillation: outcome in critically ill patients.JCrit Care.1995;10:97–103.
- ,,,.Kinetic bed therapy to prevent nosocomial pneumonia in mechanically ventilated patients: a systematic review and meta‐analysis.Crit Care.2006;10:R70.
- ,,,.The 100,000 lives campaign: setting a goal and a deadline for improving health care quality.JAMA.2006;295:324–327.
- Zap the VAP. Available at: http://www.zapthevap.com. Accessed March 1,2007.
- .Aspiration pneumonitis and aspiration pneumonia.N Engl J Med.2001;344:665–671.