User login
In recent years, US hospitals have focused on decreasing readmission rates, incented by reimbursement penalties to hospitals having excessive readmissions.[1] Gaps in the quality of care provided during transitions likely contribute to preventable readmissions.[2] One compelling quality assessment in this setting is measuring patients' discharge preparedness, using key dimensions such as understanding their instructions for medication use and follow‐up. Patient‐reported preparedness for discharge may also be useful to identify risk of readmission.
Several patient‐reported measures of preparedness for discharge exist, and herein we describe 2 measures of interest. First, the Brief‐PREPARED (B‐PREPARED) measure was derived from the longer PREPARED instrument (Prescriptions, Ready to re‐enter community, Education, Placement, Assurance of safety, Realistic expectations, Empowerment, Directed to appropriate services), which reflects the patient's perceived needs at discharge. In previous research, the B‐PREPARED measure predicted emergency department (ED) visits for patients who had been recently hospitalized and had a high risk for readmission.[3] Second, the Care Transitions Measure‐3 (CTM‐3) was developed by Coleman et al. as a patient‐reported measure to discriminate between patients who were more likely to have an ED visit or readmission from those who did not. CTM‐3 has also been used to evaluate hospitals' level of care coordination and for public reporting purposes.[4, 5, 6] It has been endorsed by the National Quality Forum and incorporated into the Hospital Consumer Assessment of Healthcare Providers and Systems (HCAHPS) survey provided to samples of recently hospitalized US patients.[7] However, recent evidence from an inpatient cohort of cardiovascular patients suggests the CTM‐3 overinflates care transition scores compared to the longer 15‐item CTM. In that cohort, the CTM‐3 could not differentiate between patients who did or did not have repeat ED visits or readmission.[8] Thus far, the B‐PREPARED and CTM‐3 measures have not been compared to one another directly.
In addition to the development of patient‐reported measures, hospitals increasingly employ administrative algorithms to predict likelihood of readmission.[9] A commonly used measure is the LACE index (Length of stay, Acuity, Comorbidity, and Emergency department use).[10] The LACE index predicted readmission and death within 30 days of discharge in a large cohort in Canada. In 2 retrospective studies of recently hospitalized patients in the United States, the LACE index's ability to discriminate between patients readmitted or not ranged from slightly better than chance to moderate (C statistic 0.56‐0.77).[11, 12]
It is unknown whether adding patient‐reported preparedness measures to commonly used readmission prediction scores increases the ability to predict readmission risk. We sought to determine whether the B‐PREPARED and CTM‐3 measures were predictive of readmission or death, as compared to the LACE index, in a large cohort of cardiovascular patients. In addition, we sought to determine the additional predictive and discriminative ability gained from administering the B‐PREPARED and CTM‐3 measures, while adjusting for the LACE index and other clinical factors. We hypothesized that: (1) higher preparedness scores on both measures would predict lower risk of readmission or death in a cohort of patients hospitalized with cardiac diagnoses; and (2) because it provides more specific and actionable information, the B‐PREPARED would discriminate readmission more accurately than CTM‐3, after controlling for clinical factors.
METHODS
Study Setting and Design
The Vanderbilt Inpatient Cohort Study (VICS) is a prospective study of patients admitted with cardiovascular disease to Vanderbilt University Hospital. The purpose of VICS is to investigate the impact of patient and social factors on postdischarge health outcomes such as quality of life, unplanned hospital utilization, and mortality. The rationale and design of VICS are detailed elsewhere.[13] Briefly, participants completed a baseline interview while hospitalized, and follow‐up phone calls were conducted within 2 to 9 days and at approximately 30 and 90 days postdischarge. During the first follow‐up call conducted by research assistants, we collected preparedness for discharge data utilizing the 2 measures described below. After the 90‐day phone call, we collected healthcare utilization since the index admission. The study was approved by the Vanderbilt University Institutional Review Board.
Patients
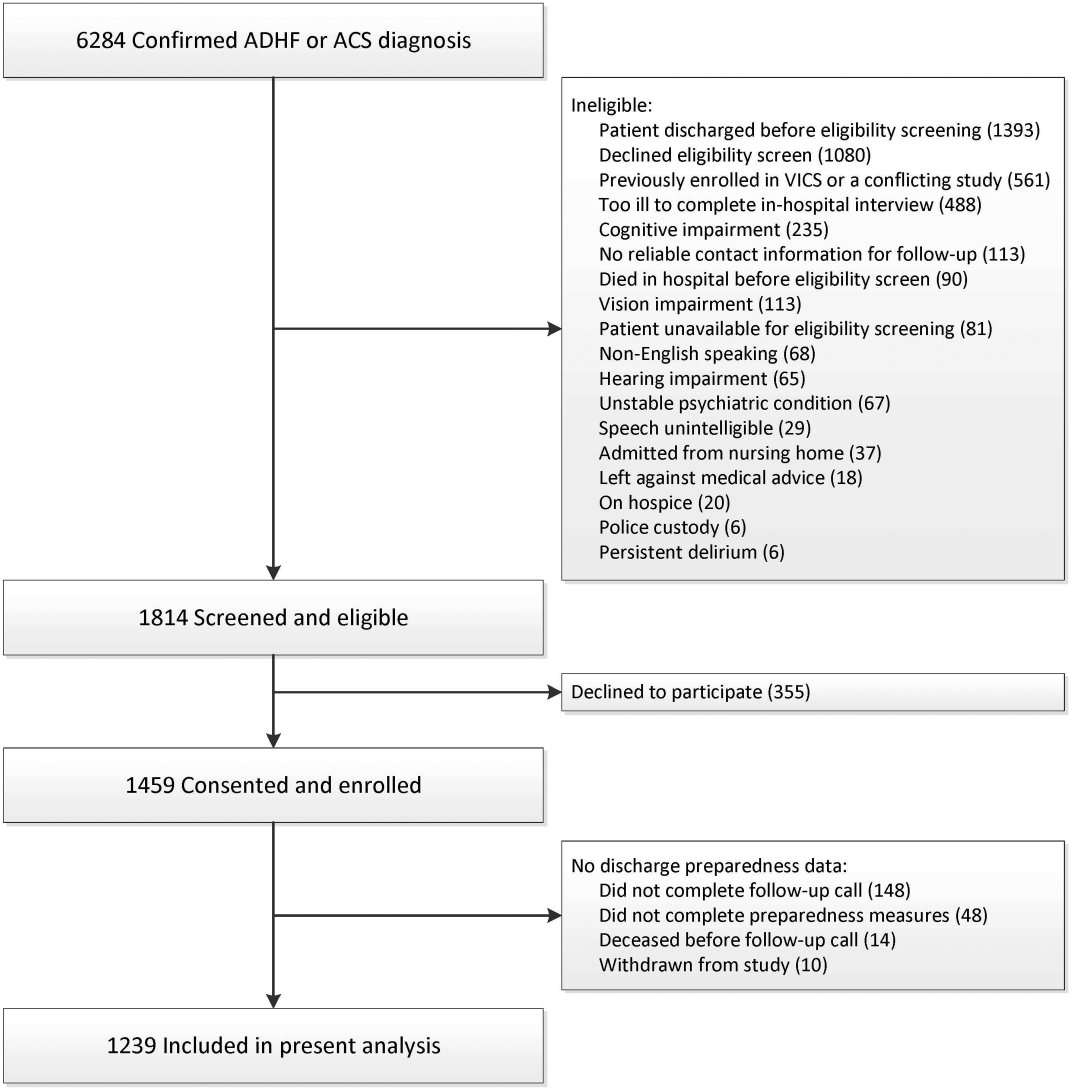
Eligibility screening shortly after admission identified patients with acute decompensated heart failure (ADHF) and/or an intermediate or high likelihood of acute coronary syndrome (ACS) per a physician's review of the clinical record. Exclusion criteria included: age <18 years, non‐English speaker, unstable psychiatric illness, delirium, low likelihood of follow‐up (eg, no reliable telephone number), on hospice, or otherwise too ill to complete an interview. To be included in these analyses, patients must have completed the preparedness for discharge measurements during the first follow‐up call. Patients who died before discharge or before completing the follow‐up call were excluded.
Preparedness for Discharge Measures (Patient‐Reported Data)
Preparedness for discharge was assessed using the 11‐item B‐PREPARED and the 3‐item CTM‐3.
The B‐PREPARED measures how prepared patients felt leaving the hospital with regard to: self‐care information for medications and activity, equipment/community services needed, and confidence in managing one's health after hospitalization. The B‐PREPARED measure has good internal consistency reliability (Cronbach's = 0.76) and has been validated in patients of varying age within a week of discharge. Preparedness is the sum of responses to all 11 questions, with a range of 0 to 22. Higher scores reflect increased preparedness for discharge.[3]
The CTM‐3 asks patients to rate how well their preferences were considered regarding transitional needs, as well as their understanding of postdischarge self‐management and the purpose of their medications, each on a 4‐point response scale (strongly disagree to strongly agree). The sum of the 3 responses quantifies the patient's perception of the quality of the care transition at discharge (Cronbach's = 0.86,[14] 0.92 in a cohort similar to ours[8]). Scores range from 3 to 12, with higher score indicating more preparedness. Then, the sum is transformed to a 0 to 100 scale.[15]
Clinical Readmission Risk Measures (Medical Record Data)
The LACE index, published by Van Walraven et al.,[10] takes into account 4 categories of clinical data: length of hospital stay, acuity of event, comorbidities, and ED visits in the prior 6 months. More specifically, a diagnostic code‐based, modified version of the Charlson Comorbidity Index was used to calculate the comorbidity score. These clinical criteria were obtained from an administrative database and weighted according to the methods used by Van Walraven et al. An overall score was calculated on a scale of 0 to 19, with higher scores indicating higher risk of readmission or death within 30 days.
From medical records, we also collected patients' demographic data including age, race, and gender, and diagnosis of ACS, ADHF, or both at hospital admission.
Outcome Measures
Healthcare utilization data were obtained from the index hospital as well as outside facilities. The electronic medical records from Vanderbilt University Hospital provided information about healthcare utilization at Vanderbilt 90 days after initial discharge. We also used Vanderbilt records to see if patients were transferred to Vanderbilt from other hospitals or if patients visited other hospitals before or after enrollment. We supplemented this with patient self‐report during the follow‐up telephone calls (at 30 and 90 days after initial discharge) so that any additional ED and hospital visits could be captured. Mortality data were collected from medical records, Social Security data, and family reports. The main outcome was time to first unplanned hospital readmission or death within 30 and 90 days of discharge.
Analysis
To describe our sample, we summarized categorical variables with percentages and continuous variables with percentiles. To test for evidence of unadjusted covariate‐outcome relationships, we used Pearson 2 and Wilcoxon rank sum tests for categorical and continuous covariates, respectively.
For the primary analyses we used Cox proportional hazard models to examine the independent associations between the prespecified predictors for patient‐reported preparedness and time to first unplanned readmission or death within 30 and 90 days of discharge. For each outcome (30‐ and 90‐day readmission or death), we fit marginal models separately for each of the B‐PREPARED, CTM‐3, and LACE scores. We then fit multivariable models that used both preparedness measures as well as age, gender, race, and diagnosis (ADHF and/or ACS), variables available to clinicians when patients are admitted. When fitting the multivariable models, we did not find strong evidence of nonlinear effects; therefore, only linear effects are reported. To facilitate comparison of effects, we scaled continuous variables by their interquartile range (IQR). The associated, exponentiated regression parameter estimates may therefore be interpreted as hazard ratios for readmission or death per IQR change in each predictor. In addition to parameter estimation, we computed the C index to evaluate capacity for the model to discriminate those who were and were not readmitted or died. All analyses were conducted in R version 3.1.2 (R Foundation for Statistical Computing, Vienna, Austria).
RESULTS
From the cohort of 1239 patients (Figure 1), 64%, 28%, and 7% of patients were hospitalized with ACS, ADHF, or both, respectively (Table 1). Nearly 45% of patients were female, 83% were white, and the median age was 61 years (IQR 5269). The median length of stay was 3 days (IQR 25). The median preparedness scores were high for both B‐PREPARED (21, IQR 1822) and CTM‐3 (77.8, IQR 66.7100). A total of 211 (17%) and 380 (31%) were readmitted or died within 30 and 90 days, respectively. The completion rate for the postdischarge phone calls was 88%.
| Death or Readmission Within 30 Days | Death or Readmission Within 90 Days | |||||
|---|---|---|---|---|---|---|
| Not Readmitted, N = 1028 | Death/Readmitted, N = 211 | P Value | Not Readmitted, N = 859 | Death/Readmitted, N = 380 | P Value | |
| ||||||
| Gender, male | 55.8% (574) | 53.1% (112) | 0.463* | 56.3% (484) | 53.2% (202) | 0.298* |
| Female | 44.2% (454) | 46.9% (99) | 43.7% (375) | 46.8% (178) | ||
| Race, white | 83.9% (860) | 80.6% (170) | 0.237* | 86.0% (737) | 77.3% (293) | <0.001* |
| Race, nonwhite | 16.1% (165) | 19.4% (41) | 14.0% (120) | 22.7% (86) | ||
| Diagnosis ACS | 68.0% (699) | 46.4% (98) | <0.001* | 72.9% (626) | 45.0% (171) | <0.001* |
| ADHF | 24.8% (255) | 46.0% (97) | 20.3% (174) | 46.8% (178) | ||
| Both | 7.2% (74) | 7.6% (16) | 6.9% (59) | 8.2% (31) | ||
| Age | 39.4:52:61:68:80 | 37.5:53.5:62:70:82 | 0.301 | 40:52:61:68:80 | 38:52:61 :70:82 | 0.651 |
| LOS | 1:2:3:5:10 | 1:3: 4:7.5:17 | <0.001 | 1:2:3:5:9 | 1:3:4:7:15 | <0.001 |
| CTM‐3 | 55.6:66.7: 77.8:100:100 | 55.6:66.7:77.8:100 :100 | 0.305 | 55.6:66.7:88.9:100:100 | 55.6:66.7:77.8:100 :100 | 0.080 |
| B‐PREPARED | 12:18:21:22.:22 | 10:17:20:22:22 | 0.066 | 12:18:21:22:22 | 10:17:20 :22:22 | 0.030 |
| LACE | 1:4: 7:10 :14 | 3.5:7:10:13:17 | <0.001 | 1:4:6: 9:14 | 3:7:10:13:16 | <0.001 |

B‐PREPARED and CTM‐3 were moderately correlated with one another (Spearman's = 0.40, P < 0.001). In bivariate analyses (Table 1), the association between B‐PREPARED and readmission or death was significant at 90 days (P = 0.030) but not 30 days. The CTM‐3 showed no significant association with readmission or death at either time point. The LACE score was significantly associated with rates of readmission at 30 and 90 days (P < 0.001).
Outcomes Within 30 Days of Discharge
When examining readmission or death within 30 days of discharge, simple unadjusted models 2 and 3 showed that the B‐PREPARED and LACE scores, respectively, were each significantly associated with time to first readmission or death (Table 2). Specifically, a 4‐point increase in the B‐PREPARED score was associated with a 16% decrease in the hazard of readmission or death (hazard ratio [HR] = 0.84, 95% confidence interval [CI]: 0.72 to 0.97). A 5‐point increase in the LACE score was associated with a 100% increase in the hazard of readmission or death (HR = 2.00, 95% CI: 1.72 to 2.32). In the multivariable model with both preparedness scores and diagnosis (model 4), the B‐PREPARED score (HR = 0.82, 95% CI: 0.70 to 0.97) was significantly associated with time to first readmission or death. In the full 30‐day model including B‐PREPARED, CTM‐3, LACE, age, gender, race, and diagnosis (model 5), only the LACE score (HR = 1.83, 95% CI: 1.54 to 2.18) was independently associated with time to readmission or death. Finally, the CTM‐3 did not predict 30‐day readmission or death in any of the models tested.
| Models | HR (95% CI)* | P Value | C Index |
|---|---|---|---|
| |||
| 1. CTM (per 10‐point change) | 0.95 (0.88 to 1.03) | 0.257 | 0.523 |
| 2. B‐PREPARED (per 4‐point change) | 0.84 (0.72 to 0.97) | 0.017 | 0.537 |
| 3. LACE (per 5‐point change) | 2.00 (1.72 to 2.32) | <0.001 | 0.679 |
| 4. CTM (per 10‐point change) | 1.00 (0.92 to 1.10) | 0.935 | 0.620 |
| B‐PREPARED (per 4‐point change) | 0.82 (0.70 to 0.97) | 0.019 | |
| ADHF only (vs ACS only) | 2.46 (1.86 to 3.26) | <0.001 | |
| ADHF and ACS (vs ACS only) | 1.42 (0.84 to 2.42) | 0.191 | |
| 5. CTM (per 10‐point change) | 1.02 (0.93 to 1.11) | 0.722 | 0.692 |
| B‐PREPARED (per 4 point change) | 0.87 (0.74 to 1.03) | 0.106 | |
| LACE (per 5‐point change) | 1.83 (1.54 to 2.18) | <0.001 | |
| ADHF only (vs ACS only) | 1.51 (1.10 to 2.08) | 0.010 | |
| ADHF and ACS (vs ACS only) | 0.90 (0.52 to 1.55) | 0.690 | |
| Age (per 10‐year change) | 1.02 (0.92 to 1.14) | 0.669 | |
| Female (vs male) | 1.11 (0.85 to 1.46) | 0.438 | |
| Nonwhite (vs white) | 0.92 (0.64 to 1.30) | 0.624 | |
Outcomes Within 90 Days of Discharge
At 90 days after discharge, again the separate unadjusted models 2 and 3 demonstrated that the B‐PREPARED and LACE scores, respectively, were each significantly associated with time to first readmission or death, whereas the CTM‐3 model only showed marginal significance (Table 3). In the multivariable model with both preparedness scores and diagnosis (model 4), results were similar to 30 days as the B‐PREPARED score was significantly associated with time to first readmission or death. Lastly, in the full model (model 5) at 90 days, again the LACE score was significantly associated with time to first readmission or death. In addition, B‐PREPARED scores were associated with a significant decrease in risk of readmission or death (HR = 0.88, 95% CI: 0.78 to 1.00); CTM‐3 scores were not independently associated with outcomes.
| Model | HR (95% CI)* | P Value | C Index |
|---|---|---|---|
| |||
| 1. CTM (per 10‐point change) | 0.94 (0.89 to 1.00) | 0.051 | 0.526 |
| 2. B‐PREPARED (per 4‐point change) | 0.84 (0.75 to 0.94) | 0.002 | 0.533 |
| 3. LACE (per 5‐point change) | 2.03 (1.82 to 2.27) | <0.001 | 0.683 |
| 4. CTM (per 10‐point change) | 0.99 (0.93 to 1.06) | 0.759 | 0.640 |
| B‐PREPARED (per 4‐point change) | 0.83 (0.74 to 0.94) | 0.003 | |
| ADHF only (vs ACS only) | 2.88 (2.33 to 3.56) | <0.001 | |
| ADHF and ACS (vs ACS only) | 1.62 (1.11 to 2.38) | 0.013 | |
| 5. CTM (per 10‐point change) | 1.00 (0.94 to 1.07) | 0.932 | 0.698 |
| B‐PREPARED (per 4‐point change) | 0.88 (0.78 to 1.00) | 0.043 | |
| LACE (per 5‐point change) | 1.76 (1.55 to 2.00) | <0.001 | |
| ADHF only (vs ACS only) | 1.76 (1.39 to 2.24) | <0.001 | |
| ADHF and ACS (vs ACS only) | 1.00 (0.67 to 1.50) | 0.980 | |
| Age (per 10‐year change) | 1.00 (0.93 to 1.09) | 0.894 | |
| Female (vs male) | 1.10 (0.90 to 1.35) | 0.341 | |
| Nonwhite (vs white) | 1.14 (0.89 to 1.47) | 0.288 | |
Tables 2 and 3 also display the C indices, or the discriminative ability of the models to differentiate whether or not a patient was readmitted or died. The range of the C index is 0.5 to 1, where values closer to 0.5 indicate random predictions and values closer to 1 indicate perfect prediction. At 30 days, the individual C indices for B‐PREPARED and CTM‐3 were only slightly better than chance (0.54 and 0.52, respectively) in their discriminative abilities. However, the C indices for the LACE score alone (0.68) and the multivariable model (0.69) including all 3 measures (ie, B‐PREPARED, CTM‐3, LACE), and clinical and demographic variables, had higher utility in discriminating patients who were readmitted/died or not. The 90‐day C indices were comparable in magnitude to those at 30 days.
DISCUSSION/CONCLUSION
In this cohort of patients hospitalized with cardiovascular disease, we compared 2 patient‐reported measures of preparedness for discharge, their association with time to death or readmission at 30 and 90 days, and their ability to discriminate patients who were or were not readmitted or died. Higher preparedness as measured by higher B‐PREPARED scores was associated with lower risk of readmission or death at 30 and 90 days after discharge in unadjusted models, and at 90 days in adjusted models. CTM‐3 was not associated with the outcome in any analyses. Lastly, the individual preparedness measures were not as strongly associated with readmission or death compared to the LACE readmission index alone.
How do our findings relate to the measurement of care transition quality? We consider 2 scenarios. First, if hospitals utilize the LACE index to predict readmission, then neither self‐reported measure of preparedness adds meaningfully to its predictive ability. However, hospital management may still find the B‐PREPARED and CTM‐3 useful as a means to direct care transition quality‐improvement efforts. These measures can instruct hospitals as to what areas their patients express the greatest difficulty or lack of preparedness and closely attend to patient needs with appropriate resources. Furthermore, the patient's perception of being prepared for discharge may be different than their actual preparedness. Their perceived preparedness may be affected by cognitive impairment, dissatisfaction with medical care, depression, lower health‐related quality of life, and lower educational attainment as demonstrated by Lau et al.[16] If a patient's perception of preparedness were low, it would behoove the clinician to investigate these other issues and address those that are mutable. Additionally, perceived preparedness may not correlate with the patient's understanding of their medical conditions, so it is imperative that clinicians provide prospective guidance about their probable postdischarge trajectory. If hospitals are not utilizing the LACE index, then perhaps using the B‐PREPARED, but not the CTM‐3, may be beneficial for predicting readmission.
How do our results fit with evidence from prior studies, and what do they mean in the context of care transitions quality? First, in the psychometric evaluation of the B‐PREPARED measure in a cohort of recently hospitalized patients, the mean score was 17.3, lower than the median of 21 in our cohort.[3] Numerous studies have utilized the CTM‐3 and the longer‐version CTM‐15. Though we cannot make a direct comparison, the median in our cohort (77.8) was on par with the means from other studies, which ranged from 63 to 82.[5, 17, 18, 19] Several studies also note ceiling effects with clusters of scores at the upper end of the scale, as did we. We conjecture that our cohort's preparedness scores may be higher because our institution has made concerted efforts to improve the discharge education for cardiovascular patients.
In a comparable patient population, the TRACE‐CORE (Transitions, Risks, and Actions in Coronary Events Center for Outcomes Research and Education) study is a cohort of more than 2200 patients with ACS who were administered the CTM‐15 within 1 month of discharge.[8] In that study, the median CTM‐15 score was 66.6, which is lower than our cohort. With regard to the predictive ability of the CTM‐3, they note that CTM‐3 scores did not differentiate between patients who were or were not readmitted or had emergency department visits. Our results support their concern that the CTM‐15 and by extension the CTM‐3, though adopted widely as part of HCAHPS, may not have sufficient ability to discriminate differences in patient outcomes or the quality of care transitions.
More recently, patient‐reported preparedness for discharge was assessed in a prospective cohort in Canada.[16] Lau et al. administered a single‐item measure of readiness at the time of discharge to general medicine patients, and found that lower readiness scores were also not associated with readmission or death at 30 days, when adjusted for the LACE index as we did.
We must acknowledge the limitations of our findings. First, our sample of recently discharged patients with cardiovascular disease is different than the community‐dwelling, underserved Americans hospitalized in the prior year, which served as the sample for reducing the CTM‐15 to 3 items.[5] This fact may explain why we did not find the CTM‐3 to be associated with readmission in our sample. Second, our analyses did not include extensive adjustment for patient‐related factors. Rather, our intention was to see how well the preparedness measures performed independently and compare their abilities to predict readmission, which is particularly relevant for clinicians who may not have all possible covariates in predicting readmission. Finally, because we limited the analyses to the patients who completed the B‐PREPARED and CTM‐3 measures (88% completion rate), we may not have data for: (1) very ill patients, who had a higher risk of readmission and least prepared, and were not able to answer the postdischarge phone call; and (2) very functional patients, who had a lower risk of readmission and were too busy to answer the postdischarge phone call. This may have limited the extremes in the spectrum of our sample.
Importantly, our study has several strengths. We report on the largest sample to date with results of both B‐PREPARED and CTM‐3. Moreover, we examined how these measures compared to a widely used readmission prediction tool, the LACE index. We had very high postdischarge phone call completion rates in the week following discharge. Furthermore, we had thorough assessment of readmission data through patient report, electronic medical record documentation, and collection of outside medical records.
Further research is needed to elucidate: (1) the ideal administration time of the patient‐reported measures of preparedness (before or after discharge), and (2) the challenges to the implementation of measures in healthcare systems. Remaining research questions center on the tradeoffs and barriers to implementing a longer measure like the 11‐item B‐PREPARED compared to a shorter measure like the CTM‐3. We do not know whether longer measures preclude their use by busy clinicians, though it provides more specific information about what patients feel they need at hospital discharge. Additionally, studies need to demonstrate the mutability of preparedness and the response of measures to interventions designed to improve the hospital discharge process.
In our sample of recently hospitalized cardiovascular patients, there was a statistically significant association between patient‐reported preparedness for discharged, as measured by B‐PREPARED, and readmissions/death at 30 and 90 days, but the magnitude of the association was very small. Furthermore, another patient‐reported preparedness measure, CTM‐3, was not associated with readmissions or death at either 30 or 90 days. Lastly, neither measure discriminated well between patients who were readmitted or not, and neither measure added meaningfully to the LACE index in terms of predicting 30‐ or 90‐day readmissions.
Disclosures
This study was supported by grant R01 HL109388 from the National Heart, Lung, and Blood Institute (Dr. Kripalani) and in part by grant UL1 RR024975‐01 from the National Center for Research Resources, and grant 2 UL1 TR000445‐06 from the National Center for Advancing Translational Sciences. Dr. Kripalani is a consultant to SAI Interactive and holds equity in Bioscape Digital, and is a consultant to and holds equity in PictureRx, LLC. Dr. Bell is supported by the National Institutes of Health (K23AG048347) and by the Eisenstein Women's Heart Fund. Dr. Vasilevskis is supported by the National Institutes of Health (K23AG040157) and the Geriatric Research, Education and Clinical Center. Dr. Mixon is a Veterans Affairs Health Services Research and Development Service Career Development awardee (12‐168) at the Nashville Department of Veterans Affairs. The content is solely the responsibility of the authors and does not necessarily represent the official views of the National Institutes of Health. The funding agency was not involved in the design and conduct of the study; collection, management, analysis, and interpretation of the data; and preparation, review, or approval of the manuscript. All authors had full access to all study data and had a significant role in writing the manuscript. The contents do not represent the views of the US Department of Veterans Affairs or the United States government. Dr. Kripalani is a consultant to and holds equity in PictureRx, LLC.
- Centers for Medicare 9(9):598–603.
- , , . Brief scale measuring patient preparedness for hospital discharge to home: psychometric properties. J Hosp Med. 2008;3(6):446–454.
- , , . Assessing the quality of preparation for posthospital care from the patient's perspective: the care transitions measure. Med Care. 2005;43(3):246–255.
- , , , . Assessing the quality of transitional care: further applications of the care transitions measure. Med Care. 2008;46(3):317–322.
- , , , , . The central role of performance measurement in improving the quality of transitional care. Home Health Care Serv Q. 2007;26(4):93–104.
- Centers for Medicare 3:e001053.
- , , , et al. Risk prediction models for hospital readmission: a systematic review. JAMA. 2011;306(15):1688–1698.
- , , , et al. Derivation and validation of an index to predict early death or unplanned readmission after discharge from hospital to the community. CMAJ. 2010;182(6):551–557.
- , , , et al. Using the LACE index to predict hospital readmissions in congestive heart failure patients. BMC Cardiovasc Disord. 2014;14:97.
- , , , . Validation of a predictive model to identify patients at high risk for hospital readmission. J Healthc Qual. 2016;38(1):34–41.
- , , , et al. Determinants of health after hospital discharge: rationale and design of the Vanderbilt Inpatient Cohort Study (VICS). BMC Health Serv Res. 2014;14:10.
- . CTM frequently asked questions. Available at: http://caretransitions.org/tools-and-resources/. Accessed January 22, 2016.
- . Instructions for scoring the CTM‐3. Available at: http://caretransitions.org/tools-and-resources/. Accessed January 22, 2016.
- , , , et al. Patient‐reported discharge readiness and 30‐day risk of readmission or death: a prospective cohort study. Am J Med. 2016;129:89–95.
- , , , , . Implementaiton of the Care Transitions Intervention: sustainability and lessons learned. Prof Case Manag. 2009;14(6):282–293.
- , , , . The care transitions innovation (C‐TraIn) for socioeconomically disadvantaged adults: results of a cluster randomized controlled trial. J Gen Intern Med. 2014;29(11):1460–1467.
- , , , et al. Telephone calls to patients after discharge from the hospital: an important part of transitions of care. Med Educ Online. 2015;29(20):26701.
In recent years, US hospitals have focused on decreasing readmission rates, incented by reimbursement penalties to hospitals having excessive readmissions.[1] Gaps in the quality of care provided during transitions likely contribute to preventable readmissions.[2] One compelling quality assessment in this setting is measuring patients' discharge preparedness, using key dimensions such as understanding their instructions for medication use and follow‐up. Patient‐reported preparedness for discharge may also be useful to identify risk of readmission.
Several patient‐reported measures of preparedness for discharge exist, and herein we describe 2 measures of interest. First, the Brief‐PREPARED (B‐PREPARED) measure was derived from the longer PREPARED instrument (Prescriptions, Ready to re‐enter community, Education, Placement, Assurance of safety, Realistic expectations, Empowerment, Directed to appropriate services), which reflects the patient's perceived needs at discharge. In previous research, the B‐PREPARED measure predicted emergency department (ED) visits for patients who had been recently hospitalized and had a high risk for readmission.[3] Second, the Care Transitions Measure‐3 (CTM‐3) was developed by Coleman et al. as a patient‐reported measure to discriminate between patients who were more likely to have an ED visit or readmission from those who did not. CTM‐3 has also been used to evaluate hospitals' level of care coordination and for public reporting purposes.[4, 5, 6] It has been endorsed by the National Quality Forum and incorporated into the Hospital Consumer Assessment of Healthcare Providers and Systems (HCAHPS) survey provided to samples of recently hospitalized US patients.[7] However, recent evidence from an inpatient cohort of cardiovascular patients suggests the CTM‐3 overinflates care transition scores compared to the longer 15‐item CTM. In that cohort, the CTM‐3 could not differentiate between patients who did or did not have repeat ED visits or readmission.[8] Thus far, the B‐PREPARED and CTM‐3 measures have not been compared to one another directly.
In addition to the development of patient‐reported measures, hospitals increasingly employ administrative algorithms to predict likelihood of readmission.[9] A commonly used measure is the LACE index (Length of stay, Acuity, Comorbidity, and Emergency department use).[10] The LACE index predicted readmission and death within 30 days of discharge in a large cohort in Canada. In 2 retrospective studies of recently hospitalized patients in the United States, the LACE index's ability to discriminate between patients readmitted or not ranged from slightly better than chance to moderate (C statistic 0.56‐0.77).[11, 12]
It is unknown whether adding patient‐reported preparedness measures to commonly used readmission prediction scores increases the ability to predict readmission risk. We sought to determine whether the B‐PREPARED and CTM‐3 measures were predictive of readmission or death, as compared to the LACE index, in a large cohort of cardiovascular patients. In addition, we sought to determine the additional predictive and discriminative ability gained from administering the B‐PREPARED and CTM‐3 measures, while adjusting for the LACE index and other clinical factors. We hypothesized that: (1) higher preparedness scores on both measures would predict lower risk of readmission or death in a cohort of patients hospitalized with cardiac diagnoses; and (2) because it provides more specific and actionable information, the B‐PREPARED would discriminate readmission more accurately than CTM‐3, after controlling for clinical factors.
METHODS
Study Setting and Design
The Vanderbilt Inpatient Cohort Study (VICS) is a prospective study of patients admitted with cardiovascular disease to Vanderbilt University Hospital. The purpose of VICS is to investigate the impact of patient and social factors on postdischarge health outcomes such as quality of life, unplanned hospital utilization, and mortality. The rationale and design of VICS are detailed elsewhere.[13] Briefly, participants completed a baseline interview while hospitalized, and follow‐up phone calls were conducted within 2 to 9 days and at approximately 30 and 90 days postdischarge. During the first follow‐up call conducted by research assistants, we collected preparedness for discharge data utilizing the 2 measures described below. After the 90‐day phone call, we collected healthcare utilization since the index admission. The study was approved by the Vanderbilt University Institutional Review Board.
Patients
Eligibility screening shortly after admission identified patients with acute decompensated heart failure (ADHF) and/or an intermediate or high likelihood of acute coronary syndrome (ACS) per a physician's review of the clinical record. Exclusion criteria included: age <18 years, non‐English speaker, unstable psychiatric illness, delirium, low likelihood of follow‐up (eg, no reliable telephone number), on hospice, or otherwise too ill to complete an interview. To be included in these analyses, patients must have completed the preparedness for discharge measurements during the first follow‐up call. Patients who died before discharge or before completing the follow‐up call were excluded.
Preparedness for Discharge Measures (Patient‐Reported Data)
Preparedness for discharge was assessed using the 11‐item B‐PREPARED and the 3‐item CTM‐3.
The B‐PREPARED measures how prepared patients felt leaving the hospital with regard to: self‐care information for medications and activity, equipment/community services needed, and confidence in managing one's health after hospitalization. The B‐PREPARED measure has good internal consistency reliability (Cronbach's = 0.76) and has been validated in patients of varying age within a week of discharge. Preparedness is the sum of responses to all 11 questions, with a range of 0 to 22. Higher scores reflect increased preparedness for discharge.[3]
The CTM‐3 asks patients to rate how well their preferences were considered regarding transitional needs, as well as their understanding of postdischarge self‐management and the purpose of their medications, each on a 4‐point response scale (strongly disagree to strongly agree). The sum of the 3 responses quantifies the patient's perception of the quality of the care transition at discharge (Cronbach's = 0.86,[14] 0.92 in a cohort similar to ours[8]). Scores range from 3 to 12, with higher score indicating more preparedness. Then, the sum is transformed to a 0 to 100 scale.[15]
Clinical Readmission Risk Measures (Medical Record Data)
The LACE index, published by Van Walraven et al.,[10] takes into account 4 categories of clinical data: length of hospital stay, acuity of event, comorbidities, and ED visits in the prior 6 months. More specifically, a diagnostic code‐based, modified version of the Charlson Comorbidity Index was used to calculate the comorbidity score. These clinical criteria were obtained from an administrative database and weighted according to the methods used by Van Walraven et al. An overall score was calculated on a scale of 0 to 19, with higher scores indicating higher risk of readmission or death within 30 days.
From medical records, we also collected patients' demographic data including age, race, and gender, and diagnosis of ACS, ADHF, or both at hospital admission.
Outcome Measures
Healthcare utilization data were obtained from the index hospital as well as outside facilities. The electronic medical records from Vanderbilt University Hospital provided information about healthcare utilization at Vanderbilt 90 days after initial discharge. We also used Vanderbilt records to see if patients were transferred to Vanderbilt from other hospitals or if patients visited other hospitals before or after enrollment. We supplemented this with patient self‐report during the follow‐up telephone calls (at 30 and 90 days after initial discharge) so that any additional ED and hospital visits could be captured. Mortality data were collected from medical records, Social Security data, and family reports. The main outcome was time to first unplanned hospital readmission or death within 30 and 90 days of discharge.
Analysis
To describe our sample, we summarized categorical variables with percentages and continuous variables with percentiles. To test for evidence of unadjusted covariate‐outcome relationships, we used Pearson 2 and Wilcoxon rank sum tests for categorical and continuous covariates, respectively.
For the primary analyses we used Cox proportional hazard models to examine the independent associations between the prespecified predictors for patient‐reported preparedness and time to first unplanned readmission or death within 30 and 90 days of discharge. For each outcome (30‐ and 90‐day readmission or death), we fit marginal models separately for each of the B‐PREPARED, CTM‐3, and LACE scores. We then fit multivariable models that used both preparedness measures as well as age, gender, race, and diagnosis (ADHF and/or ACS), variables available to clinicians when patients are admitted. When fitting the multivariable models, we did not find strong evidence of nonlinear effects; therefore, only linear effects are reported. To facilitate comparison of effects, we scaled continuous variables by their interquartile range (IQR). The associated, exponentiated regression parameter estimates may therefore be interpreted as hazard ratios for readmission or death per IQR change in each predictor. In addition to parameter estimation, we computed the C index to evaluate capacity for the model to discriminate those who were and were not readmitted or died. All analyses were conducted in R version 3.1.2 (R Foundation for Statistical Computing, Vienna, Austria).
RESULTS
From the cohort of 1239 patients (Figure 1), 64%, 28%, and 7% of patients were hospitalized with ACS, ADHF, or both, respectively (Table 1). Nearly 45% of patients were female, 83% were white, and the median age was 61 years (IQR 5269). The median length of stay was 3 days (IQR 25). The median preparedness scores were high for both B‐PREPARED (21, IQR 1822) and CTM‐3 (77.8, IQR 66.7100). A total of 211 (17%) and 380 (31%) were readmitted or died within 30 and 90 days, respectively. The completion rate for the postdischarge phone calls was 88%.
| Death or Readmission Within 30 Days | Death or Readmission Within 90 Days | |||||
|---|---|---|---|---|---|---|
| Not Readmitted, N = 1028 | Death/Readmitted, N = 211 | P Value | Not Readmitted, N = 859 | Death/Readmitted, N = 380 | P Value | |
| ||||||
| Gender, male | 55.8% (574) | 53.1% (112) | 0.463* | 56.3% (484) | 53.2% (202) | 0.298* |
| Female | 44.2% (454) | 46.9% (99) | 43.7% (375) | 46.8% (178) | ||
| Race, white | 83.9% (860) | 80.6% (170) | 0.237* | 86.0% (737) | 77.3% (293) | <0.001* |
| Race, nonwhite | 16.1% (165) | 19.4% (41) | 14.0% (120) | 22.7% (86) | ||
| Diagnosis ACS | 68.0% (699) | 46.4% (98) | <0.001* | 72.9% (626) | 45.0% (171) | <0.001* |
| ADHF | 24.8% (255) | 46.0% (97) | 20.3% (174) | 46.8% (178) | ||
| Both | 7.2% (74) | 7.6% (16) | 6.9% (59) | 8.2% (31) | ||
| Age | 39.4:52:61:68:80 | 37.5:53.5:62:70:82 | 0.301 | 40:52:61:68:80 | 38:52:61 :70:82 | 0.651 |
| LOS | 1:2:3:5:10 | 1:3: 4:7.5:17 | <0.001 | 1:2:3:5:9 | 1:3:4:7:15 | <0.001 |
| CTM‐3 | 55.6:66.7: 77.8:100:100 | 55.6:66.7:77.8:100 :100 | 0.305 | 55.6:66.7:88.9:100:100 | 55.6:66.7:77.8:100 :100 | 0.080 |
| B‐PREPARED | 12:18:21:22.:22 | 10:17:20:22:22 | 0.066 | 12:18:21:22:22 | 10:17:20 :22:22 | 0.030 |
| LACE | 1:4: 7:10 :14 | 3.5:7:10:13:17 | <0.001 | 1:4:6: 9:14 | 3:7:10:13:16 | <0.001 |
B‐PREPARED and CTM‐3 were moderately correlated with one another (Spearman's = 0.40, P < 0.001). In bivariate analyses (Table 1), the association between B‐PREPARED and readmission or death was significant at 90 days (P = 0.030) but not 30 days. The CTM‐3 showed no significant association with readmission or death at either time point. The LACE score was significantly associated with rates of readmission at 30 and 90 days (P < 0.001).
Outcomes Within 30 Days of Discharge
When examining readmission or death within 30 days of discharge, simple unadjusted models 2 and 3 showed that the B‐PREPARED and LACE scores, respectively, were each significantly associated with time to first readmission or death (Table 2). Specifically, a 4‐point increase in the B‐PREPARED score was associated with a 16% decrease in the hazard of readmission or death (hazard ratio [HR] = 0.84, 95% confidence interval [CI]: 0.72 to 0.97). A 5‐point increase in the LACE score was associated with a 100% increase in the hazard of readmission or death (HR = 2.00, 95% CI: 1.72 to 2.32). In the multivariable model with both preparedness scores and diagnosis (model 4), the B‐PREPARED score (HR = 0.82, 95% CI: 0.70 to 0.97) was significantly associated with time to first readmission or death. In the full 30‐day model including B‐PREPARED, CTM‐3, LACE, age, gender, race, and diagnosis (model 5), only the LACE score (HR = 1.83, 95% CI: 1.54 to 2.18) was independently associated with time to readmission or death. Finally, the CTM‐3 did not predict 30‐day readmission or death in any of the models tested.
| Models | HR (95% CI)* | P Value | C Index |
|---|---|---|---|
| |||
| 1. CTM (per 10‐point change) | 0.95 (0.88 to 1.03) | 0.257 | 0.523 |
| 2. B‐PREPARED (per 4‐point change) | 0.84 (0.72 to 0.97) | 0.017 | 0.537 |
| 3. LACE (per 5‐point change) | 2.00 (1.72 to 2.32) | <0.001 | 0.679 |
| 4. CTM (per 10‐point change) | 1.00 (0.92 to 1.10) | 0.935 | 0.620 |
| B‐PREPARED (per 4‐point change) | 0.82 (0.70 to 0.97) | 0.019 | |
| ADHF only (vs ACS only) | 2.46 (1.86 to 3.26) | <0.001 | |
| ADHF and ACS (vs ACS only) | 1.42 (0.84 to 2.42) | 0.191 | |
| 5. CTM (per 10‐point change) | 1.02 (0.93 to 1.11) | 0.722 | 0.692 |
| B‐PREPARED (per 4 point change) | 0.87 (0.74 to 1.03) | 0.106 | |
| LACE (per 5‐point change) | 1.83 (1.54 to 2.18) | <0.001 | |
| ADHF only (vs ACS only) | 1.51 (1.10 to 2.08) | 0.010 | |
| ADHF and ACS (vs ACS only) | 0.90 (0.52 to 1.55) | 0.690 | |
| Age (per 10‐year change) | 1.02 (0.92 to 1.14) | 0.669 | |
| Female (vs male) | 1.11 (0.85 to 1.46) | 0.438 | |
| Nonwhite (vs white) | 0.92 (0.64 to 1.30) | 0.624 | |
Outcomes Within 90 Days of Discharge
At 90 days after discharge, again the separate unadjusted models 2 and 3 demonstrated that the B‐PREPARED and LACE scores, respectively, were each significantly associated with time to first readmission or death, whereas the CTM‐3 model only showed marginal significance (Table 3). In the multivariable model with both preparedness scores and diagnosis (model 4), results were similar to 30 days as the B‐PREPARED score was significantly associated with time to first readmission or death. Lastly, in the full model (model 5) at 90 days, again the LACE score was significantly associated with time to first readmission or death. In addition, B‐PREPARED scores were associated with a significant decrease in risk of readmission or death (HR = 0.88, 95% CI: 0.78 to 1.00); CTM‐3 scores were not independently associated with outcomes.
| Model | HR (95% CI)* | P Value | C Index |
|---|---|---|---|
| |||
| 1. CTM (per 10‐point change) | 0.94 (0.89 to 1.00) | 0.051 | 0.526 |
| 2. B‐PREPARED (per 4‐point change) | 0.84 (0.75 to 0.94) | 0.002 | 0.533 |
| 3. LACE (per 5‐point change) | 2.03 (1.82 to 2.27) | <0.001 | 0.683 |
| 4. CTM (per 10‐point change) | 0.99 (0.93 to 1.06) | 0.759 | 0.640 |
| B‐PREPARED (per 4‐point change) | 0.83 (0.74 to 0.94) | 0.003 | |
| ADHF only (vs ACS only) | 2.88 (2.33 to 3.56) | <0.001 | |
| ADHF and ACS (vs ACS only) | 1.62 (1.11 to 2.38) | 0.013 | |
| 5. CTM (per 10‐point change) | 1.00 (0.94 to 1.07) | 0.932 | 0.698 |
| B‐PREPARED (per 4‐point change) | 0.88 (0.78 to 1.00) | 0.043 | |
| LACE (per 5‐point change) | 1.76 (1.55 to 2.00) | <0.001 | |
| ADHF only (vs ACS only) | 1.76 (1.39 to 2.24) | <0.001 | |
| ADHF and ACS (vs ACS only) | 1.00 (0.67 to 1.50) | 0.980 | |
| Age (per 10‐year change) | 1.00 (0.93 to 1.09) | 0.894 | |
| Female (vs male) | 1.10 (0.90 to 1.35) | 0.341 | |
| Nonwhite (vs white) | 1.14 (0.89 to 1.47) | 0.288 | |
Tables 2 and 3 also display the C indices, or the discriminative ability of the models to differentiate whether or not a patient was readmitted or died. The range of the C index is 0.5 to 1, where values closer to 0.5 indicate random predictions and values closer to 1 indicate perfect prediction. At 30 days, the individual C indices for B‐PREPARED and CTM‐3 were only slightly better than chance (0.54 and 0.52, respectively) in their discriminative abilities. However, the C indices for the LACE score alone (0.68) and the multivariable model (0.69) including all 3 measures (ie, B‐PREPARED, CTM‐3, LACE), and clinical and demographic variables, had higher utility in discriminating patients who were readmitted/died or not. The 90‐day C indices were comparable in magnitude to those at 30 days.
DISCUSSION/CONCLUSION
In this cohort of patients hospitalized with cardiovascular disease, we compared 2 patient‐reported measures of preparedness for discharge, their association with time to death or readmission at 30 and 90 days, and their ability to discriminate patients who were or were not readmitted or died. Higher preparedness as measured by higher B‐PREPARED scores was associated with lower risk of readmission or death at 30 and 90 days after discharge in unadjusted models, and at 90 days in adjusted models. CTM‐3 was not associated with the outcome in any analyses. Lastly, the individual preparedness measures were not as strongly associated with readmission or death compared to the LACE readmission index alone.
How do our findings relate to the measurement of care transition quality? We consider 2 scenarios. First, if hospitals utilize the LACE index to predict readmission, then neither self‐reported measure of preparedness adds meaningfully to its predictive ability. However, hospital management may still find the B‐PREPARED and CTM‐3 useful as a means to direct care transition quality‐improvement efforts. These measures can instruct hospitals as to what areas their patients express the greatest difficulty or lack of preparedness and closely attend to patient needs with appropriate resources. Furthermore, the patient's perception of being prepared for discharge may be different than their actual preparedness. Their perceived preparedness may be affected by cognitive impairment, dissatisfaction with medical care, depression, lower health‐related quality of life, and lower educational attainment as demonstrated by Lau et al.[16] If a patient's perception of preparedness were low, it would behoove the clinician to investigate these other issues and address those that are mutable. Additionally, perceived preparedness may not correlate with the patient's understanding of their medical conditions, so it is imperative that clinicians provide prospective guidance about their probable postdischarge trajectory. If hospitals are not utilizing the LACE index, then perhaps using the B‐PREPARED, but not the CTM‐3, may be beneficial for predicting readmission.
How do our results fit with evidence from prior studies, and what do they mean in the context of care transitions quality? First, in the psychometric evaluation of the B‐PREPARED measure in a cohort of recently hospitalized patients, the mean score was 17.3, lower than the median of 21 in our cohort.[3] Numerous studies have utilized the CTM‐3 and the longer‐version CTM‐15. Though we cannot make a direct comparison, the median in our cohort (77.8) was on par with the means from other studies, which ranged from 63 to 82.[5, 17, 18, 19] Several studies also note ceiling effects with clusters of scores at the upper end of the scale, as did we. We conjecture that our cohort's preparedness scores may be higher because our institution has made concerted efforts to improve the discharge education for cardiovascular patients.
In a comparable patient population, the TRACE‐CORE (Transitions, Risks, and Actions in Coronary Events Center for Outcomes Research and Education) study is a cohort of more than 2200 patients with ACS who were administered the CTM‐15 within 1 month of discharge.[8] In that study, the median CTM‐15 score was 66.6, which is lower than our cohort. With regard to the predictive ability of the CTM‐3, they note that CTM‐3 scores did not differentiate between patients who were or were not readmitted or had emergency department visits. Our results support their concern that the CTM‐15 and by extension the CTM‐3, though adopted widely as part of HCAHPS, may not have sufficient ability to discriminate differences in patient outcomes or the quality of care transitions.
More recently, patient‐reported preparedness for discharge was assessed in a prospective cohort in Canada.[16] Lau et al. administered a single‐item measure of readiness at the time of discharge to general medicine patients, and found that lower readiness scores were also not associated with readmission or death at 30 days, when adjusted for the LACE index as we did.
We must acknowledge the limitations of our findings. First, our sample of recently discharged patients with cardiovascular disease is different than the community‐dwelling, underserved Americans hospitalized in the prior year, which served as the sample for reducing the CTM‐15 to 3 items.[5] This fact may explain why we did not find the CTM‐3 to be associated with readmission in our sample. Second, our analyses did not include extensive adjustment for patient‐related factors. Rather, our intention was to see how well the preparedness measures performed independently and compare their abilities to predict readmission, which is particularly relevant for clinicians who may not have all possible covariates in predicting readmission. Finally, because we limited the analyses to the patients who completed the B‐PREPARED and CTM‐3 measures (88% completion rate), we may not have data for: (1) very ill patients, who had a higher risk of readmission and least prepared, and were not able to answer the postdischarge phone call; and (2) very functional patients, who had a lower risk of readmission and were too busy to answer the postdischarge phone call. This may have limited the extremes in the spectrum of our sample.
Importantly, our study has several strengths. We report on the largest sample to date with results of both B‐PREPARED and CTM‐3. Moreover, we examined how these measures compared to a widely used readmission prediction tool, the LACE index. We had very high postdischarge phone call completion rates in the week following discharge. Furthermore, we had thorough assessment of readmission data through patient report, electronic medical record documentation, and collection of outside medical records.
Further research is needed to elucidate: (1) the ideal administration time of the patient‐reported measures of preparedness (before or after discharge), and (2) the challenges to the implementation of measures in healthcare systems. Remaining research questions center on the tradeoffs and barriers to implementing a longer measure like the 11‐item B‐PREPARED compared to a shorter measure like the CTM‐3. We do not know whether longer measures preclude their use by busy clinicians, though it provides more specific information about what patients feel they need at hospital discharge. Additionally, studies need to demonstrate the mutability of preparedness and the response of measures to interventions designed to improve the hospital discharge process.
In our sample of recently hospitalized cardiovascular patients, there was a statistically significant association between patient‐reported preparedness for discharged, as measured by B‐PREPARED, and readmissions/death at 30 and 90 days, but the magnitude of the association was very small. Furthermore, another patient‐reported preparedness measure, CTM‐3, was not associated with readmissions or death at either 30 or 90 days. Lastly, neither measure discriminated well between patients who were readmitted or not, and neither measure added meaningfully to the LACE index in terms of predicting 30‐ or 90‐day readmissions.
Disclosures
This study was supported by grant R01 HL109388 from the National Heart, Lung, and Blood Institute (Dr. Kripalani) and in part by grant UL1 RR024975‐01 from the National Center for Research Resources, and grant 2 UL1 TR000445‐06 from the National Center for Advancing Translational Sciences. Dr. Kripalani is a consultant to SAI Interactive and holds equity in Bioscape Digital, and is a consultant to and holds equity in PictureRx, LLC. Dr. Bell is supported by the National Institutes of Health (K23AG048347) and by the Eisenstein Women's Heart Fund. Dr. Vasilevskis is supported by the National Institutes of Health (K23AG040157) and the Geriatric Research, Education and Clinical Center. Dr. Mixon is a Veterans Affairs Health Services Research and Development Service Career Development awardee (12‐168) at the Nashville Department of Veterans Affairs. The content is solely the responsibility of the authors and does not necessarily represent the official views of the National Institutes of Health. The funding agency was not involved in the design and conduct of the study; collection, management, analysis, and interpretation of the data; and preparation, review, or approval of the manuscript. All authors had full access to all study data and had a significant role in writing the manuscript. The contents do not represent the views of the US Department of Veterans Affairs or the United States government. Dr. Kripalani is a consultant to and holds equity in PictureRx, LLC.
- Centers for Medicare 9(9):598–603.
- , , . Brief scale measuring patient preparedness for hospital discharge to home: psychometric properties. J Hosp Med. 2008;3(6):446–454.
- , , . Assessing the quality of preparation for posthospital care from the patient's perspective: the care transitions measure. Med Care. 2005;43(3):246–255.
- , , , . Assessing the quality of transitional care: further applications of the care transitions measure. Med Care. 2008;46(3):317–322.
- , , , , . The central role of performance measurement in improving the quality of transitional care. Home Health Care Serv Q. 2007;26(4):93–104.
- Centers for Medicare 3:e001053.
- , , , et al. Risk prediction models for hospital readmission: a systematic review. JAMA. 2011;306(15):1688–1698.
- , , , et al. Derivation and validation of an index to predict early death or unplanned readmission after discharge from hospital to the community. CMAJ. 2010;182(6):551–557.
- , , , et al. Using the LACE index to predict hospital readmissions in congestive heart failure patients. BMC Cardiovasc Disord. 2014;14:97.
- , , , . Validation of a predictive model to identify patients at high risk for hospital readmission. J Healthc Qual. 2016;38(1):34–41.
- , , , et al. Determinants of health after hospital discharge: rationale and design of the Vanderbilt Inpatient Cohort Study (VICS). BMC Health Serv Res. 2014;14:10.
- . CTM frequently asked questions. Available at: http://caretransitions.org/tools-and-resources/. Accessed January 22, 2016.
- . Instructions for scoring the CTM‐3. Available at: http://caretransitions.org/tools-and-resources/. Accessed January 22, 2016.
- , , , et al. Patient‐reported discharge readiness and 30‐day risk of readmission or death: a prospective cohort study. Am J Med. 2016;129:89–95.
- , , , , . Implementaiton of the Care Transitions Intervention: sustainability and lessons learned. Prof Case Manag. 2009;14(6):282–293.
- , , , . The care transitions innovation (C‐TraIn) for socioeconomically disadvantaged adults: results of a cluster randomized controlled trial. J Gen Intern Med. 2014;29(11):1460–1467.
- , , , et al. Telephone calls to patients after discharge from the hospital: an important part of transitions of care. Med Educ Online. 2015;29(20):26701.