User login
MAGS Prevalence in Older Adults
Geriatric syndromes are common clinical conditions in older adults that do not fall into specific disease categories. Unlike the traditional definition of a syndrome, geriatric syndrome refers to a condition that is mediated by multiple shared underlying risk factors.[1, 2] Conditions commonly referred to as geriatric syndromes include delirium, cognitive impairment, falls, unintentional weight loss, depressive symptoms, and incontinence. Even though many perceive it as medical misnomer,[3] geriatric syndromes have been shown to negatively impact quality of life and activities of daily living in older adults.[2] They are also associated with adverse outcomes such as increased healthcare utilization, functional decline, and mortality, even after adjusting for age and disease severity.[4, 5, 6] Hospitalized older adults, including those discharged to skilled nursing facilities (SNFs)[7, 8] are particularly at high risk for new‐onset or exacerbation of geriatric syndromes and poor outcomes.[7, 9, 10] However, hospital providers seldom assess, manage, or document geriatric syndromes because they are often overshadowed by disease conditions that lead to an acute episode requiring hospitalization (e.g., heart disease).[11]
Pharmacotherapy is the cornerstone of hospital treatment, and it is well‐known that it affects multiple physiologic systems causing side effects apart from the condition they are approved to treat. Given that geriatric syndromes are a result of impairments in multiple organ systems, it is plausible that pharmacotherapy may initiate or worsen these syndromes.[12] Medication‐related problems in older adults are well known. Polypharmacy and adverse drug events (as a result of drug‐drug/disease interactions and changes in pharmacokinetics and pharmacodynamics) are prevalent in multimorbid elderly patients.[13, 14, 15, 16] The prescribing cascade[17] increases the medication burden and may be a contributing factor for geriatric syndromes in hospitalized patients.[18] For instance, laxatives may be prescribed to counteract constipation caused by anticholinergic drugs.
The American Geriatric Society (AGS) Beers list[19, 20] and similar criteria[21] provide excellent resources to identify medications with potentially harmful interactions or adverse effects in older adults. Although these lists include medicines associated with a specific geriatric syndrome, they were not developed to explicitly link medicines across multiple geriatric syndromes, regardless of indication or appropriateness. For example, medications that effect important geriatric syndromes like unintentional weight/appetite loss, depression, and urinary incontinence are not extensively covered. In addition, disease‐appropriate medications (eg, ‐blockers for systolic heart failure), that may be associated with a geriatric syndrome (eg, falls) are not included; however, they may be important to consider for a patient and clinician who are weighing the disease benefits compared to the geriatric syndrome‐related risks. Finally, the AGS 2015 Beers criteria panel mentions the limitation that many medication associations may be excluded because older adults are less represented in clinical trials.[20] Clinicians are currently limited in identifying medications potentially contributing to a broad set of geriatric syndromes in their patients without a specific list of medications associated with geriatric syndromes (MAGS).[20]
In response to this gap, identifying these medications is important and should be a starting point in efforts toward prevention and treatment of geriatric syndromes. The 2 main objectives of this study were to first identify medications that may meaningfully contribute to 6 geriatric syndromes and subsequently describe the frequency of these medications in a population transitioning from acute care to postacute care to highlight the need and potential impact of such a list.
METHODS
This study included 2 phases that aligned with our 2 primary objectives. Phase 1 involved identifying medications associated with 6 geriatric syndromes, and phase 2 included a cross‐sectional analysis of the prevalence of these medications in a sample of patients discharged to SNFs.
Phase 1: Development of the MAGS List
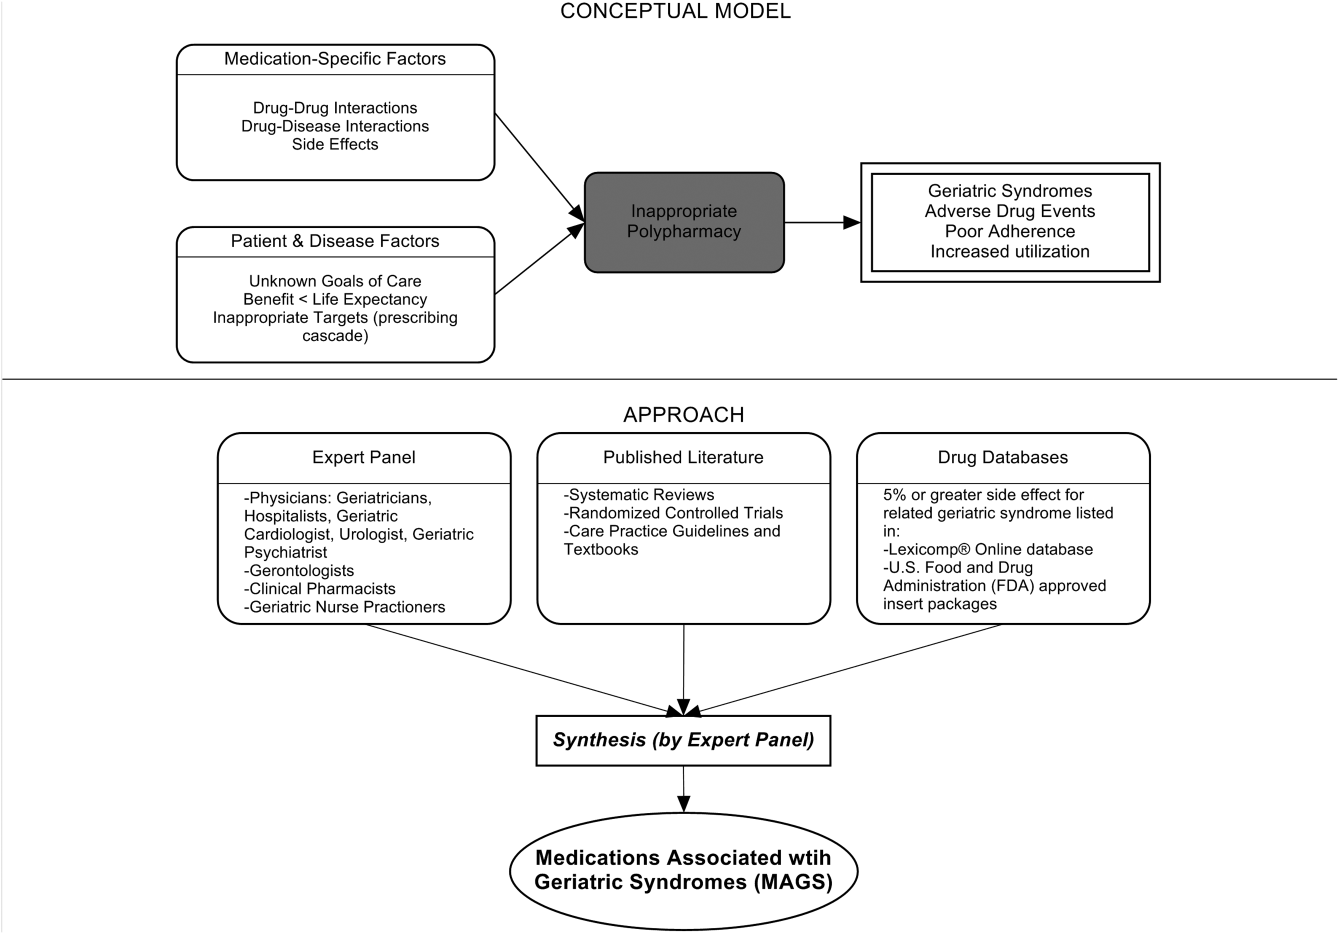
Figure 1 depicts the underlying conceptual model and approach that was used in phase 1. The interaction between the patient factors and medication leads to polypharmacy that contributes to geriatric syndromes and additional adverse outcomes. As a starting point for mitigating geriatric syndromes, we used an iterative analytical process to identify a list of medications associated with the following geriatric syndromes that were documented to be highly prevalent in patients discharged to SNFs: cognitive impairment, delirium, falls, unintentional weight and/or appetite loss, urinary incontinence, and depression.[8] To be inclusive and sensitive, our approach differed from traditional systematic reviews, and in fact was meant to bring together much of the established systematic literature about disparate geriatric syndromes in 1 place, because patients often do not experience a geriatric syndrome in isolation, but rather experience multiple geriatric syndromes.[8] The MAGS list had 3 main inclusion criteria (Figure 1): (1) evidence in the published literature (systematic reviews, cohort studies, randomized clinical trials) that the medication is related to the syndrome, (2) expert panel opinion, and (3) drug databases (Lexicomp Online database[22] and/or US Food and Drug Administration [FDA]approved package inserts).[23] We generated an initial list of medications based on these 3 main criteria to identify medications with significant associations to each geriatric syndrome. The list was further expanded and vetted using an iterative review of each medication list as it related to each geriatric syndrome through a series of group meetings focused around each geriatric syndrome. Following further discussion, we obtained agreement among all team members for medications included in the final list. For each geriatric syndrome, we excluded medications from consideration if they were used to treat the same geriatric syndrome (eg, ‐adrenergic blockers used to treat incontinence in men were listed as associated with incontinence only in women). We classified medications according to the Established Pharmacologic Class available at the FDA website. We also compared our final MAGS list with the 2015 AGS Beer's list[20] by identifying medications that were related to the 6 geriatric syndromes. This included Beers[20]‐cited rationale of anticholinergic, extrapyramidal symptoms, orthostatic hypotension (eg, falls), high‐risk adverse central nervous system effects, sedating, cognitive decline (eg, antipsychotics), delirium, falls, fractures, incontinence, and gastrointestinal (eg, nausea, vomiting). Specifically, we assessed whether the medications were included as inappropriate by the AGS Beers 2015[20] list and also whether they documented the syndrome association for that medication.
Phase 2: Prevalence of MAGS in Hospitalized Older Adults Discharged to SNFs
Sample
We next applied the MAGS list to a convenience sample of hospitalized patients discharged to SNFs to assess the prevalence of MAGS in this sample, and also to compare with the prevalence of Beers criteria[20] medications. Our sample was selected from data collected as part of a quality‐improvement project to reduce hospital readmissions in patients discharged to SNFs. The larger study enrolled a total 1093 medical and surgical patients who had Medicare insurance eligibility and were discharged from 1 large university hospital to 23 area SNFs from January 17, 2013 through July 31, 2014. The university institutional review board waived the requirement for written consent. For the purpose of this substudy. we selected the first 154 patients with complete chart abstraction (approximately 15% of the total) as a convenience sample.
Data Analysis
We applied descriptive statistics to summarize demographic and clinical characteristics of the convenience sample. To understand potential selection biases that could have resulted by the convenience sampling, we compared participant characteristics of the convenience sample (N = 154) with the characteristics of the remaining participants of the larger study (N = 939) using independent sample t tests and 2 tests for continuous and categorical measures, respectively. We applied the MAGS list and the AGS 2015 Beers criteria[20] for the sample of 154 and identified the medications associated with each of the 6 geriatric syndromes from the discharge medication lists completed by hospital clinical pharmacists. For each patient, we identified both scheduled and PRN (pro re nata, or as needed) medications associated with each geriatric syndrome. Thereafter, we determined whether the discharge list contained at least 1 medication associated with a geriatric syndrome per the MAGS list and the AGS Beers 2015 criteria,[20] and the percentage of overall medications that were part of the MAGS and Beers lists. Data were aggregated using means and standard deviations across syndromes (ie, number of discharge medications per syndrome per patient) along with the percentage of patients with 1 or more medications related to a specific syndrome and the percentage of medications that were MAGS. All analyses were performed using the SPSS statistical package (IBM SPSS Statistics for Windows, version 23.0; IBM, Armonk, NY).
RESULTS
Phase 1: MAGS List
The iterative process applied in this analysis generated a list of 513 medications associated with the 6 geriatric syndromes. The list of medications related to each syndrome and the corresponding rationale and relevant references for their inclusion is presented in the Supporting Information, Appendix 1, in the online version of this article. Table 1 summarizes these medications across 18 major drug categories. Antiepileptics were linked to all 6 geriatric syndromes, whereas antipsychotics, antidepressants, antiparkinsonism, and opioid agonists were associated with 5 syndromes. Ten of the 18 categories were associated with 3 geriatric syndromescognitive impairment, delirium, and falls. Four medication categories were associated with only 1 syndrome. Nonopioid/nonsteroidal anti‐inflammatory and/or analgesics and nonopioid cough suppressant and expectorant medications were associated with falls syndrome only. Hormone replacement medications were associated with depression only, and immunosuppressants were associated with unintentional weight and appetite loss only.
| Major Medication Category | Delirium | Cognitive Impairment | Falls | Unintentional Weight and Appetite Loss | Urinary Incontinence | Depression | Drug Class/Drug Within Each Category |
|---|---|---|---|---|---|---|---|
| |||||||
| Antipsychotics | ✓ | ✓ | ✓ | ✓ | Atypical and typical antipsychotics, buspirone | ||
| Antidepressants | ✓ | ✓ | ✓ | ✓ | ✓ | Tricyclic and tetracyclic antidepressants, serotonin reuptake inhibitors, serotonin and norepinephrine reuptake inhibitor, aminoketone | |
| Antiepileptics | ✓ | ✓ | ✓ | ✓ | ✓ | ✓ | Antiepileptics, mood stabilizers, barbiturates |
| Antiparkinsonism | ✓ | ✓ | ✓ | ✓ | ✓ | Aromatic amino acid decarboxylation inhibitor and catechol‐o‐methyltransferase inhibitor, catecholamine‐depleting sympatholytic, catechol‐o‐methyltransferase inhibitor, dopaminergic agonist, ergot derivative, monoamine oxidase inhibitor, nonergot dopamine agonist, | |
| Benzodiazapines | ✓ | ✓ | ✓ | Benzodiazapines only | |||
| Nonbenzodiazepine hypnotics | ✓ | ✓ | ✓ | Benzodiazepine analogs, nonbenzodiazepine hypnotics, tranquilizers, ‐aminobutyric acid A receptor agonist | |||
| Opioid agonists | ✓ | ✓ | ✓ | ✓ | ✓ | Full or partial opioid agonists, opiates, opioids | |
| Nonopioid/nonsteroidal anti‐inflammatory and/or analgesics | ✓ | Nonopioid analgesics, NSAIDs, COX‐2 selective inhibitor NSAIDs | |||||
| Antihypertensives | ✓ | ✓ | ✓ | Calcium channel blocker, ‐adrenergic blocker, angiotensin‐converting enzyme inhibitor, angiotensin 2 receptor blocker, ‐adrenergic blocker, diuretics (loop, potassium sparing, thiazide), nitrate vasodilators, aldosterone blocker | |||
| Antiarrhythmic | ✓ | ✓ | ✓ | Antiarrhythmics, cardiac glycosides | |||
| Antidiabetics | ✓ | ✓ | Insulin and insulin analogs, sulfonylureas, ‐glucosidase inhibitor, amylin analog, biguanide, glinide, GLP‐1 receptor agonist, glucagon‐like peptide‐1 agonist | ||||
| Anticholinergics and/or antihistaminics | ✓ | ✓ | ✓ | ✓ | Anticholinergics, histamine receptor antagonists, muscarininc antagonists, combined anticholinergics, and histamine receptor antagonists | ||
| Antiemetics | ✓ | ✓ | ✓ | Antiemetics, dopaminergic antagonists, dopamine‐2 receptor antagonist | |||
| Hormone replacement | ✓ | Corticosteroids, progestin, estrogen, estrogen agonist/antagonist, gonadotropin releasing hormone receptor agonist | |||||
| Muscle relaxers | ✓ | ✓ | ✓ | ✓ | Muscle relaxers | ||
| Immunosuppressants | ✓ | Calcineurin inhibitor immunosuppressant, folate analog metabolic inhibitor, purine antimetabolite | |||||
| Nonopioid cough suppressants and expectorants | ✓ | Expectorant, non‐narcotic antitussive, ‐1 agonist, uncompetitive N‐methyl‐D‐aspartate receptor antagonist | |||||
| Antimicrobials | ✓ | ✓ | Macrolide, cephalosporin, penicillin class, rifamycin, non‐nucleoside analog reverse transcriptase inhibitor, influenza A M2 protein inhibitor | ||||
| Others | ✓ | ✓ | ✓ | ✓ | ✓ | ✓ | ‐3‐adrenergic agonist, methylxanthine, cholinesterase inhibitor, interferon and , partial cholinergic nicotinic agonist, tyrosine hydroxylase, retinoid, serotonin‐1b and serotonin‐1d receptor agonist, stimulant laxative, vitamin K antagonist, platelet aggregation inhibitor |
Approximately 58% of the medications overlapped with the AGS 2015 Beer's Criteria[20] irrespective of whether the specific syndrome association was stated in the rationale.[20] Medications that overlapped were mostly in the delirium, cognitive impairment, and falls category with only a few overlaps in depression, unintentional weight loss, and urinary incontinence lists (see Supporting Information, Appendix 1, in the online version of this article).
Phase 2: Prevalence of MAGS
Among 154 participants, the mean age was 76.5 (10.6) years, 64.3% were female, 77.9% were white, and 96.1% non‐Hispanic. The median hospital length of stay was 6 days, with an interquartile range of 5 days. The orthopedic service discharged the highest proportion of patients (24%), followed by the geriatrics and internal medicine services, which each discharged 19.5% of the patients (Table 2). The remaining participants of the larger quality‐improvement project (N = 939) did not significantly differ on these demographic and clinical characteristics except for hospital length of stay, which was shorter in the sample analyzed (see Supporting Information, Appendix 2, in the online version of this article).
| Baseline Characteristics | Mean ( SD) or Percent (n) |
|---|---|
| |
| Age, y | 76.5 ( 10.6) |
| Sex | |
| Female | 64.3% (99) |
| Race | |
| White | 77.9% (126) |
| Black | 16.2% (25) |
| Unknown | 0.6% (1) |
| Declined | 0.6% (1) |
| Missing | 0.6% (1) |
| Ethnicity | |
| Non‐Hispanic | 96.1% (148) |
| Hispanic | 1.3% (2) |
| Unknown | 2.6% (4) |
| Hospital length of stay, d | 7.0 ( 4.2) |
| Hospital length of stay, d, median (IQR) | 6.0 (5.0) |
| No. of hospital discharge medications, count | 14.0 ( 4.7) |
| Discharge service | |
| Orthopedic service | 24.0% (37) |
| Geriatric service | 19.5% (30) |
| Internal medicine | 19.5% (30) |
| Other | 37.0% (57) |
Patients were discharged to SNFs with an average of 14.0 (4.7) medication orders. Overall, 43% (13%) of these discharge medication orders were MAGS. Every patient in the sample was ordered at least 1 medication associated with geriatric syndromes. Multiple MAGS were the norm, with an average of 5.9 (2.2) MAGS per patient. MAGS were also the norm, as 98.1% of the sample had medication orders associated with at least 2 different syndromes.
When the Beer's criteria[20] were applied to the medication orders (instead of the MAGS list), problematic medications appeared less common. Patients had an average of 3.04 (1.7) MAGS that were also listed on the AGS 2015 Beer's list,[20] representing an average of 22.3% of all discharge orders.
Table 3 illustrates the average number of medications per patient associated with each syndrome, and the percentage of patients (number in parentheses) discharged with at least 1 medication associated with each syndrome per the MAGS list and the Beers 2015 criteria.[20] For example, per the MAGS list, the syndrome most frequently associated with medications was falls, with patients discharged on an average of 5.5 (2.2) medications associated with falls, and 100% of the sample had at least 1 discharge medication associated with falls. Alternatively, the syndrome associated with the lowest frequency of medications was unintentional weight loss (with an average of 0.38 medications per patient), although 36% of these patients had more than 1 discharge medication associated with weight loss. As seen in Table 3, the mean and prevalence of 1 or more medications associated with each of the geriatric syndromes as identified by the Beers 2015 criteria[20] was lower than those identified by the MAGS list developed for this study.
| Geriatric Syndromes | Associated Medications per MAGS List | Associated Medications per AGS Beers 2015 Criteria | ||
|---|---|---|---|---|
| Mean SD | Percentage of Patients Receiving 1 Related Medication | Mean SD | Percentage of Patients Receiving 1 Related Medication | |
| ||||
| Cognitive impairment | 1.8 ( 1.2) | 84.4% (130) | 1.6 ( 1.2) | 78.6% (121) |
| Delirium | 1.4 ( 1.1) | 76.0% (117) | 1.3 ( 1.2) | 68.2% (105) |
| Falls | 5.5 ( 2.2) | 100% (154) | 2.6 ( 1.6) | 92.2% (142) |
| Unintentional weight and/or appetite loss | 0.4 ( 0.5) | 36.3% (56) | 0.1 ( 0.3) | 6.5% (10) |
| Urinary incontinence | 1.6 ( 1.0) | 85.7% (132) | 0.1 ( 0.2) | 5.8% (9) |
| Depression | 1.7 ( 1.0) | 90.9% (140) | 0.0 ( 0.0) | 0.0% (0) |
| All syndromes | 5.9 ( 2.2) | 100% (154) | 3.0 ( 1.7) | 95% (149) |
DISCUSSION
An iterative process of evidence review by a multidisciplinary panel resulted in a list of 513 medications associated with 6 common geriatric syndromes. This analysis demonstrated that hospitalized, older patients discharged to SNFs were frequently prescribed MAGS. The rate of prescribing ranged from 100% of patients with a medication associated with falls to 36% for unintentional weight loss. Moreover, an alarming 43% of all medications at hospital discharge were MAGS. For this vulnerable population, the combination of high prevalence of MAGS and high risk of geriatric syndromes emphasize a need to critically review the risks and benefits of MAGS throughout hospitalization and at the time of discharge.
A body of evidence demonstrates that many drugs in a typical older adult regimen have no specific clinical indication, are considered inappropriate, or have uncertain efficacy in the geriatric population.[24, 25, 26] This study builds on the foundational work described in landmark reviews such as the AGS Beers[20] and STOPP/START[21] (Screening Tool of Older Persons' Potentially Inappropriate Prescriptions/Screening Tool to Alert doctors to Right, i.e. appropriate indicated Treatment) criteria. Both of these tools, however, were specifically designed as screening tools to identify medications considered unsafe for older adults under most circumstances and within specific illness states.[19, 20, 21] They are most often utilized when starting a medication to avoid acute adverse events. In contrast, the MAGS list was developed to be inclusive of medications that are often appropriate for many medical diagnoses but may also contribute to underlying geriatric syndromes that are more chronic in nature. In addition, inclusion of such medicines increases the sensitivity of screening for medications that can be targeted through patient‐centered deprescribing efforts when clinically appropriate.
A major strength of this study is that we bring together evidence across a spectrum of geriatric syndromes commonly experienced by hospitalized elders. In addition to evaluating multiple syndromes, we applied multiple modalities; particularly the use of an iterative review process by a multidisciplinary team of experts and using Lexicomp and FDA insert packages for linking medications to specific geriatric conditions. The inclusion criteria were broadened beyond single sources of evidence in an effort to capture a comprehensive list of medications. As a result, the MAGS list can be implemented as a screening tool for deprescribing interventions and assessing medication appropriateness to address individual or clusters of geriatric syndromes within a patient.
In addition to expanding this knowledge base, clinical relevance of the MAGS list is highlighted by its application to a sample of hospitalized older adults discharged to SNFs, a cohort known to experience geriatric syndromes. In fact, 43% of patients' medications at hospital discharge were MAGS. Importantly, due to the cross‐sectional nature of this study, we cannot be certain if the medication caused or potentiated each of the geriatric syndromes. However, hospitals and SNFs are devoting major resources toward reduction of falls, avoidance of urinary catheter use, and reduction of preventable readmissions. These efforts can be complemented by considering the number of medications associated with falls, urinary incontinence, and overall MAGS burden. The striking prevalence of MAGS demonstrates a rigorous need to weigh the risks and benefits of these medications. Above all, the intent of this study is not to propose that any MAGS be reflexively stopped, but rather that the MAGS list should facilitate a holistic approach to care for the complex older adult. For example, standard therapies such as gabapentin may be appropriate for treating neuralgic pain but may also contribute to falls and urinary incontinence. Thus, alternative pain treatments could be selected in place of gabapentin for a 75‐year old patient who is experiencing recurrent falls and increasing incontinence. Therefore, the MAGS list enables a patient‐provider discussion wherein medications' therapeutic benefits can be weighed against risks posed by specific clusters of geriatric syndromes, potential impact on quality of life, and consistency with goals of care.
This study has some limitations. First, although we examined a broad number of geriatric syndromes, several other geriatric syndromes experienced by hospitalized older adults were not addressed including: fecal incontinence, insomnia, and functional impairment. These syndromes were intentionally excluded from the study a priori due to reasons of feasibility and scope. Second, unlike the Beer's 2015 criteria, the MAGS list does not sub‐classify associations of medications with geriatric syndromes for patients with specific diseases (eg, heart failure). In fact, our MAGS list included medications often indicated in treating these diagnoses. A clinician must work with the patient to weigh the disease‐specific benefits of some medications with the potential effect on geriatric syndrome symptoms and outcomes. Third, the instrument has a very high sensitivity, which was intended to generate an inclusive list of medications that enables providers to weigh risks of geriatric syndromes with the intended indication benefit. The objective is not to use this list as a reflexive tool but rather help clinicians identify a starting point to address geriatric syndromes in their patients to make patient‐centered medication decisions. Although the MAGS list is intentionally large (sensitive), the advent of advanced bioinformatics can enable MAGS to be assessed in the future for both clinical and research purposes. Fourth, FDA insert packages and Lexicomp databases report anything experienced by the patient while on the particular medication, but it might not necessarily imply a causative link. The high use of MAGS and the specific geriatric syndrome may coexist due to the high prevalence and interplay of multimorbidity, polypharmacy, and geriatric syndromes in this population. Last, the list was developed by expert panel members predominantly from a single institution, which may introduce bias. Despite these limitations, the prevalence of these medications in a sample of patients transitioning from acute to postacute care highlights the utility of the MAGS list in future clinical research and quality improvement endeavors.
In conclusion, the MAGS list provides a comprehensive and sensitive indicator of medications associated with any of 6 geriatric syndromes regardless of medication indication and appropriateness. The MAGS list provides an overall degree of medication burden with respect to geriatric syndromes and a foundation for future research to assess the relationship between the presence of geriatric syndromes and syndrome‐associated medications. The MAGS list is an important first step in summarizing the data that link medications to geriatric syndromes. Future studies are needed to broaden the analysis of MAGS for other common geriatric syndromes and to identify new and emerging medications not present during the time of this analysis. The MAGS list has the potential to facilitate deprescribing efforts needed to combat the epidemic of overprescribing that may be contributing to the burden of geriatric syndromes among older patients.
Acknowledgements
The authors thank Dr. Linda Beuscher, Dr. Patricia Blair Miller, Dr. Joseph Ouslander, Dr. William Stuart Reynolds, and Dr. Warren Taylor for providing their expertise and participating in the expert panel discussions that facilitated the development of the MAGS list. The authors also recognize the research support provided by Christopher Simon Coelho.
Disclosures: This research was supported by the Department of Health and Human Services, Centers for Medicare & Medicaid Services grant #1C1CMS331006 awarded to Principal Investigator, John F. Schnelle, PhD. Dr. Vasilevskis was supported by the National Institute on Aging of the National Institutes of Health award K23AG040157 and the Geriatric Research, Education and Clinical Center. Dr. Bell was supported by National Institute on Aging‐K award K23AG048347‐01A1. Dr. Mixon is supported by a Veterans Affairs Health Services Research & Development Career Development Award (12‐168). This research was also supported by the National Center for Advancing Translational Sciences Clinical and Translational Science award UL1TR000445. The contents of this publication are solely the responsibility of the authors and do not necessarily represent the official views of the US Department of Health and Human Services or any of its agencies, the National Center for Advancing Translation Science, the National Institutes of Health, or the Department of Veterans Affairs. Each coauthor contributed significantly to the manuscript. Dr. Kripalani has received stock/stock options from Bioscape Digital, LLC. None of the other authors have significant conflicts of interest to report related to this project or the results reported within this article.
- , , , . Geriatric syndromes: clinical, research, and policy implications of a core geriatric concept. J Am Geriatr Soc. 2007;55:780–791.
- , , , . Shared risk factors for falls, incontinence, and functional dependence. Unifying the approach to geriatric syndromes. JAMA. 1995;273:1348–1353.
- , , , . Geriatric syndromes: medical misnomer or progress in geriatrics? Neth J Med. 2003;61:83–87.
- , , , et al. Geriatric conditions in acutely hospitalized older patients: prevalence and one‐year survival and functional decline. PLoS One. 2011;6:e26951.
- , , , , . Geriatric conditions as predictors of increased number of hospital admissions and hospital bed days over one year: findings of a nationwide cohort of older adults from Taiwan. Arch Gerontol Geriatr. 2014;59:169–174.
- , , , , . Geriatric conditions and disability: the Health and Retirement Study. Ann Intern Med. 2007;147:156–164.
- , , , , , . A prospective cohort study of geriatric syndromes among older medical patients admitted to acute care hospitals. J Am Geriatr Soc. 2011;59:2001–2008.
- , , , et al. Geriatric syndromes in hospitalized older adults discharged to skilled nursing facilities. J Am Geriatr Soc. 2016;64(4):715–722.
- , , , et al. Discharge to a skilled nursing facility and subsequent clinical outcomes among older patients hospitalized for heart failure. Circ Heart Fail. 2011;4:293–300.
- . Hazards of hospitalization of the elderly. Ann Intern Med. 1993;118:219–223.
- , , , , . Geriatric syndromes in elderly patients admitted to an inpatient cardiology ward. J Hosp Med. 2007;2:394–400.
- , , , . Effect of hospitalization on inappropriate prescribing in elderly Medicare beneficiaries. J Am Geriatr Soc. 2015;63:699–707.
- , , , et al. Polypharmacy cutoff and outcomes: five or more medicines were used to identify community‐dwelling older men at risk of different adverse outcomes. J Clin Epidemiol. 2012;65:989–995.
- , , , , . Investigating polypharmacy and drug burden index in hospitalised older people. Intern Med J. 2013;43:912–918.
- , . Potentially harmful drug‐drug interactions in the elderly: a review. Am J Geriatr Pharmacother. 2011;9:364–377.
- , , , . Hospital admissions/visits associated with drug‐drug interactions: a systematic review and meta‐analysis. Pharmacoepidemiol Drug Saf. 2014;23:489–497.
- , . Optimising drug treatment for elderly people: the prescribing cascade. BMJ. 1997;315:1096–1099.
- , , , et al. Association between acute geriatric syndromes and medication‐related hospital admissions. Drugs Aging. 2012;29:691–699.
- American Geriatrics Society Beers Criteria Update Expert P. American Geriatrics Society updated Beers Criteria for potentially inappropriate medication use in older adults. J Am Geriatr Soc. 2012;60:616–631.
- By the American Geriatrics Society 2015 Beers Criteria Update Expert Panel. American Geriatrics Society 2015 updated Beers criteria for potentially inappropriate medication use in older adults. J Am Geriatr Soc. 2015;63:2227–2246.
- , . STOPP (Screening Tool of Older Persons' potentially inappropriate Prescriptions): application to acutely ill elderly patients and comparison with Beers' criteria. Age Ageing. 2008;37:673–679.
- , , , et al. Warfarin versus aspirin for stroke prevention in an elderly community population with atrial fibrillation (the Birmingham Atrial Fibrillation Treatment of the Aged Study, BAFTA): a randomised controlled trial. Lancet. 2007;370:493–503.
- U.S. Food and Drug Administration. Drugs. Available at: http://www.fda.gov/Drugs/default.htm. Accessed May 15th, 2015.
- , , , et al. Inappropriate medication use among frail elderly inpatients. Ann Pharmacother. 2004;38:9–14.
- , , , et al. Inappropriate medications in elderly ICU survivors: where to intervene? Arch Intern Med. 2011;171:1032–1034.
- , , , et al. Appropriateness of medication prescribing in ambulatory elderly patients. J Am Geriatr Soc. 1994;42:1241–1247.
Geriatric syndromes are common clinical conditions in older adults that do not fall into specific disease categories. Unlike the traditional definition of a syndrome, geriatric syndrome refers to a condition that is mediated by multiple shared underlying risk factors.[1, 2] Conditions commonly referred to as geriatric syndromes include delirium, cognitive impairment, falls, unintentional weight loss, depressive symptoms, and incontinence. Even though many perceive it as medical misnomer,[3] geriatric syndromes have been shown to negatively impact quality of life and activities of daily living in older adults.[2] They are also associated with adverse outcomes such as increased healthcare utilization, functional decline, and mortality, even after adjusting for age and disease severity.[4, 5, 6] Hospitalized older adults, including those discharged to skilled nursing facilities (SNFs)[7, 8] are particularly at high risk for new‐onset or exacerbation of geriatric syndromes and poor outcomes.[7, 9, 10] However, hospital providers seldom assess, manage, or document geriatric syndromes because they are often overshadowed by disease conditions that lead to an acute episode requiring hospitalization (e.g., heart disease).[11]
Pharmacotherapy is the cornerstone of hospital treatment, and it is well‐known that it affects multiple physiologic systems causing side effects apart from the condition they are approved to treat. Given that geriatric syndromes are a result of impairments in multiple organ systems, it is plausible that pharmacotherapy may initiate or worsen these syndromes.[12] Medication‐related problems in older adults are well known. Polypharmacy and adverse drug events (as a result of drug‐drug/disease interactions and changes in pharmacokinetics and pharmacodynamics) are prevalent in multimorbid elderly patients.[13, 14, 15, 16] The prescribing cascade[17] increases the medication burden and may be a contributing factor for geriatric syndromes in hospitalized patients.[18] For instance, laxatives may be prescribed to counteract constipation caused by anticholinergic drugs.
The American Geriatric Society (AGS) Beers list[19, 20] and similar criteria[21] provide excellent resources to identify medications with potentially harmful interactions or adverse effects in older adults. Although these lists include medicines associated with a specific geriatric syndrome, they were not developed to explicitly link medicines across multiple geriatric syndromes, regardless of indication or appropriateness. For example, medications that effect important geriatric syndromes like unintentional weight/appetite loss, depression, and urinary incontinence are not extensively covered. In addition, disease‐appropriate medications (eg, ‐blockers for systolic heart failure), that may be associated with a geriatric syndrome (eg, falls) are not included; however, they may be important to consider for a patient and clinician who are weighing the disease benefits compared to the geriatric syndrome‐related risks. Finally, the AGS 2015 Beers criteria panel mentions the limitation that many medication associations may be excluded because older adults are less represented in clinical trials.[20] Clinicians are currently limited in identifying medications potentially contributing to a broad set of geriatric syndromes in their patients without a specific list of medications associated with geriatric syndromes (MAGS).[20]
In response to this gap, identifying these medications is important and should be a starting point in efforts toward prevention and treatment of geriatric syndromes. The 2 main objectives of this study were to first identify medications that may meaningfully contribute to 6 geriatric syndromes and subsequently describe the frequency of these medications in a population transitioning from acute care to postacute care to highlight the need and potential impact of such a list.
METHODS
This study included 2 phases that aligned with our 2 primary objectives. Phase 1 involved identifying medications associated with 6 geriatric syndromes, and phase 2 included a cross‐sectional analysis of the prevalence of these medications in a sample of patients discharged to SNFs.
Phase 1: Development of the MAGS List
Figure 1 depicts the underlying conceptual model and approach that was used in phase 1. The interaction between the patient factors and medication leads to polypharmacy that contributes to geriatric syndromes and additional adverse outcomes. As a starting point for mitigating geriatric syndromes, we used an iterative analytical process to identify a list of medications associated with the following geriatric syndromes that were documented to be highly prevalent in patients discharged to SNFs: cognitive impairment, delirium, falls, unintentional weight and/or appetite loss, urinary incontinence, and depression.[8] To be inclusive and sensitive, our approach differed from traditional systematic reviews, and in fact was meant to bring together much of the established systematic literature about disparate geriatric syndromes in 1 place, because patients often do not experience a geriatric syndrome in isolation, but rather experience multiple geriatric syndromes.[8] The MAGS list had 3 main inclusion criteria (Figure 1): (1) evidence in the published literature (systematic reviews, cohort studies, randomized clinical trials) that the medication is related to the syndrome, (2) expert panel opinion, and (3) drug databases (Lexicomp Online database[22] and/or US Food and Drug Administration [FDA]approved package inserts).[23] We generated an initial list of medications based on these 3 main criteria to identify medications with significant associations to each geriatric syndrome. The list was further expanded and vetted using an iterative review of each medication list as it related to each geriatric syndrome through a series of group meetings focused around each geriatric syndrome. Following further discussion, we obtained agreement among all team members for medications included in the final list. For each geriatric syndrome, we excluded medications from consideration if they were used to treat the same geriatric syndrome (eg, ‐adrenergic blockers used to treat incontinence in men were listed as associated with incontinence only in women). We classified medications according to the Established Pharmacologic Class available at the FDA website. We also compared our final MAGS list with the 2015 AGS Beer's list[20] by identifying medications that were related to the 6 geriatric syndromes. This included Beers[20]‐cited rationale of anticholinergic, extrapyramidal symptoms, orthostatic hypotension (eg, falls), high‐risk adverse central nervous system effects, sedating, cognitive decline (eg, antipsychotics), delirium, falls, fractures, incontinence, and gastrointestinal (eg, nausea, vomiting). Specifically, we assessed whether the medications were included as inappropriate by the AGS Beers 2015[20] list and also whether they documented the syndrome association for that medication.
Phase 2: Prevalence of MAGS in Hospitalized Older Adults Discharged to SNFs
Sample
We next applied the MAGS list to a convenience sample of hospitalized patients discharged to SNFs to assess the prevalence of MAGS in this sample, and also to compare with the prevalence of Beers criteria[20] medications. Our sample was selected from data collected as part of a quality‐improvement project to reduce hospital readmissions in patients discharged to SNFs. The larger study enrolled a total 1093 medical and surgical patients who had Medicare insurance eligibility and were discharged from 1 large university hospital to 23 area SNFs from January 17, 2013 through July 31, 2014. The university institutional review board waived the requirement for written consent. For the purpose of this substudy. we selected the first 154 patients with complete chart abstraction (approximately 15% of the total) as a convenience sample.
Data Analysis
We applied descriptive statistics to summarize demographic and clinical characteristics of the convenience sample. To understand potential selection biases that could have resulted by the convenience sampling, we compared participant characteristics of the convenience sample (N = 154) with the characteristics of the remaining participants of the larger study (N = 939) using independent sample t tests and 2 tests for continuous and categorical measures, respectively. We applied the MAGS list and the AGS 2015 Beers criteria[20] for the sample of 154 and identified the medications associated with each of the 6 geriatric syndromes from the discharge medication lists completed by hospital clinical pharmacists. For each patient, we identified both scheduled and PRN (pro re nata, or as needed) medications associated with each geriatric syndrome. Thereafter, we determined whether the discharge list contained at least 1 medication associated with a geriatric syndrome per the MAGS list and the AGS Beers 2015 criteria,[20] and the percentage of overall medications that were part of the MAGS and Beers lists. Data were aggregated using means and standard deviations across syndromes (ie, number of discharge medications per syndrome per patient) along with the percentage of patients with 1 or more medications related to a specific syndrome and the percentage of medications that were MAGS. All analyses were performed using the SPSS statistical package (IBM SPSS Statistics for Windows, version 23.0; IBM, Armonk, NY).
RESULTS
Phase 1: MAGS List
The iterative process applied in this analysis generated a list of 513 medications associated with the 6 geriatric syndromes. The list of medications related to each syndrome and the corresponding rationale and relevant references for their inclusion is presented in the Supporting Information, Appendix 1, in the online version of this article. Table 1 summarizes these medications across 18 major drug categories. Antiepileptics were linked to all 6 geriatric syndromes, whereas antipsychotics, antidepressants, antiparkinsonism, and opioid agonists were associated with 5 syndromes. Ten of the 18 categories were associated with 3 geriatric syndromescognitive impairment, delirium, and falls. Four medication categories were associated with only 1 syndrome. Nonopioid/nonsteroidal anti‐inflammatory and/or analgesics and nonopioid cough suppressant and expectorant medications were associated with falls syndrome only. Hormone replacement medications were associated with depression only, and immunosuppressants were associated with unintentional weight and appetite loss only.
| Major Medication Category | Delirium | Cognitive Impairment | Falls | Unintentional Weight and Appetite Loss | Urinary Incontinence | Depression | Drug Class/Drug Within Each Category |
|---|---|---|---|---|---|---|---|
| |||||||
| Antipsychotics | ✓ | ✓ | ✓ | ✓ | Atypical and typical antipsychotics, buspirone | ||
| Antidepressants | ✓ | ✓ | ✓ | ✓ | ✓ | Tricyclic and tetracyclic antidepressants, serotonin reuptake inhibitors, serotonin and norepinephrine reuptake inhibitor, aminoketone | |
| Antiepileptics | ✓ | ✓ | ✓ | ✓ | ✓ | ✓ | Antiepileptics, mood stabilizers, barbiturates |
| Antiparkinsonism | ✓ | ✓ | ✓ | ✓ | ✓ | Aromatic amino acid decarboxylation inhibitor and catechol‐o‐methyltransferase inhibitor, catecholamine‐depleting sympatholytic, catechol‐o‐methyltransferase inhibitor, dopaminergic agonist, ergot derivative, monoamine oxidase inhibitor, nonergot dopamine agonist, | |
| Benzodiazapines | ✓ | ✓ | ✓ | Benzodiazapines only | |||
| Nonbenzodiazepine hypnotics | ✓ | ✓ | ✓ | Benzodiazepine analogs, nonbenzodiazepine hypnotics, tranquilizers, ‐aminobutyric acid A receptor agonist | |||
| Opioid agonists | ✓ | ✓ | ✓ | ✓ | ✓ | Full or partial opioid agonists, opiates, opioids | |
| Nonopioid/nonsteroidal anti‐inflammatory and/or analgesics | ✓ | Nonopioid analgesics, NSAIDs, COX‐2 selective inhibitor NSAIDs | |||||
| Antihypertensives | ✓ | ✓ | ✓ | Calcium channel blocker, ‐adrenergic blocker, angiotensin‐converting enzyme inhibitor, angiotensin 2 receptor blocker, ‐adrenergic blocker, diuretics (loop, potassium sparing, thiazide), nitrate vasodilators, aldosterone blocker | |||
| Antiarrhythmic | ✓ | ✓ | ✓ | Antiarrhythmics, cardiac glycosides | |||
| Antidiabetics | ✓ | ✓ | Insulin and insulin analogs, sulfonylureas, ‐glucosidase inhibitor, amylin analog, biguanide, glinide, GLP‐1 receptor agonist, glucagon‐like peptide‐1 agonist | ||||
| Anticholinergics and/or antihistaminics | ✓ | ✓ | ✓ | ✓ | Anticholinergics, histamine receptor antagonists, muscarininc antagonists, combined anticholinergics, and histamine receptor antagonists | ||
| Antiemetics | ✓ | ✓ | ✓ | Antiemetics, dopaminergic antagonists, dopamine‐2 receptor antagonist | |||
| Hormone replacement | ✓ | Corticosteroids, progestin, estrogen, estrogen agonist/antagonist, gonadotropin releasing hormone receptor agonist | |||||
| Muscle relaxers | ✓ | ✓ | ✓ | ✓ | Muscle relaxers | ||
| Immunosuppressants | ✓ | Calcineurin inhibitor immunosuppressant, folate analog metabolic inhibitor, purine antimetabolite | |||||
| Nonopioid cough suppressants and expectorants | ✓ | Expectorant, non‐narcotic antitussive, ‐1 agonist, uncompetitive N‐methyl‐D‐aspartate receptor antagonist | |||||
| Antimicrobials | ✓ | ✓ | Macrolide, cephalosporin, penicillin class, rifamycin, non‐nucleoside analog reverse transcriptase inhibitor, influenza A M2 protein inhibitor | ||||
| Others | ✓ | ✓ | ✓ | ✓ | ✓ | ✓ | ‐3‐adrenergic agonist, methylxanthine, cholinesterase inhibitor, interferon and , partial cholinergic nicotinic agonist, tyrosine hydroxylase, retinoid, serotonin‐1b and serotonin‐1d receptor agonist, stimulant laxative, vitamin K antagonist, platelet aggregation inhibitor |
Approximately 58% of the medications overlapped with the AGS 2015 Beer's Criteria[20] irrespective of whether the specific syndrome association was stated in the rationale.[20] Medications that overlapped were mostly in the delirium, cognitive impairment, and falls category with only a few overlaps in depression, unintentional weight loss, and urinary incontinence lists (see Supporting Information, Appendix 1, in the online version of this article).
Phase 2: Prevalence of MAGS
Among 154 participants, the mean age was 76.5 (10.6) years, 64.3% were female, 77.9% were white, and 96.1% non‐Hispanic. The median hospital length of stay was 6 days, with an interquartile range of 5 days. The orthopedic service discharged the highest proportion of patients (24%), followed by the geriatrics and internal medicine services, which each discharged 19.5% of the patients (Table 2). The remaining participants of the larger quality‐improvement project (N = 939) did not significantly differ on these demographic and clinical characteristics except for hospital length of stay, which was shorter in the sample analyzed (see Supporting Information, Appendix 2, in the online version of this article).
| Baseline Characteristics | Mean ( SD) or Percent (n) |
|---|---|
| |
| Age, y | 76.5 ( 10.6) |
| Sex | |
| Female | 64.3% (99) |
| Race | |
| White | 77.9% (126) |
| Black | 16.2% (25) |
| Unknown | 0.6% (1) |
| Declined | 0.6% (1) |
| Missing | 0.6% (1) |
| Ethnicity | |
| Non‐Hispanic | 96.1% (148) |
| Hispanic | 1.3% (2) |
| Unknown | 2.6% (4) |
| Hospital length of stay, d | 7.0 ( 4.2) |
| Hospital length of stay, d, median (IQR) | 6.0 (5.0) |
| No. of hospital discharge medications, count | 14.0 ( 4.7) |
| Discharge service | |
| Orthopedic service | 24.0% (37) |
| Geriatric service | 19.5% (30) |
| Internal medicine | 19.5% (30) |
| Other | 37.0% (57) |
Patients were discharged to SNFs with an average of 14.0 (4.7) medication orders. Overall, 43% (13%) of these discharge medication orders were MAGS. Every patient in the sample was ordered at least 1 medication associated with geriatric syndromes. Multiple MAGS were the norm, with an average of 5.9 (2.2) MAGS per patient. MAGS were also the norm, as 98.1% of the sample had medication orders associated with at least 2 different syndromes.
When the Beer's criteria[20] were applied to the medication orders (instead of the MAGS list), problematic medications appeared less common. Patients had an average of 3.04 (1.7) MAGS that were also listed on the AGS 2015 Beer's list,[20] representing an average of 22.3% of all discharge orders.
Table 3 illustrates the average number of medications per patient associated with each syndrome, and the percentage of patients (number in parentheses) discharged with at least 1 medication associated with each syndrome per the MAGS list and the Beers 2015 criteria.[20] For example, per the MAGS list, the syndrome most frequently associated with medications was falls, with patients discharged on an average of 5.5 (2.2) medications associated with falls, and 100% of the sample had at least 1 discharge medication associated with falls. Alternatively, the syndrome associated with the lowest frequency of medications was unintentional weight loss (with an average of 0.38 medications per patient), although 36% of these patients had more than 1 discharge medication associated with weight loss. As seen in Table 3, the mean and prevalence of 1 or more medications associated with each of the geriatric syndromes as identified by the Beers 2015 criteria[20] was lower than those identified by the MAGS list developed for this study.
| Geriatric Syndromes | Associated Medications per MAGS List | Associated Medications per AGS Beers 2015 Criteria | ||
|---|---|---|---|---|
| Mean SD | Percentage of Patients Receiving 1 Related Medication | Mean SD | Percentage of Patients Receiving 1 Related Medication | |
| ||||
| Cognitive impairment | 1.8 ( 1.2) | 84.4% (130) | 1.6 ( 1.2) | 78.6% (121) |
| Delirium | 1.4 ( 1.1) | 76.0% (117) | 1.3 ( 1.2) | 68.2% (105) |
| Falls | 5.5 ( 2.2) | 100% (154) | 2.6 ( 1.6) | 92.2% (142) |
| Unintentional weight and/or appetite loss | 0.4 ( 0.5) | 36.3% (56) | 0.1 ( 0.3) | 6.5% (10) |
| Urinary incontinence | 1.6 ( 1.0) | 85.7% (132) | 0.1 ( 0.2) | 5.8% (9) |
| Depression | 1.7 ( 1.0) | 90.9% (140) | 0.0 ( 0.0) | 0.0% (0) |
| All syndromes | 5.9 ( 2.2) | 100% (154) | 3.0 ( 1.7) | 95% (149) |
DISCUSSION
An iterative process of evidence review by a multidisciplinary panel resulted in a list of 513 medications associated with 6 common geriatric syndromes. This analysis demonstrated that hospitalized, older patients discharged to SNFs were frequently prescribed MAGS. The rate of prescribing ranged from 100% of patients with a medication associated with falls to 36% for unintentional weight loss. Moreover, an alarming 43% of all medications at hospital discharge were MAGS. For this vulnerable population, the combination of high prevalence of MAGS and high risk of geriatric syndromes emphasize a need to critically review the risks and benefits of MAGS throughout hospitalization and at the time of discharge.
A body of evidence demonstrates that many drugs in a typical older adult regimen have no specific clinical indication, are considered inappropriate, or have uncertain efficacy in the geriatric population.[24, 25, 26] This study builds on the foundational work described in landmark reviews such as the AGS Beers[20] and STOPP/START[21] (Screening Tool of Older Persons' Potentially Inappropriate Prescriptions/Screening Tool to Alert doctors to Right, i.e. appropriate indicated Treatment) criteria. Both of these tools, however, were specifically designed as screening tools to identify medications considered unsafe for older adults under most circumstances and within specific illness states.[19, 20, 21] They are most often utilized when starting a medication to avoid acute adverse events. In contrast, the MAGS list was developed to be inclusive of medications that are often appropriate for many medical diagnoses but may also contribute to underlying geriatric syndromes that are more chronic in nature. In addition, inclusion of such medicines increases the sensitivity of screening for medications that can be targeted through patient‐centered deprescribing efforts when clinically appropriate.
A major strength of this study is that we bring together evidence across a spectrum of geriatric syndromes commonly experienced by hospitalized elders. In addition to evaluating multiple syndromes, we applied multiple modalities; particularly the use of an iterative review process by a multidisciplinary team of experts and using Lexicomp and FDA insert packages for linking medications to specific geriatric conditions. The inclusion criteria were broadened beyond single sources of evidence in an effort to capture a comprehensive list of medications. As a result, the MAGS list can be implemented as a screening tool for deprescribing interventions and assessing medication appropriateness to address individual or clusters of geriatric syndromes within a patient.
In addition to expanding this knowledge base, clinical relevance of the MAGS list is highlighted by its application to a sample of hospitalized older adults discharged to SNFs, a cohort known to experience geriatric syndromes. In fact, 43% of patients' medications at hospital discharge were MAGS. Importantly, due to the cross‐sectional nature of this study, we cannot be certain if the medication caused or potentiated each of the geriatric syndromes. However, hospitals and SNFs are devoting major resources toward reduction of falls, avoidance of urinary catheter use, and reduction of preventable readmissions. These efforts can be complemented by considering the number of medications associated with falls, urinary incontinence, and overall MAGS burden. The striking prevalence of MAGS demonstrates a rigorous need to weigh the risks and benefits of these medications. Above all, the intent of this study is not to propose that any MAGS be reflexively stopped, but rather that the MAGS list should facilitate a holistic approach to care for the complex older adult. For example, standard therapies such as gabapentin may be appropriate for treating neuralgic pain but may also contribute to falls and urinary incontinence. Thus, alternative pain treatments could be selected in place of gabapentin for a 75‐year old patient who is experiencing recurrent falls and increasing incontinence. Therefore, the MAGS list enables a patient‐provider discussion wherein medications' therapeutic benefits can be weighed against risks posed by specific clusters of geriatric syndromes, potential impact on quality of life, and consistency with goals of care.
This study has some limitations. First, although we examined a broad number of geriatric syndromes, several other geriatric syndromes experienced by hospitalized older adults were not addressed including: fecal incontinence, insomnia, and functional impairment. These syndromes were intentionally excluded from the study a priori due to reasons of feasibility and scope. Second, unlike the Beer's 2015 criteria, the MAGS list does not sub‐classify associations of medications with geriatric syndromes for patients with specific diseases (eg, heart failure). In fact, our MAGS list included medications often indicated in treating these diagnoses. A clinician must work with the patient to weigh the disease‐specific benefits of some medications with the potential effect on geriatric syndrome symptoms and outcomes. Third, the instrument has a very high sensitivity, which was intended to generate an inclusive list of medications that enables providers to weigh risks of geriatric syndromes with the intended indication benefit. The objective is not to use this list as a reflexive tool but rather help clinicians identify a starting point to address geriatric syndromes in their patients to make patient‐centered medication decisions. Although the MAGS list is intentionally large (sensitive), the advent of advanced bioinformatics can enable MAGS to be assessed in the future for both clinical and research purposes. Fourth, FDA insert packages and Lexicomp databases report anything experienced by the patient while on the particular medication, but it might not necessarily imply a causative link. The high use of MAGS and the specific geriatric syndrome may coexist due to the high prevalence and interplay of multimorbidity, polypharmacy, and geriatric syndromes in this population. Last, the list was developed by expert panel members predominantly from a single institution, which may introduce bias. Despite these limitations, the prevalence of these medications in a sample of patients transitioning from acute to postacute care highlights the utility of the MAGS list in future clinical research and quality improvement endeavors.
In conclusion, the MAGS list provides a comprehensive and sensitive indicator of medications associated with any of 6 geriatric syndromes regardless of medication indication and appropriateness. The MAGS list provides an overall degree of medication burden with respect to geriatric syndromes and a foundation for future research to assess the relationship between the presence of geriatric syndromes and syndrome‐associated medications. The MAGS list is an important first step in summarizing the data that link medications to geriatric syndromes. Future studies are needed to broaden the analysis of MAGS for other common geriatric syndromes and to identify new and emerging medications not present during the time of this analysis. The MAGS list has the potential to facilitate deprescribing efforts needed to combat the epidemic of overprescribing that may be contributing to the burden of geriatric syndromes among older patients.
Acknowledgements
The authors thank Dr. Linda Beuscher, Dr. Patricia Blair Miller, Dr. Joseph Ouslander, Dr. William Stuart Reynolds, and Dr. Warren Taylor for providing their expertise and participating in the expert panel discussions that facilitated the development of the MAGS list. The authors also recognize the research support provided by Christopher Simon Coelho.
Disclosures: This research was supported by the Department of Health and Human Services, Centers for Medicare & Medicaid Services grant #1C1CMS331006 awarded to Principal Investigator, John F. Schnelle, PhD. Dr. Vasilevskis was supported by the National Institute on Aging of the National Institutes of Health award K23AG040157 and the Geriatric Research, Education and Clinical Center. Dr. Bell was supported by National Institute on Aging‐K award K23AG048347‐01A1. Dr. Mixon is supported by a Veterans Affairs Health Services Research & Development Career Development Award (12‐168). This research was also supported by the National Center for Advancing Translational Sciences Clinical and Translational Science award UL1TR000445. The contents of this publication are solely the responsibility of the authors and do not necessarily represent the official views of the US Department of Health and Human Services or any of its agencies, the National Center for Advancing Translation Science, the National Institutes of Health, or the Department of Veterans Affairs. Each coauthor contributed significantly to the manuscript. Dr. Kripalani has received stock/stock options from Bioscape Digital, LLC. None of the other authors have significant conflicts of interest to report related to this project or the results reported within this article.
- , , , . Geriatric syndromes: clinical, research, and policy implications of a core geriatric concept. J Am Geriatr Soc. 2007;55:780–791.
- , , , . Shared risk factors for falls, incontinence, and functional dependence. Unifying the approach to geriatric syndromes. JAMA. 1995;273:1348–1353.
- , , , . Geriatric syndromes: medical misnomer or progress in geriatrics? Neth J Med. 2003;61:83–87.
- , , , et al. Geriatric conditions in acutely hospitalized older patients: prevalence and one‐year survival and functional decline. PLoS One. 2011;6:e26951.
- , , , , . Geriatric conditions as predictors of increased number of hospital admissions and hospital bed days over one year: findings of a nationwide cohort of older adults from Taiwan. Arch Gerontol Geriatr. 2014;59:169–174.
- , , , , . Geriatric conditions and disability: the Health and Retirement Study. Ann Intern Med. 2007;147:156–164.
- , , , , , . A prospective cohort study of geriatric syndromes among older medical patients admitted to acute care hospitals. J Am Geriatr Soc. 2011;59:2001–2008.
- , , , et al. Geriatric syndromes in hospitalized older adults discharged to skilled nursing facilities. J Am Geriatr Soc. 2016;64(4):715–722.
- , , , et al. Discharge to a skilled nursing facility and subsequent clinical outcomes among older patients hospitalized for heart failure. Circ Heart Fail. 2011;4:293–300.
- . Hazards of hospitalization of the elderly. Ann Intern Med. 1993;118:219–223.
- , , , , . Geriatric syndromes in elderly patients admitted to an inpatient cardiology ward. J Hosp Med. 2007;2:394–400.
- , , , . Effect of hospitalization on inappropriate prescribing in elderly Medicare beneficiaries. J Am Geriatr Soc. 2015;63:699–707.
- , , , et al. Polypharmacy cutoff and outcomes: five or more medicines were used to identify community‐dwelling older men at risk of different adverse outcomes. J Clin Epidemiol. 2012;65:989–995.
- , , , , . Investigating polypharmacy and drug burden index in hospitalised older people. Intern Med J. 2013;43:912–918.
- , . Potentially harmful drug‐drug interactions in the elderly: a review. Am J Geriatr Pharmacother. 2011;9:364–377.
- , , , . Hospital admissions/visits associated with drug‐drug interactions: a systematic review and meta‐analysis. Pharmacoepidemiol Drug Saf. 2014;23:489–497.
- , . Optimising drug treatment for elderly people: the prescribing cascade. BMJ. 1997;315:1096–1099.
- , , , et al. Association between acute geriatric syndromes and medication‐related hospital admissions. Drugs Aging. 2012;29:691–699.
- American Geriatrics Society Beers Criteria Update Expert P. American Geriatrics Society updated Beers Criteria for potentially inappropriate medication use in older adults. J Am Geriatr Soc. 2012;60:616–631.
- By the American Geriatrics Society 2015 Beers Criteria Update Expert Panel. American Geriatrics Society 2015 updated Beers criteria for potentially inappropriate medication use in older adults. J Am Geriatr Soc. 2015;63:2227–2246.
- , . STOPP (Screening Tool of Older Persons' potentially inappropriate Prescriptions): application to acutely ill elderly patients and comparison with Beers' criteria. Age Ageing. 2008;37:673–679.
- , , , et al. Warfarin versus aspirin for stroke prevention in an elderly community population with atrial fibrillation (the Birmingham Atrial Fibrillation Treatment of the Aged Study, BAFTA): a randomised controlled trial. Lancet. 2007;370:493–503.
- U.S. Food and Drug Administration. Drugs. Available at: http://www.fda.gov/Drugs/default.htm. Accessed May 15th, 2015.
- , , , et al. Inappropriate medication use among frail elderly inpatients. Ann Pharmacother. 2004;38:9–14.
- , , , et al. Inappropriate medications in elderly ICU survivors: where to intervene? Arch Intern Med. 2011;171:1032–1034.
- , , , et al. Appropriateness of medication prescribing in ambulatory elderly patients. J Am Geriatr Soc. 1994;42:1241–1247.

Discharge Preparedness and Readmission
In recent years, US hospitals have focused on decreasing readmission rates, incented by reimbursement penalties to hospitals having excessive readmissions.[1] Gaps in the quality of care provided during transitions likely contribute to preventable readmissions.[2] One compelling quality assessment in this setting is measuring patients' discharge preparedness, using key dimensions such as understanding their instructions for medication use and follow‐up. Patient‐reported preparedness for discharge may also be useful to identify risk of readmission.
Several patient‐reported measures of preparedness for discharge exist, and herein we describe 2 measures of interest. First, the Brief‐PREPARED (B‐PREPARED) measure was derived from the longer PREPARED instrument (Prescriptions, Ready to re‐enter community, Education, Placement, Assurance of safety, Realistic expectations, Empowerment, Directed to appropriate services), which reflects the patient's perceived needs at discharge. In previous research, the B‐PREPARED measure predicted emergency department (ED) visits for patients who had been recently hospitalized and had a high risk for readmission.[3] Second, the Care Transitions Measure‐3 (CTM‐3) was developed by Coleman et al. as a patient‐reported measure to discriminate between patients who were more likely to have an ED visit or readmission from those who did not. CTM‐3 has also been used to evaluate hospitals' level of care coordination and for public reporting purposes.[4, 5, 6] It has been endorsed by the National Quality Forum and incorporated into the Hospital Consumer Assessment of Healthcare Providers and Systems (HCAHPS) survey provided to samples of recently hospitalized US patients.[7] However, recent evidence from an inpatient cohort of cardiovascular patients suggests the CTM‐3 overinflates care transition scores compared to the longer 15‐item CTM. In that cohort, the CTM‐3 could not differentiate between patients who did or did not have repeat ED visits or readmission.[8] Thus far, the B‐PREPARED and CTM‐3 measures have not been compared to one another directly.
In addition to the development of patient‐reported measures, hospitals increasingly employ administrative algorithms to predict likelihood of readmission.[9] A commonly used measure is the LACE index (Length of stay, Acuity, Comorbidity, and Emergency department use).[10] The LACE index predicted readmission and death within 30 days of discharge in a large cohort in Canada. In 2 retrospective studies of recently hospitalized patients in the United States, the LACE index's ability to discriminate between patients readmitted or not ranged from slightly better than chance to moderate (C statistic 0.56‐0.77).[11, 12]
It is unknown whether adding patient‐reported preparedness measures to commonly used readmission prediction scores increases the ability to predict readmission risk. We sought to determine whether the B‐PREPARED and CTM‐3 measures were predictive of readmission or death, as compared to the LACE index, in a large cohort of cardiovascular patients. In addition, we sought to determine the additional predictive and discriminative ability gained from administering the B‐PREPARED and CTM‐3 measures, while adjusting for the LACE index and other clinical factors. We hypothesized that: (1) higher preparedness scores on both measures would predict lower risk of readmission or death in a cohort of patients hospitalized with cardiac diagnoses; and (2) because it provides more specific and actionable information, the B‐PREPARED would discriminate readmission more accurately than CTM‐3, after controlling for clinical factors.
METHODS
Study Setting and Design
The Vanderbilt Inpatient Cohort Study (VICS) is a prospective study of patients admitted with cardiovascular disease to Vanderbilt University Hospital. The purpose of VICS is to investigate the impact of patient and social factors on postdischarge health outcomes such as quality of life, unplanned hospital utilization, and mortality. The rationale and design of VICS are detailed elsewhere.[13] Briefly, participants completed a baseline interview while hospitalized, and follow‐up phone calls were conducted within 2 to 9 days and at approximately 30 and 90 days postdischarge. During the first follow‐up call conducted by research assistants, we collected preparedness for discharge data utilizing the 2 measures described below. After the 90‐day phone call, we collected healthcare utilization since the index admission. The study was approved by the Vanderbilt University Institutional Review Board.
Patients
Eligibility screening shortly after admission identified patients with acute decompensated heart failure (ADHF) and/or an intermediate or high likelihood of acute coronary syndrome (ACS) per a physician's review of the clinical record. Exclusion criteria included: age <18 years, non‐English speaker, unstable psychiatric illness, delirium, low likelihood of follow‐up (eg, no reliable telephone number), on hospice, or otherwise too ill to complete an interview. To be included in these analyses, patients must have completed the preparedness for discharge measurements during the first follow‐up call. Patients who died before discharge or before completing the follow‐up call were excluded.
Preparedness for Discharge Measures (Patient‐Reported Data)
Preparedness for discharge was assessed using the 11‐item B‐PREPARED and the 3‐item CTM‐3.
The B‐PREPARED measures how prepared patients felt leaving the hospital with regard to: self‐care information for medications and activity, equipment/community services needed, and confidence in managing one's health after hospitalization. The B‐PREPARED measure has good internal consistency reliability (Cronbach's = 0.76) and has been validated in patients of varying age within a week of discharge. Preparedness is the sum of responses to all 11 questions, with a range of 0 to 22. Higher scores reflect increased preparedness for discharge.[3]
The CTM‐3 asks patients to rate how well their preferences were considered regarding transitional needs, as well as their understanding of postdischarge self‐management and the purpose of their medications, each on a 4‐point response scale (strongly disagree to strongly agree). The sum of the 3 responses quantifies the patient's perception of the quality of the care transition at discharge (Cronbach's = 0.86,[14] 0.92 in a cohort similar to ours[8]). Scores range from 3 to 12, with higher score indicating more preparedness. Then, the sum is transformed to a 0 to 100 scale.[15]
Clinical Readmission Risk Measures (Medical Record Data)
The LACE index, published by Van Walraven et al.,[10] takes into account 4 categories of clinical data: length of hospital stay, acuity of event, comorbidities, and ED visits in the prior 6 months. More specifically, a diagnostic code‐based, modified version of the Charlson Comorbidity Index was used to calculate the comorbidity score. These clinical criteria were obtained from an administrative database and weighted according to the methods used by Van Walraven et al. An overall score was calculated on a scale of 0 to 19, with higher scores indicating higher risk of readmission or death within 30 days.
From medical records, we also collected patients' demographic data including age, race, and gender, and diagnosis of ACS, ADHF, or both at hospital admission.
Outcome Measures
Healthcare utilization data were obtained from the index hospital as well as outside facilities. The electronic medical records from Vanderbilt University Hospital provided information about healthcare utilization at Vanderbilt 90 days after initial discharge. We also used Vanderbilt records to see if patients were transferred to Vanderbilt from other hospitals or if patients visited other hospitals before or after enrollment. We supplemented this with patient self‐report during the follow‐up telephone calls (at 30 and 90 days after initial discharge) so that any additional ED and hospital visits could be captured. Mortality data were collected from medical records, Social Security data, and family reports. The main outcome was time to first unplanned hospital readmission or death within 30 and 90 days of discharge.
Analysis
To describe our sample, we summarized categorical variables with percentages and continuous variables with percentiles. To test for evidence of unadjusted covariate‐outcome relationships, we used Pearson 2 and Wilcoxon rank sum tests for categorical and continuous covariates, respectively.
For the primary analyses we used Cox proportional hazard models to examine the independent associations between the prespecified predictors for patient‐reported preparedness and time to first unplanned readmission or death within 30 and 90 days of discharge. For each outcome (30‐ and 90‐day readmission or death), we fit marginal models separately for each of the B‐PREPARED, CTM‐3, and LACE scores. We then fit multivariable models that used both preparedness measures as well as age, gender, race, and diagnosis (ADHF and/or ACS), variables available to clinicians when patients are admitted. When fitting the multivariable models, we did not find strong evidence of nonlinear effects; therefore, only linear effects are reported. To facilitate comparison of effects, we scaled continuous variables by their interquartile range (IQR). The associated, exponentiated regression parameter estimates may therefore be interpreted as hazard ratios for readmission or death per IQR change in each predictor. In addition to parameter estimation, we computed the C index to evaluate capacity for the model to discriminate those who were and were not readmitted or died. All analyses were conducted in R version 3.1.2 (R Foundation for Statistical Computing, Vienna, Austria).
RESULTS
From the cohort of 1239 patients (Figure 1), 64%, 28%, and 7% of patients were hospitalized with ACS, ADHF, or both, respectively (Table 1). Nearly 45% of patients were female, 83% were white, and the median age was 61 years (IQR 5269). The median length of stay was 3 days (IQR 25). The median preparedness scores were high for both B‐PREPARED (21, IQR 1822) and CTM‐3 (77.8, IQR 66.7100). A total of 211 (17%) and 380 (31%) were readmitted or died within 30 and 90 days, respectively. The completion rate for the postdischarge phone calls was 88%.
| Death or Readmission Within 30 Days | Death or Readmission Within 90 Days | |||||
|---|---|---|---|---|---|---|
| Not Readmitted, N = 1028 | Death/Readmitted, N = 211 | P Value | Not Readmitted, N = 859 | Death/Readmitted, N = 380 | P Value | |
| ||||||
| Gender, male | 55.8% (574) | 53.1% (112) | 0.463* | 56.3% (484) | 53.2% (202) | 0.298* |
| Female | 44.2% (454) | 46.9% (99) | 43.7% (375) | 46.8% (178) | ||
| Race, white | 83.9% (860) | 80.6% (170) | 0.237* | 86.0% (737) | 77.3% (293) | <0.001* |
| Race, nonwhite | 16.1% (165) | 19.4% (41) | 14.0% (120) | 22.7% (86) | ||
| Diagnosis ACS | 68.0% (699) | 46.4% (98) | <0.001* | 72.9% (626) | 45.0% (171) | <0.001* |
| ADHF | 24.8% (255) | 46.0% (97) | 20.3% (174) | 46.8% (178) | ||
| Both | 7.2% (74) | 7.6% (16) | 6.9% (59) | 8.2% (31) | ||
| Age | 39.4:52:61:68:80 | 37.5:53.5:62:70:82 | 0.301 | 40:52:61:68:80 | 38:52:61 :70:82 | 0.651 |
| LOS | 1:2:3:5:10 | 1:3: 4:7.5:17 | <0.001 | 1:2:3:5:9 | 1:3:4:7:15 | <0.001 |
| CTM‐3 | 55.6:66.7: 77.8:100:100 | 55.6:66.7:77.8:100 :100 | 0.305 | 55.6:66.7:88.9:100:100 | 55.6:66.7:77.8:100 :100 | 0.080 |
| B‐PREPARED | 12:18:21:22.:22 | 10:17:20:22:22 | 0.066 | 12:18:21:22:22 | 10:17:20 :22:22 | 0.030 |
| LACE | 1:4: 7:10 :14 | 3.5:7:10:13:17 | <0.001 | 1:4:6: 9:14 | 3:7:10:13:16 | <0.001 |

B‐PREPARED and CTM‐3 were moderately correlated with one another (Spearman's = 0.40, P < 0.001). In bivariate analyses (Table 1), the association between B‐PREPARED and readmission or death was significant at 90 days (P = 0.030) but not 30 days. The CTM‐3 showed no significant association with readmission or death at either time point. The LACE score was significantly associated with rates of readmission at 30 and 90 days (P < 0.001).
Outcomes Within 30 Days of Discharge
When examining readmission or death within 30 days of discharge, simple unadjusted models 2 and 3 showed that the B‐PREPARED and LACE scores, respectively, were each significantly associated with time to first readmission or death (Table 2). Specifically, a 4‐point increase in the B‐PREPARED score was associated with a 16% decrease in the hazard of readmission or death (hazard ratio [HR] = 0.84, 95% confidence interval [CI]: 0.72 to 0.97). A 5‐point increase in the LACE score was associated with a 100% increase in the hazard of readmission or death (HR = 2.00, 95% CI: 1.72 to 2.32). In the multivariable model with both preparedness scores and diagnosis (model 4), the B‐PREPARED score (HR = 0.82, 95% CI: 0.70 to 0.97) was significantly associated with time to first readmission or death. In the full 30‐day model including B‐PREPARED, CTM‐3, LACE, age, gender, race, and diagnosis (model 5), only the LACE score (HR = 1.83, 95% CI: 1.54 to 2.18) was independently associated with time to readmission or death. Finally, the CTM‐3 did not predict 30‐day readmission or death in any of the models tested.
| Models | HR (95% CI)* | P Value | C Index |
|---|---|---|---|
| |||
| 1. CTM (per 10‐point change) | 0.95 (0.88 to 1.03) | 0.257 | 0.523 |
| 2. B‐PREPARED (per 4‐point change) | 0.84 (0.72 to 0.97) | 0.017 | 0.537 |
| 3. LACE (per 5‐point change) | 2.00 (1.72 to 2.32) | <0.001 | 0.679 |
| 4. CTM (per 10‐point change) | 1.00 (0.92 to 1.10) | 0.935 | 0.620 |
| B‐PREPARED (per 4‐point change) | 0.82 (0.70 to 0.97) | 0.019 | |
| ADHF only (vs ACS only) | 2.46 (1.86 to 3.26) | <0.001 | |
| ADHF and ACS (vs ACS only) | 1.42 (0.84 to 2.42) | 0.191 | |
| 5. CTM (per 10‐point change) | 1.02 (0.93 to 1.11) | 0.722 | 0.692 |
| B‐PREPARED (per 4 point change) | 0.87 (0.74 to 1.03) | 0.106 | |
| LACE (per 5‐point change) | 1.83 (1.54 to 2.18) | <0.001 | |
| ADHF only (vs ACS only) | 1.51 (1.10 to 2.08) | 0.010 | |
| ADHF and ACS (vs ACS only) | 0.90 (0.52 to 1.55) | 0.690 | |
| Age (per 10‐year change) | 1.02 (0.92 to 1.14) | 0.669 | |
| Female (vs male) | 1.11 (0.85 to 1.46) | 0.438 | |
| Nonwhite (vs white) | 0.92 (0.64 to 1.30) | 0.624 | |
Outcomes Within 90 Days of Discharge
At 90 days after discharge, again the separate unadjusted models 2 and 3 demonstrated that the B‐PREPARED and LACE scores, respectively, were each significantly associated with time to first readmission or death, whereas the CTM‐3 model only showed marginal significance (Table 3). In the multivariable model with both preparedness scores and diagnosis (model 4), results were similar to 30 days as the B‐PREPARED score was significantly associated with time to first readmission or death. Lastly, in the full model (model 5) at 90 days, again the LACE score was significantly associated with time to first readmission or death. In addition, B‐PREPARED scores were associated with a significant decrease in risk of readmission or death (HR = 0.88, 95% CI: 0.78 to 1.00); CTM‐3 scores were not independently associated with outcomes.
| Model | HR (95% CI)* | P Value | C Index |
|---|---|---|---|
| |||
| 1. CTM (per 10‐point change) | 0.94 (0.89 to 1.00) | 0.051 | 0.526 |
| 2. B‐PREPARED (per 4‐point change) | 0.84 (0.75 to 0.94) | 0.002 | 0.533 |
| 3. LACE (per 5‐point change) | 2.03 (1.82 to 2.27) | <0.001 | 0.683 |
| 4. CTM (per 10‐point change) | 0.99 (0.93 to 1.06) | 0.759 | 0.640 |
| B‐PREPARED (per 4‐point change) | 0.83 (0.74 to 0.94) | 0.003 | |
| ADHF only (vs ACS only) | 2.88 (2.33 to 3.56) | <0.001 | |
| ADHF and ACS (vs ACS only) | 1.62 (1.11 to 2.38) | 0.013 | |
| 5. CTM (per 10‐point change) | 1.00 (0.94 to 1.07) | 0.932 | 0.698 |
| B‐PREPARED (per 4‐point change) | 0.88 (0.78 to 1.00) | 0.043 | |
| LACE (per 5‐point change) | 1.76 (1.55 to 2.00) | <0.001 | |
| ADHF only (vs ACS only) | 1.76 (1.39 to 2.24) | <0.001 | |
| ADHF and ACS (vs ACS only) | 1.00 (0.67 to 1.50) | 0.980 | |
| Age (per 10‐year change) | 1.00 (0.93 to 1.09) | 0.894 | |
| Female (vs male) | 1.10 (0.90 to 1.35) | 0.341 | |
| Nonwhite (vs white) | 1.14 (0.89 to 1.47) | 0.288 | |
Tables 2 and 3 also display the C indices, or the discriminative ability of the models to differentiate whether or not a patient was readmitted or died. The range of the C index is 0.5 to 1, where values closer to 0.5 indicate random predictions and values closer to 1 indicate perfect prediction. At 30 days, the individual C indices for B‐PREPARED and CTM‐3 were only slightly better than chance (0.54 and 0.52, respectively) in their discriminative abilities. However, the C indices for the LACE score alone (0.68) and the multivariable model (0.69) including all 3 measures (ie, B‐PREPARED, CTM‐3, LACE), and clinical and demographic variables, had higher utility in discriminating patients who were readmitted/died or not. The 90‐day C indices were comparable in magnitude to those at 30 days.
DISCUSSION/CONCLUSION
In this cohort of patients hospitalized with cardiovascular disease, we compared 2 patient‐reported measures of preparedness for discharge, their association with time to death or readmission at 30 and 90 days, and their ability to discriminate patients who were or were not readmitted or died. Higher preparedness as measured by higher B‐PREPARED scores was associated with lower risk of readmission or death at 30 and 90 days after discharge in unadjusted models, and at 90 days in adjusted models. CTM‐3 was not associated with the outcome in any analyses. Lastly, the individual preparedness measures were not as strongly associated with readmission or death compared to the LACE readmission index alone.
How do our findings relate to the measurement of care transition quality? We consider 2 scenarios. First, if hospitals utilize the LACE index to predict readmission, then neither self‐reported measure of preparedness adds meaningfully to its predictive ability. However, hospital management may still find the B‐PREPARED and CTM‐3 useful as a means to direct care transition quality‐improvement efforts. These measures can instruct hospitals as to what areas their patients express the greatest difficulty or lack of preparedness and closely attend to patient needs with appropriate resources. Furthermore, the patient's perception of being prepared for discharge may be different than their actual preparedness. Their perceived preparedness may be affected by cognitive impairment, dissatisfaction with medical care, depression, lower health‐related quality of life, and lower educational attainment as demonstrated by Lau et al.[16] If a patient's perception of preparedness were low, it would behoove the clinician to investigate these other issues and address those that are mutable. Additionally, perceived preparedness may not correlate with the patient's understanding of their medical conditions, so it is imperative that clinicians provide prospective guidance about their probable postdischarge trajectory. If hospitals are not utilizing the LACE index, then perhaps using the B‐PREPARED, but not the CTM‐3, may be beneficial for predicting readmission.
How do our results fit with evidence from prior studies, and what do they mean in the context of care transitions quality? First, in the psychometric evaluation of the B‐PREPARED measure in a cohort of recently hospitalized patients, the mean score was 17.3, lower than the median of 21 in our cohort.[3] Numerous studies have utilized the CTM‐3 and the longer‐version CTM‐15. Though we cannot make a direct comparison, the median in our cohort (77.8) was on par with the means from other studies, which ranged from 63 to 82.[5, 17, 18, 19] Several studies also note ceiling effects with clusters of scores at the upper end of the scale, as did we. We conjecture that our cohort's preparedness scores may be higher because our institution has made concerted efforts to improve the discharge education for cardiovascular patients.
In a comparable patient population, the TRACE‐CORE (Transitions, Risks, and Actions in Coronary Events Center for Outcomes Research and Education) study is a cohort of more than 2200 patients with ACS who were administered the CTM‐15 within 1 month of discharge.[8] In that study, the median CTM‐15 score was 66.6, which is lower than our cohort. With regard to the predictive ability of the CTM‐3, they note that CTM‐3 scores did not differentiate between patients who were or were not readmitted or had emergency department visits. Our results support their concern that the CTM‐15 and by extension the CTM‐3, though adopted widely as part of HCAHPS, may not have sufficient ability to discriminate differences in patient outcomes or the quality of care transitions.
More recently, patient‐reported preparedness for discharge was assessed in a prospective cohort in Canada.[16] Lau et al. administered a single‐item measure of readiness at the time of discharge to general medicine patients, and found that lower readiness scores were also not associated with readmission or death at 30 days, when adjusted for the LACE index as we did.
We must acknowledge the limitations of our findings. First, our sample of recently discharged patients with cardiovascular disease is different than the community‐dwelling, underserved Americans hospitalized in the prior year, which served as the sample for reducing the CTM‐15 to 3 items.[5] This fact may explain why we did not find the CTM‐3 to be associated with readmission in our sample. Second, our analyses did not include extensive adjustment for patient‐related factors. Rather, our intention was to see how well the preparedness measures performed independently and compare their abilities to predict readmission, which is particularly relevant for clinicians who may not have all possible covariates in predicting readmission. Finally, because we limited the analyses to the patients who completed the B‐PREPARED and CTM‐3 measures (88% completion rate), we may not have data for: (1) very ill patients, who had a higher risk of readmission and least prepared, and were not able to answer the postdischarge phone call; and (2) very functional patients, who had a lower risk of readmission and were too busy to answer the postdischarge phone call. This may have limited the extremes in the spectrum of our sample.
Importantly, our study has several strengths. We report on the largest sample to date with results of both B‐PREPARED and CTM‐3. Moreover, we examined how these measures compared to a widely used readmission prediction tool, the LACE index. We had very high postdischarge phone call completion rates in the week following discharge. Furthermore, we had thorough assessment of readmission data through patient report, electronic medical record documentation, and collection of outside medical records.
Further research is needed to elucidate: (1) the ideal administration time of the patient‐reported measures of preparedness (before or after discharge), and (2) the challenges to the implementation of measures in healthcare systems. Remaining research questions center on the tradeoffs and barriers to implementing a longer measure like the 11‐item B‐PREPARED compared to a shorter measure like the CTM‐3. We do not know whether longer measures preclude their use by busy clinicians, though it provides more specific information about what patients feel they need at hospital discharge. Additionally, studies need to demonstrate the mutability of preparedness and the response of measures to interventions designed to improve the hospital discharge process.
In our sample of recently hospitalized cardiovascular patients, there was a statistically significant association between patient‐reported preparedness for discharged, as measured by B‐PREPARED, and readmissions/death at 30 and 90 days, but the magnitude of the association was very small. Furthermore, another patient‐reported preparedness measure, CTM‐3, was not associated with readmissions or death at either 30 or 90 days. Lastly, neither measure discriminated well between patients who were readmitted or not, and neither measure added meaningfully to the LACE index in terms of predicting 30‐ or 90‐day readmissions.
Disclosures
This study was supported by grant R01 HL109388 from the National Heart, Lung, and Blood Institute (Dr. Kripalani) and in part by grant UL1 RR024975‐01 from the National Center for Research Resources, and grant 2 UL1 TR000445‐06 from the National Center for Advancing Translational Sciences. Dr. Kripalani is a consultant to SAI Interactive and holds equity in Bioscape Digital, and is a consultant to and holds equity in PictureRx, LLC. Dr. Bell is supported by the National Institutes of Health (K23AG048347) and by the Eisenstein Women's Heart Fund. Dr. Vasilevskis is supported by the National Institutes of Health (K23AG040157) and the Geriatric Research, Education and Clinical Center. Dr. Mixon is a Veterans Affairs Health Services Research and Development Service Career Development awardee (12‐168) at the Nashville Department of Veterans Affairs. The content is solely the responsibility of the authors and does not necessarily represent the official views of the National Institutes of Health. The funding agency was not involved in the design and conduct of the study; collection, management, analysis, and interpretation of the data; and preparation, review, or approval of the manuscript. All authors had full access to all study data and had a significant role in writing the manuscript. The contents do not represent the views of the US Department of Veterans Affairs or the United States government. Dr. Kripalani is a consultant to and holds equity in PictureRx, LLC.
- Centers for Medicare 9(9):598–603.
- , , . Brief scale measuring patient preparedness for hospital discharge to home: psychometric properties. J Hosp Med. 2008;3(6):446–454.
- , , . Assessing the quality of preparation for posthospital care from the patient's perspective: the care transitions measure. Med Care. 2005;43(3):246–255.
- , , , . Assessing the quality of transitional care: further applications of the care transitions measure. Med Care. 2008;46(3):317–322.
- , , , , . The central role of performance measurement in improving the quality of transitional care. Home Health Care Serv Q. 2007;26(4):93–104.
- Centers for Medicare 3:e001053.
- , , , et al. Risk prediction models for hospital readmission: a systematic review. JAMA. 2011;306(15):1688–1698.
- , , , et al. Derivation and validation of an index to predict early death or unplanned readmission after discharge from hospital to the community. CMAJ. 2010;182(6):551–557.
- , , , et al. Using the LACE index to predict hospital readmissions in congestive heart failure patients. BMC Cardiovasc Disord. 2014;14:97.
- , , , . Validation of a predictive model to identify patients at high risk for hospital readmission. J Healthc Qual. 2016;38(1):34–41.
- , , , et al. Determinants of health after hospital discharge: rationale and design of the Vanderbilt Inpatient Cohort Study (VICS). BMC Health Serv Res. 2014;14:10.
- . CTM frequently asked questions. Available at: http://caretransitions.org/tools-and-resources/. Accessed January 22, 2016.
- . Instructions for scoring the CTM‐3. Available at: http://caretransitions.org/tools-and-resources/. Accessed January 22, 2016.
- , , , et al. Patient‐reported discharge readiness and 30‐day risk of readmission or death: a prospective cohort study. Am J Med. 2016;129:89–95.
- , , , , . Implementaiton of the Care Transitions Intervention: sustainability and lessons learned. Prof Case Manag. 2009;14(6):282–293.
- , , , . The care transitions innovation (C‐TraIn) for socioeconomically disadvantaged adults: results of a cluster randomized controlled trial. J Gen Intern Med. 2014;29(11):1460–1467.
- , , , et al. Telephone calls to patients after discharge from the hospital: an important part of transitions of care. Med Educ Online. 2015;29(20):26701.
In recent years, US hospitals have focused on decreasing readmission rates, incented by reimbursement penalties to hospitals having excessive readmissions.[1] Gaps in the quality of care provided during transitions likely contribute to preventable readmissions.[2] One compelling quality assessment in this setting is measuring patients' discharge preparedness, using key dimensions such as understanding their instructions for medication use and follow‐up. Patient‐reported preparedness for discharge may also be useful to identify risk of readmission.
Several patient‐reported measures of preparedness for discharge exist, and herein we describe 2 measures of interest. First, the Brief‐PREPARED (B‐PREPARED) measure was derived from the longer PREPARED instrument (Prescriptions, Ready to re‐enter community, Education, Placement, Assurance of safety, Realistic expectations, Empowerment, Directed to appropriate services), which reflects the patient's perceived needs at discharge. In previous research, the B‐PREPARED measure predicted emergency department (ED) visits for patients who had been recently hospitalized and had a high risk for readmission.[3] Second, the Care Transitions Measure‐3 (CTM‐3) was developed by Coleman et al. as a patient‐reported measure to discriminate between patients who were more likely to have an ED visit or readmission from those who did not. CTM‐3 has also been used to evaluate hospitals' level of care coordination and for public reporting purposes.[4, 5, 6] It has been endorsed by the National Quality Forum and incorporated into the Hospital Consumer Assessment of Healthcare Providers and Systems (HCAHPS) survey provided to samples of recently hospitalized US patients.[7] However, recent evidence from an inpatient cohort of cardiovascular patients suggests the CTM‐3 overinflates care transition scores compared to the longer 15‐item CTM. In that cohort, the CTM‐3 could not differentiate between patients who did or did not have repeat ED visits or readmission.[8] Thus far, the B‐PREPARED and CTM‐3 measures have not been compared to one another directly.
In addition to the development of patient‐reported measures, hospitals increasingly employ administrative algorithms to predict likelihood of readmission.[9] A commonly used measure is the LACE index (Length of stay, Acuity, Comorbidity, and Emergency department use).[10] The LACE index predicted readmission and death within 30 days of discharge in a large cohort in Canada. In 2 retrospective studies of recently hospitalized patients in the United States, the LACE index's ability to discriminate between patients readmitted or not ranged from slightly better than chance to moderate (C statistic 0.56‐0.77).[11, 12]
It is unknown whether adding patient‐reported preparedness measures to commonly used readmission prediction scores increases the ability to predict readmission risk. We sought to determine whether the B‐PREPARED and CTM‐3 measures were predictive of readmission or death, as compared to the LACE index, in a large cohort of cardiovascular patients. In addition, we sought to determine the additional predictive and discriminative ability gained from administering the B‐PREPARED and CTM‐3 measures, while adjusting for the LACE index and other clinical factors. We hypothesized that: (1) higher preparedness scores on both measures would predict lower risk of readmission or death in a cohort of patients hospitalized with cardiac diagnoses; and (2) because it provides more specific and actionable information, the B‐PREPARED would discriminate readmission more accurately than CTM‐3, after controlling for clinical factors.
METHODS
Study Setting and Design
The Vanderbilt Inpatient Cohort Study (VICS) is a prospective study of patients admitted with cardiovascular disease to Vanderbilt University Hospital. The purpose of VICS is to investigate the impact of patient and social factors on postdischarge health outcomes such as quality of life, unplanned hospital utilization, and mortality. The rationale and design of VICS are detailed elsewhere.[13] Briefly, participants completed a baseline interview while hospitalized, and follow‐up phone calls were conducted within 2 to 9 days and at approximately 30 and 90 days postdischarge. During the first follow‐up call conducted by research assistants, we collected preparedness for discharge data utilizing the 2 measures described below. After the 90‐day phone call, we collected healthcare utilization since the index admission. The study was approved by the Vanderbilt University Institutional Review Board.
Patients
Eligibility screening shortly after admission identified patients with acute decompensated heart failure (ADHF) and/or an intermediate or high likelihood of acute coronary syndrome (ACS) per a physician's review of the clinical record. Exclusion criteria included: age <18 years, non‐English speaker, unstable psychiatric illness, delirium, low likelihood of follow‐up (eg, no reliable telephone number), on hospice, or otherwise too ill to complete an interview. To be included in these analyses, patients must have completed the preparedness for discharge measurements during the first follow‐up call. Patients who died before discharge or before completing the follow‐up call were excluded.
Preparedness for Discharge Measures (Patient‐Reported Data)
Preparedness for discharge was assessed using the 11‐item B‐PREPARED and the 3‐item CTM‐3.
The B‐PREPARED measures how prepared patients felt leaving the hospital with regard to: self‐care information for medications and activity, equipment/community services needed, and confidence in managing one's health after hospitalization. The B‐PREPARED measure has good internal consistency reliability (Cronbach's = 0.76) and has been validated in patients of varying age within a week of discharge. Preparedness is the sum of responses to all 11 questions, with a range of 0 to 22. Higher scores reflect increased preparedness for discharge.[3]
The CTM‐3 asks patients to rate how well their preferences were considered regarding transitional needs, as well as their understanding of postdischarge self‐management and the purpose of their medications, each on a 4‐point response scale (strongly disagree to strongly agree). The sum of the 3 responses quantifies the patient's perception of the quality of the care transition at discharge (Cronbach's = 0.86,[14] 0.92 in a cohort similar to ours[8]). Scores range from 3 to 12, with higher score indicating more preparedness. Then, the sum is transformed to a 0 to 100 scale.[15]
Clinical Readmission Risk Measures (Medical Record Data)
The LACE index, published by Van Walraven et al.,[10] takes into account 4 categories of clinical data: length of hospital stay, acuity of event, comorbidities, and ED visits in the prior 6 months. More specifically, a diagnostic code‐based, modified version of the Charlson Comorbidity Index was used to calculate the comorbidity score. These clinical criteria were obtained from an administrative database and weighted according to the methods used by Van Walraven et al. An overall score was calculated on a scale of 0 to 19, with higher scores indicating higher risk of readmission or death within 30 days.
From medical records, we also collected patients' demographic data including age, race, and gender, and diagnosis of ACS, ADHF, or both at hospital admission.
Outcome Measures
Healthcare utilization data were obtained from the index hospital as well as outside facilities. The electronic medical records from Vanderbilt University Hospital provided information about healthcare utilization at Vanderbilt 90 days after initial discharge. We also used Vanderbilt records to see if patients were transferred to Vanderbilt from other hospitals or if patients visited other hospitals before or after enrollment. We supplemented this with patient self‐report during the follow‐up telephone calls (at 30 and 90 days after initial discharge) so that any additional ED and hospital visits could be captured. Mortality data were collected from medical records, Social Security data, and family reports. The main outcome was time to first unplanned hospital readmission or death within 30 and 90 days of discharge.
Analysis
To describe our sample, we summarized categorical variables with percentages and continuous variables with percentiles. To test for evidence of unadjusted covariate‐outcome relationships, we used Pearson 2 and Wilcoxon rank sum tests for categorical and continuous covariates, respectively.
For the primary analyses we used Cox proportional hazard models to examine the independent associations between the prespecified predictors for patient‐reported preparedness and time to first unplanned readmission or death within 30 and 90 days of discharge. For each outcome (30‐ and 90‐day readmission or death), we fit marginal models separately for each of the B‐PREPARED, CTM‐3, and LACE scores. We then fit multivariable models that used both preparedness measures as well as age, gender, race, and diagnosis (ADHF and/or ACS), variables available to clinicians when patients are admitted. When fitting the multivariable models, we did not find strong evidence of nonlinear effects; therefore, only linear effects are reported. To facilitate comparison of effects, we scaled continuous variables by their interquartile range (IQR). The associated, exponentiated regression parameter estimates may therefore be interpreted as hazard ratios for readmission or death per IQR change in each predictor. In addition to parameter estimation, we computed the C index to evaluate capacity for the model to discriminate those who were and were not readmitted or died. All analyses were conducted in R version 3.1.2 (R Foundation for Statistical Computing, Vienna, Austria).
RESULTS
From the cohort of 1239 patients (Figure 1), 64%, 28%, and 7% of patients were hospitalized with ACS, ADHF, or both, respectively (Table 1). Nearly 45% of patients were female, 83% were white, and the median age was 61 years (IQR 5269). The median length of stay was 3 days (IQR 25). The median preparedness scores were high for both B‐PREPARED (21, IQR 1822) and CTM‐3 (77.8, IQR 66.7100). A total of 211 (17%) and 380 (31%) were readmitted or died within 30 and 90 days, respectively. The completion rate for the postdischarge phone calls was 88%.
| Death or Readmission Within 30 Days | Death or Readmission Within 90 Days | |||||
|---|---|---|---|---|---|---|
| Not Readmitted, N = 1028 | Death/Readmitted, N = 211 | P Value | Not Readmitted, N = 859 | Death/Readmitted, N = 380 | P Value | |
| ||||||
| Gender, male | 55.8% (574) | 53.1% (112) | 0.463* | 56.3% (484) | 53.2% (202) | 0.298* |
| Female | 44.2% (454) | 46.9% (99) | 43.7% (375) | 46.8% (178) | ||
| Race, white | 83.9% (860) | 80.6% (170) | 0.237* | 86.0% (737) | 77.3% (293) | <0.001* |
| Race, nonwhite | 16.1% (165) | 19.4% (41) | 14.0% (120) | 22.7% (86) | ||
| Diagnosis ACS | 68.0% (699) | 46.4% (98) | <0.001* | 72.9% (626) | 45.0% (171) | <0.001* |
| ADHF | 24.8% (255) | 46.0% (97) | 20.3% (174) | 46.8% (178) | ||
| Both | 7.2% (74) | 7.6% (16) | 6.9% (59) | 8.2% (31) | ||
| Age | 39.4:52:61:68:80 | 37.5:53.5:62:70:82 | 0.301 | 40:52:61:68:80 | 38:52:61 :70:82 | 0.651 |
| LOS | 1:2:3:5:10 | 1:3: 4:7.5:17 | <0.001 | 1:2:3:5:9 | 1:3:4:7:15 | <0.001 |
| CTM‐3 | 55.6:66.7: 77.8:100:100 | 55.6:66.7:77.8:100 :100 | 0.305 | 55.6:66.7:88.9:100:100 | 55.6:66.7:77.8:100 :100 | 0.080 |
| B‐PREPARED | 12:18:21:22.:22 | 10:17:20:22:22 | 0.066 | 12:18:21:22:22 | 10:17:20 :22:22 | 0.030 |
| LACE | 1:4: 7:10 :14 | 3.5:7:10:13:17 | <0.001 | 1:4:6: 9:14 | 3:7:10:13:16 | <0.001 |
B‐PREPARED and CTM‐3 were moderately correlated with one another (Spearman's = 0.40, P < 0.001). In bivariate analyses (Table 1), the association between B‐PREPARED and readmission or death was significant at 90 days (P = 0.030) but not 30 days. The CTM‐3 showed no significant association with readmission or death at either time point. The LACE score was significantly associated with rates of readmission at 30 and 90 days (P < 0.001).
Outcomes Within 30 Days of Discharge
When examining readmission or death within 30 days of discharge, simple unadjusted models 2 and 3 showed that the B‐PREPARED and LACE scores, respectively, were each significantly associated with time to first readmission or death (Table 2). Specifically, a 4‐point increase in the B‐PREPARED score was associated with a 16% decrease in the hazard of readmission or death (hazard ratio [HR] = 0.84, 95% confidence interval [CI]: 0.72 to 0.97). A 5‐point increase in the LACE score was associated with a 100% increase in the hazard of readmission or death (HR = 2.00, 95% CI: 1.72 to 2.32). In the multivariable model with both preparedness scores and diagnosis (model 4), the B‐PREPARED score (HR = 0.82, 95% CI: 0.70 to 0.97) was significantly associated with time to first readmission or death. In the full 30‐day model including B‐PREPARED, CTM‐3, LACE, age, gender, race, and diagnosis (model 5), only the LACE score (HR = 1.83, 95% CI: 1.54 to 2.18) was independently associated with time to readmission or death. Finally, the CTM‐3 did not predict 30‐day readmission or death in any of the models tested.
| Models | HR (95% CI)* | P Value | C Index |
|---|---|---|---|
| |||
| 1. CTM (per 10‐point change) | 0.95 (0.88 to 1.03) | 0.257 | 0.523 |
| 2. B‐PREPARED (per 4‐point change) | 0.84 (0.72 to 0.97) | 0.017 | 0.537 |
| 3. LACE (per 5‐point change) | 2.00 (1.72 to 2.32) | <0.001 | 0.679 |
| 4. CTM (per 10‐point change) | 1.00 (0.92 to 1.10) | 0.935 | 0.620 |
| B‐PREPARED (per 4‐point change) | 0.82 (0.70 to 0.97) | 0.019 | |
| ADHF only (vs ACS only) | 2.46 (1.86 to 3.26) | <0.001 | |
| ADHF and ACS (vs ACS only) | 1.42 (0.84 to 2.42) | 0.191 | |
| 5. CTM (per 10‐point change) | 1.02 (0.93 to 1.11) | 0.722 | 0.692 |
| B‐PREPARED (per 4 point change) | 0.87 (0.74 to 1.03) | 0.106 | |
| LACE (per 5‐point change) | 1.83 (1.54 to 2.18) | <0.001 | |
| ADHF only (vs ACS only) | 1.51 (1.10 to 2.08) | 0.010 | |
| ADHF and ACS (vs ACS only) | 0.90 (0.52 to 1.55) | 0.690 | |
| Age (per 10‐year change) | 1.02 (0.92 to 1.14) | 0.669 | |
| Female (vs male) | 1.11 (0.85 to 1.46) | 0.438 | |
| Nonwhite (vs white) | 0.92 (0.64 to 1.30) | 0.624 | |
Outcomes Within 90 Days of Discharge
At 90 days after discharge, again the separate unadjusted models 2 and 3 demonstrated that the B‐PREPARED and LACE scores, respectively, were each significantly associated with time to first readmission or death, whereas the CTM‐3 model only showed marginal significance (Table 3). In the multivariable model with both preparedness scores and diagnosis (model 4), results were similar to 30 days as the B‐PREPARED score was significantly associated with time to first readmission or death. Lastly, in the full model (model 5) at 90 days, again the LACE score was significantly associated with time to first readmission or death. In addition, B‐PREPARED scores were associated with a significant decrease in risk of readmission or death (HR = 0.88, 95% CI: 0.78 to 1.00); CTM‐3 scores were not independently associated with outcomes.
| Model | HR (95% CI)* | P Value | C Index |
|---|---|---|---|
| |||
| 1. CTM (per 10‐point change) | 0.94 (0.89 to 1.00) | 0.051 | 0.526 |
| 2. B‐PREPARED (per 4‐point change) | 0.84 (0.75 to 0.94) | 0.002 | 0.533 |
| 3. LACE (per 5‐point change) | 2.03 (1.82 to 2.27) | <0.001 | 0.683 |
| 4. CTM (per 10‐point change) | 0.99 (0.93 to 1.06) | 0.759 | 0.640 |
| B‐PREPARED (per 4‐point change) | 0.83 (0.74 to 0.94) | 0.003 | |
| ADHF only (vs ACS only) | 2.88 (2.33 to 3.56) | <0.001 | |
| ADHF and ACS (vs ACS only) | 1.62 (1.11 to 2.38) | 0.013 | |
| 5. CTM (per 10‐point change) | 1.00 (0.94 to 1.07) | 0.932 | 0.698 |
| B‐PREPARED (per 4‐point change) | 0.88 (0.78 to 1.00) | 0.043 | |
| LACE (per 5‐point change) | 1.76 (1.55 to 2.00) | <0.001 | |
| ADHF only (vs ACS only) | 1.76 (1.39 to 2.24) | <0.001 | |
| ADHF and ACS (vs ACS only) | 1.00 (0.67 to 1.50) | 0.980 | |
| Age (per 10‐year change) | 1.00 (0.93 to 1.09) | 0.894 | |
| Female (vs male) | 1.10 (0.90 to 1.35) | 0.341 | |
| Nonwhite (vs white) | 1.14 (0.89 to 1.47) | 0.288 | |
Tables 2 and 3 also display the C indices, or the discriminative ability of the models to differentiate whether or not a patient was readmitted or died. The range of the C index is 0.5 to 1, where values closer to 0.5 indicate random predictions and values closer to 1 indicate perfect prediction. At 30 days, the individual C indices for B‐PREPARED and CTM‐3 were only slightly better than chance (0.54 and 0.52, respectively) in their discriminative abilities. However, the C indices for the LACE score alone (0.68) and the multivariable model (0.69) including all 3 measures (ie, B‐PREPARED, CTM‐3, LACE), and clinical and demographic variables, had higher utility in discriminating patients who were readmitted/died or not. The 90‐day C indices were comparable in magnitude to those at 30 days.
DISCUSSION/CONCLUSION
In this cohort of patients hospitalized with cardiovascular disease, we compared 2 patient‐reported measures of preparedness for discharge, their association with time to death or readmission at 30 and 90 days, and their ability to discriminate patients who were or were not readmitted or died. Higher preparedness as measured by higher B‐PREPARED scores was associated with lower risk of readmission or death at 30 and 90 days after discharge in unadjusted models, and at 90 days in adjusted models. CTM‐3 was not associated with the outcome in any analyses. Lastly, the individual preparedness measures were not as strongly associated with readmission or death compared to the LACE readmission index alone.
How do our findings relate to the measurement of care transition quality? We consider 2 scenarios. First, if hospitals utilize the LACE index to predict readmission, then neither self‐reported measure of preparedness adds meaningfully to its predictive ability. However, hospital management may still find the B‐PREPARED and CTM‐3 useful as a means to direct care transition quality‐improvement efforts. These measures can instruct hospitals as to what areas their patients express the greatest difficulty or lack of preparedness and closely attend to patient needs with appropriate resources. Furthermore, the patient's perception of being prepared for discharge may be different than their actual preparedness. Their perceived preparedness may be affected by cognitive impairment, dissatisfaction with medical care, depression, lower health‐related quality of life, and lower educational attainment as demonstrated by Lau et al.[16] If a patient's perception of preparedness were low, it would behoove the clinician to investigate these other issues and address those that are mutable. Additionally, perceived preparedness may not correlate with the patient's understanding of their medical conditions, so it is imperative that clinicians provide prospective guidance about their probable postdischarge trajectory. If hospitals are not utilizing the LACE index, then perhaps using the B‐PREPARED, but not the CTM‐3, may be beneficial for predicting readmission.
How do our results fit with evidence from prior studies, and what do they mean in the context of care transitions quality? First, in the psychometric evaluation of the B‐PREPARED measure in a cohort of recently hospitalized patients, the mean score was 17.3, lower than the median of 21 in our cohort.[3] Numerous studies have utilized the CTM‐3 and the longer‐version CTM‐15. Though we cannot make a direct comparison, the median in our cohort (77.8) was on par with the means from other studies, which ranged from 63 to 82.[5, 17, 18, 19] Several studies also note ceiling effects with clusters of scores at the upper end of the scale, as did we. We conjecture that our cohort's preparedness scores may be higher because our institution has made concerted efforts to improve the discharge education for cardiovascular patients.
In a comparable patient population, the TRACE‐CORE (Transitions, Risks, and Actions in Coronary Events Center for Outcomes Research and Education) study is a cohort of more than 2200 patients with ACS who were administered the CTM‐15 within 1 month of discharge.[8] In that study, the median CTM‐15 score was 66.6, which is lower than our cohort. With regard to the predictive ability of the CTM‐3, they note that CTM‐3 scores did not differentiate between patients who were or were not readmitted or had emergency department visits. Our results support their concern that the CTM‐15 and by extension the CTM‐3, though adopted widely as part of HCAHPS, may not have sufficient ability to discriminate differences in patient outcomes or the quality of care transitions.
More recently, patient‐reported preparedness for discharge was assessed in a prospective cohort in Canada.[16] Lau et al. administered a single‐item measure of readiness at the time of discharge to general medicine patients, and found that lower readiness scores were also not associated with readmission or death at 30 days, when adjusted for the LACE index as we did.
We must acknowledge the limitations of our findings. First, our sample of recently discharged patients with cardiovascular disease is different than the community‐dwelling, underserved Americans hospitalized in the prior year, which served as the sample for reducing the CTM‐15 to 3 items.[5] This fact may explain why we did not find the CTM‐3 to be associated with readmission in our sample. Second, our analyses did not include extensive adjustment for patient‐related factors. Rather, our intention was to see how well the preparedness measures performed independently and compare their abilities to predict readmission, which is particularly relevant for clinicians who may not have all possible covariates in predicting readmission. Finally, because we limited the analyses to the patients who completed the B‐PREPARED and CTM‐3 measures (88% completion rate), we may not have data for: (1) very ill patients, who had a higher risk of readmission and least prepared, and were not able to answer the postdischarge phone call; and (2) very functional patients, who had a lower risk of readmission and were too busy to answer the postdischarge phone call. This may have limited the extremes in the spectrum of our sample.
Importantly, our study has several strengths. We report on the largest sample to date with results of both B‐PREPARED and CTM‐3. Moreover, we examined how these measures compared to a widely used readmission prediction tool, the LACE index. We had very high postdischarge phone call completion rates in the week following discharge. Furthermore, we had thorough assessment of readmission data through patient report, electronic medical record documentation, and collection of outside medical records.
Further research is needed to elucidate: (1) the ideal administration time of the patient‐reported measures of preparedness (before or after discharge), and (2) the challenges to the implementation of measures in healthcare systems. Remaining research questions center on the tradeoffs and barriers to implementing a longer measure like the 11‐item B‐PREPARED compared to a shorter measure like the CTM‐3. We do not know whether longer measures preclude their use by busy clinicians, though it provides more specific information about what patients feel they need at hospital discharge. Additionally, studies need to demonstrate the mutability of preparedness and the response of measures to interventions designed to improve the hospital discharge process.
In our sample of recently hospitalized cardiovascular patients, there was a statistically significant association between patient‐reported preparedness for discharged, as measured by B‐PREPARED, and readmissions/death at 30 and 90 days, but the magnitude of the association was very small. Furthermore, another patient‐reported preparedness measure, CTM‐3, was not associated with readmissions or death at either 30 or 90 days. Lastly, neither measure discriminated well between patients who were readmitted or not, and neither measure added meaningfully to the LACE index in terms of predicting 30‐ or 90‐day readmissions.
Disclosures
This study was supported by grant R01 HL109388 from the National Heart, Lung, and Blood Institute (Dr. Kripalani) and in part by grant UL1 RR024975‐01 from the National Center for Research Resources, and grant 2 UL1 TR000445‐06 from the National Center for Advancing Translational Sciences. Dr. Kripalani is a consultant to SAI Interactive and holds equity in Bioscape Digital, and is a consultant to and holds equity in PictureRx, LLC. Dr. Bell is supported by the National Institutes of Health (K23AG048347) and by the Eisenstein Women's Heart Fund. Dr. Vasilevskis is supported by the National Institutes of Health (K23AG040157) and the Geriatric Research, Education and Clinical Center. Dr. Mixon is a Veterans Affairs Health Services Research and Development Service Career Development awardee (12‐168) at the Nashville Department of Veterans Affairs. The content is solely the responsibility of the authors and does not necessarily represent the official views of the National Institutes of Health. The funding agency was not involved in the design and conduct of the study; collection, management, analysis, and interpretation of the data; and preparation, review, or approval of the manuscript. All authors had full access to all study data and had a significant role in writing the manuscript. The contents do not represent the views of the US Department of Veterans Affairs or the United States government. Dr. Kripalani is a consultant to and holds equity in PictureRx, LLC.
- Centers for Medicare 9(9):598–603.
- , , . Brief scale measuring patient preparedness for hospital discharge to home: psychometric properties. J Hosp Med. 2008;3(6):446–454.
- , , . Assessing the quality of preparation for posthospital care from the patient's perspective: the care transitions measure. Med Care. 2005;43(3):246–255.
- , , , . Assessing the quality of transitional care: further applications of the care transitions measure. Med Care. 2008;46(3):317–322.
- , , , , . The central role of performance measurement in improving the quality of transitional care. Home Health Care Serv Q. 2007;26(4):93–104.
- Centers for Medicare 3:e001053.
- , , , et al. Risk prediction models for hospital readmission: a systematic review. JAMA. 2011;306(15):1688–1698.
- , , , et al. Derivation and validation of an index to predict early death or unplanned readmission after discharge from hospital to the community. CMAJ. 2010;182(6):551–557.
- , , , et al. Using the LACE index to predict hospital readmissions in congestive heart failure patients. BMC Cardiovasc Disord. 2014;14:97.
- , , , . Validation of a predictive model to identify patients at high risk for hospital readmission. J Healthc Qual. 2016;38(1):34–41.
- , , , et al. Determinants of health after hospital discharge: rationale and design of the Vanderbilt Inpatient Cohort Study (VICS). BMC Health Serv Res. 2014;14:10.
- . CTM frequently asked questions. Available at: http://caretransitions.org/tools-and-resources/. Accessed January 22, 2016.
- . Instructions for scoring the CTM‐3. Available at: http://caretransitions.org/tools-and-resources/. Accessed January 22, 2016.
- , , , et al. Patient‐reported discharge readiness and 30‐day risk of readmission or death: a prospective cohort study. Am J Med. 2016;129:89–95.
- , , , , . Implementaiton of the Care Transitions Intervention: sustainability and lessons learned. Prof Case Manag. 2009;14(6):282–293.
- , , , . The care transitions innovation (C‐TraIn) for socioeconomically disadvantaged adults: results of a cluster randomized controlled trial. J Gen Intern Med. 2014;29(11):1460–1467.
- , , , et al. Telephone calls to patients after discharge from the hospital: an important part of transitions of care. Med Educ Online. 2015;29(20):26701.