User login
Hospital Evidence‐Based Practice Centers
Hospital evidence‐based practice centers (EPCs) are structures with the potential to facilitate the integration of evidence into institutional decision making to close knowing‐doing gaps[1, 2, 3, 4, 5, 6]; in the process, they can support the evolution of their parent institutions into learning healthcare systems.[7] The potential of hospital EPCs stems from their ability to identify and adapt national evidence‐based guidelines and systematic reviews for the local setting,[8] create local evidence‐based guidelines in the absence of national guidelines, use local data to help define problems and assess the impact of solutions,[9] and implement evidence into practice through computerized clinical decision support (CDS) interventions and other quality‐improvement (QI) initiatives.[9, 10] As such, hospital EPCs have the potential to strengthen relationships and understanding between clinicians and administrators[11]; foster a culture of evidence‐based practice; and improve the quality, safety, and value of care provided.[10]
Formal hospital EPCs remain uncommon in the United States,[10, 11, 12] though their numbers have expanded worldwide.[13, 14] This growth is due not to any reduced role for national EPCs, such as the National Institute for Health and Clinical Excellence[15] in the United Kingdom, or the 13 EPCs funded by the Agency for Healthcare Research and Quality (AHRQ)[16, 17] in the United States. Rather, this growth is fueled by the heightened awareness that the value of healthcare interventions often needs to be assessed locally, and that clinical guidelines that consider local context have a greater potential to improve quality and efficiency.[9, 18, 19]
Despite the increasing number of hospital EPCs globally, their impact on administrative and clinical decision making has rarely been examined,[13, 20] especially for hospital EPCs in the United States. The few studies that have assessed the impact of hospital EPCs on institutional decision making have done so in the context of technology acquisition, neglecting the role hospital EPCs may play in the integration of evidence into clinical practice. For example, the Technology Assessment Unit at McGill University Health Center found that of the 27 reviews commissioned in their first 5 years, 25 were implemented, with 6 (24%) recommending investments in new technologies and 19 (76%) recommending rejection, for a reported net hospital savings of $10 million.[21] Understanding the activities and impact of hospital EPCs is particularly critical for hospitalist leaders, who could leverage hospital EPCs to inform efforts to support the quality, safety, and value of care provided, or who may choose to establish or lead such infrastructure. The availability of such opportunities could also support hospitalist recruitment and retention.
In 2006, the University of Pennsylvania Health System (UPHS) created the Center for Evidence‐based Practice (CEP) to support the integration of evidence into practice to strengthen quality, safety, and value.[10] Cofounded by hospitalists with formal training in clinical epidemiology, the CEP performs rapid systematic reviews of the scientific literature to inform local practice and policy. In this article, we describe the first 8 years of the CEP's evidence synthesis activities and examine its impact on decision making across the health system.
METHODS
Setting
The UPHS includes 3 acute care hospitals, and inpatient facilities specializing in acute rehabilitation, skilled nursing, long‐term acute care, and hospice, with a capacity of more than 1800 beds and 75,000 annual admissions, as well as primary care and specialty clinics with more than 2 million annual outpatient visits. The CEP is funded by and organized within the Office of the UPHS Chief Medical Officer, serves all UPHS facilities, has an annual budget of approximately $1 million, and is currently staffed by a hospitalist director, 3 research analysts, 6 physician and nurse liaisons, a health economist, biostatistician, administrator, and librarians, totaling 5.5 full time equivalents.
The mission of the CEP is to support the quality, safety, and value of care at Penn through evidence‐based practice. To accomplish this mission, the CEP performs rapid systematic reviews, translates evidence into practice through the use of CDS interventions and clinical pathways, and offers education in evidence‐based decision making to trainees, staff, and faculty. This study is focused on the CEP's evidence synthesis activities.
Typically, clinical and administrative leaders submit a request to the CEP for an evidence review, the request is discussed and approved at the weekly staff meeting, and a research analyst and clinical liaison are assigned to the request and communicate with the requestor to clearly define the question of interest. Subsequently, the research analyst completes a protocol, a draft search, and a draft report, each reviewed and approved by the clinical liaison and requestor. The final report is posted to the website, disseminated to all key stakeholders across the UPHS as identified by the clinical liaisons, and integrated into decision making through various routes, including in‐person presentations to decision makers, and CDS and QI initiatives.
Study Design
The study included an analysis of an internal database of evidence reviews and a survey of report requestors, and was exempted from institutional review board review. Survey respondents were informed that their responses would be confidential and did not receive incentives.
Internal Database of Reports
Data from the CEP's internal management database were analyzed for its first 8 fiscal years (July 2006June 2014). Variables included requestor characteristics, report characteristics (eg, technology reviewed, clinical specialty examined, completion time, and performance of meta‐analyses and GRADE [Grading of Recommendations Assessment, Development and Evaluation] analyses[22]), report use (eg, integration of report into CDS interventions) and dissemination beyond the UPHS (eg, submission to Center for Reviews and Dissemination [CRD] Health Technology Assessment [HTA] database[23] and to peer‐reviewed journals). Report completion time was defined as the time between the date work began on the report and the date the final report was sent to the requestor. The technology categorization scheme was adapted from that provided by Goodman (2004)[24] and the UK National Institute for Health Research HTA Programme.[25] We systematically assigned the technology reviewed in each report to 1 of 8 mutually exclusive categories. The clinical specialty examined in each report was determined using an algorithm (see Supporting Information, Appendix 1, in the online version of this article).
We compared the report completion times and the proportions of requestor types, technologies reviewed, and clinical specialties examined in the CEP's first 4 fiscal years (July 2006June 2010) to those in the CEP's second 4 fiscal years (July 2010June 2014) using t tests and 2 tests for continuous and categorical variables, respectively.
Survey
We conducted a Web‐based survey (see Supporting Information, Appendix 2, in the online version of this article) of all requestors of the 139 rapid reviews completed in the last 4 fiscal years. Participants who requested multiple reports were surveyed only about the most recent report. Requestors were invited to participate in the survey via e‐mail, and follow‐up e‐mails were sent to nonrespondents at 7, 14, and 16 days. Nonrespondents and respondents were compared with respect to requestor type (physician vs nonphysician) and topic evaluated (traditional HTA topics such as drugs, biologics, and devices vs nontraditional HTA topics such as processes of care). The survey was administered using REDCap[26] electronic data capture tools. The 44‐item questionnaire collected data on the interaction between the requestor and the CEP, report characteristics, report impact, and requestor satisfaction.
Survey results were imported into Microsoft Excel (Microsoft Corp, Redmond, WA) and SPSS (IBM, Armonk, NY) for analysis. Descriptive statistics were generated, and statistical comparisons were conducted using 2 and Fisher exact tests.
RESULTS
Evidence Synthesis Activity
The CEP has produced several different report products since its inception. Evidence reviews (57%, n = 142) consist of a systematic review and analysis of the primary literature. Evidence advisories (32%, n = 79) are summaries of evidence from secondary sources such as guidelines or systematic reviews. Evidence inventories (3%, n = 7) are literature searches that describe the quantity and focus of available evidence, without analysis or synthesis.[27]
The categories of technologies examined, including their definitions and examples, are provided in Table 1. Drugs (24%, n = 60) and devices/equipment/supplies (19%, n = 48) were most commonly examined. The proportion of reports examining technology types traditionally evaluated by HTA organizations significantly decreased when comparing the first 4 years of CEP activity to the second 4 years (62% vs 38%, P < 0.01), whereas reports examining less traditionally reviewed categories increased (38% vs 62%, P < 0.01). The most common clinical specialties represented by the CEP reports were nursing (11%, n = 28), general surgery (11%, n = 28), critical care (10%, n = 24), and general medicine (9%, n = 22) (see Supporting Information, Appendix 3, in the online version of this article). Clinical departments were the most common requestors (29%, n = 72) (Table 2). The proportion of requests from clinical departments significantly increased when comparing the first 4 years to the second 4 years (20% vs 36%, P < 0.01), with requests from purchasing committees significantly decreasing (25% vs 6%, P < 0.01). The overall report completion time was 70 days, and significantly decreased when comparing the first 4 years to the second 4 years (89 days vs 50 days, P < 0.01).
| Category | Definition | Examples | Total | 20072010 | 20112014 | P Value |
|---|---|---|---|---|---|---|
| Total | 249 (100%) | 109 (100%) | 140 (100%) | |||
| Drug | A report primarily examining the efficacy/effectiveness, safety, appropriate use, or cost of a pharmacologic agent | Celecoxib for pain in joint arthroplasty; colchicine for prevention of pericarditis and atrial fibrillation | 60 (24%) | 35 (32%) | 25 (18%) | 0.009 |
| Device, equipment, and supplies | A report primarily examining the efficacy/effectiveness, safety, appropriate use, or cost of an instrument, apparatus, implement, machine, contrivance, implant, in vitro reagent, or other similar or related article, including a component part, or accessory that is intended for use in the prevention, diagnosis, or treatment of disease and does not achieve its primary intended purposes though chemical action or metabolism[50] | Thermometers for pediatric use; femoral closure devices for cardiac catheterization | 48 (19%) | 25 (23%) | 23 (16%) | 0.19 |
| Process of care | A report primarily examining a clinical pathway or a clinical practice guideline that significantly involves elements of prevention, diagnosis, and/or treatment or significantly incorporates 2 or more of the other technology categories | Preventing patient falls; prevention and management of delirium | 31 (12%) | 18 (17%) | 13 (9%) | 0.09 |
| Test, scale, or risk factor | A report primarily examining the efficacy/effectiveness, safety, appropriate use, or cost of a test intended to screen for, diagnose, classify, or monitor the progression of a disease | Computed tomography for acute chest pain; urine drug screening in chronic pain patients on opioid therapy | 31 (12%) | 8 (7%) | 23 (16%) | 0.03 |
| Medical/surgical procedure | A report primarily examining the efficacy/effectiveness, safety, appropriate use, or cost of a medical intervention that is not a drug, device, or test or of the application or removal of a device | Biliary drainage for chemotherapy patients; cognitive behavioral therapy for insomnia | 26 (10%) | 8 (7%) | 18 (13%) | 0.16 |
| Policy or organizational/managerial system | A report primarily examining laws or regulations; the organization, financing, or delivery of care, including settings of care; or healthcare providers | Medical care costs and productivity changes associated with smoking; physician training and credentialing for robotic surgery in obstetrics and gynecology | 26 (10%) | 4 (4%) | 22 (16%) | 0.002 |
| Support system | A report primarily examining the efficacy/effectiveness, safety, appropriate use, or cost of an intervention designed to provide a new or improved service to patients or healthcare providers that does not fall into 1 of the other categories | Reconciliation of data from differing electronic medical records; social media, text messaging, and postdischarge communication | 14 (6%) | 3 (3%) | 11 (8%) | 0.09 |
| Biologic | A report primarily examining the efficacy/effectiveness, safety, appropriate use, or cost of a product manufactured in a living system | Recombinant factor VIIa for cardiovascular surgery; osteobiologics for orthopedic fusions | 13 (5%) | 8 (7%) | 5 (4%) | 0.19 |
| Category | Total | 20072010 | 20112014 | P Value |
|---|---|---|---|---|
| ||||
| Total | 249 (100%) | 109 (100%) | 140 (100%) | |
| Clinical department | 72 (29%) | 22 (20%) | 50 (36%) | 0.007 |
| CMO | 47 (19%) | 21 (19%) | 26 (19%) | 0.92 |
| Purchasing committee | 35 (14%) | 27 (25%) | 8 (6%) | <0.001 |
| Formulary committee | 22 (9%) | 12 (11%) | 10 (7%) | 0.54 |
| Quality committee | 21 (8%) | 11 (10%) | 10 (7%) | 0.42 |
| Administrative department | 19 (8%) | 5 (5%) | 14 (10%) | 0.11 |
| Nursing | 14 (6%) | 4 (4%) | 10 (7%) | 0.23 |
| Other* | 19 (8%) | 7 (6%) | 12 (9%) | 0.55 |
Thirty‐seven (15%) reports included meta‐analyses conducted by CEP staff. Seventy‐five reports (30%) contained an evaluation of the quality of the evidence base using GRADE analyses.[22] Of these reports, the highest GRADE of evidence available for any comparison of interest was moderate (35%, n = 26) or high (33%, n = 25) in most cases, followed by very low (19%, n = 14) and low (13%, n = 10).
Reports were disseminated in a variety of ways beyond direct dissemination and presentation to requestors and posting on the center website. Thirty reports (12%) informed CDS interventions, 24 (10%) resulted in peer‐reviewed publications, and 204 (82%) were posted to the CRD HTA database.
Evidence Synthesis Impact
A total of 139 reports were completed between July 2010 and June 2014 for 65 individual requestors. Email invitations to participate in the survey were sent to the 64 requestors employed by the UPHS. The response rate was 72% (46/64). The proportions of physician requestors and traditional HTA topics evaluated were similar across respondents and nonrespondents (43% [20/46] vs 39% [7/18], P = 0.74; and 37% [17/46] vs 44% [8/18], P = 0.58, respectively). Aggregated survey responses are presented for items using a Likert scale in Figure 1, and for items using a yes/no or ordinal scale in Table 3.
| Items | % of Respondents Responding Affirmatively |
|---|---|
| Percentage of Respondents Ranking as First Choice* | |
| |
| Requestor activity | |
| What factors prompted you to request a report from CEP? (Please select all that apply.) | |
| My own time constraints | 28% (13/46) |
| CEP's ability to identify and synthesize evidence | 89% (41/46) |
| CEP's objectivity | 52% (24/46) |
| Recommendation from colleague | 30% (14/46) |
| Did you conduct any of your own literature searches before contacting CEP? | 67% (31/46) |
| Did you obtain and read any of the articles cited in CEP's report? | 63% (29/46) |
| Did you read the following sections of CEP's report? | |
| Evidence summary (at beginning of report) | 100% (45/45) |
| Introduction/background | 93% (42/45) |
| Methods | 84% (38/45) |
| Results | 98% (43/43) |
| Conclusion | 100% (43/43) |
| Report dissemination | |
| Did you share CEP's report with anyone NOT involved in requesting the report or in making the final decision? | 67% (30/45) |
| Did you share CEP's report with anyone outside of Penn? | 7% (3/45) |
| Requestor preferences | |
| Would it be helpful for CEP staff to call you after you receive any future CEP reports to answer any questions you might have? | 55% (24/44) |
| Following any future reports you request from CEP, would you be willing to complete a brief questionnaire? | 100% (44/44) |
| Please rank how you would prefer to receive reports from CEP in the future. | |
| E‐mail containing the report as a PDF attachment | 77% (34/44) |
| E‐mail containing a link to the report on CEP's website | 16% (7/44) |
| In‐person presentation by the CEP analyst writing the report | 18% (8/44) |
| In‐person presentation by the CEP director involved in the report | 16% (7/44) |

In general, respondents found reports easy to request, easy to use, timely, and relevant, resulting in high requestor satisfaction. In addition, 98% described the scope of content and level of detail as about right. Report impact was rated highly as well, with the evidence summary and conclusions rated as the most critical to decision making. A majority of respondents indicated that reports confirmed their tentative decision (77%, n = 34), whereas some changed their tentative decision (7%, n = 3), and others suggested the report had no effect on their tentative decision (16%, n = 7). Respondents indicated the amount of time that elapsed between receiving reports and making final decisions was 1 to 7 days (5%, n = 2), 8 to 30 days (40%, n = 17), 1 to 3 months (37%, n = 16), 4 to 6 months (9%, n = 4), or greater than 6 months (9%, n = 4). The most common reasons cited for requesting a report were the CEP's evidence synthesis skills and objectivity.
DISCUSSION
To our knowledge, this is the first comprehensive description and assessment of evidence synthesis activity by a hospital EPC in the United States. Our findings suggest that clinical and administrative leaders will request reports from a hospital EPC, and that hospital EPCs can promptly produce reports when requested. Moreover, these syntheses can address a wide range of clinical and policy topics, and can be disseminated through a variety of routes. Lastly, requestors are satisfied by these syntheses, and report that they inform decision making. These results suggest that EPCs may be an effective infrastructure paradigm for promoting evidence‐based decision making within healthcare provider organizations, and are consistent with previous analyses of hospital‐based EPCs.[21, 28, 29]
Over half of report requestors cited CEP's objectivity as a factor in their decision to request a report, underscoring the value of a neutral entity in an environment where clinical departments and hospital committees may have competing interests.[10] This asset was 1 of the primary drivers for establishing our hospital EPC. Concerns by clinical executives about the influence of industry and local politics on institutional decision making, and a desire to have clinical evidence more systematically and objectively integrated into decision making, fueled our center's funding.
The survey results also demonstrate that respondents were satisfied with the reports for many reasons, including readability, concision, timeliness, scope, and content, consistent with the evaluation of the French hospital‐based EPC CEDIT (French Committee for the Assessment and Dissemination of Technological Innovations).[29] Given the importance of readability, concision, and relevance that has been previously described,[16, 28, 30] nearly all CEP reports contain an evidence summary on the first page that highlights key findings in a concise, user‐friendly format.[31] The evidence summaries include bullet points that: (1) reference the most pertinent guideline recommendations along with their strength of recommendation and underlying quality of evidence; (2) organize and summarize study findings using the most critical clinical outcomes, including an assessment of the quality of the underlying evidence for each outcome; and (3) note important limitations of the findings.
Evidence syntheses must be timely to allow decision makers to act on the findings.[28, 32] The primary criticism of CEDIT was the lag between requests and report publication.[29] Rapid reviews, designed to inform urgent decisions, can overcome this challenge.[31, 33, 34] CEP reviews required approximately 2 months to complete on average, consistent with the most rapid timelines reported,[31, 33, 34] and much shorter than standard systematic review timelines, which can take up to 12 to 24 months.[33] Working with requestors to limit the scope of reviews to those issues most critical to a decision, using secondary resources when available, and hiring experienced research analysts help achieve these efficiencies.
The study by Bodeau‐Livinec also argues for the importance of report accessibility to ensure dissemination.[29] This is consistent with the CEP's approach, where all reports are posted on the UPHS internal website. Many also inform QI initiatives, as well as CDS interventions that address topics of general interest to acute care hospitals, such as venous thromboembolism (VTE) prophylaxis,[35] blood product transfusions,[36] sepsis care,[37, 38] and prevention of catheter‐associated urinary tract infections (CAUTI)[39] and hospital readmissions.[40] Most reports are also listed in an international database of rapid reviews,[23] and reports that address topics of general interest, have sufficient evidence to synthesize, and have no prior published systematic reviews are published in the peer‐reviewed literature.[41, 42]
The majority of reports completed by the CEP were evidence reviews, or systematic reviews of primary literature, suggesting that CEP reports often address questions previously unanswered by existing published systematic reviews; however, about a third of reports were evidence advisories, or summaries of evidence from preexisting secondary sources. The relative scarcity of high‐quality evidence bases in those reports where GRADE analyses were conducted might be expected, as requestors may be more likely to seek guidance when the evidence base on a topic is lacking. This was further supported by the small percentage (15%) of reports where adequate data of sufficient homogeneity existed to allow meta‐analyses. The small number of original meta‐analyses performed also reflects our reliance on secondary resources when available.
Only 7% of respondents reported that tentative decisions were changed based on their report. This is not surprising, as evidence reviews infrequently result in clear go or no go recommendations. More commonly, they address or inform complex clinical questions or pathways. In this context, the change/confirm/no effect framework may not completely reflect respondents' use of or benefit from reports. Thus, we included a diverse set of questions in our survey to best estimate the value of our reports. For example, when asked whether the report answered the question posed, informed their final decision, or was consistent with their final decision, 91%, 79%, and 71% agreed or strongly agreed, respectively. When asked whether they would request a report again if they had to do it all over, recommend CEP to their colleagues, and be likely to request reports in the future, at least 95% of survey respondents agreed or strongly agreed. In addition, no respondent indicated that their report was not timely enough to influence their decision. Moreover, only a minority of respondents expressed disappointment that the CEP's report did not provide actionable recommendations due to a lack of published evidence (9%, n = 4). Importantly, the large proportion of requestors indicating that reports confirmed their tentative decisions may be a reflection of hindsight bias.
The most apparent trend in the production of CEP reviews over time is the relative increase in requests by clinical departments, suggesting that the CEP is being increasingly consulted to help define best clinical practices. This is also supported by the relative increase in reports focused on policy or organizational/managerial systems. These findings suggest that hospital EPCs have value beyond the traditional realm of HTA.
This study has a number of limitations. First, not all of the eligible report requestors responded to our survey. Despite this, our response rate of 72% compares favorably with surveys published in medical journals.[43] In addition, nonresponse bias may be less important in physician surveys than surveys of the general population.[44] The similarity in requestor and report characteristics for respondents and nonrespondents supports this. Second, our survey of impact is self‐reported rather than an evaluation of actual decision making or patient outcomes. Thus, the survey relies on the accuracy of the responses. Third, recall bias must be considered, as some respondents were asked to evaluate reports that were greater than 1 year old. To reduce this bias, we asked respondents to consider the most recent report they requested, included that report as an attachment in the survey request, and only surveyed requestors from the most recent 4 of the CEP's 8 fiscal years. Fourth, social desirability bias could have also affected the survey responses, though it was likely minimized by the promise of confidentiality. Fifth, an examination of the impact of the CEP on costs was outside the scope of this evaluation; however, such information may be important to those assessing the sustainability or return on investment of such centers. Simple approaches we have previously used to approximate the value of our activities include: (1) estimating hospital cost savings resulting from decisions supported by our reports, such as the use of technologies like chlorhexidine for surgical site infections[45] or discontinuation of technologies like aprotinin for cardiac surgery[46]; and (2) estimating penalties avoided or rewards attained as a result of center‐led initiatives, such as those to increase VTE prophylaxis,[35] reduce CAUTI rates,[39] and reduce preventable mortality associated with sepsis.[37, 38] Similarly, given the focus of this study on the local evidence synthesis activities of our center, our examination did not include a detailed description of our CDS activities, or teaching activities, including our multidisciplinary workshops for physicians and nurses in evidence‐based QI[47] and our novel evidence‐based practice curriculum for medical students. Our study also did not include a description of our extramural activities, such as those supported by our contract with AHRQ as 1 of their 13 EPCs.[16, 17, 48, 49] A consideration of all of these activities enables a greater appreciation for the potential of such centers. Lastly, we examined a single EPC, which may not be representative of the diversity of hospitals and hospital staff across the United States. However, our EPC serves a diverse array of patient populations, clinical services, and service models throughout our multientity academic healthcare system, which may improve the generalizability of our experience to other settings.
As next steps, we recommend evaluation of other existing hospital EPCs nationally. Such studies could help hospitals and health systems ascertain which of their internal decisions might benefit from locally sourced rapid systematic reviews and determine whether an in‐house EPC could improve the value of care delivered.
In conclusion, our findings suggest that hospital EPCs within academic healthcare systems can efficiently synthesize and disseminate evidence for a variety of stakeholders. Moreover, these syntheses impact decision making in a variety of hospital contexts and clinical specialties. Hospitals and hospitalist leaders seeking to improve the implementation of evidence‐based practice at a systems level might consider establishing such infrastructure locally.
Acknowledgements
The authors thank Fran Barg, PhD (Department of Family Medicine and Community Health, University of Pennsylvania Perelman School of Medicine) and Joel Betesh, MD (University of Pennsylvania Health System) for their contributions to developing the survey. They did not receive any compensation for their contributions.
Disclosures: An earlier version of this work was presented as a poster at the 2014 AMA Research Symposium, November 7, 2014, Dallas, Texas. Mr. Jayakumar reports having received a University of Pennsylvania fellowship as a summer intern at the Center for Evidence‐based Practice. Dr. Umscheid cocreated and directs a hospital evidence‐based practice center, is the Senior Associate Director of an Agency for Healthcare Research and Quality Evidence‐Based Practice Center, and is a past member of the Medicare Evidence Development and Coverage Advisory Committee, which uses evidence reports developed by the Evidence‐based Practice Centers of the Agency for Healthcare Research and Quality. Dr. Umscheid's contribution was supported in part by the National Center for Research Resources, grant UL1RR024134, which is now at the National Center for Advancing Translational Sciences, grant UL1TR000003. The content of this article is solely the responsibility of the authors and does not necessarily represent the official views of the National Institutes of Health. None of the funders had a role in the design and conduct of the study; collection, management, analysis, and interpretation of the data; preparation, review, or approval of the manuscript; and decision to submit the manuscript for publication. Dr. Lavenberg, Dr. Mitchell, and Mr. Leas are employed as research analysts by a hospital evidence‐based practice center. Dr. Doshi is supported in part by a hospital evidence‐based practice center and is an Associate Director of an Agency for Healthcare Research and Quality Evidence‐based Practice Center. Dr. Goldmann is emeritus faculty at Penn, is supported in part by a hospital evidence‐based practice center, and is the Vice President and Chief Quality Assurance Officer in Clinical Solutions, a division of Elsevier, Inc., a global publishing company, and director of the division's Evidence‐based Medicine Center. Dr. Williams cocreated and codirects a hospital evidence‐based practice center. Dr. Brennan has oversight for and helped create a hospital evidence‐based practice center.
- , . “Bench to behavior”: translating comparative effectiveness research into improved clinical practice. Health Aff (Millwood). 2010;29(10):1891–1900.
- , , . Evaluating the status of “translating research into practice” at a major academic healthcare system. Int J Technol Assess Health Care. 2009;25(1):84–89.
- , , , . Five reasons that many comparative effectiveness studies fail to change patient care and clinical practice. Health Aff (Millwood). 2012;31(10):2168–2175.
- , , , , , . Fostering implementation of health services research findings into practice: a consolidated framework for advancing implementation science. Implement Sci. 2009;4(1):50.
- , . From best evidence to best practice: effective implementation of change in patients' care. Lancet. 2003;362(9391):1225–1230.
- , . Incentivizing “structures” over “outcomes” to bridge the knowing‐doing gap. JAMA Intern Med. 2015;175(3):354.
- Olsen L, Aisner D, McGinnis JM, eds. Institute of Medicine (US) Roundtable on Evidence‐Based Medicine. The Learning Healthcare System: Workshop Summary. Washington, DC: National Academies Press; 2007. Available at: http://www.ncbi.nlm.nih.gov/books/NBK53494/. Accessed October 29, 2014.
- , , , . Adapting clinical practice guidelines to local context and assessing barriers to their use. Can Med Assoc J. 2010;182(2):E78–E84.
- , , , . Integrating local data into hospital‐based healthcare technology assessment: two case studies. Int J Technol Assess Health Care. 2010;26(3):294–300.
- , , . Hospital‐based comparative effectiveness centers: translating research into practice to improve the quality, safety and value of patient care. J Gen Intern Med. 2010;25(12):1352–1355.
- , , , , . Health technology assessment at the University of California‐San Francisco. J Healthc Manag Am Coll Healthc Exec. 2011;56(1):15–29; discussion 29–30.
- , . Kaiser Permanente Southern California regional technology management process: evidence‐based medicine operationalized. Perm J. 2006;10(1):38–41.
- . Hospital‐based health technology assessment: developments to date. Pharmacoeconomics. 2014;32(9):819–824.
- , , , . Hospital based health technology assessment world‐wide survey. Available at: http://www.htai.org/fileadmin/HTAi_Files/ISG/HospitalBasedHTA/2008Files/HospitalBasedHTAISGSurveyReport.pdf. Accessed October 11, 2015.
- , . At the center of health care policy making: the use of health technology assessment at NICE. Med Decis Making. 2013;33(3):320–324.
- , , . Better information for better health care: the Evidence‐based Practice Center program and the Agency for Healthcare Research and Quality. Ann Intern Med. 2005;142(12 part 2):1035–1041.
- , . AHRQ's Effective Health Care Program: why comparative effectiveness matters. Am J Med Qual. 2009;24(1):67–70.
- , . Effect of clinical guidelines on medical practice: a systematic review of rigorous evaluations. Lancet. 1993;342(8883):1317–1322.
- , , , et al. Lost in knowledge translation: time for a map? J Contin Educ Health Prof. 2006;26(1):13–24.
- , , , . Effects and repercussions of local/hospital‐based health technology assessment (HTA): a systematic. Syst Rev. 2014;3:129.
- , , , et al. Impact of TAU Reports. McGill University Health Centre. Available at: https://francais.mcgill.ca/files/tau/FINAL_TAU_IMPACT_REPORT_FEB_2008.pdf. Published Feb 1, 2008. Accessed August 19, 2014.
- , , , et al. GRADE: an emerging consensus on rating quality of evidence and strength of recommendations. BMJ. 2008;336(7650):924–926.
- , , . Centre for Reviews and Dissemination databases: value, content, and developments. Int J Technol Assess Health Care. 2010;26(4):470–472.
- . HTA 101. Introduction to Health Technology Assessment. Available at: https://www.nlm.nih.gov/nichsr/hta101/ta10103.html. Accessed October 11, 2015.
- National Institute for Health Research. Remit. NIHR HTA Programme. Available at: http://www.nets.nihr.ac.uk/programmes/hta/remit. Accessed August 20, 2014.
- , , , , , . Research Electronic Data Capture (REDCap)—a metadata‐driven methodology and workflow process for providing translational research informatics support. J Biomed Inform. 2009;42(2):377–381.
- , , , . When the decision is what to decide: Using evidence inventory reports to focus health technology assessments. Int J Technol Assess Health Care. 2011;27(2):127–132.
- , . End‐user involvement in health technology assessment (HTA) development: a way to increase impact. Int J Technol Assess Health Care. 2005;21(02):263–267.
- , , , , . Impact of CEDIT recommendations: an example of health technology assessment in a hospital network. Int J Technol Assess Health Care. 2006;22(2):161–168.
- , , , . Increasing the relevance of research to health care managers: hospital CEO imperatives for improving quality and lowering costs. Health Care Manage Rev. 2007;32(2):150–159.
- , , , , . Evidence summaries: the evolution of a rapid review approach. Syst Rev. 2012;1(1):10.
- , , , . Health care decision makers' use of comparative effectiveness research: report from a series of focus groups. J Manag Care Pharm. 2013;19(9):745–754.
- , , , et al. Rapid reviews versus full systematic reviews: an inventory of current methods and practice in health technology assessment. Int J Technol Assess Health Care. 2008;24(2):133–139.
- , , , et al. EPC Methods: An Exploration of Methods and Context for the Production of Rapid Reviews. Rockville, MD: Agency for Healthcare Research and Quality; 2015. Available at: http://www.ncbi.nlm.nih.gov/books/NBK274092. Accessed March 5, 2015.
- , , , , . Effectiveness of a novel and scalable clinical decision support intervention to improve venous thromboembolism prophylaxis: a quasi‐experimental study. BMC Med Inform Decis Mak. 2012;12:92.
- . Order sets in electronic health records: principles of good practice. Chest. 2013;143(1):228–235.
- , , , et al. Development, implementation, and impact of an automated early warning and response system for sepsis. J Hosp Med. 2015;10(1):26–31.
- , , , et al. Clinician perception of the effectiveness of an automated early warning and response system for sepsis in an academic medical center. Ann Am Thorac Soc. 2015;12(10):1514–1519.
- , , , , , . Usability and impact of a computerized clinical decision support intervention designed to reduce urinary catheter utilization and catheter‐associated urinary tract infections. Infect Control Hosp Epidemiol. 2014;35(9):1147–1155.
- , , , et al. The readmission risk flag: using the electronic health record to automatically identify patients at risk for 30‐day readmission. J Hosp Med. 2013;8(12):689–695.
- , , , , , . A systematic review to inform institutional decisions about the use of extracorporeal membrane oxygenation during the H1N1 influenza pandemic. Crit Care Med. 2010;38(6):1398–1404.
- , , , . Heparin flushing and other interventions to maintain patency of central venous catheters: a systematic review. J Adv Nurs. 2009;65(10):2007–2021.
- , , . Response rates to mail surveys published in medical journals. J Clin Epidemiol. 1997;50(10):1129–1136.
- , . Physician response to surveys: a review of the literature. Am J Prev Med. 2001;20(1):61–67.
- , , , , . Systematic review and cost analysis comparing use of chlorhexidine with use of iodine for preoperative skin antisepsis to prevent surgical site infection. Infect Control Hosp Epidemiol. 2010;31(12):1219–1229.
- , , . Antifibrinolytic use in adult cardiac surgery. Curr Opin Hematol. 2007;14(5):455–467.
- , , , , . Teaching evidence assimilation for collaborative health care (TEACH) 2009–2014: building evidence‐based capacity within health care provider organizations. EGEMS (Wash DC). 2015;3(2):1165.
- , , , , , . Cleaning hospital room surfaces to prevent health care‐associated infections: a technical brief [published online August 11, 2015]. Ann Intern Med. doi:10.7326/M15‐1192.
- , , , Healthcare Infection Control Practices Advisory Committee. Updating the guideline development methodology of the Healthcare Infection Control Practices Advisory Committee (HICPAC). Am J Infect Control. 2010;38(4):264–273.
- U.S. Food and Drug Administration. FDA basics—What is a medical device? Available at: http://www.fda.gov/AboutFDA/Transparency/Basics/ucm211822.htm. Accessed November 12, 2014.
Hospital evidence‐based practice centers (EPCs) are structures with the potential to facilitate the integration of evidence into institutional decision making to close knowing‐doing gaps[1, 2, 3, 4, 5, 6]; in the process, they can support the evolution of their parent institutions into learning healthcare systems.[7] The potential of hospital EPCs stems from their ability to identify and adapt national evidence‐based guidelines and systematic reviews for the local setting,[8] create local evidence‐based guidelines in the absence of national guidelines, use local data to help define problems and assess the impact of solutions,[9] and implement evidence into practice through computerized clinical decision support (CDS) interventions and other quality‐improvement (QI) initiatives.[9, 10] As such, hospital EPCs have the potential to strengthen relationships and understanding between clinicians and administrators[11]; foster a culture of evidence‐based practice; and improve the quality, safety, and value of care provided.[10]
Formal hospital EPCs remain uncommon in the United States,[10, 11, 12] though their numbers have expanded worldwide.[13, 14] This growth is due not to any reduced role for national EPCs, such as the National Institute for Health and Clinical Excellence[15] in the United Kingdom, or the 13 EPCs funded by the Agency for Healthcare Research and Quality (AHRQ)[16, 17] in the United States. Rather, this growth is fueled by the heightened awareness that the value of healthcare interventions often needs to be assessed locally, and that clinical guidelines that consider local context have a greater potential to improve quality and efficiency.[9, 18, 19]
Despite the increasing number of hospital EPCs globally, their impact on administrative and clinical decision making has rarely been examined,[13, 20] especially for hospital EPCs in the United States. The few studies that have assessed the impact of hospital EPCs on institutional decision making have done so in the context of technology acquisition, neglecting the role hospital EPCs may play in the integration of evidence into clinical practice. For example, the Technology Assessment Unit at McGill University Health Center found that of the 27 reviews commissioned in their first 5 years, 25 were implemented, with 6 (24%) recommending investments in new technologies and 19 (76%) recommending rejection, for a reported net hospital savings of $10 million.[21] Understanding the activities and impact of hospital EPCs is particularly critical for hospitalist leaders, who could leverage hospital EPCs to inform efforts to support the quality, safety, and value of care provided, or who may choose to establish or lead such infrastructure. The availability of such opportunities could also support hospitalist recruitment and retention.
In 2006, the University of Pennsylvania Health System (UPHS) created the Center for Evidence‐based Practice (CEP) to support the integration of evidence into practice to strengthen quality, safety, and value.[10] Cofounded by hospitalists with formal training in clinical epidemiology, the CEP performs rapid systematic reviews of the scientific literature to inform local practice and policy. In this article, we describe the first 8 years of the CEP's evidence synthesis activities and examine its impact on decision making across the health system.
METHODS
Setting
The UPHS includes 3 acute care hospitals, and inpatient facilities specializing in acute rehabilitation, skilled nursing, long‐term acute care, and hospice, with a capacity of more than 1800 beds and 75,000 annual admissions, as well as primary care and specialty clinics with more than 2 million annual outpatient visits. The CEP is funded by and organized within the Office of the UPHS Chief Medical Officer, serves all UPHS facilities, has an annual budget of approximately $1 million, and is currently staffed by a hospitalist director, 3 research analysts, 6 physician and nurse liaisons, a health economist, biostatistician, administrator, and librarians, totaling 5.5 full time equivalents.
The mission of the CEP is to support the quality, safety, and value of care at Penn through evidence‐based practice. To accomplish this mission, the CEP performs rapid systematic reviews, translates evidence into practice through the use of CDS interventions and clinical pathways, and offers education in evidence‐based decision making to trainees, staff, and faculty. This study is focused on the CEP's evidence synthesis activities.
Typically, clinical and administrative leaders submit a request to the CEP for an evidence review, the request is discussed and approved at the weekly staff meeting, and a research analyst and clinical liaison are assigned to the request and communicate with the requestor to clearly define the question of interest. Subsequently, the research analyst completes a protocol, a draft search, and a draft report, each reviewed and approved by the clinical liaison and requestor. The final report is posted to the website, disseminated to all key stakeholders across the UPHS as identified by the clinical liaisons, and integrated into decision making through various routes, including in‐person presentations to decision makers, and CDS and QI initiatives.
Study Design
The study included an analysis of an internal database of evidence reviews and a survey of report requestors, and was exempted from institutional review board review. Survey respondents were informed that their responses would be confidential and did not receive incentives.
Internal Database of Reports
Data from the CEP's internal management database were analyzed for its first 8 fiscal years (July 2006June 2014). Variables included requestor characteristics, report characteristics (eg, technology reviewed, clinical specialty examined, completion time, and performance of meta‐analyses and GRADE [Grading of Recommendations Assessment, Development and Evaluation] analyses[22]), report use (eg, integration of report into CDS interventions) and dissemination beyond the UPHS (eg, submission to Center for Reviews and Dissemination [CRD] Health Technology Assessment [HTA] database[23] and to peer‐reviewed journals). Report completion time was defined as the time between the date work began on the report and the date the final report was sent to the requestor. The technology categorization scheme was adapted from that provided by Goodman (2004)[24] and the UK National Institute for Health Research HTA Programme.[25] We systematically assigned the technology reviewed in each report to 1 of 8 mutually exclusive categories. The clinical specialty examined in each report was determined using an algorithm (see Supporting Information, Appendix 1, in the online version of this article).
We compared the report completion times and the proportions of requestor types, technologies reviewed, and clinical specialties examined in the CEP's first 4 fiscal years (July 2006June 2010) to those in the CEP's second 4 fiscal years (July 2010June 2014) using t tests and 2 tests for continuous and categorical variables, respectively.
Survey
We conducted a Web‐based survey (see Supporting Information, Appendix 2, in the online version of this article) of all requestors of the 139 rapid reviews completed in the last 4 fiscal years. Participants who requested multiple reports were surveyed only about the most recent report. Requestors were invited to participate in the survey via e‐mail, and follow‐up e‐mails were sent to nonrespondents at 7, 14, and 16 days. Nonrespondents and respondents were compared with respect to requestor type (physician vs nonphysician) and topic evaluated (traditional HTA topics such as drugs, biologics, and devices vs nontraditional HTA topics such as processes of care). The survey was administered using REDCap[26] electronic data capture tools. The 44‐item questionnaire collected data on the interaction between the requestor and the CEP, report characteristics, report impact, and requestor satisfaction.
Survey results were imported into Microsoft Excel (Microsoft Corp, Redmond, WA) and SPSS (IBM, Armonk, NY) for analysis. Descriptive statistics were generated, and statistical comparisons were conducted using 2 and Fisher exact tests.
RESULTS
Evidence Synthesis Activity
The CEP has produced several different report products since its inception. Evidence reviews (57%, n = 142) consist of a systematic review and analysis of the primary literature. Evidence advisories (32%, n = 79) are summaries of evidence from secondary sources such as guidelines or systematic reviews. Evidence inventories (3%, n = 7) are literature searches that describe the quantity and focus of available evidence, without analysis or synthesis.[27]
The categories of technologies examined, including their definitions and examples, are provided in Table 1. Drugs (24%, n = 60) and devices/equipment/supplies (19%, n = 48) were most commonly examined. The proportion of reports examining technology types traditionally evaluated by HTA organizations significantly decreased when comparing the first 4 years of CEP activity to the second 4 years (62% vs 38%, P < 0.01), whereas reports examining less traditionally reviewed categories increased (38% vs 62%, P < 0.01). The most common clinical specialties represented by the CEP reports were nursing (11%, n = 28), general surgery (11%, n = 28), critical care (10%, n = 24), and general medicine (9%, n = 22) (see Supporting Information, Appendix 3, in the online version of this article). Clinical departments were the most common requestors (29%, n = 72) (Table 2). The proportion of requests from clinical departments significantly increased when comparing the first 4 years to the second 4 years (20% vs 36%, P < 0.01), with requests from purchasing committees significantly decreasing (25% vs 6%, P < 0.01). The overall report completion time was 70 days, and significantly decreased when comparing the first 4 years to the second 4 years (89 days vs 50 days, P < 0.01).
| Category | Definition | Examples | Total | 20072010 | 20112014 | P Value |
|---|---|---|---|---|---|---|
| Total | 249 (100%) | 109 (100%) | 140 (100%) | |||
| Drug | A report primarily examining the efficacy/effectiveness, safety, appropriate use, or cost of a pharmacologic agent | Celecoxib for pain in joint arthroplasty; colchicine for prevention of pericarditis and atrial fibrillation | 60 (24%) | 35 (32%) | 25 (18%) | 0.009 |
| Device, equipment, and supplies | A report primarily examining the efficacy/effectiveness, safety, appropriate use, or cost of an instrument, apparatus, implement, machine, contrivance, implant, in vitro reagent, or other similar or related article, including a component part, or accessory that is intended for use in the prevention, diagnosis, or treatment of disease and does not achieve its primary intended purposes though chemical action or metabolism[50] | Thermometers for pediatric use; femoral closure devices for cardiac catheterization | 48 (19%) | 25 (23%) | 23 (16%) | 0.19 |
| Process of care | A report primarily examining a clinical pathway or a clinical practice guideline that significantly involves elements of prevention, diagnosis, and/or treatment or significantly incorporates 2 or more of the other technology categories | Preventing patient falls; prevention and management of delirium | 31 (12%) | 18 (17%) | 13 (9%) | 0.09 |
| Test, scale, or risk factor | A report primarily examining the efficacy/effectiveness, safety, appropriate use, or cost of a test intended to screen for, diagnose, classify, or monitor the progression of a disease | Computed tomography for acute chest pain; urine drug screening in chronic pain patients on opioid therapy | 31 (12%) | 8 (7%) | 23 (16%) | 0.03 |
| Medical/surgical procedure | A report primarily examining the efficacy/effectiveness, safety, appropriate use, or cost of a medical intervention that is not a drug, device, or test or of the application or removal of a device | Biliary drainage for chemotherapy patients; cognitive behavioral therapy for insomnia | 26 (10%) | 8 (7%) | 18 (13%) | 0.16 |
| Policy or organizational/managerial system | A report primarily examining laws or regulations; the organization, financing, or delivery of care, including settings of care; or healthcare providers | Medical care costs and productivity changes associated with smoking; physician training and credentialing for robotic surgery in obstetrics and gynecology | 26 (10%) | 4 (4%) | 22 (16%) | 0.002 |
| Support system | A report primarily examining the efficacy/effectiveness, safety, appropriate use, or cost of an intervention designed to provide a new or improved service to patients or healthcare providers that does not fall into 1 of the other categories | Reconciliation of data from differing electronic medical records; social media, text messaging, and postdischarge communication | 14 (6%) | 3 (3%) | 11 (8%) | 0.09 |
| Biologic | A report primarily examining the efficacy/effectiveness, safety, appropriate use, or cost of a product manufactured in a living system | Recombinant factor VIIa for cardiovascular surgery; osteobiologics for orthopedic fusions | 13 (5%) | 8 (7%) | 5 (4%) | 0.19 |
| Category | Total | 20072010 | 20112014 | P Value |
|---|---|---|---|---|
| ||||
| Total | 249 (100%) | 109 (100%) | 140 (100%) | |
| Clinical department | 72 (29%) | 22 (20%) | 50 (36%) | 0.007 |
| CMO | 47 (19%) | 21 (19%) | 26 (19%) | 0.92 |
| Purchasing committee | 35 (14%) | 27 (25%) | 8 (6%) | <0.001 |
| Formulary committee | 22 (9%) | 12 (11%) | 10 (7%) | 0.54 |
| Quality committee | 21 (8%) | 11 (10%) | 10 (7%) | 0.42 |
| Administrative department | 19 (8%) | 5 (5%) | 14 (10%) | 0.11 |
| Nursing | 14 (6%) | 4 (4%) | 10 (7%) | 0.23 |
| Other* | 19 (8%) | 7 (6%) | 12 (9%) | 0.55 |
Thirty‐seven (15%) reports included meta‐analyses conducted by CEP staff. Seventy‐five reports (30%) contained an evaluation of the quality of the evidence base using GRADE analyses.[22] Of these reports, the highest GRADE of evidence available for any comparison of interest was moderate (35%, n = 26) or high (33%, n = 25) in most cases, followed by very low (19%, n = 14) and low (13%, n = 10).
Reports were disseminated in a variety of ways beyond direct dissemination and presentation to requestors and posting on the center website. Thirty reports (12%) informed CDS interventions, 24 (10%) resulted in peer‐reviewed publications, and 204 (82%) were posted to the CRD HTA database.
Evidence Synthesis Impact
A total of 139 reports were completed between July 2010 and June 2014 for 65 individual requestors. Email invitations to participate in the survey were sent to the 64 requestors employed by the UPHS. The response rate was 72% (46/64). The proportions of physician requestors and traditional HTA topics evaluated were similar across respondents and nonrespondents (43% [20/46] vs 39% [7/18], P = 0.74; and 37% [17/46] vs 44% [8/18], P = 0.58, respectively). Aggregated survey responses are presented for items using a Likert scale in Figure 1, and for items using a yes/no or ordinal scale in Table 3.
| Items | % of Respondents Responding Affirmatively |
|---|---|
| Percentage of Respondents Ranking as First Choice* | |
| |
| Requestor activity | |
| What factors prompted you to request a report from CEP? (Please select all that apply.) | |
| My own time constraints | 28% (13/46) |
| CEP's ability to identify and synthesize evidence | 89% (41/46) |
| CEP's objectivity | 52% (24/46) |
| Recommendation from colleague | 30% (14/46) |
| Did you conduct any of your own literature searches before contacting CEP? | 67% (31/46) |
| Did you obtain and read any of the articles cited in CEP's report? | 63% (29/46) |
| Did you read the following sections of CEP's report? | |
| Evidence summary (at beginning of report) | 100% (45/45) |
| Introduction/background | 93% (42/45) |
| Methods | 84% (38/45) |
| Results | 98% (43/43) |
| Conclusion | 100% (43/43) |
| Report dissemination | |
| Did you share CEP's report with anyone NOT involved in requesting the report or in making the final decision? | 67% (30/45) |
| Did you share CEP's report with anyone outside of Penn? | 7% (3/45) |
| Requestor preferences | |
| Would it be helpful for CEP staff to call you after you receive any future CEP reports to answer any questions you might have? | 55% (24/44) |
| Following any future reports you request from CEP, would you be willing to complete a brief questionnaire? | 100% (44/44) |
| Please rank how you would prefer to receive reports from CEP in the future. | |
| E‐mail containing the report as a PDF attachment | 77% (34/44) |
| E‐mail containing a link to the report on CEP's website | 16% (7/44) |
| In‐person presentation by the CEP analyst writing the report | 18% (8/44) |
| In‐person presentation by the CEP director involved in the report | 16% (7/44) |
In general, respondents found reports easy to request, easy to use, timely, and relevant, resulting in high requestor satisfaction. In addition, 98% described the scope of content and level of detail as about right. Report impact was rated highly as well, with the evidence summary and conclusions rated as the most critical to decision making. A majority of respondents indicated that reports confirmed their tentative decision (77%, n = 34), whereas some changed their tentative decision (7%, n = 3), and others suggested the report had no effect on their tentative decision (16%, n = 7). Respondents indicated the amount of time that elapsed between receiving reports and making final decisions was 1 to 7 days (5%, n = 2), 8 to 30 days (40%, n = 17), 1 to 3 months (37%, n = 16), 4 to 6 months (9%, n = 4), or greater than 6 months (9%, n = 4). The most common reasons cited for requesting a report were the CEP's evidence synthesis skills and objectivity.
DISCUSSION
To our knowledge, this is the first comprehensive description and assessment of evidence synthesis activity by a hospital EPC in the United States. Our findings suggest that clinical and administrative leaders will request reports from a hospital EPC, and that hospital EPCs can promptly produce reports when requested. Moreover, these syntheses can address a wide range of clinical and policy topics, and can be disseminated through a variety of routes. Lastly, requestors are satisfied by these syntheses, and report that they inform decision making. These results suggest that EPCs may be an effective infrastructure paradigm for promoting evidence‐based decision making within healthcare provider organizations, and are consistent with previous analyses of hospital‐based EPCs.[21, 28, 29]
Over half of report requestors cited CEP's objectivity as a factor in their decision to request a report, underscoring the value of a neutral entity in an environment where clinical departments and hospital committees may have competing interests.[10] This asset was 1 of the primary drivers for establishing our hospital EPC. Concerns by clinical executives about the influence of industry and local politics on institutional decision making, and a desire to have clinical evidence more systematically and objectively integrated into decision making, fueled our center's funding.
The survey results also demonstrate that respondents were satisfied with the reports for many reasons, including readability, concision, timeliness, scope, and content, consistent with the evaluation of the French hospital‐based EPC CEDIT (French Committee for the Assessment and Dissemination of Technological Innovations).[29] Given the importance of readability, concision, and relevance that has been previously described,[16, 28, 30] nearly all CEP reports contain an evidence summary on the first page that highlights key findings in a concise, user‐friendly format.[31] The evidence summaries include bullet points that: (1) reference the most pertinent guideline recommendations along with their strength of recommendation and underlying quality of evidence; (2) organize and summarize study findings using the most critical clinical outcomes, including an assessment of the quality of the underlying evidence for each outcome; and (3) note important limitations of the findings.
Evidence syntheses must be timely to allow decision makers to act on the findings.[28, 32] The primary criticism of CEDIT was the lag between requests and report publication.[29] Rapid reviews, designed to inform urgent decisions, can overcome this challenge.[31, 33, 34] CEP reviews required approximately 2 months to complete on average, consistent with the most rapid timelines reported,[31, 33, 34] and much shorter than standard systematic review timelines, which can take up to 12 to 24 months.[33] Working with requestors to limit the scope of reviews to those issues most critical to a decision, using secondary resources when available, and hiring experienced research analysts help achieve these efficiencies.
The study by Bodeau‐Livinec also argues for the importance of report accessibility to ensure dissemination.[29] This is consistent with the CEP's approach, where all reports are posted on the UPHS internal website. Many also inform QI initiatives, as well as CDS interventions that address topics of general interest to acute care hospitals, such as venous thromboembolism (VTE) prophylaxis,[35] blood product transfusions,[36] sepsis care,[37, 38] and prevention of catheter‐associated urinary tract infections (CAUTI)[39] and hospital readmissions.[40] Most reports are also listed in an international database of rapid reviews,[23] and reports that address topics of general interest, have sufficient evidence to synthesize, and have no prior published systematic reviews are published in the peer‐reviewed literature.[41, 42]
The majority of reports completed by the CEP were evidence reviews, or systematic reviews of primary literature, suggesting that CEP reports often address questions previously unanswered by existing published systematic reviews; however, about a third of reports were evidence advisories, or summaries of evidence from preexisting secondary sources. The relative scarcity of high‐quality evidence bases in those reports where GRADE analyses were conducted might be expected, as requestors may be more likely to seek guidance when the evidence base on a topic is lacking. This was further supported by the small percentage (15%) of reports where adequate data of sufficient homogeneity existed to allow meta‐analyses. The small number of original meta‐analyses performed also reflects our reliance on secondary resources when available.
Only 7% of respondents reported that tentative decisions were changed based on their report. This is not surprising, as evidence reviews infrequently result in clear go or no go recommendations. More commonly, they address or inform complex clinical questions or pathways. In this context, the change/confirm/no effect framework may not completely reflect respondents' use of or benefit from reports. Thus, we included a diverse set of questions in our survey to best estimate the value of our reports. For example, when asked whether the report answered the question posed, informed their final decision, or was consistent with their final decision, 91%, 79%, and 71% agreed or strongly agreed, respectively. When asked whether they would request a report again if they had to do it all over, recommend CEP to their colleagues, and be likely to request reports in the future, at least 95% of survey respondents agreed or strongly agreed. In addition, no respondent indicated that their report was not timely enough to influence their decision. Moreover, only a minority of respondents expressed disappointment that the CEP's report did not provide actionable recommendations due to a lack of published evidence (9%, n = 4). Importantly, the large proportion of requestors indicating that reports confirmed their tentative decisions may be a reflection of hindsight bias.
The most apparent trend in the production of CEP reviews over time is the relative increase in requests by clinical departments, suggesting that the CEP is being increasingly consulted to help define best clinical practices. This is also supported by the relative increase in reports focused on policy or organizational/managerial systems. These findings suggest that hospital EPCs have value beyond the traditional realm of HTA.
This study has a number of limitations. First, not all of the eligible report requestors responded to our survey. Despite this, our response rate of 72% compares favorably with surveys published in medical journals.[43] In addition, nonresponse bias may be less important in physician surveys than surveys of the general population.[44] The similarity in requestor and report characteristics for respondents and nonrespondents supports this. Second, our survey of impact is self‐reported rather than an evaluation of actual decision making or patient outcomes. Thus, the survey relies on the accuracy of the responses. Third, recall bias must be considered, as some respondents were asked to evaluate reports that were greater than 1 year old. To reduce this bias, we asked respondents to consider the most recent report they requested, included that report as an attachment in the survey request, and only surveyed requestors from the most recent 4 of the CEP's 8 fiscal years. Fourth, social desirability bias could have also affected the survey responses, though it was likely minimized by the promise of confidentiality. Fifth, an examination of the impact of the CEP on costs was outside the scope of this evaluation; however, such information may be important to those assessing the sustainability or return on investment of such centers. Simple approaches we have previously used to approximate the value of our activities include: (1) estimating hospital cost savings resulting from decisions supported by our reports, such as the use of technologies like chlorhexidine for surgical site infections[45] or discontinuation of technologies like aprotinin for cardiac surgery[46]; and (2) estimating penalties avoided or rewards attained as a result of center‐led initiatives, such as those to increase VTE prophylaxis,[35] reduce CAUTI rates,[39] and reduce preventable mortality associated with sepsis.[37, 38] Similarly, given the focus of this study on the local evidence synthesis activities of our center, our examination did not include a detailed description of our CDS activities, or teaching activities, including our multidisciplinary workshops for physicians and nurses in evidence‐based QI[47] and our novel evidence‐based practice curriculum for medical students. Our study also did not include a description of our extramural activities, such as those supported by our contract with AHRQ as 1 of their 13 EPCs.[16, 17, 48, 49] A consideration of all of these activities enables a greater appreciation for the potential of such centers. Lastly, we examined a single EPC, which may not be representative of the diversity of hospitals and hospital staff across the United States. However, our EPC serves a diverse array of patient populations, clinical services, and service models throughout our multientity academic healthcare system, which may improve the generalizability of our experience to other settings.
As next steps, we recommend evaluation of other existing hospital EPCs nationally. Such studies could help hospitals and health systems ascertain which of their internal decisions might benefit from locally sourced rapid systematic reviews and determine whether an in‐house EPC could improve the value of care delivered.
In conclusion, our findings suggest that hospital EPCs within academic healthcare systems can efficiently synthesize and disseminate evidence for a variety of stakeholders. Moreover, these syntheses impact decision making in a variety of hospital contexts and clinical specialties. Hospitals and hospitalist leaders seeking to improve the implementation of evidence‐based practice at a systems level might consider establishing such infrastructure locally.
Acknowledgements
The authors thank Fran Barg, PhD (Department of Family Medicine and Community Health, University of Pennsylvania Perelman School of Medicine) and Joel Betesh, MD (University of Pennsylvania Health System) for their contributions to developing the survey. They did not receive any compensation for their contributions.
Disclosures: An earlier version of this work was presented as a poster at the 2014 AMA Research Symposium, November 7, 2014, Dallas, Texas. Mr. Jayakumar reports having received a University of Pennsylvania fellowship as a summer intern at the Center for Evidence‐based Practice. Dr. Umscheid cocreated and directs a hospital evidence‐based practice center, is the Senior Associate Director of an Agency for Healthcare Research and Quality Evidence‐Based Practice Center, and is a past member of the Medicare Evidence Development and Coverage Advisory Committee, which uses evidence reports developed by the Evidence‐based Practice Centers of the Agency for Healthcare Research and Quality. Dr. Umscheid's contribution was supported in part by the National Center for Research Resources, grant UL1RR024134, which is now at the National Center for Advancing Translational Sciences, grant UL1TR000003. The content of this article is solely the responsibility of the authors and does not necessarily represent the official views of the National Institutes of Health. None of the funders had a role in the design and conduct of the study; collection, management, analysis, and interpretation of the data; preparation, review, or approval of the manuscript; and decision to submit the manuscript for publication. Dr. Lavenberg, Dr. Mitchell, and Mr. Leas are employed as research analysts by a hospital evidence‐based practice center. Dr. Doshi is supported in part by a hospital evidence‐based practice center and is an Associate Director of an Agency for Healthcare Research and Quality Evidence‐based Practice Center. Dr. Goldmann is emeritus faculty at Penn, is supported in part by a hospital evidence‐based practice center, and is the Vice President and Chief Quality Assurance Officer in Clinical Solutions, a division of Elsevier, Inc., a global publishing company, and director of the division's Evidence‐based Medicine Center. Dr. Williams cocreated and codirects a hospital evidence‐based practice center. Dr. Brennan has oversight for and helped create a hospital evidence‐based practice center.
- , . “Bench to behavior”: translating comparative effectiveness research into improved clinical practice. Health Aff (Millwood). 2010;29(10):1891–1900.
- , , . Evaluating the status of “translating research into practice” at a major academic healthcare system. Int J Technol Assess Health Care. 2009;25(1):84–89.
- , , , . Five reasons that many comparative effectiveness studies fail to change patient care and clinical practice. Health Aff (Millwood). 2012;31(10):2168–2175.
- , , , , , . Fostering implementation of health services research findings into practice: a consolidated framework for advancing implementation science. Implement Sci. 2009;4(1):50.
- , . From best evidence to best practice: effective implementation of change in patients' care. Lancet. 2003;362(9391):1225–1230.
- , . Incentivizing “structures” over “outcomes” to bridge the knowing‐doing gap. JAMA Intern Med. 2015;175(3):354.
- Olsen L, Aisner D, McGinnis JM, eds. Institute of Medicine (US) Roundtable on Evidence‐Based Medicine. The Learning Healthcare System: Workshop Summary. Washington, DC: National Academies Press; 2007. Available at: http://www.ncbi.nlm.nih.gov/books/NBK53494/. Accessed October 29, 2014.
- , , , . Adapting clinical practice guidelines to local context and assessing barriers to their use. Can Med Assoc J. 2010;182(2):E78–E84.
- , , , . Integrating local data into hospital‐based healthcare technology assessment: two case studies. Int J Technol Assess Health Care. 2010;26(3):294–300.
- , , . Hospital‐based comparative effectiveness centers: translating research into practice to improve the quality, safety and value of patient care. J Gen Intern Med. 2010;25(12):1352–1355.
- , , , , . Health technology assessment at the University of California‐San Francisco. J Healthc Manag Am Coll Healthc Exec. 2011;56(1):15–29; discussion 29–30.
- , . Kaiser Permanente Southern California regional technology management process: evidence‐based medicine operationalized. Perm J. 2006;10(1):38–41.
- . Hospital‐based health technology assessment: developments to date. Pharmacoeconomics. 2014;32(9):819–824.
- , , , . Hospital based health technology assessment world‐wide survey. Available at: http://www.htai.org/fileadmin/HTAi_Files/ISG/HospitalBasedHTA/2008Files/HospitalBasedHTAISGSurveyReport.pdf. Accessed October 11, 2015.
- , . At the center of health care policy making: the use of health technology assessment at NICE. Med Decis Making. 2013;33(3):320–324.
- , , . Better information for better health care: the Evidence‐based Practice Center program and the Agency for Healthcare Research and Quality. Ann Intern Med. 2005;142(12 part 2):1035–1041.
- , . AHRQ's Effective Health Care Program: why comparative effectiveness matters. Am J Med Qual. 2009;24(1):67–70.
- , . Effect of clinical guidelines on medical practice: a systematic review of rigorous evaluations. Lancet. 1993;342(8883):1317–1322.
- , , , et al. Lost in knowledge translation: time for a map? J Contin Educ Health Prof. 2006;26(1):13–24.
- , , , . Effects and repercussions of local/hospital‐based health technology assessment (HTA): a systematic. Syst Rev. 2014;3:129.
- , , , et al. Impact of TAU Reports. McGill University Health Centre. Available at: https://francais.mcgill.ca/files/tau/FINAL_TAU_IMPACT_REPORT_FEB_2008.pdf. Published Feb 1, 2008. Accessed August 19, 2014.
- , , , et al. GRADE: an emerging consensus on rating quality of evidence and strength of recommendations. BMJ. 2008;336(7650):924–926.
- , , . Centre for Reviews and Dissemination databases: value, content, and developments. Int J Technol Assess Health Care. 2010;26(4):470–472.
- . HTA 101. Introduction to Health Technology Assessment. Available at: https://www.nlm.nih.gov/nichsr/hta101/ta10103.html. Accessed October 11, 2015.
- National Institute for Health Research. Remit. NIHR HTA Programme. Available at: http://www.nets.nihr.ac.uk/programmes/hta/remit. Accessed August 20, 2014.
- , , , , , . Research Electronic Data Capture (REDCap)—a metadata‐driven methodology and workflow process for providing translational research informatics support. J Biomed Inform. 2009;42(2):377–381.
- , , , . When the decision is what to decide: Using evidence inventory reports to focus health technology assessments. Int J Technol Assess Health Care. 2011;27(2):127–132.
- , . End‐user involvement in health technology assessment (HTA) development: a way to increase impact. Int J Technol Assess Health Care. 2005;21(02):263–267.
- , , , , . Impact of CEDIT recommendations: an example of health technology assessment in a hospital network. Int J Technol Assess Health Care. 2006;22(2):161–168.
- , , , . Increasing the relevance of research to health care managers: hospital CEO imperatives for improving quality and lowering costs. Health Care Manage Rev. 2007;32(2):150–159.
- , , , , . Evidence summaries: the evolution of a rapid review approach. Syst Rev. 2012;1(1):10.
- , , , . Health care decision makers' use of comparative effectiveness research: report from a series of focus groups. J Manag Care Pharm. 2013;19(9):745–754.
- , , , et al. Rapid reviews versus full systematic reviews: an inventory of current methods and practice in health technology assessment. Int J Technol Assess Health Care. 2008;24(2):133–139.
- , , , et al. EPC Methods: An Exploration of Methods and Context for the Production of Rapid Reviews. Rockville, MD: Agency for Healthcare Research and Quality; 2015. Available at: http://www.ncbi.nlm.nih.gov/books/NBK274092. Accessed March 5, 2015.
- , , , , . Effectiveness of a novel and scalable clinical decision support intervention to improve venous thromboembolism prophylaxis: a quasi‐experimental study. BMC Med Inform Decis Mak. 2012;12:92.
- . Order sets in electronic health records: principles of good practice. Chest. 2013;143(1):228–235.
- , , , et al. Development, implementation, and impact of an automated early warning and response system for sepsis. J Hosp Med. 2015;10(1):26–31.
- , , , et al. Clinician perception of the effectiveness of an automated early warning and response system for sepsis in an academic medical center. Ann Am Thorac Soc. 2015;12(10):1514–1519.
- , , , , , . Usability and impact of a computerized clinical decision support intervention designed to reduce urinary catheter utilization and catheter‐associated urinary tract infections. Infect Control Hosp Epidemiol. 2014;35(9):1147–1155.
- , , , et al. The readmission risk flag: using the electronic health record to automatically identify patients at risk for 30‐day readmission. J Hosp Med. 2013;8(12):689–695.
- , , , , , . A systematic review to inform institutional decisions about the use of extracorporeal membrane oxygenation during the H1N1 influenza pandemic. Crit Care Med. 2010;38(6):1398–1404.
- , , , . Heparin flushing and other interventions to maintain patency of central venous catheters: a systematic review. J Adv Nurs. 2009;65(10):2007–2021.
- , , . Response rates to mail surveys published in medical journals. J Clin Epidemiol. 1997;50(10):1129–1136.
- , . Physician response to surveys: a review of the literature. Am J Prev Med. 2001;20(1):61–67.
- , , , , . Systematic review and cost analysis comparing use of chlorhexidine with use of iodine for preoperative skin antisepsis to prevent surgical site infection. Infect Control Hosp Epidemiol. 2010;31(12):1219–1229.
- , , . Antifibrinolytic use in adult cardiac surgery. Curr Opin Hematol. 2007;14(5):455–467.
- , , , , . Teaching evidence assimilation for collaborative health care (TEACH) 2009–2014: building evidence‐based capacity within health care provider organizations. EGEMS (Wash DC). 2015;3(2):1165.
- , , , , , . Cleaning hospital room surfaces to prevent health care‐associated infections: a technical brief [published online August 11, 2015]. Ann Intern Med. doi:10.7326/M15‐1192.
- , , , Healthcare Infection Control Practices Advisory Committee. Updating the guideline development methodology of the Healthcare Infection Control Practices Advisory Committee (HICPAC). Am J Infect Control. 2010;38(4):264–273.
- U.S. Food and Drug Administration. FDA basics—What is a medical device? Available at: http://www.fda.gov/AboutFDA/Transparency/Basics/ucm211822.htm. Accessed November 12, 2014.
© 2015 Society of Hospital Medicine
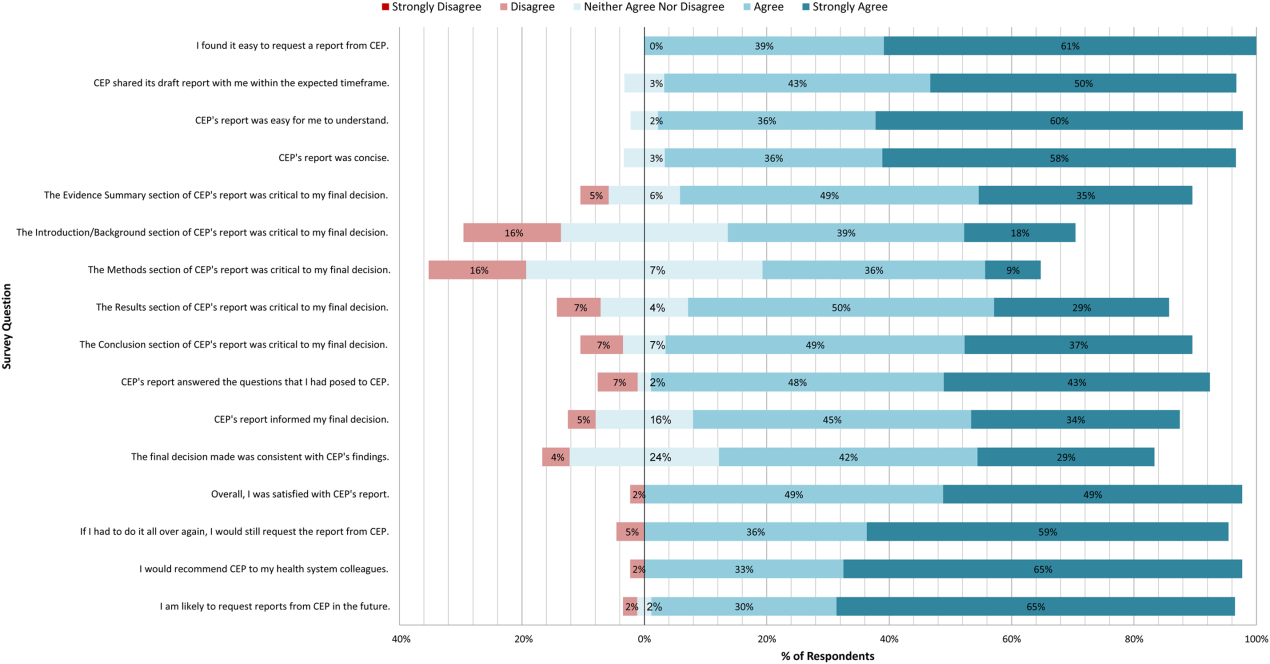
Hospital Readmissions and Preventability
Hospital readmissions cost Medicare $15 to $17 billion per year.[1, 2] In 2010, the Hospital Readmission Reduction Program (HRRP), created by the Patient Protection and Affordable Care Act, authorized the Centers for Medicare and Medicaid Services (CMS) to penalize hospitals with higher‐than‐expected readmission rates for certain index conditions.[3] Other payers may follow suit, so hospitals and health systems nationwide are devoting significant resources to reducing readmissions.[4, 5, 6]
Implicit in these efforts are the assumptions that a significant proportion of readmissions are preventable, and that preventable readmissions can be identified. Unfortunately, estimates of preventability vary widely.[7, 8] In this article, we examine how preventable readmissions have been defined, measured, and calculated, and explore the associated implications for readmission reduction efforts.
THE MEDICARE READMISSION METRIC
The medical literature reveals substantial heterogeneity in how readmissions are assessed. Time periods range from 14 days to 4 years, and readmissions may be counted differently depending on whether they are to the same hospital or to any hospital, whether they are for the same (or a related) condition or for any condition, whether a patient is allowed to count only once during the follow‐up period, how mortality is treated, and whether observation stays are considered.[9]
Despite a lack of consensus in the literature, the approach adopted by CMS is endorsed by the National Quality Forum (NQF)[10] and has become the de facto standard for calculating readmission rates. CMS derives risk‐standardized readmission rates for acute myocardial infarction (AMI), heart failure (HF), and pneumonia (PN), using administrative claims data for each Medicare fee‐for‐service beneficiary 65 years or older.[11, 12, 13, 14] CMS counts the first readmission (but not subsequent ones) for any cause within 30 days of the index discharge, including readmissions to other facilities. Certain planned readmissions for revascularization are excluded, as are patients who left against medical advice, transferred to another acute‐care hospital, or died during the index admission. Admissions to psychiatric, rehabilitation, cancer specialty, and children's hospitals[12] are also excluded, as well as patients classified as observation status for either hospital stay.[15] Only administrative data are used in readmission calculations (ie, there are no chart reviews or interviews with healthcare personnel or patients). Details are published online and updated at least annually.[15]
EFFECTS AND LIMITATIONS OF THE HRRP AND THE CMS READMISSION METRIC
Penalizing hospitals for higher‐than‐expected readmission rates based on the CMS metric has been successful in the sense that hospitals now feel more accountable for patient outcomes after discharge; they are implementing transitional care programs, improving communication, and building relationships with community programs.[4, 5, 16] Early data suggest a small decline in readmission rates of Medicare beneficiaries nationally.[17] Previously, such readmission rates were constant.[18]
Nevertheless, significant concerns with the current approach have surfaced.[19, 20, 21] First, why choose 30 days? This time horizon was believed to be long enough to identify readmissions attributable to an index admission and short enough to reflect hospital‐delivered care and transitions to the outpatient setting, and it allows for collaboration between hospitals and their communities to reduce readmissions.[3] However, some have argued that this time horizon has little scientific basis,[22] and that hospitals are unfairly held accountable for a timeframe when outcomes may largely be influenced by the quality of outpatient care or the development of new problems.[23, 24] Approximately one‐third of 30‐day readmissions occur within the first 7 days, and more than half (55.7%) occur within the first 14 days[22, 25]; such time frames may be more appropriate for hospital accountability.[26]
Second, spurred by the focus of CMS penalties, efforts to reduce readmissions have largely concerned patients admitted for HF, AMI, or PN, although these 3 medical conditions account for only 10% of Medicare hospitalizations.[18] Programs focused on a narrow patient population may not benefit other patients with high readmission rates, such as those with gastrointestinal or psychiatric problems,[2] or lead to improvements in the underlying processes of care that could benefit patients in additional ways. Indeed, research suggests that low readmission rates may not be related to other measures of hospital quality.[27, 28]
Third, public reporting and hospital penalties are based on 3‐year historical performance, in part to accumulate a large enough sample size for each diagnosis. Hospitals that seek real‐time performance monitoring are limited to tracking surrogate outcomes, such as readmissions back to their own facility.[29, 30] Moreover, because of the long performance time frame, hospitals that achieve rapid improvement may endure penalties precisely when they are attempting to sustain their achievements.
Fourth, the CMS approach utilizes a complex risk‐standardization methodology, which has only modest ability to predict readmissions and allow hospital comparisons.[9] There is no adjustment for community characteristics, even though practice patterns are significantly associated with readmission rates,[9, 31] and more than half of the variation in readmission rates across hospitals can be explained by characteristics of the community such as access to care.[32] Moreover, patient factors, such as race and socioeconomic status, are currently not included in an attempt to hold hospitals to similar standards regardless of their patient population. This is hotly contested, however, and critics note this policy penalizes hospitals for factors outside of their control, such as patients' ability to afford medications.[33] Indeed, the June 2013 Medicare Payment Advisory Committee (MedPAC) report to Congress recommended evaluating hospital performance against facilities with a like percentage of low‐income patients as a way to take into account socioeconomic status.[34]
Fifth, observation stays are excluded, so patients who remain in observation status during their index or subsequent hospitalization cannot be counted as a readmission. Prevalence of observation care has increased, raising concerns that inpatient admissions are being shifted to observation status, producing an artificial decline in readmissions.[35] Fortunately, recent population‐level data provide some reassuring evidence to the contrary.[36]
Finally, and perhaps most significantly, the current readmission metric does not consider preventability. Recent reviews have demonstrated that estimates of preventability vary widely in individual studies, ranging from 5% to 79%, depending on study methodology and setting.[7, 8] Across these studies, on average, only 23% of 30‐day readmissions appear to be avoidable.[8] Another way to consider the preventability of hospital readmissions is by noting that the most effective multimodal care‐transition interventions reduce readmission rates by only about 30%, and most interventions are much less effective.[26] The likely fact that only 23% to 30% of readmissions are preventable has profound implications for the anticipated results of hospital readmission reduction efforts. Interventions that are 75% effective in reducing preventable readmissions should be expected to produce only an 18% to 22% reduction in overall readmission rates.[37]
FOCUSING ON PREVENTABLE READMISSIONS
A greater focus on identifying and targeting preventable readmissions would offer a number of advantages over the present approach. First, it is more meaningful to compare hospitals based on their percentage of discharges resulting in a preventable readmission, than on the basis of highly complex risk standardization procedures for selected conditions. Second, a focus on preventable readmissions more clearly identifies and permits hospitals to target opportunities for improvement. Third, if the focus were on preventable readmissions for a large number of conditions, the necessary sample size could be obtained over a shorter period of time. Overall, such a preventable readmissions metric could serve as a more agile and undiluted performance indicator, as opposed to the present 3‐year rolling average rate of all‐cause readmissions for certain conditions, the majority of which are probably not preventable.
DEFINING PREVENTABILITY
Defining a preventable readmission is critically important. However, neither a consensus definition nor a validated standard for assessing preventable hospital readmissions exists. Different conceptual frameworks and terms (eg, avoidable, potentially preventable, or urgent readmission) complicate the issue.[38, 39, 40]
Although the CMS measure does not address preventability, it is helpful to consider whether other readmission metrics incorporate this concept. The United Health Group's (UHG, formerly Pacificare) All‐Cause Readmission Index, University HealthSystem Consortium's 30‐Day Readmission Rate (all cause), and 3M Health Information Systems' (3M) Potentially Preventable Readmissions (PPR) are 3 commonly used measures.
Of these, only the 3M PPR metric includes the concept of preventability. 3M created a proprietary matrix of 98,000 readmission‐index admission All Patient Refined Diagnosis Related Group pairs based on the review of several physicians and the logical assumption that a readmission for a clinically related diagnosis is potentially preventable.[24, 41] Readmission and index admissions are considered clinically related if any of the following occur: (1) medical readmission for continuation or recurrence of an initial, or closely related, condition; (2) medical readmission for acute decompensation of a chronic condition that was not the reason for the index admission but was plausibly related to care during or immediately afterward (eg, readmission for diabetes in a patient whose index admission was AMI); (3) medical readmission for acute complication plausibly related to care during index admission; (4) readmission for surgical procedure for continuation or recurrence of initial problem (eg, readmission for appendectomy following admission for abdominal pain and fever); or (5) readmission for surgical procedure to address complication resulting from care during index admission.[24, 41] The readmission time frame is not standardized and may be set by the user. Though conceptually appealing in some ways, CMS and the NQF have expressed concern about this specific approach because of the uncertain reliability of the relatedness of the admission‐readmission diagnosis dyads.[3]
In the research literature, only a few studies have examined the 3M PPR or other preventability assessments that rely on the relatedness of diagnostic codes.[8] Using the 3M PPR, a study showed that 78% of readmissions were classified as potentially preventable,[42] which explains why the 3M PPR and all‐cause readmission metric may correlate highly.[43] Others have demonstrated that ratings of hospital performance on readmission rates vary by a moderate to large amount, depending on whether the 3M PPR, CMS, or UHG methodology is used.[43, 44] An algorithm called SQLape[45, 46] is used in Switzerland to benchmark hospitals and defines potentially avoidable readmissions as being related to index diagnoses or complications of those conditions. It has recently been tested in the United States in a single‐center study,[47] and a multihospital study is underway.
Aside from these algorithms using related diagnosis codes, most ratings of preventability have relied on subjective assessments made primarily through a review of hospital records, and approximately one‐third also included data from clinic visits or interviews with the treating medical team or patients/families.[8] Unfortunately, these reports provide insufficient detail on how to apply their preventability criteria to subsequent readmission reviews. Studies did, however, provide categories of preventability into which readmissions could be organized (see Supporting Information, Appendix Table 1, in the online version of this article for details from a subset of studies cited in van Walraven's reviews that illustrate this point).
Assessment of preventability by clinician review can be challenging. In general, such assessments have considered readmissions resulting from factors within the hospital's control to be avoidable (eg, providing appropriate discharge instructions, reconciling medications, arranging timely postdischarge follow‐up appointments), whereas readmissions resulting from factors not within the hospital's control are unavoidable (eg, patient socioeconomic status, social support, disease progression). However, readmissions resulting from patient behaviors or social reasons could potentially be classified as avoidable or unavoidable depending on the circumstances. For example, if a patient decides not to take a prescribed antibiotic and is readmitted with worsening infection, this could be classified as an unavoidable readmission from the hospital's perspective. Alternatively, if the physician prescribing the antibiotic was inattentive to the cost of the medication and the patient would have taken a less expensive medication had it been prescribed, this could be classified as an avoidable readmission. Differing interpretations of contextual factors may partially account for the variability in clinical assessments of preventability.
Indeed, despite the lack of consensus around a standard method of defining preventability, hospitals and health systems are moving forward to address the issue and reduce readmissions. A recent survey by America's Essential Hospitals (previously the National Association of Public Hospitals and Health Systems), indicated that: (1) reducing readmissions was a high priority for the majority (86%) of members, (2) most had established interdisciplinary teams to address the issue, and (3) over half had a formal process for determining which readmissions were potentially preventable. Of the survey respondents, just over one‐third rely on staff review of individual patient charts or patient and family interviews, and slightly less than one‐third rely on other mechanisms such as external consultants, criteria developed by other entities, or the Institute for Clinical Systems Improvement methodology.[48] Approximately one‐fifth make use of 3M's PPR product, and slightly fewer use the list of the Agency for Healthcare Research and Quality's ambulatory care sensitive conditions (ACSCs). These are medical conditions for which it is believed that good outpatient care could prevent the need for hospitalization (eg, asthma, congestive heart failure, diabetes) or for which early intervention minimizes complications.[49] Hospitalization rates for ACSCs may represent a good measure of excess hospitalization, with a focus on the quality of outpatient care.
RECOMMENDATIONS
We recommend that reporting of hospital readmission rates be based on preventable or potentially preventable readmissions. Although we acknowledge the challenges in doing so, the advantages are notable. At minimum, a preventable readmission rate would more accurately reflect the true gap in care and therefore hospitals' real opportunity for improvement, without being obscured by readmissions that are not preventable.
Because readmission rates are used for public reporting and financial penalties for hospitals, we favor a measure of preventability that reflects the readmissions that the hospital or hospital system has the ability to prevent. This would not penalize hospitals for factors that are under the control of others, namely patients and caregivers, community supports, or society at large. We further recommend that this measure apply to a broader composite of unplanned care, inclusive of both inpatient and observation stays, which have little distinction in patients' eyes, and both represent potentially unnecessary utilization of acute‐care resources.[50] Such a measure would require development, validation, and appropriate vetting before it is implemented.
The first step is for researchers and policy makers to agree on how a measure of preventable or potentially preventable readmissions could be defined. A common element of preventability assessment is to identify the degree to which the reasons for readmission are related to the diagnoses of the index hospitalization. To be reliable and scalable, this measure will need to be based on algorithms that relate the index and readmission diagnoses, most likely using claims data. Choosing common medical and surgical conditions and developing a consensus‐based list of related readmission diagnoses is an important first step. It would also be important to include some less common conditions, because they may reflect very different aspects of hospital care.
An approach based on a list of related diagnoses would represent potentially preventable rehospitalizations. Generally, clinical review is required to determine actual preventability, taking into account patient factors such as a high level of illness or functional impairment that leads to clinical decompensation in spite of excellent management.[51, 52] Clinical review, like a root cause analysis, also provides greater insight into hospital processes that may warrant improvement. Therefore, even if an administrative measure of potentially preventable readmissions is implemented, hospitals may wish to continue performing detailed clinical review of some readmissions for quality improvement purposes. When clinical review becomes more standardized,[53] a combined approach that uses administrative data plus clinical verification and arbitration may be feasible, as with hospital‐acquired infections.
Similar work to develop related sets of admission and readmission diagnoses has already been undertaken in development of the 3M PPR and SQLape measures.[41, 46] However, the 3M PPR is a proprietary system that has low specificity and a high false‐positive rate for identifying preventable readmissions when compared to clinical review.[42] Moreover, neither measure has yet achieved the consensus required for widespread adoption in the United States. What is needed is a nonproprietary listing of related admission and readmission diagnoses, developed with the engagement of relevant stakeholders, that goes through a period of public comment and vetting by a body such as the NQF.
Until a validated measure of potentially preventable readmission can be developed, how could the current approach evolve toward preventability? The most feasible, rapidly implementable change would be to alter the readmission time horizon from 30 days to 7 or 15 days. A 30‐day period holds hospitals accountable for complications of outpatient care or new problems that may develop weeks after discharge. Even though this may foster shared accountability and collaboration among hospitals and outpatient or community settings, research has demonstrated that early readmissions (eg, within 715 days of discharge) are more likely preventable.[54] Second, consideration of the socioeconomic status of hospital patients, as recommended by MedPAC,[34] would improve on the current model by comparing hospitals to like facilities when determining penalties for excess readmission rates. Finally, adjustment for community factors, such as practice patterns and access to care, would enable readmission metrics to better reflect factors under the hospital's control.[32]
CONCLUSION
Holding hospitals accountable for the quality of acute and transitional care is an important policy initiative that has accelerated many improvements in discharge planning and care coordination. Optimally, the policies, public reporting, and penalties should target preventable readmissions, which may represent as little as one‐quarter of all readmissions. By summarizing some of the issues in defining preventability, we hope to foster continued refinement of quality metrics used in this arena.
Acknowledgements
We thank Eduard Vasilevskis, MD, MPH, for feedback on an earlier draft of this article. This manuscript was informed by a special report titled Preventable Readmissions, written by Julia Lavenberg, Joel Betesh, David Goldmann, Craig Kean, and Kendal Williams of the Penn Medicine Center for Evidence‐based Practice. The review was performed at the request of the Penn Medicine Chief Medical Officer Patrick J. Brennan to inform the development of local readmission prevention metrics, and is available at
Disclosures
Dr. Umscheid's contribution to this project was supported in part by the National Center for Research Resources and the National Center for Advancing Translational Sciences, National Institutes of Health, through grant UL1TR000003. Dr. Kripalani receives support from the National Heart, Lung, and Blood Institute of the National Institutes of Health under award number R01HL109388, and from the Centers for Medicare and Medicaid Services under awards 1C1CMS331006‐01 and 1C1CMS330979‐01. The content is solely the responsibility of the authors and does not necessarily represent the official views of the National Institutes of Health or Centers for Medicare and Medicaid Services.
- , . Physician Visits After Hospital Discharge: Implications for Reducing Readmissions. Washington, DC: National Institute for Health Care Reform; 2011. Report no. 6.
- , , . Rehospitalizations among patients in the Medicare fee‐for‐service program. N Engl J Med. 2009;360(14):1418–1428.
- Centers for Medicare and Medicaid Services, US Department of Health and Human Services. Medicare program: hospital inpatient prospective payment systems for acute care hospitals and the long‐term care hospital prospective payment system and FY 2012 rates. Fed Regist. 2011;76(160):51476–51846.
- , , , , , . Quality collaboratives and campaigns to reduce readmissions: what strategies are hospitals using? J Hosp Med. 2013;8:601–608.
- , , , , . Contemporary data about hospital strategies to reduce unplanned readmissions: what has changed [research letter]? JAMA Intern Med. 2014;174(1):154–156.
- , , , , . Interventions to reduce 30‐day rehospitalization: a systematic review. Ann Intern Med. 2011;155(8):520–528.
- , , , . Comparing methods to calculate hospital‐specific rates of early death or urgent readmission. CMAJ. 2012;184(15):E810–E817.
- , , , , . Proportion of hospital readmissions deemed avoidable: a systematic review. CMAJ. 2011;183(7):E391–E402.
- , , , et al. Risk prediction models for hospital readmission: a systematic review. JAMA. 2011;306(15):1688–1698.
- National Quality Forum. Patient outcomes: all‐cause readmissions expedited review 2011. Available at: http://www.qualityforum.org/WorkArea/linkit.aspx?LinkIdentifier=id60(7):607–614.
- , , , , , . Data shows reduction in Medicare hospital readmission rates during 2012. Medicare Medicaid Res Rev. 2013;3(2):E1–E11.
- , . Thirty‐day readmissions—truth and consequences. N Engl J Med. 2012;366(15):1366–1369.
- , , , . Moving beyond readmission penalties: creating an ideal process to improve transitional care. J Hosp Med. 2013;8(2):102–109.
- , . A path forward on Medicare readmissions. N Engl J Med. 2013;368(13):1175–1177.
- American Hospital Association. TrendWatch: examining the drivers of readmissions and reducing unnecessary readmissions for better patient care. Washington, DC: American Hospital Association; 2011.
- , , , et al. Diagnoses and timing of 30‐day readmissions after hospitalization for heart failure, acute myocardial infarction, or pneumonia. JAMA. 2013;309(4):355–363.
- , . Characteristics of hospitals receiving penalties under the hospital readmissions reduction program. JAMA. 2013;309(4):342–343.
- , , , , , , et al. Identifying potentially preventable readmissions. Health Care Financ Rev. 2008;30(1):75–91.
- , , , et al. Use of hospital‐based acute care among patients recently discharged from the hospital. JAMA. 2013;309(4):364–371.
- , , , . Reducing hospital readmission rates: current strategies and future directions. Annu Rev Med. 2014;65:471–485.
- , , , et al. Relationship between hospital readmission and mortality rates for patients hospitalized with acute myocardial infarction, heart failure, or pneumonia. JAMA. 2013;309(6):587–593.
- , , , et al. Hospital performance measures and 30‐day readmission rates. J Gen Intern Med. 2013;28(3):377–385.
- , , , . Limitations of using same‐hospital readmission metrics. Int J Qual Health Care. 2013;25(6):633–639.
- , , , et al. Is same‐hospital readmission rate a good surrogate for all‐hospital readmission rate? Med Care. 2010;48(5):477–481.
- , , . The relationship between hospital admission rates and rehospitalizations. N Engl J Med. 2011;365(24):2287–2295.
- . Community factors and hospital readmission rates [published online April 9, 2014]. Health Serv Res. doi: 10.1111/1475–6773.12177.
- American Hospital Association. Hospital readmissions reduction program: factsheet. American Hospital Association. Available at: http://www.aha.org/content/13/fs‐readmissions.pdf. Published April 14, 2014. Accessed May 5, 2014.
- Medicare Payment Advisory Commission. Report to the congress: Medicare and the health care delivery system. Available at: http://www.medpac.gov/documents/Jun13_EntireReport.pdf. Published June 14, 2013. Accessed May 5, 2014.
- , , . Sharp rise in Medicare enrollees being held in hospitals for observation raises concerns about causes and consequences. Health Aff (Millwood). 2012;31(6):1251–1259.
- , , . Quality improvement of care transitions and the trend of composite hospital care. JAMA. 2014;311(10):1013–1014.
- , . When projecting required effectiveness of interventions for hospital readmission reduction, the percentage that is potentially avoidable must be considered. J Clin Epidemiol. 2013;66(6):688–690.
- , , . Urgent readmission rates can be used to infer differences in avoidable readmission rates between hospitals. J Clin Epidemiol. 2012;65(10):1124–1130.
- , , , , . Proportion of hospital readmissions deemed avoidable: a systematic review. CMAJ. 2011;183(7):E391–E402.
- , , , , , . Measuring and preventing potentially avoidable hospital readmissions: a review of the literature. Hong Kong Med J. 2010;16(5):383–389.
- 3M Health Information Systems. Potentially preventable readmissions classification system methodology: overview. 3M Health Information Systems; May 2008. Report No.: GRP‐139. Available at: http://multimedia.3m.com/mws/mediawebserver?66666UuZjcFSLXTtNXMtmxMEEVuQEcuZgVs6EVs6E666666‐‐. Accessed June 8, 2014.
- , , , , , . Manual and automated methods for identifying potentially preventable readmissions: a comparison in a large healthcare system. BMC Med Inform Decis Mak. 2014;14:28.
- , , , , , , et al. Comparing 2 methods of assessing 30‐day readmissions: what is the impact on hospital profiling in the Veterans Health Administration? Med Care. 2013;51(7):589–596.
- , . It's not six of one, half‐dozen the other: a comparative analysis of 3 rehospitalization measurement systems for Massachusetts. Academy Health Annual Research Meeting. Seattle, WA. 2011. Available at: http://www.academyhealth.org/files/2011/tuesday/boutwell.pdf. Accessed May 9, 2014.
- , , , , , . Validation of the potentially avoidable hospital readmission rate as a routine indicator of the quality of hospital care. Med Care. 2006;44(11):972–981.
- , , , , , . Measuring potentially avoidable hospital readmissions. J Clin Epidemiol. 2002;55:573–587.
- , , , . Potentially avoidable 30‐day hospital readmissions in medical patients: derivation and validation of a prediction model. JAMA Intern Med. 2013;173(8):632–638.
- National Association of Public Hospitals and Health Systems. NAPH members focus on reducing readmissions. Available at: www.naph.org. Published June 2011. Accessed October 19, 2011.
- Agency for Healthcare Research and Quality. AHRQ quality indicators: prevention quality indicators. Available at: http://www.qualityindicators.ahrq.gov/Modules/pqi_resources.aspx. Accessed February 11, 2014.
- , , , , , . Shifting the dialogue from hospital readmissions to unplanned care. Am J Manag Care. 2013;19(6):450–453.
- . Post‐hospital syndrome—an acquired, transient condition of generalized risk. N Engl J Med. 2013;368(2):100–102.
- , . The hospital‐dependent patient. N Engl J Med. 2014;370(8):694–697.
- , , , et al. The hospital medicine reengineering network (HOMERuN): a learning organization focused on improving hospital care. Acad Med. 2014;89(3):415–420.
- , , , et al. Incidence of potentially avoidable urgent readmissions and their relation to all‐cause urgent readmissions. CMAJ. 2011;183(14):E1067–E1072.
Hospital readmissions cost Medicare $15 to $17 billion per year.[1, 2] In 2010, the Hospital Readmission Reduction Program (HRRP), created by the Patient Protection and Affordable Care Act, authorized the Centers for Medicare and Medicaid Services (CMS) to penalize hospitals with higher‐than‐expected readmission rates for certain index conditions.[3] Other payers may follow suit, so hospitals and health systems nationwide are devoting significant resources to reducing readmissions.[4, 5, 6]
Implicit in these efforts are the assumptions that a significant proportion of readmissions are preventable, and that preventable readmissions can be identified. Unfortunately, estimates of preventability vary widely.[7, 8] In this article, we examine how preventable readmissions have been defined, measured, and calculated, and explore the associated implications for readmission reduction efforts.
THE MEDICARE READMISSION METRIC
The medical literature reveals substantial heterogeneity in how readmissions are assessed. Time periods range from 14 days to 4 years, and readmissions may be counted differently depending on whether they are to the same hospital or to any hospital, whether they are for the same (or a related) condition or for any condition, whether a patient is allowed to count only once during the follow‐up period, how mortality is treated, and whether observation stays are considered.[9]
Despite a lack of consensus in the literature, the approach adopted by CMS is endorsed by the National Quality Forum (NQF)[10] and has become the de facto standard for calculating readmission rates. CMS derives risk‐standardized readmission rates for acute myocardial infarction (AMI), heart failure (HF), and pneumonia (PN), using administrative claims data for each Medicare fee‐for‐service beneficiary 65 years or older.[11, 12, 13, 14] CMS counts the first readmission (but not subsequent ones) for any cause within 30 days of the index discharge, including readmissions to other facilities. Certain planned readmissions for revascularization are excluded, as are patients who left against medical advice, transferred to another acute‐care hospital, or died during the index admission. Admissions to psychiatric, rehabilitation, cancer specialty, and children's hospitals[12] are also excluded, as well as patients classified as observation status for either hospital stay.[15] Only administrative data are used in readmission calculations (ie, there are no chart reviews or interviews with healthcare personnel or patients). Details are published online and updated at least annually.[15]
EFFECTS AND LIMITATIONS OF THE HRRP AND THE CMS READMISSION METRIC
Penalizing hospitals for higher‐than‐expected readmission rates based on the CMS metric has been successful in the sense that hospitals now feel more accountable for patient outcomes after discharge; they are implementing transitional care programs, improving communication, and building relationships with community programs.[4, 5, 16] Early data suggest a small decline in readmission rates of Medicare beneficiaries nationally.[17] Previously, such readmission rates were constant.[18]
Nevertheless, significant concerns with the current approach have surfaced.[19, 20, 21] First, why choose 30 days? This time horizon was believed to be long enough to identify readmissions attributable to an index admission and short enough to reflect hospital‐delivered care and transitions to the outpatient setting, and it allows for collaboration between hospitals and their communities to reduce readmissions.[3] However, some have argued that this time horizon has little scientific basis,[22] and that hospitals are unfairly held accountable for a timeframe when outcomes may largely be influenced by the quality of outpatient care or the development of new problems.[23, 24] Approximately one‐third of 30‐day readmissions occur within the first 7 days, and more than half (55.7%) occur within the first 14 days[22, 25]; such time frames may be more appropriate for hospital accountability.[26]
Second, spurred by the focus of CMS penalties, efforts to reduce readmissions have largely concerned patients admitted for HF, AMI, or PN, although these 3 medical conditions account for only 10% of Medicare hospitalizations.[18] Programs focused on a narrow patient population may not benefit other patients with high readmission rates, such as those with gastrointestinal or psychiatric problems,[2] or lead to improvements in the underlying processes of care that could benefit patients in additional ways. Indeed, research suggests that low readmission rates may not be related to other measures of hospital quality.[27, 28]
Third, public reporting and hospital penalties are based on 3‐year historical performance, in part to accumulate a large enough sample size for each diagnosis. Hospitals that seek real‐time performance monitoring are limited to tracking surrogate outcomes, such as readmissions back to their own facility.[29, 30] Moreover, because of the long performance time frame, hospitals that achieve rapid improvement may endure penalties precisely when they are attempting to sustain their achievements.
Fourth, the CMS approach utilizes a complex risk‐standardization methodology, which has only modest ability to predict readmissions and allow hospital comparisons.[9] There is no adjustment for community characteristics, even though practice patterns are significantly associated with readmission rates,[9, 31] and more than half of the variation in readmission rates across hospitals can be explained by characteristics of the community such as access to care.[32] Moreover, patient factors, such as race and socioeconomic status, are currently not included in an attempt to hold hospitals to similar standards regardless of their patient population. This is hotly contested, however, and critics note this policy penalizes hospitals for factors outside of their control, such as patients' ability to afford medications.[33] Indeed, the June 2013 Medicare Payment Advisory Committee (MedPAC) report to Congress recommended evaluating hospital performance against facilities with a like percentage of low‐income patients as a way to take into account socioeconomic status.[34]
Fifth, observation stays are excluded, so patients who remain in observation status during their index or subsequent hospitalization cannot be counted as a readmission. Prevalence of observation care has increased, raising concerns that inpatient admissions are being shifted to observation status, producing an artificial decline in readmissions.[35] Fortunately, recent population‐level data provide some reassuring evidence to the contrary.[36]
Finally, and perhaps most significantly, the current readmission metric does not consider preventability. Recent reviews have demonstrated that estimates of preventability vary widely in individual studies, ranging from 5% to 79%, depending on study methodology and setting.[7, 8] Across these studies, on average, only 23% of 30‐day readmissions appear to be avoidable.[8] Another way to consider the preventability of hospital readmissions is by noting that the most effective multimodal care‐transition interventions reduce readmission rates by only about 30%, and most interventions are much less effective.[26] The likely fact that only 23% to 30% of readmissions are preventable has profound implications for the anticipated results of hospital readmission reduction efforts. Interventions that are 75% effective in reducing preventable readmissions should be expected to produce only an 18% to 22% reduction in overall readmission rates.[37]
FOCUSING ON PREVENTABLE READMISSIONS
A greater focus on identifying and targeting preventable readmissions would offer a number of advantages over the present approach. First, it is more meaningful to compare hospitals based on their percentage of discharges resulting in a preventable readmission, than on the basis of highly complex risk standardization procedures for selected conditions. Second, a focus on preventable readmissions more clearly identifies and permits hospitals to target opportunities for improvement. Third, if the focus were on preventable readmissions for a large number of conditions, the necessary sample size could be obtained over a shorter period of time. Overall, such a preventable readmissions metric could serve as a more agile and undiluted performance indicator, as opposed to the present 3‐year rolling average rate of all‐cause readmissions for certain conditions, the majority of which are probably not preventable.
DEFINING PREVENTABILITY
Defining a preventable readmission is critically important. However, neither a consensus definition nor a validated standard for assessing preventable hospital readmissions exists. Different conceptual frameworks and terms (eg, avoidable, potentially preventable, or urgent readmission) complicate the issue.[38, 39, 40]
Although the CMS measure does not address preventability, it is helpful to consider whether other readmission metrics incorporate this concept. The United Health Group's (UHG, formerly Pacificare) All‐Cause Readmission Index, University HealthSystem Consortium's 30‐Day Readmission Rate (all cause), and 3M Health Information Systems' (3M) Potentially Preventable Readmissions (PPR) are 3 commonly used measures.
Of these, only the 3M PPR metric includes the concept of preventability. 3M created a proprietary matrix of 98,000 readmission‐index admission All Patient Refined Diagnosis Related Group pairs based on the review of several physicians and the logical assumption that a readmission for a clinically related diagnosis is potentially preventable.[24, 41] Readmission and index admissions are considered clinically related if any of the following occur: (1) medical readmission for continuation or recurrence of an initial, or closely related, condition; (2) medical readmission for acute decompensation of a chronic condition that was not the reason for the index admission but was plausibly related to care during or immediately afterward (eg, readmission for diabetes in a patient whose index admission was AMI); (3) medical readmission for acute complication plausibly related to care during index admission; (4) readmission for surgical procedure for continuation or recurrence of initial problem (eg, readmission for appendectomy following admission for abdominal pain and fever); or (5) readmission for surgical procedure to address complication resulting from care during index admission.[24, 41] The readmission time frame is not standardized and may be set by the user. Though conceptually appealing in some ways, CMS and the NQF have expressed concern about this specific approach because of the uncertain reliability of the relatedness of the admission‐readmission diagnosis dyads.[3]
In the research literature, only a few studies have examined the 3M PPR or other preventability assessments that rely on the relatedness of diagnostic codes.[8] Using the 3M PPR, a study showed that 78% of readmissions were classified as potentially preventable,[42] which explains why the 3M PPR and all‐cause readmission metric may correlate highly.[43] Others have demonstrated that ratings of hospital performance on readmission rates vary by a moderate to large amount, depending on whether the 3M PPR, CMS, or UHG methodology is used.[43, 44] An algorithm called SQLape[45, 46] is used in Switzerland to benchmark hospitals and defines potentially avoidable readmissions as being related to index diagnoses or complications of those conditions. It has recently been tested in the United States in a single‐center study,[47] and a multihospital study is underway.
Aside from these algorithms using related diagnosis codes, most ratings of preventability have relied on subjective assessments made primarily through a review of hospital records, and approximately one‐third also included data from clinic visits or interviews with the treating medical team or patients/families.[8] Unfortunately, these reports provide insufficient detail on how to apply their preventability criteria to subsequent readmission reviews. Studies did, however, provide categories of preventability into which readmissions could be organized (see Supporting Information, Appendix Table 1, in the online version of this article for details from a subset of studies cited in van Walraven's reviews that illustrate this point).
Assessment of preventability by clinician review can be challenging. In general, such assessments have considered readmissions resulting from factors within the hospital's control to be avoidable (eg, providing appropriate discharge instructions, reconciling medications, arranging timely postdischarge follow‐up appointments), whereas readmissions resulting from factors not within the hospital's control are unavoidable (eg, patient socioeconomic status, social support, disease progression). However, readmissions resulting from patient behaviors or social reasons could potentially be classified as avoidable or unavoidable depending on the circumstances. For example, if a patient decides not to take a prescribed antibiotic and is readmitted with worsening infection, this could be classified as an unavoidable readmission from the hospital's perspective. Alternatively, if the physician prescribing the antibiotic was inattentive to the cost of the medication and the patient would have taken a less expensive medication had it been prescribed, this could be classified as an avoidable readmission. Differing interpretations of contextual factors may partially account for the variability in clinical assessments of preventability.
Indeed, despite the lack of consensus around a standard method of defining preventability, hospitals and health systems are moving forward to address the issue and reduce readmissions. A recent survey by America's Essential Hospitals (previously the National Association of Public Hospitals and Health Systems), indicated that: (1) reducing readmissions was a high priority for the majority (86%) of members, (2) most had established interdisciplinary teams to address the issue, and (3) over half had a formal process for determining which readmissions were potentially preventable. Of the survey respondents, just over one‐third rely on staff review of individual patient charts or patient and family interviews, and slightly less than one‐third rely on other mechanisms such as external consultants, criteria developed by other entities, or the Institute for Clinical Systems Improvement methodology.[48] Approximately one‐fifth make use of 3M's PPR product, and slightly fewer use the list of the Agency for Healthcare Research and Quality's ambulatory care sensitive conditions (ACSCs). These are medical conditions for which it is believed that good outpatient care could prevent the need for hospitalization (eg, asthma, congestive heart failure, diabetes) or for which early intervention minimizes complications.[49] Hospitalization rates for ACSCs may represent a good measure of excess hospitalization, with a focus on the quality of outpatient care.
RECOMMENDATIONS
We recommend that reporting of hospital readmission rates be based on preventable or potentially preventable readmissions. Although we acknowledge the challenges in doing so, the advantages are notable. At minimum, a preventable readmission rate would more accurately reflect the true gap in care and therefore hospitals' real opportunity for improvement, without being obscured by readmissions that are not preventable.
Because readmission rates are used for public reporting and financial penalties for hospitals, we favor a measure of preventability that reflects the readmissions that the hospital or hospital system has the ability to prevent. This would not penalize hospitals for factors that are under the control of others, namely patients and caregivers, community supports, or society at large. We further recommend that this measure apply to a broader composite of unplanned care, inclusive of both inpatient and observation stays, which have little distinction in patients' eyes, and both represent potentially unnecessary utilization of acute‐care resources.[50] Such a measure would require development, validation, and appropriate vetting before it is implemented.
The first step is for researchers and policy makers to agree on how a measure of preventable or potentially preventable readmissions could be defined. A common element of preventability assessment is to identify the degree to which the reasons for readmission are related to the diagnoses of the index hospitalization. To be reliable and scalable, this measure will need to be based on algorithms that relate the index and readmission diagnoses, most likely using claims data. Choosing common medical and surgical conditions and developing a consensus‐based list of related readmission diagnoses is an important first step. It would also be important to include some less common conditions, because they may reflect very different aspects of hospital care.
An approach based on a list of related diagnoses would represent potentially preventable rehospitalizations. Generally, clinical review is required to determine actual preventability, taking into account patient factors such as a high level of illness or functional impairment that leads to clinical decompensation in spite of excellent management.[51, 52] Clinical review, like a root cause analysis, also provides greater insight into hospital processes that may warrant improvement. Therefore, even if an administrative measure of potentially preventable readmissions is implemented, hospitals may wish to continue performing detailed clinical review of some readmissions for quality improvement purposes. When clinical review becomes more standardized,[53] a combined approach that uses administrative data plus clinical verification and arbitration may be feasible, as with hospital‐acquired infections.
Similar work to develop related sets of admission and readmission diagnoses has already been undertaken in development of the 3M PPR and SQLape measures.[41, 46] However, the 3M PPR is a proprietary system that has low specificity and a high false‐positive rate for identifying preventable readmissions when compared to clinical review.[42] Moreover, neither measure has yet achieved the consensus required for widespread adoption in the United States. What is needed is a nonproprietary listing of related admission and readmission diagnoses, developed with the engagement of relevant stakeholders, that goes through a period of public comment and vetting by a body such as the NQF.
Until a validated measure of potentially preventable readmission can be developed, how could the current approach evolve toward preventability? The most feasible, rapidly implementable change would be to alter the readmission time horizon from 30 days to 7 or 15 days. A 30‐day period holds hospitals accountable for complications of outpatient care or new problems that may develop weeks after discharge. Even though this may foster shared accountability and collaboration among hospitals and outpatient or community settings, research has demonstrated that early readmissions (eg, within 715 days of discharge) are more likely preventable.[54] Second, consideration of the socioeconomic status of hospital patients, as recommended by MedPAC,[34] would improve on the current model by comparing hospitals to like facilities when determining penalties for excess readmission rates. Finally, adjustment for community factors, such as practice patterns and access to care, would enable readmission metrics to better reflect factors under the hospital's control.[32]
CONCLUSION
Holding hospitals accountable for the quality of acute and transitional care is an important policy initiative that has accelerated many improvements in discharge planning and care coordination. Optimally, the policies, public reporting, and penalties should target preventable readmissions, which may represent as little as one‐quarter of all readmissions. By summarizing some of the issues in defining preventability, we hope to foster continued refinement of quality metrics used in this arena.
Acknowledgements
We thank Eduard Vasilevskis, MD, MPH, for feedback on an earlier draft of this article. This manuscript was informed by a special report titled Preventable Readmissions, written by Julia Lavenberg, Joel Betesh, David Goldmann, Craig Kean, and Kendal Williams of the Penn Medicine Center for Evidence‐based Practice. The review was performed at the request of the Penn Medicine Chief Medical Officer Patrick J. Brennan to inform the development of local readmission prevention metrics, and is available at
Disclosures
Dr. Umscheid's contribution to this project was supported in part by the National Center for Research Resources and the National Center for Advancing Translational Sciences, National Institutes of Health, through grant UL1TR000003. Dr. Kripalani receives support from the National Heart, Lung, and Blood Institute of the National Institutes of Health under award number R01HL109388, and from the Centers for Medicare and Medicaid Services under awards 1C1CMS331006‐01 and 1C1CMS330979‐01. The content is solely the responsibility of the authors and does not necessarily represent the official views of the National Institutes of Health or Centers for Medicare and Medicaid Services.
- , . Physician Visits After Hospital Discharge: Implications for Reducing Readmissions. Washington, DC: National Institute for Health Care Reform; 2011. Report no. 6.
- , , . Rehospitalizations among patients in the Medicare fee‐for‐service program. N Engl J Med. 2009;360(14):1418–1428.
- Centers for Medicare and Medicaid Services, US Department of Health and Human Services. Medicare program: hospital inpatient prospective payment systems for acute care hospitals and the long‐term care hospital prospective payment system and FY 2012 rates. Fed Regist. 2011;76(160):51476–51846.
- , , , , , . Quality collaboratives and campaigns to reduce readmissions: what strategies are hospitals using? J Hosp Med. 2013;8:601–608.
- , , , , . Contemporary data about hospital strategies to reduce unplanned readmissions: what has changed [research letter]? JAMA Intern Med. 2014;174(1):154–156.
- , , , , . Interventions to reduce 30‐day rehospitalization: a systematic review. Ann Intern Med. 2011;155(8):520–528.
- , , , . Comparing methods to calculate hospital‐specific rates of early death or urgent readmission. CMAJ. 2012;184(15):E810–E817.
- , , , , . Proportion of hospital readmissions deemed avoidable: a systematic review. CMAJ. 2011;183(7):E391–E402.
- , , , et al. Risk prediction models for hospital readmission: a systematic review. JAMA. 2011;306(15):1688–1698.
- National Quality Forum. Patient outcomes: all‐cause readmissions expedited review 2011. Available at: http://www.qualityforum.org/WorkArea/linkit.aspx?LinkIdentifier=id60(7):607–614.
- , , , , , . Data shows reduction in Medicare hospital readmission rates during 2012. Medicare Medicaid Res Rev. 2013;3(2):E1–E11.
- , . Thirty‐day readmissions—truth and consequences. N Engl J Med. 2012;366(15):1366–1369.
- , , , . Moving beyond readmission penalties: creating an ideal process to improve transitional care. J Hosp Med. 2013;8(2):102–109.
- , . A path forward on Medicare readmissions. N Engl J Med. 2013;368(13):1175–1177.
- American Hospital Association. TrendWatch: examining the drivers of readmissions and reducing unnecessary readmissions for better patient care. Washington, DC: American Hospital Association; 2011.
- , , , et al. Diagnoses and timing of 30‐day readmissions after hospitalization for heart failure, acute myocardial infarction, or pneumonia. JAMA. 2013;309(4):355–363.
- , . Characteristics of hospitals receiving penalties under the hospital readmissions reduction program. JAMA. 2013;309(4):342–343.
- , , , , , , et al. Identifying potentially preventable readmissions. Health Care Financ Rev. 2008;30(1):75–91.
- , , , et al. Use of hospital‐based acute care among patients recently discharged from the hospital. JAMA. 2013;309(4):364–371.
- , , , . Reducing hospital readmission rates: current strategies and future directions. Annu Rev Med. 2014;65:471–485.
- , , , et al. Relationship between hospital readmission and mortality rates for patients hospitalized with acute myocardial infarction, heart failure, or pneumonia. JAMA. 2013;309(6):587–593.
- , , , et al. Hospital performance measures and 30‐day readmission rates. J Gen Intern Med. 2013;28(3):377–385.
- , , , . Limitations of using same‐hospital readmission metrics. Int J Qual Health Care. 2013;25(6):633–639.
- , , , et al. Is same‐hospital readmission rate a good surrogate for all‐hospital readmission rate? Med Care. 2010;48(5):477–481.
- , , . The relationship between hospital admission rates and rehospitalizations. N Engl J Med. 2011;365(24):2287–2295.
- . Community factors and hospital readmission rates [published online April 9, 2014]. Health Serv Res. doi: 10.1111/1475–6773.12177.
- American Hospital Association. Hospital readmissions reduction program: factsheet. American Hospital Association. Available at: http://www.aha.org/content/13/fs‐readmissions.pdf. Published April 14, 2014. Accessed May 5, 2014.
- Medicare Payment Advisory Commission. Report to the congress: Medicare and the health care delivery system. Available at: http://www.medpac.gov/documents/Jun13_EntireReport.pdf. Published June 14, 2013. Accessed May 5, 2014.
- , , . Sharp rise in Medicare enrollees being held in hospitals for observation raises concerns about causes and consequences. Health Aff (Millwood). 2012;31(6):1251–1259.
- , , . Quality improvement of care transitions and the trend of composite hospital care. JAMA. 2014;311(10):1013–1014.
- , . When projecting required effectiveness of interventions for hospital readmission reduction, the percentage that is potentially avoidable must be considered. J Clin Epidemiol. 2013;66(6):688–690.
- , , . Urgent readmission rates can be used to infer differences in avoidable readmission rates between hospitals. J Clin Epidemiol. 2012;65(10):1124–1130.
- , , , , . Proportion of hospital readmissions deemed avoidable: a systematic review. CMAJ. 2011;183(7):E391–E402.
- , , , , , . Measuring and preventing potentially avoidable hospital readmissions: a review of the literature. Hong Kong Med J. 2010;16(5):383–389.
- 3M Health Information Systems. Potentially preventable readmissions classification system methodology: overview. 3M Health Information Systems; May 2008. Report No.: GRP‐139. Available at: http://multimedia.3m.com/mws/mediawebserver?66666UuZjcFSLXTtNXMtmxMEEVuQEcuZgVs6EVs6E666666‐‐. Accessed June 8, 2014.
- , , , , , . Manual and automated methods for identifying potentially preventable readmissions: a comparison in a large healthcare system. BMC Med Inform Decis Mak. 2014;14:28.
- , , , , , , et al. Comparing 2 methods of assessing 30‐day readmissions: what is the impact on hospital profiling in the Veterans Health Administration? Med Care. 2013;51(7):589–596.
- , . It's not six of one, half‐dozen the other: a comparative analysis of 3 rehospitalization measurement systems for Massachusetts. Academy Health Annual Research Meeting. Seattle, WA. 2011. Available at: http://www.academyhealth.org/files/2011/tuesday/boutwell.pdf. Accessed May 9, 2014.
- , , , , , . Validation of the potentially avoidable hospital readmission rate as a routine indicator of the quality of hospital care. Med Care. 2006;44(11):972–981.
- , , , , , . Measuring potentially avoidable hospital readmissions. J Clin Epidemiol. 2002;55:573–587.
- , , , . Potentially avoidable 30‐day hospital readmissions in medical patients: derivation and validation of a prediction model. JAMA Intern Med. 2013;173(8):632–638.
- National Association of Public Hospitals and Health Systems. NAPH members focus on reducing readmissions. Available at: www.naph.org. Published June 2011. Accessed October 19, 2011.
- Agency for Healthcare Research and Quality. AHRQ quality indicators: prevention quality indicators. Available at: http://www.qualityindicators.ahrq.gov/Modules/pqi_resources.aspx. Accessed February 11, 2014.
- , , , , , . Shifting the dialogue from hospital readmissions to unplanned care. Am J Manag Care. 2013;19(6):450–453.
- . Post‐hospital syndrome—an acquired, transient condition of generalized risk. N Engl J Med. 2013;368(2):100–102.
- , . The hospital‐dependent patient. N Engl J Med. 2014;370(8):694–697.
- , , , et al. The hospital medicine reengineering network (HOMERuN): a learning organization focused on improving hospital care. Acad Med. 2014;89(3):415–420.
- , , , et al. Incidence of potentially avoidable urgent readmissions and their relation to all‐cause urgent readmissions. CMAJ. 2011;183(14):E1067–E1072.