User login
Associations of Physician Empathy with Patient Anxiety and Ratings of Communication in Hospital Admission Encounters
Admission to a hospital can be a stressful event,1,2 and patients report having many concerns at the time of hospital admission.3 Over the last 20 years, the United States has widely adopted the hospitalist model of inpatient care. Although this model has clear benefits, it also has the potential to contribute to patient stress, as hospitalized patients generally lack preexisting relationships with their inpatient physicians.4,5 In this changing hospital environment, defining and promoting effective medical communication has become an essential goal of both individual practitioners and medical centers.
Successful communication and strong therapeutic relationships with physicians support patients’ coping with illness-associated stress6,7 as well as promote adherence to medical treatment plans.8 Empathy serves as an important building block of patient-centered communication and encourages a strong therapeutic alliance.9 Studies from primary care, oncology, and intensive care unit (ICU) settings indicate that physician empathy is associated with decreased emotional distress,10,11 improved ratings of communication,12 and even better medical outcomes.13
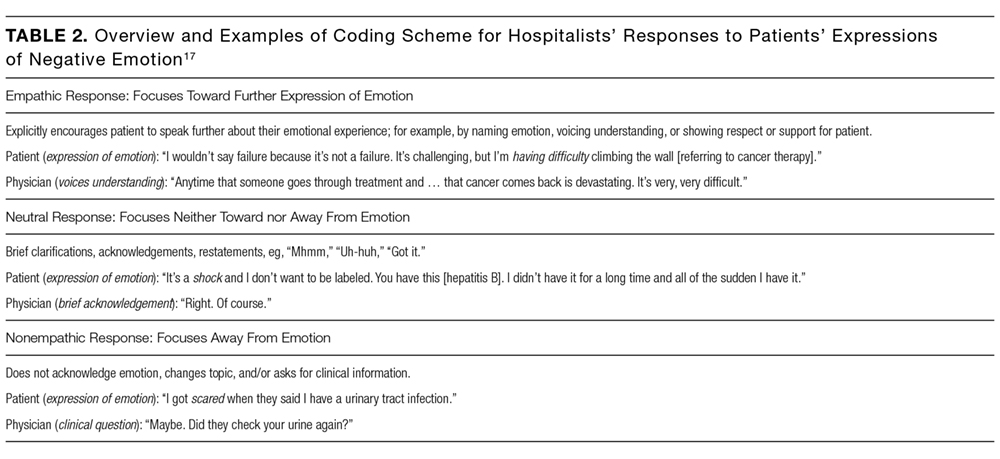
Prior work has shown that hospitalists, like other clinicians, underutilize empathy as a tool in their daily interactions with patients.14-16 Our prior qualitative analysis of audio-recorded hospitalist-patient admission encounters indicated that how hospitalists respond to patient expressions of negative emotion influences relationships with patients and alignment around care plans.17 To determine whether empathic communication is associated with patient-reported outcomes in the hospitalist model, we quantitatively analyzed coded admission encounters and survey data to examine the association between hospitalists’ responses to patient expressions of negative emotion (anxiety, sadness, and anger) and patient anxiety and ratings of communication. Given the often-limited time hospitalists have to complete admission encounters, we also examined the association between response to emotion and encounter length.
METHODS
We analyzed data collected as part of an observational study of hospitalist-patient communication during hospital admission encounters14 to assess the association between the way physicians responded to patient expressions of negative emotion and patient anxiety, ratings of communication in the encounter, and encounter length. We collected data between August 2008 and March 2009 on the general medical service at 2 urban hospitals that are part of an academic medical center. Participants were attending hospitalists (not physician trainees), and patients admitted under participating hospitalists’ care who were able to communicate verbally in English and provide informed consent for the study. The institutional review board at the University of California, San Francisco approved the study; physician and patient participants provided written informed consent.
Enrollment and data collection has been described previously.17 Our cohort for this analysis included 76 patients of 27 physicians who completed encounter audio recordings and pre- and postencounter surveys. Following enrollment, patients completed a preencounter survey to collect demographic information and to measure their baseline anxiety via the State Anxiety Scale (STAI-S), which assesses transient anxious mood using 20 items answered on a 4-point scale for a final score range of 20 to 80.10,18,19 We timed and audio-recorded admission encounters. Encounter recordings were obtained solely from patient interactions with attending hospitalists and did not take into account the time patients may have spent with other physicians, including trainees. After the encounter, patients completed postencounter surveys, which included the STAI-S and patients’ ratings of communication during the encounter. To rate communication, patients responded to 7 items on a 0- to 10-point scale that were derived from previous work (Table 1)12,20,21; the anchors were “not at all” and “completely.” To identify patients with serious illness, which we used as a covariate in regression models, we asked physicians on a postencounter survey whether or not they “would be surprised by this patient’s death or admission to the ICU in the next year.”22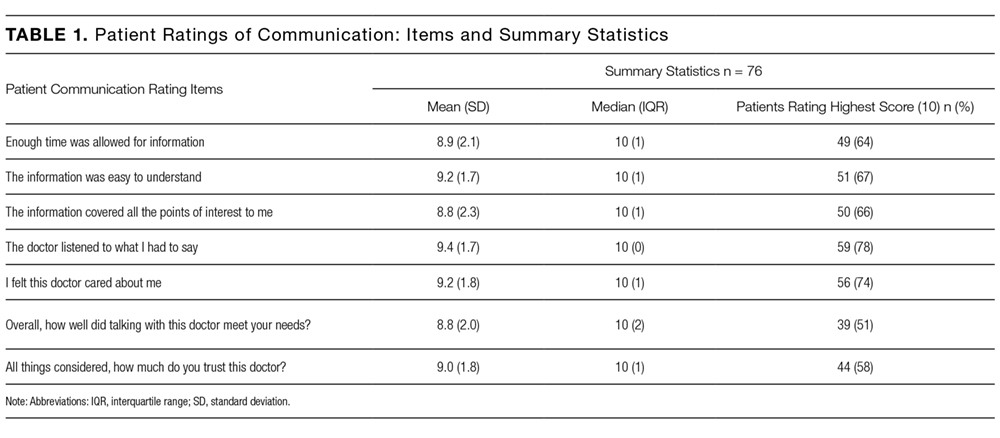
We considered physician as a clustering variable in the calculation of robust standard errors for all models. In addition, we included in each model covariates that were associated with the outcome at P ≤ 0.10, including patient gender, patient age, serious illness,22 preencounter anxiety, encounter length, and hospital. We considered P values < 0.05 to be statistically significant. We used Stata SE 13 (StataCorp LLC, College Station, TX) for all statistical analyses.
RESULTS

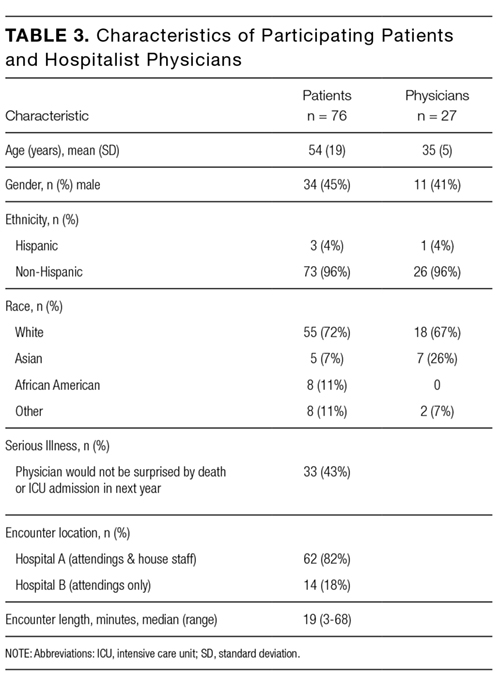
We analyzed data from admission encounters with 76 patients (consent rate 63%) and 27 hospitalists (consent rate 91%). Their characteristics are shown in Table 3. Median encounter length was 19 minutes (mean 21 minutes, range 3-68). Patients expressed negative emotion in 190 instances across all encounters; median number of expressions per encounter was 1 (range 0-14). Hospitalists responded empathically to 32% (n = 61) of the patient expressions, neutrally to 43% (n = 81), and nonempathically to 25% (n = 48).
The STAI-S was normally distributed. The mean preencounter STAI-S score was 39 (standard deviation [SD] 8.9). Mean postencounter STAI-S score was 38 (SD 10.7). Mean change in anxiety over the course of the encounter, calculated as the postencounter minus preencounter mean was −1.2 (SD 7.6). Table 1 shows summary statistics for the patient ratings of communication items. All items were rated highly. Across the items, between 51% and 78% of patients rated the highest score of 10.
Across the range of frequencies of emotional expressions per encounter in our data set (0-14 expressions), each additional empathic hospitalist response was associated with a 1.65-point decrease in the STAI-S (95% confidence interval [CI], 0.48-2.82). We did not find significant associations between changes in the STAI-S and the number of neutral hospitalist responses (−0.65 per response; 95% CI, −1.67-0.37) or nonempathic hospitalist responses (0.61 per response; 95% CI, −0.88-2.10).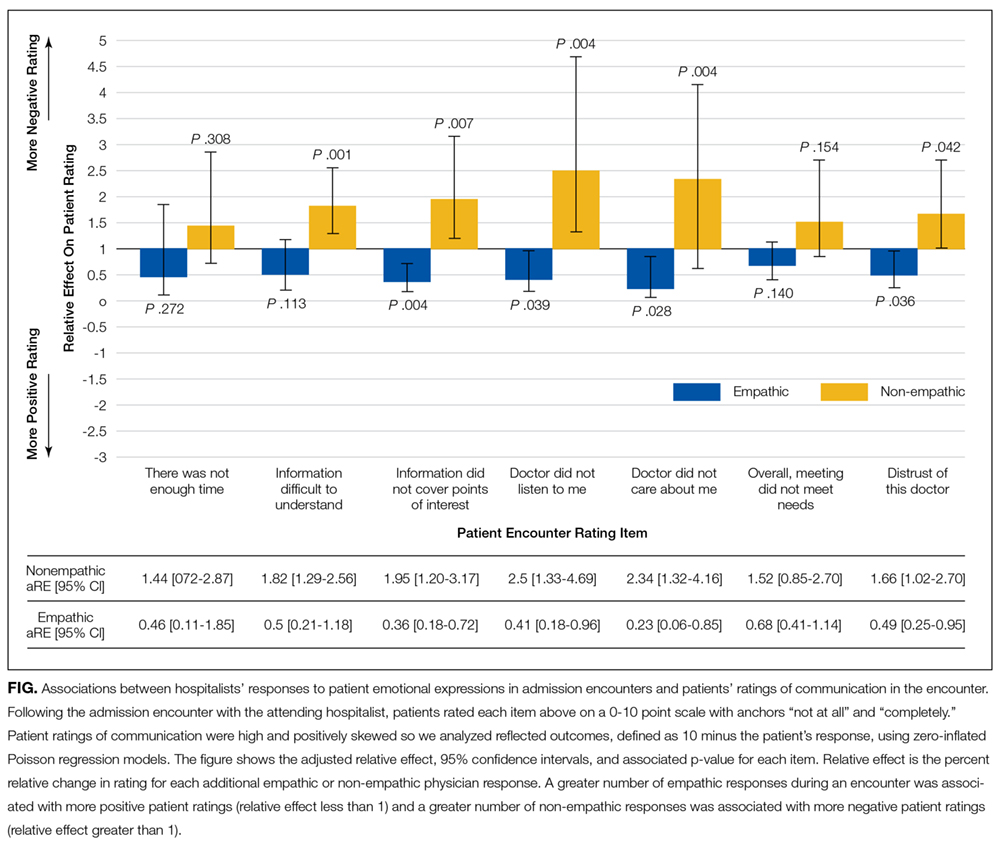
In addition, nonempathic responses were associated with more negative ratings of communication for 5 of the 7 items: ease of understanding information, covering points of interest, the doctor listening, the doctor caring, and trusting the doctor. For example, for the item “I felt this doctor cared about me,” each nonempathic hospitalist response was associated with a more than doubling of negative patient ratings (aRE: 2.3; 95% CI, 1.32-4.16). Neutral physician responses to patient expressions of negative emotion were associated with less negative patient ratings for 2 of the items: covering points of interest (aRE 0.68; 95% CI, 0.51-0.90) and trusting the doctor (aRE: 0.86; 95% CI, 0.75-0.99).
We did not find a statistical association between encounter length and the number of empathic hospitalist responses in the encounter (percent change in encounter length per response [PC]: 1%; 95% CI, −8%-10%) or the number of nonempathic responses (PC: 18%; 95% CI, −2%-42%). We did find a statistically significant association between the number of neutral responses and encounter length (PC: 13%; 95% CI, 3%-24%), corresponding to 2.5 minutes of additional encounter time per neutral response for the median encounter length of 19 minutes.
DISCUSSION
Our study set out to measure how hospitalists responded to expressions of negative emotion during admission encounters with patients and how those responses correlated with patient anxiety, ratings of communication, and encounter length. We found that empathic responses were associated with diminishing patient anxiety after the visit, as well as with better ratings of several domains of hospitalist communication. Moreover, nonempathic responses to negative emotion were associated with more strongly negative ratings of hospitalist communication. Finally, while clinicians may worry that encouraging patients to speak further about emotion will result in excessive visit lengths, we did not find a statistical association between empathic responses and encounter duration. To our knowledge, this is the first study to indicate an association between empathy and patient anxiety and communication ratings within the hospitalist model, which is rapidly becoming the predominant model for providing inpatient care in the United States.4,5
As in oncologic care, anxiety is an emotion commonly confronted by clinicians meeting admitted medical patients for the first time. Studies show that not only do patient anxiety levels remain high throughout a hospital course, patients who experience higher levels of anxiety tend to stay longer in the hospital.1,2,27-30 But unlike oncologic care or other therapy provided in an outpatient setting, the hospitalist model does not facilitate “continuity” of care, or the ability to care for the same patients over a long period of time. This reality of inpatient care makes rapid, effective rapport-building critical to establishing strong physician-patient relationships. In this setting, a simple communication tool that is potentially able to reduce inpatients’ anxiety could have a meaningful impact on hospitalist-provided care and patient outcomes.
In terms of the magnitude of the effect of empathic responses, the clinical significance of a 1.65-point decrease in the STAI-S anxiety score is not precisely clear. A prior study that examined the effect of music therapy on anxiety levels in patients with cancer found an average anxiety reduction of approximately 9.5 units on the STAIS-S scale after sensitivity analysis, suggesting a rather large meaningful effect size.31 Given we found a reduction of 1.65 points for each empathic response, however, with a range of 0-14 negative emotions expressed over a median 19-minute encounter, there is opportunity for hospitalists to achieve a clinically significant decrease in patient anxiety during an admission encounter. The potential to reduce anxiety is extended further when we consider that the impact of an empathic response may apply not just to the admission encounter alone but also to numerous other patient-clinician interactions over the course of a hospitalization.
A healthy body of communication research supports the associations we found in our study between empathy and patient ratings of communication and physicians. Families in ICU conferences rate communication more positively when physicians express empathy,12 and a number of studies indicate an association between empathy and patient satisfaction in outpatient settings.8 Given the associations we found with negative ratings on the items in our study, promoting empathic responses to expressions of emotion and, more importantly, stressing avoidance of nonempathic responses may be relevant efforts in working to improve patient satisfaction scores on surveys reporting “top box” percentages, such as Hospital Consumer Assessment of Healthcare Providers and Systems (HCAHPS). More notably, evidence indicates that empathy has positive impacts beyond satisfaction surveys, such as adherence, better diagnostic and clinical outcomes, and strengthening of patient enablement.8Not all hospitalist responses to emotion were associated with patient ratings across the 7 communication items we assessed. For example, we did not find an association between how physicians responded to patient expressions of negative emotion and patient perception that enough time was spent in the visit or the degree to which talking with the doctor met a patient’s overall needs. It follows logically, and other research supports, that empathy would influence patient ratings of physician caring and trust,32 whereas other communication factors we were unable to measure (eg, physician body language, tone, and use of jargon and patient health literacy and primary language) may have a more significant association with patient ratings of the other items we assessed.
In considering the clinical application of our results, it is important to note that communication skills, including responding empathically to patient expressions of negative emotion, can be imparted through training in the same way as abdominal examination or electrocardiogram interpretation skills.33-35 However, training of hospitalists in communication skills requires time and some financial investment on the part of the physician, their hospital or group, or, ideally, both. Effective training methods, like those for other skill acquisition, involve learner-centered teaching and practicing skills with role-play and feedback.36 Given the importance of a learner-centered approach, learning would likely be better received and more effective if it was tailored to the specific needs and patient scenarios commonly encountered by hospitalist physicians. As these programs are developed, it will be important to assess the impact of any training on the patient-reported outcomes we assessed in this observational study, along with clinical outcomes.
Our study has several limitations. First, we were only able to evaluate whether hospitalists verbally responded to patient emotion and were thus not able to account for nonverbal empathy such as facial expressions, body language, or voice tone. Second, given our patient consent rate of 63%, patients who agreed to participate in the study may have had different opinions than those who declined to participate. Also, hospitalists and patients may have behaved differently as a result of being audio recorded. We only included patients who spoke English, and our patient population was predominately non-Hispanic white. Patients who spoke other languages or came from other cultural backgrounds may have had different responses. Third, we did not use a single validated scale for patient ratings of communication, and multiple analyses increase our risk of finding statistically significant associations by chance. The skewing of the communication rating items toward high scores may also have led to our results being driven by outliers, although the model we chose for analysis does penalize for this. Furthermore, our sample size was small, leading to wide CIs and potential for lack of statistical associations due to insufficient power. Our findings warrant replication in larger studies. Fourth, the setting of our study in an academic center may affect generalizability. Finally, the age of our data (collected between 2008 and 2009) is also a limitation. Given a recent focus on communication and patient experience since the initiation of HCAHPS feedback, a similar analysis of empathy and communication methods now may result in different outcomes.
In conclusion, our results suggest that enhancing hospitalists’ empathic responses to patient expressions of negative emotion could decrease patient anxiety and improve patients’ perceptions of (and thus possibly their relationships with) hospitalists, without sacrificing efficiency. Future work should focus on tailoring and implementing communication skills training programs for hospitalists and evaluating the impact of training on patient outcomes.
Acknowledgments
The authors extend their sincere thanks to the patients and physicians who participated in this study. Dr. Anderson was funded by the National Palliative Care Research Center and the University of California, San Francisco Clinical and Translational Science Institute Career Development Program, National Institutes of Health (NIH) grant number 5 KL2 RR024130-04. Project costs were funded by a grant from the University of California, San Francisco Academic Senate.
Disclosure
All coauthors have seen and agree with the contents of this manuscript. This submission is not under review by any other publication. Wendy Anderson received funding for this project from the National Palliative Care Research Center, University of California San Francisco Clinical and Translational Science Institute (NIH grant number 5KL2RR024130-04), and the University of San Francisco Academic Senate [From Section 2 of Author Disclosure Form]. Andy Auerbach has a Patient-Centered Outcomes Research Institute research grant in development [From Section 3 of the Author Disclosure Form].
1. Walker FB, Novack DH, Kaiser DL, Knight A, Oblinger P. Anxiety and depression among medical and surgical patients nearing hospital discharge. J Gen Intern Med. 1987;2(2):99-101. PubMed
2. Castillo MI, Cooke M, Macfarlane B, Aitken LM. Factors associated with anxiety in critically ill patients: A prospective observational cohort study. Int J Nurs Stud. 2016;60:225-233. PubMed
3. Anderson WG, Winters K, Auerbach AD. Patient concerns at hospital admission. Arch Intern Med. 2011;171(15):1399-1400. PubMed
4. Kuo Y-F, Sharma G, Freeman JL, Goodwin JS. Growth in the care of older patients by hospitalists in the United States. N Engl J Med. 2009;360(11):1102-1112. PubMed
5. Wachter RM, Goldman L. Zero to 50,000 - The 20th Anniversary of the Hospitalist. N Engl J Med. 2016;375(11):1009-1011. PubMed
6. Mack JW, Block SD, Nilsson M, et al. Measuring therapeutic alliance between oncologists and patients with advanced cancer: the Human Connection Scale. Cancer. 2009;115(14):3302-3311. PubMed
7. Huff NG, Nadig N, Ford DW, Cox CE. Therapeutic Alliance between the Caregivers of Critical Illness Survivors and Intensive Care Unit Clinicians. [published correction appears in Ann Am Thorac Soc. 2016;13(4):576]. Ann Am Thorac Soc. 2015;12(11):1646-1653. PubMed
8. Derksen F, Bensing J, Lagro-Janssen A. Effectiveness of empathy in general practice: a systematic review. Br J Gen Pract. 2013;63(606):e76-e84. PubMed
9. Dwamena F, Holmes-Rovner M, Gaulden CM, et al. Interventions for providers to promote a patient-centred approach in clinical consultations. Cochrane Database Syst Rev. 2012;12:CD003267. PubMed
10. Fogarty LA, Curbow BA, Wingard JR, McDonnell K, Somerfield MR. Can 40 seconds of compassion reduce patient anxiety? J Clin Oncol. 1999;17(1):371-379. PubMed
11. Roter DL, Hall JA, Kern DE, Barker LR, Cole KA, Roca RP. Improving physicians’ interviewing skills and reducing patients’ emotional distress. A randomized clinical trial. Arch Intern Med. 1995;155(17):1877-1884. PubMed
12. Stapleton RD, Engelberg RA, Wenrich MD, Goss CH, Curtis JR. Clinician statements and family satisfaction with family conferences in the intensive care unit. Crit Care Med. 2006;34(6):1679-1685. PubMed
13. Hojat M, Louis DZ, Markham FW, Wender R, Rabinowitz C, Gonnella JS. Physicians’ empathy and clinical outcomes for diabetic patients. Acad Med. 2011;86(3):359-364. PubMed
14. Anderson WG, Winters K, Arnold RM, Puntillo KA, White DB, Auerbach AD. Studying physician-patient communication in the acute care setting: the hospitalist rapport study. Patient Educ Couns. 2011;82(2):275-279. PubMed
15. Pollak KI, Arnold RM, Jeffreys AS, et al. Oncologist communication about emotion during visits with patients with advanced cancer. J Clin Oncol. 2007;25(36):5748-5752. PubMed
16. Suchman AL, Markakis K, Beckman HB, Frankel R. A model of empathic communication in the medical interview. JAMA. 1997;277(8):678-682. PubMed
17. Adams K, Cimino JEW, Arnold RM, Anderson WG. Why should I talk about emotion? Communication patterns associated with physician discussion of patient expressions of negative emotion in hospital admission encounters. Patient Educ Couns. 2012;89(1):44-50. PubMed
18. Julian LJ. Measures of anxiety: State-Trait Anxiety Inventory (STAI), Beck Anxiety Inventory (BAI), and Hospital Anxiety and Depression Scale-Anxiety (HADS-A). Arthritis Care Res (Hoboken). 2011;63 Suppl 11:S467-S472. PubMed
19. Speilberger C, Ritterband L, Sydeman S, Reheiser E, Unger K. Assessment of emotional states and personality traits: measuring psychological vital signs. In: Butcher J, editor. Clinical personality assessment: practical approaches. New York: Oxford University Press; 1995.
20. Safran DG, Kosinski M, Tarlov AR, et al. The Primary Care Assessment Survey: tests of data quality and measurement performance. Med Care. 1998;36(5):728-739. PubMed
21. Azoulay E, Pochard F, Kentish-Barnes N, et al. Risk of post-traumatic stress symptoms in family members of intensive care unit patients. Am J Respir Crit Care Med. 2005;171(9):987-994. PubMed
22. Lynn J. Perspectives on care at the close of life. Serving patients who may die soon and their families: the role of hospice and other services. JAMA. 2001;285(7):925-932. PubMed
23. Kennifer SL, Alexander SC, Pollak KI, et al. Negative emotions in cancer care: do oncologists’ responses depend on severity and type of emotion? Patient Educ Couns. 2009;76(1):51-56. PubMed
24. Butow PN, Brown RF, Cogar S, Tattersall MHN, Dunn SM. Oncologists’ reactions to cancer patients’ verbal cues. Psychooncology. 2002;11(1):47-58. PubMed
25. Levinson W, Gorawara-Bhat R, Lamb J. A study of patient clues and physician responses in primary care and surgical settings. JAMA. 2000;284(8):1021-1027. PubMed
26. Cohen J. A coefficient of agreement for nominal scales. Educ Psychol Meas. 1960;20(1):37-46.
27. Fulop G. Anxiety disorders in the general hospital setting. Psychiatr Med. 1990;8(3):187-195. PubMed
28. Gerson S, Mistry R, Bastani R, et al. Symptoms of depression and anxiety (MHI) following acute medical/surgical hospitalization and post-discharge psychiatric diagnoses (DSM) in 839 geriatric US veterans. Int J Geriatr Psychiatry. 2004;19(12):1155-1167. PubMed
29. Kathol RG, Wenzel RP. Natural history of symptoms of depression and anxiety during inpatient treatment on general medicine wards. J Gen Intern Med. 1992;7(3):287-293. PubMed
30. Unsal A, Unaldi C, Baytemir C. Anxiety and depression levels of inpatients in the city centre of Kirşehir in Turkey. Int J Nurs Pract. 2011;17(4):411-418. PubMed
31. Bradt J, Dileo C, Grocke D, Magill L. Music interventions for improving psychological and physical outcomes in cancer patients. [Update appears in Cochrane Database Syst Rev. 2016;(8):CD006911] Cochrane Database Syst Rev. 2011;(8):CD006911. PubMed
32. Kim SS, Kaplowitz S, Johnston MV. The effects of physician empathy on patient satisfaction and compliance. Eval Health Prof. 2004;27(3):237-251. PubMed
33. Tulsky JA, Arnold RM, Alexander SC, et al. Enhancing communication between oncologists and patients with a computer-based training program: a randomized trial. Ann Intern Med. 2011;155(9):593-601. PubMed
34. Bays AM, Engelberg RA, Back AL, et al. Interprofessional communication skills training for serious illness: evaluation of a small-group, simulated patient intervention. J Palliat Med. 2014;17(2):159-166. PubMed
35. Epstein RM, Duberstein PR, Fenton JJ, et al. Effect of a Patient-Centered Communication Intervention on Oncologist-Patient Communication, Quality of Life, and Health Care Utilization in Advanced Cancer: The VOICE Randomized Clinical Trial. JAMA Oncol. 2017;3(1):92-100. PubMed
36. Berkhof M, van Rijssen HJ, Schellart AJM, Anema JR, van der Beek AJ. Effective training strategies for teaching communication skills to physicians: an overview of systematic reviews. Patient Educ Couns. 2011;84(2):152-162. PubMed
Admission to a hospital can be a stressful event,1,2 and patients report having many concerns at the time of hospital admission.3 Over the last 20 years, the United States has widely adopted the hospitalist model of inpatient care. Although this model has clear benefits, it also has the potential to contribute to patient stress, as hospitalized patients generally lack preexisting relationships with their inpatient physicians.4,5 In this changing hospital environment, defining and promoting effective medical communication has become an essential goal of both individual practitioners and medical centers.
Successful communication and strong therapeutic relationships with physicians support patients’ coping with illness-associated stress6,7 as well as promote adherence to medical treatment plans.8 Empathy serves as an important building block of patient-centered communication and encourages a strong therapeutic alliance.9 Studies from primary care, oncology, and intensive care unit (ICU) settings indicate that physician empathy is associated with decreased emotional distress,10,11 improved ratings of communication,12 and even better medical outcomes.13
Prior work has shown that hospitalists, like other clinicians, underutilize empathy as a tool in their daily interactions with patients.14-16 Our prior qualitative analysis of audio-recorded hospitalist-patient admission encounters indicated that how hospitalists respond to patient expressions of negative emotion influences relationships with patients and alignment around care plans.17 To determine whether empathic communication is associated with patient-reported outcomes in the hospitalist model, we quantitatively analyzed coded admission encounters and survey data to examine the association between hospitalists’ responses to patient expressions of negative emotion (anxiety, sadness, and anger) and patient anxiety and ratings of communication. Given the often-limited time hospitalists have to complete admission encounters, we also examined the association between response to emotion and encounter length.
METHODS
We analyzed data collected as part of an observational study of hospitalist-patient communication during hospital admission encounters14 to assess the association between the way physicians responded to patient expressions of negative emotion and patient anxiety, ratings of communication in the encounter, and encounter length. We collected data between August 2008 and March 2009 on the general medical service at 2 urban hospitals that are part of an academic medical center. Participants were attending hospitalists (not physician trainees), and patients admitted under participating hospitalists’ care who were able to communicate verbally in English and provide informed consent for the study. The institutional review board at the University of California, San Francisco approved the study; physician and patient participants provided written informed consent.
Enrollment and data collection has been described previously.17 Our cohort for this analysis included 76 patients of 27 physicians who completed encounter audio recordings and pre- and postencounter surveys. Following enrollment, patients completed a preencounter survey to collect demographic information and to measure their baseline anxiety via the State Anxiety Scale (STAI-S), which assesses transient anxious mood using 20 items answered on a 4-point scale for a final score range of 20 to 80.10,18,19 We timed and audio-recorded admission encounters. Encounter recordings were obtained solely from patient interactions with attending hospitalists and did not take into account the time patients may have spent with other physicians, including trainees. After the encounter, patients completed postencounter surveys, which included the STAI-S and patients’ ratings of communication during the encounter. To rate communication, patients responded to 7 items on a 0- to 10-point scale that were derived from previous work (Table 1)12,20,21; the anchors were “not at all” and “completely.” To identify patients with serious illness, which we used as a covariate in regression models, we asked physicians on a postencounter survey whether or not they “would be surprised by this patient’s death or admission to the ICU in the next year.”22
We considered physician as a clustering variable in the calculation of robust standard errors for all models. In addition, we included in each model covariates that were associated with the outcome at P ≤ 0.10, including patient gender, patient age, serious illness,22 preencounter anxiety, encounter length, and hospital. We considered P values < 0.05 to be statistically significant. We used Stata SE 13 (StataCorp LLC, College Station, TX) for all statistical analyses.
RESULTS
We analyzed data from admission encounters with 76 patients (consent rate 63%) and 27 hospitalists (consent rate 91%). Their characteristics are shown in Table 3. Median encounter length was 19 minutes (mean 21 minutes, range 3-68). Patients expressed negative emotion in 190 instances across all encounters; median number of expressions per encounter was 1 (range 0-14). Hospitalists responded empathically to 32% (n = 61) of the patient expressions, neutrally to 43% (n = 81), and nonempathically to 25% (n = 48).
The STAI-S was normally distributed. The mean preencounter STAI-S score was 39 (standard deviation [SD] 8.9). Mean postencounter STAI-S score was 38 (SD 10.7). Mean change in anxiety over the course of the encounter, calculated as the postencounter minus preencounter mean was −1.2 (SD 7.6). Table 1 shows summary statistics for the patient ratings of communication items. All items were rated highly. Across the items, between 51% and 78% of patients rated the highest score of 10.
Across the range of frequencies of emotional expressions per encounter in our data set (0-14 expressions), each additional empathic hospitalist response was associated with a 1.65-point decrease in the STAI-S (95% confidence interval [CI], 0.48-2.82). We did not find significant associations between changes in the STAI-S and the number of neutral hospitalist responses (−0.65 per response; 95% CI, −1.67-0.37) or nonempathic hospitalist responses (0.61 per response; 95% CI, −0.88-2.10).
In addition, nonempathic responses were associated with more negative ratings of communication for 5 of the 7 items: ease of understanding information, covering points of interest, the doctor listening, the doctor caring, and trusting the doctor. For example, for the item “I felt this doctor cared about me,” each nonempathic hospitalist response was associated with a more than doubling of negative patient ratings (aRE: 2.3; 95% CI, 1.32-4.16). Neutral physician responses to patient expressions of negative emotion were associated with less negative patient ratings for 2 of the items: covering points of interest (aRE 0.68; 95% CI, 0.51-0.90) and trusting the doctor (aRE: 0.86; 95% CI, 0.75-0.99).
We did not find a statistical association between encounter length and the number of empathic hospitalist responses in the encounter (percent change in encounter length per response [PC]: 1%; 95% CI, −8%-10%) or the number of nonempathic responses (PC: 18%; 95% CI, −2%-42%). We did find a statistically significant association between the number of neutral responses and encounter length (PC: 13%; 95% CI, 3%-24%), corresponding to 2.5 minutes of additional encounter time per neutral response for the median encounter length of 19 minutes.
DISCUSSION
Our study set out to measure how hospitalists responded to expressions of negative emotion during admission encounters with patients and how those responses correlated with patient anxiety, ratings of communication, and encounter length. We found that empathic responses were associated with diminishing patient anxiety after the visit, as well as with better ratings of several domains of hospitalist communication. Moreover, nonempathic responses to negative emotion were associated with more strongly negative ratings of hospitalist communication. Finally, while clinicians may worry that encouraging patients to speak further about emotion will result in excessive visit lengths, we did not find a statistical association between empathic responses and encounter duration. To our knowledge, this is the first study to indicate an association between empathy and patient anxiety and communication ratings within the hospitalist model, which is rapidly becoming the predominant model for providing inpatient care in the United States.4,5
As in oncologic care, anxiety is an emotion commonly confronted by clinicians meeting admitted medical patients for the first time. Studies show that not only do patient anxiety levels remain high throughout a hospital course, patients who experience higher levels of anxiety tend to stay longer in the hospital.1,2,27-30 But unlike oncologic care or other therapy provided in an outpatient setting, the hospitalist model does not facilitate “continuity” of care, or the ability to care for the same patients over a long period of time. This reality of inpatient care makes rapid, effective rapport-building critical to establishing strong physician-patient relationships. In this setting, a simple communication tool that is potentially able to reduce inpatients’ anxiety could have a meaningful impact on hospitalist-provided care and patient outcomes.
In terms of the magnitude of the effect of empathic responses, the clinical significance of a 1.65-point decrease in the STAI-S anxiety score is not precisely clear. A prior study that examined the effect of music therapy on anxiety levels in patients with cancer found an average anxiety reduction of approximately 9.5 units on the STAIS-S scale after sensitivity analysis, suggesting a rather large meaningful effect size.31 Given we found a reduction of 1.65 points for each empathic response, however, with a range of 0-14 negative emotions expressed over a median 19-minute encounter, there is opportunity for hospitalists to achieve a clinically significant decrease in patient anxiety during an admission encounter. The potential to reduce anxiety is extended further when we consider that the impact of an empathic response may apply not just to the admission encounter alone but also to numerous other patient-clinician interactions over the course of a hospitalization.
A healthy body of communication research supports the associations we found in our study between empathy and patient ratings of communication and physicians. Families in ICU conferences rate communication more positively when physicians express empathy,12 and a number of studies indicate an association between empathy and patient satisfaction in outpatient settings.8 Given the associations we found with negative ratings on the items in our study, promoting empathic responses to expressions of emotion and, more importantly, stressing avoidance of nonempathic responses may be relevant efforts in working to improve patient satisfaction scores on surveys reporting “top box” percentages, such as Hospital Consumer Assessment of Healthcare Providers and Systems (HCAHPS). More notably, evidence indicates that empathy has positive impacts beyond satisfaction surveys, such as adherence, better diagnostic and clinical outcomes, and strengthening of patient enablement.8Not all hospitalist responses to emotion were associated with patient ratings across the 7 communication items we assessed. For example, we did not find an association between how physicians responded to patient expressions of negative emotion and patient perception that enough time was spent in the visit or the degree to which talking with the doctor met a patient’s overall needs. It follows logically, and other research supports, that empathy would influence patient ratings of physician caring and trust,32 whereas other communication factors we were unable to measure (eg, physician body language, tone, and use of jargon and patient health literacy and primary language) may have a more significant association with patient ratings of the other items we assessed.
In considering the clinical application of our results, it is important to note that communication skills, including responding empathically to patient expressions of negative emotion, can be imparted through training in the same way as abdominal examination or electrocardiogram interpretation skills.33-35 However, training of hospitalists in communication skills requires time and some financial investment on the part of the physician, their hospital or group, or, ideally, both. Effective training methods, like those for other skill acquisition, involve learner-centered teaching and practicing skills with role-play and feedback.36 Given the importance of a learner-centered approach, learning would likely be better received and more effective if it was tailored to the specific needs and patient scenarios commonly encountered by hospitalist physicians. As these programs are developed, it will be important to assess the impact of any training on the patient-reported outcomes we assessed in this observational study, along with clinical outcomes.
Our study has several limitations. First, we were only able to evaluate whether hospitalists verbally responded to patient emotion and were thus not able to account for nonverbal empathy such as facial expressions, body language, or voice tone. Second, given our patient consent rate of 63%, patients who agreed to participate in the study may have had different opinions than those who declined to participate. Also, hospitalists and patients may have behaved differently as a result of being audio recorded. We only included patients who spoke English, and our patient population was predominately non-Hispanic white. Patients who spoke other languages or came from other cultural backgrounds may have had different responses. Third, we did not use a single validated scale for patient ratings of communication, and multiple analyses increase our risk of finding statistically significant associations by chance. The skewing of the communication rating items toward high scores may also have led to our results being driven by outliers, although the model we chose for analysis does penalize for this. Furthermore, our sample size was small, leading to wide CIs and potential for lack of statistical associations due to insufficient power. Our findings warrant replication in larger studies. Fourth, the setting of our study in an academic center may affect generalizability. Finally, the age of our data (collected between 2008 and 2009) is also a limitation. Given a recent focus on communication and patient experience since the initiation of HCAHPS feedback, a similar analysis of empathy and communication methods now may result in different outcomes.
In conclusion, our results suggest that enhancing hospitalists’ empathic responses to patient expressions of negative emotion could decrease patient anxiety and improve patients’ perceptions of (and thus possibly their relationships with) hospitalists, without sacrificing efficiency. Future work should focus on tailoring and implementing communication skills training programs for hospitalists and evaluating the impact of training on patient outcomes.
Acknowledgments
The authors extend their sincere thanks to the patients and physicians who participated in this study. Dr. Anderson was funded by the National Palliative Care Research Center and the University of California, San Francisco Clinical and Translational Science Institute Career Development Program, National Institutes of Health (NIH) grant number 5 KL2 RR024130-04. Project costs were funded by a grant from the University of California, San Francisco Academic Senate.
Disclosure
All coauthors have seen and agree with the contents of this manuscript. This submission is not under review by any other publication. Wendy Anderson received funding for this project from the National Palliative Care Research Center, University of California San Francisco Clinical and Translational Science Institute (NIH grant number 5KL2RR024130-04), and the University of San Francisco Academic Senate [From Section 2 of Author Disclosure Form]. Andy Auerbach has a Patient-Centered Outcomes Research Institute research grant in development [From Section 3 of the Author Disclosure Form].
1. Walker FB, Novack DH, Kaiser DL, Knight A, Oblinger P. Anxiety and depression among medical and surgical patients nearing hospital discharge. J Gen Intern Med. 1987;2(2):99-101. PubMed
2. Castillo MI, Cooke M, Macfarlane B, Aitken LM. Factors associated with anxiety in critically ill patients: A prospective observational cohort study. Int J Nurs Stud. 2016;60:225-233. PubMed
3. Anderson WG, Winters K, Auerbach AD. Patient concerns at hospital admission. Arch Intern Med. 2011;171(15):1399-1400. PubMed
4. Kuo Y-F, Sharma G, Freeman JL, Goodwin JS. Growth in the care of older patients by hospitalists in the United States. N Engl J Med. 2009;360(11):1102-1112. PubMed
5. Wachter RM, Goldman L. Zero to 50,000 - The 20th Anniversary of the Hospitalist. N Engl J Med. 2016;375(11):1009-1011. PubMed
6. Mack JW, Block SD, Nilsson M, et al. Measuring therapeutic alliance between oncologists and patients with advanced cancer: the Human Connection Scale. Cancer. 2009;115(14):3302-3311. PubMed
7. Huff NG, Nadig N, Ford DW, Cox CE. Therapeutic Alliance between the Caregivers of Critical Illness Survivors and Intensive Care Unit Clinicians. [published correction appears in Ann Am Thorac Soc. 2016;13(4):576]. Ann Am Thorac Soc. 2015;12(11):1646-1653. PubMed
8. Derksen F, Bensing J, Lagro-Janssen A. Effectiveness of empathy in general practice: a systematic review. Br J Gen Pract. 2013;63(606):e76-e84. PubMed
9. Dwamena F, Holmes-Rovner M, Gaulden CM, et al. Interventions for providers to promote a patient-centred approach in clinical consultations. Cochrane Database Syst Rev. 2012;12:CD003267. PubMed
10. Fogarty LA, Curbow BA, Wingard JR, McDonnell K, Somerfield MR. Can 40 seconds of compassion reduce patient anxiety? J Clin Oncol. 1999;17(1):371-379. PubMed
11. Roter DL, Hall JA, Kern DE, Barker LR, Cole KA, Roca RP. Improving physicians’ interviewing skills and reducing patients’ emotional distress. A randomized clinical trial. Arch Intern Med. 1995;155(17):1877-1884. PubMed
12. Stapleton RD, Engelberg RA, Wenrich MD, Goss CH, Curtis JR. Clinician statements and family satisfaction with family conferences in the intensive care unit. Crit Care Med. 2006;34(6):1679-1685. PubMed
13. Hojat M, Louis DZ, Markham FW, Wender R, Rabinowitz C, Gonnella JS. Physicians’ empathy and clinical outcomes for diabetic patients. Acad Med. 2011;86(3):359-364. PubMed
14. Anderson WG, Winters K, Arnold RM, Puntillo KA, White DB, Auerbach AD. Studying physician-patient communication in the acute care setting: the hospitalist rapport study. Patient Educ Couns. 2011;82(2):275-279. PubMed
15. Pollak KI, Arnold RM, Jeffreys AS, et al. Oncologist communication about emotion during visits with patients with advanced cancer. J Clin Oncol. 2007;25(36):5748-5752. PubMed
16. Suchman AL, Markakis K, Beckman HB, Frankel R. A model of empathic communication in the medical interview. JAMA. 1997;277(8):678-682. PubMed
17. Adams K, Cimino JEW, Arnold RM, Anderson WG. Why should I talk about emotion? Communication patterns associated with physician discussion of patient expressions of negative emotion in hospital admission encounters. Patient Educ Couns. 2012;89(1):44-50. PubMed
18. Julian LJ. Measures of anxiety: State-Trait Anxiety Inventory (STAI), Beck Anxiety Inventory (BAI), and Hospital Anxiety and Depression Scale-Anxiety (HADS-A). Arthritis Care Res (Hoboken). 2011;63 Suppl 11:S467-S472. PubMed
19. Speilberger C, Ritterband L, Sydeman S, Reheiser E, Unger K. Assessment of emotional states and personality traits: measuring psychological vital signs. In: Butcher J, editor. Clinical personality assessment: practical approaches. New York: Oxford University Press; 1995.
20. Safran DG, Kosinski M, Tarlov AR, et al. The Primary Care Assessment Survey: tests of data quality and measurement performance. Med Care. 1998;36(5):728-739. PubMed
21. Azoulay E, Pochard F, Kentish-Barnes N, et al. Risk of post-traumatic stress symptoms in family members of intensive care unit patients. Am J Respir Crit Care Med. 2005;171(9):987-994. PubMed
22. Lynn J. Perspectives on care at the close of life. Serving patients who may die soon and their families: the role of hospice and other services. JAMA. 2001;285(7):925-932. PubMed
23. Kennifer SL, Alexander SC, Pollak KI, et al. Negative emotions in cancer care: do oncologists’ responses depend on severity and type of emotion? Patient Educ Couns. 2009;76(1):51-56. PubMed
24. Butow PN, Brown RF, Cogar S, Tattersall MHN, Dunn SM. Oncologists’ reactions to cancer patients’ verbal cues. Psychooncology. 2002;11(1):47-58. PubMed
25. Levinson W, Gorawara-Bhat R, Lamb J. A study of patient clues and physician responses in primary care and surgical settings. JAMA. 2000;284(8):1021-1027. PubMed
26. Cohen J. A coefficient of agreement for nominal scales. Educ Psychol Meas. 1960;20(1):37-46.
27. Fulop G. Anxiety disorders in the general hospital setting. Psychiatr Med. 1990;8(3):187-195. PubMed
28. Gerson S, Mistry R, Bastani R, et al. Symptoms of depression and anxiety (MHI) following acute medical/surgical hospitalization and post-discharge psychiatric diagnoses (DSM) in 839 geriatric US veterans. Int J Geriatr Psychiatry. 2004;19(12):1155-1167. PubMed
29. Kathol RG, Wenzel RP. Natural history of symptoms of depression and anxiety during inpatient treatment on general medicine wards. J Gen Intern Med. 1992;7(3):287-293. PubMed
30. Unsal A, Unaldi C, Baytemir C. Anxiety and depression levels of inpatients in the city centre of Kirşehir in Turkey. Int J Nurs Pract. 2011;17(4):411-418. PubMed
31. Bradt J, Dileo C, Grocke D, Magill L. Music interventions for improving psychological and physical outcomes in cancer patients. [Update appears in Cochrane Database Syst Rev. 2016;(8):CD006911] Cochrane Database Syst Rev. 2011;(8):CD006911. PubMed
32. Kim SS, Kaplowitz S, Johnston MV. The effects of physician empathy on patient satisfaction and compliance. Eval Health Prof. 2004;27(3):237-251. PubMed
33. Tulsky JA, Arnold RM, Alexander SC, et al. Enhancing communication between oncologists and patients with a computer-based training program: a randomized trial. Ann Intern Med. 2011;155(9):593-601. PubMed
34. Bays AM, Engelberg RA, Back AL, et al. Interprofessional communication skills training for serious illness: evaluation of a small-group, simulated patient intervention. J Palliat Med. 2014;17(2):159-166. PubMed
35. Epstein RM, Duberstein PR, Fenton JJ, et al. Effect of a Patient-Centered Communication Intervention on Oncologist-Patient Communication, Quality of Life, and Health Care Utilization in Advanced Cancer: The VOICE Randomized Clinical Trial. JAMA Oncol. 2017;3(1):92-100. PubMed
36. Berkhof M, van Rijssen HJ, Schellart AJM, Anema JR, van der Beek AJ. Effective training strategies for teaching communication skills to physicians: an overview of systematic reviews. Patient Educ Couns. 2011;84(2):152-162. PubMed
© 2017 Society of Hospital Medicine
Automating venous thromboembolism risk calculation using electronic health record data upon hospital admission: The automated Padua Prediction Score
Hospital-acquired venous thromboembolism (VTE) continues to be a critical quality challenge for U.S. hospitals,1 and high-risk patients are often not adequately prophylaxed. Use of VTE prophylaxis (VTEP) varies as widely as 26% to 85% of patients in various studies, as does patient outcomes and care expenditures.2-6 The 9th edition of the American College of Chest Physicians (CHEST) guidelines7 recommend the Padua Prediction Score (PPS) to select individual patients who may be at high risk for venous thromboembolism (VTE) and could benefit from thromboprophylaxis. Use of the manually calculated PPS to select patients for thromboprophylaxis has been shown to help decrease 30-day and 90-day mortality associated with VTE events after hospitalization to medical services.8 However, the PPS requires time-consuming manual calculation by a provider, who may be focused on more immediate aspects of patient care and several other risk scores competing for his attention, potentially decreasing its use.
Other risk scores that use only discrete scalar data, such as vital signs and lab results to predict early recognition of sepsis, have been successfully automated and implemented within electronic health records (EHRs).9-11 Successful automation of scores requiring input of diagnoses, recent medical events, and current clinical status such as the PPS remains difficult.12 Data representing these characteristics are more prone to error, and harder to translate clearly into a single data field than discrete elements like heart rate, potentially impacting validity of the calculated result.13 To improve usage of guideline based VTE risk assessment and decrease physician burden, we developed an algorithm called Automated Padua Prediction Score (APPS) that automatically calculates the PPS using only EHR data available within prior encounters and the first 4 hours of admission, a similar timeframe to when admitting providers would be entering orders. Our goal was to assess if an automatically calculated version of the PPS, a score that depends on criteria more complex than vital signs and labs, would accurately assess risk for hospital-acquired VTE when compared to traditional manual calculation of the Padua Prediction Score by a provider.
METHODS
Site Description and Ethics
The study was conducted at University of California, San Francisco Medical Center, a 790-bed academic hospital; its Institutional Review Board approved the study and collection of data via chart review. Handling of patient information complied with the Health Insurance Portability and Accountability Act of 1996.
Patient Inclusion
Adult patients admitted to a medical or surgical service between July 1, 2012 and April 1, 2014 were included in the study if they were candidates for VTEP, defined as: length of stay (LOS) greater than 2 days, not on hospice care, not pregnant at admission, no present on admission VTE diagnosis, no known contraindications to prophylaxis (eg, gastrointestinal bleed), and were not receiving therapeutic doses of warfarin, low molecular weight heparins, heparin, or novel anticoagulants prior to admission.
Data Sources
Clinical variables were extracted from the EHR’s enterprise data warehouse (EDW) by SQL Server query (Microsoft, Redmond, Washington) and deposited in a secure database. Chart review was conducted by a trained researcher (Mr. Jacolbia) using the EHR and a standardized protocol. Findings were recorded using REDCap (REDCap Consortium, Vanderbilt University, Nashville, Tennessee). The specific ICD-9, procedure, and lab codes used to determine each criterion of APPS are available in the Appendix.
Creation of the Automated Padua Prediction Score (APPS)
We developed APPS from the original 11 criteria that comprise the Padua Prediction Score: active cancer, previous VTE (excluding superficial vein thrombosis), reduced mobility, known thrombophilic condition, recent (1 month or less) trauma and/or surgery, age 70 years or older, heart and/or respiratory failure, acute myocardial infarction and/or ischemic stroke, acute infection and/or rheumatologic disorder, body mass index (BMI) 30 or higher, and ongoing hormonal treatment.13 APPS has the same scoring methodology as PPS: criteria are weighted from 1 to 3 points and summed with a maximum score of 20, representing highest risk of VTE. To automate the score calculation from data routinely available in the EHR, APPS checks pre-selected structured data fields for specific values within laboratory results, orders, nursing flowsheets and claims. Claims data included all ICD-9 and procedure codes used for billing purposes. If any of the predetermined data elements are found, then the specific criterion is considered positive; otherwise, it is scored as negative. The creators of the PPS were consulted in the generation of these data queries to replicate the original standards for deeming a criterion positive. The automated calculation required no use of natural language processing.
Characterization of Study Population
We recorded patient demographics (age, race, gender, BMI), LOS, and rate of hospital-acquired VTE. These patients were separated into 2 cohorts determined by the VTE prophylaxis they received. The risk profile of patients who received pharmacologic prophylaxis was hypothesized to be inherently different from those who had not. To evaluate APPS within this heterogeneous cohort, patients were divided into 2 major categories: pharmacologic vs. no pharmacologic prophylaxis. If they had a completed order or medication administration record on the institution’s approved formulary for pharmacologic VTEP, they were considered to have received pharmacologic prophylaxis. If they had only a completed order for usage of mechanical prophylaxis (sequential compression devices) or no evidence of any form of VTEP, they were considered to have received no pharmacologic prophylaxis. Patients with evidence of both pharmacologic and mechanical were placed in the pharmacologic prophylaxis group. To ensure that automated designation of prophylaxis group was accurate, we reviewed 40 randomly chosen charts because prior researchers were able to achieve sensitivity and specificity greater than 90% with that sample size.14
The primary outcome of hospital-acquired VTE was defined as an ICD-9 code for VTE (specific codes are found in the Appendix) paired with a “present on admission = no” flag on that encounter’s hospital billing data, abstracted from the EDW. A previous study at this institution used the same methodology and found 212/226 (94%) of patients with a VTE ICD-9 code on claim had evidence of a hospital-acquired VTE event upon chart review.14 Chart review was also completed to ensure that the primary outcome of newly discovered hospital-acquired VTE was differentiated from chronic VTE or history of VTE. Theoretically, ICD-9 codes and other data elements treat chronic VTE, history of VTE, and hospital-acquired VTE as distinct diagnoses, but it was unclear if this was true in our dataset. For 75 randomly selected cases of presumed hospital-acquired VTE, charts were reviewed for evidence that confirmed newly found VTE during that encounter.
Validation of APPS through Comparison to Manual Calculation of the Original PPS
To compare our automated calculation to standard clinical practice, we manually calculated the PPS through chart review within the first 2 days of admission on 300 random patients, a subsample of the entire study cohort. The largest study we could find had manually calculated the PPS of 1,080 hospitalized patients with a mean PPS of 4.86 (standard deviation [SD], 2.26).15 One researcher (Mr. Jacolbia) accessed the EHR with all patient information available to physicians, including admission notes, orders, labs, flowsheets, past medical history, and all prior encounters to calculate and record the PPS. To limit potential score bias, 2 authors (Drs. Elias and Davies) assessed 30 randomly selected charts from the cohort of 300. The standardized chart review protocol mimicked a physician’s approach to determine if a patient met a criterion, such as concluding if he/she had active cancer by examining medication lists for chemotherapy, procedure notes for radiation, and recent diagnoses on problem lists. After the original PPS was manually calculated, APPS was automatically calculated for the same 300 patients. We intended to characterize similarities and differences between APPS and manual calculation prior to investigating APPS’ predictive capacity for the entire study population, because it would not be feasible to manually calculate the PPS for all 30,726 patients.
Statistical Analysis
For the 75 randomly selected cases of presumed hospital-acquired VTE, the number of cases was chosen by powering our analysis to find a difference in proportion of 20% with 90% power, α = 0.05 (two-sided). We conducted χ2 tests on the entire study cohort to determine if there were significant differences in demographics, LOS, and incidence of hospital-acquired VTE by prophylaxis received. For both the pharmacologic and the no pharmacologic prophylaxis groups, we conducted 2-sample Student t tests to determine significant differences in demographics and LOS between patients who experienced a hospital-acquired VTE and those who did not.
For the comparison of our automated calculation to standard clinical practice, we manually calculated the PPS through chart review within the first 2 days of admission on a subsample of 300 random patients. We powered our analysis to detect a difference in mean PPS from 4.86 to 4.36, enough to alter the point value, with 90% power and α = 0.05 (two-sided) and found 300 patients to be comfortably above the required sample size. We compared APPS and manual calculation in the 300-patient cohort using: 2-sample Student t tests to compare mean scores, χ2 tests to compare the frequency with which criteria were positive, and receiver operating characteristic (ROC) curves to determine capacity to predict a hospital-acquired VTE event. Pearson’s correlation was also completed to assess score agreement between APPS and manual calculation on a per-patient basis. After comparing automated calculation of APPS to manual chart review on the same 300 patients, we used APPS to calculate scores for the entire study cohort (n = 30,726). We calculated the mean of APPS by prophylaxis group and whether hospital-acquired VTE had occurred. We analyzed APPS’ ROC curve statistics by prophylaxis group to determine its overall predictive capacity in our study population. Lastly, we computed the time required to calculate APPS per patient. Statistical analyses were conducted using SPSS Statistics (IBM, Armonk, New York) and Python 2.7 (Python Software Foundation, Beaverton, Oregon); 95% confidence intervals (CI) and (SD) were reported when appropriate.
RESULTS
Among the 30,726 unique patients in our entire cohort (all patients admitted during the time period who met the study criteria), we found 6574 (21.4%) on pharmacologic (with or without mechanical) prophylaxis, 13,511 (44.0%) on mechanical only, and 10,641 (34.6%) on no prophylaxis. χ2 tests found no significant differences in demographics, LOS, or incidence of hospital-acquired VTE between the patients who received mechanical prophylaxis only and those who received no prophylaxis (Table 1). Similarly, there were no differences in these characteristics in patients receiving pharmacologic prophylaxis with or without the addition of mechanical prophylaxis. Designation of prophylaxis group by manual chart review vs. our automated process was found to agree in categorization for 39/40 (97.5%) sampled encounters. When comparing the cohort that received pharmacologic prophylaxis against the cohort that did not, there were significant differences in racial distribution, sex, BMI, and average LOS as shown in Table 1. Those who received pharmacologic prophylaxis were found to be significantly older than those who did not (62.7 years versus 53.2 years, P < 0.001), more likely to be male (50.6% vs, 42.4%, P < 0.001), more likely to have hospital-acquired VTE (2.2% vs. 0.5%, P < 0.001), and to have a shorter LOS (7.1 days vs. 9.8, P < 0.001).

Within the cohort group receiving pharmacologic prophylaxis (n = 6574), hospital-acquired VTE occurred in patients who were significantly younger (58.2 years vs. 62.8 years, P = 0.003) with a greater LOS (23.8 days vs. 6.7, P < 0.001) than those without. Within the group receiving no pharmacologic prophylaxis (n = 24,152), hospital-acquired VTE occurred in patients who were significantly older (57.1 years vs. 53.2 years, P = 0.014) with more than twice the LOS (20.2 days vs. 9.7 days, P < 0.001) compared to those without. Sixty-six of 75 (88%) randomly selected patients in which new VTE was identified by the automated electronic query had this diagnosis confirmed during manual chart review.
As shown in Table 2, automated calculation on a subsample of 300 randomly selected patients using APPS had a mean of 5.5 (SD, 2.9) while manual calculation of the original PPS on the same patients had a mean of 5.1 (SD, 2.6). There was no significant difference in mean between manual calculation and APPS (P = 0.073). There were, however, significant differences in how often individual criteria were considered present. The largest contributors to the difference in scores between APPS and manual calculation were “prior VTE” (positive, 16% vs. 8.3%, respectively) and “reduced mobility” (positive, 74.3% vs. 66%, respectively) as shown in Table 2. In the subsample, there were a total of 6 (2.0%) hospital-acquired VTE events. APPS’ automated calculation had an AUC = 0.79 (CI, 0.63-0.95) that was significant (P = 0.016) with a cutoff value of 5. Chart review’s manual calculation of the PPS had an AUC = 0.76 (CI 0.61-0.91) that was also significant (P = 0.029).
Distribution of Patient Characteristics in Cohort
Our entire cohort of 30,726 unique patients admitted during the study period included 260 (0.8%) who experienced hospital-acquired VTEs (Table 3). In patients receiving no pharmacologic prophylaxis, the average APPS was 4.0 (SD, 2.4) for those without VTE and 7.1 (SD, 2.3) for those with VTE. In patients who had received pharmacologic prophylaxis, those without hospital-acquired VTE had an average APPS of 4.9 (SD, 2.6) and those with hospital-acquired VTE averaged 7.7 (SD, 2.6). APPS’ ROC curves for “no pharmacologic prophylaxis” had an AUC = 0.81 (CI, 0.79 – 0.83) that was significant (P < 0.001) with a cutoff value of 5. There was similar performance in the pharmacologic prophylaxis group with an AUC = 0.79 (CI, 0.76 – 0.82) and cutoff value of 5, as shown in the Figure. Over the entire cohort, APPS had a sensitivity of 85.4%, specificity of 53.3%, positive predictive value (PPV) of 1.5%, and a negative predictive value (NPV) of 99.8% when using a cutoff of 5. The average APPS calculation time was 0.03 seconds per encounter. Additional information on individual criteria can be found in Table 3.

DISCUSSION
Automated calculation of APPS using EHR data from prior encounters and the first 4 hours of admission was predictive of in-hospital VTE. APPS performed as well as traditional manual score calculation of the PPS. It was able to do so with no physician input, significantly lessening the burden of calculation and potentially increasing frequency of data-driven VTE risk assessment.
While automated calculation of certain scores is becoming more common, risk calculators that require data beyond vital signs and lab results have lagged,16-19 in part because of uncertainty about 2 issues. The first is whether EHR data accurately represent the current clinical picture. The second is if a machine-interpretable algorithm to determine a clinical status (eg, “active cancer”) would be similar to a doctor’s perception of that same concept. We attempted to better understand these 2 challenges through developing APPS. Concerning accuracy, EHR data correctly represent the clinical scenario: designations of VTEP and hospital-acquired VTE were accurate in approximately 90% of reviewed cases. Regarding the second concern, when comparing APPS to manual calculation, we found significant differences (P < 0.001) in how often 8 of the 11 criteria were positive, yet no significant difference in overall score and similar predictive capacity. Manual calculation appeared more likely to find data in the index encounter or in structured data. For example, “active cancer” may be documented only in a physician’s note, easily accounted for during a physician’s calculation but missed by APPS looking only for structured data. In contrast, automated calculation found historic criteria, such as “prior VTE” or “known thrombophilic condition,” positive more often. If the patient is being admitted for a problem unrelated to blood clots, the physician may have little time or interest to look through hundreds of EHR documents to discover a 2-year-old VTE. As patients’ records become larger and denser, more historic data can become buried and forgotten. While the 2 scores differ on individual criteria, they are similarly predictive and able to bifurcate the at-risk population to those who should and should not receive pharmacologic prophylaxis.

The APPS was found to have near-equal performance in the pharmacologic vs. no pharmacologic prophylaxis cohorts. This finding agrees with a study that found no significant difference in predicting 90-day VTE when looking at 86 risk factors vs. the most significant 4, none of which related to prescribed prophylaxis.18 The original PPS had a reported sensitivity of 94.6%, specificity 62%, PPV 7.5%, and NPV 99.7% in its derivation cohort.13 We matched APPS to the ratio of sensitivity to specificity, using 5 as the cutoff value. APPS performed slightly worse with sensitivity of 85.4%, specificity 53.3%, PPV 1.5%, and NPV 99.8%. This difference may have resulted from the original PPS study’s use of 90-day follow-up to determine VTE occurrence, whereas we looked only until the end of current hospitalization, an average of 9.2 days. Furthermore, the PPS had significantly poorer performance (AUC = 0.62) than that seen in the original derivation cohort in a separate study that manually calculated the score on more than 1000 patients.15
There are important limitations to our study. It was done at a single academic institution using a dataset of VTE-associated, validated research that was well-known to the researchers.20 Another major limitation is the dependence of the algorithm on data available within the first 4 hours of admission and earlier; thus, previous encounters may frequently play an important role. Patients presenting to our health system for the first time would have significantly fewer data available at the time of calculation. Additionally, our data could not reliably tell us the total doses of pharmacologic prophylaxis that a patient received. While most patients will maintain a consistent VTEP regimen once initiated in the hospital, 2 patients with the same LOS may have received differing amounts of pharmacologic prophylaxis. This research study did not assess how much time automatic calculation of VTE risk might save providers, because we did not record the time for each manual abstraction; however, from discussion with the main abstracter, chart review and manual calculation for this study took from 2 to 14 minutes per patient, depending on the number of previous interactions with the health system. Finally, although we chose data elements that are likely to exist at most institutions using an EHR, many institutions’ EHRs do not have EDW capabilities nor programmers who can assist with an automated risk score.
The EHR interventions to assist providers in determining appropriate VTEP have been able to increase rates of VTEP and decrease VTE-associated mortality.16,21 In addition to automating the calculation of guideline-adherent risk scores, there is a need for wider adoption for clinical decision support for VTE. For this reason, we chose only structured data fields from some of the most common elements within our EHR’s data warehouse to derive APPS (Appendix 1). Our study supports the idea that automated calculation of scores requiring input of more complex data such as diagnoses, recent medical events, and current clinical status remains predictive of hospital-acquired VTE risk. Because it is calculated automatically in the background while the clinician completes his or her assessment, the APPS holds the potential to significantly reduce the burden on providers while making guideline-adherent risk assessment more readily accessible. Further research is required to determine the exact amount of time automatic calculation saves, and, more important, if the relatively high predictive capacity we observed using APPS would be reproducible across institutions and could reduce incidence of hospital-acquired VTE.
Disclosures
Dr. Auerbach was supported by NHLBI K24HL098372 during the period of this study. Dr. Khanna, who is an implementation scientist at the University of California San Francisco Center for Digital Health Innovation, is the principal inventor of CareWeb, and may benefit financially from its commercialization. The other authors report no financial conflicts of interest.
1. Galson S. The Surgeon General’s call to action to prevent deep vein thrombosis and pulmonary embolism. 2008. https://www.ncbi.nlm.nih.gov/books/NBK44178/. Accessed February 11, 2016. PubMed
2. Borch KH, Nyegaard C, Hansen JB, et al. Joint effects of obesity and body height on the risk of venous thromboembolism: the Tromsø study. Arterioscler Thromb Vasc Biol. 2011;31(6):1439-44. PubMed
3. Braekkan SK, Borch KH, Mathiesen EB, Njølstad I, Wilsgaard T, Hansen JB.. Body height and risk of venous thromboembolism: the Tromsø Study. Am J Epidemiol. 2010;171(10):1109-1115. PubMed
4. Bounameaux H, Rosendaal FR. Venous thromboembolism: why does ethnicity matter? Circulation. 2011;123(200:2189-2191. PubMed
5. Spyropoulos AC, Anderson FA Jr, Fitzgerald G, et al; IMPROVE Investigators. Predictive and associative models to identify hospitalized medical patients at risk for VTE. Chest. 2011;140(3):706-714. PubMed
6. Rothberg MB, Lindenauer PK, Lahti M, Pekow PS, Selker HP. Risk factor model to predict venous thromboembolism in hospitalized medical patients. J Hosp Med. 2011;6(4):202-209. PubMed
7. Perioperative Management of Antithrombotic Therapy: Prevention of VTE in Nonsurgical Patients: Antithrombotic Therapy and Prevention of Thrombosis, 9th ed: American College of Chest Physicians Evidence-Based Clinical Practice Guidelines. Chest. 2012;141(6):1645.
8. Subbe CP, Kruger M, Rutherford P, Gemmel L. Validation of a modified Early Warning Score in medical admissions. QJM. 2001;94(10):521-526. PubMed
9. Alvarez CA, Clark CA, Zhang S, et al. Predicting out of intensive care unit cardiopulmonary arrest or death using electronic medical record data. BMC Med Inform Decis Mak. 2013;13:28. PubMed
10. Escobar GJ, LaGuardia JC, Turk BJ, Ragins A, Kipnis P, Draper D. Early detection of impending physiologic deterioration among patients who are not in intensive care: development of predictive models using data from an automated electronic medical record. J Hosp Med. 2012;7(5):388-395. PubMed
11. Umscheid CA, Hanish A, Chittams J, Weiner MG, Hecht TE. Effectiveness of a novel and scalable clinical decision support intervention to improve venous thromboembolism prophylaxis: a quasi-experimental study. BMC Med Inform Decis Mak. 2012;12:92. PubMed
12. Tepas JJ 3rd, Rimar JM, Hsiao AL, Nussbaum MS. Automated analysis of electronic medical record data reflects the pathophysiology of operative complications. Surgery. 2013;154(4):918-924. PubMed
13. Barbar S, Noventa F, Rossetto V, et al. A risk assessment model for the identification of hospitalized medical patients at risk for venous thromboembolism: the Padua Prediction Score. J Thromb Haemost. 2010; 8(11):2450-2457. PubMed
14. Khanna R, Maynard G, Sadeghi B, et al. Incidence of hospital-acquired venous thromboembolic codes in medical patients hospitalized in academic medical centers. J Hosp Med. 2014; 9(4):221-225. PubMed
15. Vardi M, Ghanem-Zoubi NO, Zidan R, Yurin V, Bitterman H. Venous thromboembolism and the utility of the Padua Prediction Score in patients with sepsis admitted to internal medicine departments. J Thromb Haemost. 2013;11(3):467-473. PubMed
16. Samama MM, Dahl OE, Mismetti P, et al. An electronic tool for venous thromboembolism prevention in medical and surgical patients. Haematologica. 2006;91(1):64-70. PubMed
17. Mann DM, Kannry JL, Edonyabo D, et al. Rationale, design, and implementation protocol of an electronic health record integrated clinical prediction rule (iCPR) randomized trial in primary care. Implement Sci. 2011;6:109. PubMed
18. Woller SC, Stevens SM, Jones JP, et al. Derivation and validation of a simple model to identify venous thromboembolism risk in medical patients. Am J Med. 2011;124(10):947-954. PubMed
19. Huang W, Anderson FA, Spencer FA, Gallus A, Goldberg RJ. Risk-assessment models for predicting venous thromboembolism among hospitalized non-surgical patients: a systematic review. J Thromb Thrombolysis. 2013;35(1):67-80. PubMed
20. Khanna RR, Kim SB, Jenkins I, et al. Predictive value of the present-on-admission indicator for hospital-acquired venous thromboembolism. Med Care. 2015;53(4):e31-e36. PubMed
21. Kucher N, Koo S, Quiroz R, et al. Electronic alerts to prevent venous thromboembolism a
Hospital-acquired venous thromboembolism (VTE) continues to be a critical quality challenge for U.S. hospitals,1 and high-risk patients are often not adequately prophylaxed. Use of VTE prophylaxis (VTEP) varies as widely as 26% to 85% of patients in various studies, as does patient outcomes and care expenditures.2-6 The 9th edition of the American College of Chest Physicians (CHEST) guidelines7 recommend the Padua Prediction Score (PPS) to select individual patients who may be at high risk for venous thromboembolism (VTE) and could benefit from thromboprophylaxis. Use of the manually calculated PPS to select patients for thromboprophylaxis has been shown to help decrease 30-day and 90-day mortality associated with VTE events after hospitalization to medical services.8 However, the PPS requires time-consuming manual calculation by a provider, who may be focused on more immediate aspects of patient care and several other risk scores competing for his attention, potentially decreasing its use.
Other risk scores that use only discrete scalar data, such as vital signs and lab results to predict early recognition of sepsis, have been successfully automated and implemented within electronic health records (EHRs).9-11 Successful automation of scores requiring input of diagnoses, recent medical events, and current clinical status such as the PPS remains difficult.12 Data representing these characteristics are more prone to error, and harder to translate clearly into a single data field than discrete elements like heart rate, potentially impacting validity of the calculated result.13 To improve usage of guideline based VTE risk assessment and decrease physician burden, we developed an algorithm called Automated Padua Prediction Score (APPS) that automatically calculates the PPS using only EHR data available within prior encounters and the first 4 hours of admission, a similar timeframe to when admitting providers would be entering orders. Our goal was to assess if an automatically calculated version of the PPS, a score that depends on criteria more complex than vital signs and labs, would accurately assess risk for hospital-acquired VTE when compared to traditional manual calculation of the Padua Prediction Score by a provider.
METHODS
Site Description and Ethics
The study was conducted at University of California, San Francisco Medical Center, a 790-bed academic hospital; its Institutional Review Board approved the study and collection of data via chart review. Handling of patient information complied with the Health Insurance Portability and Accountability Act of 1996.
Patient Inclusion
Adult patients admitted to a medical or surgical service between July 1, 2012 and April 1, 2014 were included in the study if they were candidates for VTEP, defined as: length of stay (LOS) greater than 2 days, not on hospice care, not pregnant at admission, no present on admission VTE diagnosis, no known contraindications to prophylaxis (eg, gastrointestinal bleed), and were not receiving therapeutic doses of warfarin, low molecular weight heparins, heparin, or novel anticoagulants prior to admission.
Data Sources
Clinical variables were extracted from the EHR’s enterprise data warehouse (EDW) by SQL Server query (Microsoft, Redmond, Washington) and deposited in a secure database. Chart review was conducted by a trained researcher (Mr. Jacolbia) using the EHR and a standardized protocol. Findings were recorded using REDCap (REDCap Consortium, Vanderbilt University, Nashville, Tennessee). The specific ICD-9, procedure, and lab codes used to determine each criterion of APPS are available in the Appendix.
Creation of the Automated Padua Prediction Score (APPS)
We developed APPS from the original 11 criteria that comprise the Padua Prediction Score: active cancer, previous VTE (excluding superficial vein thrombosis), reduced mobility, known thrombophilic condition, recent (1 month or less) trauma and/or surgery, age 70 years or older, heart and/or respiratory failure, acute myocardial infarction and/or ischemic stroke, acute infection and/or rheumatologic disorder, body mass index (BMI) 30 or higher, and ongoing hormonal treatment.13 APPS has the same scoring methodology as PPS: criteria are weighted from 1 to 3 points and summed with a maximum score of 20, representing highest risk of VTE. To automate the score calculation from data routinely available in the EHR, APPS checks pre-selected structured data fields for specific values within laboratory results, orders, nursing flowsheets and claims. Claims data included all ICD-9 and procedure codes used for billing purposes. If any of the predetermined data elements are found, then the specific criterion is considered positive; otherwise, it is scored as negative. The creators of the PPS were consulted in the generation of these data queries to replicate the original standards for deeming a criterion positive. The automated calculation required no use of natural language processing.
Characterization of Study Population
We recorded patient demographics (age, race, gender, BMI), LOS, and rate of hospital-acquired VTE. These patients were separated into 2 cohorts determined by the VTE prophylaxis they received. The risk profile of patients who received pharmacologic prophylaxis was hypothesized to be inherently different from those who had not. To evaluate APPS within this heterogeneous cohort, patients were divided into 2 major categories: pharmacologic vs. no pharmacologic prophylaxis. If they had a completed order or medication administration record on the institution’s approved formulary for pharmacologic VTEP, they were considered to have received pharmacologic prophylaxis. If they had only a completed order for usage of mechanical prophylaxis (sequential compression devices) or no evidence of any form of VTEP, they were considered to have received no pharmacologic prophylaxis. Patients with evidence of both pharmacologic and mechanical were placed in the pharmacologic prophylaxis group. To ensure that automated designation of prophylaxis group was accurate, we reviewed 40 randomly chosen charts because prior researchers were able to achieve sensitivity and specificity greater than 90% with that sample size.14
The primary outcome of hospital-acquired VTE was defined as an ICD-9 code for VTE (specific codes are found in the Appendix) paired with a “present on admission = no” flag on that encounter’s hospital billing data, abstracted from the EDW. A previous study at this institution used the same methodology and found 212/226 (94%) of patients with a VTE ICD-9 code on claim had evidence of a hospital-acquired VTE event upon chart review.14 Chart review was also completed to ensure that the primary outcome of newly discovered hospital-acquired VTE was differentiated from chronic VTE or history of VTE. Theoretically, ICD-9 codes and other data elements treat chronic VTE, history of VTE, and hospital-acquired VTE as distinct diagnoses, but it was unclear if this was true in our dataset. For 75 randomly selected cases of presumed hospital-acquired VTE, charts were reviewed for evidence that confirmed newly found VTE during that encounter.
Validation of APPS through Comparison to Manual Calculation of the Original PPS
To compare our automated calculation to standard clinical practice, we manually calculated the PPS through chart review within the first 2 days of admission on 300 random patients, a subsample of the entire study cohort. The largest study we could find had manually calculated the PPS of 1,080 hospitalized patients with a mean PPS of 4.86 (standard deviation [SD], 2.26).15 One researcher (Mr. Jacolbia) accessed the EHR with all patient information available to physicians, including admission notes, orders, labs, flowsheets, past medical history, and all prior encounters to calculate and record the PPS. To limit potential score bias, 2 authors (Drs. Elias and Davies) assessed 30 randomly selected charts from the cohort of 300. The standardized chart review protocol mimicked a physician’s approach to determine if a patient met a criterion, such as concluding if he/she had active cancer by examining medication lists for chemotherapy, procedure notes for radiation, and recent diagnoses on problem lists. After the original PPS was manually calculated, APPS was automatically calculated for the same 300 patients. We intended to characterize similarities and differences between APPS and manual calculation prior to investigating APPS’ predictive capacity for the entire study population, because it would not be feasible to manually calculate the PPS for all 30,726 patients.
Statistical Analysis
For the 75 randomly selected cases of presumed hospital-acquired VTE, the number of cases was chosen by powering our analysis to find a difference in proportion of 20% with 90% power, α = 0.05 (two-sided). We conducted χ2 tests on the entire study cohort to determine if there were significant differences in demographics, LOS, and incidence of hospital-acquired VTE by prophylaxis received. For both the pharmacologic and the no pharmacologic prophylaxis groups, we conducted 2-sample Student t tests to determine significant differences in demographics and LOS between patients who experienced a hospital-acquired VTE and those who did not.
For the comparison of our automated calculation to standard clinical practice, we manually calculated the PPS through chart review within the first 2 days of admission on a subsample of 300 random patients. We powered our analysis to detect a difference in mean PPS from 4.86 to 4.36, enough to alter the point value, with 90% power and α = 0.05 (two-sided) and found 300 patients to be comfortably above the required sample size. We compared APPS and manual calculation in the 300-patient cohort using: 2-sample Student t tests to compare mean scores, χ2 tests to compare the frequency with which criteria were positive, and receiver operating characteristic (ROC) curves to determine capacity to predict a hospital-acquired VTE event. Pearson’s correlation was also completed to assess score agreement between APPS and manual calculation on a per-patient basis. After comparing automated calculation of APPS to manual chart review on the same 300 patients, we used APPS to calculate scores for the entire study cohort (n = 30,726). We calculated the mean of APPS by prophylaxis group and whether hospital-acquired VTE had occurred. We analyzed APPS’ ROC curve statistics by prophylaxis group to determine its overall predictive capacity in our study population. Lastly, we computed the time required to calculate APPS per patient. Statistical analyses were conducted using SPSS Statistics (IBM, Armonk, New York) and Python 2.7 (Python Software Foundation, Beaverton, Oregon); 95% confidence intervals (CI) and (SD) were reported when appropriate.
RESULTS
Among the 30,726 unique patients in our entire cohort (all patients admitted during the time period who met the study criteria), we found 6574 (21.4%) on pharmacologic (with or without mechanical) prophylaxis, 13,511 (44.0%) on mechanical only, and 10,641 (34.6%) on no prophylaxis. χ2 tests found no significant differences in demographics, LOS, or incidence of hospital-acquired VTE between the patients who received mechanical prophylaxis only and those who received no prophylaxis (Table 1). Similarly, there were no differences in these characteristics in patients receiving pharmacologic prophylaxis with or without the addition of mechanical prophylaxis. Designation of prophylaxis group by manual chart review vs. our automated process was found to agree in categorization for 39/40 (97.5%) sampled encounters. When comparing the cohort that received pharmacologic prophylaxis against the cohort that did not, there were significant differences in racial distribution, sex, BMI, and average LOS as shown in Table 1. Those who received pharmacologic prophylaxis were found to be significantly older than those who did not (62.7 years versus 53.2 years, P < 0.001), more likely to be male (50.6% vs, 42.4%, P < 0.001), more likely to have hospital-acquired VTE (2.2% vs. 0.5%, P < 0.001), and to have a shorter LOS (7.1 days vs. 9.8, P < 0.001).
Within the cohort group receiving pharmacologic prophylaxis (n = 6574), hospital-acquired VTE occurred in patients who were significantly younger (58.2 years vs. 62.8 years, P = 0.003) with a greater LOS (23.8 days vs. 6.7, P < 0.001) than those without. Within the group receiving no pharmacologic prophylaxis (n = 24,152), hospital-acquired VTE occurred in patients who were significantly older (57.1 years vs. 53.2 years, P = 0.014) with more than twice the LOS (20.2 days vs. 9.7 days, P < 0.001) compared to those without. Sixty-six of 75 (88%) randomly selected patients in which new VTE was identified by the automated electronic query had this diagnosis confirmed during manual chart review.
As shown in Table 2, automated calculation on a subsample of 300 randomly selected patients using APPS had a mean of 5.5 (SD, 2.9) while manual calculation of the original PPS on the same patients had a mean of 5.1 (SD, 2.6). There was no significant difference in mean between manual calculation and APPS (P = 0.073). There were, however, significant differences in how often individual criteria were considered present. The largest contributors to the difference in scores between APPS and manual calculation were “prior VTE” (positive, 16% vs. 8.3%, respectively) and “reduced mobility” (positive, 74.3% vs. 66%, respectively) as shown in Table 2. In the subsample, there were a total of 6 (2.0%) hospital-acquired VTE events. APPS’ automated calculation had an AUC = 0.79 (CI, 0.63-0.95) that was significant (P = 0.016) with a cutoff value of 5. Chart review’s manual calculation of the PPS had an AUC = 0.76 (CI 0.61-0.91) that was also significant (P = 0.029).
Distribution of Patient Characteristics in Cohort
Our entire cohort of 30,726 unique patients admitted during the study period included 260 (0.8%) who experienced hospital-acquired VTEs (Table 3). In patients receiving no pharmacologic prophylaxis, the average APPS was 4.0 (SD, 2.4) for those without VTE and 7.1 (SD, 2.3) for those with VTE. In patients who had received pharmacologic prophylaxis, those without hospital-acquired VTE had an average APPS of 4.9 (SD, 2.6) and those with hospital-acquired VTE averaged 7.7 (SD, 2.6). APPS’ ROC curves for “no pharmacologic prophylaxis” had an AUC = 0.81 (CI, 0.79 – 0.83) that was significant (P < 0.001) with a cutoff value of 5. There was similar performance in the pharmacologic prophylaxis group with an AUC = 0.79 (CI, 0.76 – 0.82) and cutoff value of 5, as shown in the Figure. Over the entire cohort, APPS had a sensitivity of 85.4%, specificity of 53.3%, positive predictive value (PPV) of 1.5%, and a negative predictive value (NPV) of 99.8% when using a cutoff of 5. The average APPS calculation time was 0.03 seconds per encounter. Additional information on individual criteria can be found in Table 3.
DISCUSSION
Automated calculation of APPS using EHR data from prior encounters and the first 4 hours of admission was predictive of in-hospital VTE. APPS performed as well as traditional manual score calculation of the PPS. It was able to do so with no physician input, significantly lessening the burden of calculation and potentially increasing frequency of data-driven VTE risk assessment.
While automated calculation of certain scores is becoming more common, risk calculators that require data beyond vital signs and lab results have lagged,16-19 in part because of uncertainty about 2 issues. The first is whether EHR data accurately represent the current clinical picture. The second is if a machine-interpretable algorithm to determine a clinical status (eg, “active cancer”) would be similar to a doctor’s perception of that same concept. We attempted to better understand these 2 challenges through developing APPS. Concerning accuracy, EHR data correctly represent the clinical scenario: designations of VTEP and hospital-acquired VTE were accurate in approximately 90% of reviewed cases. Regarding the second concern, when comparing APPS to manual calculation, we found significant differences (P < 0.001) in how often 8 of the 11 criteria were positive, yet no significant difference in overall score and similar predictive capacity. Manual calculation appeared more likely to find data in the index encounter or in structured data. For example, “active cancer” may be documented only in a physician’s note, easily accounted for during a physician’s calculation but missed by APPS looking only for structured data. In contrast, automated calculation found historic criteria, such as “prior VTE” or “known thrombophilic condition,” positive more often. If the patient is being admitted for a problem unrelated to blood clots, the physician may have little time or interest to look through hundreds of EHR documents to discover a 2-year-old VTE. As patients’ records become larger and denser, more historic data can become buried and forgotten. While the 2 scores differ on individual criteria, they are similarly predictive and able to bifurcate the at-risk population to those who should and should not receive pharmacologic prophylaxis.
The APPS was found to have near-equal performance in the pharmacologic vs. no pharmacologic prophylaxis cohorts. This finding agrees with a study that found no significant difference in predicting 90-day VTE when looking at 86 risk factors vs. the most significant 4, none of which related to prescribed prophylaxis.18 The original PPS had a reported sensitivity of 94.6%, specificity 62%, PPV 7.5%, and NPV 99.7% in its derivation cohort.13 We matched APPS to the ratio of sensitivity to specificity, using 5 as the cutoff value. APPS performed slightly worse with sensitivity of 85.4%, specificity 53.3%, PPV 1.5%, and NPV 99.8%. This difference may have resulted from the original PPS study’s use of 90-day follow-up to determine VTE occurrence, whereas we looked only until the end of current hospitalization, an average of 9.2 days. Furthermore, the PPS had significantly poorer performance (AUC = 0.62) than that seen in the original derivation cohort in a separate study that manually calculated the score on more than 1000 patients.15
There are important limitations to our study. It was done at a single academic institution using a dataset of VTE-associated, validated research that was well-known to the researchers.20 Another major limitation is the dependence of the algorithm on data available within the first 4 hours of admission and earlier; thus, previous encounters may frequently play an important role. Patients presenting to our health system for the first time would have significantly fewer data available at the time of calculation. Additionally, our data could not reliably tell us the total doses of pharmacologic prophylaxis that a patient received. While most patients will maintain a consistent VTEP regimen once initiated in the hospital, 2 patients with the same LOS may have received differing amounts of pharmacologic prophylaxis. This research study did not assess how much time automatic calculation of VTE risk might save providers, because we did not record the time for each manual abstraction; however, from discussion with the main abstracter, chart review and manual calculation for this study took from 2 to 14 minutes per patient, depending on the number of previous interactions with the health system. Finally, although we chose data elements that are likely to exist at most institutions using an EHR, many institutions’ EHRs do not have EDW capabilities nor programmers who can assist with an automated risk score.
The EHR interventions to assist providers in determining appropriate VTEP have been able to increase rates of VTEP and decrease VTE-associated mortality.16,21 In addition to automating the calculation of guideline-adherent risk scores, there is a need for wider adoption for clinical decision support for VTE. For this reason, we chose only structured data fields from some of the most common elements within our EHR’s data warehouse to derive APPS (Appendix 1). Our study supports the idea that automated calculation of scores requiring input of more complex data such as diagnoses, recent medical events, and current clinical status remains predictive of hospital-acquired VTE risk. Because it is calculated automatically in the background while the clinician completes his or her assessment, the APPS holds the potential to significantly reduce the burden on providers while making guideline-adherent risk assessment more readily accessible. Further research is required to determine the exact amount of time automatic calculation saves, and, more important, if the relatively high predictive capacity we observed using APPS would be reproducible across institutions and could reduce incidence of hospital-acquired VTE.
Disclosures
Dr. Auerbach was supported by NHLBI K24HL098372 during the period of this study. Dr. Khanna, who is an implementation scientist at the University of California San Francisco Center for Digital Health Innovation, is the principal inventor of CareWeb, and may benefit financially from its commercialization. The other authors report no financial conflicts of interest.
1. Galson S. The Surgeon General’s call to action to prevent deep vein thrombosis and pulmonary embolism. 2008. https://www.ncbi.nlm.nih.gov/books/NBK44178/. Accessed February 11, 2016. PubMed
2. Borch KH, Nyegaard C, Hansen JB, et al. Joint effects of obesity and body height on the risk of venous thromboembolism: the Tromsø study. Arterioscler Thromb Vasc Biol. 2011;31(6):1439-44. PubMed
3. Braekkan SK, Borch KH, Mathiesen EB, Njølstad I, Wilsgaard T, Hansen JB.. Body height and risk of venous thromboembolism: the Tromsø Study. Am J Epidemiol. 2010;171(10):1109-1115. PubMed
4. Bounameaux H, Rosendaal FR. Venous thromboembolism: why does ethnicity matter? Circulation. 2011;123(200:2189-2191. PubMed
5. Spyropoulos AC, Anderson FA Jr, Fitzgerald G, et al; IMPROVE Investigators. Predictive and associative models to identify hospitalized medical patients at risk for VTE. Chest. 2011;140(3):706-714. PubMed
6. Rothberg MB, Lindenauer PK, Lahti M, Pekow PS, Selker HP. Risk factor model to predict venous thromboembolism in hospitalized medical patients. J Hosp Med. 2011;6(4):202-209. PubMed
7. Perioperative Management of Antithrombotic Therapy: Prevention of VTE in Nonsurgical Patients: Antithrombotic Therapy and Prevention of Thrombosis, 9th ed: American College of Chest Physicians Evidence-Based Clinical Practice Guidelines. Chest. 2012;141(6):1645.
8. Subbe CP, Kruger M, Rutherford P, Gemmel L. Validation of a modified Early Warning Score in medical admissions. QJM. 2001;94(10):521-526. PubMed
9. Alvarez CA, Clark CA, Zhang S, et al. Predicting out of intensive care unit cardiopulmonary arrest or death using electronic medical record data. BMC Med Inform Decis Mak. 2013;13:28. PubMed
10. Escobar GJ, LaGuardia JC, Turk BJ, Ragins A, Kipnis P, Draper D. Early detection of impending physiologic deterioration among patients who are not in intensive care: development of predictive models using data from an automated electronic medical record. J Hosp Med. 2012;7(5):388-395. PubMed
11. Umscheid CA, Hanish A, Chittams J, Weiner MG, Hecht TE. Effectiveness of a novel and scalable clinical decision support intervention to improve venous thromboembolism prophylaxis: a quasi-experimental study. BMC Med Inform Decis Mak. 2012;12:92. PubMed
12. Tepas JJ 3rd, Rimar JM, Hsiao AL, Nussbaum MS. Automated analysis of electronic medical record data reflects the pathophysiology of operative complications. Surgery. 2013;154(4):918-924. PubMed
13. Barbar S, Noventa F, Rossetto V, et al. A risk assessment model for the identification of hospitalized medical patients at risk for venous thromboembolism: the Padua Prediction Score. J Thromb Haemost. 2010; 8(11):2450-2457. PubMed
14. Khanna R, Maynard G, Sadeghi B, et al. Incidence of hospital-acquired venous thromboembolic codes in medical patients hospitalized in academic medical centers. J Hosp Med. 2014; 9(4):221-225. PubMed
15. Vardi M, Ghanem-Zoubi NO, Zidan R, Yurin V, Bitterman H. Venous thromboembolism and the utility of the Padua Prediction Score in patients with sepsis admitted to internal medicine departments. J Thromb Haemost. 2013;11(3):467-473. PubMed
16. Samama MM, Dahl OE, Mismetti P, et al. An electronic tool for venous thromboembolism prevention in medical and surgical patients. Haematologica. 2006;91(1):64-70. PubMed
17. Mann DM, Kannry JL, Edonyabo D, et al. Rationale, design, and implementation protocol of an electronic health record integrated clinical prediction rule (iCPR) randomized trial in primary care. Implement Sci. 2011;6:109. PubMed
18. Woller SC, Stevens SM, Jones JP, et al. Derivation and validation of a simple model to identify venous thromboembolism risk in medical patients. Am J Med. 2011;124(10):947-954. PubMed
19. Huang W, Anderson FA, Spencer FA, Gallus A, Goldberg RJ. Risk-assessment models for predicting venous thromboembolism among hospitalized non-surgical patients: a systematic review. J Thromb Thrombolysis. 2013;35(1):67-80. PubMed
20. Khanna RR, Kim SB, Jenkins I, et al. Predictive value of the present-on-admission indicator for hospital-acquired venous thromboembolism. Med Care. 2015;53(4):e31-e36. PubMed
21. Kucher N, Koo S, Quiroz R, et al. Electronic alerts to prevent venous thromboembolism a
© 2017 Society of Hospital Medicine
Introducing Choosing Wisely®
In this issue of the Journal of Hospital Medicine, we introduce a new recurring feature, Choosing Wisely: Next Steps in Improving Healthcare Value, sponsored by the American Board of Internal Medicine Foundation. The Choosing Wisely campaign is a collaborative initiative led by the American Board of Internal Medicine Foundation, in which specialty societies develop priority lists of activities that physicians should question doing routinely. The program has been broadly embraced by both patient and provider stakeholder groups. More than 35 specialty societies have contributed 26 published lists, including the Society of Hospital Medicine, which published 2 lists, 1 for adults and 1 for pediatrics. These included suggestions such as avoiding urinary catheters for convenience or monitoring of output, avoiding stress ulcer prophylaxis for low‐ to medium‐risk patients, and avoiding routine daily laboratory testing in clinically stable patients. A recent study estimated that up to $5 billion might be saved if just the primary care‐related recommendations were implemented.[1]
THE NEED FOR CHANGE
The Choosing Wisely campaign has so far focused primarily on identifying individual treatments that are not beneficial and potentially harmful to patients. At the Journal of Hospital Medicine, we believe the discipline of hospital medicine is well‐positioned to advance the broader discussion about achieving the triple aim: better healthcare, better health, and better value. Inpatient care represents only 7% of US healthcare encounters but 29% of healthcare expenditures (over $375 billion annually).[2] Patients aged 65 years and over account for 41% of all hospital costs and 34% of all hospital stays. Accordingly, without a change in current utilization patterns, the aging of the baby boomer generation will have a marked impact on expenditures for hospital care. Healthcare costs are increasingly edging out discretionary federal and municipal spending on critical services such as education and scientific research. Historically, federal discretionary spending has averaged 8.3% of gross domestic product (GDP). In 2014, it dropped to 7.2% and is projected to decline to 5.1% in 2024. By comparison, federal spending for Medicare, Medicaid, and health insurance subsidies was 2.1% in 1990[3] but in 2014 is estimated at 4.8% of GDP, rising to 5.7% by 2024.[4]
In conjunction with the deleterious consequences of unchecked growth in healthcare costs on national fiscal health, hospitals are feeling intense and increasing pressure to improve quality and value. In fiscal year 2015, hospitals will be at risk for up to 5.5% of Medicare payments under the parameters of the Hospital Readmission Reduction Program (maximum penalty 3% of base diagnosis‐related group [DRG] payments), Value‐Based Purchasing (maximum withholding 1.5% of base DRG payments), and the Hospital Acquired Conditions Program (maximum penalty 1% of all payments). Simultaneously, long‐standing subsidies are being phased out, including payments to teaching hospitals or for disproportionate share of care delivered to uninsured populations. The challenge for hospital medicine will be to take a leadership role in defining national priorities for change, organizing and guiding a pivot toward lower‐intensity care settings and services, and most importantly, promoting innovation in hospital‐based healthcare delivery.
EXISTING INNOVATIONS
The passage of the Affordable Care Act gave the Centers for Medicare & Medicaid Services (CMS) a platform for spurring innovation in healthcare delivery. In addition to deploying the payment penalty programs described above, the CMS Center for Medicare & Medicaid Innovation has a $10 billion budget to test alternate models of care. Demonstration projects to date include Accountable Care Organization pilots (ACOs, encouraging hospitals to join with community clinicians to provide integrated and coordinated care), the Bundled Payment program (paying providers a lump fee for an extended episode of care rather than service volume), a Comprehensive End Stage Renal Disease Care Initiative, and a variety of other tests of novel delivery and payment models that directly involve hospital medicine.[5] Private insurers are following suit, with an increasing proportion of hospital contracts involving shared savings or risk.
Hospitals are already responding to this new era of cost sharing and cross‐continuum accountability in a variety of creative ways. The University of Utah has developed an award‐winning cost accounting system that integrates highly detailed patient‐level cost data with clinical information to create a value‐driven outcomes tool that enables the hospital to consider costs as they relate to the results of care delivery. In this way, the hospital can justify maintaining high cost/better outcome activities, while targeting high cost/worse outcome practices for improvement.[6] Boston Children's Hospital is leading a group of healthcare systems in the development and application of a series of Standardized Clinical Assessment and Management Plans (SCAMPs), designed to improve patient care while decreasing unnecessary utilization (particularly in cases where existing evidence or guidelines are insufficient or outdated). Unlike traditional clinical care pathways or clinical guidelines, SCAMPs are developed iteratively based on actual internal practices, especially deviations from the standard plan, and their relationship to outcomes.[7, 8]
Local innovations, however, are of limited national importance in bending the cost curve unless broadly disseminated. The last decade has brought a new degree of cross‐institution collaboration to hospital care. Regional consortiums to improve care have existed for years, often prompted by CMS‐funded quality improvement organizations and demonstration projects.[9, 10] CMS's Partnership for Patients program has aimed to reduce hospital‐acquired conditions and readmissions by enrolling hospitals in 26 regional Hospital Engagement Networks.[11] Increasingly, however, hospitals are voluntarily engaging in collaboratives to improve the quality and value of their care. Over 500 US hospitals participate in the American College of Surgeons National Surgical Quality Improvement Program to improve surgical outcomes, nearly 1000 joined the Door‐to‐Balloon Alliance to improve percutaneous catheterization outcomes, and over 1000 joined the Hospital2Home collaborative to improve care transitions.[12, 13, 14] In 2008, the Premier hospital alliance formed QUEST (Quality, Efficiency, Safety and Transparency), a collaborative of approximately 350 members committed to improving a wide range of outcomes, from cost and efficiency to safety and mortality. Most recently, the High Value Healthcare Collaborative was formed, encompassing 19 large healthcare delivery organizations and over 70 million patients, with the central objective of creating a true learning healthcare system. In principle, these boundary‐spanning collaboratives should accelerate change nationally and serve as transformational agents. In practice, outcomes from these efforts have been variable, largely depending on the degree to which hospitals are able to share data, evaluate outcomes, and identify generalizable improvement interventions that can be reliably adopted.
Last, the focus of hospital care has already begun to extend beyond inpatient care. Hospitals already care for more outpatients than they do inpatients, and that trend is expected to continue. In 2012, hospitals treated 34.4 million inpatient admissions, but cared for nearly 675 million outpatient visits, only a fraction of which were emergency department visits or observation stays. From 2011 to 2012, outpatient visits to hospitals increased 2.9%, whereas inpatient admissions declined 1.2%.[15] Hospitals are buying up outpatient practices, creating infusion centers to provide intravenous‐based therapy to outpatients, establishing postdischarge clinics to transition their discharged patients, chartering their own visiting nurse agencies, and testing a host of other outpatient‐focused activities. Combined with an enhanced focus on postacute transitions following an inpatient admission as part of the care continuum, this broadening reach of hospital medicine brings a host of new opportunities for innovation in care delivery and payment models.
CHOOSING WISELY: NEXT STEPS IN IMPROVING HEALTHCARE VALUE
This series will consider a wide range of ways in which hospital medicine can help drive improvements in healthcare value, both from a conceptual standpoint (what to do and why?), as well as demonstration of practical application of these principles (how?). A companion series, Choosing Wisely: Things We Do For No Reason, will focus more explicitly on services such as blood transfusions or diagnostic tests such as creatinine kinase that are commonly overutilized. Example topics of interest for Next Steps include:
- Best methodologies for improvement science in hospital settings, including Lean healthcare, behavioral economics, human factors engineering
- Strategies for reconciling system‐level standardization with the delivery of personalized, patient‐centered care
- Impacts of national policies on hospital‐based improvement efforts: how do ACOs, bundled payments, and medical homes alter hospital practice?
- Reports on creative new ideas to help achieve value: changes in clinical workflow or care pathways, radical physical plant redesign, electronic medical record innovations, payment incentives, provider accountability and more
- Results of models that move the reach of hospital medicine beyond the walls as an integrated part of the care continuum.
We welcome unsolicited proposals for series topics submitted as a 500‐word precis to: nextsteps@hospitalmedicine.org.
Disclosures
Choosing Wisely: Next Steps in Improving Healthcare Value is sponsored by the American Board of Internal Medicine Foundation. Dr. Horwitz is supported by the National Institute on Aging (K08 AG038336) and by the American Federation for Aging Research through the Paul B. Beeson Career Development Award Program. The authors report no conflicts of interest.
- , , , . “Top 5” lists top $5 billion. Arch Intern Med. 2011;171(20):1858–1859.
- Healthcare Cost and Utilization Project. Statistical brief #146. Available at: http://www.hcup‐us.ahrq.gov/reports/statbriefs/sb146.pdf. Published January 2013. Accessed October 18, 2014.
- Centers for Medicare 32(5):911–920.
- Institute for Relevant Clinical Data Analytics, Inc. Relevant clinical data analytics I. SCAMPs mission statement. 2014. Available at: http://www.scamps.org/index.htm. Accessed October 18, 2014.
- , , , . The long‐term effect of premier pay for performance on patient outcomes. N Engl J Med. 2012;366(17):1606–1615.
- . Effects of the Premier Hospital Quality Incentive Demonstration on Medicare patient mortality and cost. Health Serv Res. 2009;44(3):821–842.
- Centers for Medicare 1(1):97–104.
- American College of Cardiology. Quality Improvement for Institutions. Hospital to home. 2014. Available at: http://cvquality.acc.org/Initiatives/H2H.aspx. Accessed October 19, 2014.
- American College of Surgeons. National Surgical Quality Improvement Program. 2014. Available at: http://site.acsnsqip.org/. Accessed October 19, 2014.
- . Hospitals on the rebound, show stronger operating margins. Modern Healthcare website. Available at: http://www. modernhealthcare.com/article/20140103/NEWS/301039973. Published January 3, 2014. Accessed October 18, 2014.
In this issue of the Journal of Hospital Medicine, we introduce a new recurring feature, Choosing Wisely: Next Steps in Improving Healthcare Value, sponsored by the American Board of Internal Medicine Foundation. The Choosing Wisely campaign is a collaborative initiative led by the American Board of Internal Medicine Foundation, in which specialty societies develop priority lists of activities that physicians should question doing routinely. The program has been broadly embraced by both patient and provider stakeholder groups. More than 35 specialty societies have contributed 26 published lists, including the Society of Hospital Medicine, which published 2 lists, 1 for adults and 1 for pediatrics. These included suggestions such as avoiding urinary catheters for convenience or monitoring of output, avoiding stress ulcer prophylaxis for low‐ to medium‐risk patients, and avoiding routine daily laboratory testing in clinically stable patients. A recent study estimated that up to $5 billion might be saved if just the primary care‐related recommendations were implemented.[1]
THE NEED FOR CHANGE
The Choosing Wisely campaign has so far focused primarily on identifying individual treatments that are not beneficial and potentially harmful to patients. At the Journal of Hospital Medicine, we believe the discipline of hospital medicine is well‐positioned to advance the broader discussion about achieving the triple aim: better healthcare, better health, and better value. Inpatient care represents only 7% of US healthcare encounters but 29% of healthcare expenditures (over $375 billion annually).[2] Patients aged 65 years and over account for 41% of all hospital costs and 34% of all hospital stays. Accordingly, without a change in current utilization patterns, the aging of the baby boomer generation will have a marked impact on expenditures for hospital care. Healthcare costs are increasingly edging out discretionary federal and municipal spending on critical services such as education and scientific research. Historically, federal discretionary spending has averaged 8.3% of gross domestic product (GDP). In 2014, it dropped to 7.2% and is projected to decline to 5.1% in 2024. By comparison, federal spending for Medicare, Medicaid, and health insurance subsidies was 2.1% in 1990[3] but in 2014 is estimated at 4.8% of GDP, rising to 5.7% by 2024.[4]
In conjunction with the deleterious consequences of unchecked growth in healthcare costs on national fiscal health, hospitals are feeling intense and increasing pressure to improve quality and value. In fiscal year 2015, hospitals will be at risk for up to 5.5% of Medicare payments under the parameters of the Hospital Readmission Reduction Program (maximum penalty 3% of base diagnosis‐related group [DRG] payments), Value‐Based Purchasing (maximum withholding 1.5% of base DRG payments), and the Hospital Acquired Conditions Program (maximum penalty 1% of all payments). Simultaneously, long‐standing subsidies are being phased out, including payments to teaching hospitals or for disproportionate share of care delivered to uninsured populations. The challenge for hospital medicine will be to take a leadership role in defining national priorities for change, organizing and guiding a pivot toward lower‐intensity care settings and services, and most importantly, promoting innovation in hospital‐based healthcare delivery.
EXISTING INNOVATIONS
The passage of the Affordable Care Act gave the Centers for Medicare & Medicaid Services (CMS) a platform for spurring innovation in healthcare delivery. In addition to deploying the payment penalty programs described above, the CMS Center for Medicare & Medicaid Innovation has a $10 billion budget to test alternate models of care. Demonstration projects to date include Accountable Care Organization pilots (ACOs, encouraging hospitals to join with community clinicians to provide integrated and coordinated care), the Bundled Payment program (paying providers a lump fee for an extended episode of care rather than service volume), a Comprehensive End Stage Renal Disease Care Initiative, and a variety of other tests of novel delivery and payment models that directly involve hospital medicine.[5] Private insurers are following suit, with an increasing proportion of hospital contracts involving shared savings or risk.
Hospitals are already responding to this new era of cost sharing and cross‐continuum accountability in a variety of creative ways. The University of Utah has developed an award‐winning cost accounting system that integrates highly detailed patient‐level cost data with clinical information to create a value‐driven outcomes tool that enables the hospital to consider costs as they relate to the results of care delivery. In this way, the hospital can justify maintaining high cost/better outcome activities, while targeting high cost/worse outcome practices for improvement.[6] Boston Children's Hospital is leading a group of healthcare systems in the development and application of a series of Standardized Clinical Assessment and Management Plans (SCAMPs), designed to improve patient care while decreasing unnecessary utilization (particularly in cases where existing evidence or guidelines are insufficient or outdated). Unlike traditional clinical care pathways or clinical guidelines, SCAMPs are developed iteratively based on actual internal practices, especially deviations from the standard plan, and their relationship to outcomes.[7, 8]
Local innovations, however, are of limited national importance in bending the cost curve unless broadly disseminated. The last decade has brought a new degree of cross‐institution collaboration to hospital care. Regional consortiums to improve care have existed for years, often prompted by CMS‐funded quality improvement organizations and demonstration projects.[9, 10] CMS's Partnership for Patients program has aimed to reduce hospital‐acquired conditions and readmissions by enrolling hospitals in 26 regional Hospital Engagement Networks.[11] Increasingly, however, hospitals are voluntarily engaging in collaboratives to improve the quality and value of their care. Over 500 US hospitals participate in the American College of Surgeons National Surgical Quality Improvement Program to improve surgical outcomes, nearly 1000 joined the Door‐to‐Balloon Alliance to improve percutaneous catheterization outcomes, and over 1000 joined the Hospital2Home collaborative to improve care transitions.[12, 13, 14] In 2008, the Premier hospital alliance formed QUEST (Quality, Efficiency, Safety and Transparency), a collaborative of approximately 350 members committed to improving a wide range of outcomes, from cost and efficiency to safety and mortality. Most recently, the High Value Healthcare Collaborative was formed, encompassing 19 large healthcare delivery organizations and over 70 million patients, with the central objective of creating a true learning healthcare system. In principle, these boundary‐spanning collaboratives should accelerate change nationally and serve as transformational agents. In practice, outcomes from these efforts have been variable, largely depending on the degree to which hospitals are able to share data, evaluate outcomes, and identify generalizable improvement interventions that can be reliably adopted.
Last, the focus of hospital care has already begun to extend beyond inpatient care. Hospitals already care for more outpatients than they do inpatients, and that trend is expected to continue. In 2012, hospitals treated 34.4 million inpatient admissions, but cared for nearly 675 million outpatient visits, only a fraction of which were emergency department visits or observation stays. From 2011 to 2012, outpatient visits to hospitals increased 2.9%, whereas inpatient admissions declined 1.2%.[15] Hospitals are buying up outpatient practices, creating infusion centers to provide intravenous‐based therapy to outpatients, establishing postdischarge clinics to transition their discharged patients, chartering their own visiting nurse agencies, and testing a host of other outpatient‐focused activities. Combined with an enhanced focus on postacute transitions following an inpatient admission as part of the care continuum, this broadening reach of hospital medicine brings a host of new opportunities for innovation in care delivery and payment models.
CHOOSING WISELY: NEXT STEPS IN IMPROVING HEALTHCARE VALUE
This series will consider a wide range of ways in which hospital medicine can help drive improvements in healthcare value, both from a conceptual standpoint (what to do and why?), as well as demonstration of practical application of these principles (how?). A companion series, Choosing Wisely: Things We Do For No Reason, will focus more explicitly on services such as blood transfusions or diagnostic tests such as creatinine kinase that are commonly overutilized. Example topics of interest for Next Steps include:
- Best methodologies for improvement science in hospital settings, including Lean healthcare, behavioral economics, human factors engineering
- Strategies for reconciling system‐level standardization with the delivery of personalized, patient‐centered care
- Impacts of national policies on hospital‐based improvement efforts: how do ACOs, bundled payments, and medical homes alter hospital practice?
- Reports on creative new ideas to help achieve value: changes in clinical workflow or care pathways, radical physical plant redesign, electronic medical record innovations, payment incentives, provider accountability and more
- Results of models that move the reach of hospital medicine beyond the walls as an integrated part of the care continuum.
We welcome unsolicited proposals for series topics submitted as a 500‐word precis to: nextsteps@hospitalmedicine.org.
Disclosures
Choosing Wisely: Next Steps in Improving Healthcare Value is sponsored by the American Board of Internal Medicine Foundation. Dr. Horwitz is supported by the National Institute on Aging (K08 AG038336) and by the American Federation for Aging Research through the Paul B. Beeson Career Development Award Program. The authors report no conflicts of interest.
- , , , . “Top 5” lists top $5 billion. Arch Intern Med. 2011;171(20):1858–1859.
- Healthcare Cost and Utilization Project. Statistical brief #146. Available at: http://www.hcup‐us.ahrq.gov/reports/statbriefs/sb146.pdf. Published January 2013. Accessed October 18, 2014.
- Centers for Medicare 32(5):911–920.
- Institute for Relevant Clinical Data Analytics, Inc. Relevant clinical data analytics I. SCAMPs mission statement. 2014. Available at: http://www.scamps.org/index.htm. Accessed October 18, 2014.
- , , , . The long‐term effect of premier pay for performance on patient outcomes. N Engl J Med. 2012;366(17):1606–1615.
- . Effects of the Premier Hospital Quality Incentive Demonstration on Medicare patient mortality and cost. Health Serv Res. 2009;44(3):821–842.
- Centers for Medicare 1(1):97–104.
- American College of Cardiology. Quality Improvement for Institutions. Hospital to home. 2014. Available at: http://cvquality.acc.org/Initiatives/H2H.aspx. Accessed October 19, 2014.
- American College of Surgeons. National Surgical Quality Improvement Program. 2014. Available at: http://site.acsnsqip.org/. Accessed October 19, 2014.
- . Hospitals on the rebound, show stronger operating margins. Modern Healthcare website. Available at: http://www. modernhealthcare.com/article/20140103/NEWS/301039973. Published January 3, 2014. Accessed October 18, 2014.
Hospitalist Attendings: Systematic Review
Wachter and Goldman1 described the hospitalist model for inpatient care more than a decade ago. The Society of Hospital Medicine (SHM) defines hospitalists as physicians whose primary professional focus is the general medical care of hospitalized patients. Their activities include patient care, teaching, research, and leadership related to hospital medicine.2 This care delivery model has enjoyed exponential growth, with approximately 20,000 hospitalists in the United States, and an estimated 30,000 by the end of the decade.35 Currently, 29% of hospitals, including 55% with at least 200 beds, employ hospitalists to coordinate inpatient care.6 Data suggests that hospitalists promote cost containment and decrease length of stay without negatively affecting rates of death, readmission, or patient satisfaction.715
In academic settings, hospitalists also provide a substantial amount of teaching to trainees,1618 and the hospitalist model represents a fundamental change in inpatient education delivery. Traditional ward attendings typically consisted of a heterogeneous group of subspecialists, laboratory‐based clinician scientists, and general internists, many of whom attended and taught relatively infrequently. By virtue of focusing purely on inpatient care, hospitalists are more intimately involved with inpatient care systems, as well as teaching challenges (and opportunities) in the inpatient setting. The theoretical educational benefits of hospitalists include greater availability, more expertise in hospital medicine, and more emphasis on cost‐effective care.7, 18, 19 Concerns that trainees would have diminished autonomy and less exposure to subspecialist care have not been borne out.16, 20, 21
The purpose of this study was to examine the role of hospitalists on inpatient trainee education. We systematically reviewed the literature to determine the impact of hospitalists compared to nonhospitalist attendings on medical students' and residents' education.
MATERIALS AND METHODS
Data Sources
We searched the MEDLINE, Database of Reviews of Effectiveness (DARE), National Health Service (NHS) Economic Evaluation Database (EED), Health Technology Assessment (HTA), and Cochrane Collaboration databases for citations using the term hospitalist through November 2007, and updated the literature search through October 1, 2008. Additionally, we manually searched the bibliographies of relevant retrieved articles and national meeting abstracts from the SHM (2002‐2007), Society of General Internal Medicine (SGIM) (2001‐2007), and Pediatric Academic Societies (PAS) (2000‐2007). The authors of included meeting abstracts were contacted for additional information.
Data Selection
We included English‐language studies that reported the effects of hospitalist attending physicians on the knowledge, skills, or attitudes of medical students or residents in an inpatient setting, and compared these outcomes to a comparison group of trainees taught by nonhospitalist attending physicians. We excluded opinion articles, review articles, descriptions of curricula, surveys of program leaders, and evaluations of teaching without trainee assessments.
Data Extraction
We developed a standardized data extraction form based on the Best Evidence Medical Education (BEME) Collaboration protocol.22 The following information was extracted from each article: study design and measurement scale; attending and trainee information; study setting; response rate, if available; outcomes measuring attending physician's teaching ability; and outcomes assessing trainees' attitudes, knowledge, and skills. Open‐ended items solicited overall impression, concerns, new insights, and avenues for research not already captured in the data extraction form. A meta‐analysis was not performed due to varying measures for teacher assessments.
One investigator (P.N.) performed the literature search and a second investigator (K.E.H.) reviewed and confirmed the appropriateness of the articles retained and excluded based on review of the titles and abstracts. Next, 3 investigators (P.N., K.E.H., S.R.) confirmed that all the included articles met inclusion criteria. All 3 independently abstracted each article and coded the strength of findings and methodological quality based on: (1) response rate: (2) number of trainees and attendings; (3) control for additional education interventions; (4) explicit indication of random allocation of trainees to attendings; and (5) presence of a contemporaneous comparison group of nonhospitalist attendings. The level of behavioral impact by the 4‐level Kirkpatrick hierarchy was also recorded for each study to assess the strength of the intervention.23 The strength of data was rated for each study on a scale of 1 to 5, with 1 = no clear conclusions can be drawn; 2 = results ambiguous, but appears to be a trend; 3 = conclusions can probably be based on results; 4 = results are clear and very likely to be true; and 5 = results are unequivocal. Disagreements about search criteria, data extraction, and classification of study results were resolved by consensus.
RESULTS
Search Results
The database searches yielded 711 articles (Figure 1). Based on review of titles and abstracts, 32 articles were retrieved for full‐text review. During full‐text review, we eliminated 26 studies because they had no nonhospitalist control group,7, 16, 18, 2427 were opinion or review articles,19, 21, 2834 examined hospitalists' roles without trainee outcomes,17, 3540 surveyed program administration,41 or did not involve hospitalists.42, 43 Ultimately, 6 citations published between 2002 and 2007 met all inclusion criteria (Table 1).4449 The updated literature search through October 1, 2008 did not yield any additional relevant studies.
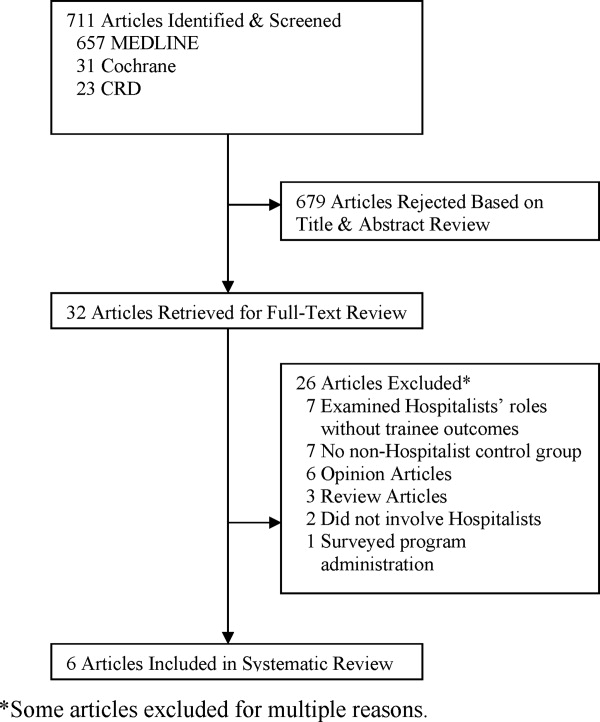
| Location, yearreference | Learners (n) | Number of Attendings | Attending Ward Responsibilities (weeks per year) | Attending Experience (mean years postgraduation) | Attending Gender (% female) | Survey Response Rate (%) | Data Strength |
|---|---|---|---|---|---|---|---|
| |||||||
| University of Chicago, 200244 | PGY‐unspecified (86) | 2‐4 hospitalists; unknown nonhospitalists | 12‐24 hospitalists; 4‐8 nonhospitalists | 58 | 2 | ||
| Children's Hospital, Boston, 200245 | PGY‐1, PGY‐3 (unknown) | 8 hospitalists; 75 nonhospitalists | 12‐16 hospitalists; 2‐4 nonhospitalists | 63 | 2 | ||
| Oregon Health & Sciences, 200446 | MS3 (138) | 6 hospitalists; 11 nonhospitalists | 22.8 hospitalists; 6.4 nonhospitalists | 4.2 hospitalists; 10.9 nonhospitalists | 2/6 (33%) hospitalists; 4/11 (36%) nonhospitalists | 72 | 3 |
| University of California, San Francisco, 200447 | MS3‐4, PGY1‐3 (917) | 17 hospitalists; 39 general internists; 13 subspecialists | 12 hospitalists; 3.24 nonhospitalists | 6/17 (35%) hospitalists; 17/52 (33%) nonhospitalists | 91 | 4 | |
| Grady Memorial, 200448 | MS3‐4, PGY1‐3 (unknown) | 12 hospitalists; 27 general internists; 51 subspecialists | 24 hospitalists; 6 nonhospitalists | 6.1 hospitalists; 9.7 general internists; 21.6 subspecialists | 6/12 (50%) hospitalists; 16/51 (31%) nonhospitalists | 81 | 3 |
| Penn State Children's Hospital, 200749 | MS3 (67) | 2 hospitalists; 8 nonhospitalists | 2 MDs covered 32 hospitalists; 8 MDs covered 28 nonhospitalists | 1/2 (50%) hospitalists; 2/8 (25%) nonhospitalists | 100 | 3 | |
| Multiple sites, 200550* | MS3 (294) | 54 | 2 | ||||
| California Pacific Medical Center, 200651* | PGY‐unspecified (unknown) | 1 | |||||
Examination of meeting abstracts yielded a total of 7,062 abstracts (Figure 2), of which 9 abstracts were retrieved for full‐text review. Two abstracts met inclusion criteria (Table 1).50, 51 Excluded meeting abstracts included published studies that were already abstracted as manuscripts,52, 53 had no nonhospitalist control group,54, 55 did not involve hospitalists,56 surveyed program administrators,57 or examined hospitalists' roles without trainee outcomes.58 Our communications with abstract authors did not yield any relevant additional information.
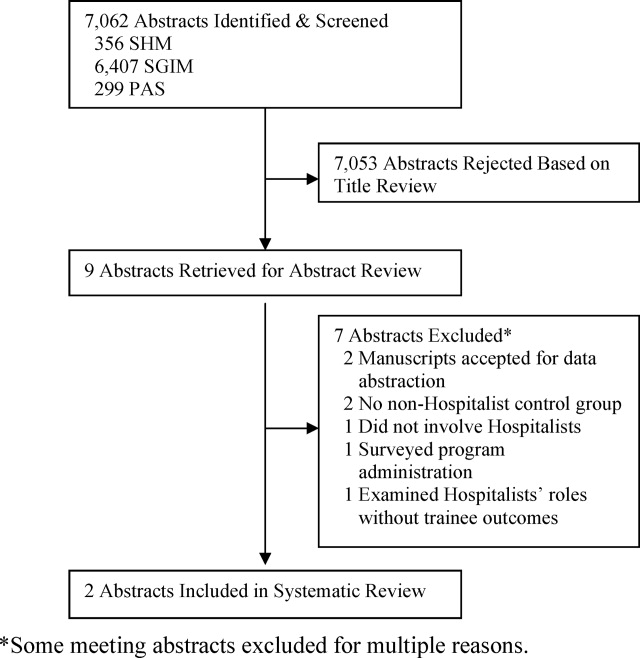
Study Settings, Designs, and Outcomes
Six of 8 included studies occurred in an internal medicine inpatient setting: 4 in university hospitals,44, 46, 47, 50 1 in a public safety‐net hospital,48 and 1 in a community teaching hospital.51 The remaining 2 studied the inpatient pediatric wards in university hospitals.45, 49
In 7 of 8 included studies, trainees were assigned to work with hospitalists or nonhospitalists according to the study site's standard method for allocating trainees to rotations; trainees were not allowed to choose their supervising attending. We considered these studies to be quasirandomized. The other study compared nonhospitalist attending evaluations the year prior to implementing hospitalists to hospitalist attending evaluations the year afterward.45
Studies measured trainee attitudes through routinely administered evaluations,46, 47, 49, 51 dedicated surveys,44, 48, 50 or both.45 One also qualitatively coded trainees' written responses to determine themes.48
Characteristics of Learners
Studies assessed only residents,44, 45, 51 only third‐year medical students,46, 49, 50 or residents and third‐year and fourth‐year medical students.47, 48 The amount of time trainees spent with each attending physician ranged from 2 to 4 weeks. One‐half of the studies reported the number of trainees responding to surveys in each attending group. Two studies had an equivalent number of trainees respond for each attending group,47, 49 while the other 2 had approximately twice as many trainees working with hospitalists respond.46, 50 No studies reported other characteristics of trainees assigned to the different attending groups.
Characteristics of Attendings
Hospitalists were described as attending between 12 and 32 weeks per year while nonhospitalists worked 2 to 12 weeks, except in 1 study where nonhospitalists worked 28 weeks (Table 1).49 Two studies separated nonhospitalists into general internists and subspecialists47, 48 but only 1 contrasted the weeks on service for the 2 groups of nonhospitalists.48 On average, hospitalists tended to be younger and have less experience than nonhospitalist attendings (Table 1). In those reporting attending gender, there was no significant difference between the 2 attending groups.
Methodological Quality
Because all of the included studies only evaluated trainee attitudes, they were all coded as Level 1 by the Kirkpatrick hierarchy for covering learners' views on the learning experience, its organization, presentation, content, teaching methods, and aspects of the instructional organization, materials, quality of instruction.23
The methodological quality of the studies varied. Seven studies used a contemporaneous control group, and 145 employed a noncontemporaneous comparison of hospitalists to nonhospitalists. Seven included studies reported the trainee response rate, which varied widely (from 54% to 100%) (Table 1). None of the studies reported whether any other educational interventions that could have biased study results were implemented during the study period. Of the 6 published studies, the strength of the data for 5 studies was rated as a 2 or 3 and for 1 the strength was rated a 4 (Table 1).
Trainee Evaluations Comparing Hospitalists to All Nonhospitalists
The most commonly evaluated attending measures included trainees' overall satisfaction with attendings (n = 8 studies),4451 trainees' ratings of teaching effectiveness (n = 5 studies),44, 46, 47, 49, 50 attending effectiveness of feedback delivery (n = 4 studies),4548 trainees' perceptions of attending knowledge (n = 3 studies),45, 47, 48 and attending involvement of trainees in patient care decisions (n = 3 studies) (Table 2).44, 45, 47 Several other outcomes were reported in 2 or fewer studies (Table 3). All studies reported nonnormally distributed evaluation ratings, with trainee ratings of all attending groups skewed toward high ratings.
| Number of Studies Evaluated | Hospitalists Better | Nonhospitalists Better | No Difference | |
|---|---|---|---|---|
| ||||
| Overall rating of attending | 8 | 44‐46, 47*, 48‐51 | 47 | |
| Teaching effectiveness | 5 | 44, 48‐50 | 46 | |
| Feedback delivery | 4 | 45, 47*, 48 | 47 | 46 |
| Involvement of trainees in patient care decisions | 3 | 45, 48 | 44 | |
| Quality of ward rounds | 2 | 44, 49 | ||
| Effectiveness as a role model | 2 | 45, 48 | ||
| Communication of rotation goals | 1 | 46 | ||
| Emphasizes evidence‐based care | 1 | 48 | ||
| Emphasizes cost‐effective care | 1 | 47 | ||
| Availability | 2 | 45 | 48 | |
| Perceived knowledge | 3 | 45, 48 | 47 | |
| Bedside teaching | 1 | 45 | ||
| Apparent interest in psychosocial aspects of care | 1 | 47* | 47 | |
| Reference Citation, Location, Year | Study Design | Major Findings | Data Strength |
|---|---|---|---|
| |||
| Chung et al.,44 University of Chicago, 2002 | Retrospective, quasirandomized with contemporaneous controls | % of Internal Medicine house staff very satisfied with Internal Medicine attendings (5‐point scale, 5 = very satisfied): End of month: hospitalist 58%, nonhospitalist 39%; end of year: hospitalists 76%, nonhospitalists 48%. Compared to residents who did not work with hospitalists, residents with experience with hospitalists had fewer concerns about loss of autonomy (8% vs. 41%, P = 0.02), and no difference in concerns about exposure to different faculty (41% vs. 60%, P = 0.08) | 2 |
| Landrigan et al.,45 Children's Hospital, Boston, 2002 | Retrospective, single group with historical control | Overall satisfaction with inpatient experience (4‐point scale, 4 = extremely satisfied): interns, 3.5 with hospitalists, 3.2 with nonhospitalists. PGY3, 3.5 with hospitalists, 3.5 with nonhospitalists. Rating of teaching effectiveness (5‐point scale, 5 = excellent): hospitalists 4.7, nonhospitalists 4.4. PGY3s reported less ability to make decisions independently, less ability to supervise with hospitalist attendings, but differences did not meet statistical significance (P = 0.07). | 2 |
| Hunter et al.,46 Oregon Health & Sciences, 2004 | Retrospective, quasirandomized with contemporaneous controls | MS3 combined overall rating of attending during Internal Medicine clerkship (9‐point scale, 9 = outstanding): hospitalists 8.56, nonhospitalists 8.22. Combined rating was a composite of 7 parameters (communication of rotation goals, establishing learning climate, use of educational time, teaching style, evaluation and feedback, contribution to growth and development, and effectiveness as clinical teacher). | 3 |
| Hauer et al.,47 University of California, San Francisco, 2004 | Retrospective, quasirandomized with contemporaneous controls | Internal medicine house staff, MS4 and MS3 overall satisfaction with Internal Medicine attending (9‐point scale, 9 = excellent): hospitalists 8.3 (SD 0.9), nonhospitalist general internists 7.9 (SD 1.3), subspecialists 8.1 (SD 1.7); P = 0.01 for comparison of hospitalists vs. nonhospitalist generalists, P = 0.20 for comparison of hospitalists vs. subspecialists. Attending teaching effectiveness (5‐point scale, 5 = excellent): hospitalists 4.8 (SD 0.6), general internists 4.5 (SD 0.8), specialists 4.5 (SD 1.1); P < 0.001 for comparison of hospitalists vs. nonhospitalist generalists, P = 0.03 for comparison of hospitalists vs. subspecialists. Attending knowledge (9‐point scale): hospitalists 8.2 (SD 1.1), nonhospitalists 7.9 (SD 1.2), subspecialists 8.1 (SD 1.5); P < 0.01 for comparison of hospitalists vs. nonhospitalist generalists, P = 0.10 for comparison of hospitalists vs. subspecialists. Attending valuation of trainee opinions (9‐point scale): hospitalists 8.3 (SD 0.9), nonhospitalist generalists 8.2 (SD 1.3), subspecialists 8.1 (SD 1.7); P = 0.20 for comparison of hospitalists vs. nonhospitalist generalists; P = 0.60 for comparison of hospitalist vs. subspecialists. Provision of feedback (9‐point scale): hospitalists 7.9 (SD 1.6), nonhospitalist generalists 7.2 (SD 2.3), subspecialists 7.0 (SD 2.5); P < 0.01 for comparison of hospitalists vs. nonhospitalist generalists, P = 0.01 for comparison of hospitalists vs. subspecialists. | 4 |
| Kripalani et al.,48 Grady Memorial, 2004 | Retrospective, quasirandomized with contemporaneous controls | Internal medicine house staff, MS4 and MS3 satisfaction with Internal Medicine attending teaching effectiveness (25‐item McGill Clinical Tutor Evaluation, maximum score 150): hospitalists 134.5 (95% CI, 130.2‐138.8), general internists 135.0 (95% CI, 131.2‐138.8), specialists 126.3 (95% CI, 120.4‐132.1). | 3 |
| Geskey and Kees‐Folts,49 Penn State Children's Hospital, 2007 | Retrospective, quasirandomized with contemporaneous controls | MS3 overall satisfaction with Pediatric attending teaching (4‐point scale, 4 = excellent), hospitalists 3.9, nonhospitalists 3.0. MS3s rated hospitalists higher than nonhospitalists in all 4 attending characteristics measured: teaching effectiveness, effectiveness as a pediatrician, student advocacy effectiveness, and overall. | 3 |
| Arora et al.,50 Multiple sites, 2005*, | Retrospective, quasirandomized with contemporaneous controls | MS3 overall satisfaction with Internal Medicine clerkship (5‐point scale, 5 = very satisfied): hospitalists 4.5, nonhospitalists 4.3. Trends toward greater emphasis on education (P = 0.07) and higher quality attending rounds (P = 0.07) with hospitalists. Effects of hospitalists on resident perceptions of autonomy not reported. | 2 |
| Chintharajah and Aronowitz,51 California Pacific Medical Center, 2006* | Retrospective, with contemporaneous controls. Method of assignment to attending type not stated. | Internal Medicine house staff ratings of Internal Medicine attendings: Using a 9‐point scale in 1998‐2002, then 5‐point scale in 2003‐2005, Hospitalists were rated higher than nonhospitalists in all areas assessed in 1998‐2002, but were rated higher in only 3 areas in 2003‐2005 (accessibility, feedback, and teaching procedures.) Data not shown. | 1 |
Of the 8 studies comparing hospitalists to all nonhospitalists, trainees were statistically significantly more satisfied with hospitalists in all but 1 (Table 3).4451 Hospitalists' overall teaching effectiveness was rated significantly higher in 4 studies,44, 47, 49, 50 but 1 did not demonstrate a difference.46 Hospitalists were also rated higher at feedback delivery compared to all nonhospitalists, with 2 studies45, 47 and 1 abstract reporting hospitalists' superiority. One other study showed increased satisfaction with hospitalists' feedback only compared to subspecialists.48 Hospitalists were perceived as being more knowledgeable and allowing greater trainee involvement in patient care decisions, in 2 of 3 studies addressing each of these questions. In order to evaluate preconceived notions, 1 study demonstrated that residents who never worked with hospitalists were significantly more concerned about hospitalists negatively impacting their clinical autonomy than residents who had worked with hospitalists at least once.44
Hospitalists were rated as more available in 1 study45 with a trend toward more availability in another.47 Trainee satisfaction was higher with hospitalists on other measures including quality of ward rounds,44, 49 effectiveness as a role model,45, 48 communication of rotations' goals,46 emphasis on evidence‐based medicine,48 and emphasis on cost‐effective care.47 In 1 study, trainees were significantly more satisfied with the bedside teaching of nonhospitalists.45 In another, trainees felt that, compared to hospitalists, general internists seemed to be more interested in the psychosocial aspects of patients' care.48
Trainee Evaluations Comparing Hospitalists to Outpatient Generalists and Subspecialists
Of the studies that examined whether the type of nonhospitalist (general internist vs. subspecialist) impacted trainee ratings, 1 showed that trainees were equally satisfied with hospitalists and general internists but that general internists were rated higher than hospitalists for feedback delivery.48 Hospitalists were rated significantly higher than subspecialists overall and for feedback delivery.48 The other study that subclassified nonhospitalists into general internists and subspecialists showed that hospitalists were more highly rated than both general internists and subspecialists overall and for teaching effectiveness and feedback delivery.47
DISCUSSION
This systematic review of the literature describing hospitalists as educators shows that trainees are generally more satisfied with hospitalists than nonhospitalists on their inpatient rotations. Hospitalists were rated more highly than traditional ward attendings overall, and for teaching effectiveness44, 47, 49, 50 and feedback delivery.45, 47 Limited data (3 studies each) indicates that trainees perceive hospitalists as being at least as knowledgeable as traditional attendings, and encouraging similar levels of trainee involvement in patient care decisions. Trainees may be more satisfied with hospitalists than with general internists or subspecialists, although some comparisons have shown that general internists may be preferred. No studies have evaluated the impact of hospitalists on trainee outcomes beyond satisfaction, such as knowledge acquisition, rotation grades, or clinical performance.
Our review suggests that, with increased time spent on the wards, hospitalists exhibit attributes consistent with specialization in inpatient care.1, 14 Hospitalists were noted to emphasize cost‐effectiveness47 and evidence‐based medicine48 and to conduct higher‐quality ward rounds.44, 49 Hospitalists are uniquely qualified to teach about inpatient goals and processes such as decreasing length of stay in the hospital and cost‐effective care.1, 3, 7, 12, 15 Trainees see hospitalists as role models,45, 47 and the site‐defined nature of hospital medicine promotes trainees' access to hospitalist attendings. Such accessibility has been described as an independent attribute of excellent physician role models,59, 60, 62 Our findings from our methodologically rigorous systematic review of the literature extend the conclusions of a narrative review of the literature on hospitalists as educators that also identified favorable ratings of hospitalists, with some unresolved concerns about resident autonomy and the role of subspecialist teachers in hospitalist systems.63
Diminished trainee autonomy was an early concern about hospitalists in academic medical centers.16, 20, 21 In the earliest study we identified that assessed autonomy, trainees perceived similar amounts of autonomy with hospitalists compared to nonhospitalists.44 Interestingly, house staff in more experienced hospitalist models even described experiencing increased involvement in patient care when supervised by hospitalist attendings in both the pediatric and internal medicine settings.45, 47 Hospitalists might also generate more clinical diversity for house staff by reducing length of stay and thereby enhancing opportunities for learning with newly admitted patients.13, 14, 64
The studies that did not demonstrate increased satisfaction with hospitalists may be instructive as well. One negative study46 reported results from a program that instituted the hospitalist model in response to declining trainee satisfaction. With an emphasis on improving the educational experience, nonhospitalist physicians who were already rated highly as teachers were also selected to attend on the wards. Nonetheless, trainees still were more satisfied with hospitalists overall. One study showed that hospitalists were rated more highly than subspecialists when delivering feedback but less so than general internists.47 The authors suggest that their general internists may have been at a more optimum demographic by being a few more years out of training; such correlations of age and rank to evaluations have not been previously described.60, 61
The disadvantages of hospitalists in trainee education identified by this systematic review include the quality of bedside teaching in one study45 and interest in psychosocial aspects of care in another48 compared to general internists. The decline in satisfaction with bedside teaching is a concern but the comparison was noncontemporaneous and the authors explained that the team size increased and resulted in an overall decrease in time at the bedside.45 The concern that decreased patient length of stays may translate to less time spent with patients and less bedside teaching is not new.18 Although hospitalists have shown particular educational advantages, the balance of clinical efficiency and education remains challenging. Trainees' perception that hospitalists were less interested in the psychosocial aspects of care compared to general internists48 was also anticipated when inpatient attending models began to shift, because hospitalization may now be viewed by trainees as discontinuous from a patient's outpatient care and social situation.18 Nevertheless, hospitalists have been able to achieve such quality measures as decreased length of stay without decreasing patient satisfaction.10, 12
Our study has several limitations. First, all attendings were rated highly in all studies. These high ratings are commonly seen with educational evaluations,65 and this phenomenon creates a ceiling effect that limits variability within the group. Nevertheless, trainees rated hospitalists significantly higher than nonhospitalists overall in all of the included studies. The impact of these small but significant differences on trainees' learning and future clinical performance is unknown. Additionally, the distinction between hospitalists and nonhospitalists was not universal. Initially, it was proposed that academic hospitalists work as hospitalists 3 to 6 months each year.1 This definition is sustained through almost all included studies that reported attending time on the wards, with hospitalists working 3 to 7 months and nonhospitalists working less than 3 months, but observed variability does not permit a universal hospitalist definition. It is possible that publication bias influenced our findings toward positive ratings of hospitalists; we reviewed and included meeting abstracts to minimize this bias. We did not review family medicine meeting abstracts.
The included studies had some methodologic strengths, including quasirandom assignment of trainees and use of a contemporaneous control group in almost all studies. However, the overall methodologic strength was fair given limitations in response rates and reporting of cointerventions; we thus considered most studies to represent trends rather than definitive results. Finally, all of the studies meeting our inclusion criteria to date only evaluated trainees' attitudes and beliefs. Because knowledge and skills were not objectively assessed, it is unclear how increased trainee satisfaction translates to knowledge and skill acquisition on the wards. However, Miller's pyramid and its proposed modification, the Cambridge model, suggest that targeting attitudes precedes knowledge acquisition,66 and our study suggests the need for a research agenda examining the impact of hospitalists on trainees' future performance. Griffith et al.67 demonstrated an association between increased satisfaction with teaching and medical students' performance on clerkship examinations and the U.S. Medical Licensing Examination (USMLE) Step 2.
Overall, trainees were more satisfied with hospitalists' teaching and feedback delivery. Our literature search shows that, although there are a limited number of studies of varying level of quality that cannot be compared using meta‐analytic techniques, the currently available data suggests that hospitalists lead to improved learner satisfaction. More studies to delineate the differences between hospitalists and nonhospitalist general internists are needed. Continued exploration of the effects of attending age and rank on trainee learning may help determine whether this effect is reproducible, and what facets of attendings' teaching actually impact trainees' knowledge, skill acquisition, and behaviors. Since all studies only evaluated attitudes, studies analyzing knowledge and skills are required to more fully understand the educational outcomes of the hospitalist model.
- , .The emerging role of “hospitalists” in the American health care system.N Engl J Med.1996;335:514–517.
- Society of Hospital Medicine. Definition of a Hospitalist. Available at: http://www.hospitalmedicine.org/AM/Template.cfm?Section=General_ Information130:343–349.
- Society of Hospital Medicine. Hospital Medicine Specialty Shows 20 Percent Growth. Available at: http://www.hospitalmedicine.org/AM/Template. cfm?Section=Press_Releases21:1079–1085.
- , , , .The status of hospital medicine groups in the United States.J Hosp Med.2006;1:75–80.
- , , , , .Assessing the value of hospitalists to academic health centers: Brigham and Women's Hospital and Harvard Medical School.Am J Med.1999;106:134–137.
- , , , , .Reorganizing an academic medical service. Impact on cost, quality, patient satisfaction, and education.JAMA.1998;279:1560–1565.
- , .Implications of the hospitalist movement for academic departments of medicine: lessons from the UCSF experience.Am J Med.1999;106:127–133.
- , , , et al.Effects of hospitalists on cost, outcomes, and patient satisfaction in a rural health system.Am J Med.2000;108:621–626.
- , , , et al.Implementation of a hospitalist system in a large health maintenance organization: the Kaiser Permanente experience.Ann Intern Med.1999;130:355–359.
- , , , .The impact of an inpatient physician program on quality, utilization, and satisfaction.Am J Manag Care.2000;6:549–555.
- , , .Decreased length of stay, costs and mortality in a randomized trial of academic hospitalists.J Gen Intern Med.2001;16:S208.
- , , , , , .Implementation of a voluntary hospitalist service at a community teaching hospital: improved clinical efficiency and patient outcomes.Ann Intern Med.2002;137(11):859–865.
- , , , , , .Outcomes of care by hospitalists, general internists, and family physicians.N Engl J Med.2007;357(25):2589–2600.
- .The impact of hospitalists on medical education and the academic health system.Ann Intern Med.1999;130:364–367.
- , .The role of hospitalists in medical education.Am J Med.1999;107:305–309.
- , .Implications of the hospitalist model for medical students' education.Acad Med.2001;76:324–330.
- , .Changing teaching for changing times: the effect of a hospitalist program on the education of students.Acad Med.2000;75:521.
- .Reflections: the hospitalist movement a decade later.J Hosp Med.2006;1(4):248–252.
- .Response to the effect of hospitalist systems on residency education: re‐incorporating medical subspecialists.Acad Med.2001;76:555–556.
- Best Evidence Medical Education (BEME) Collaboration, Dundee, UK. Home page. Available at: http://www.bemecollaboration.org. Accessed May2009.
- .Evaluation of Training. In: Craig R, Mittel I, eds.Training and Development Handbook.New York:McGraw‐Hill;1967:87–112.
- , , , et al.The positive impact of initiation of hospitalist clinician educators.J Gen Intern Med.2004;19(4):293–301.
- , , , .Evaluation of a staff‐only hospitalist system in a tertiary care, academic children's hospital.Pediatrics.2004;114(6):1545–1549.
- .How pediatric hospitalist programs can affect graduate medical education.Pediatr Ann.2003;32(12):822–824.
- .A “hospitalist” rotation increases short‐term knowledge of fourth‐year medical students.South Med J.2002;95(3):374.
- .The hospitalist movement 10 years later: life as a Swiss army knife.MedGenMed.2006;8(3):30.
- , , , , .Managing discontinuity in academic medical centers: strategies for a safe and effective resident sign‐out.J Hosp Med.2006;1(4):257–266.
- .Hospitalists in medical education: coming to an academic medical center near you.J Natl Med Assoc.2006;98(9):1501–1504.
- , .Teaching residents to consider costs in medical decision making.Am J Bioeth.2006;6(4):33–34.
- Association of Program Directors in Internal Medicine;, , , , .Redesigning residency education in internal medicine: a position paper from the Association of Program Directors in Internal Medicine.Ann Intern Med.2006;144(12):920–926.
- , , , .Hospital medicine fellowships: works in progress.Am J Med.2006;119(1):72.e1–e7.
- .Employing hospitalists to improve residents' inpatient learning.Acad Med.2001;76(5):556.
- , , , , .The spectrum of community‐based hospitalist practice: a call to tailor internal medicine residency training.Arch Intern Med.2007;167(7):727–728.
- , , , , .How to use the core competencies in hospital medicine: a framework for curriculum development.J Hosp Med.2006;1(suppl 1):57–67.
- , , , , .Core competencies in hospital medicine: development and methodology.J Hosp Med.2006;1(suppl 1):48–56.
- , , .How hospitalists spend their time: insights on efficiency and safety.J Hosp Med.2006;1(2):88–93.
- .Determining the professional attributes of a hospitalist: experience in one Australian metropolitan hospital.Intern Med J.2005;35(5):305–308.
- .The internal medicine clerkship: the view from the vantage point of one chair of medicine.Am J Med.1999;107(2):109–111.
- , , , , .The presence of hospitalists in medical education.Acad Med.2000;75(10 suppl):S34–S36.
- , , , et al.Learning opportunities for Australian prevocational hospital doctors: exposure, perceived quality and desired methods of learning.Med J Aust.2006;184(9):436–440.
- , , , , .Training the ideal hospital doctor: the specialist registrars' perspective.Med Educ.2001;35(10):957–966.
- , , , , , .Resident satisfaction on an academic hospitalist service: time to teach.Am J Med.2002;112(7):597–601.
- , , , , , .Effect of a pediatric hospitalist system on housestaff education and experience.Arch Pediatr Adolesc Med.2002;156(9):877–883.
- , , , .Medical student evaluation of the quality of hospitalist and nonhospitalist teaching faculty on inpatient medicine rotations.Acad Med.2004;79(1):78–82.
- , , , , .Effects of hospitalist attending physicians on trainee satisfaction with teaching and with internal medicine rotations.Arch Intern Med.2004;164(17):1866–1871.
- , , , et al.Hospitalists as teachers.J Gen Intern Med.2004;19(1):8–15.
- , .Third‐year medical students' evaluation of hospitalist and nonhospitalist faculty during the inpatient portion of their pediatrics clerkships.J Hosp Med.2007;2(1):17–22.
- , , , et al. The effects of hospitalist teaching attendings on medical student satisfaction and career interest: results from the multicenter hospitalist study. Society of Hospital Medicine;2005 Annual Meeting Abstracts.
- , . Hospitalist teachers may lose their superiority over non‐hospitalist teachers in “mature” hospitalist systems. Society of General Internal Medicine;2006 Annual Meeting Abstracts.
- , , , . Medical student evaluation of the quality of hospitalist and non‐hospitalist teaching faculty on inpatient medicine rotations. Society of Hospital Medicine;2003 Annual Meeting Abstracts.
- , , , . Effects of hospitalist attendings on trainee satisfaction with rotations. Society of General Internal Medicine;2002 Annual Meeting Abstracts.
- , , . Internal medicine and orthopedic residents' perception of education and satisfaction after the initiation of a non‐resident hospitalist service. Society of Hospital Medicine;2004 Annual Meeting Abstracts.
- , , , . Medical subinternship: student experience on a resident uncovered hospitalist service. Society of Hospital Medicine;2006 Annual Meeting Abstracts.
- , , , , . A randomized controlled trial to evaluate the effect of dedicated clinical teachers (or “Educationalists”) on the internal medicine clerkship experience. Society of General Internal Medicine;2002 Annual Meeting Abstracts.
- , , . Internal medicine residency program goals drive the development of hospitalist programs at teaching hospitals. Society of Hospital Medicine;2002 Annual Meeting Abstracts.
- , . The role of the hospitalist in teaching. Society of General Internal Medicine;2003 Annual Meeting Abstracts.
- , , .Clinical tutor evaluation: a 5‐year study by students on an inpatient service and residents in an ambulatory care clinic.Med Educ.1993;27:48–54.
- , , , , .Attributes of excellent attending‐physician role models.N Engl J Med.1998;339:1986–1992.
- , , .Factors affecting ratings of clinical teachers by medical students and residents.J Med Educ.1987;62:1–7.
- , , , .Attending rounds: a survey of physician attitudes.J Gen Intern Med.1990;5:229–233.
- , .Hospitalist educators: future of inpatient internal medicine training.Mt Sinai J Med.2008;75:430–435.
- , , , .Pediatric hospitalists: a systematic review of the literature.Pediatrics.2006;117:1736–1744.
- , , .Grade inflation in internal medicine clerkships: results of a national survey.Teach Learn Med.2000;12:112–116.
- , , , et al.The relationship between competence and performance: implications for assessing practice performance.Med Educ.2002;36(10):901–909.
- , , .Six‐year documentation of the association between excellent clinical teaching and improved students' examination performances.Acad Med.2000;75(10 suppl):S62–S64.
Wachter and Goldman1 described the hospitalist model for inpatient care more than a decade ago. The Society of Hospital Medicine (SHM) defines hospitalists as physicians whose primary professional focus is the general medical care of hospitalized patients. Their activities include patient care, teaching, research, and leadership related to hospital medicine.2 This care delivery model has enjoyed exponential growth, with approximately 20,000 hospitalists in the United States, and an estimated 30,000 by the end of the decade.35 Currently, 29% of hospitals, including 55% with at least 200 beds, employ hospitalists to coordinate inpatient care.6 Data suggests that hospitalists promote cost containment and decrease length of stay without negatively affecting rates of death, readmission, or patient satisfaction.715
In academic settings, hospitalists also provide a substantial amount of teaching to trainees,1618 and the hospitalist model represents a fundamental change in inpatient education delivery. Traditional ward attendings typically consisted of a heterogeneous group of subspecialists, laboratory‐based clinician scientists, and general internists, many of whom attended and taught relatively infrequently. By virtue of focusing purely on inpatient care, hospitalists are more intimately involved with inpatient care systems, as well as teaching challenges (and opportunities) in the inpatient setting. The theoretical educational benefits of hospitalists include greater availability, more expertise in hospital medicine, and more emphasis on cost‐effective care.7, 18, 19 Concerns that trainees would have diminished autonomy and less exposure to subspecialist care have not been borne out.16, 20, 21
The purpose of this study was to examine the role of hospitalists on inpatient trainee education. We systematically reviewed the literature to determine the impact of hospitalists compared to nonhospitalist attendings on medical students' and residents' education.
MATERIALS AND METHODS
Data Sources
We searched the MEDLINE, Database of Reviews of Effectiveness (DARE), National Health Service (NHS) Economic Evaluation Database (EED), Health Technology Assessment (HTA), and Cochrane Collaboration databases for citations using the term hospitalist through November 2007, and updated the literature search through October 1, 2008. Additionally, we manually searched the bibliographies of relevant retrieved articles and national meeting abstracts from the SHM (2002‐2007), Society of General Internal Medicine (SGIM) (2001‐2007), and Pediatric Academic Societies (PAS) (2000‐2007). The authors of included meeting abstracts were contacted for additional information.
Data Selection
We included English‐language studies that reported the effects of hospitalist attending physicians on the knowledge, skills, or attitudes of medical students or residents in an inpatient setting, and compared these outcomes to a comparison group of trainees taught by nonhospitalist attending physicians. We excluded opinion articles, review articles, descriptions of curricula, surveys of program leaders, and evaluations of teaching without trainee assessments.
Data Extraction
We developed a standardized data extraction form based on the Best Evidence Medical Education (BEME) Collaboration protocol.22 The following information was extracted from each article: study design and measurement scale; attending and trainee information; study setting; response rate, if available; outcomes measuring attending physician's teaching ability; and outcomes assessing trainees' attitudes, knowledge, and skills. Open‐ended items solicited overall impression, concerns, new insights, and avenues for research not already captured in the data extraction form. A meta‐analysis was not performed due to varying measures for teacher assessments.
One investigator (P.N.) performed the literature search and a second investigator (K.E.H.) reviewed and confirmed the appropriateness of the articles retained and excluded based on review of the titles and abstracts. Next, 3 investigators (P.N., K.E.H., S.R.) confirmed that all the included articles met inclusion criteria. All 3 independently abstracted each article and coded the strength of findings and methodological quality based on: (1) response rate: (2) number of trainees and attendings; (3) control for additional education interventions; (4) explicit indication of random allocation of trainees to attendings; and (5) presence of a contemporaneous comparison group of nonhospitalist attendings. The level of behavioral impact by the 4‐level Kirkpatrick hierarchy was also recorded for each study to assess the strength of the intervention.23 The strength of data was rated for each study on a scale of 1 to 5, with 1 = no clear conclusions can be drawn; 2 = results ambiguous, but appears to be a trend; 3 = conclusions can probably be based on results; 4 = results are clear and very likely to be true; and 5 = results are unequivocal. Disagreements about search criteria, data extraction, and classification of study results were resolved by consensus.
RESULTS
Search Results
The database searches yielded 711 articles (Figure 1). Based on review of titles and abstracts, 32 articles were retrieved for full‐text review. During full‐text review, we eliminated 26 studies because they had no nonhospitalist control group,7, 16, 18, 2427 were opinion or review articles,19, 21, 2834 examined hospitalists' roles without trainee outcomes,17, 3540 surveyed program administration,41 or did not involve hospitalists.42, 43 Ultimately, 6 citations published between 2002 and 2007 met all inclusion criteria (Table 1).4449 The updated literature search through October 1, 2008 did not yield any additional relevant studies.
| Location, yearreference | Learners (n) | Number of Attendings | Attending Ward Responsibilities (weeks per year) | Attending Experience (mean years postgraduation) | Attending Gender (% female) | Survey Response Rate (%) | Data Strength |
|---|---|---|---|---|---|---|---|
| |||||||
| University of Chicago, 200244 | PGY‐unspecified (86) | 2‐4 hospitalists; unknown nonhospitalists | 12‐24 hospitalists; 4‐8 nonhospitalists | 58 | 2 | ||
| Children's Hospital, Boston, 200245 | PGY‐1, PGY‐3 (unknown) | 8 hospitalists; 75 nonhospitalists | 12‐16 hospitalists; 2‐4 nonhospitalists | 63 | 2 | ||
| Oregon Health & Sciences, 200446 | MS3 (138) | 6 hospitalists; 11 nonhospitalists | 22.8 hospitalists; 6.4 nonhospitalists | 4.2 hospitalists; 10.9 nonhospitalists | 2/6 (33%) hospitalists; 4/11 (36%) nonhospitalists | 72 | 3 |
| University of California, San Francisco, 200447 | MS3‐4, PGY1‐3 (917) | 17 hospitalists; 39 general internists; 13 subspecialists | 12 hospitalists; 3.24 nonhospitalists | 6/17 (35%) hospitalists; 17/52 (33%) nonhospitalists | 91 | 4 | |
| Grady Memorial, 200448 | MS3‐4, PGY1‐3 (unknown) | 12 hospitalists; 27 general internists; 51 subspecialists | 24 hospitalists; 6 nonhospitalists | 6.1 hospitalists; 9.7 general internists; 21.6 subspecialists | 6/12 (50%) hospitalists; 16/51 (31%) nonhospitalists | 81 | 3 |
| Penn State Children's Hospital, 200749 | MS3 (67) | 2 hospitalists; 8 nonhospitalists | 2 MDs covered 32 hospitalists; 8 MDs covered 28 nonhospitalists | 1/2 (50%) hospitalists; 2/8 (25%) nonhospitalists | 100 | 3 | |
| Multiple sites, 200550* | MS3 (294) | 54 | 2 | ||||
| California Pacific Medical Center, 200651* | PGY‐unspecified (unknown) | 1 | |||||
Examination of meeting abstracts yielded a total of 7,062 abstracts (Figure 2), of which 9 abstracts were retrieved for full‐text review. Two abstracts met inclusion criteria (Table 1).50, 51 Excluded meeting abstracts included published studies that were already abstracted as manuscripts,52, 53 had no nonhospitalist control group,54, 55 did not involve hospitalists,56 surveyed program administrators,57 or examined hospitalists' roles without trainee outcomes.58 Our communications with abstract authors did not yield any relevant additional information.
Study Settings, Designs, and Outcomes
Six of 8 included studies occurred in an internal medicine inpatient setting: 4 in university hospitals,44, 46, 47, 50 1 in a public safety‐net hospital,48 and 1 in a community teaching hospital.51 The remaining 2 studied the inpatient pediatric wards in university hospitals.45, 49
In 7 of 8 included studies, trainees were assigned to work with hospitalists or nonhospitalists according to the study site's standard method for allocating trainees to rotations; trainees were not allowed to choose their supervising attending. We considered these studies to be quasirandomized. The other study compared nonhospitalist attending evaluations the year prior to implementing hospitalists to hospitalist attending evaluations the year afterward.45
Studies measured trainee attitudes through routinely administered evaluations,46, 47, 49, 51 dedicated surveys,44, 48, 50 or both.45 One also qualitatively coded trainees' written responses to determine themes.48
Characteristics of Learners
Studies assessed only residents,44, 45, 51 only third‐year medical students,46, 49, 50 or residents and third‐year and fourth‐year medical students.47, 48 The amount of time trainees spent with each attending physician ranged from 2 to 4 weeks. One‐half of the studies reported the number of trainees responding to surveys in each attending group. Two studies had an equivalent number of trainees respond for each attending group,47, 49 while the other 2 had approximately twice as many trainees working with hospitalists respond.46, 50 No studies reported other characteristics of trainees assigned to the different attending groups.
Characteristics of Attendings
Hospitalists were described as attending between 12 and 32 weeks per year while nonhospitalists worked 2 to 12 weeks, except in 1 study where nonhospitalists worked 28 weeks (Table 1).49 Two studies separated nonhospitalists into general internists and subspecialists47, 48 but only 1 contrasted the weeks on service for the 2 groups of nonhospitalists.48 On average, hospitalists tended to be younger and have less experience than nonhospitalist attendings (Table 1). In those reporting attending gender, there was no significant difference between the 2 attending groups.
Methodological Quality
Because all of the included studies only evaluated trainee attitudes, they were all coded as Level 1 by the Kirkpatrick hierarchy for covering learners' views on the learning experience, its organization, presentation, content, teaching methods, and aspects of the instructional organization, materials, quality of instruction.23
The methodological quality of the studies varied. Seven studies used a contemporaneous control group, and 145 employed a noncontemporaneous comparison of hospitalists to nonhospitalists. Seven included studies reported the trainee response rate, which varied widely (from 54% to 100%) (Table 1). None of the studies reported whether any other educational interventions that could have biased study results were implemented during the study period. Of the 6 published studies, the strength of the data for 5 studies was rated as a 2 or 3 and for 1 the strength was rated a 4 (Table 1).
Trainee Evaluations Comparing Hospitalists to All Nonhospitalists
The most commonly evaluated attending measures included trainees' overall satisfaction with attendings (n = 8 studies),4451 trainees' ratings of teaching effectiveness (n = 5 studies),44, 46, 47, 49, 50 attending effectiveness of feedback delivery (n = 4 studies),4548 trainees' perceptions of attending knowledge (n = 3 studies),45, 47, 48 and attending involvement of trainees in patient care decisions (n = 3 studies) (Table 2).44, 45, 47 Several other outcomes were reported in 2 or fewer studies (Table 3). All studies reported nonnormally distributed evaluation ratings, with trainee ratings of all attending groups skewed toward high ratings.
| Number of Studies Evaluated | Hospitalists Better | Nonhospitalists Better | No Difference | |
|---|---|---|---|---|
| ||||
| Overall rating of attending | 8 | 44‐46, 47*, 48‐51 | 47 | |
| Teaching effectiveness | 5 | 44, 48‐50 | 46 | |
| Feedback delivery | 4 | 45, 47*, 48 | 47 | 46 |
| Involvement of trainees in patient care decisions | 3 | 45, 48 | 44 | |
| Quality of ward rounds | 2 | 44, 49 | ||
| Effectiveness as a role model | 2 | 45, 48 | ||
| Communication of rotation goals | 1 | 46 | ||
| Emphasizes evidence‐based care | 1 | 48 | ||
| Emphasizes cost‐effective care | 1 | 47 | ||
| Availability | 2 | 45 | 48 | |
| Perceived knowledge | 3 | 45, 48 | 47 | |
| Bedside teaching | 1 | 45 | ||
| Apparent interest in psychosocial aspects of care | 1 | 47* | 47 | |
| Reference Citation, Location, Year | Study Design | Major Findings | Data Strength |
|---|---|---|---|
| |||
| Chung et al.,44 University of Chicago, 2002 | Retrospective, quasirandomized with contemporaneous controls | % of Internal Medicine house staff very satisfied with Internal Medicine attendings (5‐point scale, 5 = very satisfied): End of month: hospitalist 58%, nonhospitalist 39%; end of year: hospitalists 76%, nonhospitalists 48%. Compared to residents who did not work with hospitalists, residents with experience with hospitalists had fewer concerns about loss of autonomy (8% vs. 41%, P = 0.02), and no difference in concerns about exposure to different faculty (41% vs. 60%, P = 0.08) | 2 |
| Landrigan et al.,45 Children's Hospital, Boston, 2002 | Retrospective, single group with historical control | Overall satisfaction with inpatient experience (4‐point scale, 4 = extremely satisfied): interns, 3.5 with hospitalists, 3.2 with nonhospitalists. PGY3, 3.5 with hospitalists, 3.5 with nonhospitalists. Rating of teaching effectiveness (5‐point scale, 5 = excellent): hospitalists 4.7, nonhospitalists 4.4. PGY3s reported less ability to make decisions independently, less ability to supervise with hospitalist attendings, but differences did not meet statistical significance (P = 0.07). | 2 |
| Hunter et al.,46 Oregon Health & Sciences, 2004 | Retrospective, quasirandomized with contemporaneous controls | MS3 combined overall rating of attending during Internal Medicine clerkship (9‐point scale, 9 = outstanding): hospitalists 8.56, nonhospitalists 8.22. Combined rating was a composite of 7 parameters (communication of rotation goals, establishing learning climate, use of educational time, teaching style, evaluation and feedback, contribution to growth and development, and effectiveness as clinical teacher). | 3 |
| Hauer et al.,47 University of California, San Francisco, 2004 | Retrospective, quasirandomized with contemporaneous controls | Internal medicine house staff, MS4 and MS3 overall satisfaction with Internal Medicine attending (9‐point scale, 9 = excellent): hospitalists 8.3 (SD 0.9), nonhospitalist general internists 7.9 (SD 1.3), subspecialists 8.1 (SD 1.7); P = 0.01 for comparison of hospitalists vs. nonhospitalist generalists, P = 0.20 for comparison of hospitalists vs. subspecialists. Attending teaching effectiveness (5‐point scale, 5 = excellent): hospitalists 4.8 (SD 0.6), general internists 4.5 (SD 0.8), specialists 4.5 (SD 1.1); P < 0.001 for comparison of hospitalists vs. nonhospitalist generalists, P = 0.03 for comparison of hospitalists vs. subspecialists. Attending knowledge (9‐point scale): hospitalists 8.2 (SD 1.1), nonhospitalists 7.9 (SD 1.2), subspecialists 8.1 (SD 1.5); P < 0.01 for comparison of hospitalists vs. nonhospitalist generalists, P = 0.10 for comparison of hospitalists vs. subspecialists. Attending valuation of trainee opinions (9‐point scale): hospitalists 8.3 (SD 0.9), nonhospitalist generalists 8.2 (SD 1.3), subspecialists 8.1 (SD 1.7); P = 0.20 for comparison of hospitalists vs. nonhospitalist generalists; P = 0.60 for comparison of hospitalist vs. subspecialists. Provision of feedback (9‐point scale): hospitalists 7.9 (SD 1.6), nonhospitalist generalists 7.2 (SD 2.3), subspecialists 7.0 (SD 2.5); P < 0.01 for comparison of hospitalists vs. nonhospitalist generalists, P = 0.01 for comparison of hospitalists vs. subspecialists. | 4 |
| Kripalani et al.,48 Grady Memorial, 2004 | Retrospective, quasirandomized with contemporaneous controls | Internal medicine house staff, MS4 and MS3 satisfaction with Internal Medicine attending teaching effectiveness (25‐item McGill Clinical Tutor Evaluation, maximum score 150): hospitalists 134.5 (95% CI, 130.2‐138.8), general internists 135.0 (95% CI, 131.2‐138.8), specialists 126.3 (95% CI, 120.4‐132.1). | 3 |
| Geskey and Kees‐Folts,49 Penn State Children's Hospital, 2007 | Retrospective, quasirandomized with contemporaneous controls | MS3 overall satisfaction with Pediatric attending teaching (4‐point scale, 4 = excellent), hospitalists 3.9, nonhospitalists 3.0. MS3s rated hospitalists higher than nonhospitalists in all 4 attending characteristics measured: teaching effectiveness, effectiveness as a pediatrician, student advocacy effectiveness, and overall. | 3 |
| Arora et al.,50 Multiple sites, 2005*, | Retrospective, quasirandomized with contemporaneous controls | MS3 overall satisfaction with Internal Medicine clerkship (5‐point scale, 5 = very satisfied): hospitalists 4.5, nonhospitalists 4.3. Trends toward greater emphasis on education (P = 0.07) and higher quality attending rounds (P = 0.07) with hospitalists. Effects of hospitalists on resident perceptions of autonomy not reported. | 2 |
| Chintharajah and Aronowitz,51 California Pacific Medical Center, 2006* | Retrospective, with contemporaneous controls. Method of assignment to attending type not stated. | Internal Medicine house staff ratings of Internal Medicine attendings: Using a 9‐point scale in 1998‐2002, then 5‐point scale in 2003‐2005, Hospitalists were rated higher than nonhospitalists in all areas assessed in 1998‐2002, but were rated higher in only 3 areas in 2003‐2005 (accessibility, feedback, and teaching procedures.) Data not shown. | 1 |
Of the 8 studies comparing hospitalists to all nonhospitalists, trainees were statistically significantly more satisfied with hospitalists in all but 1 (Table 3).4451 Hospitalists' overall teaching effectiveness was rated significantly higher in 4 studies,44, 47, 49, 50 but 1 did not demonstrate a difference.46 Hospitalists were also rated higher at feedback delivery compared to all nonhospitalists, with 2 studies45, 47 and 1 abstract reporting hospitalists' superiority. One other study showed increased satisfaction with hospitalists' feedback only compared to subspecialists.48 Hospitalists were perceived as being more knowledgeable and allowing greater trainee involvement in patient care decisions, in 2 of 3 studies addressing each of these questions. In order to evaluate preconceived notions, 1 study demonstrated that residents who never worked with hospitalists were significantly more concerned about hospitalists negatively impacting their clinical autonomy than residents who had worked with hospitalists at least once.44
Hospitalists were rated as more available in 1 study45 with a trend toward more availability in another.47 Trainee satisfaction was higher with hospitalists on other measures including quality of ward rounds,44, 49 effectiveness as a role model,45, 48 communication of rotations' goals,46 emphasis on evidence‐based medicine,48 and emphasis on cost‐effective care.47 In 1 study, trainees were significantly more satisfied with the bedside teaching of nonhospitalists.45 In another, trainees felt that, compared to hospitalists, general internists seemed to be more interested in the psychosocial aspects of patients' care.48
Trainee Evaluations Comparing Hospitalists to Outpatient Generalists and Subspecialists
Of the studies that examined whether the type of nonhospitalist (general internist vs. subspecialist) impacted trainee ratings, 1 showed that trainees were equally satisfied with hospitalists and general internists but that general internists were rated higher than hospitalists for feedback delivery.48 Hospitalists were rated significantly higher than subspecialists overall and for feedback delivery.48 The other study that subclassified nonhospitalists into general internists and subspecialists showed that hospitalists were more highly rated than both general internists and subspecialists overall and for teaching effectiveness and feedback delivery.47
DISCUSSION
This systematic review of the literature describing hospitalists as educators shows that trainees are generally more satisfied with hospitalists than nonhospitalists on their inpatient rotations. Hospitalists were rated more highly than traditional ward attendings overall, and for teaching effectiveness44, 47, 49, 50 and feedback delivery.45, 47 Limited data (3 studies each) indicates that trainees perceive hospitalists as being at least as knowledgeable as traditional attendings, and encouraging similar levels of trainee involvement in patient care decisions. Trainees may be more satisfied with hospitalists than with general internists or subspecialists, although some comparisons have shown that general internists may be preferred. No studies have evaluated the impact of hospitalists on trainee outcomes beyond satisfaction, such as knowledge acquisition, rotation grades, or clinical performance.
Our review suggests that, with increased time spent on the wards, hospitalists exhibit attributes consistent with specialization in inpatient care.1, 14 Hospitalists were noted to emphasize cost‐effectiveness47 and evidence‐based medicine48 and to conduct higher‐quality ward rounds.44, 49 Hospitalists are uniquely qualified to teach about inpatient goals and processes such as decreasing length of stay in the hospital and cost‐effective care.1, 3, 7, 12, 15 Trainees see hospitalists as role models,45, 47 and the site‐defined nature of hospital medicine promotes trainees' access to hospitalist attendings. Such accessibility has been described as an independent attribute of excellent physician role models,59, 60, 62 Our findings from our methodologically rigorous systematic review of the literature extend the conclusions of a narrative review of the literature on hospitalists as educators that also identified favorable ratings of hospitalists, with some unresolved concerns about resident autonomy and the role of subspecialist teachers in hospitalist systems.63
Diminished trainee autonomy was an early concern about hospitalists in academic medical centers.16, 20, 21 In the earliest study we identified that assessed autonomy, trainees perceived similar amounts of autonomy with hospitalists compared to nonhospitalists.44 Interestingly, house staff in more experienced hospitalist models even described experiencing increased involvement in patient care when supervised by hospitalist attendings in both the pediatric and internal medicine settings.45, 47 Hospitalists might also generate more clinical diversity for house staff by reducing length of stay and thereby enhancing opportunities for learning with newly admitted patients.13, 14, 64
The studies that did not demonstrate increased satisfaction with hospitalists may be instructive as well. One negative study46 reported results from a program that instituted the hospitalist model in response to declining trainee satisfaction. With an emphasis on improving the educational experience, nonhospitalist physicians who were already rated highly as teachers were also selected to attend on the wards. Nonetheless, trainees still were more satisfied with hospitalists overall. One study showed that hospitalists were rated more highly than subspecialists when delivering feedback but less so than general internists.47 The authors suggest that their general internists may have been at a more optimum demographic by being a few more years out of training; such correlations of age and rank to evaluations have not been previously described.60, 61
The disadvantages of hospitalists in trainee education identified by this systematic review include the quality of bedside teaching in one study45 and interest in psychosocial aspects of care in another48 compared to general internists. The decline in satisfaction with bedside teaching is a concern but the comparison was noncontemporaneous and the authors explained that the team size increased and resulted in an overall decrease in time at the bedside.45 The concern that decreased patient length of stays may translate to less time spent with patients and less bedside teaching is not new.18 Although hospitalists have shown particular educational advantages, the balance of clinical efficiency and education remains challenging. Trainees' perception that hospitalists were less interested in the psychosocial aspects of care compared to general internists48 was also anticipated when inpatient attending models began to shift, because hospitalization may now be viewed by trainees as discontinuous from a patient's outpatient care and social situation.18 Nevertheless, hospitalists have been able to achieve such quality measures as decreased length of stay without decreasing patient satisfaction.10, 12
Our study has several limitations. First, all attendings were rated highly in all studies. These high ratings are commonly seen with educational evaluations,65 and this phenomenon creates a ceiling effect that limits variability within the group. Nevertheless, trainees rated hospitalists significantly higher than nonhospitalists overall in all of the included studies. The impact of these small but significant differences on trainees' learning and future clinical performance is unknown. Additionally, the distinction between hospitalists and nonhospitalists was not universal. Initially, it was proposed that academic hospitalists work as hospitalists 3 to 6 months each year.1 This definition is sustained through almost all included studies that reported attending time on the wards, with hospitalists working 3 to 7 months and nonhospitalists working less than 3 months, but observed variability does not permit a universal hospitalist definition. It is possible that publication bias influenced our findings toward positive ratings of hospitalists; we reviewed and included meeting abstracts to minimize this bias. We did not review family medicine meeting abstracts.
The included studies had some methodologic strengths, including quasirandom assignment of trainees and use of a contemporaneous control group in almost all studies. However, the overall methodologic strength was fair given limitations in response rates and reporting of cointerventions; we thus considered most studies to represent trends rather than definitive results. Finally, all of the studies meeting our inclusion criteria to date only evaluated trainees' attitudes and beliefs. Because knowledge and skills were not objectively assessed, it is unclear how increased trainee satisfaction translates to knowledge and skill acquisition on the wards. However, Miller's pyramid and its proposed modification, the Cambridge model, suggest that targeting attitudes precedes knowledge acquisition,66 and our study suggests the need for a research agenda examining the impact of hospitalists on trainees' future performance. Griffith et al.67 demonstrated an association between increased satisfaction with teaching and medical students' performance on clerkship examinations and the U.S. Medical Licensing Examination (USMLE) Step 2.
Overall, trainees were more satisfied with hospitalists' teaching and feedback delivery. Our literature search shows that, although there are a limited number of studies of varying level of quality that cannot be compared using meta‐analytic techniques, the currently available data suggests that hospitalists lead to improved learner satisfaction. More studies to delineate the differences between hospitalists and nonhospitalist general internists are needed. Continued exploration of the effects of attending age and rank on trainee learning may help determine whether this effect is reproducible, and what facets of attendings' teaching actually impact trainees' knowledge, skill acquisition, and behaviors. Since all studies only evaluated attitudes, studies analyzing knowledge and skills are required to more fully understand the educational outcomes of the hospitalist model.
- , .The emerging role of “hospitalists” in the American health care system.N Engl J Med.1996;335:514–517.
- Society of Hospital Medicine. Definition of a Hospitalist. Available at: http://www.hospitalmedicine.org/AM/Template.cfm?Section=General_ Information130:343–349.
- Society of Hospital Medicine. Hospital Medicine Specialty Shows 20 Percent Growth. Available at: http://www.hospitalmedicine.org/AM/Template. cfm?Section=Press_Releases21:1079–1085.
- , , , .The status of hospital medicine groups in the United States.J Hosp Med.2006;1:75–80.
- , , , , .Assessing the value of hospitalists to academic health centers: Brigham and Women's Hospital and Harvard Medical School.Am J Med.1999;106:134–137.
- , , , , .Reorganizing an academic medical service. Impact on cost, quality, patient satisfaction, and education.JAMA.1998;279:1560–1565.
- , .Implications of the hospitalist movement for academic departments of medicine: lessons from the UCSF experience.Am J Med.1999;106:127–133.
- , , , et al.Effects of hospitalists on cost, outcomes, and patient satisfaction in a rural health system.Am J Med.2000;108:621–626.
- , , , et al.Implementation of a hospitalist system in a large health maintenance organization: the Kaiser Permanente experience.Ann Intern Med.1999;130:355–359.
- , , , .The impact of an inpatient physician program on quality, utilization, and satisfaction.Am J Manag Care.2000;6:549–555.
- , , .Decreased length of stay, costs and mortality in a randomized trial of academic hospitalists.J Gen Intern Med.2001;16:S208.
- , , , , , .Implementation of a voluntary hospitalist service at a community teaching hospital: improved clinical efficiency and patient outcomes.Ann Intern Med.2002;137(11):859–865.
- , , , , , .Outcomes of care by hospitalists, general internists, and family physicians.N Engl J Med.2007;357(25):2589–2600.
- .The impact of hospitalists on medical education and the academic health system.Ann Intern Med.1999;130:364–367.
- , .The role of hospitalists in medical education.Am J Med.1999;107:305–309.
- , .Implications of the hospitalist model for medical students' education.Acad Med.2001;76:324–330.
- , .Changing teaching for changing times: the effect of a hospitalist program on the education of students.Acad Med.2000;75:521.
- .Reflections: the hospitalist movement a decade later.J Hosp Med.2006;1(4):248–252.
- .Response to the effect of hospitalist systems on residency education: re‐incorporating medical subspecialists.Acad Med.2001;76:555–556.
- Best Evidence Medical Education (BEME) Collaboration, Dundee, UK. Home page. Available at: http://www.bemecollaboration.org. Accessed May2009.
- .Evaluation of Training. In: Craig R, Mittel I, eds.Training and Development Handbook.New York:McGraw‐Hill;1967:87–112.
- , , , et al.The positive impact of initiation of hospitalist clinician educators.J Gen Intern Med.2004;19(4):293–301.
- , , , .Evaluation of a staff‐only hospitalist system in a tertiary care, academic children's hospital.Pediatrics.2004;114(6):1545–1549.
- .How pediatric hospitalist programs can affect graduate medical education.Pediatr Ann.2003;32(12):822–824.
- .A “hospitalist” rotation increases short‐term knowledge of fourth‐year medical students.South Med J.2002;95(3):374.
- .The hospitalist movement 10 years later: life as a Swiss army knife.MedGenMed.2006;8(3):30.
- , , , , .Managing discontinuity in academic medical centers: strategies for a safe and effective resident sign‐out.J Hosp Med.2006;1(4):257–266.
- .Hospitalists in medical education: coming to an academic medical center near you.J Natl Med Assoc.2006;98(9):1501–1504.
- , .Teaching residents to consider costs in medical decision making.Am J Bioeth.2006;6(4):33–34.
- Association of Program Directors in Internal Medicine;, , , , .Redesigning residency education in internal medicine: a position paper from the Association of Program Directors in Internal Medicine.Ann Intern Med.2006;144(12):920–926.
- , , , .Hospital medicine fellowships: works in progress.Am J Med.2006;119(1):72.e1–e7.
- .Employing hospitalists to improve residents' inpatient learning.Acad Med.2001;76(5):556.
- , , , , .The spectrum of community‐based hospitalist practice: a call to tailor internal medicine residency training.Arch Intern Med.2007;167(7):727–728.
- , , , , .How to use the core competencies in hospital medicine: a framework for curriculum development.J Hosp Med.2006;1(suppl 1):57–67.
- , , , , .Core competencies in hospital medicine: development and methodology.J Hosp Med.2006;1(suppl 1):48–56.
- , , .How hospitalists spend their time: insights on efficiency and safety.J Hosp Med.2006;1(2):88–93.
- .Determining the professional attributes of a hospitalist: experience in one Australian metropolitan hospital.Intern Med J.2005;35(5):305–308.
- .The internal medicine clerkship: the view from the vantage point of one chair of medicine.Am J Med.1999;107(2):109–111.
- , , , , .The presence of hospitalists in medical education.Acad Med.2000;75(10 suppl):S34–S36.
- , , , et al.Learning opportunities for Australian prevocational hospital doctors: exposure, perceived quality and desired methods of learning.Med J Aust.2006;184(9):436–440.
- , , , , .Training the ideal hospital doctor: the specialist registrars' perspective.Med Educ.2001;35(10):957–966.
- , , , , , .Resident satisfaction on an academic hospitalist service: time to teach.Am J Med.2002;112(7):597–601.
- , , , , , .Effect of a pediatric hospitalist system on housestaff education and experience.Arch Pediatr Adolesc Med.2002;156(9):877–883.
- , , , .Medical student evaluation of the quality of hospitalist and nonhospitalist teaching faculty on inpatient medicine rotations.Acad Med.2004;79(1):78–82.
- , , , , .Effects of hospitalist attending physicians on trainee satisfaction with teaching and with internal medicine rotations.Arch Intern Med.2004;164(17):1866–1871.
- , , , et al.Hospitalists as teachers.J Gen Intern Med.2004;19(1):8–15.
- , .Third‐year medical students' evaluation of hospitalist and nonhospitalist faculty during the inpatient portion of their pediatrics clerkships.J Hosp Med.2007;2(1):17–22.
- , , , et al. The effects of hospitalist teaching attendings on medical student satisfaction and career interest: results from the multicenter hospitalist study. Society of Hospital Medicine;2005 Annual Meeting Abstracts.
- , . Hospitalist teachers may lose their superiority over non‐hospitalist teachers in “mature” hospitalist systems. Society of General Internal Medicine;2006 Annual Meeting Abstracts.
- , , , . Medical student evaluation of the quality of hospitalist and non‐hospitalist teaching faculty on inpatient medicine rotations. Society of Hospital Medicine;2003 Annual Meeting Abstracts.
- , , , . Effects of hospitalist attendings on trainee satisfaction with rotations. Society of General Internal Medicine;2002 Annual Meeting Abstracts.
- , , . Internal medicine and orthopedic residents' perception of education and satisfaction after the initiation of a non‐resident hospitalist service. Society of Hospital Medicine;2004 Annual Meeting Abstracts.
- , , , . Medical subinternship: student experience on a resident uncovered hospitalist service. Society of Hospital Medicine;2006 Annual Meeting Abstracts.
- , , , , . A randomized controlled trial to evaluate the effect of dedicated clinical teachers (or “Educationalists”) on the internal medicine clerkship experience. Society of General Internal Medicine;2002 Annual Meeting Abstracts.
- , , . Internal medicine residency program goals drive the development of hospitalist programs at teaching hospitals. Society of Hospital Medicine;2002 Annual Meeting Abstracts.
- , . The role of the hospitalist in teaching. Society of General Internal Medicine;2003 Annual Meeting Abstracts.
- , , .Clinical tutor evaluation: a 5‐year study by students on an inpatient service and residents in an ambulatory care clinic.Med Educ.1993;27:48–54.
- , , , , .Attributes of excellent attending‐physician role models.N Engl J Med.1998;339:1986–1992.
- , , .Factors affecting ratings of clinical teachers by medical students and residents.J Med Educ.1987;62:1–7.
- , , , .Attending rounds: a survey of physician attitudes.J Gen Intern Med.1990;5:229–233.
- , .Hospitalist educators: future of inpatient internal medicine training.Mt Sinai J Med.2008;75:430–435.
- , , , .Pediatric hospitalists: a systematic review of the literature.Pediatrics.2006;117:1736–1744.
- , , .Grade inflation in internal medicine clerkships: results of a national survey.Teach Learn Med.2000;12:112–116.
- , , , et al.The relationship between competence and performance: implications for assessing practice performance.Med Educ.2002;36(10):901–909.
- , , .Six‐year documentation of the association between excellent clinical teaching and improved students' examination performances.Acad Med.2000;75(10 suppl):S62–S64.
