User login
Examining the Interfacility Variation of Social Determinants of Health in the Veterans Health Administration
Social determinants of health (SDoH) are social, economic, environmental, and occupational factors that are known to influence an individual’s health care utilization and clinical outcomes.1,2 Because the Veterans Health Administration (VHA) is charged to address both the medical and nonmedical needs of the veteran population, it is increasingly interested in the impact SDoH have on veteran care.3,4 To combat the adverse impact of such factors, the VHA has implemented several large-scale programs across the US that focus on prevalent SDoH, such as homelessness, substance abuse, and alcohol use disorders.5,6 While such risk factors are generally universal in their distribution, variation across regions, between urban and rural spaces, and even within cities has been shown to exist in private settings.7 Understanding such variability potentially could be helpful to US Department of Veterans Affairs (VA) policymakers and leaders to better allocate funding and resources to address such issues.
Although previous work has highlighted regional and neighborhood-level variability of SDoH, no study has examined the facility-level variability of commonly encountered social risk factors within the VHA.4,8 The aim of this study was to describe the interfacility variation of 5 common SDoH known to influence health and health outcomes among a national cohort of veterans hospitalized for common medical issues by using administrative data.
Methods
We used a national cohort of veterans aged ≥ 65 years who were hospitalized at a VHA acute care facility with a primary discharge diagnosis of acute myocardial infarction (AMI), heart failure (HF), or pneumonia in 2012. These conditions were chosen because they are publicly reported and frequently used for interfacility comparison.
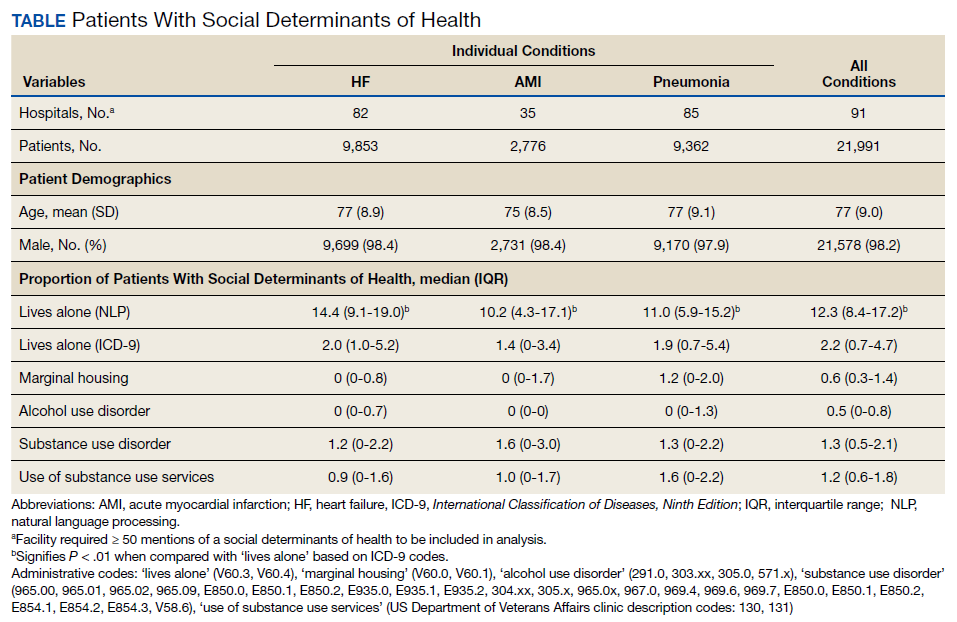
Using the International Classification of Diseases–9th Revision (ICD-9) and VHA clinical stop codes, we calculated the median documented proportion of patients with any of the following 5 SDoH: lived alone, marginal housing, alcohol use disorder, substance use disorder, and use of substance use services for patients presenting with HF, MI, and pneumonia (Table). These SDoH were chosen because they are intervenable risk factors for which the VHA has several programs (eg, homeless outreach, substance abuse, and tobacco cessation). To examine the variability of these SDoH across VHA facilities, we determined the number of hospitals that had a sufficient number of admissions (≥ 50) to be included in the analyses. We then examined the administratively documented, facility-level variation in the proportion of individuals with any of the 5 SDoH administrative codes and examined the distribution of their use across all qualifying facilities.
Because variability may be due to regional coding differences, we examined the difference in the estimated prevalence of the risk factor lives alone by using a previously developed natural language processing (NLP) program.9 The NLP program is a rule-based system designed to automatically extract information that requires inferencing from clinical notes (eg, discharge summaries and nursing, social work, emergency department physician, primary care, and hospital admission notes). For instance, the program identifies whether there was direct or indirect evidence that the patient did or did not live alone. In addition to extracting data on lives alone, the NLP program has the capacity to extract information on lack of social support and living alone—2 characteristics without VHA interventions, which were not examined here. The NLP program was developed and evaluated using at least 1 year of notes prior to index hospitalization. Because this program was developed and validated on a 2012 data set, we were limited to using a cohort from this year as well.
All analyses were conducted using SAS Version 9.4. The San Francisco VA Medical Center Institutional Review Board approved this study.
Results
In total, 21,991 patients with either HF (9,853), pneumonia (9,362), or AMI (2,776) were identified across 91 VHA facilities. The majority were male (98%) and had a median (SD) age of 77.0 (9.0) years. The median facility-level proportion of veterans who had any of the SDoH risk factors extracted through administrative codes was low across all conditions, ranging from 0.5 to 2.2%. The most prevalent factors among patients admitted for HF, AMI, and pneumonia were lives alone (2.0% [Interquartile range (IQR), 1.0-5.2], 1.4% [IQR, 0-3.4], and 1.9% [IQR, 0.7-5.4]), substance use disorder (1.2% [IQR, 0-2.2], 1.6% [IQR: 0-3.0], and 1.3% [IQR, 0-2.2] and use of substance use services (0.9% [IQR, 0-1.6%], 1.0% [IQR, 0-1.7%], and 1.6% [IQR, 0-2.2%], respectively [Table]).
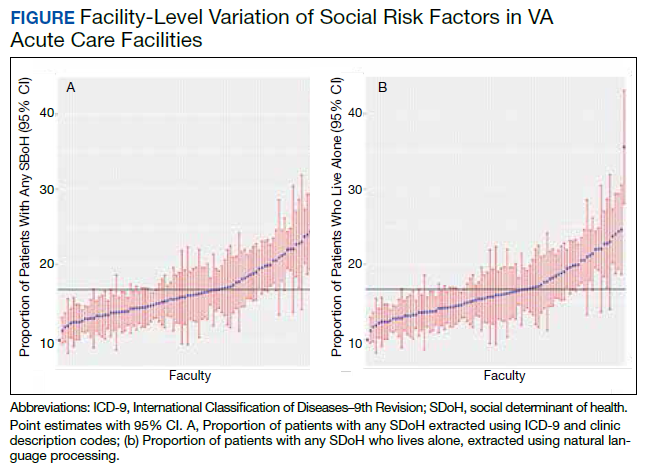
When utilizing the NLP algorithm, the documented prevalence of lives alone in the free text of the medical record was higher than administrative coding across all conditions (12.3% vs. 2.2%; P < .01). Among each of the 3 assessed conditions, HF (14.4% vs 2.0%, P < .01) had higher levels of lives alone compared with pneumonia (11% vs 1.9%, P < .01), and AMI (10.2% vs 1.4%, P < .01) when using the NLP algorithm. When we examined the documented facility-level variation in the proportion of individuals with any of the 5 SDoH administrative codes or NLP, we found large variability across all facilities—regardless of extraction method (Figure).
Discussion
While SDoH are known to impact health outcomes, the presence of these risk factors in administrative data among individuals hospitalized for common medical issues is low and variable across VHA facilities. Understanding the documented, facility-level variability of these measures may assist the VHA in determining how it invests time and resources—as different facilities may disproportionately serve a higher number of vulnerable individuals. Beyond the VHA, these findings have generalizable lessons for the US health care system, which has come to recognize how these risk factors impact patients’ health.10
Although the proportion of individuals with any of the assessed SDoH identified by administrative data was low, our findings are in line with recent studies that showed other risk factors such as social isolation (0.65%), housing issues (0.19%), and financial strain (0.07%) had similarly low prevalence.8,11 Although the exact prevalence of such factors remains unclear, these findings highlight that SDoH do not appear to be well documented in administrative data. Low coding rates are likely due to the fact that SDoH administrative codes are not tied to financial reimbursement—thus not incentivizing their use by clinicians or hospital systems.
In 2014, an Institute of Medicine report suggested that collection of SDoH in electronic health data as a means to better empower clinicians and health care systems to address social disparities and further support research in SDoH.12 Since then, data collection using SDoH screening tools has become more common across settings, but is not consistently translated to standardized data due to lack of industry consensus and technical barriers.13 To improve this process, the Centers for Medicare and Medicaid Services created “z-codes” for the ICD-10 classification system—a subset of codes that are meant to better capture patients’ underlying social risk.14 It remains to be seen if such administrative codes have improved the documentation of SDoH.
As health care systems have grown to understand the impact of SDoH on health outcomes,other means of collecting these data have evolved.1,10 For example, NLP-based extraction methods and electronic screening tools have been proposed and utilized as alternative for obtaining this information. Our findings suggest that some of these measures (eg, lives alone) often may be documented as part of routine care in the electronic health record, thus highlighting NLP as a tool to obtain such data. However, other studies using NLP technology to extract SDoH have shown this technology is often complicated by quality issues (ie, missing data), complex methods, and poor integration with current information technology infrastructures—thus limiting its use in health care delivery.15-18
While variance among SDoH across a national health care system is natural, it remains an important systems-level characteristic that health care leaders and policymakers should appreciate. As health care systems disperse financial resources and initiate quality improvement initiatives to address SDoH, knowing that not all facilities are equally affected by SDoH should impact allocation of such resources and energies. Although previous work has highlighted regional and neighborhood levels of variation within the VHA and other health care systems, to our knowledge, this is the first study to examine variability at the facility-level within the VHA.2,4,13,19
Limitations
There are several limitations to this study. First, though our findings are in line with previous data in other health care systems, generalizability beyond the VA, which primarily cares for older, male patients, may be limited.8 Though, as the nation’s largest health care system, lessons from the VHA can still be useful for other health care systems as they consider SDoH variation. Second, among the many SDoH previously identified to impact health, our analysis only focused on 5 such variables. Administrative and medical record documentation of other SDoH may be more common and less variable across institutions. Third, while our data suggests facility-level variation in these measures, this may be in part related to variation in coding across facilities. However, the single SDoH variable extracted using NLP also varied at the facility-level, suggesting that coding may not entirely drive the variation observed.
Conclusions
As US health care systems continue to address SDoH, our findings highlight the various challenges in obtaining accurate data on a patient’s social risk. Moreover, these findings highlight the large variability that exists among institutions in a national integrated health care system. Future work should explore the prevalence and variance of other SDoH as a means to help guide resource allocation and prioritize spending to better address SDoH where it is most needed.
Acknowledgments
This work was supported by NHLBI R01 RO1 HL116522-01A1. Support for VA/CMS data is provided by the US Department of Veterans Affairs, Veterans Health Administration, Office of Research and Development, Health Services Research and Development, VA Information Resource Center (Project Numbers SDR 02-237 and 98-004).
1. Social determinants of health (SDOH). https://catalyst.nejm.org/doi/full/10.1056/CAT.17.0312. Published December 1, 2017. Accessed December 8, 2020.
2. Hatef E, Searle KM, Predmore Z, et al. The Impact of Social Determinants of Health on hospitalization in the Veterans Health Administration. Am J Prev Med. 2019;56(6):811-818. doi:10.1016/j.amepre.2018.12.012
3. Lushniak BD, Alley DE, Ulin B, Graffunder C. The National Prevention Strategy: leveraging multiple sectors to improve population health. Am J Public Health. 2015;105(2):229-231. doi:10.2105/AJPH.2014.302257
4. Nelson K, Schwartz G, Hernandez S, Simonetti J, Curtis I, Fihn SD. The association between neighborhood environment and mortality: results from a national study of veterans. J Gen Intern Med. 2017;32(4):416-422. doi:10.1007/s11606-016-3905-x
5. Gundlapalli AV, Redd A, Bolton D, et al. Patient-aligned care team engagement to connect veterans experiencing homelessness with appropriate health care. Med Care. 2017;55 Suppl 9 Suppl 2:S104-S110. doi:10.1097/MLR.0000000000000770
6. Rash CJ, DePhilippis D. Considerations for implementing contingency management in substance abuse treatment clinics: the Veterans Affairs initiative as a model. Perspect Behav Sci. 2019;42(3):479-499. doi:10.1007/s40614-019-00204-3.
7. Ompad DC, Galea S, Caiaffa WT, Vlahov D. Social determinants of the health of urban populations: methodologic considerations. J Urban Health. 2007;84(3 Suppl):i42-i53. doi:10.1007/s11524-007-9168-4
8. Hatef E, Rouhizadeh M, Tia I, et al. Assessing the availability of data on social and behavioral determinants in structured and unstructured electronic health records: a retrospective analysis of a multilevel health care system. JMIR Med Inform. 2019;7(3):e13802. doi:10.2196/13802
9. Conway M, Keyhani S, Christensen L, et al. Moonstone: a novel natural language processing system for inferring social risk from clinical narratives. J Biomed Semantics. 2019;10(1):6. doi:10.1186/s13326-019-0198-0
10. Adler NE, Cutler DM, Fielding JE, et al. Addressing social determinants of health and health disparities: a vital direction for health and health care. Discussion Paper. NAM Perspectives. National Academy of Medicine, Washington, DC. doi:10.31478/201609t
11. Cottrell EK, Dambrun K, Cowburn S, et al. Variation in electronic health record documentation of social determinants of health across a national network of community health centers. Am J Prev Med. 2019;57(6):S65-S73. doi:10.1016/j.amepre.2019.07.014
12. Committee on the Recommended Social and Behavioral Domains and Measures for Electronic Health Records, Board on Population Health and Public Health Practice, Institute of Medicine. Capturing Social and Behavioral Domains and Measures in Electronic Health Records: Phase 2. National Academies Press (US); 2015.
13. Gottlieb L, Tobey R, Cantor J, Hessler D, Adler NE. Integrating Social And Medical Data To Improve Population Health: Opportunities And Barriers. Health Aff (Millwood). 2016;35(11):2116-2123. doi:10.1377/hlthaff.2016.0723
14. Centers for Medicare and Medicaid Service, Office of Minority Health. Z codes utilization among medicare fee-for-service (FFS) beneficiaries in 2017. Published January 2020. Accessed December 8, 2020. https://www.cms.gov/files/document/cms-omh-january2020-zcode-data-highlightpdf.pdf
15. Kharrazi H, Wang C, Scharfstein D. Prospective EHR-based clinical trials: the challenge of missing data. J Gen Intern Med. 2014;29(7):976-978. doi:10.1007/s11606-014-2883-0
16. Weiskopf NG, Weng C. Methods and dimensions of electronic health record data quality assessment: enabling reuse for clinical research. J Am Med Inform Assoc. 2013;20(1):144-151. doi:10.1136/amiajnl-2011-000681
17. Anzaldi LJ, Davison A, Boyd CM, Leff B, Kharrazi H. Comparing clinician descriptions of frailty and geriatric syndromes using electronic health records: a retrospective cohort study. BMC Geriatr. 2017;17(1):248. doi:10.1186/s12877-017-0645-7
18. Chen T, Dredze M, Weiner JP, Kharrazi H. Identifying vulnerable older adult populations by contextualizing geriatric syndrome information in clinical notes of electronic health records. J Am Med Inform Assoc. 2019;26(8-9):787-795. doi:10.1093/jamia/ocz093
19. Raphael E, Gaynes R, Hamad R. Cross-sectional analysis of place-based and racial disparities in hospitalisation rates by disease category in California in 2001 and 2011. BMJ Open. 2019;9(10):e031556. doi:10.1136/bmjopen-2019-031556
Social determinants of health (SDoH) are social, economic, environmental, and occupational factors that are known to influence an individual’s health care utilization and clinical outcomes.1,2 Because the Veterans Health Administration (VHA) is charged to address both the medical and nonmedical needs of the veteran population, it is increasingly interested in the impact SDoH have on veteran care.3,4 To combat the adverse impact of such factors, the VHA has implemented several large-scale programs across the US that focus on prevalent SDoH, such as homelessness, substance abuse, and alcohol use disorders.5,6 While such risk factors are generally universal in their distribution, variation across regions, between urban and rural spaces, and even within cities has been shown to exist in private settings.7 Understanding such variability potentially could be helpful to US Department of Veterans Affairs (VA) policymakers and leaders to better allocate funding and resources to address such issues.
Although previous work has highlighted regional and neighborhood-level variability of SDoH, no study has examined the facility-level variability of commonly encountered social risk factors within the VHA.4,8 The aim of this study was to describe the interfacility variation of 5 common SDoH known to influence health and health outcomes among a national cohort of veterans hospitalized for common medical issues by using administrative data.
Methods
We used a national cohort of veterans aged ≥ 65 years who were hospitalized at a VHA acute care facility with a primary discharge diagnosis of acute myocardial infarction (AMI), heart failure (HF), or pneumonia in 2012. These conditions were chosen because they are publicly reported and frequently used for interfacility comparison.
Using the International Classification of Diseases–9th Revision (ICD-9) and VHA clinical stop codes, we calculated the median documented proportion of patients with any of the following 5 SDoH: lived alone, marginal housing, alcohol use disorder, substance use disorder, and use of substance use services for patients presenting with HF, MI, and pneumonia (Table). These SDoH were chosen because they are intervenable risk factors for which the VHA has several programs (eg, homeless outreach, substance abuse, and tobacco cessation). To examine the variability of these SDoH across VHA facilities, we determined the number of hospitals that had a sufficient number of admissions (≥ 50) to be included in the analyses. We then examined the administratively documented, facility-level variation in the proportion of individuals with any of the 5 SDoH administrative codes and examined the distribution of their use across all qualifying facilities.
Because variability may be due to regional coding differences, we examined the difference in the estimated prevalence of the risk factor lives alone by using a previously developed natural language processing (NLP) program.9 The NLP program is a rule-based system designed to automatically extract information that requires inferencing from clinical notes (eg, discharge summaries and nursing, social work, emergency department physician, primary care, and hospital admission notes). For instance, the program identifies whether there was direct or indirect evidence that the patient did or did not live alone. In addition to extracting data on lives alone, the NLP program has the capacity to extract information on lack of social support and living alone—2 characteristics without VHA interventions, which were not examined here. The NLP program was developed and evaluated using at least 1 year of notes prior to index hospitalization. Because this program was developed and validated on a 2012 data set, we were limited to using a cohort from this year as well.
All analyses were conducted using SAS Version 9.4. The San Francisco VA Medical Center Institutional Review Board approved this study.
Results
In total, 21,991 patients with either HF (9,853), pneumonia (9,362), or AMI (2,776) were identified across 91 VHA facilities. The majority were male (98%) and had a median (SD) age of 77.0 (9.0) years. The median facility-level proportion of veterans who had any of the SDoH risk factors extracted through administrative codes was low across all conditions, ranging from 0.5 to 2.2%. The most prevalent factors among patients admitted for HF, AMI, and pneumonia were lives alone (2.0% [Interquartile range (IQR), 1.0-5.2], 1.4% [IQR, 0-3.4], and 1.9% [IQR, 0.7-5.4]), substance use disorder (1.2% [IQR, 0-2.2], 1.6% [IQR: 0-3.0], and 1.3% [IQR, 0-2.2] and use of substance use services (0.9% [IQR, 0-1.6%], 1.0% [IQR, 0-1.7%], and 1.6% [IQR, 0-2.2%], respectively [Table]).
When utilizing the NLP algorithm, the documented prevalence of lives alone in the free text of the medical record was higher than administrative coding across all conditions (12.3% vs. 2.2%; P < .01). Among each of the 3 assessed conditions, HF (14.4% vs 2.0%, P < .01) had higher levels of lives alone compared with pneumonia (11% vs 1.9%, P < .01), and AMI (10.2% vs 1.4%, P < .01) when using the NLP algorithm. When we examined the documented facility-level variation in the proportion of individuals with any of the 5 SDoH administrative codes or NLP, we found large variability across all facilities—regardless of extraction method (Figure).
Discussion
While SDoH are known to impact health outcomes, the presence of these risk factors in administrative data among individuals hospitalized for common medical issues is low and variable across VHA facilities. Understanding the documented, facility-level variability of these measures may assist the VHA in determining how it invests time and resources—as different facilities may disproportionately serve a higher number of vulnerable individuals. Beyond the VHA, these findings have generalizable lessons for the US health care system, which has come to recognize how these risk factors impact patients’ health.10
Although the proportion of individuals with any of the assessed SDoH identified by administrative data was low, our findings are in line with recent studies that showed other risk factors such as social isolation (0.65%), housing issues (0.19%), and financial strain (0.07%) had similarly low prevalence.8,11 Although the exact prevalence of such factors remains unclear, these findings highlight that SDoH do not appear to be well documented in administrative data. Low coding rates are likely due to the fact that SDoH administrative codes are not tied to financial reimbursement—thus not incentivizing their use by clinicians or hospital systems.
In 2014, an Institute of Medicine report suggested that collection of SDoH in electronic health data as a means to better empower clinicians and health care systems to address social disparities and further support research in SDoH.12 Since then, data collection using SDoH screening tools has become more common across settings, but is not consistently translated to standardized data due to lack of industry consensus and technical barriers.13 To improve this process, the Centers for Medicare and Medicaid Services created “z-codes” for the ICD-10 classification system—a subset of codes that are meant to better capture patients’ underlying social risk.14 It remains to be seen if such administrative codes have improved the documentation of SDoH.
As health care systems have grown to understand the impact of SDoH on health outcomes,other means of collecting these data have evolved.1,10 For example, NLP-based extraction methods and electronic screening tools have been proposed and utilized as alternative for obtaining this information. Our findings suggest that some of these measures (eg, lives alone) often may be documented as part of routine care in the electronic health record, thus highlighting NLP as a tool to obtain such data. However, other studies using NLP technology to extract SDoH have shown this technology is often complicated by quality issues (ie, missing data), complex methods, and poor integration with current information technology infrastructures—thus limiting its use in health care delivery.15-18
While variance among SDoH across a national health care system is natural, it remains an important systems-level characteristic that health care leaders and policymakers should appreciate. As health care systems disperse financial resources and initiate quality improvement initiatives to address SDoH, knowing that not all facilities are equally affected by SDoH should impact allocation of such resources and energies. Although previous work has highlighted regional and neighborhood levels of variation within the VHA and other health care systems, to our knowledge, this is the first study to examine variability at the facility-level within the VHA.2,4,13,19
Limitations
There are several limitations to this study. First, though our findings are in line with previous data in other health care systems, generalizability beyond the VA, which primarily cares for older, male patients, may be limited.8 Though, as the nation’s largest health care system, lessons from the VHA can still be useful for other health care systems as they consider SDoH variation. Second, among the many SDoH previously identified to impact health, our analysis only focused on 5 such variables. Administrative and medical record documentation of other SDoH may be more common and less variable across institutions. Third, while our data suggests facility-level variation in these measures, this may be in part related to variation in coding across facilities. However, the single SDoH variable extracted using NLP also varied at the facility-level, suggesting that coding may not entirely drive the variation observed.
Conclusions
As US health care systems continue to address SDoH, our findings highlight the various challenges in obtaining accurate data on a patient’s social risk. Moreover, these findings highlight the large variability that exists among institutions in a national integrated health care system. Future work should explore the prevalence and variance of other SDoH as a means to help guide resource allocation and prioritize spending to better address SDoH where it is most needed.
Acknowledgments
This work was supported by NHLBI R01 RO1 HL116522-01A1. Support for VA/CMS data is provided by the US Department of Veterans Affairs, Veterans Health Administration, Office of Research and Development, Health Services Research and Development, VA Information Resource Center (Project Numbers SDR 02-237 and 98-004).
1. Social determinants of health (SDOH). https://catalyst.nejm.org/doi/full/10.1056/CAT.17.0312. Published December 1, 2017. Accessed December 8, 2020.
2. Hatef E, Searle KM, Predmore Z, et al. The Impact of Social Determinants of Health on hospitalization in the Veterans Health Administration. Am J Prev Med. 2019;56(6):811-818. doi:10.1016/j.amepre.2018.12.012
3. Lushniak BD, Alley DE, Ulin B, Graffunder C. The National Prevention Strategy: leveraging multiple sectors to improve population health. Am J Public Health. 2015;105(2):229-231. doi:10.2105/AJPH.2014.302257
4. Nelson K, Schwartz G, Hernandez S, Simonetti J, Curtis I, Fihn SD. The association between neighborhood environment and mortality: results from a national study of veterans. J Gen Intern Med. 2017;32(4):416-422. doi:10.1007/s11606-016-3905-x
5. Gundlapalli AV, Redd A, Bolton D, et al. Patient-aligned care team engagement to connect veterans experiencing homelessness with appropriate health care. Med Care. 2017;55 Suppl 9 Suppl 2:S104-S110. doi:10.1097/MLR.0000000000000770
6. Rash CJ, DePhilippis D. Considerations for implementing contingency management in substance abuse treatment clinics: the Veterans Affairs initiative as a model. Perspect Behav Sci. 2019;42(3):479-499. doi:10.1007/s40614-019-00204-3.
7. Ompad DC, Galea S, Caiaffa WT, Vlahov D. Social determinants of the health of urban populations: methodologic considerations. J Urban Health. 2007;84(3 Suppl):i42-i53. doi:10.1007/s11524-007-9168-4
8. Hatef E, Rouhizadeh M, Tia I, et al. Assessing the availability of data on social and behavioral determinants in structured and unstructured electronic health records: a retrospective analysis of a multilevel health care system. JMIR Med Inform. 2019;7(3):e13802. doi:10.2196/13802
9. Conway M, Keyhani S, Christensen L, et al. Moonstone: a novel natural language processing system for inferring social risk from clinical narratives. J Biomed Semantics. 2019;10(1):6. doi:10.1186/s13326-019-0198-0
10. Adler NE, Cutler DM, Fielding JE, et al. Addressing social determinants of health and health disparities: a vital direction for health and health care. Discussion Paper. NAM Perspectives. National Academy of Medicine, Washington, DC. doi:10.31478/201609t
11. Cottrell EK, Dambrun K, Cowburn S, et al. Variation in electronic health record documentation of social determinants of health across a national network of community health centers. Am J Prev Med. 2019;57(6):S65-S73. doi:10.1016/j.amepre.2019.07.014
12. Committee on the Recommended Social and Behavioral Domains and Measures for Electronic Health Records, Board on Population Health and Public Health Practice, Institute of Medicine. Capturing Social and Behavioral Domains and Measures in Electronic Health Records: Phase 2. National Academies Press (US); 2015.
13. Gottlieb L, Tobey R, Cantor J, Hessler D, Adler NE. Integrating Social And Medical Data To Improve Population Health: Opportunities And Barriers. Health Aff (Millwood). 2016;35(11):2116-2123. doi:10.1377/hlthaff.2016.0723
14. Centers for Medicare and Medicaid Service, Office of Minority Health. Z codes utilization among medicare fee-for-service (FFS) beneficiaries in 2017. Published January 2020. Accessed December 8, 2020. https://www.cms.gov/files/document/cms-omh-january2020-zcode-data-highlightpdf.pdf
15. Kharrazi H, Wang C, Scharfstein D. Prospective EHR-based clinical trials: the challenge of missing data. J Gen Intern Med. 2014;29(7):976-978. doi:10.1007/s11606-014-2883-0
16. Weiskopf NG, Weng C. Methods and dimensions of electronic health record data quality assessment: enabling reuse for clinical research. J Am Med Inform Assoc. 2013;20(1):144-151. doi:10.1136/amiajnl-2011-000681
17. Anzaldi LJ, Davison A, Boyd CM, Leff B, Kharrazi H. Comparing clinician descriptions of frailty and geriatric syndromes using electronic health records: a retrospective cohort study. BMC Geriatr. 2017;17(1):248. doi:10.1186/s12877-017-0645-7
18. Chen T, Dredze M, Weiner JP, Kharrazi H. Identifying vulnerable older adult populations by contextualizing geriatric syndrome information in clinical notes of electronic health records. J Am Med Inform Assoc. 2019;26(8-9):787-795. doi:10.1093/jamia/ocz093
19. Raphael E, Gaynes R, Hamad R. Cross-sectional analysis of place-based and racial disparities in hospitalisation rates by disease category in California in 2001 and 2011. BMJ Open. 2019;9(10):e031556. doi:10.1136/bmjopen-2019-031556
The evolution of social media and visual abstracts in hospital medicine
In recent years, social media platforms like Twitter, Facebook, and Instagram have become popular gathering spots for clinicians to connect, engage, and share medical content. Medical journals, which often act as purveyors of this content, have recognized social media’s growing power and influence and have begun looking for ways to better engage their audiences.

In 2016, the Annals of Surgery was looking to better disseminate the work being published in its pages and looked to Twitter as one way of accomplishing this. At the time, most journals were only posting the title or a brief description of the published manuscript and hoping their Twitter followers would click on the article link. As journal editors were finding, if the audience was not immediately familiar with the topic or able to quickly capture the nuances of the study, there was a good chance the reader would continue to scroll past the post and never view the article.
Recognizing that social media heavily relies on visual material to garner attention, Annals turned to Andrew Ibrahim, MD, an architect turned surgeon, to help them rethink their social media strategy. Using the design training he had previously received in his career as an architect, Dr. Ibrahim created a simple visual tool that could be used to capture the often complicated and nuanced aspects of a research study. He called his creation a “visual abstract.”
But what is a visual abstract? Simply, they are visual representations of the key findings of a published manuscript; or put another way, a “movie trailer” to the full manuscript. While they can take many different forms and designs, they often consist of three key components: (1) a simple, easy to understand title, (2) a primary focus on outcomes, and (3) the use of visual cues or images to help the reader absorb and remember the take home message. This simplified delivery of complex information allows the producer to efficiently share complex findings in a format that allows for rapid visualization and interpretation.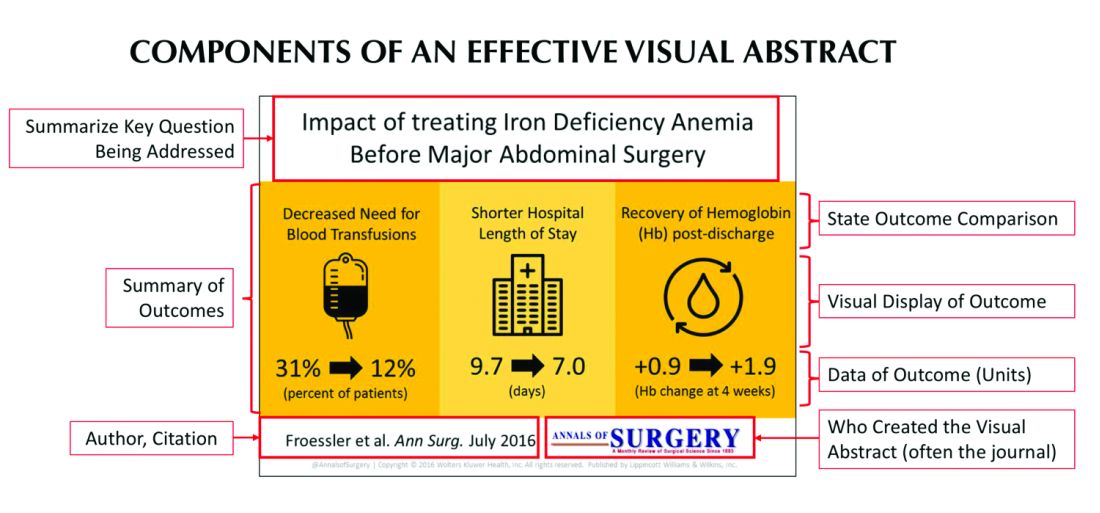
Since its inception, several studies have examined the influence visual abstracts have on disseminating research. One study conducted by Dr. Ibrahim and his colleagues found that articles tweeted with a visual abstract had an almost eightfold increase in the number of Twitter impressions (a measure of social media dissemination) and a threefold increase in article visits, compared with those manuscripts tweeted with the article title only.1 These results reflect what behavioral scientists have long understood: Humans process visual data better than any other type of data.2 For instance, according to research compiled by 3M, the company behind popular sticky notes, visual data is processed 60,000 times faster than text and has been shown to improve learning by 400%.3 Likewise, digital marketers have found that pages with videos and images draw on average 94% more views than their text-only counterparts.4
This knowledge, along with the substantial difference in engagement and dissemination characteristics from Dr. Ibrahim’s study, was far beyond what anyone might have expected and started a trend in medicine that continues to grow today. Medical journals across all practices and disciplines, including several leading journals, such as the New England Journal of Medicine, the Journal of the American Medical Association, and the Journal of Hospital Medicine (JHM), are utilizing this new tool to help disseminate their work in social media.
Visual abstracts have expanded beyond the social media sphere and are now frequently used in Grand Rounds presentations and as teaching tools among medical educators. JHM was one of the first journals to adopt the use of visual abstracts and has since published more than 150 in total. Given the growing popularity and expanded use of visual abstracts, JHM recently began archiving them on the journal’s website to allow clinicians to use the material in their own creative ways.
Visual abstracts are just one piece of the growing enterprise in social media for JHM. Recognizing the growing utilization of social media among physicians, JHM has taken a leading role in the use of online journal clubs. Since 2014, JHM has run a monthly Twitter-based journal club that discusses recently published articles and hospital medicine–based topics, called #JHMChat.5 This forum has allowed hospitalists from across the country, and around the world, to connect, network, and engage around topics important to the field of hospital medicine. The journal frequently reaches beyond hospital medicine borders and partners with other specialties and interest groups to gain perspective and insights into shared topic areas. To date, #JHMChat has one of the most robust online communities and continues to attract new followers each month.
As social media use continues to expand among clinicians, engagement tools like visual abstracts and Twitter chats will certainly continue to grow. Given that more clinicians are scrolling through websites than flipping through journal pages, medical journals like JHM will continually look for novel ways to engage their audiences and create communities among their followers. While a former architect who now practices as a surgeon led the way with visual abstracts, it remains to be seen who will create the next tool used to capture our attention on the ever-evolving sphere of social media.
Dr. Wray is a hospitalist at the University of California, San Francisco, and the San Francisco Veterans Affairs Medical Center. He also serves as a digital media and associate editor for the Journal of Hospital Medicine.
References
1. Ibrahim AM et al. Visual abstracts to disseminate research on social media: A prospective, case-control crossover study. Ann Surg. 2017;266(6):e46.
2. Tufte ER. The Visual Display of Quantitative Information. Second edition. Cheshire, Conn. Graphics Press, 2001. https://search.library.wisc.edu/catalog/999913808702121.
3. Polishing Your Presentation. http://web.archive.org/web/20001014041642/http://www.3m.com:80/meetingnetwork/files/meetingguide_pres.pdf. Accessed May 28, 2017.
4. 7 reasons you need visual content in your marketing strategy. https://medium.com/@nikos_iliopoulos/7-reasons-you-need-visual-content-in-your-marketing-strategy-bc77ca5521ac. Accessed May 28, 2017.
5. Wray CM et al. The adoption of an online journal club to improve research dissemination and social media engagement among hospitalists. J Hosp Med. 2018. doi: 10.12788/jhm.2987.
In recent years, social media platforms like Twitter, Facebook, and Instagram have become popular gathering spots for clinicians to connect, engage, and share medical content. Medical journals, which often act as purveyors of this content, have recognized social media’s growing power and influence and have begun looking for ways to better engage their audiences.
In 2016, the Annals of Surgery was looking to better disseminate the work being published in its pages and looked to Twitter as one way of accomplishing this. At the time, most journals were only posting the title or a brief description of the published manuscript and hoping their Twitter followers would click on the article link. As journal editors were finding, if the audience was not immediately familiar with the topic or able to quickly capture the nuances of the study, there was a good chance the reader would continue to scroll past the post and never view the article.
Recognizing that social media heavily relies on visual material to garner attention, Annals turned to Andrew Ibrahim, MD, an architect turned surgeon, to help them rethink their social media strategy. Using the design training he had previously received in his career as an architect, Dr. Ibrahim created a simple visual tool that could be used to capture the often complicated and nuanced aspects of a research study. He called his creation a “visual abstract.”
But what is a visual abstract? Simply, they are visual representations of the key findings of a published manuscript; or put another way, a “movie trailer” to the full manuscript. While they can take many different forms and designs, they often consist of three key components: (1) a simple, easy to understand title, (2) a primary focus on outcomes, and (3) the use of visual cues or images to help the reader absorb and remember the take home message. This simplified delivery of complex information allows the producer to efficiently share complex findings in a format that allows for rapid visualization and interpretation.
Since its inception, several studies have examined the influence visual abstracts have on disseminating research. One study conducted by Dr. Ibrahim and his colleagues found that articles tweeted with a visual abstract had an almost eightfold increase in the number of Twitter impressions (a measure of social media dissemination) and a threefold increase in article visits, compared with those manuscripts tweeted with the article title only.1 These results reflect what behavioral scientists have long understood: Humans process visual data better than any other type of data.2 For instance, according to research compiled by 3M, the company behind popular sticky notes, visual data is processed 60,000 times faster than text and has been shown to improve learning by 400%.3 Likewise, digital marketers have found that pages with videos and images draw on average 94% more views than their text-only counterparts.4
This knowledge, along with the substantial difference in engagement and dissemination characteristics from Dr. Ibrahim’s study, was far beyond what anyone might have expected and started a trend in medicine that continues to grow today. Medical journals across all practices and disciplines, including several leading journals, such as the New England Journal of Medicine, the Journal of the American Medical Association, and the Journal of Hospital Medicine (JHM), are utilizing this new tool to help disseminate their work in social media.
Visual abstracts have expanded beyond the social media sphere and are now frequently used in Grand Rounds presentations and as teaching tools among medical educators. JHM was one of the first journals to adopt the use of visual abstracts and has since published more than 150 in total. Given the growing popularity and expanded use of visual abstracts, JHM recently began archiving them on the journal’s website to allow clinicians to use the material in their own creative ways.
Visual abstracts are just one piece of the growing enterprise in social media for JHM. Recognizing the growing utilization of social media among physicians, JHM has taken a leading role in the use of online journal clubs. Since 2014, JHM has run a monthly Twitter-based journal club that discusses recently published articles and hospital medicine–based topics, called #JHMChat.5 This forum has allowed hospitalists from across the country, and around the world, to connect, network, and engage around topics important to the field of hospital medicine. The journal frequently reaches beyond hospital medicine borders and partners with other specialties and interest groups to gain perspective and insights into shared topic areas. To date, #JHMChat has one of the most robust online communities and continues to attract new followers each month.
As social media use continues to expand among clinicians, engagement tools like visual abstracts and Twitter chats will certainly continue to grow. Given that more clinicians are scrolling through websites than flipping through journal pages, medical journals like JHM will continually look for novel ways to engage their audiences and create communities among their followers. While a former architect who now practices as a surgeon led the way with visual abstracts, it remains to be seen who will create the next tool used to capture our attention on the ever-evolving sphere of social media.
Dr. Wray is a hospitalist at the University of California, San Francisco, and the San Francisco Veterans Affairs Medical Center. He also serves as a digital media and associate editor for the Journal of Hospital Medicine.
References
1. Ibrahim AM et al. Visual abstracts to disseminate research on social media: A prospective, case-control crossover study. Ann Surg. 2017;266(6):e46.
2. Tufte ER. The Visual Display of Quantitative Information. Second edition. Cheshire, Conn. Graphics Press, 2001. https://search.library.wisc.edu/catalog/999913808702121.
3. Polishing Your Presentation. http://web.archive.org/web/20001014041642/http://www.3m.com:80/meetingnetwork/files/meetingguide_pres.pdf. Accessed May 28, 2017.
4. 7 reasons you need visual content in your marketing strategy. https://medium.com/@nikos_iliopoulos/7-reasons-you-need-visual-content-in-your-marketing-strategy-bc77ca5521ac. Accessed May 28, 2017.
5. Wray CM et al. The adoption of an online journal club to improve research dissemination and social media engagement among hospitalists. J Hosp Med. 2018. doi: 10.12788/jhm.2987.
Announcing the Journal of Hospital Medicine Editorial Fellowship
The peer review and editorial processes are integral activities in academic medicine that provide ethical, independent, and unbiased critical assessment of submitted manuscripts to academic journals. Recognizing that few trainees or junior faculty are formally exposed to these processes,1 the Journal of Hospital Medicine aims to fill this opportunity gap through the launch of a one-year Editorial Fellowship.
The Fellowship is open to chief residents, hospital medicine fellows, and junior faculty (eg, Assistant Professor or Clinical Instructor). Starting in July of each year, a group of four to six applicants are paired with editorial mentors who are current JHM Deputy or Associate Editors. Structured as a distance-learning program, this program aims to allow Fellows the ability to continue in their full time professional roles while also allowing the opportunity to engage with national leaders in hospital medicine. Regular communication and interactions take place through both synchronous and asynchronous means. Fellows’ responsibilities during the 12-month experience include: completion of six guided peer reviews, preparation of one or two editorials, participation in monthly editorial meetings, and quarterly educational videoconferences. Interested Fellows may also have an opportunity to co-lead the journal’s online journal club, #JHMChat.2 Fellows are expected to attend the editorial staff meeting at the annual Society of Hospital Medicine Conference.
With this program, JHM aims to accomplish several tasks. First, we hope to offer a unique educational experience that allows for further growth, development, inspiration, and experience in academic medicine—specifically around the manuscript review and editorial processes. Second, recognizing that a journal’s quality is frequently a product of its reviewers, JHM hopes to build a cadre of well-trained and experienced reviewers and, hopefully, future members of the JHM editorial leadership team. Third, the program hopes to act as a networking experience, allowing editorial Fellows to learn from, collaborate with, and become academic leaders in the field. Finally, we hope to provide an opportunity for Fellows to be academically productive in their composition of editorial content—an output that will help catalyze their professional development.
We believe that in working closely with the JHM editorial staff, this program will help develop the next generation of leaders in academic hospital medicine. We strongly encourage applications from physicians who have been historically under-represented in leadership in academic medicine. Further details and the application can be found in the appendix and on the JHM website (www.journalofhospitalmedicine.com). It will be announced annually through the @JHospMedicine twitter handle.
Disclosures
The authors have nothing to disclose.
1. Lovejoy TI, Revenson TA, France CR. Reviewing manuscripts for peer-review journals: a primer for novice and seasoned reviewers. Ann Behav Med Publ Soc Behav Med. 2011;42(1):1-13. doi:10.1007/s12160-011-9269-x PubMed
2. Wray CM, Arora VM, Auerbach AD. The Adoption of an Online Journal Club to Improve Research Dissemination and Social Media Engagement Among Hospitalists. J Hosp Med. 2018;13(11). doi:10.12788/jhm.2987 PubMed
The peer review and editorial processes are integral activities in academic medicine that provide ethical, independent, and unbiased critical assessment of submitted manuscripts to academic journals. Recognizing that few trainees or junior faculty are formally exposed to these processes,1 the Journal of Hospital Medicine aims to fill this opportunity gap through the launch of a one-year Editorial Fellowship.
The Fellowship is open to chief residents, hospital medicine fellows, and junior faculty (eg, Assistant Professor or Clinical Instructor). Starting in July of each year, a group of four to six applicants are paired with editorial mentors who are current JHM Deputy or Associate Editors. Structured as a distance-learning program, this program aims to allow Fellows the ability to continue in their full time professional roles while also allowing the opportunity to engage with national leaders in hospital medicine. Regular communication and interactions take place through both synchronous and asynchronous means. Fellows’ responsibilities during the 12-month experience include: completion of six guided peer reviews, preparation of one or two editorials, participation in monthly editorial meetings, and quarterly educational videoconferences. Interested Fellows may also have an opportunity to co-lead the journal’s online journal club, #JHMChat.2 Fellows are expected to attend the editorial staff meeting at the annual Society of Hospital Medicine Conference.
With this program, JHM aims to accomplish several tasks. First, we hope to offer a unique educational experience that allows for further growth, development, inspiration, and experience in academic medicine—specifically around the manuscript review and editorial processes. Second, recognizing that a journal’s quality is frequently a product of its reviewers, JHM hopes to build a cadre of well-trained and experienced reviewers and, hopefully, future members of the JHM editorial leadership team. Third, the program hopes to act as a networking experience, allowing editorial Fellows to learn from, collaborate with, and become academic leaders in the field. Finally, we hope to provide an opportunity for Fellows to be academically productive in their composition of editorial content—an output that will help catalyze their professional development.
We believe that in working closely with the JHM editorial staff, this program will help develop the next generation of leaders in academic hospital medicine. We strongly encourage applications from physicians who have been historically under-represented in leadership in academic medicine. Further details and the application can be found in the appendix and on the JHM website (www.journalofhospitalmedicine.com). It will be announced annually through the @JHospMedicine twitter handle.
Disclosures
The authors have nothing to disclose.
1. Lovejoy TI, Revenson TA, France CR. Reviewing manuscripts for peer-review journals: a primer for novice and seasoned reviewers. Ann Behav Med Publ Soc Behav Med. 2011;42(1):1-13. doi:10.1007/s12160-011-9269-x PubMed
2. Wray CM, Arora VM, Auerbach AD. The Adoption of an Online Journal Club to Improve Research Dissemination and Social Media Engagement Among Hospitalists. J Hosp Med. 2018;13(11). doi:10.12788/jhm.2987 PubMed
© 2019 Society of Hospital Medicine
The Adoption of an Online Journal Club to Improve Research Dissemination and Social Media Engagement Among Hospitalists
Clinicians, educators, and medical journals are increasingly using the social media outlet, Twitter, as a medium to connect and engage with their colleagues. In particular, online journal clubs have created a space for the timely discussion of research, creation of online communities, and dissemination of research.
Social media-based journal clubs are thought to be one way in which journals can leverage the power of social networks so that researchers can engage with a diverse range of end users4 (including bedside clinicians, administrators, and patients). Several examples of these models exist. For example, #GeriMedJC acts as a complimentary, synchronous chat that takes place at the same time as a live, in-person journal club. #NephJC offers multiple 1-hour chats per month and provides an in-depth summary and analysis of each article, while #UroJC is an asynchronous discussion that takes place over 48 hours. Few data exist to describe whether any of these programs produce measurable improvements in indicators of engagement or dissemination of results.
In 2015, the Journal of Hospital Medicine (JHM) began producing a Twitter-based journal club as a means to connect and engage the Hospital Medicine community and allow for discussion and rapid exchange of information and opinions around a specific clinical topic. This study aims to describe the implementation of the first Journal-sponsored, Twitter-based online journal club and ascertain its impact on both Twitter and journal metrics.
METHODS
#JHMChat was launched in October 2015, and was initially held every 2-3 months until January 2017, when chats began to take place monthly. Each 1-hour chat focused on a recently published article in JHM, was moderated by a JHM social media editor (C.M.W., V.M.A.), and included at least 1 study author or guest expert. Articles were chosen by the social media editors based on the following criteria: (1) attractiveness to possible participants, (2) providing topic variety within the journal club series, and (3) sustainability and topic conduciveness to the online chat model. Chats were held at 9 PM EST in order to engage hospitalists across all US time zones and on different days to accommodate authors’ availability. All sessions were framed by 3-4 questions intended to encourage discussion and presented to chat participants at spaced intervals so as to stimulate a current of responses.
Chats were promoted by way of the JHM (@JHospMedicine, 3400 followers) and Society of Hospital Medicine (SHM; @SHMLive, 5800 followers) Twitter feeds beginning 1 month prior to each session. Visual Abstracts5,6 were used to publicize the sessions, also via Twitter, starting in February 2017.
Continuing Medical Education (CME) credits were offered through the SHM to registered participants, starting in July 2016.7 All sessions were cosponsored by the American Board of Internal Medicine (ABIM) Foundation and the Costs of Care Organization, a non-profit organization aimed at improving healthcare value.
Twitter Metrics
After each session, the following Twitter-based engagement metrics were obtained using the Symplur© Healthcare Hashtag project;8 total number of participants and tweets, tweets/participant, and total impressions (calculated as the number of tweets from each participant multiplied by the number of followers that participant currently had then summed up for all participants). Simply put, impressions can also be thought of as the number of times a single Tweet makes it into someone else’s Twitter feed. So as to avoid artificially inflated metrics, all were obtained 2 hours after the end of the journal club. Participants were defined as anyone who posted an original tweet or retweeted during the session and were encouraged to tag their tweets with the hashtag #JHMChat for post-discussion indexing and measurement. Because authors’ or guests’ popularity on Twitter may influence participation rates, we also assessed the number of followers for each participating author. Spearman’s rank correlation was calculated (Microsoft ExcelTM) where appropriate.
Altmetrics and Page Views
As a means to measure exposure and dissemination external to Twitter, we assessed the change (“Delta”) in the each article’s Altmetric score9, a digital-based metric that quantifies the attention received by a scientific publication on various online platforms including news, blogs, and social media. Delta Altmetric scores were calculated as the difference between the scores on the day of the session and 2 weeks after the respective session, with higher scores indicating greater global online discussion. By measuring the Altmetric score on the day of the discussion, we established a baseline score for comparison purposes. Additionally, this allowed us to better attribute any changes that may have occurred to the discussion itself.
Additionally, using information provided by the journal publisher (John Wiley & Sons Publishing) in 2016, we assessed the effect of #JHMChat on the number of article page views on the JHM website relative to the release of the electronic Table of Contents (eTOC). The eTOC release was chosen as it is historically associated with a high number of page views. In order to isolate the effect of #JHMChat, we only reviewed months in which #JHMChat was not held within 3 days of the eTOC release. Because JHM changed publishers in January 2017, we only assessed page view data on 2016 sessions, as the new publisher lacked enhanced search optimization to obtain these data.
Thematic Analysis
In addition to the above measurements, a thematic analysis of each article was conducted to assess any common themes that would influence our chosen metrics. Themes were assessed and ascribed by one author (C.M.W.) and verified by another (V.M.A.).
Participant and Author Experience
To assess the participant experience, responses to a post-session CME questionnaire that assessed (1) overall quality, (2) comprehensiveness of the discussion, (3) whether the participant would recommend the chat to a colleague, and (4) whether participation would lead to practice-changing measures were reviewed. Registration of each session for CME was also quantified. Finally, each participating author was asked to fill out an electronic post-chat survey (SurveyMonkey®) meant to assess the authors’ experience with the journal club (Appendix).
RESULTS
Between October 2015 and November 2017, a total of 15 sessions were held with a mean of 2.17 (±0.583) million impressions/session, 499 (±129) total tweets/session, and 73 (±24) participants/session (compared to a range of 21-58 participants/session from other online journal clubs, where reported) with 7.2 (±2.0) tweets/participant (Table 1). The total number of participants for all sessions was 1096. Participating authors had on average 1389 (±2714) followers, ranging from a low of 37 to a high of 10,376 (Appendix). No correlation between author following and number of participants (r = 0.19), impressions (r = 0.05), or change in Altmetric score (r = 0.17) was seen.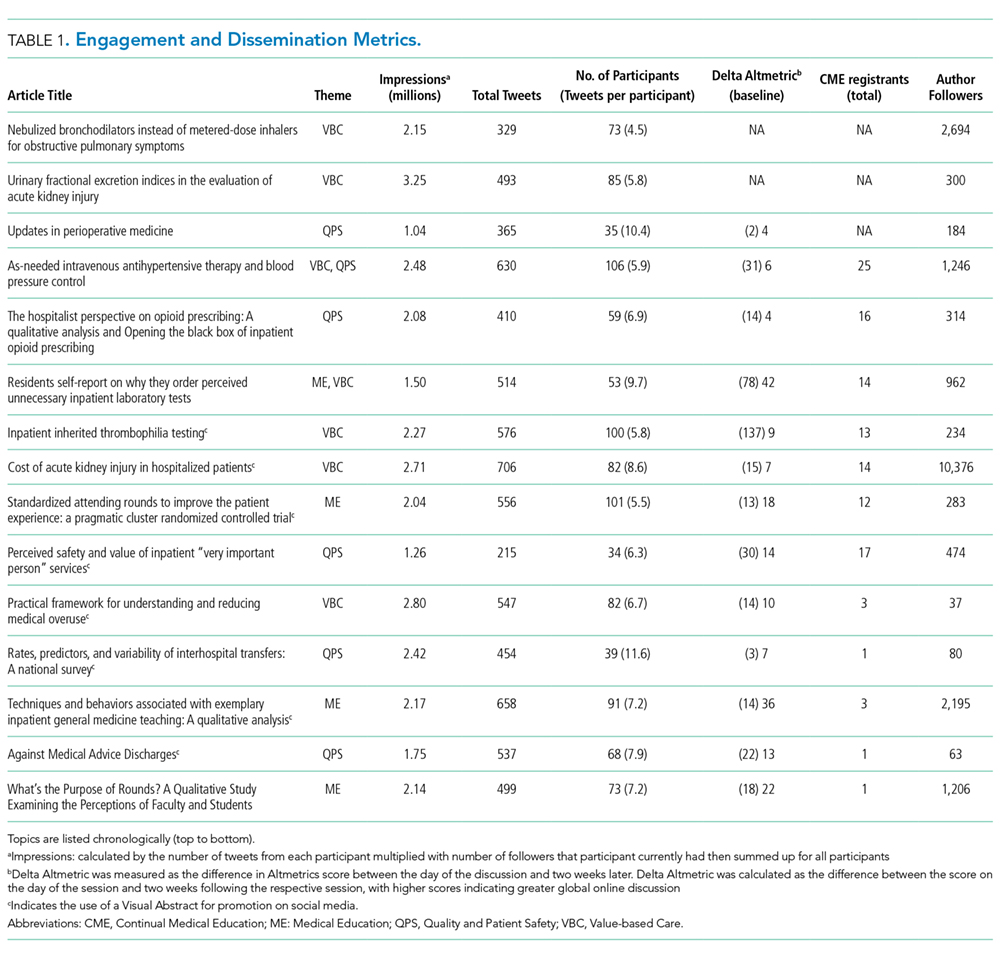
Thematic analysis revealed 3 predominant themes among the chosen articles: Value-based care (VBC), Quality and Patient Safety (QPS), and Medical Education (ME). Articles focused on VBC had the greatest number of impressions (mean ±SD: 2.61 ± 0.55 million) and participants (mean ±SD: 90 ± 12), while QPS articles had the fewest impressions (mean ±SD: 1.71 ± 0.59 million) and number of participants (mean ±SD: 47 ± 16). The mean increase in the Altmetric score among all discussed articles was 14 (±12), from an average baseline of 30 (±37). Medical Education-themed articles appeared to garner the greatest increase in Altmetric scores, averaging an increase of 32 points, compared with an average baseline score of 31 (±32). In contrast, VBC and QPS articles averaged an increase of 8.6 and 8.4 points, from average baselines of 55 (±53) and 17 (±13), respectively. A 2-month analysis of JHM articles not included in these discussions, in which Altmetric scores were measured in the same way as those from the discussion, revealed a baseline Altmetric score of 27 (±24) with an average increase of 8 (±6) 2 weeks following the chat.
Four articles met the inclusion criteria for page view analysis and suggested that article page views increased to similar levels as the eTOC release (mean: 2668 vs. 2998, respectively; P = .35) (Figure). These increases equate to a 33% and 50% increase in average daily page views (2002) for the chat and eTOC release, respectively.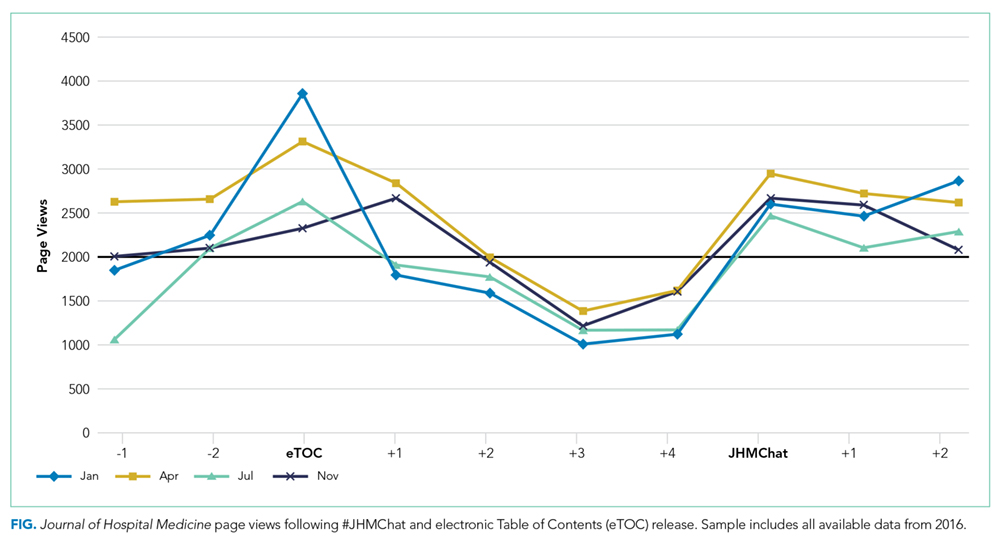
Ninety-three percent (14/15) of the participating authors responded to the post-discussion survey. All strongly agreed (5/5 on a Likert scale) that the venue allowed for an in-depth discussion about processes and challenges in conducting the study and allowed for greater dissemination and visibility of their work (5/5). Additionally, authors agreed that the journal club was a valuable experience for themselves (4.88/5) and other practitioners (4.88/5). Most agreed that the journal club allowed them to share their work with a different group of participants than usual (4.75/5) and that the experience changed how they would discuss their manuscripts in the future (4.75/5.0); Table 2).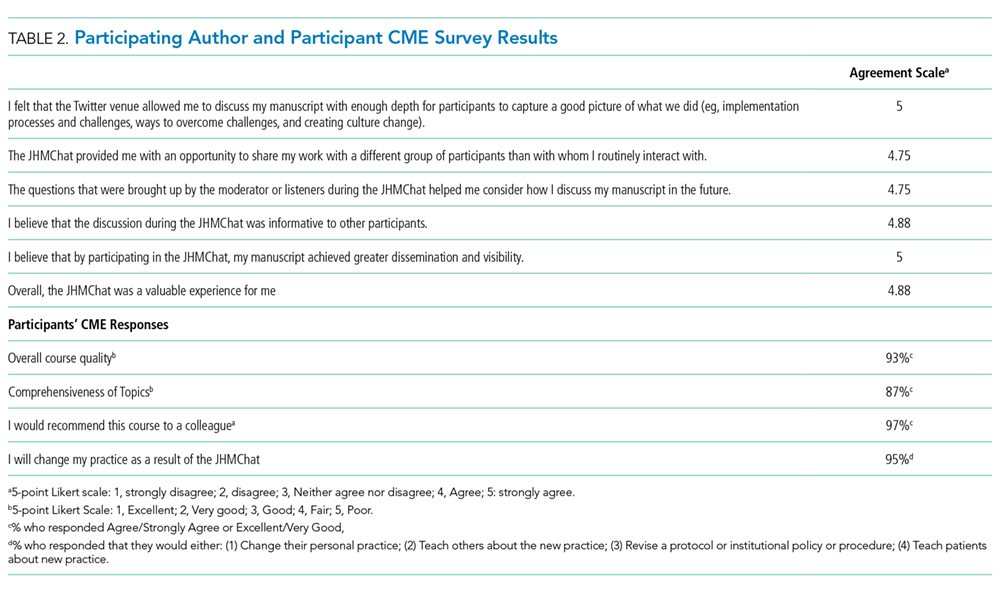
DISCUSSION
The Twitter-based journal club #JHMChat appears to increase social media awareness and dissemination of journal articles and was considered a useful engagement platform by both authors and participants.
Articles with a focus on VBC and ME had the greatest impact on dissemination metrics, particularly, total impressions and Altmetric scores, respectively. Given the strong presence and interest in these topics within Twitter and social media, these findings are not surprising.10,11 For example, over the past several years, the VBC movement has taken shape and grown alongside the expansion of social media, thus giving a space for this community to grow and engage. Of note, the cosponsorship relationship with the ABIM Foundation (which works closely with the Choosing Wisely™ campaign) and the Costs of Care Organization could have influenced the participation and dissemination rates of VBC articles. Medical education articles were also popular and appeared to have increased uptake after chats, based on their Altmetric scores. This may be explained by the fact that medical educators have long utilized social media as a means to connect and engage within their community.12–14 It is also possible that the use of Twitter by trainees (residents, students) may have driven some of the dissemination of ME articles, as this group may not be regular subscribers to JHM.
Online journal clubs offer distinct advantages over traditional in-person journal clubs. First, online journal clubs allow for increased connectivity among online communities, bringing together participants from different geographic areas with diverse training and clinical experiences. Subsequently, this allows for the rapid exchange of both personal and organizational approaches to the topic of discussion.15–17 Second, online journal clubs allow for continual access to the discussion material. For example, while the metrics used in this study only assessed active, synchronous participation, anecdotal evidence and feedback to the authors suggests that many individuals passively engaged by following along or reviewed the chat feed post hoc at their convenience. This asynchronous access is a quality not found in more traditional journal club formats. Finally, because online journal clubs commonly operate with a flattened hierarchy,18 they can break down access barriers to both the researchers who performed the study and thought leaders who commonly participate.17
Several insightful lessons were gleaned in the production and management of this online journal club. On the implementation side, promotion, preparation, and continued organization of an online journal club requires a fair amount of work. In this case, the required time and resources were provided by 2 social media editors in addition to administrative assistance from the SHM. The high attrition rate of online journal clubs over the years attests to these difficulties.24 Additionally, finding incentives to attract and sustain participation can be difficult, as we noted that neither CME nor author popularity (based on their Twitter following) appeared to influence engagement metrics (number of participants, total tweets, and tweets/participant). We also found that partnering with other journal club communities, in particular #NephJC, lead to greater participation rates and impressions. Thus, leveraging connections and topics that span clinical domains may be one way to improve and broaden engagement within these forums. Finally, feedback from participants revealed that the timing of the journal club and the inability to have in-depth discussions, a characteristic commonly associated with traditional journal clubs, were problematic.
This study has several limitations. First, the metrics used to assess social media engagement and dissemination can be easily skewed. For instance, the activity of 1 or 2 individuals with large followings can dramatically influence the number of impressions, giving a falsely elevated sense of broad dissemination. Conversely, there may have been some participants who did not use the #JHMChat hashtag, thus leading to an underestimation in these metrics. Second, while we report total impressions as a measure of dissemination, this metric represents possible interactions and does not guarantee interaction or visualization of that tweet. Additionally, we were unable to characterize our participants and their participation rates over time, as this information is not made available through Symplur© analytics. Third, our page view assessment was limited to 2016 sessions only; therefore, these data may not be an accurate reflection of the impact of #JHMChat on this metric. Fourth, given the marginal response rate to our CME questionnaire, a selection bias could have occurred. Finally, whether social media discussions such as online journal clubs act as leading indicators for future citations remains unclear, as some research has shown an association between increased Altmetric scores and increased citation rates,19-21 while others have not.22,23 Our study was not equipped to assess this correlation.
CONCLUSION
Online journal clubs create new opportunities to connect, engage, and disseminate medical research. These developing forums provide journal editors, researchers, patients, and clinicians with a means to connect and discuss research in ways that were not previously possible. In order to continue to evolve and grow, future research in online journal clubs should explore the downstream effects on citation rates, clinical uptake, and participant knowledge after the sessions.
Acknowledgments
The authors would like to thank Felicia Steele for her assistance in organizing and promoting the chats. Additionally, the authors would like to thank all the authors, guests and participants who took time from their families, work, and daily lives to participate in these activities. Your time and presence were truly appreciated.
Disclosures
The authors of this article operate as the Social Media Editors (C.M.W., V.M.A.) and the Editor-in-Chief (A.A.) for the Journal of Hospital Medicine. Dr. Wray had full access to all the data in the project, takes responsibility for the integrity of the data, and the accuracy of the data analysis.
1. Topf JM, Sparks MA, Phelan PJ, et al. The evolution of the journal club: from osler to twitter. Am J Kidney Dis Off J Natl Kidney Found. 2017;69(6):827-836. doi: 10.1053/j.ajkd.2016.12.012. PubMed
2. Thangasamy IA, Leveridge M, Davies BJ, Finelli A, Stork B, Woo HH. International urology journal club via Twitter: 12-month experience. Eur Urol. 2014;66(1):112-117. doi: 10.1016/j.eururo.2014.01.034. PubMed
3. Gardhouse AI, Budd L, Yang SYC, Wong CL. #GeriMedJC: the Twitter complement to the traditional-format geriatric medicine journal club. J Am Geriatr Soc. 2017;65(6):1347-1351. doi: 10.1111/jgs.14920. PubMed
4. Duque L. How academics and researchers can get more out of social media. Harvard Business Review. https://hbr.org/2016/06/how-academics-and-researchers-can-get-more-out-of-social-media. Accessed November 9, 2017.
5. Wray CM, Arora VM. #VisualAbstract: a revolution in communicating science? Ann Surg. 2017;266(6):e49-e50. doi: 10.1097/SLA.0000000000002339. PubMed
6. Ibrahim AM. Seeing is believing: using visual abstracts to disseminate scientific research. Am J Gastroenterol. 2017:ajg2017268. doi: 10.1038/ajg.2017.268. PubMed
7. #JHMChat. http://shm.hospitalmedicine.org/acton/media/25526/jhmchat. Accessed November 9, 2017.
8. #JHMChat-healthcare social media. Symplur. https://www.symplur.com/search/%23JHMChat. Accessed November 9, 2017.
9. Altmetric. Altmetric. https://www.altmetric.com/. Accessed November 9, 2017.
10. value-based healthcare | Symplur. https://www.symplur.com/topic/value-based-healthcare/. Accessed November 17, 2017.
11. medical education | Symplur. https://www.symplur.com/topic/medical-education/. Accessed November 17, 2017.
12. Sterling M, Leung P, Wright D, Bishop TF. The use of social media in graduate medical education: a systematic review. Acad Med. 2017;92(7):1043. doi: 10.1097/ACM.0000000000001617. PubMed
13. Davis WM, Ho K, Last J. Advancing social media in medical education. CMAJ Can Med Assoc J. 2015;187(8):549-550. doi: 10.1503/cmaj.141417. PubMed
14. Hillman T, Sherbino J. Social media in medical education: a new pedagogical paradigm? Postgrad Med J. 2015;91(1080):544-545. doi: 10.1136/postgradmedj-2015-133686. PubMed
15. Gerds AT, Chan T. Social media in hematology in 2017: dystopia, utopia, or somewhere in-between? Curr Hematol Malig Rep. 2017;12(6):582-591. doi: 10.1007/s11899-017-0424-8. PubMed
16. Mehta N, Flickinger T. The times they are a-changin’: academia, social media and the JGIM Twitter Journal Club. J Gen Intern Med. 2014;29(10):1317-1318. doi: 10.1007/s11606-014-2976-9. PubMed
17. Chan T, Trueger NS, Roland D, Thoma B. Evidence-based medicine in the era of social media: scholarly engagement through participation and online interaction. CJEM. 2017:1-6. doi: 10.1017/cem.2016.407. PubMed
18. Utengen A. The flattening of healthcare: breaking down of barriers in healthcare social media-twitter visualized. https://www.symplur.com/shorts/the-flattening-of-healthcare-twitter-visualized/. Accessed November 8, 2017.
19. Thelwall M, Haustein S, Larivière V, Sugimoto CR. Do altmetrics work? Twitter and ten other social web services. PloS One. 2013;8(5):e64841. doi: 10.1371/journal.pone.0064841. PubMed
20. Peoples BK, Midway SR, Sackett D, Lynch A, Cooney PB. Twitter predicts citation rates of ecological research. PloS One. 2016;11(11):e0166570. doi: 10.1371/journal.pone.0166570. PubMed
21. Eysenbach G. Can tweets predict citations? Metrics of social impact based on Twitter and correlation with traditional metrics of scientific impact. J Med Internet Res. 2011;13(4):e123. doi: 10.2196/jmir.2012. PubMed
22. Winter JCF de. The relationship between tweets, citations, and article views for PLOS ONE articles. Scientometrics. 2015;102(2):1773-1779. doi: 10.1007/s11192-014-1445-x.
23. Haustein S, Peters I, Sugimoto CR, Thelwall M, Larivière V. Tweeting biomedicine: an analysis of tweets and citations in the biomedical literature. J Assoc Inf Sci Technol. 2014;65(4):656-669. doi: 10.1002/asi.23101.
24. Journal club. In: Wikipedia. 2017. https://en.wikipedia.org/w/index.php?title=Journal_club&oldid=807037773. Accessed November 9, 2017.
Clinicians, educators, and medical journals are increasingly using the social media outlet, Twitter, as a medium to connect and engage with their colleagues. In particular, online journal clubs have created a space for the timely discussion of research, creation of online communities, and dissemination of research.
Social media-based journal clubs are thought to be one way in which journals can leverage the power of social networks so that researchers can engage with a diverse range of end users4 (including bedside clinicians, administrators, and patients). Several examples of these models exist. For example, #GeriMedJC acts as a complimentary, synchronous chat that takes place at the same time as a live, in-person journal club. #NephJC offers multiple 1-hour chats per month and provides an in-depth summary and analysis of each article, while #UroJC is an asynchronous discussion that takes place over 48 hours. Few data exist to describe whether any of these programs produce measurable improvements in indicators of engagement or dissemination of results.
In 2015, the Journal of Hospital Medicine (JHM) began producing a Twitter-based journal club as a means to connect and engage the Hospital Medicine community and allow for discussion and rapid exchange of information and opinions around a specific clinical topic. This study aims to describe the implementation of the first Journal-sponsored, Twitter-based online journal club and ascertain its impact on both Twitter and journal metrics.
METHODS
#JHMChat was launched in October 2015, and was initially held every 2-3 months until January 2017, when chats began to take place monthly. Each 1-hour chat focused on a recently published article in JHM, was moderated by a JHM social media editor (C.M.W., V.M.A.), and included at least 1 study author or guest expert. Articles were chosen by the social media editors based on the following criteria: (1) attractiveness to possible participants, (2) providing topic variety within the journal club series, and (3) sustainability and topic conduciveness to the online chat model. Chats were held at 9 PM EST in order to engage hospitalists across all US time zones and on different days to accommodate authors’ availability. All sessions were framed by 3-4 questions intended to encourage discussion and presented to chat participants at spaced intervals so as to stimulate a current of responses.
Chats were promoted by way of the JHM (@JHospMedicine, 3400 followers) and Society of Hospital Medicine (SHM; @SHMLive, 5800 followers) Twitter feeds beginning 1 month prior to each session. Visual Abstracts5,6 were used to publicize the sessions, also via Twitter, starting in February 2017.
Continuing Medical Education (CME) credits were offered through the SHM to registered participants, starting in July 2016.7 All sessions were cosponsored by the American Board of Internal Medicine (ABIM) Foundation and the Costs of Care Organization, a non-profit organization aimed at improving healthcare value.
Twitter Metrics
After each session, the following Twitter-based engagement metrics were obtained using the Symplur© Healthcare Hashtag project;8 total number of participants and tweets, tweets/participant, and total impressions (calculated as the number of tweets from each participant multiplied by the number of followers that participant currently had then summed up for all participants). Simply put, impressions can also be thought of as the number of times a single Tweet makes it into someone else’s Twitter feed. So as to avoid artificially inflated metrics, all were obtained 2 hours after the end of the journal club. Participants were defined as anyone who posted an original tweet or retweeted during the session and were encouraged to tag their tweets with the hashtag #JHMChat for post-discussion indexing and measurement. Because authors’ or guests’ popularity on Twitter may influence participation rates, we also assessed the number of followers for each participating author. Spearman’s rank correlation was calculated (Microsoft ExcelTM) where appropriate.
Altmetrics and Page Views
As a means to measure exposure and dissemination external to Twitter, we assessed the change (“Delta”) in the each article’s Altmetric score9, a digital-based metric that quantifies the attention received by a scientific publication on various online platforms including news, blogs, and social media. Delta Altmetric scores were calculated as the difference between the scores on the day of the session and 2 weeks after the respective session, with higher scores indicating greater global online discussion. By measuring the Altmetric score on the day of the discussion, we established a baseline score for comparison purposes. Additionally, this allowed us to better attribute any changes that may have occurred to the discussion itself.
Additionally, using information provided by the journal publisher (John Wiley & Sons Publishing) in 2016, we assessed the effect of #JHMChat on the number of article page views on the JHM website relative to the release of the electronic Table of Contents (eTOC). The eTOC release was chosen as it is historically associated with a high number of page views. In order to isolate the effect of #JHMChat, we only reviewed months in which #JHMChat was not held within 3 days of the eTOC release. Because JHM changed publishers in January 2017, we only assessed page view data on 2016 sessions, as the new publisher lacked enhanced search optimization to obtain these data.
Thematic Analysis
In addition to the above measurements, a thematic analysis of each article was conducted to assess any common themes that would influence our chosen metrics. Themes were assessed and ascribed by one author (C.M.W.) and verified by another (V.M.A.).
Participant and Author Experience
To assess the participant experience, responses to a post-session CME questionnaire that assessed (1) overall quality, (2) comprehensiveness of the discussion, (3) whether the participant would recommend the chat to a colleague, and (4) whether participation would lead to practice-changing measures were reviewed. Registration of each session for CME was also quantified. Finally, each participating author was asked to fill out an electronic post-chat survey (SurveyMonkey®) meant to assess the authors’ experience with the journal club (Appendix).
RESULTS
Between October 2015 and November 2017, a total of 15 sessions were held with a mean of 2.17 (±0.583) million impressions/session, 499 (±129) total tweets/session, and 73 (±24) participants/session (compared to a range of 21-58 participants/session from other online journal clubs, where reported) with 7.2 (±2.0) tweets/participant (Table 1). The total number of participants for all sessions was 1096. Participating authors had on average 1389 (±2714) followers, ranging from a low of 37 to a high of 10,376 (Appendix). No correlation between author following and number of participants (r = 0.19), impressions (r = 0.05), or change in Altmetric score (r = 0.17) was seen.
Thematic analysis revealed 3 predominant themes among the chosen articles: Value-based care (VBC), Quality and Patient Safety (QPS), and Medical Education (ME). Articles focused on VBC had the greatest number of impressions (mean ±SD: 2.61 ± 0.55 million) and participants (mean ±SD: 90 ± 12), while QPS articles had the fewest impressions (mean ±SD: 1.71 ± 0.59 million) and number of participants (mean ±SD: 47 ± 16). The mean increase in the Altmetric score among all discussed articles was 14 (±12), from an average baseline of 30 (±37). Medical Education-themed articles appeared to garner the greatest increase in Altmetric scores, averaging an increase of 32 points, compared with an average baseline score of 31 (±32). In contrast, VBC and QPS articles averaged an increase of 8.6 and 8.4 points, from average baselines of 55 (±53) and 17 (±13), respectively. A 2-month analysis of JHM articles not included in these discussions, in which Altmetric scores were measured in the same way as those from the discussion, revealed a baseline Altmetric score of 27 (±24) with an average increase of 8 (±6) 2 weeks following the chat.
Four articles met the inclusion criteria for page view analysis and suggested that article page views increased to similar levels as the eTOC release (mean: 2668 vs. 2998, respectively; P = .35) (Figure). These increases equate to a 33% and 50% increase in average daily page views (2002) for the chat and eTOC release, respectively.
Ninety-three percent (14/15) of the participating authors responded to the post-discussion survey. All strongly agreed (5/5 on a Likert scale) that the venue allowed for an in-depth discussion about processes and challenges in conducting the study and allowed for greater dissemination and visibility of their work (5/5). Additionally, authors agreed that the journal club was a valuable experience for themselves (4.88/5) and other practitioners (4.88/5). Most agreed that the journal club allowed them to share their work with a different group of participants than usual (4.75/5) and that the experience changed how they would discuss their manuscripts in the future (4.75/5.0); Table 2).
DISCUSSION
The Twitter-based journal club #JHMChat appears to increase social media awareness and dissemination of journal articles and was considered a useful engagement platform by both authors and participants.
Articles with a focus on VBC and ME had the greatest impact on dissemination metrics, particularly, total impressions and Altmetric scores, respectively. Given the strong presence and interest in these topics within Twitter and social media, these findings are not surprising.10,11 For example, over the past several years, the VBC movement has taken shape and grown alongside the expansion of social media, thus giving a space for this community to grow and engage. Of note, the cosponsorship relationship with the ABIM Foundation (which works closely with the Choosing Wisely™ campaign) and the Costs of Care Organization could have influenced the participation and dissemination rates of VBC articles. Medical education articles were also popular and appeared to have increased uptake after chats, based on their Altmetric scores. This may be explained by the fact that medical educators have long utilized social media as a means to connect and engage within their community.12–14 It is also possible that the use of Twitter by trainees (residents, students) may have driven some of the dissemination of ME articles, as this group may not be regular subscribers to JHM.
Online journal clubs offer distinct advantages over traditional in-person journal clubs. First, online journal clubs allow for increased connectivity among online communities, bringing together participants from different geographic areas with diverse training and clinical experiences. Subsequently, this allows for the rapid exchange of both personal and organizational approaches to the topic of discussion.15–17 Second, online journal clubs allow for continual access to the discussion material. For example, while the metrics used in this study only assessed active, synchronous participation, anecdotal evidence and feedback to the authors suggests that many individuals passively engaged by following along or reviewed the chat feed post hoc at their convenience. This asynchronous access is a quality not found in more traditional journal club formats. Finally, because online journal clubs commonly operate with a flattened hierarchy,18 they can break down access barriers to both the researchers who performed the study and thought leaders who commonly participate.17
Several insightful lessons were gleaned in the production and management of this online journal club. On the implementation side, promotion, preparation, and continued organization of an online journal club requires a fair amount of work. In this case, the required time and resources were provided by 2 social media editors in addition to administrative assistance from the SHM. The high attrition rate of online journal clubs over the years attests to these difficulties.24 Additionally, finding incentives to attract and sustain participation can be difficult, as we noted that neither CME nor author popularity (based on their Twitter following) appeared to influence engagement metrics (number of participants, total tweets, and tweets/participant). We also found that partnering with other journal club communities, in particular #NephJC, lead to greater participation rates and impressions. Thus, leveraging connections and topics that span clinical domains may be one way to improve and broaden engagement within these forums. Finally, feedback from participants revealed that the timing of the journal club and the inability to have in-depth discussions, a characteristic commonly associated with traditional journal clubs, were problematic.
This study has several limitations. First, the metrics used to assess social media engagement and dissemination can be easily skewed. For instance, the activity of 1 or 2 individuals with large followings can dramatically influence the number of impressions, giving a falsely elevated sense of broad dissemination. Conversely, there may have been some participants who did not use the #JHMChat hashtag, thus leading to an underestimation in these metrics. Second, while we report total impressions as a measure of dissemination, this metric represents possible interactions and does not guarantee interaction or visualization of that tweet. Additionally, we were unable to characterize our participants and their participation rates over time, as this information is not made available through Symplur© analytics. Third, our page view assessment was limited to 2016 sessions only; therefore, these data may not be an accurate reflection of the impact of #JHMChat on this metric. Fourth, given the marginal response rate to our CME questionnaire, a selection bias could have occurred. Finally, whether social media discussions such as online journal clubs act as leading indicators for future citations remains unclear, as some research has shown an association between increased Altmetric scores and increased citation rates,19-21 while others have not.22,23 Our study was not equipped to assess this correlation.
CONCLUSION
Online journal clubs create new opportunities to connect, engage, and disseminate medical research. These developing forums provide journal editors, researchers, patients, and clinicians with a means to connect and discuss research in ways that were not previously possible. In order to continue to evolve and grow, future research in online journal clubs should explore the downstream effects on citation rates, clinical uptake, and participant knowledge after the sessions.
Acknowledgments
The authors would like to thank Felicia Steele for her assistance in organizing and promoting the chats. Additionally, the authors would like to thank all the authors, guests and participants who took time from their families, work, and daily lives to participate in these activities. Your time and presence were truly appreciated.
Disclosures
The authors of this article operate as the Social Media Editors (C.M.W., V.M.A.) and the Editor-in-Chief (A.A.) for the Journal of Hospital Medicine. Dr. Wray had full access to all the data in the project, takes responsibility for the integrity of the data, and the accuracy of the data analysis.
1. Topf JM, Sparks MA, Phelan PJ, et al. The evolution of the journal club: from osler to twitter. Am J Kidney Dis Off J Natl Kidney Found. 2017;69(6):827-836. doi: 10.1053/j.ajkd.2016.12.012. PubMed
2. Thangasamy IA, Leveridge M, Davies BJ, Finelli A, Stork B, Woo HH. International urology journal club via Twitter: 12-month experience. Eur Urol. 2014;66(1):112-117. doi: 10.1016/j.eururo.2014.01.034. PubMed
3. Gardhouse AI, Budd L, Yang SYC, Wong CL. #GeriMedJC: the Twitter complement to the traditional-format geriatric medicine journal club. J Am Geriatr Soc. 2017;65(6):1347-1351. doi: 10.1111/jgs.14920. PubMed
4. Duque L. How academics and researchers can get more out of social media. Harvard Business Review. https://hbr.org/2016/06/how-academics-and-researchers-can-get-more-out-of-social-media. Accessed November 9, 2017.
5. Wray CM, Arora VM. #VisualAbstract: a revolution in communicating science? Ann Surg. 2017;266(6):e49-e50. doi: 10.1097/SLA.0000000000002339. PubMed
6. Ibrahim AM. Seeing is believing: using visual abstracts to disseminate scientific research. Am J Gastroenterol. 2017:ajg2017268. doi: 10.1038/ajg.2017.268. PubMed
7. #JHMChat. http://shm.hospitalmedicine.org/acton/media/25526/jhmchat. Accessed November 9, 2017.
8. #JHMChat-healthcare social media. Symplur. https://www.symplur.com/search/%23JHMChat. Accessed November 9, 2017.
9. Altmetric. Altmetric. https://www.altmetric.com/. Accessed November 9, 2017.
10. value-based healthcare | Symplur. https://www.symplur.com/topic/value-based-healthcare/. Accessed November 17, 2017.
11. medical education | Symplur. https://www.symplur.com/topic/medical-education/. Accessed November 17, 2017.
12. Sterling M, Leung P, Wright D, Bishop TF. The use of social media in graduate medical education: a systematic review. Acad Med. 2017;92(7):1043. doi: 10.1097/ACM.0000000000001617. PubMed
13. Davis WM, Ho K, Last J. Advancing social media in medical education. CMAJ Can Med Assoc J. 2015;187(8):549-550. doi: 10.1503/cmaj.141417. PubMed
14. Hillman T, Sherbino J. Social media in medical education: a new pedagogical paradigm? Postgrad Med J. 2015;91(1080):544-545. doi: 10.1136/postgradmedj-2015-133686. PubMed
15. Gerds AT, Chan T. Social media in hematology in 2017: dystopia, utopia, or somewhere in-between? Curr Hematol Malig Rep. 2017;12(6):582-591. doi: 10.1007/s11899-017-0424-8. PubMed
16. Mehta N, Flickinger T. The times they are a-changin’: academia, social media and the JGIM Twitter Journal Club. J Gen Intern Med. 2014;29(10):1317-1318. doi: 10.1007/s11606-014-2976-9. PubMed
17. Chan T, Trueger NS, Roland D, Thoma B. Evidence-based medicine in the era of social media: scholarly engagement through participation and online interaction. CJEM. 2017:1-6. doi: 10.1017/cem.2016.407. PubMed
18. Utengen A. The flattening of healthcare: breaking down of barriers in healthcare social media-twitter visualized. https://www.symplur.com/shorts/the-flattening-of-healthcare-twitter-visualized/. Accessed November 8, 2017.
19. Thelwall M, Haustein S, Larivière V, Sugimoto CR. Do altmetrics work? Twitter and ten other social web services. PloS One. 2013;8(5):e64841. doi: 10.1371/journal.pone.0064841. PubMed
20. Peoples BK, Midway SR, Sackett D, Lynch A, Cooney PB. Twitter predicts citation rates of ecological research. PloS One. 2016;11(11):e0166570. doi: 10.1371/journal.pone.0166570. PubMed
21. Eysenbach G. Can tweets predict citations? Metrics of social impact based on Twitter and correlation with traditional metrics of scientific impact. J Med Internet Res. 2011;13(4):e123. doi: 10.2196/jmir.2012. PubMed
22. Winter JCF de. The relationship between tweets, citations, and article views for PLOS ONE articles. Scientometrics. 2015;102(2):1773-1779. doi: 10.1007/s11192-014-1445-x.
23. Haustein S, Peters I, Sugimoto CR, Thelwall M, Larivière V. Tweeting biomedicine: an analysis of tweets and citations in the biomedical literature. J Assoc Inf Sci Technol. 2014;65(4):656-669. doi: 10.1002/asi.23101.
24. Journal club. In: Wikipedia. 2017. https://en.wikipedia.org/w/index.php?title=Journal_club&oldid=807037773. Accessed November 9, 2017.
© 2018 Society of Hospital Medicine