User login
The Adoption of an Online Journal Club to Improve Research Dissemination and Social Media Engagement Among Hospitalists
Clinicians, educators, and medical journals are increasingly using the social media outlet, Twitter, as a medium to connect and engage with their colleagues. In particular, online journal clubs have created a space for the timely discussion of research, creation of online communities, and dissemination of research.
Social media-based journal clubs are thought to be one way in which journals can leverage the power of social networks so that researchers can engage with a diverse range of end users4 (including bedside clinicians, administrators, and patients). Several examples of these models exist. For example, #GeriMedJC acts as a complimentary, synchronous chat that takes place at the same time as a live, in-person journal club. #NephJC offers multiple 1-hour chats per month and provides an in-depth summary and analysis of each article, while #UroJC is an asynchronous discussion that takes place over 48 hours. Few data exist to describe whether any of these programs produce measurable improvements in indicators of engagement or dissemination of results.
In 2015, the Journal of Hospital Medicine (JHM) began producing a Twitter-based journal club as a means to connect and engage the Hospital Medicine community and allow for discussion and rapid exchange of information and opinions around a specific clinical topic. This study aims to describe the implementation of the first Journal-sponsored, Twitter-based online journal club and ascertain its impact on both Twitter and journal metrics.
METHODS
#JHMChat was launched in October 2015, and was initially held every 2-3 months until January 2017, when chats began to take place monthly. Each 1-hour chat focused on a recently published article in JHM, was moderated by a JHM social media editor (C.M.W., V.M.A.), and included at least 1 study author or guest expert. Articles were chosen by the social media editors based on the following criteria: (1) attractiveness to possible participants, (2) providing topic variety within the journal club series, and (3) sustainability and topic conduciveness to the online chat model. Chats were held at 9 PM EST in order to engage hospitalists across all US time zones and on different days to accommodate authors’ availability. All sessions were framed by 3-4 questions intended to encourage discussion and presented to chat participants at spaced intervals so as to stimulate a current of responses.
Chats were promoted by way of the JHM (@JHospMedicine, 3400 followers) and Society of Hospital Medicine (SHM; @SHMLive, 5800 followers) Twitter feeds beginning 1 month prior to each session. Visual Abstracts5,6 were used to publicize the sessions, also via Twitter, starting in February 2017.
Continuing Medical Education (CME) credits were offered through the SHM to registered participants, starting in July 2016.7 All sessions were cosponsored by the American Board of Internal Medicine (ABIM) Foundation and the Costs of Care Organization, a non-profit organization aimed at improving healthcare value.
Twitter Metrics
After each session, the following Twitter-based engagement metrics were obtained using the Symplur© Healthcare Hashtag project;8 total number of participants and tweets, tweets/participant, and total impressions (calculated as the number of tweets from each participant multiplied by the number of followers that participant currently had then summed up for all participants). Simply put, impressions can also be thought of as the number of times a single Tweet makes it into someone else’s Twitter feed. So as to avoid artificially inflated metrics, all were obtained 2 hours after the end of the journal club. Participants were defined as anyone who posted an original tweet or retweeted during the session and were encouraged to tag their tweets with the hashtag #JHMChat for post-discussion indexing and measurement. Because authors’ or guests’ popularity on Twitter may influence participation rates, we also assessed the number of followers for each participating author. Spearman’s rank correlation was calculated (Microsoft ExcelTM) where appropriate.
Altmetrics and Page Views
As a means to measure exposure and dissemination external to Twitter, we assessed the change (“Delta”) in the each article’s Altmetric score9, a digital-based metric that quantifies the attention received by a scientific publication on various online platforms including news, blogs, and social media. Delta Altmetric scores were calculated as the difference between the scores on the day of the session and 2 weeks after the respective session, with higher scores indicating greater global online discussion. By measuring the Altmetric score on the day of the discussion, we established a baseline score for comparison purposes. Additionally, this allowed us to better attribute any changes that may have occurred to the discussion itself.
Additionally, using information provided by the journal publisher (John Wiley & Sons Publishing) in 2016, we assessed the effect of #JHMChat on the number of article page views on the JHM website relative to the release of the electronic Table of Contents (eTOC). The eTOC release was chosen as it is historically associated with a high number of page views. In order to isolate the effect of #JHMChat, we only reviewed months in which #JHMChat was not held within 3 days of the eTOC release. Because JHM changed publishers in January 2017, we only assessed page view data on 2016 sessions, as the new publisher lacked enhanced search optimization to obtain these data.
Thematic Analysis
In addition to the above measurements, a thematic analysis of each article was conducted to assess any common themes that would influence our chosen metrics. Themes were assessed and ascribed by one author (C.M.W.) and verified by another (V.M.A.).
Participant and Author Experience
To assess the participant experience, responses to a post-session CME questionnaire that assessed (1) overall quality, (2) comprehensiveness of the discussion, (3) whether the participant would recommend the chat to a colleague, and (4) whether participation would lead to practice-changing measures were reviewed. Registration of each session for CME was also quantified. Finally, each participating author was asked to fill out an electronic post-chat survey (SurveyMonkey®) meant to assess the authors’ experience with the journal club (Appendix).
RESULTS
Between October 2015 and November 2017, a total of 15 sessions were held with a mean of 2.17 (±0.583) million impressions/session, 499 (±129) total tweets/session, and 73 (±24) participants/session (compared to a range of 21-58 participants/session from other online journal clubs, where reported) with 7.2 (±2.0) tweets/participant (Table 1). The total number of participants for all sessions was 1096. Participating authors had on average 1389 (±2714) followers, ranging from a low of 37 to a high of 10,376 (Appendix). No correlation between author following and number of participants (r = 0.19), impressions (r = 0.05), or change in Altmetric score (r = 0.17) was seen.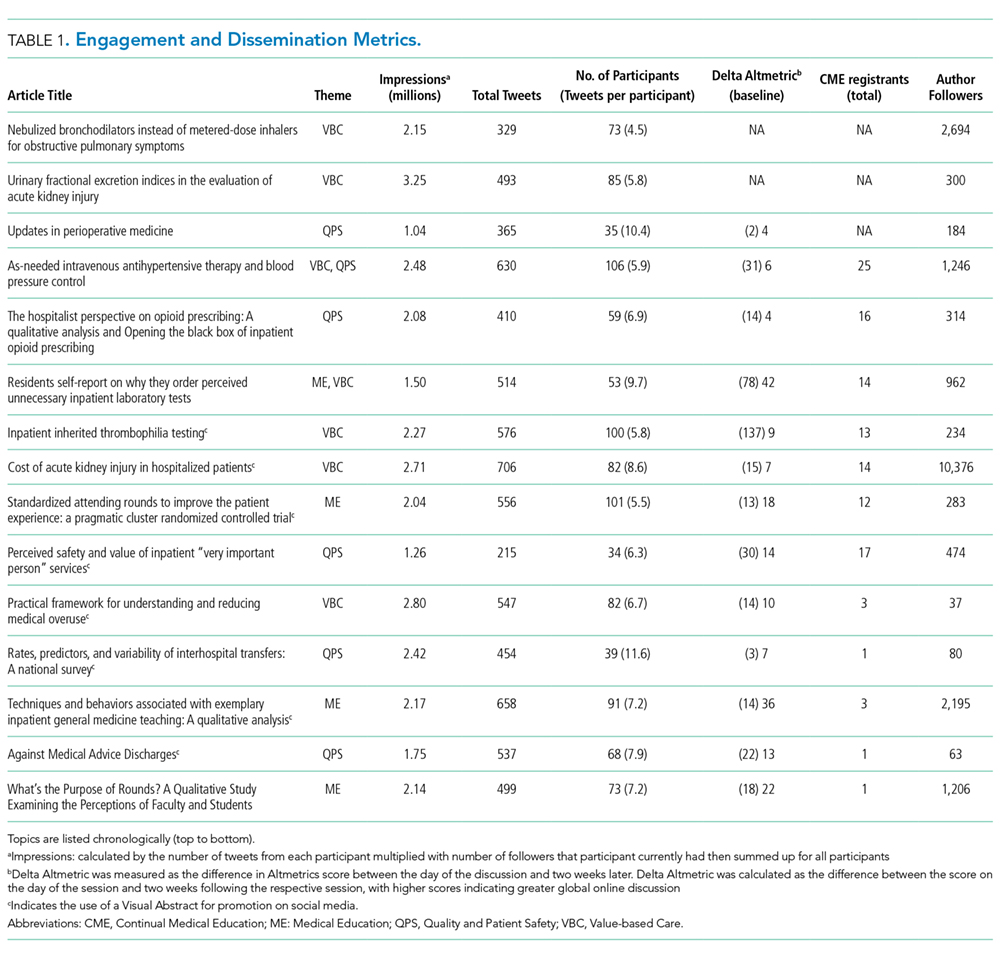
Thematic analysis revealed 3 predominant themes among the chosen articles: Value-based care (VBC), Quality and Patient Safety (QPS), and Medical Education (ME). Articles focused on VBC had the greatest number of impressions (mean ±SD: 2.61 ± 0.55 million) and participants (mean ±SD: 90 ± 12), while QPS articles had the fewest impressions (mean ±SD: 1.71 ± 0.59 million) and number of participants (mean ±SD: 47 ± 16). The mean increase in the Altmetric score among all discussed articles was 14 (±12), from an average baseline of 30 (±37). Medical Education-themed articles appeared to garner the greatest increase in Altmetric scores, averaging an increase of 32 points, compared with an average baseline score of 31 (±32). In contrast, VBC and QPS articles averaged an increase of 8.6 and 8.4 points, from average baselines of 55 (±53) and 17 (±13), respectively. A 2-month analysis of JHM articles not included in these discussions, in which Altmetric scores were measured in the same way as those from the discussion, revealed a baseline Altmetric score of 27 (±24) with an average increase of 8 (±6) 2 weeks following the chat.
Four articles met the inclusion criteria for page view analysis and suggested that article page views increased to similar levels as the eTOC release (mean: 2668 vs. 2998, respectively; P = .35) (Figure). These increases equate to a 33% and 50% increase in average daily page views (2002) for the chat and eTOC release, respectively.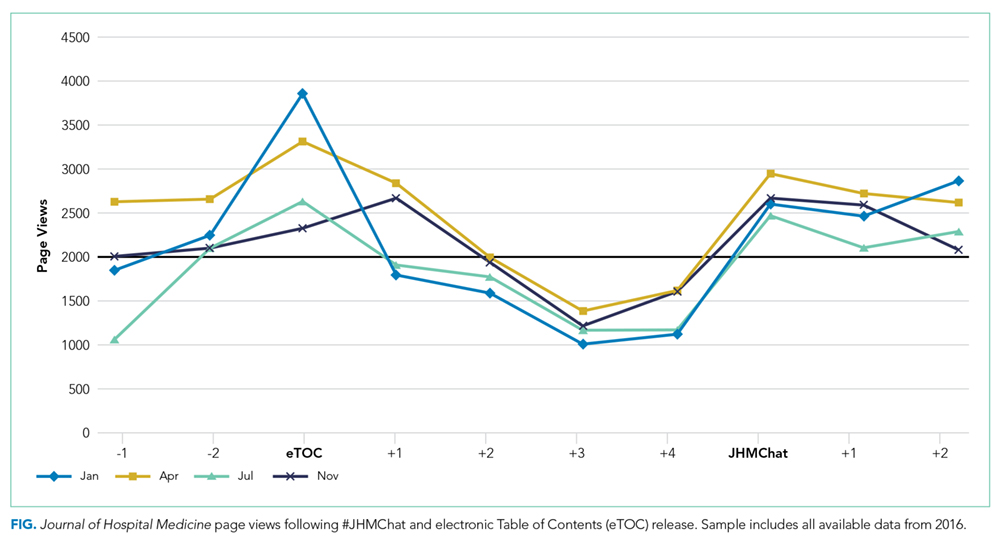
Ninety-three percent (14/15) of the participating authors responded to the post-discussion survey. All strongly agreed (5/5 on a Likert scale) that the venue allowed for an in-depth discussion about processes and challenges in conducting the study and allowed for greater dissemination and visibility of their work (5/5). Additionally, authors agreed that the journal club was a valuable experience for themselves (4.88/5) and other practitioners (4.88/5). Most agreed that the journal club allowed them to share their work with a different group of participants than usual (4.75/5) and that the experience changed how they would discuss their manuscripts in the future (4.75/5.0); Table 2).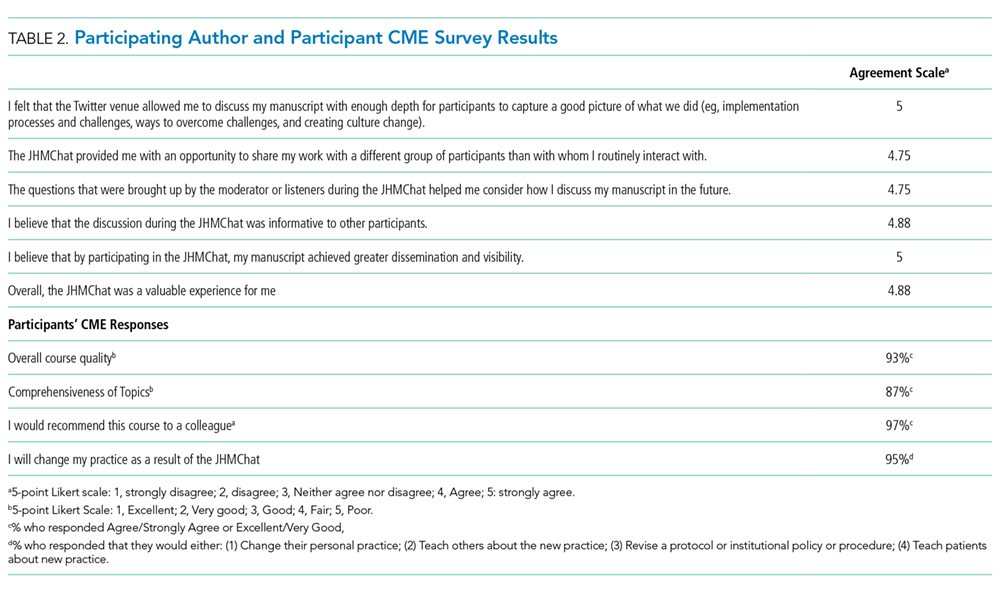
DISCUSSION
The Twitter-based journal club #JHMChat appears to increase social media awareness and dissemination of journal articles and was considered a useful engagement platform by both authors and participants.
Articles with a focus on VBC and ME had the greatest impact on dissemination metrics, particularly, total impressions and Altmetric scores, respectively. Given the strong presence and interest in these topics within Twitter and social media, these findings are not surprising.10,11 For example, over the past several years, the VBC movement has taken shape and grown alongside the expansion of social media, thus giving a space for this community to grow and engage. Of note, the cosponsorship relationship with the ABIM Foundation (which works closely with the Choosing Wisely™ campaign) and the Costs of Care Organization could have influenced the participation and dissemination rates of VBC articles. Medical education articles were also popular and appeared to have increased uptake after chats, based on their Altmetric scores. This may be explained by the fact that medical educators have long utilized social media as a means to connect and engage within their community.12–14 It is also possible that the use of Twitter by trainees (residents, students) may have driven some of the dissemination of ME articles, as this group may not be regular subscribers to JHM.
Online journal clubs offer distinct advantages over traditional in-person journal clubs. First, online journal clubs allow for increased connectivity among online communities, bringing together participants from different geographic areas with diverse training and clinical experiences. Subsequently, this allows for the rapid exchange of both personal and organizational approaches to the topic of discussion.15–17 Second, online journal clubs allow for continual access to the discussion material. For example, while the metrics used in this study only assessed active, synchronous participation, anecdotal evidence and feedback to the authors suggests that many individuals passively engaged by following along or reviewed the chat feed post hoc at their convenience. This asynchronous access is a quality not found in more traditional journal club formats. Finally, because online journal clubs commonly operate with a flattened hierarchy,18 they can break down access barriers to both the researchers who performed the study and thought leaders who commonly participate.17
Several insightful lessons were gleaned in the production and management of this online journal club. On the implementation side, promotion, preparation, and continued organization of an online journal club requires a fair amount of work. In this case, the required time and resources were provided by 2 social media editors in addition to administrative assistance from the SHM. The high attrition rate of online journal clubs over the years attests to these difficulties.24 Additionally, finding incentives to attract and sustain participation can be difficult, as we noted that neither CME nor author popularity (based on their Twitter following) appeared to influence engagement metrics (number of participants, total tweets, and tweets/participant). We also found that partnering with other journal club communities, in particular #NephJC, lead to greater participation rates and impressions. Thus, leveraging connections and topics that span clinical domains may be one way to improve and broaden engagement within these forums. Finally, feedback from participants revealed that the timing of the journal club and the inability to have in-depth discussions, a characteristic commonly associated with traditional journal clubs, were problematic.
This study has several limitations. First, the metrics used to assess social media engagement and dissemination can be easily skewed. For instance, the activity of 1 or 2 individuals with large followings can dramatically influence the number of impressions, giving a falsely elevated sense of broad dissemination. Conversely, there may have been some participants who did not use the #JHMChat hashtag, thus leading to an underestimation in these metrics. Second, while we report total impressions as a measure of dissemination, this metric represents possible interactions and does not guarantee interaction or visualization of that tweet. Additionally, we were unable to characterize our participants and their participation rates over time, as this information is not made available through Symplur© analytics. Third, our page view assessment was limited to 2016 sessions only; therefore, these data may not be an accurate reflection of the impact of #JHMChat on this metric. Fourth, given the marginal response rate to our CME questionnaire, a selection bias could have occurred. Finally, whether social media discussions such as online journal clubs act as leading indicators for future citations remains unclear, as some research has shown an association between increased Altmetric scores and increased citation rates,19-21 while others have not.22,23 Our study was not equipped to assess this correlation.
CONCLUSION
Online journal clubs create new opportunities to connect, engage, and disseminate medical research. These developing forums provide journal editors, researchers, patients, and clinicians with a means to connect and discuss research in ways that were not previously possible. In order to continue to evolve and grow, future research in online journal clubs should explore the downstream effects on citation rates, clinical uptake, and participant knowledge after the sessions.
Acknowledgments
The authors would like to thank Felicia Steele for her assistance in organizing and promoting the chats. Additionally, the authors would like to thank all the authors, guests and participants who took time from their families, work, and daily lives to participate in these activities. Your time and presence were truly appreciated.
Disclosures
The authors of this article operate as the Social Media Editors (C.M.W., V.M.A.) and the Editor-in-Chief (A.A.) for the Journal of Hospital Medicine. Dr. Wray had full access to all the data in the project, takes responsibility for the integrity of the data, and the accuracy of the data analysis.
1. Topf JM, Sparks MA, Phelan PJ, et al. The evolution of the journal club: from osler to twitter. Am J Kidney Dis Off J Natl Kidney Found. 2017;69(6):827-836. doi: 10.1053/j.ajkd.2016.12.012. PubMed
2. Thangasamy IA, Leveridge M, Davies BJ, Finelli A, Stork B, Woo HH. International urology journal club via Twitter: 12-month experience. Eur Urol. 2014;66(1):112-117. doi: 10.1016/j.eururo.2014.01.034. PubMed
3. Gardhouse AI, Budd L, Yang SYC, Wong CL. #GeriMedJC: the Twitter complement to the traditional-format geriatric medicine journal club. J Am Geriatr Soc. 2017;65(6):1347-1351. doi: 10.1111/jgs.14920. PubMed
4. Duque L. How academics and researchers can get more out of social media. Harvard Business Review. https://hbr.org/2016/06/how-academics-and-researchers-can-get-more-out-of-social-media. Accessed November 9, 2017.
5. Wray CM, Arora VM. #VisualAbstract: a revolution in communicating science? Ann Surg. 2017;266(6):e49-e50. doi: 10.1097/SLA.0000000000002339. PubMed
6. Ibrahim AM. Seeing is believing: using visual abstracts to disseminate scientific research. Am J Gastroenterol. 2017:ajg2017268. doi: 10.1038/ajg.2017.268. PubMed
7. #JHMChat. http://shm.hospitalmedicine.org/acton/media/25526/jhmchat. Accessed November 9, 2017.
8. #JHMChat-healthcare social media. Symplur. https://www.symplur.com/search/%23JHMChat. Accessed November 9, 2017.
9. Altmetric. Altmetric. https://www.altmetric.com/. Accessed November 9, 2017.
10. value-based healthcare | Symplur. https://www.symplur.com/topic/value-based-healthcare/. Accessed November 17, 2017.
11. medical education | Symplur. https://www.symplur.com/topic/medical-education/. Accessed November 17, 2017.
12. Sterling M, Leung P, Wright D, Bishop TF. The use of social media in graduate medical education: a systematic review. Acad Med. 2017;92(7):1043. doi: 10.1097/ACM.0000000000001617. PubMed
13. Davis WM, Ho K, Last J. Advancing social media in medical education. CMAJ Can Med Assoc J. 2015;187(8):549-550. doi: 10.1503/cmaj.141417. PubMed
14. Hillman T, Sherbino J. Social media in medical education: a new pedagogical paradigm? Postgrad Med J. 2015;91(1080):544-545. doi: 10.1136/postgradmedj-2015-133686. PubMed
15. Gerds AT, Chan T. Social media in hematology in 2017: dystopia, utopia, or somewhere in-between? Curr Hematol Malig Rep. 2017;12(6):582-591. doi: 10.1007/s11899-017-0424-8. PubMed
16. Mehta N, Flickinger T. The times they are a-changin’: academia, social media and the JGIM Twitter Journal Club. J Gen Intern Med. 2014;29(10):1317-1318. doi: 10.1007/s11606-014-2976-9. PubMed
17. Chan T, Trueger NS, Roland D, Thoma B. Evidence-based medicine in the era of social media: scholarly engagement through participation and online interaction. CJEM. 2017:1-6. doi: 10.1017/cem.2016.407. PubMed
18. Utengen A. The flattening of healthcare: breaking down of barriers in healthcare social media-twitter visualized. https://www.symplur.com/shorts/the-flattening-of-healthcare-twitter-visualized/. Accessed November 8, 2017.
19. Thelwall M, Haustein S, Larivière V, Sugimoto CR. Do altmetrics work? Twitter and ten other social web services. PloS One. 2013;8(5):e64841. doi: 10.1371/journal.pone.0064841. PubMed
20. Peoples BK, Midway SR, Sackett D, Lynch A, Cooney PB. Twitter predicts citation rates of ecological research. PloS One. 2016;11(11):e0166570. doi: 10.1371/journal.pone.0166570. PubMed
21. Eysenbach G. Can tweets predict citations? Metrics of social impact based on Twitter and correlation with traditional metrics of scientific impact. J Med Internet Res. 2011;13(4):e123. doi: 10.2196/jmir.2012. PubMed
22. Winter JCF de. The relationship between tweets, citations, and article views for PLOS ONE articles. Scientometrics. 2015;102(2):1773-1779. doi: 10.1007/s11192-014-1445-x.
23. Haustein S, Peters I, Sugimoto CR, Thelwall M, Larivière V. Tweeting biomedicine: an analysis of tweets and citations in the biomedical literature. J Assoc Inf Sci Technol. 2014;65(4):656-669. doi: 10.1002/asi.23101.
24. Journal club. In: Wikipedia. 2017. https://en.wikipedia.org/w/index.php?title=Journal_club&oldid=807037773. Accessed November 9, 2017.
Clinicians, educators, and medical journals are increasingly using the social media outlet, Twitter, as a medium to connect and engage with their colleagues. In particular, online journal clubs have created a space for the timely discussion of research, creation of online communities, and dissemination of research.
Social media-based journal clubs are thought to be one way in which journals can leverage the power of social networks so that researchers can engage with a diverse range of end users4 (including bedside clinicians, administrators, and patients). Several examples of these models exist. For example, #GeriMedJC acts as a complimentary, synchronous chat that takes place at the same time as a live, in-person journal club. #NephJC offers multiple 1-hour chats per month and provides an in-depth summary and analysis of each article, while #UroJC is an asynchronous discussion that takes place over 48 hours. Few data exist to describe whether any of these programs produce measurable improvements in indicators of engagement or dissemination of results.
In 2015, the Journal of Hospital Medicine (JHM) began producing a Twitter-based journal club as a means to connect and engage the Hospital Medicine community and allow for discussion and rapid exchange of information and opinions around a specific clinical topic. This study aims to describe the implementation of the first Journal-sponsored, Twitter-based online journal club and ascertain its impact on both Twitter and journal metrics.
METHODS
#JHMChat was launched in October 2015, and was initially held every 2-3 months until January 2017, when chats began to take place monthly. Each 1-hour chat focused on a recently published article in JHM, was moderated by a JHM social media editor (C.M.W., V.M.A.), and included at least 1 study author or guest expert. Articles were chosen by the social media editors based on the following criteria: (1) attractiveness to possible participants, (2) providing topic variety within the journal club series, and (3) sustainability and topic conduciveness to the online chat model. Chats were held at 9 PM EST in order to engage hospitalists across all US time zones and on different days to accommodate authors’ availability. All sessions were framed by 3-4 questions intended to encourage discussion and presented to chat participants at spaced intervals so as to stimulate a current of responses.
Chats were promoted by way of the JHM (@JHospMedicine, 3400 followers) and Society of Hospital Medicine (SHM; @SHMLive, 5800 followers) Twitter feeds beginning 1 month prior to each session. Visual Abstracts5,6 were used to publicize the sessions, also via Twitter, starting in February 2017.
Continuing Medical Education (CME) credits were offered through the SHM to registered participants, starting in July 2016.7 All sessions were cosponsored by the American Board of Internal Medicine (ABIM) Foundation and the Costs of Care Organization, a non-profit organization aimed at improving healthcare value.
Twitter Metrics
After each session, the following Twitter-based engagement metrics were obtained using the Symplur© Healthcare Hashtag project;8 total number of participants and tweets, tweets/participant, and total impressions (calculated as the number of tweets from each participant multiplied by the number of followers that participant currently had then summed up for all participants). Simply put, impressions can also be thought of as the number of times a single Tweet makes it into someone else’s Twitter feed. So as to avoid artificially inflated metrics, all were obtained 2 hours after the end of the journal club. Participants were defined as anyone who posted an original tweet or retweeted during the session and were encouraged to tag their tweets with the hashtag #JHMChat for post-discussion indexing and measurement. Because authors’ or guests’ popularity on Twitter may influence participation rates, we also assessed the number of followers for each participating author. Spearman’s rank correlation was calculated (Microsoft ExcelTM) where appropriate.
Altmetrics and Page Views
As a means to measure exposure and dissemination external to Twitter, we assessed the change (“Delta”) in the each article’s Altmetric score9, a digital-based metric that quantifies the attention received by a scientific publication on various online platforms including news, blogs, and social media. Delta Altmetric scores were calculated as the difference between the scores on the day of the session and 2 weeks after the respective session, with higher scores indicating greater global online discussion. By measuring the Altmetric score on the day of the discussion, we established a baseline score for comparison purposes. Additionally, this allowed us to better attribute any changes that may have occurred to the discussion itself.
Additionally, using information provided by the journal publisher (John Wiley & Sons Publishing) in 2016, we assessed the effect of #JHMChat on the number of article page views on the JHM website relative to the release of the electronic Table of Contents (eTOC). The eTOC release was chosen as it is historically associated with a high number of page views. In order to isolate the effect of #JHMChat, we only reviewed months in which #JHMChat was not held within 3 days of the eTOC release. Because JHM changed publishers in January 2017, we only assessed page view data on 2016 sessions, as the new publisher lacked enhanced search optimization to obtain these data.
Thematic Analysis
In addition to the above measurements, a thematic analysis of each article was conducted to assess any common themes that would influence our chosen metrics. Themes were assessed and ascribed by one author (C.M.W.) and verified by another (V.M.A.).
Participant and Author Experience
To assess the participant experience, responses to a post-session CME questionnaire that assessed (1) overall quality, (2) comprehensiveness of the discussion, (3) whether the participant would recommend the chat to a colleague, and (4) whether participation would lead to practice-changing measures were reviewed. Registration of each session for CME was also quantified. Finally, each participating author was asked to fill out an electronic post-chat survey (SurveyMonkey®) meant to assess the authors’ experience with the journal club (Appendix).
RESULTS
Between October 2015 and November 2017, a total of 15 sessions were held with a mean of 2.17 (±0.583) million impressions/session, 499 (±129) total tweets/session, and 73 (±24) participants/session (compared to a range of 21-58 participants/session from other online journal clubs, where reported) with 7.2 (±2.0) tweets/participant (Table 1). The total number of participants for all sessions was 1096. Participating authors had on average 1389 (±2714) followers, ranging from a low of 37 to a high of 10,376 (Appendix). No correlation between author following and number of participants (r = 0.19), impressions (r = 0.05), or change in Altmetric score (r = 0.17) was seen.
Thematic analysis revealed 3 predominant themes among the chosen articles: Value-based care (VBC), Quality and Patient Safety (QPS), and Medical Education (ME). Articles focused on VBC had the greatest number of impressions (mean ±SD: 2.61 ± 0.55 million) and participants (mean ±SD: 90 ± 12), while QPS articles had the fewest impressions (mean ±SD: 1.71 ± 0.59 million) and number of participants (mean ±SD: 47 ± 16). The mean increase in the Altmetric score among all discussed articles was 14 (±12), from an average baseline of 30 (±37). Medical Education-themed articles appeared to garner the greatest increase in Altmetric scores, averaging an increase of 32 points, compared with an average baseline score of 31 (±32). In contrast, VBC and QPS articles averaged an increase of 8.6 and 8.4 points, from average baselines of 55 (±53) and 17 (±13), respectively. A 2-month analysis of JHM articles not included in these discussions, in which Altmetric scores were measured in the same way as those from the discussion, revealed a baseline Altmetric score of 27 (±24) with an average increase of 8 (±6) 2 weeks following the chat.
Four articles met the inclusion criteria for page view analysis and suggested that article page views increased to similar levels as the eTOC release (mean: 2668 vs. 2998, respectively; P = .35) (Figure). These increases equate to a 33% and 50% increase in average daily page views (2002) for the chat and eTOC release, respectively.
Ninety-three percent (14/15) of the participating authors responded to the post-discussion survey. All strongly agreed (5/5 on a Likert scale) that the venue allowed for an in-depth discussion about processes and challenges in conducting the study and allowed for greater dissemination and visibility of their work (5/5). Additionally, authors agreed that the journal club was a valuable experience for themselves (4.88/5) and other practitioners (4.88/5). Most agreed that the journal club allowed them to share their work with a different group of participants than usual (4.75/5) and that the experience changed how they would discuss their manuscripts in the future (4.75/5.0); Table 2).
DISCUSSION
The Twitter-based journal club #JHMChat appears to increase social media awareness and dissemination of journal articles and was considered a useful engagement platform by both authors and participants.
Articles with a focus on VBC and ME had the greatest impact on dissemination metrics, particularly, total impressions and Altmetric scores, respectively. Given the strong presence and interest in these topics within Twitter and social media, these findings are not surprising.10,11 For example, over the past several years, the VBC movement has taken shape and grown alongside the expansion of social media, thus giving a space for this community to grow and engage. Of note, the cosponsorship relationship with the ABIM Foundation (which works closely with the Choosing Wisely™ campaign) and the Costs of Care Organization could have influenced the participation and dissemination rates of VBC articles. Medical education articles were also popular and appeared to have increased uptake after chats, based on their Altmetric scores. This may be explained by the fact that medical educators have long utilized social media as a means to connect and engage within their community.12–14 It is also possible that the use of Twitter by trainees (residents, students) may have driven some of the dissemination of ME articles, as this group may not be regular subscribers to JHM.
Online journal clubs offer distinct advantages over traditional in-person journal clubs. First, online journal clubs allow for increased connectivity among online communities, bringing together participants from different geographic areas with diverse training and clinical experiences. Subsequently, this allows for the rapid exchange of both personal and organizational approaches to the topic of discussion.15–17 Second, online journal clubs allow for continual access to the discussion material. For example, while the metrics used in this study only assessed active, synchronous participation, anecdotal evidence and feedback to the authors suggests that many individuals passively engaged by following along or reviewed the chat feed post hoc at their convenience. This asynchronous access is a quality not found in more traditional journal club formats. Finally, because online journal clubs commonly operate with a flattened hierarchy,18 they can break down access barriers to both the researchers who performed the study and thought leaders who commonly participate.17
Several insightful lessons were gleaned in the production and management of this online journal club. On the implementation side, promotion, preparation, and continued organization of an online journal club requires a fair amount of work. In this case, the required time and resources were provided by 2 social media editors in addition to administrative assistance from the SHM. The high attrition rate of online journal clubs over the years attests to these difficulties.24 Additionally, finding incentives to attract and sustain participation can be difficult, as we noted that neither CME nor author popularity (based on their Twitter following) appeared to influence engagement metrics (number of participants, total tweets, and tweets/participant). We also found that partnering with other journal club communities, in particular #NephJC, lead to greater participation rates and impressions. Thus, leveraging connections and topics that span clinical domains may be one way to improve and broaden engagement within these forums. Finally, feedback from participants revealed that the timing of the journal club and the inability to have in-depth discussions, a characteristic commonly associated with traditional journal clubs, were problematic.
This study has several limitations. First, the metrics used to assess social media engagement and dissemination can be easily skewed. For instance, the activity of 1 or 2 individuals with large followings can dramatically influence the number of impressions, giving a falsely elevated sense of broad dissemination. Conversely, there may have been some participants who did not use the #JHMChat hashtag, thus leading to an underestimation in these metrics. Second, while we report total impressions as a measure of dissemination, this metric represents possible interactions and does not guarantee interaction or visualization of that tweet. Additionally, we were unable to characterize our participants and their participation rates over time, as this information is not made available through Symplur© analytics. Third, our page view assessment was limited to 2016 sessions only; therefore, these data may not be an accurate reflection of the impact of #JHMChat on this metric. Fourth, given the marginal response rate to our CME questionnaire, a selection bias could have occurred. Finally, whether social media discussions such as online journal clubs act as leading indicators for future citations remains unclear, as some research has shown an association between increased Altmetric scores and increased citation rates,19-21 while others have not.22,23 Our study was not equipped to assess this correlation.
CONCLUSION
Online journal clubs create new opportunities to connect, engage, and disseminate medical research. These developing forums provide journal editors, researchers, patients, and clinicians with a means to connect and discuss research in ways that were not previously possible. In order to continue to evolve and grow, future research in online journal clubs should explore the downstream effects on citation rates, clinical uptake, and participant knowledge after the sessions.
Acknowledgments
The authors would like to thank Felicia Steele for her assistance in organizing and promoting the chats. Additionally, the authors would like to thank all the authors, guests and participants who took time from their families, work, and daily lives to participate in these activities. Your time and presence were truly appreciated.
Disclosures
The authors of this article operate as the Social Media Editors (C.M.W., V.M.A.) and the Editor-in-Chief (A.A.) for the Journal of Hospital Medicine. Dr. Wray had full access to all the data in the project, takes responsibility for the integrity of the data, and the accuracy of the data analysis.
1. Topf JM, Sparks MA, Phelan PJ, et al. The evolution of the journal club: from osler to twitter. Am J Kidney Dis Off J Natl Kidney Found. 2017;69(6):827-836. doi: 10.1053/j.ajkd.2016.12.012. PubMed
2. Thangasamy IA, Leveridge M, Davies BJ, Finelli A, Stork B, Woo HH. International urology journal club via Twitter: 12-month experience. Eur Urol. 2014;66(1):112-117. doi: 10.1016/j.eururo.2014.01.034. PubMed
3. Gardhouse AI, Budd L, Yang SYC, Wong CL. #GeriMedJC: the Twitter complement to the traditional-format geriatric medicine journal club. J Am Geriatr Soc. 2017;65(6):1347-1351. doi: 10.1111/jgs.14920. PubMed
4. Duque L. How academics and researchers can get more out of social media. Harvard Business Review. https://hbr.org/2016/06/how-academics-and-researchers-can-get-more-out-of-social-media. Accessed November 9, 2017.
5. Wray CM, Arora VM. #VisualAbstract: a revolution in communicating science? Ann Surg. 2017;266(6):e49-e50. doi: 10.1097/SLA.0000000000002339. PubMed
6. Ibrahim AM. Seeing is believing: using visual abstracts to disseminate scientific research. Am J Gastroenterol. 2017:ajg2017268. doi: 10.1038/ajg.2017.268. PubMed
7. #JHMChat. http://shm.hospitalmedicine.org/acton/media/25526/jhmchat. Accessed November 9, 2017.
8. #JHMChat-healthcare social media. Symplur. https://www.symplur.com/search/%23JHMChat. Accessed November 9, 2017.
9. Altmetric. Altmetric. https://www.altmetric.com/. Accessed November 9, 2017.
10. value-based healthcare | Symplur. https://www.symplur.com/topic/value-based-healthcare/. Accessed November 17, 2017.
11. medical education | Symplur. https://www.symplur.com/topic/medical-education/. Accessed November 17, 2017.
12. Sterling M, Leung P, Wright D, Bishop TF. The use of social media in graduate medical education: a systematic review. Acad Med. 2017;92(7):1043. doi: 10.1097/ACM.0000000000001617. PubMed
13. Davis WM, Ho K, Last J. Advancing social media in medical education. CMAJ Can Med Assoc J. 2015;187(8):549-550. doi: 10.1503/cmaj.141417. PubMed
14. Hillman T, Sherbino J. Social media in medical education: a new pedagogical paradigm? Postgrad Med J. 2015;91(1080):544-545. doi: 10.1136/postgradmedj-2015-133686. PubMed
15. Gerds AT, Chan T. Social media in hematology in 2017: dystopia, utopia, or somewhere in-between? Curr Hematol Malig Rep. 2017;12(6):582-591. doi: 10.1007/s11899-017-0424-8. PubMed
16. Mehta N, Flickinger T. The times they are a-changin’: academia, social media and the JGIM Twitter Journal Club. J Gen Intern Med. 2014;29(10):1317-1318. doi: 10.1007/s11606-014-2976-9. PubMed
17. Chan T, Trueger NS, Roland D, Thoma B. Evidence-based medicine in the era of social media: scholarly engagement through participation and online interaction. CJEM. 2017:1-6. doi: 10.1017/cem.2016.407. PubMed
18. Utengen A. The flattening of healthcare: breaking down of barriers in healthcare social media-twitter visualized. https://www.symplur.com/shorts/the-flattening-of-healthcare-twitter-visualized/. Accessed November 8, 2017.
19. Thelwall M, Haustein S, Larivière V, Sugimoto CR. Do altmetrics work? Twitter and ten other social web services. PloS One. 2013;8(5):e64841. doi: 10.1371/journal.pone.0064841. PubMed
20. Peoples BK, Midway SR, Sackett D, Lynch A, Cooney PB. Twitter predicts citation rates of ecological research. PloS One. 2016;11(11):e0166570. doi: 10.1371/journal.pone.0166570. PubMed
21. Eysenbach G. Can tweets predict citations? Metrics of social impact based on Twitter and correlation with traditional metrics of scientific impact. J Med Internet Res. 2011;13(4):e123. doi: 10.2196/jmir.2012. PubMed
22. Winter JCF de. The relationship between tweets, citations, and article views for PLOS ONE articles. Scientometrics. 2015;102(2):1773-1779. doi: 10.1007/s11192-014-1445-x.
23. Haustein S, Peters I, Sugimoto CR, Thelwall M, Larivière V. Tweeting biomedicine: an analysis of tweets and citations in the biomedical literature. J Assoc Inf Sci Technol. 2014;65(4):656-669. doi: 10.1002/asi.23101.
24. Journal club. In: Wikipedia. 2017. https://en.wikipedia.org/w/index.php?title=Journal_club&oldid=807037773. Accessed November 9, 2017.
© 2018 Society of Hospital Medicine
FYI: This Message Will Interrupt You – Texting Impact on Clinical Learning Environment
Fifteen years ago, beepers with 5-digit call-back numbers were the norm. Pushing a call light button outside the patient’s room to flag the desk clerk that a new order had been hand-written was all part of the lived experience of residency. Using that as our baseline, we have clearly come a long way in the way that we communicate with other clinicians in hospitals. Communication among the patient care team in the digital age predominantly involves bidirectional messaging using mobile devices. The approach is both immediate and convenient. Mobile devices can improve work efficiency, patient safety, and quality of care, but their main advantage may be real-time bedside decision support.1,2 However, the widespread use of mobile devices for communication in healthcare is not without its concerns. First and foremost, there has been abundant literature around short message service (SMS) use in the healthcare setting, and there are concerns surrounding both threats to privacy and the prevalence and impact of interruptions in clinical care.
The first SMS was sent in 1992.3 Text messaging since then has become ubiquitous, even in healthcare, raising concerns around the protection of patient health information under the Health Insurance Portability and Accountability Act (HIPAA). Interestingly, the United States Department of Health and Human Services Office for Civil Rights, enforcer of HIPAA, is tech neutral on the subject.3 Multiple studies have assessed physician stances on SMS communication in the healthcare setting using routine, non-HIPAA-compliant mobile phones. Overall, 60%-80% of respondents admitted to using SMS in patient care, while in another study, 72% and 80% of Internal Medicine residents surveyed found SMS to be the most efficient form of communication and overall preferred method of communication, respectively.3,4 Interestingly, 82.5% of those same residents preferred the hospital-based alphanumeric paging system for security purposes, even though Freundlich et al. make a compelling argument that unidirectional alphanumeric paging systems are most certainly less HIPAA compliant, lacking encryption and password protection.5 Newer platforms that enable HIPAA-compliant messaging are promising, although they may not be fully adopted by clinical teams without full-scale implementation in hospitals.6In addition to privacy concerns with SMS applications on mobile phones, interruptions in healthcare – be it from phone calls, emails, text messages, or in-person conversations – are common. In fact, famed communication researcher Enrico Coeira has notoriously described healthcare communication as ”interrupt-driven.”7 Prior work has shown that frequent interruptions in the healthcare setting can lead to medication prescription errors, errors in computerized physician order entry, and even surgical procedural errors.8-10
While studies have focused on interruptions in clinical care in the healthcare setting, little is known about how education may be compromised by interruptions due to mobile devices. Text messaging during dedicated conference time can lead to inadequate learning and a sense of frustration among residents. In this issue of the Journal of Hospital Medicine, Mendel et al. performed a quality improvement study involving eight academic inpatient clinical training units with the aim of reducing nonurgent text messages during education rounds.11 Their unique interventions included learning sessions, posters, adding alerts to the digital communication platform, and alternative messaging options. Of four sequential interventions, a message alerting the sender that they will be interrupting educational rounds and suggesting a “delayed send” or “send as an FYI” showed the greatest impact, reducing the number of text interruptions per team per educational hour from 0.81 to 0.59 (95% CI 0.51-0.67). When comparing a four-week pre-intervention sample with a four-week end-intervention sample, the percentage of nonurgent messages decreased from 82% to 68% (P < .01).
While these results are promising, challenges to large-scale implementation of such a program exist. Buy-in from the ancillary healthcare team is critical for such interventions to succeed and be sustained. It also places a burden of “point triage” on the healthcare team members, who must assess the patient situation and determine the level of urgency and whether to immediately interrupt, delay interrupt or send an FYI message. For example, in the study by Mendel et al.,11 it is noteworthy that urgent patient care issues were mislabeled as “FYI” in 2% of patients. While this is a seemingly low rate, even one of these mislabeled messages could result in significant adverse patient outcomes and should be considered a “never event.” Finally, the study used a messaging platform with programming flexibility and IT personnel to assist. This could be cost prohibitive for some programs, especially if rolled out to an entire institution.
Communication is critical for effective patient care and unfortunately, the timing of such communication is often not orderly but rather, chaotic. Text message communication can introduce interruptions into all aspects of patient care and education, not only dedicated learning conferences. If the goal is for all residents to attend all conferences, it seems impossible (and likely dangerous) to eliminate all messaging interruptions during conference hours. Nevertheless, it is worth noting that Mandel et al. have moved us creatively toward that goal with a multifaceted approach.11 Future work should address more downstream outcomes, such as objective resident learning retention and adverse patient events relative to the number of interruptions per educational hour. If such studies showed improved learning outcomes and fewer adverse patient events, the next step would be to further strengthen and refine their protocol with real-time and scheduled feedback sessions between providers and other patient care team members in addition to the continued search for additional innovative approaches. In addition, combining artificial intelligence or predictive modeling may help us delineate when an interruption is warranted, for example, when a patient is at high clinical risk without intervention. Likewise, human factors research may help us understand the best way to time and execute an interruption to minimize the risk to clinical care or education. After all, the ideal system would not eliminate interruptions entirely but allow clinicians to know when someone should be interrupted and when they do not need to be interrupted.
Disclosures
The authors have no financial relationships relevant to this article to disclose.
1. Berner ES, Houston TK, Ray MN, et al. Improving ambulatory prescribing safety with a handheld decision support system: a ran domized controlled trial. J Am Med Inform Assoc. 2006;13(2):171-179. doi: 10.1197/jamia.M1961. PubMed
2. Sintchenko V, Iredell JR, Gilbert GL, et al. Handheld computer-based decision support reduces patient length of stay and antibiotic prescribing in critical care. J Am Med Inform Assoc. 2005;12(4):398-402. doi: 10.1197/jamia.M1798. PubMed
3. Drolet BC. Text messaging and protected health information: what is permitted? JAMA. 2017;317(23):2369-2370. doi: 10.1001/jama.2017.5646. PubMed
4. Prochaska MT, Bird AN, Chadaga A, Arora VM. Resident use of text messaging for patient care: ease of use or breach of privacy? JMIR Med Inform. 2015;3(4):e37. doi: 10.2196/medinform.4797. PubMed
5. Samora JB, Blazar PE, Lifchez SD, et al. Mobile messaging communication in health care rules, regulations, penalties, and safety of provider use. JBJS Rev. 2018;6(3):e4. doi: 10.2106/JBJS.RVW.17.00070 PubMed
6. Freundlich RE, Freundlich KL, Drolet BC. Pagers, smartphones, and HIPAA: finding the best solution for electronic communication of protected health information. J Med Syst. 2017;42(1):9. doi: 10.1007/s10916-017-0870-9. PubMed
7. Coiera E. Clinical communication—a new informatics paradigm. In Proceedings of the American. Medical Informatics Association Autumn Symposium. 1996;17-21.
8. Feuerbacher RL, Funk KH, Spight DH, et al. Realistic distractions and interruptions that impair simulated surgical performance by novice surgeons. Arch Surg. 2012;147(11):1026-1030. doi: 10.1001/archsurg.2012.1480. PubMed
9. Agency for Healthcare Research and Quality–Patient Safety Network (AHRQ-PSNet). https://psnet.ahrq.gov/webmm/case/257/order-interrupted-by-text-multitasking-mishapCases & Commentaries. Order Interrupted by Text: Multitasking Mishap. December 2011. Commentary by John Halamka, MD, MS.
10. Westbrook JI, Raban MZ, Walter SR, et al. Task errors by emergency physicians are associated with interruptions, multitasking, fatigue and working memory capacity: a prospective, direct observation study [published online ahead of print January 9, 2018]. BMJ Qual Saf. doi: 10.1136/bmjqs-2017-007333. [Epub ahead of print]. PubMed
11. Mendel A, Lott A, Lo L, et al. A matter of urgency: reducing clinical text message interruptions during educational sessions. J Hosp Med. 2018;13(9):616-622. doi: 10.12788/jhm.2959. PubMed
Fifteen years ago, beepers with 5-digit call-back numbers were the norm. Pushing a call light button outside the patient’s room to flag the desk clerk that a new order had been hand-written was all part of the lived experience of residency. Using that as our baseline, we have clearly come a long way in the way that we communicate with other clinicians in hospitals. Communication among the patient care team in the digital age predominantly involves bidirectional messaging using mobile devices. The approach is both immediate and convenient. Mobile devices can improve work efficiency, patient safety, and quality of care, but their main advantage may be real-time bedside decision support.1,2 However, the widespread use of mobile devices for communication in healthcare is not without its concerns. First and foremost, there has been abundant literature around short message service (SMS) use in the healthcare setting, and there are concerns surrounding both threats to privacy and the prevalence and impact of interruptions in clinical care.
The first SMS was sent in 1992.3 Text messaging since then has become ubiquitous, even in healthcare, raising concerns around the protection of patient health information under the Health Insurance Portability and Accountability Act (HIPAA). Interestingly, the United States Department of Health and Human Services Office for Civil Rights, enforcer of HIPAA, is tech neutral on the subject.3 Multiple studies have assessed physician stances on SMS communication in the healthcare setting using routine, non-HIPAA-compliant mobile phones. Overall, 60%-80% of respondents admitted to using SMS in patient care, while in another study, 72% and 80% of Internal Medicine residents surveyed found SMS to be the most efficient form of communication and overall preferred method of communication, respectively.3,4 Interestingly, 82.5% of those same residents preferred the hospital-based alphanumeric paging system for security purposes, even though Freundlich et al. make a compelling argument that unidirectional alphanumeric paging systems are most certainly less HIPAA compliant, lacking encryption and password protection.5 Newer platforms that enable HIPAA-compliant messaging are promising, although they may not be fully adopted by clinical teams without full-scale implementation in hospitals.6In addition to privacy concerns with SMS applications on mobile phones, interruptions in healthcare – be it from phone calls, emails, text messages, or in-person conversations – are common. In fact, famed communication researcher Enrico Coeira has notoriously described healthcare communication as ”interrupt-driven.”7 Prior work has shown that frequent interruptions in the healthcare setting can lead to medication prescription errors, errors in computerized physician order entry, and even surgical procedural errors.8-10
While studies have focused on interruptions in clinical care in the healthcare setting, little is known about how education may be compromised by interruptions due to mobile devices. Text messaging during dedicated conference time can lead to inadequate learning and a sense of frustration among residents. In this issue of the Journal of Hospital Medicine, Mendel et al. performed a quality improvement study involving eight academic inpatient clinical training units with the aim of reducing nonurgent text messages during education rounds.11 Their unique interventions included learning sessions, posters, adding alerts to the digital communication platform, and alternative messaging options. Of four sequential interventions, a message alerting the sender that they will be interrupting educational rounds and suggesting a “delayed send” or “send as an FYI” showed the greatest impact, reducing the number of text interruptions per team per educational hour from 0.81 to 0.59 (95% CI 0.51-0.67). When comparing a four-week pre-intervention sample with a four-week end-intervention sample, the percentage of nonurgent messages decreased from 82% to 68% (P < .01).
While these results are promising, challenges to large-scale implementation of such a program exist. Buy-in from the ancillary healthcare team is critical for such interventions to succeed and be sustained. It also places a burden of “point triage” on the healthcare team members, who must assess the patient situation and determine the level of urgency and whether to immediately interrupt, delay interrupt or send an FYI message. For example, in the study by Mendel et al.,11 it is noteworthy that urgent patient care issues were mislabeled as “FYI” in 2% of patients. While this is a seemingly low rate, even one of these mislabeled messages could result in significant adverse patient outcomes and should be considered a “never event.” Finally, the study used a messaging platform with programming flexibility and IT personnel to assist. This could be cost prohibitive for some programs, especially if rolled out to an entire institution.
Communication is critical for effective patient care and unfortunately, the timing of such communication is often not orderly but rather, chaotic. Text message communication can introduce interruptions into all aspects of patient care and education, not only dedicated learning conferences. If the goal is for all residents to attend all conferences, it seems impossible (and likely dangerous) to eliminate all messaging interruptions during conference hours. Nevertheless, it is worth noting that Mandel et al. have moved us creatively toward that goal with a multifaceted approach.11 Future work should address more downstream outcomes, such as objective resident learning retention and adverse patient events relative to the number of interruptions per educational hour. If such studies showed improved learning outcomes and fewer adverse patient events, the next step would be to further strengthen and refine their protocol with real-time and scheduled feedback sessions between providers and other patient care team members in addition to the continued search for additional innovative approaches. In addition, combining artificial intelligence or predictive modeling may help us delineate when an interruption is warranted, for example, when a patient is at high clinical risk without intervention. Likewise, human factors research may help us understand the best way to time and execute an interruption to minimize the risk to clinical care or education. After all, the ideal system would not eliminate interruptions entirely but allow clinicians to know when someone should be interrupted and when they do not need to be interrupted.
Disclosures
The authors have no financial relationships relevant to this article to disclose.
1. Berner ES, Houston TK, Ray MN, et al. Improving ambulatory prescribing safety with a handheld decision support system: a ran domized controlled trial. J Am Med Inform Assoc. 2006;13(2):171-179. doi: 10.1197/jamia.M1961. PubMed
2. Sintchenko V, Iredell JR, Gilbert GL, et al. Handheld computer-based decision support reduces patient length of stay and antibiotic prescribing in critical care. J Am Med Inform Assoc. 2005;12(4):398-402. doi: 10.1197/jamia.M1798. PubMed
3. Drolet BC. Text messaging and protected health information: what is permitted? JAMA. 2017;317(23):2369-2370. doi: 10.1001/jama.2017.5646. PubMed
4. Prochaska MT, Bird AN, Chadaga A, Arora VM. Resident use of text messaging for patient care: ease of use or breach of privacy? JMIR Med Inform. 2015;3(4):e37. doi: 10.2196/medinform.4797. PubMed
5. Samora JB, Blazar PE, Lifchez SD, et al. Mobile messaging communication in health care rules, regulations, penalties, and safety of provider use. JBJS Rev. 2018;6(3):e4. doi: 10.2106/JBJS.RVW.17.00070 PubMed
6. Freundlich RE, Freundlich KL, Drolet BC. Pagers, smartphones, and HIPAA: finding the best solution for electronic communication of protected health information. J Med Syst. 2017;42(1):9. doi: 10.1007/s10916-017-0870-9. PubMed
7. Coiera E. Clinical communication—a new informatics paradigm. In Proceedings of the American. Medical Informatics Association Autumn Symposium. 1996;17-21.
8. Feuerbacher RL, Funk KH, Spight DH, et al. Realistic distractions and interruptions that impair simulated surgical performance by novice surgeons. Arch Surg. 2012;147(11):1026-1030. doi: 10.1001/archsurg.2012.1480. PubMed
9. Agency for Healthcare Research and Quality–Patient Safety Network (AHRQ-PSNet). https://psnet.ahrq.gov/webmm/case/257/order-interrupted-by-text-multitasking-mishapCases & Commentaries. Order Interrupted by Text: Multitasking Mishap. December 2011. Commentary by John Halamka, MD, MS.
10. Westbrook JI, Raban MZ, Walter SR, et al. Task errors by emergency physicians are associated with interruptions, multitasking, fatigue and working memory capacity: a prospective, direct observation study [published online ahead of print January 9, 2018]. BMJ Qual Saf. doi: 10.1136/bmjqs-2017-007333. [Epub ahead of print]. PubMed
11. Mendel A, Lott A, Lo L, et al. A matter of urgency: reducing clinical text message interruptions during educational sessions. J Hosp Med. 2018;13(9):616-622. doi: 10.12788/jhm.2959. PubMed
© 2018 Society of Hospital Medicine
Health Literacy and Hospital Length of Stay: An Inpatient Cohort Study
Health literacy (HL), defined as patients’ ability to understand health information and make health decisions,1 is a prevalent problem in the outpatient and inpatient settings.2,3 In both settings, low HL has adverse implications for self-care including interpreting health labels4 and taking medications correctly.5 Among outpatient cohorts, HL has been associated with worse outcomes and acute care utilization.6 Associations with low HL include increased hospitalizations,7 rehospitalizations,8,9 emergency department visits,10 and decreased preventative care use.11 Among the elderly, low HL is associated with increased mortality12 and decreased self-perception of health.13
A systematic review revealed that most high-quality HL outcome studies were conducted in the outpatient setting.6 There have been very few studies assessing effects of low HL in an acute-care setting.7,14 These studies have evaluated postdischarge outcomes, including admissions or readmissions,7-9 and medication knowledge.14 To the best of our knowledge, there are no studies evaluating associations between HL and hospital length of stay (LOS).
LOS has received much attention as providers and payers focus more on resource utilization and eliminating adverse effects of prolonged hospitalization.15 LOS is multifactorial, depending on clinical characteristics like disease severity, as well as on sociocultural, demographic, and geographic factors.16 Despite evidence that LOS reductions translate into improved resource allocation and potentially fewer complications, there remains a tension between the appropriate LOS and one that is too short for a given condition.17
Because low HL is associated with inefficient resource utilization, we hypothesized that low HL would be associated with increased LOS after controlling for illness severity. Our objectives were to evaluate the association between low HL and LOS and whether such an association was modified by illness severity and sociodemographics.
METHODS
Study Design, Setting, Participants
An in-hospital, cohort study design of patients who were admitted or transferred to the general medicine service at the University of Chicago between October 2012 and November 2015 and screened for inclusion as part of a large, ongoing study of inpatient care quality was conducted.18 Exclusion criteria included observation status, age under 18 years, non-English speaking, and repeat participants. Those who died during hospitalization or whose discharge status was missing were excluded because the primary goal was to examine the association of HL and time to discharge, which could not be evaluated among those who died. We excluded participants with LOS >30 days to limit overly influential effects of extreme outliers (1% of the population).
Variables
HL was screened using the Brief Health Literacy Screen (BHLS), a validated, 3-question verbal survey not requiring adequate visual acuity to assess HL.19,20 The 3 questions are as follows: (1) “How confident are you filling out medical forms by yourself?”, (2) “How often do you have someone help you read hospital materials?”, and (3) “How often do you have problems learning about your medical condition because of difficulty understanding written information?” Responses to the questions were scored on a 5-point Likert scale in which higher scores corresponded to higher HL.21,22 The scores for each of the 3 questions were summed to yield a range between 3 and 15. On the individual questions, prior work has demonstrated improved test performance with a cutoff of ≤3, which corresponds to a response of “some of the time” or “somewhat”; therefore, when the 3 questions were summed together, scores of ≤9 were considered indicative of low HL.21,23
For severity of illness adjustment, we used relative weights derived from the 3M (3M, Maplewood, MN) All Patient Refined Diagnosis Related Groups (APR-DRG) classification system, which uses administrative data to classify the severity. The APR-DRG system assigns each admission to a DRG based on principal diagnosis; for each DRG, patients are then subdivided into 4 severity classes based on age, comorbidity, and interactions between these variables and the admitting diagnosis.24 Using the base DRG and severity score, the system assigns relative weights that reflect differences in expected hospital resource utilization.
LOS was derived from hospital administrative data and counted from the date of admission to the hospital. Participants who were discharged on the day of admission were counted as having an LOS of 1. Insurance status (Medicare, Medicaid, no payer, private) also was obtained from administrative data. Age, sex (male or female), education (junior high or less, some high school, high school graduate, some college, college graduate, postgraduate), and race (black/African American, white, Asian or Pacific Islander [including Asian Indian, Chinese, Filipino, Japanese, Korean, Vietnamese, other Asian, Native Hawaiian, Guam/Chamorro, Samoan, other Pacific], American Indian or Alaskan Native, multiple race) were obtained from administrative data based on information provided by the patient. Participants with missing data on any of the sociodemographic variables or on the APR-DRG score were excluded from the analysis.
Statistical Analysis
χ2 and 2-tailed t tests were used to compare categorical and continuous variables, respectively. Multivariate linear regressions were employed to measure associations between the independent variables (HL, illness severity, race, gender, education, and insurance status) and the dependent variable, LOS. Independent variables were chosen for clinical significance and retained in the model regardless of statistical significance. The adjusted R2 values of models with and without the HL variable included were reported to provide information on the contribution of HL to the overall model.
Because LOS was observed to be right skewed and residuals of the untransformed regression were observed to be non-normally distributed, the decision was made to natural log transform LOS, which is consistent with previous hospital LOS studies.16 Regression coefficients and confidence intervals were then transformed into percentage estimates using the following equation: 100(eβ–1). Adjusted R2 was reported for the transformed regression.
The APR-DRG relative weight was treated as a continuous variable. Sociodemographic variables were dichotomized as follows: female vs male; high school graduates vs not; African American vs not; Medicaid/no payer vs Medicare/private payer. Age was not included in the multivariate model because it has been incorporated into the weighted APR-DRG illness severity scores.
Each of the sociodemographic variables and the APR-DRG score were examined for effect modification via the same multivariate linear equation described above, with the addition of an interaction term. A separate regression was performed with an interaction term between age (dichotomized at ≥65) and HL to investigate whether age modified the association between HL and LOS. Finally, we explored whether effects were isolated to long vs short LOS by dividing the sample based on the mean LOS (≥6 days) and performing separate multivariate comparisons.
Sensitivity analyses were performed to exclude those with LOS greater than the 90th percentile and those with APR-DRG score greater than the 90th percentile; age was added to the model as a continuous variable to evaluate whether the illness severity score fully adjusted for the effects of age on LOS. Furthermore, we compared the participants with missing data to those with complete data across both dependent and independent variables. Alpha was set at 0.05; analyses were performed using Stata Version 14 (Stata, College Station, TX).
RESULTS
A total of 5983 participants met inclusion criteria and completed the HL assessment; of these participants, 75 (1%) died during hospitalization, 9 (0.2%) had missing discharge status, and 79 (1%) had LOS >30 days. Two hundred eighty (5%) were missing data on sociodemographic variables or APR-DRG score. Of the remaining (n = 5540), the mean age was 57 years (standard deviation [SD] = 19 years), over half of participants were female (57%), and the majority were African American (73%) and had graduated from high school (81%). The sample was divided into those with private insurance (25%), those with Medicare (46%), and those with Medicaid (26%); 2% had no payer. The mean APR-DRG score was 1.3 (SD = 1.2), and the scores ranged from 0.3 to 15.8.
On the BHLS screen for HL, 20% (1104/5540) had inadequate HL. Participants with low HL had higher weighted illness severity scores (average 1.4 vs 1.3; P = 0.003). Participants with low HL were also more likely to be 65 or older (55% vs 33%; P < 0.001), non-high school graduates (35% vs 15%; P < 0.001), and African American (78% vs 72%; P < 0.001), and to have Medicare or private insurance (75% vs 71%; P = 0.02). There was no significant difference with respect to gender (54% male vs 57% female; P = 0.1)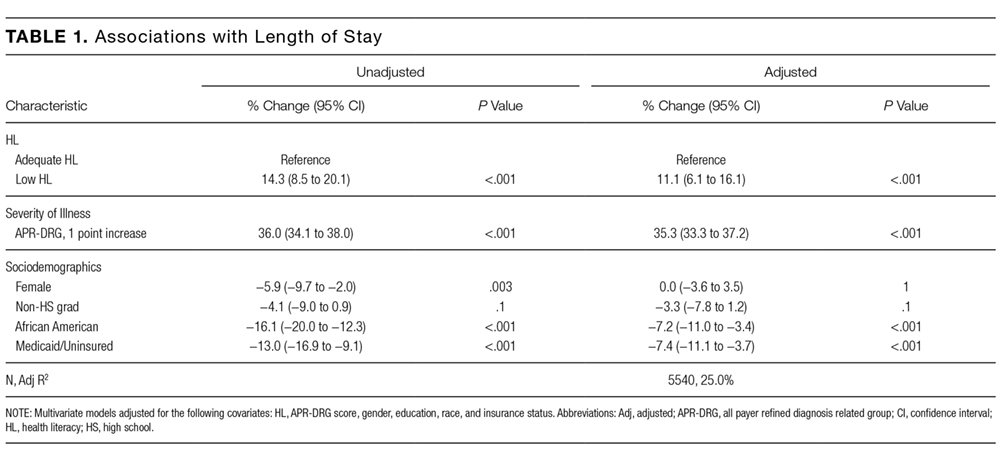
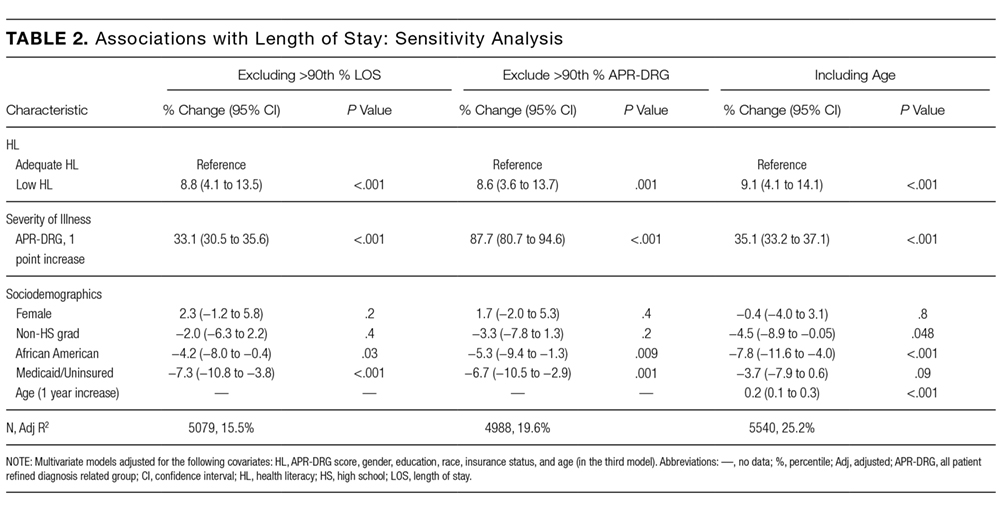
Finally, we compared the group with missing data (n = 280) to the group with complete data (n = 5540). The participants with missing data were more likely to have low HL (31% [86/280] vs 20%; P < 0.001) and to have Medicare or private insurance (82% [177/217] vs 72%; P = 0.002); however, they were not more likely to be 65 or older (40% [112/280] vs 37%; P = 0.3), high school graduates (88% [113/129] vs 81%; P = 0.06), African American (69% [177/256] vs 73%; P = 0.1), or female (57% [158/279] vs 57%; P = 1), nor were they more likely to have longer LOS (5.7 [n = 280] vs 5.5 days; P = 0.6) or higher illness severity scores (1.3 [n = 231] vs 1.3; P = 0.7).
DISCUSSION
To our knowledge, this study is the first to evaluate the association between low HL and an important in-hospital outcome measure, hospital LOS. We found that low HL was associated with a longer hospital LOS, a result which remained significant when controlling for severity of illness and sociodemographic variables and when testing the model for sensitivity to the highest values of LOS and illness severity. Additionally, the association of HL with LOS appeared concentrated among participants with shorter LOS. Relative to other predictors, the contribution of HL to the overall LOS model was small, as evidenced by the change in adjusted R2 values with HL excluded.
Among the covariates, only gender modified the association between HL and LOS; the findings suggested that men were more susceptible to the effect of low HL on increased LOS. Illness severity and other sociodemographics, including age ≥65, did not appear to modify the association. We also found that being African American and having Medicaid or no insurance were associated with a significantly shorter LOS in multivariate analysis.
Previous work suggested that the adverse health effects of low HL may be mediated through several pathways, including health knowledge, self-efficacy, health skills, and illness stigma.25-27 The finding of a small but significant relationship between HL and LOS was not surprising given these known associations; nevertheless, there may be an additional patient-dependent effect of low HL on LOS not discovered here. For instance, patients with poor health knowledge and self-efficacy might stay in the hospital longer if they or their providers do not feel comfortable with their self-care ability.
This finding may be useful in developing hospital-based interventions. HL-specific interventions, several of which have been tested in the inpatient setting,14,28,29 have shown promise toward improving health knowledge,30 disease severity,31 and health resource utilization.32
Those with low HL may lack the self-efficacy to participate in discharge planning; in fact, previous work has related low HL to posthospital readmissions.8,9 Conversely, patients with low HL might struggle to engage in the inpatient milieu, advocating for shorter LOS if they feel alienated by the inpatient experience.
These possibilities show that LOS is a complex measure shown to depend on patient-level characteristics and on provider-based, geographical, and sociocultural factors.16,33 With these forces at play, additional effects of lower levels of HL may be lost without phenotyping patients by both level of HL and related characteristics, such as self-efficacy, health skills, and stigma. By gathering these additional data, future work should explore whether subpopulations of patients with low HL may be at risk for too-short vs too-long hospital admissions.
For instance, in this study, both race and Medicaid insurance were associated with shorter LOS. Being African American was associated with shorter LOS in our study but has been found to be associated with longer LOS in another study specifically focused on diabetes.34 Prior findings found uninsured patients have shorter LOS.35 Therefore, these findings in our study are difficult to explain without further work to understand whether there are health disparities in the way patients are cared for during hospitalization that may shorten or lengthen their LOS because of factors outside of their clinical need.
The finding that gender modified the effect of low HL on LOS was unexpected. There were similar proportions of men and women with low HL. There is evidence to support that women make the majority of health decisions for themselves and their familes36; therefore, there may be unmeasured aspects of HL that provide an advantage for female vs male inpatients. Furthermore, omitted confounders, such as social support, may not fully capture potential gender-related differences. Future work is needed to understand the role of gender in relationship to HL and LOS.
Limitations of this study include its observational, single-centered design with information derived from administrative data; positive and negative confounding cannot be ruled out. For instance, we did not control for complex aspects affecting LOS, such as discharge disposition and goals of care (eg, aggressive care after discharge vs hospice). To address this limitation, multivariate analyses were performed, which were adjusted for illness severity scores and took into account both comorbidity and severity of the current illness. Additionally, although it is important to study such populations, our largely urban, minority sample is not representative of the U.S. population, and within our large sample, there were participants with missing data who had lower HL on average, although this group represented only 5% of the sample. Finally, different HL tools have noncomplete concordance, which has been seen when comparing the BHLS with more objective tools.20,37 Furthermore, certain in-hospital clinical scenarios (eg, recent stroke or prolonged intensive care unit stay) may present unique challenges in establishing a baseline HL level. However, the BHLS was used in this study because of its greater feasibility.
In conclusion, this study is the first to evaluate the relationship between low HL and LOS. The findings suggest that HL may play a role in shaping outcomes in the inpatient setting and that targeting interventions toward screened patients may be a pathway toward mitigating adverse effects. Our findings need to be replicated in larger, more representative samples, and further work understanding subpopulations within the low HL population is needed. Future work should measure this association in diverse inpatient settings (eg, psychiatric, surgical, and specialty), in addition to assessing associations between HL and other important in-hospital outcome measures, including mortality and discharge disposition.
Acknowledgments
The authors thank the Hospitalist Project team for their assistance with data collection. The authors especially thank Chuanhong Liao and Ashley Snyder for assistance with statistical analyses; Andrea Flores, Ainoa Coltri, and Tom Best for their assistance with data management. The authors would also like to thank Nicole Twu for her help with preparing and editing the manuscript.
Disclosures
Dr. Jaffee was supported by a Calvin Fentress Research Fellowship and NIH R25MH094612. Dr. Press was supported by a career development award (NHLBI K23HL118151). This work was also supported by a seed grant from the Center for Health Administration Studies. All other authors declare no conflicts of interest.
1. U.S. Department of Health and Human Services. Healthy People 2010: Understanding and Improving Health. Washington, DC: U.S. Government Printing Office; 2000.
2. “What Did the Doctor Say”? Improving Health Literacy to Protect Patient Safety. The Joint Commission; 2007.
3. Kutner M, Greenberg E, Jin Y, Paulsen C. The Health Literacy of America’s Adults: Results from the 2003 National Assessment of Adult Literacy. National Center for Education Statistics; 2006.
4. Davis TC, Wolf MS, Bass PF, et al. Literacy and misunderstanding prescription drug labels. Ann Intern Med. 2006;145(12):887-894. PubMed
5. Kripalani S, Henderson LE, Chiu EY, Robertson R, Kolm P, Jacobson TA. Predictors of medication self-management skill in a low-literacy population. J Gen Intern Med. 2006;21(8):852-856. PubMed
6. Berkman ND, Sheridan SL, Donahue KE, Halpern DJ, Crotty K. Low health literacy and health outcomes: an updated systematic review. Ann Intern Med. 2011;155(2):97-107. PubMed
7. Baker DW, Parker RM, Williams MV, Clark WS. Health literacy and the risk of hospital admission. J Gen Intern Med. 1998;13(12):791-798. PubMed
8. Mitchell SE, Sadikova E, Jack BW, Paasche-Orlow MK. Health literacy and 30-day postdischarge hospital utilization. J Health Commun. 2012;17(Suppl 3):325-338. PubMed
9. Jaffee EG, Arora VM, Matthiesen MI, Hariprasad SM, Meltzer DO, Press VG. Postdischarge Falls and Readmissions: Associations with Insufficient Vision and Low Health Literacy among Hospitalized Seniors. J Health Commun. 2016;21(sup2):135-140. PubMed
10. Hope CJ, Wu J, Tu W, Young J, Murray MD. Association of medication adherence, knowledge, and skills with emergency department visits by adults 50 years or older with congestive heart failure. Am J Health Syst Pharm. 2004;61(19):2043-2049. PubMed
11. Bennett IM, Chen J, Soroui JS, White S. The contribution of health literacy to disparities in self-rated health status and preventive health behaviors in older adults. Ann Fam Med. 2009;7(3):204-211. PubMed
12. Baker DW, Wolf MS, Feinglass J, Thompson JA. Health literacy, cognitive abilities, and mortality among elderly persons. J Gen Intern Med. 2008;23(6):723-726. PubMed
13. Cho YI, Lee SY, Arozullah AM, Crittenden KS. Effects of health literacy on health status and health service utilization amongst the elderly. Soc Sci Med. 2008;66(8):1809-1816. PubMed
14. Paasche-Orlow MK, Riekert KA, Bilderback A, et al. Tailored education may reduce health literacy disparities in asthma self-management. Am J Respir Crit Care Med. 2005;172(8):980-986. PubMed
15. Soria-Aledo V, Carrillo-Alcaraz A, Campillo-Soto Á, et al. Associated factors and cost of inappropriate hospital admissions and stays in a second-level hospital. Am J Med Qual. 2009;24(4):321-332. PubMed
16. Lu M, Sajobi T, Lucyk K, Lorenzetti D, Quan H. Systematic review of risk adjustment models of hospital length of stay (LOS). Med Care. 2015;53(4):355-365. PubMed
17. Clarke A, Rosen R. Length of stay. How short should hospital care be? Eur J Public Health. 2001;11(2):166-170. PubMed
18. Meltzer D, Manning WG, Morrison J, et al. Effects of physician experience on costs and outcomes on an academic general medicine service: results of a trial of hospitalists. Ann Intern Med. 2002;137(11):866-874. PubMed
19. Chew LD, Bradley KA, Boyko EJ. Brief questions to identify patients with inadequate health literacy. Fam Med. 2004;36(8):588-594. PubMed
20. Press VG, Shapiro MI, Mayo AM, Meltzer DO, Arora VM. More than meets the eye: relationship between low health literacy and poor vision in hospitalized patients. J Health Commun. 2013;18 Suppl 1:197-204. PubMed
21. Willens DE, Kripalani S, Schildcrout JS, et al. Association of brief health literacy screening and blood pressure in primary care. J Health Commun. 2013;18 Suppl 1:129-142. PubMed
22. Peterson PN, Shetterly SM, Clarke CL, et al. Health literacy and outcomes among patients with heart failure. JAMA. 2011;305(16):1695-1701. PubMed
23. Chew LD, Griffin JM, Partin MR, et al. Validation of screening questions for limited health literacy in a large VA outpatient population. J Gen Intern Med. 2008;23(5):561-566. PubMed
24. Averill RF, Goldfield N, Hughes JS, et al. All Patient Refined Diagnosis Related Groups (APR-DRGs): Methodology Overview. 3M Health Information Systems; 2003.
25. Waite KR, Paasche-Orlow M, Rintamaki LS, Davis TC, Wolf MS. Literacy, social stigma, and HIV medication adherence. J Gen Intern Med. 2008;23(9):1367-1372. PubMed
26. Paasche-Orlow MK, Wolf MS. The causal pathways linking health literacy to health outcomes. Am J Health Behav. 2007;31 Suppl 1:S19-26. PubMed
27. Berkman ND, Sheridan SL, Donahue KE, et al. Health literacy interventions and outcomes: an updated systematic review. Evid Rep Technol Assess (Full Rep). 2011;(199):1-941. PubMed
28. Kripalani S, Roumie CL, Dalal AK, et al. Effect of a pharmacist intervention on clinically important medication errors after hospital discharge: a randomized trial. Ann Intern Med. 2012;157(1):1-10. PubMed
29. Press VG, Arora VM, Shah LM, et al. Teaching the use of respiratory inhalers to hospitalized patients with asthma or COPD: a randomized trial. J Gen Intern Med. 2012;27(10):1317-1325. PubMed
30. Sobel RM, Paasche-Orlow MK, Waite KR, Rittner SS, Wilson EAH, Wolf MS. Asthma 1-2-3: a low literacy multimedia tool to educate African American adults about asthma. J Community Health. 2009;34(4):321-327. PubMed
31. Rothman RL, DeWalt DA, Malone R, et al. Influence of patient literacy on the effectiveness of a primary care-based diabetes disease management program. JAMA. 2004;292(14):1711-1716. PubMed
32. DeWalt DA, Malone RM, Bryant ME, et al. A heart failure self-management
program for patients of all literacy levels: a randomized, controlled trial [ISRCTN11535170].
BMC Health Serv Res. 2006;6:30. PubMed
33. Hasan O, Orav EJ, Hicks LS. Insurance status and hospital care for myocardial
infarction, stroke, and pneumonia. J Hosp Med. 2010;5(8):452-459. PubMed
34. Cook CB, Naylor DB, Hentz JG, et al. Disparities in diabetes-related hospitalizations:
relationship of age, sex, and race/ethnicity with hospital discharges, lengths
of stay, and direct inpatient charges. Ethn Dis. 2006;16(1):126-131. PubMed
35. Hadley J, Steinberg EP, Feder J. Comparison of uninsured and privately insured
hospital patients. Condition on admission, resource use, and outcome. JAMA.
1991;265(3):374-379. PubMed
36. Women’s Health Care Chartbook: Key Findings From the Kaiser Women’s
Health Survey. May 2011. https://kaiserfamilyfoundation.files.wordpress.
com/2013/01/8164.pdf. Accessed August 1, 2017.
37. Louis AJ, Arora VM, Matthiesen MI, Meltzer DO, Press VG. Screening Hospitalized Patients for Low Health Literacy: Beyond the REALM of Possibility? PubMed
Health literacy (HL), defined as patients’ ability to understand health information and make health decisions,1 is a prevalent problem in the outpatient and inpatient settings.2,3 In both settings, low HL has adverse implications for self-care including interpreting health labels4 and taking medications correctly.5 Among outpatient cohorts, HL has been associated with worse outcomes and acute care utilization.6 Associations with low HL include increased hospitalizations,7 rehospitalizations,8,9 emergency department visits,10 and decreased preventative care use.11 Among the elderly, low HL is associated with increased mortality12 and decreased self-perception of health.13
A systematic review revealed that most high-quality HL outcome studies were conducted in the outpatient setting.6 There have been very few studies assessing effects of low HL in an acute-care setting.7,14 These studies have evaluated postdischarge outcomes, including admissions or readmissions,7-9 and medication knowledge.14 To the best of our knowledge, there are no studies evaluating associations between HL and hospital length of stay (LOS).
LOS has received much attention as providers and payers focus more on resource utilization and eliminating adverse effects of prolonged hospitalization.15 LOS is multifactorial, depending on clinical characteristics like disease severity, as well as on sociocultural, demographic, and geographic factors.16 Despite evidence that LOS reductions translate into improved resource allocation and potentially fewer complications, there remains a tension between the appropriate LOS and one that is too short for a given condition.17
Because low HL is associated with inefficient resource utilization, we hypothesized that low HL would be associated with increased LOS after controlling for illness severity. Our objectives were to evaluate the association between low HL and LOS and whether such an association was modified by illness severity and sociodemographics.
METHODS
Study Design, Setting, Participants
An in-hospital, cohort study design of patients who were admitted or transferred to the general medicine service at the University of Chicago between October 2012 and November 2015 and screened for inclusion as part of a large, ongoing study of inpatient care quality was conducted.18 Exclusion criteria included observation status, age under 18 years, non-English speaking, and repeat participants. Those who died during hospitalization or whose discharge status was missing were excluded because the primary goal was to examine the association of HL and time to discharge, which could not be evaluated among those who died. We excluded participants with LOS >30 days to limit overly influential effects of extreme outliers (1% of the population).
Variables
HL was screened using the Brief Health Literacy Screen (BHLS), a validated, 3-question verbal survey not requiring adequate visual acuity to assess HL.19,20 The 3 questions are as follows: (1) “How confident are you filling out medical forms by yourself?”, (2) “How often do you have someone help you read hospital materials?”, and (3) “How often do you have problems learning about your medical condition because of difficulty understanding written information?” Responses to the questions were scored on a 5-point Likert scale in which higher scores corresponded to higher HL.21,22 The scores for each of the 3 questions were summed to yield a range between 3 and 15. On the individual questions, prior work has demonstrated improved test performance with a cutoff of ≤3, which corresponds to a response of “some of the time” or “somewhat”; therefore, when the 3 questions were summed together, scores of ≤9 were considered indicative of low HL.21,23
For severity of illness adjustment, we used relative weights derived from the 3M (3M, Maplewood, MN) All Patient Refined Diagnosis Related Groups (APR-DRG) classification system, which uses administrative data to classify the severity. The APR-DRG system assigns each admission to a DRG based on principal diagnosis; for each DRG, patients are then subdivided into 4 severity classes based on age, comorbidity, and interactions between these variables and the admitting diagnosis.24 Using the base DRG and severity score, the system assigns relative weights that reflect differences in expected hospital resource utilization.
LOS was derived from hospital administrative data and counted from the date of admission to the hospital. Participants who were discharged on the day of admission were counted as having an LOS of 1. Insurance status (Medicare, Medicaid, no payer, private) also was obtained from administrative data. Age, sex (male or female), education (junior high or less, some high school, high school graduate, some college, college graduate, postgraduate), and race (black/African American, white, Asian or Pacific Islander [including Asian Indian, Chinese, Filipino, Japanese, Korean, Vietnamese, other Asian, Native Hawaiian, Guam/Chamorro, Samoan, other Pacific], American Indian or Alaskan Native, multiple race) were obtained from administrative data based on information provided by the patient. Participants with missing data on any of the sociodemographic variables or on the APR-DRG score were excluded from the analysis.
Statistical Analysis
χ2 and 2-tailed t tests were used to compare categorical and continuous variables, respectively. Multivariate linear regressions were employed to measure associations between the independent variables (HL, illness severity, race, gender, education, and insurance status) and the dependent variable, LOS. Independent variables were chosen for clinical significance and retained in the model regardless of statistical significance. The adjusted R2 values of models with and without the HL variable included were reported to provide information on the contribution of HL to the overall model.
Because LOS was observed to be right skewed and residuals of the untransformed regression were observed to be non-normally distributed, the decision was made to natural log transform LOS, which is consistent with previous hospital LOS studies.16 Regression coefficients and confidence intervals were then transformed into percentage estimates using the following equation: 100(eβ–1). Adjusted R2 was reported for the transformed regression.
The APR-DRG relative weight was treated as a continuous variable. Sociodemographic variables were dichotomized as follows: female vs male; high school graduates vs not; African American vs not; Medicaid/no payer vs Medicare/private payer. Age was not included in the multivariate model because it has been incorporated into the weighted APR-DRG illness severity scores.
Each of the sociodemographic variables and the APR-DRG score were examined for effect modification via the same multivariate linear equation described above, with the addition of an interaction term. A separate regression was performed with an interaction term between age (dichotomized at ≥65) and HL to investigate whether age modified the association between HL and LOS. Finally, we explored whether effects were isolated to long vs short LOS by dividing the sample based on the mean LOS (≥6 days) and performing separate multivariate comparisons.
Sensitivity analyses were performed to exclude those with LOS greater than the 90th percentile and those with APR-DRG score greater than the 90th percentile; age was added to the model as a continuous variable to evaluate whether the illness severity score fully adjusted for the effects of age on LOS. Furthermore, we compared the participants with missing data to those with complete data across both dependent and independent variables. Alpha was set at 0.05; analyses were performed using Stata Version 14 (Stata, College Station, TX).
RESULTS
A total of 5983 participants met inclusion criteria and completed the HL assessment; of these participants, 75 (1%) died during hospitalization, 9 (0.2%) had missing discharge status, and 79 (1%) had LOS >30 days. Two hundred eighty (5%) were missing data on sociodemographic variables or APR-DRG score. Of the remaining (n = 5540), the mean age was 57 years (standard deviation [SD] = 19 years), over half of participants were female (57%), and the majority were African American (73%) and had graduated from high school (81%). The sample was divided into those with private insurance (25%), those with Medicare (46%), and those with Medicaid (26%); 2% had no payer. The mean APR-DRG score was 1.3 (SD = 1.2), and the scores ranged from 0.3 to 15.8.
On the BHLS screen for HL, 20% (1104/5540) had inadequate HL. Participants with low HL had higher weighted illness severity scores (average 1.4 vs 1.3; P = 0.003). Participants with low HL were also more likely to be 65 or older (55% vs 33%; P < 0.001), non-high school graduates (35% vs 15%; P < 0.001), and African American (78% vs 72%; P < 0.001), and to have Medicare or private insurance (75% vs 71%; P = 0.02). There was no significant difference with respect to gender (54% male vs 57% female; P = 0.1)
Finally, we compared the group with missing data (n = 280) to the group with complete data (n = 5540). The participants with missing data were more likely to have low HL (31% [86/280] vs 20%; P < 0.001) and to have Medicare or private insurance (82% [177/217] vs 72%; P = 0.002); however, they were not more likely to be 65 or older (40% [112/280] vs 37%; P = 0.3), high school graduates (88% [113/129] vs 81%; P = 0.06), African American (69% [177/256] vs 73%; P = 0.1), or female (57% [158/279] vs 57%; P = 1), nor were they more likely to have longer LOS (5.7 [n = 280] vs 5.5 days; P = 0.6) or higher illness severity scores (1.3 [n = 231] vs 1.3; P = 0.7).
DISCUSSION
To our knowledge, this study is the first to evaluate the association between low HL and an important in-hospital outcome measure, hospital LOS. We found that low HL was associated with a longer hospital LOS, a result which remained significant when controlling for severity of illness and sociodemographic variables and when testing the model for sensitivity to the highest values of LOS and illness severity. Additionally, the association of HL with LOS appeared concentrated among participants with shorter LOS. Relative to other predictors, the contribution of HL to the overall LOS model was small, as evidenced by the change in adjusted R2 values with HL excluded.
Among the covariates, only gender modified the association between HL and LOS; the findings suggested that men were more susceptible to the effect of low HL on increased LOS. Illness severity and other sociodemographics, including age ≥65, did not appear to modify the association. We also found that being African American and having Medicaid or no insurance were associated with a significantly shorter LOS in multivariate analysis.
Previous work suggested that the adverse health effects of low HL may be mediated through several pathways, including health knowledge, self-efficacy, health skills, and illness stigma.25-27 The finding of a small but significant relationship between HL and LOS was not surprising given these known associations; nevertheless, there may be an additional patient-dependent effect of low HL on LOS not discovered here. For instance, patients with poor health knowledge and self-efficacy might stay in the hospital longer if they or their providers do not feel comfortable with their self-care ability.
This finding may be useful in developing hospital-based interventions. HL-specific interventions, several of which have been tested in the inpatient setting,14,28,29 have shown promise toward improving health knowledge,30 disease severity,31 and health resource utilization.32
Those with low HL may lack the self-efficacy to participate in discharge planning; in fact, previous work has related low HL to posthospital readmissions.8,9 Conversely, patients with low HL might struggle to engage in the inpatient milieu, advocating for shorter LOS if they feel alienated by the inpatient experience.
These possibilities show that LOS is a complex measure shown to depend on patient-level characteristics and on provider-based, geographical, and sociocultural factors.16,33 With these forces at play, additional effects of lower levels of HL may be lost without phenotyping patients by both level of HL and related characteristics, such as self-efficacy, health skills, and stigma. By gathering these additional data, future work should explore whether subpopulations of patients with low HL may be at risk for too-short vs too-long hospital admissions.
For instance, in this study, both race and Medicaid insurance were associated with shorter LOS. Being African American was associated with shorter LOS in our study but has been found to be associated with longer LOS in another study specifically focused on diabetes.34 Prior findings found uninsured patients have shorter LOS.35 Therefore, these findings in our study are difficult to explain without further work to understand whether there are health disparities in the way patients are cared for during hospitalization that may shorten or lengthen their LOS because of factors outside of their clinical need.
The finding that gender modified the effect of low HL on LOS was unexpected. There were similar proportions of men and women with low HL. There is evidence to support that women make the majority of health decisions for themselves and their familes36; therefore, there may be unmeasured aspects of HL that provide an advantage for female vs male inpatients. Furthermore, omitted confounders, such as social support, may not fully capture potential gender-related differences. Future work is needed to understand the role of gender in relationship to HL and LOS.
Limitations of this study include its observational, single-centered design with information derived from administrative data; positive and negative confounding cannot be ruled out. For instance, we did not control for complex aspects affecting LOS, such as discharge disposition and goals of care (eg, aggressive care after discharge vs hospice). To address this limitation, multivariate analyses were performed, which were adjusted for illness severity scores and took into account both comorbidity and severity of the current illness. Additionally, although it is important to study such populations, our largely urban, minority sample is not representative of the U.S. population, and within our large sample, there were participants with missing data who had lower HL on average, although this group represented only 5% of the sample. Finally, different HL tools have noncomplete concordance, which has been seen when comparing the BHLS with more objective tools.20,37 Furthermore, certain in-hospital clinical scenarios (eg, recent stroke or prolonged intensive care unit stay) may present unique challenges in establishing a baseline HL level. However, the BHLS was used in this study because of its greater feasibility.
In conclusion, this study is the first to evaluate the relationship between low HL and LOS. The findings suggest that HL may play a role in shaping outcomes in the inpatient setting and that targeting interventions toward screened patients may be a pathway toward mitigating adverse effects. Our findings need to be replicated in larger, more representative samples, and further work understanding subpopulations within the low HL population is needed. Future work should measure this association in diverse inpatient settings (eg, psychiatric, surgical, and specialty), in addition to assessing associations between HL and other important in-hospital outcome measures, including mortality and discharge disposition.
Acknowledgments
The authors thank the Hospitalist Project team for their assistance with data collection. The authors especially thank Chuanhong Liao and Ashley Snyder for assistance with statistical analyses; Andrea Flores, Ainoa Coltri, and Tom Best for their assistance with data management. The authors would also like to thank Nicole Twu for her help with preparing and editing the manuscript.
Disclosures
Dr. Jaffee was supported by a Calvin Fentress Research Fellowship and NIH R25MH094612. Dr. Press was supported by a career development award (NHLBI K23HL118151). This work was also supported by a seed grant from the Center for Health Administration Studies. All other authors declare no conflicts of interest.
1. U.S. Department of Health and Human Services. Healthy People 2010: Understanding and Improving Health. Washington, DC: U.S. Government Printing Office; 2000.
2. “What Did the Doctor Say”? Improving Health Literacy to Protect Patient Safety. The Joint Commission; 2007.
3. Kutner M, Greenberg E, Jin Y, Paulsen C. The Health Literacy of America’s Adults: Results from the 2003 National Assessment of Adult Literacy. National Center for Education Statistics; 2006.
4. Davis TC, Wolf MS, Bass PF, et al. Literacy and misunderstanding prescription drug labels. Ann Intern Med. 2006;145(12):887-894. PubMed
5. Kripalani S, Henderson LE, Chiu EY, Robertson R, Kolm P, Jacobson TA. Predictors of medication self-management skill in a low-literacy population. J Gen Intern Med. 2006;21(8):852-856. PubMed
6. Berkman ND, Sheridan SL, Donahue KE, Halpern DJ, Crotty K. Low health literacy and health outcomes: an updated systematic review. Ann Intern Med. 2011;155(2):97-107. PubMed
7. Baker DW, Parker RM, Williams MV, Clark WS. Health literacy and the risk of hospital admission. J Gen Intern Med. 1998;13(12):791-798. PubMed
8. Mitchell SE, Sadikova E, Jack BW, Paasche-Orlow MK. Health literacy and 30-day postdischarge hospital utilization. J Health Commun. 2012;17(Suppl 3):325-338. PubMed
9. Jaffee EG, Arora VM, Matthiesen MI, Hariprasad SM, Meltzer DO, Press VG. Postdischarge Falls and Readmissions: Associations with Insufficient Vision and Low Health Literacy among Hospitalized Seniors. J Health Commun. 2016;21(sup2):135-140. PubMed
10. Hope CJ, Wu J, Tu W, Young J, Murray MD. Association of medication adherence, knowledge, and skills with emergency department visits by adults 50 years or older with congestive heart failure. Am J Health Syst Pharm. 2004;61(19):2043-2049. PubMed
11. Bennett IM, Chen J, Soroui JS, White S. The contribution of health literacy to disparities in self-rated health status and preventive health behaviors in older adults. Ann Fam Med. 2009;7(3):204-211. PubMed
12. Baker DW, Wolf MS, Feinglass J, Thompson JA. Health literacy, cognitive abilities, and mortality among elderly persons. J Gen Intern Med. 2008;23(6):723-726. PubMed
13. Cho YI, Lee SY, Arozullah AM, Crittenden KS. Effects of health literacy on health status and health service utilization amongst the elderly. Soc Sci Med. 2008;66(8):1809-1816. PubMed
14. Paasche-Orlow MK, Riekert KA, Bilderback A, et al. Tailored education may reduce health literacy disparities in asthma self-management. Am J Respir Crit Care Med. 2005;172(8):980-986. PubMed
15. Soria-Aledo V, Carrillo-Alcaraz A, Campillo-Soto Á, et al. Associated factors and cost of inappropriate hospital admissions and stays in a second-level hospital. Am J Med Qual. 2009;24(4):321-332. PubMed
16. Lu M, Sajobi T, Lucyk K, Lorenzetti D, Quan H. Systematic review of risk adjustment models of hospital length of stay (LOS). Med Care. 2015;53(4):355-365. PubMed
17. Clarke A, Rosen R. Length of stay. How short should hospital care be? Eur J Public Health. 2001;11(2):166-170. PubMed
18. Meltzer D, Manning WG, Morrison J, et al. Effects of physician experience on costs and outcomes on an academic general medicine service: results of a trial of hospitalists. Ann Intern Med. 2002;137(11):866-874. PubMed
19. Chew LD, Bradley KA, Boyko EJ. Brief questions to identify patients with inadequate health literacy. Fam Med. 2004;36(8):588-594. PubMed
20. Press VG, Shapiro MI, Mayo AM, Meltzer DO, Arora VM. More than meets the eye: relationship between low health literacy and poor vision in hospitalized patients. J Health Commun. 2013;18 Suppl 1:197-204. PubMed
21. Willens DE, Kripalani S, Schildcrout JS, et al. Association of brief health literacy screening and blood pressure in primary care. J Health Commun. 2013;18 Suppl 1:129-142. PubMed
22. Peterson PN, Shetterly SM, Clarke CL, et al. Health literacy and outcomes among patients with heart failure. JAMA. 2011;305(16):1695-1701. PubMed
23. Chew LD, Griffin JM, Partin MR, et al. Validation of screening questions for limited health literacy in a large VA outpatient population. J Gen Intern Med. 2008;23(5):561-566. PubMed
24. Averill RF, Goldfield N, Hughes JS, et al. All Patient Refined Diagnosis Related Groups (APR-DRGs): Methodology Overview. 3M Health Information Systems; 2003.
25. Waite KR, Paasche-Orlow M, Rintamaki LS, Davis TC, Wolf MS. Literacy, social stigma, and HIV medication adherence. J Gen Intern Med. 2008;23(9):1367-1372. PubMed
26. Paasche-Orlow MK, Wolf MS. The causal pathways linking health literacy to health outcomes. Am J Health Behav. 2007;31 Suppl 1:S19-26. PubMed
27. Berkman ND, Sheridan SL, Donahue KE, et al. Health literacy interventions and outcomes: an updated systematic review. Evid Rep Technol Assess (Full Rep). 2011;(199):1-941. PubMed
28. Kripalani S, Roumie CL, Dalal AK, et al. Effect of a pharmacist intervention on clinically important medication errors after hospital discharge: a randomized trial. Ann Intern Med. 2012;157(1):1-10. PubMed
29. Press VG, Arora VM, Shah LM, et al. Teaching the use of respiratory inhalers to hospitalized patients with asthma or COPD: a randomized trial. J Gen Intern Med. 2012;27(10):1317-1325. PubMed
30. Sobel RM, Paasche-Orlow MK, Waite KR, Rittner SS, Wilson EAH, Wolf MS. Asthma 1-2-3: a low literacy multimedia tool to educate African American adults about asthma. J Community Health. 2009;34(4):321-327. PubMed
31. Rothman RL, DeWalt DA, Malone R, et al. Influence of patient literacy on the effectiveness of a primary care-based diabetes disease management program. JAMA. 2004;292(14):1711-1716. PubMed
32. DeWalt DA, Malone RM, Bryant ME, et al. A heart failure self-management
program for patients of all literacy levels: a randomized, controlled trial [ISRCTN11535170].
BMC Health Serv Res. 2006;6:30. PubMed
33. Hasan O, Orav EJ, Hicks LS. Insurance status and hospital care for myocardial
infarction, stroke, and pneumonia. J Hosp Med. 2010;5(8):452-459. PubMed
34. Cook CB, Naylor DB, Hentz JG, et al. Disparities in diabetes-related hospitalizations:
relationship of age, sex, and race/ethnicity with hospital discharges, lengths
of stay, and direct inpatient charges. Ethn Dis. 2006;16(1):126-131. PubMed
35. Hadley J, Steinberg EP, Feder J. Comparison of uninsured and privately insured
hospital patients. Condition on admission, resource use, and outcome. JAMA.
1991;265(3):374-379. PubMed
36. Women’s Health Care Chartbook: Key Findings From the Kaiser Women’s
Health Survey. May 2011. https://kaiserfamilyfoundation.files.wordpress.
com/2013/01/8164.pdf. Accessed August 1, 2017.
37. Louis AJ, Arora VM, Matthiesen MI, Meltzer DO, Press VG. Screening Hospitalized Patients for Low Health Literacy: Beyond the REALM of Possibility? PubMed
© 2017 Society of Hospital Medicine
Trends in Troponin-Only Testing for AMI in Academic Teaching Hospitals and the Impact of Choosing Wisely®
Evidence suggests that troponin-only testing is the superior strategy to diagnose acute myocardial infarction (AMI).1 Because of this, in February 2015, the Choosing Wisely® campaign issued a recommendation to use troponin I or T to diagnose AMI, and not to test for myoglobin or creatine kinase-MB (CK-MB).2 This recommendation was in line with guidelines from the American Heart Association and the American College of Cardiology, which recommended that myoglobin and CK-MB are not useful and offer no benefit for the diagnosis of acute coronary syndrome.3 Some institutions have developed interventions to promote troponin-only testing, reporting substantial cost savings and no negative consequences.4,5
Despite these successes, it is likely that institutions vary with respect to the adoption of the Choosing Wisely® troponin-only testing recommendation.6 Implementing this recommendation requires both promoting clinician behavior change and a strong institutional culture of high-value care.7 Understanding the variation across institutions of troponin-only testing could inform how to promote high-value care recommendations nationwide. We aimed to describe patterns of troponin, myoglobin, and CK-MB testing in a sample of academic teaching hospitals before and after the Choosing Wisely® recommendation.
METHODS
Troponin, myoglobin, and CK-MB ordering data were extracted from Vizient’s (formerly University HealthSystem Consortium, Chicago, IL) Clinical Database/Resource Manager (CDB/RM®) for all patients with a principal discharge diagnosis of AMI at all hospitals reporting all 36 months from the fourth quarter of 2013 through the third quarter of 2016. This period includes time both before and after the Choosing Wisely® recommendation, which was released in the first quarter of 2015. Vizient’s CDB/RM contains ordering data for 300 academic medical centers and their affiliated hospitals and includes the discharge diagnoses for patients cared for by these institutions. Only patients with a principal discharge diagnosis of AMI were included because the Choosing Wisely® recommendation is specific with regard to troponin-only testing for the diagnosis of AMI. Patients with a principal diagnosis code for subcategories of myocardial ischemia (eg, stable angina, unstable angina) were not included because of the large number of diagnosis codes for these subcategories (more than 100 in the International Classification of Diseases, Ninth Revision and the International Classification of Diseases, Tenth Revision) and because the variation in their use across institutions within the dataset limited the utility of using these codes to consistently and accurately identify patients with myocardial ischemia. Moreover, the diagnosis of AMI encompasses the subcategories of myocardial ischemia.8
Hospital rates of ordering cardiac biomarkers (troponin-only or troponin and myoglobin/CK-MB) were determined overall for the entire study period and for each quarter of the study period based on the total patients with a discharge diagnosis of AMI. For each quarter of the 12 study quarters, all the hospitals were divided into tertiles based on their rate of troponin-only testing per discharge diagnosis of AMI. Hospitals were then classified into 3 groups based on their tertile ranking over the full 12 study quarters. The first group included hospitals whose rate of troponin-only testing placed them in the top tertile for each and all quarters throughout the study period. The second group included hospitals whose troponin-only testing rate placed them in the bottom tertile for each and all quarters throughout the study period. The third group included hospitals whose troponin-only testing rate each quarter led to either an increase or decrease in their tertile ranking throughout the study period. χ2 tests were used to test for bivariate associations among hospitals based on their rate of troponin-only testing and hospital size (number of beds), their regional geographic location, the volume of AMI patients seen at the hospital, whether the primary physician during the hospitalization was a cardiologist or other provider, and the hospitals’ quality ratings. Quality rating was based on an internal Vizient rating and the “Best Hospitals for Cardiology and Heart Surgery Rankings” as published in the US News & World Report.9 The Vizient quality rating is based on a composite score that combines scores from the domains of quality (hospital quality incentive scores), safety (patient safety indicators), patient-centeredness (Hospital Consumer Assessment of Healthcare Providers and Systems Hospital Survey), and equity (distribution of care by race/ethnicity, gender, and age). Simple slopes were calculated to determine the rate of change in troponin-only testing for each study quarter, and Student t tests were used to compare the rates of change of these simple slopes across study quarters.
RESULTS
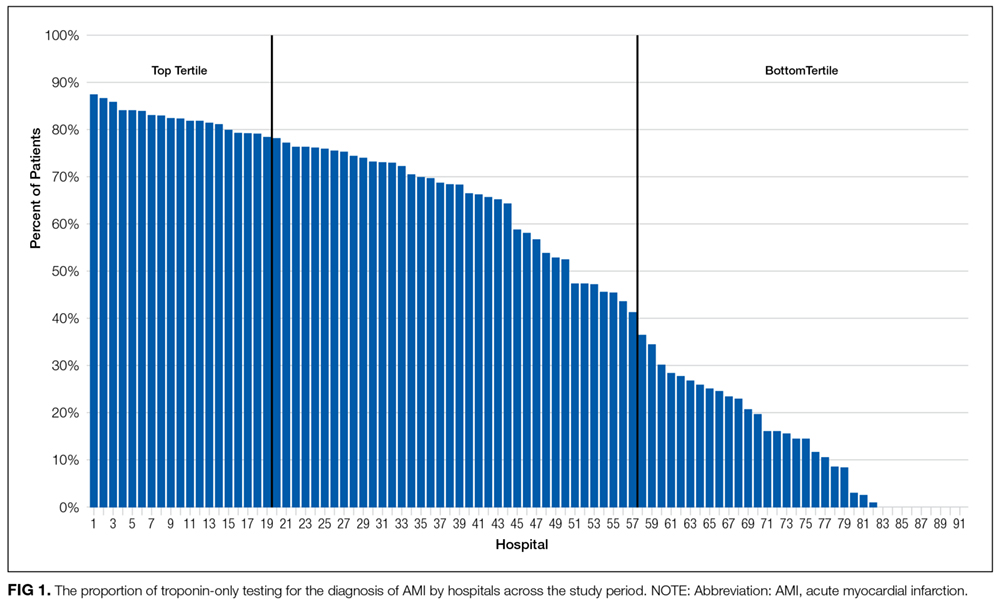
Pattern of Troponin-Only Testing by Hospital Size
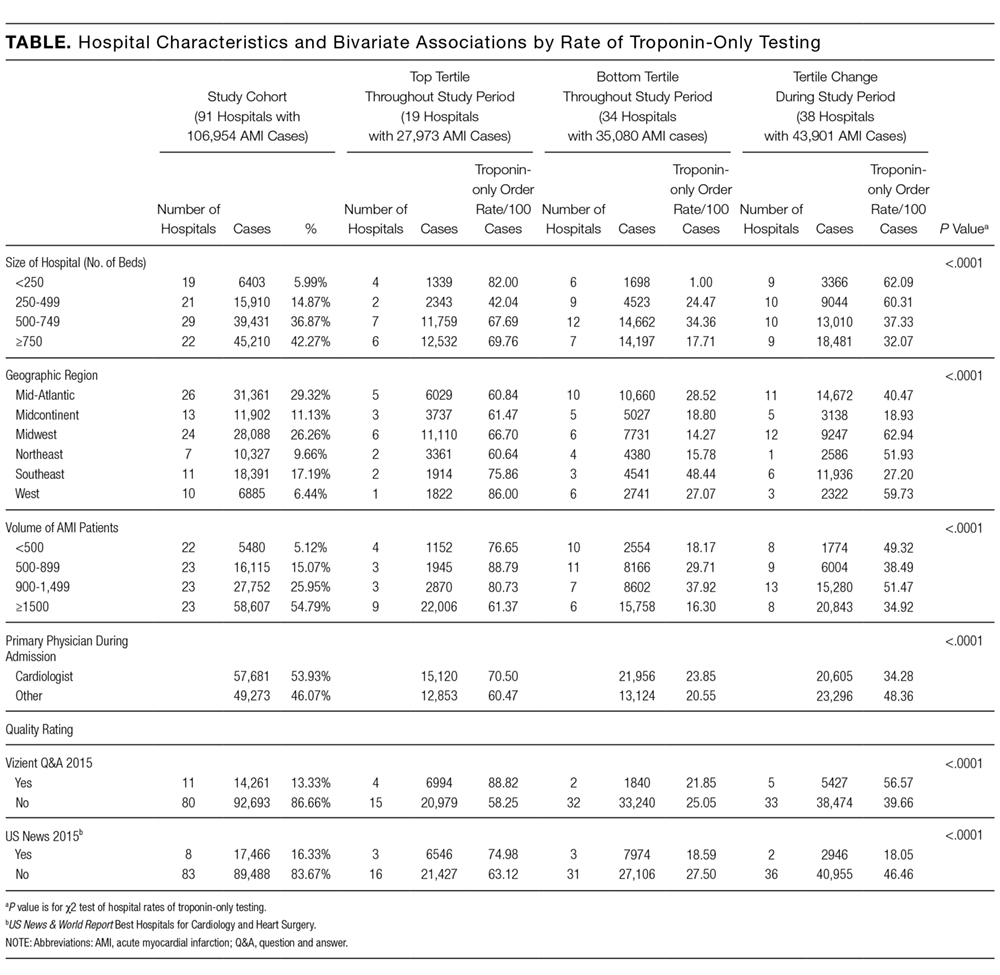
Pattern of Troponin-Only Testing by Geographic Region
The rate of troponin-only testing also varied and was statistically significantly different when comparing the 3 groups of hospitals across geographic regions of the country (P < 0.0001). Of the hospitals in the top tertile of troponin-only testing throughout the study period, the majority were in the Midwest (n = 6) and Mid-Atlantic (n = 5) regions. However, the rate of troponin-only testing for AMI in this group was highest in hospitals in the West (86/100 patients) and/or Southeast (75/100 patients) regions, although this rate was based on a small number of hospitals in these geographic areas (n = 1 in the West, n = 2 in the Southeast). Of hospitals in the bottom tertile of troponin-only testing throughout the study period, the majority were in the Mid-Atlantic region (n = 10). Hospitals that increased their troponin-only testing during the study period were predominantly in the Midwest (n = 12) and Mid-Atlantic regions (n = 11; Table), with the hospitals in the Midwest having the highest rate of troponin-only testing in this group.
Pattern of Troponin-Only Testing by Volume of AMI Patients
Of the hospitals in the top tertile of troponin-only testing during the study period, the majority cared for ≥1500 AMI patients (n = 9), but interestingly, among these hospitals, those caring for a smaller volume of AMI patients all had higher rates of troponin-only testing per 100 patients (P < 0.0001; Table). There was no other obvious pattern of troponin-only testing based on the volume of AMI patients cared for in hospitals in either the bottom tertile of troponin-only testing or hospitals that improved troponin-only testing during the study period.
Pattern of Troponin-Only Testing by Physician Type
Of the hospitals in the top tertile of troponin-only testing throughout the study period, those where a cardiologist cared for patients with AMI had higher rates of troponin-only testing (71/100 patients) than did hospitals where patients were cared for by a noncardiologist (60/100 patients). However, of the hospitals that improved their troponin-only testing during the study period, higher rates of troponin-only testing were seen in hospitals where patients were cared for by a noncardiologist (48/100 patients) compared with patients cared for by a cardiologist (34/100 patients; Table). These differences in hospital rates of troponin-only testing during the study period based on physician type were statistically significant (P < 0.0001; Table).
Pattern of Troponin-Only Testing by Quality Rating
Hospitals that were in the top tertile of troponin-only testing and were rated highly by Vizient’s quality rating or recognized as a top hospital by the US News & World Report had higher rates of troponin-only testing per 100 patients than did hospitals in the top tertile that were not ranked highly by Vizient’s quality rating or recognized as a top hospital by the US News & World Report. However, the majority of hospitals in the top tertile of troponin-only testing were not rated highly by Vizient (n = 15) or recognized as a top hospital by the US News & World Report (n = 16). The large majority of hospitals in the bottom tertile of troponin-only testing were not recognized as high-quality hospitals by Vizient (n = 32) or the US News & World Report (n = 31). Of the hospitals that improved their troponin-only testing during the study period, the majority were not recognized as high-quality hospitals by Vizient (n = 33) or the US News & World Report (n = 36), but among this group, those hospitals recognized by Vizient as high quality (n = 5) had the highest rate of troponin-only testing (57/100 patients). The differences in the rate of troponin-only testing across the different groups of hospitals and quality ratings were statistically significant (P < 0.0001; Table).
The Effect of Choosing Wisely® on Troponin-Only Testing
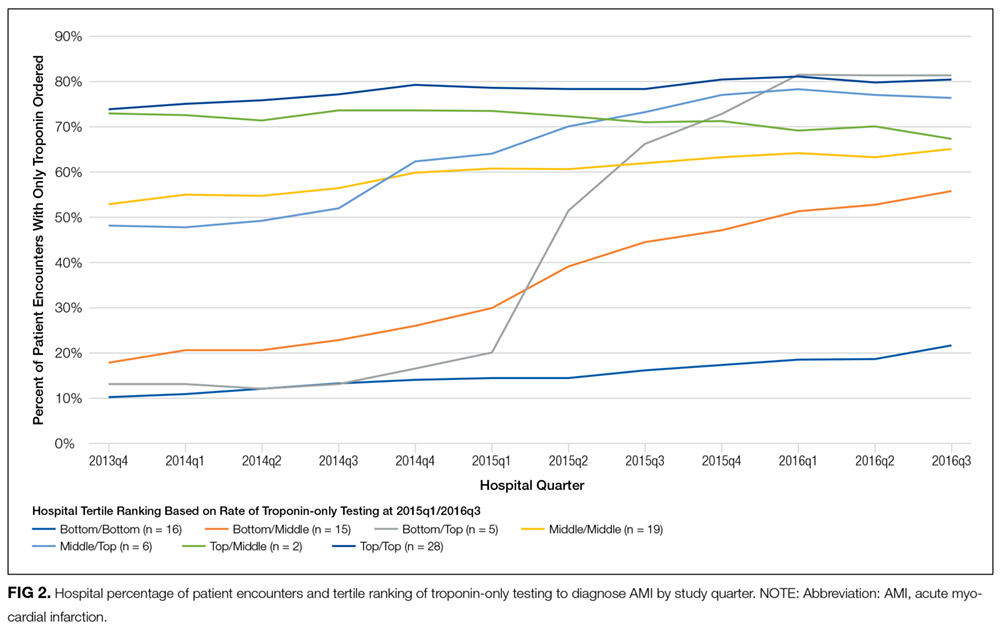
DISCUSSION
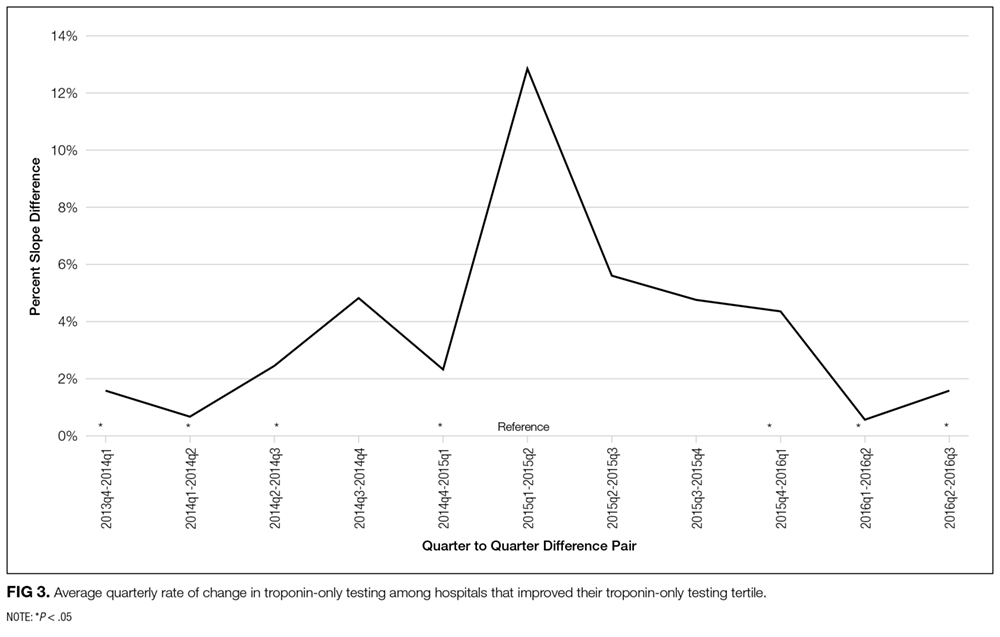
In the hospitals that demonstrated increasing adoption of troponin-only testing, there are several interesting patterns. First, among these hospitals, smaller hospitals tended to have higher overall rates of troponin-only testing per 100 patients than larger hospitals. Additionally, the hospitals with the highest rates were located in the Midwest region. These hospitals may be learning from and following the high-performing institutions observed in our data that are also located in the Midwest. Additionally, among the hospitals that significantly increased their rate of troponin-only testing, we see that the Choosing Wisely® recommendation appeared to facilitate accelerated adoption of troponin-only testing. In these institutions, it is likely that the impact of Choosing Wisely® was significant because there was attention to high-value care and already an existing movement underway to institute such high-value practices. For example, natural champions, leadership, infrastructure, and a supportive culture may all be prerequisites for Choosing Wisely® recommendations to become institutionally adopted.
Lastly, in the hospitals that have continued to order myoglobin and CK-MB, future work is needed to understand and overcome barriers to adopting high-value care practices.
There are several limitations to this study. First, because this was an observational study, we cannot prove a causal relationship between the Choosing Wisely® recommendation and the increased rates of troponin-only testing. Additionally, the Vizient CDB/RM contains reporting data for a limited number of academic medical centers only, and therefore, these results may not represent practices at nonacademic or even other academic medical centers. Our study only included patients with a principal discharge diagnosis of AMI because the Choosing Wisely® recommendation to order troponin-only is specific for diagnosing patients with AMI. However, it is possible that the Choosing Wisely® recommendation also has affected provider ordering in patients with diagnoses such as chest pain or angina, and these affects would not be captured in our study. Lastly, because instituting high-value care practices take time, our follow-up time may not have been long enough to capture improvement in troponin-only testing at institutions responding to and attempting to adhere to the Choosing Wisely® recommendation to order troponin-only testing for patients with AMI.
Disclosure
No other individuals besides the authors contributed to this work. This project was not funded or supported by any external grant or agency. Dr. Prochaska’s institute received funding from the Agency for Research Healthcare and Quality for a K12 Career Development Grant (AHRQ K12 HS023007) outside the submitted work. Dr. Hohmann and Dr Modes have nothing to disclose. Dr. Arora receives financial compensation as a member of the Board of Directors for the American Board of Internal Medicine and has received grant funding from the ABIM Foundation. She also receives royalties from McGraw Hill.
1. Pickering JW, Than MP, Cullen L, et al. Rapid rule-out of acute myocardial infarction with a single high-sensitivity cardiac troponin t measurement below the limit of detection: A collaborative meta-analysis. Ann Intern Med. 2017;166(10):715-724. PubMed
2. American Society for Clinical Pathology. Don’t test for myoglobin or CK-MB in the diagnosis of acute myocardial infarction (AMI). Instead, use troponin I or T. http://www.choosingwisely.org/clinician-lists/american-society-clinical-pathology-myoglobin-to-diagnose-acute-myocardial-infarction/. Accessed August 3, 2016.
3. Amsterdam EA, Wenger NK, Brindis RG, et al. 2014 AHA/ACC guideline for the management of patients with non–st-elevation acute coronary syndromes. Circulation. 2014;130(25):e344-e426. PubMed
4. Larochelle MR, Knight AM, Pantle H, Riedel S, Trost JC. Reducing excess cardiac biomarker testing at an academic medical center. J Gen Intern Med. 2014;29(11):1468-1474. PubMed
5. Le RD, Kosowsky JM, Landman AB, Bixho I, Melanson SEF, Tanasijevic MJ. Clinical and financial impact of removing creatine kinase-MB from the routine testing menu in the emergency setting. Am J Emerg Med. 2015;33(1):72-75. PubMed
6. Rosenberg A, Agiro A, Gottlieb M, et al. Early trends among seven recommendations from the choosing wisely campaign. JAMA Intern Med. 2015;175(12):1913. PubMed
7. Wolfson DB. Choosing Wisely recommendations using administrative claims data. JAMA Intern Med. 2016;176(4):565-565. PubMed
8. Thygesen K, Alpert JS, Jaffe AS, Simoons ML, Chaitman BR, White HD. Third universal definition of myocardial infarction. Circulation. 2012;126(16):2020-2035. PubMed
9. US News & World Report. Best hospitals for cardiology & heart surgery. http://health.usnews.com/best-hospitals/rankings/cardiology-and-heart-surgery. Accessed April 19, 2017.
10. Bradley EH, Curry LA, Ramanadhan S, Rowe L, Nembhard IM, Krumholz HM. Research in action: using positive deviance to improve quality of health care. Implement Sci IS. 2009;4:25. PubMed
Evidence suggests that troponin-only testing is the superior strategy to diagnose acute myocardial infarction (AMI).1 Because of this, in February 2015, the Choosing Wisely® campaign issued a recommendation to use troponin I or T to diagnose AMI, and not to test for myoglobin or creatine kinase-MB (CK-MB).2 This recommendation was in line with guidelines from the American Heart Association and the American College of Cardiology, which recommended that myoglobin and CK-MB are not useful and offer no benefit for the diagnosis of acute coronary syndrome.3 Some institutions have developed interventions to promote troponin-only testing, reporting substantial cost savings and no negative consequences.4,5
Despite these successes, it is likely that institutions vary with respect to the adoption of the Choosing Wisely® troponin-only testing recommendation.6 Implementing this recommendation requires both promoting clinician behavior change and a strong institutional culture of high-value care.7 Understanding the variation across institutions of troponin-only testing could inform how to promote high-value care recommendations nationwide. We aimed to describe patterns of troponin, myoglobin, and CK-MB testing in a sample of academic teaching hospitals before and after the Choosing Wisely® recommendation.
METHODS
Troponin, myoglobin, and CK-MB ordering data were extracted from Vizient’s (formerly University HealthSystem Consortium, Chicago, IL) Clinical Database/Resource Manager (CDB/RM®) for all patients with a principal discharge diagnosis of AMI at all hospitals reporting all 36 months from the fourth quarter of 2013 through the third quarter of 2016. This period includes time both before and after the Choosing Wisely® recommendation, which was released in the first quarter of 2015. Vizient’s CDB/RM contains ordering data for 300 academic medical centers and their affiliated hospitals and includes the discharge diagnoses for patients cared for by these institutions. Only patients with a principal discharge diagnosis of AMI were included because the Choosing Wisely® recommendation is specific with regard to troponin-only testing for the diagnosis of AMI. Patients with a principal diagnosis code for subcategories of myocardial ischemia (eg, stable angina, unstable angina) were not included because of the large number of diagnosis codes for these subcategories (more than 100 in the International Classification of Diseases, Ninth Revision and the International Classification of Diseases, Tenth Revision) and because the variation in their use across institutions within the dataset limited the utility of using these codes to consistently and accurately identify patients with myocardial ischemia. Moreover, the diagnosis of AMI encompasses the subcategories of myocardial ischemia.8
Hospital rates of ordering cardiac biomarkers (troponin-only or troponin and myoglobin/CK-MB) were determined overall for the entire study period and for each quarter of the study period based on the total patients with a discharge diagnosis of AMI. For each quarter of the 12 study quarters, all the hospitals were divided into tertiles based on their rate of troponin-only testing per discharge diagnosis of AMI. Hospitals were then classified into 3 groups based on their tertile ranking over the full 12 study quarters. The first group included hospitals whose rate of troponin-only testing placed them in the top tertile for each and all quarters throughout the study period. The second group included hospitals whose troponin-only testing rate placed them in the bottom tertile for each and all quarters throughout the study period. The third group included hospitals whose troponin-only testing rate each quarter led to either an increase or decrease in their tertile ranking throughout the study period. χ2 tests were used to test for bivariate associations among hospitals based on their rate of troponin-only testing and hospital size (number of beds), their regional geographic location, the volume of AMI patients seen at the hospital, whether the primary physician during the hospitalization was a cardiologist or other provider, and the hospitals’ quality ratings. Quality rating was based on an internal Vizient rating and the “Best Hospitals for Cardiology and Heart Surgery Rankings” as published in the US News & World Report.9 The Vizient quality rating is based on a composite score that combines scores from the domains of quality (hospital quality incentive scores), safety (patient safety indicators), patient-centeredness (Hospital Consumer Assessment of Healthcare Providers and Systems Hospital Survey), and equity (distribution of care by race/ethnicity, gender, and age). Simple slopes were calculated to determine the rate of change in troponin-only testing for each study quarter, and Student t tests were used to compare the rates of change of these simple slopes across study quarters.
RESULTS
Pattern of Troponin-Only Testing by Hospital Size
Pattern of Troponin-Only Testing by Geographic Region
The rate of troponin-only testing also varied and was statistically significantly different when comparing the 3 groups of hospitals across geographic regions of the country (P < 0.0001). Of the hospitals in the top tertile of troponin-only testing throughout the study period, the majority were in the Midwest (n = 6) and Mid-Atlantic (n = 5) regions. However, the rate of troponin-only testing for AMI in this group was highest in hospitals in the West (86/100 patients) and/or Southeast (75/100 patients) regions, although this rate was based on a small number of hospitals in these geographic areas (n = 1 in the West, n = 2 in the Southeast). Of hospitals in the bottom tertile of troponin-only testing throughout the study period, the majority were in the Mid-Atlantic region (n = 10). Hospitals that increased their troponin-only testing during the study period were predominantly in the Midwest (n = 12) and Mid-Atlantic regions (n = 11; Table), with the hospitals in the Midwest having the highest rate of troponin-only testing in this group.
Pattern of Troponin-Only Testing by Volume of AMI Patients
Of the hospitals in the top tertile of troponin-only testing during the study period, the majority cared for ≥1500 AMI patients (n = 9), but interestingly, among these hospitals, those caring for a smaller volume of AMI patients all had higher rates of troponin-only testing per 100 patients (P < 0.0001; Table). There was no other obvious pattern of troponin-only testing based on the volume of AMI patients cared for in hospitals in either the bottom tertile of troponin-only testing or hospitals that improved troponin-only testing during the study period.
Pattern of Troponin-Only Testing by Physician Type
Of the hospitals in the top tertile of troponin-only testing throughout the study period, those where a cardiologist cared for patients with AMI had higher rates of troponin-only testing (71/100 patients) than did hospitals where patients were cared for by a noncardiologist (60/100 patients). However, of the hospitals that improved their troponin-only testing during the study period, higher rates of troponin-only testing were seen in hospitals where patients were cared for by a noncardiologist (48/100 patients) compared with patients cared for by a cardiologist (34/100 patients; Table). These differences in hospital rates of troponin-only testing during the study period based on physician type were statistically significant (P < 0.0001; Table).
Pattern of Troponin-Only Testing by Quality Rating
Hospitals that were in the top tertile of troponin-only testing and were rated highly by Vizient’s quality rating or recognized as a top hospital by the US News & World Report had higher rates of troponin-only testing per 100 patients than did hospitals in the top tertile that were not ranked highly by Vizient’s quality rating or recognized as a top hospital by the US News & World Report. However, the majority of hospitals in the top tertile of troponin-only testing were not rated highly by Vizient (n = 15) or recognized as a top hospital by the US News & World Report (n = 16). The large majority of hospitals in the bottom tertile of troponin-only testing were not recognized as high-quality hospitals by Vizient (n = 32) or the US News & World Report (n = 31). Of the hospitals that improved their troponin-only testing during the study period, the majority were not recognized as high-quality hospitals by Vizient (n = 33) or the US News & World Report (n = 36), but among this group, those hospitals recognized by Vizient as high quality (n = 5) had the highest rate of troponin-only testing (57/100 patients). The differences in the rate of troponin-only testing across the different groups of hospitals and quality ratings were statistically significant (P < 0.0001; Table).
The Effect of Choosing Wisely® on Troponin-Only Testing
DISCUSSION
In the hospitals that demonstrated increasing adoption of troponin-only testing, there are several interesting patterns. First, among these hospitals, smaller hospitals tended to have higher overall rates of troponin-only testing per 100 patients than larger hospitals. Additionally, the hospitals with the highest rates were located in the Midwest region. These hospitals may be learning from and following the high-performing institutions observed in our data that are also located in the Midwest. Additionally, among the hospitals that significantly increased their rate of troponin-only testing, we see that the Choosing Wisely® recommendation appeared to facilitate accelerated adoption of troponin-only testing. In these institutions, it is likely that the impact of Choosing Wisely® was significant because there was attention to high-value care and already an existing movement underway to institute such high-value practices. For example, natural champions, leadership, infrastructure, and a supportive culture may all be prerequisites for Choosing Wisely® recommendations to become institutionally adopted.
Lastly, in the hospitals that have continued to order myoglobin and CK-MB, future work is needed to understand and overcome barriers to adopting high-value care practices.
There are several limitations to this study. First, because this was an observational study, we cannot prove a causal relationship between the Choosing Wisely® recommendation and the increased rates of troponin-only testing. Additionally, the Vizient CDB/RM contains reporting data for a limited number of academic medical centers only, and therefore, these results may not represent practices at nonacademic or even other academic medical centers. Our study only included patients with a principal discharge diagnosis of AMI because the Choosing Wisely® recommendation to order troponin-only is specific for diagnosing patients with AMI. However, it is possible that the Choosing Wisely® recommendation also has affected provider ordering in patients with diagnoses such as chest pain or angina, and these affects would not be captured in our study. Lastly, because instituting high-value care practices take time, our follow-up time may not have been long enough to capture improvement in troponin-only testing at institutions responding to and attempting to adhere to the Choosing Wisely® recommendation to order troponin-only testing for patients with AMI.
Disclosure
No other individuals besides the authors contributed to this work. This project was not funded or supported by any external grant or agency. Dr. Prochaska’s institute received funding from the Agency for Research Healthcare and Quality for a K12 Career Development Grant (AHRQ K12 HS023007) outside the submitted work. Dr. Hohmann and Dr Modes have nothing to disclose. Dr. Arora receives financial compensation as a member of the Board of Directors for the American Board of Internal Medicine and has received grant funding from the ABIM Foundation. She also receives royalties from McGraw Hill.
1. Pickering JW, Than MP, Cullen L, et al. Rapid rule-out of acute myocardial infarction with a single high-sensitivity cardiac troponin t measurement below the limit of detection: A collaborative meta-analysis. Ann Intern Med. 2017;166(10):715-724. PubMed
2. American Society for Clinical Pathology. Don’t test for myoglobin or CK-MB in the diagnosis of acute myocardial infarction (AMI). Instead, use troponin I or T. http://www.choosingwisely.org/clinician-lists/american-society-clinical-pathology-myoglobin-to-diagnose-acute-myocardial-infarction/. Accessed August 3, 2016.
3. Amsterdam EA, Wenger NK, Brindis RG, et al. 2014 AHA/ACC guideline for the management of patients with non–st-elevation acute coronary syndromes. Circulation. 2014;130(25):e344-e426. PubMed
4. Larochelle MR, Knight AM, Pantle H, Riedel S, Trost JC. Reducing excess cardiac biomarker testing at an academic medical center. J Gen Intern Med. 2014;29(11):1468-1474. PubMed
5. Le RD, Kosowsky JM, Landman AB, Bixho I, Melanson SEF, Tanasijevic MJ. Clinical and financial impact of removing creatine kinase-MB from the routine testing menu in the emergency setting. Am J Emerg Med. 2015;33(1):72-75. PubMed
6. Rosenberg A, Agiro A, Gottlieb M, et al. Early trends among seven recommendations from the choosing wisely campaign. JAMA Intern Med. 2015;175(12):1913. PubMed
7. Wolfson DB. Choosing Wisely recommendations using administrative claims data. JAMA Intern Med. 2016;176(4):565-565. PubMed
8. Thygesen K, Alpert JS, Jaffe AS, Simoons ML, Chaitman BR, White HD. Third universal definition of myocardial infarction. Circulation. 2012;126(16):2020-2035. PubMed
9. US News & World Report. Best hospitals for cardiology & heart surgery. http://health.usnews.com/best-hospitals/rankings/cardiology-and-heart-surgery. Accessed April 19, 2017.
10. Bradley EH, Curry LA, Ramanadhan S, Rowe L, Nembhard IM, Krumholz HM. Research in action: using positive deviance to improve quality of health care. Implement Sci IS. 2009;4:25. PubMed
© 2017 Society of Hospital Medicine
Use of simulation to assess incoming interns’ recognition of opportunities to choose wisely
In recent years, the American Board of Internal Medicine (ABIM) Foundation’s Choosing Wisely™ campaign has advanced the dialogue on cost-consciousness by identifying potential examples of overuse in clinical practice.1 Eliminating low-value care can decrease costs, improve quality, and potentially decrease patient harm.2 In fact, there is growing consensus among health leaders and educators on the need for a physician workforce that is conscious of high-value care.3,4 The Institute of Medicine has issued a call-to-action for graduate medical education (GME) to emphasize value-based care,5 and the Accreditation Council for Graduate Medical Education has outlined expectations that residents receive formal and experiential training on overuse as a part of its Clinical Learning Environment Review.6
However, recent reports highlight a lack of emphasis on value-based care in medical education.7 For example, few residency program directors believe that residents are prepared to incorporate value and cost into their medical decisions.8 In 2012, only 15% of medicine residencies reported having formal curricula addressing value, although many were developing one.8 Of the curricula reported, most were didactic in nature and did not include an assessment component.8
Experiential learning through simulation is one promising method to teach clinicians-in-training to practice value-based care. Simulation-based training promotes situational awareness (defined as being cognizant of one’s working environment), a concept that is crucial for recognizing both low-value and unsafe care.9,10 Simulated training exercises are often included in GME orientation “boot-camps,” which have typically addressed safety.11 The incorporation of value into existing GME boot-camp exercises could provide a promising model for the addition of value-based training to GME.
At the University of Chicago, we had successfully implemented the “Room of Horrors,” a simulation for entering interns to promote the detection of patient safety hazards.11 Here, we describe a modification to this simulation to embed low-value hazards in addition to traditional patient safety hazards. The aim of this study is to assess the entering interns’ recognition of low-value care and their ability to recognize unsafe care in a simulation designed to promote situational awareness.
METHODS
Setting and Participants
The simulation was conducted during GME orientation at a large, urban academic medical institution. One hundred and twenty-five entering postgraduate year one (PGY1) interns participated in the simulation, which was a required component of a multiday orientation “boot-camp” experience. All eligible interns participated in the simulation, representing 13 specialty programs and 60 medical schools. Interns entering into pathology were excluded because of infrequent patient contact. Participating interns were divided into 7 specialty groups for analysis in order to preserve the anonymity of interns in smaller residency programs (surgical subspecialties combined with general surgery, medicine-pediatrics grouped with internal medicine). The University of Chicago Institutional Review Board deemed this study exempt from review.
Program Description
A simulation of an inpatient hospital room, known as the “Room of Horrors,” was constructed in collaboration with the University of Chicago Simulation Center and adapted from a previous version of the exercise.11 The simulation consisted of a mock door chart highlighting the patient had been admitted for diarrhea (Clostridium difficile positive) following a recent hospitalization for pneumonia. A clinical scenario was constructed by using a patient mannequin and an accompanying door chart that listed information on the patient’s hospital course, allergies, and medications. In addition to the 8 patient safety hazards utilized in the prior version, our team selected 4 low-value hazards to be included in the simulation.

The 8 safety hazards have been detailed in a prior study and were previously selected from Medicare’s Hospital-Acquired Conditions (HAC) Reduction Program and Agency for Healthcare Research and Quality (AHRQ) Patient Safety Indicators.11-13 Each of the hazards was represented either physically in the simulation room and/or was indicated on the patient’s chart. For example, the latex allergy hazard was represented by latex gloves at the bedside despite an allergy indicated on the patient’s chart and wristband. A complete list of the 8 safety hazards and their representations in the simulation is shown in Table 1.
The Choosing Wisely™ lists were reviewed to identify low-value hazards for addition to the simulation.14 Our team selected 3 low-value hazards from the Society of Hospital Medicine (SHM) list,15 including (1) arbitrary blood transfusion despite the patient’s stable hemoglobin level of 8.0 g/dL and absence of cardiac symptoms,16 (2) addition of a proton pump inhibitor (PPI) for stress ulcer prophylaxis in a patient without high risk for gastrointestinal (GI) complications who was not on a PPI prior to admission, and (3) placement of a urinary catheter without medical indication. We had originally selected continuous telemetry monitoring as a fourth hazard from the SHM list, but were unable to operationalize, as it was difficult to simulate continuous telemetry on a mannequin. Because many inpatients are older than 65 years, we reviewed the American Geriatrics Society list17 and selected our fourth low-value hazard: (4) unnecessary use of physical restraints to manage behavioral symptoms in a hospitalized patient with delirium. Several of these hazards were also quality and safety priorities at our institution, including the overuse of urinary catheters, physical restraints, and blood transfusions. All 4 low-value hazards were referenced in the patient’s door chart, and 3 were also physically represented in the room via presence of a hanging unit of blood, Foley catheter, and upper-arm restraints (Table 1). See Appendix for a photograph of the simulation setup.
Each intern was allowed 10 minutes inside the simulation room. During this time, they were instructed to read the 1-page door chart, inspect the simulation room, and write down as many potential low-value and safety hazards as they could identify on a free-response form (see Appendix). Upon exiting the room, they were allotted 5 additional minutes to complete their free-response answers and provide written feedback on the simulation. The simulation was conducted in 3 simulated hospital rooms over the course of 2 days, and the correct answers were provided via e-mail after all interns had completed the exercise.
To assess prior training and safety knowledge, interns were asked to complete a 3-question preassessment on a ScanTronTM (Tustin, CA) form. The preassessment asked interns whether they had received training on hospital safety during medical school (yes, no, or unsure), if they were satisfied with the hospital safety training they received during medical school (strongly disagree to strongly agree on a Likert scale), and if they were confident in their ability to identify potential hazards in a hospital setting (strongly disagree to strongly agree). Interns were also given the opportunity to provide feedback on the simulation experience on the ScanTronTM (Tustin, CA) form.
One month after participating in the simulation, interns were asked to complete an online follow-up survey on MedHubTM (Ann Arbor, MI), which included 2 Likert-scale questions (strongly disagree to strongly agree) assessing the simulation’s impact on their experience mitigating hospital hazards during the first month of internship.
Data Analysis
Interns’ free-response answers were manually coded, and descriptive statistics were used to summarize the mean percent correct for each hazard. A paired t test was used to compare intern identification of low-value vs safety hazards. T tests were used to compare hazard identification for interns entering highly procedural-intensive specialties (ie, surgical specialties, emergency medicine, anesthesia, obstetrics/gynecology) and those entering less procedural-intensive specialties (ie, internal medicine, pediatrics, psychiatry), as well as among those graduating from “Top 30” medical schools (based on US News & World Report Medical School Rankings18) and our own institution. One-way analysis of variance (ANOVA) calculations were used to test for differences in hazard identification based on interns’ prior hospital safety training, with interns who rated their satisfaction with prior training or confidence in identifying hazards as a “4” or a “5” considered “satisfied” and “confident,” respectively. Responses to the MedHubTM (Ann Arbor, MI) survey were dichotomized with “strongly agree” and “agree” considered positive responses. Statistical significance was defined at P < .05. All data analysis was conducted using Stata 14TM software (College Station, TX).
RESULTS
Intern Characteristics

One hundred twenty-five entering PGY1 interns participated in the simulation, representing 60 medical schools and 7 different specialty groups (Table 2). Thirty-five percent (44/125) were graduates from “Top 30” medical schools, and 8.8% (11/125) graduated from our own institution. Seventy-four percent (89/121) had received prior hospital safety training during medical school, and 62.9% (56/89) were satisfied with their training. A majority of interns (64.2%, 79/123) felt confident in their ability to identify potential hazards in a hospital setting, although confidence was much higher among those with prior safety training (71.9%, 64/89) compared to those without prior training or who were unsure about their training (40.6%, 13/32; P = .09, t test).

Identification of Hazards
The mean percentage of hazards correctly identified by interns during the simulation was 50.4% (standard deviation [SD] 11.8%), with a normal distribution (Figure 1). Interns identified a significantly lower percentage of low-value hazards than safety hazards in the simulation (mean 19.2% [SD 18.6%] vs 66.0% [SD 16.0%], respectively; P < .001, paired t test). Interns also identified significantly more room-based errors than chart-based errors (mean 58.6% [SD 13.4%] vs 9.6% [SD 19.8%], respectively; P < .001, paired t test). The 3 most commonly identified hazards were unavailability of hand hygiene (120/125, 96.0%), presence of latex gloves despite the patient’s allergy (111/125, 88.8%), and fall risk due to the lowered bed rail (107/125, 85.6%). More than half of interns identified the incorrect name on the patient’s wristband and IV bag (91/125, 72.8%), a lack of isolation precautions (90/125, 72.0%), administration of penicillin despite the patient’s allergy (67/125, 53.6%), and unnecessary restraints (64/125, 51.2%). Less than half of interns identified the wrong medication being administered (50/125, 40.0%), unnecessary Foley catheter (25/125, 20.0%), and absence of venous thromboembolism (VTE) prophylaxis (24/125, 19.2%). Few interns identified the unnecessary blood transfusion (7/125, 5.6%), and no one identified the unnecessary stress ulcer prophylaxis (0/125, 0.0%; Figure 2).
. N = 125.")
Predictors of Hazard Identification
Interns who self-reported as confident in their ability to identify hazards were not any more likely to correctly identify hazards than those who were not confident (50.9% overall hazard identification vs 49.6%, respectively; P = .56, t test). Interns entering into less procedural-intensive specialties identified significantly more safety hazards than those entering highly procedural-intensive specialties (mean 69.1% [SD 16.9%] vs 61.8% [SD 13.7%], respectively; P = .01, t test). However, there was no statistically significant difference in their identification of low-value hazards (mean 19.8% [SD 18.3%] for less procedural-intensive vs 18.4% [SD 19.1%] for highly procedural-intensive; P = .68, t test). There was no statistically significant difference in hazard identification among graduates of “Top 30” medical schools or graduates of our own institution. Prior hospital safety training had no significant impact on interns’ ability to identify safety or low-value hazards. Overall, interns who were satisfied with their prior training identified a mean of 51.8% of hazards present (SD 11.8%), interns who were not satisfied with their prior training identified 51.5% (SD 12.7%), interns with no prior training identified 48.7% (SD 11.7%), and interns who were unsure about their prior training identified 47.4% (SD 11.5%) [F(3,117) = .79; P = .51, ANOVA]. There was also no significant association between prior training and the identification of any one of the 12 specific hazards (chi-square tests, all P values > .1).
Intern Feedback and Follow-Up Survey
Debriefing revealed that most interns passively assumed the patient’s chart was correct and did not think they should question the patient’s current care regimen. For example, many interns commented that they did not think to consider the patient’s blood transfusion as unnecessary, even though they were aware of the recommended hemoglobin cutoffs for stable patients.
Interns also provided formal feedback on the simulation through open-ended comments on their ScanTronTM (Tustin, CA) form. For example, one intern wrote that they would “inherently approach every patient room ‘looking’ for safety issues, probably directly because of this exercise.” Another commented that the simulation was “more difficult than I expected, but very necessary to facilitate discussion and learning.” One intern wrote that “I wish I had done this earlier in my career.”
Ninety-six percent of participating interns (120/125) completed an online follow-up survey 1 month after beginning internship. In the survey, 68.9% (82/119) of interns indicated they were more aware of how to identify potential hazards facing hospitalized patients as a result of the simulation. Furthermore, 52.1% (62/119) of interns had taken action during internship to reduce a potential hazard that was present in the simulation.
DISCUSSION
While many GME orientations include simulation and safety training, this study is the first of its kind to incorporate low-value care from Choosing Wisely™ recommendations into simulated training. It is concerning that interns identified significantly fewer low-value hazards than safety hazards in the simulation. In some cases, no interns identified the low-value hazard. For example, while almost all interns identified the hand hygiene hazard, not one could identify the unnecessary stress ulcer prophylaxis. Furthermore, interns who self-reported as confident in their ability to identify hazards did not perform any better in the simulation. Interns entering less procedural-intensive specialties identified more safety hazards overall.
The simulation was well received by interns. Many commented that the experience was engaging, challenging, and effective in cultivating situational awareness towards low-value care. Our follow-up survey demonstrated the majority of interns reported taking action during their first month of internship to reduce a hazard included in the simulation. Most interns also reported a greater awareness of how to identify hospital hazards as a result of the simulation. These findings suggest that a brief simulation-based experience has the potential to create a lasting retention of situational awareness and behavior change.
It is worth exploring why interns identified significantly fewer low-value hazards than safety hazards in the simulation. One hypothesis is that interns were less attuned to low-value hazards, which may reflect a lacking emphasis on value-based care in undergraduate medical education (UME). It is especially concerning that so few interns identified the catheter-associated urinary tract infection (CAUTI) risk, as interns are primarily responsible for recognizing and removing an unnecessary catheter. Although the risks of low-value care should be apparent to most trainees, the process of recognizing and deliberately stopping or avoiding low-value care can be challenging for young clinicians.19 To promote value-based thinking among entering residents, UME programs should teach students to question the utility of the interventions their patients are receiving. One promising framework for doing so is the Subjective, Objective, Assessment, Plan- (SOAP)-V, in which a V for “Value” is added to the traditional SOAP note.20 SOAP-V notes serve as a cognitive forcing function that requires students to pause and assess the value and cost-consciousness of their patients’ care.20
The results from the “Room of Horrors” simulation can also guide health leaders and educators in identifying institutional areas of focus towards providing high-value and safe care. For example, at the University of Chicago we launched an initiative to improve the inappropriate use of urinary catheters after learning that few of our incoming interns recognized this during the simulation. Institutions could use this model to raise awareness of initiatives and redirect resources from areas that trainees perform well in (eg, hand hygiene) to areas that need improvement (eg, recognition of low-value care). Given the simulation’s low cost and minimal material requirements, it could be easily integrated into existing training programs with the support of an institution’s simulation center.
This study’s limitations include its conduction at single-institution, although the participants represented graduates of 60 different institutions. Furthermore, while the 12 hazards included in the simulation represent patient safety and value initiatives from a wide array of medical societies, they were not intended to be comprehensive and were not tailored to specific specialties. The simulation included only 4 low-value hazards, and future iterations of this exercise should aim to include an equal number of safety and low-value hazards. Furthermore, the evaluation of interns’ prior hospital safety training relied on self-reporting, and the specific context and content of each interns’ training was not examined. Finally, at this point we are unable to provide objective longitudinal data assessing the simulation’s impact on clinical practice and patient outcomes. Subsequent work will assess the sustained impact of the simulation by correlating with institutional data on measurable occurrences of low-value care.
In conclusion, interns identified significantly fewer low-value hazards than safety hazards in an inpatient simulation designed to promote situational awareness. Our results suggest that interns are on the lookout for errors of omission (eg, absence of hand hygiene, absence of isolation precautions) but are often blinded to errors of commission, such that when patients are started on therapies there is an assumption that the therapies are correct and necessary (eg, blood transfusions, stress ulcer prophylaxis). These findings suggest poor awareness of low-value care among incoming interns and highlight the need for additional training in both UME and GME to place a greater emphasis on preventing low-value care.
Disclosure
Dr. Arora is a member of the American Board of Medicine Board of Directors and has received grant funding from ABIM Foundation via Costs of Care for the Teaching Value Choosing Wisely™ Challenge. Dr. Farnan, Dr. Arora, and Ms. Hirsch receive grant funds from Accreditation Council of Graduate Medical Education as part of the Pursuing Excellence Initiative. Dr. Arora and Dr. Farnan also receive grant funds from the American Medical Association Accelerating Change in Medical Education initiative. Kathleen Wiest and Lukas Matern were funded through matching funds of the Pritzker Summer Research Program for NIA T35AG029795.
1. Colla CH, Morden NE, Sequist TD, Schpero WL, Rosenthal MB. Choosing wisely: prevalence and correlates of low-value health care services in the United States. J Gen Intern Med. 2015;30(2):221-228. doi:10.1007/s11606-014-3070-z. PubMed
2. Elshaug AG, McWilliams JM, Landon BE. The value of low-value lists. JAMA. 2013;309(8):775-776. doi:10.1001/jama.2013.828. PubMed
3. Cooke M. Cost consciousness in patient care--what is medical education’s responsibility? N Engl J Med. 2010;362(14):1253-1255. doi:10.1056/NEJMp0911502. PubMed
4. Weinberger SE. Providing high-value, cost-conscious care: a critical seventh general competency for physicians. Ann Intern Med. 2011;155(6):386-388. doi:10.7326/0003-4819-155-6-201109200-00007. PubMed
5. Graduate Medical Education That Meets the Nation’s Health Needs. Institute of Medicine. http://www.nationalacademies.org/hmd/Reports/2014/Graduate-Medical-Education-That-Meets-the-Nations-Health-Needs.aspx. Accessed May 25, 2016.
6. Accreditation Council for Graduate Medical Education. CLER Pathways to Excellence. https://www.acgme.org/acgmeweb/Portals/0/PDFs/CLER/CLER_Brochure.pdf. Accessed July 15, 2015.
7. Varkey P, Murad MH, Braun C, Grall KJH, Saoji V. A review of cost-effectiveness, cost-containment and economics curricula in graduate medical education. J Eval Clin Pract. 2010;16(6):1055-1062. doi:10.1111/j.1365-2753.2009.01249.x. PubMed
8. Patel MS, Reed DA, Loertscher L, McDonald FS, Arora VM. Teaching residents to provide cost-conscious care: a national survey of residency program directors. JAMA Intern Med. 2014;174(3):470-472. doi:10.1001/jamainternmed.2013.13222. PubMed
9. Cohen NL. Using the ABCs of situational awareness for patient safety. Nursing. 2013;43(4):64-65. doi:10.1097/01.NURSE.0000428332.23978.82. PubMed
10. Varkey P, Karlapudi S, Rose S, Swensen S. A patient safety curriculum for graduate medical education: results from a needs assessment of educators and patient safety experts. Am J Med Qual. 2009;24(3):214-221. doi:10.1177/1062860609332905. PubMed
11. Farnan JM, Gaffney S, Poston JT, et al. Patient safety room of horrors: a novel method to assess medical students and entering residents’ ability to identify hazards of hospitalisation. BMJ Qual Saf. 2016;25(3):153-158. doi:10.1136/bmjqs-2015-004621. PubMed
12. Centers for Medicare and Medicaid Services Hospital-acquired condition reduction program. Medicare.gov. https://www.medicare.gov/hospitalcompare/HAC-reduction-program.html. Accessed August 1, 2015.
13. Agency for Healthcare Research and Quality. Patient Safety Indicators Overview. http://www. qualityindicators.ahrq.gov/modules/psi_overview.aspx. Accessed August 20, 2015.
14. ABIM Foundation. Choosing Wisely. http://www.choosingwisely.org. Accessed August 21, 2015.
15. ABIM Foundation. Society of Hospital Medicine – Adult Hospital Medicine List. Choosing Wisely. http://www.choosingwisely.org/societies/ society-of-hospital-medicine-adult/. Accessed August 21, 2015.
16. Carson JL, Grossman BJ, Kleinman S, et al. Red blood cell transfusion: A clinical practice guideline from the AABB*. Ann Intern Med. 2012;157(1):49-58. PubMed
17. ABIM Foundation. American Geriatrics Society List. Choosing Wisely. http://www.choosingwisely.org/societies/american-geriatrics-society/. Accessed August 21, 2015.
18. The Best Medical Schools for Research, Ranked. http://grad-schools.usnews.rankingsandreviews.com/best-graduate-schools/top-medical-schools/research-rankings?int=af3309&int=b3b50a&int=b14409. Accessed June 7, 2016.
19. Roman BR, Asch DA. Faded promises: The challenge of deadopting low-value care. Ann Intern Med. 2014;161(2):149-150. doi:10.7326/M14-0212. PubMed
20. Moser EM, Huang GC, Packer CD, et al. SOAP-V: Introducing a method to empower medical students to be change agents in bending the cost curve. J Hosp Med. 2016;11(3):217-220. doi:10.1002/jhm.2489. PubMed
In recent years, the American Board of Internal Medicine (ABIM) Foundation’s Choosing Wisely™ campaign has advanced the dialogue on cost-consciousness by identifying potential examples of overuse in clinical practice.1 Eliminating low-value care can decrease costs, improve quality, and potentially decrease patient harm.2 In fact, there is growing consensus among health leaders and educators on the need for a physician workforce that is conscious of high-value care.3,4 The Institute of Medicine has issued a call-to-action for graduate medical education (GME) to emphasize value-based care,5 and the Accreditation Council for Graduate Medical Education has outlined expectations that residents receive formal and experiential training on overuse as a part of its Clinical Learning Environment Review.6
However, recent reports highlight a lack of emphasis on value-based care in medical education.7 For example, few residency program directors believe that residents are prepared to incorporate value and cost into their medical decisions.8 In 2012, only 15% of medicine residencies reported having formal curricula addressing value, although many were developing one.8 Of the curricula reported, most were didactic in nature and did not include an assessment component.8
Experiential learning through simulation is one promising method to teach clinicians-in-training to practice value-based care. Simulation-based training promotes situational awareness (defined as being cognizant of one’s working environment), a concept that is crucial for recognizing both low-value and unsafe care.9,10 Simulated training exercises are often included in GME orientation “boot-camps,” which have typically addressed safety.11 The incorporation of value into existing GME boot-camp exercises could provide a promising model for the addition of value-based training to GME.
At the University of Chicago, we had successfully implemented the “Room of Horrors,” a simulation for entering interns to promote the detection of patient safety hazards.11 Here, we describe a modification to this simulation to embed low-value hazards in addition to traditional patient safety hazards. The aim of this study is to assess the entering interns’ recognition of low-value care and their ability to recognize unsafe care in a simulation designed to promote situational awareness.
METHODS
Setting and Participants
The simulation was conducted during GME orientation at a large, urban academic medical institution. One hundred and twenty-five entering postgraduate year one (PGY1) interns participated in the simulation, which was a required component of a multiday orientation “boot-camp” experience. All eligible interns participated in the simulation, representing 13 specialty programs and 60 medical schools. Interns entering into pathology were excluded because of infrequent patient contact. Participating interns were divided into 7 specialty groups for analysis in order to preserve the anonymity of interns in smaller residency programs (surgical subspecialties combined with general surgery, medicine-pediatrics grouped with internal medicine). The University of Chicago Institutional Review Board deemed this study exempt from review.
Program Description
A simulation of an inpatient hospital room, known as the “Room of Horrors,” was constructed in collaboration with the University of Chicago Simulation Center and adapted from a previous version of the exercise.11 The simulation consisted of a mock door chart highlighting the patient had been admitted for diarrhea (Clostridium difficile positive) following a recent hospitalization for pneumonia. A clinical scenario was constructed by using a patient mannequin and an accompanying door chart that listed information on the patient’s hospital course, allergies, and medications. In addition to the 8 patient safety hazards utilized in the prior version, our team selected 4 low-value hazards to be included in the simulation.
The 8 safety hazards have been detailed in a prior study and were previously selected from Medicare’s Hospital-Acquired Conditions (HAC) Reduction Program and Agency for Healthcare Research and Quality (AHRQ) Patient Safety Indicators.11-13 Each of the hazards was represented either physically in the simulation room and/or was indicated on the patient’s chart. For example, the latex allergy hazard was represented by latex gloves at the bedside despite an allergy indicated on the patient’s chart and wristband. A complete list of the 8 safety hazards and their representations in the simulation is shown in Table 1.
The Choosing Wisely™ lists were reviewed to identify low-value hazards for addition to the simulation.14 Our team selected 3 low-value hazards from the Society of Hospital Medicine (SHM) list,15 including (1) arbitrary blood transfusion despite the patient’s stable hemoglobin level of 8.0 g/dL and absence of cardiac symptoms,16 (2) addition of a proton pump inhibitor (PPI) for stress ulcer prophylaxis in a patient without high risk for gastrointestinal (GI) complications who was not on a PPI prior to admission, and (3) placement of a urinary catheter without medical indication. We had originally selected continuous telemetry monitoring as a fourth hazard from the SHM list, but were unable to operationalize, as it was difficult to simulate continuous telemetry on a mannequin. Because many inpatients are older than 65 years, we reviewed the American Geriatrics Society list17 and selected our fourth low-value hazard: (4) unnecessary use of physical restraints to manage behavioral symptoms in a hospitalized patient with delirium. Several of these hazards were also quality and safety priorities at our institution, including the overuse of urinary catheters, physical restraints, and blood transfusions. All 4 low-value hazards were referenced in the patient’s door chart, and 3 were also physically represented in the room via presence of a hanging unit of blood, Foley catheter, and upper-arm restraints (Table 1). See Appendix for a photograph of the simulation setup.
Each intern was allowed 10 minutes inside the simulation room. During this time, they were instructed to read the 1-page door chart, inspect the simulation room, and write down as many potential low-value and safety hazards as they could identify on a free-response form (see Appendix). Upon exiting the room, they were allotted 5 additional minutes to complete their free-response answers and provide written feedback on the simulation. The simulation was conducted in 3 simulated hospital rooms over the course of 2 days, and the correct answers were provided via e-mail after all interns had completed the exercise.
To assess prior training and safety knowledge, interns were asked to complete a 3-question preassessment on a ScanTronTM (Tustin, CA) form. The preassessment asked interns whether they had received training on hospital safety during medical school (yes, no, or unsure), if they were satisfied with the hospital safety training they received during medical school (strongly disagree to strongly agree on a Likert scale), and if they were confident in their ability to identify potential hazards in a hospital setting (strongly disagree to strongly agree). Interns were also given the opportunity to provide feedback on the simulation experience on the ScanTronTM (Tustin, CA) form.
One month after participating in the simulation, interns were asked to complete an online follow-up survey on MedHubTM (Ann Arbor, MI), which included 2 Likert-scale questions (strongly disagree to strongly agree) assessing the simulation’s impact on their experience mitigating hospital hazards during the first month of internship.
Data Analysis
Interns’ free-response answers were manually coded, and descriptive statistics were used to summarize the mean percent correct for each hazard. A paired t test was used to compare intern identification of low-value vs safety hazards. T tests were used to compare hazard identification for interns entering highly procedural-intensive specialties (ie, surgical specialties, emergency medicine, anesthesia, obstetrics/gynecology) and those entering less procedural-intensive specialties (ie, internal medicine, pediatrics, psychiatry), as well as among those graduating from “Top 30” medical schools (based on US News & World Report Medical School Rankings18) and our own institution. One-way analysis of variance (ANOVA) calculations were used to test for differences in hazard identification based on interns’ prior hospital safety training, with interns who rated their satisfaction with prior training or confidence in identifying hazards as a “4” or a “5” considered “satisfied” and “confident,” respectively. Responses to the MedHubTM (Ann Arbor, MI) survey were dichotomized with “strongly agree” and “agree” considered positive responses. Statistical significance was defined at P < .05. All data analysis was conducted using Stata 14TM software (College Station, TX).
RESULTS
Intern Characteristics
One hundred twenty-five entering PGY1 interns participated in the simulation, representing 60 medical schools and 7 different specialty groups (Table 2). Thirty-five percent (44/125) were graduates from “Top 30” medical schools, and 8.8% (11/125) graduated from our own institution. Seventy-four percent (89/121) had received prior hospital safety training during medical school, and 62.9% (56/89) were satisfied with their training. A majority of interns (64.2%, 79/123) felt confident in their ability to identify potential hazards in a hospital setting, although confidence was much higher among those with prior safety training (71.9%, 64/89) compared to those without prior training or who were unsure about their training (40.6%, 13/32; P = .09, t test).
Identification of Hazards
The mean percentage of hazards correctly identified by interns during the simulation was 50.4% (standard deviation [SD] 11.8%), with a normal distribution (Figure 1). Interns identified a significantly lower percentage of low-value hazards than safety hazards in the simulation (mean 19.2% [SD 18.6%] vs 66.0% [SD 16.0%], respectively; P < .001, paired t test). Interns also identified significantly more room-based errors than chart-based errors (mean 58.6% [SD 13.4%] vs 9.6% [SD 19.8%], respectively; P < .001, paired t test). The 3 most commonly identified hazards were unavailability of hand hygiene (120/125, 96.0%), presence of latex gloves despite the patient’s allergy (111/125, 88.8%), and fall risk due to the lowered bed rail (107/125, 85.6%). More than half of interns identified the incorrect name on the patient’s wristband and IV bag (91/125, 72.8%), a lack of isolation precautions (90/125, 72.0%), administration of penicillin despite the patient’s allergy (67/125, 53.6%), and unnecessary restraints (64/125, 51.2%). Less than half of interns identified the wrong medication being administered (50/125, 40.0%), unnecessary Foley catheter (25/125, 20.0%), and absence of venous thromboembolism (VTE) prophylaxis (24/125, 19.2%). Few interns identified the unnecessary blood transfusion (7/125, 5.6%), and no one identified the unnecessary stress ulcer prophylaxis (0/125, 0.0%; Figure 2).
Predictors of Hazard Identification
Interns who self-reported as confident in their ability to identify hazards were not any more likely to correctly identify hazards than those who were not confident (50.9% overall hazard identification vs 49.6%, respectively; P = .56, t test). Interns entering into less procedural-intensive specialties identified significantly more safety hazards than those entering highly procedural-intensive specialties (mean 69.1% [SD 16.9%] vs 61.8% [SD 13.7%], respectively; P = .01, t test). However, there was no statistically significant difference in their identification of low-value hazards (mean 19.8% [SD 18.3%] for less procedural-intensive vs 18.4% [SD 19.1%] for highly procedural-intensive; P = .68, t test). There was no statistically significant difference in hazard identification among graduates of “Top 30” medical schools or graduates of our own institution. Prior hospital safety training had no significant impact on interns’ ability to identify safety or low-value hazards. Overall, interns who were satisfied with their prior training identified a mean of 51.8% of hazards present (SD 11.8%), interns who were not satisfied with their prior training identified 51.5% (SD 12.7%), interns with no prior training identified 48.7% (SD 11.7%), and interns who were unsure about their prior training identified 47.4% (SD 11.5%) [F(3,117) = .79; P = .51, ANOVA]. There was also no significant association between prior training and the identification of any one of the 12 specific hazards (chi-square tests, all P values > .1).
Intern Feedback and Follow-Up Survey
Debriefing revealed that most interns passively assumed the patient’s chart was correct and did not think they should question the patient’s current care regimen. For example, many interns commented that they did not think to consider the patient’s blood transfusion as unnecessary, even though they were aware of the recommended hemoglobin cutoffs for stable patients.
Interns also provided formal feedback on the simulation through open-ended comments on their ScanTronTM (Tustin, CA) form. For example, one intern wrote that they would “inherently approach every patient room ‘looking’ for safety issues, probably directly because of this exercise.” Another commented that the simulation was “more difficult than I expected, but very necessary to facilitate discussion and learning.” One intern wrote that “I wish I had done this earlier in my career.”
Ninety-six percent of participating interns (120/125) completed an online follow-up survey 1 month after beginning internship. In the survey, 68.9% (82/119) of interns indicated they were more aware of how to identify potential hazards facing hospitalized patients as a result of the simulation. Furthermore, 52.1% (62/119) of interns had taken action during internship to reduce a potential hazard that was present in the simulation.
DISCUSSION
While many GME orientations include simulation and safety training, this study is the first of its kind to incorporate low-value care from Choosing Wisely™ recommendations into simulated training. It is concerning that interns identified significantly fewer low-value hazards than safety hazards in the simulation. In some cases, no interns identified the low-value hazard. For example, while almost all interns identified the hand hygiene hazard, not one could identify the unnecessary stress ulcer prophylaxis. Furthermore, interns who self-reported as confident in their ability to identify hazards did not perform any better in the simulation. Interns entering less procedural-intensive specialties identified more safety hazards overall.
The simulation was well received by interns. Many commented that the experience was engaging, challenging, and effective in cultivating situational awareness towards low-value care. Our follow-up survey demonstrated the majority of interns reported taking action during their first month of internship to reduce a hazard included in the simulation. Most interns also reported a greater awareness of how to identify hospital hazards as a result of the simulation. These findings suggest that a brief simulation-based experience has the potential to create a lasting retention of situational awareness and behavior change.
It is worth exploring why interns identified significantly fewer low-value hazards than safety hazards in the simulation. One hypothesis is that interns were less attuned to low-value hazards, which may reflect a lacking emphasis on value-based care in undergraduate medical education (UME). It is especially concerning that so few interns identified the catheter-associated urinary tract infection (CAUTI) risk, as interns are primarily responsible for recognizing and removing an unnecessary catheter. Although the risks of low-value care should be apparent to most trainees, the process of recognizing and deliberately stopping or avoiding low-value care can be challenging for young clinicians.19 To promote value-based thinking among entering residents, UME programs should teach students to question the utility of the interventions their patients are receiving. One promising framework for doing so is the Subjective, Objective, Assessment, Plan- (SOAP)-V, in which a V for “Value” is added to the traditional SOAP note.20 SOAP-V notes serve as a cognitive forcing function that requires students to pause and assess the value and cost-consciousness of their patients’ care.20
The results from the “Room of Horrors” simulation can also guide health leaders and educators in identifying institutional areas of focus towards providing high-value and safe care. For example, at the University of Chicago we launched an initiative to improve the inappropriate use of urinary catheters after learning that few of our incoming interns recognized this during the simulation. Institutions could use this model to raise awareness of initiatives and redirect resources from areas that trainees perform well in (eg, hand hygiene) to areas that need improvement (eg, recognition of low-value care). Given the simulation’s low cost and minimal material requirements, it could be easily integrated into existing training programs with the support of an institution’s simulation center.
This study’s limitations include its conduction at single-institution, although the participants represented graduates of 60 different institutions. Furthermore, while the 12 hazards included in the simulation represent patient safety and value initiatives from a wide array of medical societies, they were not intended to be comprehensive and were not tailored to specific specialties. The simulation included only 4 low-value hazards, and future iterations of this exercise should aim to include an equal number of safety and low-value hazards. Furthermore, the evaluation of interns’ prior hospital safety training relied on self-reporting, and the specific context and content of each interns’ training was not examined. Finally, at this point we are unable to provide objective longitudinal data assessing the simulation’s impact on clinical practice and patient outcomes. Subsequent work will assess the sustained impact of the simulation by correlating with institutional data on measurable occurrences of low-value care.
In conclusion, interns identified significantly fewer low-value hazards than safety hazards in an inpatient simulation designed to promote situational awareness. Our results suggest that interns are on the lookout for errors of omission (eg, absence of hand hygiene, absence of isolation precautions) but are often blinded to errors of commission, such that when patients are started on therapies there is an assumption that the therapies are correct and necessary (eg, blood transfusions, stress ulcer prophylaxis). These findings suggest poor awareness of low-value care among incoming interns and highlight the need for additional training in both UME and GME to place a greater emphasis on preventing low-value care.
Disclosure
Dr. Arora is a member of the American Board of Medicine Board of Directors and has received grant funding from ABIM Foundation via Costs of Care for the Teaching Value Choosing Wisely™ Challenge. Dr. Farnan, Dr. Arora, and Ms. Hirsch receive grant funds from Accreditation Council of Graduate Medical Education as part of the Pursuing Excellence Initiative. Dr. Arora and Dr. Farnan also receive grant funds from the American Medical Association Accelerating Change in Medical Education initiative. Kathleen Wiest and Lukas Matern were funded through matching funds of the Pritzker Summer Research Program for NIA T35AG029795.
1. Colla CH, Morden NE, Sequist TD, Schpero WL, Rosenthal MB. Choosing wisely: prevalence and correlates of low-value health care services in the United States. J Gen Intern Med. 2015;30(2):221-228. doi:10.1007/s11606-014-3070-z. PubMed
2. Elshaug AG, McWilliams JM, Landon BE. The value of low-value lists. JAMA. 2013;309(8):775-776. doi:10.1001/jama.2013.828. PubMed
3. Cooke M. Cost consciousness in patient care--what is medical education’s responsibility? N Engl J Med. 2010;362(14):1253-1255. doi:10.1056/NEJMp0911502. PubMed
4. Weinberger SE. Providing high-value, cost-conscious care: a critical seventh general competency for physicians. Ann Intern Med. 2011;155(6):386-388. doi:10.7326/0003-4819-155-6-201109200-00007. PubMed
5. Graduate Medical Education That Meets the Nation’s Health Needs. Institute of Medicine. http://www.nationalacademies.org/hmd/Reports/2014/Graduate-Medical-Education-That-Meets-the-Nations-Health-Needs.aspx. Accessed May 25, 2016.
6. Accreditation Council for Graduate Medical Education. CLER Pathways to Excellence. https://www.acgme.org/acgmeweb/Portals/0/PDFs/CLER/CLER_Brochure.pdf. Accessed July 15, 2015.
7. Varkey P, Murad MH, Braun C, Grall KJH, Saoji V. A review of cost-effectiveness, cost-containment and economics curricula in graduate medical education. J Eval Clin Pract. 2010;16(6):1055-1062. doi:10.1111/j.1365-2753.2009.01249.x. PubMed
8. Patel MS, Reed DA, Loertscher L, McDonald FS, Arora VM. Teaching residents to provide cost-conscious care: a national survey of residency program directors. JAMA Intern Med. 2014;174(3):470-472. doi:10.1001/jamainternmed.2013.13222. PubMed
9. Cohen NL. Using the ABCs of situational awareness for patient safety. Nursing. 2013;43(4):64-65. doi:10.1097/01.NURSE.0000428332.23978.82. PubMed
10. Varkey P, Karlapudi S, Rose S, Swensen S. A patient safety curriculum for graduate medical education: results from a needs assessment of educators and patient safety experts. Am J Med Qual. 2009;24(3):214-221. doi:10.1177/1062860609332905. PubMed
11. Farnan JM, Gaffney S, Poston JT, et al. Patient safety room of horrors: a novel method to assess medical students and entering residents’ ability to identify hazards of hospitalisation. BMJ Qual Saf. 2016;25(3):153-158. doi:10.1136/bmjqs-2015-004621. PubMed
12. Centers for Medicare and Medicaid Services Hospital-acquired condition reduction program. Medicare.gov. https://www.medicare.gov/hospitalcompare/HAC-reduction-program.html. Accessed August 1, 2015.
13. Agency for Healthcare Research and Quality. Patient Safety Indicators Overview. http://www. qualityindicators.ahrq.gov/modules/psi_overview.aspx. Accessed August 20, 2015.
14. ABIM Foundation. Choosing Wisely. http://www.choosingwisely.org. Accessed August 21, 2015.
15. ABIM Foundation. Society of Hospital Medicine – Adult Hospital Medicine List. Choosing Wisely. http://www.choosingwisely.org/societies/ society-of-hospital-medicine-adult/. Accessed August 21, 2015.
16. Carson JL, Grossman BJ, Kleinman S, et al. Red blood cell transfusion: A clinical practice guideline from the AABB*. Ann Intern Med. 2012;157(1):49-58. PubMed
17. ABIM Foundation. American Geriatrics Society List. Choosing Wisely. http://www.choosingwisely.org/societies/american-geriatrics-society/. Accessed August 21, 2015.
18. The Best Medical Schools for Research, Ranked. http://grad-schools.usnews.rankingsandreviews.com/best-graduate-schools/top-medical-schools/research-rankings?int=af3309&int=b3b50a&int=b14409. Accessed June 7, 2016.
19. Roman BR, Asch DA. Faded promises: The challenge of deadopting low-value care. Ann Intern Med. 2014;161(2):149-150. doi:10.7326/M14-0212. PubMed
20. Moser EM, Huang GC, Packer CD, et al. SOAP-V: Introducing a method to empower medical students to be change agents in bending the cost curve. J Hosp Med. 2016;11(3):217-220. doi:10.1002/jhm.2489. PubMed
© 2017 Society of Hospital Medicine
In Reference to “Pilot Study Aiming to Support Sleep Quality and Duration During Hospitalizations”
We commend Gathecha et al.1 on the implementation of a well-formed, multicomponent sleep intervention to improve sleep in hospitalized patients. While they were unable to show objective improvement in sleep outcomes, they found improvements in patient-reported sleep outcomes across hospital days, implying that multiple hospital nights are needed to realize the benefits. We wish to propose an alternative strategy. To produce a more observable and immediate improvement in patient sleep outcomes, the behavioral economics principle of nudges2 could be an effective way to influence hospital staff toward sleep-promoting practices.
In focus groups at the University of Chicago Medicine, nurses, hospitalists, and residents reported unnecessary nocturnal disruptions were the “default” option hardwired in electronic medical records admission order sets. It was time-consuming to enter orders that minimized unnecessary nocturnal disruptions, such as forgo overnight vitals for stable patients. Given that changing default settings of order sets have been shown to effectively nudge physicians in other areas,3-5 altering default settings in admission orders could facilitate physicians’ adherence to sleep-promoting practices. An intervention combining these nudges with educational initiatives may be more effective in sustained reductions in nocturnal disruptions and improved inpatient sleep from the start of a hospital stay.
References
1. Gathecha E, Rios R, Buenaver LF, Landis R, Howell E, Wright S. Pilot study aiming to support sleep quality and duration during hospitalizations. J Hosp Med. 2016;11(7):467-472. doi:10.1002/jhm.2578. PubMed
2. Thaler R, Sunstein C. Nudge: Improving Decisions About Health, Wealth and Happiness. New Haven, CT: Yale University Press; 2008.
3. Bourdeaux CP, Davies KJ, Thomas MJC, Bewley JS, Gould TH. Using “nudge” principles for order set design: a before and after evaluation of an electronic prescribing template in critical care. BMJ Qual Saf. 2014;23(5):382-388. doi:10.1136/bmjqs-2013-002395. PubMed
4. Halpern SD, Ubel PA, Asch DA. Harnessing the power of default options to improve health care. N Engl J Med. 2007;357(13):1340-1344. doi:10.1056/NEJMsb071595. PubMed
5. Ansher C, Ariely D, Nagler A, Rudd M, Schwartz J, Shah A. Better medicine by default. Med Decis Making. 2014;34(2):147-158. doi:10.1177/0272989X13507339. PubMed
We commend Gathecha et al.1 on the implementation of a well-formed, multicomponent sleep intervention to improve sleep in hospitalized patients. While they were unable to show objective improvement in sleep outcomes, they found improvements in patient-reported sleep outcomes across hospital days, implying that multiple hospital nights are needed to realize the benefits. We wish to propose an alternative strategy. To produce a more observable and immediate improvement in patient sleep outcomes, the behavioral economics principle of nudges2 could be an effective way to influence hospital staff toward sleep-promoting practices.
In focus groups at the University of Chicago Medicine, nurses, hospitalists, and residents reported unnecessary nocturnal disruptions were the “default” option hardwired in electronic medical records admission order sets. It was time-consuming to enter orders that minimized unnecessary nocturnal disruptions, such as forgo overnight vitals for stable patients. Given that changing default settings of order sets have been shown to effectively nudge physicians in other areas,3-5 altering default settings in admission orders could facilitate physicians’ adherence to sleep-promoting practices. An intervention combining these nudges with educational initiatives may be more effective in sustained reductions in nocturnal disruptions and improved inpatient sleep from the start of a hospital stay.
References
1. Gathecha E, Rios R, Buenaver LF, Landis R, Howell E, Wright S. Pilot study aiming to support sleep quality and duration during hospitalizations. J Hosp Med. 2016;11(7):467-472. doi:10.1002/jhm.2578. PubMed
2. Thaler R, Sunstein C. Nudge: Improving Decisions About Health, Wealth and Happiness. New Haven, CT: Yale University Press; 2008.
3. Bourdeaux CP, Davies KJ, Thomas MJC, Bewley JS, Gould TH. Using “nudge” principles for order set design: a before and after evaluation of an electronic prescribing template in critical care. BMJ Qual Saf. 2014;23(5):382-388. doi:10.1136/bmjqs-2013-002395. PubMed
4. Halpern SD, Ubel PA, Asch DA. Harnessing the power of default options to improve health care. N Engl J Med. 2007;357(13):1340-1344. doi:10.1056/NEJMsb071595. PubMed
5. Ansher C, Ariely D, Nagler A, Rudd M, Schwartz J, Shah A. Better medicine by default. Med Decis Making. 2014;34(2):147-158. doi:10.1177/0272989X13507339. PubMed
© 2017 Society of Hospital Medicine
Analysis of Hospitalist Discontinuity
Studies examining the importance of continuity of care have shown that patients who maintain a continuous relationship with a single physician have improved outcomes.[1, 2] However, most of these studies were performed in the outpatient, rather than the inpatient setting. With over 35 million patients admitted to hospitals in 2013, along with the significant increase in hospital discontinuity over recent years, the impact of inpatient continuity of care on quality outcomes and patient satisfaction is becoming increasingly relevant.[3, 4]
Service handoffs, when a physician hands over treatment responsibility for a panel of patients and is not expected to return, are a type of handoff that contributes to inpatient discontinuity. In particular, service handoffs between hospitalists are an especially common and inherently risky type of transition, as there is a severing of an established relationship during a patient's hospitalization. Unfortunately, due to the lack of evidence on the effects of service handoffs, current guidelines are limited in their recommendations.[5] Whereas several recent studies have begun to explore the effects of these handoffs, no prior study has examined this issue from a patient's perspective.[6, 7, 8]
Patients are uniquely positioned to inform us about their experiences in care transitions. Furthermore, with patient satisfaction now affecting Medicare reimbursement rates, patient experiences while in the hospital are becoming even more significant.[9] Despite this emphasis toward more patient‐centered care, no study has explored the hospitalized patient's experience with hospitalist service handoffs. Our goal was to qualitatively assess the hospitalized patients' experiences with transitions between hospitalists to develop a conceptual model to inform future work on improving inpatient transitions of care.
METHODS
Sampling and Recruitment
We conducted bedside interviews of hospitalized patients at an urban academic medical center from October 2014 through December 2014. The hospitalist service consists of a physician and an advanced nurse practitioner (ANP) who divide a panel of patients that consist of general medicine and subspecialty patients who are often comanaged with hepatology, oncology, and nephrology subspecialists. We performed a purposive selection of patients who could potentially comment on their experience with a hospitalist service transition using the following method: 48 hours after a service handoff (ie, an outgoing physician completing 1 week on service, then transfers the care of the patient to a new oncoming hospitalist), oncoming hospitalists were approached and asked if any patient on their service had experienced a service handoff and still remained in the hospital. A 48‐hour time period was chosen to give the patients time to familiarize themselves with their new hospitalist, allowing them to properly comment on the handoff. Patients who were managed by the ANP, who were non‐English speaking, or who were deemed to have an altered mental status based on clinical suspicion by the interviewing physician (C.M.W.) were excluded from participation. Following each weekly service transition, a list of patients who met the above criteria was collected from 4 nonteaching hospitalist services, and were approached by the primary investigator (C.M.W.) and asked if they would be willing to participate. All patients were general medicine patients and no exclusions were made based on physical location within the hospital. Those who agreed provided signed written consent prior to participation to allow access to the electronic health records (EHRs) by study personnel.
Data Collection
Patients were administered a 9‐question, semistructured interview that was informed by expert opinion and existing literature, which was developed to elicit their perspective regarding their transition between hospitalists.[10, 11] No formal changes were made to the interview guide during the study period, and all patients were asked the same questions. Outcomes from interim analysis guided further questioning in subsequent interviews so as to increase the depth of patient responses (ie, Can you explain your response in greater depth?). Prior to the interview, patients were read a description of a hospitalist, and were reminded which hospitalists had cared for them during their stay (see Supporting Information, Appendix 1, in the online version of this article). If family members or a caregiver were present at the time of interview, they were asked not to comment. No repeat interviews were carried out.
All interviews were performed privately in single‐occupancy rooms, digitally recorded using an iPad (Apple, Cupertino, CA) and professionally transcribed verbatim (Rev, San Francisco, CA). All analysis was performed using MAXQDA Software (VERBI Software GmbH, Berlin, Germany). We obtained demographic information about each patient through chart review
Data Analysis
Grounded theory was utilized, with an inductive approach with no a priori hypothesis.[12] The constant comparative method was used to generate emerging and reoccurring themes.[13] Units of analysis were sentences and phrases. Our research team consisted of 4 academic hospitalists, 2 with backgrounds in clinical medicine, medical education, and qualitative analysis (J.M.F., V.M.A.), 1 as a clinician (C.M.W.), and 1 in health economics (D.O.M.). Interim analysis was performed on a weekly basis (C.M.W.), during which time a coding template was created and refined through an iterative process (C.M.W., J.M.F.). All disagreements in coded themes were resolved through group discussion until full consensus was reached. Each week, responses were assessed for thematic saturation.[14] Interviews were continued if new themes arose during this analysis. Data collection was ended once we ceased to extract new topics from participants. A summary of all themes was then presented to a group of 10 patients who met the same inclusion criteria for respondent validation and member checking. All reporting was performed within the Standards for Reporting Qualitative Research, with additional guidance derived from the Consolidated Criteria for Reporting Qualitative Research.[15, 16] The University of Chicago Institutional Review Board approved this protocol.
RESULTS
In total, 43 eligible patients were recruited, and 40 (93%) agreed to participate. Interviewed patients were between 51 and 65 (39%) years old, had a mean age of 54.5 (15) years, were predominantly female (65%), African American (58%), had a median length of stay at the time of interview of 6.5 days (interquartile range [IQR]: 48), and had an average of 2.0 (IQR: 13) hospitalists oversee their care at the time of interview (Table 1). Interview times ranged from 10:25 to 25:48 minutes, with an average of 15:32 minutes.
| Value | |
|---|---|
| |
| Response rate, n (%) | 40/43 (93) |
| Age, mean SD | 54.5 15 |
| Sex, n (%) | |
| Female | 26 (65) |
| Male | 14 (35) |
| Race, n (%) | |
| African American | 23 (58) |
| White | 16 (40) |
| Hispanic | 1 (2) |
| Median LOS at time of interview, d (IQR) | 6.5 (48) |
| Median no. of hospitalists at time of interview, n (IQR) | 2.0 (13) |
We identified 6 major themes on patient perceptions of hospitalist service handoffs including (1) physician‐patient communication, (2) transparency in the hospitalist transition process, (3) indifference toward the hospitalist transition, (4) hospitalist‐subspecialist communication, (5) recognition of new opportunities due to a transition, and (6) hospitalists' bedside manner (Table 2).
| Themes | Subthemes | Representative Quotes |
|---|---|---|
| Physician‐patient communication | Patients dislike redundant communication with oncoming hospitalist. | I mean it's just you always have to explain your situation over and over and over again. (patient 14) |
| When I said it once already, then you're repeating it to another doctor. I feel as if that hospitalist didn't talk to the other hospitalist. (patient 7) | ||
| Poor communication can negatively affect the doctor‐patient relationship. | They don't really want to explain things. They don't think I'll understand. I think & yeah, I'm okay. You don't even have to put it in layman's terms. I know medical. I'm in nursing school. I have a year left. But even if you didn't know that, I would still hope you would try to tell me what was going on instead of just doing it in your head, and treating it. (patient 2) | |
| I mean it's just you always have to explain your situation over and over and over again. After a while you just stop trusting them. (patient 20) | ||
| Good communication can positively affect the doctor‐patient relationship. | Just continue with the communication, the open communication, and always stress to me that I have a voice and just going out of their way to do whatever they can to help me through whatever I'm going through. (patient 1) | |
| Transparency in transition | Patients want to be informed prior to a service changeover. | I think they should be told immediately, even maybe given prior notice, like this may happen, just so you're not surprised when it happens. (patient 15) |
| When the doctor approached me, he let me know that he wasn't going to be here the next day and there was going to be another doctor coming in. That made me feel comfortable. (patient 9) | ||
| Patients desire a more formalized process in the service changeover. | People want things to be consistent. People don't like change. They like routine. So, if he's leaving, you're coming on, I'd like for him to bring you in, introduce you to me, and for you just assure me that I'll take care of you. (patient 4) | |
| Just like when you get a new medication, you're given all this information on it. So when you get a new hospitalist, shouldn't I get all the information on them? Like where they went to school, what they look like. (patient 23) | ||
| Patients want clearer definition of the roles the physicians will play in their care. | The first time I was hospitalized for the first time I had all these different doctors coming in, and I had the residency, and the specialists, and the department, and I don't know who's who. What I asked them to do is when they come in the room, which they did, but introduce it a little more for me. Write it down like these are the special team and these are the doctors because even though they come in and give me their name, I have no idea what they're doing. (patient 5) | |
| Someone should explain the setup and who people are. Someone would say, Okay when you're in a hospital this is your [doctor's] role. Like they should have booklets and everything. (patient 19) | ||
| Indifference toward transition | Many patients have trust in service changeovers. | [S]o as long as everybody's on board and communicates well and efficiently, I don't have a problem with it. (patient 6) |
| To me, it really wasn't no preference, as long as I was getting the care that I needed. (patient 21) | ||
| It's not a concern as long as they're on the same page. (patient 17) | ||
| Hospitalist‐specialist communication | Patients are concerned about communication between their hospitalist and their subspecialists. | The more cooks you get in the kitchen, the more things get to get lost, so I'm always concerned that they're not sharing the same information, especially when you're getting asked the same questions that you might have just answered the last hour ago. (patient 9) |
| I don't know if the hospitalist are talking to them [subspecialist]. They haven't got time. (patient 35) | ||
| Patients place trust in the communication between hospitalist and subspecialist. | I think among the teams themselveswhich is my pain doctor, Dr. K's group, the oncology group itself, they switch off and trade with each other and they all speak the same language so that works out good. (patient 3) | |
| Lack of interprofessional communication can lead to patient concern. | I was afraid that one was going to drop the ball on something and not pass something on, or you know. (patient 11) | |
| I had numerous doctors who all seemed to not communicate with each other at all or did so by email or whatever. They didn't just sit down together and say we feel this way and we feel that way. I didn't like that at all. (patient 10) | ||
| New opportunities due to transition | Patients see new doctor as opportunity for medical reevaluation. | I see it as two heads are better than one, three heads are better than one, four heads are better than one. When people put their heads together to work towards a common goal, especially when they're, you know, people working their craft, it can't be bad. (patient 9) |
| I finally got my ears looked atbecause I've asked to have my ears looked at since Mondayand the new doc is trying to make an effort to look at them. (patient 39) | ||
| Patients see service changeover as an opportunity to form a better personal relationship. | Having a new hospitalist it gives you opportunity for a new beginning. (patient 11) | |
| Bedside manner | Good bedside manner can assist in a service changeover. | Some of them are all business‐like but some of them are, Well how do you feel today? Hi, how are you? So this made a little difference. You feel more comfortable. You're going to be more comfortable with them. Their bedside manner helps. (patient 16) |
| It's just like when a doctor sits down and talks to you, they just seem more relaxed and more .... I know they're very busy and they have lots of things to do and other patients to see, but while they're in there with you, you know, you don't get too much time with them. So bedside manner is just so important. (patient 24) | ||
| Poor bedside manner can be detrimental in transition. | [B]ecause they be so busy they claim they don't have time just to sit and talk to a patient, and make sure they all right. (patient 17) |
Physician‐Patient Communication
Communication between the physician and the patient was an important element in patients' assessment of their experience. Patient's tended to divide physician‐patient communication into 2 categories: good communication, which consisted of open communication (patient 1) and patient engagement, and bad communication, which was described as physicians not sharing information or taking the time to explain the course of care in words that I'll understand (patient 2). Patients also described dissatisfaction with redundant communication between multiple hospitalists and the frustration of often having to describe their clinical course to multiple providers.
Transparency in Communication
The desire to have greater transparency in the handoff process was another common theme. This was likely due to the fact that 34/40 (85%) of surveyed patients were unaware that a service changeover had ever taken place. This lack of transparency was viewed to have further downstream consequences as patients stated that there should be a level of transparency, and when it's not, then there is always trust issues (patient 1). Upon further questioning as to how to make the process more transparent, many patients recommended a formalized, face‐to‐face introduction involving the patient and both hospitalists, in which the outgoing hospitalist would, bring you [oncoming hospitalist] in, and introduce you to me (patient 4).
Patients often stated that given the large spectrum of physicians they might encounter during their stay (ie, medical student, resident, hospitalist attending, subspecialty fellow, subspecialist attending), clearer definitions of physicians' roles are needed.
Hospitalist‐Specialist Communication
Concern about the communication between their hospitalist and subspecialist was another predominant theme. Conflicting and unclear directions from multiple services were especially frustrating, as a patient stated, One guy took me off this pill, the other guy wants me on that pill, I'm like okay, I can't do both (patient 8). Furthermore, a subset of patients referenced their subspecialist as their primary care provider and preferred their subspecialist for guidance in their hospital course, rather than their hospitalist. This often appeared in cases where the patient had an established relationship with the subspecialist prior to their hospitalization.
New Opportunities Due to Transition
Patients expressed positive feelings toward service handoffs by viewing the transition as an opportunity for medical reevaluation by a new physician. Patients told of instances in which a specific complaint was not being addressed by the first physician, but would be addressed by the second (oncoming) physician. A commonly expressed idea was that the oncoming physician might know something that he [Dr. B] didn't know, and since Dr. B was only here for a week, why not give him [oncoming hospitalist] a chance (patient 10). Patients would also describe the transition as an opportunity to form, and possibly improve, therapeutic alliances with a new hospitalist.
Bedside Manner
Bedside manner was another commonly mentioned thematic element. Patients were often quick to forget prior problems or issues that they may have suffered because of the transition if the oncoming physician was perceived to have a good bedside manner, often described as someone who formally introduced themselves, was considered relaxed, and would take the time to sit and talk with the patient. As a patient put it, [S]he sat down and got to know meand asked me what I wanted to do (patient 12). Conversely, patients described instances in which a perceived bad bedside manner led to a poor relationship between the physician and the patient, in which trust and comfort (patient 11) were sacrificed.
Indifference Toward Transition
In contrast to some of the previous findings, which called for improved interactions between physicians and patients, we also discovered a theme of indifference toward the transition. Several patients stated feelings of trust with the medical system, and were content with the service changeover as long as they felt that their medical needs were being met. Patients also tended to express a level of acceptance with the transition, and tended to believe that this was the price we pay for being here [in the hospital] (patient 7).
Conceptual Model
Following the collection and analysis of all patient responses, all themes were utilized to construct the ideal patient‐centered service handoff. The ideal transition describes open lines of communication between all involved parties, is facilitated by multiple modalities, such as the EHRs and nursing staff, and recognizes the patient as the primary stakeholder (Figure 1).
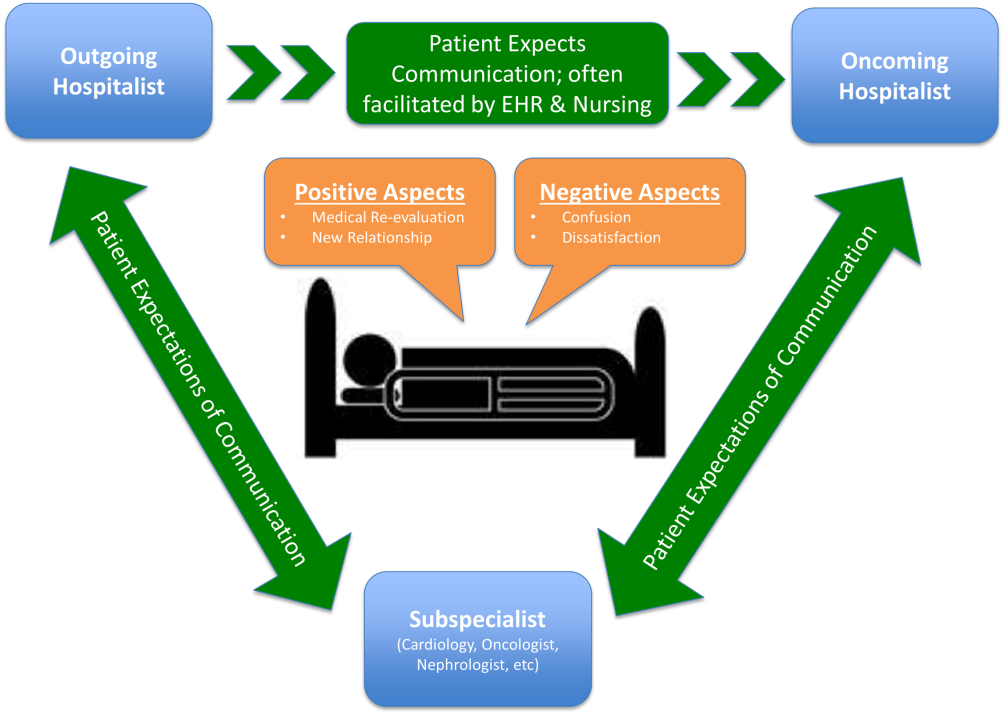
DISCUSSION
To our knowledge, this is the first qualitative investigation of the hospitalized patient's experience with service handoffs between hospitalists. The patient perspective adds a personal and first‐hand description of how fragmented care may impact the hospitalized patient experience.
Of the 6 themes, communication was found to be the most pertinent to our respondents. Because much of patient care is an inherently communicative activity, it is not surprising that patients, as well as patient safety experts, have focused on communication as an area in need of improvement in transition processes.[17, 18] Moreover, multiple medical societies have directly called for improvements within this area, and have specifically recommended clear and direct communication of treatment plans between the patient and physician, timely exchange of information, and knowledge of who is primarily in charge of the patients care.[11] Not surprisingly, each of these recommendations appears to be echoed by our participants. This theme is especially important given that good physician‐patient communication has been noted to be a major goal in achieving patient‐centered care, and has been positively correlated to medication adherence, patient satisfaction, and physical health outcomes.[19, 20, 21, 22, 23]
Although not a substitute for face‐to‐face interactions, other communication interventions between physicians and patients should be considered. For example, get to know me posters placed in patient rooms have been shown to encourage communication between patients and physicians.[24] Additionally, physician face cards have been used to improve patients' abilities to identify and clarify physicians' roles in patient care.[25] As a patient put it, If they got a new one [hospitalist], just as if I got a new medicationprint out information on themlike where they went to med school, and stuff(patient 13). These modalities may represent highly implementable, cost‐effective adjuncts to current handoff methods that may improve lines of communication between physicians and patients.
In addition to the importance placed on physician‐patient communication, interprofessional communication between hospitalists and subspecialists was also highly regarded. Studies have shown that practice‐based interprofessional communication, such as daily interdisciplinary rounds and the use of external facilitators, can improve healthcare processes and outcomes.[26] However, these interventions must be weighed with the many conflicting factors that both hospitalists and subspecialists face on daily basis, including high patient volumes, time limitations, patient availability, and scheduling conflicts.[27] None the less, the strong emphasis patients placed on this line of communication highlights this domain as an area in which hospitalist and subspecialist can work together for systematic improvement.
Patients also recognized the complexity of the transfer process between hospitalists and called for improved transparency. For example, patients repeatedly requested to be informed prior to any changes in their hospitalists, a request that remains consistent with current guidelines.[11] There also existed a strong desire for a more formalized process of transitioning between hospitalists, which often described a handoff procedure that would occur at the patient's bedside. This desire seems to be mirrored in the data that show that patients prefer to interact with their care team at the bedside and report higher satisfaction when they are involved with their care.[28, 29] Unfortunately, this desire for more direct interaction with physicians runs counter to the current paradigm of patient care, where most activities on rounds do not take place at the bedside.[30]
In contrast to patient's calls for improved transparency, an equally large portion of patients expressed relative indifference to the transition. Whereas on the surface this may seem salutary, some studies suggest that a lack of patient activation and engagement may have adverse effects toward patients' overall care.[31] Furthermore, others have shown evidence of better healthcare experiences, improved health outcomes, and lower costs in patients who are more active in their care.[30, 31] Altogether, this suggests that despite some patients' indifference, physicians should continue to engage patients in their hospital care.[32]
Although prevailing sentiments among patient safety advocates are that patient handoffs are inherently dangerous and place patients at increased risk of adverse events, patients did not always share this concern. A frequently occurring theme was that the transition is an opportunity for medical reevaluation or the establishment of a new, possibly improved therapeutic alliance. Recognizing this viewpoint offers oncoming hospitalists the opportunity to focus on issues that the patient may have felt were not being properly addressed with their prior physician.
Finally, although our conceptual model is not a strict guideline, we believe that any future studies should consider this framework when constructing interventions to improve service‐level handoffs. Several interventions already exist. For instance, educational interventions, such as patient‐centered interviewing, have been shown to improve patient satisfaction, compliance with medications, lead to fewer lawsuits, and improve health outcomes.[33, 34, 35] Additional methods of keeping the patient more informed include physician face sheets and performance of the handoff at the patient's bedside. Although well known in nursing literature, the idea of physicians performing handoffs at the patient's bedside is a particularly patient‐centric process.[36] This type of intervention may have the ability to transform the handoff from the current state of a 2‐way street, in which information is passed between 2 hospitalists, to a 3‐way stop, in which both hospitalists and the patient are able to communicate at this critical junction of care.
Although our study does offer new insight into the effects of discontinuous care, its exploratory nature does have limitations. First, being performed at a single academic center limits our ability to generalize our findings. Second, perspectives of those who did not wish to participate, patients' family members or caregivers, and those who were not queried, could highly differ from those we interviewed. Additionally, we did not collect data on patients' diagnoses or reason for admission, thus limiting our ability to assess if certain diagnosis or subpopulations predispose patients to experiencing a service handoff. Third, although our study was restricted to English‐speaking patients only, we must consider that non‐English speakers would likely suffer from even greater communication barriers than those who took part in our study. Finally, our interviews and data analysis were conducted by hospitalists, which could have subconsciously influenced the interview process, and the interpretation of patient responses. However, we tried to mitigate these issues by having the same individual interview all participants, by using an interview guide to ensure cross‐cohort consistency, by using open‐ended questions, and by attempting to give patients every opportunity to express themselves.
CONCLUSIONS
From a patients' perspective, inpatient service handoffs are often opaque experiences that are highlighted by poor communication between physicians and patients. Although deficits in communication and transparency acted as barriers to a patient‐centered handoff, physicians should recognize that service handoffs may also represent opportunities for improvement, and should focus on these domains when they start on a new service.
Disclosures
All funding for this project was provided by the Section of Hospital Medicine at The University of Chicago Medical Center. The data from this article were presented at the Society of Hospital Medicine Annual Conference, National Harbor, March 31, 2015, and at the Society of General Internal Medicine National Meeting in Toronto, Canada, April 23, 2015. The authors report that no conflicts of interest, financial or otherwise, exist.
- , , , , , . Continuity of outpatient and inpatient care by primary care physicians for hospitalized older adults. JAMA. 2009;301(16):1671–1680.
- , , , et al. Continuity of care and the risk of preventable hospitalization in older adults. JAMA Intern Med. 2013;173(20):1879–1885.
- Agency for Healthcare Research and Quality. HCUPnet: a tool for identifying, tracking, and analyzing national hospital statistics. Available at: http://hcupnet.ahrq.gov/HCUPnet.jsp?Id=82B37DA366A36BAD6(8):438–444.
- , , , , , . Hospitalist handoffs: a systematic review and task force recommendations. J Hosp Med. 2009;4(7):433–440.
- , , , , . The impact of fragmentation of hospitalist care on length of stay. J Hosp Med. 2010;5(6):335–338.
- , , , et al. The impact of hospitalist discontinuity on hospital cost, readmissions, and patient satisfaction. J Gen Intern Med. 2014;29(7):1004–1008.
- , , , et al. The effect of hospitalist discontinuity on adverse events. J Hosp Med. 2015;10(3):147–151.
- Agency for Healthcare Research and Quality. HCAHPS Fact Sheet. CAHPS Hospital Survey August 2013. Available at: http://www.hcahpsonline.org/files/August_2013_HCAHPS_Fact_Sheet3.pdf. Accessed February 2, 2015.
- , , , et al. A conceptual framework for studying the safety of transitions in emergency care. In: Henriksen K, Battles JB, Marks ES, eds. Advances in Patient Safety: From Research to Implementation. Rockville, MD: Agency for Healthcare Research and Quality; 2005:309–321. Concepts and Methodology; vol 2. Available at: http://www.ncbi.nlm.nih.gov/books/NBK20522. Accessed January 15, 2015.
- , , , et al. Transitions of care consensus policy statement American College of Physicians‐Society of General Internal Medicine‐Society of Hospital Medicine‐American Geriatrics Society‐American College of Emergency Physicians‐Society of Academic Emergency Medicine. J Gen Intern Med. 2009;24(8):971–976.
- , . Grounded theory in medical education research: AMEE guide no. 70. Med Teach. 2012;34(10):850–861.
- . A purposeful approach to the constant comparative method in the analysis of qualitative interviews. Qual Quant. 2002;36(4):391–409.
- . The significance of saturation. Qual Health Res. 1995;5(2):147–149.
- , , , , . Standards for reporting qualitative research: a synthesis of recommendations. Acad Med. 2014;89(9):1245–1251.
- , , . Consolidated criteria for reporting qualitative research (COREQ): a 32‐item checklist for interviews and focus groups. Int J Qual Health Care. 2007;19(6):349–357.
- , , , . Promoting effective transitions of care at hospital discharge: a review of key issues for hospitalists. J Hosp Med. 2007;2(5):314–323.
- The Joint Commission. Hot Topics in Healthcare, Issue 2. Transitions of care: the need for collaboration across entire care continuum. Available at: http://www.jointcommission.org/assets/1/6/TOC_Hot_Topics.pdf. Accessed April 9, 2015.
- , . Physician communication and patient adherence to treatment: a meta‐analysis. Med Care. 2009;47(8):826–834.
- , . Impediments to adherence to post myocardial infarction medications. Curr Cardiol Rep. 2013;15(1):322.
- , , , , . Medical specialists' patient‐centered communication and patient‐reported outcomes. Med Care. 2007;45(4):330–339.
- , , , . Does doctor‐patient communication affect patient satisfaction with hospital care? Results of an analysis with a novel instrumental variable. Health Serv Res. 2008;43(5 pt 1):1505–1519.
- , , . Patient‐centredness in chronic illness: what is it and does it matter? Patient Educ Couns. 2003;51(3):197–206.
- , , , et al. Merging cultures: palliative care specialists in the medical intensive care unit. Crit Care Med. 2006;34(11 suppl):S388–S393.
- , , , et al. Improving inpatients' identification of their doctors: use of FACE cards. Jt Comm J Qual Patient Saf. 2009;35(12):613–619.
- , , . Interprofessional collaboration: effects of practice‐based interventions on professional practice and healthcare outcomes. Cochrane Database Syst Rev. 2009;(3):CD000072.
- , , , et al. Identifying and overcoming the barriers to bedside rounds: a multicenter qualitative study. Acad Med. 2014;89(2):326–334.
- , , , , . The effect of bedside case presentations on patients' perceptions of their medical care. N Engl J Med. 1997;336(16):1150–1155.
- , , , . Patient‐centered interprofessional collaborative care: factors associated with bedside interprofessional rounds. J Gen Intern Med. 2014;29(7):1040–1047.
- , , , et al. Attending rounds in the current era: what is and is not happening. JAMA Intern Med. 2013;173(12):1084–1089.
- , . What the evidence shows about patient activation: better health outcomes and care experiences; fewer data on costs. Health Aff (Millwood). 2013;32(2):207–214.
- , , , , . When patient activation levels change, health outcomes and costs change, too. Health Aff Proj Hope. 2015;34(3):431–437.
- , , , et al. Evidence‐based guidelines for teaching patient‐centered interviewing. Patient Educ Couns. 2000;39(1):27–36.
- , , . Meta‐analysis of correlates of provider behavior in medical encounters. Med Care. 1988;26(7):657–675.
- , . Characteristics of potential plaintiffs in malpractice litigation. Ann Intern Med. 1994;120(9):792–798.
- , , , , . Bedside shift reports: what does the evidence say? J Nurs Adm. 2014;44(10):541–545.
Studies examining the importance of continuity of care have shown that patients who maintain a continuous relationship with a single physician have improved outcomes.[1, 2] However, most of these studies were performed in the outpatient, rather than the inpatient setting. With over 35 million patients admitted to hospitals in 2013, along with the significant increase in hospital discontinuity over recent years, the impact of inpatient continuity of care on quality outcomes and patient satisfaction is becoming increasingly relevant.[3, 4]
Service handoffs, when a physician hands over treatment responsibility for a panel of patients and is not expected to return, are a type of handoff that contributes to inpatient discontinuity. In particular, service handoffs between hospitalists are an especially common and inherently risky type of transition, as there is a severing of an established relationship during a patient's hospitalization. Unfortunately, due to the lack of evidence on the effects of service handoffs, current guidelines are limited in their recommendations.[5] Whereas several recent studies have begun to explore the effects of these handoffs, no prior study has examined this issue from a patient's perspective.[6, 7, 8]
Patients are uniquely positioned to inform us about their experiences in care transitions. Furthermore, with patient satisfaction now affecting Medicare reimbursement rates, patient experiences while in the hospital are becoming even more significant.[9] Despite this emphasis toward more patient‐centered care, no study has explored the hospitalized patient's experience with hospitalist service handoffs. Our goal was to qualitatively assess the hospitalized patients' experiences with transitions between hospitalists to develop a conceptual model to inform future work on improving inpatient transitions of care.
METHODS
Sampling and Recruitment
We conducted bedside interviews of hospitalized patients at an urban academic medical center from October 2014 through December 2014. The hospitalist service consists of a physician and an advanced nurse practitioner (ANP) who divide a panel of patients that consist of general medicine and subspecialty patients who are often comanaged with hepatology, oncology, and nephrology subspecialists. We performed a purposive selection of patients who could potentially comment on their experience with a hospitalist service transition using the following method: 48 hours after a service handoff (ie, an outgoing physician completing 1 week on service, then transfers the care of the patient to a new oncoming hospitalist), oncoming hospitalists were approached and asked if any patient on their service had experienced a service handoff and still remained in the hospital. A 48‐hour time period was chosen to give the patients time to familiarize themselves with their new hospitalist, allowing them to properly comment on the handoff. Patients who were managed by the ANP, who were non‐English speaking, or who were deemed to have an altered mental status based on clinical suspicion by the interviewing physician (C.M.W.) were excluded from participation. Following each weekly service transition, a list of patients who met the above criteria was collected from 4 nonteaching hospitalist services, and were approached by the primary investigator (C.M.W.) and asked if they would be willing to participate. All patients were general medicine patients and no exclusions were made based on physical location within the hospital. Those who agreed provided signed written consent prior to participation to allow access to the electronic health records (EHRs) by study personnel.
Data Collection
Patients were administered a 9‐question, semistructured interview that was informed by expert opinion and existing literature, which was developed to elicit their perspective regarding their transition between hospitalists.[10, 11] No formal changes were made to the interview guide during the study period, and all patients were asked the same questions. Outcomes from interim analysis guided further questioning in subsequent interviews so as to increase the depth of patient responses (ie, Can you explain your response in greater depth?). Prior to the interview, patients were read a description of a hospitalist, and were reminded which hospitalists had cared for them during their stay (see Supporting Information, Appendix 1, in the online version of this article). If family members or a caregiver were present at the time of interview, they were asked not to comment. No repeat interviews were carried out.
All interviews were performed privately in single‐occupancy rooms, digitally recorded using an iPad (Apple, Cupertino, CA) and professionally transcribed verbatim (Rev, San Francisco, CA). All analysis was performed using MAXQDA Software (VERBI Software GmbH, Berlin, Germany). We obtained demographic information about each patient through chart review
Data Analysis
Grounded theory was utilized, with an inductive approach with no a priori hypothesis.[12] The constant comparative method was used to generate emerging and reoccurring themes.[13] Units of analysis were sentences and phrases. Our research team consisted of 4 academic hospitalists, 2 with backgrounds in clinical medicine, medical education, and qualitative analysis (J.M.F., V.M.A.), 1 as a clinician (C.M.W.), and 1 in health economics (D.O.M.). Interim analysis was performed on a weekly basis (C.M.W.), during which time a coding template was created and refined through an iterative process (C.M.W., J.M.F.). All disagreements in coded themes were resolved through group discussion until full consensus was reached. Each week, responses were assessed for thematic saturation.[14] Interviews were continued if new themes arose during this analysis. Data collection was ended once we ceased to extract new topics from participants. A summary of all themes was then presented to a group of 10 patients who met the same inclusion criteria for respondent validation and member checking. All reporting was performed within the Standards for Reporting Qualitative Research, with additional guidance derived from the Consolidated Criteria for Reporting Qualitative Research.[15, 16] The University of Chicago Institutional Review Board approved this protocol.
RESULTS
In total, 43 eligible patients were recruited, and 40 (93%) agreed to participate. Interviewed patients were between 51 and 65 (39%) years old, had a mean age of 54.5 (15) years, were predominantly female (65%), African American (58%), had a median length of stay at the time of interview of 6.5 days (interquartile range [IQR]: 48), and had an average of 2.0 (IQR: 13) hospitalists oversee their care at the time of interview (Table 1). Interview times ranged from 10:25 to 25:48 minutes, with an average of 15:32 minutes.
| Value | |
|---|---|
| |
| Response rate, n (%) | 40/43 (93) |
| Age, mean SD | 54.5 15 |
| Sex, n (%) | |
| Female | 26 (65) |
| Male | 14 (35) |
| Race, n (%) | |
| African American | 23 (58) |
| White | 16 (40) |
| Hispanic | 1 (2) |
| Median LOS at time of interview, d (IQR) | 6.5 (48) |
| Median no. of hospitalists at time of interview, n (IQR) | 2.0 (13) |
We identified 6 major themes on patient perceptions of hospitalist service handoffs including (1) physician‐patient communication, (2) transparency in the hospitalist transition process, (3) indifference toward the hospitalist transition, (4) hospitalist‐subspecialist communication, (5) recognition of new opportunities due to a transition, and (6) hospitalists' bedside manner (Table 2).
| Themes | Subthemes | Representative Quotes |
|---|---|---|
| Physician‐patient communication | Patients dislike redundant communication with oncoming hospitalist. | I mean it's just you always have to explain your situation over and over and over again. (patient 14) |
| When I said it once already, then you're repeating it to another doctor. I feel as if that hospitalist didn't talk to the other hospitalist. (patient 7) | ||
| Poor communication can negatively affect the doctor‐patient relationship. | They don't really want to explain things. They don't think I'll understand. I think & yeah, I'm okay. You don't even have to put it in layman's terms. I know medical. I'm in nursing school. I have a year left. But even if you didn't know that, I would still hope you would try to tell me what was going on instead of just doing it in your head, and treating it. (patient 2) | |
| I mean it's just you always have to explain your situation over and over and over again. After a while you just stop trusting them. (patient 20) | ||
| Good communication can positively affect the doctor‐patient relationship. | Just continue with the communication, the open communication, and always stress to me that I have a voice and just going out of their way to do whatever they can to help me through whatever I'm going through. (patient 1) | |
| Transparency in transition | Patients want to be informed prior to a service changeover. | I think they should be told immediately, even maybe given prior notice, like this may happen, just so you're not surprised when it happens. (patient 15) |
| When the doctor approached me, he let me know that he wasn't going to be here the next day and there was going to be another doctor coming in. That made me feel comfortable. (patient 9) | ||
| Patients desire a more formalized process in the service changeover. | People want things to be consistent. People don't like change. They like routine. So, if he's leaving, you're coming on, I'd like for him to bring you in, introduce you to me, and for you just assure me that I'll take care of you. (patient 4) | |
| Just like when you get a new medication, you're given all this information on it. So when you get a new hospitalist, shouldn't I get all the information on them? Like where they went to school, what they look like. (patient 23) | ||
| Patients want clearer definition of the roles the physicians will play in their care. | The first time I was hospitalized for the first time I had all these different doctors coming in, and I had the residency, and the specialists, and the department, and I don't know who's who. What I asked them to do is when they come in the room, which they did, but introduce it a little more for me. Write it down like these are the special team and these are the doctors because even though they come in and give me their name, I have no idea what they're doing. (patient 5) | |
| Someone should explain the setup and who people are. Someone would say, Okay when you're in a hospital this is your [doctor's] role. Like they should have booklets and everything. (patient 19) | ||
| Indifference toward transition | Many patients have trust in service changeovers. | [S]o as long as everybody's on board and communicates well and efficiently, I don't have a problem with it. (patient 6) |
| To me, it really wasn't no preference, as long as I was getting the care that I needed. (patient 21) | ||
| It's not a concern as long as they're on the same page. (patient 17) | ||
| Hospitalist‐specialist communication | Patients are concerned about communication between their hospitalist and their subspecialists. | The more cooks you get in the kitchen, the more things get to get lost, so I'm always concerned that they're not sharing the same information, especially when you're getting asked the same questions that you might have just answered the last hour ago. (patient 9) |
| I don't know if the hospitalist are talking to them [subspecialist]. They haven't got time. (patient 35) | ||
| Patients place trust in the communication between hospitalist and subspecialist. | I think among the teams themselveswhich is my pain doctor, Dr. K's group, the oncology group itself, they switch off and trade with each other and they all speak the same language so that works out good. (patient 3) | |
| Lack of interprofessional communication can lead to patient concern. | I was afraid that one was going to drop the ball on something and not pass something on, or you know. (patient 11) | |
| I had numerous doctors who all seemed to not communicate with each other at all or did so by email or whatever. They didn't just sit down together and say we feel this way and we feel that way. I didn't like that at all. (patient 10) | ||
| New opportunities due to transition | Patients see new doctor as opportunity for medical reevaluation. | I see it as two heads are better than one, three heads are better than one, four heads are better than one. When people put their heads together to work towards a common goal, especially when they're, you know, people working their craft, it can't be bad. (patient 9) |
| I finally got my ears looked atbecause I've asked to have my ears looked at since Mondayand the new doc is trying to make an effort to look at them. (patient 39) | ||
| Patients see service changeover as an opportunity to form a better personal relationship. | Having a new hospitalist it gives you opportunity for a new beginning. (patient 11) | |
| Bedside manner | Good bedside manner can assist in a service changeover. | Some of them are all business‐like but some of them are, Well how do you feel today? Hi, how are you? So this made a little difference. You feel more comfortable. You're going to be more comfortable with them. Their bedside manner helps. (patient 16) |
| It's just like when a doctor sits down and talks to you, they just seem more relaxed and more .... I know they're very busy and they have lots of things to do and other patients to see, but while they're in there with you, you know, you don't get too much time with them. So bedside manner is just so important. (patient 24) | ||
| Poor bedside manner can be detrimental in transition. | [B]ecause they be so busy they claim they don't have time just to sit and talk to a patient, and make sure they all right. (patient 17) |
Physician‐Patient Communication
Communication between the physician and the patient was an important element in patients' assessment of their experience. Patient's tended to divide physician‐patient communication into 2 categories: good communication, which consisted of open communication (patient 1) and patient engagement, and bad communication, which was described as physicians not sharing information or taking the time to explain the course of care in words that I'll understand (patient 2). Patients also described dissatisfaction with redundant communication between multiple hospitalists and the frustration of often having to describe their clinical course to multiple providers.
Transparency in Communication
The desire to have greater transparency in the handoff process was another common theme. This was likely due to the fact that 34/40 (85%) of surveyed patients were unaware that a service changeover had ever taken place. This lack of transparency was viewed to have further downstream consequences as patients stated that there should be a level of transparency, and when it's not, then there is always trust issues (patient 1). Upon further questioning as to how to make the process more transparent, many patients recommended a formalized, face‐to‐face introduction involving the patient and both hospitalists, in which the outgoing hospitalist would, bring you [oncoming hospitalist] in, and introduce you to me (patient 4).
Patients often stated that given the large spectrum of physicians they might encounter during their stay (ie, medical student, resident, hospitalist attending, subspecialty fellow, subspecialist attending), clearer definitions of physicians' roles are needed.
Hospitalist‐Specialist Communication
Concern about the communication between their hospitalist and subspecialist was another predominant theme. Conflicting and unclear directions from multiple services were especially frustrating, as a patient stated, One guy took me off this pill, the other guy wants me on that pill, I'm like okay, I can't do both (patient 8). Furthermore, a subset of patients referenced their subspecialist as their primary care provider and preferred their subspecialist for guidance in their hospital course, rather than their hospitalist. This often appeared in cases where the patient had an established relationship with the subspecialist prior to their hospitalization.
New Opportunities Due to Transition
Patients expressed positive feelings toward service handoffs by viewing the transition as an opportunity for medical reevaluation by a new physician. Patients told of instances in which a specific complaint was not being addressed by the first physician, but would be addressed by the second (oncoming) physician. A commonly expressed idea was that the oncoming physician might know something that he [Dr. B] didn't know, and since Dr. B was only here for a week, why not give him [oncoming hospitalist] a chance (patient 10). Patients would also describe the transition as an opportunity to form, and possibly improve, therapeutic alliances with a new hospitalist.
Bedside Manner
Bedside manner was another commonly mentioned thematic element. Patients were often quick to forget prior problems or issues that they may have suffered because of the transition if the oncoming physician was perceived to have a good bedside manner, often described as someone who formally introduced themselves, was considered relaxed, and would take the time to sit and talk with the patient. As a patient put it, [S]he sat down and got to know meand asked me what I wanted to do (patient 12). Conversely, patients described instances in which a perceived bad bedside manner led to a poor relationship between the physician and the patient, in which trust and comfort (patient 11) were sacrificed.
Indifference Toward Transition
In contrast to some of the previous findings, which called for improved interactions between physicians and patients, we also discovered a theme of indifference toward the transition. Several patients stated feelings of trust with the medical system, and were content with the service changeover as long as they felt that their medical needs were being met. Patients also tended to express a level of acceptance with the transition, and tended to believe that this was the price we pay for being here [in the hospital] (patient 7).
Conceptual Model
Following the collection and analysis of all patient responses, all themes were utilized to construct the ideal patient‐centered service handoff. The ideal transition describes open lines of communication between all involved parties, is facilitated by multiple modalities, such as the EHRs and nursing staff, and recognizes the patient as the primary stakeholder (Figure 1).
DISCUSSION
To our knowledge, this is the first qualitative investigation of the hospitalized patient's experience with service handoffs between hospitalists. The patient perspective adds a personal and first‐hand description of how fragmented care may impact the hospitalized patient experience.
Of the 6 themes, communication was found to be the most pertinent to our respondents. Because much of patient care is an inherently communicative activity, it is not surprising that patients, as well as patient safety experts, have focused on communication as an area in need of improvement in transition processes.[17, 18] Moreover, multiple medical societies have directly called for improvements within this area, and have specifically recommended clear and direct communication of treatment plans between the patient and physician, timely exchange of information, and knowledge of who is primarily in charge of the patients care.[11] Not surprisingly, each of these recommendations appears to be echoed by our participants. This theme is especially important given that good physician‐patient communication has been noted to be a major goal in achieving patient‐centered care, and has been positively correlated to medication adherence, patient satisfaction, and physical health outcomes.[19, 20, 21, 22, 23]
Although not a substitute for face‐to‐face interactions, other communication interventions between physicians and patients should be considered. For example, get to know me posters placed in patient rooms have been shown to encourage communication between patients and physicians.[24] Additionally, physician face cards have been used to improve patients' abilities to identify and clarify physicians' roles in patient care.[25] As a patient put it, If they got a new one [hospitalist], just as if I got a new medicationprint out information on themlike where they went to med school, and stuff(patient 13). These modalities may represent highly implementable, cost‐effective adjuncts to current handoff methods that may improve lines of communication between physicians and patients.
In addition to the importance placed on physician‐patient communication, interprofessional communication between hospitalists and subspecialists was also highly regarded. Studies have shown that practice‐based interprofessional communication, such as daily interdisciplinary rounds and the use of external facilitators, can improve healthcare processes and outcomes.[26] However, these interventions must be weighed with the many conflicting factors that both hospitalists and subspecialists face on daily basis, including high patient volumes, time limitations, patient availability, and scheduling conflicts.[27] None the less, the strong emphasis patients placed on this line of communication highlights this domain as an area in which hospitalist and subspecialist can work together for systematic improvement.
Patients also recognized the complexity of the transfer process between hospitalists and called for improved transparency. For example, patients repeatedly requested to be informed prior to any changes in their hospitalists, a request that remains consistent with current guidelines.[11] There also existed a strong desire for a more formalized process of transitioning between hospitalists, which often described a handoff procedure that would occur at the patient's bedside. This desire seems to be mirrored in the data that show that patients prefer to interact with their care team at the bedside and report higher satisfaction when they are involved with their care.[28, 29] Unfortunately, this desire for more direct interaction with physicians runs counter to the current paradigm of patient care, where most activities on rounds do not take place at the bedside.[30]
In contrast to patient's calls for improved transparency, an equally large portion of patients expressed relative indifference to the transition. Whereas on the surface this may seem salutary, some studies suggest that a lack of patient activation and engagement may have adverse effects toward patients' overall care.[31] Furthermore, others have shown evidence of better healthcare experiences, improved health outcomes, and lower costs in patients who are more active in their care.[30, 31] Altogether, this suggests that despite some patients' indifference, physicians should continue to engage patients in their hospital care.[32]
Although prevailing sentiments among patient safety advocates are that patient handoffs are inherently dangerous and place patients at increased risk of adverse events, patients did not always share this concern. A frequently occurring theme was that the transition is an opportunity for medical reevaluation or the establishment of a new, possibly improved therapeutic alliance. Recognizing this viewpoint offers oncoming hospitalists the opportunity to focus on issues that the patient may have felt were not being properly addressed with their prior physician.
Finally, although our conceptual model is not a strict guideline, we believe that any future studies should consider this framework when constructing interventions to improve service‐level handoffs. Several interventions already exist. For instance, educational interventions, such as patient‐centered interviewing, have been shown to improve patient satisfaction, compliance with medications, lead to fewer lawsuits, and improve health outcomes.[33, 34, 35] Additional methods of keeping the patient more informed include physician face sheets and performance of the handoff at the patient's bedside. Although well known in nursing literature, the idea of physicians performing handoffs at the patient's bedside is a particularly patient‐centric process.[36] This type of intervention may have the ability to transform the handoff from the current state of a 2‐way street, in which information is passed between 2 hospitalists, to a 3‐way stop, in which both hospitalists and the patient are able to communicate at this critical junction of care.
Although our study does offer new insight into the effects of discontinuous care, its exploratory nature does have limitations. First, being performed at a single academic center limits our ability to generalize our findings. Second, perspectives of those who did not wish to participate, patients' family members or caregivers, and those who were not queried, could highly differ from those we interviewed. Additionally, we did not collect data on patients' diagnoses or reason for admission, thus limiting our ability to assess if certain diagnosis or subpopulations predispose patients to experiencing a service handoff. Third, although our study was restricted to English‐speaking patients only, we must consider that non‐English speakers would likely suffer from even greater communication barriers than those who took part in our study. Finally, our interviews and data analysis were conducted by hospitalists, which could have subconsciously influenced the interview process, and the interpretation of patient responses. However, we tried to mitigate these issues by having the same individual interview all participants, by using an interview guide to ensure cross‐cohort consistency, by using open‐ended questions, and by attempting to give patients every opportunity to express themselves.
CONCLUSIONS
From a patients' perspective, inpatient service handoffs are often opaque experiences that are highlighted by poor communication between physicians and patients. Although deficits in communication and transparency acted as barriers to a patient‐centered handoff, physicians should recognize that service handoffs may also represent opportunities for improvement, and should focus on these domains when they start on a new service.
Disclosures
All funding for this project was provided by the Section of Hospital Medicine at The University of Chicago Medical Center. The data from this article were presented at the Society of Hospital Medicine Annual Conference, National Harbor, March 31, 2015, and at the Society of General Internal Medicine National Meeting in Toronto, Canada, April 23, 2015. The authors report that no conflicts of interest, financial or otherwise, exist.
- , , , , , . Continuity of outpatient and inpatient care by primary care physicians for hospitalized older adults. JAMA. 2009;301(16):1671–1680.
- , , , et al. Continuity of care and the risk of preventable hospitalization in older adults. JAMA Intern Med. 2013;173(20):1879–1885.
- Agency for Healthcare Research and Quality. HCUPnet: a tool for identifying, tracking, and analyzing national hospital statistics. Available at: http://hcupnet.ahrq.gov/HCUPnet.jsp?Id=82B37DA366A36BAD6(8):438–444.
- , , , , , . Hospitalist handoffs: a systematic review and task force recommendations. J Hosp Med. 2009;4(7):433–440.
- , , , , . The impact of fragmentation of hospitalist care on length of stay. J Hosp Med. 2010;5(6):335–338.
- , , , et al. The impact of hospitalist discontinuity on hospital cost, readmissions, and patient satisfaction. J Gen Intern Med. 2014;29(7):1004–1008.
- , , , et al. The effect of hospitalist discontinuity on adverse events. J Hosp Med. 2015;10(3):147–151.
- Agency for Healthcare Research and Quality. HCAHPS Fact Sheet. CAHPS Hospital Survey August 2013. Available at: http://www.hcahpsonline.org/files/August_2013_HCAHPS_Fact_Sheet3.pdf. Accessed February 2, 2015.
- , , , et al. A conceptual framework for studying the safety of transitions in emergency care. In: Henriksen K, Battles JB, Marks ES, eds. Advances in Patient Safety: From Research to Implementation. Rockville, MD: Agency for Healthcare Research and Quality; 2005:309–321. Concepts and Methodology; vol 2. Available at: http://www.ncbi.nlm.nih.gov/books/NBK20522. Accessed January 15, 2015.
- , , , et al. Transitions of care consensus policy statement American College of Physicians‐Society of General Internal Medicine‐Society of Hospital Medicine‐American Geriatrics Society‐American College of Emergency Physicians‐Society of Academic Emergency Medicine. J Gen Intern Med. 2009;24(8):971–976.
- , . Grounded theory in medical education research: AMEE guide no. 70. Med Teach. 2012;34(10):850–861.
- . A purposeful approach to the constant comparative method in the analysis of qualitative interviews. Qual Quant. 2002;36(4):391–409.
- . The significance of saturation. Qual Health Res. 1995;5(2):147–149.
- , , , , . Standards for reporting qualitative research: a synthesis of recommendations. Acad Med. 2014;89(9):1245–1251.
- , , . Consolidated criteria for reporting qualitative research (COREQ): a 32‐item checklist for interviews and focus groups. Int J Qual Health Care. 2007;19(6):349–357.
- , , , . Promoting effective transitions of care at hospital discharge: a review of key issues for hospitalists. J Hosp Med. 2007;2(5):314–323.
- The Joint Commission. Hot Topics in Healthcare, Issue 2. Transitions of care: the need for collaboration across entire care continuum. Available at: http://www.jointcommission.org/assets/1/6/TOC_Hot_Topics.pdf. Accessed April 9, 2015.
- , . Physician communication and patient adherence to treatment: a meta‐analysis. Med Care. 2009;47(8):826–834.
- , . Impediments to adherence to post myocardial infarction medications. Curr Cardiol Rep. 2013;15(1):322.
- , , , , . Medical specialists' patient‐centered communication and patient‐reported outcomes. Med Care. 2007;45(4):330–339.
- , , , . Does doctor‐patient communication affect patient satisfaction with hospital care? Results of an analysis with a novel instrumental variable. Health Serv Res. 2008;43(5 pt 1):1505–1519.
- , , . Patient‐centredness in chronic illness: what is it and does it matter? Patient Educ Couns. 2003;51(3):197–206.
- , , , et al. Merging cultures: palliative care specialists in the medical intensive care unit. Crit Care Med. 2006;34(11 suppl):S388–S393.
- , , , et al. Improving inpatients' identification of their doctors: use of FACE cards. Jt Comm J Qual Patient Saf. 2009;35(12):613–619.
- , , . Interprofessional collaboration: effects of practice‐based interventions on professional practice and healthcare outcomes. Cochrane Database Syst Rev. 2009;(3):CD000072.
- , , , et al. Identifying and overcoming the barriers to bedside rounds: a multicenter qualitative study. Acad Med. 2014;89(2):326–334.
- , , , , . The effect of bedside case presentations on patients' perceptions of their medical care. N Engl J Med. 1997;336(16):1150–1155.
- , , , . Patient‐centered interprofessional collaborative care: factors associated with bedside interprofessional rounds. J Gen Intern Med. 2014;29(7):1040–1047.
- , , , et al. Attending rounds in the current era: what is and is not happening. JAMA Intern Med. 2013;173(12):1084–1089.
- , . What the evidence shows about patient activation: better health outcomes and care experiences; fewer data on costs. Health Aff (Millwood). 2013;32(2):207–214.
- , , , , . When patient activation levels change, health outcomes and costs change, too. Health Aff Proj Hope. 2015;34(3):431–437.
- , , , et al. Evidence‐based guidelines for teaching patient‐centered interviewing. Patient Educ Couns. 2000;39(1):27–36.
- , , . Meta‐analysis of correlates of provider behavior in medical encounters. Med Care. 1988;26(7):657–675.
- , . Characteristics of potential plaintiffs in malpractice litigation. Ann Intern Med. 1994;120(9):792–798.
- , , , , . Bedside shift reports: what does the evidence say? J Nurs Adm. 2014;44(10):541–545.

Hospitalists Can Improve Healthcare Value
As the nation considers how to reduce healthcare costs, hospitalists can play a crucial role in this effort because they control many healthcare services through routine clinical decisions at the point of care. In fact, the government, payers, and the public now look to hospitalists as essential partners for reining in healthcare costs.[1, 2] The role of hospitalists is even more critical as payers, including Medicare, seek to shift reimbursements from volume to value.[1] Medicare's Value‐Based Purchasing program has already tied a percentage of hospital payments to metrics of quality, patient satisfaction, and cost,[1, 3] and Health and Human Services Secretary Sylvia Burwell announced that by the end of 2018, the goal is to have 50% of Medicare payments tied to quality or value through alternative payment models.[4]
Major opportunities for cost savings exist across the care continuum, particularly in postacute and transitional care, and hospitalist groups are leading innovative models that show promise for coordinating care and improving value.[5] Individual hospitalists are also in a unique position to provide high‐value care for their patients through advocating for appropriate care and leading local initiatives to improve value of care.[6, 7, 8] This commentary article aims to provide practicing hospitalists with a framework to incorporate these strategies into their daily work.
DESIGN STRATEGIES TO COORDINATE CARE
As delivery systems undertake the task of population health management, hospitalists will inevitably play a critical role in facilitating coordination between community, acute, and postacute care. During admission, discharge, and the hospitalization itself, standardizing care pathways for common hospital conditions such as pneumonia and cellulitis can be effective in decreasing utilization and improving clinical outcomes.[9, 10] Intermountain Healthcare in Utah has applied evidence‐based protocols to more than 60 clinical processes, re‐engineering roughly 80% of all care that they deliver.[11] These types of care redesigns and standardization promise to provide better, more efficient, and often safer care for more patients. Hospitalists can play important roles in developing and delivering on these pathways.
In addition, hospital physician discontinuity during admissions may lead to increased resource utilization, costs, and lower patient satisfaction.[12] Therefore, ensuring clear handoffs between inpatient providers, as well as with outpatient providers during transitions in care, is a vital component of delivering high‐value care. Of particular importance is the population of patients frequently readmitted to the hospital. Hospitalists are often well acquainted with these patients, and the myriad of psychosocial, economic, and environmental challenges this vulnerable population faces. Although care coordination programs are increasing in prevalence, data on their cost‐effectiveness are mixed, highlighting the need for testing innovations.[13] Certainly, hospitalists can be leaders adopting and documenting the effectiveness of spreading interventions that have been shown to be promising in improving care transitions at discharge, such as the Care Transitions Intervention, Project RED (Re‐Engineered Discharge), or the Transitional Care Model.[14, 15, 16]
The University of Chicago, through funding from the Centers for Medicare and Medicaid Innovation, is testing the use of a single physician who cares for frequently admitted patients both in and out of the hospital, thereby reducing the costs of coordination.[5] This comprehensivist model depends on physicians seeing patients in the hospital and then in a clinic located in or near the hospital for the subset of patients who stand to benefit most from this continuity. This differs from the old model of having primary care providers (PCPs) see inpatients and outpatients because the comprehensivist's patient panel is enriched with only patients who are at high risk for hospitalization, and thus these physicians have a more direct focus on hospital‐related care and higher daily hospitalized patient censuses, whereas PCPs were seeing fewer and fewer of their patients in the hospital on a daily basis. Evidence concerning the effectiveness of this model is expected by 2016. Hospitalists have also ventured out of the hospital into skilled nursing facilities, specializing in long‐term care.[17] These physicians are helping provide care to the roughly 1.6 million residents of US nursing homes.[17, 18] Preliminary evidence suggests increased physician staffing is associated with decreased hospitalization of nursing home residents.[18]
ADVOCATE FOR APPROPRIATE CARE
Hospitalists can advocate for appropriate care through avoiding low‐value services at the point of care, as well as learning and teaching about value.
Avoiding Low‐Value Services at the Point of Care
The largest contributor to the approximately $750 billion in annual healthcare waste is unnecessary services, which includes overuse, discretionary use beyond benchmarks, and unnecessary choice of higher‐cost services.[19] Drivers of overuse include medical culture, fee‐for‐service payments, patient expectations, and fear of malpractice litigation.[20] For practicing hospitalists, the most substantial motivation for overuse may be a desire to reassure patients and themselves.[21] Unfortunately, patients commonly overestimate the benefits and underestimate the potential harms of testing and treatments.[22] However, clear communication with patients can reduce overuse, underuse, and misuse.[23]
Specific targets for improving appropriate resource utilization may be identified from resources such as Choosing Wisely lists, guidelines, and appropriateness criteria. The Choosing Wisely campaign has brought together an unprecedented number of medical specialty societies to issue top five lists of things that physicians and patients should question (
| Adult Hospital Medicine Recommendations | Pediatric Hospital Medicine Recommendations |
|---|---|
| 1. Do not place, or leave in place, urinary catheters for incontinence or convenience, or monitoring of output for noncritically ill patients (acceptable indications: critical illness, obstruction, hospice, perioperatively for <2 days or urologic procedures; use weights instead to monitor diuresis). | 1. Do not order chest radiographs in children with uncomplicated asthma or bronchiolitis. |
| 2. Do not prescribe medications for stress ulcer prophylaxis to medical inpatients unless at high risk for gastrointestinal complication. | 2. Do not routinely use bronchodilators in children with bronchiolitis. |
| 3. Avoid transfusing red blood cells just because hemoglobin levels are below arbitrary thresholds such as 10, 9, or even 8 mg/dL in the absence of symptoms. | 3. Do not use systemic corticosteroids in children under 2 years of age with an uncomplicated lower respiratory tract infection. |
| 4. Avoid overuse/unnecessary use of telemetry monitoring in the hospital, particularly for patients at low risk for adverse cardiac outcomes. | 4. Do not treat gastroesophageal reflux in infants routinely with acid suppression therapy. |
| 5. Do not perform repetitive complete blood count and chemistry testing in the face of clinical and lab stability. | 5. Do not use continuous pulse oximetry routinely in children with acute respiratory illness unless they are on supplemental oxygen. |
As an example of this strategy, 1 multi‐institutional group has started training medical students to augment the traditional subjective‐objective‐assessment‐plan (SOAP) daily template with a value section (SOAP‐V), creating a cognitive forcing function to promote discussion of high‐value care delivery.[28] Physicians could include brief thoughts in this section about why they chose a specific intervention, their consideration of the potential benefits and harms compared to alternatives, how it may incorporate the patient's goals and values, and the known and potential costs of the intervention. Similarly, Flanders and Saint recommend that daily progress notes and sign‐outs include the indication, day of administration, and expected duration of therapy for all antimicrobial treatments, as a mechanism for curbing antimicrobial overuse in hospitalized patients.[29] Likewise, hospitalists can also document whether or not a patient needs routine labs, telemetry, continuous pulse oximetry, or other interventions or monitoring. It is not yet clear how effective this type of strategy will be, and drawbacks include creating longer progress notes and requiring more time for documentation. Another approach would be to work with the electronic health record to flag patients who are scheduled for telemetry or other potentially wasteful practices to inspire a daily practice audit to question whether the patient still meets criteria for such care. This approach acknowledges that patient's clinical status changes, and overcomes the inertia that results in so many therapies being continued despite a need or indication.
Communicating With Patients Who Want Everything
Some patients may be more worried about not getting every possible test, rather than concerns regarding associated costs. This may oftentimes be related to patients routinely overestimating the benefits of testing and treatments while not realizing the many potential downstream harms.[22] The perception is that patient demands frequently drive overtesting, but studies suggest the demanding patient is actually much less common than most physicians think.[30]
The Choosing Wisely campaign features video modules that provide a framework and specific examples for physician‐patient communication around some of the Choosing Wisely recommendations (available at:
Clinicians can explain why they do not believe that a test will help a patient and can share their concerns about the potential harms and downstream consequences of a given test. In addition, Consumer Reports and other groups have created trusted resources for patients that provide clear information for the public about unnecessary testing and services.
Learn and Teach Value
Traditionally, healthcare costs have largely remained hidden from both the public and medical professionals.[31, 32] As a result, hospitalists are generally not aware of the costs associated with their care.[33, 34] Although medical education has historically avoided the topic of healthcare costs,[35] recent calls to teach healthcare value have led to new educational efforts.[35, 36, 37] Future generations of medical professionals will be trained in these skills, but current hospitalists should seek opportunities to improve their knowledge of healthcare value and costs.
Fortunately, several resources can fill this gap. In addition to Choosing Wisely and ACR appropriateness criteria discussed above, newer tools focus on how to operationalize these recommendations with patients. The American College of Physicians (ACP) has launched a high‐value care educational platform that includes clinical recommendations, physician resources, curricula and public policy recommendations, and patient resources to help them understand the benefits, harms, and costs of tests and treatments for common clinical issues (
In an effort to provide frontline clinicians with the knowledge and tools necessary to address healthcare value, we have authored a textbook, Understanding Value‐Based Healthcare.[38] To identify the most promising ways of teaching these concepts, we also host the annual Teaching Value & Choosing Wisely Challenge and convene the Teaching Value in Healthcare Learning Network (bit.ly/teachingvaluenetwork) through our nonprofit, Costs of Care.[39]
In addition, hospitalists can also advocate for greater price transparency to help improve cost awareness and drive more appropriate care. The evidence on the effect of transparent costs in the electronic ordering system is evolving. Historically, efforts to provide diagnostic test prices at time of order led to mixed results,[40] but recent studies show clear benefits in resource utilization related to some form of cost display.[41, 42] This may be because physicians care more about healthcare costs and resource utilization than before. Feldman and colleagues found in a controlled clinical trial at Johns Hopkins that providing the costs of lab tests resulted in substantial decreases of certain lab tests and yielded a net cost reduction (based on 2011 Medicare Allowable Rate) of more than $400,000 at the hospital level during the 6‐month intervention period.[41] A recent systematic review concluded that charge information changed ordering and prescribing behavior in the majority of studies.[42] Some hospitalist programs are developing dashboards for various quality and utilization metrics. Sharing ratings or metrics internally or publically is a powerful way to motivate behavior change.[43]
LEAD LOCAL VALUE INITIATIVES
Hospitalists are ideal leaders of local value initiatives, whether it be through running value‐improvement projects or launching formal high‐value care programs.
Conduct Value‐Improvement Projects
Hospitalists across the country have largely taken the lead on designing value‐improvement pilots, programs, and groups within hospitals. Although value‐improvement projects may be built upon the established structures and techniques for quality improvement, importantly these programs should also include expertise in cost analyses.[8] Furthermore, some traditional quality‐improvement programs have failed to result in actual cost savings[44]; thus, it is not enough to simply rebrand quality improvement with a banner of value. Value‐improvement efforts must overcome the cultural hurdle of more care as better care, as well as pay careful attention to the diplomacy required with value improvement, because reducing costs may result in decreased revenue for certain departments or even decreases in individuals' wages.
One framework that we have used to guide value‐improvement project design is COST: culture, oversight accountability, system support, and training.[45] This approach leverages principles from implementation science to ensure that value‐improvement projects successfully provide multipronged tactics for overcoming the many barriers to high‐value care delivery. Figure 1 includes a worksheet for individual clinicians or teams to use when initially planning value‐improvement project interventions.[46] The examples in this worksheet come from a successful project at the University of California, San Francisco aimed at improving blood utilization stewardship by supporting adherence to a restrictive transfusion strategy. To address culture, a hospital‐wide campaign was led by physician peer champions to raise awareness about appropriate transfusion practices. This included posters that featured prominent local physician leaders displaying their support for the program. Oversight was provided through regular audit and feedback. Each month the number of patients on the medicine service who received transfusion with a pretransfusion hemoglobin above 8 grams per deciliter was shared at a faculty lunch meeting and shown on a graph included in the quality newsletter that was widely distributed in the hospital. The ordering system in the electronic medical record was eventually modified to include the patient's pretransfusion hemoglobin level at time of transfusion order and to provide default options and advice based on whether or not guidelines would generally recommend transfusion. Hospitalists and resident physicians were trained through multiple lectures and informal teaching settings about the rationale behind the changes and the evidence that supported a restrictive transfusion strategy.
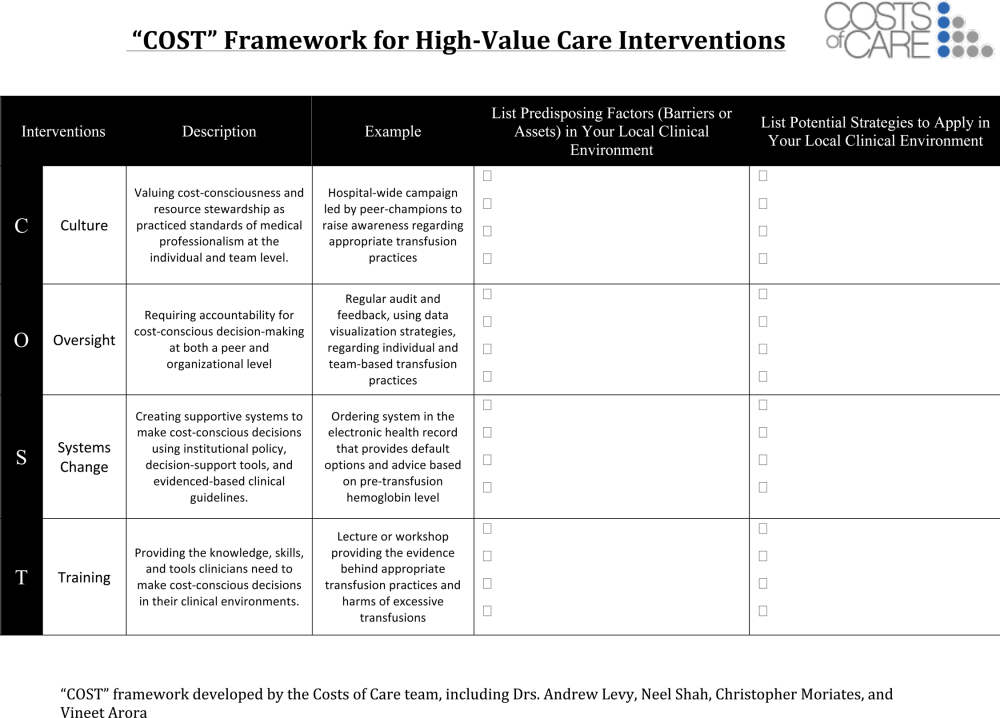
Launch High‐Value Care Programs
As value‐improvement projects grow, some institutions have created high‐value care programs and infrastructure. In March 2012, the University of California, San Francisco Division of Hospital Medicine launched a high‐value care program to promote healthcare value and clinician engagement.[8] The program was led by clinical hospitalists alongside a financial administrator, and aimed to use financial data to identify areas with clear evidence of waste, create evidence‐based interventions that would simultaneously improve quality while cutting costs, and pair interventions with cost awareness education and culture change efforts. In the first year of this program, 6 projects were launched targeting: (1) nebulizer to inhaler transitions,[47] (2) overuse of proton pump inhibitor stress ulcer prophlaxis,[48] (3) transfusions, (4) telemetry, (5) ionized calcium lab ordering, and (6) repeat inpatient echocardiograms.[8]
Similar hospitalist‐led groups have now formed across the country including the Johns Hopkins High‐Value Care Committee, Johns Hopkins Bayview Physicians for Responsible Ordering, and High‐Value Carolina. These groups are relatively new, and best practices and early lessons are still emerging, but all focus on engaging frontline clinicians in choosing targets and leading multipronged intervention efforts.
What About Financial Incentives?
Hospitalist high‐value care groups thus far have mostly focused on intrinsic motivations for decreasing waste by appealing to hospitalists' sense of professionalism and their commitment to improve patient affordability. When financial incentives are used, it is important that they are well aligned with internal motivations for clinicians to provide the best possible care to their patients. The Institute of Medicine recommends that payments are structured in a way to reward continuous learning and improvement in the provision of best care at lower cost.[19] In the Geisinger Health System in Pennsylvania, physician incentives are designed to reward teamwork and collaboration. For example, endocrinologists' goals are based on good control of glucose levels for all diabetes patients in the system, not just those they see.[49] Moreover, a collaborative approach is encouraged by bringing clinicians together across disciplinary service lines to plan, budget, and evaluate one another's performance. These efforts are partly credited with a 43% reduction in hospitalized days and $100 per member per month in savings among diabetic patients.[50]
Healthcare leaders, Drs. Tom Lee and Toby Cosgrove, have made a number of recommendations for creating incentives that lead to sustainable changes in care delivery[49]: avoid attaching large sums to any single target, watch for conflicts of interest, reward collaboration, and communicate the incentive program and goals clearly to clinicians.
In general, when appropriate extrinsic motivators align or interact synergistically with intrinsic motivation, it can promote high levels of performance and satisfaction.[51]
CONCLUSIONS
Hospitalists are now faced with a responsibility to reduce financial harm and provide high‐value care. To achieve this goal, hospitalist groups are developing innovative models for care across the continuum from hospital to home, and individual hospitalists can advocate for appropriate care and lead value‐improvement initiatives in hospitals. Through existing knowledge and new frameworks and tools that specifically address value, hospitalists can champion value at the bedside and ensure their patients get the best possible care at lower costs.
Disclosures: Drs. Moriates, Shah, and Arora have received grant funding from the ABIM Foundation, and royalties from McGraw‐Hill for the textbook Understanding Value‐Based Healthcare. The authors report no conflicts of interest.
- , . Value‐based purchasing—national programs to move from volume to value. N Engl J Med. 2012;367(4):292–295.
- . Value‐driven health care: implications for hospitals and hospitalists. J Hosp Med. 2009;4(8):507–511.
- , . Hospital value‐based purchasing. J Hosp Med. 2013;8(5):271–277.
- . Setting value‐based payment goals—HHS efforts to improve U.S. health care. N Engl J Med. 2015;372(10):897–899.
- , . Redesigning care for patients at increased hospitalization risk: the Comprehensive Care Physician model. Health Aff Proj Hope. 2014;33(5):770–777.
- , , , et al. Choosing wisely in adult hospital medicine: five opportunities for improved healthcare value. J Hosp Med. 2013;8(9):486–492.
- , , . First, do no (financial) harm. JAMA. 2013;310(6):577–578.
- , , , . Development of a hospital‐based program focused on improving healthcare value. J Hosp Med. 2014;9(10):671–677.
- , , , et al. A controlled trial of a critical pathway for treatment of community‐acquired pneumonia. JAMA. 2000;283(6):749–755.
- , , , , . Evidence‐based care pathway for cellulitis improves process, clinical, and cost outcomes [published online July 28, 2015]. J Hosp Med. doi:10.1002/jhm.2433.
- . The Lean approach to health care: safety, quality, and cost. Institute of Medicine. Available at: http://nam.edu/perspectives‐2012‐the‐lean‐approach‐to‐health‐care‐safety‐quality‐and‐cost/. Accessed September 22, 2015.
- , , , et al. The impact of hospitalist discontinuity on hospital cost, readmissions, and patient satisfaction. J Gen Intern Med. 2014;29(7):1004–1008.
- Congressional Budget Office. Lessons from Medicare's Demonstration Projects on Disease Management, Care Coordination, and Value‐Based Payment. Available at: https://www.cbo.gov/publication/42860. Accessed April 26, 2015.
- , , , et al. A reengineered hospital discharge program to decrease rehospitalization: a randomized trial. Ann Intern Med. 2009;150(3):178–187.
- , , , . The care transitions intervention: results of a randomized controlled trial. Arch Intern Med. 2006;166(17):1822–1828.
- , , , et al. Comprehensive discharge planning and home follow‐up of hospitalized elders: a randomized clinical trial. JAMA. 1999;281(7):613–620.
- . “SNFists” at work: nursing home docs patterned after hospitalists. Mod Healthc. 2012;42(13):32–33.
- , , , . Nursing home physician specialists: a response to the workforce crisis in long‐term care. Ann Intern Med. 2009;150(6):411–413.
- Institute of Medicine. Best Care at Lower Cost: The Path to Continuously Learning Health Care in America. Washington, DC: National Academies Press; 2012.
- , . The perfect storm of overutilization. JAMA. 2008;299(23):2789–2791.
- , , , et al. Overuse of testing in preoperative evaluation and syncope: a survey of hospitalists. Ann Intern Med. 2015;162(2):100–108.
- , . Patients' expectations of the benefits and harms of treatments, screening, and tests: a systematic review. JAMA Intern Med. 2015;175(2):274–286.
- , , , et al. Enhancing the Use and Quality of Colorectal Cancer Screening. Rockville, MD: Agency for Healthcare Research and Quality; 2010. Available at: http://www.ncbi.nlm.nih.gov/books/NBK44526. Accessed September 30, 2013.
- , , , et al. Choosing wisely in pediatric hospital medicine: five opportunities for improved healthcare value. J Hosp Med. 2013;8(9):479–485.
- . Teaching Choosing Wisely in medical education and training: the story of a pioneer. The Medical Professionalism Blog. Available at: http://blog.abimfoundation.org/teaching‐choosing‐wisely‐in‐meded. Accessed March 29, 2014.
- American College of Radiology. ACR appropriateness criteria overview. November 2013. Available at: http://www.acr.org/∼/media/ACR/Documents/AppCriteria/Overview.pdf. Accessed March 4, 2014.
- American College of Cardiology Foundation. Appropriate use criteria: what you need to know. Available at: http://www.cardiosource.org/∼/media/Files/Science%20and%20Quality/Quality%20Programs/FOCUS/E1302_AUC_Primer_Update.ashx. Accessed March 4, 2014.
- , , , , . SOAP‐V: applying high‐value care during patient care. The Medical Professionalism Blog. Available at: http://blog.abimfoundation.org/soap‐v‐applying‐high‐value‐care‐during‐patient‐care. Accessed April 3, 2015.
- , . Why does antimicrobial overuse in hospitalized patients persist? JAMA Intern Med. 2014;174(5):661–662.
- . The myth of the demanding patient. JAMA Oncol. 2015;1(1):18–19.
- . The disruptive innovation of price transparency in health care. JAMA. 2013;310(18):1927–1928.
- United States Government Accountability Office. Health Care Price Transparency—Meaningful Price Information Is Difficult for Consumers to Obtain Prior to Receiving Care. Washington, DC: United States Government Accountability Office; 2011:43.
- , , . General pediatric attending physicians' and residents' knowledge of inpatient hospital finances. Pediatrics. 2013;131(6):1072–1080.
- , , . Hospitalists' awareness of patient charges associated with inpatient care. J Hosp Med. 2010;5(5):295–297.
- . Cost consciousness in patient care—what is medical education's responsibility? N Engl J Med. 2010;362(14):1253–1255.
- . Providing high‐value, cost‐conscious care: a critical seventh general competency for physicians. Ann Intern Med. 2011;155(6):386–388.
- , , , . Defining competencies for education in health care value: recommendations from the University of California, San Francisco Center for Healthcare Value Training Initiative. Acad Med. 2015;90(4):421–424.
- , , . Understanding Value‐Based Healthcare. New York: McGraw‐Hill; 2015.
- , , , . Wisdom of the crowd: bright ideas and innovations from the teaching value and choosing wisely challenge. Acad Med. 2015;90(5):624–628.
- , , , et al. Does the computerized display of charges affect inpatient ancillary test utilization? Arch Intern Med. 1997;157(21):2501–2508.
- , , , et al. Impact of providing fee data on laboratory test ordering: a controlled clinical trial. JAMA Intern Med. 2013;173(10):903–908.
- , , , . The effect of charge display on cost of care and physician practice behaviors: a systematic review. J Gen Intern Med. 2015;30(6):835–842.
- , , , , , . Closing the Quality Gap: Revisiting the State of the Science. Vol. 5. Public Reporting as a Quality Improvement Strategy. Rockville, MD: Agency for Healthcare Research and Quality; 2012.
- , , , . The savings illusion—why clinical quality improvement fails to deliver bottom‐line results. N Engl J Med. 2011;365(26):e48.
- , , , . Fostering value in clinical practice among future physicians: time to consider COST. Acad Med. 2014;89(11):1440.
- , , , , , . The Teaching Value Workshop. MedEdPORTAL Publications; 2014. Available at: https://www.mededportal.org/publication/9859. Accessed September 22, 2015.
- , , , , . “Nebs no more after 24”: a pilot program to improve the use of appropriate respiratory therapies. JAMA Intern Med. 2013;173(17):1647–1648.
- , , , et al. The development and implementation of a bundled quality improvement initiative to reduce inappropriate stress ulcer prophylaxis. ICU Dir. 2013;4(6):322–325.
- , . Engaging doctors in the health care revolution. Harvard Business Review. June 2014. Available at: http://hbr.org/2014/06/engaging‐doctors‐in‐the‐health‐care‐revolution/ar/1. Accessed July 30, 2014.
- , , . Geisinger Health System: achieving the potential of system integration through innovation, leadership, measurement, and incentives. June 2009. Available at: http://www.commonwealthfund.org/publications/case‐studies/2009/jun/geisinger‐health‐system‐achieving‐the‐potential‐of‐system‐integration. Accessed September 22, 2015.
- Motivational synergy: toward new conceptualizations of intrinsic and extrinsic motivation in the workplace. Hum Resource Manag 1993;3(3):185–201. Available at: http://www.hbs.edu/faculty/Pages/item.aspx?num=2500. Accessed July 31, 2014.
As the nation considers how to reduce healthcare costs, hospitalists can play a crucial role in this effort because they control many healthcare services through routine clinical decisions at the point of care. In fact, the government, payers, and the public now look to hospitalists as essential partners for reining in healthcare costs.[1, 2] The role of hospitalists is even more critical as payers, including Medicare, seek to shift reimbursements from volume to value.[1] Medicare's Value‐Based Purchasing program has already tied a percentage of hospital payments to metrics of quality, patient satisfaction, and cost,[1, 3] and Health and Human Services Secretary Sylvia Burwell announced that by the end of 2018, the goal is to have 50% of Medicare payments tied to quality or value through alternative payment models.[4]
Major opportunities for cost savings exist across the care continuum, particularly in postacute and transitional care, and hospitalist groups are leading innovative models that show promise for coordinating care and improving value.[5] Individual hospitalists are also in a unique position to provide high‐value care for their patients through advocating for appropriate care and leading local initiatives to improve value of care.[6, 7, 8] This commentary article aims to provide practicing hospitalists with a framework to incorporate these strategies into their daily work.
DESIGN STRATEGIES TO COORDINATE CARE
As delivery systems undertake the task of population health management, hospitalists will inevitably play a critical role in facilitating coordination between community, acute, and postacute care. During admission, discharge, and the hospitalization itself, standardizing care pathways for common hospital conditions such as pneumonia and cellulitis can be effective in decreasing utilization and improving clinical outcomes.[9, 10] Intermountain Healthcare in Utah has applied evidence‐based protocols to more than 60 clinical processes, re‐engineering roughly 80% of all care that they deliver.[11] These types of care redesigns and standardization promise to provide better, more efficient, and often safer care for more patients. Hospitalists can play important roles in developing and delivering on these pathways.
In addition, hospital physician discontinuity during admissions may lead to increased resource utilization, costs, and lower patient satisfaction.[12] Therefore, ensuring clear handoffs between inpatient providers, as well as with outpatient providers during transitions in care, is a vital component of delivering high‐value care. Of particular importance is the population of patients frequently readmitted to the hospital. Hospitalists are often well acquainted with these patients, and the myriad of psychosocial, economic, and environmental challenges this vulnerable population faces. Although care coordination programs are increasing in prevalence, data on their cost‐effectiveness are mixed, highlighting the need for testing innovations.[13] Certainly, hospitalists can be leaders adopting and documenting the effectiveness of spreading interventions that have been shown to be promising in improving care transitions at discharge, such as the Care Transitions Intervention, Project RED (Re‐Engineered Discharge), or the Transitional Care Model.[14, 15, 16]
The University of Chicago, through funding from the Centers for Medicare and Medicaid Innovation, is testing the use of a single physician who cares for frequently admitted patients both in and out of the hospital, thereby reducing the costs of coordination.[5] This comprehensivist model depends on physicians seeing patients in the hospital and then in a clinic located in or near the hospital for the subset of patients who stand to benefit most from this continuity. This differs from the old model of having primary care providers (PCPs) see inpatients and outpatients because the comprehensivist's patient panel is enriched with only patients who are at high risk for hospitalization, and thus these physicians have a more direct focus on hospital‐related care and higher daily hospitalized patient censuses, whereas PCPs were seeing fewer and fewer of their patients in the hospital on a daily basis. Evidence concerning the effectiveness of this model is expected by 2016. Hospitalists have also ventured out of the hospital into skilled nursing facilities, specializing in long‐term care.[17] These physicians are helping provide care to the roughly 1.6 million residents of US nursing homes.[17, 18] Preliminary evidence suggests increased physician staffing is associated with decreased hospitalization of nursing home residents.[18]
ADVOCATE FOR APPROPRIATE CARE
Hospitalists can advocate for appropriate care through avoiding low‐value services at the point of care, as well as learning and teaching about value.
Avoiding Low‐Value Services at the Point of Care
The largest contributor to the approximately $750 billion in annual healthcare waste is unnecessary services, which includes overuse, discretionary use beyond benchmarks, and unnecessary choice of higher‐cost services.[19] Drivers of overuse include medical culture, fee‐for‐service payments, patient expectations, and fear of malpractice litigation.[20] For practicing hospitalists, the most substantial motivation for overuse may be a desire to reassure patients and themselves.[21] Unfortunately, patients commonly overestimate the benefits and underestimate the potential harms of testing and treatments.[22] However, clear communication with patients can reduce overuse, underuse, and misuse.[23]
Specific targets for improving appropriate resource utilization may be identified from resources such as Choosing Wisely lists, guidelines, and appropriateness criteria. The Choosing Wisely campaign has brought together an unprecedented number of medical specialty societies to issue top five lists of things that physicians and patients should question (
| Adult Hospital Medicine Recommendations | Pediatric Hospital Medicine Recommendations |
|---|---|
| 1. Do not place, or leave in place, urinary catheters for incontinence or convenience, or monitoring of output for noncritically ill patients (acceptable indications: critical illness, obstruction, hospice, perioperatively for <2 days or urologic procedures; use weights instead to monitor diuresis). | 1. Do not order chest radiographs in children with uncomplicated asthma or bronchiolitis. |
| 2. Do not prescribe medications for stress ulcer prophylaxis to medical inpatients unless at high risk for gastrointestinal complication. | 2. Do not routinely use bronchodilators in children with bronchiolitis. |
| 3. Avoid transfusing red blood cells just because hemoglobin levels are below arbitrary thresholds such as 10, 9, or even 8 mg/dL in the absence of symptoms. | 3. Do not use systemic corticosteroids in children under 2 years of age with an uncomplicated lower respiratory tract infection. |
| 4. Avoid overuse/unnecessary use of telemetry monitoring in the hospital, particularly for patients at low risk for adverse cardiac outcomes. | 4. Do not treat gastroesophageal reflux in infants routinely with acid suppression therapy. |
| 5. Do not perform repetitive complete blood count and chemistry testing in the face of clinical and lab stability. | 5. Do not use continuous pulse oximetry routinely in children with acute respiratory illness unless they are on supplemental oxygen. |
As an example of this strategy, 1 multi‐institutional group has started training medical students to augment the traditional subjective‐objective‐assessment‐plan (SOAP) daily template with a value section (SOAP‐V), creating a cognitive forcing function to promote discussion of high‐value care delivery.[28] Physicians could include brief thoughts in this section about why they chose a specific intervention, their consideration of the potential benefits and harms compared to alternatives, how it may incorporate the patient's goals and values, and the known and potential costs of the intervention. Similarly, Flanders and Saint recommend that daily progress notes and sign‐outs include the indication, day of administration, and expected duration of therapy for all antimicrobial treatments, as a mechanism for curbing antimicrobial overuse in hospitalized patients.[29] Likewise, hospitalists can also document whether or not a patient needs routine labs, telemetry, continuous pulse oximetry, or other interventions or monitoring. It is not yet clear how effective this type of strategy will be, and drawbacks include creating longer progress notes and requiring more time for documentation. Another approach would be to work with the electronic health record to flag patients who are scheduled for telemetry or other potentially wasteful practices to inspire a daily practice audit to question whether the patient still meets criteria for such care. This approach acknowledges that patient's clinical status changes, and overcomes the inertia that results in so many therapies being continued despite a need or indication.
Communicating With Patients Who Want Everything
Some patients may be more worried about not getting every possible test, rather than concerns regarding associated costs. This may oftentimes be related to patients routinely overestimating the benefits of testing and treatments while not realizing the many potential downstream harms.[22] The perception is that patient demands frequently drive overtesting, but studies suggest the demanding patient is actually much less common than most physicians think.[30]
The Choosing Wisely campaign features video modules that provide a framework and specific examples for physician‐patient communication around some of the Choosing Wisely recommendations (available at:
Clinicians can explain why they do not believe that a test will help a patient and can share their concerns about the potential harms and downstream consequences of a given test. In addition, Consumer Reports and other groups have created trusted resources for patients that provide clear information for the public about unnecessary testing and services.
Learn and Teach Value
Traditionally, healthcare costs have largely remained hidden from both the public and medical professionals.[31, 32] As a result, hospitalists are generally not aware of the costs associated with their care.[33, 34] Although medical education has historically avoided the topic of healthcare costs,[35] recent calls to teach healthcare value have led to new educational efforts.[35, 36, 37] Future generations of medical professionals will be trained in these skills, but current hospitalists should seek opportunities to improve their knowledge of healthcare value and costs.
Fortunately, several resources can fill this gap. In addition to Choosing Wisely and ACR appropriateness criteria discussed above, newer tools focus on how to operationalize these recommendations with patients. The American College of Physicians (ACP) has launched a high‐value care educational platform that includes clinical recommendations, physician resources, curricula and public policy recommendations, and patient resources to help them understand the benefits, harms, and costs of tests and treatments for common clinical issues (
In an effort to provide frontline clinicians with the knowledge and tools necessary to address healthcare value, we have authored a textbook, Understanding Value‐Based Healthcare.[38] To identify the most promising ways of teaching these concepts, we also host the annual Teaching Value & Choosing Wisely Challenge and convene the Teaching Value in Healthcare Learning Network (bit.ly/teachingvaluenetwork) through our nonprofit, Costs of Care.[39]
In addition, hospitalists can also advocate for greater price transparency to help improve cost awareness and drive more appropriate care. The evidence on the effect of transparent costs in the electronic ordering system is evolving. Historically, efforts to provide diagnostic test prices at time of order led to mixed results,[40] but recent studies show clear benefits in resource utilization related to some form of cost display.[41, 42] This may be because physicians care more about healthcare costs and resource utilization than before. Feldman and colleagues found in a controlled clinical trial at Johns Hopkins that providing the costs of lab tests resulted in substantial decreases of certain lab tests and yielded a net cost reduction (based on 2011 Medicare Allowable Rate) of more than $400,000 at the hospital level during the 6‐month intervention period.[41] A recent systematic review concluded that charge information changed ordering and prescribing behavior in the majority of studies.[42] Some hospitalist programs are developing dashboards for various quality and utilization metrics. Sharing ratings or metrics internally or publically is a powerful way to motivate behavior change.[43]
LEAD LOCAL VALUE INITIATIVES
Hospitalists are ideal leaders of local value initiatives, whether it be through running value‐improvement projects or launching formal high‐value care programs.
Conduct Value‐Improvement Projects
Hospitalists across the country have largely taken the lead on designing value‐improvement pilots, programs, and groups within hospitals. Although value‐improvement projects may be built upon the established structures and techniques for quality improvement, importantly these programs should also include expertise in cost analyses.[8] Furthermore, some traditional quality‐improvement programs have failed to result in actual cost savings[44]; thus, it is not enough to simply rebrand quality improvement with a banner of value. Value‐improvement efforts must overcome the cultural hurdle of more care as better care, as well as pay careful attention to the diplomacy required with value improvement, because reducing costs may result in decreased revenue for certain departments or even decreases in individuals' wages.
One framework that we have used to guide value‐improvement project design is COST: culture, oversight accountability, system support, and training.[45] This approach leverages principles from implementation science to ensure that value‐improvement projects successfully provide multipronged tactics for overcoming the many barriers to high‐value care delivery. Figure 1 includes a worksheet for individual clinicians or teams to use when initially planning value‐improvement project interventions.[46] The examples in this worksheet come from a successful project at the University of California, San Francisco aimed at improving blood utilization stewardship by supporting adherence to a restrictive transfusion strategy. To address culture, a hospital‐wide campaign was led by physician peer champions to raise awareness about appropriate transfusion practices. This included posters that featured prominent local physician leaders displaying their support for the program. Oversight was provided through regular audit and feedback. Each month the number of patients on the medicine service who received transfusion with a pretransfusion hemoglobin above 8 grams per deciliter was shared at a faculty lunch meeting and shown on a graph included in the quality newsletter that was widely distributed in the hospital. The ordering system in the electronic medical record was eventually modified to include the patient's pretransfusion hemoglobin level at time of transfusion order and to provide default options and advice based on whether or not guidelines would generally recommend transfusion. Hospitalists and resident physicians were trained through multiple lectures and informal teaching settings about the rationale behind the changes and the evidence that supported a restrictive transfusion strategy.
Launch High‐Value Care Programs
As value‐improvement projects grow, some institutions have created high‐value care programs and infrastructure. In March 2012, the University of California, San Francisco Division of Hospital Medicine launched a high‐value care program to promote healthcare value and clinician engagement.[8] The program was led by clinical hospitalists alongside a financial administrator, and aimed to use financial data to identify areas with clear evidence of waste, create evidence‐based interventions that would simultaneously improve quality while cutting costs, and pair interventions with cost awareness education and culture change efforts. In the first year of this program, 6 projects were launched targeting: (1) nebulizer to inhaler transitions,[47] (2) overuse of proton pump inhibitor stress ulcer prophlaxis,[48] (3) transfusions, (4) telemetry, (5) ionized calcium lab ordering, and (6) repeat inpatient echocardiograms.[8]
Similar hospitalist‐led groups have now formed across the country including the Johns Hopkins High‐Value Care Committee, Johns Hopkins Bayview Physicians for Responsible Ordering, and High‐Value Carolina. These groups are relatively new, and best practices and early lessons are still emerging, but all focus on engaging frontline clinicians in choosing targets and leading multipronged intervention efforts.
What About Financial Incentives?
Hospitalist high‐value care groups thus far have mostly focused on intrinsic motivations for decreasing waste by appealing to hospitalists' sense of professionalism and their commitment to improve patient affordability. When financial incentives are used, it is important that they are well aligned with internal motivations for clinicians to provide the best possible care to their patients. The Institute of Medicine recommends that payments are structured in a way to reward continuous learning and improvement in the provision of best care at lower cost.[19] In the Geisinger Health System in Pennsylvania, physician incentives are designed to reward teamwork and collaboration. For example, endocrinologists' goals are based on good control of glucose levels for all diabetes patients in the system, not just those they see.[49] Moreover, a collaborative approach is encouraged by bringing clinicians together across disciplinary service lines to plan, budget, and evaluate one another's performance. These efforts are partly credited with a 43% reduction in hospitalized days and $100 per member per month in savings among diabetic patients.[50]
Healthcare leaders, Drs. Tom Lee and Toby Cosgrove, have made a number of recommendations for creating incentives that lead to sustainable changes in care delivery[49]: avoid attaching large sums to any single target, watch for conflicts of interest, reward collaboration, and communicate the incentive program and goals clearly to clinicians.
In general, when appropriate extrinsic motivators align or interact synergistically with intrinsic motivation, it can promote high levels of performance and satisfaction.[51]
CONCLUSIONS
Hospitalists are now faced with a responsibility to reduce financial harm and provide high‐value care. To achieve this goal, hospitalist groups are developing innovative models for care across the continuum from hospital to home, and individual hospitalists can advocate for appropriate care and lead value‐improvement initiatives in hospitals. Through existing knowledge and new frameworks and tools that specifically address value, hospitalists can champion value at the bedside and ensure their patients get the best possible care at lower costs.
Disclosures: Drs. Moriates, Shah, and Arora have received grant funding from the ABIM Foundation, and royalties from McGraw‐Hill for the textbook Understanding Value‐Based Healthcare. The authors report no conflicts of interest.
- , . Value‐based purchasing—national programs to move from volume to value. N Engl J Med. 2012;367(4):292–295.
- . Value‐driven health care: implications for hospitals and hospitalists. J Hosp Med. 2009;4(8):507–511.
- , . Hospital value‐based purchasing. J Hosp Med. 2013;8(5):271–277.
- . Setting value‐based payment goals—HHS efforts to improve U.S. health care. N Engl J Med. 2015;372(10):897–899.
- , . Redesigning care for patients at increased hospitalization risk: the Comprehensive Care Physician model. Health Aff Proj Hope. 2014;33(5):770–777.
- , , , et al. Choosing wisely in adult hospital medicine: five opportunities for improved healthcare value. J Hosp Med. 2013;8(9):486–492.
- , , . First, do no (financial) harm. JAMA. 2013;310(6):577–578.
- , , , . Development of a hospital‐based program focused on improving healthcare value. J Hosp Med. 2014;9(10):671–677.
- , , , et al. A controlled trial of a critical pathway for treatment of community‐acquired pneumonia. JAMA. 2000;283(6):749–755.
- , , , , . Evidence‐based care pathway for cellulitis improves process, clinical, and cost outcomes [published online July 28, 2015]. J Hosp Med. doi:10.1002/jhm.2433.
- . The Lean approach to health care: safety, quality, and cost. Institute of Medicine. Available at: http://nam.edu/perspectives‐2012‐the‐lean‐approach‐to‐health‐care‐safety‐quality‐and‐cost/. Accessed September 22, 2015.
- , , , et al. The impact of hospitalist discontinuity on hospital cost, readmissions, and patient satisfaction. J Gen Intern Med. 2014;29(7):1004–1008.
- Congressional Budget Office. Lessons from Medicare's Demonstration Projects on Disease Management, Care Coordination, and Value‐Based Payment. Available at: https://www.cbo.gov/publication/42860. Accessed April 26, 2015.
- , , , et al. A reengineered hospital discharge program to decrease rehospitalization: a randomized trial. Ann Intern Med. 2009;150(3):178–187.
- , , , . The care transitions intervention: results of a randomized controlled trial. Arch Intern Med. 2006;166(17):1822–1828.
- , , , et al. Comprehensive discharge planning and home follow‐up of hospitalized elders: a randomized clinical trial. JAMA. 1999;281(7):613–620.
- . “SNFists” at work: nursing home docs patterned after hospitalists. Mod Healthc. 2012;42(13):32–33.
- , , , . Nursing home physician specialists: a response to the workforce crisis in long‐term care. Ann Intern Med. 2009;150(6):411–413.
- Institute of Medicine. Best Care at Lower Cost: The Path to Continuously Learning Health Care in America. Washington, DC: National Academies Press; 2012.
- , . The perfect storm of overutilization. JAMA. 2008;299(23):2789–2791.
- , , , et al. Overuse of testing in preoperative evaluation and syncope: a survey of hospitalists. Ann Intern Med. 2015;162(2):100–108.
- , . Patients' expectations of the benefits and harms of treatments, screening, and tests: a systematic review. JAMA Intern Med. 2015;175(2):274–286.
- , , , et al. Enhancing the Use and Quality of Colorectal Cancer Screening. Rockville, MD: Agency for Healthcare Research and Quality; 2010. Available at: http://www.ncbi.nlm.nih.gov/books/NBK44526. Accessed September 30, 2013.
- , , , et al. Choosing wisely in pediatric hospital medicine: five opportunities for improved healthcare value. J Hosp Med. 2013;8(9):479–485.
- . Teaching Choosing Wisely in medical education and training: the story of a pioneer. The Medical Professionalism Blog. Available at: http://blog.abimfoundation.org/teaching‐choosing‐wisely‐in‐meded. Accessed March 29, 2014.
- American College of Radiology. ACR appropriateness criteria overview. November 2013. Available at: http://www.acr.org/∼/media/ACR/Documents/AppCriteria/Overview.pdf. Accessed March 4, 2014.
- American College of Cardiology Foundation. Appropriate use criteria: what you need to know. Available at: http://www.cardiosource.org/∼/media/Files/Science%20and%20Quality/Quality%20Programs/FOCUS/E1302_AUC_Primer_Update.ashx. Accessed March 4, 2014.
- , , , , . SOAP‐V: applying high‐value care during patient care. The Medical Professionalism Blog. Available at: http://blog.abimfoundation.org/soap‐v‐applying‐high‐value‐care‐during‐patient‐care. Accessed April 3, 2015.
- , . Why does antimicrobial overuse in hospitalized patients persist? JAMA Intern Med. 2014;174(5):661–662.
- . The myth of the demanding patient. JAMA Oncol. 2015;1(1):18–19.
- . The disruptive innovation of price transparency in health care. JAMA. 2013;310(18):1927–1928.
- United States Government Accountability Office. Health Care Price Transparency—Meaningful Price Information Is Difficult for Consumers to Obtain Prior to Receiving Care. Washington, DC: United States Government Accountability Office; 2011:43.
- , , . General pediatric attending physicians' and residents' knowledge of inpatient hospital finances. Pediatrics. 2013;131(6):1072–1080.
- , , . Hospitalists' awareness of patient charges associated with inpatient care. J Hosp Med. 2010;5(5):295–297.
- . Cost consciousness in patient care—what is medical education's responsibility? N Engl J Med. 2010;362(14):1253–1255.
- . Providing high‐value, cost‐conscious care: a critical seventh general competency for physicians. Ann Intern Med. 2011;155(6):386–388.
- , , , . Defining competencies for education in health care value: recommendations from the University of California, San Francisco Center for Healthcare Value Training Initiative. Acad Med. 2015;90(4):421–424.
- , , . Understanding Value‐Based Healthcare. New York: McGraw‐Hill; 2015.
- , , , . Wisdom of the crowd: bright ideas and innovations from the teaching value and choosing wisely challenge. Acad Med. 2015;90(5):624–628.
- , , , et al. Does the computerized display of charges affect inpatient ancillary test utilization? Arch Intern Med. 1997;157(21):2501–2508.
- , , , et al. Impact of providing fee data on laboratory test ordering: a controlled clinical trial. JAMA Intern Med. 2013;173(10):903–908.
- , , , . The effect of charge display on cost of care and physician practice behaviors: a systematic review. J Gen Intern Med. 2015;30(6):835–842.
- , , , , , . Closing the Quality Gap: Revisiting the State of the Science. Vol. 5. Public Reporting as a Quality Improvement Strategy. Rockville, MD: Agency for Healthcare Research and Quality; 2012.
- , , , . The savings illusion—why clinical quality improvement fails to deliver bottom‐line results. N Engl J Med. 2011;365(26):e48.
- , , , . Fostering value in clinical practice among future physicians: time to consider COST. Acad Med. 2014;89(11):1440.
- , , , , , . The Teaching Value Workshop. MedEdPORTAL Publications; 2014. Available at: https://www.mededportal.org/publication/9859. Accessed September 22, 2015.
- , , , , . “Nebs no more after 24”: a pilot program to improve the use of appropriate respiratory therapies. JAMA Intern Med. 2013;173(17):1647–1648.
- , , , et al. The development and implementation of a bundled quality improvement initiative to reduce inappropriate stress ulcer prophylaxis. ICU Dir. 2013;4(6):322–325.
- , . Engaging doctors in the health care revolution. Harvard Business Review. June 2014. Available at: http://hbr.org/2014/06/engaging‐doctors‐in‐the‐health‐care‐revolution/ar/1. Accessed July 30, 2014.
- , , . Geisinger Health System: achieving the potential of system integration through innovation, leadership, measurement, and incentives. June 2009. Available at: http://www.commonwealthfund.org/publications/case‐studies/2009/jun/geisinger‐health‐system‐achieving‐the‐potential‐of‐system‐integration. Accessed September 22, 2015.
- Motivational synergy: toward new conceptualizations of intrinsic and extrinsic motivation in the workplace. Hum Resource Manag 1993;3(3):185–201. Available at: http://www.hbs.edu/faculty/Pages/item.aspx?num=2500. Accessed July 31, 2014.
© 2015 Society of Hospital Medicine

Measuring Patient Experiences
The hospitalized patient experience has become an area of increased focus for hospitals given the recent coupling of patient satisfaction to reimbursement rates for Medicare patients.[1] Although patient experiences are multifactorial, 1 component is the relationship that hospitalized patients develop with their inpatient physicians. In recognition of the importance of this relationship, several organizations including the Society of Hospital Medicine, Society of General Internal Medicine, American College of Physicians, the American College of Emergency Physicians, and the Accreditation Council for Graduate Medical Education have recommended that patients know and understand who is guiding their care at all times during their hospitalization.[2, 3] Unfortunately, previous studies have shown that hospitalized patients often lack the ability to identify[4, 5] and understand their course of care.[6, 7] This may be due to numerous clinical factors including lack of a prior relationship, rapid pace of clinical care, and the frequent transitions of care found in both hospitalists and general medicine teaching services.[5, 8, 9] Regardless of the cause, one could hypothesize that patients who are unable to identify or understand the role of their physician may be less informed about their hospitalization, which may lead to further confusion, dissatisfaction, and ultimately a poor experience.
Given the proliferation of nonteaching hospitalist services in teaching hospitals, it is important to understand if patient experiences differ between general medicine teaching and hospitalist services. Several reasons could explain why patient experiences may vary on these services. For example, patients on a hospitalist service will likely interact with a single physician caretaker, which may give a feeling of more personalized care. In contrast, patients on general medicine teaching services are cared for by larger teams of residents under the supervision of an attending physician. Residents are also subjected to duty‐hour restrictions, clinic responsibilities, and other educational requirements that may impede the continuity of care for hospitalized patients.[10, 11, 12] Although 1 study has shown that hospitalist‐intensive hospitals perform better on patient satisfaction measures,[13] no study to date has compared patient‐reported experiences on general medicine teaching and nonteaching hospitalist services. This study aimed to evaluate the hospitalized patient experience on both teaching and nonteaching hospitalist services by assessing several patient‐reported measures of their experience, namely their confidence in their ability to identify their physician(s), understand their roles, and their rating of both the coordination and overall care.
METHODS
Study Design
We performed a retrospective cohort analysis at the University of Chicago Medical Center between July 2007 and June 2013. Data were acquired as part of the Hospitalist Project, an ongoing study that is used to evaluate the impact of hospitalists, and now serves as infrastructure to continue research related to hospital care at University of Chicago.[14] Patients were cared for by either the general medicine teaching service or the nonteaching hospitalist service. General medicine teaching services were composed of an attending physician who rotates for 2 weeks at a time, a second‐ or third‐year medicine resident, 1 to 2 medicine interns, and 1 to 2 medical students.[15] The attending physician assigned to the patient's hospitalization was the attending listed on the first day of hospitalization, regardless of the length of hospitalization. Nonteaching hospitalist services consisted of a single hospitalist who worked 7‐day shifts, and were assisted by a nurse practitioner/physician's assistant (NPA). The majority of attendings on the hospitalist service were less than 5 years out of residency. Both services admitted 7 days a week, with patients initially admitted to the general medicine teaching service until resident caps were met, after which all subsequent admissions were admitted to the hospitalist service. In addition, the hospitalist service is also responsible for specific patient subpopulations, such as lung and renal transplants, and oncologic patients who have previously established care with our institution.
Data Collection
During a 30‐day posthospitalization follow‐up questionnaire, patients were surveyed regarding their confidence in their ability to identify and understand the roles of their physician(s) and their perceptions of the overall coordination of care and their overall care, using a 5‐point Likert scale (1 = poor understanding to 5 = excellent understanding). Questions related to satisfaction with care and coordination were derived from the Picker‐Commonwealth Survey, a previously validated survey meant to evaluate patient‐centered care.[16] Patients were also asked to report their race, level of education, comorbid diseases, and whether they had any prior hospitalizations within 1 year. Chart review was performed to obtain patient age, gender, and hospital length of stay (LOS), and calculated Charlson Comorbidity Index (CCI).[17] Patients with missing data or responses to survey questions were excluded from final analysis. The University of Chicago Institutional Review Board approved the study protocol, and all patients provided written consented prior to participation.
Data Analysis
After initial analysis noted that outcomes were skewed, the decision was made to dichotomize the data and use logistic rather than linear regression models. Patient responses to the follow‐up phone questionnaire were dichotomized to reflect the top 2 categories (excellent and very good). Pearson 2 analysis was used to assess for any differences in demographic characteristics, disease severity, and measures of patient experience between the 2 services. To assess if service type was associated with differences in our 4 measures of patient experience, we created a 3‐level mixed‐effects logistic regression using a logit function while controlling for age, gender, race, CCI, LOS, previous hospitalizations within 1 year, level of education, and academic year. These models studied the longitudinal association between teaching service and the 4 outcome measures, while also controlling for the cluster effect of time nested within individual patients who were clustered within physicians. The model included random intercepts at both the patient and physician level and also included a random effect of service (teaching vs nonteaching) at the patient level. A Hausman test was used to determine if these random‐effects models improved fit over a fixed‐effects model, and the intraclass correlations were compared using likelihood ratio tests to determine the appropriateness of a 3‐level versus 2‐level model. Data management and 2 analyses were performed using Stata version 13.0 (StataCorp, College Station, TX), and mixed‐effects regression models were done in SuperMix (Scientific Software International, Skokie, IL).
RESULTS
In total, 14,855 patients were enrolled during their hospitalization with 57% and 61% completing the 30‐day follow‐up survey on the hospitalist and general medicine teaching service, respectively. In total, 4131 (69%) and 4322 (48%) of the hospitalist and general medicine services, respectively, either did not answer all survey questions, or were missing basic demographic data, and thus were excluded. Data from 4591 patients on the general medicine teaching (52% of those enrolled at hospitalization) and 1811 on the hospitalist service (31% of those enrolled at hospitalization) were used for final analysis (Figure 1). Respondents were predominantly female (61% and 56%), African American (75% and 63%), with a mean age of 56.2 (19.4) and 57.1 (16.1) years, for the general medicine teaching and hospitalist services, respectively. A majority of patients (71% and 66%) had a CCI of 0 to 3 on both services. There were differences in self‐reported comorbidities between the 2 groups, with hospitalist services having a higher prevalence of cancer (20% vs 7%), renal disease (25% vs 18%), and liver disease (23% vs 7%). Patients on the hospitalist service had a longer mean LOS (5.5 vs 4.8 days), a greater percentage of a hospitalization within 1 year (58% vs 52%), and a larger proportion who were admitted in 2011 to 2013 compared to 2007 to 2010 (75% vs 39%), when compared to the general medicine teaching services. Median LOS and interquartile ranges were similar between both groups. Although most baseline demographics were statistically different between the 2 groups (Table 1), these differences were likely clinically insignificant. Compared to those who responded to the follow‐up survey, nonresponders were more likely to be African American (73% and 64%, P < 0.001) and female (60% and 56%, P < 0.01). The nonresponders were more likely to be hospitalized in the past 1 year (62% and 53%, P < 0.001) and have a lower CCI (CCI 03 [75% and 80%, P < 0.001]) compared to responders. Demographics between responders and nonresponders were also statistically different from one another.
| Variable | General Medicine Teaching | Nonteaching Hospitalist | P Value |
|---|---|---|---|
| |||
| Total (n) | 4,591 | 1,811 | <0.001 |
| Attending classification, hospitalist, n (%) | 1,147 (25) | 1,811 (100) | |
| Response rate, % | 61 | 57 | <0.01 |
| Age, y, mean SD | 56.2 19.4 | 57.1 16.1 | <0.01 |
| Gender, n (%) | <0.01 | ||
| Male | 1,796 (39) | 805 (44) | |
| Female | 2,795 (61) | 1,004 (56) | |
| Race, n (%) | <0.01 | ||
| African American | 3,440 (75) | 1,092 (63) | |
| White | 900 (20) | 571 (32) | |
| Asian/Pacific | 38 (1) | 17 (1) | |
| Other | 20 (1) | 10 (1) | |
| Unknown | 134 (3) | 52 (3) | |
| Charlson Comorbidity Index, n (%) | <0.001 | ||
| 0 | 1,635 (36) | 532 (29) | |
| 12 | 1,590 (35) | 675 (37) | |
| 39 | 1,366 (30) | 602 (33) | |
| Self‐reported comorbidities | |||
| Anemia/sickle cell disease | 1,201 (26) | 408 (23) | 0.003 |
| Asthma/COPD | 1,251 (28) | 432 (24) | 0.006 |
| Cancer* | 300 (7) | 371 (20) | <0.001 |
| Depression | 1,035 (23) | 411 (23) | 0.887 |
| Diabetes | 1,381 (30) | 584 (32) | 0.087 |
| Gastrointestinal | 1,140 (25) | 485 (27) | 0.104 |
| Cardiac | 1,336 (29) | 520 (29) | 0.770 |
| Hypertension | 2,566 (56) | 1,042 (58) | 0.222 |
| HIV/AIDS | 151 (3) | 40 (2) | 0.022 |
| Kidney disease | 828 (18) | 459 (25) | <0.001 |
| Liver disease | 313 (7) | 417 (23) | <0.001 |
| Stroke | 543 (12) | 201 (11) | 0.417 |
| Education level | 0.066 | ||
| High school | 2,248 (49) | 832 (46) | |
| Junior college/college | 1,878 (41) | 781 (43) | |
| Postgraduate | 388 (8) | 173 (10) | |
| Don't know | 77 (2) | 23 (1) | |
| Academic year, n (%) | <0.001 | ||
| July 2007 June 2008 | 938 (20) | 90 (5) | |
| July 2008 June 2009 | 702 (15) | 148 (8) | |
| July 2009 June 2010 | 576(13) | 85 (5) | |
| July 2010 June 2011 | 602 (13) | 138 (8) | |
| July 2011 June 2012 | 769 (17) | 574 (32) | |
| July 2012 June 2013 | 1,004 (22) | 774 (43) | |
| Length of stay, d, mean SD | 4.8 7.3 | 5.5 6.4 | <0.01 |
| Prior hospitalization (within 1 year), yes, n (%) | 2,379 (52) | 1,039 (58) | <0.01 |

Unadjusted results revealed that patients on the hospitalist service were more confident in their abilities to identify their physician(s) (50% vs 45%, P < 0.001), perceived greater ability in understanding the role of their physician(s) (54% vs 50%, P < 0.001), and reported greater satisfaction with coordination and teamwork (68% vs 64%, P = 0.006) and with overall care (73% vs 67%, P < 0.001) (Figure 2).
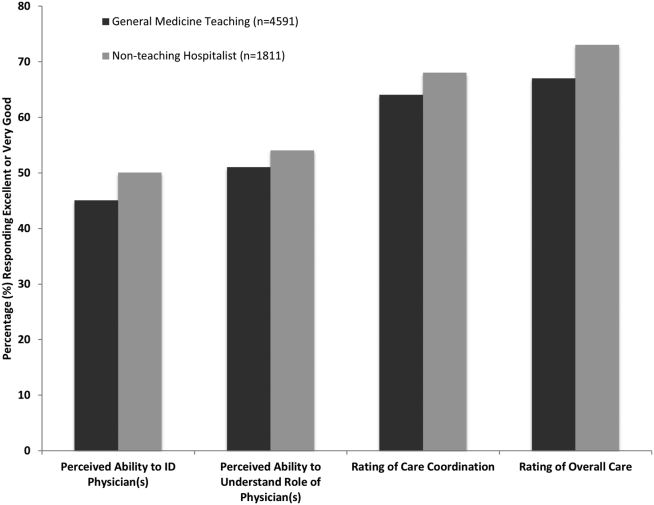
From the mixed‐effects regression models it was discovered that admission to the hospitalist service was associated with a higher odds ratio (OR) of reporting overall care as excellent or very good (OR: 1.33; 95% confidence interval [CI]: 1.15‐1.47). There was no difference between services in patients' ability to identify their physician(s) (OR: 0.89; 95% CI: 0.61‐1.11), in patients reporting a better understanding of the role of their physician(s) (OR: 1.09; 95% CI: 0.94‐1.23), or in their rating of overall coordination and teamwork (OR: 0.71; 95% CI: 0.42‐1.89).
A subgroup analysis was performed on the 25% of hospitalist attendings in the general medicine teaching service comparing this cohort to the hospitalist services, and it was found that patients perceived better overall care on the hospitalist service (OR: 1.17; 95% CI: 1.01‐ 1.31) than on the general medicine service (Table 2). All other domains in the subgroup analysis were not statistically significant. Finally, an ordinal logistic regression was performed for each of these outcomes, but it did not show any major differences compared to the logistic regression of dichotomous outcomes.
| Domains in Patient Experience* | Odds Ratio (95% CI) | P Value |
|---|---|---|
| ||
| How would you rate your ability to identify the physicians and trainees on your general medicine team during the hospitalization? | ||
| Model 1 | 0.89 (0.611.11) | 0.32 |
| Model 2 | 0.98 (0.671.22) | 0.86 |
| How would you rate your understanding of the roles of the physicians and trainees on your general medicine team? | ||
| Model 1 | 1.09 (0.941.23) | 0.25 |
| Model 2 | 1.19 (0.981.36) | 0.08 |
| How would you rate the overall coordination and teamwork among the doctors and nurses who care for you during your hospital stay? | ||
| Model 1 | 0.71 (0.421.89) | 0.18 |
| Model 2 | 0.82 (0.651.20) | 0.23 |
| Overall, how would you rate the care you received at the hospital? | ||
| Model 1 | 1.33 (1.151.47) | 0.001 |
| Model 2 | 1.17 (1.011.31) | 0.04 |
DISCUSSION
This study is the first to directly compare measures of patient experience on hospitalist and general medicine teaching services in a large, multiyear comparison across multiple domains. In adjusted analysis, we found that patients on nonteaching hospitalist services rated their overall care better than those on general medicine teaching services, whereas no differences in patients' ability to identify their physician(s), understand their role in their care, or rating of coordination of care were found. Although the magnitude of the differences in rating of overall care may appear small, it remains noteworthy because of the recent focus on patient experience at the reimbursement level, where small differences in performance can lead to large changes in payment. Because of the observational design of this study, it is important to consider mechanisms that could account for our findings.
The first are the structural differences between the 2 services. Our subgroup analysis comparing patients rating of overall care on a general medicine service with a hospitalist attending to a pure hospitalist cohort found a significant difference between the groups, indicating that the structural differences between the 2 groups may be a significant contributor to patient satisfaction ratings. Under the care of a hospitalist service, a patient would only interact with a single physician on a daily basis, possibly leading to a more meaningful relationship and improved communication between patient and provider. Alternatively, while on a general medicine teaching service, patients would likely interact with multiple physicians, as a result making their confidence in their ability to identify and perception at understanding physicians' roles more challenging.[18] This dilemma is further compounded by duty hour restrictions, which have subsequently led to increased fragmentation in housestaff scheduling. The patient experience on the general medicine teaching service may be further complicated by recent data that show residents spend a minority of time in direct patient care,[19, 20] which could additionally contribute to patients' inability to understand who their physicians are and to the decreased satisfaction with their care. This combination of structural complexity, duty hour reform, and reduced direct patient interaction would likely decrease the chance a patient will interact with the same resident on a consistent basis,[5, 21] thus making the ability to truly understand who their caretakers are, and the role they play, more difficult.
Another contributing factor could be the use of NPAs on our hospitalist service. Given that these providers often see the patient on a more continual basis, hospitalized patients' exposure to a single, continuous caretaker may be a factor in our findings.[22] Furthermore, with studies showing that hospitalists also spend a small fraction of their day in direct patient care,[23, 24, 25] the use of NPAs may allow our hospitalists to spend greater amounts of time with their patients, thus improving patients' rating of their overall care and influencing their perceived ability to understand their physician's role.
Although there was no difference between general medicine teaching and hospitalist services with respect to patient understanding of their roles, our data suggest that both groups would benefit from interventions to target this area. Focused attempts at improving patient's ability to identify and explain the roles of their inpatient physician(s) have been performed. For example, previous studies have attempted to improve a patient's ability to identify their physician through physician facecards[8, 9] or the use of other simple interventions (ie, bedside whiteboards).[4, 26] Results from such interventions are mixed, as they have demonstrated the capacity to improve patients' ability to identify who their physician is, whereas few have shown any appreciable improvement in patient satisfaction.[26]
Although our findings suggest that structural differences in team composition may be a possible explanation, it is also important to consider how the quality of care a patient receives affects their experience. For instance, hospitalists have been shown to produce moderate improvements in patient‐centered outcomes such as 30‐day readmission[27] and hospital length of stay[14, 28, 29, 30, 31] when compared to other care providers, which in turn could be reflected in the patient's perception of their overall care. In a large national study of acute care hospitals using the Hospital Consumer Assessment of Healthcare Providers and Systems survey, Chen and colleagues found that for most measures of patient satisfaction, hospitals with greater use of hospitalist care were associated with better patient‐centered care.[13] These outcomes were in part driven by patient‐centered domains such as discharge planning, pain control, and medication management. It is possible that patients are sensitive to the improved outcomes that are associated with hospitalist services, and reflect this in their measures of patient satisfaction.
Last, because this is an observational study and not a randomized trial, it is possible that the clinical differences in the patients cared for by these services could have led to our findings. Although the clinical significance of the differences in patient demographics were small, patients seen on the hospitalist service were more likely to be older white males, with a slightly longer LOS, greater comorbidities, and more hospitalizations in the previous year than those seen on the general medicine teaching service. Additionally, our hospitalist service frequently cares for highly specific subpopulations (ie, liver and renal transplant patients, and oncology patients), which could have influenced our results. For example, transplant patients who may be very grateful for their second chance, are preferentially admitted to the hospitalist service, which could have biased our results in favor of hospitalists.[32] Unfortunately, we were unable to control for all such factors.
Although we hope that multivariable analysis can adjust for many of these differences, we are not able to account for possible unmeasured confounders such as time of day of admission, health literacy, personality differences, physician turnover, or nursing and other ancillary care that could contribute to these findings. In addition to its observational study design, our study has several other limitations. First, our study was performed at a single institution, thus limiting its generalizability. Second, as a retrospective study based on observational data, no definitive conclusions regarding causality can be made. Third, although our response rate was low, it is comparable to other studies that have examined underserved populations.[33, 34] Fourth, because our survey was performed 30 days after hospitalization, this may impart imprecision on our outcomes measures. Finally, we were not able to mitigate selection bias through imputation for missing data .
All together, given the small absolute differences between the groups in patients' ratings of their overall care compared to large differences in possible confounders, these findings call for further exploration into the significance and possible mechanisms of these outcomes. Our study raises the potential possibility that the structural component of a care team may play a role in overall patient satisfaction. If this is the case, future studies of team structure could help inform how best to optimize this component for the patient experience. On the other hand, if process differences are to explain our findings, it is important to distill the types of processes hospitalists are using to improve the patient experience and potentially export this to resident services.
Finally, if similar results were found in other institutions, these findings could have implications on how hospitals respond to new payment models that are linked to patient‐experience measures. For example, the Hospital Value‐Based Purchasing Program currently links the Centers for Medicare and Medicaid Services payments to a set of quality measures that consist of (1) clinical processes of care (70%) and (2) the patient experience (30%).[1] Given this linkage, any small changes in the domain of patient satisfaction could have large payment implications on a national level.
CONCLUSION
In summary, in this large‐scale multiyear study, patients cared for by a nonteaching hospitalist service reported greater satisfaction with their overall care than patients cared for by a general medicine teaching service. This difference could be mediated by the structural differences between these 2 services. As hospitals seek to optimize patient experiences in an era where reimbursement models are now being linked to patient‐experience measures, future work should focus on further understanding the mechanisms for these findings.
Disclosures
Financial support for this work was provided by the Robert Wood Johnson Investigator Program (RWJF Grant ID 63910 PI Meltzer), a Midcareer Career Development Award from the National Institute of Aging (1 K24 AG031326‐01, PI Meltzer), and a Clinical and Translational Science Award (NIH/NCATS 2UL1TR000430‐08, PI Solway, Meltzer Core Leader). The authors report no conflicts of interest.
- Hospital Consumer Assessment of Healthcare Providers and Systems. HCAHPS fact sheet. CAHPS hospital survey August 2013. Available at: http://www.hcahpsonline.org/files/August_2013_HCAHPS_Fact_Sheet3.pdf. Accessed February 2, 2015.
- , , , et al. Transitions of Care Consensus policy statement: American College of Physicians, Society of General Internal Medicine, Society of Hospital Medicine, American Geriatrics Society, American College Of Emergency Physicians, and Society for Academic Emergency Medicine. J Hosp Med. 2009;4(6):364–370.
- Accreditation Council for Graduate Medical Education. Common program requirements. Available at: http://www.acgme.org/acgmeweb/Portals/0/PFAssets/ProgramRequirements/CPRs2013.pdf. Accessed January 15, 2015.
- , , . Increasing a patient's ability to identify his or her attending physician using a patient room display. Arch Intern Med. 2010;170(12):1084–1085.
- , , , , , . Ability of hospitalized patients to identify their in‐hospital physicians. Arch Intern Med. 2009;169(2):199–201.
- , , , et al. Hospitalized patients' understanding of their plan of care. Mayo Clin Proc. 2010;85(1):47–52.
- , , , et al. Patient‐physician communication at hospital discharge and patients' understanding of the postdischarge treatment plan. Arch Intern Med. 1997;157(9):1026–1030.
- , , , et al. Improving inpatients' identification of their doctors: use of FACE cards. Jt Comm J Qual Patient Saf. 2009;35(12):613–619.
- , , , , , . The impact of facecards on patients' knowledge, satisfaction, trust, and agreement with hospital physicians: a pilot study. J Hosp Med. 2014;9(3):137–141.
- , , . Restructuring an inpatient resident service to improve outcomes for residents, students, and patients. Acad Med. 2011;86(12):1500–1507.
- , , . Residency training in the modern era: the pipe dream of less time to learn more, care better, and be more professional. Arch Intern Med. 2005;165(22):2561–2562.
- , , , , . Managing discontinuity in academic medical centers: strategies for a safe and effective resident sign‐out. J Hosp Med. 2006;1(4):257–266.
- , , , . Hospitalist staffing and patient satisfaction in the national Medicare population. J Hosp Med. 2013;8(3):126–131.
- , , , et al. Effects of physician experience on costs and outcomes on an academic general medicine service: results of a trial of hospitalists. Ann Intern Med. 2002;137(11):866–874.
- , , , , , . The Effects of on‐duty napping on intern sleep time and fatigue. Ann Intern Med. 2006;144(11):792–798.
- , , , et al. Patients evaluate their hospital care: a national survey. Health Aff (Millwood). 1991;10(4):254–267.
- , , , . A new method of classifying prognostic comorbidity in longitudinal studies: development and validation. J Chronic Dis. 1987;40(5):373–383.
- Agency for Healthcare Research and Quality. Welcome to HCUPnet. Available at: http://hcupnet.ahrq.gov/HCUPnet.jsp?Id=F70FC59C286BADCB371(4):293–295.
- , , , et al. In the wake of the 2003 and 2011 duty hours regulations, how do internal medicine interns spend their time? J Gen Intern Med. 2013;28(8):1042–1047.
- , , , , , . The composition of intern work while on call. J Gen Intern Med. 2012;27(11):1432–1437.
- , , , et al. Effect of the 2011 vs 2003 duty hour regulation‐compliant models on sleep duration, trainee education, and continuity of patient care among internal medicine house staff: a randomized trial. JAMA Intern Med. 2013;173(8):649–655.
- , , , et al. The impact of hospitalist discontinuity on hospital cost, readmissions, and patient satisfaction. J Gen Intern Med. 2014;29(7):1004–1008.
- , , , , . Hospitalist time usage and cyclicality: opportunities to improve efficiency. J Hosp Med. 2010;5(6):329–334.
- , , , et al. Where did the day go?—a time‐motion study of hospitalists. J Hosp Med. 2010;5(6):323–328.
- , , . How hospitalists spend their time: insights on efficiency and safety. J Hosp Med. 2006;1(2):88–93.
- , , . Patient satisfaction associated with correct identification of physician's photographs. Mayo Clin Proc. 2001;76(6):604–608.
- , , , . Comparing patient outcomes of academician‐preceptors, hospitalist‐preceptors, and hospitalists on internal medicine services in an academic medical center. J Gen Intern Med. 2014;29(12):1672–1678.
- , , , . Comparison of processes and outcomes of pneumonia care between hospitalists and community‐based primary care physicians. Mayo Clin Proc. 2002;77(10):1053–1058.
- , , , , , . Outcomes of care by hospitalists, general internists, and family physicians. N Engl J Med. 2007;357(25):2589–2600.
- . A systematic review of outcomes and quality measures in adult patients cared for by hospitalists vs nonhospitalists. Mayo Clin Proc. 2009;84(3):248–254.
- , . Do hospitalist physicians improve the quality of inpatient care delivery? A systematic review of process, efficiency and outcome measures. BMC Med. 2011;9(1):58.
- , . Patients' experiences of everyday life after lung transplantation. J Clin Nurs. 2009;18(24):3472–3479.
- , , , et al. Optimal design features for surveying low‐income populations. J Health Care Poor Underserved. 2005;16(4):677–690.
The hospitalized patient experience has become an area of increased focus for hospitals given the recent coupling of patient satisfaction to reimbursement rates for Medicare patients.[1] Although patient experiences are multifactorial, 1 component is the relationship that hospitalized patients develop with their inpatient physicians. In recognition of the importance of this relationship, several organizations including the Society of Hospital Medicine, Society of General Internal Medicine, American College of Physicians, the American College of Emergency Physicians, and the Accreditation Council for Graduate Medical Education have recommended that patients know and understand who is guiding their care at all times during their hospitalization.[2, 3] Unfortunately, previous studies have shown that hospitalized patients often lack the ability to identify[4, 5] and understand their course of care.[6, 7] This may be due to numerous clinical factors including lack of a prior relationship, rapid pace of clinical care, and the frequent transitions of care found in both hospitalists and general medicine teaching services.[5, 8, 9] Regardless of the cause, one could hypothesize that patients who are unable to identify or understand the role of their physician may be less informed about their hospitalization, which may lead to further confusion, dissatisfaction, and ultimately a poor experience.
Given the proliferation of nonteaching hospitalist services in teaching hospitals, it is important to understand if patient experiences differ between general medicine teaching and hospitalist services. Several reasons could explain why patient experiences may vary on these services. For example, patients on a hospitalist service will likely interact with a single physician caretaker, which may give a feeling of more personalized care. In contrast, patients on general medicine teaching services are cared for by larger teams of residents under the supervision of an attending physician. Residents are also subjected to duty‐hour restrictions, clinic responsibilities, and other educational requirements that may impede the continuity of care for hospitalized patients.[10, 11, 12] Although 1 study has shown that hospitalist‐intensive hospitals perform better on patient satisfaction measures,[13] no study to date has compared patient‐reported experiences on general medicine teaching and nonteaching hospitalist services. This study aimed to evaluate the hospitalized patient experience on both teaching and nonteaching hospitalist services by assessing several patient‐reported measures of their experience, namely their confidence in their ability to identify their physician(s), understand their roles, and their rating of both the coordination and overall care.
METHODS
Study Design
We performed a retrospective cohort analysis at the University of Chicago Medical Center between July 2007 and June 2013. Data were acquired as part of the Hospitalist Project, an ongoing study that is used to evaluate the impact of hospitalists, and now serves as infrastructure to continue research related to hospital care at University of Chicago.[14] Patients were cared for by either the general medicine teaching service or the nonteaching hospitalist service. General medicine teaching services were composed of an attending physician who rotates for 2 weeks at a time, a second‐ or third‐year medicine resident, 1 to 2 medicine interns, and 1 to 2 medical students.[15] The attending physician assigned to the patient's hospitalization was the attending listed on the first day of hospitalization, regardless of the length of hospitalization. Nonteaching hospitalist services consisted of a single hospitalist who worked 7‐day shifts, and were assisted by a nurse practitioner/physician's assistant (NPA). The majority of attendings on the hospitalist service were less than 5 years out of residency. Both services admitted 7 days a week, with patients initially admitted to the general medicine teaching service until resident caps were met, after which all subsequent admissions were admitted to the hospitalist service. In addition, the hospitalist service is also responsible for specific patient subpopulations, such as lung and renal transplants, and oncologic patients who have previously established care with our institution.
Data Collection
During a 30‐day posthospitalization follow‐up questionnaire, patients were surveyed regarding their confidence in their ability to identify and understand the roles of their physician(s) and their perceptions of the overall coordination of care and their overall care, using a 5‐point Likert scale (1 = poor understanding to 5 = excellent understanding). Questions related to satisfaction with care and coordination were derived from the Picker‐Commonwealth Survey, a previously validated survey meant to evaluate patient‐centered care.[16] Patients were also asked to report their race, level of education, comorbid diseases, and whether they had any prior hospitalizations within 1 year. Chart review was performed to obtain patient age, gender, and hospital length of stay (LOS), and calculated Charlson Comorbidity Index (CCI).[17] Patients with missing data or responses to survey questions were excluded from final analysis. The University of Chicago Institutional Review Board approved the study protocol, and all patients provided written consented prior to participation.
Data Analysis
After initial analysis noted that outcomes were skewed, the decision was made to dichotomize the data and use logistic rather than linear regression models. Patient responses to the follow‐up phone questionnaire were dichotomized to reflect the top 2 categories (excellent and very good). Pearson 2 analysis was used to assess for any differences in demographic characteristics, disease severity, and measures of patient experience between the 2 services. To assess if service type was associated with differences in our 4 measures of patient experience, we created a 3‐level mixed‐effects logistic regression using a logit function while controlling for age, gender, race, CCI, LOS, previous hospitalizations within 1 year, level of education, and academic year. These models studied the longitudinal association between teaching service and the 4 outcome measures, while also controlling for the cluster effect of time nested within individual patients who were clustered within physicians. The model included random intercepts at both the patient and physician level and also included a random effect of service (teaching vs nonteaching) at the patient level. A Hausman test was used to determine if these random‐effects models improved fit over a fixed‐effects model, and the intraclass correlations were compared using likelihood ratio tests to determine the appropriateness of a 3‐level versus 2‐level model. Data management and 2 analyses were performed using Stata version 13.0 (StataCorp, College Station, TX), and mixed‐effects regression models were done in SuperMix (Scientific Software International, Skokie, IL).
RESULTS
In total, 14,855 patients were enrolled during their hospitalization with 57% and 61% completing the 30‐day follow‐up survey on the hospitalist and general medicine teaching service, respectively. In total, 4131 (69%) and 4322 (48%) of the hospitalist and general medicine services, respectively, either did not answer all survey questions, or were missing basic demographic data, and thus were excluded. Data from 4591 patients on the general medicine teaching (52% of those enrolled at hospitalization) and 1811 on the hospitalist service (31% of those enrolled at hospitalization) were used for final analysis (Figure 1). Respondents were predominantly female (61% and 56%), African American (75% and 63%), with a mean age of 56.2 (19.4) and 57.1 (16.1) years, for the general medicine teaching and hospitalist services, respectively. A majority of patients (71% and 66%) had a CCI of 0 to 3 on both services. There were differences in self‐reported comorbidities between the 2 groups, with hospitalist services having a higher prevalence of cancer (20% vs 7%), renal disease (25% vs 18%), and liver disease (23% vs 7%). Patients on the hospitalist service had a longer mean LOS (5.5 vs 4.8 days), a greater percentage of a hospitalization within 1 year (58% vs 52%), and a larger proportion who were admitted in 2011 to 2013 compared to 2007 to 2010 (75% vs 39%), when compared to the general medicine teaching services. Median LOS and interquartile ranges were similar between both groups. Although most baseline demographics were statistically different between the 2 groups (Table 1), these differences were likely clinically insignificant. Compared to those who responded to the follow‐up survey, nonresponders were more likely to be African American (73% and 64%, P < 0.001) and female (60% and 56%, P < 0.01). The nonresponders were more likely to be hospitalized in the past 1 year (62% and 53%, P < 0.001) and have a lower CCI (CCI 03 [75% and 80%, P < 0.001]) compared to responders. Demographics between responders and nonresponders were also statistically different from one another.
| Variable | General Medicine Teaching | Nonteaching Hospitalist | P Value |
|---|---|---|---|
| |||
| Total (n) | 4,591 | 1,811 | <0.001 |
| Attending classification, hospitalist, n (%) | 1,147 (25) | 1,811 (100) | |
| Response rate, % | 61 | 57 | <0.01 |
| Age, y, mean SD | 56.2 19.4 | 57.1 16.1 | <0.01 |
| Gender, n (%) | <0.01 | ||
| Male | 1,796 (39) | 805 (44) | |
| Female | 2,795 (61) | 1,004 (56) | |
| Race, n (%) | <0.01 | ||
| African American | 3,440 (75) | 1,092 (63) | |
| White | 900 (20) | 571 (32) | |
| Asian/Pacific | 38 (1) | 17 (1) | |
| Other | 20 (1) | 10 (1) | |
| Unknown | 134 (3) | 52 (3) | |
| Charlson Comorbidity Index, n (%) | <0.001 | ||
| 0 | 1,635 (36) | 532 (29) | |
| 12 | 1,590 (35) | 675 (37) | |
| 39 | 1,366 (30) | 602 (33) | |
| Self‐reported comorbidities | |||
| Anemia/sickle cell disease | 1,201 (26) | 408 (23) | 0.003 |
| Asthma/COPD | 1,251 (28) | 432 (24) | 0.006 |
| Cancer* | 300 (7) | 371 (20) | <0.001 |
| Depression | 1,035 (23) | 411 (23) | 0.887 |
| Diabetes | 1,381 (30) | 584 (32) | 0.087 |
| Gastrointestinal | 1,140 (25) | 485 (27) | 0.104 |
| Cardiac | 1,336 (29) | 520 (29) | 0.770 |
| Hypertension | 2,566 (56) | 1,042 (58) | 0.222 |
| HIV/AIDS | 151 (3) | 40 (2) | 0.022 |
| Kidney disease | 828 (18) | 459 (25) | <0.001 |
| Liver disease | 313 (7) | 417 (23) | <0.001 |
| Stroke | 543 (12) | 201 (11) | 0.417 |
| Education level | 0.066 | ||
| High school | 2,248 (49) | 832 (46) | |
| Junior college/college | 1,878 (41) | 781 (43) | |
| Postgraduate | 388 (8) | 173 (10) | |
| Don't know | 77 (2) | 23 (1) | |
| Academic year, n (%) | <0.001 | ||
| July 2007 June 2008 | 938 (20) | 90 (5) | |
| July 2008 June 2009 | 702 (15) | 148 (8) | |
| July 2009 June 2010 | 576(13) | 85 (5) | |
| July 2010 June 2011 | 602 (13) | 138 (8) | |
| July 2011 June 2012 | 769 (17) | 574 (32) | |
| July 2012 June 2013 | 1,004 (22) | 774 (43) | |
| Length of stay, d, mean SD | 4.8 7.3 | 5.5 6.4 | <0.01 |
| Prior hospitalization (within 1 year), yes, n (%) | 2,379 (52) | 1,039 (58) | <0.01 |
Unadjusted results revealed that patients on the hospitalist service were more confident in their abilities to identify their physician(s) (50% vs 45%, P < 0.001), perceived greater ability in understanding the role of their physician(s) (54% vs 50%, P < 0.001), and reported greater satisfaction with coordination and teamwork (68% vs 64%, P = 0.006) and with overall care (73% vs 67%, P < 0.001) (Figure 2).
From the mixed‐effects regression models it was discovered that admission to the hospitalist service was associated with a higher odds ratio (OR) of reporting overall care as excellent or very good (OR: 1.33; 95% confidence interval [CI]: 1.15‐1.47). There was no difference between services in patients' ability to identify their physician(s) (OR: 0.89; 95% CI: 0.61‐1.11), in patients reporting a better understanding of the role of their physician(s) (OR: 1.09; 95% CI: 0.94‐1.23), or in their rating of overall coordination and teamwork (OR: 0.71; 95% CI: 0.42‐1.89).
A subgroup analysis was performed on the 25% of hospitalist attendings in the general medicine teaching service comparing this cohort to the hospitalist services, and it was found that patients perceived better overall care on the hospitalist service (OR: 1.17; 95% CI: 1.01‐ 1.31) than on the general medicine service (Table 2). All other domains in the subgroup analysis were not statistically significant. Finally, an ordinal logistic regression was performed for each of these outcomes, but it did not show any major differences compared to the logistic regression of dichotomous outcomes.
| Domains in Patient Experience* | Odds Ratio (95% CI) | P Value |
|---|---|---|
| ||
| How would you rate your ability to identify the physicians and trainees on your general medicine team during the hospitalization? | ||
| Model 1 | 0.89 (0.611.11) | 0.32 |
| Model 2 | 0.98 (0.671.22) | 0.86 |
| How would you rate your understanding of the roles of the physicians and trainees on your general medicine team? | ||
| Model 1 | 1.09 (0.941.23) | 0.25 |
| Model 2 | 1.19 (0.981.36) | 0.08 |
| How would you rate the overall coordination and teamwork among the doctors and nurses who care for you during your hospital stay? | ||
| Model 1 | 0.71 (0.421.89) | 0.18 |
| Model 2 | 0.82 (0.651.20) | 0.23 |
| Overall, how would you rate the care you received at the hospital? | ||
| Model 1 | 1.33 (1.151.47) | 0.001 |
| Model 2 | 1.17 (1.011.31) | 0.04 |
DISCUSSION
This study is the first to directly compare measures of patient experience on hospitalist and general medicine teaching services in a large, multiyear comparison across multiple domains. In adjusted analysis, we found that patients on nonteaching hospitalist services rated their overall care better than those on general medicine teaching services, whereas no differences in patients' ability to identify their physician(s), understand their role in their care, or rating of coordination of care were found. Although the magnitude of the differences in rating of overall care may appear small, it remains noteworthy because of the recent focus on patient experience at the reimbursement level, where small differences in performance can lead to large changes in payment. Because of the observational design of this study, it is important to consider mechanisms that could account for our findings.
The first are the structural differences between the 2 services. Our subgroup analysis comparing patients rating of overall care on a general medicine service with a hospitalist attending to a pure hospitalist cohort found a significant difference between the groups, indicating that the structural differences between the 2 groups may be a significant contributor to patient satisfaction ratings. Under the care of a hospitalist service, a patient would only interact with a single physician on a daily basis, possibly leading to a more meaningful relationship and improved communication between patient and provider. Alternatively, while on a general medicine teaching service, patients would likely interact with multiple physicians, as a result making their confidence in their ability to identify and perception at understanding physicians' roles more challenging.[18] This dilemma is further compounded by duty hour restrictions, which have subsequently led to increased fragmentation in housestaff scheduling. The patient experience on the general medicine teaching service may be further complicated by recent data that show residents spend a minority of time in direct patient care,[19, 20] which could additionally contribute to patients' inability to understand who their physicians are and to the decreased satisfaction with their care. This combination of structural complexity, duty hour reform, and reduced direct patient interaction would likely decrease the chance a patient will interact with the same resident on a consistent basis,[5, 21] thus making the ability to truly understand who their caretakers are, and the role they play, more difficult.
Another contributing factor could be the use of NPAs on our hospitalist service. Given that these providers often see the patient on a more continual basis, hospitalized patients' exposure to a single, continuous caretaker may be a factor in our findings.[22] Furthermore, with studies showing that hospitalists also spend a small fraction of their day in direct patient care,[23, 24, 25] the use of NPAs may allow our hospitalists to spend greater amounts of time with their patients, thus improving patients' rating of their overall care and influencing their perceived ability to understand their physician's role.
Although there was no difference between general medicine teaching and hospitalist services with respect to patient understanding of their roles, our data suggest that both groups would benefit from interventions to target this area. Focused attempts at improving patient's ability to identify and explain the roles of their inpatient physician(s) have been performed. For example, previous studies have attempted to improve a patient's ability to identify their physician through physician facecards[8, 9] or the use of other simple interventions (ie, bedside whiteboards).[4, 26] Results from such interventions are mixed, as they have demonstrated the capacity to improve patients' ability to identify who their physician is, whereas few have shown any appreciable improvement in patient satisfaction.[26]
Although our findings suggest that structural differences in team composition may be a possible explanation, it is also important to consider how the quality of care a patient receives affects their experience. For instance, hospitalists have been shown to produce moderate improvements in patient‐centered outcomes such as 30‐day readmission[27] and hospital length of stay[14, 28, 29, 30, 31] when compared to other care providers, which in turn could be reflected in the patient's perception of their overall care. In a large national study of acute care hospitals using the Hospital Consumer Assessment of Healthcare Providers and Systems survey, Chen and colleagues found that for most measures of patient satisfaction, hospitals with greater use of hospitalist care were associated with better patient‐centered care.[13] These outcomes were in part driven by patient‐centered domains such as discharge planning, pain control, and medication management. It is possible that patients are sensitive to the improved outcomes that are associated with hospitalist services, and reflect this in their measures of patient satisfaction.
Last, because this is an observational study and not a randomized trial, it is possible that the clinical differences in the patients cared for by these services could have led to our findings. Although the clinical significance of the differences in patient demographics were small, patients seen on the hospitalist service were more likely to be older white males, with a slightly longer LOS, greater comorbidities, and more hospitalizations in the previous year than those seen on the general medicine teaching service. Additionally, our hospitalist service frequently cares for highly specific subpopulations (ie, liver and renal transplant patients, and oncology patients), which could have influenced our results. For example, transplant patients who may be very grateful for their second chance, are preferentially admitted to the hospitalist service, which could have biased our results in favor of hospitalists.[32] Unfortunately, we were unable to control for all such factors.
Although we hope that multivariable analysis can adjust for many of these differences, we are not able to account for possible unmeasured confounders such as time of day of admission, health literacy, personality differences, physician turnover, or nursing and other ancillary care that could contribute to these findings. In addition to its observational study design, our study has several other limitations. First, our study was performed at a single institution, thus limiting its generalizability. Second, as a retrospective study based on observational data, no definitive conclusions regarding causality can be made. Third, although our response rate was low, it is comparable to other studies that have examined underserved populations.[33, 34] Fourth, because our survey was performed 30 days after hospitalization, this may impart imprecision on our outcomes measures. Finally, we were not able to mitigate selection bias through imputation for missing data .
All together, given the small absolute differences between the groups in patients' ratings of their overall care compared to large differences in possible confounders, these findings call for further exploration into the significance and possible mechanisms of these outcomes. Our study raises the potential possibility that the structural component of a care team may play a role in overall patient satisfaction. If this is the case, future studies of team structure could help inform how best to optimize this component for the patient experience. On the other hand, if process differences are to explain our findings, it is important to distill the types of processes hospitalists are using to improve the patient experience and potentially export this to resident services.
Finally, if similar results were found in other institutions, these findings could have implications on how hospitals respond to new payment models that are linked to patient‐experience measures. For example, the Hospital Value‐Based Purchasing Program currently links the Centers for Medicare and Medicaid Services payments to a set of quality measures that consist of (1) clinical processes of care (70%) and (2) the patient experience (30%).[1] Given this linkage, any small changes in the domain of patient satisfaction could have large payment implications on a national level.
CONCLUSION
In summary, in this large‐scale multiyear study, patients cared for by a nonteaching hospitalist service reported greater satisfaction with their overall care than patients cared for by a general medicine teaching service. This difference could be mediated by the structural differences between these 2 services. As hospitals seek to optimize patient experiences in an era where reimbursement models are now being linked to patient‐experience measures, future work should focus on further understanding the mechanisms for these findings.
Disclosures
Financial support for this work was provided by the Robert Wood Johnson Investigator Program (RWJF Grant ID 63910 PI Meltzer), a Midcareer Career Development Award from the National Institute of Aging (1 K24 AG031326‐01, PI Meltzer), and a Clinical and Translational Science Award (NIH/NCATS 2UL1TR000430‐08, PI Solway, Meltzer Core Leader). The authors report no conflicts of interest.
- Hospital Consumer Assessment of Healthcare Providers and Systems. HCAHPS fact sheet. CAHPS hospital survey August 2013. Available at: http://www.hcahpsonline.org/files/August_2013_HCAHPS_Fact_Sheet3.pdf. Accessed February 2, 2015.
- , , , et al. Transitions of Care Consensus policy statement: American College of Physicians, Society of General Internal Medicine, Society of Hospital Medicine, American Geriatrics Society, American College Of Emergency Physicians, and Society for Academic Emergency Medicine. J Hosp Med. 2009;4(6):364–370.
- Accreditation Council for Graduate Medical Education. Common program requirements. Available at: http://www.acgme.org/acgmeweb/Portals/0/PFAssets/ProgramRequirements/CPRs2013.pdf. Accessed January 15, 2015.
- , , . Increasing a patient's ability to identify his or her attending physician using a patient room display. Arch Intern Med. 2010;170(12):1084–1085.
- , , , , , . Ability of hospitalized patients to identify their in‐hospital physicians. Arch Intern Med. 2009;169(2):199–201.
- , , , et al. Hospitalized patients' understanding of their plan of care. Mayo Clin Proc. 2010;85(1):47–52.
- , , , et al. Patient‐physician communication at hospital discharge and patients' understanding of the postdischarge treatment plan. Arch Intern Med. 1997;157(9):1026–1030.
- , , , et al. Improving inpatients' identification of their doctors: use of FACE cards. Jt Comm J Qual Patient Saf. 2009;35(12):613–619.
- , , , , , . The impact of facecards on patients' knowledge, satisfaction, trust, and agreement with hospital physicians: a pilot study. J Hosp Med. 2014;9(3):137–141.
- , , . Restructuring an inpatient resident service to improve outcomes for residents, students, and patients. Acad Med. 2011;86(12):1500–1507.
- , , . Residency training in the modern era: the pipe dream of less time to learn more, care better, and be more professional. Arch Intern Med. 2005;165(22):2561–2562.
- , , , , . Managing discontinuity in academic medical centers: strategies for a safe and effective resident sign‐out. J Hosp Med. 2006;1(4):257–266.
- , , , . Hospitalist staffing and patient satisfaction in the national Medicare population. J Hosp Med. 2013;8(3):126–131.
- , , , et al. Effects of physician experience on costs and outcomes on an academic general medicine service: results of a trial of hospitalists. Ann Intern Med. 2002;137(11):866–874.
- , , , , , . The Effects of on‐duty napping on intern sleep time and fatigue. Ann Intern Med. 2006;144(11):792–798.
- , , , et al. Patients evaluate their hospital care: a national survey. Health Aff (Millwood). 1991;10(4):254–267.
- , , , . A new method of classifying prognostic comorbidity in longitudinal studies: development and validation. J Chronic Dis. 1987;40(5):373–383.
- Agency for Healthcare Research and Quality. Welcome to HCUPnet. Available at: http://hcupnet.ahrq.gov/HCUPnet.jsp?Id=F70FC59C286BADCB371(4):293–295.
- , , , et al. In the wake of the 2003 and 2011 duty hours regulations, how do internal medicine interns spend their time? J Gen Intern Med. 2013;28(8):1042–1047.
- , , , , , . The composition of intern work while on call. J Gen Intern Med. 2012;27(11):1432–1437.
- , , , et al. Effect of the 2011 vs 2003 duty hour regulation‐compliant models on sleep duration, trainee education, and continuity of patient care among internal medicine house staff: a randomized trial. JAMA Intern Med. 2013;173(8):649–655.
- , , , et al. The impact of hospitalist discontinuity on hospital cost, readmissions, and patient satisfaction. J Gen Intern Med. 2014;29(7):1004–1008.
- , , , , . Hospitalist time usage and cyclicality: opportunities to improve efficiency. J Hosp Med. 2010;5(6):329–334.
- , , , et al. Where did the day go?—a time‐motion study of hospitalists. J Hosp Med. 2010;5(6):323–328.
- , , . How hospitalists spend their time: insights on efficiency and safety. J Hosp Med. 2006;1(2):88–93.
- , , . Patient satisfaction associated with correct identification of physician's photographs. Mayo Clin Proc. 2001;76(6):604–608.
- , , , . Comparing patient outcomes of academician‐preceptors, hospitalist‐preceptors, and hospitalists on internal medicine services in an academic medical center. J Gen Intern Med. 2014;29(12):1672–1678.
- , , , . Comparison of processes and outcomes of pneumonia care between hospitalists and community‐based primary care physicians. Mayo Clin Proc. 2002;77(10):1053–1058.
- , , , , , . Outcomes of care by hospitalists, general internists, and family physicians. N Engl J Med. 2007;357(25):2589–2600.
- . A systematic review of outcomes and quality measures in adult patients cared for by hospitalists vs nonhospitalists. Mayo Clin Proc. 2009;84(3):248–254.
- , . Do hospitalist physicians improve the quality of inpatient care delivery? A systematic review of process, efficiency and outcome measures. BMC Med. 2011;9(1):58.
- , . Patients' experiences of everyday life after lung transplantation. J Clin Nurs. 2009;18(24):3472–3479.
- , , , et al. Optimal design features for surveying low‐income populations. J Health Care Poor Underserved. 2005;16(4):677–690.
© 2015 Society of Hospital Medicine
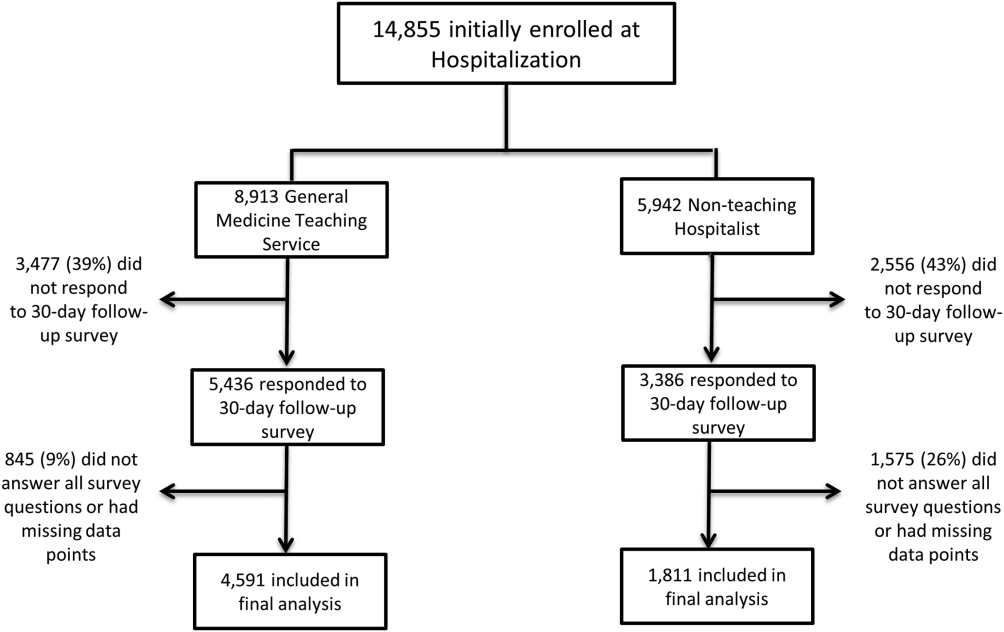
Memory and Sleep in Hospital Patients
Hospitalization is often utilized as a teachable moment, as patients are provided with education about treatment and disease management, particularly at discharge.[1, 2, 3] However, memory impairment among hospitalized patients may undermine the utility of the teachable moment. In one study of community‐dwelling seniors admitted to the hospital, one‐third had previously unrecognized poor memory at discharge.[4]
Sleep loss may be an underappreciated contributor to short‐term memory deficits in inpatients, particularly in seniors, who have baseline higher rates of sleep disruptions and sleep disorders.[5] Patients often receive 2 hours less sleep than at home and experience poor quality sleep due to disruptions.[6, 7] Robust studies of healthy subjects in laboratory settings demonstrate that sleep loss leads to decreased attention and worse recall, and that more sleep is associated with better memory performance.[8, 9]
Very few studies have examined memory in hospitalized patients. Although word‐list tasks are often used to assess memory because they are quick and easy to administer, these tasks may not accurately reflect memory for a set of instructions provided at patient discharge. Finally, no studies have examined the association between inpatient sleep loss and memory. Thus, our primary aim in this study was to examine memory performance in older, hospitalized patients using a word listbased memory task and a more complex medical vignette task. Our second aim was to investigate the relationship between in‐hospital sleep and memory.
METHODS
Study Design
We conducted a prospective cohort study with subjects enrolled in an ongoing sleep study at the University of Chicago Medical Center.[10] Eligible subjects were on the general medicine or hematology/oncology service, at least 50 years old, community dwelling, ambulatory, and without detectable cognitive impairment on the Mini Mental State Exam[11] or Short Portable Mental Status Questionnaire.[12, 13] Patients were excluded if they had a documented sleep disorder (ie, obstructive sleep apnea), were transferred from an intensive care unit or were in droplet or airborne isolation, had a bedrest order, or had already spent over 72 hours in the hospital prior to enrollment. These criteria were used to select a population appropriate for wristwatch actigraphy and with low likelihood of baseline memory impairment. The University of Chicago Institutional Review Board approved this study, and participants provided written consent.
Data Collection
Memory Testing
Memory was evaluated using the University of Southern California Repeatable Episodic Memory Test (USC‐REMT), a validated verbal memory test in which subjects listen to a list of 15 words and then complete free‐recall and recognition of the list.[14, 15] Free‐recall tests subjects' ability to procure information without cues. In contrast, recognition requires subjects to pick out the words they just heard from distractors, an easier task. The USC‐REMT contains multiple functionally equivalent different word lists, and may be administered more than once to the same subject without learning effects.[15] Immediate and delayed memory were tested by asking the subject to complete the tasks immediately after listening to the word list and 24‐hours after listening to the list, respectively.
Immediate Recall and Recognition
Recall and recognition following a night of sleep in the hospital was the primary outcome for this study. After 1 night of actigraphy recorded sleep, subjects listened as a 15‐item word list (word list A) was read aloud. For the free‐recall task, subjects were asked to repeat back all the words they could remember immediately after hearing the list. For the recognition task, subjects were read a new list of 15 words, including a mix of words from the previous list and new distractor words. They answered yes if they thought the word had previously been read to them and no if they thought the word was new.
Delayed Recall and Delayed Recognition
At the conclusion of study enrollment on day 1 prior to the night of actigraphy, subjects were shown a laminated paper with a printed word list (word list B) from the USC‐REMT. They were given 2 minutes to study the sheet and were informed they would be asked to remember the words the following day. One day later, after the night of actigraphy recorded sleep, subjects completed the free recall and yes/no recognition task based on what they remembered from word list B. This established delayed recall and recognition scores.
Medical Vignette
Because it is unclear how word recall and recognition tasks approximate remembering discharge instructions, we developed a 5‐sentence vignette about an outpatient medical encounter, based on the logical memory component of the Wechsler Memory Scale IV, a commonly used, validated test of memory assessment.[16, 17] After the USC‐REMT was administered following a night of sleep in the hospital, patients listened to a story and were immediately asked to repeat back in free form as much information as possible from the story. Responses were recorded by trained research assistants. The story is comprised of short sentences with simple ideas and vocabulary (see Supporting Information, Appendix 1, in the online version of this article).
Sleep: Wrist Actigraphy and Karolinska Sleep Log
Patient sleep was measured by actigraphy following the protocol described previously by our group.[7] Patients wore a wrist actigraphy monitor (Actiwatch 2; Philips Respironics, Inc., Murrysville, PA) to collect data on sleep duration and quality. The monitor detects wrist movement by measuring acceleration.[18] Actigraphy has been validated against polysomnography, demonstrating a correlation in sleep duration of 0.82 in insomniacs and 0.97 in healthy subjects.[19] Sleep duration and sleep efficiency overnight were calculated from the actigraphy data using Actiware 5 software.[20] Sleep duration was defined by the software based on low levels of recorded movement. Sleep efficiency was calculated as the percentage of time asleep out of the subjects' self‐reported time in bed, which was obtained using the Karolinska Sleep Log.[21]
The Karolinska Sleep Log questionnaire also asks patients to rate their sleep quality, restlessness during sleep, ease of falling asleep and the ability to sleep through the night on a 5‐point scale. The Karolinska Sleep Quality Index (KSQI) is calculated by averaging the latter 4 items.[22] A score of 3 or less classifies the subject in an insomniac range.[7, 21]
Demographic Information
Demographic information, including age, race, and gender were obtained by chart audit.
Data Analysis
Data were entered into REDCap, a secure online tool for managing survey data.[23]
Memory Scoring
For immediate and delayed recall scores, subjects received 1 point for every word they remembered correctly, with a maximum score of 15 words. We defined poor memory on the immediate recall test as a score of 3 or lower, based on a score utilized by Lindquist et al.[4] in a similar task. This score was less than half of the mean score of 6.63 obtained by Parker et al. for a sample of healthy 60 to 79 year olds in a sensitivity study of the USC‐REMT.[14] For immediate and delayed recognition, subjects received 1 point for correctly identifying whether a word had been on the word list they heard or whether it was a distractor, with a maximum score of 15.
A key was created to standardize scoring of the medical vignette by assigning 1 point to specific correctly remembered items from the story (see Supporting Information, Appendix 2A, in the online version of this article). These points were added to obtain a total score for correctly remembered vignette items. It was also noted when a vignette item was remembered incorrectly, for example, when the patient remembered left foot instead of right foot. Each incorrectly remembered item received 1 point, and these were summed to create the total score for incorrectly remembered vignette items (see Supporting Information, Appendix 2A, in the online version of this article for the scoring guide). Forgotten items were assigned 0 points. Two independent raters scored each subject's responses, and their scores were averaged for each item. Inter‐rater reliability was calculated as percentage of agreement across responses.
Statistical Analysis
Descriptive statistics were performed on the memory task data. Tests for skew and curtosis were performed for recall and recognition task data. The mean and standard deviation (SD) were calculated for normally distributed data, and the median and interquartile range (IQR) were obtained for data that showed significant skew. Mean and SD were also calculated for sleep duration and sleep efficiency measured by actigraphy.
Two‐tailed t tests were used to examine the association between memory and gender and African American race. Cuzick's nonparametric test of trend was used to test the association between age quartile and recall and recognition scores.[24] Mean and standard deviation for the correct total score and incorrect total score for the medical vignette were calculated. Pearson's correlation coefficient was used to examine the association between USC‐REMT memory measures and medical vignette score.
Pearson's correlation coefficient was calculated to test the associations between sleep duration and memory scores (immediate and delayed recall, immediate and delayed recognition, medical vignette task). This test was repeated to examine the relationship between sleep efficiency and the above memory scores. Linear regression models were used to characterize the relationship between inpatient sleep duration and efficiency and memory task performance. Two‐tailed t tests were used to compare sleep metrics (duration and efficiency) between high‐ and low‐memory groups, with low memory defined as immediate recall of 3 words.
All statistical tests were conducted using Stata 12.0 software (StataCorp, College Station, TX). Statistical significance was defined as P<0.05.
RESULTS
From April 11, 2013 to May 3, 2014, 322 patients were eligible for our study. Of these, 99 patients were enrolled in the study. We were able to collect sleep actigraphy data and immediate memory scores from 59 on day 2 of the study (Figure 1).
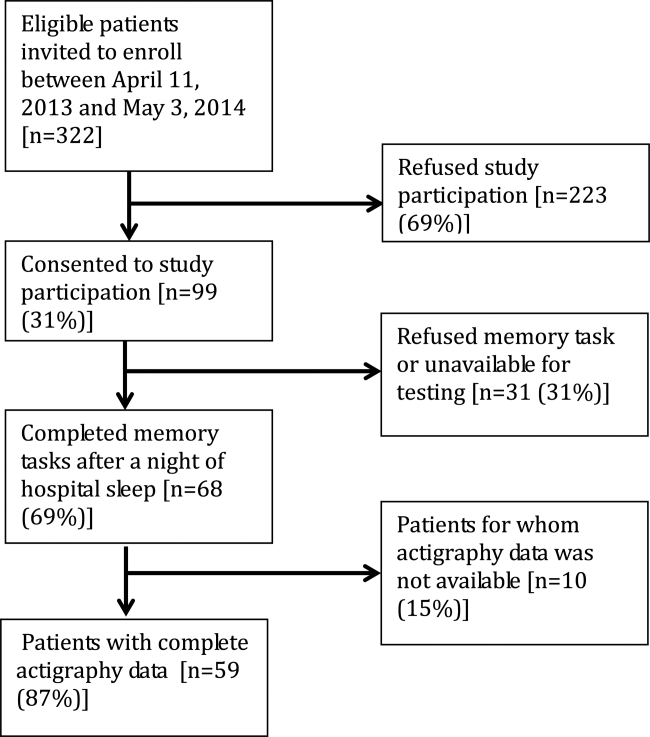
The study population had a mean age of 61.6 years (SD=9.3 years). Demographic information is presented in Table 1. Average nightly sleep in the hospital was 5.44 hours (326.4 minutes, SD=134.5 minutes), whereas mean sleep efficiency was 70.9 (SD=17.1), which is below the normal threshold of 85%.[25, 26] Forty‐four percent had a KSQI score of 3, representing in‐hospital sleep quality in the insomniac range.
| Value | |
|---|---|
| |
| Patient characteristics | |
| Age, y, mean (SD) | 61.6 (9.3) |
| Female, n (%) | 36 (61.0%) |
| BMI, n (%) | |
| Underweight (<18.5) | 3 (5.1%) |
| Normal weight (18.524.9) | 16 (27.1%) |
| Overweight (25.029.9) | 14 (23.7%) |
| Obese (30.0) | 26 (44.1%) |
| African American, n (%) | 43 (72.9%) |
| Non‐Hispanic, n (%) | 57 (96.6%) |
| Education, n (%) | |
| Did not finish high school | 13 (23.2%) |
| High school graduate | 13 (23.2%) |
| Some college or junior college | 16 (28.6%) |
| College graduate or postgraduate degree | 13 (23.2%) |
| Discharge diagnosis (ICD‐9‐CM classification), n (%) | |
| Circulatory system disease | 5 (8.5%) |
| Digestive system disease | 9 (15.3%) |
| Genitourinary system disease | 4 (6.8%) |
| Musculoskeletal system disease | 3 (5.1%) |
| Respiratory system disease | 5 (8.5%) |
| Sensory organ disease | 1 (1.7%) |
| Skin and subcutaneous tissue disease | 3 (5.1%) |
| Endocrine, nutritional, and metabolic disease | 7 (11.9%) |
| Infection and parasitic disease | 6 (10.2%) |
| Injury and poisoning | 4 (6.8%) |
| Mental disorders | 2 (3.4%) |
| Neoplasm | 5 (8.5%) |
| Symptoms, signs, and ill‐defined conditions | 5 (8.5%) |
| Comorbidities by self‐report, n=57, n (%) | |
| Cancer | 6 (10.5%) |
| Depression | 15 (26.3%) |
| Diabetes | 15 (26.3%) |
| Heart trouble | 16 (28.1%) |
| HIV/AIDS | 2 (3.5%) |
| Kidney disease | 10 (17.5%) |
| Liver disease | 9 (15.8%) |
| Stroke | 4 (7.0%) |
| Subject on the hematology and oncology service, n (%) | 6 (10.2%) |
| Sleep characteristics | |
| Nights in hospital prior to enrollment, n (%) | |
| 0 nights | 12 (20.3%) |
| 1 night | 24 (40.7%) |
| 2 nights | 17 (28.8%) |
| 3 nights | 6 (10.1%) |
| Received pharmacologic sleep aids, n (%) | 10 (17.0%) |
| Karolinska Sleep Quality Index scores, score 3, n (%) | 26 (44.1%) |
| Sleep duration, min, mean (SD) | 326.4 (134.5) |
| Sleep efficiency, %, mean (SD) | 70.9 (17.1) |
Memory test scores are presented in Figure 2. Nearly half (49%) of patients had poor memory, defined by a score of 3 words (Figure 2). Immediate recall scores varied significantly with age quartile, with older subjects recalling fewer words (Q1 [age 50.453.6 years] mean=4.9 words; Q2 [age 54.059.2 years] mean=4.1 words; Q3 [age 59.466.9 years] mean=3.7 words; Q4 [age 68.285.0 years] mean=2.5 words; P=0.001). Immediate recognition scores did not vary significantly by age quartile (Q1 [age 50.453.6 years] mean=10.3 words; Q2 [age 54.059.2 years] mean =10.3 words; Q3 [age 59.466.9 years)] mean=11.8 words; Q4 [age 68.285.0 years] mean=10.4 words; P=0.992). Fifty‐two subjects completed the delayed memory tasks. The median delayed recall score was low, at 1 word (IQR=02), with 44% of subjects remembering 0 items. Delayed memory scores were not associated with age quartile. There was no association between any memory scores and gender or African American race.
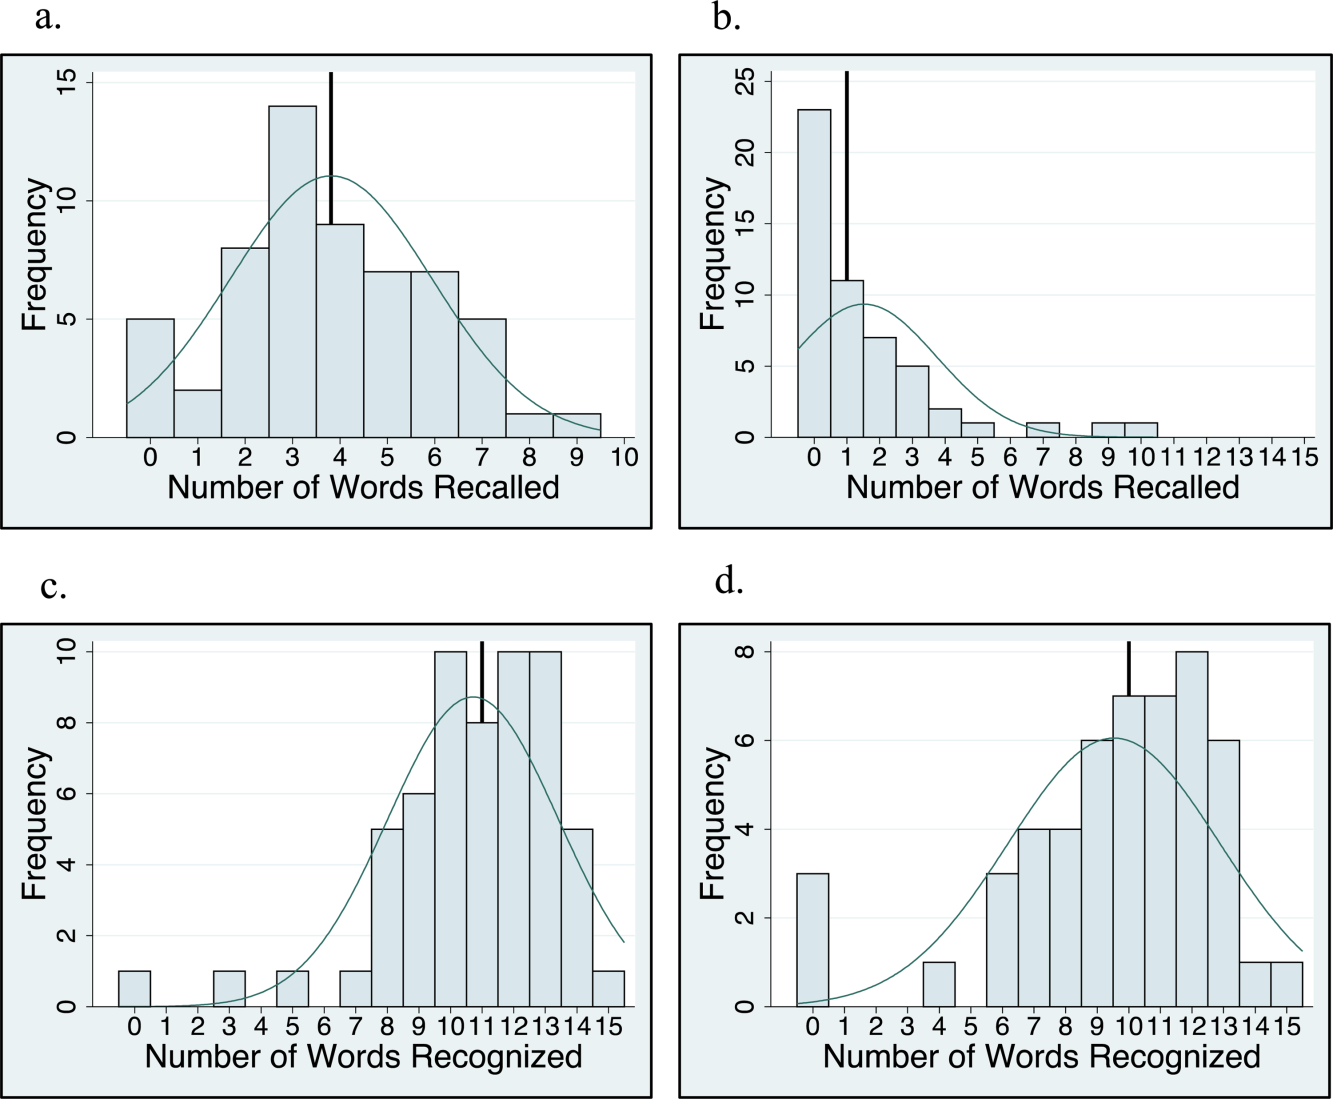
For 35 subjects in this study, we piloted the use of the medical vignette memory task. Two raters scored subject responses. Of the 525 total items, there was 98.1% agreement between the 2 raters, and only 7 out of 35 subjects' total scores differed between the 2 raters (see Supporting Information, Appendix 2B, in the online version of this article for detailed results). Median number of items remembered correctly was 4 out of 15 (IQR=26). Median number of incorrectly remembered items was 0.5 (IQR=01). Up to 57% (20 subjects) incorrectly remembered at least 1 item. The medical vignette memory score was significantly correlated with immediate recall score (r=0.49, P<0.01), but not immediate recognition score (r=0.24, P=0.16), delayed recall (r=0.13, P=0.47), or delayed recognition (r=0.01, P=0.96). There was a negative relationship between the number of items correctly recalled by a subject and the number of incorrectly recalled items on the medical vignette memory task that did not reach statistical significance (r=0.32, P=0.06).
There was no association between sleep duration, sleep efficiency, and KSQI with memory scores (immediate and delayed recall, immediate and delayed recognition, medical vignette task) (Table 2.) The relationship between objective sleep measures and immediate memory are plotted in Figure 3. Finally, there was no significant difference in sleep duration or efficiency between groups with high memory (immediate recall of >3 words) and low memory (immediate recall of 3 words).
| Independent Variables | ||||
|---|---|---|---|---|
| Sleep Duration, h | Sleep Efficiency, % | Karolinska Sleep Quality Index | ||
| Immediate recall (n=59) | Pearson's r | 0.044 | 0.2 | 0.18 |
| coefficient | 0.042 | 0.025 | 0.27 | |
| P value | 0.74 | 0.12 | 0.16 | |
| Immediate recognition (n=59) | Pearson's r | 0.066 | 0.037 | 0.13 |
| coefficient | 0.080 | 0.0058 | 0.25 | |
| P value | 0.62 | 0.78 | 0.31 | |
| Delayed recall (n=52) | Pearson's r | 0.028 | 0.0020 | 0.0081 |
| coefficient | 0.027 | 0.00025 | 0.012 | |
| P value | 0.85 | 0.99 | 0.96 | |
| Delayed recognition (n=52) | Pearson's r | 0.21 | 0.12 | 0.15 |
| coefficient | 0.31 | 0.024 | 0.35 | |
| P value | 0.13 | 0.39 | 0.29 | |
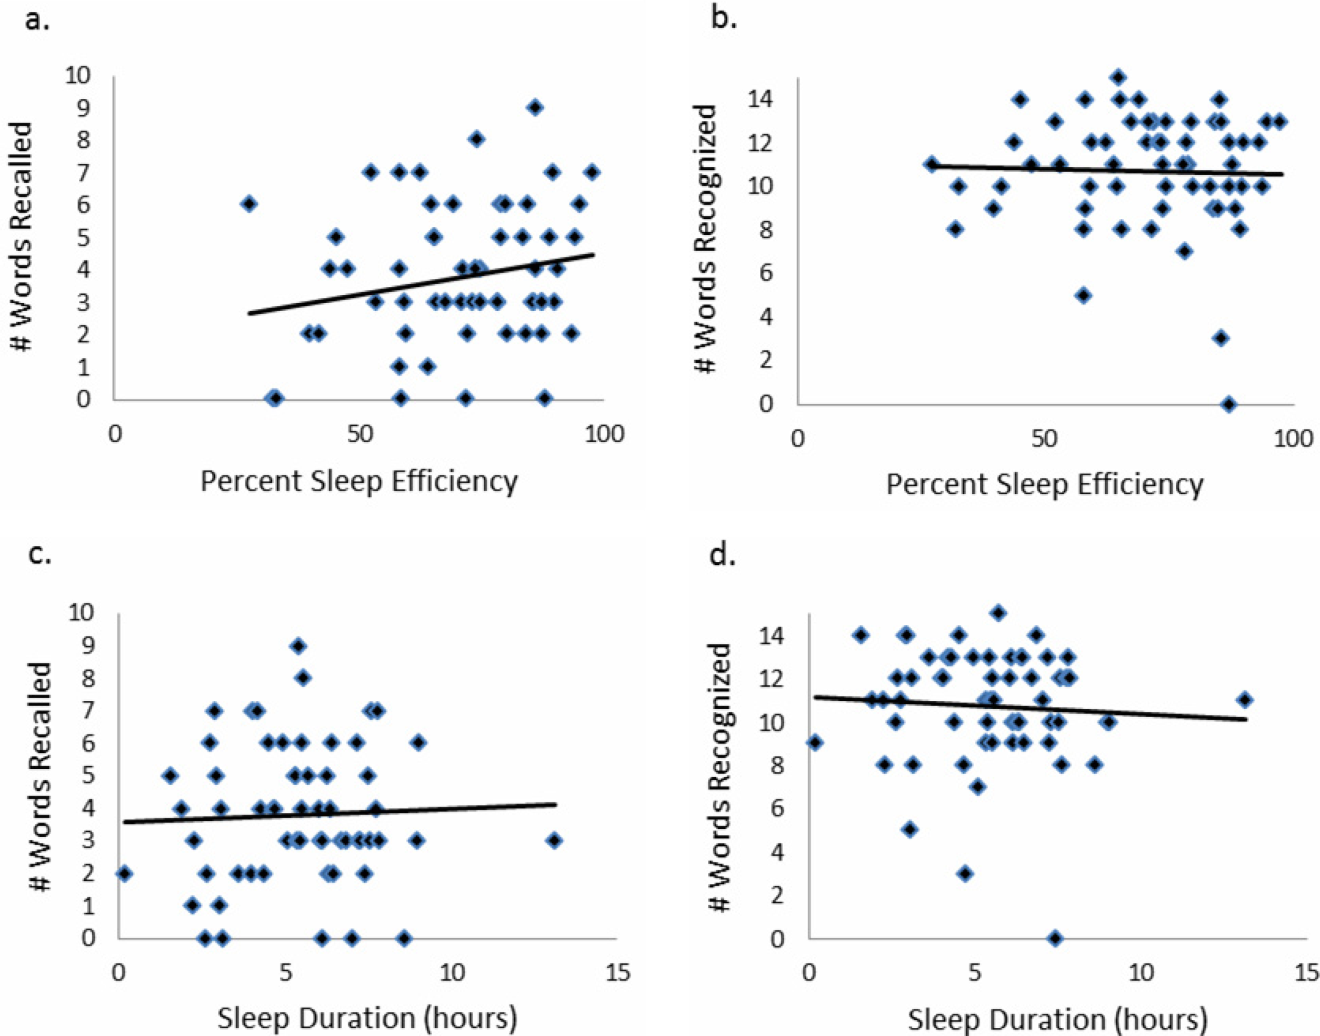
CONCLUSIONS/DISCUSSION
This study demonstrated that roughly half of hospitalized older adults without diagnosed memory or cognitive impairment had poor memory using an immediate word recall task. Although performance on an immediate word recall task may not be considered a good approximation for remembering discharge instructions, immediate recall did correlate with performance on a more complex medical vignette memory task. Though our subjects had low sleep efficiency and duration while in the hospital, memory performance was not significantly associated with inpatient sleep.
Perhaps the most concerning finding in this study was the substantial number of subjects who had poor memory. In addition to scoring approximately 1 SD lower than the community sample of healthy older adults tested in the sensitivity study of USC‐REMT,[14] our subjects also scored lower on immediate recall when compared to another hospitalized patient study.[4] In the study by Lindquist et al. that utilized a similar 15‐item word recall task in hospitalized patients, 29% of subjects were found to have poor memory (recall score of 3 words), compared to 49% in our study. In our 24‐hour delayed recall task we found that 44% of our patients could not recall a single word, with 65% remembering 1 word or fewer. In their study, Lindquist et al. similarly found that greater than 50% of subjects qualified as poor memory by recalling 1 or fewer words after merely an 8‐minute delay. Given these findings, hospitalization may not be the optimal teachable moment that it is often suggested to be. Use of transition coaches, memory aids like written instructions and reminders, and involvement of caregivers are likely critical to ensuring inpatients retain instructions and knowledge. More focus also needs to be given to older patients, who often have the worst memory. Technology tools, such as the Vocera Good To Go app, could allow medical professionals to make audio recordings of discharge instructions that patients may access at any time on a mobile device.
This study also has implications for how to measure memory in inpatients. For example, a vignette‐based memory test may be appropriate for assessing inpatient memory for discharge instructions. Our task was easy to administer and correlated with immediate recall scores. Furthermore, the story‐based task helps us to establish a sense of how much information from a paragraph is truly remembered. Our data show that only 4 items of 15 were remembered, and the majority of subjects actually misremembered 1 item. This latter measure sheds light on the rate of inaccuracy of patient recall. It is worth noting also that word recognition showed a ceiling effect in our sample, suggesting the task was too easy. In contrast, delayed recall was too difficult, as scores showed a floor effect, with over half of our sample unable to recall a single word after a 24‐hour delay.
This is the first study to assess the relationship between sleep loss and memory in hospitalized patients. We found that memory scores were not significantly associated with sleep duration, sleep efficiency, or with the self‐reported KSQI. Memory during hospitalization may be affected by factors other than sleep, like cognition, obscuring the relationship between sleep and memory. It is also possible that we were unable to see a significant association between sleep and memory because of universally low sleep duration and efficiency scores in the hospital.
Our study has several limitations. Most importantly, this study includes a small number of subjects who were hospitalized on a general medicine service at a single institution, limiting generalizability. Also importantly, our data capture only 1 night of sleep, and this may limit our study's ability to detect an association between hospital sleep and memory. More longitudinal data measuring sleep and memory across a longer period of time may reveal the distinct contribution of in‐hospital sleep. We also excluded patients with known cognitive impairment from enrollment, limiting our patient population to those with only high cognitive reserve. We hypothesize that patients with dementia experience both increased sleep disturbance and greater decline in memory during hospitalization. In addition, we are unable to test causal associations in this observational study. Furthermore, we applied a standardized memory test, the USC‐REMT, in a hospital setting, where noise and other disruptions at the time of test administration cannot be completely controlled. This makes it difficult to compare our results with those of community‐dwelling members taking the test under optimal conditions. Finally, because we created our own medical vignette task, future testing to validate this method against other memory testing is warranted.
In conclusion, our results show that memory in older hospitalized inpatients is often impaired, despite patients' appearing cognitively intact. These deficits in memory are revealed by a word recall task and also by a medical vignette task that more closely approximates memory for complex discharge instructions.
Disclosure
This work was funded by the National Institute on Aging Short‐Term Aging‐Related Research Program (5T35AG029795),the National Institute on Aging Career Development Award (K23AG033763), and the National Heart Lung and Blood Institute (R25 HL116372).
- . Importance of in‐hospital initiation of evidence‐based medical therapies for heart failure: taking advantage of the teachable moment. Congest Heart Fail. 2005;11(3):153–154.
- , , , , . Smoking cessation in hospitalized patients: results of a randomized trial. Arch Intern Med. 1997;157(4):409–415.
- , , . Smoking cessation interventions for hospitalized smokers: a systematic review. Arch Intern Med. 2008;168(18):1950–1960.
- , , , , . Improvements in cognition following hospital discharge of community dwelling seniors. J Gen Intern Med. 2011;26(7):765–770.
- , , , . Sleep and aging: 1. sleep disorders commonly found in older people. Can Med Assoc J. 2007;176(9):1299–1304.
- . Noise and sleep among adult medical inpatients: far from a quiet night. Arch Intern Med. 2012;172(1):68–70.
- , , , , , . Perceived control and sleep in hospitalized older adults: a sound hypothesis? J Hosp Med. 2013;8(4):184–190.
- , . A meta‐analysis of the impact of short‐term sleep deprivation on cognitive variables. Psychol Bull. 2010;136(3):375–389.
- , . Sleep deprivation: Impact on cognitive performance. Neuropsychiatr Dis Treat. 2007;3(5):553–567.
- , , , et al. Effects of physician experience on costs and outcomes on an academic general medicine service: results of a trial of hospitalists. Ann Intern Med. 2002;137(11):866–874.
- , , . “Mini‐mental state”: a practical method for grading the cognitive state of patients for the clinician. J Psychiatr Res. 1975;12(3):189–198.
- . A short portable mental status questionnaire for the assessment of organic brain deficit in elderly patients. J Am Geriatr Soc. 1975;10:433–441.
- , , , . Reliability and validity of the Short Portable Mental Status Questionnaire administered by telephone. J Geriatr Psychiatry Neurol. 1994;7(1):33–38.
- , , , . Aging, recall and recognition: a study on the sensitivity of the University of Southern California Repeatable Episodic Memory Test (USC‐REMT). J Clin Exp Neuropsychol. 2004;26(3):428–440.
- , , , , . University of southern california repeatable episodic memory test. J Clin Exp Neuropsychol. 1995;17(6):926–936.
- , , . Development of alternate paragraphs for the logical memory subtest of the Wechsler Memory Scale‐Revised. Clin Neuropsychol. 1997;11(4):370–374.
- , , . A Compendium of Neuropsychological Tests: Administration, Norms, and Commentary. 3rd ed. New York, NY: Oxford University Press; 2009.
- . Review of physical activity measurement using accelerometers in older adults: considerations for research design and conduct. Prev Med. 2009;48(2):108–114.
- , , , , , . The actigraph data analysis software: I. A novel approach to scoring and interpreting sleep‐wake activity. Percept Mot Skills. 1997;85(1):207–216.
- , , , et al. Evaluation of immobility time for sleep latency in actigraphy. Sleep Med. 2009;10(6):621–625.
- , , , , . The subjective meaning of sleep quality: a comparison of individuals with and without insomnia. Sleep. 2008;31(3):383–393.
- , . Objective components of individual differences in subjective sleep quality. J Sleep Res. 1997;6(4):217–220.
- , , , , , . Research electronic data capture (REDCap)—a metadata‐driven methodology and workflow process for providing translational research informatics support. J Biomed Inform. 2009;42(2):377–381.
- . A Wilcoxon‐type test for trend. Stat Med. 1985;4(1):87–90.
- , , , et al. Derivation of research diagnostic criteria for insomnia: report of an American Academy of Sleep Medicine Work Group. Sleep. 2004;27(8):1567–1596.
- , , , , . Quantitative criteria for insomnia. Behav Res Ther. 2003;41(4):427–445.
Hospitalization is often utilized as a teachable moment, as patients are provided with education about treatment and disease management, particularly at discharge.[1, 2, 3] However, memory impairment among hospitalized patients may undermine the utility of the teachable moment. In one study of community‐dwelling seniors admitted to the hospital, one‐third had previously unrecognized poor memory at discharge.[4]
Sleep loss may be an underappreciated contributor to short‐term memory deficits in inpatients, particularly in seniors, who have baseline higher rates of sleep disruptions and sleep disorders.[5] Patients often receive 2 hours less sleep than at home and experience poor quality sleep due to disruptions.[6, 7] Robust studies of healthy subjects in laboratory settings demonstrate that sleep loss leads to decreased attention and worse recall, and that more sleep is associated with better memory performance.[8, 9]
Very few studies have examined memory in hospitalized patients. Although word‐list tasks are often used to assess memory because they are quick and easy to administer, these tasks may not accurately reflect memory for a set of instructions provided at patient discharge. Finally, no studies have examined the association between inpatient sleep loss and memory. Thus, our primary aim in this study was to examine memory performance in older, hospitalized patients using a word listbased memory task and a more complex medical vignette task. Our second aim was to investigate the relationship between in‐hospital sleep and memory.
METHODS
Study Design
We conducted a prospective cohort study with subjects enrolled in an ongoing sleep study at the University of Chicago Medical Center.[10] Eligible subjects were on the general medicine or hematology/oncology service, at least 50 years old, community dwelling, ambulatory, and without detectable cognitive impairment on the Mini Mental State Exam[11] or Short Portable Mental Status Questionnaire.[12, 13] Patients were excluded if they had a documented sleep disorder (ie, obstructive sleep apnea), were transferred from an intensive care unit or were in droplet or airborne isolation, had a bedrest order, or had already spent over 72 hours in the hospital prior to enrollment. These criteria were used to select a population appropriate for wristwatch actigraphy and with low likelihood of baseline memory impairment. The University of Chicago Institutional Review Board approved this study, and participants provided written consent.
Data Collection
Memory Testing
Memory was evaluated using the University of Southern California Repeatable Episodic Memory Test (USC‐REMT), a validated verbal memory test in which subjects listen to a list of 15 words and then complete free‐recall and recognition of the list.[14, 15] Free‐recall tests subjects' ability to procure information without cues. In contrast, recognition requires subjects to pick out the words they just heard from distractors, an easier task. The USC‐REMT contains multiple functionally equivalent different word lists, and may be administered more than once to the same subject without learning effects.[15] Immediate and delayed memory were tested by asking the subject to complete the tasks immediately after listening to the word list and 24‐hours after listening to the list, respectively.
Immediate Recall and Recognition
Recall and recognition following a night of sleep in the hospital was the primary outcome for this study. After 1 night of actigraphy recorded sleep, subjects listened as a 15‐item word list (word list A) was read aloud. For the free‐recall task, subjects were asked to repeat back all the words they could remember immediately after hearing the list. For the recognition task, subjects were read a new list of 15 words, including a mix of words from the previous list and new distractor words. They answered yes if they thought the word had previously been read to them and no if they thought the word was new.
Delayed Recall and Delayed Recognition
At the conclusion of study enrollment on day 1 prior to the night of actigraphy, subjects were shown a laminated paper with a printed word list (word list B) from the USC‐REMT. They were given 2 minutes to study the sheet and were informed they would be asked to remember the words the following day. One day later, after the night of actigraphy recorded sleep, subjects completed the free recall and yes/no recognition task based on what they remembered from word list B. This established delayed recall and recognition scores.
Medical Vignette
Because it is unclear how word recall and recognition tasks approximate remembering discharge instructions, we developed a 5‐sentence vignette about an outpatient medical encounter, based on the logical memory component of the Wechsler Memory Scale IV, a commonly used, validated test of memory assessment.[16, 17] After the USC‐REMT was administered following a night of sleep in the hospital, patients listened to a story and were immediately asked to repeat back in free form as much information as possible from the story. Responses were recorded by trained research assistants. The story is comprised of short sentences with simple ideas and vocabulary (see Supporting Information, Appendix 1, in the online version of this article).
Sleep: Wrist Actigraphy and Karolinska Sleep Log
Patient sleep was measured by actigraphy following the protocol described previously by our group.[7] Patients wore a wrist actigraphy monitor (Actiwatch 2; Philips Respironics, Inc., Murrysville, PA) to collect data on sleep duration and quality. The monitor detects wrist movement by measuring acceleration.[18] Actigraphy has been validated against polysomnography, demonstrating a correlation in sleep duration of 0.82 in insomniacs and 0.97 in healthy subjects.[19] Sleep duration and sleep efficiency overnight were calculated from the actigraphy data using Actiware 5 software.[20] Sleep duration was defined by the software based on low levels of recorded movement. Sleep efficiency was calculated as the percentage of time asleep out of the subjects' self‐reported time in bed, which was obtained using the Karolinska Sleep Log.[21]
The Karolinska Sleep Log questionnaire also asks patients to rate their sleep quality, restlessness during sleep, ease of falling asleep and the ability to sleep through the night on a 5‐point scale. The Karolinska Sleep Quality Index (KSQI) is calculated by averaging the latter 4 items.[22] A score of 3 or less classifies the subject in an insomniac range.[7, 21]
Demographic Information
Demographic information, including age, race, and gender were obtained by chart audit.
Data Analysis
Data were entered into REDCap, a secure online tool for managing survey data.[23]
Memory Scoring
For immediate and delayed recall scores, subjects received 1 point for every word they remembered correctly, with a maximum score of 15 words. We defined poor memory on the immediate recall test as a score of 3 or lower, based on a score utilized by Lindquist et al.[4] in a similar task. This score was less than half of the mean score of 6.63 obtained by Parker et al. for a sample of healthy 60 to 79 year olds in a sensitivity study of the USC‐REMT.[14] For immediate and delayed recognition, subjects received 1 point for correctly identifying whether a word had been on the word list they heard or whether it was a distractor, with a maximum score of 15.
A key was created to standardize scoring of the medical vignette by assigning 1 point to specific correctly remembered items from the story (see Supporting Information, Appendix 2A, in the online version of this article). These points were added to obtain a total score for correctly remembered vignette items. It was also noted when a vignette item was remembered incorrectly, for example, when the patient remembered left foot instead of right foot. Each incorrectly remembered item received 1 point, and these were summed to create the total score for incorrectly remembered vignette items (see Supporting Information, Appendix 2A, in the online version of this article for the scoring guide). Forgotten items were assigned 0 points. Two independent raters scored each subject's responses, and their scores were averaged for each item. Inter‐rater reliability was calculated as percentage of agreement across responses.
Statistical Analysis
Descriptive statistics were performed on the memory task data. Tests for skew and curtosis were performed for recall and recognition task data. The mean and standard deviation (SD) were calculated for normally distributed data, and the median and interquartile range (IQR) were obtained for data that showed significant skew. Mean and SD were also calculated for sleep duration and sleep efficiency measured by actigraphy.
Two‐tailed t tests were used to examine the association between memory and gender and African American race. Cuzick's nonparametric test of trend was used to test the association between age quartile and recall and recognition scores.[24] Mean and standard deviation for the correct total score and incorrect total score for the medical vignette were calculated. Pearson's correlation coefficient was used to examine the association between USC‐REMT memory measures and medical vignette score.
Pearson's correlation coefficient was calculated to test the associations between sleep duration and memory scores (immediate and delayed recall, immediate and delayed recognition, medical vignette task). This test was repeated to examine the relationship between sleep efficiency and the above memory scores. Linear regression models were used to characterize the relationship between inpatient sleep duration and efficiency and memory task performance. Two‐tailed t tests were used to compare sleep metrics (duration and efficiency) between high‐ and low‐memory groups, with low memory defined as immediate recall of 3 words.
All statistical tests were conducted using Stata 12.0 software (StataCorp, College Station, TX). Statistical significance was defined as P<0.05.
RESULTS
From April 11, 2013 to May 3, 2014, 322 patients were eligible for our study. Of these, 99 patients were enrolled in the study. We were able to collect sleep actigraphy data and immediate memory scores from 59 on day 2 of the study (Figure 1).
The study population had a mean age of 61.6 years (SD=9.3 years). Demographic information is presented in Table 1. Average nightly sleep in the hospital was 5.44 hours (326.4 minutes, SD=134.5 minutes), whereas mean sleep efficiency was 70.9 (SD=17.1), which is below the normal threshold of 85%.[25, 26] Forty‐four percent had a KSQI score of 3, representing in‐hospital sleep quality in the insomniac range.
| Value | |
|---|---|
| |
| Patient characteristics | |
| Age, y, mean (SD) | 61.6 (9.3) |
| Female, n (%) | 36 (61.0%) |
| BMI, n (%) | |
| Underweight (<18.5) | 3 (5.1%) |
| Normal weight (18.524.9) | 16 (27.1%) |
| Overweight (25.029.9) | 14 (23.7%) |
| Obese (30.0) | 26 (44.1%) |
| African American, n (%) | 43 (72.9%) |
| Non‐Hispanic, n (%) | 57 (96.6%) |
| Education, n (%) | |
| Did not finish high school | 13 (23.2%) |
| High school graduate | 13 (23.2%) |
| Some college or junior college | 16 (28.6%) |
| College graduate or postgraduate degree | 13 (23.2%) |
| Discharge diagnosis (ICD‐9‐CM classification), n (%) | |
| Circulatory system disease | 5 (8.5%) |
| Digestive system disease | 9 (15.3%) |
| Genitourinary system disease | 4 (6.8%) |
| Musculoskeletal system disease | 3 (5.1%) |
| Respiratory system disease | 5 (8.5%) |
| Sensory organ disease | 1 (1.7%) |
| Skin and subcutaneous tissue disease | 3 (5.1%) |
| Endocrine, nutritional, and metabolic disease | 7 (11.9%) |
| Infection and parasitic disease | 6 (10.2%) |
| Injury and poisoning | 4 (6.8%) |
| Mental disorders | 2 (3.4%) |
| Neoplasm | 5 (8.5%) |
| Symptoms, signs, and ill‐defined conditions | 5 (8.5%) |
| Comorbidities by self‐report, n=57, n (%) | |
| Cancer | 6 (10.5%) |
| Depression | 15 (26.3%) |
| Diabetes | 15 (26.3%) |
| Heart trouble | 16 (28.1%) |
| HIV/AIDS | 2 (3.5%) |
| Kidney disease | 10 (17.5%) |
| Liver disease | 9 (15.8%) |
| Stroke | 4 (7.0%) |
| Subject on the hematology and oncology service, n (%) | 6 (10.2%) |
| Sleep characteristics | |
| Nights in hospital prior to enrollment, n (%) | |
| 0 nights | 12 (20.3%) |
| 1 night | 24 (40.7%) |
| 2 nights | 17 (28.8%) |
| 3 nights | 6 (10.1%) |
| Received pharmacologic sleep aids, n (%) | 10 (17.0%) |
| Karolinska Sleep Quality Index scores, score 3, n (%) | 26 (44.1%) |
| Sleep duration, min, mean (SD) | 326.4 (134.5) |
| Sleep efficiency, %, mean (SD) | 70.9 (17.1) |
Memory test scores are presented in Figure 2. Nearly half (49%) of patients had poor memory, defined by a score of 3 words (Figure 2). Immediate recall scores varied significantly with age quartile, with older subjects recalling fewer words (Q1 [age 50.453.6 years] mean=4.9 words; Q2 [age 54.059.2 years] mean=4.1 words; Q3 [age 59.466.9 years] mean=3.7 words; Q4 [age 68.285.0 years] mean=2.5 words; P=0.001). Immediate recognition scores did not vary significantly by age quartile (Q1 [age 50.453.6 years] mean=10.3 words; Q2 [age 54.059.2 years] mean =10.3 words; Q3 [age 59.466.9 years)] mean=11.8 words; Q4 [age 68.285.0 years] mean=10.4 words; P=0.992). Fifty‐two subjects completed the delayed memory tasks. The median delayed recall score was low, at 1 word (IQR=02), with 44% of subjects remembering 0 items. Delayed memory scores were not associated with age quartile. There was no association between any memory scores and gender or African American race.
For 35 subjects in this study, we piloted the use of the medical vignette memory task. Two raters scored subject responses. Of the 525 total items, there was 98.1% agreement between the 2 raters, and only 7 out of 35 subjects' total scores differed between the 2 raters (see Supporting Information, Appendix 2B, in the online version of this article for detailed results). Median number of items remembered correctly was 4 out of 15 (IQR=26). Median number of incorrectly remembered items was 0.5 (IQR=01). Up to 57% (20 subjects) incorrectly remembered at least 1 item. The medical vignette memory score was significantly correlated with immediate recall score (r=0.49, P<0.01), but not immediate recognition score (r=0.24, P=0.16), delayed recall (r=0.13, P=0.47), or delayed recognition (r=0.01, P=0.96). There was a negative relationship between the number of items correctly recalled by a subject and the number of incorrectly recalled items on the medical vignette memory task that did not reach statistical significance (r=0.32, P=0.06).
There was no association between sleep duration, sleep efficiency, and KSQI with memory scores (immediate and delayed recall, immediate and delayed recognition, medical vignette task) (Table 2.) The relationship between objective sleep measures and immediate memory are plotted in Figure 3. Finally, there was no significant difference in sleep duration or efficiency between groups with high memory (immediate recall of >3 words) and low memory (immediate recall of 3 words).
| Independent Variables | ||||
|---|---|---|---|---|
| Sleep Duration, h | Sleep Efficiency, % | Karolinska Sleep Quality Index | ||
| Immediate recall (n=59) | Pearson's r | 0.044 | 0.2 | 0.18 |
| coefficient | 0.042 | 0.025 | 0.27 | |
| P value | 0.74 | 0.12 | 0.16 | |
| Immediate recognition (n=59) | Pearson's r | 0.066 | 0.037 | 0.13 |
| coefficient | 0.080 | 0.0058 | 0.25 | |
| P value | 0.62 | 0.78 | 0.31 | |
| Delayed recall (n=52) | Pearson's r | 0.028 | 0.0020 | 0.0081 |
| coefficient | 0.027 | 0.00025 | 0.012 | |
| P value | 0.85 | 0.99 | 0.96 | |
| Delayed recognition (n=52) | Pearson's r | 0.21 | 0.12 | 0.15 |
| coefficient | 0.31 | 0.024 | 0.35 | |
| P value | 0.13 | 0.39 | 0.29 | |
CONCLUSIONS/DISCUSSION
This study demonstrated that roughly half of hospitalized older adults without diagnosed memory or cognitive impairment had poor memory using an immediate word recall task. Although performance on an immediate word recall task may not be considered a good approximation for remembering discharge instructions, immediate recall did correlate with performance on a more complex medical vignette memory task. Though our subjects had low sleep efficiency and duration while in the hospital, memory performance was not significantly associated with inpatient sleep.
Perhaps the most concerning finding in this study was the substantial number of subjects who had poor memory. In addition to scoring approximately 1 SD lower than the community sample of healthy older adults tested in the sensitivity study of USC‐REMT,[14] our subjects also scored lower on immediate recall when compared to another hospitalized patient study.[4] In the study by Lindquist et al. that utilized a similar 15‐item word recall task in hospitalized patients, 29% of subjects were found to have poor memory (recall score of 3 words), compared to 49% in our study. In our 24‐hour delayed recall task we found that 44% of our patients could not recall a single word, with 65% remembering 1 word or fewer. In their study, Lindquist et al. similarly found that greater than 50% of subjects qualified as poor memory by recalling 1 or fewer words after merely an 8‐minute delay. Given these findings, hospitalization may not be the optimal teachable moment that it is often suggested to be. Use of transition coaches, memory aids like written instructions and reminders, and involvement of caregivers are likely critical to ensuring inpatients retain instructions and knowledge. More focus also needs to be given to older patients, who often have the worst memory. Technology tools, such as the Vocera Good To Go app, could allow medical professionals to make audio recordings of discharge instructions that patients may access at any time on a mobile device.
This study also has implications for how to measure memory in inpatients. For example, a vignette‐based memory test may be appropriate for assessing inpatient memory for discharge instructions. Our task was easy to administer and correlated with immediate recall scores. Furthermore, the story‐based task helps us to establish a sense of how much information from a paragraph is truly remembered. Our data show that only 4 items of 15 were remembered, and the majority of subjects actually misremembered 1 item. This latter measure sheds light on the rate of inaccuracy of patient recall. It is worth noting also that word recognition showed a ceiling effect in our sample, suggesting the task was too easy. In contrast, delayed recall was too difficult, as scores showed a floor effect, with over half of our sample unable to recall a single word after a 24‐hour delay.
This is the first study to assess the relationship between sleep loss and memory in hospitalized patients. We found that memory scores were not significantly associated with sleep duration, sleep efficiency, or with the self‐reported KSQI. Memory during hospitalization may be affected by factors other than sleep, like cognition, obscuring the relationship between sleep and memory. It is also possible that we were unable to see a significant association between sleep and memory because of universally low sleep duration and efficiency scores in the hospital.
Our study has several limitations. Most importantly, this study includes a small number of subjects who were hospitalized on a general medicine service at a single institution, limiting generalizability. Also importantly, our data capture only 1 night of sleep, and this may limit our study's ability to detect an association between hospital sleep and memory. More longitudinal data measuring sleep and memory across a longer period of time may reveal the distinct contribution of in‐hospital sleep. We also excluded patients with known cognitive impairment from enrollment, limiting our patient population to those with only high cognitive reserve. We hypothesize that patients with dementia experience both increased sleep disturbance and greater decline in memory during hospitalization. In addition, we are unable to test causal associations in this observational study. Furthermore, we applied a standardized memory test, the USC‐REMT, in a hospital setting, where noise and other disruptions at the time of test administration cannot be completely controlled. This makes it difficult to compare our results with those of community‐dwelling members taking the test under optimal conditions. Finally, because we created our own medical vignette task, future testing to validate this method against other memory testing is warranted.
In conclusion, our results show that memory in older hospitalized inpatients is often impaired, despite patients' appearing cognitively intact. These deficits in memory are revealed by a word recall task and also by a medical vignette task that more closely approximates memory for complex discharge instructions.
Disclosure
This work was funded by the National Institute on Aging Short‐Term Aging‐Related Research Program (5T35AG029795),the National Institute on Aging Career Development Award (K23AG033763), and the National Heart Lung and Blood Institute (R25 HL116372).
- . Importance of in‐hospital initiation of evidence‐based medical therapies for heart failure: taking advantage of the teachable moment. Congest Heart Fail. 2005;11(3):153–154.
- , , , , . Smoking cessation in hospitalized patients: results of a randomized trial. Arch Intern Med. 1997;157(4):409–415.
- , , . Smoking cessation interventions for hospitalized smokers: a systematic review. Arch Intern Med. 2008;168(18):1950–1960.
- , , , , . Improvements in cognition following hospital discharge of community dwelling seniors. J Gen Intern Med. 2011;26(7):765–770.
- , , , . Sleep and aging: 1. sleep disorders commonly found in older people. Can Med Assoc J. 2007;176(9):1299–1304.
- . Noise and sleep among adult medical inpatients: far from a quiet night. Arch Intern Med. 2012;172(1):68–70.
- , , , , , . Perceived control and sleep in hospitalized older adults: a sound hypothesis? J Hosp Med. 2013;8(4):184–190.
- , . A meta‐analysis of the impact of short‐term sleep deprivation on cognitive variables. Psychol Bull. 2010;136(3):375–389.
- , . Sleep deprivation: Impact on cognitive performance. Neuropsychiatr Dis Treat. 2007;3(5):553–567.
- , , , et al. Effects of physician experience on costs and outcomes on an academic general medicine service: results of a trial of hospitalists. Ann Intern Med. 2002;137(11):866–874.
- , , . “Mini‐mental state”: a practical method for grading the cognitive state of patients for the clinician. J Psychiatr Res. 1975;12(3):189–198.
- . A short portable mental status questionnaire for the assessment of organic brain deficit in elderly patients. J Am Geriatr Soc. 1975;10:433–441.
- , , , . Reliability and validity of the Short Portable Mental Status Questionnaire administered by telephone. J Geriatr Psychiatry Neurol. 1994;7(1):33–38.
- , , , . Aging, recall and recognition: a study on the sensitivity of the University of Southern California Repeatable Episodic Memory Test (USC‐REMT). J Clin Exp Neuropsychol. 2004;26(3):428–440.
- , , , , . University of southern california repeatable episodic memory test. J Clin Exp Neuropsychol. 1995;17(6):926–936.
- , , . Development of alternate paragraphs for the logical memory subtest of the Wechsler Memory Scale‐Revised. Clin Neuropsychol. 1997;11(4):370–374.
- , , . A Compendium of Neuropsychological Tests: Administration, Norms, and Commentary. 3rd ed. New York, NY: Oxford University Press; 2009.
- . Review of physical activity measurement using accelerometers in older adults: considerations for research design and conduct. Prev Med. 2009;48(2):108–114.
- , , , , , . The actigraph data analysis software: I. A novel approach to scoring and interpreting sleep‐wake activity. Percept Mot Skills. 1997;85(1):207–216.
- , , , et al. Evaluation of immobility time for sleep latency in actigraphy. Sleep Med. 2009;10(6):621–625.
- , , , , . The subjective meaning of sleep quality: a comparison of individuals with and without insomnia. Sleep. 2008;31(3):383–393.
- , . Objective components of individual differences in subjective sleep quality. J Sleep Res. 1997;6(4):217–220.
- , , , , , . Research electronic data capture (REDCap)—a metadata‐driven methodology and workflow process for providing translational research informatics support. J Biomed Inform. 2009;42(2):377–381.
- . A Wilcoxon‐type test for trend. Stat Med. 1985;4(1):87–90.
- , , , et al. Derivation of research diagnostic criteria for insomnia: report of an American Academy of Sleep Medicine Work Group. Sleep. 2004;27(8):1567–1596.
- , , , , . Quantitative criteria for insomnia. Behav Res Ther. 2003;41(4):427–445.
© 2015 Society of Hospital Medicine
