User login
Health Literacy and Hospital Length of Stay: An Inpatient Cohort Study
Health literacy (HL), defined as patients’ ability to understand health information and make health decisions,1 is a prevalent problem in the outpatient and inpatient settings.2,3 In both settings, low HL has adverse implications for self-care including interpreting health labels4 and taking medications correctly.5 Among outpatient cohorts, HL has been associated with worse outcomes and acute care utilization.6 Associations with low HL include increased hospitalizations,7 rehospitalizations,8,9 emergency department visits,10 and decreased preventative care use.11 Among the elderly, low HL is associated with increased mortality12 and decreased self-perception of health.13
A systematic review revealed that most high-quality HL outcome studies were conducted in the outpatient setting.6 There have been very few studies assessing effects of low HL in an acute-care setting.7,14 These studies have evaluated postdischarge outcomes, including admissions or readmissions,7-9 and medication knowledge.14 To the best of our knowledge, there are no studies evaluating associations between HL and hospital length of stay (LOS).
LOS has received much attention as providers and payers focus more on resource utilization and eliminating adverse effects of prolonged hospitalization.15 LOS is multifactorial, depending on clinical characteristics like disease severity, as well as on sociocultural, demographic, and geographic factors.16 Despite evidence that LOS reductions translate into improved resource allocation and potentially fewer complications, there remains a tension between the appropriate LOS and one that is too short for a given condition.17
Because low HL is associated with inefficient resource utilization, we hypothesized that low HL would be associated with increased LOS after controlling for illness severity. Our objectives were to evaluate the association between low HL and LOS and whether such an association was modified by illness severity and sociodemographics.
METHODS
Study Design, Setting, Participants
An in-hospital, cohort study design of patients who were admitted or transferred to the general medicine service at the University of Chicago between October 2012 and November 2015 and screened for inclusion as part of a large, ongoing study of inpatient care quality was conducted.18 Exclusion criteria included observation status, age under 18 years, non-English speaking, and repeat participants. Those who died during hospitalization or whose discharge status was missing were excluded because the primary goal was to examine the association of HL and time to discharge, which could not be evaluated among those who died. We excluded participants with LOS >30 days to limit overly influential effects of extreme outliers (1% of the population).
Variables
HL was screened using the Brief Health Literacy Screen (BHLS), a validated, 3-question verbal survey not requiring adequate visual acuity to assess HL.19,20 The 3 questions are as follows: (1) “How confident are you filling out medical forms by yourself?”, (2) “How often do you have someone help you read hospital materials?”, and (3) “How often do you have problems learning about your medical condition because of difficulty understanding written information?” Responses to the questions were scored on a 5-point Likert scale in which higher scores corresponded to higher HL.21,22 The scores for each of the 3 questions were summed to yield a range between 3 and 15. On the individual questions, prior work has demonstrated improved test performance with a cutoff of ≤3, which corresponds to a response of “some of the time” or “somewhat”; therefore, when the 3 questions were summed together, scores of ≤9 were considered indicative of low HL.21,23
For severity of illness adjustment, we used relative weights derived from the 3M (3M, Maplewood, MN) All Patient Refined Diagnosis Related Groups (APR-DRG) classification system, which uses administrative data to classify the severity. The APR-DRG system assigns each admission to a DRG based on principal diagnosis; for each DRG, patients are then subdivided into 4 severity classes based on age, comorbidity, and interactions between these variables and the admitting diagnosis.24 Using the base DRG and severity score, the system assigns relative weights that reflect differences in expected hospital resource utilization.
LOS was derived from hospital administrative data and counted from the date of admission to the hospital. Participants who were discharged on the day of admission were counted as having an LOS of 1. Insurance status (Medicare, Medicaid, no payer, private) also was obtained from administrative data. Age, sex (male or female), education (junior high or less, some high school, high school graduate, some college, college graduate, postgraduate), and race (black/African American, white, Asian or Pacific Islander [including Asian Indian, Chinese, Filipino, Japanese, Korean, Vietnamese, other Asian, Native Hawaiian, Guam/Chamorro, Samoan, other Pacific], American Indian or Alaskan Native, multiple race) were obtained from administrative data based on information provided by the patient. Participants with missing data on any of the sociodemographic variables or on the APR-DRG score were excluded from the analysis.
Statistical Analysis
χ2 and 2-tailed t tests were used to compare categorical and continuous variables, respectively. Multivariate linear regressions were employed to measure associations between the independent variables (HL, illness severity, race, gender, education, and insurance status) and the dependent variable, LOS. Independent variables were chosen for clinical significance and retained in the model regardless of statistical significance. The adjusted R2 values of models with and without the HL variable included were reported to provide information on the contribution of HL to the overall model.
Because LOS was observed to be right skewed and residuals of the untransformed regression were observed to be non-normally distributed, the decision was made to natural log transform LOS, which is consistent with previous hospital LOS studies.16 Regression coefficients and confidence intervals were then transformed into percentage estimates using the following equation: 100(eβ–1). Adjusted R2 was reported for the transformed regression.
The APR-DRG relative weight was treated as a continuous variable. Sociodemographic variables were dichotomized as follows: female vs male; high school graduates vs not; African American vs not; Medicaid/no payer vs Medicare/private payer. Age was not included in the multivariate model because it has been incorporated into the weighted APR-DRG illness severity scores.
Each of the sociodemographic variables and the APR-DRG score were examined for effect modification via the same multivariate linear equation described above, with the addition of an interaction term. A separate regression was performed with an interaction term between age (dichotomized at ≥65) and HL to investigate whether age modified the association between HL and LOS. Finally, we explored whether effects were isolated to long vs short LOS by dividing the sample based on the mean LOS (≥6 days) and performing separate multivariate comparisons.
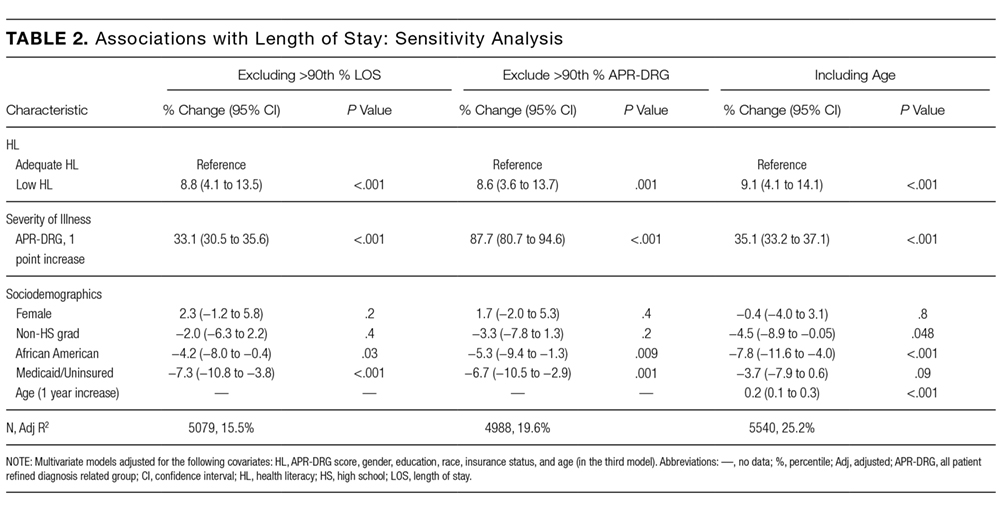
Sensitivity analyses were performed to exclude those with LOS greater than the 90th percentile and those with APR-DRG score greater than the 90th percentile; age was added to the model as a continuous variable to evaluate whether the illness severity score fully adjusted for the effects of age on LOS. Furthermore, we compared the participants with missing data to those with complete data across both dependent and independent variables. Alpha was set at 0.05; analyses were performed using Stata Version 14 (Stata, College Station, TX).
RESULTS
A total of 5983 participants met inclusion criteria and completed the HL assessment; of these participants, 75 (1%) died during hospitalization, 9 (0.2%) had missing discharge status, and 79 (1%) had LOS >30 days. Two hundred eighty (5%) were missing data on sociodemographic variables or APR-DRG score. Of the remaining (n = 5540), the mean age was 57 years (standard deviation [SD] = 19 years), over half of participants were female (57%), and the majority were African American (73%) and had graduated from high school (81%). The sample was divided into those with private insurance (25%), those with Medicare (46%), and those with Medicaid (26%); 2% had no payer. The mean APR-DRG score was 1.3 (SD = 1.2), and the scores ranged from 0.3 to 15.8.
On the BHLS screen for HL, 20% (1104/5540) had inadequate HL. Participants with low HL had higher weighted illness severity scores (average 1.4 vs 1.3; P = 0.003). Participants with low HL were also more likely to be 65 or older (55% vs 33%; P < 0.001), non-high school graduates (35% vs 15%; P < 0.001), and African American (78% vs 72%; P < 0.001), and to have Medicare or private insurance (75% vs 71%; P = 0.02). There was no significant difference with respect to gender (54% male vs 57% female; P = 0.1)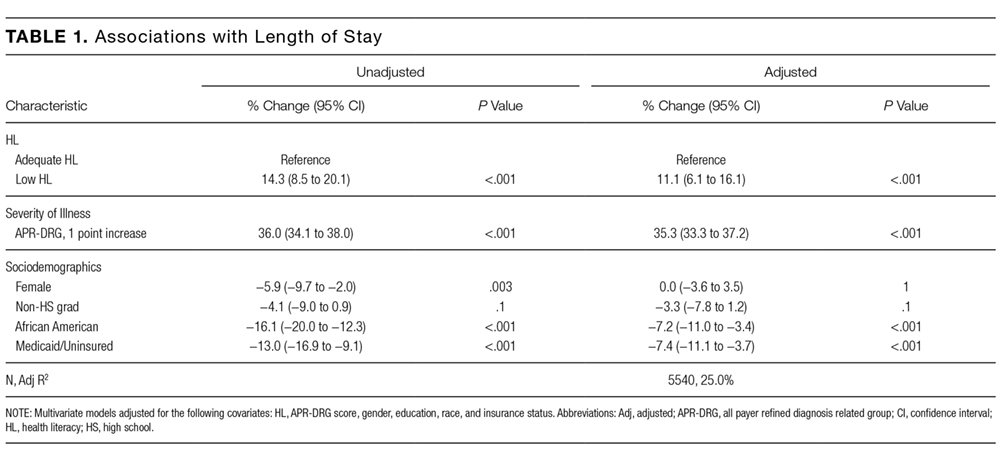
Finally, we compared the group with missing data (n = 280) to the group with complete data (n = 5540). The participants with missing data were more likely to have low HL (31% [86/280] vs 20%; P < 0.001) and to have Medicare or private insurance (82% [177/217] vs 72%; P = 0.002); however, they were not more likely to be 65 or older (40% [112/280] vs 37%; P = 0.3), high school graduates (88% [113/129] vs 81%; P = 0.06), African American (69% [177/256] vs 73%; P = 0.1), or female (57% [158/279] vs 57%; P = 1), nor were they more likely to have longer LOS (5.7 [n = 280] vs 5.5 days; P = 0.6) or higher illness severity scores (1.3 [n = 231] vs 1.3; P = 0.7).
DISCUSSION
To our knowledge, this study is the first to evaluate the association between low HL and an important in-hospital outcome measure, hospital LOS. We found that low HL was associated with a longer hospital LOS, a result which remained significant when controlling for severity of illness and sociodemographic variables and when testing the model for sensitivity to the highest values of LOS and illness severity. Additionally, the association of HL with LOS appeared concentrated among participants with shorter LOS. Relative to other predictors, the contribution of HL to the overall LOS model was small, as evidenced by the change in adjusted R2 values with HL excluded.
Among the covariates, only gender modified the association between HL and LOS; the findings suggested that men were more susceptible to the effect of low HL on increased LOS. Illness severity and other sociodemographics, including age ≥65, did not appear to modify the association. We also found that being African American and having Medicaid or no insurance were associated with a significantly shorter LOS in multivariate analysis.
Previous work suggested that the adverse health effects of low HL may be mediated through several pathways, including health knowledge, self-efficacy, health skills, and illness stigma.25-27 The finding of a small but significant relationship between HL and LOS was not surprising given these known associations; nevertheless, there may be an additional patient-dependent effect of low HL on LOS not discovered here. For instance, patients with poor health knowledge and self-efficacy might stay in the hospital longer if they or their providers do not feel comfortable with their self-care ability.
This finding may be useful in developing hospital-based interventions. HL-specific interventions, several of which have been tested in the inpatient setting,14,28,29 have shown promise toward improving health knowledge,30 disease severity,31 and health resource utilization.32
Those with low HL may lack the self-efficacy to participate in discharge planning; in fact, previous work has related low HL to posthospital readmissions.8,9 Conversely, patients with low HL might struggle to engage in the inpatient milieu, advocating for shorter LOS if they feel alienated by the inpatient experience.
These possibilities show that LOS is a complex measure shown to depend on patient-level characteristics and on provider-based, geographical, and sociocultural factors.16,33 With these forces at play, additional effects of lower levels of HL may be lost without phenotyping patients by both level of HL and related characteristics, such as self-efficacy, health skills, and stigma. By gathering these additional data, future work should explore whether subpopulations of patients with low HL may be at risk for too-short vs too-long hospital admissions.
For instance, in this study, both race and Medicaid insurance were associated with shorter LOS. Being African American was associated with shorter LOS in our study but has been found to be associated with longer LOS in another study specifically focused on diabetes.34 Prior findings found uninsured patients have shorter LOS.35 Therefore, these findings in our study are difficult to explain without further work to understand whether there are health disparities in the way patients are cared for during hospitalization that may shorten or lengthen their LOS because of factors outside of their clinical need.
The finding that gender modified the effect of low HL on LOS was unexpected. There were similar proportions of men and women with low HL. There is evidence to support that women make the majority of health decisions for themselves and their familes36; therefore, there may be unmeasured aspects of HL that provide an advantage for female vs male inpatients. Furthermore, omitted confounders, such as social support, may not fully capture potential gender-related differences. Future work is needed to understand the role of gender in relationship to HL and LOS.
Limitations of this study include its observational, single-centered design with information derived from administrative data; positive and negative confounding cannot be ruled out. For instance, we did not control for complex aspects affecting LOS, such as discharge disposition and goals of care (eg, aggressive care after discharge vs hospice). To address this limitation, multivariate analyses were performed, which were adjusted for illness severity scores and took into account both comorbidity and severity of the current illness. Additionally, although it is important to study such populations, our largely urban, minority sample is not representative of the U.S. population, and within our large sample, there were participants with missing data who had lower HL on average, although this group represented only 5% of the sample. Finally, different HL tools have noncomplete concordance, which has been seen when comparing the BHLS with more objective tools.20,37 Furthermore, certain in-hospital clinical scenarios (eg, recent stroke or prolonged intensive care unit stay) may present unique challenges in establishing a baseline HL level. However, the BHLS was used in this study because of its greater feasibility.
In conclusion, this study is the first to evaluate the relationship between low HL and LOS. The findings suggest that HL may play a role in shaping outcomes in the inpatient setting and that targeting interventions toward screened patients may be a pathway toward mitigating adverse effects. Our findings need to be replicated in larger, more representative samples, and further work understanding subpopulations within the low HL population is needed. Future work should measure this association in diverse inpatient settings (eg, psychiatric, surgical, and specialty), in addition to assessing associations between HL and other important in-hospital outcome measures, including mortality and discharge disposition.
Acknowledgments
The authors thank the Hospitalist Project team for their assistance with data collection. The authors especially thank Chuanhong Liao and Ashley Snyder for assistance with statistical analyses; Andrea Flores, Ainoa Coltri, and Tom Best for their assistance with data management. The authors would also like to thank Nicole Twu for her help with preparing and editing the manuscript.
Disclosures
Dr. Jaffee was supported by a Calvin Fentress Research Fellowship and NIH R25MH094612. Dr. Press was supported by a career development award (NHLBI K23HL118151). This work was also supported by a seed grant from the Center for Health Administration Studies. All other authors declare no conflicts of interest.
1. U.S. Department of Health and Human Services. Healthy People 2010: Understanding and Improving Health. Washington, DC: U.S. Government Printing Office; 2000.
2. “What Did the Doctor Say”? Improving Health Literacy to Protect Patient Safety. The Joint Commission; 2007.
3. Kutner M, Greenberg E, Jin Y, Paulsen C. The Health Literacy of America’s Adults: Results from the 2003 National Assessment of Adult Literacy. National Center for Education Statistics; 2006.
4. Davis TC, Wolf MS, Bass PF, et al. Literacy and misunderstanding prescription drug labels. Ann Intern Med. 2006;145(12):887-894. PubMed
5. Kripalani S, Henderson LE, Chiu EY, Robertson R, Kolm P, Jacobson TA. Predictors of medication self-management skill in a low-literacy population. J Gen Intern Med. 2006;21(8):852-856. PubMed
6. Berkman ND, Sheridan SL, Donahue KE, Halpern DJ, Crotty K. Low health literacy and health outcomes: an updated systematic review. Ann Intern Med. 2011;155(2):97-107. PubMed
7. Baker DW, Parker RM, Williams MV, Clark WS. Health literacy and the risk of hospital admission. J Gen Intern Med. 1998;13(12):791-798. PubMed
8. Mitchell SE, Sadikova E, Jack BW, Paasche-Orlow MK. Health literacy and 30-day postdischarge hospital utilization. J Health Commun. 2012;17(Suppl 3):325-338. PubMed
9. Jaffee EG, Arora VM, Matthiesen MI, Hariprasad SM, Meltzer DO, Press VG. Postdischarge Falls and Readmissions: Associations with Insufficient Vision and Low Health Literacy among Hospitalized Seniors. J Health Commun. 2016;21(sup2):135-140. PubMed
10. Hope CJ, Wu J, Tu W, Young J, Murray MD. Association of medication adherence, knowledge, and skills with emergency department visits by adults 50 years or older with congestive heart failure. Am J Health Syst Pharm. 2004;61(19):2043-2049. PubMed
11. Bennett IM, Chen J, Soroui JS, White S. The contribution of health literacy to disparities in self-rated health status and preventive health behaviors in older adults. Ann Fam Med. 2009;7(3):204-211. PubMed
12. Baker DW, Wolf MS, Feinglass J, Thompson JA. Health literacy, cognitive abilities, and mortality among elderly persons. J Gen Intern Med. 2008;23(6):723-726. PubMed
13. Cho YI, Lee SY, Arozullah AM, Crittenden KS. Effects of health literacy on health status and health service utilization amongst the elderly. Soc Sci Med. 2008;66(8):1809-1816. PubMed
14. Paasche-Orlow MK, Riekert KA, Bilderback A, et al. Tailored education may reduce health literacy disparities in asthma self-management. Am J Respir Crit Care Med. 2005;172(8):980-986. PubMed
15. Soria-Aledo V, Carrillo-Alcaraz A, Campillo-Soto Á, et al. Associated factors and cost of inappropriate hospital admissions and stays in a second-level hospital. Am J Med Qual. 2009;24(4):321-332. PubMed
16. Lu M, Sajobi T, Lucyk K, Lorenzetti D, Quan H. Systematic review of risk adjustment models of hospital length of stay (LOS). Med Care. 2015;53(4):355-365. PubMed
17. Clarke A, Rosen R. Length of stay. How short should hospital care be? Eur J Public Health. 2001;11(2):166-170. PubMed
18. Meltzer D, Manning WG, Morrison J, et al. Effects of physician experience on costs and outcomes on an academic general medicine service: results of a trial of hospitalists. Ann Intern Med. 2002;137(11):866-874. PubMed
19. Chew LD, Bradley KA, Boyko EJ. Brief questions to identify patients with inadequate health literacy. Fam Med. 2004;36(8):588-594. PubMed
20. Press VG, Shapiro MI, Mayo AM, Meltzer DO, Arora VM. More than meets the eye: relationship between low health literacy and poor vision in hospitalized patients. J Health Commun. 2013;18 Suppl 1:197-204. PubMed
21. Willens DE, Kripalani S, Schildcrout JS, et al. Association of brief health literacy screening and blood pressure in primary care. J Health Commun. 2013;18 Suppl 1:129-142. PubMed
22. Peterson PN, Shetterly SM, Clarke CL, et al. Health literacy and outcomes among patients with heart failure. JAMA. 2011;305(16):1695-1701. PubMed
23. Chew LD, Griffin JM, Partin MR, et al. Validation of screening questions for limited health literacy in a large VA outpatient population. J Gen Intern Med. 2008;23(5):561-566. PubMed
24. Averill RF, Goldfield N, Hughes JS, et al. All Patient Refined Diagnosis Related Groups (APR-DRGs): Methodology Overview. 3M Health Information Systems; 2003.
25. Waite KR, Paasche-Orlow M, Rintamaki LS, Davis TC, Wolf MS. Literacy, social stigma, and HIV medication adherence. J Gen Intern Med. 2008;23(9):1367-1372. PubMed
26. Paasche-Orlow MK, Wolf MS. The causal pathways linking health literacy to health outcomes. Am J Health Behav. 2007;31 Suppl 1:S19-26. PubMed
27. Berkman ND, Sheridan SL, Donahue KE, et al. Health literacy interventions and outcomes: an updated systematic review. Evid Rep Technol Assess (Full Rep). 2011;(199):1-941. PubMed
28. Kripalani S, Roumie CL, Dalal AK, et al. Effect of a pharmacist intervention on clinically important medication errors after hospital discharge: a randomized trial. Ann Intern Med. 2012;157(1):1-10. PubMed
29. Press VG, Arora VM, Shah LM, et al. Teaching the use of respiratory inhalers to hospitalized patients with asthma or COPD: a randomized trial. J Gen Intern Med. 2012;27(10):1317-1325. PubMed
30. Sobel RM, Paasche-Orlow MK, Waite KR, Rittner SS, Wilson EAH, Wolf MS. Asthma 1-2-3: a low literacy multimedia tool to educate African American adults about asthma. J Community Health. 2009;34(4):321-327. PubMed
31. Rothman RL, DeWalt DA, Malone R, et al. Influence of patient literacy on the effectiveness of a primary care-based diabetes disease management program. JAMA. 2004;292(14):1711-1716. PubMed
32. DeWalt DA, Malone RM, Bryant ME, et al. A heart failure self-management
program for patients of all literacy levels: a randomized, controlled trial [ISRCTN11535170].
BMC Health Serv Res. 2006;6:30. PubMed
33. Hasan O, Orav EJ, Hicks LS. Insurance status and hospital care for myocardial
infarction, stroke, and pneumonia. J Hosp Med. 2010;5(8):452-459. PubMed
34. Cook CB, Naylor DB, Hentz JG, et al. Disparities in diabetes-related hospitalizations:
relationship of age, sex, and race/ethnicity with hospital discharges, lengths
of stay, and direct inpatient charges. Ethn Dis. 2006;16(1):126-131. PubMed
35. Hadley J, Steinberg EP, Feder J. Comparison of uninsured and privately insured
hospital patients. Condition on admission, resource use, and outcome. JAMA.
1991;265(3):374-379. PubMed
36. Women’s Health Care Chartbook: Key Findings From the Kaiser Women’s
Health Survey. May 2011. https://kaiserfamilyfoundation.files.wordpress.
com/2013/01/8164.pdf. Accessed August 1, 2017.
37. Louis AJ, Arora VM, Matthiesen MI, Meltzer DO, Press VG. Screening Hospitalized Patients for Low Health Literacy: Beyond the REALM of Possibility? PubMed
Health literacy (HL), defined as patients’ ability to understand health information and make health decisions,1 is a prevalent problem in the outpatient and inpatient settings.2,3 In both settings, low HL has adverse implications for self-care including interpreting health labels4 and taking medications correctly.5 Among outpatient cohorts, HL has been associated with worse outcomes and acute care utilization.6 Associations with low HL include increased hospitalizations,7 rehospitalizations,8,9 emergency department visits,10 and decreased preventative care use.11 Among the elderly, low HL is associated with increased mortality12 and decreased self-perception of health.13
A systematic review revealed that most high-quality HL outcome studies were conducted in the outpatient setting.6 There have been very few studies assessing effects of low HL in an acute-care setting.7,14 These studies have evaluated postdischarge outcomes, including admissions or readmissions,7-9 and medication knowledge.14 To the best of our knowledge, there are no studies evaluating associations between HL and hospital length of stay (LOS).
LOS has received much attention as providers and payers focus more on resource utilization and eliminating adverse effects of prolonged hospitalization.15 LOS is multifactorial, depending on clinical characteristics like disease severity, as well as on sociocultural, demographic, and geographic factors.16 Despite evidence that LOS reductions translate into improved resource allocation and potentially fewer complications, there remains a tension between the appropriate LOS and one that is too short for a given condition.17
Because low HL is associated with inefficient resource utilization, we hypothesized that low HL would be associated with increased LOS after controlling for illness severity. Our objectives were to evaluate the association between low HL and LOS and whether such an association was modified by illness severity and sociodemographics.
METHODS
Study Design, Setting, Participants
An in-hospital, cohort study design of patients who were admitted or transferred to the general medicine service at the University of Chicago between October 2012 and November 2015 and screened for inclusion as part of a large, ongoing study of inpatient care quality was conducted.18 Exclusion criteria included observation status, age under 18 years, non-English speaking, and repeat participants. Those who died during hospitalization or whose discharge status was missing were excluded because the primary goal was to examine the association of HL and time to discharge, which could not be evaluated among those who died. We excluded participants with LOS >30 days to limit overly influential effects of extreme outliers (1% of the population).
Variables
HL was screened using the Brief Health Literacy Screen (BHLS), a validated, 3-question verbal survey not requiring adequate visual acuity to assess HL.19,20 The 3 questions are as follows: (1) “How confident are you filling out medical forms by yourself?”, (2) “How often do you have someone help you read hospital materials?”, and (3) “How often do you have problems learning about your medical condition because of difficulty understanding written information?” Responses to the questions were scored on a 5-point Likert scale in which higher scores corresponded to higher HL.21,22 The scores for each of the 3 questions were summed to yield a range between 3 and 15. On the individual questions, prior work has demonstrated improved test performance with a cutoff of ≤3, which corresponds to a response of “some of the time” or “somewhat”; therefore, when the 3 questions were summed together, scores of ≤9 were considered indicative of low HL.21,23
For severity of illness adjustment, we used relative weights derived from the 3M (3M, Maplewood, MN) All Patient Refined Diagnosis Related Groups (APR-DRG) classification system, which uses administrative data to classify the severity. The APR-DRG system assigns each admission to a DRG based on principal diagnosis; for each DRG, patients are then subdivided into 4 severity classes based on age, comorbidity, and interactions between these variables and the admitting diagnosis.24 Using the base DRG and severity score, the system assigns relative weights that reflect differences in expected hospital resource utilization.
LOS was derived from hospital administrative data and counted from the date of admission to the hospital. Participants who were discharged on the day of admission were counted as having an LOS of 1. Insurance status (Medicare, Medicaid, no payer, private) also was obtained from administrative data. Age, sex (male or female), education (junior high or less, some high school, high school graduate, some college, college graduate, postgraduate), and race (black/African American, white, Asian or Pacific Islander [including Asian Indian, Chinese, Filipino, Japanese, Korean, Vietnamese, other Asian, Native Hawaiian, Guam/Chamorro, Samoan, other Pacific], American Indian or Alaskan Native, multiple race) were obtained from administrative data based on information provided by the patient. Participants with missing data on any of the sociodemographic variables or on the APR-DRG score were excluded from the analysis.
Statistical Analysis
χ2 and 2-tailed t tests were used to compare categorical and continuous variables, respectively. Multivariate linear regressions were employed to measure associations between the independent variables (HL, illness severity, race, gender, education, and insurance status) and the dependent variable, LOS. Independent variables were chosen for clinical significance and retained in the model regardless of statistical significance. The adjusted R2 values of models with and without the HL variable included were reported to provide information on the contribution of HL to the overall model.
Because LOS was observed to be right skewed and residuals of the untransformed regression were observed to be non-normally distributed, the decision was made to natural log transform LOS, which is consistent with previous hospital LOS studies.16 Regression coefficients and confidence intervals were then transformed into percentage estimates using the following equation: 100(eβ–1). Adjusted R2 was reported for the transformed regression.
The APR-DRG relative weight was treated as a continuous variable. Sociodemographic variables were dichotomized as follows: female vs male; high school graduates vs not; African American vs not; Medicaid/no payer vs Medicare/private payer. Age was not included in the multivariate model because it has been incorporated into the weighted APR-DRG illness severity scores.
Each of the sociodemographic variables and the APR-DRG score were examined for effect modification via the same multivariate linear equation described above, with the addition of an interaction term. A separate regression was performed with an interaction term between age (dichotomized at ≥65) and HL to investigate whether age modified the association between HL and LOS. Finally, we explored whether effects were isolated to long vs short LOS by dividing the sample based on the mean LOS (≥6 days) and performing separate multivariate comparisons.
Sensitivity analyses were performed to exclude those with LOS greater than the 90th percentile and those with APR-DRG score greater than the 90th percentile; age was added to the model as a continuous variable to evaluate whether the illness severity score fully adjusted for the effects of age on LOS. Furthermore, we compared the participants with missing data to those with complete data across both dependent and independent variables. Alpha was set at 0.05; analyses were performed using Stata Version 14 (Stata, College Station, TX).
RESULTS
A total of 5983 participants met inclusion criteria and completed the HL assessment; of these participants, 75 (1%) died during hospitalization, 9 (0.2%) had missing discharge status, and 79 (1%) had LOS >30 days. Two hundred eighty (5%) were missing data on sociodemographic variables or APR-DRG score. Of the remaining (n = 5540), the mean age was 57 years (standard deviation [SD] = 19 years), over half of participants were female (57%), and the majority were African American (73%) and had graduated from high school (81%). The sample was divided into those with private insurance (25%), those with Medicare (46%), and those with Medicaid (26%); 2% had no payer. The mean APR-DRG score was 1.3 (SD = 1.2), and the scores ranged from 0.3 to 15.8.
On the BHLS screen for HL, 20% (1104/5540) had inadequate HL. Participants with low HL had higher weighted illness severity scores (average 1.4 vs 1.3; P = 0.003). Participants with low HL were also more likely to be 65 or older (55% vs 33%; P < 0.001), non-high school graduates (35% vs 15%; P < 0.001), and African American (78% vs 72%; P < 0.001), and to have Medicare or private insurance (75% vs 71%; P = 0.02). There was no significant difference with respect to gender (54% male vs 57% female; P = 0.1)
Finally, we compared the group with missing data (n = 280) to the group with complete data (n = 5540). The participants with missing data were more likely to have low HL (31% [86/280] vs 20%; P < 0.001) and to have Medicare or private insurance (82% [177/217] vs 72%; P = 0.002); however, they were not more likely to be 65 or older (40% [112/280] vs 37%; P = 0.3), high school graduates (88% [113/129] vs 81%; P = 0.06), African American (69% [177/256] vs 73%; P = 0.1), or female (57% [158/279] vs 57%; P = 1), nor were they more likely to have longer LOS (5.7 [n = 280] vs 5.5 days; P = 0.6) or higher illness severity scores (1.3 [n = 231] vs 1.3; P = 0.7).
DISCUSSION
To our knowledge, this study is the first to evaluate the association between low HL and an important in-hospital outcome measure, hospital LOS. We found that low HL was associated with a longer hospital LOS, a result which remained significant when controlling for severity of illness and sociodemographic variables and when testing the model for sensitivity to the highest values of LOS and illness severity. Additionally, the association of HL with LOS appeared concentrated among participants with shorter LOS. Relative to other predictors, the contribution of HL to the overall LOS model was small, as evidenced by the change in adjusted R2 values with HL excluded.
Among the covariates, only gender modified the association between HL and LOS; the findings suggested that men were more susceptible to the effect of low HL on increased LOS. Illness severity and other sociodemographics, including age ≥65, did not appear to modify the association. We also found that being African American and having Medicaid or no insurance were associated with a significantly shorter LOS in multivariate analysis.
Previous work suggested that the adverse health effects of low HL may be mediated through several pathways, including health knowledge, self-efficacy, health skills, and illness stigma.25-27 The finding of a small but significant relationship between HL and LOS was not surprising given these known associations; nevertheless, there may be an additional patient-dependent effect of low HL on LOS not discovered here. For instance, patients with poor health knowledge and self-efficacy might stay in the hospital longer if they or their providers do not feel comfortable with their self-care ability.
This finding may be useful in developing hospital-based interventions. HL-specific interventions, several of which have been tested in the inpatient setting,14,28,29 have shown promise toward improving health knowledge,30 disease severity,31 and health resource utilization.32
Those with low HL may lack the self-efficacy to participate in discharge planning; in fact, previous work has related low HL to posthospital readmissions.8,9 Conversely, patients with low HL might struggle to engage in the inpatient milieu, advocating for shorter LOS if they feel alienated by the inpatient experience.
These possibilities show that LOS is a complex measure shown to depend on patient-level characteristics and on provider-based, geographical, and sociocultural factors.16,33 With these forces at play, additional effects of lower levels of HL may be lost without phenotyping patients by both level of HL and related characteristics, such as self-efficacy, health skills, and stigma. By gathering these additional data, future work should explore whether subpopulations of patients with low HL may be at risk for too-short vs too-long hospital admissions.
For instance, in this study, both race and Medicaid insurance were associated with shorter LOS. Being African American was associated with shorter LOS in our study but has been found to be associated with longer LOS in another study specifically focused on diabetes.34 Prior findings found uninsured patients have shorter LOS.35 Therefore, these findings in our study are difficult to explain without further work to understand whether there are health disparities in the way patients are cared for during hospitalization that may shorten or lengthen their LOS because of factors outside of their clinical need.
The finding that gender modified the effect of low HL on LOS was unexpected. There were similar proportions of men and women with low HL. There is evidence to support that women make the majority of health decisions for themselves and their familes36; therefore, there may be unmeasured aspects of HL that provide an advantage for female vs male inpatients. Furthermore, omitted confounders, such as social support, may not fully capture potential gender-related differences. Future work is needed to understand the role of gender in relationship to HL and LOS.
Limitations of this study include its observational, single-centered design with information derived from administrative data; positive and negative confounding cannot be ruled out. For instance, we did not control for complex aspects affecting LOS, such as discharge disposition and goals of care (eg, aggressive care after discharge vs hospice). To address this limitation, multivariate analyses were performed, which were adjusted for illness severity scores and took into account both comorbidity and severity of the current illness. Additionally, although it is important to study such populations, our largely urban, minority sample is not representative of the U.S. population, and within our large sample, there were participants with missing data who had lower HL on average, although this group represented only 5% of the sample. Finally, different HL tools have noncomplete concordance, which has been seen when comparing the BHLS with more objective tools.20,37 Furthermore, certain in-hospital clinical scenarios (eg, recent stroke or prolonged intensive care unit stay) may present unique challenges in establishing a baseline HL level. However, the BHLS was used in this study because of its greater feasibility.
In conclusion, this study is the first to evaluate the relationship between low HL and LOS. The findings suggest that HL may play a role in shaping outcomes in the inpatient setting and that targeting interventions toward screened patients may be a pathway toward mitigating adverse effects. Our findings need to be replicated in larger, more representative samples, and further work understanding subpopulations within the low HL population is needed. Future work should measure this association in diverse inpatient settings (eg, psychiatric, surgical, and specialty), in addition to assessing associations between HL and other important in-hospital outcome measures, including mortality and discharge disposition.
Acknowledgments
The authors thank the Hospitalist Project team for their assistance with data collection. The authors especially thank Chuanhong Liao and Ashley Snyder for assistance with statistical analyses; Andrea Flores, Ainoa Coltri, and Tom Best for their assistance with data management. The authors would also like to thank Nicole Twu for her help with preparing and editing the manuscript.
Disclosures
Dr. Jaffee was supported by a Calvin Fentress Research Fellowship and NIH R25MH094612. Dr. Press was supported by a career development award (NHLBI K23HL118151). This work was also supported by a seed grant from the Center for Health Administration Studies. All other authors declare no conflicts of interest.
1. U.S. Department of Health and Human Services. Healthy People 2010: Understanding and Improving Health. Washington, DC: U.S. Government Printing Office; 2000.
2. “What Did the Doctor Say”? Improving Health Literacy to Protect Patient Safety. The Joint Commission; 2007.
3. Kutner M, Greenberg E, Jin Y, Paulsen C. The Health Literacy of America’s Adults: Results from the 2003 National Assessment of Adult Literacy. National Center for Education Statistics; 2006.
4. Davis TC, Wolf MS, Bass PF, et al. Literacy and misunderstanding prescription drug labels. Ann Intern Med. 2006;145(12):887-894. PubMed
5. Kripalani S, Henderson LE, Chiu EY, Robertson R, Kolm P, Jacobson TA. Predictors of medication self-management skill in a low-literacy population. J Gen Intern Med. 2006;21(8):852-856. PubMed
6. Berkman ND, Sheridan SL, Donahue KE, Halpern DJ, Crotty K. Low health literacy and health outcomes: an updated systematic review. Ann Intern Med. 2011;155(2):97-107. PubMed
7. Baker DW, Parker RM, Williams MV, Clark WS. Health literacy and the risk of hospital admission. J Gen Intern Med. 1998;13(12):791-798. PubMed
8. Mitchell SE, Sadikova E, Jack BW, Paasche-Orlow MK. Health literacy and 30-day postdischarge hospital utilization. J Health Commun. 2012;17(Suppl 3):325-338. PubMed
9. Jaffee EG, Arora VM, Matthiesen MI, Hariprasad SM, Meltzer DO, Press VG. Postdischarge Falls and Readmissions: Associations with Insufficient Vision and Low Health Literacy among Hospitalized Seniors. J Health Commun. 2016;21(sup2):135-140. PubMed
10. Hope CJ, Wu J, Tu W, Young J, Murray MD. Association of medication adherence, knowledge, and skills with emergency department visits by adults 50 years or older with congestive heart failure. Am J Health Syst Pharm. 2004;61(19):2043-2049. PubMed
11. Bennett IM, Chen J, Soroui JS, White S. The contribution of health literacy to disparities in self-rated health status and preventive health behaviors in older adults. Ann Fam Med. 2009;7(3):204-211. PubMed
12. Baker DW, Wolf MS, Feinglass J, Thompson JA. Health literacy, cognitive abilities, and mortality among elderly persons. J Gen Intern Med. 2008;23(6):723-726. PubMed
13. Cho YI, Lee SY, Arozullah AM, Crittenden KS. Effects of health literacy on health status and health service utilization amongst the elderly. Soc Sci Med. 2008;66(8):1809-1816. PubMed
14. Paasche-Orlow MK, Riekert KA, Bilderback A, et al. Tailored education may reduce health literacy disparities in asthma self-management. Am J Respir Crit Care Med. 2005;172(8):980-986. PubMed
15. Soria-Aledo V, Carrillo-Alcaraz A, Campillo-Soto Á, et al. Associated factors and cost of inappropriate hospital admissions and stays in a second-level hospital. Am J Med Qual. 2009;24(4):321-332. PubMed
16. Lu M, Sajobi T, Lucyk K, Lorenzetti D, Quan H. Systematic review of risk adjustment models of hospital length of stay (LOS). Med Care. 2015;53(4):355-365. PubMed
17. Clarke A, Rosen R. Length of stay. How short should hospital care be? Eur J Public Health. 2001;11(2):166-170. PubMed
18. Meltzer D, Manning WG, Morrison J, et al. Effects of physician experience on costs and outcomes on an academic general medicine service: results of a trial of hospitalists. Ann Intern Med. 2002;137(11):866-874. PubMed
19. Chew LD, Bradley KA, Boyko EJ. Brief questions to identify patients with inadequate health literacy. Fam Med. 2004;36(8):588-594. PubMed
20. Press VG, Shapiro MI, Mayo AM, Meltzer DO, Arora VM. More than meets the eye: relationship between low health literacy and poor vision in hospitalized patients. J Health Commun. 2013;18 Suppl 1:197-204. PubMed
21. Willens DE, Kripalani S, Schildcrout JS, et al. Association of brief health literacy screening and blood pressure in primary care. J Health Commun. 2013;18 Suppl 1:129-142. PubMed
22. Peterson PN, Shetterly SM, Clarke CL, et al. Health literacy and outcomes among patients with heart failure. JAMA. 2011;305(16):1695-1701. PubMed
23. Chew LD, Griffin JM, Partin MR, et al. Validation of screening questions for limited health literacy in a large VA outpatient population. J Gen Intern Med. 2008;23(5):561-566. PubMed
24. Averill RF, Goldfield N, Hughes JS, et al. All Patient Refined Diagnosis Related Groups (APR-DRGs): Methodology Overview. 3M Health Information Systems; 2003.
25. Waite KR, Paasche-Orlow M, Rintamaki LS, Davis TC, Wolf MS. Literacy, social stigma, and HIV medication adherence. J Gen Intern Med. 2008;23(9):1367-1372. PubMed
26. Paasche-Orlow MK, Wolf MS. The causal pathways linking health literacy to health outcomes. Am J Health Behav. 2007;31 Suppl 1:S19-26. PubMed
27. Berkman ND, Sheridan SL, Donahue KE, et al. Health literacy interventions and outcomes: an updated systematic review. Evid Rep Technol Assess (Full Rep). 2011;(199):1-941. PubMed
28. Kripalani S, Roumie CL, Dalal AK, et al. Effect of a pharmacist intervention on clinically important medication errors after hospital discharge: a randomized trial. Ann Intern Med. 2012;157(1):1-10. PubMed
29. Press VG, Arora VM, Shah LM, et al. Teaching the use of respiratory inhalers to hospitalized patients with asthma or COPD: a randomized trial. J Gen Intern Med. 2012;27(10):1317-1325. PubMed
30. Sobel RM, Paasche-Orlow MK, Waite KR, Rittner SS, Wilson EAH, Wolf MS. Asthma 1-2-3: a low literacy multimedia tool to educate African American adults about asthma. J Community Health. 2009;34(4):321-327. PubMed
31. Rothman RL, DeWalt DA, Malone R, et al. Influence of patient literacy on the effectiveness of a primary care-based diabetes disease management program. JAMA. 2004;292(14):1711-1716. PubMed
32. DeWalt DA, Malone RM, Bryant ME, et al. A heart failure self-management
program for patients of all literacy levels: a randomized, controlled trial [ISRCTN11535170].
BMC Health Serv Res. 2006;6:30. PubMed
33. Hasan O, Orav EJ, Hicks LS. Insurance status and hospital care for myocardial
infarction, stroke, and pneumonia. J Hosp Med. 2010;5(8):452-459. PubMed
34. Cook CB, Naylor DB, Hentz JG, et al. Disparities in diabetes-related hospitalizations:
relationship of age, sex, and race/ethnicity with hospital discharges, lengths
of stay, and direct inpatient charges. Ethn Dis. 2006;16(1):126-131. PubMed
35. Hadley J, Steinberg EP, Feder J. Comparison of uninsured and privately insured
hospital patients. Condition on admission, resource use, and outcome. JAMA.
1991;265(3):374-379. PubMed
36. Women’s Health Care Chartbook: Key Findings From the Kaiser Women’s
Health Survey. May 2011. https://kaiserfamilyfoundation.files.wordpress.
com/2013/01/8164.pdf. Accessed August 1, 2017.
37. Louis AJ, Arora VM, Matthiesen MI, Meltzer DO, Press VG. Screening Hospitalized Patients for Low Health Literacy: Beyond the REALM of Possibility? PubMed
© 2017 Society of Hospital Medicine
Electronic Assessment of Mental Status
Altered mental status (AMS) is a complex spectrum of cognitive deficits that includes orientation, memory, language, visuospatial ability, and perception.[1] The clinical definitions of both delirium and dementia include AMS as a hallmark clinical prerequisite. Regardless of etiology, this broader AMS definition is particularly salient in the hospital setting, where AMS is present in up to 60% of inpatients and is associated with longer hospital stay as well as increased morbidity and mortality.[2, 3] Not surprisingly, due to the complexity of identifying and assessing changes in mental status, clinically relevant AMS is often undetected among inpatients.[2] However, when detected, the most common causes of AMS (infection, polypharmacy, and pain) are treatable, suggesting that early AMS identification could alert clinicians to early signs of clinical decompensation, potentially improving clinical outcomes.[4]
Because rapid and systemic clinical detection of AMS is limited by the complexity of mental status, a number of assessments have been created, each with their own advantages, limitations, and target populations. These assessments are often limited by time‐intensive administration, subjectivity of mental status assessment, and lack of sensitivity in general medicine patients. Time‐intensive measures, such as the Short Portable Mental Status Questionnaire (SPMSQ) have utility in the research setting, whereas current common clinical risk stratification tools (eg, National Early Warning Score) utilize simpler measures such as the Alert, Voice, Pain, Unresponsive (AVPU) and Glasgow Coma Scale (GCS) as measures of mental status.[2, 5, 6, 7, 8, 9]
To address the need for a brief, clinically feasible, accurate tool in clinical detection of AMS, our group developed a mobile application for working memory testing, the Functional Assessment of Mentation (FAMTM). In this study, we aimed to identify baseline scoring distributions of the FAMTM in a nonhospitalized subgroup, as well as assess the correlation of the FAMTM to discharge disposition and compare it to the SPMSQ in inpatients.
METHODS
Study Design
We conducted a prospective observational study. Data were collected from both hospitalized and nonhospitalized adult participants as 2 distinct subgroups. Nonhospitalized adult subjects were recruited from a university medical campus (June 2013July 2013; IRB‐12‐0175). Hospitalized participants were recruited from the general medicine service as part of an ongoing study measuring quality of care and resource allocation at the same academic medical center (June 2014August 2014; IRB‐9967).[10]
FAMTM Application
The FAMTM application is a bedside tool for working memory assessment developed for the iPhone mobile operating system (Apple Inc., Cupertino, CA) and presented on an iPad mini (Apple). The application interface displays 4 colored rectangles individually labeled with a number (see Supporting Figure 1 in the online version of this article). The testing portion of the application presents a sequence of numbered rectangles, illuminated 1 at a time in random order. Subjects are prompted first to watch and remember the sequence and then repeat the sequence by touching the screen within each numbered rectangle. Successful reproduction of the sequence is followed by a distinct and longer sequence, whereas unsuccessful attempts are followed by a shorter sequence. The final FAMTM score corresponds to the longest sequence of rectangles successfully repeated by the subject.
Data Collection
In the nonhospitalized subject population, research assistants collected demographic data immediately prior to FAMTM administration. Among hospitalized subjects, GCS information was collected by nursing staff as part of standard clinical care. One research assistant administered the SPMSQ while a second assistant, blinded to the SPMSQ and GCS scores, administered the FAMTM. Clinical data were obtained from medical records (EPIC Systems Corp., Verona, WI). Discharge disposition was dichotomized as discharged home or not.
Statistical Analyses
Demographic characteristics of the 2 subject populations were compared using Student t tests (continuous variables) and 2 tests (categorical variables). Score distribution and discharge disposition comparison was conducted with the Mann‐Whitney U test and area under receiver operating characteristic curve (AUC) analysis, using the trapezoidal rule.[11] Multivariable linear regression was used to investigate the impact of age, race, education, discharge disposition, and hospitalization status on patient scores and times. Correlations between the FAMTM and SPMSQ scores and between the GCS and SPMSQ scores were calculated using the Spearman rank test. Significance was set at a 2‐sided P value of <0.05. Analyses were conducted using Stata version 13.1 (StataCorp, College Station, TX).
RESULTS
A total of 931 subjects were enrolled in the study. In the nonhospitalized subgroup, 651 consented to study participation and 612 were included in final analysis. Subjects were excluded if they started but did not complete the application (n = 36) or were under the age of 18 years (n = 3). Of the 363 hospitalized subjects approached for enrollment, 319 were included in the final analysis. Subjects were excluded if they refused to participate (n = 23), were under the age of 18 (n = 2), had technical failures (n = 5), or had physical or visual limitations that precluded them from participation (n = 14). Within the hospitalized subgroup, 268 subjects were discharged home (85%). The table displays demographics and score distributions by subgroup.1
| Nonhospitalized Subjects, n = 612 | Hospitalized Subjects Discharged Home, n = 268 | Hospitalized Subjects Discharged Elsewhere, n = 48 | P Value | |
|---|---|---|---|---|
| ||||
| Age, y | 52 18 | 52 19 | 62 17 | <0.001 |
| Female sex | 343 (56%) | 158 (59%) | 26 (54%) | 0.63 |
| Education | <0.001 | |||
| Less than high school graduate | 31 (5%) | 32 (12%) | 7 (15%) | |
| High school graduate | 312 (51%) | 153 (57%) | 26 (54%) | |
| College graduate | 263 (43%) | 43 (16%) | 8 (17%) | |
| Missing | 6 (1%) | 40 (15%) | 7 (15%) | |
| Race | <0.001 | |||
| Black | 196 (32%) | 185 (69%) | 34 (71%) | |
| White | 324 (53%) | 75 (28%) | 13 (27%) | |
| Other | 86 (14%) | 4 (1%) | 4 (1%) | |
| Missing | 6 (1%) | 4 (1%) | 0 (0%) | |
| FAMTM score, median (IQR) | 5 (47) | 5 (36) | 3 (15) | <0.001 |
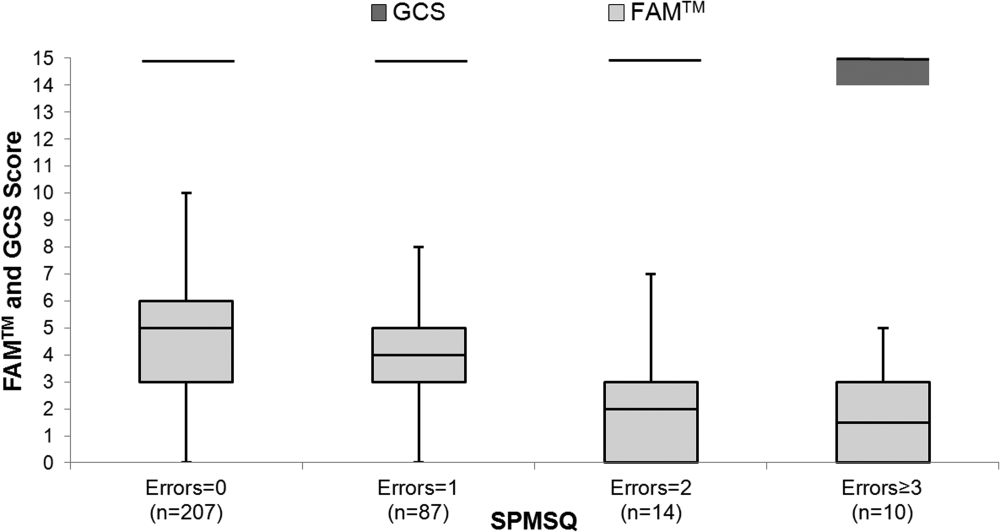
The median FAMTM score for the combined study population was 5 (interquartile range [IQR] 36), and median time to completion was 55 seconds (IQR 4567 seconds). A graded reduction was found in the FAMTM score for all stepwise comparisons between nonhospitalized subjects, hospitalized subjects discharged home, and hospitalized subjects not discharged home (median 5 [IQR 47] vs 5 [IQR 36] vs 3 [IQR 15]; P < 0.001 for all pairwise comparisons). The AUC for the FAMTM predicting discharge disposition (home vs not) was 0.66 (95% confidence interval [CI]: 0.58‐0.74]. After adjusting for confounders, higher FAMTM scores were independently associated with not being hospitalized, being discharged home, higher levels of education, younger age, and white race (see Supporting Table 1 in the online version of this article). Additionally, in the hospitalized subgroup, decreasing FAMTM score was significantly correlated with increasing errors on the SPMSQ (Spearman = 0.27, P < 0.001), whereas the GCS score was not correlated with the SPMSQ (Spearman = 0.05, P = 0.40) (Figure 1).
DISCUSSION
We demonstrated the utility of a rapid and accurate mobile application for assessment of mental status. The FAMTM was able to be quickly administered with a median time to completion of approximately 1 minute. The ability to detect mild alterations in mental status was shown through concurrent validity by FAMTM correlation with the SPMSQ and predictive validity with the association between the FAMTM and discharge disposition. Our study highlights the potential for the FAMTM to be used as a sensitive marker of AMS.
The novel design of the FAMTM presents unique advantages compared to current mental status testing. First, the FAMTM could allow patients with hearing impairment or language barriers to complete a mental status assessment. Additionally, the approximately 1‐minute median time to completion is much faster than other established mental status assessments including the SPMSQ (510 minutes). Compared to the SPMSQ taking 5 minutes, in a 400‐bed hospital, taken once per nursing shift, the FAMTM would save approximately 20,000 hours and 10 nursing full‐time equivalents per year.[5] Finally, many current mental status tests such as the Confusion Assessment Model utilize subjective mental status assessments.[2] However, the FAMTM is designed to be conducted through self‐assessment and, thus, could theoretically be free of observer bias. This potential for self‐administration expands beyond other proposed alternative testing mechanisms of the AMS such as ultrabrief assessments that include items such as asking subjects the months of the year backwards, and what is the day of the week?, and assessing arousal.[12, 13, 14]
In research settings and commonly in hospitals, the GCS and AVPU are used clinically for mental status assessment of hospitalized patients.[6, 15] However, similar to previous literature, our study found that the vast majority of hospitalized patients were defined as neurologically intact by the GCS, which is the more accurate predictor of the 2.[7] One major strength of the FAMTM was that it identified an extensive gradation of scores for patients previously labeled as merely alert, providing greater resolution than the GCS in quantifying mental status.
One of the key benefits of the FAMTM is that it can be measured longitudinally over the course of a patient's hospital stay. Therefore, once a baseline FAMTM score is established, variation from the patient's personal baseline could indicate mental status deterioration, which would not be affected by the patient's demographics, health status, or underlying neurocognitive deficits.
There were important limitations to this study. First, limited generalizability of these data may exist due to the single‐center setting and patient population. However, this initial study provides pilot data for further expansion into the potential broad applicability of the FAMTM to other patient populations and settings. Additionally, the cost of large‐scale implementation of the FAMTM is unknown and was beyond the scope of this pilot study. However, to reduce costs, the FAMTM technology could be integrated into existing hospital technology infrastructure. Finally, the scope of this study prevented a complete assessment of all validity measures or comparison to other mental status assessments such as the digit span or serial sevens tests. However, predictive and concurrent validity were assessed with comparison by discharge disposition, SPMSQ, and GCS scores.
In conclusion, this pilot study identifies the FAMTM application as a potentially clinically useful, novel, rapid, and feasible assessment tool of mental status in a general medicine inpatient setting.
Acknowledgements
The authors thank Frank Zadravecz, MPH, for his support with this project.
Disclosures: This research was supported in part by a grant from the National Institutes of Health (NIA 2T35AG029795‐07) and in part by career development awards granted to Dr. Churpek, Dr. Edelson, and Dr. Press by the National Heart, Lung, and Blood Institute (K08 HL121080, K23 HL097157, and K23 HL118151, respectively). Dr. Churpek has received honoraria from Chest for invited speaking engagements. Drs. Churpek and Edelson have a patent pending (ARCD. P0535US.P2) for risk stratification algorithms for hospitalized patients. In addition, Dr. Edelson has received research support from Philips Healthcare (Andover, MA), the American Heart Association (Dallas, TX), and Laerdal Medical (Stavanger, Norway). She has ownership interest in Quant HC (Chicago, IL), which is developing products for risk stratification of hospitalized patients. All other authors report no potential conflicts of interest.
- , . Altered mental status in older patients in the emergency department. Clin Geriatr Med. 2013;29(1):101–136.
- , , , , , . Clarifying confusion: the confusion assessment method. A new method for detection of delirium. Ann Intern Med. 1990;113(12):941–948.
- , , , , . Association between clinically abnormal observations and subsequent in‐hospital mortality: a prospective study. Resuscitation. 2004;62(2):137–141.
- , , . Early recognition of delirium: review of the literature. J Clin Nurs. 2001;10(6):721–729.
- . A short portable mental status questionnaire for the assessment of organic brain deficit in elderly patients. J Am Geriatr Soc. 1975;23(10):433–441.
- , , , , . The ability of the National Early Warning Score (NEWS) to discriminate patients at risk of early cardiac arrest, unanticipated intensive care unit admission, and death. Resuscitation. 2013;84(4):465–470.
- , , , et al. Comparison of mental‐status scales for predicting mortality on the general wards. J Hosp Med. 2015;10(10):658–663.
- , . Assessment of coma and impaired consciousness: a practical scale. Lancet. 1974;304(7872):81–84.
- , , , . Short Portable Mental Status Questionnaire as a Screening Test for Dementia and Delirium Among the Elderly. J Am Geriatr Soc. 1987;35(5):412–416.
- , , , et al. Effects of physician experience on costs and outcomes on an academic general medicine service: results of a trial of hospitalists. Ann Intern Med. 2002;137(11):866–874.
- , , . Comparing the areas under two or more correlated receiver operating characteristic curves: a nonparametric approach. Biometrics. 1988;44(3):837–845.
- , , , et al. Preliminary development of an ultrabrief two‐item bedside test for delirium. J Hosp Med. 2015;10(10):645–650.
- , , , , , . The association between an ultrabrief cognitive screening in older adults and hospital outcomes. J Hosp Med. 2015;10(10):651–657.
- , , , et al. Selecting optimal screening items for delirium: an application of item response theory. BMC Med Res Methodol. 2013;13:8.
- , , . Variability in agreement between physicians and nurses when measuring the Glasgow Coma Scale in the emergency department limits its clinical usefulness. Emerg Med Australas. 2006;18(4):379–384.
Altered mental status (AMS) is a complex spectrum of cognitive deficits that includes orientation, memory, language, visuospatial ability, and perception.[1] The clinical definitions of both delirium and dementia include AMS as a hallmark clinical prerequisite. Regardless of etiology, this broader AMS definition is particularly salient in the hospital setting, where AMS is present in up to 60% of inpatients and is associated with longer hospital stay as well as increased morbidity and mortality.[2, 3] Not surprisingly, due to the complexity of identifying and assessing changes in mental status, clinically relevant AMS is often undetected among inpatients.[2] However, when detected, the most common causes of AMS (infection, polypharmacy, and pain) are treatable, suggesting that early AMS identification could alert clinicians to early signs of clinical decompensation, potentially improving clinical outcomes.[4]
Because rapid and systemic clinical detection of AMS is limited by the complexity of mental status, a number of assessments have been created, each with their own advantages, limitations, and target populations. These assessments are often limited by time‐intensive administration, subjectivity of mental status assessment, and lack of sensitivity in general medicine patients. Time‐intensive measures, such as the Short Portable Mental Status Questionnaire (SPMSQ) have utility in the research setting, whereas current common clinical risk stratification tools (eg, National Early Warning Score) utilize simpler measures such as the Alert, Voice, Pain, Unresponsive (AVPU) and Glasgow Coma Scale (GCS) as measures of mental status.[2, 5, 6, 7, 8, 9]
To address the need for a brief, clinically feasible, accurate tool in clinical detection of AMS, our group developed a mobile application for working memory testing, the Functional Assessment of Mentation (FAMTM). In this study, we aimed to identify baseline scoring distributions of the FAMTM in a nonhospitalized subgroup, as well as assess the correlation of the FAMTM to discharge disposition and compare it to the SPMSQ in inpatients.
METHODS
Study Design
We conducted a prospective observational study. Data were collected from both hospitalized and nonhospitalized adult participants as 2 distinct subgroups. Nonhospitalized adult subjects were recruited from a university medical campus (June 2013July 2013; IRB‐12‐0175). Hospitalized participants were recruited from the general medicine service as part of an ongoing study measuring quality of care and resource allocation at the same academic medical center (June 2014August 2014; IRB‐9967).[10]
FAMTM Application
The FAMTM application is a bedside tool for working memory assessment developed for the iPhone mobile operating system (Apple Inc., Cupertino, CA) and presented on an iPad mini (Apple). The application interface displays 4 colored rectangles individually labeled with a number (see Supporting Figure 1 in the online version of this article). The testing portion of the application presents a sequence of numbered rectangles, illuminated 1 at a time in random order. Subjects are prompted first to watch and remember the sequence and then repeat the sequence by touching the screen within each numbered rectangle. Successful reproduction of the sequence is followed by a distinct and longer sequence, whereas unsuccessful attempts are followed by a shorter sequence. The final FAMTM score corresponds to the longest sequence of rectangles successfully repeated by the subject.
Data Collection
In the nonhospitalized subject population, research assistants collected demographic data immediately prior to FAMTM administration. Among hospitalized subjects, GCS information was collected by nursing staff as part of standard clinical care. One research assistant administered the SPMSQ while a second assistant, blinded to the SPMSQ and GCS scores, administered the FAMTM. Clinical data were obtained from medical records (EPIC Systems Corp., Verona, WI). Discharge disposition was dichotomized as discharged home or not.
Statistical Analyses
Demographic characteristics of the 2 subject populations were compared using Student t tests (continuous variables) and 2 tests (categorical variables). Score distribution and discharge disposition comparison was conducted with the Mann‐Whitney U test and area under receiver operating characteristic curve (AUC) analysis, using the trapezoidal rule.[11] Multivariable linear regression was used to investigate the impact of age, race, education, discharge disposition, and hospitalization status on patient scores and times. Correlations between the FAMTM and SPMSQ scores and between the GCS and SPMSQ scores were calculated using the Spearman rank test. Significance was set at a 2‐sided P value of <0.05. Analyses were conducted using Stata version 13.1 (StataCorp, College Station, TX).
RESULTS
A total of 931 subjects were enrolled in the study. In the nonhospitalized subgroup, 651 consented to study participation and 612 were included in final analysis. Subjects were excluded if they started but did not complete the application (n = 36) or were under the age of 18 years (n = 3). Of the 363 hospitalized subjects approached for enrollment, 319 were included in the final analysis. Subjects were excluded if they refused to participate (n = 23), were under the age of 18 (n = 2), had technical failures (n = 5), or had physical or visual limitations that precluded them from participation (n = 14). Within the hospitalized subgroup, 268 subjects were discharged home (85%). The table displays demographics and score distributions by subgroup.1
| Nonhospitalized Subjects, n = 612 | Hospitalized Subjects Discharged Home, n = 268 | Hospitalized Subjects Discharged Elsewhere, n = 48 | P Value | |
|---|---|---|---|---|
| ||||
| Age, y | 52 18 | 52 19 | 62 17 | <0.001 |
| Female sex | 343 (56%) | 158 (59%) | 26 (54%) | 0.63 |
| Education | <0.001 | |||
| Less than high school graduate | 31 (5%) | 32 (12%) | 7 (15%) | |
| High school graduate | 312 (51%) | 153 (57%) | 26 (54%) | |
| College graduate | 263 (43%) | 43 (16%) | 8 (17%) | |
| Missing | 6 (1%) | 40 (15%) | 7 (15%) | |
| Race | <0.001 | |||
| Black | 196 (32%) | 185 (69%) | 34 (71%) | |
| White | 324 (53%) | 75 (28%) | 13 (27%) | |
| Other | 86 (14%) | 4 (1%) | 4 (1%) | |
| Missing | 6 (1%) | 4 (1%) | 0 (0%) | |
| FAMTM score, median (IQR) | 5 (47) | 5 (36) | 3 (15) | <0.001 |
The median FAMTM score for the combined study population was 5 (interquartile range [IQR] 36), and median time to completion was 55 seconds (IQR 4567 seconds). A graded reduction was found in the FAMTM score for all stepwise comparisons between nonhospitalized subjects, hospitalized subjects discharged home, and hospitalized subjects not discharged home (median 5 [IQR 47] vs 5 [IQR 36] vs 3 [IQR 15]; P < 0.001 for all pairwise comparisons). The AUC for the FAMTM predicting discharge disposition (home vs not) was 0.66 (95% confidence interval [CI]: 0.58‐0.74]. After adjusting for confounders, higher FAMTM scores were independently associated with not being hospitalized, being discharged home, higher levels of education, younger age, and white race (see Supporting Table 1 in the online version of this article). Additionally, in the hospitalized subgroup, decreasing FAMTM score was significantly correlated with increasing errors on the SPMSQ (Spearman = 0.27, P < 0.001), whereas the GCS score was not correlated with the SPMSQ (Spearman = 0.05, P = 0.40) (Figure 1).
DISCUSSION
We demonstrated the utility of a rapid and accurate mobile application for assessment of mental status. The FAMTM was able to be quickly administered with a median time to completion of approximately 1 minute. The ability to detect mild alterations in mental status was shown through concurrent validity by FAMTM correlation with the SPMSQ and predictive validity with the association between the FAMTM and discharge disposition. Our study highlights the potential for the FAMTM to be used as a sensitive marker of AMS.
The novel design of the FAMTM presents unique advantages compared to current mental status testing. First, the FAMTM could allow patients with hearing impairment or language barriers to complete a mental status assessment. Additionally, the approximately 1‐minute median time to completion is much faster than other established mental status assessments including the SPMSQ (510 minutes). Compared to the SPMSQ taking 5 minutes, in a 400‐bed hospital, taken once per nursing shift, the FAMTM would save approximately 20,000 hours and 10 nursing full‐time equivalents per year.[5] Finally, many current mental status tests such as the Confusion Assessment Model utilize subjective mental status assessments.[2] However, the FAMTM is designed to be conducted through self‐assessment and, thus, could theoretically be free of observer bias. This potential for self‐administration expands beyond other proposed alternative testing mechanisms of the AMS such as ultrabrief assessments that include items such as asking subjects the months of the year backwards, and what is the day of the week?, and assessing arousal.[12, 13, 14]
In research settings and commonly in hospitals, the GCS and AVPU are used clinically for mental status assessment of hospitalized patients.[6, 15] However, similar to previous literature, our study found that the vast majority of hospitalized patients were defined as neurologically intact by the GCS, which is the more accurate predictor of the 2.[7] One major strength of the FAMTM was that it identified an extensive gradation of scores for patients previously labeled as merely alert, providing greater resolution than the GCS in quantifying mental status.
One of the key benefits of the FAMTM is that it can be measured longitudinally over the course of a patient's hospital stay. Therefore, once a baseline FAMTM score is established, variation from the patient's personal baseline could indicate mental status deterioration, which would not be affected by the patient's demographics, health status, or underlying neurocognitive deficits.
There were important limitations to this study. First, limited generalizability of these data may exist due to the single‐center setting and patient population. However, this initial study provides pilot data for further expansion into the potential broad applicability of the FAMTM to other patient populations and settings. Additionally, the cost of large‐scale implementation of the FAMTM is unknown and was beyond the scope of this pilot study. However, to reduce costs, the FAMTM technology could be integrated into existing hospital technology infrastructure. Finally, the scope of this study prevented a complete assessment of all validity measures or comparison to other mental status assessments such as the digit span or serial sevens tests. However, predictive and concurrent validity were assessed with comparison by discharge disposition, SPMSQ, and GCS scores.
In conclusion, this pilot study identifies the FAMTM application as a potentially clinically useful, novel, rapid, and feasible assessment tool of mental status in a general medicine inpatient setting.
Acknowledgements
The authors thank Frank Zadravecz, MPH, for his support with this project.
Disclosures: This research was supported in part by a grant from the National Institutes of Health (NIA 2T35AG029795‐07) and in part by career development awards granted to Dr. Churpek, Dr. Edelson, and Dr. Press by the National Heart, Lung, and Blood Institute (K08 HL121080, K23 HL097157, and K23 HL118151, respectively). Dr. Churpek has received honoraria from Chest for invited speaking engagements. Drs. Churpek and Edelson have a patent pending (ARCD. P0535US.P2) for risk stratification algorithms for hospitalized patients. In addition, Dr. Edelson has received research support from Philips Healthcare (Andover, MA), the American Heart Association (Dallas, TX), and Laerdal Medical (Stavanger, Norway). She has ownership interest in Quant HC (Chicago, IL), which is developing products for risk stratification of hospitalized patients. All other authors report no potential conflicts of interest.
- , . Altered mental status in older patients in the emergency department. Clin Geriatr Med. 2013;29(1):101–136.
- , , , , , . Clarifying confusion: the confusion assessment method. A new method for detection of delirium. Ann Intern Med. 1990;113(12):941–948.
- , , , , . Association between clinically abnormal observations and subsequent in‐hospital mortality: a prospective study. Resuscitation. 2004;62(2):137–141.
- , , . Early recognition of delirium: review of the literature. J Clin Nurs. 2001;10(6):721–729.
- . A short portable mental status questionnaire for the assessment of organic brain deficit in elderly patients. J Am Geriatr Soc. 1975;23(10):433–441.
- , , , , . The ability of the National Early Warning Score (NEWS) to discriminate patients at risk of early cardiac arrest, unanticipated intensive care unit admission, and death. Resuscitation. 2013;84(4):465–470.
- , , , et al. Comparison of mental‐status scales for predicting mortality on the general wards. J Hosp Med. 2015;10(10):658–663.
- , . Assessment of coma and impaired consciousness: a practical scale. Lancet. 1974;304(7872):81–84.
- , , , . Short Portable Mental Status Questionnaire as a Screening Test for Dementia and Delirium Among the Elderly. J Am Geriatr Soc. 1987;35(5):412–416.
- , , , et al. Effects of physician experience on costs and outcomes on an academic general medicine service: results of a trial of hospitalists. Ann Intern Med. 2002;137(11):866–874.
- , , . Comparing the areas under two or more correlated receiver operating characteristic curves: a nonparametric approach. Biometrics. 1988;44(3):837–845.
- , , , et al. Preliminary development of an ultrabrief two‐item bedside test for delirium. J Hosp Med. 2015;10(10):645–650.
- , , , , , . The association between an ultrabrief cognitive screening in older adults and hospital outcomes. J Hosp Med. 2015;10(10):651–657.
- , , , et al. Selecting optimal screening items for delirium: an application of item response theory. BMC Med Res Methodol. 2013;13:8.
- , , . Variability in agreement between physicians and nurses when measuring the Glasgow Coma Scale in the emergency department limits its clinical usefulness. Emerg Med Australas. 2006;18(4):379–384.

Memory and Sleep in Hospital Patients
Hospitalization is often utilized as a teachable moment, as patients are provided with education about treatment and disease management, particularly at discharge.[1, 2, 3] However, memory impairment among hospitalized patients may undermine the utility of the teachable moment. In one study of community‐dwelling seniors admitted to the hospital, one‐third had previously unrecognized poor memory at discharge.[4]
Sleep loss may be an underappreciated contributor to short‐term memory deficits in inpatients, particularly in seniors, who have baseline higher rates of sleep disruptions and sleep disorders.[5] Patients often receive 2 hours less sleep than at home and experience poor quality sleep due to disruptions.[6, 7] Robust studies of healthy subjects in laboratory settings demonstrate that sleep loss leads to decreased attention and worse recall, and that more sleep is associated with better memory performance.[8, 9]
Very few studies have examined memory in hospitalized patients. Although word‐list tasks are often used to assess memory because they are quick and easy to administer, these tasks may not accurately reflect memory for a set of instructions provided at patient discharge. Finally, no studies have examined the association between inpatient sleep loss and memory. Thus, our primary aim in this study was to examine memory performance in older, hospitalized patients using a word listbased memory task and a more complex medical vignette task. Our second aim was to investigate the relationship between in‐hospital sleep and memory.
METHODS
Study Design
We conducted a prospective cohort study with subjects enrolled in an ongoing sleep study at the University of Chicago Medical Center.[10] Eligible subjects were on the general medicine or hematology/oncology service, at least 50 years old, community dwelling, ambulatory, and without detectable cognitive impairment on the Mini Mental State Exam[11] or Short Portable Mental Status Questionnaire.[12, 13] Patients were excluded if they had a documented sleep disorder (ie, obstructive sleep apnea), were transferred from an intensive care unit or were in droplet or airborne isolation, had a bedrest order, or had already spent over 72 hours in the hospital prior to enrollment. These criteria were used to select a population appropriate for wristwatch actigraphy and with low likelihood of baseline memory impairment. The University of Chicago Institutional Review Board approved this study, and participants provided written consent.
Data Collection
Memory Testing
Memory was evaluated using the University of Southern California Repeatable Episodic Memory Test (USC‐REMT), a validated verbal memory test in which subjects listen to a list of 15 words and then complete free‐recall and recognition of the list.[14, 15] Free‐recall tests subjects' ability to procure information without cues. In contrast, recognition requires subjects to pick out the words they just heard from distractors, an easier task. The USC‐REMT contains multiple functionally equivalent different word lists, and may be administered more than once to the same subject without learning effects.[15] Immediate and delayed memory were tested by asking the subject to complete the tasks immediately after listening to the word list and 24‐hours after listening to the list, respectively.
Immediate Recall and Recognition
Recall and recognition following a night of sleep in the hospital was the primary outcome for this study. After 1 night of actigraphy recorded sleep, subjects listened as a 15‐item word list (word list A) was read aloud. For the free‐recall task, subjects were asked to repeat back all the words they could remember immediately after hearing the list. For the recognition task, subjects were read a new list of 15 words, including a mix of words from the previous list and new distractor words. They answered yes if they thought the word had previously been read to them and no if they thought the word was new.
Delayed Recall and Delayed Recognition
At the conclusion of study enrollment on day 1 prior to the night of actigraphy, subjects were shown a laminated paper with a printed word list (word list B) from the USC‐REMT. They were given 2 minutes to study the sheet and were informed they would be asked to remember the words the following day. One day later, after the night of actigraphy recorded sleep, subjects completed the free recall and yes/no recognition task based on what they remembered from word list B. This established delayed recall and recognition scores.
Medical Vignette
Because it is unclear how word recall and recognition tasks approximate remembering discharge instructions, we developed a 5‐sentence vignette about an outpatient medical encounter, based on the logical memory component of the Wechsler Memory Scale IV, a commonly used, validated test of memory assessment.[16, 17] After the USC‐REMT was administered following a night of sleep in the hospital, patients listened to a story and were immediately asked to repeat back in free form as much information as possible from the story. Responses were recorded by trained research assistants. The story is comprised of short sentences with simple ideas and vocabulary (see Supporting Information, Appendix 1, in the online version of this article).
Sleep: Wrist Actigraphy and Karolinska Sleep Log
Patient sleep was measured by actigraphy following the protocol described previously by our group.[7] Patients wore a wrist actigraphy monitor (Actiwatch 2; Philips Respironics, Inc., Murrysville, PA) to collect data on sleep duration and quality. The monitor detects wrist movement by measuring acceleration.[18] Actigraphy has been validated against polysomnography, demonstrating a correlation in sleep duration of 0.82 in insomniacs and 0.97 in healthy subjects.[19] Sleep duration and sleep efficiency overnight were calculated from the actigraphy data using Actiware 5 software.[20] Sleep duration was defined by the software based on low levels of recorded movement. Sleep efficiency was calculated as the percentage of time asleep out of the subjects' self‐reported time in bed, which was obtained using the Karolinska Sleep Log.[21]
The Karolinska Sleep Log questionnaire also asks patients to rate their sleep quality, restlessness during sleep, ease of falling asleep and the ability to sleep through the night on a 5‐point scale. The Karolinska Sleep Quality Index (KSQI) is calculated by averaging the latter 4 items.[22] A score of 3 or less classifies the subject in an insomniac range.[7, 21]
Demographic Information
Demographic information, including age, race, and gender were obtained by chart audit.
Data Analysis
Data were entered into REDCap, a secure online tool for managing survey data.[23]
Memory Scoring
For immediate and delayed recall scores, subjects received 1 point for every word they remembered correctly, with a maximum score of 15 words. We defined poor memory on the immediate recall test as a score of 3 or lower, based on a score utilized by Lindquist et al.[4] in a similar task. This score was less than half of the mean score of 6.63 obtained by Parker et al. for a sample of healthy 60 to 79 year olds in a sensitivity study of the USC‐REMT.[14] For immediate and delayed recognition, subjects received 1 point for correctly identifying whether a word had been on the word list they heard or whether it was a distractor, with a maximum score of 15.
A key was created to standardize scoring of the medical vignette by assigning 1 point to specific correctly remembered items from the story (see Supporting Information, Appendix 2A, in the online version of this article). These points were added to obtain a total score for correctly remembered vignette items. It was also noted when a vignette item was remembered incorrectly, for example, when the patient remembered left foot instead of right foot. Each incorrectly remembered item received 1 point, and these were summed to create the total score for incorrectly remembered vignette items (see Supporting Information, Appendix 2A, in the online version of this article for the scoring guide). Forgotten items were assigned 0 points. Two independent raters scored each subject's responses, and their scores were averaged for each item. Inter‐rater reliability was calculated as percentage of agreement across responses.
Statistical Analysis
Descriptive statistics were performed on the memory task data. Tests for skew and curtosis were performed for recall and recognition task data. The mean and standard deviation (SD) were calculated for normally distributed data, and the median and interquartile range (IQR) were obtained for data that showed significant skew. Mean and SD were also calculated for sleep duration and sleep efficiency measured by actigraphy.
Two‐tailed t tests were used to examine the association between memory and gender and African American race. Cuzick's nonparametric test of trend was used to test the association between age quartile and recall and recognition scores.[24] Mean and standard deviation for the correct total score and incorrect total score for the medical vignette were calculated. Pearson's correlation coefficient was used to examine the association between USC‐REMT memory measures and medical vignette score.
Pearson's correlation coefficient was calculated to test the associations between sleep duration and memory scores (immediate and delayed recall, immediate and delayed recognition, medical vignette task). This test was repeated to examine the relationship between sleep efficiency and the above memory scores. Linear regression models were used to characterize the relationship between inpatient sleep duration and efficiency and memory task performance. Two‐tailed t tests were used to compare sleep metrics (duration and efficiency) between high‐ and low‐memory groups, with low memory defined as immediate recall of 3 words.
All statistical tests were conducted using Stata 12.0 software (StataCorp, College Station, TX). Statistical significance was defined as P<0.05.
RESULTS
From April 11, 2013 to May 3, 2014, 322 patients were eligible for our study. Of these, 99 patients were enrolled in the study. We were able to collect sleep actigraphy data and immediate memory scores from 59 on day 2 of the study (Figure 1).
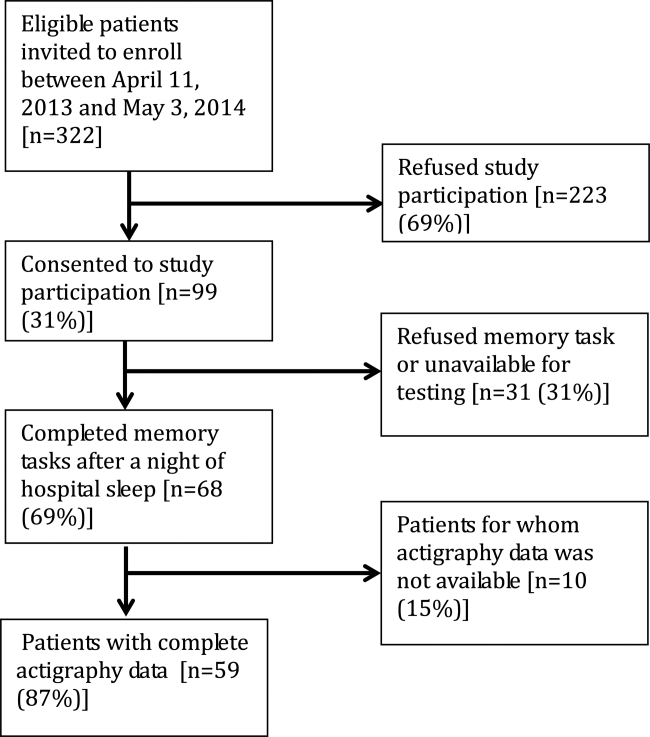
The study population had a mean age of 61.6 years (SD=9.3 years). Demographic information is presented in Table 1. Average nightly sleep in the hospital was 5.44 hours (326.4 minutes, SD=134.5 minutes), whereas mean sleep efficiency was 70.9 (SD=17.1), which is below the normal threshold of 85%.[25, 26] Forty‐four percent had a KSQI score of 3, representing in‐hospital sleep quality in the insomniac range.
| Value | |
|---|---|
| |
| Patient characteristics | |
| Age, y, mean (SD) | 61.6 (9.3) |
| Female, n (%) | 36 (61.0%) |
| BMI, n (%) | |
| Underweight (<18.5) | 3 (5.1%) |
| Normal weight (18.524.9) | 16 (27.1%) |
| Overweight (25.029.9) | 14 (23.7%) |
| Obese (30.0) | 26 (44.1%) |
| African American, n (%) | 43 (72.9%) |
| Non‐Hispanic, n (%) | 57 (96.6%) |
| Education, n (%) | |
| Did not finish high school | 13 (23.2%) |
| High school graduate | 13 (23.2%) |
| Some college or junior college | 16 (28.6%) |
| College graduate or postgraduate degree | 13 (23.2%) |
| Discharge diagnosis (ICD‐9‐CM classification), n (%) | |
| Circulatory system disease | 5 (8.5%) |
| Digestive system disease | 9 (15.3%) |
| Genitourinary system disease | 4 (6.8%) |
| Musculoskeletal system disease | 3 (5.1%) |
| Respiratory system disease | 5 (8.5%) |
| Sensory organ disease | 1 (1.7%) |
| Skin and subcutaneous tissue disease | 3 (5.1%) |
| Endocrine, nutritional, and metabolic disease | 7 (11.9%) |
| Infection and parasitic disease | 6 (10.2%) |
| Injury and poisoning | 4 (6.8%) |
| Mental disorders | 2 (3.4%) |
| Neoplasm | 5 (8.5%) |
| Symptoms, signs, and ill‐defined conditions | 5 (8.5%) |
| Comorbidities by self‐report, n=57, n (%) | |
| Cancer | 6 (10.5%) |
| Depression | 15 (26.3%) |
| Diabetes | 15 (26.3%) |
| Heart trouble | 16 (28.1%) |
| HIV/AIDS | 2 (3.5%) |
| Kidney disease | 10 (17.5%) |
| Liver disease | 9 (15.8%) |
| Stroke | 4 (7.0%) |
| Subject on the hematology and oncology service, n (%) | 6 (10.2%) |
| Sleep characteristics | |
| Nights in hospital prior to enrollment, n (%) | |
| 0 nights | 12 (20.3%) |
| 1 night | 24 (40.7%) |
| 2 nights | 17 (28.8%) |
| 3 nights | 6 (10.1%) |
| Received pharmacologic sleep aids, n (%) | 10 (17.0%) |
| Karolinska Sleep Quality Index scores, score 3, n (%) | 26 (44.1%) |
| Sleep duration, min, mean (SD) | 326.4 (134.5) |
| Sleep efficiency, %, mean (SD) | 70.9 (17.1) |
Memory test scores are presented in Figure 2. Nearly half (49%) of patients had poor memory, defined by a score of 3 words (Figure 2). Immediate recall scores varied significantly with age quartile, with older subjects recalling fewer words (Q1 [age 50.453.6 years] mean=4.9 words; Q2 [age 54.059.2 years] mean=4.1 words; Q3 [age 59.466.9 years] mean=3.7 words; Q4 [age 68.285.0 years] mean=2.5 words; P=0.001). Immediate recognition scores did not vary significantly by age quartile (Q1 [age 50.453.6 years] mean=10.3 words; Q2 [age 54.059.2 years] mean =10.3 words; Q3 [age 59.466.9 years)] mean=11.8 words; Q4 [age 68.285.0 years] mean=10.4 words; P=0.992). Fifty‐two subjects completed the delayed memory tasks. The median delayed recall score was low, at 1 word (IQR=02), with 44% of subjects remembering 0 items. Delayed memory scores were not associated with age quartile. There was no association between any memory scores and gender or African American race.
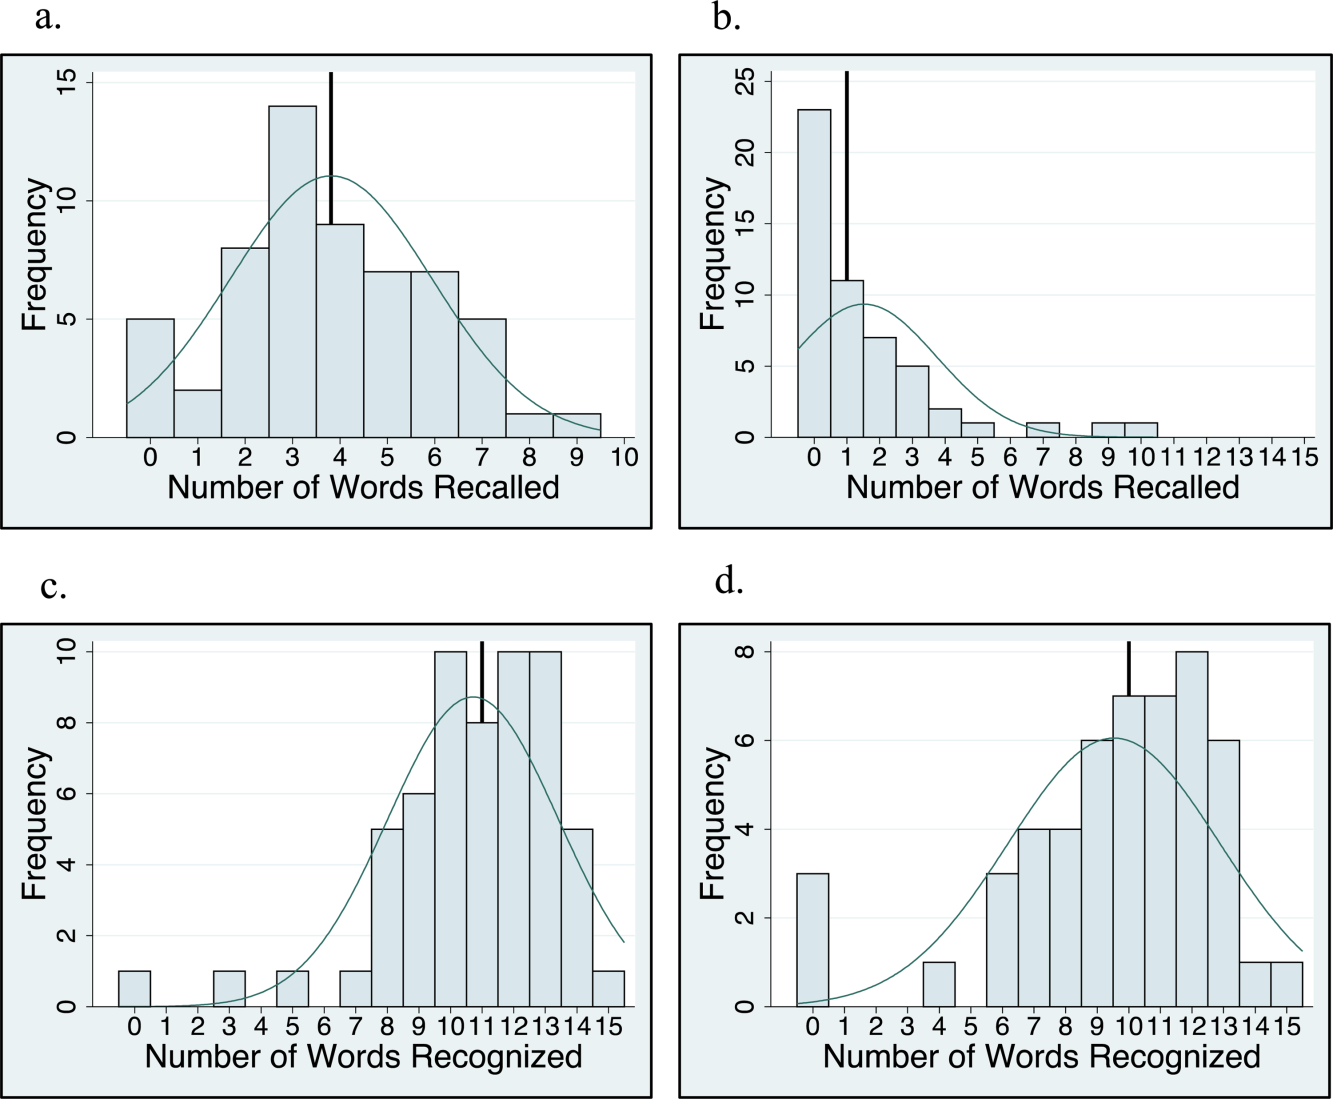
For 35 subjects in this study, we piloted the use of the medical vignette memory task. Two raters scored subject responses. Of the 525 total items, there was 98.1% agreement between the 2 raters, and only 7 out of 35 subjects' total scores differed between the 2 raters (see Supporting Information, Appendix 2B, in the online version of this article for detailed results). Median number of items remembered correctly was 4 out of 15 (IQR=26). Median number of incorrectly remembered items was 0.5 (IQR=01). Up to 57% (20 subjects) incorrectly remembered at least 1 item. The medical vignette memory score was significantly correlated with immediate recall score (r=0.49, P<0.01), but not immediate recognition score (r=0.24, P=0.16), delayed recall (r=0.13, P=0.47), or delayed recognition (r=0.01, P=0.96). There was a negative relationship between the number of items correctly recalled by a subject and the number of incorrectly recalled items on the medical vignette memory task that did not reach statistical significance (r=0.32, P=0.06).
There was no association between sleep duration, sleep efficiency, and KSQI with memory scores (immediate and delayed recall, immediate and delayed recognition, medical vignette task) (Table 2.) The relationship between objective sleep measures and immediate memory are plotted in Figure 3. Finally, there was no significant difference in sleep duration or efficiency between groups with high memory (immediate recall of >3 words) and low memory (immediate recall of 3 words).
| Independent Variables | ||||
|---|---|---|---|---|
| Sleep Duration, h | Sleep Efficiency, % | Karolinska Sleep Quality Index | ||
| Immediate recall (n=59) | Pearson's r | 0.044 | 0.2 | 0.18 |
| coefficient | 0.042 | 0.025 | 0.27 | |
| P value | 0.74 | 0.12 | 0.16 | |
| Immediate recognition (n=59) | Pearson's r | 0.066 | 0.037 | 0.13 |
| coefficient | 0.080 | 0.0058 | 0.25 | |
| P value | 0.62 | 0.78 | 0.31 | |
| Delayed recall (n=52) | Pearson's r | 0.028 | 0.0020 | 0.0081 |
| coefficient | 0.027 | 0.00025 | 0.012 | |
| P value | 0.85 | 0.99 | 0.96 | |
| Delayed recognition (n=52) | Pearson's r | 0.21 | 0.12 | 0.15 |
| coefficient | 0.31 | 0.024 | 0.35 | |
| P value | 0.13 | 0.39 | 0.29 | |
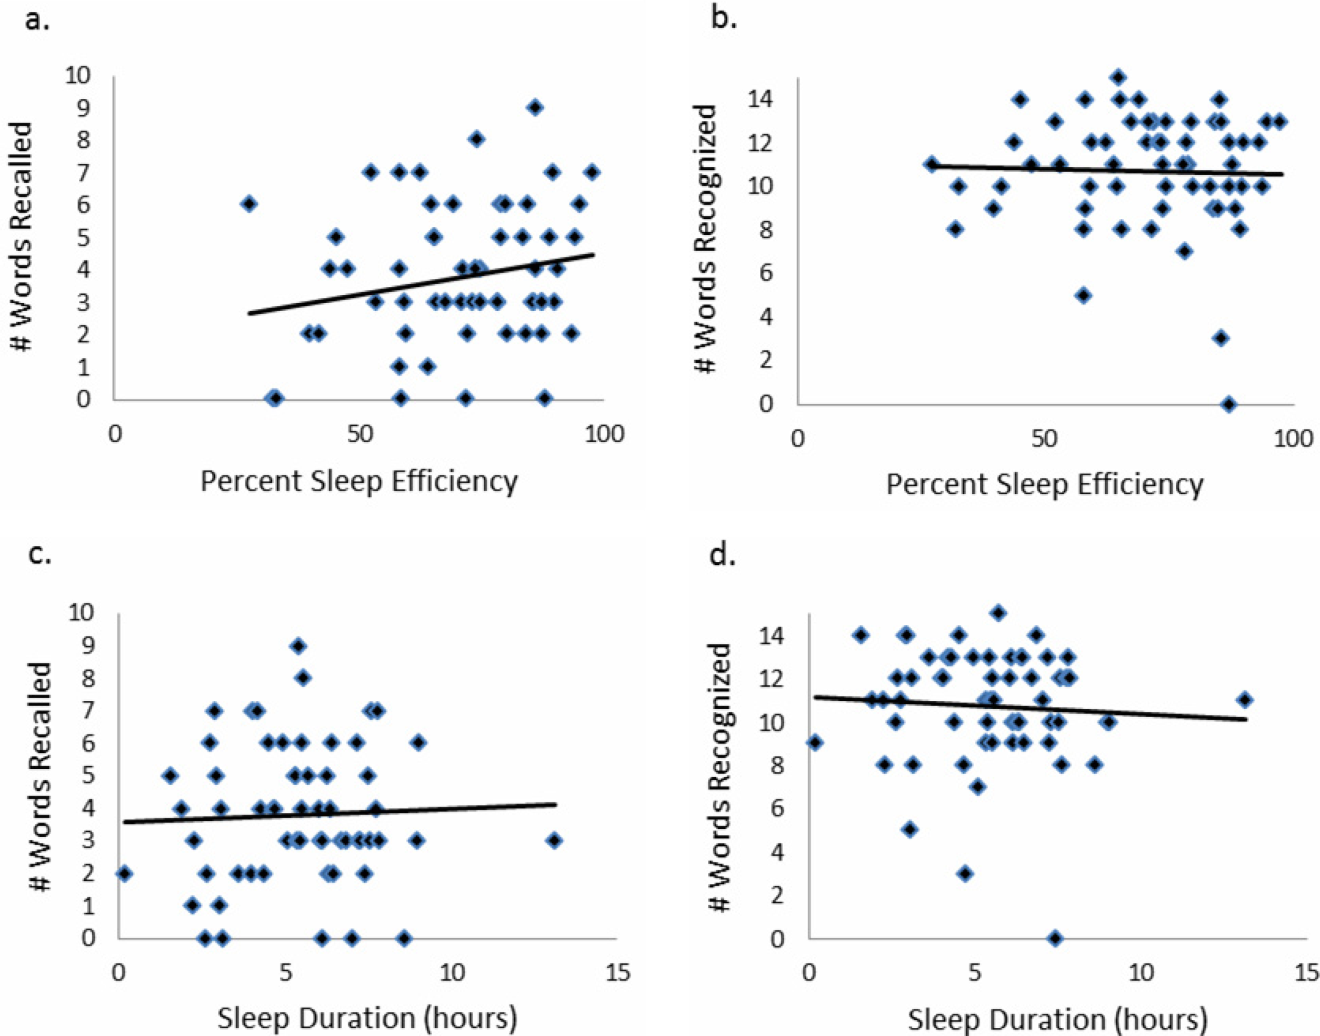
CONCLUSIONS/DISCUSSION
This study demonstrated that roughly half of hospitalized older adults without diagnosed memory or cognitive impairment had poor memory using an immediate word recall task. Although performance on an immediate word recall task may not be considered a good approximation for remembering discharge instructions, immediate recall did correlate with performance on a more complex medical vignette memory task. Though our subjects had low sleep efficiency and duration while in the hospital, memory performance was not significantly associated with inpatient sleep.
Perhaps the most concerning finding in this study was the substantial number of subjects who had poor memory. In addition to scoring approximately 1 SD lower than the community sample of healthy older adults tested in the sensitivity study of USC‐REMT,[14] our subjects also scored lower on immediate recall when compared to another hospitalized patient study.[4] In the study by Lindquist et al. that utilized a similar 15‐item word recall task in hospitalized patients, 29% of subjects were found to have poor memory (recall score of 3 words), compared to 49% in our study. In our 24‐hour delayed recall task we found that 44% of our patients could not recall a single word, with 65% remembering 1 word or fewer. In their study, Lindquist et al. similarly found that greater than 50% of subjects qualified as poor memory by recalling 1 or fewer words after merely an 8‐minute delay. Given these findings, hospitalization may not be the optimal teachable moment that it is often suggested to be. Use of transition coaches, memory aids like written instructions and reminders, and involvement of caregivers are likely critical to ensuring inpatients retain instructions and knowledge. More focus also needs to be given to older patients, who often have the worst memory. Technology tools, such as the Vocera Good To Go app, could allow medical professionals to make audio recordings of discharge instructions that patients may access at any time on a mobile device.
This study also has implications for how to measure memory in inpatients. For example, a vignette‐based memory test may be appropriate for assessing inpatient memory for discharge instructions. Our task was easy to administer and correlated with immediate recall scores. Furthermore, the story‐based task helps us to establish a sense of how much information from a paragraph is truly remembered. Our data show that only 4 items of 15 were remembered, and the majority of subjects actually misremembered 1 item. This latter measure sheds light on the rate of inaccuracy of patient recall. It is worth noting also that word recognition showed a ceiling effect in our sample, suggesting the task was too easy. In contrast, delayed recall was too difficult, as scores showed a floor effect, with over half of our sample unable to recall a single word after a 24‐hour delay.
This is the first study to assess the relationship between sleep loss and memory in hospitalized patients. We found that memory scores were not significantly associated with sleep duration, sleep efficiency, or with the self‐reported KSQI. Memory during hospitalization may be affected by factors other than sleep, like cognition, obscuring the relationship between sleep and memory. It is also possible that we were unable to see a significant association between sleep and memory because of universally low sleep duration and efficiency scores in the hospital.
Our study has several limitations. Most importantly, this study includes a small number of subjects who were hospitalized on a general medicine service at a single institution, limiting generalizability. Also importantly, our data capture only 1 night of sleep, and this may limit our study's ability to detect an association between hospital sleep and memory. More longitudinal data measuring sleep and memory across a longer period of time may reveal the distinct contribution of in‐hospital sleep. We also excluded patients with known cognitive impairment from enrollment, limiting our patient population to those with only high cognitive reserve. We hypothesize that patients with dementia experience both increased sleep disturbance and greater decline in memory during hospitalization. In addition, we are unable to test causal associations in this observational study. Furthermore, we applied a standardized memory test, the USC‐REMT, in a hospital setting, where noise and other disruptions at the time of test administration cannot be completely controlled. This makes it difficult to compare our results with those of community‐dwelling members taking the test under optimal conditions. Finally, because we created our own medical vignette task, future testing to validate this method against other memory testing is warranted.
In conclusion, our results show that memory in older hospitalized inpatients is often impaired, despite patients' appearing cognitively intact. These deficits in memory are revealed by a word recall task and also by a medical vignette task that more closely approximates memory for complex discharge instructions.
Disclosure
This work was funded by the National Institute on Aging Short‐Term Aging‐Related Research Program (5T35AG029795),the National Institute on Aging Career Development Award (K23AG033763), and the National Heart Lung and Blood Institute (R25 HL116372).
- . Importance of in‐hospital initiation of evidence‐based medical therapies for heart failure: taking advantage of the teachable moment. Congest Heart Fail. 2005;11(3):153–154.
- , , , , . Smoking cessation in hospitalized patients: results of a randomized trial. Arch Intern Med. 1997;157(4):409–415.
- , , . Smoking cessation interventions for hospitalized smokers: a systematic review. Arch Intern Med. 2008;168(18):1950–1960.
- , , , , . Improvements in cognition following hospital discharge of community dwelling seniors. J Gen Intern Med. 2011;26(7):765–770.
- , , , . Sleep and aging: 1. sleep disorders commonly found in older people. Can Med Assoc J. 2007;176(9):1299–1304.
- . Noise and sleep among adult medical inpatients: far from a quiet night. Arch Intern Med. 2012;172(1):68–70.
- , , , , , . Perceived control and sleep in hospitalized older adults: a sound hypothesis? J Hosp Med. 2013;8(4):184–190.
- , . A meta‐analysis of the impact of short‐term sleep deprivation on cognitive variables. Psychol Bull. 2010;136(3):375–389.
- , . Sleep deprivation: Impact on cognitive performance. Neuropsychiatr Dis Treat. 2007;3(5):553–567.
- , , , et al. Effects of physician experience on costs and outcomes on an academic general medicine service: results of a trial of hospitalists. Ann Intern Med. 2002;137(11):866–874.
- , , . “Mini‐mental state”: a practical method for grading the cognitive state of patients for the clinician. J Psychiatr Res. 1975;12(3):189–198.
- . A short portable mental status questionnaire for the assessment of organic brain deficit in elderly patients. J Am Geriatr Soc. 1975;10:433–441.
- , , , . Reliability and validity of the Short Portable Mental Status Questionnaire administered by telephone. J Geriatr Psychiatry Neurol. 1994;7(1):33–38.
- , , , . Aging, recall and recognition: a study on the sensitivity of the University of Southern California Repeatable Episodic Memory Test (USC‐REMT). J Clin Exp Neuropsychol. 2004;26(3):428–440.
- , , , , . University of southern california repeatable episodic memory test. J Clin Exp Neuropsychol. 1995;17(6):926–936.
- , , . Development of alternate paragraphs for the logical memory subtest of the Wechsler Memory Scale‐Revised. Clin Neuropsychol. 1997;11(4):370–374.
- , , . A Compendium of Neuropsychological Tests: Administration, Norms, and Commentary. 3rd ed. New York, NY: Oxford University Press; 2009.
- . Review of physical activity measurement using accelerometers in older adults: considerations for research design and conduct. Prev Med. 2009;48(2):108–114.
- , , , , , . The actigraph data analysis software: I. A novel approach to scoring and interpreting sleep‐wake activity. Percept Mot Skills. 1997;85(1):207–216.
- , , , et al. Evaluation of immobility time for sleep latency in actigraphy. Sleep Med. 2009;10(6):621–625.
- , , , , . The subjective meaning of sleep quality: a comparison of individuals with and without insomnia. Sleep. 2008;31(3):383–393.
- , . Objective components of individual differences in subjective sleep quality. J Sleep Res. 1997;6(4):217–220.
- , , , , , . Research electronic data capture (REDCap)—a metadata‐driven methodology and workflow process for providing translational research informatics support. J Biomed Inform. 2009;42(2):377–381.
- . A Wilcoxon‐type test for trend. Stat Med. 1985;4(1):87–90.
- , , , et al. Derivation of research diagnostic criteria for insomnia: report of an American Academy of Sleep Medicine Work Group. Sleep. 2004;27(8):1567–1596.
- , , , , . Quantitative criteria for insomnia. Behav Res Ther. 2003;41(4):427–445.
Hospitalization is often utilized as a teachable moment, as patients are provided with education about treatment and disease management, particularly at discharge.[1, 2, 3] However, memory impairment among hospitalized patients may undermine the utility of the teachable moment. In one study of community‐dwelling seniors admitted to the hospital, one‐third had previously unrecognized poor memory at discharge.[4]
Sleep loss may be an underappreciated contributor to short‐term memory deficits in inpatients, particularly in seniors, who have baseline higher rates of sleep disruptions and sleep disorders.[5] Patients often receive 2 hours less sleep than at home and experience poor quality sleep due to disruptions.[6, 7] Robust studies of healthy subjects in laboratory settings demonstrate that sleep loss leads to decreased attention and worse recall, and that more sleep is associated with better memory performance.[8, 9]
Very few studies have examined memory in hospitalized patients. Although word‐list tasks are often used to assess memory because they are quick and easy to administer, these tasks may not accurately reflect memory for a set of instructions provided at patient discharge. Finally, no studies have examined the association between inpatient sleep loss and memory. Thus, our primary aim in this study was to examine memory performance in older, hospitalized patients using a word listbased memory task and a more complex medical vignette task. Our second aim was to investigate the relationship between in‐hospital sleep and memory.
METHODS
Study Design
We conducted a prospective cohort study with subjects enrolled in an ongoing sleep study at the University of Chicago Medical Center.[10] Eligible subjects were on the general medicine or hematology/oncology service, at least 50 years old, community dwelling, ambulatory, and without detectable cognitive impairment on the Mini Mental State Exam[11] or Short Portable Mental Status Questionnaire.[12, 13] Patients were excluded if they had a documented sleep disorder (ie, obstructive sleep apnea), were transferred from an intensive care unit or were in droplet or airborne isolation, had a bedrest order, or had already spent over 72 hours in the hospital prior to enrollment. These criteria were used to select a population appropriate for wristwatch actigraphy and with low likelihood of baseline memory impairment. The University of Chicago Institutional Review Board approved this study, and participants provided written consent.
Data Collection
Memory Testing
Memory was evaluated using the University of Southern California Repeatable Episodic Memory Test (USC‐REMT), a validated verbal memory test in which subjects listen to a list of 15 words and then complete free‐recall and recognition of the list.[14, 15] Free‐recall tests subjects' ability to procure information without cues. In contrast, recognition requires subjects to pick out the words they just heard from distractors, an easier task. The USC‐REMT contains multiple functionally equivalent different word lists, and may be administered more than once to the same subject without learning effects.[15] Immediate and delayed memory were tested by asking the subject to complete the tasks immediately after listening to the word list and 24‐hours after listening to the list, respectively.
Immediate Recall and Recognition
Recall and recognition following a night of sleep in the hospital was the primary outcome for this study. After 1 night of actigraphy recorded sleep, subjects listened as a 15‐item word list (word list A) was read aloud. For the free‐recall task, subjects were asked to repeat back all the words they could remember immediately after hearing the list. For the recognition task, subjects were read a new list of 15 words, including a mix of words from the previous list and new distractor words. They answered yes if they thought the word had previously been read to them and no if they thought the word was new.
Delayed Recall and Delayed Recognition
At the conclusion of study enrollment on day 1 prior to the night of actigraphy, subjects were shown a laminated paper with a printed word list (word list B) from the USC‐REMT. They were given 2 minutes to study the sheet and were informed they would be asked to remember the words the following day. One day later, after the night of actigraphy recorded sleep, subjects completed the free recall and yes/no recognition task based on what they remembered from word list B. This established delayed recall and recognition scores.
Medical Vignette
Because it is unclear how word recall and recognition tasks approximate remembering discharge instructions, we developed a 5‐sentence vignette about an outpatient medical encounter, based on the logical memory component of the Wechsler Memory Scale IV, a commonly used, validated test of memory assessment.[16, 17] After the USC‐REMT was administered following a night of sleep in the hospital, patients listened to a story and were immediately asked to repeat back in free form as much information as possible from the story. Responses were recorded by trained research assistants. The story is comprised of short sentences with simple ideas and vocabulary (see Supporting Information, Appendix 1, in the online version of this article).
Sleep: Wrist Actigraphy and Karolinska Sleep Log
Patient sleep was measured by actigraphy following the protocol described previously by our group.[7] Patients wore a wrist actigraphy monitor (Actiwatch 2; Philips Respironics, Inc., Murrysville, PA) to collect data on sleep duration and quality. The monitor detects wrist movement by measuring acceleration.[18] Actigraphy has been validated against polysomnography, demonstrating a correlation in sleep duration of 0.82 in insomniacs and 0.97 in healthy subjects.[19] Sleep duration and sleep efficiency overnight were calculated from the actigraphy data using Actiware 5 software.[20] Sleep duration was defined by the software based on low levels of recorded movement. Sleep efficiency was calculated as the percentage of time asleep out of the subjects' self‐reported time in bed, which was obtained using the Karolinska Sleep Log.[21]
The Karolinska Sleep Log questionnaire also asks patients to rate their sleep quality, restlessness during sleep, ease of falling asleep and the ability to sleep through the night on a 5‐point scale. The Karolinska Sleep Quality Index (KSQI) is calculated by averaging the latter 4 items.[22] A score of 3 or less classifies the subject in an insomniac range.[7, 21]
Demographic Information
Demographic information, including age, race, and gender were obtained by chart audit.
Data Analysis
Data were entered into REDCap, a secure online tool for managing survey data.[23]
Memory Scoring
For immediate and delayed recall scores, subjects received 1 point for every word they remembered correctly, with a maximum score of 15 words. We defined poor memory on the immediate recall test as a score of 3 or lower, based on a score utilized by Lindquist et al.[4] in a similar task. This score was less than half of the mean score of 6.63 obtained by Parker et al. for a sample of healthy 60 to 79 year olds in a sensitivity study of the USC‐REMT.[14] For immediate and delayed recognition, subjects received 1 point for correctly identifying whether a word had been on the word list they heard or whether it was a distractor, with a maximum score of 15.
A key was created to standardize scoring of the medical vignette by assigning 1 point to specific correctly remembered items from the story (see Supporting Information, Appendix 2A, in the online version of this article). These points were added to obtain a total score for correctly remembered vignette items. It was also noted when a vignette item was remembered incorrectly, for example, when the patient remembered left foot instead of right foot. Each incorrectly remembered item received 1 point, and these were summed to create the total score for incorrectly remembered vignette items (see Supporting Information, Appendix 2A, in the online version of this article for the scoring guide). Forgotten items were assigned 0 points. Two independent raters scored each subject's responses, and their scores were averaged for each item. Inter‐rater reliability was calculated as percentage of agreement across responses.
Statistical Analysis
Descriptive statistics were performed on the memory task data. Tests for skew and curtosis were performed for recall and recognition task data. The mean and standard deviation (SD) were calculated for normally distributed data, and the median and interquartile range (IQR) were obtained for data that showed significant skew. Mean and SD were also calculated for sleep duration and sleep efficiency measured by actigraphy.
Two‐tailed t tests were used to examine the association between memory and gender and African American race. Cuzick's nonparametric test of trend was used to test the association between age quartile and recall and recognition scores.[24] Mean and standard deviation for the correct total score and incorrect total score for the medical vignette were calculated. Pearson's correlation coefficient was used to examine the association between USC‐REMT memory measures and medical vignette score.
Pearson's correlation coefficient was calculated to test the associations between sleep duration and memory scores (immediate and delayed recall, immediate and delayed recognition, medical vignette task). This test was repeated to examine the relationship between sleep efficiency and the above memory scores. Linear regression models were used to characterize the relationship between inpatient sleep duration and efficiency and memory task performance. Two‐tailed t tests were used to compare sleep metrics (duration and efficiency) between high‐ and low‐memory groups, with low memory defined as immediate recall of 3 words.
All statistical tests were conducted using Stata 12.0 software (StataCorp, College Station, TX). Statistical significance was defined as P<0.05.
RESULTS
From April 11, 2013 to May 3, 2014, 322 patients were eligible for our study. Of these, 99 patients were enrolled in the study. We were able to collect sleep actigraphy data and immediate memory scores from 59 on day 2 of the study (Figure 1).
The study population had a mean age of 61.6 years (SD=9.3 years). Demographic information is presented in Table 1. Average nightly sleep in the hospital was 5.44 hours (326.4 minutes, SD=134.5 minutes), whereas mean sleep efficiency was 70.9 (SD=17.1), which is below the normal threshold of 85%.[25, 26] Forty‐four percent had a KSQI score of 3, representing in‐hospital sleep quality in the insomniac range.
| Value | |
|---|---|
| |
| Patient characteristics | |
| Age, y, mean (SD) | 61.6 (9.3) |
| Female, n (%) | 36 (61.0%) |
| BMI, n (%) | |
| Underweight (<18.5) | 3 (5.1%) |
| Normal weight (18.524.9) | 16 (27.1%) |
| Overweight (25.029.9) | 14 (23.7%) |
| Obese (30.0) | 26 (44.1%) |
| African American, n (%) | 43 (72.9%) |
| Non‐Hispanic, n (%) | 57 (96.6%) |
| Education, n (%) | |
| Did not finish high school | 13 (23.2%) |
| High school graduate | 13 (23.2%) |
| Some college or junior college | 16 (28.6%) |
| College graduate or postgraduate degree | 13 (23.2%) |
| Discharge diagnosis (ICD‐9‐CM classification), n (%) | |
| Circulatory system disease | 5 (8.5%) |
| Digestive system disease | 9 (15.3%) |
| Genitourinary system disease | 4 (6.8%) |
| Musculoskeletal system disease | 3 (5.1%) |
| Respiratory system disease | 5 (8.5%) |
| Sensory organ disease | 1 (1.7%) |
| Skin and subcutaneous tissue disease | 3 (5.1%) |
| Endocrine, nutritional, and metabolic disease | 7 (11.9%) |
| Infection and parasitic disease | 6 (10.2%) |
| Injury and poisoning | 4 (6.8%) |
| Mental disorders | 2 (3.4%) |
| Neoplasm | 5 (8.5%) |
| Symptoms, signs, and ill‐defined conditions | 5 (8.5%) |
| Comorbidities by self‐report, n=57, n (%) | |
| Cancer | 6 (10.5%) |
| Depression | 15 (26.3%) |
| Diabetes | 15 (26.3%) |
| Heart trouble | 16 (28.1%) |
| HIV/AIDS | 2 (3.5%) |
| Kidney disease | 10 (17.5%) |
| Liver disease | 9 (15.8%) |
| Stroke | 4 (7.0%) |
| Subject on the hematology and oncology service, n (%) | 6 (10.2%) |
| Sleep characteristics | |
| Nights in hospital prior to enrollment, n (%) | |
| 0 nights | 12 (20.3%) |
| 1 night | 24 (40.7%) |
| 2 nights | 17 (28.8%) |
| 3 nights | 6 (10.1%) |
| Received pharmacologic sleep aids, n (%) | 10 (17.0%) |
| Karolinska Sleep Quality Index scores, score 3, n (%) | 26 (44.1%) |
| Sleep duration, min, mean (SD) | 326.4 (134.5) |
| Sleep efficiency, %, mean (SD) | 70.9 (17.1) |
Memory test scores are presented in Figure 2. Nearly half (49%) of patients had poor memory, defined by a score of 3 words (Figure 2). Immediate recall scores varied significantly with age quartile, with older subjects recalling fewer words (Q1 [age 50.453.6 years] mean=4.9 words; Q2 [age 54.059.2 years] mean=4.1 words; Q3 [age 59.466.9 years] mean=3.7 words; Q4 [age 68.285.0 years] mean=2.5 words; P=0.001). Immediate recognition scores did not vary significantly by age quartile (Q1 [age 50.453.6 years] mean=10.3 words; Q2 [age 54.059.2 years] mean =10.3 words; Q3 [age 59.466.9 years)] mean=11.8 words; Q4 [age 68.285.0 years] mean=10.4 words; P=0.992). Fifty‐two subjects completed the delayed memory tasks. The median delayed recall score was low, at 1 word (IQR=02), with 44% of subjects remembering 0 items. Delayed memory scores were not associated with age quartile. There was no association between any memory scores and gender or African American race.
For 35 subjects in this study, we piloted the use of the medical vignette memory task. Two raters scored subject responses. Of the 525 total items, there was 98.1% agreement between the 2 raters, and only 7 out of 35 subjects' total scores differed between the 2 raters (see Supporting Information, Appendix 2B, in the online version of this article for detailed results). Median number of items remembered correctly was 4 out of 15 (IQR=26). Median number of incorrectly remembered items was 0.5 (IQR=01). Up to 57% (20 subjects) incorrectly remembered at least 1 item. The medical vignette memory score was significantly correlated with immediate recall score (r=0.49, P<0.01), but not immediate recognition score (r=0.24, P=0.16), delayed recall (r=0.13, P=0.47), or delayed recognition (r=0.01, P=0.96). There was a negative relationship between the number of items correctly recalled by a subject and the number of incorrectly recalled items on the medical vignette memory task that did not reach statistical significance (r=0.32, P=0.06).
There was no association between sleep duration, sleep efficiency, and KSQI with memory scores (immediate and delayed recall, immediate and delayed recognition, medical vignette task) (Table 2.) The relationship between objective sleep measures and immediate memory are plotted in Figure 3. Finally, there was no significant difference in sleep duration or efficiency between groups with high memory (immediate recall of >3 words) and low memory (immediate recall of 3 words).
| Independent Variables | ||||
|---|---|---|---|---|
| Sleep Duration, h | Sleep Efficiency, % | Karolinska Sleep Quality Index | ||
| Immediate recall (n=59) | Pearson's r | 0.044 | 0.2 | 0.18 |
| coefficient | 0.042 | 0.025 | 0.27 | |
| P value | 0.74 | 0.12 | 0.16 | |
| Immediate recognition (n=59) | Pearson's r | 0.066 | 0.037 | 0.13 |
| coefficient | 0.080 | 0.0058 | 0.25 | |
| P value | 0.62 | 0.78 | 0.31 | |
| Delayed recall (n=52) | Pearson's r | 0.028 | 0.0020 | 0.0081 |
| coefficient | 0.027 | 0.00025 | 0.012 | |
| P value | 0.85 | 0.99 | 0.96 | |
| Delayed recognition (n=52) | Pearson's r | 0.21 | 0.12 | 0.15 |
| coefficient | 0.31 | 0.024 | 0.35 | |
| P value | 0.13 | 0.39 | 0.29 | |
CONCLUSIONS/DISCUSSION
This study demonstrated that roughly half of hospitalized older adults without diagnosed memory or cognitive impairment had poor memory using an immediate word recall task. Although performance on an immediate word recall task may not be considered a good approximation for remembering discharge instructions, immediate recall did correlate with performance on a more complex medical vignette memory task. Though our subjects had low sleep efficiency and duration while in the hospital, memory performance was not significantly associated with inpatient sleep.
Perhaps the most concerning finding in this study was the substantial number of subjects who had poor memory. In addition to scoring approximately 1 SD lower than the community sample of healthy older adults tested in the sensitivity study of USC‐REMT,[14] our subjects also scored lower on immediate recall when compared to another hospitalized patient study.[4] In the study by Lindquist et al. that utilized a similar 15‐item word recall task in hospitalized patients, 29% of subjects were found to have poor memory (recall score of 3 words), compared to 49% in our study. In our 24‐hour delayed recall task we found that 44% of our patients could not recall a single word, with 65% remembering 1 word or fewer. In their study, Lindquist et al. similarly found that greater than 50% of subjects qualified as poor memory by recalling 1 or fewer words after merely an 8‐minute delay. Given these findings, hospitalization may not be the optimal teachable moment that it is often suggested to be. Use of transition coaches, memory aids like written instructions and reminders, and involvement of caregivers are likely critical to ensuring inpatients retain instructions and knowledge. More focus also needs to be given to older patients, who often have the worst memory. Technology tools, such as the Vocera Good To Go app, could allow medical professionals to make audio recordings of discharge instructions that patients may access at any time on a mobile device.
This study also has implications for how to measure memory in inpatients. For example, a vignette‐based memory test may be appropriate for assessing inpatient memory for discharge instructions. Our task was easy to administer and correlated with immediate recall scores. Furthermore, the story‐based task helps us to establish a sense of how much information from a paragraph is truly remembered. Our data show that only 4 items of 15 were remembered, and the majority of subjects actually misremembered 1 item. This latter measure sheds light on the rate of inaccuracy of patient recall. It is worth noting also that word recognition showed a ceiling effect in our sample, suggesting the task was too easy. In contrast, delayed recall was too difficult, as scores showed a floor effect, with over half of our sample unable to recall a single word after a 24‐hour delay.
This is the first study to assess the relationship between sleep loss and memory in hospitalized patients. We found that memory scores were not significantly associated with sleep duration, sleep efficiency, or with the self‐reported KSQI. Memory during hospitalization may be affected by factors other than sleep, like cognition, obscuring the relationship between sleep and memory. It is also possible that we were unable to see a significant association between sleep and memory because of universally low sleep duration and efficiency scores in the hospital.
Our study has several limitations. Most importantly, this study includes a small number of subjects who were hospitalized on a general medicine service at a single institution, limiting generalizability. Also importantly, our data capture only 1 night of sleep, and this may limit our study's ability to detect an association between hospital sleep and memory. More longitudinal data measuring sleep and memory across a longer period of time may reveal the distinct contribution of in‐hospital sleep. We also excluded patients with known cognitive impairment from enrollment, limiting our patient population to those with only high cognitive reserve. We hypothesize that patients with dementia experience both increased sleep disturbance and greater decline in memory during hospitalization. In addition, we are unable to test causal associations in this observational study. Furthermore, we applied a standardized memory test, the USC‐REMT, in a hospital setting, where noise and other disruptions at the time of test administration cannot be completely controlled. This makes it difficult to compare our results with those of community‐dwelling members taking the test under optimal conditions. Finally, because we created our own medical vignette task, future testing to validate this method against other memory testing is warranted.
In conclusion, our results show that memory in older hospitalized inpatients is often impaired, despite patients' appearing cognitively intact. These deficits in memory are revealed by a word recall task and also by a medical vignette task that more closely approximates memory for complex discharge instructions.
Disclosure
This work was funded by the National Institute on Aging Short‐Term Aging‐Related Research Program (5T35AG029795),the National Institute on Aging Career Development Award (K23AG033763), and the National Heart Lung and Blood Institute (R25 HL116372).
- . Importance of in‐hospital initiation of evidence‐based medical therapies for heart failure: taking advantage of the teachable moment. Congest Heart Fail. 2005;11(3):153–154.
- , , , , . Smoking cessation in hospitalized patients: results of a randomized trial. Arch Intern Med. 1997;157(4):409–415.
- , , . Smoking cessation interventions for hospitalized smokers: a systematic review. Arch Intern Med. 2008;168(18):1950–1960.
- , , , , . Improvements in cognition following hospital discharge of community dwelling seniors. J Gen Intern Med. 2011;26(7):765–770.
- , , , . Sleep and aging: 1. sleep disorders commonly found in older people. Can Med Assoc J. 2007;176(9):1299–1304.
- . Noise and sleep among adult medical inpatients: far from a quiet night. Arch Intern Med. 2012;172(1):68–70.
- , , , , , . Perceived control and sleep in hospitalized older adults: a sound hypothesis? J Hosp Med. 2013;8(4):184–190.
- , . A meta‐analysis of the impact of short‐term sleep deprivation on cognitive variables. Psychol Bull. 2010;136(3):375–389.
- , . Sleep deprivation: Impact on cognitive performance. Neuropsychiatr Dis Treat. 2007;3(5):553–567.
- , , , et al. Effects of physician experience on costs and outcomes on an academic general medicine service: results of a trial of hospitalists. Ann Intern Med. 2002;137(11):866–874.
- , , . “Mini‐mental state”: a practical method for grading the cognitive state of patients for the clinician. J Psychiatr Res. 1975;12(3):189–198.
- . A short portable mental status questionnaire for the assessment of organic brain deficit in elderly patients. J Am Geriatr Soc. 1975;10:433–441.
- , , , . Reliability and validity of the Short Portable Mental Status Questionnaire administered by telephone. J Geriatr Psychiatry Neurol. 1994;7(1):33–38.
- , , , . Aging, recall and recognition: a study on the sensitivity of the University of Southern California Repeatable Episodic Memory Test (USC‐REMT). J Clin Exp Neuropsychol. 2004;26(3):428–440.
- , , , , . University of southern california repeatable episodic memory test. J Clin Exp Neuropsychol. 1995;17(6):926–936.
- , , . Development of alternate paragraphs for the logical memory subtest of the Wechsler Memory Scale‐Revised. Clin Neuropsychol. 1997;11(4):370–374.
- , , . A Compendium of Neuropsychological Tests: Administration, Norms, and Commentary. 3rd ed. New York, NY: Oxford University Press; 2009.
- . Review of physical activity measurement using accelerometers in older adults: considerations for research design and conduct. Prev Med. 2009;48(2):108–114.
- , , , , , . The actigraph data analysis software: I. A novel approach to scoring and interpreting sleep‐wake activity. Percept Mot Skills. 1997;85(1):207–216.
- , , , et al. Evaluation of immobility time for sleep latency in actigraphy. Sleep Med. 2009;10(6):621–625.
- , , , , . The subjective meaning of sleep quality: a comparison of individuals with and without insomnia. Sleep. 2008;31(3):383–393.
- , . Objective components of individual differences in subjective sleep quality. J Sleep Res. 1997;6(4):217–220.
- , , , , , . Research electronic data capture (REDCap)—a metadata‐driven methodology and workflow process for providing translational research informatics support. J Biomed Inform. 2009;42(2):377–381.
- . A Wilcoxon‐type test for trend. Stat Med. 1985;4(1):87–90.
- , , , et al. Derivation of research diagnostic criteria for insomnia: report of an American Academy of Sleep Medicine Work Group. Sleep. 2004;27(8):1567–1596.
- , , , , . Quantitative criteria for insomnia. Behav Res Ther. 2003;41(4):427–445.
© 2015 Society of Hospital Medicine

Inpatients With Poor Vision
Vision impairment is an under‐recognized risk factor for adverse events among hospitalized patients.[1, 2, 3] Inpatients with poor vision are at increased risk for falls and delirium[1, 3] and have more difficulty taking medications.[4, 5] They may also be at risk for being unable to read critical health information, including consent forms and discharge instructions, or decreased quality of life such as simply ordering food from menus. However, vision is neither routinely tested nor documented for inpatients. Low‐cost ($8 and up) nonprescription reading glasses, known as readers may be a simple, high‐value intervention to improve inpatients' vision. We aimed to study initial feasibility and efficacy of screening and correcting inpatients' vision.
METHODS
From June 2012 through January 2014, research assistants (RAs) identified eligible (adults [18 years], English speaking) participants daily from electronic medical records as part of an ongoing study of general medicine inpatients measuring quality‐of‐care at the University of Chicago Medicine.[6] RAs tested visual acuity using Snellen pocket charts (participants wore corrective lenses if available). For eligible participants, readers were tested with sequential fitting (+2/+2.25/+2.75/+3.25) until vision was corrected (sufficient vision: at least 20/50 acuity in at least 1 eye).[7] Eligible participants included those with insufficient vision who were not already wearing corrective lenses and had no documented blindness or medically severe vision loss, for whom nonprescription readers would be unlikely to correct vision deficiencies such as cataracts or glaucoma. The study was approved by the University of Chicago Institutional Review Board (IRB #9967).
Of note, although readers are typically used in populations over 40 years of age, readers were fitted for all participants to assess their utility for any hospitalized adult patient. Upon completing the vision screening and readers interventions, participants received instruction on how to access vision care and how to obtain readers (if they corrected vision) after hospital discharge.
Descriptive statistics and tests of comparison, including t tests and [2] tests, were used when appropriate. All analyses were performed using Stata version 12 (StataCorp, College Station, TX).
RESULTS
Over 800 participants' vision was screened (n=853); the majority were female (56%, 480/853), African American (76%, 650/853), with a mean age of 53.4 years (standard deviation 18.7), consistent with our study site's demographics. Over one‐third (36%, 304/853) of participants had insufficient vision. Older (65 years) participants (56%, 136/244) were more likely to have insufficient vision than younger participants (28%, 168/608; P<0.001).
Participants with insufficient vision were wearing their own corrective lenses during the testing (150/304, 49%), did not use corrective lenses (53/304, 17%), or were without available corrective lenses (99/304, 33%) (Figure 1A).

One‐hundred sixteen of 304 participants approached for the readers intervention were eligible (112 reported medical eye disease, 65 were wearing lenses, and 11 refused or were discharged before intervention implementation).
Nonprescription readers corrected the majority of eligible participants' vision (82%, 95/116). Most participants' (81/116, 70%) vision was corrected using the 2 lowest calibration readers (+2/+2.25); another 14 participants' (12%) vision was corrected with higher‐strength lenses (+2.75/+3.25) (Figure 1B)
DISCUSSION
We found that over one‐third of the inpatients we examined have poor vision. Furthermore, among an easily identified subgroup of inpatients with poor vision, low‐cost readers successfully corrected most participants' vision. Although preventive health is not commonly considered an inpatient issue, hospitalists and other clinicians working in the inpatient setting can play an important role in identifying opportunities to provide high‐value care related to patients' vision.
Several important ethical, safety, and cost considerations related to these findings exist. Hospitalized patients commonly sign written informed consent; therefore, due diligence to ensure patients' ability to read and understand the forms is imperative. Further, inpatient delirium is common, particularly among older patients.[8] Existing or new onset delirium occurs in up to 24% to 35% of elderly inpatients.[8] Vision is an important risk factor for multifactorial inpatient delirium, and early vision correction has been shown to improve delirium rates, as part of a multicomponent intervention.[9] Hospital‐related patient costs per delirium episode have been estimated at $16,303 to $64,421.[10] The cost of a multicomponent intervention was $6341 per case of delirium prevented,[9] whereas only 1 potentially critical component, the cost of readers ($8+), would pale in comparison.[1] Vision screening takes approximately 2.25 minutes plus 2 to 6 minutes for the readers' assessment, with little training and high fidelity. Therefore, this easily implemented, potentially cost saving, intervention targeting inpatients with poor vision may improve patient safety and quality of life in the hospital and even after discharge.
Limitations of the study include considerations of generalizability, as participants were from a single, urban, academic medical center. Additionally, long‐term benefits of the readers intervention were not assessed in this study. Finally, RAs provided the assessments; therefore, further work is required to determine costs of efficient large‐scale clinical implementation through nurse‐led programs.
Despite these study limitations, the surprisingly high prevalence of poor vision among inpatients is a call to action for hospitalists. Future work should investigate the impact and cost of vision correction on hospital outcomes such as patient satisfaction, reduced rehospitalizations, and decreased delirium.[11]
Acknowledgements
The authors thank several individuals for their assistance with this project. Andrea Flores, MA, Senior Programmer, helped with programming and data support. Kristin Constantine, BA, Project Manager, helped with developing and implementing the database for this project. Edward Kim, BA, Project Manager, helped with management of the database and data collection. The authors also thank Ainoa Coltri and the Hospitalist Project research assistants for assistance with data collection, Frank Zadravecz, MPH, for assistance with the creation of figures, and Nicole Twu, MS, for assistance with the project. The authors thank other students who helped to collect data for this project, including Allison Louis, Victoria Moreira, and Esther Schoenfeld.
Disclosures: Dr. Press is supported by a career development award from the National Heart Lung and Blood Institute (NIH K23HL118151). A pilot award from The Center on the Demography and Economics of Aging (CoA, National Institute of Aging P30 AG012857) supported this project. Dr. Matthiesen and Ms. Ranadive received support from the Summer Research Program funded by the National Institutes on Aging Short‐Term Aging‐Related Research Program (T35AG029795). Dr. Matthiesen also received funding from the Calvin Fentress Fellowship Program. Dr. Hariprasad reports being a consultant or participating on a speaker's bureau for Alcon, Allergan, Regeneron, Genentech, Optos, OD‐OS, Bayer, Clearside Biomedical, and Ocular Therapeutix. Dr. Meltzer received funding from the National Institutes on Aging Short‐Term Aging‐Related Research Program (T35AG029795), and from the Agency for Healthcare Quality and Research through the Hospital Medicine and Economics Center for Education and Research in Therapeutics (U18 HS016967‐01), and from the National Institute of Aging through a Midcareer Career Development Award (K24 AG031326‐01), from the National Cancer Institute (KM1 CA156717), and from the National Center for Advancing Translational Science (2UL1TR000430‐06). Dr. Arora received funding from the National Institutes on Aging Short‐Term Aging‐Related Research Program (T35AG029795) and National Institutes on Aging (K23AG033763).
- , , , . Risk factors and risk assessment tools for falls in hospital in‐patients: a systematic review. Age Ageing. 2004;33(2):122–130.
- , , , , . More than meets the eye: relationship between low health literacy and poor vision in hospitalized patients. J Health Commun. 2013;18(suppl 1):197–204.
- , , , , , . Risk factors for delirium at discharge: development and validation of a predictive model. Arch Intern Med. 2007;167(13):1406–1413.
- , , , et al. Misuse of respiratory inhalers in hospitalized patients with asthma or COPD. J Gen Intern Med. 2011;26(6):635–642.
- , , . Can elderly people take their medicine? Patient Educ Couns. 2005;59(2):186–191.
- , , , et al. Effects of physician experience on costs and outcomes on an academic general medicine service: results of a trial of hospitalists. Ann Intern Med. 2002;137(11):866–874.
- . Prospective evaluation of visual acuity assessment: a comparison of Snellen versus ETDRS charts in clinical practice (An AOS Thesis). Trans Am Ophthalmol Soc. 2009;107:311–324.
- , , , et al. Delirium. The occurrence and persistence of symptoms among elderly hospitalized patients. Arch Intern Med. 1992;152(2):334–340.
- , , , et al. A multicomponent intervention to prevent delirium in hospitalized older patients. N Engl J Med. 1999;340(9):669–676.
- , , , , . One‐year health care costs associated with delirium in the elderly population. Arch Intern Med. 2008;168(1):27–32.
- , , , et al. A low‐vision rehabilitation program for patients with mild cognitive deficits. JAMA Ophthalmol. 2013;131(7):912–919.
Vision impairment is an under‐recognized risk factor for adverse events among hospitalized patients.[1, 2, 3] Inpatients with poor vision are at increased risk for falls and delirium[1, 3] and have more difficulty taking medications.[4, 5] They may also be at risk for being unable to read critical health information, including consent forms and discharge instructions, or decreased quality of life such as simply ordering food from menus. However, vision is neither routinely tested nor documented for inpatients. Low‐cost ($8 and up) nonprescription reading glasses, known as readers may be a simple, high‐value intervention to improve inpatients' vision. We aimed to study initial feasibility and efficacy of screening and correcting inpatients' vision.
METHODS
From June 2012 through January 2014, research assistants (RAs) identified eligible (adults [18 years], English speaking) participants daily from electronic medical records as part of an ongoing study of general medicine inpatients measuring quality‐of‐care at the University of Chicago Medicine.[6] RAs tested visual acuity using Snellen pocket charts (participants wore corrective lenses if available). For eligible participants, readers were tested with sequential fitting (+2/+2.25/+2.75/+3.25) until vision was corrected (sufficient vision: at least 20/50 acuity in at least 1 eye).[7] Eligible participants included those with insufficient vision who were not already wearing corrective lenses and had no documented blindness or medically severe vision loss, for whom nonprescription readers would be unlikely to correct vision deficiencies such as cataracts or glaucoma. The study was approved by the University of Chicago Institutional Review Board (IRB #9967).
Of note, although readers are typically used in populations over 40 years of age, readers were fitted for all participants to assess their utility for any hospitalized adult patient. Upon completing the vision screening and readers interventions, participants received instruction on how to access vision care and how to obtain readers (if they corrected vision) after hospital discharge.
Descriptive statistics and tests of comparison, including t tests and [2] tests, were used when appropriate. All analyses were performed using Stata version 12 (StataCorp, College Station, TX).
RESULTS
Over 800 participants' vision was screened (n=853); the majority were female (56%, 480/853), African American (76%, 650/853), with a mean age of 53.4 years (standard deviation 18.7), consistent with our study site's demographics. Over one‐third (36%, 304/853) of participants had insufficient vision. Older (65 years) participants (56%, 136/244) were more likely to have insufficient vision than younger participants (28%, 168/608; P<0.001).
Participants with insufficient vision were wearing their own corrective lenses during the testing (150/304, 49%), did not use corrective lenses (53/304, 17%), or were without available corrective lenses (99/304, 33%) (Figure 1A).
One‐hundred sixteen of 304 participants approached for the readers intervention were eligible (112 reported medical eye disease, 65 were wearing lenses, and 11 refused or were discharged before intervention implementation).
Nonprescription readers corrected the majority of eligible participants' vision (82%, 95/116). Most participants' (81/116, 70%) vision was corrected using the 2 lowest calibration readers (+2/+2.25); another 14 participants' (12%) vision was corrected with higher‐strength lenses (+2.75/+3.25) (Figure 1B)
DISCUSSION
We found that over one‐third of the inpatients we examined have poor vision. Furthermore, among an easily identified subgroup of inpatients with poor vision, low‐cost readers successfully corrected most participants' vision. Although preventive health is not commonly considered an inpatient issue, hospitalists and other clinicians working in the inpatient setting can play an important role in identifying opportunities to provide high‐value care related to patients' vision.
Several important ethical, safety, and cost considerations related to these findings exist. Hospitalized patients commonly sign written informed consent; therefore, due diligence to ensure patients' ability to read and understand the forms is imperative. Further, inpatient delirium is common, particularly among older patients.[8] Existing or new onset delirium occurs in up to 24% to 35% of elderly inpatients.[8] Vision is an important risk factor for multifactorial inpatient delirium, and early vision correction has been shown to improve delirium rates, as part of a multicomponent intervention.[9] Hospital‐related patient costs per delirium episode have been estimated at $16,303 to $64,421.[10] The cost of a multicomponent intervention was $6341 per case of delirium prevented,[9] whereas only 1 potentially critical component, the cost of readers ($8+), would pale in comparison.[1] Vision screening takes approximately 2.25 minutes plus 2 to 6 minutes for the readers' assessment, with little training and high fidelity. Therefore, this easily implemented, potentially cost saving, intervention targeting inpatients with poor vision may improve patient safety and quality of life in the hospital and even after discharge.
Limitations of the study include considerations of generalizability, as participants were from a single, urban, academic medical center. Additionally, long‐term benefits of the readers intervention were not assessed in this study. Finally, RAs provided the assessments; therefore, further work is required to determine costs of efficient large‐scale clinical implementation through nurse‐led programs.
Despite these study limitations, the surprisingly high prevalence of poor vision among inpatients is a call to action for hospitalists. Future work should investigate the impact and cost of vision correction on hospital outcomes such as patient satisfaction, reduced rehospitalizations, and decreased delirium.[11]
Acknowledgements
The authors thank several individuals for their assistance with this project. Andrea Flores, MA, Senior Programmer, helped with programming and data support. Kristin Constantine, BA, Project Manager, helped with developing and implementing the database for this project. Edward Kim, BA, Project Manager, helped with management of the database and data collection. The authors also thank Ainoa Coltri and the Hospitalist Project research assistants for assistance with data collection, Frank Zadravecz, MPH, for assistance with the creation of figures, and Nicole Twu, MS, for assistance with the project. The authors thank other students who helped to collect data for this project, including Allison Louis, Victoria Moreira, and Esther Schoenfeld.
Disclosures: Dr. Press is supported by a career development award from the National Heart Lung and Blood Institute (NIH K23HL118151). A pilot award from The Center on the Demography and Economics of Aging (CoA, National Institute of Aging P30 AG012857) supported this project. Dr. Matthiesen and Ms. Ranadive received support from the Summer Research Program funded by the National Institutes on Aging Short‐Term Aging‐Related Research Program (T35AG029795). Dr. Matthiesen also received funding from the Calvin Fentress Fellowship Program. Dr. Hariprasad reports being a consultant or participating on a speaker's bureau for Alcon, Allergan, Regeneron, Genentech, Optos, OD‐OS, Bayer, Clearside Biomedical, and Ocular Therapeutix. Dr. Meltzer received funding from the National Institutes on Aging Short‐Term Aging‐Related Research Program (T35AG029795), and from the Agency for Healthcare Quality and Research through the Hospital Medicine and Economics Center for Education and Research in Therapeutics (U18 HS016967‐01), and from the National Institute of Aging through a Midcareer Career Development Award (K24 AG031326‐01), from the National Cancer Institute (KM1 CA156717), and from the National Center for Advancing Translational Science (2UL1TR000430‐06). Dr. Arora received funding from the National Institutes on Aging Short‐Term Aging‐Related Research Program (T35AG029795) and National Institutes on Aging (K23AG033763).
- , , , . Risk factors and risk assessment tools for falls in hospital in‐patients: a systematic review. Age Ageing. 2004;33(2):122–130.
- , , , , . More than meets the eye: relationship between low health literacy and poor vision in hospitalized patients. J Health Commun. 2013;18(suppl 1):197–204.
- , , , , , . Risk factors for delirium at discharge: development and validation of a predictive model. Arch Intern Med. 2007;167(13):1406–1413.
- , , , et al. Misuse of respiratory inhalers in hospitalized patients with asthma or COPD. J Gen Intern Med. 2011;26(6):635–642.
- , , . Can elderly people take their medicine? Patient Educ Couns. 2005;59(2):186–191.
- , , , et al. Effects of physician experience on costs and outcomes on an academic general medicine service: results of a trial of hospitalists. Ann Intern Med. 2002;137(11):866–874.
- . Prospective evaluation of visual acuity assessment: a comparison of Snellen versus ETDRS charts in clinical practice (An AOS Thesis). Trans Am Ophthalmol Soc. 2009;107:311–324.
- , , , et al. Delirium. The occurrence and persistence of symptoms among elderly hospitalized patients. Arch Intern Med. 1992;152(2):334–340.
- , , , et al. A multicomponent intervention to prevent delirium in hospitalized older patients. N Engl J Med. 1999;340(9):669–676.
- , , , , . One‐year health care costs associated with delirium in the elderly population. Arch Intern Med. 2008;168(1):27–32.
- , , , et al. A low‐vision rehabilitation program for patients with mild cognitive deficits. JAMA Ophthalmol. 2013;131(7):912–919.
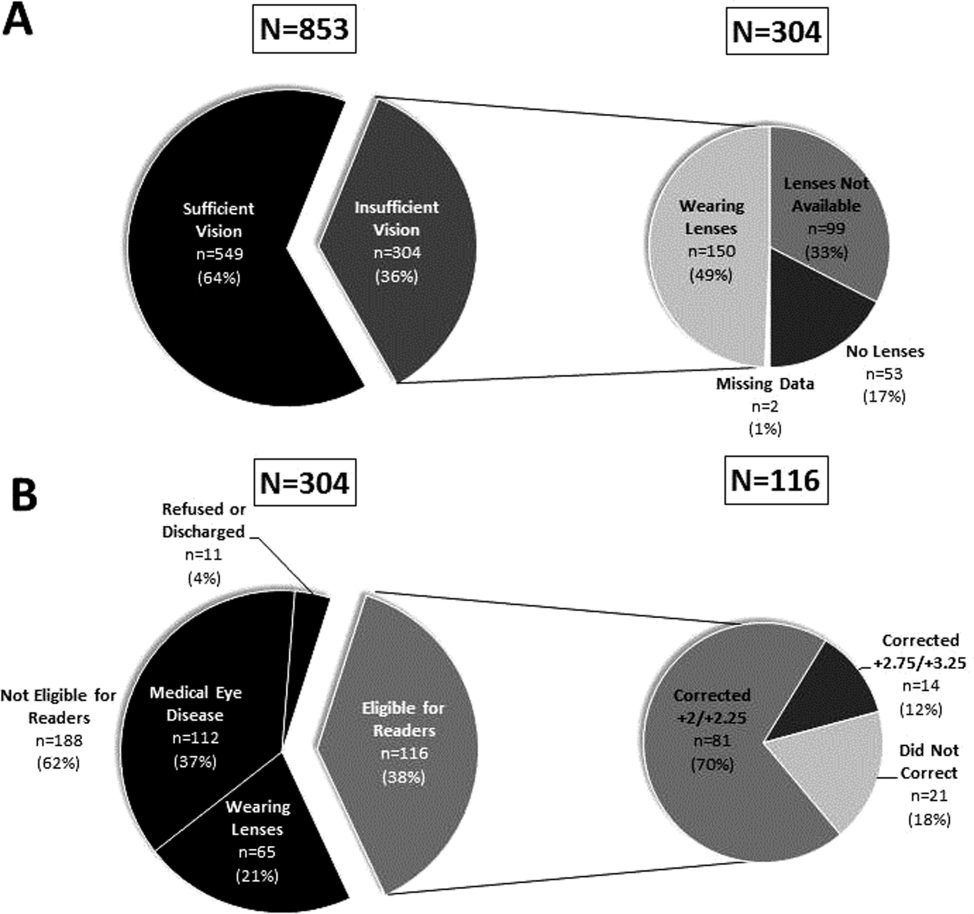
Time to Introduce Yourself to Patients
At the core of a good physician is mastery of critical communication skills. Good communication establishes rapport and can also heal patients. As communication is an essential ingredient of good physicianship, the recipe starts with a fundamental staplethe physician introduction. The physician introduction is step 2 of Kahn's etiquette‐based medicine checklist to promote good doctoring.[1] Although such rudimentary communication skills are cemented in kindergarten, sadly, more training is needed for doctors. In a recent Journal of Hospital Medicine study, interns failed to introduce themselves in 3 out of 5 inpatient encounters.[2]
Despite waning introductions, increasing importance is being placed on hospitalized patient's knowledge of their treating physician's name and role for patient safety. The Transitions of Care Consensus Policy Statement endorsed by 6 medical societies, including the Society of Hospital Medicine, recommend patients know who their treating physician is while caring for them at every step across the continuum, including hospitalization.[3] The Accreditation Council for Graduate Medical Education requires that patients be informed of who the supervising physician is and understand the roles of any trainees in their care.[4] Last, the death of young Lewis Blackman in South Carolina resulted in state legislation requiring clear identification of physicians and their roles for patients.[5] Given these recommendations, tools to remind physicians to introduce themselves and explain their role to patients are worth consideration. In this issue of the Journal of Hospital Medicine, the effectiveness of 2 interventions using physician photo tools is described.[6, 7]
Even though both studies advance our knowledge on the effectiveness of such interventions, nonrandom variable uptake by physicians represents a major common hurdle. Physician workload, competing priorities, and time pressures prevent physicians from distributing such tools. Consistent adopters of the cards likely already introduce themselves regularly. Interestingly, physicians likely withhold the cards from patients they perceive as unsatisfied, who ironically have the most to gain. System changes, such as increasing handoffs and transient coverage with resident duty hours, can also hamper tool effectiveness through the introduction of more physicians to remember, inherently decreasing the ability of patients to identify their treating physicians.[8]
Patient factors also affect the success of such interventions. Interestingly, patients' baseline ability to identify their physician ranged from 11% to 51% in these studies. Such differences can be readily attributed to previous disparities noted by age, race, gender, and education level in patient recall of their physician.[8] Future work should target interventions for these subgroups, while also accounting for the high prevalence of low health literacy, memory impairment, sleep loss, and poor vision among inpatients, all of which can hamper such interventions.[9, 10]
Although neither intervention improved overall patient satisfaction, patient satisfaction is influenced by a variety of factors unrelated to physician care, such as nursing or the environment. Given the inherent ceiling effect in patient satisfaction metrics, both studies were underpowered to show minor differences. It is also worth noting that complex social interventions depend on their context. Although some patients may enjoy receiving the cards, others may feel that it is not critical to their patient satisfaction. Using a realist evaluation would ask patients what they thought of the cards and why.[11] Like one of the authors, we noted that patients do like the cards, suggesting the problem is not the cards but the metrics of evaluation.[12]
In addition to robust evaluation metrics, future interventions should incorporate patient‐centered approaches to empower patients to ask their doctors about their name and role. With the request coming from patients, doctors are much more likely to comply. Using lessons from marketing and advertising, the hospital is full of artifacts, such as white boards, wristbands, remote controls, and monitors, that can be repurposed to advertise the doctor's name to the patient. Future advances can exploit new mobile technologies and repurpose old ones, such as the hospital television, to remind patients of their care team and other critical information. Regardless of what the future may bring, let's face itintroducing yourself properly to your patients is always good medicine.
- . Etiquette‐based medicine. N Engl J Med. 2008;358(19):1988–1989.
- , , , et al. Do internal medicine interns practice etiquette‐based communication? A critical look at the inpatient encounter. J Hosp Med. 2013;8(11):631–634.
- , , , et al. Transitions of Care Consensus policy statement: American College of Physicians, Society of General Internal Medicine, Society of Hospital Medicine, American Geriatrics Society, American College of Emergency Physicians, and Society for Academic Emergency Medicine. J Hosp Med. 2009;4(6):364–370.
- ACGME Common Program Requirements. Available at: http://www.acgme.org/acgmeweb/Portals/0/PFAssets/ProgramRequirements/CPRs2013.pdf. Accessed November 12, 2013.
- . The Informed Patient. Patients Get Power of Fast Response. Available at: http://online.wsj.com/news/articles/SB10001424052970204047504574384591232799668. Accessed November 12, 2013.
- , , . The impact of facecards on patients' knowledge, satisfaction, trust, and agreement with hospital physicians: a pilot study. J Hosp Med. 2014;9(3):137–141.
- , , . Effect of a face sheet tool on medical team provider identification and family satisfaction. J Hosp Med. 2014;9(3):186–188.
- , , , , , . Ability of hospitalized patients to identify their in‐hospital physicians. Arch Intern Med. 2009;169(2):199–201.
- , , , , . Noise and sleep among adult medical inpatients: far from a quiet night. Arch Intern Med. 2012;172(1):68–70.
- , , , , . More than meets the eye: relationship between low health literacy and poor vision in hospitalized patients. J Health Commun. 2013;18(suppl 1):197–204.
- , . Realist evaluation as a framework for the assessment of teaching about the improvement of care. J Nurs Educ. 2009;48(12):661–667.
- , , , et al. Improving inpatients' identification of their doctors: use of FACE cards. Jt Comm J Qual Patient Saf. 2009;35(12):613–619.
At the core of a good physician is mastery of critical communication skills. Good communication establishes rapport and can also heal patients. As communication is an essential ingredient of good physicianship, the recipe starts with a fundamental staplethe physician introduction. The physician introduction is step 2 of Kahn's etiquette‐based medicine checklist to promote good doctoring.[1] Although such rudimentary communication skills are cemented in kindergarten, sadly, more training is needed for doctors. In a recent Journal of Hospital Medicine study, interns failed to introduce themselves in 3 out of 5 inpatient encounters.[2]
Despite waning introductions, increasing importance is being placed on hospitalized patient's knowledge of their treating physician's name and role for patient safety. The Transitions of Care Consensus Policy Statement endorsed by 6 medical societies, including the Society of Hospital Medicine, recommend patients know who their treating physician is while caring for them at every step across the continuum, including hospitalization.[3] The Accreditation Council for Graduate Medical Education requires that patients be informed of who the supervising physician is and understand the roles of any trainees in their care.[4] Last, the death of young Lewis Blackman in South Carolina resulted in state legislation requiring clear identification of physicians and their roles for patients.[5] Given these recommendations, tools to remind physicians to introduce themselves and explain their role to patients are worth consideration. In this issue of the Journal of Hospital Medicine, the effectiveness of 2 interventions using physician photo tools is described.[6, 7]
Even though both studies advance our knowledge on the effectiveness of such interventions, nonrandom variable uptake by physicians represents a major common hurdle. Physician workload, competing priorities, and time pressures prevent physicians from distributing such tools. Consistent adopters of the cards likely already introduce themselves regularly. Interestingly, physicians likely withhold the cards from patients they perceive as unsatisfied, who ironically have the most to gain. System changes, such as increasing handoffs and transient coverage with resident duty hours, can also hamper tool effectiveness through the introduction of more physicians to remember, inherently decreasing the ability of patients to identify their treating physicians.[8]
Patient factors also affect the success of such interventions. Interestingly, patients' baseline ability to identify their physician ranged from 11% to 51% in these studies. Such differences can be readily attributed to previous disparities noted by age, race, gender, and education level in patient recall of their physician.[8] Future work should target interventions for these subgroups, while also accounting for the high prevalence of low health literacy, memory impairment, sleep loss, and poor vision among inpatients, all of which can hamper such interventions.[9, 10]
Although neither intervention improved overall patient satisfaction, patient satisfaction is influenced by a variety of factors unrelated to physician care, such as nursing or the environment. Given the inherent ceiling effect in patient satisfaction metrics, both studies were underpowered to show minor differences. It is also worth noting that complex social interventions depend on their context. Although some patients may enjoy receiving the cards, others may feel that it is not critical to their patient satisfaction. Using a realist evaluation would ask patients what they thought of the cards and why.[11] Like one of the authors, we noted that patients do like the cards, suggesting the problem is not the cards but the metrics of evaluation.[12]
In addition to robust evaluation metrics, future interventions should incorporate patient‐centered approaches to empower patients to ask their doctors about their name and role. With the request coming from patients, doctors are much more likely to comply. Using lessons from marketing and advertising, the hospital is full of artifacts, such as white boards, wristbands, remote controls, and monitors, that can be repurposed to advertise the doctor's name to the patient. Future advances can exploit new mobile technologies and repurpose old ones, such as the hospital television, to remind patients of their care team and other critical information. Regardless of what the future may bring, let's face itintroducing yourself properly to your patients is always good medicine.
- . Etiquette‐based medicine. N Engl J Med. 2008;358(19):1988–1989.
- , , , et al. Do internal medicine interns practice etiquette‐based communication? A critical look at the inpatient encounter. J Hosp Med. 2013;8(11):631–634.
- , , , et al. Transitions of Care Consensus policy statement: American College of Physicians, Society of General Internal Medicine, Society of Hospital Medicine, American Geriatrics Society, American College of Emergency Physicians, and Society for Academic Emergency Medicine. J Hosp Med. 2009;4(6):364–370.
- ACGME Common Program Requirements. Available at: http://www.acgme.org/acgmeweb/Portals/0/PFAssets/ProgramRequirements/CPRs2013.pdf. Accessed November 12, 2013.
- . The Informed Patient. Patients Get Power of Fast Response. Available at: http://online.wsj.com/news/articles/SB10001424052970204047504574384591232799668. Accessed November 12, 2013.
- , , . The impact of facecards on patients' knowledge, satisfaction, trust, and agreement with hospital physicians: a pilot study. J Hosp Med. 2014;9(3):137–141.
- , , . Effect of a face sheet tool on medical team provider identification and family satisfaction. J Hosp Med. 2014;9(3):186–188.
- , , , , , . Ability of hospitalized patients to identify their in‐hospital physicians. Arch Intern Med. 2009;169(2):199–201.
- , , , , . Noise and sleep among adult medical inpatients: far from a quiet night. Arch Intern Med. 2012;172(1):68–70.
- , , , , . More than meets the eye: relationship between low health literacy and poor vision in hospitalized patients. J Health Commun. 2013;18(suppl 1):197–204.
- , . Realist evaluation as a framework for the assessment of teaching about the improvement of care. J Nurs Educ. 2009;48(12):661–667.
- , , , et al. Improving inpatients' identification of their doctors: use of FACE cards. Jt Comm J Qual Patient Saf. 2009;35(12):613–619.
In the Literature
In This Edition
Literature at a Glance
A guide to this month’s studies
- ICU volume and outcomes
- Bicarbonate and contrast-induced nephropathy
- Rate of incidental findings in chest CT angiography
- Consequences of adverse-event reporting by physicians
- Hip fracture comanagement
- Niacin vs. ezetimibe in atherosclerosis
- Effect of hospital pharmacists on readmission rates
- Antibiotics in acute exacerbations of COPD
Higher Patient ICU Inflow Volumes Are Associated with Unplanned Readmissions to ICU
Clinical question: Do higher rates of unplanned ICU readmissions occur on days with high patient inflow volumes?
Background: Patients readmitted to ICUs have longer lengths of stay (LOS) and higher rates of in-hospital mortality. Previous studies suggest many ICU readmissions might be due to premature discharge, but there is little evidence evaluating the impact of patient inflow volumes on the incidence of ICU readmissions.
Study design: Retrospective, cohort study.
Setting: Large, urban, tertiary-care academic medical center in Baltimore.
Synopsis: A retrospective review of 3,233 discharges from a neurosciences critical-care unit revealed 95 unplanned readmissions to the ICU setting within 72 hours of discharge to lower level of care. The odds of one or more discharges becoming an unplanned readmission became significantly higher on days when ≥8 patients were admitted to the ICU (OR, 1.66; 95% CI, 1.03-2.68), and the odds of an unplanned readmission were almost five times higher on days when ≥10 patients were admitted, compared with days when ≤9 patients were admitted (OR, 4.99; 95% CI, 2.45-10.17).
After adjusting for patient complexity, patients discharged on days with ≥10 admissions had higher than twice the odds of becoming an unplanned readmission than patients discharged on days with ≤9 admissions (OR, 2.34; 95% CI, 1.27-4.34).
This study was limited to patients in a neurosciences critical-care unit at a single academic medical center. Further research is needed to better understand how high admission volumes lead to increased unplanned readmission rates.
Bottom line: Days with high patient inflow volumes to the ICU are associated with higher rates of unplanned readmissions to the ICU, and the rate of unplanned readmissions becomes significant once a daily threshold of eight admissions is reached.
Citation: Baker DR, Pronovost PJ, Morlock LL, Geocadin RG, Holzmueller CG. Patient flow variability and unplanned readmissions to an intensive care unit. Crit Care Med. 2009;37(11):2882-2887.
Effectiveness of Sodium Bicarbonate in Contrast-Induced Nephropathy Prevention
Clinical question: Is IV sodium bicarbonate effective for prevention of contrast-induced nephropathy (CIN) in high-risk patients?
Background: CIN is a leading cause of acute kidney injury in the hospital setting. Some studies have suggested IV sodium bicarbonate might reduce risk for CIN; other studies challenge this conclusion.
Study design: Systematic review.
Setting: Published and unpublished randomized, controlled trials performed worldwide.
Synopsis: The research examined in this study was composed of randomized, controlled trials that investigated CIN prevention and included IV sodium bicarbonate in one of the treatment groups. Nine published and 15 unpublished trials were selected for a total of 3,563 patients studied. The overall pooled relative risk of CIN in patients treated with IV sodium bicarbonate compared with normal saline was 0.62 (95% CI, 0.45-0.86), though the strength of this evidence was questioned.
Significant heterogeneity across studies was found (I2=49.1%; P=0.004), partially related to substantially greater treatment effect in published (RR 0.43, 95% CI, 0.25-0.75) versus unpublished (RR 0.78, 95% CI, 0.52-1.17) studies. Publication bias was confirmed statistically. Among the published studies, greater treatment effect favoring bicarbonate over saline tended to be reported in those published before 2008, had fewer patients (<200) and events (<15), had measured events within 48 hours, and were studies of lower quality.
No effects regarding the risk of heart failure, the need for dialysis, or mortality were found, though the studies were not specifically designed to investigate those clinical outcomes. Larger studies are needed to better assess these questions.
Bottom line: IV sodium bicarbonate for CIN prevention in high-risk patients could be less effective than previous reports have suggested.
Citation: Zoungas S, Ninomiya T, Huxley R, et al. Systematic review: sodium bicarbonate treatment regimens for the prevention of contrast-induced nephropathy. Ann Intern Med. 2009;151(9):631-638.
Incidental Findings More Frequent than PE in Chest CT Angiograms
Clinical question: What is the prevalence of incidental findings on chest-computed tomographic angiograms (CTAs) ordered by an ED to evaluate for pulmonary embolism (PE)?
Background: CTAs commonly are ordered by ED physicians to assess for PE. While CTAs might yield findings to support an alternate diagnosis to PE, incidental findings might be found that often require further radiographic or clinical followup. The workup of these incidental findings can be burdensome and low-yield.
Study design: Retrospective chart review.
Setting: Single, academic, tertiary-care hospital in North Carolina.
Synopsis: All patients who underwent CTA evaluation for PE in the ED over two enrollment periods were selected; radiographic findings were compiled and their medical records reviewed. Fifty-five of 589 CTAs (9%) were positive for PE. New incidental findings requiring radiographic or clinical followup were found in 141 cases (24%).
Overall, pulmonary nodules were most common, requiring followup in 73 (13%) cases. Adenopathy requiring followup was seen in 51 cases (9%), and new masses requiring followup were found in 12 cases (2%). Findings to support alternate diagnoses for shortness of breath, hypoxemia, or tachycardia were found in 195 patients (33%), most commonly pleural effusion (19%) and infiltrates (11%). Other incidental findings that required less-urgent clinical attention were common with 615 total findings, most frequently nonmalignant bone findings in 144 cases (24%), mild dependent atelectasis in 137 cases (23%), and emphysema in 69 cases (12%).
Bottom line: Incidental findings requiring followup were more than twice as common as PE (24% vs. 9%) in CTAs ordered to evaluate for PE in an ED.
Citation: Hall WB, Truitt SG, Scheunemann LP, et al. The prevalence of clinically relevant incidental findings on chest computed tomographic angiograms ordered to diagnose pulmonary embolism. Arch Intern Med. 2009;169(21):1961-1965.
Patients Don’t Penalize for Adverse-Outcome Disclosure
Clinical question: What patient or clinical characteristics affect the likelihood of physician reporting of an adverse outcome, and how does adverse-outcome disclosure affect patient perceptions of quality of care?
Background: Harmful adverse events (AE), injuries caused by medical management rather than by the underlying condition of the patient, are common in the U.S. Previous studies have focused on physician and provider attitudes about disclosure. Little is known about how characteristics of the AE affect disclosure, and how disclosure affects patients’ perceptions of quality of care.
Study design: Retrospective cohort study.
Setting: Acute-care hospitals in Massachusetts.
Synopsis: Of 4,143 eligible patients, 2,582 (62%) agreed to a telephone interview that asked about patient experiences with adverse events during their hospital stay. Respondents reporting an AE were asked about disclosure by medical staff, effects of adverse events on their hospital course, and the quality of their hospital care.
Of the 845 AEs reported by 608 patients, only 40% were disclosed, defined as “anyone from the hospital explaining why the negative effects occurred.” The majority of the AEs were related to newly prescribed medications (40%) and surgical procedures (34%). Researchers determined that 31% of the AEs were preventable and 75% were severe. In multivariate analysis, disclosure was less likely if the AE was preventable or if patients had long-term effects from the AE. Patients with an AE were more likely to rate the quality of their hospitalization higher if there had been disclosure.
Bottom line: Disclosure of adverse events by medical personnel is low (40%) in hospitalized patients, even though disclosure of adverse events increases patients’ ratings of quality of care.
Citation: López L, Weismann JS, Schneider EC, Weingart SN, Cohen AP, Epstein AM. Disclosure of hospital adverse events and its association with patients’ ratings of the quality of care. Arch Intern Med. 2009;169(20):1888-1894.
Comanagement of Hip-Fracture Patients by Geriatricians Decreases Time to Surgery, LOS, and Complications
Clinical question: Does comanagement of hip-fracture patients by geriatricians and orthopedic surgeons improve short-term outcomes?
Background: Hip fractures in older adults are associated with considerable morbidity and mortality. A model at a single center, where hip fracture patients are comanaged by geriatricians and orthopedic surgeons, demonstrated decreased LOS, readmission rates, and mortality when compared with national data. This study compares results to a usual-care site.
Study design: Retrospective cohort study.
Setting: Community-based teaching hospital and a tertiary-care hospital in Rochester, N.Y.
Synopsis: Researchers enrolled 314 patients with hip fractures. The 193 patients in the intervention group were comanaged by geriatricians and orthopedic surgeons. The 121 patients in the usual-care group were admitted under the care of orthopedic surgeons, and hospitalists were consulted when deemed necessary. Retrospective chart reviews were performed; complications were defined a priori.
When compared with usual care, patients in the intervention group had significantly shorter times to surgery (24.1 hours vs. 37.4 hours), shorter LOS (4.6 days vs. 8.3 days), fewer complications (30.6% vs. 46.3%), including fewer postoperative infections (2.3% vs. 19.8%), cardiac complications (1.0% vs. 7.4%), cases of thromboembolism (0.5% vs. 5.0%), episodes of bleeding (0% vs. 3.3%), and episodes of hypoxia (6.7% vs. 14.1%). There was no difference in inpatient mortality or 30-day readmission rates.
Further assessment comanagement by hospitalists and comanagement by geriatricians is needed.
Bottom line: Perioperative comanagement of hip-fracture patients by geriatricians and orthopedic surgeons significantly improves short-term outcomes.
Citation: Friedman SM, Mendelson DA, Bingham KW, Kates SL. Impact of a comanaged geriatric fracture center on short-term hip fracture outcomes. Arch Intern Med. 2009;169 (18):1712-1717.
Niacin Is Superior to Ezetimibe in Causing Significant Regression of Carotid Intima-Media Thickness when Combined with a Statin
Clinical question: Is ezetimibe superior to niacin for reducing carotid intima-media thickness (CIMT) in patients with coronary artery disease (CAD) already on statin monotherapy?
Background: Statin montherapy significantly reduces the risk of cardiovascular events, and further lowering of this risk can be achieved by reducing the LDL, using statin intensification, or adding ezetimibe, or by raising the HDL levels by adding niacin therapy. This comparative-effectiveness trial compared the efficacy of these two approaches.
Study design: Prospective, randomized, parallel-group, open-label study.
Setting: Tertiary-care military medical center, and private tertiary-care hospital in Washington, D.C.
Synopsis: Three hundred sixty-three patients with known CAD or CAD equivalent were enrolled, and all of the patients were maintained on statin therapy with LDL <100 and HDL <50. Patients were randomized to ezetimibe 10 mg/day or niacin, starting at 500 mg at bedtime and titrated to 2 g/day. Primary endpoint was a mean change in CIMT after 14 months. Secondary endpoints were change in lipid levels, composite of major cardiovascular events, drug discontinuation, and quality of life.
The trial was terminated early after 208 patients had completed the trial. Although ezetimibe showed greater reduction of LDL, niacin showed significantly greater reduction in the progression of CIMT. Patients receiving niacin experienced fewer cardiovascular events (1% vs. 5%) but had higher rates of withdrawal (15% vs. 9%) due to flushing.
Limitations of the study are small sample size, short follow-up period, and use of CIMT as a surrogate marker for clinical endpoint.
Bottom line: Niacin is superior to ezetimibe in reducing CIMT and raising HDL levels and might be more efficacious in reducing cardiovascular risk.
Citation: Taylor AJ, Villines TC, Stanek EJ, et al. Extended-release niacin or ezetimibe and carotid intima-media thickness. N Engl J Med. 2009;361(22):2113-2122.
Pharmacist-Facilitated Hospital Discharge Program Didn’t Reduce Post-Discharge Healthcare Resource Utilization
Clinical question: Does pharmacist-facilitated hospital discharge reduce hospital readmission rates?
Background: Medication discrepancies at the time of discharge often lead to confusion, medical errors, and readmission to the hospital. Patients who are at high risk of medication errors often are on multiple medications and experience adverse drug events upon discharge.
Study design: Prospective cohort study.
Setting: Tertiary-care, academic teaching hospital in Michigan.
Synopsis: One pharmacist alternated between the resident service and hospitalist service every month. The pharmacist monitored the patients being discharged for appropriateness and accuracy of medications. The pharmacist assessed medication therapy, reconciled medications, screened for adherence concerns, counseled and educated patients, and performed post-discharge telephone follow-up.
Primary outcomes were ED visits within 72 hours and readmission rates by day 14 and day 30.
The study found high numbers of medication discrepancies in the control (33.5%) and intervention (59.6%) groups, and these discrepancies were resolved prior to discharge; however, there was no significant impact on post-discharge ED visits, or 14- and 30-day readmission rates. Post-discharge telephone calls reduced 14-day readmission rates.
Bottom line: Pharmacist-facilitated hospital discharge did not significantly reduce post-discharge ED visits or readmissions.
Citation: Walker PC, Bernstein SJ, Jones JN, et al. Impact of a pharmacist-facilitated hospital discharge program. Arch Intern Med. 2009;169(21):2003-2010.
Questionable Antibiotic Benefit for Patients with Acute COPD Exacerbations
Clinical question: Does the addition of antibiotics to systemic corticosteroids provide additional benefits for patients hospitalized with acute exacerbations of chronic obstructive pulmonary disease (AECOPD)?
Background: The role of antibiotics in the treatment of AECOPD is unclear, particularly in addition to systemic corticosteroids. Many of the studies demonstrating the benefit of antibiotics were conducted several decades before systemic steroids were used routinely for the treatment of AECOPD.
Study design: Randomized, double-blinded, placebo-controlled study.
Setting: Two academic teaching hospitals in the Netherlands.
Synopsis: Two hundred sixty-five acute exacerbations of COPD were enrolled in the study, and patients were randomized to a seven-day course of 200 mg/day of doxycycline or placebo. All patients received systemic corticosteroids, nebulized bronchodilator therapy, and physiotherapy. The study found that doxycycline was equivalent to placebo for the primary endpoint of clinical success on day 30; however, doxycycline was superior to placebo for secondary outcomes of clinical success, clinical cure, symptomatic improvement, microbiological success, and reducing open label antibiotic use on day 10, but not on day 30.
Because the population studied had low levels of advanced antimicrobial resistance, the findings might not be generalizable. Results suggested a difference of treatment effect between subgroups based on C-reactive protein values, but further research is needed.
Bottom line: Patients treated with doxycycline for acute exacerbation of COPD had improved clinical outcomes at day 10, but the benefits were not significant at day 30. Data are still equivocal regarding benefits of antibiotics in patients with acute exacerbations of COPD.
Citation: Daniels JM, Snijders D, de Graaff CS, Vlaspolder F, Jansen HM, Boersma WG. Antibiotics in addition to systemic corticosteroids for acute exacerbations of chronic obstructive pulmonary disease. Am J Respir Crit Care Med. 2010;181(2):150-157. TH
PEDIATRIC HM LITERATURE
By Mark Shen, MD

Less Is More in the Management of Acute Gastroenteritis
Clinical question: What is the effect of a guideline-training program for pediatricians on the management of acute gastroenteritis (AGE)?
Background: Guidelines recommending oral rehydration, early refeeding, and limited interventions have been developed for AGE management, but uptake by pediatricians has been slow. While individual components of these guidelines have been shown to be effective in comparison to other resource-intensive interventions, outcomes of global guideline implementation have not been studied well.
Study design: Prospective, randomized, controlled trial.
Setting: One hundred forty-nine primary-care pediatricians in Italy.
Synopsis: Pediatricians from the Italian national healthcare system were randomized to AGE guideline training or no training (usual practice; control group). The physicians enrolled 1,309 children in the study. Parents completed daily forms documenting the interventions for, and outcomes of, each illness.
Management by the trained group of pediatricians was in full compliance with the guidelines 66% of the time, as opposed to 33% of the time in the untrained group.
Significant differences between the groups were noted for each basic tenet of the guidelines: oral rehydration use, restrictive diets, medication use, and microbiologic testing. Notably, by both intention-to-treat and per-protocol analysis, the mean duration of diarrhea was shorter in children managed by the trained group of pediatricians.
As underadherence to evidence-based guidelines remains commonplace, effective implementation will become a greater area of focus. Despite a modest effect in an ambulatory population, these investigators demonstrated a clear improvement in outcomes with a simple, two-hour training program. While not studied, it is likely that the cost of care was significantly lower in the guideline group, given the dramatic differences in medication use and testing.
Bottom line: Effective implementation of AGE guidelines will improve outcomes and reduce costs.
Citation: Albano F, Lo Vecchio A, Guarino A. The applicability and efficacy of guidelines for the management of acute gastroenteritis in outpatient children: a field-randomized trial on primary care pediatricians. J Pediatr. 2010;156(2):226-230.
In This Edition
Literature at a Glance
A guide to this month’s studies
- ICU volume and outcomes
- Bicarbonate and contrast-induced nephropathy
- Rate of incidental findings in chest CT angiography
- Consequences of adverse-event reporting by physicians
- Hip fracture comanagement
- Niacin vs. ezetimibe in atherosclerosis
- Effect of hospital pharmacists on readmission rates
- Antibiotics in acute exacerbations of COPD
Higher Patient ICU Inflow Volumes Are Associated with Unplanned Readmissions to ICU
Clinical question: Do higher rates of unplanned ICU readmissions occur on days with high patient inflow volumes?
Background: Patients readmitted to ICUs have longer lengths of stay (LOS) and higher rates of in-hospital mortality. Previous studies suggest many ICU readmissions might be due to premature discharge, but there is little evidence evaluating the impact of patient inflow volumes on the incidence of ICU readmissions.
Study design: Retrospective, cohort study.
Setting: Large, urban, tertiary-care academic medical center in Baltimore.
Synopsis: A retrospective review of 3,233 discharges from a neurosciences critical-care unit revealed 95 unplanned readmissions to the ICU setting within 72 hours of discharge to lower level of care. The odds of one or more discharges becoming an unplanned readmission became significantly higher on days when ≥8 patients were admitted to the ICU (OR, 1.66; 95% CI, 1.03-2.68), and the odds of an unplanned readmission were almost five times higher on days when ≥10 patients were admitted, compared with days when ≤9 patients were admitted (OR, 4.99; 95% CI, 2.45-10.17).
After adjusting for patient complexity, patients discharged on days with ≥10 admissions had higher than twice the odds of becoming an unplanned readmission than patients discharged on days with ≤9 admissions (OR, 2.34; 95% CI, 1.27-4.34).
This study was limited to patients in a neurosciences critical-care unit at a single academic medical center. Further research is needed to better understand how high admission volumes lead to increased unplanned readmission rates.
Bottom line: Days with high patient inflow volumes to the ICU are associated with higher rates of unplanned readmissions to the ICU, and the rate of unplanned readmissions becomes significant once a daily threshold of eight admissions is reached.
Citation: Baker DR, Pronovost PJ, Morlock LL, Geocadin RG, Holzmueller CG. Patient flow variability and unplanned readmissions to an intensive care unit. Crit Care Med. 2009;37(11):2882-2887.
Effectiveness of Sodium Bicarbonate in Contrast-Induced Nephropathy Prevention
Clinical question: Is IV sodium bicarbonate effective for prevention of contrast-induced nephropathy (CIN) in high-risk patients?
Background: CIN is a leading cause of acute kidney injury in the hospital setting. Some studies have suggested IV sodium bicarbonate might reduce risk for CIN; other studies challenge this conclusion.
Study design: Systematic review.
Setting: Published and unpublished randomized, controlled trials performed worldwide.
Synopsis: The research examined in this study was composed of randomized, controlled trials that investigated CIN prevention and included IV sodium bicarbonate in one of the treatment groups. Nine published and 15 unpublished trials were selected for a total of 3,563 patients studied. The overall pooled relative risk of CIN in patients treated with IV sodium bicarbonate compared with normal saline was 0.62 (95% CI, 0.45-0.86), though the strength of this evidence was questioned.
Significant heterogeneity across studies was found (I2=49.1%; P=0.004), partially related to substantially greater treatment effect in published (RR 0.43, 95% CI, 0.25-0.75) versus unpublished (RR 0.78, 95% CI, 0.52-1.17) studies. Publication bias was confirmed statistically. Among the published studies, greater treatment effect favoring bicarbonate over saline tended to be reported in those published before 2008, had fewer patients (<200) and events (<15), had measured events within 48 hours, and were studies of lower quality.
No effects regarding the risk of heart failure, the need for dialysis, or mortality were found, though the studies were not specifically designed to investigate those clinical outcomes. Larger studies are needed to better assess these questions.
Bottom line: IV sodium bicarbonate for CIN prevention in high-risk patients could be less effective than previous reports have suggested.
Citation: Zoungas S, Ninomiya T, Huxley R, et al. Systematic review: sodium bicarbonate treatment regimens for the prevention of contrast-induced nephropathy. Ann Intern Med. 2009;151(9):631-638.
Incidental Findings More Frequent than PE in Chest CT Angiograms
Clinical question: What is the prevalence of incidental findings on chest-computed tomographic angiograms (CTAs) ordered by an ED to evaluate for pulmonary embolism (PE)?
Background: CTAs commonly are ordered by ED physicians to assess for PE. While CTAs might yield findings to support an alternate diagnosis to PE, incidental findings might be found that often require further radiographic or clinical followup. The workup of these incidental findings can be burdensome and low-yield.
Study design: Retrospective chart review.
Setting: Single, academic, tertiary-care hospital in North Carolina.
Synopsis: All patients who underwent CTA evaluation for PE in the ED over two enrollment periods were selected; radiographic findings were compiled and their medical records reviewed. Fifty-five of 589 CTAs (9%) were positive for PE. New incidental findings requiring radiographic or clinical followup were found in 141 cases (24%).
Overall, pulmonary nodules were most common, requiring followup in 73 (13%) cases. Adenopathy requiring followup was seen in 51 cases (9%), and new masses requiring followup were found in 12 cases (2%). Findings to support alternate diagnoses for shortness of breath, hypoxemia, or tachycardia were found in 195 patients (33%), most commonly pleural effusion (19%) and infiltrates (11%). Other incidental findings that required less-urgent clinical attention were common with 615 total findings, most frequently nonmalignant bone findings in 144 cases (24%), mild dependent atelectasis in 137 cases (23%), and emphysema in 69 cases (12%).
Bottom line: Incidental findings requiring followup were more than twice as common as PE (24% vs. 9%) in CTAs ordered to evaluate for PE in an ED.
Citation: Hall WB, Truitt SG, Scheunemann LP, et al. The prevalence of clinically relevant incidental findings on chest computed tomographic angiograms ordered to diagnose pulmonary embolism. Arch Intern Med. 2009;169(21):1961-1965.
Patients Don’t Penalize for Adverse-Outcome Disclosure
Clinical question: What patient or clinical characteristics affect the likelihood of physician reporting of an adverse outcome, and how does adverse-outcome disclosure affect patient perceptions of quality of care?
Background: Harmful adverse events (AE), injuries caused by medical management rather than by the underlying condition of the patient, are common in the U.S. Previous studies have focused on physician and provider attitudes about disclosure. Little is known about how characteristics of the AE affect disclosure, and how disclosure affects patients’ perceptions of quality of care.
Study design: Retrospective cohort study.
Setting: Acute-care hospitals in Massachusetts.
Synopsis: Of 4,143 eligible patients, 2,582 (62%) agreed to a telephone interview that asked about patient experiences with adverse events during their hospital stay. Respondents reporting an AE were asked about disclosure by medical staff, effects of adverse events on their hospital course, and the quality of their hospital care.
Of the 845 AEs reported by 608 patients, only 40% were disclosed, defined as “anyone from the hospital explaining why the negative effects occurred.” The majority of the AEs were related to newly prescribed medications (40%) and surgical procedures (34%). Researchers determined that 31% of the AEs were preventable and 75% were severe. In multivariate analysis, disclosure was less likely if the AE was preventable or if patients had long-term effects from the AE. Patients with an AE were more likely to rate the quality of their hospitalization higher if there had been disclosure.
Bottom line: Disclosure of adverse events by medical personnel is low (40%) in hospitalized patients, even though disclosure of adverse events increases patients’ ratings of quality of care.
Citation: López L, Weismann JS, Schneider EC, Weingart SN, Cohen AP, Epstein AM. Disclosure of hospital adverse events and its association with patients’ ratings of the quality of care. Arch Intern Med. 2009;169(20):1888-1894.
Comanagement of Hip-Fracture Patients by Geriatricians Decreases Time to Surgery, LOS, and Complications
Clinical question: Does comanagement of hip-fracture patients by geriatricians and orthopedic surgeons improve short-term outcomes?
Background: Hip fractures in older adults are associated with considerable morbidity and mortality. A model at a single center, where hip fracture patients are comanaged by geriatricians and orthopedic surgeons, demonstrated decreased LOS, readmission rates, and mortality when compared with national data. This study compares results to a usual-care site.
Study design: Retrospective cohort study.
Setting: Community-based teaching hospital and a tertiary-care hospital in Rochester, N.Y.
Synopsis: Researchers enrolled 314 patients with hip fractures. The 193 patients in the intervention group were comanaged by geriatricians and orthopedic surgeons. The 121 patients in the usual-care group were admitted under the care of orthopedic surgeons, and hospitalists were consulted when deemed necessary. Retrospective chart reviews were performed; complications were defined a priori.
When compared with usual care, patients in the intervention group had significantly shorter times to surgery (24.1 hours vs. 37.4 hours), shorter LOS (4.6 days vs. 8.3 days), fewer complications (30.6% vs. 46.3%), including fewer postoperative infections (2.3% vs. 19.8%), cardiac complications (1.0% vs. 7.4%), cases of thromboembolism (0.5% vs. 5.0%), episodes of bleeding (0% vs. 3.3%), and episodes of hypoxia (6.7% vs. 14.1%). There was no difference in inpatient mortality or 30-day readmission rates.
Further assessment comanagement by hospitalists and comanagement by geriatricians is needed.
Bottom line: Perioperative comanagement of hip-fracture patients by geriatricians and orthopedic surgeons significantly improves short-term outcomes.
Citation: Friedman SM, Mendelson DA, Bingham KW, Kates SL. Impact of a comanaged geriatric fracture center on short-term hip fracture outcomes. Arch Intern Med. 2009;169 (18):1712-1717.
Niacin Is Superior to Ezetimibe in Causing Significant Regression of Carotid Intima-Media Thickness when Combined with a Statin
Clinical question: Is ezetimibe superior to niacin for reducing carotid intima-media thickness (CIMT) in patients with coronary artery disease (CAD) already on statin monotherapy?
Background: Statin montherapy significantly reduces the risk of cardiovascular events, and further lowering of this risk can be achieved by reducing the LDL, using statin intensification, or adding ezetimibe, or by raising the HDL levels by adding niacin therapy. This comparative-effectiveness trial compared the efficacy of these two approaches.
Study design: Prospective, randomized, parallel-group, open-label study.
Setting: Tertiary-care military medical center, and private tertiary-care hospital in Washington, D.C.
Synopsis: Three hundred sixty-three patients with known CAD or CAD equivalent were enrolled, and all of the patients were maintained on statin therapy with LDL <100 and HDL <50. Patients were randomized to ezetimibe 10 mg/day or niacin, starting at 500 mg at bedtime and titrated to 2 g/day. Primary endpoint was a mean change in CIMT after 14 months. Secondary endpoints were change in lipid levels, composite of major cardiovascular events, drug discontinuation, and quality of life.
The trial was terminated early after 208 patients had completed the trial. Although ezetimibe showed greater reduction of LDL, niacin showed significantly greater reduction in the progression of CIMT. Patients receiving niacin experienced fewer cardiovascular events (1% vs. 5%) but had higher rates of withdrawal (15% vs. 9%) due to flushing.
Limitations of the study are small sample size, short follow-up period, and use of CIMT as a surrogate marker for clinical endpoint.
Bottom line: Niacin is superior to ezetimibe in reducing CIMT and raising HDL levels and might be more efficacious in reducing cardiovascular risk.
Citation: Taylor AJ, Villines TC, Stanek EJ, et al. Extended-release niacin or ezetimibe and carotid intima-media thickness. N Engl J Med. 2009;361(22):2113-2122.
Pharmacist-Facilitated Hospital Discharge Program Didn’t Reduce Post-Discharge Healthcare Resource Utilization
Clinical question: Does pharmacist-facilitated hospital discharge reduce hospital readmission rates?
Background: Medication discrepancies at the time of discharge often lead to confusion, medical errors, and readmission to the hospital. Patients who are at high risk of medication errors often are on multiple medications and experience adverse drug events upon discharge.
Study design: Prospective cohort study.
Setting: Tertiary-care, academic teaching hospital in Michigan.
Synopsis: One pharmacist alternated between the resident service and hospitalist service every month. The pharmacist monitored the patients being discharged for appropriateness and accuracy of medications. The pharmacist assessed medication therapy, reconciled medications, screened for adherence concerns, counseled and educated patients, and performed post-discharge telephone follow-up.
Primary outcomes were ED visits within 72 hours and readmission rates by day 14 and day 30.
The study found high numbers of medication discrepancies in the control (33.5%) and intervention (59.6%) groups, and these discrepancies were resolved prior to discharge; however, there was no significant impact on post-discharge ED visits, or 14- and 30-day readmission rates. Post-discharge telephone calls reduced 14-day readmission rates.
Bottom line: Pharmacist-facilitated hospital discharge did not significantly reduce post-discharge ED visits or readmissions.
Citation: Walker PC, Bernstein SJ, Jones JN, et al. Impact of a pharmacist-facilitated hospital discharge program. Arch Intern Med. 2009;169(21):2003-2010.
Questionable Antibiotic Benefit for Patients with Acute COPD Exacerbations
Clinical question: Does the addition of antibiotics to systemic corticosteroids provide additional benefits for patients hospitalized with acute exacerbations of chronic obstructive pulmonary disease (AECOPD)?
Background: The role of antibiotics in the treatment of AECOPD is unclear, particularly in addition to systemic corticosteroids. Many of the studies demonstrating the benefit of antibiotics were conducted several decades before systemic steroids were used routinely for the treatment of AECOPD.
Study design: Randomized, double-blinded, placebo-controlled study.
Setting: Two academic teaching hospitals in the Netherlands.
Synopsis: Two hundred sixty-five acute exacerbations of COPD were enrolled in the study, and patients were randomized to a seven-day course of 200 mg/day of doxycycline or placebo. All patients received systemic corticosteroids, nebulized bronchodilator therapy, and physiotherapy. The study found that doxycycline was equivalent to placebo for the primary endpoint of clinical success on day 30; however, doxycycline was superior to placebo for secondary outcomes of clinical success, clinical cure, symptomatic improvement, microbiological success, and reducing open label antibiotic use on day 10, but not on day 30.
Because the population studied had low levels of advanced antimicrobial resistance, the findings might not be generalizable. Results suggested a difference of treatment effect between subgroups based on C-reactive protein values, but further research is needed.
Bottom line: Patients treated with doxycycline for acute exacerbation of COPD had improved clinical outcomes at day 10, but the benefits were not significant at day 30. Data are still equivocal regarding benefits of antibiotics in patients with acute exacerbations of COPD.
Citation: Daniels JM, Snijders D, de Graaff CS, Vlaspolder F, Jansen HM, Boersma WG. Antibiotics in addition to systemic corticosteroids for acute exacerbations of chronic obstructive pulmonary disease. Am J Respir Crit Care Med. 2010;181(2):150-157. TH
PEDIATRIC HM LITERATURE
By Mark Shen, MD
Less Is More in the Management of Acute Gastroenteritis
Clinical question: What is the effect of a guideline-training program for pediatricians on the management of acute gastroenteritis (AGE)?
Background: Guidelines recommending oral rehydration, early refeeding, and limited interventions have been developed for AGE management, but uptake by pediatricians has been slow. While individual components of these guidelines have been shown to be effective in comparison to other resource-intensive interventions, outcomes of global guideline implementation have not been studied well.
Study design: Prospective, randomized, controlled trial.
Setting: One hundred forty-nine primary-care pediatricians in Italy.
Synopsis: Pediatricians from the Italian national healthcare system were randomized to AGE guideline training or no training (usual practice; control group). The physicians enrolled 1,309 children in the study. Parents completed daily forms documenting the interventions for, and outcomes of, each illness.
Management by the trained group of pediatricians was in full compliance with the guidelines 66% of the time, as opposed to 33% of the time in the untrained group.
Significant differences between the groups were noted for each basic tenet of the guidelines: oral rehydration use, restrictive diets, medication use, and microbiologic testing. Notably, by both intention-to-treat and per-protocol analysis, the mean duration of diarrhea was shorter in children managed by the trained group of pediatricians.
As underadherence to evidence-based guidelines remains commonplace, effective implementation will become a greater area of focus. Despite a modest effect in an ambulatory population, these investigators demonstrated a clear improvement in outcomes with a simple, two-hour training program. While not studied, it is likely that the cost of care was significantly lower in the guideline group, given the dramatic differences in medication use and testing.
Bottom line: Effective implementation of AGE guidelines will improve outcomes and reduce costs.
Citation: Albano F, Lo Vecchio A, Guarino A. The applicability and efficacy of guidelines for the management of acute gastroenteritis in outpatient children: a field-randomized trial on primary care pediatricians. J Pediatr. 2010;156(2):226-230.