User login
Accuracy Comparisons between Manual and Automated Respiratory Rate for Detecting Clinical Deterioration in Ward Patients
Respiratory rate is the most accurate vital sign for predicting adverse outcomes in ward patients.1,2 Though other vital signs are typically collected by using machines, respiratory rate is collected manually by caregivers counting the breathing rate. However, studies have shown significant discrepancies between a patient’s respiratory rate documented in the medical record, which is often 18 or 20, and the value measured by counting the rate over a full minute.3 Thus, despite the high accuracy of respiratory rate, it is possible that these values do not represent true patient physiology. It is unknown whether a valid automated measurement of respiratory rate would be more predictive than a manually collected respiratory rate for identifying patients who develop deterioration. The aim of this study was to compare the distribution and predictive accuracy of manually and automatically recorded respiratory rates.
METHODS
In this prospective cohort study, adult patients admitted to one oncology ward at the University of Chicago from April 2015 to May 2016 were approached for consent (Institutional Review Board #14-0682). Enrolled patients were fit with a cableless, FDA-approved respiratory pod device (Philips IntelliVue clResp Pod; Philips Healthcare, Andover, MA) that automatically recorded respiratory rate and heart rate every 15 minutes while they remained on the ward. Pod data were paired with vital sign data documented in the electronic health record (EHR) by taking the automated value closest, but prior to, the manual value up to a maximum of 4 hours. Automated and manual respiratory rate were compared by using the area under the receiver operating characteristic curve (AUC) for whether an intensive care unit (ICU) transfer occurred within 24 hours of each paired observation without accounting for patient-level clustering.
RESULTS

DISCUSSION
In this prospective cohort study, we found that manual respiratory rates were different than those collected from an automated system and, yet, were significantly more accurate for predicting ICU transfer. These results suggest that the predictive accuracy of respiratory rates documented in the EHR is due to more than just physiology. Our findings have important implications for the risk stratification of ward patients.
Though previous literature has suggested that respiratory rate is the most accurate predictor of deterioration, this may not be true.1 Respiratory rates manually recorded by clinical staff may contain information beyond pure physiology, such as a proxy of clinician concern, which may inflate the predictive value. Nursing staff may record standard respiratory rate values for patients that appear to be well (eg, 18) but count actual rates for those patients they suspect have a more severe disease, which is one possible explanation for our findings. In addition, automated assessments are likely to be more sensitive to intermittent fluctuations in respiratory rate associated with patient movement or emotion. This might explain the improved accuracy at higher rates for manually recorded vital signs.
Although limited by its small sample size, our results have important implications for patient monitoring and early warning scores designed to identify high-risk ward patients given that both simple scores and statistically derived models include respiratory rates as a predictor.4 As hospitals move to use newer technologies to automate vital sign monitoring and decrease nursing workload, our findings suggest that accuracy for identifying high-risk patients may be lost. Additional methods for capturing subjective assessments from clinical providers may be necessary and could be incorporated into risk scores.5 For example, the 7-point subjective Patient Acuity Rating has been shown to augment the Modified Early Warning Score for predicting ICU transfer, rapid response activation, or cardiac arrest within 24 hours.6
Manually recorded respiratory rate may include information beyond pure physiology, which inflates its predictive value. This has important implications for the use of automated monitoring technology in hospitals and the integration of these measurements into early warning scores.
Acknowledgments
The authors thank Pamela McCall, BSN, OCN for her assistance with study implementation, Kevin Ig-Izevbekhai and Shivraj Grewal for assistance with data collection, UCM Clinical Engineering for technical support, and Timothy Holper, MS, Julie Johnson, MPH, RN, and Thomas Sutton for assistance with data abstraction.
Disclosure
Dr. Churpek is supported by a career development award from the National Heart, Lung, and Blood Institute (K08 HL121080) and has received honoraria from Chest for invited speaking engagements. Dr. Churpek and Dr. Edelson have a patent pending (ARCD. P0535US.P2) for risk stratification algorithms for hospitalized patients. In addition, Dr. Edelson has received research support from Philips Healthcare (Andover, MA), research support from the American Heart Association (Dallas, TX) and Laerdal Medical (Stavanger, Norway), and research support from EarlySense (Tel Aviv, Israel). She has ownership interest in Quant HC (Chicago, IL), which is developing products for risk stratification of hospitalized patients. This study was supported by a grant from Philips Healthcare in Andover, MA. The sponsor had no role in data collection, interpretation of results, or drafting of the manuscript.
1. Churpek MM, Yuen TC, Huber MT, Park SY, Hall JB, Edelson DP. Predicting cardiac arrest on the wards: a nested case-control study. Chest. 2012;141(5):1170-1176. PubMed
2. Fieselmann JF, Hendryx MS, Helms CM, Wakefield DS. Respiratory rate predicts cardiopulmonary arrest for internal medicine inpatients. J Gen Intern Med. 1993;8(7):354-360. PubMed
3. Semler MW, Stover DG, Copland AP, et al. Flash mob research: a single-day, multicenter, resident-directed study of respiratory rate. Chest. 2013;143(6):1740-1744. PubMed
4. Churpek MM, Yuen TC, Edelson DP. Risk stratification of hospitalized patients on the wards. Chest. 2013;143(6):1758-1765. PubMed
5. Edelson DP, Retzer E, Weidman EK, et al. Patient acuity rating: quantifying clinical judgment regarding inpatient stability. J Hosp Med. 2011;6(8):475-479. PubMed
6. Patel AR, Zadravecz FJ, Young RS, Williams MV, Churpek MM, Edelson DP. The value of clinical judgment in the detection of clinical deterioration. JAMA Intern Med. 2015;175(3):456-458. PubMed
Respiratory rate is the most accurate vital sign for predicting adverse outcomes in ward patients.1,2 Though other vital signs are typically collected by using machines, respiratory rate is collected manually by caregivers counting the breathing rate. However, studies have shown significant discrepancies between a patient’s respiratory rate documented in the medical record, which is often 18 or 20, and the value measured by counting the rate over a full minute.3 Thus, despite the high accuracy of respiratory rate, it is possible that these values do not represent true patient physiology. It is unknown whether a valid automated measurement of respiratory rate would be more predictive than a manually collected respiratory rate for identifying patients who develop deterioration. The aim of this study was to compare the distribution and predictive accuracy of manually and automatically recorded respiratory rates.
METHODS
In this prospective cohort study, adult patients admitted to one oncology ward at the University of Chicago from April 2015 to May 2016 were approached for consent (Institutional Review Board #14-0682). Enrolled patients were fit with a cableless, FDA-approved respiratory pod device (Philips IntelliVue clResp Pod; Philips Healthcare, Andover, MA) that automatically recorded respiratory rate and heart rate every 15 minutes while they remained on the ward. Pod data were paired with vital sign data documented in the electronic health record (EHR) by taking the automated value closest, but prior to, the manual value up to a maximum of 4 hours. Automated and manual respiratory rate were compared by using the area under the receiver operating characteristic curve (AUC) for whether an intensive care unit (ICU) transfer occurred within 24 hours of each paired observation without accounting for patient-level clustering.
RESULTS
DISCUSSION
In this prospective cohort study, we found that manual respiratory rates were different than those collected from an automated system and, yet, were significantly more accurate for predicting ICU transfer. These results suggest that the predictive accuracy of respiratory rates documented in the EHR is due to more than just physiology. Our findings have important implications for the risk stratification of ward patients.
Though previous literature has suggested that respiratory rate is the most accurate predictor of deterioration, this may not be true.1 Respiratory rates manually recorded by clinical staff may contain information beyond pure physiology, such as a proxy of clinician concern, which may inflate the predictive value. Nursing staff may record standard respiratory rate values for patients that appear to be well (eg, 18) but count actual rates for those patients they suspect have a more severe disease, which is one possible explanation for our findings. In addition, automated assessments are likely to be more sensitive to intermittent fluctuations in respiratory rate associated with patient movement or emotion. This might explain the improved accuracy at higher rates for manually recorded vital signs.
Although limited by its small sample size, our results have important implications for patient monitoring and early warning scores designed to identify high-risk ward patients given that both simple scores and statistically derived models include respiratory rates as a predictor.4 As hospitals move to use newer technologies to automate vital sign monitoring and decrease nursing workload, our findings suggest that accuracy for identifying high-risk patients may be lost. Additional methods for capturing subjective assessments from clinical providers may be necessary and could be incorporated into risk scores.5 For example, the 7-point subjective Patient Acuity Rating has been shown to augment the Modified Early Warning Score for predicting ICU transfer, rapid response activation, or cardiac arrest within 24 hours.6
Manually recorded respiratory rate may include information beyond pure physiology, which inflates its predictive value. This has important implications for the use of automated monitoring technology in hospitals and the integration of these measurements into early warning scores.
Acknowledgments
The authors thank Pamela McCall, BSN, OCN for her assistance with study implementation, Kevin Ig-Izevbekhai and Shivraj Grewal for assistance with data collection, UCM Clinical Engineering for technical support, and Timothy Holper, MS, Julie Johnson, MPH, RN, and Thomas Sutton for assistance with data abstraction.
Disclosure
Dr. Churpek is supported by a career development award from the National Heart, Lung, and Blood Institute (K08 HL121080) and has received honoraria from Chest for invited speaking engagements. Dr. Churpek and Dr. Edelson have a patent pending (ARCD. P0535US.P2) for risk stratification algorithms for hospitalized patients. In addition, Dr. Edelson has received research support from Philips Healthcare (Andover, MA), research support from the American Heart Association (Dallas, TX) and Laerdal Medical (Stavanger, Norway), and research support from EarlySense (Tel Aviv, Israel). She has ownership interest in Quant HC (Chicago, IL), which is developing products for risk stratification of hospitalized patients. This study was supported by a grant from Philips Healthcare in Andover, MA. The sponsor had no role in data collection, interpretation of results, or drafting of the manuscript.
1. Churpek MM, Yuen TC, Huber MT, Park SY, Hall JB, Edelson DP. Predicting cardiac arrest on the wards: a nested case-control study. Chest. 2012;141(5):1170-1176. PubMed
2. Fieselmann JF, Hendryx MS, Helms CM, Wakefield DS. Respiratory rate predicts cardiopulmonary arrest for internal medicine inpatients. J Gen Intern Med. 1993;8(7):354-360. PubMed
3. Semler MW, Stover DG, Copland AP, et al. Flash mob research: a single-day, multicenter, resident-directed study of respiratory rate. Chest. 2013;143(6):1740-1744. PubMed
4. Churpek MM, Yuen TC, Edelson DP. Risk stratification of hospitalized patients on the wards. Chest. 2013;143(6):1758-1765. PubMed
5. Edelson DP, Retzer E, Weidman EK, et al. Patient acuity rating: quantifying clinical judgment regarding inpatient stability. J Hosp Med. 2011;6(8):475-479. PubMed
6. Patel AR, Zadravecz FJ, Young RS, Williams MV, Churpek MM, Edelson DP. The value of clinical judgment in the detection of clinical deterioration. JAMA Intern Med. 2015;175(3):456-458. PubMed
© 2018 Society of Hospital Medicine
Association between opioid and benzodiazepine use and clinical deterioration in ward patients
Chronic opioid and benzodiazepine use is common and increasing.1-5 Outpatient use of these medications has been associated with hospital readmission and death,6-12 with concurrent use associated with particularly increased risk.13,14 Less is known about outcomes for hospitalized patients receiving these medications.
More than half of hospital inpatients in the United States receive opioids,15 many of which are new prescriptions rather than continuation of chronic therapy.16,17 Less is known about inpatient benzodiazepine administration, but the prevalence may exceed 10% among elderly populations.18 Hospitalized patients often have comorbidities or physiological disturbances that might increase their risk related to use of these medications. Opioids can cause central and obstructive sleep apneas,19-21 and benzodiazepines contribute to respiratory depression and airway relaxation.22 Benzodiazepines also impair psychomotor function and recall,23 which could mediate the recognized risk for delirium and falls in the hospital.24,25 These findings suggest pathways by which these medications might contribute to clinical deterioration.
Most studies in hospitalized patients have been limited to specific populations15,26-28 and have not explicitly controlled for severity of illness over time. It remains unclear whether associations identified within particular groups of patients hold true for the broader population of general ward inpatients. Therefore, we aimed to determine the independent association between opioid and benzodiazepine administration and clinical deterioration in ward patients.
MATERIALS AND METHODS
Setting and Study Population
We performed an observational cohort study at a 500-bed urban academic hospital. Data were obtained from all adults hospitalized on the wards between November 1, 2008, and January 21, 2016. The study protocol was approved by the University of Chicago Institutional Review Board (IRB#15-0195).
Data Collection
The study utilized de-identified data from the electronic health record (EHR; Epic Systems Corporation, Verona, Wisconsin) and administrative databases collected by the University of Chicago Clinical Research Data Warehouse. Patient age, sex, race, body mass index (BMI), and ward admission source (ie, emergency department (ED), transferred from the intensive care unit (ICU), or directly admitted to the wards) were collected. International Classification of Diseases, 9th Revision, Clinical Modification (ICD-9-CM) codes were used to identify Elixhauser Comorbidity Index categories.29,30 Because patients with similar diagnoses (eg, active cancer) are cohorted within particular areas in our hospital, we obtained the ward unit for all patients. Patients who underwent surgery were identified using the hospital’s admission-transfer-discharge database.
To determine severity of illness, routinely collected vital signs and laboratory values were utilized to calculate the electronic cardiac arrest risk triage (eCART) score, an accurate risk score we previously developed and validated for predicting adverse events among ward patients.31 If any vital sign or laboratory value was missing, the next available measurement was carried forward. If any value remained missing after this change, the median value for that location (ie, wards, ICU, or ED) was imputed.32,33 Additionally, patient-reported pain scores at the time of opioid administration were extracted from nursing flowsheets. If no pain score was present at the time of opioid administration, the patient’s previous score was carried forward.
We excluded patients with sickle-cell disease or seizure history and admissions with diagnoses of alcohol withdrawal from the analysis, because these diagnoses were expected to be associated with different medication administration practices compared to other inpatients. We also excluded patients with a tracheostomy because we expected their respiratory monitoring to differ from the other patients in our cohort. Finally, because ward deaths resulting from a comfort care scenario often involve opioids and/or benzodiazepines, ward segments involving comfort care deaths (defined as death without attempted resuscitation) were excluded from the analysis (Supplemental Figure 1). Patients with sickle-cell disease were identified using ICD-9 codes, and encounters during which a seizure may have occurred were identified using a combination of ICD-9 codes and receipt of anti-epileptic medication (Supplemental Table 1). Patients at risk for alcohol withdrawal were identified by the presence of any Clinical Institute Withdrawal Assessment for Alcohol score within nursing flowsheets, and patients with tracheostomies were identified using documentation of ventilator support within their first 12 hours on the wards. In addition to these exclusion criteria, patients with obstructive sleep apnea (OSA) were identified by the following ICD-9 codes: 278.03, 327.23, 780.51, 780.53, and 780.57.
Medications
Ward administrations of opioids and benzodiazepines—dose, route, and administration time—were collected from the EHR. We excluded all administrations in nonward locations such as the ED, ICU, operating room, or procedure suite. Additionally, because patients emergently intubated may receive sedative and analgesic medications to facilitate intubation, and because patients experiencing cardiac arrest are frequently intubated periresuscitation, we a priori excluded all administrations within 15 minutes of a ward cardiac arrest or an intubation.
For consistent comparisons, opioid doses were converted to oral morphine equivalents34 and adjusted by a factor of 15 to reflect the smallest routinely available oral morphine tablet in our hospital (Supplemental Table 2). Benzodiazepine doses were converted to oral lorazepam equivalents (Supplemental Table 2).34 Thus, the independent variables were oral morphine or lorazepam equivalents administered within each 6-hour window. We a priori presumed opioid doses greater than the 99th percentile (1200 mg) or benzodiazepine doses greater than 10 mg oral lorazepam equivalents within a 6-hour window to be erroneous entries, and replaced these outlier values with the median value for each medication category.
Outcomes
The primary outcome was the composite of ICU transfer or cardiac arrest (loss of pulse with attempted resuscitation) on the wards, with individual outcomes investigated secondarily. An ICU transfer (patient movement from a ward directly to the ICU) was identified using the hospital’s admission-transfer-discharge database. Cardiac arrests were identified using a prospectively validated quality improvement database.35
Because deaths on the wards resulted either from cardiac arrest or from a comfort care scenario, mortality was not studied as an outcome.
Statistical Analysis
Patient characteristics were compared using Student t tests, Wilcoxon rank sum tests, and chi-squared statistics, as appropriate. Unadjusted and adjusted models were created using discrete-time survival analysis,36-39 which involved dividing time into discrete 6-hour intervals and employing the predictor variables chronologically closest to the beginning of each time window to forecast whether the outcome occurred within each interval. Predictor variables in the adjusted model included patient characteristics (age, sex, BMI, and Elixhauser Agency for Healthcare Research and Quality-Web comorbidities30 [a priori excluding comorbidities recorded for fewer than 1000 admissions from the model]), ward unit, surgical status, prior ICU admission during the hospitalization, cumulative opioid or benzodiazepine dose during the previous 24 hours, and severity of illness (measured by eCART score). The adjusted model for opioids also included the patient’s pain score. Age, eCART score, and pain score were entered linearly while race, BMI (underweight, less than 18.5 kg/m2; normal, 18.5-24.9 kg/m2; overweight, 25.0-29.9 kg/m2; obese, 30-39.9 kg/m2; and severely obese, 40 mg/m2 or greater), and ward unit were modeled as categorical variables.
Since repeat hospitalization could confound the results of our study, we performed a sensitivity analysis including only 1 randomly selected hospital admission per patient. We also performed a sensitivity analysis including receipt of both opioids and benzodiazepines, and an interaction term within each ward segment, as well as an analysis in which zolpidem—the most commonly administered nonbenzodiazepine hypnotic medication in our hospital—was included along with both opioids and benzodiazepines. Finally, we performed a sensitivity analysis replacing missing pain scores with imputed values ranging from 0 to the median ward pain score.
We also performed subgroup analyses of adjusted models across age quartiles and for each BMI category, as well as for surgical status, OSA status, gender, time of medication administration, and route of administration (intravenous vs. oral). We also performed an analysis across pain score severity40 to determine whether these medications produce differential effects at various levels of pain.
All tests of significance used a 2-sided P value less than 0.05. Statistical analyses were completed using Stata version 14.1 (StataCorp, LLC, College Station, Texas).

RESULTS
Patient Characteristics
A total of 144,895 admissions, from 75,369 patients, had ward vital signs or laboratory values documented during the study period. Ward segments from 634 admissions were excluded due to comfort care status, which resulted in exclusion of 479 complete patient admissions. Additionally, 139 patients with tracheostomies were excluded. Furthermore, 2934 patient admissions with a sickle-cell diagnosis were excluded, of which 95% (n = 2791) received an opioid and 11% (n = 310) received a benzodiazepine. Another 14,029 admissions associated with seizures, 6134 admissions involving alcohol withdrawal, and 1332 with both were excluded, of which 66% (n = 14,174) received an opioid and 35% (n = 7504) received a benzodiazepine. After exclusions, 120,518 admissions were included in the final analysis, with 67% (n = 80,463) associated with at least 1 administration of an opioid and 21% (n = 25,279) associated with at least 1 benzodiazepine administration.
In total, there were 672,851 intervals when an opioid was administered during the study, with a median dose of 12 mg oral morphine equivalents (interquartile range, 8-30). Of these, 21,634 doses were replaced due to outlier status outside the 99th percentile. Patients receiving opioids were younger (median age 56 vs 61 years), less likely to be African American (48% vs 59%), more likely to have undergone surgery (18% vs 6%), and less likely to have most noncancer medical comorbidities than those who never received an opioid (all P < 0.001) (Table 1).
Additionally, there were a total of 98,286 6-hour intervals in which a benzodiazepine was administered in the study, with a median dose of 1 mg oral lorazepam (interquartile range, 0.5-1). A total of 790 doses of benzodiazepines (less than 1%) were replaced due to outlier status. Patients who received benzodiazepines were more likely to be male (49% vs. 41%), less likely to be African-American, less likely to be obese or morbidly obese (33% vs. 39%), and more likely to have medical comorbidities compared to patients who never received a benzodiazepine (all P < 0.001) (Table 1).
The eCART scores were similar between all patient groups. The frequency of missing variables differed by data type, with vital signs rarely missing (all less than 1.1% except AVPU [10%]), followed by hematology labs (8%-9%), electrolytes and renal function results (12%-15%), and hepatic function tests (40%-45%). In addition to imputed data for missing vital signs and laboratory values, our model omitted human immunodeficiency virus/acquired immune deficiency syndrome and peptic ulcer disease from the adjusted models on the basis of fewer than 1000 admissions with these diagnoses listed.

Patient Outcomes
The incidence of the composite outcome was higher in admissions with at least 1 opioid medication than those without an opioid (7% vs. 4%, P < 0.001), and in admissions with at least 1 dose of benzodiazepines compared to those without a benzodiazepine (11% vs. 4%, P < 0.001) (Table 2).
Within 6-hour segments, increasing doses of opioids were associated with an initial decrease in the frequency of the composite outcome followed by a dose-related increase in the frequency of the composite outcome with morphine equivalents greater than 45 mg. By contrast, the frequency of the composite outcome increased with additional benzodiazepine equivalents (Figure).
In the adjusted model, opioid administration was associated with increased risk for the composite outcome (Table 3) in a dose-dependent fashion, with each 15 mg oral morphine equivalent associated with a 1.9% increase in the odds of ICU transfer or cardiac arrest within the subsequent 6-hour time interval (odds ratio [OR], 1.019; 95% confidence interval [CI], 1.013-1.026; P < 0.001).

Similarly, benzodiazepine administration was also associated with increased adjusted risk for the composite outcome within 6 hours in a dose-dependent manner. Each 1 mg oral lorazepam equivalent was associated with a 29% increase in the odds of ward cardiac arrest or ICU transfer (OR, 1.29; 95% CI, 1.16-1.44; P < 0.001) (Table 3).
Sensitivity Analyses
A sensitivity analysis including 1 randomly selected hospitalization per patient involved 67,097 admissions and found results similar to the primary analysis, with each 15 mg oral morphine equivalent associated with a 1.9% increase in the odds of the composite outcome (OR, 1.019; 95% CI, 1.011-1.028; P < 0.001) and each 1 mg oral lorazepam equivalent associated with a 41% increase in the odds of the composite outcome (OR, 1.41; 95% CI, 1.21-1.65; P < 0.001). Inclusion of both opioids and benzodiazepines in the adjusted model again yielded results similar to the main analysis for both opioids (OR, 1.020; 95% CI, 1.013-1.026; P < 0.001) and benzodiazepines (OR, 1.35; 95% CI, 1.18-1.54; P < 0.001), without a significant interaction detected (P = 0.09). These results were unchanged with the addition of zolpidem to the model as an additional potential confounder, and zolpidem did not increase the risk of the study outcomes (P = 0.2).
A final sensitivity analysis for the opioid model involved replacing missing pain scores with imputed values ranging from 0 to the median ward score, which was 5. The results of these analyses did not differ from the primary model and were consistent regardless of imputation value (OR, 1.018; 95% CI, 1.012-1.023; P < 0.001).
Subgroup Analyses
Analyses of opioid administration by subgroup (sex, age quartiles, BMI categories, OSA diagnosis, surgical status, daytime/nighttime medication administration, IV/PO administration, and pain severity) yielded similar results to the overall analysis (Supplemental Figure 2). Subgroup analysis of patients receiving benzodiazepines revealed similarly increased adjusted odds of the composite outcome across strata of gender, BMI, surgical status, and medication administration time (Supplemental Figure 3). Notably, patients older than 70 years who received a benzodiazepine were at 64% increased odds of the composite outcome (OR, 1.64; 95% CI, 1.30-2.08), compared to 2% to 38% increased risk for patients under 70 years. Finally, IV doses of benzodiazepines were associated with 48% increased odds for deterioration (OR, 1.48; 95% CI, 1.18-1.84; P = 0.001), compared to a nonsignificant 14% increase in the odds for PO doses (OR, 1.14; 95% CI, 0.99-1.31; P = 0.066).
DISCUSSION
In a large, single-center, observational study of ward inpatients, we found that opioid use was associated with a small but significant increased risk for clinical deterioration on the wards, with every 15 mg oral morphine equivalent increasing the odds of ICU transfer or cardiac arrest in the next 6 hours by 1.9%. Benzodiazepines were associated with a much higher risk: each equivalent of 1 mg of oral lorazepam increased the odds of ICU transfer or cardiac arrest by almost 30%. These results have important implications for care at the bedside of hospitalized ward patients and suggest the need for closer monitoring after receipt of these medications, particularly benzodiazepines.
Previous work has described negative effects of opioid medications among select inpatient populations. In surgical patients, opioids have been associated with hospital readmission, increased length of stay, and hospital mortality.26,28 More recently, Herzig et al.15 found more adverse events in nonsurgical ward patients within the hospitals prescribing opioids the most frequently. These studies may have been limited by the populations studied and the inability to control for confounders such as severity of illness and pain score. Our study expands these findings to a more generalizable population and shows that even after adjustment for potential confounders, such as severity of illness, pain score, and medication dose, opioids are associated with increased short-term risk of clinical deterioration.
By contrast, few studies have characterized the risks associated with benzodiazepine use among ward inpatients. Recently, Overdyk et al.27 found that inpatient use of opioids and sedatives was associated with increased risk for cardiac arrest and hospital death. However, this study included ICU patients, which may confound the results, as ICU patients often receive high doses of opioids or benzodiazepines to facilitate mechanical ventilation or other invasive procedures, while also having a particularly high risk of adverse outcomes like cardiac arrest and inhospital death.
Several mechanisms may explain the magnitude of effect seen with regard to benzodiazepines. First, benzodiazepines may directly produce clinical deterioration by decreased respiratory drive, diminished airway tone, or hemodynamic decompensation. It is possible that the broad spectrum of cardiorespiratory side effects of benzodiazepines—and potential unpredictability of these effects—increases the difficulty of observation and management for patients receiving them. This difficulty may be compounded with intravenous administration of benzodiazepines, which was associated with a higher risk for deterioration than oral doses in our cohort. Alternatively, benzodiazepines may contribute to clinical decompensation by masking signs of deterioration such as encephalopathy or vital sign instability like tachycardia or tachypnea that may be mistaken as anxiety. Notably, while our hospital has a nursing-driven protocol for monitoring patients receiving opioids (in which pain is serially assessed, leading to additional bedside observation), we do not have protocols for ward patients receiving benzodiazepines. Finally, although we found that orders for opioids and benzodiazepines were more common in white patients than African American patients, this finding may be due to differences in the types or number of medical comorbidities experienced by these patients.
Our study has several strengths, including the large number of admissions we included. Additionally, we included a broad range of medical and surgical ward admissions, which should increase the generalizability of our results. Further, our rates of ICU transfer are in line with data reported from other groups,41,42 which again may add to the generalizability of our findings. We also addressed many potential confounders by including patient characteristics, individual ward units, and (for opioids) pain score in our model, and by controlling for severity of illness with the eCART score, an accurate predictor of ICU transfer and ward cardiac arrest within our population.32,37 Finally, our robust methodology allowed us to include acute and cumulative medication doses, as well as time, in the model. By performing a discrete-time survival analysis, we were able to evaluate receipt of opioids and benzodiazepines—as well as risk for clinical deterioration—longitudinally, lending strength to our results.
Limitations of our study include its single-center cohort, which may reduce generalizability to other populations. Additionally, because we could not validate the accuracy of—or adherence to—outpatient medication lists, we were unable to identify chronic opioid or benzodiazepine users by these lists. However, patients chronically taking opioids or benzodiazepines would likely receive doses each hospital day; by including 24-hour cumulative doses in our model, we attempted to adjust for some portion of their chronic use. Also, because evaluation of delirium was not objectively recorded in our dataset, we were unable to evaluate the relationship between receipt of these medications and development of delirium, which is an important outcome for hospitalized patients. Finally, neither the diagnoses for which these medications were prescribed, nor the reason for ICU transfer, were present in our dataset, which leaves open the possibility of unmeasured confounding.
CONCLUSION
After adjustment for important confounders including severity of illness, medication dose, and time, opioids were associated with a slight increase in clinical deterioration on the wards, while benzodiazepines were associated with a much larger risk for deterioration. This finding raises concern about the safety of benzodiazepine use among ward patients and suggests that increased monitoring of patients receiving these medications may be warranted.
Acknowledgment
The authors thank Nicole Twu for administrative support.
Disclosure
Drs. Churpek and Edelson have a patent pending (ARCD. P0535US.P2) for risk stratification algorithms for hospitalized patients. Dr. Churpek is supported by a career development award from the National Heart, Lung, and Blood Institute (K08 HL121080). Dr. Churpek has received honoraria from Chest for invited speaking engagements. In addition, Dr. Edelson has received research support from Philips Healthcare (Andover, Massachusetts), research support from the American Heart Association (Dallas, Texas) and Laerdal Medical (Stavanger, Norway), and research support from Early Sense (Tel Aviv, Israel). She has ownership interest in Quant HC (Chicago, Illinois), which is developing products for risk stratification of hospitalized patients. Dr. Mokhlesi is supported by National Institutes of Health grant R01HL119161. Dr. Mokhlesi has served as a consultant to Philips/Respironics and has received research support from Philips/Respironics. Preliminary versions of these data were presented as a poster presentation at the 2016 meeting of the American Thoracic Society, May 17, 2016; San Francisco, California.
1. Substance Abuse and Mental Health Services Administration. Results from the 2013 National Survey on Drug Use and Health: Summary of National Findings. Rockville, MD: Substance Abuse and Mental Health Services Administration; 2014.
2. Bachhuber MA, Hennessy S, Cunningham CO, Starrels JL. Increasing benzodiazepine prescriptions and overdose mortality in the United States, 1996–2013. Am J Public Health. 2016;106(4):686-688. PubMed
3. Parsells Kelly J, Cook SF, Kaufman DW, Anderson T, Rosenberg L, Mitchell AA. Prevalence and characteristics of opioid use in the US adult population. Pain. 2008;138(3):507-513. PubMed
4. Olfson M, King M, Schoenbaum M. Benzodiazepine use in the United States. JAMA Psychiatry. 2015;72(2):136-142. PubMed
5. Hwang CS, Kang EM, Kornegay CJ, Staffa JA, Jones CM, McAninch JK. Trends in the concomitant prescribing of opioids and benzodiazepines, 2002−2014. Am J Prev Med. 2016;51(2):151-160. PubMed
6. Bohnert AS, Valenstein M, Bair MJ, et al. Association between opioid prescribing patterns and opioid overdose-related deaths. JAMA. 2011;305(13):1315-1321. PubMed
7. Dart RC, Surratt HL, Cicero TJ, et al. Trends in opioid analgesic abuse and mortality in the United States. N Engl J Med. 2015;372(3):241-248. PubMed
8. Centers for Disease Control and Prevention (CDC). Vital signs: overdoses of prescription opioid pain relievers---United States, 1999--2008. MMWR Morb Mortal Wkly Rep. 2011;60(43):1487-1492. PubMed
9. Lan TY, Zeng YF, Tang GJ, et al. The use of hypnotics and mortality - a population-based retrospective cohort study. PLoS One. 2015;10(12):e0145271. PubMed
10. Mosher HJ, Jiang L, Vaughan Sarrazin MS, Cram P, Kaboli P, Vander Weg MW. Prevalence and characteristics of hospitalized adults on chronic opioid therapy: prior opioid use among veterans. J Hosp Med. 2014;9(2):82-87. PubMed
11. Palmaro A, Dupouy J, Lapeyre-Mestre M. Benzodiazepines and risk of death: results from two large cohort studies in France and UK. Eur Neuropsychopharmacol. 2015;25(10):1566-1577. PubMed
12. Parsaik AK, Mascarenhas SS, Khosh-Chashm D, et al. Mortality associated with anxiolytic and hypnotic drugs–a systematic review and meta-analysis. Aust N Z J Psychiatry. 2016;50(6):520-533. PubMed
13. Park TW, Saitz R, Ganoczy D, Ilgen MA, Bohnert AS. Benzodiazepine prescribing patterns and deaths from drug overdose among US veterans receiving opioid analgesics: case-cohort study. BMJ. 2015;350:h2698. PubMed
14. Jones CM, McAninch JK. Emergency department visits and overdose deaths from combined use of opioids and benzodiazepines. Am J Prev Med. 2015;49(4):493-501. PubMed
15. Herzig SJ, Rothberg MB, Cheung M, Ngo LH, Marcantonio ER. Opioid utilization and opioid-related adverse events in nonsurgical patients in US hospitals. J Hosp Med. 2014;9(2):73-81. PubMed
16. Jena AB, Goldman D, Karaca-Mandic P. Hospital prescribing of opioids to Medicare beneficiaries. JAMA Intern Med. 2016;176(7):990-997. PubMed
17. Calcaterra SL, Yamashita TE, Min SJ, Keniston A, Frank JW, Binswanger IA. Opioid prescribing at hospital discharge contributes to chronic opioid use. J Gen Intern Med. 2016;31(5):478-485. PubMed
18. Garrido MM, Prigerson HG, Penrod JD, Jones SC, Boockvar KS. Benzodiazepine and sedative-hypnotic use among older seriously ill veterans: choosing wisely? Clin Ther. 2014;36(11):1547-1554. PubMed
19. Doufas AG, Tian L, Padrez KA, et al. Experimental pain and opioid analgesia in volunteers at high risk for obstructive sleep apnea. PloS One. 2013;8(1):e54807. PubMed
20. Gislason T, Almqvist M, Boman G, Lindholm CE, Terenius L. Increased CSF opioid activity in sleep apnea syndrome. Regression after successful treatment. Chest. 1989;96(2):250-254. PubMed
21. Van Ryswyk E, Antic N. Opioids and sleep disordered breathing. Chest. 2016;150(4):934-944. PubMed
22. Koga Y, Sato S, Sodeyama N, et al. Comparison of the relaxant effects of diazepam, flunitrazepam and midazolam on airway smooth muscle. Br J Anaesth. 1992;69(1):65-69. PubMed
23. Pomara N, Lee SH, Bruno D, et al. Adverse performance effects of acute lorazepam administration in elderly long-term users: pharmacokinetic and clinical predictors. Prog Neuropsychopharmacol Biol Psychiatry. 2015;56:129-135. PubMed
24. Pandharipande P, Shintani A, Peterson J, et al. Lorazepam is an independent risk factor for transitioning to delirium in intensive care unit patients. Anesthesiology. 2006;104(1):21-26. PubMed
25. O’Neil CA, Krauss MJ, Bettale J, et al. Medications and patient characteristics associated with falling in the hospital. J Patient Saf. 2015 (epub ahead of print). PubMed
26. Kessler ER, Shah M, K Gruschkus S, Raju A. Cost and quality implications of opioid-based postsurgical pain control using administrative claims data from a large health system: opioid-related adverse events and their impact on clinical and economic outcomes. Pharmacotherapy. 2013;33(4):383-391. PubMed
27. Overdyk FJ, Dowling O, Marino J, et al. Association of opioids and sedatives with increased risk of in-hospital cardiopulmonary arrest from an administrative database. PLoS One. 2016;11(2):e0150214. PubMed
28. Minkowitz HS, Gruschkus SK, Shah M, Raju A. Adverse drug events among patients receiving postsurgical opioids in a large health system: risk factors and outcomes. Am J Health Syst Pharm. 2014;71(18):1556-1565. PubMed
29. Elixhauser A, Steiner C, Harris DR, Coffey RM. Comorbidity measures for use with administrative data. Med Care. 1998;36(1):8-27. PubMed
30. Quan H, Sundararajan V, Halfon P, et al. Coding algorithms for defining comorbidities in ICD-9-CM and ICD-10 administrative data. Med Care. 2005;43(11):1130-1139. PubMed
31. Churpek MM, Yuen TC, Winslow C, et al. Multicenter development and validation of a risk stratification tool for ward patients. Am J Respir Crit Care Med. 2014;190(6):649-655. PubMed
32. Knaus WA, Wagner DP, Draper EA, Z et al. The APACHE III prognostic system. Risk prediction of hospital mortality for critically ill hospitalized adults. Chest. 1991;100(6):1619-1636. PubMed
33. van den Boogaard M, Pickkers P, Slooter AJC, et al. Development and validation
of PRE-DELIRIC (PREdiction of DELIRium in ICu patients) delirium prediction
model for intensive care patients: observational multicentre study. BMJ.
2012;344:e420. PubMed
34. Clinical calculators. ClinCalc.com. http://www.clincalc.com. Accessed February
21, 2016.
35. Churpek MM, Yuen TC, Huber MT, Park SY, Hall JB, Edelson DP. Predicting
cardiac arrest on the wards: a nested case-control study. Chest. 2012;141(5):
1170-1176. PubMed
36. Churpek MM, Yuen TC, Park SY, Gibbons R, Edelson DP. Using electronic
health record data to develop and validate a prediction model for adverse outcomes
in the wards. Crit Care Med. 2014;42(4):841-848. PubMed
37. Efron B. Logistic regression, survival analysis, and the Kaplan-Meier curve. J Am
Stat Assoc. 1988;83(402):414-425.
38. Gibbons RD, Duan N, Meltzer D, et al; Institute of Medicine Committee. Waiting
for organ transplantation: results of an analysis by an Institute of Medicine Committee.
Biostatistics. 2003;4(2):207-222. PubMed
39. Singer JD, Willett JB. It’s about time: using discrete-time survival analysis to study
duration and the timing of events. J Educ Behav Stat. 1993;18(2):155-195.
40. World Health Organization. Cancer pain relief and palliative care. Report of a
WHO Expert Committee. World Health Organ Tech Rep Ser. 1990;804:1-75. PubMed
41. Bailey TC, Chen Y, Mao Y, et al. A trial of a real-time alert for clinical deterioration
in patients hospitalized on general medical wards. J Hosp Med. 2013;8(5):236-242. PubMed
42. Liu V, Kipnis P, Rizk NW, Escobar GJ. Adverse outcomes associated with delayed
intensive care unit transfers in an integrated healthcare system. J Hosp Med.
2012;7(3):224-230. PubMed
Chronic opioid and benzodiazepine use is common and increasing.1-5 Outpatient use of these medications has been associated with hospital readmission and death,6-12 with concurrent use associated with particularly increased risk.13,14 Less is known about outcomes for hospitalized patients receiving these medications.
More than half of hospital inpatients in the United States receive opioids,15 many of which are new prescriptions rather than continuation of chronic therapy.16,17 Less is known about inpatient benzodiazepine administration, but the prevalence may exceed 10% among elderly populations.18 Hospitalized patients often have comorbidities or physiological disturbances that might increase their risk related to use of these medications. Opioids can cause central and obstructive sleep apneas,19-21 and benzodiazepines contribute to respiratory depression and airway relaxation.22 Benzodiazepines also impair psychomotor function and recall,23 which could mediate the recognized risk for delirium and falls in the hospital.24,25 These findings suggest pathways by which these medications might contribute to clinical deterioration.
Most studies in hospitalized patients have been limited to specific populations15,26-28 and have not explicitly controlled for severity of illness over time. It remains unclear whether associations identified within particular groups of patients hold true for the broader population of general ward inpatients. Therefore, we aimed to determine the independent association between opioid and benzodiazepine administration and clinical deterioration in ward patients.
MATERIALS AND METHODS
Setting and Study Population
We performed an observational cohort study at a 500-bed urban academic hospital. Data were obtained from all adults hospitalized on the wards between November 1, 2008, and January 21, 2016. The study protocol was approved by the University of Chicago Institutional Review Board (IRB#15-0195).
Data Collection
The study utilized de-identified data from the electronic health record (EHR; Epic Systems Corporation, Verona, Wisconsin) and administrative databases collected by the University of Chicago Clinical Research Data Warehouse. Patient age, sex, race, body mass index (BMI), and ward admission source (ie, emergency department (ED), transferred from the intensive care unit (ICU), or directly admitted to the wards) were collected. International Classification of Diseases, 9th Revision, Clinical Modification (ICD-9-CM) codes were used to identify Elixhauser Comorbidity Index categories.29,30 Because patients with similar diagnoses (eg, active cancer) are cohorted within particular areas in our hospital, we obtained the ward unit for all patients. Patients who underwent surgery were identified using the hospital’s admission-transfer-discharge database.
To determine severity of illness, routinely collected vital signs and laboratory values were utilized to calculate the electronic cardiac arrest risk triage (eCART) score, an accurate risk score we previously developed and validated for predicting adverse events among ward patients.31 If any vital sign or laboratory value was missing, the next available measurement was carried forward. If any value remained missing after this change, the median value for that location (ie, wards, ICU, or ED) was imputed.32,33 Additionally, patient-reported pain scores at the time of opioid administration were extracted from nursing flowsheets. If no pain score was present at the time of opioid administration, the patient’s previous score was carried forward.
We excluded patients with sickle-cell disease or seizure history and admissions with diagnoses of alcohol withdrawal from the analysis, because these diagnoses were expected to be associated with different medication administration practices compared to other inpatients. We also excluded patients with a tracheostomy because we expected their respiratory monitoring to differ from the other patients in our cohort. Finally, because ward deaths resulting from a comfort care scenario often involve opioids and/or benzodiazepines, ward segments involving comfort care deaths (defined as death without attempted resuscitation) were excluded from the analysis (Supplemental Figure 1). Patients with sickle-cell disease were identified using ICD-9 codes, and encounters during which a seizure may have occurred were identified using a combination of ICD-9 codes and receipt of anti-epileptic medication (Supplemental Table 1). Patients at risk for alcohol withdrawal were identified by the presence of any Clinical Institute Withdrawal Assessment for Alcohol score within nursing flowsheets, and patients with tracheostomies were identified using documentation of ventilator support within their first 12 hours on the wards. In addition to these exclusion criteria, patients with obstructive sleep apnea (OSA) were identified by the following ICD-9 codes: 278.03, 327.23, 780.51, 780.53, and 780.57.
Medications
Ward administrations of opioids and benzodiazepines—dose, route, and administration time—were collected from the EHR. We excluded all administrations in nonward locations such as the ED, ICU, operating room, or procedure suite. Additionally, because patients emergently intubated may receive sedative and analgesic medications to facilitate intubation, and because patients experiencing cardiac arrest are frequently intubated periresuscitation, we a priori excluded all administrations within 15 minutes of a ward cardiac arrest or an intubation.
For consistent comparisons, opioid doses were converted to oral morphine equivalents34 and adjusted by a factor of 15 to reflect the smallest routinely available oral morphine tablet in our hospital (Supplemental Table 2). Benzodiazepine doses were converted to oral lorazepam equivalents (Supplemental Table 2).34 Thus, the independent variables were oral morphine or lorazepam equivalents administered within each 6-hour window. We a priori presumed opioid doses greater than the 99th percentile (1200 mg) or benzodiazepine doses greater than 10 mg oral lorazepam equivalents within a 6-hour window to be erroneous entries, and replaced these outlier values with the median value for each medication category.
Outcomes
The primary outcome was the composite of ICU transfer or cardiac arrest (loss of pulse with attempted resuscitation) on the wards, with individual outcomes investigated secondarily. An ICU transfer (patient movement from a ward directly to the ICU) was identified using the hospital’s admission-transfer-discharge database. Cardiac arrests were identified using a prospectively validated quality improvement database.35
Because deaths on the wards resulted either from cardiac arrest or from a comfort care scenario, mortality was not studied as an outcome.
Statistical Analysis
Patient characteristics were compared using Student t tests, Wilcoxon rank sum tests, and chi-squared statistics, as appropriate. Unadjusted and adjusted models were created using discrete-time survival analysis,36-39 which involved dividing time into discrete 6-hour intervals and employing the predictor variables chronologically closest to the beginning of each time window to forecast whether the outcome occurred within each interval. Predictor variables in the adjusted model included patient characteristics (age, sex, BMI, and Elixhauser Agency for Healthcare Research and Quality-Web comorbidities30 [a priori excluding comorbidities recorded for fewer than 1000 admissions from the model]), ward unit, surgical status, prior ICU admission during the hospitalization, cumulative opioid or benzodiazepine dose during the previous 24 hours, and severity of illness (measured by eCART score). The adjusted model for opioids also included the patient’s pain score. Age, eCART score, and pain score were entered linearly while race, BMI (underweight, less than 18.5 kg/m2; normal, 18.5-24.9 kg/m2; overweight, 25.0-29.9 kg/m2; obese, 30-39.9 kg/m2; and severely obese, 40 mg/m2 or greater), and ward unit were modeled as categorical variables.
Since repeat hospitalization could confound the results of our study, we performed a sensitivity analysis including only 1 randomly selected hospital admission per patient. We also performed a sensitivity analysis including receipt of both opioids and benzodiazepines, and an interaction term within each ward segment, as well as an analysis in which zolpidem—the most commonly administered nonbenzodiazepine hypnotic medication in our hospital—was included along with both opioids and benzodiazepines. Finally, we performed a sensitivity analysis replacing missing pain scores with imputed values ranging from 0 to the median ward pain score.
We also performed subgroup analyses of adjusted models across age quartiles and for each BMI category, as well as for surgical status, OSA status, gender, time of medication administration, and route of administration (intravenous vs. oral). We also performed an analysis across pain score severity40 to determine whether these medications produce differential effects at various levels of pain.
All tests of significance used a 2-sided P value less than 0.05. Statistical analyses were completed using Stata version 14.1 (StataCorp, LLC, College Station, Texas).
RESULTS
Patient Characteristics
A total of 144,895 admissions, from 75,369 patients, had ward vital signs or laboratory values documented during the study period. Ward segments from 634 admissions were excluded due to comfort care status, which resulted in exclusion of 479 complete patient admissions. Additionally, 139 patients with tracheostomies were excluded. Furthermore, 2934 patient admissions with a sickle-cell diagnosis were excluded, of which 95% (n = 2791) received an opioid and 11% (n = 310) received a benzodiazepine. Another 14,029 admissions associated with seizures, 6134 admissions involving alcohol withdrawal, and 1332 with both were excluded, of which 66% (n = 14,174) received an opioid and 35% (n = 7504) received a benzodiazepine. After exclusions, 120,518 admissions were included in the final analysis, with 67% (n = 80,463) associated with at least 1 administration of an opioid and 21% (n = 25,279) associated with at least 1 benzodiazepine administration.
In total, there were 672,851 intervals when an opioid was administered during the study, with a median dose of 12 mg oral morphine equivalents (interquartile range, 8-30). Of these, 21,634 doses were replaced due to outlier status outside the 99th percentile. Patients receiving opioids were younger (median age 56 vs 61 years), less likely to be African American (48% vs 59%), more likely to have undergone surgery (18% vs 6%), and less likely to have most noncancer medical comorbidities than those who never received an opioid (all P < 0.001) (Table 1).
Additionally, there were a total of 98,286 6-hour intervals in which a benzodiazepine was administered in the study, with a median dose of 1 mg oral lorazepam (interquartile range, 0.5-1). A total of 790 doses of benzodiazepines (less than 1%) were replaced due to outlier status. Patients who received benzodiazepines were more likely to be male (49% vs. 41%), less likely to be African-American, less likely to be obese or morbidly obese (33% vs. 39%), and more likely to have medical comorbidities compared to patients who never received a benzodiazepine (all P < 0.001) (Table 1).
The eCART scores were similar between all patient groups. The frequency of missing variables differed by data type, with vital signs rarely missing (all less than 1.1% except AVPU [10%]), followed by hematology labs (8%-9%), electrolytes and renal function results (12%-15%), and hepatic function tests (40%-45%). In addition to imputed data for missing vital signs and laboratory values, our model omitted human immunodeficiency virus/acquired immune deficiency syndrome and peptic ulcer disease from the adjusted models on the basis of fewer than 1000 admissions with these diagnoses listed.
Patient Outcomes
The incidence of the composite outcome was higher in admissions with at least 1 opioid medication than those without an opioid (7% vs. 4%, P < 0.001), and in admissions with at least 1 dose of benzodiazepines compared to those without a benzodiazepine (11% vs. 4%, P < 0.001) (Table 2).
Within 6-hour segments, increasing doses of opioids were associated with an initial decrease in the frequency of the composite outcome followed by a dose-related increase in the frequency of the composite outcome with morphine equivalents greater than 45 mg. By contrast, the frequency of the composite outcome increased with additional benzodiazepine equivalents (Figure).
In the adjusted model, opioid administration was associated with increased risk for the composite outcome (Table 3) in a dose-dependent fashion, with each 15 mg oral morphine equivalent associated with a 1.9% increase in the odds of ICU transfer or cardiac arrest within the subsequent 6-hour time interval (odds ratio [OR], 1.019; 95% confidence interval [CI], 1.013-1.026; P < 0.001).
Similarly, benzodiazepine administration was also associated with increased adjusted risk for the composite outcome within 6 hours in a dose-dependent manner. Each 1 mg oral lorazepam equivalent was associated with a 29% increase in the odds of ward cardiac arrest or ICU transfer (OR, 1.29; 95% CI, 1.16-1.44; P < 0.001) (Table 3).
Sensitivity Analyses
A sensitivity analysis including 1 randomly selected hospitalization per patient involved 67,097 admissions and found results similar to the primary analysis, with each 15 mg oral morphine equivalent associated with a 1.9% increase in the odds of the composite outcome (OR, 1.019; 95% CI, 1.011-1.028; P < 0.001) and each 1 mg oral lorazepam equivalent associated with a 41% increase in the odds of the composite outcome (OR, 1.41; 95% CI, 1.21-1.65; P < 0.001). Inclusion of both opioids and benzodiazepines in the adjusted model again yielded results similar to the main analysis for both opioids (OR, 1.020; 95% CI, 1.013-1.026; P < 0.001) and benzodiazepines (OR, 1.35; 95% CI, 1.18-1.54; P < 0.001), without a significant interaction detected (P = 0.09). These results were unchanged with the addition of zolpidem to the model as an additional potential confounder, and zolpidem did not increase the risk of the study outcomes (P = 0.2).
A final sensitivity analysis for the opioid model involved replacing missing pain scores with imputed values ranging from 0 to the median ward score, which was 5. The results of these analyses did not differ from the primary model and were consistent regardless of imputation value (OR, 1.018; 95% CI, 1.012-1.023; P < 0.001).
Subgroup Analyses
Analyses of opioid administration by subgroup (sex, age quartiles, BMI categories, OSA diagnosis, surgical status, daytime/nighttime medication administration, IV/PO administration, and pain severity) yielded similar results to the overall analysis (Supplemental Figure 2). Subgroup analysis of patients receiving benzodiazepines revealed similarly increased adjusted odds of the composite outcome across strata of gender, BMI, surgical status, and medication administration time (Supplemental Figure 3). Notably, patients older than 70 years who received a benzodiazepine were at 64% increased odds of the composite outcome (OR, 1.64; 95% CI, 1.30-2.08), compared to 2% to 38% increased risk for patients under 70 years. Finally, IV doses of benzodiazepines were associated with 48% increased odds for deterioration (OR, 1.48; 95% CI, 1.18-1.84; P = 0.001), compared to a nonsignificant 14% increase in the odds for PO doses (OR, 1.14; 95% CI, 0.99-1.31; P = 0.066).
DISCUSSION
In a large, single-center, observational study of ward inpatients, we found that opioid use was associated with a small but significant increased risk for clinical deterioration on the wards, with every 15 mg oral morphine equivalent increasing the odds of ICU transfer or cardiac arrest in the next 6 hours by 1.9%. Benzodiazepines were associated with a much higher risk: each equivalent of 1 mg of oral lorazepam increased the odds of ICU transfer or cardiac arrest by almost 30%. These results have important implications for care at the bedside of hospitalized ward patients and suggest the need for closer monitoring after receipt of these medications, particularly benzodiazepines.
Previous work has described negative effects of opioid medications among select inpatient populations. In surgical patients, opioids have been associated with hospital readmission, increased length of stay, and hospital mortality.26,28 More recently, Herzig et al.15 found more adverse events in nonsurgical ward patients within the hospitals prescribing opioids the most frequently. These studies may have been limited by the populations studied and the inability to control for confounders such as severity of illness and pain score. Our study expands these findings to a more generalizable population and shows that even after adjustment for potential confounders, such as severity of illness, pain score, and medication dose, opioids are associated with increased short-term risk of clinical deterioration.
By contrast, few studies have characterized the risks associated with benzodiazepine use among ward inpatients. Recently, Overdyk et al.27 found that inpatient use of opioids and sedatives was associated with increased risk for cardiac arrest and hospital death. However, this study included ICU patients, which may confound the results, as ICU patients often receive high doses of opioids or benzodiazepines to facilitate mechanical ventilation or other invasive procedures, while also having a particularly high risk of adverse outcomes like cardiac arrest and inhospital death.
Several mechanisms may explain the magnitude of effect seen with regard to benzodiazepines. First, benzodiazepines may directly produce clinical deterioration by decreased respiratory drive, diminished airway tone, or hemodynamic decompensation. It is possible that the broad spectrum of cardiorespiratory side effects of benzodiazepines—and potential unpredictability of these effects—increases the difficulty of observation and management for patients receiving them. This difficulty may be compounded with intravenous administration of benzodiazepines, which was associated with a higher risk for deterioration than oral doses in our cohort. Alternatively, benzodiazepines may contribute to clinical decompensation by masking signs of deterioration such as encephalopathy or vital sign instability like tachycardia or tachypnea that may be mistaken as anxiety. Notably, while our hospital has a nursing-driven protocol for monitoring patients receiving opioids (in which pain is serially assessed, leading to additional bedside observation), we do not have protocols for ward patients receiving benzodiazepines. Finally, although we found that orders for opioids and benzodiazepines were more common in white patients than African American patients, this finding may be due to differences in the types or number of medical comorbidities experienced by these patients.
Our study has several strengths, including the large number of admissions we included. Additionally, we included a broad range of medical and surgical ward admissions, which should increase the generalizability of our results. Further, our rates of ICU transfer are in line with data reported from other groups,41,42 which again may add to the generalizability of our findings. We also addressed many potential confounders by including patient characteristics, individual ward units, and (for opioids) pain score in our model, and by controlling for severity of illness with the eCART score, an accurate predictor of ICU transfer and ward cardiac arrest within our population.32,37 Finally, our robust methodology allowed us to include acute and cumulative medication doses, as well as time, in the model. By performing a discrete-time survival analysis, we were able to evaluate receipt of opioids and benzodiazepines—as well as risk for clinical deterioration—longitudinally, lending strength to our results.
Limitations of our study include its single-center cohort, which may reduce generalizability to other populations. Additionally, because we could not validate the accuracy of—or adherence to—outpatient medication lists, we were unable to identify chronic opioid or benzodiazepine users by these lists. However, patients chronically taking opioids or benzodiazepines would likely receive doses each hospital day; by including 24-hour cumulative doses in our model, we attempted to adjust for some portion of their chronic use. Also, because evaluation of delirium was not objectively recorded in our dataset, we were unable to evaluate the relationship between receipt of these medications and development of delirium, which is an important outcome for hospitalized patients. Finally, neither the diagnoses for which these medications were prescribed, nor the reason for ICU transfer, were present in our dataset, which leaves open the possibility of unmeasured confounding.
CONCLUSION
After adjustment for important confounders including severity of illness, medication dose, and time, opioids were associated with a slight increase in clinical deterioration on the wards, while benzodiazepines were associated with a much larger risk for deterioration. This finding raises concern about the safety of benzodiazepine use among ward patients and suggests that increased monitoring of patients receiving these medications may be warranted.
Acknowledgment
The authors thank Nicole Twu for administrative support.
Disclosure
Drs. Churpek and Edelson have a patent pending (ARCD. P0535US.P2) for risk stratification algorithms for hospitalized patients. Dr. Churpek is supported by a career development award from the National Heart, Lung, and Blood Institute (K08 HL121080). Dr. Churpek has received honoraria from Chest for invited speaking engagements. In addition, Dr. Edelson has received research support from Philips Healthcare (Andover, Massachusetts), research support from the American Heart Association (Dallas, Texas) and Laerdal Medical (Stavanger, Norway), and research support from Early Sense (Tel Aviv, Israel). She has ownership interest in Quant HC (Chicago, Illinois), which is developing products for risk stratification of hospitalized patients. Dr. Mokhlesi is supported by National Institutes of Health grant R01HL119161. Dr. Mokhlesi has served as a consultant to Philips/Respironics and has received research support from Philips/Respironics. Preliminary versions of these data were presented as a poster presentation at the 2016 meeting of the American Thoracic Society, May 17, 2016; San Francisco, California.
1. Substance Abuse and Mental Health Services Administration. Results from the 2013 National Survey on Drug Use and Health: Summary of National Findings. Rockville, MD: Substance Abuse and Mental Health Services Administration; 2014.
2. Bachhuber MA, Hennessy S, Cunningham CO, Starrels JL. Increasing benzodiazepine prescriptions and overdose mortality in the United States, 1996–2013. Am J Public Health. 2016;106(4):686-688. PubMed
3. Parsells Kelly J, Cook SF, Kaufman DW, Anderson T, Rosenberg L, Mitchell AA. Prevalence and characteristics of opioid use in the US adult population. Pain. 2008;138(3):507-513. PubMed
4. Olfson M, King M, Schoenbaum M. Benzodiazepine use in the United States. JAMA Psychiatry. 2015;72(2):136-142. PubMed
5. Hwang CS, Kang EM, Kornegay CJ, Staffa JA, Jones CM, McAninch JK. Trends in the concomitant prescribing of opioids and benzodiazepines, 2002−2014. Am J Prev Med. 2016;51(2):151-160. PubMed
6. Bohnert AS, Valenstein M, Bair MJ, et al. Association between opioid prescribing patterns and opioid overdose-related deaths. JAMA. 2011;305(13):1315-1321. PubMed
7. Dart RC, Surratt HL, Cicero TJ, et al. Trends in opioid analgesic abuse and mortality in the United States. N Engl J Med. 2015;372(3):241-248. PubMed
8. Centers for Disease Control and Prevention (CDC). Vital signs: overdoses of prescription opioid pain relievers---United States, 1999--2008. MMWR Morb Mortal Wkly Rep. 2011;60(43):1487-1492. PubMed
9. Lan TY, Zeng YF, Tang GJ, et al. The use of hypnotics and mortality - a population-based retrospective cohort study. PLoS One. 2015;10(12):e0145271. PubMed
10. Mosher HJ, Jiang L, Vaughan Sarrazin MS, Cram P, Kaboli P, Vander Weg MW. Prevalence and characteristics of hospitalized adults on chronic opioid therapy: prior opioid use among veterans. J Hosp Med. 2014;9(2):82-87. PubMed
11. Palmaro A, Dupouy J, Lapeyre-Mestre M. Benzodiazepines and risk of death: results from two large cohort studies in France and UK. Eur Neuropsychopharmacol. 2015;25(10):1566-1577. PubMed
12. Parsaik AK, Mascarenhas SS, Khosh-Chashm D, et al. Mortality associated with anxiolytic and hypnotic drugs–a systematic review and meta-analysis. Aust N Z J Psychiatry. 2016;50(6):520-533. PubMed
13. Park TW, Saitz R, Ganoczy D, Ilgen MA, Bohnert AS. Benzodiazepine prescribing patterns and deaths from drug overdose among US veterans receiving opioid analgesics: case-cohort study. BMJ. 2015;350:h2698. PubMed
14. Jones CM, McAninch JK. Emergency department visits and overdose deaths from combined use of opioids and benzodiazepines. Am J Prev Med. 2015;49(4):493-501. PubMed
15. Herzig SJ, Rothberg MB, Cheung M, Ngo LH, Marcantonio ER. Opioid utilization and opioid-related adverse events in nonsurgical patients in US hospitals. J Hosp Med. 2014;9(2):73-81. PubMed
16. Jena AB, Goldman D, Karaca-Mandic P. Hospital prescribing of opioids to Medicare beneficiaries. JAMA Intern Med. 2016;176(7):990-997. PubMed
17. Calcaterra SL, Yamashita TE, Min SJ, Keniston A, Frank JW, Binswanger IA. Opioid prescribing at hospital discharge contributes to chronic opioid use. J Gen Intern Med. 2016;31(5):478-485. PubMed
18. Garrido MM, Prigerson HG, Penrod JD, Jones SC, Boockvar KS. Benzodiazepine and sedative-hypnotic use among older seriously ill veterans: choosing wisely? Clin Ther. 2014;36(11):1547-1554. PubMed
19. Doufas AG, Tian L, Padrez KA, et al. Experimental pain and opioid analgesia in volunteers at high risk for obstructive sleep apnea. PloS One. 2013;8(1):e54807. PubMed
20. Gislason T, Almqvist M, Boman G, Lindholm CE, Terenius L. Increased CSF opioid activity in sleep apnea syndrome. Regression after successful treatment. Chest. 1989;96(2):250-254. PubMed
21. Van Ryswyk E, Antic N. Opioids and sleep disordered breathing. Chest. 2016;150(4):934-944. PubMed
22. Koga Y, Sato S, Sodeyama N, et al. Comparison of the relaxant effects of diazepam, flunitrazepam and midazolam on airway smooth muscle. Br J Anaesth. 1992;69(1):65-69. PubMed
23. Pomara N, Lee SH, Bruno D, et al. Adverse performance effects of acute lorazepam administration in elderly long-term users: pharmacokinetic and clinical predictors. Prog Neuropsychopharmacol Biol Psychiatry. 2015;56:129-135. PubMed
24. Pandharipande P, Shintani A, Peterson J, et al. Lorazepam is an independent risk factor for transitioning to delirium in intensive care unit patients. Anesthesiology. 2006;104(1):21-26. PubMed
25. O’Neil CA, Krauss MJ, Bettale J, et al. Medications and patient characteristics associated with falling in the hospital. J Patient Saf. 2015 (epub ahead of print). PubMed
26. Kessler ER, Shah M, K Gruschkus S, Raju A. Cost and quality implications of opioid-based postsurgical pain control using administrative claims data from a large health system: opioid-related adverse events and their impact on clinical and economic outcomes. Pharmacotherapy. 2013;33(4):383-391. PubMed
27. Overdyk FJ, Dowling O, Marino J, et al. Association of opioids and sedatives with increased risk of in-hospital cardiopulmonary arrest from an administrative database. PLoS One. 2016;11(2):e0150214. PubMed
28. Minkowitz HS, Gruschkus SK, Shah M, Raju A. Adverse drug events among patients receiving postsurgical opioids in a large health system: risk factors and outcomes. Am J Health Syst Pharm. 2014;71(18):1556-1565. PubMed
29. Elixhauser A, Steiner C, Harris DR, Coffey RM. Comorbidity measures for use with administrative data. Med Care. 1998;36(1):8-27. PubMed
30. Quan H, Sundararajan V, Halfon P, et al. Coding algorithms for defining comorbidities in ICD-9-CM and ICD-10 administrative data. Med Care. 2005;43(11):1130-1139. PubMed
31. Churpek MM, Yuen TC, Winslow C, et al. Multicenter development and validation of a risk stratification tool for ward patients. Am J Respir Crit Care Med. 2014;190(6):649-655. PubMed
32. Knaus WA, Wagner DP, Draper EA, Z et al. The APACHE III prognostic system. Risk prediction of hospital mortality for critically ill hospitalized adults. Chest. 1991;100(6):1619-1636. PubMed
33. van den Boogaard M, Pickkers P, Slooter AJC, et al. Development and validation
of PRE-DELIRIC (PREdiction of DELIRium in ICu patients) delirium prediction
model for intensive care patients: observational multicentre study. BMJ.
2012;344:e420. PubMed
34. Clinical calculators. ClinCalc.com. http://www.clincalc.com. Accessed February
21, 2016.
35. Churpek MM, Yuen TC, Huber MT, Park SY, Hall JB, Edelson DP. Predicting
cardiac arrest on the wards: a nested case-control study. Chest. 2012;141(5):
1170-1176. PubMed
36. Churpek MM, Yuen TC, Park SY, Gibbons R, Edelson DP. Using electronic
health record data to develop and validate a prediction model for adverse outcomes
in the wards. Crit Care Med. 2014;42(4):841-848. PubMed
37. Efron B. Logistic regression, survival analysis, and the Kaplan-Meier curve. J Am
Stat Assoc. 1988;83(402):414-425.
38. Gibbons RD, Duan N, Meltzer D, et al; Institute of Medicine Committee. Waiting
for organ transplantation: results of an analysis by an Institute of Medicine Committee.
Biostatistics. 2003;4(2):207-222. PubMed
39. Singer JD, Willett JB. It’s about time: using discrete-time survival analysis to study
duration and the timing of events. J Educ Behav Stat. 1993;18(2):155-195.
40. World Health Organization. Cancer pain relief and palliative care. Report of a
WHO Expert Committee. World Health Organ Tech Rep Ser. 1990;804:1-75. PubMed
41. Bailey TC, Chen Y, Mao Y, et al. A trial of a real-time alert for clinical deterioration
in patients hospitalized on general medical wards. J Hosp Med. 2013;8(5):236-242. PubMed
42. Liu V, Kipnis P, Rizk NW, Escobar GJ. Adverse outcomes associated with delayed
intensive care unit transfers in an integrated healthcare system. J Hosp Med.
2012;7(3):224-230. PubMed
© 2017 Society of Hospital Medicine
Detecting sepsis: Are two opinions better than one?
Sepsis is a leading cause of hospital mortality in the United States, contributing to up to half of all deaths.1 If the infection is identified and treated early, however, its associated morbidity and mortality can be significantly reduced.2 The 2001 sepsis guidelines define sepsis as the suspicion of infection plus meeting 2 or more systemic inflammatory response syndrome (SIRS) criteria.3 Although the utility of SIRS criteria has been extensively debated, providers’ accuracy and agreement regarding suspicion of infection are not yet fully characterized. This is very important, as the source of infection is often not identified in patients with severe sepsis or septic shock.4
Although much attention recently has been given to ideal objective criteria for accurately identifying sepsis, less is known about what constitutes ideal subjective criteria and who can best make that assessment.5-7 We conducted a study to measure providers’ agreement regarding this subjective assessment and the impact of that agreement on patient outcomes.
METHODS
We performed a secondary analysis of prospectively collected data on consecutive adults hospitalized on a general medicine ward at an academic medical center between April 1, 2014 and March 31, 2015. This study was approved by the University of Chicago Institutional Review Board with a waiver of consent.
A sepsis screening tool was developed locally as part of the Surviving Sepsis Campaign Quality Improvement Learning Collaborative8 (Supplemental Figure). This tool was completed by bedside nurses for each patient during each shift. Bedside registered nurse (RN) suspicion of infection was deemed positive if the nurse answered yes to question 2: “Does the patient have evidence of an active infection?” We compared RN assessment with assessment by the ordering provider, a medical doctor or advanced practice professionals (MD/APP), using an existing order for antibiotics or a new order for either blood or urine cultures placed within 12 hours before nursing screen time to indicate MD/APP suspicion of infection.
All nursing screens were transcribed into an electronic database, excluding screens not performed, or missing RN suspicion of infection. For quality purposes, screening data were merged with electronic health record data to verify SIRS criteria at the time of the screens as well as the presence of culture and/or antibiotic orders preceding the screens. Outcome data were obtained from an administrative database and confirmed by chart review using the 2001 sepsis definitions.6 Data were de-identified and time-shifted before this analysis. SIRS-positive criteria were defined as meeting 2 or more of the following: temperature higher than 38°C or lower than 36°C; heart rate higher than 90 beats per minute; respiratory rate more than 20 breaths per minute; and white blood cell count more than 2,000/mm3 or less than 4,000/mm3.The primary clinical outcome was progression to severe sepsis or septic shock. Secondary outcomes included transfer to intensive care unit (ICU) and in-hospital mortality. Given that RN and MD/APP suspicion of infection can vary over time, only the initial screen for each patient was used in assessing progression to severe sepsis or septic shock and in-hospital mortality. All available screens were used to investigate the association between each provider’s suspicion of infection over time and ICU transfer.
Demographic characteristics were compared using the χ2 test and analysis of variance, as appropriate. Provider agreement was evaluated with a weighted κ statistic. Fisher exact tests were used to compare proportions of mortality and severe sepsis/septic shock, and the McNemar test was used to compare proportions of ICU transfers. The association of outcomes based on provider agreement was evaluated with a nonparametric test for trend.
RESULTS
During the study period, 1386 distinct patients had 13,223 screening opportunities, with a 95.4% compliance rate. A total of 1127 screens were excluded for missing nursing documentation of suspicion of infection, leaving 1192 first screens and 11,489 total screens for analysis. Of the completed screens, 3744 (32.6%) met SIRS criteria; suspicion of infection was noted by both RN and MD/APP in 5.8% of cases, by RN only in 22.2%, by MD/APP only in 7.2%, and by neither provider in 64.7% (Figure 1). Overall agreement rate was 80.7% for suspicion of infection (κ = 0.11, P < 0.001). Demographics by subgroup are shown in the Supplemental Table. Progression to severe sepsis or shock was highest when both providers suspected infection in a SIRS-positive patient (17.7%), was substantially reduced with single-provider suspicion (6.0%), and was lowest when neither provider suspected infection (1.5%) (P < 0.001). A similar trend was found for in-hospital mortality (both providers, 6.3%; single provider, 2.7%; neither provider, 2.5%; P = 0.01). Compared with MD/APP-only suspicion, SIRS-positive patients in whom only RNs suspected infection had similar frequency of progression to severe sepsis or septic shock (6.5% vs 5.6%; P = 0.52) and higher mortality (5.0% vs 1.1%; P = 0.32), though these findings were not statistically significant.

For the 121 patients (10.2%) transferred to ICU, RNs were more likely than MD/APPs to suspect infection at all time points (Figure 2). The difference was small (P = 0.29) 48 hours before transfer (RN, 12.5%; MD/APP, 5.6%) but became more pronounced (P = 0.06) by 3 hours before transfer (RN, 46.3%; MD/APP, 33.1%). Nursing assessments were not available after transfer, but 3 hours after transfer the proportion of patients who met MD/APP suspicion-of-infection criteria (44.6%) was similar (P = 0.90) to that of the RNs 3 hours before transfer (46.3%).

DISCUSSION
Our findings reveal that bedside nurses and ordering providers routinely have discordant assessments regarding presence of infection. Specifically, when RNs are asked to screen patients on the wards, they are suspicious of infection more often than MD/APPs are, and they suspect infection earlier in ICU transfer patients. These findings have significant implications for patient care, compliance with the new national SEP-1 Centers for Medicare & Medicaid Services quality measure, and identification of appropriate patients for enrollment in sepsis-related clinical trials.
To our knowledge, this is the first study to explore agreement between bedside RN and MD/APP suspicion of infection in sepsis screening and its association with patient outcomes. Studies on nurse and physician concordance in other domains have had mixed findings.9-11 The high discordance rate found in our study points to the highly subjective nature of suspicion of infection.
Our finding that RNs suspect infection earlier in patients transferred to ICU suggests nursing suspicion has value above and beyond current practice. A possible explanation for the higher rate of RN suspicion, and earlier RN suspicion, is that bedside nurses spend substantially more time with their patients and are more attuned to subtle changes that often occur before any objective signs of deterioration. This phenomenon is well documented and accounts for why rapid response calling criteria often include “nurse worry or concern.”12,13 Thus, nurse intuition may be an important signal for early identification of patients at high risk for sepsis.
That about one third of all screens met SIRS criteria and that almost two thirds of those screens were not thought by RN or MD/APP to be caused by infection add to the literature demonstrating the limited value of SIRS as a screening tool for sepsis.14 To address this issue, the 2016 sepsis definitions propose using the quick Sepsis-Related Organ Failure Assessment (qSOFA) to identify patients at high risk for clinical deterioration; however, the Surviving Sepsis Campaign continues to encourage sepsis screening using the SIRS criteria.15
Limitations of this study include its lack of generalizability, as it was conducted with general medical patients at a single center. Second, we did not specifically ask the MD/APPs whether they suspected infection; instead, we relied on their ordering practices. Third, RN and MD/APP assessments were not independent, as RNs had access to MD/APP orders before making their own assessments, which could bias our results.
Discordance in provider suspicion of infection is common, with RNs documenting suspicion more often than MD/APPs, and earlier in patients transferred to ICU. Suspicion by either provider alone is associated with higher risk for sepsis progression and in-hospital mortality than is the case when neither provider suspects infection. Thus, a collaborative method that includes both RNs and MD/APPs may improve the accuracy and timing of sepsis detection on the wards.
Acknowledgments
The authors thank the members of the Surviving Sepsis Campaign (SSC) Quality Improvement Learning Collaborative at the University of Chicago for their help in data collection and review, especially Meredith Borak, Rita Lanier, Mary Ann Francisco, and Bill Marsack. The authors also thank Thomas Best and Mary-Kate Springman for their assistance in data entry and Nicole Twu for administrative support. Data from this study were provided by the Clinical Research Data Warehouse (CRDW) maintained by the Center for Research Informatics (CRI) at the University of Chicago. CRI is funded by the Biological Sciences Division of the Institute for Translational Medicine/Clinical and Translational Science Award (CTSA) (National Institutes of Health UL1 TR000430) at the University of Chicago.
Disclosures
Dr. Bhattacharjee is supported by postdoctoral training grant 4T32HS000078 from the Agency for Healthcare Research and Quality. Drs. Churpek and Edelson have a patent pending (ARCD.P0535US.P2) for risk stratification algorithms for hospitalized patients. Dr. Churpek is supported by career development award K08 HL121080 from the National Heart, Lung, and Blood Institute. Dr. Edelson has received research support from Philips Healthcare (Andover, Massachusetts), American Heart Association (Dallas, Texas), and Laerdal Medical (Stavanger, Norway) and has ownership interest in Quant HC (Chicago, Illinois), which is developing products for risk stratification of hospitalized patients. The other authors report no conflicts of interest.
1. Liu V, Escobar GJ, Greene JD, et al. Hospital deaths in patients with sepsis from 2 independent cohorts. JAMA. 2014;312(1):90-92. PubMed
2. Rivers E, Nguyen B, Havstad S, et al; Early Goal-Directed Therapy Collaborative Group. Early goal-directed therapy in the treatment of severe sepsis and septic shock. N Engl J Med. 2001;345(19):1368-1377. PubMed
3. Levy MM, Fink MP, Marshall JC, et al; SCCM/ESICM/ACCP/ATS/SIS. 2001 SCCM/ESICM/ACCP/ATS/SIS International Sepsis Definitions Conference. Crit Care Med. 2003;31(4):1250-1256. PubMed
4. Vincent JL, Sakr Y, Sprung CL, et al; Sepsis Occurrence in Acutely Ill Patients Investigators. Sepsis in European intensive care units: results of the SOAP study. Crit Care Med. 2006;34(2):344-353. PubMed
5. Kaukonen KM, Bailey M, Pilcher D, Cooper DJ, Bellomo R. Systemic inflammatory response syndrome criteria in defining severe sepsis. N Engl J Med. 2015;372(17):1629-1638. PubMed
6. Vincent JL, Opal SM, Marshall JC, Tracey KJ. Sepsis definitions: time for change. Lancet. 2013;381(9868):774-775. PubMed
7. Singer M, Deutschman CS, Seymour CW, et al. The Third International Consensus Definitions for Sepsis and Septic Shock (Sepsis-3). JAMA. 2016;315(8):801-810. PubMed
8. Surviving Sepsis Campaign (SSC) Sepsis on the Floors Quality Improvement Learning Collaborative. Frequently asked questions (FAQs). Society of Critical Care Medicine website. http://www.survivingsepsis.org/SiteCollectionDocuments/About-Collaboratives.pdf. Published October 8, 2013.
9. Fiesseler F, Szucs P, Kec R, Richman PB. Can nurses appropriately interpret the Ottawa ankle rule? Am J Emerg Med. 2004;22(3):145-148. PubMed
10. Blomberg H, Lundström E, Toss H, Gedeborg R, Johansson J. Agreement between ambulance nurses and physicians in assessing stroke patients. Acta Neurol Scand. 2014;129(1):4955. PubMed
11. Neville TH, Wiley JF, Yamamoto MC, et al. Concordance of nurses and physicians on whether critical care patients are receiving futile treatment. Am J Crit Care. 2015;24(5):403410. PubMed
12. Odell M, Victor C, Oliver D. Nurses’ role in detecting deterioration in ward patients: systematic literature review. J Adv Nurs. 2009;65(10):1992-2006. PubMed
13. Howell MD, Ngo L, Folcarelli P, et al. Sustained effectiveness of a primary-team-based rapid response system. Crit Care Med. 2012;40(9):2562-2568. PubMed
14. Churpek MM, Zadravecz FJ, Winslow C, Howell MD, Edelson DP. Incidence and prognostic value of the systemic inflammatory response syndrome and organ dysfunctions in ward patients. Am J Respir Crit Care Med. 2015;192(8):958-964. PubMed
15. Antonelli M, DeBacker D, Dorman T, Kleinpell R, Levy M, Rhodes A; Surviving Sepsis Campaign Executive Committee. Surviving Sepsis Campaign responds to Sepsis-3. Society of Critical Care Medicine website. http://www.survivingsepsis.org/SiteCollectionDocuments/SSC-Statements-Sepsis-Definitions-3-2016.pdf. Published March 1, 2016. Accessed May 11, 2016.
Sepsis is a leading cause of hospital mortality in the United States, contributing to up to half of all deaths.1 If the infection is identified and treated early, however, its associated morbidity and mortality can be significantly reduced.2 The 2001 sepsis guidelines define sepsis as the suspicion of infection plus meeting 2 or more systemic inflammatory response syndrome (SIRS) criteria.3 Although the utility of SIRS criteria has been extensively debated, providers’ accuracy and agreement regarding suspicion of infection are not yet fully characterized. This is very important, as the source of infection is often not identified in patients with severe sepsis or septic shock.4
Although much attention recently has been given to ideal objective criteria for accurately identifying sepsis, less is known about what constitutes ideal subjective criteria and who can best make that assessment.5-7 We conducted a study to measure providers’ agreement regarding this subjective assessment and the impact of that agreement on patient outcomes.
METHODS
We performed a secondary analysis of prospectively collected data on consecutive adults hospitalized on a general medicine ward at an academic medical center between April 1, 2014 and March 31, 2015. This study was approved by the University of Chicago Institutional Review Board with a waiver of consent.
A sepsis screening tool was developed locally as part of the Surviving Sepsis Campaign Quality Improvement Learning Collaborative8 (Supplemental Figure). This tool was completed by bedside nurses for each patient during each shift. Bedside registered nurse (RN) suspicion of infection was deemed positive if the nurse answered yes to question 2: “Does the patient have evidence of an active infection?” We compared RN assessment with assessment by the ordering provider, a medical doctor or advanced practice professionals (MD/APP), using an existing order for antibiotics or a new order for either blood or urine cultures placed within 12 hours before nursing screen time to indicate MD/APP suspicion of infection.
All nursing screens were transcribed into an electronic database, excluding screens not performed, or missing RN suspicion of infection. For quality purposes, screening data were merged with electronic health record data to verify SIRS criteria at the time of the screens as well as the presence of culture and/or antibiotic orders preceding the screens. Outcome data were obtained from an administrative database and confirmed by chart review using the 2001 sepsis definitions.6 Data were de-identified and time-shifted before this analysis. SIRS-positive criteria were defined as meeting 2 or more of the following: temperature higher than 38°C or lower than 36°C; heart rate higher than 90 beats per minute; respiratory rate more than 20 breaths per minute; and white blood cell count more than 2,000/mm3 or less than 4,000/mm3.The primary clinical outcome was progression to severe sepsis or septic shock. Secondary outcomes included transfer to intensive care unit (ICU) and in-hospital mortality. Given that RN and MD/APP suspicion of infection can vary over time, only the initial screen for each patient was used in assessing progression to severe sepsis or septic shock and in-hospital mortality. All available screens were used to investigate the association between each provider’s suspicion of infection over time and ICU transfer.
Demographic characteristics were compared using the χ2 test and analysis of variance, as appropriate. Provider agreement was evaluated with a weighted κ statistic. Fisher exact tests were used to compare proportions of mortality and severe sepsis/septic shock, and the McNemar test was used to compare proportions of ICU transfers. The association of outcomes based on provider agreement was evaluated with a nonparametric test for trend.
RESULTS
During the study period, 1386 distinct patients had 13,223 screening opportunities, with a 95.4% compliance rate. A total of 1127 screens were excluded for missing nursing documentation of suspicion of infection, leaving 1192 first screens and 11,489 total screens for analysis. Of the completed screens, 3744 (32.6%) met SIRS criteria; suspicion of infection was noted by both RN and MD/APP in 5.8% of cases, by RN only in 22.2%, by MD/APP only in 7.2%, and by neither provider in 64.7% (Figure 1). Overall agreement rate was 80.7% for suspicion of infection (κ = 0.11, P < 0.001). Demographics by subgroup are shown in the Supplemental Table. Progression to severe sepsis or shock was highest when both providers suspected infection in a SIRS-positive patient (17.7%), was substantially reduced with single-provider suspicion (6.0%), and was lowest when neither provider suspected infection (1.5%) (P < 0.001). A similar trend was found for in-hospital mortality (both providers, 6.3%; single provider, 2.7%; neither provider, 2.5%; P = 0.01). Compared with MD/APP-only suspicion, SIRS-positive patients in whom only RNs suspected infection had similar frequency of progression to severe sepsis or septic shock (6.5% vs 5.6%; P = 0.52) and higher mortality (5.0% vs 1.1%; P = 0.32), though these findings were not statistically significant.
For the 121 patients (10.2%) transferred to ICU, RNs were more likely than MD/APPs to suspect infection at all time points (Figure 2). The difference was small (P = 0.29) 48 hours before transfer (RN, 12.5%; MD/APP, 5.6%) but became more pronounced (P = 0.06) by 3 hours before transfer (RN, 46.3%; MD/APP, 33.1%). Nursing assessments were not available after transfer, but 3 hours after transfer the proportion of patients who met MD/APP suspicion-of-infection criteria (44.6%) was similar (P = 0.90) to that of the RNs 3 hours before transfer (46.3%).
DISCUSSION
Our findings reveal that bedside nurses and ordering providers routinely have discordant assessments regarding presence of infection. Specifically, when RNs are asked to screen patients on the wards, they are suspicious of infection more often than MD/APPs are, and they suspect infection earlier in ICU transfer patients. These findings have significant implications for patient care, compliance with the new national SEP-1 Centers for Medicare & Medicaid Services quality measure, and identification of appropriate patients for enrollment in sepsis-related clinical trials.
To our knowledge, this is the first study to explore agreement between bedside RN and MD/APP suspicion of infection in sepsis screening and its association with patient outcomes. Studies on nurse and physician concordance in other domains have had mixed findings.9-11 The high discordance rate found in our study points to the highly subjective nature of suspicion of infection.
Our finding that RNs suspect infection earlier in patients transferred to ICU suggests nursing suspicion has value above and beyond current practice. A possible explanation for the higher rate of RN suspicion, and earlier RN suspicion, is that bedside nurses spend substantially more time with their patients and are more attuned to subtle changes that often occur before any objective signs of deterioration. This phenomenon is well documented and accounts for why rapid response calling criteria often include “nurse worry or concern.”12,13 Thus, nurse intuition may be an important signal for early identification of patients at high risk for sepsis.
That about one third of all screens met SIRS criteria and that almost two thirds of those screens were not thought by RN or MD/APP to be caused by infection add to the literature demonstrating the limited value of SIRS as a screening tool for sepsis.14 To address this issue, the 2016 sepsis definitions propose using the quick Sepsis-Related Organ Failure Assessment (qSOFA) to identify patients at high risk for clinical deterioration; however, the Surviving Sepsis Campaign continues to encourage sepsis screening using the SIRS criteria.15
Limitations of this study include its lack of generalizability, as it was conducted with general medical patients at a single center. Second, we did not specifically ask the MD/APPs whether they suspected infection; instead, we relied on their ordering practices. Third, RN and MD/APP assessments were not independent, as RNs had access to MD/APP orders before making their own assessments, which could bias our results.
Discordance in provider suspicion of infection is common, with RNs documenting suspicion more often than MD/APPs, and earlier in patients transferred to ICU. Suspicion by either provider alone is associated with higher risk for sepsis progression and in-hospital mortality than is the case when neither provider suspects infection. Thus, a collaborative method that includes both RNs and MD/APPs may improve the accuracy and timing of sepsis detection on the wards.
Acknowledgments
The authors thank the members of the Surviving Sepsis Campaign (SSC) Quality Improvement Learning Collaborative at the University of Chicago for their help in data collection and review, especially Meredith Borak, Rita Lanier, Mary Ann Francisco, and Bill Marsack. The authors also thank Thomas Best and Mary-Kate Springman for their assistance in data entry and Nicole Twu for administrative support. Data from this study were provided by the Clinical Research Data Warehouse (CRDW) maintained by the Center for Research Informatics (CRI) at the University of Chicago. CRI is funded by the Biological Sciences Division of the Institute for Translational Medicine/Clinical and Translational Science Award (CTSA) (National Institutes of Health UL1 TR000430) at the University of Chicago.
Disclosures
Dr. Bhattacharjee is supported by postdoctoral training grant 4T32HS000078 from the Agency for Healthcare Research and Quality. Drs. Churpek and Edelson have a patent pending (ARCD.P0535US.P2) for risk stratification algorithms for hospitalized patients. Dr. Churpek is supported by career development award K08 HL121080 from the National Heart, Lung, and Blood Institute. Dr. Edelson has received research support from Philips Healthcare (Andover, Massachusetts), American Heart Association (Dallas, Texas), and Laerdal Medical (Stavanger, Norway) and has ownership interest in Quant HC (Chicago, Illinois), which is developing products for risk stratification of hospitalized patients. The other authors report no conflicts of interest.
1. Liu V, Escobar GJ, Greene JD, et al. Hospital deaths in patients with sepsis from 2 independent cohorts. JAMA. 2014;312(1):90-92. PubMed
2. Rivers E, Nguyen B, Havstad S, et al; Early Goal-Directed Therapy Collaborative Group. Early goal-directed therapy in the treatment of severe sepsis and septic shock. N Engl J Med. 2001;345(19):1368-1377. PubMed
3. Levy MM, Fink MP, Marshall JC, et al; SCCM/ESICM/ACCP/ATS/SIS. 2001 SCCM/ESICM/ACCP/ATS/SIS International Sepsis Definitions Conference. Crit Care Med. 2003;31(4):1250-1256. PubMed
4. Vincent JL, Sakr Y, Sprung CL, et al; Sepsis Occurrence in Acutely Ill Patients Investigators. Sepsis in European intensive care units: results of the SOAP study. Crit Care Med. 2006;34(2):344-353. PubMed
5. Kaukonen KM, Bailey M, Pilcher D, Cooper DJ, Bellomo R. Systemic inflammatory response syndrome criteria in defining severe sepsis. N Engl J Med. 2015;372(17):1629-1638. PubMed
6. Vincent JL, Opal SM, Marshall JC, Tracey KJ. Sepsis definitions: time for change. Lancet. 2013;381(9868):774-775. PubMed
7. Singer M, Deutschman CS, Seymour CW, et al. The Third International Consensus Definitions for Sepsis and Septic Shock (Sepsis-3). JAMA. 2016;315(8):801-810. PubMed
8. Surviving Sepsis Campaign (SSC) Sepsis on the Floors Quality Improvement Learning Collaborative. Frequently asked questions (FAQs). Society of Critical Care Medicine website. http://www.survivingsepsis.org/SiteCollectionDocuments/About-Collaboratives.pdf. Published October 8, 2013.
9. Fiesseler F, Szucs P, Kec R, Richman PB. Can nurses appropriately interpret the Ottawa ankle rule? Am J Emerg Med. 2004;22(3):145-148. PubMed
10. Blomberg H, Lundström E, Toss H, Gedeborg R, Johansson J. Agreement between ambulance nurses and physicians in assessing stroke patients. Acta Neurol Scand. 2014;129(1):4955. PubMed
11. Neville TH, Wiley JF, Yamamoto MC, et al. Concordance of nurses and physicians on whether critical care patients are receiving futile treatment. Am J Crit Care. 2015;24(5):403410. PubMed
12. Odell M, Victor C, Oliver D. Nurses’ role in detecting deterioration in ward patients: systematic literature review. J Adv Nurs. 2009;65(10):1992-2006. PubMed
13. Howell MD, Ngo L, Folcarelli P, et al. Sustained effectiveness of a primary-team-based rapid response system. Crit Care Med. 2012;40(9):2562-2568. PubMed
14. Churpek MM, Zadravecz FJ, Winslow C, Howell MD, Edelson DP. Incidence and prognostic value of the systemic inflammatory response syndrome and organ dysfunctions in ward patients. Am J Respir Crit Care Med. 2015;192(8):958-964. PubMed
15. Antonelli M, DeBacker D, Dorman T, Kleinpell R, Levy M, Rhodes A; Surviving Sepsis Campaign Executive Committee. Surviving Sepsis Campaign responds to Sepsis-3. Society of Critical Care Medicine website. http://www.survivingsepsis.org/SiteCollectionDocuments/SSC-Statements-Sepsis-Definitions-3-2016.pdf. Published March 1, 2016. Accessed May 11, 2016.
© 2017 Society of Hospital Medicine
ICU Transfer Delay and Outcome
Patients on hospital wards may become critically ill due to worsening of the underlying condition that was the cause of their admission or acquisition of a new hospital‐acquired illness. Once physiologic deterioration occurs, some patients are evaluated and quickly transferred to the intensive care unit (ICU), whereas others are left on the wards until further deterioration occurs. Because many critical illness syndromes benefit from early intervention, such as sepsis and respiratory failure, early transfer to the ICU for treatment may improve patient outcomes, and conversely, delays in ICU transfer may lead to increased mortality and length of stay (LOS) in critically ill ward patients.[1, 2] However, the timeliness of that transfer is dependent on numerous changing variables, such as ICU bed availability, clinician identification of the deterioration, and clinical judgment regarding the appropriate transfer thresholds.[2, 3, 4, 5, 6, 7] As a result, there is a large degree of heterogeneity in the severity of illness of patients at the time of ICU transfer and in patient outcomes.[6, 8]
Previous studies investigating the association between delayed ICU transfer and patient outcomes have typically utilized the time of consultation by the ICU team to denote the onset of critical illness.[5, 6, 9, 10] However, the decision to transfer a patient to the ICU is often subjective, and previous studies have found an alarmingly high rate of errors in diagnosis and management of critically ill ward patients, including the failure to call for help.[2, 11] Therefore, a more objective tool for quantifying critical illness is necessary for determining the onset of critical illness and quantifying the association of transfer delay with patient outcomes.
Early warning scores, which are designed to detect critical illness on the wards, represent objective measures of critical illness that can be easily calculated in ward patients.[12] The aim of this study was to utilize the electronic Cardiac Arrest Risk Triage (eCART) score, a previously published, statistically derived early warning score that utilizes demographic, vital sign, and laboratory data, as an objective measure of critical illness to estimate the effect of delayed ICU transfer on patient outcomes in a large, multicenter database.[13] We chose 6 hours as the cutoff for delay in this study a priori because it is a threshold noted to be an important time period in critical illness syndromes, such as sepsis.[14, 15]
METHODS
All patients admitted to the medical‐surgical wards at 5 hospitals between November 2008 and January 2013 were eligible for inclusion in this observational cohort study. Further details of the hospital populations have been previously described.[13] A waiver of consent was granted by NorthShore University HealthSystem (IRB #EH11‐258) and the University of Chicago Institutional Review Board (IRB #16995A) based on general impracticability and minimal harm. Collection of patient information was designed to comply with the Health Insurance Portability and Accountability Act of 1996 (HIPAA) regulations.
Defining the Onset of Critical Illness
The eCART score, a statistically derived early warning score that is calculated based on patient demographic, vital sign, and laboratory data, was used as an objective measure of critical illness.[13] Score calculation was performed utilizing demographic information from administrative databases and time‐ and location‐stamped vital signs and laboratory results from data warehouses at the respective institutions. In this study, a score was calculated for each time‐stamped point in the entire dataset. Of note, eCART was not used in this population for patient care as this was a retrospective observational study. An eCART score at the 95% specificity cutoff for ICU transfer from the entire dataset defined a ward patient as critically ill, a definition created a priori and before any data analysis was performed.
Defining ICU Transfer Delay and Study Outcomes
The period of time from when a patient first reached this predefined eCART score to ICU transfer was calculated for each patient, up to a maximum of 24 hours. Transfer to the ICU greater than 6 hours after reaching the critical eCART score was defined a priori as a delayed transfer to allow comparisons between patients with nondelayed and delayed transfer. A patient who suffered a ward cardiac arrest with attempted resuscitation was counted as an ICU transfer at the time of arrest. If a patient experienced more than 1 ICU transfer during the admission, then only the first ward to ICU transfer was used. The primary outcome of the study was in‐hospital mortality, and secondary outcomes were ICU mortality and hospital LOS.
Statistical Analysis
Patient characteristics were compared between patients who experienced delayed and nondelayed ICU transfers using t tests, Wilcoxon rank sums, and [2] tests, as appropriate. The association between length of transfer delay and in‐hospital mortality was calculated using logistic regression, with adjustment for age, sex, and surgical status. In a post hoc sensitivity analysis, additional adjustments were made using each patient's first eCART score on the ward, the individual vital signs and laboratory variables from eCART, and whether the ICU transfer was due to a cardiac arrest on the wards. In addition, an interaction term between time to transfer and the initial eCART on the ward was added to determine if the association between delay and mortality varied by baseline severity. The change in eCART score over time was plotted from 12 hours before the time of first reaching the critical value until ICU transfer for those in the delayed and nondelayed groups using restricted cubic splines to compare the trajectories of severity of illness between these 2 groups. In addition, a linear regression model was fit to investigate the association between the eCART slope in the 8 hours prior to the critical eCART value until ICU transfer and the timing of ICU transfer delay. Statistical analyses were performed using Stata version 12.1 (StataCorp, College Station, TX), and all tests of significance used a 2‐sided P<0.05.
RESULTS
A total of 269,999 admissions had documented vital signs on the hospital wards during the study period, including 11,995 patients who were either transferred from the wards to the ICU (n=11,636) or who suffered a cardiac arrest on the wards (n=359) during their initial ward stay. Of these patients, 3789 reached an eCART score at the 95% specificity cutoff (critical eCART score of 60) within 24 hours of transfer. The median time from first critical eCART value to ICU transfer was 5.4 hours (interquartile range (IQR), 214 hours; mean, 8 hours). Compared to patients without delayed ICU transfer, those with delayed transfer were slightly older (median age, 73 [IQR, 6083] years vs 71 [IQR, 5882] years; P=0.002), whereas all other characteristics were similar (Table 1). Table 2 shows comparisons of vital sign and laboratory results for delayed and nondelayed transfers at the time of ICU transfer. As shown, patients with delayed transfer had lower median respiratory rate, blood pressure, heart rate, and hemoglobin, but higher median white blood cell count and creatinine.
| Characteristic | Transferred Within 6 Hours, n=2,055 | Transfer Delayed, n=1,734 | P Value |
|---|---|---|---|
| |||
| Age, median (IQR), y | 71 (5882) | 73 (6083) | 0.002 |
| Female sex, n (%) | 1,018 (49.5) | 847 (48.8) | 0.67 |
| Race, n (%) | 0.72 | ||
| Black | 467 (22.7) | 374 (21.6) | |
| White | 1,141 (55.5) | 971 (56.0) | |
| Other/unknown | 447 (21.8) | 389 (22.4) | |
| Surgical patient, n (%) | 572 (27.8) | 438 (25.2) | 0.07 |
| Hospital LOS prior to first critical eCART, median (IQR), d | 1.5 (0.33.7) | 1.6 (0.43.9) | 0.04 |
| Total hospital LOS, median (IQR), d* | 11 (719) | 13 (821) | <0.001 |
| Died during admission, n (%) | 503 (24.5) | 576 (33.2) | <0.001 |
| Transferred Within 6 Hours, n=2,055 | Transfer Delayed, n=1,734 | P Value | |
|---|---|---|---|
| |||
| Respiratory rate, breaths/min | 23 (1830) | 22 (1828) | <0.001 |
| Systolic blood pressure, mm Hg | 111 (92134) | 109 (92128) | 0.002 |
| Diastolic blood pressure, mm Hg | 61 (5075) | 59 (4971) | <0.001 |
| Heart rate, beats/min | 106 (88124) | 101 (85117) | <0.001 |
| Oxygen saturation, median (IQR), % | 97 (9499) | 97 (9599) | 0.15 |
| Temperature, F | 98.0 (97.299.1) | 98.0 (97.199.0) | 0.001 |
| Alert mental status, number of observations (%) | 1,749 (85%) | 1,431 (83%) | <0.001 |
| eCART score at time of ICU transfer | 61 (26122) | 48 (21121) | 0.914 |
| WBC | 10.3 (7.514.5) | 11.7 (8.117.0) | <0.001 |
| Hemoglobin | 10.7 (9.312.0) | 10.3 (9.111.6) | <0.001 |
| Platelet | 215 (137275) | 195 (120269) | 0.017 |
| Sodium | 137 (134140) | 137 (134141) | 0.70 |
| K+ | 4.1 (3.84.6) | 4.2 (3.84.7) | 0.006 |
| Anion Gap | 10 (813) | 10 (814) | <0.001 |
| CO2 | 24 (2026) | 23 (1826) | <0.001 |
| BUN | 24 (1640) | 32 (1853) | <0.001 |
| Cr | 1.2 (0.92.0) | 1.5 (1.02.7) | <0.001 |
| GFR | 70 (7070) | 70 (5170) | <0.001 |
| Glucose | 123 (106161) | 129 (105164) | 0.48 |
| Calcium | 8.5 (7.98.8) | 8.2 (7.78.7) | <0.001 |
| SGOT | 26 (2635) | 26 (2644) | 0.001 |
| SGPT | 21 (2127) | 21 (2033) | 0.002 |
| Total bilirubin | 0.7 (0.71.0) | 0.7 (0.71.3) | <0.001 |
| Alk phos | 80 (8096) | 80 (79111) | 0.175 |
| Albumin | 3.0 (2.73.0) | 3.0 (2.43.0) | <0.001 |
Delayed transfer occurred in 46% of patients (n=1734) and was associated with increased in‐hospital mortality (33.2% vs 24.5%, P<0.001). This relationship was linear, with each 1‐hour increase in transfer delay associated with a 3% increase in the odds of in‐hospital death (P<0.001) (Figure 1). The association between length of transfer delay and hospital mortality remained unchanged after controlling for age, sex, surgical status, initial eCART score on the wards, vital signs, laboratory values, and whether the ICU transfer was due to a cardiac arrest (3% increase per hour, P<0.001). This association did not vary based on the initial eCART score on the wards (P=0.71 for interaction). Additionally, despite having similar median hospital lengths of stay prior to first critical eCART score (1.6 vs 1.5 days, P=0.04), patients experiencing delayed ICU transfer who survived to discharge had a longer median hospital LOS by 2 days compared to those with nondelayed transfer who survived to discharge (median LOS, 13 (821) days vs 11 (719) days, P=0.01). The change in eCART score over time in the 12 hours before first reaching the critical eCART score until ICU transfer is shown in Figure 2 for patients with delayed and nondelayed transfer. As shown, patients transferred within 6 hours had a more rapid rise in eCART score prior to ICU transfer compared to those with a delayed transfer. This difference in trajectories between delayed and nondelayed patients was similar in patients with low (<13), intermediate (1359), and high (60) initial eCART scores on the wards. A regression model investigating the association between eCART slope prior to ICU transfer and time to ICU transfer demonstrated that a steeper slope was significantly associated with a decreased time to ICU transfer (P<0.01).
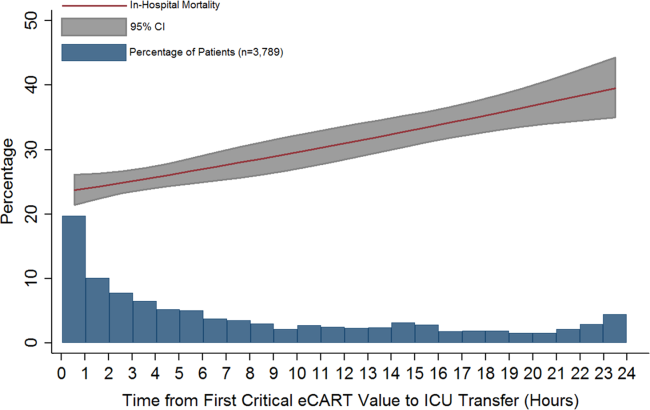
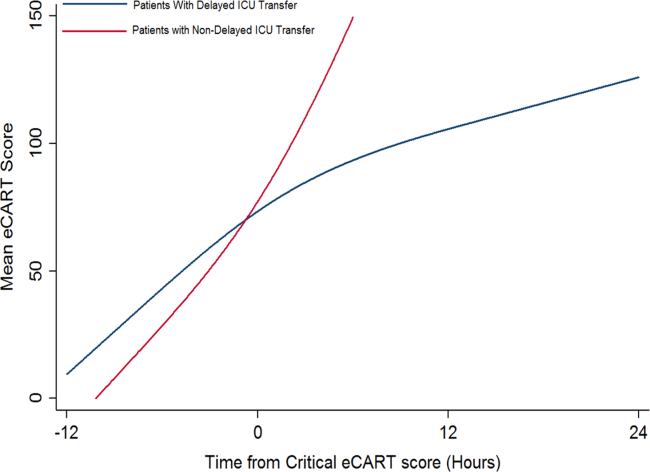
DISCUSSION
We found that a delay in transfer to the ICU after reaching a predefined objective threshold of critical illness was associated with a significant increase in hospital mortality and hospital LOS. We also discovered a significant association between critical illness trajectory and delays in transfer, suggesting that caregivers may not recognize more subtle trends in critical illness. This work highlights the importance of timely transfer to the ICU for critically ill ward patients, which can be affected by several factors such as ICU bed availability and caregiver recognition and triage decisions. Our findings have significant implications for patient safety on the wards and provide further evidence for implementing early warning scores into practice to aid with clinical decision making.
Our findings of increased mortality with delayed ICU transfer are consistent with previous studies.[1, 5, 9] For example, Young et al. compared ICU mortality between delayed and nondelayed transfers in 91 consecutive patients with noncardiac diagnoses at a community hospital.[1] They also used predefined criteria for critical illness, and found that delayed transfers had a higher ICU mortality than nondelayed patients (41% vs 11%). However, their criteria for critical illness only had a specificity of 13% for predicting ICU transfer, compared to 95% in our study, suggesting that our threshold is more consistent with critical illness. Another study, by Cardoso and colleagues, investigated the impact of delayed ICU admission due to bed shortages on ICU mortality in 401 patients at a university hospital.[9] Of those patients deemed appropriate for transfer to the ICU but who had to wait for a bed to become available, the median wait time for a bed was 18 hours. They found that each hour of waiting was associated with a 1.5% increase in ICU death. A similar study by Robert and colleagues investigated the impact of delayed or refused ICU admission due to a lack of bed availability.[5] Patients deemed too sick (or too well) to benefit from ICU transfer were excluded. Twenty‐eightday and 60‐day mortality were higher in the admitted group compared to those not admitted, although this finding was not statistically significant. In addition, patients later admitted to the ICU once a bed became available (median wait time, 6 hours; n=89) had higher 28‐day mortality than those admitted immediately (adjusted odds ratio, 1.78; P=0.05). Several other studies have investigated the impact of ICU refusal for reasons that included bed shortages, and found increased mortality in those not admitted to the ICU.[16, 17] However, many of these studies included patients deemed too sick or too well to be transferred to the ICU in the group of nonadmitted patients. Our study adds to this literature by utilizing a highly specific objective measure of critical illness and by including all patients on the wards who reached this threshold, rather than only those for whom a consult was requested.
There are several potential explanations for our finding of increased mortality with delayed ICU transfer. First, those with delayed transfer might be different in some way from those transferred immediately. For example, we found that those with delayed transfer were older. The finding that increasing age is associated with a delay in ICU transfer is interesting, and may reflect physiologic differences in older patients compared to younger ones. For example, older patients have a lower maximum heart rate and thus may not develop the same level of vital sign abnormalities that younger patients do, causing them to be inappropriately left on the wards for too long.[18] In addition, patients with delayed transfer had more deranged renal function and lower blood pressure. It is unknown whether these organ dysfunctions would have been prevented by earlier transfer and to what degree they were related to chronic conditions. However, delayed transfer was still associated with increased mortality even after controlling for age, vital sign and laboratory values, and eCART on ward admission. It may also be possible that patients with delayed transfer received early and appropriate treatment on the wards but failed to improve and thus required ICU transfer. We did not have access to orders in this large database, so this theory will need to be investigated in future work. Finally, the most likely explanation for our findings is that earlier identification and treatment improves outcomes of critically ill patients on the wards, which is consistent with the findings of previous studies.[1, 5, 9, 10] Our study demonstrates that early identification of critical illness is crucial, and that delayed treatment can rapidly lead to increased mortality and LOS.
Our comparison of eCART score trajectory showed that patients transferred within 6 hours of onset of critical illness had a more rapid rise in eCART score over the preceding time period, whereas patients who experienced transfer delay showed a slower increase in eCART score. One explanation for this finding is that patients who decompensate more rapidly are in turn more readily recognizable to providers, whereas patients who experience a more insidious clinical deterioration are recognized later in the process, which then leads to a delay in escalation of care. This hypothesis underlines the importance of utilizing an objective marker of illness that is calculated longitudinally and in real time, as opposed to relying upon provider recognition alone. In fact, we have recently demonstrated that eCART is more accurate and identifies patients earlier than standard rapid response team activation.[19]
There are several important implications of our findings. First, it highlights the potential impact that early warning scores, particular those that are evidence based, can have on the outcomes of hospitalized patients. Second, it suggests that it is important to include age in early warning scores. Previous studies have been mixed as to whether the inclusion of age improves detection of outcomes on the wards, although the method of inclusion of age has been variable in terms of its weighting.[20, 21, 22] Our study found that older patients were more likely to be left on the wards longer prior to ICU transfer after becoming critically ill. By incorporating age into early warning scores, both accuracy and early recognition of critical illness may be improved. Finally, our finding that the trends of the eCART score differed among patients who were immediately transferred to the ICU, and who had a delay in their transfer, suggests that adding vital sign trends to early warning scores may further improve their accuracy and ability to serve as clinical decision support tools.
Our study is unique in that we used an objective measure of critical illness and then examined outcomes after patients reached this threshold on the wards. This overcomes the subjectivity of using evaluation by the ICU team or rapid response team as the starting point, as previous studies have shown a failure to call for help when patients become critically ill on the wards.[2, 11, 23] By using the eCART score, which contains commonly collected electronic health record data and can be calculated electronically in real time, we were able to calculate the score for patients on the wards and in the ICU. This allowed us to examine trends in the eCART score over time to find clues as to why some patients are transferred late to the ICU and why these late transfers have worse outcomes than those transferred earlier. Another strength is the large multicenter database used for the analysis, which included an urban tertiary care hospital, suburban teaching hospitals, and a community nonteaching hospital.
Our study has several limitations. First, we utilized just 1 of many potential measures of critical illness and a cutoff that only included one‐third of patients ultimately transferred to the ICU. However, by using the eCART score, we were able to track a patient's physiologic status over time and remove the variability that comes with using subjective definitions of critical illness. Furthermore, we utilized a high‐specificity cutoff for eCART to ensure that transferred patients had significantly deranged physiology and to avoid including planned transfers to the ICU. It is likely that some patients who were critically ill with less deranged physiology that would have benefitted from earlier transfer were excluded from the study. Second, we were unable to determine the cause of physiologic deterioration for patients in our study due to the large number of included patients. In addition, we did not have code status, comorbidities, or reason for ICU admission available in the dataset. It is likely that the impact of delayed transfer varies by the indication for ICU admission and chronic disease burden. It is also possible that controlling for these unmeasured factors could negate the beneficial association seen for earlier ICU admission. However, our finding of such a strong relationship between time to transfer and mortality after controlling for several important variables suggests that early recognition of critical illness is beneficial to many patients on the wards. Third, due to its observational nature, our study cannot estimate the true impact of timely ICU transfer on critically ill ward patient outcomes. Future clinical trials will be needed to determine the impact of electronic early warning scores on patient outcomes.
In conclusion, delayed ICU transfer is associated with significantly increased hospital LOS and mortality. This association highlights the need for ongoing work toward both the implementation of an evidence‐based risk stratification tool as well as development of effective critical care outreach resources for patients decompensating on the wards. Real‐time use of a validated early warning score, such as eCART, could potentially lead to more timely ICU transfer for critically ill patients and reduced rates of preventable in‐hospital death.
Acknowledgements
The authors thank Timothy Holper, Justin Lakeman, and Contessa Hsu for assistance with data extraction and technical support; Poome Chamnankit, MS, CNP, Kelly Bhatia, MSN, ACNP, and Audrey Seitman, MSN, ACNP for performing manual chart review of cardiac arrest patients; and Nicole Twu for administrative support.
Disclosures: This research was funded in part by an institutional Clinical and Translational Science Award grant (UL1 RR024999, PI: Dr. Julian Solway). Dr. Churpek is supported by a career development award from the National Heart, Lung, and Blood Institute (K08 HL121080). Drs. Churpek and Edelson have a patent pending (ARCD. P0535US.P2) for risk stratification algorithms for hospitalized patients. In addition, Dr. Edelson has received research support from Philips Healthcare (Andover, MA), the American Heart Association (Dallas, TX), and Laerdal Medical (Stavanger, Norway). She has ownership interest in Quant HC (Chicago, IL), which is developing products for risk stratification of hospitalized patients. Drs. Churpek and Wendlandt had full access to all the data in the study and take responsibility for the integrity of the data and the accuracy of the data analysis. Preliminary versions of these data were presented at the 2015 meeting of the Society of Hospital Medicine (March 31, 2015, National Harbor, MD).
- , , , , . Inpatient transfers to the intensive care unit: delays are associated with increased mortality and morbidity. J Gen Intern Med. 2003;18(2):77–83.
- , , , et al. Confidential inquiry into quality of care before admission to intensive care. BMJ. 1998;316(7148):1853–1858.
- , , , , , . Relationship between ICU bed availability, ICU readmission, and cardiac arrest in the general wards. Crit Care Med. 2014;42(9):2037–2041.
- , , , et al. Survival of critically ill patients hospitalized in and out of intensive care units under paucity of intensive care unit beds. Crit Care Med. 2004;32(8):1654–1661.
- , , , et al. Refusal of intensive care unit admission due to a full unit: impact on mortality. Am J Respir Crit Care Med. 2012;185(10):1081–1087.
- , , , et al. Evaluation of triage decisions for intensive care admission. Crit Care Med. 1999;27(6):1073–1079.
- , , , et al. Predictors of intensive care unit refusal in French intensive care units: a multiple‐center study. Crit Care Med. 2005;33(4):750–755.
- , , , . Acute Physiology and Chronic Health Evaluation (APACHE) IV: hospital mortality assessment for today's critically ill patients. Crit Care Med. 2006;34(5):1297–1310.
- , , , et al. Impact of delayed admission to intensive care units on mortality of critically ill patients: a cohort study. Crit Care. 2011;15(1):R28.
- , , , et al. Reasons for refusal of admission to intensive care and impact on mortality. Intensive Care Med. 2010;36(10):1772–1779.
- , , , et al. Incidence, location and reasons for avoidable in‐hospital cardiac arrest in a district general hospital. Resuscitation. 2002;54(2):115–123.
- , , . Risk stratification of hospitalized patients on the wards. Chest. 2013;143(6):1758–1765.
- , , , et al. Multicenter development and validation of a risk stratification tool for ward patients. Am J Respir Crit Care Med. 2014;190(6):649–655.
- , , , et al. Early goal‐directed therapy in the treatment of severe sepsis and septic shock. N Engl J Med. 2001;345(19):1368–1377.
- , , , et al. Surviving sepsis campaign: international guidelines for management of severe sepsis and septic shock: 2012. Crit Care Med. 2013;41(2):580–637.
- , , , et al. Outcomes of patients considered for, but not admitted to, the intensive care unit. Crit Care Med. 2008;36(3):812–817.
- , , . Mortality among appropriately referred patients refused admission to intensive‐care units. Lancet. 1997;350(9070):7–11.
- , , , , . Differences in vital signs between elderly and nonelderly patients prior to ward cardiac arrest. Crit Care Med. 2015;43(4):816–822.
- , , , , , . Real‐time risk prediction on the wards: a feasibility study [published April 13, 2016]. Crit Care Med. doi: 10.1097/CCM.0000000000001716.
- , , , et al. Should age be included as a component of track and trigger systems used to identify sick adult patients? Resuscitation. 2008;78(2):109–115.
- , , , et al. Worthing physiological scoring system: derivation and validation of a physiological early‐warning system for medical admissions. An observational, population‐based single‐centre study. Br J Anaesth. 2007;98(6):769–774.
- , , , . Validation of a modified Early Warning Score in medical admissions. QJM. 2001;94(10):521–526.
- , , , et al. Introduction of the medical emergency team (MET) system: a cluster‐randomised controlled trial. Lancet. 2005;365(9477):2091–2097.
Patients on hospital wards may become critically ill due to worsening of the underlying condition that was the cause of their admission or acquisition of a new hospital‐acquired illness. Once physiologic deterioration occurs, some patients are evaluated and quickly transferred to the intensive care unit (ICU), whereas others are left on the wards until further deterioration occurs. Because many critical illness syndromes benefit from early intervention, such as sepsis and respiratory failure, early transfer to the ICU for treatment may improve patient outcomes, and conversely, delays in ICU transfer may lead to increased mortality and length of stay (LOS) in critically ill ward patients.[1, 2] However, the timeliness of that transfer is dependent on numerous changing variables, such as ICU bed availability, clinician identification of the deterioration, and clinical judgment regarding the appropriate transfer thresholds.[2, 3, 4, 5, 6, 7] As a result, there is a large degree of heterogeneity in the severity of illness of patients at the time of ICU transfer and in patient outcomes.[6, 8]
Previous studies investigating the association between delayed ICU transfer and patient outcomes have typically utilized the time of consultation by the ICU team to denote the onset of critical illness.[5, 6, 9, 10] However, the decision to transfer a patient to the ICU is often subjective, and previous studies have found an alarmingly high rate of errors in diagnosis and management of critically ill ward patients, including the failure to call for help.[2, 11] Therefore, a more objective tool for quantifying critical illness is necessary for determining the onset of critical illness and quantifying the association of transfer delay with patient outcomes.
Early warning scores, which are designed to detect critical illness on the wards, represent objective measures of critical illness that can be easily calculated in ward patients.[12] The aim of this study was to utilize the electronic Cardiac Arrest Risk Triage (eCART) score, a previously published, statistically derived early warning score that utilizes demographic, vital sign, and laboratory data, as an objective measure of critical illness to estimate the effect of delayed ICU transfer on patient outcomes in a large, multicenter database.[13] We chose 6 hours as the cutoff for delay in this study a priori because it is a threshold noted to be an important time period in critical illness syndromes, such as sepsis.[14, 15]
METHODS
All patients admitted to the medical‐surgical wards at 5 hospitals between November 2008 and January 2013 were eligible for inclusion in this observational cohort study. Further details of the hospital populations have been previously described.[13] A waiver of consent was granted by NorthShore University HealthSystem (IRB #EH11‐258) and the University of Chicago Institutional Review Board (IRB #16995A) based on general impracticability and minimal harm. Collection of patient information was designed to comply with the Health Insurance Portability and Accountability Act of 1996 (HIPAA) regulations.
Defining the Onset of Critical Illness
The eCART score, a statistically derived early warning score that is calculated based on patient demographic, vital sign, and laboratory data, was used as an objective measure of critical illness.[13] Score calculation was performed utilizing demographic information from administrative databases and time‐ and location‐stamped vital signs and laboratory results from data warehouses at the respective institutions. In this study, a score was calculated for each time‐stamped point in the entire dataset. Of note, eCART was not used in this population for patient care as this was a retrospective observational study. An eCART score at the 95% specificity cutoff for ICU transfer from the entire dataset defined a ward patient as critically ill, a definition created a priori and before any data analysis was performed.
Defining ICU Transfer Delay and Study Outcomes
The period of time from when a patient first reached this predefined eCART score to ICU transfer was calculated for each patient, up to a maximum of 24 hours. Transfer to the ICU greater than 6 hours after reaching the critical eCART score was defined a priori as a delayed transfer to allow comparisons between patients with nondelayed and delayed transfer. A patient who suffered a ward cardiac arrest with attempted resuscitation was counted as an ICU transfer at the time of arrest. If a patient experienced more than 1 ICU transfer during the admission, then only the first ward to ICU transfer was used. The primary outcome of the study was in‐hospital mortality, and secondary outcomes were ICU mortality and hospital LOS.
Statistical Analysis
Patient characteristics were compared between patients who experienced delayed and nondelayed ICU transfers using t tests, Wilcoxon rank sums, and [2] tests, as appropriate. The association between length of transfer delay and in‐hospital mortality was calculated using logistic regression, with adjustment for age, sex, and surgical status. In a post hoc sensitivity analysis, additional adjustments were made using each patient's first eCART score on the ward, the individual vital signs and laboratory variables from eCART, and whether the ICU transfer was due to a cardiac arrest on the wards. In addition, an interaction term between time to transfer and the initial eCART on the ward was added to determine if the association between delay and mortality varied by baseline severity. The change in eCART score over time was plotted from 12 hours before the time of first reaching the critical value until ICU transfer for those in the delayed and nondelayed groups using restricted cubic splines to compare the trajectories of severity of illness between these 2 groups. In addition, a linear regression model was fit to investigate the association between the eCART slope in the 8 hours prior to the critical eCART value until ICU transfer and the timing of ICU transfer delay. Statistical analyses were performed using Stata version 12.1 (StataCorp, College Station, TX), and all tests of significance used a 2‐sided P<0.05.
RESULTS
A total of 269,999 admissions had documented vital signs on the hospital wards during the study period, including 11,995 patients who were either transferred from the wards to the ICU (n=11,636) or who suffered a cardiac arrest on the wards (n=359) during their initial ward stay. Of these patients, 3789 reached an eCART score at the 95% specificity cutoff (critical eCART score of 60) within 24 hours of transfer. The median time from first critical eCART value to ICU transfer was 5.4 hours (interquartile range (IQR), 214 hours; mean, 8 hours). Compared to patients without delayed ICU transfer, those with delayed transfer were slightly older (median age, 73 [IQR, 6083] years vs 71 [IQR, 5882] years; P=0.002), whereas all other characteristics were similar (Table 1). Table 2 shows comparisons of vital sign and laboratory results for delayed and nondelayed transfers at the time of ICU transfer. As shown, patients with delayed transfer had lower median respiratory rate, blood pressure, heart rate, and hemoglobin, but higher median white blood cell count and creatinine.
| Characteristic | Transferred Within 6 Hours, n=2,055 | Transfer Delayed, n=1,734 | P Value |
|---|---|---|---|
| |||
| Age, median (IQR), y | 71 (5882) | 73 (6083) | 0.002 |
| Female sex, n (%) | 1,018 (49.5) | 847 (48.8) | 0.67 |
| Race, n (%) | 0.72 | ||
| Black | 467 (22.7) | 374 (21.6) | |
| White | 1,141 (55.5) | 971 (56.0) | |
| Other/unknown | 447 (21.8) | 389 (22.4) | |
| Surgical patient, n (%) | 572 (27.8) | 438 (25.2) | 0.07 |
| Hospital LOS prior to first critical eCART, median (IQR), d | 1.5 (0.33.7) | 1.6 (0.43.9) | 0.04 |
| Total hospital LOS, median (IQR), d* | 11 (719) | 13 (821) | <0.001 |
| Died during admission, n (%) | 503 (24.5) | 576 (33.2) | <0.001 |
| Transferred Within 6 Hours, n=2,055 | Transfer Delayed, n=1,734 | P Value | |
|---|---|---|---|
| |||
| Respiratory rate, breaths/min | 23 (1830) | 22 (1828) | <0.001 |
| Systolic blood pressure, mm Hg | 111 (92134) | 109 (92128) | 0.002 |
| Diastolic blood pressure, mm Hg | 61 (5075) | 59 (4971) | <0.001 |
| Heart rate, beats/min | 106 (88124) | 101 (85117) | <0.001 |
| Oxygen saturation, median (IQR), % | 97 (9499) | 97 (9599) | 0.15 |
| Temperature, F | 98.0 (97.299.1) | 98.0 (97.199.0) | 0.001 |
| Alert mental status, number of observations (%) | 1,749 (85%) | 1,431 (83%) | <0.001 |
| eCART score at time of ICU transfer | 61 (26122) | 48 (21121) | 0.914 |
| WBC | 10.3 (7.514.5) | 11.7 (8.117.0) | <0.001 |
| Hemoglobin | 10.7 (9.312.0) | 10.3 (9.111.6) | <0.001 |
| Platelet | 215 (137275) | 195 (120269) | 0.017 |
| Sodium | 137 (134140) | 137 (134141) | 0.70 |
| K+ | 4.1 (3.84.6) | 4.2 (3.84.7) | 0.006 |
| Anion Gap | 10 (813) | 10 (814) | <0.001 |
| CO2 | 24 (2026) | 23 (1826) | <0.001 |
| BUN | 24 (1640) | 32 (1853) | <0.001 |
| Cr | 1.2 (0.92.0) | 1.5 (1.02.7) | <0.001 |
| GFR | 70 (7070) | 70 (5170) | <0.001 |
| Glucose | 123 (106161) | 129 (105164) | 0.48 |
| Calcium | 8.5 (7.98.8) | 8.2 (7.78.7) | <0.001 |
| SGOT | 26 (2635) | 26 (2644) | 0.001 |
| SGPT | 21 (2127) | 21 (2033) | 0.002 |
| Total bilirubin | 0.7 (0.71.0) | 0.7 (0.71.3) | <0.001 |
| Alk phos | 80 (8096) | 80 (79111) | 0.175 |
| Albumin | 3.0 (2.73.0) | 3.0 (2.43.0) | <0.001 |
Delayed transfer occurred in 46% of patients (n=1734) and was associated with increased in‐hospital mortality (33.2% vs 24.5%, P<0.001). This relationship was linear, with each 1‐hour increase in transfer delay associated with a 3% increase in the odds of in‐hospital death (P<0.001) (Figure 1). The association between length of transfer delay and hospital mortality remained unchanged after controlling for age, sex, surgical status, initial eCART score on the wards, vital signs, laboratory values, and whether the ICU transfer was due to a cardiac arrest (3% increase per hour, P<0.001). This association did not vary based on the initial eCART score on the wards (P=0.71 for interaction). Additionally, despite having similar median hospital lengths of stay prior to first critical eCART score (1.6 vs 1.5 days, P=0.04), patients experiencing delayed ICU transfer who survived to discharge had a longer median hospital LOS by 2 days compared to those with nondelayed transfer who survived to discharge (median LOS, 13 (821) days vs 11 (719) days, P=0.01). The change in eCART score over time in the 12 hours before first reaching the critical eCART score until ICU transfer is shown in Figure 2 for patients with delayed and nondelayed transfer. As shown, patients transferred within 6 hours had a more rapid rise in eCART score prior to ICU transfer compared to those with a delayed transfer. This difference in trajectories between delayed and nondelayed patients was similar in patients with low (<13), intermediate (1359), and high (60) initial eCART scores on the wards. A regression model investigating the association between eCART slope prior to ICU transfer and time to ICU transfer demonstrated that a steeper slope was significantly associated with a decreased time to ICU transfer (P<0.01).
DISCUSSION
We found that a delay in transfer to the ICU after reaching a predefined objective threshold of critical illness was associated with a significant increase in hospital mortality and hospital LOS. We also discovered a significant association between critical illness trajectory and delays in transfer, suggesting that caregivers may not recognize more subtle trends in critical illness. This work highlights the importance of timely transfer to the ICU for critically ill ward patients, which can be affected by several factors such as ICU bed availability and caregiver recognition and triage decisions. Our findings have significant implications for patient safety on the wards and provide further evidence for implementing early warning scores into practice to aid with clinical decision making.
Our findings of increased mortality with delayed ICU transfer are consistent with previous studies.[1, 5, 9] For example, Young et al. compared ICU mortality between delayed and nondelayed transfers in 91 consecutive patients with noncardiac diagnoses at a community hospital.[1] They also used predefined criteria for critical illness, and found that delayed transfers had a higher ICU mortality than nondelayed patients (41% vs 11%). However, their criteria for critical illness only had a specificity of 13% for predicting ICU transfer, compared to 95% in our study, suggesting that our threshold is more consistent with critical illness. Another study, by Cardoso and colleagues, investigated the impact of delayed ICU admission due to bed shortages on ICU mortality in 401 patients at a university hospital.[9] Of those patients deemed appropriate for transfer to the ICU but who had to wait for a bed to become available, the median wait time for a bed was 18 hours. They found that each hour of waiting was associated with a 1.5% increase in ICU death. A similar study by Robert and colleagues investigated the impact of delayed or refused ICU admission due to a lack of bed availability.[5] Patients deemed too sick (or too well) to benefit from ICU transfer were excluded. Twenty‐eightday and 60‐day mortality were higher in the admitted group compared to those not admitted, although this finding was not statistically significant. In addition, patients later admitted to the ICU once a bed became available (median wait time, 6 hours; n=89) had higher 28‐day mortality than those admitted immediately (adjusted odds ratio, 1.78; P=0.05). Several other studies have investigated the impact of ICU refusal for reasons that included bed shortages, and found increased mortality in those not admitted to the ICU.[16, 17] However, many of these studies included patients deemed too sick or too well to be transferred to the ICU in the group of nonadmitted patients. Our study adds to this literature by utilizing a highly specific objective measure of critical illness and by including all patients on the wards who reached this threshold, rather than only those for whom a consult was requested.
There are several potential explanations for our finding of increased mortality with delayed ICU transfer. First, those with delayed transfer might be different in some way from those transferred immediately. For example, we found that those with delayed transfer were older. The finding that increasing age is associated with a delay in ICU transfer is interesting, and may reflect physiologic differences in older patients compared to younger ones. For example, older patients have a lower maximum heart rate and thus may not develop the same level of vital sign abnormalities that younger patients do, causing them to be inappropriately left on the wards for too long.[18] In addition, patients with delayed transfer had more deranged renal function and lower blood pressure. It is unknown whether these organ dysfunctions would have been prevented by earlier transfer and to what degree they were related to chronic conditions. However, delayed transfer was still associated with increased mortality even after controlling for age, vital sign and laboratory values, and eCART on ward admission. It may also be possible that patients with delayed transfer received early and appropriate treatment on the wards but failed to improve and thus required ICU transfer. We did not have access to orders in this large database, so this theory will need to be investigated in future work. Finally, the most likely explanation for our findings is that earlier identification and treatment improves outcomes of critically ill patients on the wards, which is consistent with the findings of previous studies.[1, 5, 9, 10] Our study demonstrates that early identification of critical illness is crucial, and that delayed treatment can rapidly lead to increased mortality and LOS.
Our comparison of eCART score trajectory showed that patients transferred within 6 hours of onset of critical illness had a more rapid rise in eCART score over the preceding time period, whereas patients who experienced transfer delay showed a slower increase in eCART score. One explanation for this finding is that patients who decompensate more rapidly are in turn more readily recognizable to providers, whereas patients who experience a more insidious clinical deterioration are recognized later in the process, which then leads to a delay in escalation of care. This hypothesis underlines the importance of utilizing an objective marker of illness that is calculated longitudinally and in real time, as opposed to relying upon provider recognition alone. In fact, we have recently demonstrated that eCART is more accurate and identifies patients earlier than standard rapid response team activation.[19]
There are several important implications of our findings. First, it highlights the potential impact that early warning scores, particular those that are evidence based, can have on the outcomes of hospitalized patients. Second, it suggests that it is important to include age in early warning scores. Previous studies have been mixed as to whether the inclusion of age improves detection of outcomes on the wards, although the method of inclusion of age has been variable in terms of its weighting.[20, 21, 22] Our study found that older patients were more likely to be left on the wards longer prior to ICU transfer after becoming critically ill. By incorporating age into early warning scores, both accuracy and early recognition of critical illness may be improved. Finally, our finding that the trends of the eCART score differed among patients who were immediately transferred to the ICU, and who had a delay in their transfer, suggests that adding vital sign trends to early warning scores may further improve their accuracy and ability to serve as clinical decision support tools.
Our study is unique in that we used an objective measure of critical illness and then examined outcomes after patients reached this threshold on the wards. This overcomes the subjectivity of using evaluation by the ICU team or rapid response team as the starting point, as previous studies have shown a failure to call for help when patients become critically ill on the wards.[2, 11, 23] By using the eCART score, which contains commonly collected electronic health record data and can be calculated electronically in real time, we were able to calculate the score for patients on the wards and in the ICU. This allowed us to examine trends in the eCART score over time to find clues as to why some patients are transferred late to the ICU and why these late transfers have worse outcomes than those transferred earlier. Another strength is the large multicenter database used for the analysis, which included an urban tertiary care hospital, suburban teaching hospitals, and a community nonteaching hospital.
Our study has several limitations. First, we utilized just 1 of many potential measures of critical illness and a cutoff that only included one‐third of patients ultimately transferred to the ICU. However, by using the eCART score, we were able to track a patient's physiologic status over time and remove the variability that comes with using subjective definitions of critical illness. Furthermore, we utilized a high‐specificity cutoff for eCART to ensure that transferred patients had significantly deranged physiology and to avoid including planned transfers to the ICU. It is likely that some patients who were critically ill with less deranged physiology that would have benefitted from earlier transfer were excluded from the study. Second, we were unable to determine the cause of physiologic deterioration for patients in our study due to the large number of included patients. In addition, we did not have code status, comorbidities, or reason for ICU admission available in the dataset. It is likely that the impact of delayed transfer varies by the indication for ICU admission and chronic disease burden. It is also possible that controlling for these unmeasured factors could negate the beneficial association seen for earlier ICU admission. However, our finding of such a strong relationship between time to transfer and mortality after controlling for several important variables suggests that early recognition of critical illness is beneficial to many patients on the wards. Third, due to its observational nature, our study cannot estimate the true impact of timely ICU transfer on critically ill ward patient outcomes. Future clinical trials will be needed to determine the impact of electronic early warning scores on patient outcomes.
In conclusion, delayed ICU transfer is associated with significantly increased hospital LOS and mortality. This association highlights the need for ongoing work toward both the implementation of an evidence‐based risk stratification tool as well as development of effective critical care outreach resources for patients decompensating on the wards. Real‐time use of a validated early warning score, such as eCART, could potentially lead to more timely ICU transfer for critically ill patients and reduced rates of preventable in‐hospital death.
Acknowledgements
The authors thank Timothy Holper, Justin Lakeman, and Contessa Hsu for assistance with data extraction and technical support; Poome Chamnankit, MS, CNP, Kelly Bhatia, MSN, ACNP, and Audrey Seitman, MSN, ACNP for performing manual chart review of cardiac arrest patients; and Nicole Twu for administrative support.
Disclosures: This research was funded in part by an institutional Clinical and Translational Science Award grant (UL1 RR024999, PI: Dr. Julian Solway). Dr. Churpek is supported by a career development award from the National Heart, Lung, and Blood Institute (K08 HL121080). Drs. Churpek and Edelson have a patent pending (ARCD. P0535US.P2) for risk stratification algorithms for hospitalized patients. In addition, Dr. Edelson has received research support from Philips Healthcare (Andover, MA), the American Heart Association (Dallas, TX), and Laerdal Medical (Stavanger, Norway). She has ownership interest in Quant HC (Chicago, IL), which is developing products for risk stratification of hospitalized patients. Drs. Churpek and Wendlandt had full access to all the data in the study and take responsibility for the integrity of the data and the accuracy of the data analysis. Preliminary versions of these data were presented at the 2015 meeting of the Society of Hospital Medicine (March 31, 2015, National Harbor, MD).
- , , , , . Inpatient transfers to the intensive care unit: delays are associated with increased mortality and morbidity. J Gen Intern Med. 2003;18(2):77–83.
- , , , et al. Confidential inquiry into quality of care before admission to intensive care. BMJ. 1998;316(7148):1853–1858.
- , , , , , . Relationship between ICU bed availability, ICU readmission, and cardiac arrest in the general wards. Crit Care Med. 2014;42(9):2037–2041.
- , , , et al. Survival of critically ill patients hospitalized in and out of intensive care units under paucity of intensive care unit beds. Crit Care Med. 2004;32(8):1654–1661.
- , , , et al. Refusal of intensive care unit admission due to a full unit: impact on mortality. Am J Respir Crit Care Med. 2012;185(10):1081–1087.
- , , , et al. Evaluation of triage decisions for intensive care admission. Crit Care Med. 1999;27(6):1073–1079.
- , , , et al. Predictors of intensive care unit refusal in French intensive care units: a multiple‐center study. Crit Care Med. 2005;33(4):750–755.
- , , , . Acute Physiology and Chronic Health Evaluation (APACHE) IV: hospital mortality assessment for today's critically ill patients. Crit Care Med. 2006;34(5):1297–1310.
- , , , et al. Impact of delayed admission to intensive care units on mortality of critically ill patients: a cohort study. Crit Care. 2011;15(1):R28.
- , , , et al. Reasons for refusal of admission to intensive care and impact on mortality. Intensive Care Med. 2010;36(10):1772–1779.
- , , , et al. Incidence, location and reasons for avoidable in‐hospital cardiac arrest in a district general hospital. Resuscitation. 2002;54(2):115–123.
- , , . Risk stratification of hospitalized patients on the wards. Chest. 2013;143(6):1758–1765.
- , , , et al. Multicenter development and validation of a risk stratification tool for ward patients. Am J Respir Crit Care Med. 2014;190(6):649–655.
- , , , et al. Early goal‐directed therapy in the treatment of severe sepsis and septic shock. N Engl J Med. 2001;345(19):1368–1377.
- , , , et al. Surviving sepsis campaign: international guidelines for management of severe sepsis and septic shock: 2012. Crit Care Med. 2013;41(2):580–637.
- , , , et al. Outcomes of patients considered for, but not admitted to, the intensive care unit. Crit Care Med. 2008;36(3):812–817.
- , , . Mortality among appropriately referred patients refused admission to intensive‐care units. Lancet. 1997;350(9070):7–11.
- , , , , . Differences in vital signs between elderly and nonelderly patients prior to ward cardiac arrest. Crit Care Med. 2015;43(4):816–822.
- , , , , , . Real‐time risk prediction on the wards: a feasibility study [published April 13, 2016]. Crit Care Med. doi: 10.1097/CCM.0000000000001716.
- , , , et al. Should age be included as a component of track and trigger systems used to identify sick adult patients? Resuscitation. 2008;78(2):109–115.
- , , , et al. Worthing physiological scoring system: derivation and validation of a physiological early‐warning system for medical admissions. An observational, population‐based single‐centre study. Br J Anaesth. 2007;98(6):769–774.
- , , , . Validation of a modified Early Warning Score in medical admissions. QJM. 2001;94(10):521–526.
- , , , et al. Introduction of the medical emergency team (MET) system: a cluster‐randomised controlled trial. Lancet. 2005;365(9477):2091–2097.

Electronic Assessment of Mental Status
Altered mental status (AMS) is a complex spectrum of cognitive deficits that includes orientation, memory, language, visuospatial ability, and perception.[1] The clinical definitions of both delirium and dementia include AMS as a hallmark clinical prerequisite. Regardless of etiology, this broader AMS definition is particularly salient in the hospital setting, where AMS is present in up to 60% of inpatients and is associated with longer hospital stay as well as increased morbidity and mortality.[2, 3] Not surprisingly, due to the complexity of identifying and assessing changes in mental status, clinically relevant AMS is often undetected among inpatients.[2] However, when detected, the most common causes of AMS (infection, polypharmacy, and pain) are treatable, suggesting that early AMS identification could alert clinicians to early signs of clinical decompensation, potentially improving clinical outcomes.[4]
Because rapid and systemic clinical detection of AMS is limited by the complexity of mental status, a number of assessments have been created, each with their own advantages, limitations, and target populations. These assessments are often limited by time‐intensive administration, subjectivity of mental status assessment, and lack of sensitivity in general medicine patients. Time‐intensive measures, such as the Short Portable Mental Status Questionnaire (SPMSQ) have utility in the research setting, whereas current common clinical risk stratification tools (eg, National Early Warning Score) utilize simpler measures such as the Alert, Voice, Pain, Unresponsive (AVPU) and Glasgow Coma Scale (GCS) as measures of mental status.[2, 5, 6, 7, 8, 9]
To address the need for a brief, clinically feasible, accurate tool in clinical detection of AMS, our group developed a mobile application for working memory testing, the Functional Assessment of Mentation (FAMTM). In this study, we aimed to identify baseline scoring distributions of the FAMTM in a nonhospitalized subgroup, as well as assess the correlation of the FAMTM to discharge disposition and compare it to the SPMSQ in inpatients.
METHODS
Study Design
We conducted a prospective observational study. Data were collected from both hospitalized and nonhospitalized adult participants as 2 distinct subgroups. Nonhospitalized adult subjects were recruited from a university medical campus (June 2013July 2013; IRB‐12‐0175). Hospitalized participants were recruited from the general medicine service as part of an ongoing study measuring quality of care and resource allocation at the same academic medical center (June 2014August 2014; IRB‐9967).[10]
FAMTM Application
The FAMTM application is a bedside tool for working memory assessment developed for the iPhone mobile operating system (Apple Inc., Cupertino, CA) and presented on an iPad mini (Apple). The application interface displays 4 colored rectangles individually labeled with a number (see Supporting Figure 1 in the online version of this article). The testing portion of the application presents a sequence of numbered rectangles, illuminated 1 at a time in random order. Subjects are prompted first to watch and remember the sequence and then repeat the sequence by touching the screen within each numbered rectangle. Successful reproduction of the sequence is followed by a distinct and longer sequence, whereas unsuccessful attempts are followed by a shorter sequence. The final FAMTM score corresponds to the longest sequence of rectangles successfully repeated by the subject.
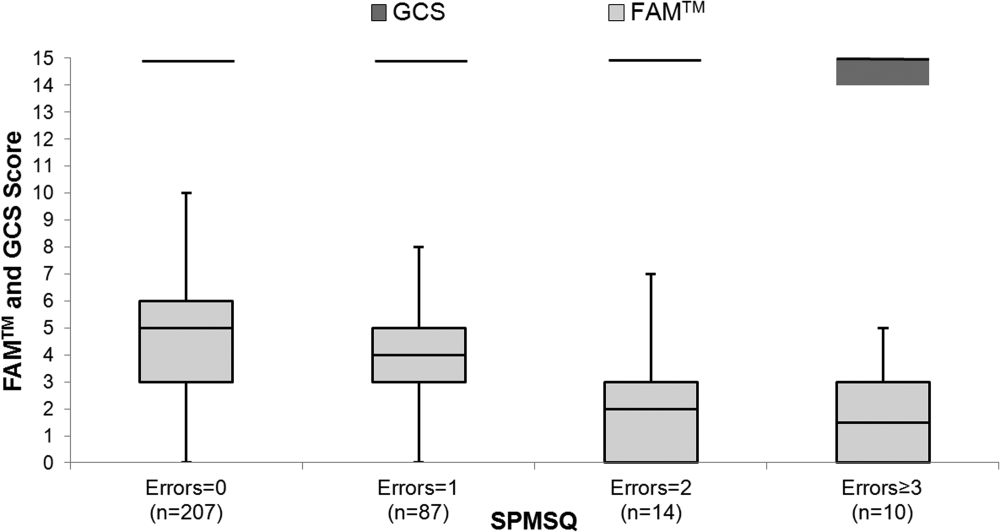
Data Collection
In the nonhospitalized subject population, research assistants collected demographic data immediately prior to FAMTM administration. Among hospitalized subjects, GCS information was collected by nursing staff as part of standard clinical care. One research assistant administered the SPMSQ while a second assistant, blinded to the SPMSQ and GCS scores, administered the FAMTM. Clinical data were obtained from medical records (EPIC Systems Corp., Verona, WI). Discharge disposition was dichotomized as discharged home or not.
Statistical Analyses
Demographic characteristics of the 2 subject populations were compared using Student t tests (continuous variables) and 2 tests (categorical variables). Score distribution and discharge disposition comparison was conducted with the Mann‐Whitney U test and area under receiver operating characteristic curve (AUC) analysis, using the trapezoidal rule.[11] Multivariable linear regression was used to investigate the impact of age, race, education, discharge disposition, and hospitalization status on patient scores and times. Correlations between the FAMTM and SPMSQ scores and between the GCS and SPMSQ scores were calculated using the Spearman rank test. Significance was set at a 2‐sided P value of <0.05. Analyses were conducted using Stata version 13.1 (StataCorp, College Station, TX).
RESULTS
A total of 931 subjects were enrolled in the study. In the nonhospitalized subgroup, 651 consented to study participation and 612 were included in final analysis. Subjects were excluded if they started but did not complete the application (n = 36) or were under the age of 18 years (n = 3). Of the 363 hospitalized subjects approached for enrollment, 319 were included in the final analysis. Subjects were excluded if they refused to participate (n = 23), were under the age of 18 (n = 2), had technical failures (n = 5), or had physical or visual limitations that precluded them from participation (n = 14). Within the hospitalized subgroup, 268 subjects were discharged home (85%). The table displays demographics and score distributions by subgroup.1
| Nonhospitalized Subjects, n = 612 | Hospitalized Subjects Discharged Home, n = 268 | Hospitalized Subjects Discharged Elsewhere, n = 48 | P Value | |
|---|---|---|---|---|
| ||||
| Age, y | 52 18 | 52 19 | 62 17 | <0.001 |
| Female sex | 343 (56%) | 158 (59%) | 26 (54%) | 0.63 |
| Education | <0.001 | |||
| Less than high school graduate | 31 (5%) | 32 (12%) | 7 (15%) | |
| High school graduate | 312 (51%) | 153 (57%) | 26 (54%) | |
| College graduate | 263 (43%) | 43 (16%) | 8 (17%) | |
| Missing | 6 (1%) | 40 (15%) | 7 (15%) | |
| Race | <0.001 | |||
| Black | 196 (32%) | 185 (69%) | 34 (71%) | |
| White | 324 (53%) | 75 (28%) | 13 (27%) | |
| Other | 86 (14%) | 4 (1%) | 4 (1%) | |
| Missing | 6 (1%) | 4 (1%) | 0 (0%) | |
| FAMTM score, median (IQR) | 5 (47) | 5 (36) | 3 (15) | <0.001 |
The median FAMTM score for the combined study population was 5 (interquartile range [IQR] 36), and median time to completion was 55 seconds (IQR 4567 seconds). A graded reduction was found in the FAMTM score for all stepwise comparisons between nonhospitalized subjects, hospitalized subjects discharged home, and hospitalized subjects not discharged home (median 5 [IQR 47] vs 5 [IQR 36] vs 3 [IQR 15]; P < 0.001 for all pairwise comparisons). The AUC for the FAMTM predicting discharge disposition (home vs not) was 0.66 (95% confidence interval [CI]: 0.58‐0.74]. After adjusting for confounders, higher FAMTM scores were independently associated with not being hospitalized, being discharged home, higher levels of education, younger age, and white race (see Supporting Table 1 in the online version of this article). Additionally, in the hospitalized subgroup, decreasing FAMTM score was significantly correlated with increasing errors on the SPMSQ (Spearman = 0.27, P < 0.001), whereas the GCS score was not correlated with the SPMSQ (Spearman = 0.05, P = 0.40) (Figure 1).
DISCUSSION
We demonstrated the utility of a rapid and accurate mobile application for assessment of mental status. The FAMTM was able to be quickly administered with a median time to completion of approximately 1 minute. The ability to detect mild alterations in mental status was shown through concurrent validity by FAMTM correlation with the SPMSQ and predictive validity with the association between the FAMTM and discharge disposition. Our study highlights the potential for the FAMTM to be used as a sensitive marker of AMS.
The novel design of the FAMTM presents unique advantages compared to current mental status testing. First, the FAMTM could allow patients with hearing impairment or language barriers to complete a mental status assessment. Additionally, the approximately 1‐minute median time to completion is much faster than other established mental status assessments including the SPMSQ (510 minutes). Compared to the SPMSQ taking 5 minutes, in a 400‐bed hospital, taken once per nursing shift, the FAMTM would save approximately 20,000 hours and 10 nursing full‐time equivalents per year.[5] Finally, many current mental status tests such as the Confusion Assessment Model utilize subjective mental status assessments.[2] However, the FAMTM is designed to be conducted through self‐assessment and, thus, could theoretically be free of observer bias. This potential for self‐administration expands beyond other proposed alternative testing mechanisms of the AMS such as ultrabrief assessments that include items such as asking subjects the months of the year backwards, and what is the day of the week?, and assessing arousal.[12, 13, 14]
In research settings and commonly in hospitals, the GCS and AVPU are used clinically for mental status assessment of hospitalized patients.[6, 15] However, similar to previous literature, our study found that the vast majority of hospitalized patients were defined as neurologically intact by the GCS, which is the more accurate predictor of the 2.[7] One major strength of the FAMTM was that it identified an extensive gradation of scores for patients previously labeled as merely alert, providing greater resolution than the GCS in quantifying mental status.
One of the key benefits of the FAMTM is that it can be measured longitudinally over the course of a patient's hospital stay. Therefore, once a baseline FAMTM score is established, variation from the patient's personal baseline could indicate mental status deterioration, which would not be affected by the patient's demographics, health status, or underlying neurocognitive deficits.
There were important limitations to this study. First, limited generalizability of these data may exist due to the single‐center setting and patient population. However, this initial study provides pilot data for further expansion into the potential broad applicability of the FAMTM to other patient populations and settings. Additionally, the cost of large‐scale implementation of the FAMTM is unknown and was beyond the scope of this pilot study. However, to reduce costs, the FAMTM technology could be integrated into existing hospital technology infrastructure. Finally, the scope of this study prevented a complete assessment of all validity measures or comparison to other mental status assessments such as the digit span or serial sevens tests. However, predictive and concurrent validity were assessed with comparison by discharge disposition, SPMSQ, and GCS scores.
In conclusion, this pilot study identifies the FAMTM application as a potentially clinically useful, novel, rapid, and feasible assessment tool of mental status in a general medicine inpatient setting.
Acknowledgements
The authors thank Frank Zadravecz, MPH, for his support with this project.
Disclosures: This research was supported in part by a grant from the National Institutes of Health (NIA 2T35AG029795‐07) and in part by career development awards granted to Dr. Churpek, Dr. Edelson, and Dr. Press by the National Heart, Lung, and Blood Institute (K08 HL121080, K23 HL097157, and K23 HL118151, respectively). Dr. Churpek has received honoraria from Chest for invited speaking engagements. Drs. Churpek and Edelson have a patent pending (ARCD. P0535US.P2) for risk stratification algorithms for hospitalized patients. In addition, Dr. Edelson has received research support from Philips Healthcare (Andover, MA), the American Heart Association (Dallas, TX), and Laerdal Medical (Stavanger, Norway). She has ownership interest in Quant HC (Chicago, IL), which is developing products for risk stratification of hospitalized patients. All other authors report no potential conflicts of interest.
- , . Altered mental status in older patients in the emergency department. Clin Geriatr Med. 2013;29(1):101–136.
- , , , , , . Clarifying confusion: the confusion assessment method. A new method for detection of delirium. Ann Intern Med. 1990;113(12):941–948.
- , , , , . Association between clinically abnormal observations and subsequent in‐hospital mortality: a prospective study. Resuscitation. 2004;62(2):137–141.
- , , . Early recognition of delirium: review of the literature. J Clin Nurs. 2001;10(6):721–729.
- . A short portable mental status questionnaire for the assessment of organic brain deficit in elderly patients. J Am Geriatr Soc. 1975;23(10):433–441.
- , , , , . The ability of the National Early Warning Score (NEWS) to discriminate patients at risk of early cardiac arrest, unanticipated intensive care unit admission, and death. Resuscitation. 2013;84(4):465–470.
- , , , et al. Comparison of mental‐status scales for predicting mortality on the general wards. J Hosp Med. 2015;10(10):658–663.
- , . Assessment of coma and impaired consciousness: a practical scale. Lancet. 1974;304(7872):81–84.
- , , , . Short Portable Mental Status Questionnaire as a Screening Test for Dementia and Delirium Among the Elderly. J Am Geriatr Soc. 1987;35(5):412–416.
- , , , et al. Effects of physician experience on costs and outcomes on an academic general medicine service: results of a trial of hospitalists. Ann Intern Med. 2002;137(11):866–874.
- , , . Comparing the areas under two or more correlated receiver operating characteristic curves: a nonparametric approach. Biometrics. 1988;44(3):837–845.
- , , , et al. Preliminary development of an ultrabrief two‐item bedside test for delirium. J Hosp Med. 2015;10(10):645–650.
- , , , , , . The association between an ultrabrief cognitive screening in older adults and hospital outcomes. J Hosp Med. 2015;10(10):651–657.
- , , , et al. Selecting optimal screening items for delirium: an application of item response theory. BMC Med Res Methodol. 2013;13:8.
- , , . Variability in agreement between physicians and nurses when measuring the Glasgow Coma Scale in the emergency department limits its clinical usefulness. Emerg Med Australas. 2006;18(4):379–384.
Altered mental status (AMS) is a complex spectrum of cognitive deficits that includes orientation, memory, language, visuospatial ability, and perception.[1] The clinical definitions of both delirium and dementia include AMS as a hallmark clinical prerequisite. Regardless of etiology, this broader AMS definition is particularly salient in the hospital setting, where AMS is present in up to 60% of inpatients and is associated with longer hospital stay as well as increased morbidity and mortality.[2, 3] Not surprisingly, due to the complexity of identifying and assessing changes in mental status, clinically relevant AMS is often undetected among inpatients.[2] However, when detected, the most common causes of AMS (infection, polypharmacy, and pain) are treatable, suggesting that early AMS identification could alert clinicians to early signs of clinical decompensation, potentially improving clinical outcomes.[4]
Because rapid and systemic clinical detection of AMS is limited by the complexity of mental status, a number of assessments have been created, each with their own advantages, limitations, and target populations. These assessments are often limited by time‐intensive administration, subjectivity of mental status assessment, and lack of sensitivity in general medicine patients. Time‐intensive measures, such as the Short Portable Mental Status Questionnaire (SPMSQ) have utility in the research setting, whereas current common clinical risk stratification tools (eg, National Early Warning Score) utilize simpler measures such as the Alert, Voice, Pain, Unresponsive (AVPU) and Glasgow Coma Scale (GCS) as measures of mental status.[2, 5, 6, 7, 8, 9]
To address the need for a brief, clinically feasible, accurate tool in clinical detection of AMS, our group developed a mobile application for working memory testing, the Functional Assessment of Mentation (FAMTM). In this study, we aimed to identify baseline scoring distributions of the FAMTM in a nonhospitalized subgroup, as well as assess the correlation of the FAMTM to discharge disposition and compare it to the SPMSQ in inpatients.
METHODS
Study Design
We conducted a prospective observational study. Data were collected from both hospitalized and nonhospitalized adult participants as 2 distinct subgroups. Nonhospitalized adult subjects were recruited from a university medical campus (June 2013July 2013; IRB‐12‐0175). Hospitalized participants were recruited from the general medicine service as part of an ongoing study measuring quality of care and resource allocation at the same academic medical center (June 2014August 2014; IRB‐9967).[10]
FAMTM Application
The FAMTM application is a bedside tool for working memory assessment developed for the iPhone mobile operating system (Apple Inc., Cupertino, CA) and presented on an iPad mini (Apple). The application interface displays 4 colored rectangles individually labeled with a number (see Supporting Figure 1 in the online version of this article). The testing portion of the application presents a sequence of numbered rectangles, illuminated 1 at a time in random order. Subjects are prompted first to watch and remember the sequence and then repeat the sequence by touching the screen within each numbered rectangle. Successful reproduction of the sequence is followed by a distinct and longer sequence, whereas unsuccessful attempts are followed by a shorter sequence. The final FAMTM score corresponds to the longest sequence of rectangles successfully repeated by the subject.
Data Collection
In the nonhospitalized subject population, research assistants collected demographic data immediately prior to FAMTM administration. Among hospitalized subjects, GCS information was collected by nursing staff as part of standard clinical care. One research assistant administered the SPMSQ while a second assistant, blinded to the SPMSQ and GCS scores, administered the FAMTM. Clinical data were obtained from medical records (EPIC Systems Corp., Verona, WI). Discharge disposition was dichotomized as discharged home or not.
Statistical Analyses
Demographic characteristics of the 2 subject populations were compared using Student t tests (continuous variables) and 2 tests (categorical variables). Score distribution and discharge disposition comparison was conducted with the Mann‐Whitney U test and area under receiver operating characteristic curve (AUC) analysis, using the trapezoidal rule.[11] Multivariable linear regression was used to investigate the impact of age, race, education, discharge disposition, and hospitalization status on patient scores and times. Correlations between the FAMTM and SPMSQ scores and between the GCS and SPMSQ scores were calculated using the Spearman rank test. Significance was set at a 2‐sided P value of <0.05. Analyses were conducted using Stata version 13.1 (StataCorp, College Station, TX).
RESULTS
A total of 931 subjects were enrolled in the study. In the nonhospitalized subgroup, 651 consented to study participation and 612 were included in final analysis. Subjects were excluded if they started but did not complete the application (n = 36) or were under the age of 18 years (n = 3). Of the 363 hospitalized subjects approached for enrollment, 319 were included in the final analysis. Subjects were excluded if they refused to participate (n = 23), were under the age of 18 (n = 2), had technical failures (n = 5), or had physical or visual limitations that precluded them from participation (n = 14). Within the hospitalized subgroup, 268 subjects were discharged home (85%). The table displays demographics and score distributions by subgroup.1
| Nonhospitalized Subjects, n = 612 | Hospitalized Subjects Discharged Home, n = 268 | Hospitalized Subjects Discharged Elsewhere, n = 48 | P Value | |
|---|---|---|---|---|
| ||||
| Age, y | 52 18 | 52 19 | 62 17 | <0.001 |
| Female sex | 343 (56%) | 158 (59%) | 26 (54%) | 0.63 |
| Education | <0.001 | |||
| Less than high school graduate | 31 (5%) | 32 (12%) | 7 (15%) | |
| High school graduate | 312 (51%) | 153 (57%) | 26 (54%) | |
| College graduate | 263 (43%) | 43 (16%) | 8 (17%) | |
| Missing | 6 (1%) | 40 (15%) | 7 (15%) | |
| Race | <0.001 | |||
| Black | 196 (32%) | 185 (69%) | 34 (71%) | |
| White | 324 (53%) | 75 (28%) | 13 (27%) | |
| Other | 86 (14%) | 4 (1%) | 4 (1%) | |
| Missing | 6 (1%) | 4 (1%) | 0 (0%) | |
| FAMTM score, median (IQR) | 5 (47) | 5 (36) | 3 (15) | <0.001 |
The median FAMTM score for the combined study population was 5 (interquartile range [IQR] 36), and median time to completion was 55 seconds (IQR 4567 seconds). A graded reduction was found in the FAMTM score for all stepwise comparisons between nonhospitalized subjects, hospitalized subjects discharged home, and hospitalized subjects not discharged home (median 5 [IQR 47] vs 5 [IQR 36] vs 3 [IQR 15]; P < 0.001 for all pairwise comparisons). The AUC for the FAMTM predicting discharge disposition (home vs not) was 0.66 (95% confidence interval [CI]: 0.58‐0.74]. After adjusting for confounders, higher FAMTM scores were independently associated with not being hospitalized, being discharged home, higher levels of education, younger age, and white race (see Supporting Table 1 in the online version of this article). Additionally, in the hospitalized subgroup, decreasing FAMTM score was significantly correlated with increasing errors on the SPMSQ (Spearman = 0.27, P < 0.001), whereas the GCS score was not correlated with the SPMSQ (Spearman = 0.05, P = 0.40) (Figure 1).
DISCUSSION
We demonstrated the utility of a rapid and accurate mobile application for assessment of mental status. The FAMTM was able to be quickly administered with a median time to completion of approximately 1 minute. The ability to detect mild alterations in mental status was shown through concurrent validity by FAMTM correlation with the SPMSQ and predictive validity with the association between the FAMTM and discharge disposition. Our study highlights the potential for the FAMTM to be used as a sensitive marker of AMS.
The novel design of the FAMTM presents unique advantages compared to current mental status testing. First, the FAMTM could allow patients with hearing impairment or language barriers to complete a mental status assessment. Additionally, the approximately 1‐minute median time to completion is much faster than other established mental status assessments including the SPMSQ (510 minutes). Compared to the SPMSQ taking 5 minutes, in a 400‐bed hospital, taken once per nursing shift, the FAMTM would save approximately 20,000 hours and 10 nursing full‐time equivalents per year.[5] Finally, many current mental status tests such as the Confusion Assessment Model utilize subjective mental status assessments.[2] However, the FAMTM is designed to be conducted through self‐assessment and, thus, could theoretically be free of observer bias. This potential for self‐administration expands beyond other proposed alternative testing mechanisms of the AMS such as ultrabrief assessments that include items such as asking subjects the months of the year backwards, and what is the day of the week?, and assessing arousal.[12, 13, 14]
In research settings and commonly in hospitals, the GCS and AVPU are used clinically for mental status assessment of hospitalized patients.[6, 15] However, similar to previous literature, our study found that the vast majority of hospitalized patients were defined as neurologically intact by the GCS, which is the more accurate predictor of the 2.[7] One major strength of the FAMTM was that it identified an extensive gradation of scores for patients previously labeled as merely alert, providing greater resolution than the GCS in quantifying mental status.
One of the key benefits of the FAMTM is that it can be measured longitudinally over the course of a patient's hospital stay. Therefore, once a baseline FAMTM score is established, variation from the patient's personal baseline could indicate mental status deterioration, which would not be affected by the patient's demographics, health status, or underlying neurocognitive deficits.
There were important limitations to this study. First, limited generalizability of these data may exist due to the single‐center setting and patient population. However, this initial study provides pilot data for further expansion into the potential broad applicability of the FAMTM to other patient populations and settings. Additionally, the cost of large‐scale implementation of the FAMTM is unknown and was beyond the scope of this pilot study. However, to reduce costs, the FAMTM technology could be integrated into existing hospital technology infrastructure. Finally, the scope of this study prevented a complete assessment of all validity measures or comparison to other mental status assessments such as the digit span or serial sevens tests. However, predictive and concurrent validity were assessed with comparison by discharge disposition, SPMSQ, and GCS scores.
In conclusion, this pilot study identifies the FAMTM application as a potentially clinically useful, novel, rapid, and feasible assessment tool of mental status in a general medicine inpatient setting.
Acknowledgements
The authors thank Frank Zadravecz, MPH, for his support with this project.
Disclosures: This research was supported in part by a grant from the National Institutes of Health (NIA 2T35AG029795‐07) and in part by career development awards granted to Dr. Churpek, Dr. Edelson, and Dr. Press by the National Heart, Lung, and Blood Institute (K08 HL121080, K23 HL097157, and K23 HL118151, respectively). Dr. Churpek has received honoraria from Chest for invited speaking engagements. Drs. Churpek and Edelson have a patent pending (ARCD. P0535US.P2) for risk stratification algorithms for hospitalized patients. In addition, Dr. Edelson has received research support from Philips Healthcare (Andover, MA), the American Heart Association (Dallas, TX), and Laerdal Medical (Stavanger, Norway). She has ownership interest in Quant HC (Chicago, IL), which is developing products for risk stratification of hospitalized patients. All other authors report no potential conflicts of interest.
- , . Altered mental status in older patients in the emergency department. Clin Geriatr Med. 2013;29(1):101–136.
- , , , , , . Clarifying confusion: the confusion assessment method. A new method for detection of delirium. Ann Intern Med. 1990;113(12):941–948.
- , , , , . Association between clinically abnormal observations and subsequent in‐hospital mortality: a prospective study. Resuscitation. 2004;62(2):137–141.
- , , . Early recognition of delirium: review of the literature. J Clin Nurs. 2001;10(6):721–729.
- . A short portable mental status questionnaire for the assessment of organic brain deficit in elderly patients. J Am Geriatr Soc. 1975;23(10):433–441.
- , , , , . The ability of the National Early Warning Score (NEWS) to discriminate patients at risk of early cardiac arrest, unanticipated intensive care unit admission, and death. Resuscitation. 2013;84(4):465–470.
- , , , et al. Comparison of mental‐status scales for predicting mortality on the general wards. J Hosp Med. 2015;10(10):658–663.
- , . Assessment of coma and impaired consciousness: a practical scale. Lancet. 1974;304(7872):81–84.
- , , , . Short Portable Mental Status Questionnaire as a Screening Test for Dementia and Delirium Among the Elderly. J Am Geriatr Soc. 1987;35(5):412–416.
- , , , et al. Effects of physician experience on costs and outcomes on an academic general medicine service: results of a trial of hospitalists. Ann Intern Med. 2002;137(11):866–874.
- , , . Comparing the areas under two or more correlated receiver operating characteristic curves: a nonparametric approach. Biometrics. 1988;44(3):837–845.
- , , , et al. Preliminary development of an ultrabrief two‐item bedside test for delirium. J Hosp Med. 2015;10(10):645–650.
- , , , , , . The association between an ultrabrief cognitive screening in older adults and hospital outcomes. J Hosp Med. 2015;10(10):651–657.
- , , , et al. Selecting optimal screening items for delirium: an application of item response theory. BMC Med Res Methodol. 2013;13:8.
- , , . Variability in agreement between physicians and nurses when measuring the Glasgow Coma Scale in the emergency department limits its clinical usefulness. Emerg Med Australas. 2006;18(4):379–384.

Mental Status to Predict Mortality
Altered mental status (AMS), characterized by abnormal changes in a patient's arousal and/or cognition, is a significant predictor of hospital mortality.[1, 2, 3] Yet despite its prevalence[3, 4, 5] and importance, up to three‐quarters of AMS events go unrecognized by caregivers.[6, 7, 8] Acute changes in mental status, often caused by delirium in the hospitalized patient,[3] can present nonspecifically, making it difficult to detect and distinguish from other diagnoses such as depression or dementia.[7, 9] Further complicating the recognition of AMS, numerous and imprecise qualitative descriptors such as confused and alert and oriented are used in clinical practice to describe the mental status of patients.[10] Thus, more objective measures may result in improved detection of altered mental status and in earlier diagnostic and therapeutic interventions.
In critically ill patients, several scales have been widely adopted for quantifying mental status. The Richmond Agitation and Sedation Scale (RASS) was created to optimize sedation.[11] The Glasgow Coma Scale (GCS) was developed for head‐trauma patients[12] and is now a standardized assessment tool in intensive care units,[13] the emergency department,[14] and the prehospital setting.[15] In addition, a simplified scale, AVPU (Alert, responsive to Verbal stimuli, responsive to Painful stimuli, and Unresponsive) was initially used in the primary survey of trauma patients[16] but is now a common component of early‐warning scores and rapid response activation criteria, such as the Modified Early Warning Score (MEWS).[17, 18] In fact, in a systematic review of 72 distinct early‐warning scores, 89% of the scores used AVPU as the measure of mentation.[17] However, the utility of these 3 scales is not well established in the general‐ward setting. Our aim was therefore to compare the accuracies of AVPU, GCS, and RASS for predicting mortality in hospitalized general‐ward patients to provide insight into the accuracy of these different scores for clinical deterioration.
METHODS
Study Setting and Protocol
We conducted an observational cohort study of consecutive adult general‐ward admissions from July 2011 through January 2013 at a 500‐bed, urban US teaching hospital. During the study period, no early‐warning scoring systems were in place on the hospital wards. Rapid response teams responding to altered mental status would do so without specific thresholds for activation. During this period, nurses on the general floors were expected to record each patient's GCS and RASS score in the electronic health record (EPIC Systems Corp., Verona, WI) as part of the routine patient assessment at least once every 12‐hour shift. AVPU assessments were extracted from the eye component of the GCS. The letter A was assigned to a GCS Eye score of 4 (opens eyes spontaneously), V to a score of 3 (opens eyes in response to voice), P to a score of 2 (opens eyes in response to painful stimuli), and U to a score of 1 (does not open eyes). To avoid comparison of mental‐status scores at different time points, only concurrent GCS and RASS scores, documented within 10 minutes of one another, were included in the analysis.
Location and time‐stamped GCS and RASS scores, demographics, and in‐hospital mortality data were obtained from the hospital's Clinical Research Data Warehouse, which is maintained by the Center for Research Informatics at The University of Chicago. The study protocol and data‐collection mechanisms were approved by The University of Chicago Institutional Review Board (#16995A).
Statistical Analysis
Baseline admission characteristics were described using proportions (%) and measures of central tendency (mean, standard deviations [SD]; median, interquartile ranges [IQR]). Patient severity of illness at first ward observation was calculated using the MEWS.[19] All mental‐status observations during a patient's ward stay were included in the analysis. Odds ratios for 24‐hour mortality following an abnormal mental‐status score were calculated using generalized estimating equations, with an exchangeable correlation structure to account for the correlation of scores within the same patient, as more than 1 abnormal mental‐status score may have been documented within the 24 hours preceding death. Spearman's rank correlation coefficients () were used to estimate the correlation among AVPU, GCS, and RASS scores.
The predictive accuracies of AVPU, GCS, RASS, and the subscales of GCS were compared using the area under the receiver operating characteristic curve (AUC), with mortality within 24 hours of a mental‐status observation as the primary outcome and the mental‐status score as the predictor variable. Although AUCs are typically used as a measure of discriminative ability, this study used AUCs to summarize both sensitivity and specificity across a range of cutoffs, providing an overall measure of predictive accuracies across mental‐status scales. To estimate AUCs, the AVPU, GCS, and GCS subscales were entered into a logistic regression model as ordinal variables, whereas RASS was entered as a nominal variable due to its positive and negative components, and predicted probabilities were calculated. In addition, a combined model was fit where GCS and RASS were classified as categorical independent variables. AUCs were then calculated by utilizing the predicted probabilities from each logistic regression model using the trapezoidal rule.[20] A sensitivity analysis was performed to estimate the internal validity of the RASS model using 10‐fold cross‐validation.
Predefined subgroup analyses were performed that compared the accuracies of AVPU, GCS, and RASS for predicting 24‐hour mortality in patients above and below the median age of the study population, and between patients who underwent surgery during their admission or not (surgical vs medical). All tests of significance used a 2‐sided P value <0.05. All data analysis was performed using Stata version 13.0 (StataCorp, College Station, TX).
RESULTS
During the study period, 313,577 complete GCS and 305,177 RASS scores were recorded in the electronic health record by nursing staff. A total of 26,806 (17,603 GCS and 9203 RASS) observations were excluded due to nonsimultaneous measurement of the other score, resulting in 295,974 paired mental‐status observations. These observations were obtained from 26,873 admissions in 17,660 unique patients, with a median MEWS at ward admission of 1 (IQR 11). The mean patient age was 57 years (SD 17), and 23% were surgical patients (Table 1). Patients spent a median 63.9 hours (IQR 26.7118.6) on the wards per admission and contributed a median of 3 paired observations (IQR 24) per day, with 91% of patients having at least 2 observations per day. A total of 417 (1.6%) general‐ward admissions resulted in death during the hospitalization, with 354 mental‐status observations occurring within 24 hours of a death. In addition, 26,618 (99.9%) admissions had at least 1 paired mental‐status observation within the last 24 hours of their ward stay.
| |
| Total no. of admissions | 26,873 |
| Total no. of unique patients | 17,660 |
| Age, y, mean (SD) | 57 (17) |
| Female sex, n (%) | 14,293 (53) |
| Race, n (%) | |
| White | 10,516 (39) |
| Black | 12,580 (47) |
| Other/unknown | 3,777 (14) |
| Admission MEWS, median (IQR) | 1 (11) |
| Days on ward, median (IQR) | 5 (310) |
| Observations per person, per day, median (IQR) | 3 (24) |
| Underwent surgery during hospitalization, n (%) | 6,141 (23) |
| Deaths, n (%) | 417 (1.6) |
AVPU was moderately correlated with GCS (Spearman's =0.56) (Figure 1a) and weakly correlated with RASS (Spearman's =0.28) (Figure 1b). GCS scores were also weakly correlated to RASS (Spearman's =0.13, P<0.001). Notably, AVPU mapped to distinct levels of GCS, with Alert associated with a median GCS total score of 15, Voice a score of 12, Pain a score of 8, and Unresponsive a score of 5. Abnormal mental‐status scores on any scale were associated with significantly higher odds of death within 24 hours than normal mental‐status scores (Table 2). This association was consistent within the 3 subscales of GCS and for scores in both the sedation (<0) and agitation (>0) ranges of RASS.
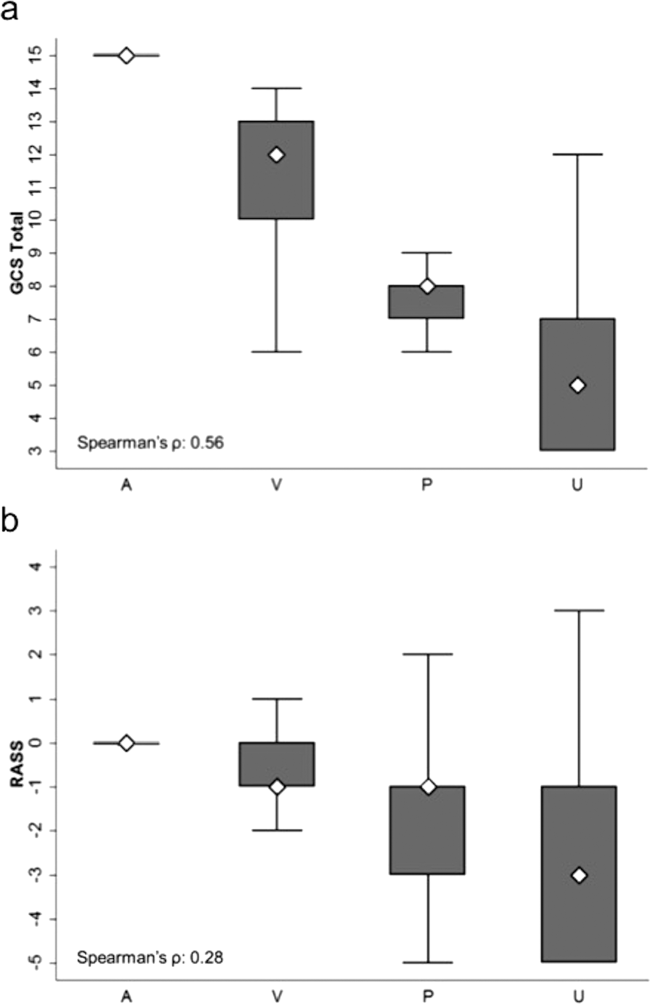
| Mental‐status Score | Observations, n (%) | Odds Ratio for Mortality (95% CI) |
|---|---|---|
| ||
| GCS Eye (AVPU) | ||
| 4 (alert) | 289,857 (98) | Reference |
| <4 (not alert) | 6,117 (2) | 33.8 (23.947.9) |
| GCS Verbal | ||
| 5 | 277,862 (94) | Reference |
| 4 | 11,258 (4) | 4.7 (2.87.9) |
| <4 | 6,854 (2) | 52.7 (38.073.2) |
| GCS Motor | ||
| 6 | 287,441 (97) | Reference |
| <6 | 8,533 (3) | 41.8 (30.756.9) |
| GCS total | ||
| 15 | 276,042 (93) | Reference |
| 13, 14 | 12,437 (4) | 5.2 (3.38.3) |
| <13 | 7,495 (3) | 55.5 (40.077.1) |
| RASS | ||
| >0 | 6,867 (2) | 8.5 (5.613.0) |
| 0 | 275,708 (93) | Reference |
| <0 | 13,339 (5) | 25.8 (19.234.6) |
AVPU was the least accurate predictor of mortality (AUC 0.73 [95% confidence interval {CI}: 0.710.76]), whereas simultaneous use of GCS and RASS was the most accurate predictor (AUC 0.85 [95% CI: 0.820.87] (Figure 2). The accuracies of GCS and RASS were not significantly different from one another in the total study population (AUC 0.80 [95% CI: 0.770.83] and 0.82 [0.790.84], respectively, P=0.13). Ten‐fold cross‐validation to estimate the internal validity of the RASS model resulted in a lower AUC (0.78 [95% CI: 0.750.81]) for RASS as a predictor of 24‐hour mortality. Subgroup analysis indicated that RASS was more accurate than GCS in younger patients (<57 years old) and in surgical patients (Figure 3).
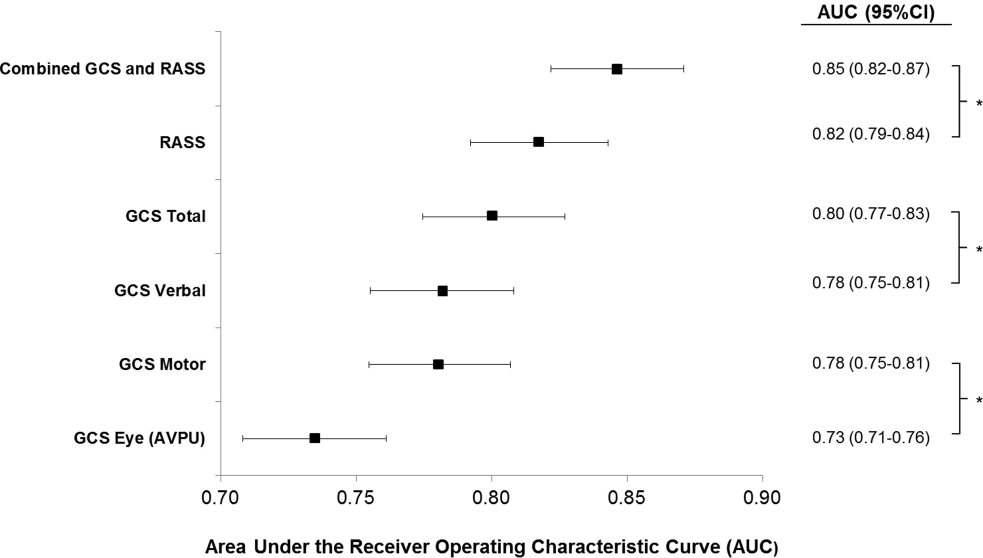
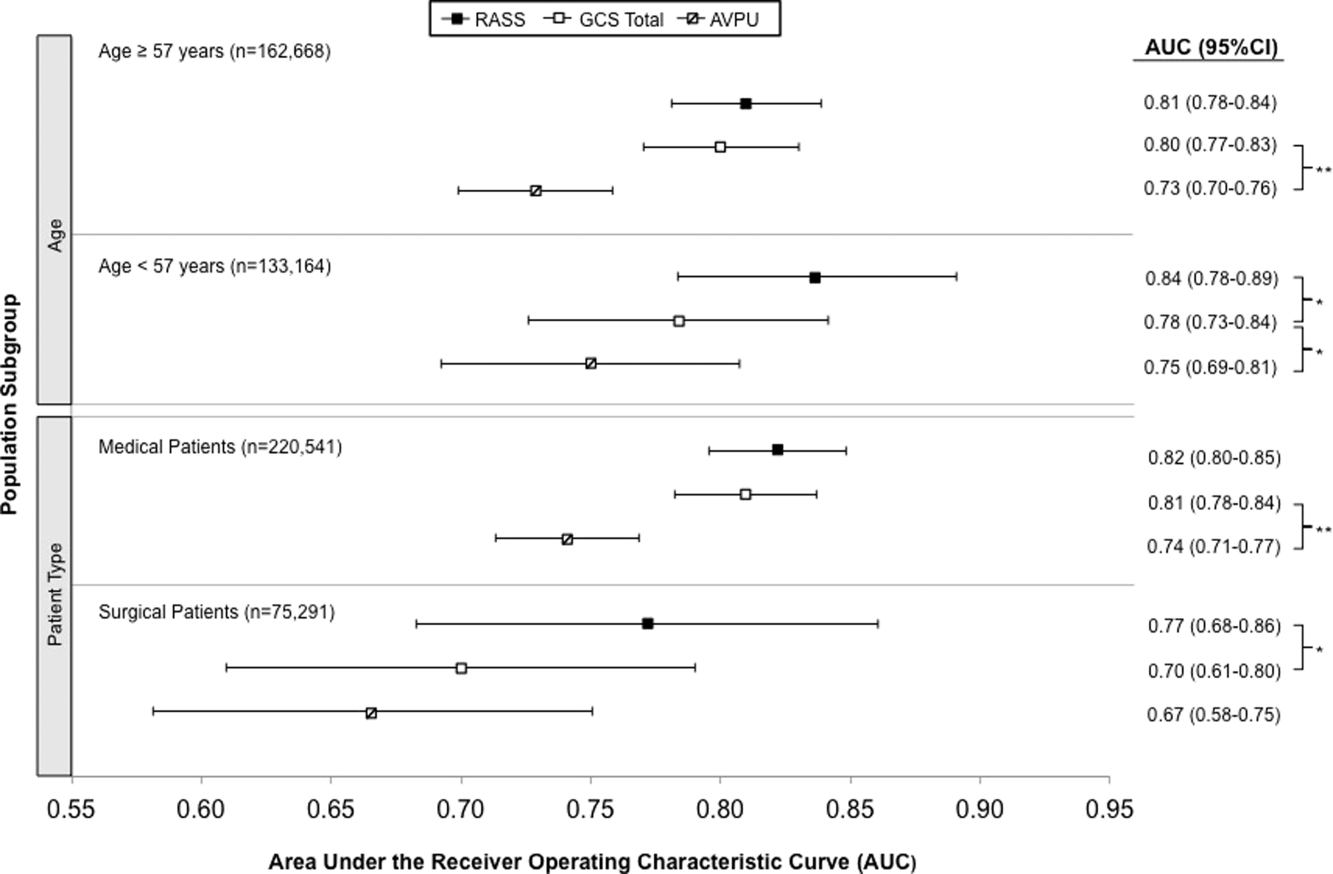
Removal of the 255 admissions missing a paired mental‐status observation within the last 24 hours of their ward stay resulted in no change in the AUC values. A sensitivity analysis for prediction of a combined secondary outcome of 24‐hour intensive care unit ICU transfer or cardiac arrest yielded lower AUCs for each mental‐status scale, with no change in the association among scales.
DISCUSSION
To our knowledge, this study is the first to compare the accuracies of AVPU, GCS, and RASS for predicting mortality in the general‐ward setting. Similar to McNarry and Goldhill, we demonstrated that AVPU scores mapped to distinct levels of GCS. Although our study reports the same median GCS scores of 15 and 8 for AVPU levels of Alert and Pain, respectively, we indicate slightly lower corresponding median GCS scores for AVPU scores of Voice (12 vs 13) and Unresponsive (5 vs 6) than their previous work.[21] We found that AVPU was the least accurate predictor of mortality within 24 hours of an observation, and the combination of GCS and RASS was the most accurate. RASS was at least as accurate a predictor for 24‐hour mortality in comparison to GCS total in the overall study population. However, the RASS score was the most accurate individual score in surgical and younger patients. These findings suggest that changing from the commonly used AVPU scale to the RASS and/or GCS would improve the prognostic ability of mental‐status assessments on the general wards.
Buist and colleagues have previously demonstrated altered mental status to be one of the strongest predictors of death on the wards. In that study, a GCS score of 3 and a decrease in GCS score by more than 2 points were independently associated with mortality (odds ratio 6.1 [95% CI: 3.111.8] and 5.5 [95% CI: 2.611.9], respectively).[22] We have also previously shown that after adjusting for vital signs, being unresponsive to pain was associated with a 4.5‐fold increase in the odds of death within 24 hours,[23]whereas Subbe and colleagues showed a relative risk ratio of 5.2 (95% CI: 1.518.1) for the combined endpoint of cardiac arrest, death at 60 days, or admission to the intensive care/high dependency unit.[19] In the current study, the magnitude of these associations was even stronger, with a GCS score <13 correlating with a 55‐fold increase in the odds of death, compared to a normal GCS, and not being alert being associated with a 33.8‐fold increase in the odds of death. This difference in magnitude is likely a product of the univariate nature of the current analysis, compared to both the Buist et al. and Churpek et al. studies, which adjusted for vital signs, thereby lessening the impact of any single predictor. Because this study was designed to compare mental‐status variables to one another for future model inclusion, and all the analyses were paired, confounding by additional predictors of death was not a concern.
One of the potential strengths of RASS over GCS and AVPU is its ability to measure agitation levels, in addition to depressed mentation, a feature that has been shown to be present in up to 60% of delirium episodes.[24] This may also explain why RASS was the most accurate predictor of mortality in our subset of younger patients and surgical patients, because hyperactive delirium is more common in younger and healthier patients, which surgical patients tend to be as compared to medical patients.[25, 26] In this study, we found negative RASS scores portending a worse prognosis than positive ones, which supports previous findings that hypoactive delirium had a higher association with mortality than hyperactive delirium at 6 months (hazard ratio 1.90 vs 1.37) and at 1 year (hazard ratio 1.60 vs 1.30) in elderly patients at postacute‐care facilities in 2 separate studies.[27, 28] However, a study of patients undergoing surgery for hip fracture found that patients with hyperactive delirium were more likely to die or be placed in a nursing home at 1 month follow‐up when compared to patients with purely hypoactive delirium (79% vs 32%, P=0.003).[29]
We found the assessment of RASS and GCS by ward nurses to be highly feasible. During the study period, nurses assessed mental status with the GCS and RASS scales at least once per 12‐hour shift in 91% of patients. GCS has been shown to be reliably and accurately recorded by experienced nurses (reliability coefficient=0.944 with 96.4% agreement with expert ratings).[30] RASS can take <30 seconds to administer, and in previous studies of the ICU setting has been shown to have over 94% nurse compliance for administration,[31] and good inter‐rater reliability (weighted kappa 0.66 and 0.89, respectively).[31, 32] Further, in a prior survey of 55 critical care nurses, 82% agreed that RASS was easy to score and clinically relevant.[31]
This study has several limitations. First, it was conducted in a single academic institution, which may limit generalizability to other hospitals. Second, baseline cognition and comorbidities were not available in the dataset, so we were unable to conduct additional subgroup analyses by these categories. However, we used age and hospital admission type as proxies. Third, the AVPU scores in this study were extracted from the Eye subset of the GCS scale, as AVPU was not directly assessed on our wards during the study period. Clinical assessment of mental status on the AVPU scale notes the presence of any active patient response (eg, eye opening, grunting, moaning, movement) to increasingly noxious stimuli. As such, our adaptation of AVPU using only eye‐opening criteria may underestimate the true number of patients correctly classified as alert, or responding to vocal/painful stimuli. However, a sensitivity analysis comparing directly assessed AVPU during a 3‐year period prior to the study implementation at our institution, and AVPU derived from the GCS Eye subscale for the study period, indicated no difference in predictive value for 24‐hour mortality. Fourth, we did not perform trend analyses for change from baseline mental status or evolution of AMS, which may more accurately predict 24‐hour mortality than discrete mental‐status observations. Finally, the 3 scales we compared differ in length, which may bias the AUC against AVPU, a 4‐point scale with a trapezoidal ROC curve compared to the smoother curve generated by the 15‐point GCS scale, for example. However, the lack of discrimination of the AVPU is the likely source of its lesser accuracy.
CONCLUSION
In the general‐ward setting, routine collection of GCS and RASS is feasible, and both are significantly more accurate for predicting mortality than the more commonly used AVPU scale. In addition, the combination of GCS and RASS has greater accuracy than any of the 3 individual scales. RASS may be particularly beneficial in the assessment of younger and/or surgical patients. Routine documentation and tracking of GCS and/or RASS by nurses may improve the detection of clinical deterioration in general‐ward patients. In addition, future early‐warning scores may benefit from the inclusion of GCS and/or RASS in lieu of AVPU.
Disclosures
Drs. Churpek and Edelson have a patent pending (ARCD. P0535US.P2) for risk stratification algorithms for hospitalized patients. Dr. Churpek is supported by a career development award from the National Heart, Lung, and Blood Institute (K08 HL121080). Dr. Edelson has received research support from the National Heart, Lung, and Blood Institute (K23 HL097157), Philips (Andover, MA), the American Heart Association (Dallas, TX), Laerdal Medical (Stavanger, Norway), and Early Sense (Tel Aviv, Israel). She has ownership interest in Quant HC (Chicago, IL), which is developing products for risk stratification of hospitalized patients. All other authors report no conflicts of interest.
- , , , et al. Delirium as a predictor of mortality in mechanically ventilated patients in the intensive care unit. JAMA. 2004;291(14):1753–1762.
- , , , , , Delirium in hospitalized older persons: outcomes and predictors. J Am Geriatr Soc. 1994;42(8):809–815.
- , , Occurrence and outcome of delirium in medical in‐patients: a systematic literature review. Age Ageing. 2006;35(4):350–364.
- , , , et al. Delirium. The occurrence and persistence of symptoms among elderly hospitalized patients. Arch Intern Med. 1992;152(2):334–340.
- , , Postoperative delirium. A review of 80 primary data‐collection studies. Arch Intern Med. 1995;155(5):461–465.
- , , , , Nurses' recognition of delirium and its symptoms: comparison of nurse and researcher ratings. Arch Intern Med. 2001;161(20):2467–2473.
- , , The misdiagnosis of delirium. Psychosomatics. 1997;38(5):433–439.
- , , , et al. Current opinions regarding the importance, diagnosis, and management of delirium in the intensive care unit: a survey of 912 healthcare professionals. Crit Care Med. 2004;32(1):106–112.
- , Misdiagnosing delirium as depression in medically ill elderly patients. Arch Intern Med. 1995;155(22):2459–2464.
- Doctors and nurses use of the word confused. Br J Psychiatry. 1984;145:441–443.
- , , , et al. The Richmond Agitation‐Sedation Scale: validity and reliability in adult intensive care unit patients. Am J Respir Crit Care Med. 2002;166(10):1338–1344.
- , Assessment and prognosis of coma after head injury. Acta Neurochir (Wien). 1976;34(1–4):45–55.
- , , , , Glasgow Coma Scale score in the evaluation of outcome in the intensive care unit: findings from the Acute Physiology and Chronic Health Evaluation III study. Crit Care Med. 1993;21(10):1459–1465.
- , , Variability in agreement between physicians and nurses when measuring the Glasgow Coma Scale in the emergency department limits its clinical usefulness. Emerg Med Australas. 2006;18(4):379–384.
- , , , Reliability of the Glasgow Coma Scale when used by emergency physicians and paramedics. J Trauma. 1993;34(1):46–48.
- , ; American College of Surgeons. Committee on Trauma. Advanced Trauma Life Support Program For Physicians: ATLS. 5th ed. Chicago, IL: American College of Surgeons; 1993.
- , , , Review and performance evaluation of aggregate weighted 'track and trigger' systems. Resuscitation. 2008;77(2):170–179.
- , , , , A review, and performance evaluation, of single‐parameter “track and trigger” systems. Resuscitation. 2008;79(1):11–21.
- , , , Validation of a modified Early Warning score in medical admissions. QJM. 2001;94(10):521–526.
- , , Comparing the areas under two or more correlated receiver operating characteristic curves: a nonparametric approach. Biometrics. 1988;44(3):837–845.
- , Simple bedside assessment of level of consciousness: comparison of two simple assessment scales with the Glascow Coma Scale. Anaesthesia. 2004;59(1):34–37.
- , , , , Association between clinically abnormal observations and subsequent in‐hospital mortality: a prospective study. Resuscitation. 2004;62(2):137–141.
- , , Predicting clinical deterioration in the hospital: the impact of outcome selection. Resuscitation. 2013;84(5):564–568.
- , , , et al. Delirium and its motoric subtypes: a study of 614 critically ill patients. J Am Geriatr Soc. 2006;54(3):479–484.
- , , , et al. Risk factors for delirium after major trauma. Am J Surg. 2008;196(6):864–869.
- , , , , Relationship between symptoms and motoric subtype of delirium. J Neuropsychiatry Clin Neurosci. 2000;12(1):51–56.
- , , , et al. Phenomenological subtypes of delirium in older persons: patterns, prevalence, and prognosis. Psychosomatics. 2009;50(3):248–254.
- , , , Association between psychomotor activity delirium subtypes and mortality among newly admitted post‐acute facility patients. J Gerontol A Biol Sci Med Sci. 2007;62(2):174–179.
- , , , Delirium severity and psychomotor types: their relationship with outcomes after hip fracture repair. J Am Geriatr Soc. 2002;50(5):850–857.
- , Reliability and accuracy of the Glasgow Coma Scale with experienced and inexperienced users. Lancet. 1991;337(8740):535–538.
- , , , et al. Large‐scale implementation of sedation and delirium monitoring in the intensive care unit: a report from two medical centers. Crit Care Med. 2005;33(6):1199–1205.
- , , , et al. Delirium and sedation recognition using validated instruments: reliability of bedside intensive care unit nursing assessments from 2007 to 2010. J Am Geriatr Soc. 2011;59(suppl 2):S249–S255.
Altered mental status (AMS), characterized by abnormal changes in a patient's arousal and/or cognition, is a significant predictor of hospital mortality.[1, 2, 3] Yet despite its prevalence[3, 4, 5] and importance, up to three‐quarters of AMS events go unrecognized by caregivers.[6, 7, 8] Acute changes in mental status, often caused by delirium in the hospitalized patient,[3] can present nonspecifically, making it difficult to detect and distinguish from other diagnoses such as depression or dementia.[7, 9] Further complicating the recognition of AMS, numerous and imprecise qualitative descriptors such as confused and alert and oriented are used in clinical practice to describe the mental status of patients.[10] Thus, more objective measures may result in improved detection of altered mental status and in earlier diagnostic and therapeutic interventions.
In critically ill patients, several scales have been widely adopted for quantifying mental status. The Richmond Agitation and Sedation Scale (RASS) was created to optimize sedation.[11] The Glasgow Coma Scale (GCS) was developed for head‐trauma patients[12] and is now a standardized assessment tool in intensive care units,[13] the emergency department,[14] and the prehospital setting.[15] In addition, a simplified scale, AVPU (Alert, responsive to Verbal stimuli, responsive to Painful stimuli, and Unresponsive) was initially used in the primary survey of trauma patients[16] but is now a common component of early‐warning scores and rapid response activation criteria, such as the Modified Early Warning Score (MEWS).[17, 18] In fact, in a systematic review of 72 distinct early‐warning scores, 89% of the scores used AVPU as the measure of mentation.[17] However, the utility of these 3 scales is not well established in the general‐ward setting. Our aim was therefore to compare the accuracies of AVPU, GCS, and RASS for predicting mortality in hospitalized general‐ward patients to provide insight into the accuracy of these different scores for clinical deterioration.
METHODS
Study Setting and Protocol
We conducted an observational cohort study of consecutive adult general‐ward admissions from July 2011 through January 2013 at a 500‐bed, urban US teaching hospital. During the study period, no early‐warning scoring systems were in place on the hospital wards. Rapid response teams responding to altered mental status would do so without specific thresholds for activation. During this period, nurses on the general floors were expected to record each patient's GCS and RASS score in the electronic health record (EPIC Systems Corp., Verona, WI) as part of the routine patient assessment at least once every 12‐hour shift. AVPU assessments were extracted from the eye component of the GCS. The letter A was assigned to a GCS Eye score of 4 (opens eyes spontaneously), V to a score of 3 (opens eyes in response to voice), P to a score of 2 (opens eyes in response to painful stimuli), and U to a score of 1 (does not open eyes). To avoid comparison of mental‐status scores at different time points, only concurrent GCS and RASS scores, documented within 10 minutes of one another, were included in the analysis.
Location and time‐stamped GCS and RASS scores, demographics, and in‐hospital mortality data were obtained from the hospital's Clinical Research Data Warehouse, which is maintained by the Center for Research Informatics at The University of Chicago. The study protocol and data‐collection mechanisms were approved by The University of Chicago Institutional Review Board (#16995A).
Statistical Analysis
Baseline admission characteristics were described using proportions (%) and measures of central tendency (mean, standard deviations [SD]; median, interquartile ranges [IQR]). Patient severity of illness at first ward observation was calculated using the MEWS.[19] All mental‐status observations during a patient's ward stay were included in the analysis. Odds ratios for 24‐hour mortality following an abnormal mental‐status score were calculated using generalized estimating equations, with an exchangeable correlation structure to account for the correlation of scores within the same patient, as more than 1 abnormal mental‐status score may have been documented within the 24 hours preceding death. Spearman's rank correlation coefficients () were used to estimate the correlation among AVPU, GCS, and RASS scores.
The predictive accuracies of AVPU, GCS, RASS, and the subscales of GCS were compared using the area under the receiver operating characteristic curve (AUC), with mortality within 24 hours of a mental‐status observation as the primary outcome and the mental‐status score as the predictor variable. Although AUCs are typically used as a measure of discriminative ability, this study used AUCs to summarize both sensitivity and specificity across a range of cutoffs, providing an overall measure of predictive accuracies across mental‐status scales. To estimate AUCs, the AVPU, GCS, and GCS subscales were entered into a logistic regression model as ordinal variables, whereas RASS was entered as a nominal variable due to its positive and negative components, and predicted probabilities were calculated. In addition, a combined model was fit where GCS and RASS were classified as categorical independent variables. AUCs were then calculated by utilizing the predicted probabilities from each logistic regression model using the trapezoidal rule.[20] A sensitivity analysis was performed to estimate the internal validity of the RASS model using 10‐fold cross‐validation.
Predefined subgroup analyses were performed that compared the accuracies of AVPU, GCS, and RASS for predicting 24‐hour mortality in patients above and below the median age of the study population, and between patients who underwent surgery during their admission or not (surgical vs medical). All tests of significance used a 2‐sided P value <0.05. All data analysis was performed using Stata version 13.0 (StataCorp, College Station, TX).
RESULTS
During the study period, 313,577 complete GCS and 305,177 RASS scores were recorded in the electronic health record by nursing staff. A total of 26,806 (17,603 GCS and 9203 RASS) observations were excluded due to nonsimultaneous measurement of the other score, resulting in 295,974 paired mental‐status observations. These observations were obtained from 26,873 admissions in 17,660 unique patients, with a median MEWS at ward admission of 1 (IQR 11). The mean patient age was 57 years (SD 17), and 23% were surgical patients (Table 1). Patients spent a median 63.9 hours (IQR 26.7118.6) on the wards per admission and contributed a median of 3 paired observations (IQR 24) per day, with 91% of patients having at least 2 observations per day. A total of 417 (1.6%) general‐ward admissions resulted in death during the hospitalization, with 354 mental‐status observations occurring within 24 hours of a death. In addition, 26,618 (99.9%) admissions had at least 1 paired mental‐status observation within the last 24 hours of their ward stay.
| |
| Total no. of admissions | 26,873 |
| Total no. of unique patients | 17,660 |
| Age, y, mean (SD) | 57 (17) |
| Female sex, n (%) | 14,293 (53) |
| Race, n (%) | |
| White | 10,516 (39) |
| Black | 12,580 (47) |
| Other/unknown | 3,777 (14) |
| Admission MEWS, median (IQR) | 1 (11) |
| Days on ward, median (IQR) | 5 (310) |
| Observations per person, per day, median (IQR) | 3 (24) |
| Underwent surgery during hospitalization, n (%) | 6,141 (23) |
| Deaths, n (%) | 417 (1.6) |
AVPU was moderately correlated with GCS (Spearman's =0.56) (Figure 1a) and weakly correlated with RASS (Spearman's =0.28) (Figure 1b). GCS scores were also weakly correlated to RASS (Spearman's =0.13, P<0.001). Notably, AVPU mapped to distinct levels of GCS, with Alert associated with a median GCS total score of 15, Voice a score of 12, Pain a score of 8, and Unresponsive a score of 5. Abnormal mental‐status scores on any scale were associated with significantly higher odds of death within 24 hours than normal mental‐status scores (Table 2). This association was consistent within the 3 subscales of GCS and for scores in both the sedation (<0) and agitation (>0) ranges of RASS.
| Mental‐status Score | Observations, n (%) | Odds Ratio for Mortality (95% CI) |
|---|---|---|
| ||
| GCS Eye (AVPU) | ||
| 4 (alert) | 289,857 (98) | Reference |
| <4 (not alert) | 6,117 (2) | 33.8 (23.947.9) |
| GCS Verbal | ||
| 5 | 277,862 (94) | Reference |
| 4 | 11,258 (4) | 4.7 (2.87.9) |
| <4 | 6,854 (2) | 52.7 (38.073.2) |
| GCS Motor | ||
| 6 | 287,441 (97) | Reference |
| <6 | 8,533 (3) | 41.8 (30.756.9) |
| GCS total | ||
| 15 | 276,042 (93) | Reference |
| 13, 14 | 12,437 (4) | 5.2 (3.38.3) |
| <13 | 7,495 (3) | 55.5 (40.077.1) |
| RASS | ||
| >0 | 6,867 (2) | 8.5 (5.613.0) |
| 0 | 275,708 (93) | Reference |
| <0 | 13,339 (5) | 25.8 (19.234.6) |
AVPU was the least accurate predictor of mortality (AUC 0.73 [95% confidence interval {CI}: 0.710.76]), whereas simultaneous use of GCS and RASS was the most accurate predictor (AUC 0.85 [95% CI: 0.820.87] (Figure 2). The accuracies of GCS and RASS were not significantly different from one another in the total study population (AUC 0.80 [95% CI: 0.770.83] and 0.82 [0.790.84], respectively, P=0.13). Ten‐fold cross‐validation to estimate the internal validity of the RASS model resulted in a lower AUC (0.78 [95% CI: 0.750.81]) for RASS as a predictor of 24‐hour mortality. Subgroup analysis indicated that RASS was more accurate than GCS in younger patients (<57 years old) and in surgical patients (Figure 3).
Removal of the 255 admissions missing a paired mental‐status observation within the last 24 hours of their ward stay resulted in no change in the AUC values. A sensitivity analysis for prediction of a combined secondary outcome of 24‐hour intensive care unit ICU transfer or cardiac arrest yielded lower AUCs for each mental‐status scale, with no change in the association among scales.
DISCUSSION
To our knowledge, this study is the first to compare the accuracies of AVPU, GCS, and RASS for predicting mortality in the general‐ward setting. Similar to McNarry and Goldhill, we demonstrated that AVPU scores mapped to distinct levels of GCS. Although our study reports the same median GCS scores of 15 and 8 for AVPU levels of Alert and Pain, respectively, we indicate slightly lower corresponding median GCS scores for AVPU scores of Voice (12 vs 13) and Unresponsive (5 vs 6) than their previous work.[21] We found that AVPU was the least accurate predictor of mortality within 24 hours of an observation, and the combination of GCS and RASS was the most accurate. RASS was at least as accurate a predictor for 24‐hour mortality in comparison to GCS total in the overall study population. However, the RASS score was the most accurate individual score in surgical and younger patients. These findings suggest that changing from the commonly used AVPU scale to the RASS and/or GCS would improve the prognostic ability of mental‐status assessments on the general wards.
Buist and colleagues have previously demonstrated altered mental status to be one of the strongest predictors of death on the wards. In that study, a GCS score of 3 and a decrease in GCS score by more than 2 points were independently associated with mortality (odds ratio 6.1 [95% CI: 3.111.8] and 5.5 [95% CI: 2.611.9], respectively).[22] We have also previously shown that after adjusting for vital signs, being unresponsive to pain was associated with a 4.5‐fold increase in the odds of death within 24 hours,[23]whereas Subbe and colleagues showed a relative risk ratio of 5.2 (95% CI: 1.518.1) for the combined endpoint of cardiac arrest, death at 60 days, or admission to the intensive care/high dependency unit.[19] In the current study, the magnitude of these associations was even stronger, with a GCS score <13 correlating with a 55‐fold increase in the odds of death, compared to a normal GCS, and not being alert being associated with a 33.8‐fold increase in the odds of death. This difference in magnitude is likely a product of the univariate nature of the current analysis, compared to both the Buist et al. and Churpek et al. studies, which adjusted for vital signs, thereby lessening the impact of any single predictor. Because this study was designed to compare mental‐status variables to one another for future model inclusion, and all the analyses were paired, confounding by additional predictors of death was not a concern.
One of the potential strengths of RASS over GCS and AVPU is its ability to measure agitation levels, in addition to depressed mentation, a feature that has been shown to be present in up to 60% of delirium episodes.[24] This may also explain why RASS was the most accurate predictor of mortality in our subset of younger patients and surgical patients, because hyperactive delirium is more common in younger and healthier patients, which surgical patients tend to be as compared to medical patients.[25, 26] In this study, we found negative RASS scores portending a worse prognosis than positive ones, which supports previous findings that hypoactive delirium had a higher association with mortality than hyperactive delirium at 6 months (hazard ratio 1.90 vs 1.37) and at 1 year (hazard ratio 1.60 vs 1.30) in elderly patients at postacute‐care facilities in 2 separate studies.[27, 28] However, a study of patients undergoing surgery for hip fracture found that patients with hyperactive delirium were more likely to die or be placed in a nursing home at 1 month follow‐up when compared to patients with purely hypoactive delirium (79% vs 32%, P=0.003).[29]
We found the assessment of RASS and GCS by ward nurses to be highly feasible. During the study period, nurses assessed mental status with the GCS and RASS scales at least once per 12‐hour shift in 91% of patients. GCS has been shown to be reliably and accurately recorded by experienced nurses (reliability coefficient=0.944 with 96.4% agreement with expert ratings).[30] RASS can take <30 seconds to administer, and in previous studies of the ICU setting has been shown to have over 94% nurse compliance for administration,[31] and good inter‐rater reliability (weighted kappa 0.66 and 0.89, respectively).[31, 32] Further, in a prior survey of 55 critical care nurses, 82% agreed that RASS was easy to score and clinically relevant.[31]
This study has several limitations. First, it was conducted in a single academic institution, which may limit generalizability to other hospitals. Second, baseline cognition and comorbidities were not available in the dataset, so we were unable to conduct additional subgroup analyses by these categories. However, we used age and hospital admission type as proxies. Third, the AVPU scores in this study were extracted from the Eye subset of the GCS scale, as AVPU was not directly assessed on our wards during the study period. Clinical assessment of mental status on the AVPU scale notes the presence of any active patient response (eg, eye opening, grunting, moaning, movement) to increasingly noxious stimuli. As such, our adaptation of AVPU using only eye‐opening criteria may underestimate the true number of patients correctly classified as alert, or responding to vocal/painful stimuli. However, a sensitivity analysis comparing directly assessed AVPU during a 3‐year period prior to the study implementation at our institution, and AVPU derived from the GCS Eye subscale for the study period, indicated no difference in predictive value for 24‐hour mortality. Fourth, we did not perform trend analyses for change from baseline mental status or evolution of AMS, which may more accurately predict 24‐hour mortality than discrete mental‐status observations. Finally, the 3 scales we compared differ in length, which may bias the AUC against AVPU, a 4‐point scale with a trapezoidal ROC curve compared to the smoother curve generated by the 15‐point GCS scale, for example. However, the lack of discrimination of the AVPU is the likely source of its lesser accuracy.
CONCLUSION
In the general‐ward setting, routine collection of GCS and RASS is feasible, and both are significantly more accurate for predicting mortality than the more commonly used AVPU scale. In addition, the combination of GCS and RASS has greater accuracy than any of the 3 individual scales. RASS may be particularly beneficial in the assessment of younger and/or surgical patients. Routine documentation and tracking of GCS and/or RASS by nurses may improve the detection of clinical deterioration in general‐ward patients. In addition, future early‐warning scores may benefit from the inclusion of GCS and/or RASS in lieu of AVPU.
Disclosures
Drs. Churpek and Edelson have a patent pending (ARCD. P0535US.P2) for risk stratification algorithms for hospitalized patients. Dr. Churpek is supported by a career development award from the National Heart, Lung, and Blood Institute (K08 HL121080). Dr. Edelson has received research support from the National Heart, Lung, and Blood Institute (K23 HL097157), Philips (Andover, MA), the American Heart Association (Dallas, TX), Laerdal Medical (Stavanger, Norway), and Early Sense (Tel Aviv, Israel). She has ownership interest in Quant HC (Chicago, IL), which is developing products for risk stratification of hospitalized patients. All other authors report no conflicts of interest.
- , , , et al. Delirium as a predictor of mortality in mechanically ventilated patients in the intensive care unit. JAMA. 2004;291(14):1753–1762.
- , , , , , Delirium in hospitalized older persons: outcomes and predictors. J Am Geriatr Soc. 1994;42(8):809–815.
- , , Occurrence and outcome of delirium in medical in‐patients: a systematic literature review. Age Ageing. 2006;35(4):350–364.
- , , , et al. Delirium. The occurrence and persistence of symptoms among elderly hospitalized patients. Arch Intern Med. 1992;152(2):334–340.
- , , Postoperative delirium. A review of 80 primary data‐collection studies. Arch Intern Med. 1995;155(5):461–465.
- , , , , Nurses' recognition of delirium and its symptoms: comparison of nurse and researcher ratings. Arch Intern Med. 2001;161(20):2467–2473.
- , , The misdiagnosis of delirium. Psychosomatics. 1997;38(5):433–439.
- , , , et al. Current opinions regarding the importance, diagnosis, and management of delirium in the intensive care unit: a survey of 912 healthcare professionals. Crit Care Med. 2004;32(1):106–112.
- , Misdiagnosing delirium as depression in medically ill elderly patients. Arch Intern Med. 1995;155(22):2459–2464.
- Doctors and nurses use of the word confused. Br J Psychiatry. 1984;145:441–443.
- , , , et al. The Richmond Agitation‐Sedation Scale: validity and reliability in adult intensive care unit patients. Am J Respir Crit Care Med. 2002;166(10):1338–1344.
- , Assessment and prognosis of coma after head injury. Acta Neurochir (Wien). 1976;34(1–4):45–55.
- , , , , Glasgow Coma Scale score in the evaluation of outcome in the intensive care unit: findings from the Acute Physiology and Chronic Health Evaluation III study. Crit Care Med. 1993;21(10):1459–1465.
- , , Variability in agreement between physicians and nurses when measuring the Glasgow Coma Scale in the emergency department limits its clinical usefulness. Emerg Med Australas. 2006;18(4):379–384.
- , , , Reliability of the Glasgow Coma Scale when used by emergency physicians and paramedics. J Trauma. 1993;34(1):46–48.
- , ; American College of Surgeons. Committee on Trauma. Advanced Trauma Life Support Program For Physicians: ATLS. 5th ed. Chicago, IL: American College of Surgeons; 1993.
- , , , Review and performance evaluation of aggregate weighted 'track and trigger' systems. Resuscitation. 2008;77(2):170–179.
- , , , , A review, and performance evaluation, of single‐parameter “track and trigger” systems. Resuscitation. 2008;79(1):11–21.
- , , , Validation of a modified Early Warning score in medical admissions. QJM. 2001;94(10):521–526.
- , , Comparing the areas under two or more correlated receiver operating characteristic curves: a nonparametric approach. Biometrics. 1988;44(3):837–845.
- , Simple bedside assessment of level of consciousness: comparison of two simple assessment scales with the Glascow Coma Scale. Anaesthesia. 2004;59(1):34–37.
- , , , , Association between clinically abnormal observations and subsequent in‐hospital mortality: a prospective study. Resuscitation. 2004;62(2):137–141.
- , , Predicting clinical deterioration in the hospital: the impact of outcome selection. Resuscitation. 2013;84(5):564–568.
- , , , et al. Delirium and its motoric subtypes: a study of 614 critically ill patients. J Am Geriatr Soc. 2006;54(3):479–484.
- , , , et al. Risk factors for delirium after major trauma. Am J Surg. 2008;196(6):864–869.
- , , , , Relationship between symptoms and motoric subtype of delirium. J Neuropsychiatry Clin Neurosci. 2000;12(1):51–56.
- , , , et al. Phenomenological subtypes of delirium in older persons: patterns, prevalence, and prognosis. Psychosomatics. 2009;50(3):248–254.
- , , , Association between psychomotor activity delirium subtypes and mortality among newly admitted post‐acute facility patients. J Gerontol A Biol Sci Med Sci. 2007;62(2):174–179.
- , , , Delirium severity and psychomotor types: their relationship with outcomes after hip fracture repair. J Am Geriatr Soc. 2002;50(5):850–857.
- , Reliability and accuracy of the Glasgow Coma Scale with experienced and inexperienced users. Lancet. 1991;337(8740):535–538.
- , , , et al. Large‐scale implementation of sedation and delirium monitoring in the intensive care unit: a report from two medical centers. Crit Care Med. 2005;33(6):1199–1205.
- , , , et al. Delirium and sedation recognition using validated instruments: reliability of bedside intensive care unit nursing assessments from 2007 to 2010. J Am Geriatr Soc. 2011;59(suppl 2):S249–S255.
© 2015 Society of Hospital Medicine

OSA and Outcomes in Ward Patients
Obstructive sleep apnea (OSA) is an increasingly prevalent condition characterized by intermittent airway obstruction during sleep, which leads to hypoxemia, hypercapnia, and fragmented sleep. The current prevalence estimates of moderate to severe OSA (apnea‐hypopnea index 15, measured as events/hour) in middle‐aged adults are approximately 13% in men and 6% in women.[1] OSA is a well‐described independent risk factor for long‐term neurocognitive, cardiovascular, and cerebrovascular morbidity and mortality.[2, 3, 4, 5, 6]
Recent studies have also identified OSA as an independent risk factor for adverse perioperative outcomes, including endotracheal intubation, intensive care unit (ICU) transfer, and increased length of stay.[7, 8, 9, 10, 11] Paradoxically, despite an increase in the risk of complications, several of these studies did not find an association between in‐hospital death and OSA even after controlling for potential confounders.[9, 10, 11] Furthermore, a recent study of patients hospitalized for pneumonia reported increased rates of clinical deterioration and mechanical ventilation, but also lower odds of inpatient mortality in patients with OSA.[12]
These studies may have been limited by the absence of physiologic data, which prevented controlling for severity of illness. It is also unclear whether these previously described associations between OSA and adverse clinical outcomes hold true for general hospital inpatients. OSA may be worsened by medications frequently used in hospitals, such as narcotics and benzodiazepines. Opiate use contributes to both central and obstructive sleep apneas,[13, 14] and benzodiazepines are known to produce airway smooth muscle relaxation and can cause respiratory depression.[15] In fact, the use of benzodiazepines has been implicated in the unmasking of OSA in patients with previously undiagnosed sleep‐disordered breathing.[16] These findings suggest mechanisms by which OSA could contribute to an increased risk in hospital ward patients for rapid response team (RRT) activation, ICU transfer, cardiac arrest, and in‐hospital death.
The aim of this study was to determine the independent association between OSA and in‐hospital mortality in ward patients. We also aimed to investigate the association of OSA with clinical deterioration on the wards, while controlling for patient characteristics, initial physiology, and severity of illness.
MATERIALS AND METHODS
Setting and Study Population
This observational cohort study was performed at an academic tertiary care medical center with approximately 500 beds. Data were obtained from all adult patients hospitalized on the wards between November 1, 2008 and October 1, 2013. Our hospital has utilized an RRT, led by a critical care nurse and respiratory therapist with hospitalist and pharmacist consultation available upon request, since 2008. This team is separate from the team that responds to a cardiac arrest. Criteria for RRT activation include tachypnea, tachycardia, hypotension, and staff worry, but specific vital sign thresholds are not specified.
The study analyzed deidentified data from the hospital's Clinical Research Data Warehouse, which is maintained by the Center for Research Informatics at The University of Chicago. The study protocol was approved by the University of Chicago Institutional Review Board (IRB #16995A).
Data Collection
Patient age, sex, race, body mass index (BMI), and location prior to ward admission (ie, whether they were admitted from the emergency department, transferred from the ICU, or directly admitted from clinic or home) were collected. Patients who underwent surgery during their admission were identified using the hospital's admission‐transfer‐discharge database. In addition, routinely collected vital signs (eg, respiratory rate, blood pressure, heart rate) were obtained from the electronic health record (Epic, Verona, WI). To determine severity of illness, the first set of vital signs measured on hospital presentation were utilized to calculate the cardiac arrest risk triage (CART) score, a vital‐signbased early warning score we previously developed and validated for predicting adverse events in our population.[17] The CART score ranges from 0 to 57, with points assigned for abnormalities in respiratory rate, heart rate, diastolic blood pressure, and age. If any vital sign was missing, the next available measurement was pulled into the set. If any vital sign remained missing after this change, the median value for that particular location (ie, wards, ICU, or emergency department) was imputed as previously described.[18, 19]
Patients with OSA were identified by the following International Classification of Diseases, Ninth Revision, Clinical Modification (ICD‐9‐CM) codes using inpatient and outpatient medical records: 278.03, 327.20, 327.23, 327.29, 780.51, 780.53, and 780.57 (Table 1). Data on other patient comorbidities, including coronary artery disease, congestive heart failure, arrhythmias, uncomplicated and complicated diabetes mellitus, hypertension, and cerebrovascular disease were collected using specific ICD‐9‐CM codes from both inpatient and outpatient records. Information on insurance payer was also collected from the hospital's billing database. Insurance payers were grouped into the following categories: private payer, Medicare/Medicaid, and no insurance. Patients with both public and private payers were counted as being privately insured.
| Diagnosis Code | Description | % of Sleep Apnea Diagnosesa |
|---|---|---|
| ||
| 327.23 | Obstructive sleep apnea | 65.6 |
| 780.57 | Unspecified sleep apnea | 19.4 |
| 780.53 | Hypersomnia with sleep apnea, unspecified | 11.7 |
| 780.51 | Insomnia with sleep apnea, unspecified | 1.5 |
| 327.2 | Organic sleep apnea, unspecified | 0.2 |
| 278.03 | Obesity hypoventilation syndrome | 1.7 |
Outcomes
The primary outcome of the study was in‐hospital mortality. Secondary outcomes included length of stay, RRT activation, transfer to the ICU, endotracheal intubation, cardiac arrest (defined as a loss of pulse with attempted resuscitation) on the wards, and a composite outcome of RRT activation, ICU transfer, and death. Because cardiac arrests on the wards result either in death or ICU transfer following successful resuscitation, this variable was omitted from the composite outcome. Cardiac arrests were identified using a prospectively validated quality improvement database that has been described previously.[20] ICU transfer was identified using the hospital's admission‐transfer‐discharge database. Only the index cardiac arrest, intubation, RRT, or ICU transfer for each admission was used in the study, but more than 1 type of outcome could occur for each patient (eg, a patient who died following an unsuccessful resuscitation attempt would count as both a cardiac arrest and a death).
Statistical Analysis
Patient characteristics were compared using Student t tests, Wilcoxon rank sum tests, and 2 statistics, as appropriate. Unadjusted logistic regression models were fit to estimate the change in odds of each adverse event and a composite outcome of any event for patient admissions with OSA compared to those without OSA. Adjusted logistic regression models were then fit for each outcome to control for patient characteristics (age, sex, BMI, insurance status, and individual comorbidities), location immediately prior to ward admission, and admission severity of illness (as measured by CART score). In the adjusted model, CART score, age, and number of comorbidities were entered linearly, with the addition of squared terms for age and CART score, as these variables showed nonlinear associations with the outcomes of interest. Race, surgical status, insurance payer, location prior to ward, and BMI (underweight, <18.5 kg/m2; normal weight, 18.524.9 kg/m2; overweight, 25.029.9 kg/m2; obese, 3039.9 kg/m2; and severely obese, (40 kg/m2) were modeled as categorical variables.
Given that an individual patient could experience multiple hospitalizations during the study period, we performed a sensitivity analysis of all adjusted and unadjusted models using a single randomly selected hospitalization for each unique patient. In addition, we performed a sensitivity analysis of all patients who were not admitted to the ICU prior to their ward stay. Finally, we performed subgroup analyses of all unadjusted and adjusted models for each BMI category and surgical status.
All tests of significance used a 2‐sided P value <0.05. Statistical analyses were completed using Stata version 12.0 (StataCorp, College Station, TX).
RESULTS
Patient Characteristics
During the study period, 93,676 patient admissions from 53,150 unique patients resulted in the occurrence of 1,069 RRT activations, 6,305 ICU transfers, and 1,239 in‐hospital deaths. Within our sample, 40,034 patients had at least 1 inpatient record and at least 1 outpatient record. OSA diagnosis was present in 5,625 patients (10.6% of the total sample), with 4,748 patients having an OSA diagnosis code entered during a hospitalization, 2,143 with an OSA diagnosis code entered during an outpatient encounter, and 877 with both inpatient and outpatient diagnosis codes. These patients identified as having OSA contributed 12,745 (13.6%) hospital admissions.
Patients with an OSA diagnosis were more likely to be older (median age 59 years [interquartile range 4968] vs 55 years [3868]), male (49% vs 42%), overweight or obese (88% vs 62%), and more likely to carry diagnoses of diabetes (53.8% vs 25.5%), hypertension (45.3% vs 18.2%), arrhythmias (44.4% vs 26.7%), coronary artery disease (46.8% vs 23.5%), heart failure (35.8% vs 13.5%), and cerebrovascular disease (13.5% vs 8.1%) than patients without an OSA diagnosis (all comparisons significant, P < 0.001) (Table 2).
| Characteristic | Patient Admissions With OSA Diagnoses, n = 12,745 | Patient Admissions Without OSA Diagnoses, n = 80,931 | P Value |
|---|---|---|---|
| |||
| Age, y, median (IQR) | 59 (4968) | 55 (3868) | <0.001 |
| Female, n (%) | 6,514 (51%) | 47,202 (58%) | <0.001 |
| Race, n (%) | <0.001 | ||
| White | 4,205 (33%) | 30,119 (37%) | |
| Black/African American | 7,024 (55%) | 38,561 (48%) | |
| Asian | 561 (4.4%) | 3,419 (4.2%) | |
| American Indian or Native Alaskan | 20 (0.2%) | 113 (0.1%) | |
| More than 1 race | 127 (1%) | 843 (1%) | |
| Race unknown | 808 (6%) | 7,876 (10%) | |
| Insurance status, n (%) | <0.001 | ||
| Private | 4,484 (35%) | 32,467 (40%) | |
| Medicare/Medicaid | 8,201 (64%) | 42,208 (58%) | |
| Uninsured | 53 (0.4%) | 1,190 (1%) | |
| Unknown | 4 (<0.1%) | 16 (<0.1%) | |
| Location prior to wards, n (%) | <0.001 | ||
| ICU | 1,400 (11%) | 8,065 (10%) | |
| Emergency department | 4,633 (36%) | 25,170 (31%) | |
| Ambulatory admission | 6,712 (53%) | 47,696 (59%) | |
| Body mass index, kg/m2, n (%) | <0.001 | ||
| Normal (18.525) | 1,431 (11%) | 26,560 (33%) | |
| Underweight (<18.5) | 122 (1%) | 4,256 (5%) | |
| Overweight (2530) | 2,484 (20%) | 23,761 (29%) | |
| Obese (3040) | 4,959 (39%) | 19,132 (24%) | |
| Severely obese (40) | 3,745 (29%) | 7,171 (9%) | |
| Initial cardiac arrest risk triage score, median (IQR) | 4 (09) | 4 (09) | <0.001 |
| Underwent surgery, n (%) | 4,482 (35%) | 28,843 (36%) | 0.3 |
| Comorbidities | |||
| Number of comorbidities, median (IQR) | 2 (14) | 1 (02) | <0.001 |
| Arrhythmia | 5,659 (44%) | 21,581 (27%) | <0.001 |
| Diabetes mellitus | 6,855 (54%) | 20,641 (26%) | <0.001 |
| Hypertension | 5,777 (45%) | 14,728 (18%) | <0.001 |
| Coronary artery disease | 5,958 (47%) | 18,979 (23%) | <0.001 |
| Cerebrovascular accident | 1,725 (14%) | 6,556 (8%) | <0.001 |
| Congestive heart failure | 4,559 (36%) | 10,919 (13%) | <0.001 |
Complications and Adverse Outcomes
In the unadjusted analyses, the overall incidence of adverse outcomes was higher among patient admissions with a diagnosis of OSA compared to those without OSA (Table 3). Those with OSA were more likely to experience RRT activation (1.5% vs 1.1%), ICU transfer (8% vs 7%), and endotracheal intubation (3.9% vs 2.9%) than those without OSA diagnoses (P < 0.001 for all comparisons). There was no significant difference in the incidence of cardiac arrest between the 2 groups, nor was there a significant difference in length of stay. Unadjusted inpatient mortality for OSA patient admissions was lower than that for non‐OSA hospitalizations (1.1% vs 1.4%, P < 0.05). A diagnosis of OSA was associated with increased unadjusted odds for RRT activation (odds ratio [OR]: 1.36 [1.16‐1.59]) and ICU transfer (OR: 1.28 [1.20‐1.38]). However, after controlling for confounders, OSA was not associated with increased odds for RRT activation (OR: 1.14 [0.95‐1.36]) or intubation (OR: 1.06 [0.94‐1.19]), and was associated with slightly decreased odds for ICU transfer (OR: 0.91 [0.84‐0.99]) (Figure 1). Those with OSA had decreased adjusted odds of cardiac arrest (OR: 0.72 [0.55‐0.95]) compared to those without OSA. OSA was also associated with decreased odds of in‐hospital mortality before (OR: 0.83 [0.70‐0.99]) and after (OR: 0.70 [0.58‐0.85]) controlling for confounders.
| Characteristic | Patient Admissions With OSA Diagnoses, n = 12,745 | Patient Admissions Without OSA Diagnoses, n = 80,931 | P Value |
|---|---|---|---|
| |||
| Outcomes, n (%) | |||
| Composite outcomea | 1,137 (9%) | 5,792 (7%) | <0.001 |
| In‐hospital death | 144 (1.1%) | 1,095 (1.4%) | 0.04 |
| Rapid response team call | 188 (1.5%) | 881 (1.1%) | <0.001 |
| ICU transfer | 1,045 (8%) | 5,260 (7%) | <0.001 |
| Cardiac arrest | 413 (0.5%) | 73 (0.6%) | 0.36 |
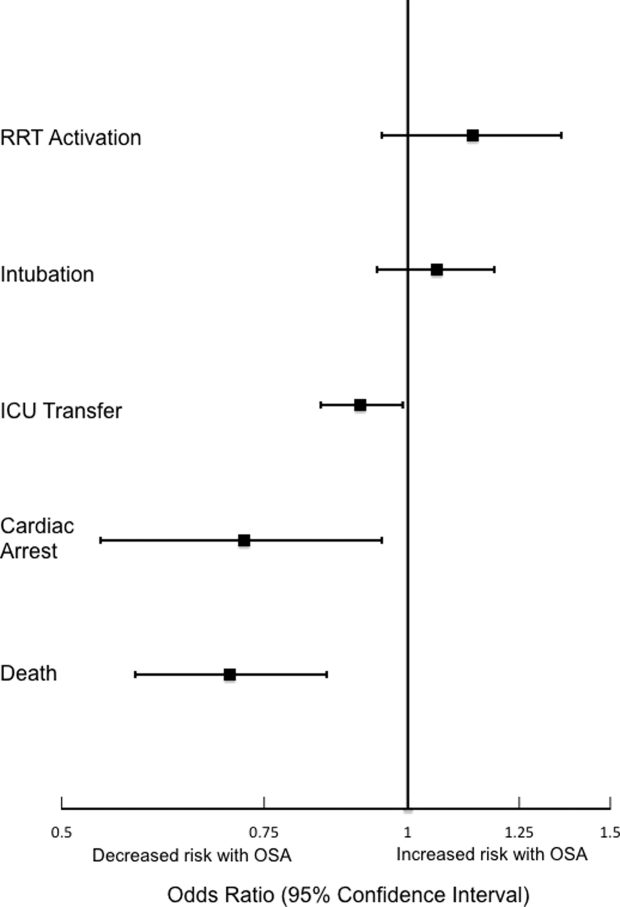
Sensitivity Analyses
The sensitivity analysis involving 1 randomly selected hospitalization per patient included a total of 53,150 patients. The results were similar to the main analysis, with adjusted odds of 1.01 (0.77‐1.32) for RRT activation, 0.86 (0.76‐0.96) for ICU transfer, and 0.69 (0.53‐0.89) for inpatient mortality. An additional sensitivity analysis included only patients who were not admitted to the ICU prior to their ward stay. This analysis included 84,211 hospitalizations and demonstrated similar findings, with adjusted odds of 0.70 for in‐hospital mortality (0.57‐0.87). Adjusted odds for RRT activation (OR: 1.12 [0.92‐1.37]) and ICU transfer (OR: 0.88 [0.81‐0.96] were also similar to the results of our main analysis.
Subgroup Analyses
Surgical and Nonsurgical Patients
Subgroup analyses of surgical versus nonsurgical patients (Figure 2) revealed similarly decreased adjusted odds of in‐hospital death for OSA patients in both groups (surgical OR: 0.69 [0.49‐0.97]; nonsurgical OR: 0.72 [0.58‐0.91]). Surgical patients with OSA diagnoses had decreased adjusted odds for ICU transfer (surgical OR: 0.82 [0.73‐0.92], but this finding was not seen in nonsurgical patients (OR: 1.03 [0.92‐1.15]).
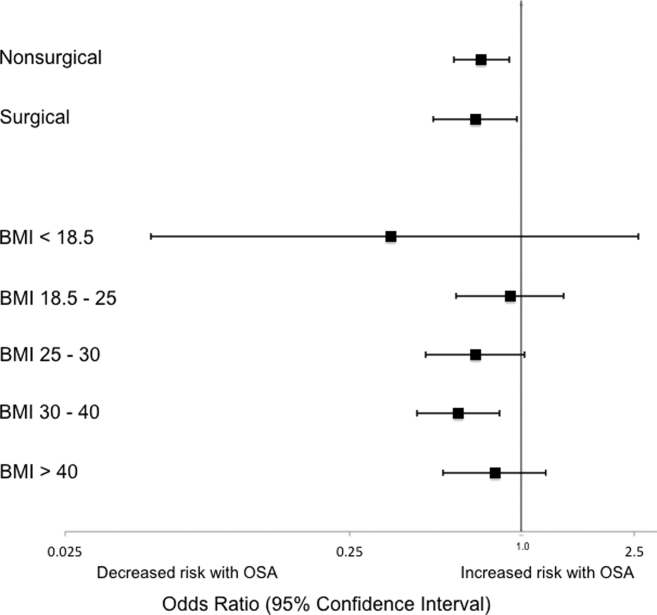
Patients Stratified by BMI
Examination across BMI categories (Figure 2) showed a significant decrease in adjusted odds of death for OSA patients with BMI 30 to 40 kg/m2 (OR: 0.60 [0.43‐0.84]). A nonsignificant decrease in adjusted odds of death was seen for OSA patients in all other groups. Adjusted odds ratios for the risk of RRT activation and ICU transfer in OSA patients within the different BMI categories were not statistically significant.
DISCUSSION
In this large observational single‐center cohort study, we found that OSA was associated with increased odds of adverse events, such as ICU transfers and RRT calls, but this risk was no longer present after adjusting for demographics, comorbidities, and presenting vital signs. Interestingly, we also found that patients with OSA had decreased adjusted odds for cardiac arrest and mortality. This mortality finding was robust to multiple sensitivity analyses and subgroup analyses. These results have significant implications for our understanding of the short‐term risks of sleep‐disordered breathing in hospitalized patients, and suggest the possibility that OSA is associated with a protective effect with regard to inpatient mortality.
Our findings are in line with other recent work in this area. In 2 large observational cohorts of surgical populations drawn from the nationally representative Nationwide Inpatient Sample administrative database, our group reported decreased odds of in‐hospital postoperative mortality in OSA patients.[10, 11] Using the same Nationwide Inpatient Sample, Lindenauer et al. showed that among inpatients hospitalized with pneumonia, OSA diagnosis was associated with increased rates of clinical deterioration but lower rates of inpatient mortality.[12] Although these 3 studies have identified decreased inpatient mortality among certain surgical populations and patients hospitalized with pneumonia, they are limited by using administrative databases that do not provide specific data on vital signs, presenting physiology, BMI, or race. Another important limitation of the Nationwide Inpatient Sample is the lack of any information on RRT activations and ICU transfers. Moreover, the database does not include information on outpatient diagnoses, which may have led to a significantly lower prevalence of OSA than expected in these studies. Despite the important methodological differences, our study corroborates this finding among a diverse cohort of hospitalized patients. Unlike these previous studies of postoperative patients or those hospitalized with pneumonia, we did not find an increased risk of adverse events associated with OSA after controlling for potential confounders.
The decreased mortality seen in OSA patients could be explained by these patients receiving more vigilant care, showing earlier signs of deterioration, or displaying more easily treatable forms of distress than patients without OSA. For example, earlier identification of deterioration could lead to earlier interventions, which could decrease inpatient mortality. In 2 studies of postsurgical patients,[10, 11] those with OSA diagnosis who developed respiratory failure were intubated earlier and received mechanical ventilation for a shorter period of time, suggesting that the cause of respiratory failure was rapidly reversible (eg, upper airway complications due to oversedation or excessive analgesia). However, we did not find increased adjusted odds of RRT activation or ICU transfer for OSA patients in our study, and so it is less likely that earlier recognition of decompensation occurred in our sample. In addition, our hospital did not have standardized practices for monitoring or managing OSA patients during the study period, which makes systematic early recognition of clinical deterioration among the OSA population in our study less likely.
Alternatively, there may be a true physiologic phenomenon providing a short‐term mortality benefit in those with OSA. It has been observed that patients with obesity (but without severe obesity) often have better outcomes after acute illness, whether by earlier or more frequent contact with medical care or heightened levels of metabolic reserve.[21, 22] However, our findings of decreased mortality for OSA patients remained even after controlling for BMI. An additional important possibility to consider is ischemic preconditioning, a well‐described phenomenon in which episodes of sublethal ischemia confer protection on tissues from subsequent ischemia/reperfusion damage.[23] Ischemic preconditioning has been demonstrated in models of cardiac and neural tissue[24, 25, 26] and has been shown to enhance stem cell survival by providing resistance to necrosis and lending functional benefits to heart, brain, and kidney models after transplantation.[25, 26, 27, 28, 29, 30, 31] The fundamentals of this concept may have applications in transplant and cardiac surgery,[32, 33] in the management of acute coronary syndromes and stroke,[32, 34, 35] and in athletic training and performance.[35, 36] Although OSA has been associated with long‐term cardiovascular morbidity and mortality,[2, 3, 4, 5, 6] the intermittent hypoxemia OSA patients experience could actually improve their ability to survive clinical deterioration in the short‐term (ie, during a hospitalization).
Limitations of our study include its conduction at a single center, which may prevent generalization to populations different than ours. Furthermore, during the study period, our hospital did not have formal guidelines or standardized management or monitoring practices for patients with OSA. Additionally, practices for managing OSA may vary across institutions. Therefore, our results may not be generalizable to hospitals with such protocols in place. However, as mentioned above, similar findings have been noted in studies using large, nationally representative administrative databases. In addition, we identified OSA via ICD‐9‐CM codes, which are likely insensitive for estimating the true prevalence of OSA in our sample. Despite this, our reported OSA prevalence of over 10% falls within the prevalence range reported in large epidemiological studies.[37, 38, 39] Finally, we did not have data on polysomnograms or treatment received for patients with OSA, so we do not know the severity of OSA or adequacy of treatment for these patients.
Notwithstanding our limitations, our study has several strengths. First, we included a large number of hospitalized patients across a diverse range of medical and surgical ward admissions, which increases the generalizability of our results. We also addressed potential confounders by including a large number of comorbidities and controlling for severity of presenting physiology with the CART score. The CART score, which contains physiologic variables such as respiratory rate, heart rate, and diastolic blood pressure, is an accurate predictor of cardiac arrest, ICU transfer, and in‐hospital mortality in our population.[40] Finally, we were able to obtain information about these diagnoses from outpatient as well as inpatient data.
In conclusion, we found that after adjustment for important confounders, OSA was associated with a decrease in hospital mortality and cardiac arrest but not with other adverse events on the wards. These results may suggest a protective benefit from OSA with regard to mortality, an advantage that could be explained by ischemic preconditioning or a higher level of care or vigilance not reflected by the number of RRT activations or ICU transfers experienced by these patients. Further research is needed to confirm these findings across other populations, to investigate the physiologic pathways by which OSA may produce these effects, and to examine the mechanisms by which treatment of OSA could influence these outcomes.
Acknowledgements
The authors thank Nicole Babuskow for administrative support, as well as Brian Furner and Timothy Holper for assistance with data acquisition.
Disclosures: Study concept and design: P.L., D.P.E, B.M., M.C.; acquisition of data: P.L.; analysis and interpretation of data: all authors; first drafting of the manuscript: P.L.; critical revision of the manuscript for important intellectual content: all authors; statistical analysis: P.L., F.Z., M.C.; obtained funding: D.P.E., M.C.; administrative, technical, and material support: F.Z., D.P.E.; study supervision: D.P.E, B.M., M.C.; data access and responsibility: P.L. and M.C. had full access to all the data in the study, and take responsibility for the integrity of the data and the accuracy of the data analysis. Drs. Churpek and Edelson have a patent pending (ARCD. P0535US.P2) for risk stratification algorithms for hospitalized patients. Dr. Churpek and Dr. Edelson are both supported by career development awards from the National Heart, Lung, and Blood Institute (K08 HL121080 and K23 HL097157, respectively). Dr. Churpek has received honoraria from Chest for invited speaking engagements. In addition, Dr. Edelson has received research support and honoraria from Philips Healthcare (Andover, MA), research support from the American Heart Association (Dallas, TX) and Laerdal Medical (Stavanger, Norway), and an honorarium from Early Sense (Tel Aviv, Israel). She has ownership interest in Quant HC (Chicago, IL), which is developing products for risk stratification of hospitalized patients. Dr. Mokhlesi is supported by National Institutes of Health grant R01HL119161. Dr. Mokhlesi has served as a consultant to Philips/Respironics and has received research support from Philips/Respironics.
- , , , , , . Increased prevalence of sleep‐disordered breathing in adults. Am J Epidemiol. 2013;177(9):1006–1014.
- , , , . Long‐term cardiovascular outcomes in men with obstructive sleep apnoea‐hypopnoea with or without treatment with continuous positive airway pressure: an observational study. Lancet. 2005;365(9464):1046–1053.
- , , , . Prospective study of the association between sleep‐disordered breathing and hypertension. N Engl J Med. 2000;342(19):1378–1384.
- , , , , , . Obstructive sleep apnea as a risk factor for stroke and death. N Engl J Med. 2005;353(19):2034–2041.
- , , , , . Obstructive sleep apnea and risk of cardiovascular events and all‐cause mortality: a decade‐long historical cohort study. PLoS Med. 2014;11(2):e1001599.
- , , , , , . Sleep apnea as an independent risk factor for all‐cause mortality: the Busselton Health Study. Sleep. 2008;31(8):1079–1085.
- , , , , . Postoperative complications in patients with obstructive sleep apnea. Chest. 2012;141(2):436–441.
- , , , , , . Meta‐analysis of the association between obstructive sleep apnoea and postoperative outcome. Br J Anaesth. 2012;109(6):897–906.
- , , , et al. The impact of sleep apnea on postoperative utilization of resources and adverse outcomes. Anesth Analg. 2014;118(2):407–418.
- , , , , , . Sleep‐disordered breathing and postoperative outcomes after bariatric surgery: analysis of the nationwide inpatient sample. Obes Surg. 2013;23(11):1842–1851.
- , , , , , . Sleep‐disordered breathing and postoperative outcomes after elective surgery: analysis of the nationwide inpatient sample. Chest. 2013;144:903–914.
- , , , , , . Prevalence, treatment and outcomes associated with obstructive sleep apnea among patients hospitalized with pneumonia. Chest. 2014;145(5):1032–1038.
- , , , et al. Experimental pain and opioid analgesia in volunteers at high risk for obstructive sleep apnea. PLoS One. 2013;8(1):e54807.
- , , , , . Increased CSF opioid activity in sleep apnea syndrome. Regression after successful treatment. Chest. 1989;96(2):250–254.
- , , , et al. Comparison of the relaxant effects of diazepam, flunitrazepam and midazolam on airway smooth muscle. Br J Anaesth. 1992;69(1):65–69.
- , . Effect of flurazepam on sleep‐disordered breathing and nocturnal oxygen desaturation in asymptomatic subjects. Am J Med. 1982;73(2):239–243.
- , , , , , . Derivation of a cardiac arrest prediction model using ward vital signs*. Crit Care Med. 2012;40(7):2102–2108.
- , , , , . Using electronic health record data to develop and validate a prediction model for adverse outcomes in the wards*. Crit Care Med. 2014;42(4):841–848.
- , , , et al. The APACHE III prognostic system. Risk prediction of hospital mortality for critically ill hospitalized adults. Chest. 1991;100(6):1619–1636.
- , , , , , . Predicting cardiac arrest on the wards: a nested case‐control study. Chest. 2012;141(5):1170–1176.
- , , , , , . Mortality of patients with respiratory insufficiency and adult respiratory distress syndrome after surgery: the obesity paradox. J Intensive Care Med. 2012;27(4):306–311.
- , , , et al. Body mass index and mortality in acute myocardial infarction patients. Am J Med. 2012(8);125:796–803.
- , , . Preconditioning with ischemia: a delay of lethal cell injury in ischemic myocardium. Circulation. 1986;74(5):1124–1136.
- , , , . Ischemic preconditioning slows energy metabolism and delays ultrastructural damage during a sustained ischemic episode. Circ Res. 1990;66(4):913–931.
- , , , et al. Transplantation of hypoxia‐preconditioned mesenchymal stem cells improves infarcted heart function via enhanced survival of implanted cells and angiogenesis. J Thorac Cardiovasc Surg. 2008;135(4):799–808.
- , , , et al. Hypoxic preconditioning with cobalt of bone marrow mesenchymal stem cells improves cell migration and enhances therapy for treatment of ischemic acute kidney injury. PLoS One. 2013;8(5):e62703.
- , . Human embryonic stem cell neural differentiation and enhanced cell survival promoted by hypoxic preconditioning. Cell Death Dis. 2010;1:e22.
- , , , et al. Ischemic pre‐conditioning enhances the mobilization and recruitment of bone marrow stem cells to protect against ischemia/reperfusion injury in the late phase. J Am Coll Cardiol. 2009;53(19):1814–1822.
- , , , et al. Hypoxic preconditioning enhances bone marrow mesenchymal stem cell migration via Kv2.1 channel and FAK activation. Am J Physiol Cell Physiol. 2011;301(2):C362–C372.
- , , , et al. In vitro hypoxic preconditioning of embryonic stem cells as a strategy of promoting cell survival and functional benefits after transplantation into the ischemic rat brain. Exp Neurol. 2008;210(2):656–670.
- , , , , . Transplantation of hypoxia preconditioned bone marrow mesenchymal stem cells enhances angiogenesis and neurogenesis after cerebral ischemia in rats. Neurobiol Dis. 2012;46(3):635–645.
- , , . Translation of remote ischaemic preconditioning into clinical practice. Lancet. 2009;374(9700):1557–1565.
- , , . Novel adjunctive treatments of myocardial infarction. World J Cardiol. 2014;6(6):434–443.
- , . Hypoxic‐preconditioning enhances the regenerative capacity of neural stem/progenitors in subventricular zone of newborn piglet brain. Stem Cell Res. 2013;11(2):669–686.
- , , , , . Ischemic preconditioning improves oxygen saturation and attenuates hypoxic pulmonary vasoconstriction at high altitude. High Alt Med Biol. 2014;15(2):155–161.
- , , , et al. Remote preconditioning improves maximal performance in highly trained athletes. Med Sci Sports Exerc. 2011;43(7):1280–1286.
- , , , . Obstructive sleep apnea‐hypopnea and related clinical features in a population‐based sample of subjects aged 30 to 70 yr. Am J Respir Crit Care Med. 2001;163(3 pt 1):685–689.
- , , , , , . The occurrence of sleep‐disordered breathing among middle‐aged adults. N Engl J Med. 1993;328(17):1230–1235.
- , , . Epidemiology of obstructive sleep apnea: a population health perspective. Am J Respir Crit Care Med. 2002;165(9):1217–1239.
- , , . Risk stratification of hospitalized patients on the wards. Chest. 2013;143(6):1758–1765.
Obstructive sleep apnea (OSA) is an increasingly prevalent condition characterized by intermittent airway obstruction during sleep, which leads to hypoxemia, hypercapnia, and fragmented sleep. The current prevalence estimates of moderate to severe OSA (apnea‐hypopnea index 15, measured as events/hour) in middle‐aged adults are approximately 13% in men and 6% in women.[1] OSA is a well‐described independent risk factor for long‐term neurocognitive, cardiovascular, and cerebrovascular morbidity and mortality.[2, 3, 4, 5, 6]
Recent studies have also identified OSA as an independent risk factor for adverse perioperative outcomes, including endotracheal intubation, intensive care unit (ICU) transfer, and increased length of stay.[7, 8, 9, 10, 11] Paradoxically, despite an increase in the risk of complications, several of these studies did not find an association between in‐hospital death and OSA even after controlling for potential confounders.[9, 10, 11] Furthermore, a recent study of patients hospitalized for pneumonia reported increased rates of clinical deterioration and mechanical ventilation, but also lower odds of inpatient mortality in patients with OSA.[12]
These studies may have been limited by the absence of physiologic data, which prevented controlling for severity of illness. It is also unclear whether these previously described associations between OSA and adverse clinical outcomes hold true for general hospital inpatients. OSA may be worsened by medications frequently used in hospitals, such as narcotics and benzodiazepines. Opiate use contributes to both central and obstructive sleep apneas,[13, 14] and benzodiazepines are known to produce airway smooth muscle relaxation and can cause respiratory depression.[15] In fact, the use of benzodiazepines has been implicated in the unmasking of OSA in patients with previously undiagnosed sleep‐disordered breathing.[16] These findings suggest mechanisms by which OSA could contribute to an increased risk in hospital ward patients for rapid response team (RRT) activation, ICU transfer, cardiac arrest, and in‐hospital death.
The aim of this study was to determine the independent association between OSA and in‐hospital mortality in ward patients. We also aimed to investigate the association of OSA with clinical deterioration on the wards, while controlling for patient characteristics, initial physiology, and severity of illness.
MATERIALS AND METHODS
Setting and Study Population
This observational cohort study was performed at an academic tertiary care medical center with approximately 500 beds. Data were obtained from all adult patients hospitalized on the wards between November 1, 2008 and October 1, 2013. Our hospital has utilized an RRT, led by a critical care nurse and respiratory therapist with hospitalist and pharmacist consultation available upon request, since 2008. This team is separate from the team that responds to a cardiac arrest. Criteria for RRT activation include tachypnea, tachycardia, hypotension, and staff worry, but specific vital sign thresholds are not specified.
The study analyzed deidentified data from the hospital's Clinical Research Data Warehouse, which is maintained by the Center for Research Informatics at The University of Chicago. The study protocol was approved by the University of Chicago Institutional Review Board (IRB #16995A).
Data Collection
Patient age, sex, race, body mass index (BMI), and location prior to ward admission (ie, whether they were admitted from the emergency department, transferred from the ICU, or directly admitted from clinic or home) were collected. Patients who underwent surgery during their admission were identified using the hospital's admission‐transfer‐discharge database. In addition, routinely collected vital signs (eg, respiratory rate, blood pressure, heart rate) were obtained from the electronic health record (Epic, Verona, WI). To determine severity of illness, the first set of vital signs measured on hospital presentation were utilized to calculate the cardiac arrest risk triage (CART) score, a vital‐signbased early warning score we previously developed and validated for predicting adverse events in our population.[17] The CART score ranges from 0 to 57, with points assigned for abnormalities in respiratory rate, heart rate, diastolic blood pressure, and age. If any vital sign was missing, the next available measurement was pulled into the set. If any vital sign remained missing after this change, the median value for that particular location (ie, wards, ICU, or emergency department) was imputed as previously described.[18, 19]
Patients with OSA were identified by the following International Classification of Diseases, Ninth Revision, Clinical Modification (ICD‐9‐CM) codes using inpatient and outpatient medical records: 278.03, 327.20, 327.23, 327.29, 780.51, 780.53, and 780.57 (Table 1). Data on other patient comorbidities, including coronary artery disease, congestive heart failure, arrhythmias, uncomplicated and complicated diabetes mellitus, hypertension, and cerebrovascular disease were collected using specific ICD‐9‐CM codes from both inpatient and outpatient records. Information on insurance payer was also collected from the hospital's billing database. Insurance payers were grouped into the following categories: private payer, Medicare/Medicaid, and no insurance. Patients with both public and private payers were counted as being privately insured.
| Diagnosis Code | Description | % of Sleep Apnea Diagnosesa |
|---|---|---|
| ||
| 327.23 | Obstructive sleep apnea | 65.6 |
| 780.57 | Unspecified sleep apnea | 19.4 |
| 780.53 | Hypersomnia with sleep apnea, unspecified | 11.7 |
| 780.51 | Insomnia with sleep apnea, unspecified | 1.5 |
| 327.2 | Organic sleep apnea, unspecified | 0.2 |
| 278.03 | Obesity hypoventilation syndrome | 1.7 |
Outcomes
The primary outcome of the study was in‐hospital mortality. Secondary outcomes included length of stay, RRT activation, transfer to the ICU, endotracheal intubation, cardiac arrest (defined as a loss of pulse with attempted resuscitation) on the wards, and a composite outcome of RRT activation, ICU transfer, and death. Because cardiac arrests on the wards result either in death or ICU transfer following successful resuscitation, this variable was omitted from the composite outcome. Cardiac arrests were identified using a prospectively validated quality improvement database that has been described previously.[20] ICU transfer was identified using the hospital's admission‐transfer‐discharge database. Only the index cardiac arrest, intubation, RRT, or ICU transfer for each admission was used in the study, but more than 1 type of outcome could occur for each patient (eg, a patient who died following an unsuccessful resuscitation attempt would count as both a cardiac arrest and a death).
Statistical Analysis
Patient characteristics were compared using Student t tests, Wilcoxon rank sum tests, and 2 statistics, as appropriate. Unadjusted logistic regression models were fit to estimate the change in odds of each adverse event and a composite outcome of any event for patient admissions with OSA compared to those without OSA. Adjusted logistic regression models were then fit for each outcome to control for patient characteristics (age, sex, BMI, insurance status, and individual comorbidities), location immediately prior to ward admission, and admission severity of illness (as measured by CART score). In the adjusted model, CART score, age, and number of comorbidities were entered linearly, with the addition of squared terms for age and CART score, as these variables showed nonlinear associations with the outcomes of interest. Race, surgical status, insurance payer, location prior to ward, and BMI (underweight, <18.5 kg/m2; normal weight, 18.524.9 kg/m2; overweight, 25.029.9 kg/m2; obese, 3039.9 kg/m2; and severely obese, (40 kg/m2) were modeled as categorical variables.
Given that an individual patient could experience multiple hospitalizations during the study period, we performed a sensitivity analysis of all adjusted and unadjusted models using a single randomly selected hospitalization for each unique patient. In addition, we performed a sensitivity analysis of all patients who were not admitted to the ICU prior to their ward stay. Finally, we performed subgroup analyses of all unadjusted and adjusted models for each BMI category and surgical status.
All tests of significance used a 2‐sided P value <0.05. Statistical analyses were completed using Stata version 12.0 (StataCorp, College Station, TX).
RESULTS
Patient Characteristics
During the study period, 93,676 patient admissions from 53,150 unique patients resulted in the occurrence of 1,069 RRT activations, 6,305 ICU transfers, and 1,239 in‐hospital deaths. Within our sample, 40,034 patients had at least 1 inpatient record and at least 1 outpatient record. OSA diagnosis was present in 5,625 patients (10.6% of the total sample), with 4,748 patients having an OSA diagnosis code entered during a hospitalization, 2,143 with an OSA diagnosis code entered during an outpatient encounter, and 877 with both inpatient and outpatient diagnosis codes. These patients identified as having OSA contributed 12,745 (13.6%) hospital admissions.
Patients with an OSA diagnosis were more likely to be older (median age 59 years [interquartile range 4968] vs 55 years [3868]), male (49% vs 42%), overweight or obese (88% vs 62%), and more likely to carry diagnoses of diabetes (53.8% vs 25.5%), hypertension (45.3% vs 18.2%), arrhythmias (44.4% vs 26.7%), coronary artery disease (46.8% vs 23.5%), heart failure (35.8% vs 13.5%), and cerebrovascular disease (13.5% vs 8.1%) than patients without an OSA diagnosis (all comparisons significant, P < 0.001) (Table 2).
| Characteristic | Patient Admissions With OSA Diagnoses, n = 12,745 | Patient Admissions Without OSA Diagnoses, n = 80,931 | P Value |
|---|---|---|---|
| |||
| Age, y, median (IQR) | 59 (4968) | 55 (3868) | <0.001 |
| Female, n (%) | 6,514 (51%) | 47,202 (58%) | <0.001 |
| Race, n (%) | <0.001 | ||
| White | 4,205 (33%) | 30,119 (37%) | |
| Black/African American | 7,024 (55%) | 38,561 (48%) | |
| Asian | 561 (4.4%) | 3,419 (4.2%) | |
| American Indian or Native Alaskan | 20 (0.2%) | 113 (0.1%) | |
| More than 1 race | 127 (1%) | 843 (1%) | |
| Race unknown | 808 (6%) | 7,876 (10%) | |
| Insurance status, n (%) | <0.001 | ||
| Private | 4,484 (35%) | 32,467 (40%) | |
| Medicare/Medicaid | 8,201 (64%) | 42,208 (58%) | |
| Uninsured | 53 (0.4%) | 1,190 (1%) | |
| Unknown | 4 (<0.1%) | 16 (<0.1%) | |
| Location prior to wards, n (%) | <0.001 | ||
| ICU | 1,400 (11%) | 8,065 (10%) | |
| Emergency department | 4,633 (36%) | 25,170 (31%) | |
| Ambulatory admission | 6,712 (53%) | 47,696 (59%) | |
| Body mass index, kg/m2, n (%) | <0.001 | ||
| Normal (18.525) | 1,431 (11%) | 26,560 (33%) | |
| Underweight (<18.5) | 122 (1%) | 4,256 (5%) | |
| Overweight (2530) | 2,484 (20%) | 23,761 (29%) | |
| Obese (3040) | 4,959 (39%) | 19,132 (24%) | |
| Severely obese (40) | 3,745 (29%) | 7,171 (9%) | |
| Initial cardiac arrest risk triage score, median (IQR) | 4 (09) | 4 (09) | <0.001 |
| Underwent surgery, n (%) | 4,482 (35%) | 28,843 (36%) | 0.3 |
| Comorbidities | |||
| Number of comorbidities, median (IQR) | 2 (14) | 1 (02) | <0.001 |
| Arrhythmia | 5,659 (44%) | 21,581 (27%) | <0.001 |
| Diabetes mellitus | 6,855 (54%) | 20,641 (26%) | <0.001 |
| Hypertension | 5,777 (45%) | 14,728 (18%) | <0.001 |
| Coronary artery disease | 5,958 (47%) | 18,979 (23%) | <0.001 |
| Cerebrovascular accident | 1,725 (14%) | 6,556 (8%) | <0.001 |
| Congestive heart failure | 4,559 (36%) | 10,919 (13%) | <0.001 |
Complications and Adverse Outcomes
In the unadjusted analyses, the overall incidence of adverse outcomes was higher among patient admissions with a diagnosis of OSA compared to those without OSA (Table 3). Those with OSA were more likely to experience RRT activation (1.5% vs 1.1%), ICU transfer (8% vs 7%), and endotracheal intubation (3.9% vs 2.9%) than those without OSA diagnoses (P < 0.001 for all comparisons). There was no significant difference in the incidence of cardiac arrest between the 2 groups, nor was there a significant difference in length of stay. Unadjusted inpatient mortality for OSA patient admissions was lower than that for non‐OSA hospitalizations (1.1% vs 1.4%, P < 0.05). A diagnosis of OSA was associated with increased unadjusted odds for RRT activation (odds ratio [OR]: 1.36 [1.16‐1.59]) and ICU transfer (OR: 1.28 [1.20‐1.38]). However, after controlling for confounders, OSA was not associated with increased odds for RRT activation (OR: 1.14 [0.95‐1.36]) or intubation (OR: 1.06 [0.94‐1.19]), and was associated with slightly decreased odds for ICU transfer (OR: 0.91 [0.84‐0.99]) (Figure 1). Those with OSA had decreased adjusted odds of cardiac arrest (OR: 0.72 [0.55‐0.95]) compared to those without OSA. OSA was also associated with decreased odds of in‐hospital mortality before (OR: 0.83 [0.70‐0.99]) and after (OR: 0.70 [0.58‐0.85]) controlling for confounders.
| Characteristic | Patient Admissions With OSA Diagnoses, n = 12,745 | Patient Admissions Without OSA Diagnoses, n = 80,931 | P Value |
|---|---|---|---|
| |||
| Outcomes, n (%) | |||
| Composite outcomea | 1,137 (9%) | 5,792 (7%) | <0.001 |
| In‐hospital death | 144 (1.1%) | 1,095 (1.4%) | 0.04 |
| Rapid response team call | 188 (1.5%) | 881 (1.1%) | <0.001 |
| ICU transfer | 1,045 (8%) | 5,260 (7%) | <0.001 |
| Cardiac arrest | 413 (0.5%) | 73 (0.6%) | 0.36 |
Sensitivity Analyses
The sensitivity analysis involving 1 randomly selected hospitalization per patient included a total of 53,150 patients. The results were similar to the main analysis, with adjusted odds of 1.01 (0.77‐1.32) for RRT activation, 0.86 (0.76‐0.96) for ICU transfer, and 0.69 (0.53‐0.89) for inpatient mortality. An additional sensitivity analysis included only patients who were not admitted to the ICU prior to their ward stay. This analysis included 84,211 hospitalizations and demonstrated similar findings, with adjusted odds of 0.70 for in‐hospital mortality (0.57‐0.87). Adjusted odds for RRT activation (OR: 1.12 [0.92‐1.37]) and ICU transfer (OR: 0.88 [0.81‐0.96] were also similar to the results of our main analysis.
Subgroup Analyses
Surgical and Nonsurgical Patients
Subgroup analyses of surgical versus nonsurgical patients (Figure 2) revealed similarly decreased adjusted odds of in‐hospital death for OSA patients in both groups (surgical OR: 0.69 [0.49‐0.97]; nonsurgical OR: 0.72 [0.58‐0.91]). Surgical patients with OSA diagnoses had decreased adjusted odds for ICU transfer (surgical OR: 0.82 [0.73‐0.92], but this finding was not seen in nonsurgical patients (OR: 1.03 [0.92‐1.15]).
Patients Stratified by BMI
Examination across BMI categories (Figure 2) showed a significant decrease in adjusted odds of death for OSA patients with BMI 30 to 40 kg/m2 (OR: 0.60 [0.43‐0.84]). A nonsignificant decrease in adjusted odds of death was seen for OSA patients in all other groups. Adjusted odds ratios for the risk of RRT activation and ICU transfer in OSA patients within the different BMI categories were not statistically significant.
DISCUSSION
In this large observational single‐center cohort study, we found that OSA was associated with increased odds of adverse events, such as ICU transfers and RRT calls, but this risk was no longer present after adjusting for demographics, comorbidities, and presenting vital signs. Interestingly, we also found that patients with OSA had decreased adjusted odds for cardiac arrest and mortality. This mortality finding was robust to multiple sensitivity analyses and subgroup analyses. These results have significant implications for our understanding of the short‐term risks of sleep‐disordered breathing in hospitalized patients, and suggest the possibility that OSA is associated with a protective effect with regard to inpatient mortality.
Our findings are in line with other recent work in this area. In 2 large observational cohorts of surgical populations drawn from the nationally representative Nationwide Inpatient Sample administrative database, our group reported decreased odds of in‐hospital postoperative mortality in OSA patients.[10, 11] Using the same Nationwide Inpatient Sample, Lindenauer et al. showed that among inpatients hospitalized with pneumonia, OSA diagnosis was associated with increased rates of clinical deterioration but lower rates of inpatient mortality.[12] Although these 3 studies have identified decreased inpatient mortality among certain surgical populations and patients hospitalized with pneumonia, they are limited by using administrative databases that do not provide specific data on vital signs, presenting physiology, BMI, or race. Another important limitation of the Nationwide Inpatient Sample is the lack of any information on RRT activations and ICU transfers. Moreover, the database does not include information on outpatient diagnoses, which may have led to a significantly lower prevalence of OSA than expected in these studies. Despite the important methodological differences, our study corroborates this finding among a diverse cohort of hospitalized patients. Unlike these previous studies of postoperative patients or those hospitalized with pneumonia, we did not find an increased risk of adverse events associated with OSA after controlling for potential confounders.
The decreased mortality seen in OSA patients could be explained by these patients receiving more vigilant care, showing earlier signs of deterioration, or displaying more easily treatable forms of distress than patients without OSA. For example, earlier identification of deterioration could lead to earlier interventions, which could decrease inpatient mortality. In 2 studies of postsurgical patients,[10, 11] those with OSA diagnosis who developed respiratory failure were intubated earlier and received mechanical ventilation for a shorter period of time, suggesting that the cause of respiratory failure was rapidly reversible (eg, upper airway complications due to oversedation or excessive analgesia). However, we did not find increased adjusted odds of RRT activation or ICU transfer for OSA patients in our study, and so it is less likely that earlier recognition of decompensation occurred in our sample. In addition, our hospital did not have standardized practices for monitoring or managing OSA patients during the study period, which makes systematic early recognition of clinical deterioration among the OSA population in our study less likely.
Alternatively, there may be a true physiologic phenomenon providing a short‐term mortality benefit in those with OSA. It has been observed that patients with obesity (but without severe obesity) often have better outcomes after acute illness, whether by earlier or more frequent contact with medical care or heightened levels of metabolic reserve.[21, 22] However, our findings of decreased mortality for OSA patients remained even after controlling for BMI. An additional important possibility to consider is ischemic preconditioning, a well‐described phenomenon in which episodes of sublethal ischemia confer protection on tissues from subsequent ischemia/reperfusion damage.[23] Ischemic preconditioning has been demonstrated in models of cardiac and neural tissue[24, 25, 26] and has been shown to enhance stem cell survival by providing resistance to necrosis and lending functional benefits to heart, brain, and kidney models after transplantation.[25, 26, 27, 28, 29, 30, 31] The fundamentals of this concept may have applications in transplant and cardiac surgery,[32, 33] in the management of acute coronary syndromes and stroke,[32, 34, 35] and in athletic training and performance.[35, 36] Although OSA has been associated with long‐term cardiovascular morbidity and mortality,[2, 3, 4, 5, 6] the intermittent hypoxemia OSA patients experience could actually improve their ability to survive clinical deterioration in the short‐term (ie, during a hospitalization).
Limitations of our study include its conduction at a single center, which may prevent generalization to populations different than ours. Furthermore, during the study period, our hospital did not have formal guidelines or standardized management or monitoring practices for patients with OSA. Additionally, practices for managing OSA may vary across institutions. Therefore, our results may not be generalizable to hospitals with such protocols in place. However, as mentioned above, similar findings have been noted in studies using large, nationally representative administrative databases. In addition, we identified OSA via ICD‐9‐CM codes, which are likely insensitive for estimating the true prevalence of OSA in our sample. Despite this, our reported OSA prevalence of over 10% falls within the prevalence range reported in large epidemiological studies.[37, 38, 39] Finally, we did not have data on polysomnograms or treatment received for patients with OSA, so we do not know the severity of OSA or adequacy of treatment for these patients.
Notwithstanding our limitations, our study has several strengths. First, we included a large number of hospitalized patients across a diverse range of medical and surgical ward admissions, which increases the generalizability of our results. We also addressed potential confounders by including a large number of comorbidities and controlling for severity of presenting physiology with the CART score. The CART score, which contains physiologic variables such as respiratory rate, heart rate, and diastolic blood pressure, is an accurate predictor of cardiac arrest, ICU transfer, and in‐hospital mortality in our population.[40] Finally, we were able to obtain information about these diagnoses from outpatient as well as inpatient data.
In conclusion, we found that after adjustment for important confounders, OSA was associated with a decrease in hospital mortality and cardiac arrest but not with other adverse events on the wards. These results may suggest a protective benefit from OSA with regard to mortality, an advantage that could be explained by ischemic preconditioning or a higher level of care or vigilance not reflected by the number of RRT activations or ICU transfers experienced by these patients. Further research is needed to confirm these findings across other populations, to investigate the physiologic pathways by which OSA may produce these effects, and to examine the mechanisms by which treatment of OSA could influence these outcomes.
Acknowledgements
The authors thank Nicole Babuskow for administrative support, as well as Brian Furner and Timothy Holper for assistance with data acquisition.
Disclosures: Study concept and design: P.L., D.P.E, B.M., M.C.; acquisition of data: P.L.; analysis and interpretation of data: all authors; first drafting of the manuscript: P.L.; critical revision of the manuscript for important intellectual content: all authors; statistical analysis: P.L., F.Z., M.C.; obtained funding: D.P.E., M.C.; administrative, technical, and material support: F.Z., D.P.E.; study supervision: D.P.E, B.M., M.C.; data access and responsibility: P.L. and M.C. had full access to all the data in the study, and take responsibility for the integrity of the data and the accuracy of the data analysis. Drs. Churpek and Edelson have a patent pending (ARCD. P0535US.P2) for risk stratification algorithms for hospitalized patients. Dr. Churpek and Dr. Edelson are both supported by career development awards from the National Heart, Lung, and Blood Institute (K08 HL121080 and K23 HL097157, respectively). Dr. Churpek has received honoraria from Chest for invited speaking engagements. In addition, Dr. Edelson has received research support and honoraria from Philips Healthcare (Andover, MA), research support from the American Heart Association (Dallas, TX) and Laerdal Medical (Stavanger, Norway), and an honorarium from Early Sense (Tel Aviv, Israel). She has ownership interest in Quant HC (Chicago, IL), which is developing products for risk stratification of hospitalized patients. Dr. Mokhlesi is supported by National Institutes of Health grant R01HL119161. Dr. Mokhlesi has served as a consultant to Philips/Respironics and has received research support from Philips/Respironics.
- , , , , , . Increased prevalence of sleep‐disordered breathing in adults. Am J Epidemiol. 2013;177(9):1006–1014.
- , , , . Long‐term cardiovascular outcomes in men with obstructive sleep apnoea‐hypopnoea with or without treatment with continuous positive airway pressure: an observational study. Lancet. 2005;365(9464):1046–1053.
- , , , . Prospective study of the association between sleep‐disordered breathing and hypertension. N Engl J Med. 2000;342(19):1378–1384.
- , , , , , . Obstructive sleep apnea as a risk factor for stroke and death. N Engl J Med. 2005;353(19):2034–2041.
- , , , , . Obstructive sleep apnea and risk of cardiovascular events and all‐cause mortality: a decade‐long historical cohort study. PLoS Med. 2014;11(2):e1001599.
- , , , , , . Sleep apnea as an independent risk factor for all‐cause mortality: the Busselton Health Study. Sleep. 2008;31(8):1079–1085.
- , , , , . Postoperative complications in patients with obstructive sleep apnea. Chest. 2012;141(2):436–441.
- , , , , , . Meta‐analysis of the association between obstructive sleep apnoea and postoperative outcome. Br J Anaesth. 2012;109(6):897–906.
- , , , et al. The impact of sleep apnea on postoperative utilization of resources and adverse outcomes. Anesth Analg. 2014;118(2):407–418.
- , , , , , . Sleep‐disordered breathing and postoperative outcomes after bariatric surgery: analysis of the nationwide inpatient sample. Obes Surg. 2013;23(11):1842–1851.
- , , , , , . Sleep‐disordered breathing and postoperative outcomes after elective surgery: analysis of the nationwide inpatient sample. Chest. 2013;144:903–914.
- , , , , , . Prevalence, treatment and outcomes associated with obstructive sleep apnea among patients hospitalized with pneumonia. Chest. 2014;145(5):1032–1038.
- , , , et al. Experimental pain and opioid analgesia in volunteers at high risk for obstructive sleep apnea. PLoS One. 2013;8(1):e54807.
- , , , , . Increased CSF opioid activity in sleep apnea syndrome. Regression after successful treatment. Chest. 1989;96(2):250–254.
- , , , et al. Comparison of the relaxant effects of diazepam, flunitrazepam and midazolam on airway smooth muscle. Br J Anaesth. 1992;69(1):65–69.
- , . Effect of flurazepam on sleep‐disordered breathing and nocturnal oxygen desaturation in asymptomatic subjects. Am J Med. 1982;73(2):239–243.
- , , , , , . Derivation of a cardiac arrest prediction model using ward vital signs*. Crit Care Med. 2012;40(7):2102–2108.
- , , , , . Using electronic health record data to develop and validate a prediction model for adverse outcomes in the wards*. Crit Care Med. 2014;42(4):841–848.
- , , , et al. The APACHE III prognostic system. Risk prediction of hospital mortality for critically ill hospitalized adults. Chest. 1991;100(6):1619–1636.
- , , , , , . Predicting cardiac arrest on the wards: a nested case‐control study. Chest. 2012;141(5):1170–1176.
- , , , , , . Mortality of patients with respiratory insufficiency and adult respiratory distress syndrome after surgery: the obesity paradox. J Intensive Care Med. 2012;27(4):306–311.
- , , , et al. Body mass index and mortality in acute myocardial infarction patients. Am J Med. 2012(8);125:796–803.
- , , . Preconditioning with ischemia: a delay of lethal cell injury in ischemic myocardium. Circulation. 1986;74(5):1124–1136.
- , , , . Ischemic preconditioning slows energy metabolism and delays ultrastructural damage during a sustained ischemic episode. Circ Res. 1990;66(4):913–931.
- , , , et al. Transplantation of hypoxia‐preconditioned mesenchymal stem cells improves infarcted heart function via enhanced survival of implanted cells and angiogenesis. J Thorac Cardiovasc Surg. 2008;135(4):799–808.
- , , , et al. Hypoxic preconditioning with cobalt of bone marrow mesenchymal stem cells improves cell migration and enhances therapy for treatment of ischemic acute kidney injury. PLoS One. 2013;8(5):e62703.
- , . Human embryonic stem cell neural differentiation and enhanced cell survival promoted by hypoxic preconditioning. Cell Death Dis. 2010;1:e22.
- , , , et al. Ischemic pre‐conditioning enhances the mobilization and recruitment of bone marrow stem cells to protect against ischemia/reperfusion injury in the late phase. J Am Coll Cardiol. 2009;53(19):1814–1822.
- , , , et al. Hypoxic preconditioning enhances bone marrow mesenchymal stem cell migration via Kv2.1 channel and FAK activation. Am J Physiol Cell Physiol. 2011;301(2):C362–C372.
- , , , et al. In vitro hypoxic preconditioning of embryonic stem cells as a strategy of promoting cell survival and functional benefits after transplantation into the ischemic rat brain. Exp Neurol. 2008;210(2):656–670.
- , , , , . Transplantation of hypoxia preconditioned bone marrow mesenchymal stem cells enhances angiogenesis and neurogenesis after cerebral ischemia in rats. Neurobiol Dis. 2012;46(3):635–645.
- , , . Translation of remote ischaemic preconditioning into clinical practice. Lancet. 2009;374(9700):1557–1565.
- , , . Novel adjunctive treatments of myocardial infarction. World J Cardiol. 2014;6(6):434–443.
- , . Hypoxic‐preconditioning enhances the regenerative capacity of neural stem/progenitors in subventricular zone of newborn piglet brain. Stem Cell Res. 2013;11(2):669–686.
- , , , , . Ischemic preconditioning improves oxygen saturation and attenuates hypoxic pulmonary vasoconstriction at high altitude. High Alt Med Biol. 2014;15(2):155–161.
- , , , et al. Remote preconditioning improves maximal performance in highly trained athletes. Med Sci Sports Exerc. 2011;43(7):1280–1286.
- , , , . Obstructive sleep apnea‐hypopnea and related clinical features in a population‐based sample of subjects aged 30 to 70 yr. Am J Respir Crit Care Med. 2001;163(3 pt 1):685–689.
- , , , , , . The occurrence of sleep‐disordered breathing among middle‐aged adults. N Engl J Med. 1993;328(17):1230–1235.
- , , . Epidemiology of obstructive sleep apnea: a population health perspective. Am J Respir Crit Care Med. 2002;165(9):1217–1239.
- , , . Risk stratification of hospitalized patients on the wards. Chest. 2013;143(6):1758–1765.
© 2015 Society of Hospital Medicine

Optimal Rapid Response System Bundle
The theory behind rapid response teams (RRTs), namely to provide critical care resources to patients with clinical deterioration on the wards, is such common sense that failure to do so seems unethical. This idea, combined with evidence that many cardiac arrests on the wards are predictable and potentially preventable events, led to the proliferation of RRTs across the country and a Joint Commission mandate.[1] However, data from clinical trials have failed to consistently confirm the value of these teams, likely a product of the wide variability in implementation practices across institutions.[2]
In this issue of the Journal of Hospital Medicine, Davis and colleagues demonstrate improvements in both mortality and cardiac arrest rates outside the intensive care unit (ICU) following implementation of their rapid response system in 2 hospitals.[3] Although several other studies have shown similar results, what makes this implementation unique is the bundle approach that included proactive rounding by the charge nurse from each unit, annual focused training of team members and staff, and an integrated, continuous, quality‐improvement feedback loop. Bundles are common in successful quality‐improvement work, but can be challenging for deciphering which of the individual components are driving the results, leaving readers to venture an educated guess. In the current bundle, the novel use of the charge nurse has some significant appeal as a candidate primary driver of the impact, because it likely had 2 distinct actions: (1) proactive rounding and (2) promoting a culture change, both of which are well supported in the literature.4,5
Several studies, including this one, have demonstrated a dose‐response association between the number of RRT activations and patient outcomes, with a low number of RRT activations deemed a major contributor to the neutral results of the large multicenter, randomized, controlled MERIT trial.[6, 7] Additionally, delays in treatment and transfer to the ICU for unstable patients are known to increase mortality.[8] One way to increase the number of patients seen by the RRT and decrease activation delays is by instituting proactive rounding by the team on high‐risk patients. This was the strategy employed in a landmark ward‐randomized trial by Priestley and colleagues, which demonstrated a significant improvement in mortality from proactive rounding on patients deemed to be at high risk of clinical deterioration as calculated by an early warning score or due to caregiver concern.4
Identification of at‐risk patients for proactive rounding can be accomplished with gestalt, as was done by the charge nurse in the current study, or using specific individual criteria such as recent discharge from an ICU. Alternatively, this can be accomplished using composite vital signbased risk scores, such as the Modified Early Warning Score (MEWS).[9] Recently, several newer algorithms that integrate vital signs, laboratory data, and demographics have been shown to outperform the MEWS.[10, 11] Such systems promise an exciting age of real‐time computer‐generated risk stratification, with the ability to automate and standardize the selection of patients for proactive rounding across institutions.
Interestingly, the selection of the charge nurse, rather than someone who did not reside on the unit, to conduct the surveillance rounds likely had another benefit: expediting and facilitating the culture change necessary for a successful implementation. The integration of the charge nurse into the RRT likely led to a local reinforcement of important cultural changes that were already happening at the institutional level. It is clear that culture change is essential in any quality improvement endeavor, and previous literature on RRTs supports this notion.[5]
Rapid response systems are complex and include the activation criteria, team composition and training, and an administrative component. A multifaceted, bundled approach is likely to be required for success. Furthermore, regardless of what risk stratification criteria are used, proactive rounding on high‐risk patients is likely to increase the yield. Utilizing the charge nurse in that effort is a creative use of a preexisting local resource and is worthy of future study.
Disclosures: Dr. Churpek is supported by a career development award from the National Heart, Lung, and Blood Institute (K08 HL121080) and has received honoraria from CHEST for invited speaking engagements. Drs. Churpek and Edelson have a patent pending (ARCD.P0535US.P2) for risk stratification algorithms for hospitalized patients, and Dr. Edelson has an ownership interest in Quant HC (Chicago, IL), which seeks to commercialize those algorithms.
- , , . Rapid‐response teams. N Engl J Med. 2011;365(2):139–146.
- , , , , . Rapid response teams: a systematic review and meta‐analysis. Arch Intern Med. 2010;170(1):18–26.
- , , , et al. A novel configuration of a traditional rapid response team decreases non‐ICU arrests and overall hospital mortality. J Hosp Med. 2015;10(6):352–357
- , , , et al. Introducing Critical Care Outreach: a ward‐randomised trial of phased introduction in a general hospital. Intensive Care Med. 2004;30(7):1398–1404.
- , , , , , . Long‐term culture change related to rapid response system implementation. Med Educ. 2014;48(12):1211–1219.
- , , , et al. Introduction of the medical emergency team (MET) system: a cluster‐randomised controlled trial. Lancet. 2005;365(9477):2091–2097.
- , , . Effectiveness of the Medical Emergency Team: the importance of dose. Crit Care. 2009;13(5):313.
- , , , , . Inpatient transfers to the intensive care unit: delays are associated with increased mortality and morbidity. J Gen Intern Med. 2003;18(2):77–83.
- , , , . Validation of a modified Early Warning Score in medical admissions. QJM. 2001;94(10):521–526.
- , , , et al. Multicenter development and validation of a risk stratification tool for ward patients. Am J Respir Crit Care Med. 2014;190(6):649–655.
- , , , , , . Early detection of impending physiologic deterioration among patients who are not in intensive care: development of predictive models using data from an automated electronic medical record. J Hosp Med. 2012;7(5):388–395.
The theory behind rapid response teams (RRTs), namely to provide critical care resources to patients with clinical deterioration on the wards, is such common sense that failure to do so seems unethical. This idea, combined with evidence that many cardiac arrests on the wards are predictable and potentially preventable events, led to the proliferation of RRTs across the country and a Joint Commission mandate.[1] However, data from clinical trials have failed to consistently confirm the value of these teams, likely a product of the wide variability in implementation practices across institutions.[2]
In this issue of the Journal of Hospital Medicine, Davis and colleagues demonstrate improvements in both mortality and cardiac arrest rates outside the intensive care unit (ICU) following implementation of their rapid response system in 2 hospitals.[3] Although several other studies have shown similar results, what makes this implementation unique is the bundle approach that included proactive rounding by the charge nurse from each unit, annual focused training of team members and staff, and an integrated, continuous, quality‐improvement feedback loop. Bundles are common in successful quality‐improvement work, but can be challenging for deciphering which of the individual components are driving the results, leaving readers to venture an educated guess. In the current bundle, the novel use of the charge nurse has some significant appeal as a candidate primary driver of the impact, because it likely had 2 distinct actions: (1) proactive rounding and (2) promoting a culture change, both of which are well supported in the literature.4,5
Several studies, including this one, have demonstrated a dose‐response association between the number of RRT activations and patient outcomes, with a low number of RRT activations deemed a major contributor to the neutral results of the large multicenter, randomized, controlled MERIT trial.[6, 7] Additionally, delays in treatment and transfer to the ICU for unstable patients are known to increase mortality.[8] One way to increase the number of patients seen by the RRT and decrease activation delays is by instituting proactive rounding by the team on high‐risk patients. This was the strategy employed in a landmark ward‐randomized trial by Priestley and colleagues, which demonstrated a significant improvement in mortality from proactive rounding on patients deemed to be at high risk of clinical deterioration as calculated by an early warning score or due to caregiver concern.4
Identification of at‐risk patients for proactive rounding can be accomplished with gestalt, as was done by the charge nurse in the current study, or using specific individual criteria such as recent discharge from an ICU. Alternatively, this can be accomplished using composite vital signbased risk scores, such as the Modified Early Warning Score (MEWS).[9] Recently, several newer algorithms that integrate vital signs, laboratory data, and demographics have been shown to outperform the MEWS.[10, 11] Such systems promise an exciting age of real‐time computer‐generated risk stratification, with the ability to automate and standardize the selection of patients for proactive rounding across institutions.
Interestingly, the selection of the charge nurse, rather than someone who did not reside on the unit, to conduct the surveillance rounds likely had another benefit: expediting and facilitating the culture change necessary for a successful implementation. The integration of the charge nurse into the RRT likely led to a local reinforcement of important cultural changes that were already happening at the institutional level. It is clear that culture change is essential in any quality improvement endeavor, and previous literature on RRTs supports this notion.[5]
Rapid response systems are complex and include the activation criteria, team composition and training, and an administrative component. A multifaceted, bundled approach is likely to be required for success. Furthermore, regardless of what risk stratification criteria are used, proactive rounding on high‐risk patients is likely to increase the yield. Utilizing the charge nurse in that effort is a creative use of a preexisting local resource and is worthy of future study.
Disclosures: Dr. Churpek is supported by a career development award from the National Heart, Lung, and Blood Institute (K08 HL121080) and has received honoraria from CHEST for invited speaking engagements. Drs. Churpek and Edelson have a patent pending (ARCD.P0535US.P2) for risk stratification algorithms for hospitalized patients, and Dr. Edelson has an ownership interest in Quant HC (Chicago, IL), which seeks to commercialize those algorithms.
- , , . Rapid‐response teams. N Engl J Med. 2011;365(2):139–146.
- , , , , . Rapid response teams: a systematic review and meta‐analysis. Arch Intern Med. 2010;170(1):18–26.
- , , , et al. A novel configuration of a traditional rapid response team decreases non‐ICU arrests and overall hospital mortality. J Hosp Med. 2015;10(6):352–357
- , , , et al. Introducing Critical Care Outreach: a ward‐randomised trial of phased introduction in a general hospital. Intensive Care Med. 2004;30(7):1398–1404.
- , , , , , . Long‐term culture change related to rapid response system implementation. Med Educ. 2014;48(12):1211–1219.
- , , , et al. Introduction of the medical emergency team (MET) system: a cluster‐randomised controlled trial. Lancet. 2005;365(9477):2091–2097.
- , , . Effectiveness of the Medical Emergency Team: the importance of dose. Crit Care. 2009;13(5):313.
- , , , , . Inpatient transfers to the intensive care unit: delays are associated with increased mortality and morbidity. J Gen Intern Med. 2003;18(2):77–83.
- , , , . Validation of a modified Early Warning Score in medical admissions. QJM. 2001;94(10):521–526.
- , , , et al. Multicenter development and validation of a risk stratification tool for ward patients. Am J Respir Crit Care Med. 2014;190(6):649–655.
- , , , , , . Early detection of impending physiologic deterioration among patients who are not in intensive care: development of predictive models using data from an automated electronic medical record. J Hosp Med. 2012;7(5):388–395.