User login
Mental Status to Predict Mortality
Altered mental status (AMS), characterized by abnormal changes in a patient's arousal and/or cognition, is a significant predictor of hospital mortality.[1, 2, 3] Yet despite its prevalence[3, 4, 5] and importance, up to three‐quarters of AMS events go unrecognized by caregivers.[6, 7, 8] Acute changes in mental status, often caused by delirium in the hospitalized patient,[3] can present nonspecifically, making it difficult to detect and distinguish from other diagnoses such as depression or dementia.[7, 9] Further complicating the recognition of AMS, numerous and imprecise qualitative descriptors such as confused and alert and oriented are used in clinical practice to describe the mental status of patients.[10] Thus, more objective measures may result in improved detection of altered mental status and in earlier diagnostic and therapeutic interventions.
In critically ill patients, several scales have been widely adopted for quantifying mental status. The Richmond Agitation and Sedation Scale (RASS) was created to optimize sedation.[11] The Glasgow Coma Scale (GCS) was developed for head‐trauma patients[12] and is now a standardized assessment tool in intensive care units,[13] the emergency department,[14] and the prehospital setting.[15] In addition, a simplified scale, AVPU (Alert, responsive to Verbal stimuli, responsive to Painful stimuli, and Unresponsive) was initially used in the primary survey of trauma patients[16] but is now a common component of early‐warning scores and rapid response activation criteria, such as the Modified Early Warning Score (MEWS).[17, 18] In fact, in a systematic review of 72 distinct early‐warning scores, 89% of the scores used AVPU as the measure of mentation.[17] However, the utility of these 3 scales is not well established in the general‐ward setting. Our aim was therefore to compare the accuracies of AVPU, GCS, and RASS for predicting mortality in hospitalized general‐ward patients to provide insight into the accuracy of these different scores for clinical deterioration.
METHODS
Study Setting and Protocol
We conducted an observational cohort study of consecutive adult general‐ward admissions from July 2011 through January 2013 at a 500‐bed, urban US teaching hospital. During the study period, no early‐warning scoring systems were in place on the hospital wards. Rapid response teams responding to altered mental status would do so without specific thresholds for activation. During this period, nurses on the general floors were expected to record each patient's GCS and RASS score in the electronic health record (EPIC Systems Corp., Verona, WI) as part of the routine patient assessment at least once every 12‐hour shift. AVPU assessments were extracted from the eye component of the GCS. The letter A was assigned to a GCS Eye score of 4 (opens eyes spontaneously), V to a score of 3 (opens eyes in response to voice), P to a score of 2 (opens eyes in response to painful stimuli), and U to a score of 1 (does not open eyes). To avoid comparison of mental‐status scores at different time points, only concurrent GCS and RASS scores, documented within 10 minutes of one another, were included in the analysis.
Location and time‐stamped GCS and RASS scores, demographics, and in‐hospital mortality data were obtained from the hospital's Clinical Research Data Warehouse, which is maintained by the Center for Research Informatics at The University of Chicago. The study protocol and data‐collection mechanisms were approved by The University of Chicago Institutional Review Board (#16995A).
Statistical Analysis
Baseline admission characteristics were described using proportions (%) and measures of central tendency (mean, standard deviations [SD]; median, interquartile ranges [IQR]). Patient severity of illness at first ward observation was calculated using the MEWS.[19] All mental‐status observations during a patient's ward stay were included in the analysis. Odds ratios for 24‐hour mortality following an abnormal mental‐status score were calculated using generalized estimating equations, with an exchangeable correlation structure to account for the correlation of scores within the same patient, as more than 1 abnormal mental‐status score may have been documented within the 24 hours preceding death. Spearman's rank correlation coefficients () were used to estimate the correlation among AVPU, GCS, and RASS scores.
The predictive accuracies of AVPU, GCS, RASS, and the subscales of GCS were compared using the area under the receiver operating characteristic curve (AUC), with mortality within 24 hours of a mental‐status observation as the primary outcome and the mental‐status score as the predictor variable. Although AUCs are typically used as a measure of discriminative ability, this study used AUCs to summarize both sensitivity and specificity across a range of cutoffs, providing an overall measure of predictive accuracies across mental‐status scales. To estimate AUCs, the AVPU, GCS, and GCS subscales were entered into a logistic regression model as ordinal variables, whereas RASS was entered as a nominal variable due to its positive and negative components, and predicted probabilities were calculated. In addition, a combined model was fit where GCS and RASS were classified as categorical independent variables. AUCs were then calculated by utilizing the predicted probabilities from each logistic regression model using the trapezoidal rule.[20] A sensitivity analysis was performed to estimate the internal validity of the RASS model using 10‐fold cross‐validation.
Predefined subgroup analyses were performed that compared the accuracies of AVPU, GCS, and RASS for predicting 24‐hour mortality in patients above and below the median age of the study population, and between patients who underwent surgery during their admission or not (surgical vs medical). All tests of significance used a 2‐sided P value <0.05. All data analysis was performed using Stata version 13.0 (StataCorp, College Station, TX).
RESULTS
During the study period, 313,577 complete GCS and 305,177 RASS scores were recorded in the electronic health record by nursing staff. A total of 26,806 (17,603 GCS and 9203 RASS) observations were excluded due to nonsimultaneous measurement of the other score, resulting in 295,974 paired mental‐status observations. These observations were obtained from 26,873 admissions in 17,660 unique patients, with a median MEWS at ward admission of 1 (IQR 11). The mean patient age was 57 years (SD 17), and 23% were surgical patients (Table 1). Patients spent a median 63.9 hours (IQR 26.7118.6) on the wards per admission and contributed a median of 3 paired observations (IQR 24) per day, with 91% of patients having at least 2 observations per day. A total of 417 (1.6%) general‐ward admissions resulted in death during the hospitalization, with 354 mental‐status observations occurring within 24 hours of a death. In addition, 26,618 (99.9%) admissions had at least 1 paired mental‐status observation within the last 24 hours of their ward stay.
| |
| Total no. of admissions | 26,873 |
| Total no. of unique patients | 17,660 |
| Age, y, mean (SD) | 57 (17) |
| Female sex, n (%) | 14,293 (53) |
| Race, n (%) | |
| White | 10,516 (39) |
| Black | 12,580 (47) |
| Other/unknown | 3,777 (14) |
| Admission MEWS, median (IQR) | 1 (11) |
| Days on ward, median (IQR) | 5 (310) |
| Observations per person, per day, median (IQR) | 3 (24) |
| Underwent surgery during hospitalization, n (%) | 6,141 (23) |
| Deaths, n (%) | 417 (1.6) |
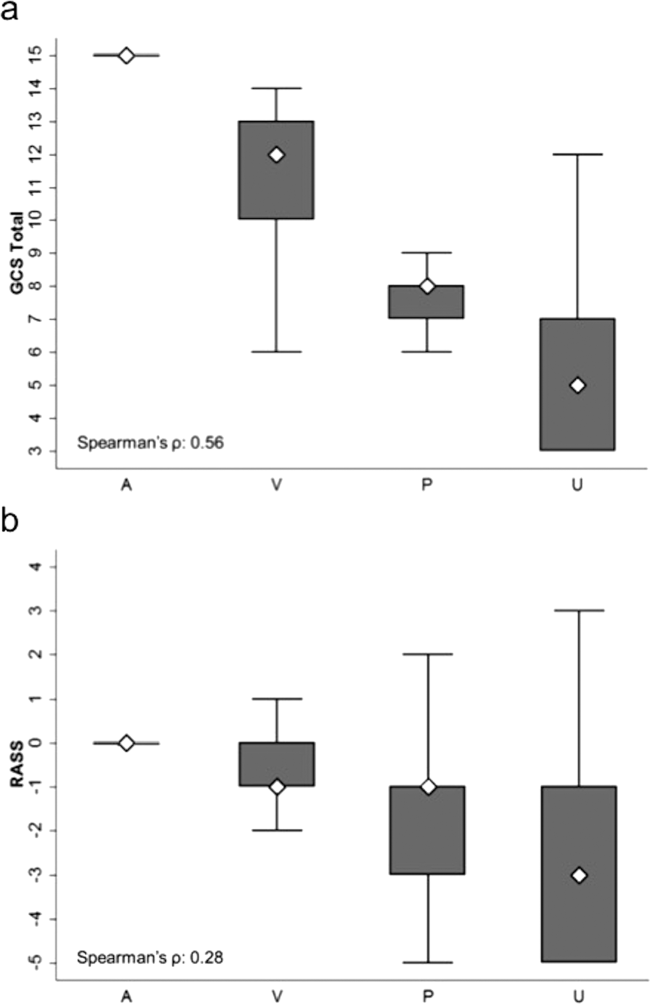
AVPU was moderately correlated with GCS (Spearman's =0.56) (Figure 1a) and weakly correlated with RASS (Spearman's =0.28) (Figure 1b). GCS scores were also weakly correlated to RASS (Spearman's =0.13, P<0.001). Notably, AVPU mapped to distinct levels of GCS, with Alert associated with a median GCS total score of 15, Voice a score of 12, Pain a score of 8, and Unresponsive a score of 5. Abnormal mental‐status scores on any scale were associated with significantly higher odds of death within 24 hours than normal mental‐status scores (Table 2). This association was consistent within the 3 subscales of GCS and for scores in both the sedation (<0) and agitation (>0) ranges of RASS.
| Mental‐status Score | Observations, n (%) | Odds Ratio for Mortality (95% CI) |
|---|---|---|
| ||
| GCS Eye (AVPU) | ||
| 4 (alert) | 289,857 (98) | Reference |
| <4 (not alert) | 6,117 (2) | 33.8 (23.947.9) |
| GCS Verbal | ||
| 5 | 277,862 (94) | Reference |
| 4 | 11,258 (4) | 4.7 (2.87.9) |
| <4 | 6,854 (2) | 52.7 (38.073.2) |
| GCS Motor | ||
| 6 | 287,441 (97) | Reference |
| <6 | 8,533 (3) | 41.8 (30.756.9) |
| GCS total | ||
| 15 | 276,042 (93) | Reference |
| 13, 14 | 12,437 (4) | 5.2 (3.38.3) |
| <13 | 7,495 (3) | 55.5 (40.077.1) |
| RASS | ||
| >0 | 6,867 (2) | 8.5 (5.613.0) |
| 0 | 275,708 (93) | Reference |
| <0 | 13,339 (5) | 25.8 (19.234.6) |
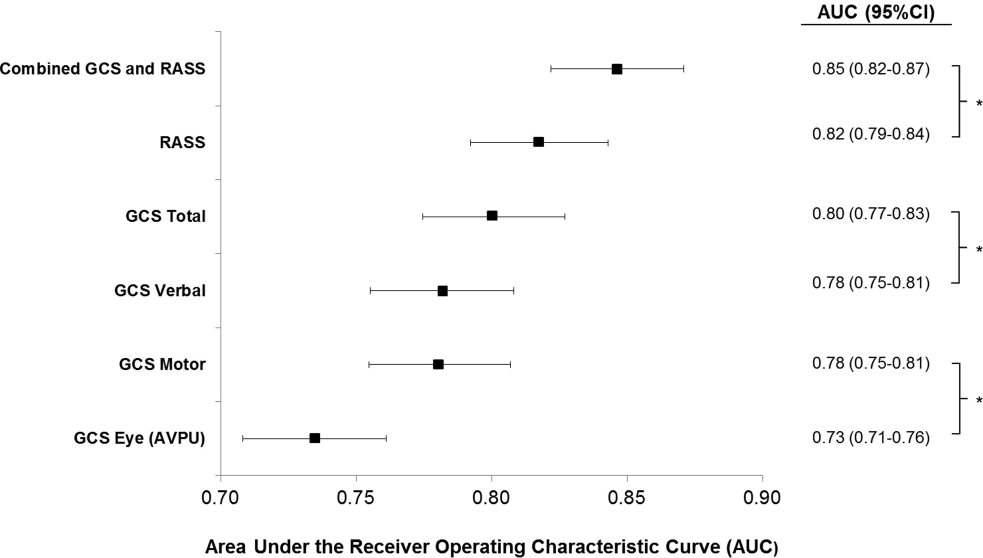
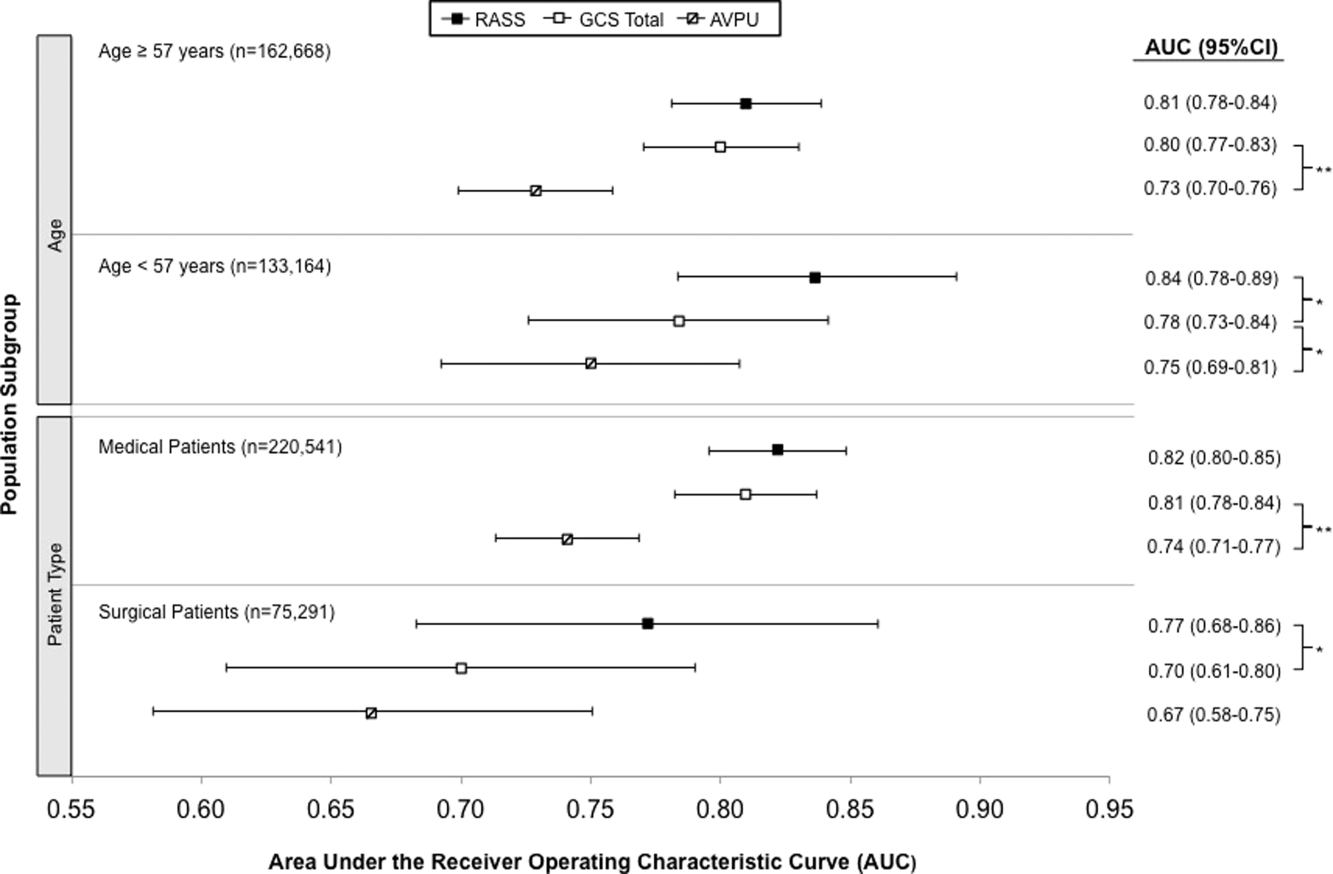
AVPU was the least accurate predictor of mortality (AUC 0.73 [95% confidence interval {CI}: 0.710.76]), whereas simultaneous use of GCS and RASS was the most accurate predictor (AUC 0.85 [95% CI: 0.820.87] (Figure 2). The accuracies of GCS and RASS were not significantly different from one another in the total study population (AUC 0.80 [95% CI: 0.770.83] and 0.82 [0.790.84], respectively, P=0.13). Ten‐fold cross‐validation to estimate the internal validity of the RASS model resulted in a lower AUC (0.78 [95% CI: 0.750.81]) for RASS as a predictor of 24‐hour mortality. Subgroup analysis indicated that RASS was more accurate than GCS in younger patients (<57 years old) and in surgical patients (Figure 3).
Removal of the 255 admissions missing a paired mental‐status observation within the last 24 hours of their ward stay resulted in no change in the AUC values. A sensitivity analysis for prediction of a combined secondary outcome of 24‐hour intensive care unit ICU transfer or cardiac arrest yielded lower AUCs for each mental‐status scale, with no change in the association among scales.
DISCUSSION
To our knowledge, this study is the first to compare the accuracies of AVPU, GCS, and RASS for predicting mortality in the general‐ward setting. Similar to McNarry and Goldhill, we demonstrated that AVPU scores mapped to distinct levels of GCS. Although our study reports the same median GCS scores of 15 and 8 for AVPU levels of Alert and Pain, respectively, we indicate slightly lower corresponding median GCS scores for AVPU scores of Voice (12 vs 13) and Unresponsive (5 vs 6) than their previous work.[21] We found that AVPU was the least accurate predictor of mortality within 24 hours of an observation, and the combination of GCS and RASS was the most accurate. RASS was at least as accurate a predictor for 24‐hour mortality in comparison to GCS total in the overall study population. However, the RASS score was the most accurate individual score in surgical and younger patients. These findings suggest that changing from the commonly used AVPU scale to the RASS and/or GCS would improve the prognostic ability of mental‐status assessments on the general wards.
Buist and colleagues have previously demonstrated altered mental status to be one of the strongest predictors of death on the wards. In that study, a GCS score of 3 and a decrease in GCS score by more than 2 points were independently associated with mortality (odds ratio 6.1 [95% CI: 3.111.8] and 5.5 [95% CI: 2.611.9], respectively).[22] We have also previously shown that after adjusting for vital signs, being unresponsive to pain was associated with a 4.5‐fold increase in the odds of death within 24 hours,[23]whereas Subbe and colleagues showed a relative risk ratio of 5.2 (95% CI: 1.518.1) for the combined endpoint of cardiac arrest, death at 60 days, or admission to the intensive care/high dependency unit.[19] In the current study, the magnitude of these associations was even stronger, with a GCS score <13 correlating with a 55‐fold increase in the odds of death, compared to a normal GCS, and not being alert being associated with a 33.8‐fold increase in the odds of death. This difference in magnitude is likely a product of the univariate nature of the current analysis, compared to both the Buist et al. and Churpek et al. studies, which adjusted for vital signs, thereby lessening the impact of any single predictor. Because this study was designed to compare mental‐status variables to one another for future model inclusion, and all the analyses were paired, confounding by additional predictors of death was not a concern.
One of the potential strengths of RASS over GCS and AVPU is its ability to measure agitation levels, in addition to depressed mentation, a feature that has been shown to be present in up to 60% of delirium episodes.[24] This may also explain why RASS was the most accurate predictor of mortality in our subset of younger patients and surgical patients, because hyperactive delirium is more common in younger and healthier patients, which surgical patients tend to be as compared to medical patients.[25, 26] In this study, we found negative RASS scores portending a worse prognosis than positive ones, which supports previous findings that hypoactive delirium had a higher association with mortality than hyperactive delirium at 6 months (hazard ratio 1.90 vs 1.37) and at 1 year (hazard ratio 1.60 vs 1.30) in elderly patients at postacute‐care facilities in 2 separate studies.[27, 28] However, a study of patients undergoing surgery for hip fracture found that patients with hyperactive delirium were more likely to die or be placed in a nursing home at 1 month follow‐up when compared to patients with purely hypoactive delirium (79% vs 32%, P=0.003).[29]
We found the assessment of RASS and GCS by ward nurses to be highly feasible. During the study period, nurses assessed mental status with the GCS and RASS scales at least once per 12‐hour shift in 91% of patients. GCS has been shown to be reliably and accurately recorded by experienced nurses (reliability coefficient=0.944 with 96.4% agreement with expert ratings).[30] RASS can take <30 seconds to administer, and in previous studies of the ICU setting has been shown to have over 94% nurse compliance for administration,[31] and good inter‐rater reliability (weighted kappa 0.66 and 0.89, respectively).[31, 32] Further, in a prior survey of 55 critical care nurses, 82% agreed that RASS was easy to score and clinically relevant.[31]
This study has several limitations. First, it was conducted in a single academic institution, which may limit generalizability to other hospitals. Second, baseline cognition and comorbidities were not available in the dataset, so we were unable to conduct additional subgroup analyses by these categories. However, we used age and hospital admission type as proxies. Third, the AVPU scores in this study were extracted from the Eye subset of the GCS scale, as AVPU was not directly assessed on our wards during the study period. Clinical assessment of mental status on the AVPU scale notes the presence of any active patient response (eg, eye opening, grunting, moaning, movement) to increasingly noxious stimuli. As such, our adaptation of AVPU using only eye‐opening criteria may underestimate the true number of patients correctly classified as alert, or responding to vocal/painful stimuli. However, a sensitivity analysis comparing directly assessed AVPU during a 3‐year period prior to the study implementation at our institution, and AVPU derived from the GCS Eye subscale for the study period, indicated no difference in predictive value for 24‐hour mortality. Fourth, we did not perform trend analyses for change from baseline mental status or evolution of AMS, which may more accurately predict 24‐hour mortality than discrete mental‐status observations. Finally, the 3 scales we compared differ in length, which may bias the AUC against AVPU, a 4‐point scale with a trapezoidal ROC curve compared to the smoother curve generated by the 15‐point GCS scale, for example. However, the lack of discrimination of the AVPU is the likely source of its lesser accuracy.
CONCLUSION
In the general‐ward setting, routine collection of GCS and RASS is feasible, and both are significantly more accurate for predicting mortality than the more commonly used AVPU scale. In addition, the combination of GCS and RASS has greater accuracy than any of the 3 individual scales. RASS may be particularly beneficial in the assessment of younger and/or surgical patients. Routine documentation and tracking of GCS and/or RASS by nurses may improve the detection of clinical deterioration in general‐ward patients. In addition, future early‐warning scores may benefit from the inclusion of GCS and/or RASS in lieu of AVPU.
Disclosures
Drs. Churpek and Edelson have a patent pending (ARCD. P0535US.P2) for risk stratification algorithms for hospitalized patients. Dr. Churpek is supported by a career development award from the National Heart, Lung, and Blood Institute (K08 HL121080). Dr. Edelson has received research support from the National Heart, Lung, and Blood Institute (K23 HL097157), Philips (Andover, MA), the American Heart Association (Dallas, TX), Laerdal Medical (Stavanger, Norway), and Early Sense (Tel Aviv, Israel). She has ownership interest in Quant HC (Chicago, IL), which is developing products for risk stratification of hospitalized patients. All other authors report no conflicts of interest.
- , , , et al. Delirium as a predictor of mortality in mechanically ventilated patients in the intensive care unit. JAMA. 2004;291(14):1753–1762.
- , , , , , Delirium in hospitalized older persons: outcomes and predictors. J Am Geriatr Soc. 1994;42(8):809–815.
- , , Occurrence and outcome of delirium in medical in‐patients: a systematic literature review. Age Ageing. 2006;35(4):350–364.
- , , , et al. Delirium. The occurrence and persistence of symptoms among elderly hospitalized patients. Arch Intern Med. 1992;152(2):334–340.
- , , Postoperative delirium. A review of 80 primary data‐collection studies. Arch Intern Med. 1995;155(5):461–465.
- , , , , Nurses' recognition of delirium and its symptoms: comparison of nurse and researcher ratings. Arch Intern Med. 2001;161(20):2467–2473.
- , , The misdiagnosis of delirium. Psychosomatics. 1997;38(5):433–439.
- , , , et al. Current opinions regarding the importance, diagnosis, and management of delirium in the intensive care unit: a survey of 912 healthcare professionals. Crit Care Med. 2004;32(1):106–112.
- , Misdiagnosing delirium as depression in medically ill elderly patients. Arch Intern Med. 1995;155(22):2459–2464.
- Doctors and nurses use of the word confused. Br J Psychiatry. 1984;145:441–443.
- , , , et al. The Richmond Agitation‐Sedation Scale: validity and reliability in adult intensive care unit patients. Am J Respir Crit Care Med. 2002;166(10):1338–1344.
- , Assessment and prognosis of coma after head injury. Acta Neurochir (Wien). 1976;34(1–4):45–55.
- , , , , Glasgow Coma Scale score in the evaluation of outcome in the intensive care unit: findings from the Acute Physiology and Chronic Health Evaluation III study. Crit Care Med. 1993;21(10):1459–1465.
- , , Variability in agreement between physicians and nurses when measuring the Glasgow Coma Scale in the emergency department limits its clinical usefulness. Emerg Med Australas. 2006;18(4):379–384.
- , , , Reliability of the Glasgow Coma Scale when used by emergency physicians and paramedics. J Trauma. 1993;34(1):46–48.
- , ; American College of Surgeons. Committee on Trauma. Advanced Trauma Life Support Program For Physicians: ATLS. 5th ed. Chicago, IL: American College of Surgeons; 1993.
- , , , Review and performance evaluation of aggregate weighted 'track and trigger' systems. Resuscitation. 2008;77(2):170–179.
- , , , , A review, and performance evaluation, of single‐parameter “track and trigger” systems. Resuscitation. 2008;79(1):11–21.
- , , , Validation of a modified Early Warning score in medical admissions. QJM. 2001;94(10):521–526.
- , , Comparing the areas under two or more correlated receiver operating characteristic curves: a nonparametric approach. Biometrics. 1988;44(3):837–845.
- , Simple bedside assessment of level of consciousness: comparison of two simple assessment scales with the Glascow Coma Scale. Anaesthesia. 2004;59(1):34–37.
- , , , , Association between clinically abnormal observations and subsequent in‐hospital mortality: a prospective study. Resuscitation. 2004;62(2):137–141.
- , , Predicting clinical deterioration in the hospital: the impact of outcome selection. Resuscitation. 2013;84(5):564–568.
- , , , et al. Delirium and its motoric subtypes: a study of 614 critically ill patients. J Am Geriatr Soc. 2006;54(3):479–484.
- , , , et al. Risk factors for delirium after major trauma. Am J Surg. 2008;196(6):864–869.
- , , , , Relationship between symptoms and motoric subtype of delirium. J Neuropsychiatry Clin Neurosci. 2000;12(1):51–56.
- , , , et al. Phenomenological subtypes of delirium in older persons: patterns, prevalence, and prognosis. Psychosomatics. 2009;50(3):248–254.
- , , , Association between psychomotor activity delirium subtypes and mortality among newly admitted post‐acute facility patients. J Gerontol A Biol Sci Med Sci. 2007;62(2):174–179.
- , , , Delirium severity and psychomotor types: their relationship with outcomes after hip fracture repair. J Am Geriatr Soc. 2002;50(5):850–857.
- , Reliability and accuracy of the Glasgow Coma Scale with experienced and inexperienced users. Lancet. 1991;337(8740):535–538.
- , , , et al. Large‐scale implementation of sedation and delirium monitoring in the intensive care unit: a report from two medical centers. Crit Care Med. 2005;33(6):1199–1205.
- , , , et al. Delirium and sedation recognition using validated instruments: reliability of bedside intensive care unit nursing assessments from 2007 to 2010. J Am Geriatr Soc. 2011;59(suppl 2):S249–S255.
Altered mental status (AMS), characterized by abnormal changes in a patient's arousal and/or cognition, is a significant predictor of hospital mortality.[1, 2, 3] Yet despite its prevalence[3, 4, 5] and importance, up to three‐quarters of AMS events go unrecognized by caregivers.[6, 7, 8] Acute changes in mental status, often caused by delirium in the hospitalized patient,[3] can present nonspecifically, making it difficult to detect and distinguish from other diagnoses such as depression or dementia.[7, 9] Further complicating the recognition of AMS, numerous and imprecise qualitative descriptors such as confused and alert and oriented are used in clinical practice to describe the mental status of patients.[10] Thus, more objective measures may result in improved detection of altered mental status and in earlier diagnostic and therapeutic interventions.
In critically ill patients, several scales have been widely adopted for quantifying mental status. The Richmond Agitation and Sedation Scale (RASS) was created to optimize sedation.[11] The Glasgow Coma Scale (GCS) was developed for head‐trauma patients[12] and is now a standardized assessment tool in intensive care units,[13] the emergency department,[14] and the prehospital setting.[15] In addition, a simplified scale, AVPU (Alert, responsive to Verbal stimuli, responsive to Painful stimuli, and Unresponsive) was initially used in the primary survey of trauma patients[16] but is now a common component of early‐warning scores and rapid response activation criteria, such as the Modified Early Warning Score (MEWS).[17, 18] In fact, in a systematic review of 72 distinct early‐warning scores, 89% of the scores used AVPU as the measure of mentation.[17] However, the utility of these 3 scales is not well established in the general‐ward setting. Our aim was therefore to compare the accuracies of AVPU, GCS, and RASS for predicting mortality in hospitalized general‐ward patients to provide insight into the accuracy of these different scores for clinical deterioration.
METHODS
Study Setting and Protocol
We conducted an observational cohort study of consecutive adult general‐ward admissions from July 2011 through January 2013 at a 500‐bed, urban US teaching hospital. During the study period, no early‐warning scoring systems were in place on the hospital wards. Rapid response teams responding to altered mental status would do so without specific thresholds for activation. During this period, nurses on the general floors were expected to record each patient's GCS and RASS score in the electronic health record (EPIC Systems Corp., Verona, WI) as part of the routine patient assessment at least once every 12‐hour shift. AVPU assessments were extracted from the eye component of the GCS. The letter A was assigned to a GCS Eye score of 4 (opens eyes spontaneously), V to a score of 3 (opens eyes in response to voice), P to a score of 2 (opens eyes in response to painful stimuli), and U to a score of 1 (does not open eyes). To avoid comparison of mental‐status scores at different time points, only concurrent GCS and RASS scores, documented within 10 minutes of one another, were included in the analysis.
Location and time‐stamped GCS and RASS scores, demographics, and in‐hospital mortality data were obtained from the hospital's Clinical Research Data Warehouse, which is maintained by the Center for Research Informatics at The University of Chicago. The study protocol and data‐collection mechanisms were approved by The University of Chicago Institutional Review Board (#16995A).
Statistical Analysis
Baseline admission characteristics were described using proportions (%) and measures of central tendency (mean, standard deviations [SD]; median, interquartile ranges [IQR]). Patient severity of illness at first ward observation was calculated using the MEWS.[19] All mental‐status observations during a patient's ward stay were included in the analysis. Odds ratios for 24‐hour mortality following an abnormal mental‐status score were calculated using generalized estimating equations, with an exchangeable correlation structure to account for the correlation of scores within the same patient, as more than 1 abnormal mental‐status score may have been documented within the 24 hours preceding death. Spearman's rank correlation coefficients () were used to estimate the correlation among AVPU, GCS, and RASS scores.
The predictive accuracies of AVPU, GCS, RASS, and the subscales of GCS were compared using the area under the receiver operating characteristic curve (AUC), with mortality within 24 hours of a mental‐status observation as the primary outcome and the mental‐status score as the predictor variable. Although AUCs are typically used as a measure of discriminative ability, this study used AUCs to summarize both sensitivity and specificity across a range of cutoffs, providing an overall measure of predictive accuracies across mental‐status scales. To estimate AUCs, the AVPU, GCS, and GCS subscales were entered into a logistic regression model as ordinal variables, whereas RASS was entered as a nominal variable due to its positive and negative components, and predicted probabilities were calculated. In addition, a combined model was fit where GCS and RASS were classified as categorical independent variables. AUCs were then calculated by utilizing the predicted probabilities from each logistic regression model using the trapezoidal rule.[20] A sensitivity analysis was performed to estimate the internal validity of the RASS model using 10‐fold cross‐validation.
Predefined subgroup analyses were performed that compared the accuracies of AVPU, GCS, and RASS for predicting 24‐hour mortality in patients above and below the median age of the study population, and between patients who underwent surgery during their admission or not (surgical vs medical). All tests of significance used a 2‐sided P value <0.05. All data analysis was performed using Stata version 13.0 (StataCorp, College Station, TX).
RESULTS
During the study period, 313,577 complete GCS and 305,177 RASS scores were recorded in the electronic health record by nursing staff. A total of 26,806 (17,603 GCS and 9203 RASS) observations were excluded due to nonsimultaneous measurement of the other score, resulting in 295,974 paired mental‐status observations. These observations were obtained from 26,873 admissions in 17,660 unique patients, with a median MEWS at ward admission of 1 (IQR 11). The mean patient age was 57 years (SD 17), and 23% were surgical patients (Table 1). Patients spent a median 63.9 hours (IQR 26.7118.6) on the wards per admission and contributed a median of 3 paired observations (IQR 24) per day, with 91% of patients having at least 2 observations per day. A total of 417 (1.6%) general‐ward admissions resulted in death during the hospitalization, with 354 mental‐status observations occurring within 24 hours of a death. In addition, 26,618 (99.9%) admissions had at least 1 paired mental‐status observation within the last 24 hours of their ward stay.
| |
| Total no. of admissions | 26,873 |
| Total no. of unique patients | 17,660 |
| Age, y, mean (SD) | 57 (17) |
| Female sex, n (%) | 14,293 (53) |
| Race, n (%) | |
| White | 10,516 (39) |
| Black | 12,580 (47) |
| Other/unknown | 3,777 (14) |
| Admission MEWS, median (IQR) | 1 (11) |
| Days on ward, median (IQR) | 5 (310) |
| Observations per person, per day, median (IQR) | 3 (24) |
| Underwent surgery during hospitalization, n (%) | 6,141 (23) |
| Deaths, n (%) | 417 (1.6) |
AVPU was moderately correlated with GCS (Spearman's =0.56) (Figure 1a) and weakly correlated with RASS (Spearman's =0.28) (Figure 1b). GCS scores were also weakly correlated to RASS (Spearman's =0.13, P<0.001). Notably, AVPU mapped to distinct levels of GCS, with Alert associated with a median GCS total score of 15, Voice a score of 12, Pain a score of 8, and Unresponsive a score of 5. Abnormal mental‐status scores on any scale were associated with significantly higher odds of death within 24 hours than normal mental‐status scores (Table 2). This association was consistent within the 3 subscales of GCS and for scores in both the sedation (<0) and agitation (>0) ranges of RASS.
| Mental‐status Score | Observations, n (%) | Odds Ratio for Mortality (95% CI) |
|---|---|---|
| ||
| GCS Eye (AVPU) | ||
| 4 (alert) | 289,857 (98) | Reference |
| <4 (not alert) | 6,117 (2) | 33.8 (23.947.9) |
| GCS Verbal | ||
| 5 | 277,862 (94) | Reference |
| 4 | 11,258 (4) | 4.7 (2.87.9) |
| <4 | 6,854 (2) | 52.7 (38.073.2) |
| GCS Motor | ||
| 6 | 287,441 (97) | Reference |
| <6 | 8,533 (3) | 41.8 (30.756.9) |
| GCS total | ||
| 15 | 276,042 (93) | Reference |
| 13, 14 | 12,437 (4) | 5.2 (3.38.3) |
| <13 | 7,495 (3) | 55.5 (40.077.1) |
| RASS | ||
| >0 | 6,867 (2) | 8.5 (5.613.0) |
| 0 | 275,708 (93) | Reference |
| <0 | 13,339 (5) | 25.8 (19.234.6) |
AVPU was the least accurate predictor of mortality (AUC 0.73 [95% confidence interval {CI}: 0.710.76]), whereas simultaneous use of GCS and RASS was the most accurate predictor (AUC 0.85 [95% CI: 0.820.87] (Figure 2). The accuracies of GCS and RASS were not significantly different from one another in the total study population (AUC 0.80 [95% CI: 0.770.83] and 0.82 [0.790.84], respectively, P=0.13). Ten‐fold cross‐validation to estimate the internal validity of the RASS model resulted in a lower AUC (0.78 [95% CI: 0.750.81]) for RASS as a predictor of 24‐hour mortality. Subgroup analysis indicated that RASS was more accurate than GCS in younger patients (<57 years old) and in surgical patients (Figure 3).
Removal of the 255 admissions missing a paired mental‐status observation within the last 24 hours of their ward stay resulted in no change in the AUC values. A sensitivity analysis for prediction of a combined secondary outcome of 24‐hour intensive care unit ICU transfer or cardiac arrest yielded lower AUCs for each mental‐status scale, with no change in the association among scales.
DISCUSSION
To our knowledge, this study is the first to compare the accuracies of AVPU, GCS, and RASS for predicting mortality in the general‐ward setting. Similar to McNarry and Goldhill, we demonstrated that AVPU scores mapped to distinct levels of GCS. Although our study reports the same median GCS scores of 15 and 8 for AVPU levels of Alert and Pain, respectively, we indicate slightly lower corresponding median GCS scores for AVPU scores of Voice (12 vs 13) and Unresponsive (5 vs 6) than their previous work.[21] We found that AVPU was the least accurate predictor of mortality within 24 hours of an observation, and the combination of GCS and RASS was the most accurate. RASS was at least as accurate a predictor for 24‐hour mortality in comparison to GCS total in the overall study population. However, the RASS score was the most accurate individual score in surgical and younger patients. These findings suggest that changing from the commonly used AVPU scale to the RASS and/or GCS would improve the prognostic ability of mental‐status assessments on the general wards.
Buist and colleagues have previously demonstrated altered mental status to be one of the strongest predictors of death on the wards. In that study, a GCS score of 3 and a decrease in GCS score by more than 2 points were independently associated with mortality (odds ratio 6.1 [95% CI: 3.111.8] and 5.5 [95% CI: 2.611.9], respectively).[22] We have also previously shown that after adjusting for vital signs, being unresponsive to pain was associated with a 4.5‐fold increase in the odds of death within 24 hours,[23]whereas Subbe and colleagues showed a relative risk ratio of 5.2 (95% CI: 1.518.1) for the combined endpoint of cardiac arrest, death at 60 days, or admission to the intensive care/high dependency unit.[19] In the current study, the magnitude of these associations was even stronger, with a GCS score <13 correlating with a 55‐fold increase in the odds of death, compared to a normal GCS, and not being alert being associated with a 33.8‐fold increase in the odds of death. This difference in magnitude is likely a product of the univariate nature of the current analysis, compared to both the Buist et al. and Churpek et al. studies, which adjusted for vital signs, thereby lessening the impact of any single predictor. Because this study was designed to compare mental‐status variables to one another for future model inclusion, and all the analyses were paired, confounding by additional predictors of death was not a concern.
One of the potential strengths of RASS over GCS and AVPU is its ability to measure agitation levels, in addition to depressed mentation, a feature that has been shown to be present in up to 60% of delirium episodes.[24] This may also explain why RASS was the most accurate predictor of mortality in our subset of younger patients and surgical patients, because hyperactive delirium is more common in younger and healthier patients, which surgical patients tend to be as compared to medical patients.[25, 26] In this study, we found negative RASS scores portending a worse prognosis than positive ones, which supports previous findings that hypoactive delirium had a higher association with mortality than hyperactive delirium at 6 months (hazard ratio 1.90 vs 1.37) and at 1 year (hazard ratio 1.60 vs 1.30) in elderly patients at postacute‐care facilities in 2 separate studies.[27, 28] However, a study of patients undergoing surgery for hip fracture found that patients with hyperactive delirium were more likely to die or be placed in a nursing home at 1 month follow‐up when compared to patients with purely hypoactive delirium (79% vs 32%, P=0.003).[29]
We found the assessment of RASS and GCS by ward nurses to be highly feasible. During the study period, nurses assessed mental status with the GCS and RASS scales at least once per 12‐hour shift in 91% of patients. GCS has been shown to be reliably and accurately recorded by experienced nurses (reliability coefficient=0.944 with 96.4% agreement with expert ratings).[30] RASS can take <30 seconds to administer, and in previous studies of the ICU setting has been shown to have over 94% nurse compliance for administration,[31] and good inter‐rater reliability (weighted kappa 0.66 and 0.89, respectively).[31, 32] Further, in a prior survey of 55 critical care nurses, 82% agreed that RASS was easy to score and clinically relevant.[31]
This study has several limitations. First, it was conducted in a single academic institution, which may limit generalizability to other hospitals. Second, baseline cognition and comorbidities were not available in the dataset, so we were unable to conduct additional subgroup analyses by these categories. However, we used age and hospital admission type as proxies. Third, the AVPU scores in this study were extracted from the Eye subset of the GCS scale, as AVPU was not directly assessed on our wards during the study period. Clinical assessment of mental status on the AVPU scale notes the presence of any active patient response (eg, eye opening, grunting, moaning, movement) to increasingly noxious stimuli. As such, our adaptation of AVPU using only eye‐opening criteria may underestimate the true number of patients correctly classified as alert, or responding to vocal/painful stimuli. However, a sensitivity analysis comparing directly assessed AVPU during a 3‐year period prior to the study implementation at our institution, and AVPU derived from the GCS Eye subscale for the study period, indicated no difference in predictive value for 24‐hour mortality. Fourth, we did not perform trend analyses for change from baseline mental status or evolution of AMS, which may more accurately predict 24‐hour mortality than discrete mental‐status observations. Finally, the 3 scales we compared differ in length, which may bias the AUC against AVPU, a 4‐point scale with a trapezoidal ROC curve compared to the smoother curve generated by the 15‐point GCS scale, for example. However, the lack of discrimination of the AVPU is the likely source of its lesser accuracy.
CONCLUSION
In the general‐ward setting, routine collection of GCS and RASS is feasible, and both are significantly more accurate for predicting mortality than the more commonly used AVPU scale. In addition, the combination of GCS and RASS has greater accuracy than any of the 3 individual scales. RASS may be particularly beneficial in the assessment of younger and/or surgical patients. Routine documentation and tracking of GCS and/or RASS by nurses may improve the detection of clinical deterioration in general‐ward patients. In addition, future early‐warning scores may benefit from the inclusion of GCS and/or RASS in lieu of AVPU.
Disclosures
Drs. Churpek and Edelson have a patent pending (ARCD. P0535US.P2) for risk stratification algorithms for hospitalized patients. Dr. Churpek is supported by a career development award from the National Heart, Lung, and Blood Institute (K08 HL121080). Dr. Edelson has received research support from the National Heart, Lung, and Blood Institute (K23 HL097157), Philips (Andover, MA), the American Heart Association (Dallas, TX), Laerdal Medical (Stavanger, Norway), and Early Sense (Tel Aviv, Israel). She has ownership interest in Quant HC (Chicago, IL), which is developing products for risk stratification of hospitalized patients. All other authors report no conflicts of interest.
- , , , et al. Delirium as a predictor of mortality in mechanically ventilated patients in the intensive care unit. JAMA. 2004;291(14):1753–1762.
- , , , , , Delirium in hospitalized older persons: outcomes and predictors. J Am Geriatr Soc. 1994;42(8):809–815.
- , , Occurrence and outcome of delirium in medical in‐patients: a systematic literature review. Age Ageing. 2006;35(4):350–364.
- , , , et al. Delirium. The occurrence and persistence of symptoms among elderly hospitalized patients. Arch Intern Med. 1992;152(2):334–340.
- , , Postoperative delirium. A review of 80 primary data‐collection studies. Arch Intern Med. 1995;155(5):461–465.
- , , , , Nurses' recognition of delirium and its symptoms: comparison of nurse and researcher ratings. Arch Intern Med. 2001;161(20):2467–2473.
- , , The misdiagnosis of delirium. Psychosomatics. 1997;38(5):433–439.
- , , , et al. Current opinions regarding the importance, diagnosis, and management of delirium in the intensive care unit: a survey of 912 healthcare professionals. Crit Care Med. 2004;32(1):106–112.
- , Misdiagnosing delirium as depression in medically ill elderly patients. Arch Intern Med. 1995;155(22):2459–2464.
- Doctors and nurses use of the word confused. Br J Psychiatry. 1984;145:441–443.
- , , , et al. The Richmond Agitation‐Sedation Scale: validity and reliability in adult intensive care unit patients. Am J Respir Crit Care Med. 2002;166(10):1338–1344.
- , Assessment and prognosis of coma after head injury. Acta Neurochir (Wien). 1976;34(1–4):45–55.
- , , , , Glasgow Coma Scale score in the evaluation of outcome in the intensive care unit: findings from the Acute Physiology and Chronic Health Evaluation III study. Crit Care Med. 1993;21(10):1459–1465.
- , , Variability in agreement between physicians and nurses when measuring the Glasgow Coma Scale in the emergency department limits its clinical usefulness. Emerg Med Australas. 2006;18(4):379–384.
- , , , Reliability of the Glasgow Coma Scale when used by emergency physicians and paramedics. J Trauma. 1993;34(1):46–48.
- , ; American College of Surgeons. Committee on Trauma. Advanced Trauma Life Support Program For Physicians: ATLS. 5th ed. Chicago, IL: American College of Surgeons; 1993.
- , , , Review and performance evaluation of aggregate weighted 'track and trigger' systems. Resuscitation. 2008;77(2):170–179.
- , , , , A review, and performance evaluation, of single‐parameter “track and trigger” systems. Resuscitation. 2008;79(1):11–21.
- , , , Validation of a modified Early Warning score in medical admissions. QJM. 2001;94(10):521–526.
- , , Comparing the areas under two or more correlated receiver operating characteristic curves: a nonparametric approach. Biometrics. 1988;44(3):837–845.
- , Simple bedside assessment of level of consciousness: comparison of two simple assessment scales with the Glascow Coma Scale. Anaesthesia. 2004;59(1):34–37.
- , , , , Association between clinically abnormal observations and subsequent in‐hospital mortality: a prospective study. Resuscitation. 2004;62(2):137–141.
- , , Predicting clinical deterioration in the hospital: the impact of outcome selection. Resuscitation. 2013;84(5):564–568.
- , , , et al. Delirium and its motoric subtypes: a study of 614 critically ill patients. J Am Geriatr Soc. 2006;54(3):479–484.
- , , , et al. Risk factors for delirium after major trauma. Am J Surg. 2008;196(6):864–869.
- , , , , Relationship between symptoms and motoric subtype of delirium. J Neuropsychiatry Clin Neurosci. 2000;12(1):51–56.
- , , , et al. Phenomenological subtypes of delirium in older persons: patterns, prevalence, and prognosis. Psychosomatics. 2009;50(3):248–254.
- , , , Association between psychomotor activity delirium subtypes and mortality among newly admitted post‐acute facility patients. J Gerontol A Biol Sci Med Sci. 2007;62(2):174–179.
- , , , Delirium severity and psychomotor types: their relationship with outcomes after hip fracture repair. J Am Geriatr Soc. 2002;50(5):850–857.
- , Reliability and accuracy of the Glasgow Coma Scale with experienced and inexperienced users. Lancet. 1991;337(8740):535–538.
- , , , et al. Large‐scale implementation of sedation and delirium monitoring in the intensive care unit: a report from two medical centers. Crit Care Med. 2005;33(6):1199–1205.
- , , , et al. Delirium and sedation recognition using validated instruments: reliability of bedside intensive care unit nursing assessments from 2007 to 2010. J Am Geriatr Soc. 2011;59(suppl 2):S249–S255.
© 2015 Society of Hospital Medicine
