User login
ICU Transfer Delay and Outcome
Patients on hospital wards may become critically ill due to worsening of the underlying condition that was the cause of their admission or acquisition of a new hospital‐acquired illness. Once physiologic deterioration occurs, some patients are evaluated and quickly transferred to the intensive care unit (ICU), whereas others are left on the wards until further deterioration occurs. Because many critical illness syndromes benefit from early intervention, such as sepsis and respiratory failure, early transfer to the ICU for treatment may improve patient outcomes, and conversely, delays in ICU transfer may lead to increased mortality and length of stay (LOS) in critically ill ward patients.[1, 2] However, the timeliness of that transfer is dependent on numerous changing variables, such as ICU bed availability, clinician identification of the deterioration, and clinical judgment regarding the appropriate transfer thresholds.[2, 3, 4, 5, 6, 7] As a result, there is a large degree of heterogeneity in the severity of illness of patients at the time of ICU transfer and in patient outcomes.[6, 8]
Previous studies investigating the association between delayed ICU transfer and patient outcomes have typically utilized the time of consultation by the ICU team to denote the onset of critical illness.[5, 6, 9, 10] However, the decision to transfer a patient to the ICU is often subjective, and previous studies have found an alarmingly high rate of errors in diagnosis and management of critically ill ward patients, including the failure to call for help.[2, 11] Therefore, a more objective tool for quantifying critical illness is necessary for determining the onset of critical illness and quantifying the association of transfer delay with patient outcomes.
Early warning scores, which are designed to detect critical illness on the wards, represent objective measures of critical illness that can be easily calculated in ward patients.[12] The aim of this study was to utilize the electronic Cardiac Arrest Risk Triage (eCART) score, a previously published, statistically derived early warning score that utilizes demographic, vital sign, and laboratory data, as an objective measure of critical illness to estimate the effect of delayed ICU transfer on patient outcomes in a large, multicenter database.[13] We chose 6 hours as the cutoff for delay in this study a priori because it is a threshold noted to be an important time period in critical illness syndromes, such as sepsis.[14, 15]
METHODS
All patients admitted to the medical‐surgical wards at 5 hospitals between November 2008 and January 2013 were eligible for inclusion in this observational cohort study. Further details of the hospital populations have been previously described.[13] A waiver of consent was granted by NorthShore University HealthSystem (IRB #EH11‐258) and the University of Chicago Institutional Review Board (IRB #16995A) based on general impracticability and minimal harm. Collection of patient information was designed to comply with the Health Insurance Portability and Accountability Act of 1996 (HIPAA) regulations.
Defining the Onset of Critical Illness
The eCART score, a statistically derived early warning score that is calculated based on patient demographic, vital sign, and laboratory data, was used as an objective measure of critical illness.[13] Score calculation was performed utilizing demographic information from administrative databases and time‐ and location‐stamped vital signs and laboratory results from data warehouses at the respective institutions. In this study, a score was calculated for each time‐stamped point in the entire dataset. Of note, eCART was not used in this population for patient care as this was a retrospective observational study. An eCART score at the 95% specificity cutoff for ICU transfer from the entire dataset defined a ward patient as critically ill, a definition created a priori and before any data analysis was performed.
Defining ICU Transfer Delay and Study Outcomes
The period of time from when a patient first reached this predefined eCART score to ICU transfer was calculated for each patient, up to a maximum of 24 hours. Transfer to the ICU greater than 6 hours after reaching the critical eCART score was defined a priori as a delayed transfer to allow comparisons between patients with nondelayed and delayed transfer. A patient who suffered a ward cardiac arrest with attempted resuscitation was counted as an ICU transfer at the time of arrest. If a patient experienced more than 1 ICU transfer during the admission, then only the first ward to ICU transfer was used. The primary outcome of the study was in‐hospital mortality, and secondary outcomes were ICU mortality and hospital LOS.
Statistical Analysis
Patient characteristics were compared between patients who experienced delayed and nondelayed ICU transfers using t tests, Wilcoxon rank sums, and [2] tests, as appropriate. The association between length of transfer delay and in‐hospital mortality was calculated using logistic regression, with adjustment for age, sex, and surgical status. In a post hoc sensitivity analysis, additional adjustments were made using each patient's first eCART score on the ward, the individual vital signs and laboratory variables from eCART, and whether the ICU transfer was due to a cardiac arrest on the wards. In addition, an interaction term between time to transfer and the initial eCART on the ward was added to determine if the association between delay and mortality varied by baseline severity. The change in eCART score over time was plotted from 12 hours before the time of first reaching the critical value until ICU transfer for those in the delayed and nondelayed groups using restricted cubic splines to compare the trajectories of severity of illness between these 2 groups. In addition, a linear regression model was fit to investigate the association between the eCART slope in the 8 hours prior to the critical eCART value until ICU transfer and the timing of ICU transfer delay. Statistical analyses were performed using Stata version 12.1 (StataCorp, College Station, TX), and all tests of significance used a 2‐sided P<0.05.
RESULTS
A total of 269,999 admissions had documented vital signs on the hospital wards during the study period, including 11,995 patients who were either transferred from the wards to the ICU (n=11,636) or who suffered a cardiac arrest on the wards (n=359) during their initial ward stay. Of these patients, 3789 reached an eCART score at the 95% specificity cutoff (critical eCART score of 60) within 24 hours of transfer. The median time from first critical eCART value to ICU transfer was 5.4 hours (interquartile range (IQR), 214 hours; mean, 8 hours). Compared to patients without delayed ICU transfer, those with delayed transfer were slightly older (median age, 73 [IQR, 6083] years vs 71 [IQR, 5882] years; P=0.002), whereas all other characteristics were similar (Table 1). Table 2 shows comparisons of vital sign and laboratory results for delayed and nondelayed transfers at the time of ICU transfer. As shown, patients with delayed transfer had lower median respiratory rate, blood pressure, heart rate, and hemoglobin, but higher median white blood cell count and creatinine.
| Characteristic | Transferred Within 6 Hours, n=2,055 | Transfer Delayed, n=1,734 | P Value |
|---|---|---|---|
| |||
| Age, median (IQR), y | 71 (5882) | 73 (6083) | 0.002 |
| Female sex, n (%) | 1,018 (49.5) | 847 (48.8) | 0.67 |
| Race, n (%) | 0.72 | ||
| Black | 467 (22.7) | 374 (21.6) | |
| White | 1,141 (55.5) | 971 (56.0) | |
| Other/unknown | 447 (21.8) | 389 (22.4) | |
| Surgical patient, n (%) | 572 (27.8) | 438 (25.2) | 0.07 |
| Hospital LOS prior to first critical eCART, median (IQR), d | 1.5 (0.33.7) | 1.6 (0.43.9) | 0.04 |
| Total hospital LOS, median (IQR), d* | 11 (719) | 13 (821) | <0.001 |
| Died during admission, n (%) | 503 (24.5) | 576 (33.2) | <0.001 |
| Transferred Within 6 Hours, n=2,055 | Transfer Delayed, n=1,734 | P Value | |
|---|---|---|---|
| |||
| Respiratory rate, breaths/min | 23 (1830) | 22 (1828) | <0.001 |
| Systolic blood pressure, mm Hg | 111 (92134) | 109 (92128) | 0.002 |
| Diastolic blood pressure, mm Hg | 61 (5075) | 59 (4971) | <0.001 |
| Heart rate, beats/min | 106 (88124) | 101 (85117) | <0.001 |
| Oxygen saturation, median (IQR), % | 97 (9499) | 97 (9599) | 0.15 |
| Temperature, F | 98.0 (97.299.1) | 98.0 (97.199.0) | 0.001 |
| Alert mental status, number of observations (%) | 1,749 (85%) | 1,431 (83%) | <0.001 |
| eCART score at time of ICU transfer | 61 (26122) | 48 (21121) | 0.914 |
| WBC | 10.3 (7.514.5) | 11.7 (8.117.0) | <0.001 |
| Hemoglobin | 10.7 (9.312.0) | 10.3 (9.111.6) | <0.001 |
| Platelet | 215 (137275) | 195 (120269) | 0.017 |
| Sodium | 137 (134140) | 137 (134141) | 0.70 |
| K+ | 4.1 (3.84.6) | 4.2 (3.84.7) | 0.006 |
| Anion Gap | 10 (813) | 10 (814) | <0.001 |
| CO2 | 24 (2026) | 23 (1826) | <0.001 |
| BUN | 24 (1640) | 32 (1853) | <0.001 |
| Cr | 1.2 (0.92.0) | 1.5 (1.02.7) | <0.001 |
| GFR | 70 (7070) | 70 (5170) | <0.001 |
| Glucose | 123 (106161) | 129 (105164) | 0.48 |
| Calcium | 8.5 (7.98.8) | 8.2 (7.78.7) | <0.001 |
| SGOT | 26 (2635) | 26 (2644) | 0.001 |
| SGPT | 21 (2127) | 21 (2033) | 0.002 |
| Total bilirubin | 0.7 (0.71.0) | 0.7 (0.71.3) | <0.001 |
| Alk phos | 80 (8096) | 80 (79111) | 0.175 |
| Albumin | 3.0 (2.73.0) | 3.0 (2.43.0) | <0.001 |
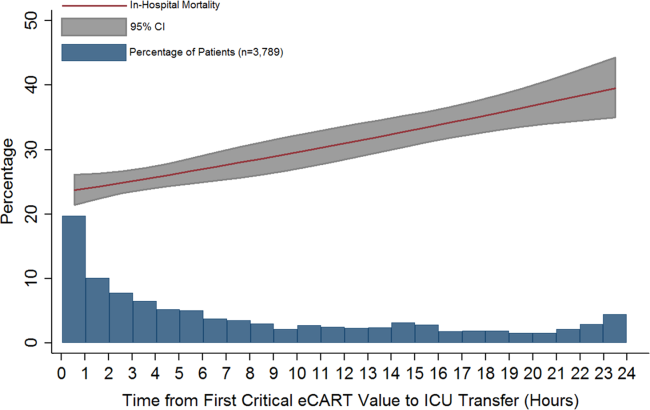
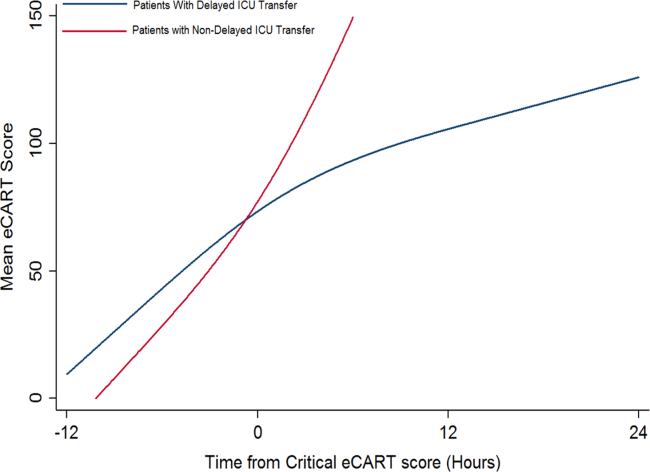
Delayed transfer occurred in 46% of patients (n=1734) and was associated with increased in‐hospital mortality (33.2% vs 24.5%, P<0.001). This relationship was linear, with each 1‐hour increase in transfer delay associated with a 3% increase in the odds of in‐hospital death (P<0.001) (Figure 1). The association between length of transfer delay and hospital mortality remained unchanged after controlling for age, sex, surgical status, initial eCART score on the wards, vital signs, laboratory values, and whether the ICU transfer was due to a cardiac arrest (3% increase per hour, P<0.001). This association did not vary based on the initial eCART score on the wards (P=0.71 for interaction). Additionally, despite having similar median hospital lengths of stay prior to first critical eCART score (1.6 vs 1.5 days, P=0.04), patients experiencing delayed ICU transfer who survived to discharge had a longer median hospital LOS by 2 days compared to those with nondelayed transfer who survived to discharge (median LOS, 13 (821) days vs 11 (719) days, P=0.01). The change in eCART score over time in the 12 hours before first reaching the critical eCART score until ICU transfer is shown in Figure 2 for patients with delayed and nondelayed transfer. As shown, patients transferred within 6 hours had a more rapid rise in eCART score prior to ICU transfer compared to those with a delayed transfer. This difference in trajectories between delayed and nondelayed patients was similar in patients with low (<13), intermediate (1359), and high (60) initial eCART scores on the wards. A regression model investigating the association between eCART slope prior to ICU transfer and time to ICU transfer demonstrated that a steeper slope was significantly associated with a decreased time to ICU transfer (P<0.01).
DISCUSSION
We found that a delay in transfer to the ICU after reaching a predefined objective threshold of critical illness was associated with a significant increase in hospital mortality and hospital LOS. We also discovered a significant association between critical illness trajectory and delays in transfer, suggesting that caregivers may not recognize more subtle trends in critical illness. This work highlights the importance of timely transfer to the ICU for critically ill ward patients, which can be affected by several factors such as ICU bed availability and caregiver recognition and triage decisions. Our findings have significant implications for patient safety on the wards and provide further evidence for implementing early warning scores into practice to aid with clinical decision making.
Our findings of increased mortality with delayed ICU transfer are consistent with previous studies.[1, 5, 9] For example, Young et al. compared ICU mortality between delayed and nondelayed transfers in 91 consecutive patients with noncardiac diagnoses at a community hospital.[1] They also used predefined criteria for critical illness, and found that delayed transfers had a higher ICU mortality than nondelayed patients (41% vs 11%). However, their criteria for critical illness only had a specificity of 13% for predicting ICU transfer, compared to 95% in our study, suggesting that our threshold is more consistent with critical illness. Another study, by Cardoso and colleagues, investigated the impact of delayed ICU admission due to bed shortages on ICU mortality in 401 patients at a university hospital.[9] Of those patients deemed appropriate for transfer to the ICU but who had to wait for a bed to become available, the median wait time for a bed was 18 hours. They found that each hour of waiting was associated with a 1.5% increase in ICU death. A similar study by Robert and colleagues investigated the impact of delayed or refused ICU admission due to a lack of bed availability.[5] Patients deemed too sick (or too well) to benefit from ICU transfer were excluded. Twenty‐eightday and 60‐day mortality were higher in the admitted group compared to those not admitted, although this finding was not statistically significant. In addition, patients later admitted to the ICU once a bed became available (median wait time, 6 hours; n=89) had higher 28‐day mortality than those admitted immediately (adjusted odds ratio, 1.78; P=0.05). Several other studies have investigated the impact of ICU refusal for reasons that included bed shortages, and found increased mortality in those not admitted to the ICU.[16, 17] However, many of these studies included patients deemed too sick or too well to be transferred to the ICU in the group of nonadmitted patients. Our study adds to this literature by utilizing a highly specific objective measure of critical illness and by including all patients on the wards who reached this threshold, rather than only those for whom a consult was requested.
There are several potential explanations for our finding of increased mortality with delayed ICU transfer. First, those with delayed transfer might be different in some way from those transferred immediately. For example, we found that those with delayed transfer were older. The finding that increasing age is associated with a delay in ICU transfer is interesting, and may reflect physiologic differences in older patients compared to younger ones. For example, older patients have a lower maximum heart rate and thus may not develop the same level of vital sign abnormalities that younger patients do, causing them to be inappropriately left on the wards for too long.[18] In addition, patients with delayed transfer had more deranged renal function and lower blood pressure. It is unknown whether these organ dysfunctions would have been prevented by earlier transfer and to what degree they were related to chronic conditions. However, delayed transfer was still associated with increased mortality even after controlling for age, vital sign and laboratory values, and eCART on ward admission. It may also be possible that patients with delayed transfer received early and appropriate treatment on the wards but failed to improve and thus required ICU transfer. We did not have access to orders in this large database, so this theory will need to be investigated in future work. Finally, the most likely explanation for our findings is that earlier identification and treatment improves outcomes of critically ill patients on the wards, which is consistent with the findings of previous studies.[1, 5, 9, 10] Our study demonstrates that early identification of critical illness is crucial, and that delayed treatment can rapidly lead to increased mortality and LOS.
Our comparison of eCART score trajectory showed that patients transferred within 6 hours of onset of critical illness had a more rapid rise in eCART score over the preceding time period, whereas patients who experienced transfer delay showed a slower increase in eCART score. One explanation for this finding is that patients who decompensate more rapidly are in turn more readily recognizable to providers, whereas patients who experience a more insidious clinical deterioration are recognized later in the process, which then leads to a delay in escalation of care. This hypothesis underlines the importance of utilizing an objective marker of illness that is calculated longitudinally and in real time, as opposed to relying upon provider recognition alone. In fact, we have recently demonstrated that eCART is more accurate and identifies patients earlier than standard rapid response team activation.[19]
There are several important implications of our findings. First, it highlights the potential impact that early warning scores, particular those that are evidence based, can have on the outcomes of hospitalized patients. Second, it suggests that it is important to include age in early warning scores. Previous studies have been mixed as to whether the inclusion of age improves detection of outcomes on the wards, although the method of inclusion of age has been variable in terms of its weighting.[20, 21, 22] Our study found that older patients were more likely to be left on the wards longer prior to ICU transfer after becoming critically ill. By incorporating age into early warning scores, both accuracy and early recognition of critical illness may be improved. Finally, our finding that the trends of the eCART score differed among patients who were immediately transferred to the ICU, and who had a delay in their transfer, suggests that adding vital sign trends to early warning scores may further improve their accuracy and ability to serve as clinical decision support tools.
Our study is unique in that we used an objective measure of critical illness and then examined outcomes after patients reached this threshold on the wards. This overcomes the subjectivity of using evaluation by the ICU team or rapid response team as the starting point, as previous studies have shown a failure to call for help when patients become critically ill on the wards.[2, 11, 23] By using the eCART score, which contains commonly collected electronic health record data and can be calculated electronically in real time, we were able to calculate the score for patients on the wards and in the ICU. This allowed us to examine trends in the eCART score over time to find clues as to why some patients are transferred late to the ICU and why these late transfers have worse outcomes than those transferred earlier. Another strength is the large multicenter database used for the analysis, which included an urban tertiary care hospital, suburban teaching hospitals, and a community nonteaching hospital.
Our study has several limitations. First, we utilized just 1 of many potential measures of critical illness and a cutoff that only included one‐third of patients ultimately transferred to the ICU. However, by using the eCART score, we were able to track a patient's physiologic status over time and remove the variability that comes with using subjective definitions of critical illness. Furthermore, we utilized a high‐specificity cutoff for eCART to ensure that transferred patients had significantly deranged physiology and to avoid including planned transfers to the ICU. It is likely that some patients who were critically ill with less deranged physiology that would have benefitted from earlier transfer were excluded from the study. Second, we were unable to determine the cause of physiologic deterioration for patients in our study due to the large number of included patients. In addition, we did not have code status, comorbidities, or reason for ICU admission available in the dataset. It is likely that the impact of delayed transfer varies by the indication for ICU admission and chronic disease burden. It is also possible that controlling for these unmeasured factors could negate the beneficial association seen for earlier ICU admission. However, our finding of such a strong relationship between time to transfer and mortality after controlling for several important variables suggests that early recognition of critical illness is beneficial to many patients on the wards. Third, due to its observational nature, our study cannot estimate the true impact of timely ICU transfer on critically ill ward patient outcomes. Future clinical trials will be needed to determine the impact of electronic early warning scores on patient outcomes.
In conclusion, delayed ICU transfer is associated with significantly increased hospital LOS and mortality. This association highlights the need for ongoing work toward both the implementation of an evidence‐based risk stratification tool as well as development of effective critical care outreach resources for patients decompensating on the wards. Real‐time use of a validated early warning score, such as eCART, could potentially lead to more timely ICU transfer for critically ill patients and reduced rates of preventable in‐hospital death.
Acknowledgements
The authors thank Timothy Holper, Justin Lakeman, and Contessa Hsu for assistance with data extraction and technical support; Poome Chamnankit, MS, CNP, Kelly Bhatia, MSN, ACNP, and Audrey Seitman, MSN, ACNP for performing manual chart review of cardiac arrest patients; and Nicole Twu for administrative support.
Disclosures: This research was funded in part by an institutional Clinical and Translational Science Award grant (UL1 RR024999, PI: Dr. Julian Solway). Dr. Churpek is supported by a career development award from the National Heart, Lung, and Blood Institute (K08 HL121080). Drs. Churpek and Edelson have a patent pending (ARCD. P0535US.P2) for risk stratification algorithms for hospitalized patients. In addition, Dr. Edelson has received research support from Philips Healthcare (Andover, MA), the American Heart Association (Dallas, TX), and Laerdal Medical (Stavanger, Norway). She has ownership interest in Quant HC (Chicago, IL), which is developing products for risk stratification of hospitalized patients. Drs. Churpek and Wendlandt had full access to all the data in the study and take responsibility for the integrity of the data and the accuracy of the data analysis. Preliminary versions of these data were presented at the 2015 meeting of the Society of Hospital Medicine (March 31, 2015, National Harbor, MD).
- , , , , . Inpatient transfers to the intensive care unit: delays are associated with increased mortality and morbidity. J Gen Intern Med. 2003;18(2):77–83.
- , , , et al. Confidential inquiry into quality of care before admission to intensive care. BMJ. 1998;316(7148):1853–1858.
- , , , , , . Relationship between ICU bed availability, ICU readmission, and cardiac arrest in the general wards. Crit Care Med. 2014;42(9):2037–2041.
- , , , et al. Survival of critically ill patients hospitalized in and out of intensive care units under paucity of intensive care unit beds. Crit Care Med. 2004;32(8):1654–1661.
- , , , et al. Refusal of intensive care unit admission due to a full unit: impact on mortality. Am J Respir Crit Care Med. 2012;185(10):1081–1087.
- , , , et al. Evaluation of triage decisions for intensive care admission. Crit Care Med. 1999;27(6):1073–1079.
- , , , et al. Predictors of intensive care unit refusal in French intensive care units: a multiple‐center study. Crit Care Med. 2005;33(4):750–755.
- , , , . Acute Physiology and Chronic Health Evaluation (APACHE) IV: hospital mortality assessment for today's critically ill patients. Crit Care Med. 2006;34(5):1297–1310.
- , , , et al. Impact of delayed admission to intensive care units on mortality of critically ill patients: a cohort study. Crit Care. 2011;15(1):R28.
- , , , et al. Reasons for refusal of admission to intensive care and impact on mortality. Intensive Care Med. 2010;36(10):1772–1779.
- , , , et al. Incidence, location and reasons for avoidable in‐hospital cardiac arrest in a district general hospital. Resuscitation. 2002;54(2):115–123.
- , , . Risk stratification of hospitalized patients on the wards. Chest. 2013;143(6):1758–1765.
- , , , et al. Multicenter development and validation of a risk stratification tool for ward patients. Am J Respir Crit Care Med. 2014;190(6):649–655.
- , , , et al. Early goal‐directed therapy in the treatment of severe sepsis and septic shock. N Engl J Med. 2001;345(19):1368–1377.
- , , , et al. Surviving sepsis campaign: international guidelines for management of severe sepsis and septic shock: 2012. Crit Care Med. 2013;41(2):580–637.
- , , , et al. Outcomes of patients considered for, but not admitted to, the intensive care unit. Crit Care Med. 2008;36(3):812–817.
- , , . Mortality among appropriately referred patients refused admission to intensive‐care units. Lancet. 1997;350(9070):7–11.
- , , , , . Differences in vital signs between elderly and nonelderly patients prior to ward cardiac arrest. Crit Care Med. 2015;43(4):816–822.
- , , , , , . Real‐time risk prediction on the wards: a feasibility study [published April 13, 2016]. Crit Care Med. doi: 10.1097/CCM.0000000000001716.
- , , , et al. Should age be included as a component of track and trigger systems used to identify sick adult patients? Resuscitation. 2008;78(2):109–115.
- , , , et al. Worthing physiological scoring system: derivation and validation of a physiological early‐warning system for medical admissions. An observational, population‐based single‐centre study. Br J Anaesth. 2007;98(6):769–774.
- , , , . Validation of a modified Early Warning Score in medical admissions. QJM. 2001;94(10):521–526.
- , , , et al. Introduction of the medical emergency team (MET) system: a cluster‐randomised controlled trial. Lancet. 2005;365(9477):2091–2097.
Patients on hospital wards may become critically ill due to worsening of the underlying condition that was the cause of their admission or acquisition of a new hospital‐acquired illness. Once physiologic deterioration occurs, some patients are evaluated and quickly transferred to the intensive care unit (ICU), whereas others are left on the wards until further deterioration occurs. Because many critical illness syndromes benefit from early intervention, such as sepsis and respiratory failure, early transfer to the ICU for treatment may improve patient outcomes, and conversely, delays in ICU transfer may lead to increased mortality and length of stay (LOS) in critically ill ward patients.[1, 2] However, the timeliness of that transfer is dependent on numerous changing variables, such as ICU bed availability, clinician identification of the deterioration, and clinical judgment regarding the appropriate transfer thresholds.[2, 3, 4, 5, 6, 7] As a result, there is a large degree of heterogeneity in the severity of illness of patients at the time of ICU transfer and in patient outcomes.[6, 8]
Previous studies investigating the association between delayed ICU transfer and patient outcomes have typically utilized the time of consultation by the ICU team to denote the onset of critical illness.[5, 6, 9, 10] However, the decision to transfer a patient to the ICU is often subjective, and previous studies have found an alarmingly high rate of errors in diagnosis and management of critically ill ward patients, including the failure to call for help.[2, 11] Therefore, a more objective tool for quantifying critical illness is necessary for determining the onset of critical illness and quantifying the association of transfer delay with patient outcomes.
Early warning scores, which are designed to detect critical illness on the wards, represent objective measures of critical illness that can be easily calculated in ward patients.[12] The aim of this study was to utilize the electronic Cardiac Arrest Risk Triage (eCART) score, a previously published, statistically derived early warning score that utilizes demographic, vital sign, and laboratory data, as an objective measure of critical illness to estimate the effect of delayed ICU transfer on patient outcomes in a large, multicenter database.[13] We chose 6 hours as the cutoff for delay in this study a priori because it is a threshold noted to be an important time period in critical illness syndromes, such as sepsis.[14, 15]
METHODS
All patients admitted to the medical‐surgical wards at 5 hospitals between November 2008 and January 2013 were eligible for inclusion in this observational cohort study. Further details of the hospital populations have been previously described.[13] A waiver of consent was granted by NorthShore University HealthSystem (IRB #EH11‐258) and the University of Chicago Institutional Review Board (IRB #16995A) based on general impracticability and minimal harm. Collection of patient information was designed to comply with the Health Insurance Portability and Accountability Act of 1996 (HIPAA) regulations.
Defining the Onset of Critical Illness
The eCART score, a statistically derived early warning score that is calculated based on patient demographic, vital sign, and laboratory data, was used as an objective measure of critical illness.[13] Score calculation was performed utilizing demographic information from administrative databases and time‐ and location‐stamped vital signs and laboratory results from data warehouses at the respective institutions. In this study, a score was calculated for each time‐stamped point in the entire dataset. Of note, eCART was not used in this population for patient care as this was a retrospective observational study. An eCART score at the 95% specificity cutoff for ICU transfer from the entire dataset defined a ward patient as critically ill, a definition created a priori and before any data analysis was performed.
Defining ICU Transfer Delay and Study Outcomes
The period of time from when a patient first reached this predefined eCART score to ICU transfer was calculated for each patient, up to a maximum of 24 hours. Transfer to the ICU greater than 6 hours after reaching the critical eCART score was defined a priori as a delayed transfer to allow comparisons between patients with nondelayed and delayed transfer. A patient who suffered a ward cardiac arrest with attempted resuscitation was counted as an ICU transfer at the time of arrest. If a patient experienced more than 1 ICU transfer during the admission, then only the first ward to ICU transfer was used. The primary outcome of the study was in‐hospital mortality, and secondary outcomes were ICU mortality and hospital LOS.
Statistical Analysis
Patient characteristics were compared between patients who experienced delayed and nondelayed ICU transfers using t tests, Wilcoxon rank sums, and [2] tests, as appropriate. The association between length of transfer delay and in‐hospital mortality was calculated using logistic regression, with adjustment for age, sex, and surgical status. In a post hoc sensitivity analysis, additional adjustments were made using each patient's first eCART score on the ward, the individual vital signs and laboratory variables from eCART, and whether the ICU transfer was due to a cardiac arrest on the wards. In addition, an interaction term between time to transfer and the initial eCART on the ward was added to determine if the association between delay and mortality varied by baseline severity. The change in eCART score over time was plotted from 12 hours before the time of first reaching the critical value until ICU transfer for those in the delayed and nondelayed groups using restricted cubic splines to compare the trajectories of severity of illness between these 2 groups. In addition, a linear regression model was fit to investigate the association between the eCART slope in the 8 hours prior to the critical eCART value until ICU transfer and the timing of ICU transfer delay. Statistical analyses were performed using Stata version 12.1 (StataCorp, College Station, TX), and all tests of significance used a 2‐sided P<0.05.
RESULTS
A total of 269,999 admissions had documented vital signs on the hospital wards during the study period, including 11,995 patients who were either transferred from the wards to the ICU (n=11,636) or who suffered a cardiac arrest on the wards (n=359) during their initial ward stay. Of these patients, 3789 reached an eCART score at the 95% specificity cutoff (critical eCART score of 60) within 24 hours of transfer. The median time from first critical eCART value to ICU transfer was 5.4 hours (interquartile range (IQR), 214 hours; mean, 8 hours). Compared to patients without delayed ICU transfer, those with delayed transfer were slightly older (median age, 73 [IQR, 6083] years vs 71 [IQR, 5882] years; P=0.002), whereas all other characteristics were similar (Table 1). Table 2 shows comparisons of vital sign and laboratory results for delayed and nondelayed transfers at the time of ICU transfer. As shown, patients with delayed transfer had lower median respiratory rate, blood pressure, heart rate, and hemoglobin, but higher median white blood cell count and creatinine.
| Characteristic | Transferred Within 6 Hours, n=2,055 | Transfer Delayed, n=1,734 | P Value |
|---|---|---|---|
| |||
| Age, median (IQR), y | 71 (5882) | 73 (6083) | 0.002 |
| Female sex, n (%) | 1,018 (49.5) | 847 (48.8) | 0.67 |
| Race, n (%) | 0.72 | ||
| Black | 467 (22.7) | 374 (21.6) | |
| White | 1,141 (55.5) | 971 (56.0) | |
| Other/unknown | 447 (21.8) | 389 (22.4) | |
| Surgical patient, n (%) | 572 (27.8) | 438 (25.2) | 0.07 |
| Hospital LOS prior to first critical eCART, median (IQR), d | 1.5 (0.33.7) | 1.6 (0.43.9) | 0.04 |
| Total hospital LOS, median (IQR), d* | 11 (719) | 13 (821) | <0.001 |
| Died during admission, n (%) | 503 (24.5) | 576 (33.2) | <0.001 |
| Transferred Within 6 Hours, n=2,055 | Transfer Delayed, n=1,734 | P Value | |
|---|---|---|---|
| |||
| Respiratory rate, breaths/min | 23 (1830) | 22 (1828) | <0.001 |
| Systolic blood pressure, mm Hg | 111 (92134) | 109 (92128) | 0.002 |
| Diastolic blood pressure, mm Hg | 61 (5075) | 59 (4971) | <0.001 |
| Heart rate, beats/min | 106 (88124) | 101 (85117) | <0.001 |
| Oxygen saturation, median (IQR), % | 97 (9499) | 97 (9599) | 0.15 |
| Temperature, F | 98.0 (97.299.1) | 98.0 (97.199.0) | 0.001 |
| Alert mental status, number of observations (%) | 1,749 (85%) | 1,431 (83%) | <0.001 |
| eCART score at time of ICU transfer | 61 (26122) | 48 (21121) | 0.914 |
| WBC | 10.3 (7.514.5) | 11.7 (8.117.0) | <0.001 |
| Hemoglobin | 10.7 (9.312.0) | 10.3 (9.111.6) | <0.001 |
| Platelet | 215 (137275) | 195 (120269) | 0.017 |
| Sodium | 137 (134140) | 137 (134141) | 0.70 |
| K+ | 4.1 (3.84.6) | 4.2 (3.84.7) | 0.006 |
| Anion Gap | 10 (813) | 10 (814) | <0.001 |
| CO2 | 24 (2026) | 23 (1826) | <0.001 |
| BUN | 24 (1640) | 32 (1853) | <0.001 |
| Cr | 1.2 (0.92.0) | 1.5 (1.02.7) | <0.001 |
| GFR | 70 (7070) | 70 (5170) | <0.001 |
| Glucose | 123 (106161) | 129 (105164) | 0.48 |
| Calcium | 8.5 (7.98.8) | 8.2 (7.78.7) | <0.001 |
| SGOT | 26 (2635) | 26 (2644) | 0.001 |
| SGPT | 21 (2127) | 21 (2033) | 0.002 |
| Total bilirubin | 0.7 (0.71.0) | 0.7 (0.71.3) | <0.001 |
| Alk phos | 80 (8096) | 80 (79111) | 0.175 |
| Albumin | 3.0 (2.73.0) | 3.0 (2.43.0) | <0.001 |
Delayed transfer occurred in 46% of patients (n=1734) and was associated with increased in‐hospital mortality (33.2% vs 24.5%, P<0.001). This relationship was linear, with each 1‐hour increase in transfer delay associated with a 3% increase in the odds of in‐hospital death (P<0.001) (Figure 1). The association between length of transfer delay and hospital mortality remained unchanged after controlling for age, sex, surgical status, initial eCART score on the wards, vital signs, laboratory values, and whether the ICU transfer was due to a cardiac arrest (3% increase per hour, P<0.001). This association did not vary based on the initial eCART score on the wards (P=0.71 for interaction). Additionally, despite having similar median hospital lengths of stay prior to first critical eCART score (1.6 vs 1.5 days, P=0.04), patients experiencing delayed ICU transfer who survived to discharge had a longer median hospital LOS by 2 days compared to those with nondelayed transfer who survived to discharge (median LOS, 13 (821) days vs 11 (719) days, P=0.01). The change in eCART score over time in the 12 hours before first reaching the critical eCART score until ICU transfer is shown in Figure 2 for patients with delayed and nondelayed transfer. As shown, patients transferred within 6 hours had a more rapid rise in eCART score prior to ICU transfer compared to those with a delayed transfer. This difference in trajectories between delayed and nondelayed patients was similar in patients with low (<13), intermediate (1359), and high (60) initial eCART scores on the wards. A regression model investigating the association between eCART slope prior to ICU transfer and time to ICU transfer demonstrated that a steeper slope was significantly associated with a decreased time to ICU transfer (P<0.01).
DISCUSSION
We found that a delay in transfer to the ICU after reaching a predefined objective threshold of critical illness was associated with a significant increase in hospital mortality and hospital LOS. We also discovered a significant association between critical illness trajectory and delays in transfer, suggesting that caregivers may not recognize more subtle trends in critical illness. This work highlights the importance of timely transfer to the ICU for critically ill ward patients, which can be affected by several factors such as ICU bed availability and caregiver recognition and triage decisions. Our findings have significant implications for patient safety on the wards and provide further evidence for implementing early warning scores into practice to aid with clinical decision making.
Our findings of increased mortality with delayed ICU transfer are consistent with previous studies.[1, 5, 9] For example, Young et al. compared ICU mortality between delayed and nondelayed transfers in 91 consecutive patients with noncardiac diagnoses at a community hospital.[1] They also used predefined criteria for critical illness, and found that delayed transfers had a higher ICU mortality than nondelayed patients (41% vs 11%). However, their criteria for critical illness only had a specificity of 13% for predicting ICU transfer, compared to 95% in our study, suggesting that our threshold is more consistent with critical illness. Another study, by Cardoso and colleagues, investigated the impact of delayed ICU admission due to bed shortages on ICU mortality in 401 patients at a university hospital.[9] Of those patients deemed appropriate for transfer to the ICU but who had to wait for a bed to become available, the median wait time for a bed was 18 hours. They found that each hour of waiting was associated with a 1.5% increase in ICU death. A similar study by Robert and colleagues investigated the impact of delayed or refused ICU admission due to a lack of bed availability.[5] Patients deemed too sick (or too well) to benefit from ICU transfer were excluded. Twenty‐eightday and 60‐day mortality were higher in the admitted group compared to those not admitted, although this finding was not statistically significant. In addition, patients later admitted to the ICU once a bed became available (median wait time, 6 hours; n=89) had higher 28‐day mortality than those admitted immediately (adjusted odds ratio, 1.78; P=0.05). Several other studies have investigated the impact of ICU refusal for reasons that included bed shortages, and found increased mortality in those not admitted to the ICU.[16, 17] However, many of these studies included patients deemed too sick or too well to be transferred to the ICU in the group of nonadmitted patients. Our study adds to this literature by utilizing a highly specific objective measure of critical illness and by including all patients on the wards who reached this threshold, rather than only those for whom a consult was requested.
There are several potential explanations for our finding of increased mortality with delayed ICU transfer. First, those with delayed transfer might be different in some way from those transferred immediately. For example, we found that those with delayed transfer were older. The finding that increasing age is associated with a delay in ICU transfer is interesting, and may reflect physiologic differences in older patients compared to younger ones. For example, older patients have a lower maximum heart rate and thus may not develop the same level of vital sign abnormalities that younger patients do, causing them to be inappropriately left on the wards for too long.[18] In addition, patients with delayed transfer had more deranged renal function and lower blood pressure. It is unknown whether these organ dysfunctions would have been prevented by earlier transfer and to what degree they were related to chronic conditions. However, delayed transfer was still associated with increased mortality even after controlling for age, vital sign and laboratory values, and eCART on ward admission. It may also be possible that patients with delayed transfer received early and appropriate treatment on the wards but failed to improve and thus required ICU transfer. We did not have access to orders in this large database, so this theory will need to be investigated in future work. Finally, the most likely explanation for our findings is that earlier identification and treatment improves outcomes of critically ill patients on the wards, which is consistent with the findings of previous studies.[1, 5, 9, 10] Our study demonstrates that early identification of critical illness is crucial, and that delayed treatment can rapidly lead to increased mortality and LOS.
Our comparison of eCART score trajectory showed that patients transferred within 6 hours of onset of critical illness had a more rapid rise in eCART score over the preceding time period, whereas patients who experienced transfer delay showed a slower increase in eCART score. One explanation for this finding is that patients who decompensate more rapidly are in turn more readily recognizable to providers, whereas patients who experience a more insidious clinical deterioration are recognized later in the process, which then leads to a delay in escalation of care. This hypothesis underlines the importance of utilizing an objective marker of illness that is calculated longitudinally and in real time, as opposed to relying upon provider recognition alone. In fact, we have recently demonstrated that eCART is more accurate and identifies patients earlier than standard rapid response team activation.[19]
There are several important implications of our findings. First, it highlights the potential impact that early warning scores, particular those that are evidence based, can have on the outcomes of hospitalized patients. Second, it suggests that it is important to include age in early warning scores. Previous studies have been mixed as to whether the inclusion of age improves detection of outcomes on the wards, although the method of inclusion of age has been variable in terms of its weighting.[20, 21, 22] Our study found that older patients were more likely to be left on the wards longer prior to ICU transfer after becoming critically ill. By incorporating age into early warning scores, both accuracy and early recognition of critical illness may be improved. Finally, our finding that the trends of the eCART score differed among patients who were immediately transferred to the ICU, and who had a delay in their transfer, suggests that adding vital sign trends to early warning scores may further improve their accuracy and ability to serve as clinical decision support tools.
Our study is unique in that we used an objective measure of critical illness and then examined outcomes after patients reached this threshold on the wards. This overcomes the subjectivity of using evaluation by the ICU team or rapid response team as the starting point, as previous studies have shown a failure to call for help when patients become critically ill on the wards.[2, 11, 23] By using the eCART score, which contains commonly collected electronic health record data and can be calculated electronically in real time, we were able to calculate the score for patients on the wards and in the ICU. This allowed us to examine trends in the eCART score over time to find clues as to why some patients are transferred late to the ICU and why these late transfers have worse outcomes than those transferred earlier. Another strength is the large multicenter database used for the analysis, which included an urban tertiary care hospital, suburban teaching hospitals, and a community nonteaching hospital.
Our study has several limitations. First, we utilized just 1 of many potential measures of critical illness and a cutoff that only included one‐third of patients ultimately transferred to the ICU. However, by using the eCART score, we were able to track a patient's physiologic status over time and remove the variability that comes with using subjective definitions of critical illness. Furthermore, we utilized a high‐specificity cutoff for eCART to ensure that transferred patients had significantly deranged physiology and to avoid including planned transfers to the ICU. It is likely that some patients who were critically ill with less deranged physiology that would have benefitted from earlier transfer were excluded from the study. Second, we were unable to determine the cause of physiologic deterioration for patients in our study due to the large number of included patients. In addition, we did not have code status, comorbidities, or reason for ICU admission available in the dataset. It is likely that the impact of delayed transfer varies by the indication for ICU admission and chronic disease burden. It is also possible that controlling for these unmeasured factors could negate the beneficial association seen for earlier ICU admission. However, our finding of such a strong relationship between time to transfer and mortality after controlling for several important variables suggests that early recognition of critical illness is beneficial to many patients on the wards. Third, due to its observational nature, our study cannot estimate the true impact of timely ICU transfer on critically ill ward patient outcomes. Future clinical trials will be needed to determine the impact of electronic early warning scores on patient outcomes.
In conclusion, delayed ICU transfer is associated with significantly increased hospital LOS and mortality. This association highlights the need for ongoing work toward both the implementation of an evidence‐based risk stratification tool as well as development of effective critical care outreach resources for patients decompensating on the wards. Real‐time use of a validated early warning score, such as eCART, could potentially lead to more timely ICU transfer for critically ill patients and reduced rates of preventable in‐hospital death.
Acknowledgements
The authors thank Timothy Holper, Justin Lakeman, and Contessa Hsu for assistance with data extraction and technical support; Poome Chamnankit, MS, CNP, Kelly Bhatia, MSN, ACNP, and Audrey Seitman, MSN, ACNP for performing manual chart review of cardiac arrest patients; and Nicole Twu for administrative support.
Disclosures: This research was funded in part by an institutional Clinical and Translational Science Award grant (UL1 RR024999, PI: Dr. Julian Solway). Dr. Churpek is supported by a career development award from the National Heart, Lung, and Blood Institute (K08 HL121080). Drs. Churpek and Edelson have a patent pending (ARCD. P0535US.P2) for risk stratification algorithms for hospitalized patients. In addition, Dr. Edelson has received research support from Philips Healthcare (Andover, MA), the American Heart Association (Dallas, TX), and Laerdal Medical (Stavanger, Norway). She has ownership interest in Quant HC (Chicago, IL), which is developing products for risk stratification of hospitalized patients. Drs. Churpek and Wendlandt had full access to all the data in the study and take responsibility for the integrity of the data and the accuracy of the data analysis. Preliminary versions of these data were presented at the 2015 meeting of the Society of Hospital Medicine (March 31, 2015, National Harbor, MD).
- , , , , . Inpatient transfers to the intensive care unit: delays are associated with increased mortality and morbidity. J Gen Intern Med. 2003;18(2):77–83.
- , , , et al. Confidential inquiry into quality of care before admission to intensive care. BMJ. 1998;316(7148):1853–1858.
- , , , , , . Relationship between ICU bed availability, ICU readmission, and cardiac arrest in the general wards. Crit Care Med. 2014;42(9):2037–2041.
- , , , et al. Survival of critically ill patients hospitalized in and out of intensive care units under paucity of intensive care unit beds. Crit Care Med. 2004;32(8):1654–1661.
- , , , et al. Refusal of intensive care unit admission due to a full unit: impact on mortality. Am J Respir Crit Care Med. 2012;185(10):1081–1087.
- , , , et al. Evaluation of triage decisions for intensive care admission. Crit Care Med. 1999;27(6):1073–1079.
- , , , et al. Predictors of intensive care unit refusal in French intensive care units: a multiple‐center study. Crit Care Med. 2005;33(4):750–755.
- , , , . Acute Physiology and Chronic Health Evaluation (APACHE) IV: hospital mortality assessment for today's critically ill patients. Crit Care Med. 2006;34(5):1297–1310.
- , , , et al. Impact of delayed admission to intensive care units on mortality of critically ill patients: a cohort study. Crit Care. 2011;15(1):R28.
- , , , et al. Reasons for refusal of admission to intensive care and impact on mortality. Intensive Care Med. 2010;36(10):1772–1779.
- , , , et al. Incidence, location and reasons for avoidable in‐hospital cardiac arrest in a district general hospital. Resuscitation. 2002;54(2):115–123.
- , , . Risk stratification of hospitalized patients on the wards. Chest. 2013;143(6):1758–1765.
- , , , et al. Multicenter development and validation of a risk stratification tool for ward patients. Am J Respir Crit Care Med. 2014;190(6):649–655.
- , , , et al. Early goal‐directed therapy in the treatment of severe sepsis and septic shock. N Engl J Med. 2001;345(19):1368–1377.
- , , , et al. Surviving sepsis campaign: international guidelines for management of severe sepsis and septic shock: 2012. Crit Care Med. 2013;41(2):580–637.
- , , , et al. Outcomes of patients considered for, but not admitted to, the intensive care unit. Crit Care Med. 2008;36(3):812–817.
- , , . Mortality among appropriately referred patients refused admission to intensive‐care units. Lancet. 1997;350(9070):7–11.
- , , , , . Differences in vital signs between elderly and nonelderly patients prior to ward cardiac arrest. Crit Care Med. 2015;43(4):816–822.
- , , , , , . Real‐time risk prediction on the wards: a feasibility study [published April 13, 2016]. Crit Care Med. doi: 10.1097/CCM.0000000000001716.
- , , , et al. Should age be included as a component of track and trigger systems used to identify sick adult patients? Resuscitation. 2008;78(2):109–115.
- , , , et al. Worthing physiological scoring system: derivation and validation of a physiological early‐warning system for medical admissions. An observational, population‐based single‐centre study. Br J Anaesth. 2007;98(6):769–774.
- , , , . Validation of a modified Early Warning Score in medical admissions. QJM. 2001;94(10):521–526.
- , , , et al. Introduction of the medical emergency team (MET) system: a cluster‐randomised controlled trial. Lancet. 2005;365(9477):2091–2097.

Mental Status to Predict Mortality
Altered mental status (AMS), characterized by abnormal changes in a patient's arousal and/or cognition, is a significant predictor of hospital mortality.[1, 2, 3] Yet despite its prevalence[3, 4, 5] and importance, up to three‐quarters of AMS events go unrecognized by caregivers.[6, 7, 8] Acute changes in mental status, often caused by delirium in the hospitalized patient,[3] can present nonspecifically, making it difficult to detect and distinguish from other diagnoses such as depression or dementia.[7, 9] Further complicating the recognition of AMS, numerous and imprecise qualitative descriptors such as confused and alert and oriented are used in clinical practice to describe the mental status of patients.[10] Thus, more objective measures may result in improved detection of altered mental status and in earlier diagnostic and therapeutic interventions.
In critically ill patients, several scales have been widely adopted for quantifying mental status. The Richmond Agitation and Sedation Scale (RASS) was created to optimize sedation.[11] The Glasgow Coma Scale (GCS) was developed for head‐trauma patients[12] and is now a standardized assessment tool in intensive care units,[13] the emergency department,[14] and the prehospital setting.[15] In addition, a simplified scale, AVPU (Alert, responsive to Verbal stimuli, responsive to Painful stimuli, and Unresponsive) was initially used in the primary survey of trauma patients[16] but is now a common component of early‐warning scores and rapid response activation criteria, such as the Modified Early Warning Score (MEWS).[17, 18] In fact, in a systematic review of 72 distinct early‐warning scores, 89% of the scores used AVPU as the measure of mentation.[17] However, the utility of these 3 scales is not well established in the general‐ward setting. Our aim was therefore to compare the accuracies of AVPU, GCS, and RASS for predicting mortality in hospitalized general‐ward patients to provide insight into the accuracy of these different scores for clinical deterioration.
METHODS
Study Setting and Protocol
We conducted an observational cohort study of consecutive adult general‐ward admissions from July 2011 through January 2013 at a 500‐bed, urban US teaching hospital. During the study period, no early‐warning scoring systems were in place on the hospital wards. Rapid response teams responding to altered mental status would do so without specific thresholds for activation. During this period, nurses on the general floors were expected to record each patient's GCS and RASS score in the electronic health record (EPIC Systems Corp., Verona, WI) as part of the routine patient assessment at least once every 12‐hour shift. AVPU assessments were extracted from the eye component of the GCS. The letter A was assigned to a GCS Eye score of 4 (opens eyes spontaneously), V to a score of 3 (opens eyes in response to voice), P to a score of 2 (opens eyes in response to painful stimuli), and U to a score of 1 (does not open eyes). To avoid comparison of mental‐status scores at different time points, only concurrent GCS and RASS scores, documented within 10 minutes of one another, were included in the analysis.
Location and time‐stamped GCS and RASS scores, demographics, and in‐hospital mortality data were obtained from the hospital's Clinical Research Data Warehouse, which is maintained by the Center for Research Informatics at The University of Chicago. The study protocol and data‐collection mechanisms were approved by The University of Chicago Institutional Review Board (#16995A).
Statistical Analysis
Baseline admission characteristics were described using proportions (%) and measures of central tendency (mean, standard deviations [SD]; median, interquartile ranges [IQR]). Patient severity of illness at first ward observation was calculated using the MEWS.[19] All mental‐status observations during a patient's ward stay were included in the analysis. Odds ratios for 24‐hour mortality following an abnormal mental‐status score were calculated using generalized estimating equations, with an exchangeable correlation structure to account for the correlation of scores within the same patient, as more than 1 abnormal mental‐status score may have been documented within the 24 hours preceding death. Spearman's rank correlation coefficients () were used to estimate the correlation among AVPU, GCS, and RASS scores.
The predictive accuracies of AVPU, GCS, RASS, and the subscales of GCS were compared using the area under the receiver operating characteristic curve (AUC), with mortality within 24 hours of a mental‐status observation as the primary outcome and the mental‐status score as the predictor variable. Although AUCs are typically used as a measure of discriminative ability, this study used AUCs to summarize both sensitivity and specificity across a range of cutoffs, providing an overall measure of predictive accuracies across mental‐status scales. To estimate AUCs, the AVPU, GCS, and GCS subscales were entered into a logistic regression model as ordinal variables, whereas RASS was entered as a nominal variable due to its positive and negative components, and predicted probabilities were calculated. In addition, a combined model was fit where GCS and RASS were classified as categorical independent variables. AUCs were then calculated by utilizing the predicted probabilities from each logistic regression model using the trapezoidal rule.[20] A sensitivity analysis was performed to estimate the internal validity of the RASS model using 10‐fold cross‐validation.
Predefined subgroup analyses were performed that compared the accuracies of AVPU, GCS, and RASS for predicting 24‐hour mortality in patients above and below the median age of the study population, and between patients who underwent surgery during their admission or not (surgical vs medical). All tests of significance used a 2‐sided P value <0.05. All data analysis was performed using Stata version 13.0 (StataCorp, College Station, TX).
RESULTS
During the study period, 313,577 complete GCS and 305,177 RASS scores were recorded in the electronic health record by nursing staff. A total of 26,806 (17,603 GCS and 9203 RASS) observations were excluded due to nonsimultaneous measurement of the other score, resulting in 295,974 paired mental‐status observations. These observations were obtained from 26,873 admissions in 17,660 unique patients, with a median MEWS at ward admission of 1 (IQR 11). The mean patient age was 57 years (SD 17), and 23% were surgical patients (Table 1). Patients spent a median 63.9 hours (IQR 26.7118.6) on the wards per admission and contributed a median of 3 paired observations (IQR 24) per day, with 91% of patients having at least 2 observations per day. A total of 417 (1.6%) general‐ward admissions resulted in death during the hospitalization, with 354 mental‐status observations occurring within 24 hours of a death. In addition, 26,618 (99.9%) admissions had at least 1 paired mental‐status observation within the last 24 hours of their ward stay.
| |
| Total no. of admissions | 26,873 |
| Total no. of unique patients | 17,660 |
| Age, y, mean (SD) | 57 (17) |
| Female sex, n (%) | 14,293 (53) |
| Race, n (%) | |
| White | 10,516 (39) |
| Black | 12,580 (47) |
| Other/unknown | 3,777 (14) |
| Admission MEWS, median (IQR) | 1 (11) |
| Days on ward, median (IQR) | 5 (310) |
| Observations per person, per day, median (IQR) | 3 (24) |
| Underwent surgery during hospitalization, n (%) | 6,141 (23) |
| Deaths, n (%) | 417 (1.6) |
AVPU was moderately correlated with GCS (Spearman's =0.56) (Figure 1a) and weakly correlated with RASS (Spearman's =0.28) (Figure 1b). GCS scores were also weakly correlated to RASS (Spearman's =0.13, P<0.001). Notably, AVPU mapped to distinct levels of GCS, with Alert associated with a median GCS total score of 15, Voice a score of 12, Pain a score of 8, and Unresponsive a score of 5. Abnormal mental‐status scores on any scale were associated with significantly higher odds of death within 24 hours than normal mental‐status scores (Table 2). This association was consistent within the 3 subscales of GCS and for scores in both the sedation (<0) and agitation (>0) ranges of RASS.
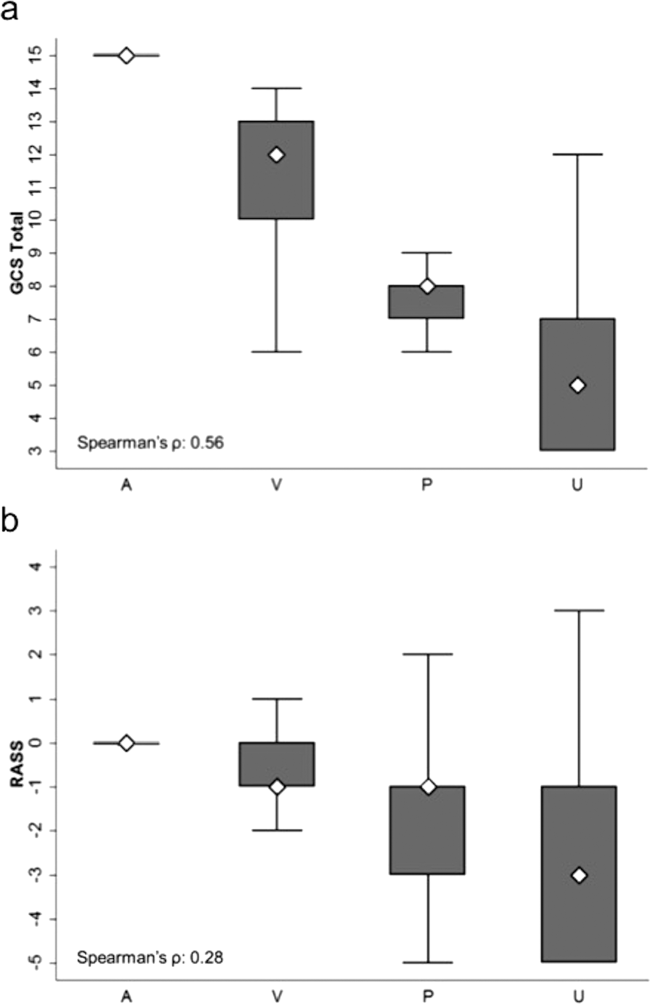
| Mental‐status Score | Observations, n (%) | Odds Ratio for Mortality (95% CI) |
|---|---|---|
| ||
| GCS Eye (AVPU) | ||
| 4 (alert) | 289,857 (98) | Reference |
| <4 (not alert) | 6,117 (2) | 33.8 (23.947.9) |
| GCS Verbal | ||
| 5 | 277,862 (94) | Reference |
| 4 | 11,258 (4) | 4.7 (2.87.9) |
| <4 | 6,854 (2) | 52.7 (38.073.2) |
| GCS Motor | ||
| 6 | 287,441 (97) | Reference |
| <6 | 8,533 (3) | 41.8 (30.756.9) |
| GCS total | ||
| 15 | 276,042 (93) | Reference |
| 13, 14 | 12,437 (4) | 5.2 (3.38.3) |
| <13 | 7,495 (3) | 55.5 (40.077.1) |
| RASS | ||
| >0 | 6,867 (2) | 8.5 (5.613.0) |
| 0 | 275,708 (93) | Reference |
| <0 | 13,339 (5) | 25.8 (19.234.6) |
AVPU was the least accurate predictor of mortality (AUC 0.73 [95% confidence interval {CI}: 0.710.76]), whereas simultaneous use of GCS and RASS was the most accurate predictor (AUC 0.85 [95% CI: 0.820.87] (Figure 2). The accuracies of GCS and RASS were not significantly different from one another in the total study population (AUC 0.80 [95% CI: 0.770.83] and 0.82 [0.790.84], respectively, P=0.13). Ten‐fold cross‐validation to estimate the internal validity of the RASS model resulted in a lower AUC (0.78 [95% CI: 0.750.81]) for RASS as a predictor of 24‐hour mortality. Subgroup analysis indicated that RASS was more accurate than GCS in younger patients (<57 years old) and in surgical patients (Figure 3).
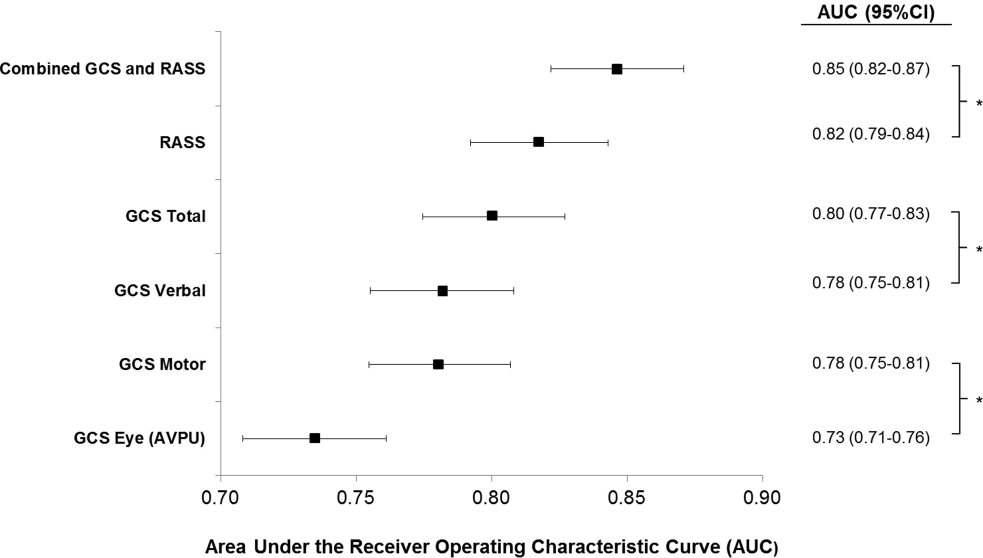
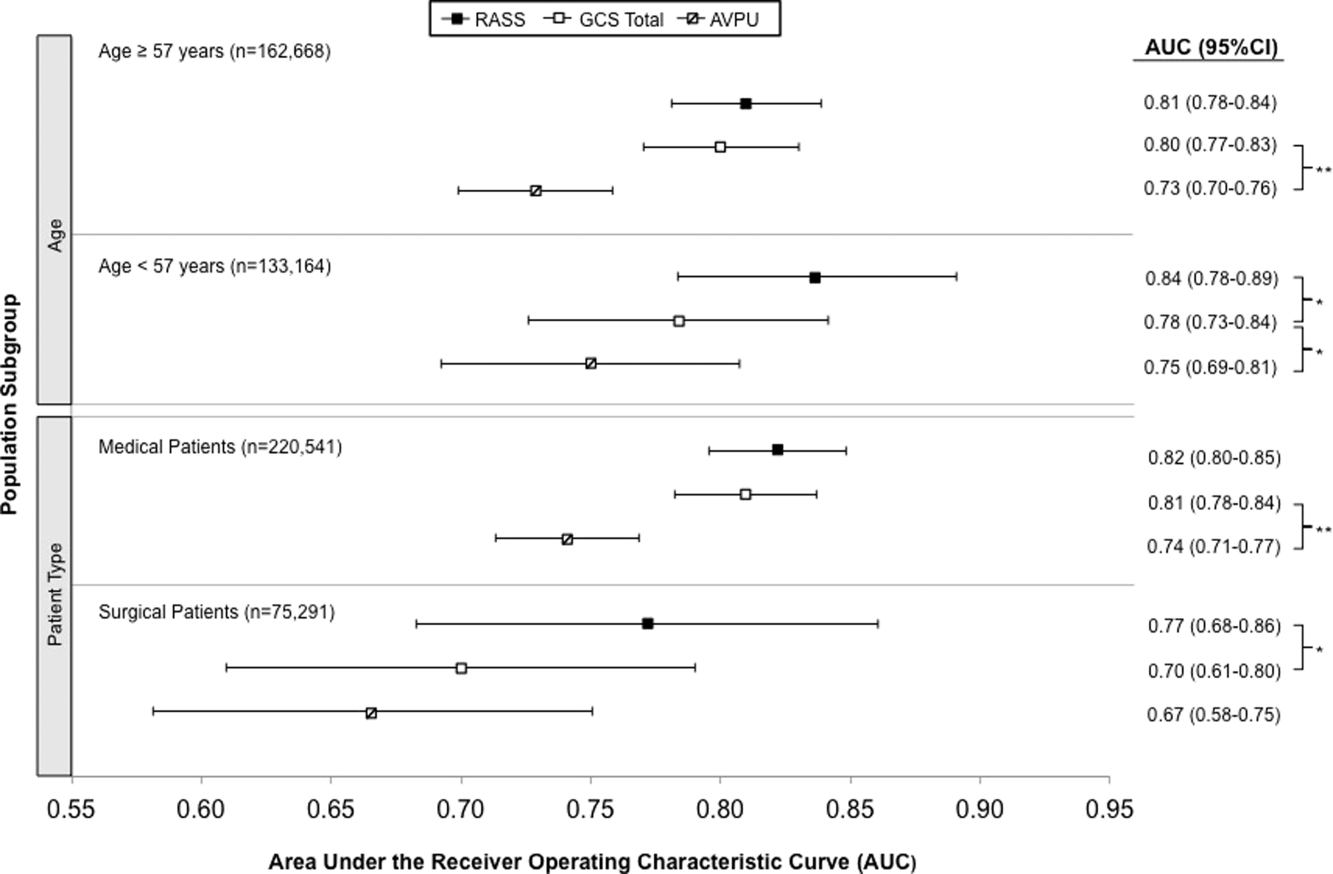
Removal of the 255 admissions missing a paired mental‐status observation within the last 24 hours of their ward stay resulted in no change in the AUC values. A sensitivity analysis for prediction of a combined secondary outcome of 24‐hour intensive care unit ICU transfer or cardiac arrest yielded lower AUCs for each mental‐status scale, with no change in the association among scales.
DISCUSSION
To our knowledge, this study is the first to compare the accuracies of AVPU, GCS, and RASS for predicting mortality in the general‐ward setting. Similar to McNarry and Goldhill, we demonstrated that AVPU scores mapped to distinct levels of GCS. Although our study reports the same median GCS scores of 15 and 8 for AVPU levels of Alert and Pain, respectively, we indicate slightly lower corresponding median GCS scores for AVPU scores of Voice (12 vs 13) and Unresponsive (5 vs 6) than their previous work.[21] We found that AVPU was the least accurate predictor of mortality within 24 hours of an observation, and the combination of GCS and RASS was the most accurate. RASS was at least as accurate a predictor for 24‐hour mortality in comparison to GCS total in the overall study population. However, the RASS score was the most accurate individual score in surgical and younger patients. These findings suggest that changing from the commonly used AVPU scale to the RASS and/or GCS would improve the prognostic ability of mental‐status assessments on the general wards.
Buist and colleagues have previously demonstrated altered mental status to be one of the strongest predictors of death on the wards. In that study, a GCS score of 3 and a decrease in GCS score by more than 2 points were independently associated with mortality (odds ratio 6.1 [95% CI: 3.111.8] and 5.5 [95% CI: 2.611.9], respectively).[22] We have also previously shown that after adjusting for vital signs, being unresponsive to pain was associated with a 4.5‐fold increase in the odds of death within 24 hours,[23]whereas Subbe and colleagues showed a relative risk ratio of 5.2 (95% CI: 1.518.1) for the combined endpoint of cardiac arrest, death at 60 days, or admission to the intensive care/high dependency unit.[19] In the current study, the magnitude of these associations was even stronger, with a GCS score <13 correlating with a 55‐fold increase in the odds of death, compared to a normal GCS, and not being alert being associated with a 33.8‐fold increase in the odds of death. This difference in magnitude is likely a product of the univariate nature of the current analysis, compared to both the Buist et al. and Churpek et al. studies, which adjusted for vital signs, thereby lessening the impact of any single predictor. Because this study was designed to compare mental‐status variables to one another for future model inclusion, and all the analyses were paired, confounding by additional predictors of death was not a concern.
One of the potential strengths of RASS over GCS and AVPU is its ability to measure agitation levels, in addition to depressed mentation, a feature that has been shown to be present in up to 60% of delirium episodes.[24] This may also explain why RASS was the most accurate predictor of mortality in our subset of younger patients and surgical patients, because hyperactive delirium is more common in younger and healthier patients, which surgical patients tend to be as compared to medical patients.[25, 26] In this study, we found negative RASS scores portending a worse prognosis than positive ones, which supports previous findings that hypoactive delirium had a higher association with mortality than hyperactive delirium at 6 months (hazard ratio 1.90 vs 1.37) and at 1 year (hazard ratio 1.60 vs 1.30) in elderly patients at postacute‐care facilities in 2 separate studies.[27, 28] However, a study of patients undergoing surgery for hip fracture found that patients with hyperactive delirium were more likely to die or be placed in a nursing home at 1 month follow‐up when compared to patients with purely hypoactive delirium (79% vs 32%, P=0.003).[29]
We found the assessment of RASS and GCS by ward nurses to be highly feasible. During the study period, nurses assessed mental status with the GCS and RASS scales at least once per 12‐hour shift in 91% of patients. GCS has been shown to be reliably and accurately recorded by experienced nurses (reliability coefficient=0.944 with 96.4% agreement with expert ratings).[30] RASS can take <30 seconds to administer, and in previous studies of the ICU setting has been shown to have over 94% nurse compliance for administration,[31] and good inter‐rater reliability (weighted kappa 0.66 and 0.89, respectively).[31, 32] Further, in a prior survey of 55 critical care nurses, 82% agreed that RASS was easy to score and clinically relevant.[31]
This study has several limitations. First, it was conducted in a single academic institution, which may limit generalizability to other hospitals. Second, baseline cognition and comorbidities were not available in the dataset, so we were unable to conduct additional subgroup analyses by these categories. However, we used age and hospital admission type as proxies. Third, the AVPU scores in this study were extracted from the Eye subset of the GCS scale, as AVPU was not directly assessed on our wards during the study period. Clinical assessment of mental status on the AVPU scale notes the presence of any active patient response (eg, eye opening, grunting, moaning, movement) to increasingly noxious stimuli. As such, our adaptation of AVPU using only eye‐opening criteria may underestimate the true number of patients correctly classified as alert, or responding to vocal/painful stimuli. However, a sensitivity analysis comparing directly assessed AVPU during a 3‐year period prior to the study implementation at our institution, and AVPU derived from the GCS Eye subscale for the study period, indicated no difference in predictive value for 24‐hour mortality. Fourth, we did not perform trend analyses for change from baseline mental status or evolution of AMS, which may more accurately predict 24‐hour mortality than discrete mental‐status observations. Finally, the 3 scales we compared differ in length, which may bias the AUC against AVPU, a 4‐point scale with a trapezoidal ROC curve compared to the smoother curve generated by the 15‐point GCS scale, for example. However, the lack of discrimination of the AVPU is the likely source of its lesser accuracy.
CONCLUSION
In the general‐ward setting, routine collection of GCS and RASS is feasible, and both are significantly more accurate for predicting mortality than the more commonly used AVPU scale. In addition, the combination of GCS and RASS has greater accuracy than any of the 3 individual scales. RASS may be particularly beneficial in the assessment of younger and/or surgical patients. Routine documentation and tracking of GCS and/or RASS by nurses may improve the detection of clinical deterioration in general‐ward patients. In addition, future early‐warning scores may benefit from the inclusion of GCS and/or RASS in lieu of AVPU.
Disclosures
Drs. Churpek and Edelson have a patent pending (ARCD. P0535US.P2) for risk stratification algorithms for hospitalized patients. Dr. Churpek is supported by a career development award from the National Heart, Lung, and Blood Institute (K08 HL121080). Dr. Edelson has received research support from the National Heart, Lung, and Blood Institute (K23 HL097157), Philips (Andover, MA), the American Heart Association (Dallas, TX), Laerdal Medical (Stavanger, Norway), and Early Sense (Tel Aviv, Israel). She has ownership interest in Quant HC (Chicago, IL), which is developing products for risk stratification of hospitalized patients. All other authors report no conflicts of interest.
- , , , et al. Delirium as a predictor of mortality in mechanically ventilated patients in the intensive care unit. JAMA. 2004;291(14):1753–1762.
- , , , , , Delirium in hospitalized older persons: outcomes and predictors. J Am Geriatr Soc. 1994;42(8):809–815.
- , , Occurrence and outcome of delirium in medical in‐patients: a systematic literature review. Age Ageing. 2006;35(4):350–364.
- , , , et al. Delirium. The occurrence and persistence of symptoms among elderly hospitalized patients. Arch Intern Med. 1992;152(2):334–340.
- , , Postoperative delirium. A review of 80 primary data‐collection studies. Arch Intern Med. 1995;155(5):461–465.
- , , , , Nurses' recognition of delirium and its symptoms: comparison of nurse and researcher ratings. Arch Intern Med. 2001;161(20):2467–2473.
- , , The misdiagnosis of delirium. Psychosomatics. 1997;38(5):433–439.
- , , , et al. Current opinions regarding the importance, diagnosis, and management of delirium in the intensive care unit: a survey of 912 healthcare professionals. Crit Care Med. 2004;32(1):106–112.
- , Misdiagnosing delirium as depression in medically ill elderly patients. Arch Intern Med. 1995;155(22):2459–2464.
- Doctors and nurses use of the word confused. Br J Psychiatry. 1984;145:441–443.
- , , , et al. The Richmond Agitation‐Sedation Scale: validity and reliability in adult intensive care unit patients. Am J Respir Crit Care Med. 2002;166(10):1338–1344.
- , Assessment and prognosis of coma after head injury. Acta Neurochir (Wien). 1976;34(1–4):45–55.
- , , , , Glasgow Coma Scale score in the evaluation of outcome in the intensive care unit: findings from the Acute Physiology and Chronic Health Evaluation III study. Crit Care Med. 1993;21(10):1459–1465.
- , , Variability in agreement between physicians and nurses when measuring the Glasgow Coma Scale in the emergency department limits its clinical usefulness. Emerg Med Australas. 2006;18(4):379–384.
- , , , Reliability of the Glasgow Coma Scale when used by emergency physicians and paramedics. J Trauma. 1993;34(1):46–48.
- , ; American College of Surgeons. Committee on Trauma. Advanced Trauma Life Support Program For Physicians: ATLS. 5th ed. Chicago, IL: American College of Surgeons; 1993.
- , , , Review and performance evaluation of aggregate weighted 'track and trigger' systems. Resuscitation. 2008;77(2):170–179.
- , , , , A review, and performance evaluation, of single‐parameter “track and trigger” systems. Resuscitation. 2008;79(1):11–21.
- , , , Validation of a modified Early Warning score in medical admissions. QJM. 2001;94(10):521–526.
- , , Comparing the areas under two or more correlated receiver operating characteristic curves: a nonparametric approach. Biometrics. 1988;44(3):837–845.
- , Simple bedside assessment of level of consciousness: comparison of two simple assessment scales with the Glascow Coma Scale. Anaesthesia. 2004;59(1):34–37.
- , , , , Association between clinically abnormal observations and subsequent in‐hospital mortality: a prospective study. Resuscitation. 2004;62(2):137–141.
- , , Predicting clinical deterioration in the hospital: the impact of outcome selection. Resuscitation. 2013;84(5):564–568.
- , , , et al. Delirium and its motoric subtypes: a study of 614 critically ill patients. J Am Geriatr Soc. 2006;54(3):479–484.
- , , , et al. Risk factors for delirium after major trauma. Am J Surg. 2008;196(6):864–869.
- , , , , Relationship between symptoms and motoric subtype of delirium. J Neuropsychiatry Clin Neurosci. 2000;12(1):51–56.
- , , , et al. Phenomenological subtypes of delirium in older persons: patterns, prevalence, and prognosis. Psychosomatics. 2009;50(3):248–254.
- , , , Association between psychomotor activity delirium subtypes and mortality among newly admitted post‐acute facility patients. J Gerontol A Biol Sci Med Sci. 2007;62(2):174–179.
- , , , Delirium severity and psychomotor types: their relationship with outcomes after hip fracture repair. J Am Geriatr Soc. 2002;50(5):850–857.
- , Reliability and accuracy of the Glasgow Coma Scale with experienced and inexperienced users. Lancet. 1991;337(8740):535–538.
- , , , et al. Large‐scale implementation of sedation and delirium monitoring in the intensive care unit: a report from two medical centers. Crit Care Med. 2005;33(6):1199–1205.
- , , , et al. Delirium and sedation recognition using validated instruments: reliability of bedside intensive care unit nursing assessments from 2007 to 2010. J Am Geriatr Soc. 2011;59(suppl 2):S249–S255.
Altered mental status (AMS), characterized by abnormal changes in a patient's arousal and/or cognition, is a significant predictor of hospital mortality.[1, 2, 3] Yet despite its prevalence[3, 4, 5] and importance, up to three‐quarters of AMS events go unrecognized by caregivers.[6, 7, 8] Acute changes in mental status, often caused by delirium in the hospitalized patient,[3] can present nonspecifically, making it difficult to detect and distinguish from other diagnoses such as depression or dementia.[7, 9] Further complicating the recognition of AMS, numerous and imprecise qualitative descriptors such as confused and alert and oriented are used in clinical practice to describe the mental status of patients.[10] Thus, more objective measures may result in improved detection of altered mental status and in earlier diagnostic and therapeutic interventions.
In critically ill patients, several scales have been widely adopted for quantifying mental status. The Richmond Agitation and Sedation Scale (RASS) was created to optimize sedation.[11] The Glasgow Coma Scale (GCS) was developed for head‐trauma patients[12] and is now a standardized assessment tool in intensive care units,[13] the emergency department,[14] and the prehospital setting.[15] In addition, a simplified scale, AVPU (Alert, responsive to Verbal stimuli, responsive to Painful stimuli, and Unresponsive) was initially used in the primary survey of trauma patients[16] but is now a common component of early‐warning scores and rapid response activation criteria, such as the Modified Early Warning Score (MEWS).[17, 18] In fact, in a systematic review of 72 distinct early‐warning scores, 89% of the scores used AVPU as the measure of mentation.[17] However, the utility of these 3 scales is not well established in the general‐ward setting. Our aim was therefore to compare the accuracies of AVPU, GCS, and RASS for predicting mortality in hospitalized general‐ward patients to provide insight into the accuracy of these different scores for clinical deterioration.
METHODS
Study Setting and Protocol
We conducted an observational cohort study of consecutive adult general‐ward admissions from July 2011 through January 2013 at a 500‐bed, urban US teaching hospital. During the study period, no early‐warning scoring systems were in place on the hospital wards. Rapid response teams responding to altered mental status would do so without specific thresholds for activation. During this period, nurses on the general floors were expected to record each patient's GCS and RASS score in the electronic health record (EPIC Systems Corp., Verona, WI) as part of the routine patient assessment at least once every 12‐hour shift. AVPU assessments were extracted from the eye component of the GCS. The letter A was assigned to a GCS Eye score of 4 (opens eyes spontaneously), V to a score of 3 (opens eyes in response to voice), P to a score of 2 (opens eyes in response to painful stimuli), and U to a score of 1 (does not open eyes). To avoid comparison of mental‐status scores at different time points, only concurrent GCS and RASS scores, documented within 10 minutes of one another, were included in the analysis.
Location and time‐stamped GCS and RASS scores, demographics, and in‐hospital mortality data were obtained from the hospital's Clinical Research Data Warehouse, which is maintained by the Center for Research Informatics at The University of Chicago. The study protocol and data‐collection mechanisms were approved by The University of Chicago Institutional Review Board (#16995A).
Statistical Analysis
Baseline admission characteristics were described using proportions (%) and measures of central tendency (mean, standard deviations [SD]; median, interquartile ranges [IQR]). Patient severity of illness at first ward observation was calculated using the MEWS.[19] All mental‐status observations during a patient's ward stay were included in the analysis. Odds ratios for 24‐hour mortality following an abnormal mental‐status score were calculated using generalized estimating equations, with an exchangeable correlation structure to account for the correlation of scores within the same patient, as more than 1 abnormal mental‐status score may have been documented within the 24 hours preceding death. Spearman's rank correlation coefficients () were used to estimate the correlation among AVPU, GCS, and RASS scores.
The predictive accuracies of AVPU, GCS, RASS, and the subscales of GCS were compared using the area under the receiver operating characteristic curve (AUC), with mortality within 24 hours of a mental‐status observation as the primary outcome and the mental‐status score as the predictor variable. Although AUCs are typically used as a measure of discriminative ability, this study used AUCs to summarize both sensitivity and specificity across a range of cutoffs, providing an overall measure of predictive accuracies across mental‐status scales. To estimate AUCs, the AVPU, GCS, and GCS subscales were entered into a logistic regression model as ordinal variables, whereas RASS was entered as a nominal variable due to its positive and negative components, and predicted probabilities were calculated. In addition, a combined model was fit where GCS and RASS were classified as categorical independent variables. AUCs were then calculated by utilizing the predicted probabilities from each logistic regression model using the trapezoidal rule.[20] A sensitivity analysis was performed to estimate the internal validity of the RASS model using 10‐fold cross‐validation.
Predefined subgroup analyses were performed that compared the accuracies of AVPU, GCS, and RASS for predicting 24‐hour mortality in patients above and below the median age of the study population, and between patients who underwent surgery during their admission or not (surgical vs medical). All tests of significance used a 2‐sided P value <0.05. All data analysis was performed using Stata version 13.0 (StataCorp, College Station, TX).
RESULTS
During the study period, 313,577 complete GCS and 305,177 RASS scores were recorded in the electronic health record by nursing staff. A total of 26,806 (17,603 GCS and 9203 RASS) observations were excluded due to nonsimultaneous measurement of the other score, resulting in 295,974 paired mental‐status observations. These observations were obtained from 26,873 admissions in 17,660 unique patients, with a median MEWS at ward admission of 1 (IQR 11). The mean patient age was 57 years (SD 17), and 23% were surgical patients (Table 1). Patients spent a median 63.9 hours (IQR 26.7118.6) on the wards per admission and contributed a median of 3 paired observations (IQR 24) per day, with 91% of patients having at least 2 observations per day. A total of 417 (1.6%) general‐ward admissions resulted in death during the hospitalization, with 354 mental‐status observations occurring within 24 hours of a death. In addition, 26,618 (99.9%) admissions had at least 1 paired mental‐status observation within the last 24 hours of their ward stay.
| |
| Total no. of admissions | 26,873 |
| Total no. of unique patients | 17,660 |
| Age, y, mean (SD) | 57 (17) |
| Female sex, n (%) | 14,293 (53) |
| Race, n (%) | |
| White | 10,516 (39) |
| Black | 12,580 (47) |
| Other/unknown | 3,777 (14) |
| Admission MEWS, median (IQR) | 1 (11) |
| Days on ward, median (IQR) | 5 (310) |
| Observations per person, per day, median (IQR) | 3 (24) |
| Underwent surgery during hospitalization, n (%) | 6,141 (23) |
| Deaths, n (%) | 417 (1.6) |
AVPU was moderately correlated with GCS (Spearman's =0.56) (Figure 1a) and weakly correlated with RASS (Spearman's =0.28) (Figure 1b). GCS scores were also weakly correlated to RASS (Spearman's =0.13, P<0.001). Notably, AVPU mapped to distinct levels of GCS, with Alert associated with a median GCS total score of 15, Voice a score of 12, Pain a score of 8, and Unresponsive a score of 5. Abnormal mental‐status scores on any scale were associated with significantly higher odds of death within 24 hours than normal mental‐status scores (Table 2). This association was consistent within the 3 subscales of GCS and for scores in both the sedation (<0) and agitation (>0) ranges of RASS.
| Mental‐status Score | Observations, n (%) | Odds Ratio for Mortality (95% CI) |
|---|---|---|
| ||
| GCS Eye (AVPU) | ||
| 4 (alert) | 289,857 (98) | Reference |
| <4 (not alert) | 6,117 (2) | 33.8 (23.947.9) |
| GCS Verbal | ||
| 5 | 277,862 (94) | Reference |
| 4 | 11,258 (4) | 4.7 (2.87.9) |
| <4 | 6,854 (2) | 52.7 (38.073.2) |
| GCS Motor | ||
| 6 | 287,441 (97) | Reference |
| <6 | 8,533 (3) | 41.8 (30.756.9) |
| GCS total | ||
| 15 | 276,042 (93) | Reference |
| 13, 14 | 12,437 (4) | 5.2 (3.38.3) |
| <13 | 7,495 (3) | 55.5 (40.077.1) |
| RASS | ||
| >0 | 6,867 (2) | 8.5 (5.613.0) |
| 0 | 275,708 (93) | Reference |
| <0 | 13,339 (5) | 25.8 (19.234.6) |
AVPU was the least accurate predictor of mortality (AUC 0.73 [95% confidence interval {CI}: 0.710.76]), whereas simultaneous use of GCS and RASS was the most accurate predictor (AUC 0.85 [95% CI: 0.820.87] (Figure 2). The accuracies of GCS and RASS were not significantly different from one another in the total study population (AUC 0.80 [95% CI: 0.770.83] and 0.82 [0.790.84], respectively, P=0.13). Ten‐fold cross‐validation to estimate the internal validity of the RASS model resulted in a lower AUC (0.78 [95% CI: 0.750.81]) for RASS as a predictor of 24‐hour mortality. Subgroup analysis indicated that RASS was more accurate than GCS in younger patients (<57 years old) and in surgical patients (Figure 3).
Removal of the 255 admissions missing a paired mental‐status observation within the last 24 hours of their ward stay resulted in no change in the AUC values. A sensitivity analysis for prediction of a combined secondary outcome of 24‐hour intensive care unit ICU transfer or cardiac arrest yielded lower AUCs for each mental‐status scale, with no change in the association among scales.
DISCUSSION
To our knowledge, this study is the first to compare the accuracies of AVPU, GCS, and RASS for predicting mortality in the general‐ward setting. Similar to McNarry and Goldhill, we demonstrated that AVPU scores mapped to distinct levels of GCS. Although our study reports the same median GCS scores of 15 and 8 for AVPU levels of Alert and Pain, respectively, we indicate slightly lower corresponding median GCS scores for AVPU scores of Voice (12 vs 13) and Unresponsive (5 vs 6) than their previous work.[21] We found that AVPU was the least accurate predictor of mortality within 24 hours of an observation, and the combination of GCS and RASS was the most accurate. RASS was at least as accurate a predictor for 24‐hour mortality in comparison to GCS total in the overall study population. However, the RASS score was the most accurate individual score in surgical and younger patients. These findings suggest that changing from the commonly used AVPU scale to the RASS and/or GCS would improve the prognostic ability of mental‐status assessments on the general wards.
Buist and colleagues have previously demonstrated altered mental status to be one of the strongest predictors of death on the wards. In that study, a GCS score of 3 and a decrease in GCS score by more than 2 points were independently associated with mortality (odds ratio 6.1 [95% CI: 3.111.8] and 5.5 [95% CI: 2.611.9], respectively).[22] We have also previously shown that after adjusting for vital signs, being unresponsive to pain was associated with a 4.5‐fold increase in the odds of death within 24 hours,[23]whereas Subbe and colleagues showed a relative risk ratio of 5.2 (95% CI: 1.518.1) for the combined endpoint of cardiac arrest, death at 60 days, or admission to the intensive care/high dependency unit.[19] In the current study, the magnitude of these associations was even stronger, with a GCS score <13 correlating with a 55‐fold increase in the odds of death, compared to a normal GCS, and not being alert being associated with a 33.8‐fold increase in the odds of death. This difference in magnitude is likely a product of the univariate nature of the current analysis, compared to both the Buist et al. and Churpek et al. studies, which adjusted for vital signs, thereby lessening the impact of any single predictor. Because this study was designed to compare mental‐status variables to one another for future model inclusion, and all the analyses were paired, confounding by additional predictors of death was not a concern.
One of the potential strengths of RASS over GCS and AVPU is its ability to measure agitation levels, in addition to depressed mentation, a feature that has been shown to be present in up to 60% of delirium episodes.[24] This may also explain why RASS was the most accurate predictor of mortality in our subset of younger patients and surgical patients, because hyperactive delirium is more common in younger and healthier patients, which surgical patients tend to be as compared to medical patients.[25, 26] In this study, we found negative RASS scores portending a worse prognosis than positive ones, which supports previous findings that hypoactive delirium had a higher association with mortality than hyperactive delirium at 6 months (hazard ratio 1.90 vs 1.37) and at 1 year (hazard ratio 1.60 vs 1.30) in elderly patients at postacute‐care facilities in 2 separate studies.[27, 28] However, a study of patients undergoing surgery for hip fracture found that patients with hyperactive delirium were more likely to die or be placed in a nursing home at 1 month follow‐up when compared to patients with purely hypoactive delirium (79% vs 32%, P=0.003).[29]
We found the assessment of RASS and GCS by ward nurses to be highly feasible. During the study period, nurses assessed mental status with the GCS and RASS scales at least once per 12‐hour shift in 91% of patients. GCS has been shown to be reliably and accurately recorded by experienced nurses (reliability coefficient=0.944 with 96.4% agreement with expert ratings).[30] RASS can take <30 seconds to administer, and in previous studies of the ICU setting has been shown to have over 94% nurse compliance for administration,[31] and good inter‐rater reliability (weighted kappa 0.66 and 0.89, respectively).[31, 32] Further, in a prior survey of 55 critical care nurses, 82% agreed that RASS was easy to score and clinically relevant.[31]
This study has several limitations. First, it was conducted in a single academic institution, which may limit generalizability to other hospitals. Second, baseline cognition and comorbidities were not available in the dataset, so we were unable to conduct additional subgroup analyses by these categories. However, we used age and hospital admission type as proxies. Third, the AVPU scores in this study were extracted from the Eye subset of the GCS scale, as AVPU was not directly assessed on our wards during the study period. Clinical assessment of mental status on the AVPU scale notes the presence of any active patient response (eg, eye opening, grunting, moaning, movement) to increasingly noxious stimuli. As such, our adaptation of AVPU using only eye‐opening criteria may underestimate the true number of patients correctly classified as alert, or responding to vocal/painful stimuli. However, a sensitivity analysis comparing directly assessed AVPU during a 3‐year period prior to the study implementation at our institution, and AVPU derived from the GCS Eye subscale for the study period, indicated no difference in predictive value for 24‐hour mortality. Fourth, we did not perform trend analyses for change from baseline mental status or evolution of AMS, which may more accurately predict 24‐hour mortality than discrete mental‐status observations. Finally, the 3 scales we compared differ in length, which may bias the AUC against AVPU, a 4‐point scale with a trapezoidal ROC curve compared to the smoother curve generated by the 15‐point GCS scale, for example. However, the lack of discrimination of the AVPU is the likely source of its lesser accuracy.
CONCLUSION
In the general‐ward setting, routine collection of GCS and RASS is feasible, and both are significantly more accurate for predicting mortality than the more commonly used AVPU scale. In addition, the combination of GCS and RASS has greater accuracy than any of the 3 individual scales. RASS may be particularly beneficial in the assessment of younger and/or surgical patients. Routine documentation and tracking of GCS and/or RASS by nurses may improve the detection of clinical deterioration in general‐ward patients. In addition, future early‐warning scores may benefit from the inclusion of GCS and/or RASS in lieu of AVPU.
Disclosures
Drs. Churpek and Edelson have a patent pending (ARCD. P0535US.P2) for risk stratification algorithms for hospitalized patients. Dr. Churpek is supported by a career development award from the National Heart, Lung, and Blood Institute (K08 HL121080). Dr. Edelson has received research support from the National Heart, Lung, and Blood Institute (K23 HL097157), Philips (Andover, MA), the American Heart Association (Dallas, TX), Laerdal Medical (Stavanger, Norway), and Early Sense (Tel Aviv, Israel). She has ownership interest in Quant HC (Chicago, IL), which is developing products for risk stratification of hospitalized patients. All other authors report no conflicts of interest.
- , , , et al. Delirium as a predictor of mortality in mechanically ventilated patients in the intensive care unit. JAMA. 2004;291(14):1753–1762.
- , , , , , Delirium in hospitalized older persons: outcomes and predictors. J Am Geriatr Soc. 1994;42(8):809–815.
- , , Occurrence and outcome of delirium in medical in‐patients: a systematic literature review. Age Ageing. 2006;35(4):350–364.
- , , , et al. Delirium. The occurrence and persistence of symptoms among elderly hospitalized patients. Arch Intern Med. 1992;152(2):334–340.
- , , Postoperative delirium. A review of 80 primary data‐collection studies. Arch Intern Med. 1995;155(5):461–465.
- , , , , Nurses' recognition of delirium and its symptoms: comparison of nurse and researcher ratings. Arch Intern Med. 2001;161(20):2467–2473.
- , , The misdiagnosis of delirium. Psychosomatics. 1997;38(5):433–439.
- , , , et al. Current opinions regarding the importance, diagnosis, and management of delirium in the intensive care unit: a survey of 912 healthcare professionals. Crit Care Med. 2004;32(1):106–112.
- , Misdiagnosing delirium as depression in medically ill elderly patients. Arch Intern Med. 1995;155(22):2459–2464.
- Doctors and nurses use of the word confused. Br J Psychiatry. 1984;145:441–443.
- , , , et al. The Richmond Agitation‐Sedation Scale: validity and reliability in adult intensive care unit patients. Am J Respir Crit Care Med. 2002;166(10):1338–1344.
- , Assessment and prognosis of coma after head injury. Acta Neurochir (Wien). 1976;34(1–4):45–55.
- , , , , Glasgow Coma Scale score in the evaluation of outcome in the intensive care unit: findings from the Acute Physiology and Chronic Health Evaluation III study. Crit Care Med. 1993;21(10):1459–1465.
- , , Variability in agreement between physicians and nurses when measuring the Glasgow Coma Scale in the emergency department limits its clinical usefulness. Emerg Med Australas. 2006;18(4):379–384.
- , , , Reliability of the Glasgow Coma Scale when used by emergency physicians and paramedics. J Trauma. 1993;34(1):46–48.
- , ; American College of Surgeons. Committee on Trauma. Advanced Trauma Life Support Program For Physicians: ATLS. 5th ed. Chicago, IL: American College of Surgeons; 1993.
- , , , Review and performance evaluation of aggregate weighted 'track and trigger' systems. Resuscitation. 2008;77(2):170–179.
- , , , , A review, and performance evaluation, of single‐parameter “track and trigger” systems. Resuscitation. 2008;79(1):11–21.
- , , , Validation of a modified Early Warning score in medical admissions. QJM. 2001;94(10):521–526.
- , , Comparing the areas under two or more correlated receiver operating characteristic curves: a nonparametric approach. Biometrics. 1988;44(3):837–845.
- , Simple bedside assessment of level of consciousness: comparison of two simple assessment scales with the Glascow Coma Scale. Anaesthesia. 2004;59(1):34–37.
- , , , , Association between clinically abnormal observations and subsequent in‐hospital mortality: a prospective study. Resuscitation. 2004;62(2):137–141.
- , , Predicting clinical deterioration in the hospital: the impact of outcome selection. Resuscitation. 2013;84(5):564–568.
- , , , et al. Delirium and its motoric subtypes: a study of 614 critically ill patients. J Am Geriatr Soc. 2006;54(3):479–484.
- , , , et al. Risk factors for delirium after major trauma. Am J Surg. 2008;196(6):864–869.
- , , , , Relationship between symptoms and motoric subtype of delirium. J Neuropsychiatry Clin Neurosci. 2000;12(1):51–56.
- , , , et al. Phenomenological subtypes of delirium in older persons: patterns, prevalence, and prognosis. Psychosomatics. 2009;50(3):248–254.
- , , , Association between psychomotor activity delirium subtypes and mortality among newly admitted post‐acute facility patients. J Gerontol A Biol Sci Med Sci. 2007;62(2):174–179.
- , , , Delirium severity and psychomotor types: their relationship with outcomes after hip fracture repair. J Am Geriatr Soc. 2002;50(5):850–857.
- , Reliability and accuracy of the Glasgow Coma Scale with experienced and inexperienced users. Lancet. 1991;337(8740):535–538.
- , , , et al. Large‐scale implementation of sedation and delirium monitoring in the intensive care unit: a report from two medical centers. Crit Care Med. 2005;33(6):1199–1205.
- , , , et al. Delirium and sedation recognition using validated instruments: reliability of bedside intensive care unit nursing assessments from 2007 to 2010. J Am Geriatr Soc. 2011;59(suppl 2):S249–S255.
© 2015 Society of Hospital Medicine

OSA and Outcomes in Ward Patients
Obstructive sleep apnea (OSA) is an increasingly prevalent condition characterized by intermittent airway obstruction during sleep, which leads to hypoxemia, hypercapnia, and fragmented sleep. The current prevalence estimates of moderate to severe OSA (apnea‐hypopnea index 15, measured as events/hour) in middle‐aged adults are approximately 13% in men and 6% in women.[1] OSA is a well‐described independent risk factor for long‐term neurocognitive, cardiovascular, and cerebrovascular morbidity and mortality.[2, 3, 4, 5, 6]
Recent studies have also identified OSA as an independent risk factor for adverse perioperative outcomes, including endotracheal intubation, intensive care unit (ICU) transfer, and increased length of stay.[7, 8, 9, 10, 11] Paradoxically, despite an increase in the risk of complications, several of these studies did not find an association between in‐hospital death and OSA even after controlling for potential confounders.[9, 10, 11] Furthermore, a recent study of patients hospitalized for pneumonia reported increased rates of clinical deterioration and mechanical ventilation, but also lower odds of inpatient mortality in patients with OSA.[12]
These studies may have been limited by the absence of physiologic data, which prevented controlling for severity of illness. It is also unclear whether these previously described associations between OSA and adverse clinical outcomes hold true for general hospital inpatients. OSA may be worsened by medications frequently used in hospitals, such as narcotics and benzodiazepines. Opiate use contributes to both central and obstructive sleep apneas,[13, 14] and benzodiazepines are known to produce airway smooth muscle relaxation and can cause respiratory depression.[15] In fact, the use of benzodiazepines has been implicated in the unmasking of OSA in patients with previously undiagnosed sleep‐disordered breathing.[16] These findings suggest mechanisms by which OSA could contribute to an increased risk in hospital ward patients for rapid response team (RRT) activation, ICU transfer, cardiac arrest, and in‐hospital death.
The aim of this study was to determine the independent association between OSA and in‐hospital mortality in ward patients. We also aimed to investigate the association of OSA with clinical deterioration on the wards, while controlling for patient characteristics, initial physiology, and severity of illness.
MATERIALS AND METHODS
Setting and Study Population
This observational cohort study was performed at an academic tertiary care medical center with approximately 500 beds. Data were obtained from all adult patients hospitalized on the wards between November 1, 2008 and October 1, 2013. Our hospital has utilized an RRT, led by a critical care nurse and respiratory therapist with hospitalist and pharmacist consultation available upon request, since 2008. This team is separate from the team that responds to a cardiac arrest. Criteria for RRT activation include tachypnea, tachycardia, hypotension, and staff worry, but specific vital sign thresholds are not specified.
The study analyzed deidentified data from the hospital's Clinical Research Data Warehouse, which is maintained by the Center for Research Informatics at The University of Chicago. The study protocol was approved by the University of Chicago Institutional Review Board (IRB #16995A).
Data Collection
Patient age, sex, race, body mass index (BMI), and location prior to ward admission (ie, whether they were admitted from the emergency department, transferred from the ICU, or directly admitted from clinic or home) were collected. Patients who underwent surgery during their admission were identified using the hospital's admission‐transfer‐discharge database. In addition, routinely collected vital signs (eg, respiratory rate, blood pressure, heart rate) were obtained from the electronic health record (Epic, Verona, WI). To determine severity of illness, the first set of vital signs measured on hospital presentation were utilized to calculate the cardiac arrest risk triage (CART) score, a vital‐signbased early warning score we previously developed and validated for predicting adverse events in our population.[17] The CART score ranges from 0 to 57, with points assigned for abnormalities in respiratory rate, heart rate, diastolic blood pressure, and age. If any vital sign was missing, the next available measurement was pulled into the set. If any vital sign remained missing after this change, the median value for that particular location (ie, wards, ICU, or emergency department) was imputed as previously described.[18, 19]
Patients with OSA were identified by the following International Classification of Diseases, Ninth Revision, Clinical Modification (ICD‐9‐CM) codes using inpatient and outpatient medical records: 278.03, 327.20, 327.23, 327.29, 780.51, 780.53, and 780.57 (Table 1). Data on other patient comorbidities, including coronary artery disease, congestive heart failure, arrhythmias, uncomplicated and complicated diabetes mellitus, hypertension, and cerebrovascular disease were collected using specific ICD‐9‐CM codes from both inpatient and outpatient records. Information on insurance payer was also collected from the hospital's billing database. Insurance payers were grouped into the following categories: private payer, Medicare/Medicaid, and no insurance. Patients with both public and private payers were counted as being privately insured.
| Diagnosis Code | Description | % of Sleep Apnea Diagnosesa |
|---|---|---|
| ||
| 327.23 | Obstructive sleep apnea | 65.6 |
| 780.57 | Unspecified sleep apnea | 19.4 |
| 780.53 | Hypersomnia with sleep apnea, unspecified | 11.7 |
| 780.51 | Insomnia with sleep apnea, unspecified | 1.5 |
| 327.2 | Organic sleep apnea, unspecified | 0.2 |
| 278.03 | Obesity hypoventilation syndrome | 1.7 |
Outcomes
The primary outcome of the study was in‐hospital mortality. Secondary outcomes included length of stay, RRT activation, transfer to the ICU, endotracheal intubation, cardiac arrest (defined as a loss of pulse with attempted resuscitation) on the wards, and a composite outcome of RRT activation, ICU transfer, and death. Because cardiac arrests on the wards result either in death or ICU transfer following successful resuscitation, this variable was omitted from the composite outcome. Cardiac arrests were identified using a prospectively validated quality improvement database that has been described previously.[20] ICU transfer was identified using the hospital's admission‐transfer‐discharge database. Only the index cardiac arrest, intubation, RRT, or ICU transfer for each admission was used in the study, but more than 1 type of outcome could occur for each patient (eg, a patient who died following an unsuccessful resuscitation attempt would count as both a cardiac arrest and a death).
Statistical Analysis
Patient characteristics were compared using Student t tests, Wilcoxon rank sum tests, and 2 statistics, as appropriate. Unadjusted logistic regression models were fit to estimate the change in odds of each adverse event and a composite outcome of any event for patient admissions with OSA compared to those without OSA. Adjusted logistic regression models were then fit for each outcome to control for patient characteristics (age, sex, BMI, insurance status, and individual comorbidities), location immediately prior to ward admission, and admission severity of illness (as measured by CART score). In the adjusted model, CART score, age, and number of comorbidities were entered linearly, with the addition of squared terms for age and CART score, as these variables showed nonlinear associations with the outcomes of interest. Race, surgical status, insurance payer, location prior to ward, and BMI (underweight, <18.5 kg/m2; normal weight, 18.524.9 kg/m2; overweight, 25.029.9 kg/m2; obese, 3039.9 kg/m2; and severely obese, (40 kg/m2) were modeled as categorical variables.
Given that an individual patient could experience multiple hospitalizations during the study period, we performed a sensitivity analysis of all adjusted and unadjusted models using a single randomly selected hospitalization for each unique patient. In addition, we performed a sensitivity analysis of all patients who were not admitted to the ICU prior to their ward stay. Finally, we performed subgroup analyses of all unadjusted and adjusted models for each BMI category and surgical status.
All tests of significance used a 2‐sided P value <0.05. Statistical analyses were completed using Stata version 12.0 (StataCorp, College Station, TX).
RESULTS
Patient Characteristics
During the study period, 93,676 patient admissions from 53,150 unique patients resulted in the occurrence of 1,069 RRT activations, 6,305 ICU transfers, and 1,239 in‐hospital deaths. Within our sample, 40,034 patients had at least 1 inpatient record and at least 1 outpatient record. OSA diagnosis was present in 5,625 patients (10.6% of the total sample), with 4,748 patients having an OSA diagnosis code entered during a hospitalization, 2,143 with an OSA diagnosis code entered during an outpatient encounter, and 877 with both inpatient and outpatient diagnosis codes. These patients identified as having OSA contributed 12,745 (13.6%) hospital admissions.
Patients with an OSA diagnosis were more likely to be older (median age 59 years [interquartile range 4968] vs 55 years [3868]), male (49% vs 42%), overweight or obese (88% vs 62%), and more likely to carry diagnoses of diabetes (53.8% vs 25.5%), hypertension (45.3% vs 18.2%), arrhythmias (44.4% vs 26.7%), coronary artery disease (46.8% vs 23.5%), heart failure (35.8% vs 13.5%), and cerebrovascular disease (13.5% vs 8.1%) than patients without an OSA diagnosis (all comparisons significant, P < 0.001) (Table 2).
| Characteristic | Patient Admissions With OSA Diagnoses, n = 12,745 | Patient Admissions Without OSA Diagnoses, n = 80,931 | P Value |
|---|---|---|---|
| |||
| Age, y, median (IQR) | 59 (4968) | 55 (3868) | <0.001 |
| Female, n (%) | 6,514 (51%) | 47,202 (58%) | <0.001 |
| Race, n (%) | <0.001 | ||
| White | 4,205 (33%) | 30,119 (37%) | |
| Black/African American | 7,024 (55%) | 38,561 (48%) | |
| Asian | 561 (4.4%) | 3,419 (4.2%) | |
| American Indian or Native Alaskan | 20 (0.2%) | 113 (0.1%) | |
| More than 1 race | 127 (1%) | 843 (1%) | |
| Race unknown | 808 (6%) | 7,876 (10%) | |
| Insurance status, n (%) | <0.001 | ||
| Private | 4,484 (35%) | 32,467 (40%) | |
| Medicare/Medicaid | 8,201 (64%) | 42,208 (58%) | |
| Uninsured | 53 (0.4%) | 1,190 (1%) | |
| Unknown | 4 (<0.1%) | 16 (<0.1%) | |
| Location prior to wards, n (%) | <0.001 | ||
| ICU | 1,400 (11%) | 8,065 (10%) | |
| Emergency department | 4,633 (36%) | 25,170 (31%) | |
| Ambulatory admission | 6,712 (53%) | 47,696 (59%) | |
| Body mass index, kg/m2, n (%) | <0.001 | ||
| Normal (18.525) | 1,431 (11%) | 26,560 (33%) | |
| Underweight (<18.5) | 122 (1%) | 4,256 (5%) | |
| Overweight (2530) | 2,484 (20%) | 23,761 (29%) | |
| Obese (3040) | 4,959 (39%) | 19,132 (24%) | |
| Severely obese (40) | 3,745 (29%) | 7,171 (9%) | |
| Initial cardiac arrest risk triage score, median (IQR) | 4 (09) | 4 (09) | <0.001 |
| Underwent surgery, n (%) | 4,482 (35%) | 28,843 (36%) | 0.3 |
| Comorbidities | |||
| Number of comorbidities, median (IQR) | 2 (14) | 1 (02) | <0.001 |
| Arrhythmia | 5,659 (44%) | 21,581 (27%) | <0.001 |
| Diabetes mellitus | 6,855 (54%) | 20,641 (26%) | <0.001 |
| Hypertension | 5,777 (45%) | 14,728 (18%) | <0.001 |
| Coronary artery disease | 5,958 (47%) | 18,979 (23%) | <0.001 |
| Cerebrovascular accident | 1,725 (14%) | 6,556 (8%) | <0.001 |
| Congestive heart failure | 4,559 (36%) | 10,919 (13%) | <0.001 |
Complications and Adverse Outcomes
In the unadjusted analyses, the overall incidence of adverse outcomes was higher among patient admissions with a diagnosis of OSA compared to those without OSA (Table 3). Those with OSA were more likely to experience RRT activation (1.5% vs 1.1%), ICU transfer (8% vs 7%), and endotracheal intubation (3.9% vs 2.9%) than those without OSA diagnoses (P < 0.001 for all comparisons). There was no significant difference in the incidence of cardiac arrest between the 2 groups, nor was there a significant difference in length of stay. Unadjusted inpatient mortality for OSA patient admissions was lower than that for non‐OSA hospitalizations (1.1% vs 1.4%, P < 0.05). A diagnosis of OSA was associated with increased unadjusted odds for RRT activation (odds ratio [OR]: 1.36 [1.16‐1.59]) and ICU transfer (OR: 1.28 [1.20‐1.38]). However, after controlling for confounders, OSA was not associated with increased odds for RRT activation (OR: 1.14 [0.95‐1.36]) or intubation (OR: 1.06 [0.94‐1.19]), and was associated with slightly decreased odds for ICU transfer (OR: 0.91 [0.84‐0.99]) (Figure 1). Those with OSA had decreased adjusted odds of cardiac arrest (OR: 0.72 [0.55‐0.95]) compared to those without OSA. OSA was also associated with decreased odds of in‐hospital mortality before (OR: 0.83 [0.70‐0.99]) and after (OR: 0.70 [0.58‐0.85]) controlling for confounders.
| Characteristic | Patient Admissions With OSA Diagnoses, n = 12,745 | Patient Admissions Without OSA Diagnoses, n = 80,931 | P Value |
|---|---|---|---|
| |||
| Outcomes, n (%) | |||
| Composite outcomea | 1,137 (9%) | 5,792 (7%) | <0.001 |
| In‐hospital death | 144 (1.1%) | 1,095 (1.4%) | 0.04 |
| Rapid response team call | 188 (1.5%) | 881 (1.1%) | <0.001 |
| ICU transfer | 1,045 (8%) | 5,260 (7%) | <0.001 |
| Cardiac arrest | 413 (0.5%) | 73 (0.6%) | 0.36 |
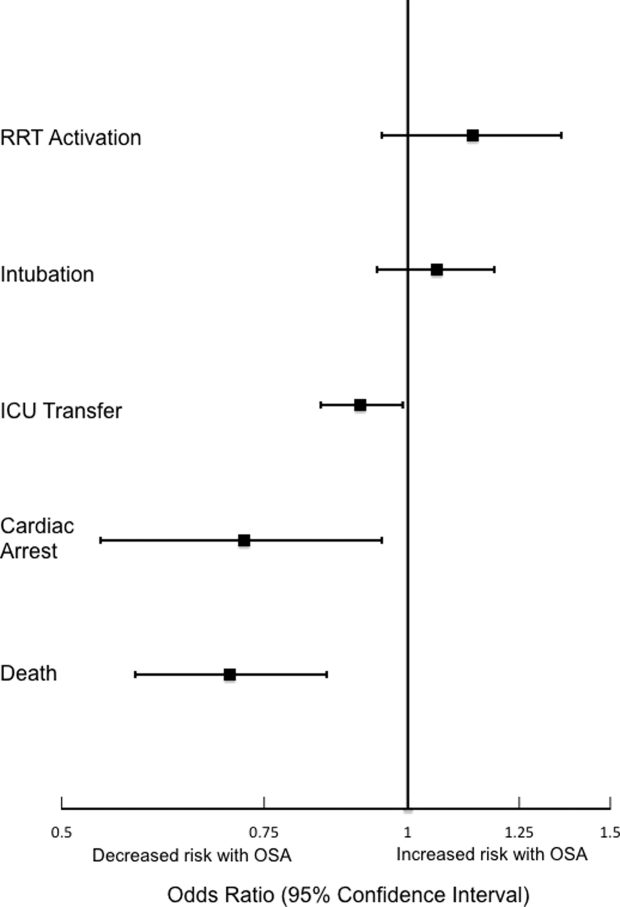
Sensitivity Analyses
The sensitivity analysis involving 1 randomly selected hospitalization per patient included a total of 53,150 patients. The results were similar to the main analysis, with adjusted odds of 1.01 (0.77‐1.32) for RRT activation, 0.86 (0.76‐0.96) for ICU transfer, and 0.69 (0.53‐0.89) for inpatient mortality. An additional sensitivity analysis included only patients who were not admitted to the ICU prior to their ward stay. This analysis included 84,211 hospitalizations and demonstrated similar findings, with adjusted odds of 0.70 for in‐hospital mortality (0.57‐0.87). Adjusted odds for RRT activation (OR: 1.12 [0.92‐1.37]) and ICU transfer (OR: 0.88 [0.81‐0.96] were also similar to the results of our main analysis.
Subgroup Analyses
Surgical and Nonsurgical Patients
Subgroup analyses of surgical versus nonsurgical patients (Figure 2) revealed similarly decreased adjusted odds of in‐hospital death for OSA patients in both groups (surgical OR: 0.69 [0.49‐0.97]; nonsurgical OR: 0.72 [0.58‐0.91]). Surgical patients with OSA diagnoses had decreased adjusted odds for ICU transfer (surgical OR: 0.82 [0.73‐0.92], but this finding was not seen in nonsurgical patients (OR: 1.03 [0.92‐1.15]).
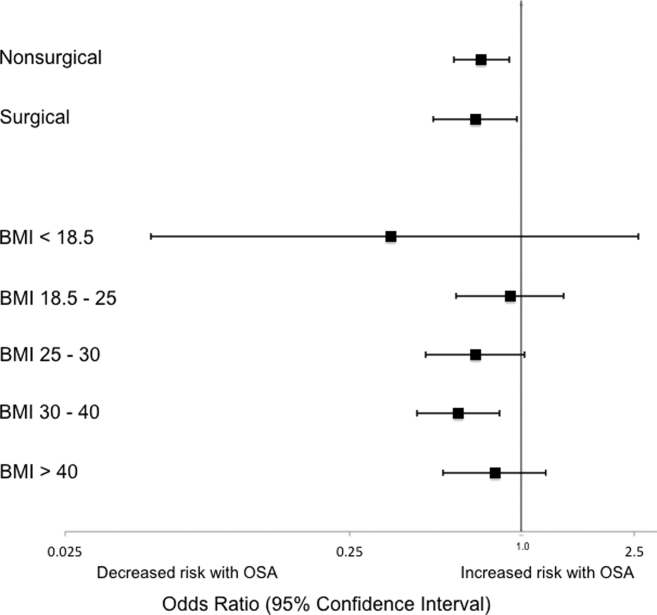
Patients Stratified by BMI
Examination across BMI categories (Figure 2) showed a significant decrease in adjusted odds of death for OSA patients with BMI 30 to 40 kg/m2 (OR: 0.60 [0.43‐0.84]). A nonsignificant decrease in adjusted odds of death was seen for OSA patients in all other groups. Adjusted odds ratios for the risk of RRT activation and ICU transfer in OSA patients within the different BMI categories were not statistically significant.
DISCUSSION
In this large observational single‐center cohort study, we found that OSA was associated with increased odds of adverse events, such as ICU transfers and RRT calls, but this risk was no longer present after adjusting for demographics, comorbidities, and presenting vital signs. Interestingly, we also found that patients with OSA had decreased adjusted odds for cardiac arrest and mortality. This mortality finding was robust to multiple sensitivity analyses and subgroup analyses. These results have significant implications for our understanding of the short‐term risks of sleep‐disordered breathing in hospitalized patients, and suggest the possibility that OSA is associated with a protective effect with regard to inpatient mortality.
Our findings are in line with other recent work in this area. In 2 large observational cohorts of surgical populations drawn from the nationally representative Nationwide Inpatient Sample administrative database, our group reported decreased odds of in‐hospital postoperative mortality in OSA patients.[10, 11] Using the same Nationwide Inpatient Sample, Lindenauer et al. showed that among inpatients hospitalized with pneumonia, OSA diagnosis was associated with increased rates of clinical deterioration but lower rates of inpatient mortality.[12] Although these 3 studies have identified decreased inpatient mortality among certain surgical populations and patients hospitalized with pneumonia, they are limited by using administrative databases that do not provide specific data on vital signs, presenting physiology, BMI, or race. Another important limitation of the Nationwide Inpatient Sample is the lack of any information on RRT activations and ICU transfers. Moreover, the database does not include information on outpatient diagnoses, which may have led to a significantly lower prevalence of OSA than expected in these studies. Despite the important methodological differences, our study corroborates this finding among a diverse cohort of hospitalized patients. Unlike these previous studies of postoperative patients or those hospitalized with pneumonia, we did not find an increased risk of adverse events associated with OSA after controlling for potential confounders.
The decreased mortality seen in OSA patients could be explained by these patients receiving more vigilant care, showing earlier signs of deterioration, or displaying more easily treatable forms of distress than patients without OSA. For example, earlier identification of deterioration could lead to earlier interventions, which could decrease inpatient mortality. In 2 studies of postsurgical patients,[10, 11] those with OSA diagnosis who developed respiratory failure were intubated earlier and received mechanical ventilation for a shorter period of time, suggesting that the cause of respiratory failure was rapidly reversible (eg, upper airway complications due to oversedation or excessive analgesia). However, we did not find increased adjusted odds of RRT activation or ICU transfer for OSA patients in our study, and so it is less likely that earlier recognition of decompensation occurred in our sample. In addition, our hospital did not have standardized practices for monitoring or managing OSA patients during the study period, which makes systematic early recognition of clinical deterioration among the OSA population in our study less likely.
Alternatively, there may be a true physiologic phenomenon providing a short‐term mortality benefit in those with OSA. It has been observed that patients with obesity (but without severe obesity) often have better outcomes after acute illness, whether by earlier or more frequent contact with medical care or heightened levels of metabolic reserve.[21, 22] However, our findings of decreased mortality for OSA patients remained even after controlling for BMI. An additional important possibility to consider is ischemic preconditioning, a well‐described phenomenon in which episodes of sublethal ischemia confer protection on tissues from subsequent ischemia/reperfusion damage.[23] Ischemic preconditioning has been demonstrated in models of cardiac and neural tissue[24, 25, 26] and has been shown to enhance stem cell survival by providing resistance to necrosis and lending functional benefits to heart, brain, and kidney models after transplantation.[25, 26, 27, 28, 29, 30, 31] The fundamentals of this concept may have applications in transplant and cardiac surgery,[32, 33] in the management of acute coronary syndromes and stroke,[32, 34, 35] and in athletic training and performance.[35, 36] Although OSA has been associated with long‐term cardiovascular morbidity and mortality,[2, 3, 4, 5, 6] the intermittent hypoxemia OSA patients experience could actually improve their ability to survive clinical deterioration in the short‐term (ie, during a hospitalization).
Limitations of our study include its conduction at a single center, which may prevent generalization to populations different than ours. Furthermore, during the study period, our hospital did not have formal guidelines or standardized management or monitoring practices for patients with OSA. Additionally, practices for managing OSA may vary across institutions. Therefore, our results may not be generalizable to hospitals with such protocols in place. However, as mentioned above, similar findings have been noted in studies using large, nationally representative administrative databases. In addition, we identified OSA via ICD‐9‐CM codes, which are likely insensitive for estimating the true prevalence of OSA in our sample. Despite this, our reported OSA prevalence of over 10% falls within the prevalence range reported in large epidemiological studies.[37, 38, 39] Finally, we did not have data on polysomnograms or treatment received for patients with OSA, so we do not know the severity of OSA or adequacy of treatment for these patients.
Notwithstanding our limitations, our study has several strengths. First, we included a large number of hospitalized patients across a diverse range of medical and surgical ward admissions, which increases the generalizability of our results. We also addressed potential confounders by including a large number of comorbidities and controlling for severity of presenting physiology with the CART score. The CART score, which contains physiologic variables such as respiratory rate, heart rate, and diastolic blood pressure, is an accurate predictor of cardiac arrest, ICU transfer, and in‐hospital mortality in our population.[40] Finally, we were able to obtain information about these diagnoses from outpatient as well as inpatient data.
In conclusion, we found that after adjustment for important confounders, OSA was associated with a decrease in hospital mortality and cardiac arrest but not with other adverse events on the wards. These results may suggest a protective benefit from OSA with regard to mortality, an advantage that could be explained by ischemic preconditioning or a higher level of care or vigilance not reflected by the number of RRT activations or ICU transfers experienced by these patients. Further research is needed to confirm these findings across other populations, to investigate the physiologic pathways by which OSA may produce these effects, and to examine the mechanisms by which treatment of OSA could influence these outcomes.
Acknowledgements
The authors thank Nicole Babuskow for administrative support, as well as Brian Furner and Timothy Holper for assistance with data acquisition.
Disclosures: Study concept and design: P.L., D.P.E, B.M., M.C.; acquisition of data: P.L.; analysis and interpretation of data: all authors; first drafting of the manuscript: P.L.; critical revision of the manuscript for important intellectual content: all authors; statistical analysis: P.L., F.Z., M.C.; obtained funding: D.P.E., M.C.; administrative, technical, and material support: F.Z., D.P.E.; study supervision: D.P.E, B.M., M.C.; data access and responsibility: P.L. and M.C. had full access to all the data in the study, and take responsibility for the integrity of the data and the accuracy of the data analysis. Drs. Churpek and Edelson have a patent pending (ARCD. P0535US.P2) for risk stratification algorithms for hospitalized patients. Dr. Churpek and Dr. Edelson are both supported by career development awards from the National Heart, Lung, and Blood Institute (K08 HL121080 and K23 HL097157, respectively). Dr. Churpek has received honoraria from Chest for invited speaking engagements. In addition, Dr. Edelson has received research support and honoraria from Philips Healthcare (Andover, MA), research support from the American Heart Association (Dallas, TX) and Laerdal Medical (Stavanger, Norway), and an honorarium from Early Sense (Tel Aviv, Israel). She has ownership interest in Quant HC (Chicago, IL), which is developing products for risk stratification of hospitalized patients. Dr. Mokhlesi is supported by National Institutes of Health grant R01HL119161. Dr. Mokhlesi has served as a consultant to Philips/Respironics and has received research support from Philips/Respironics.
- , , , , , . Increased prevalence of sleep‐disordered breathing in adults. Am J Epidemiol. 2013;177(9):1006–1014.
- , , , . Long‐term cardiovascular outcomes in men with obstructive sleep apnoea‐hypopnoea with or without treatment with continuous positive airway pressure: an observational study. Lancet. 2005;365(9464):1046–1053.
- , , , . Prospective study of the association between sleep‐disordered breathing and hypertension. N Engl J Med. 2000;342(19):1378–1384.
- , , , , , . Obstructive sleep apnea as a risk factor for stroke and death. N Engl J Med. 2005;353(19):2034–2041.
- , , , , . Obstructive sleep apnea and risk of cardiovascular events and all‐cause mortality: a decade‐long historical cohort study. PLoS Med. 2014;11(2):e1001599.
- , , , , , . Sleep apnea as an independent risk factor for all‐cause mortality: the Busselton Health Study. Sleep. 2008;31(8):1079–1085.
- , , , , . Postoperative complications in patients with obstructive sleep apnea. Chest. 2012;141(2):436–441.
- , , , , , . Meta‐analysis of the association between obstructive sleep apnoea and postoperative outcome. Br J Anaesth. 2012;109(6):897–906.
- , , , et al. The impact of sleep apnea on postoperative utilization of resources and adverse outcomes. Anesth Analg. 2014;118(2):407–418.
- , , , , , . Sleep‐disordered breathing and postoperative outcomes after bariatric surgery: analysis of the nationwide inpatient sample. Obes Surg. 2013;23(11):1842–1851.
- , , , , , . Sleep‐disordered breathing and postoperative outcomes after elective surgery: analysis of the nationwide inpatient sample. Chest. 2013;144:903–914.
- , , , , , . Prevalence, treatment and outcomes associated with obstructive sleep apnea among patients hospitalized with pneumonia. Chest. 2014;145(5):1032–1038.
- , , , et al. Experimental pain and opioid analgesia in volunteers at high risk for obstructive sleep apnea. PLoS One. 2013;8(1):e54807.
- , , , , . Increased CSF opioid activity in sleep apnea syndrome. Regression after successful treatment. Chest. 1989;96(2):250–254.
- , , , et al. Comparison of the relaxant effects of diazepam, flunitrazepam and midazolam on airway smooth muscle. Br J Anaesth. 1992;69(1):65–69.
- , . Effect of flurazepam on sleep‐disordered breathing and nocturnal oxygen desaturation in asymptomatic subjects. Am J Med. 1982;73(2):239–243.
- , , , , , . Derivation of a cardiac arrest prediction model using ward vital signs*. Crit Care Med. 2012;40(7):2102–2108.
- , , , , . Using electronic health record data to develop and validate a prediction model for adverse outcomes in the wards*. Crit Care Med. 2014;42(4):841–848.
- , , , et al. The APACHE III prognostic system. Risk prediction of hospital mortality for critically ill hospitalized adults. Chest. 1991;100(6):1619–1636.
- , , , , , . Predicting cardiac arrest on the wards: a nested case‐control study. Chest. 2012;141(5):1170–1176.
- , , , , , . Mortality of patients with respiratory insufficiency and adult respiratory distress syndrome after surgery: the obesity paradox. J Intensive Care Med. 2012;27(4):306–311.
- , , , et al. Body mass index and mortality in acute myocardial infarction patients. Am J Med. 2012(8);125:796–803.
- , , . Preconditioning with ischemia: a delay of lethal cell injury in ischemic myocardium. Circulation. 1986;74(5):1124–1136.
- , , , . Ischemic preconditioning slows energy metabolism and delays ultrastructural damage during a sustained ischemic episode. Circ Res. 1990;66(4):913–931.
- , , , et al. Transplantation of hypoxia‐preconditioned mesenchymal stem cells improves infarcted heart function via enhanced survival of implanted cells and angiogenesis. J Thorac Cardiovasc Surg. 2008;135(4):799–808.
- , , , et al. Hypoxic preconditioning with cobalt of bone marrow mesenchymal stem cells improves cell migration and enhances therapy for treatment of ischemic acute kidney injury. PLoS One. 2013;8(5):e62703.
- , . Human embryonic stem cell neural differentiation and enhanced cell survival promoted by hypoxic preconditioning. Cell Death Dis. 2010;1:e22.
- , , , et al. Ischemic pre‐conditioning enhances the mobilization and recruitment of bone marrow stem cells to protect against ischemia/reperfusion injury in the late phase. J Am Coll Cardiol. 2009;53(19):1814–1822.
- , , , et al. Hypoxic preconditioning enhances bone marrow mesenchymal stem cell migration via Kv2.1 channel and FAK activation. Am J Physiol Cell Physiol. 2011;301(2):C362–C372.
- , , , et al. In vitro hypoxic preconditioning of embryonic stem cells as a strategy of promoting cell survival and functional benefits after transplantation into the ischemic rat brain. Exp Neurol. 2008;210(2):656–670.
- , , , , . Transplantation of hypoxia preconditioned bone marrow mesenchymal stem cells enhances angiogenesis and neurogenesis after cerebral ischemia in rats. Neurobiol Dis. 2012;46(3):635–645.
- , , . Translation of remote ischaemic preconditioning into clinical practice. Lancet. 2009;374(9700):1557–1565.
- , , . Novel adjunctive treatments of myocardial infarction. World J Cardiol. 2014;6(6):434–443.
- , . Hypoxic‐preconditioning enhances the regenerative capacity of neural stem/progenitors in subventricular zone of newborn piglet brain. Stem Cell Res. 2013;11(2):669–686.
- , , , , . Ischemic preconditioning improves oxygen saturation and attenuates hypoxic pulmonary vasoconstriction at high altitude. High Alt Med Biol. 2014;15(2):155–161.
- , , , et al. Remote preconditioning improves maximal performance in highly trained athletes. Med Sci Sports Exerc. 2011;43(7):1280–1286.
- , , , . Obstructive sleep apnea‐hypopnea and related clinical features in a population‐based sample of subjects aged 30 to 70 yr. Am J Respir Crit Care Med. 2001;163(3 pt 1):685–689.
- , , , , , . The occurrence of sleep‐disordered breathing among middle‐aged adults. N Engl J Med. 1993;328(17):1230–1235.
- , , . Epidemiology of obstructive sleep apnea: a population health perspective. Am J Respir Crit Care Med. 2002;165(9):1217–1239.
- , , . Risk stratification of hospitalized patients on the wards. Chest. 2013;143(6):1758–1765.
Obstructive sleep apnea (OSA) is an increasingly prevalent condition characterized by intermittent airway obstruction during sleep, which leads to hypoxemia, hypercapnia, and fragmented sleep. The current prevalence estimates of moderate to severe OSA (apnea‐hypopnea index 15, measured as events/hour) in middle‐aged adults are approximately 13% in men and 6% in women.[1] OSA is a well‐described independent risk factor for long‐term neurocognitive, cardiovascular, and cerebrovascular morbidity and mortality.[2, 3, 4, 5, 6]
Recent studies have also identified OSA as an independent risk factor for adverse perioperative outcomes, including endotracheal intubation, intensive care unit (ICU) transfer, and increased length of stay.[7, 8, 9, 10, 11] Paradoxically, despite an increase in the risk of complications, several of these studies did not find an association between in‐hospital death and OSA even after controlling for potential confounders.[9, 10, 11] Furthermore, a recent study of patients hospitalized for pneumonia reported increased rates of clinical deterioration and mechanical ventilation, but also lower odds of inpatient mortality in patients with OSA.[12]
These studies may have been limited by the absence of physiologic data, which prevented controlling for severity of illness. It is also unclear whether these previously described associations between OSA and adverse clinical outcomes hold true for general hospital inpatients. OSA may be worsened by medications frequently used in hospitals, such as narcotics and benzodiazepines. Opiate use contributes to both central and obstructive sleep apneas,[13, 14] and benzodiazepines are known to produce airway smooth muscle relaxation and can cause respiratory depression.[15] In fact, the use of benzodiazepines has been implicated in the unmasking of OSA in patients with previously undiagnosed sleep‐disordered breathing.[16] These findings suggest mechanisms by which OSA could contribute to an increased risk in hospital ward patients for rapid response team (RRT) activation, ICU transfer, cardiac arrest, and in‐hospital death.
The aim of this study was to determine the independent association between OSA and in‐hospital mortality in ward patients. We also aimed to investigate the association of OSA with clinical deterioration on the wards, while controlling for patient characteristics, initial physiology, and severity of illness.
MATERIALS AND METHODS
Setting and Study Population
This observational cohort study was performed at an academic tertiary care medical center with approximately 500 beds. Data were obtained from all adult patients hospitalized on the wards between November 1, 2008 and October 1, 2013. Our hospital has utilized an RRT, led by a critical care nurse and respiratory therapist with hospitalist and pharmacist consultation available upon request, since 2008. This team is separate from the team that responds to a cardiac arrest. Criteria for RRT activation include tachypnea, tachycardia, hypotension, and staff worry, but specific vital sign thresholds are not specified.
The study analyzed deidentified data from the hospital's Clinical Research Data Warehouse, which is maintained by the Center for Research Informatics at The University of Chicago. The study protocol was approved by the University of Chicago Institutional Review Board (IRB #16995A).
Data Collection
Patient age, sex, race, body mass index (BMI), and location prior to ward admission (ie, whether they were admitted from the emergency department, transferred from the ICU, or directly admitted from clinic or home) were collected. Patients who underwent surgery during their admission were identified using the hospital's admission‐transfer‐discharge database. In addition, routinely collected vital signs (eg, respiratory rate, blood pressure, heart rate) were obtained from the electronic health record (Epic, Verona, WI). To determine severity of illness, the first set of vital signs measured on hospital presentation were utilized to calculate the cardiac arrest risk triage (CART) score, a vital‐signbased early warning score we previously developed and validated for predicting adverse events in our population.[17] The CART score ranges from 0 to 57, with points assigned for abnormalities in respiratory rate, heart rate, diastolic blood pressure, and age. If any vital sign was missing, the next available measurement was pulled into the set. If any vital sign remained missing after this change, the median value for that particular location (ie, wards, ICU, or emergency department) was imputed as previously described.[18, 19]
Patients with OSA were identified by the following International Classification of Diseases, Ninth Revision, Clinical Modification (ICD‐9‐CM) codes using inpatient and outpatient medical records: 278.03, 327.20, 327.23, 327.29, 780.51, 780.53, and 780.57 (Table 1). Data on other patient comorbidities, including coronary artery disease, congestive heart failure, arrhythmias, uncomplicated and complicated diabetes mellitus, hypertension, and cerebrovascular disease were collected using specific ICD‐9‐CM codes from both inpatient and outpatient records. Information on insurance payer was also collected from the hospital's billing database. Insurance payers were grouped into the following categories: private payer, Medicare/Medicaid, and no insurance. Patients with both public and private payers were counted as being privately insured.
| Diagnosis Code | Description | % of Sleep Apnea Diagnosesa |
|---|---|---|
| ||
| 327.23 | Obstructive sleep apnea | 65.6 |
| 780.57 | Unspecified sleep apnea | 19.4 |
| 780.53 | Hypersomnia with sleep apnea, unspecified | 11.7 |
| 780.51 | Insomnia with sleep apnea, unspecified | 1.5 |
| 327.2 | Organic sleep apnea, unspecified | 0.2 |
| 278.03 | Obesity hypoventilation syndrome | 1.7 |
Outcomes
The primary outcome of the study was in‐hospital mortality. Secondary outcomes included length of stay, RRT activation, transfer to the ICU, endotracheal intubation, cardiac arrest (defined as a loss of pulse with attempted resuscitation) on the wards, and a composite outcome of RRT activation, ICU transfer, and death. Because cardiac arrests on the wards result either in death or ICU transfer following successful resuscitation, this variable was omitted from the composite outcome. Cardiac arrests were identified using a prospectively validated quality improvement database that has been described previously.[20] ICU transfer was identified using the hospital's admission‐transfer‐discharge database. Only the index cardiac arrest, intubation, RRT, or ICU transfer for each admission was used in the study, but more than 1 type of outcome could occur for each patient (eg, a patient who died following an unsuccessful resuscitation attempt would count as both a cardiac arrest and a death).
Statistical Analysis
Patient characteristics were compared using Student t tests, Wilcoxon rank sum tests, and 2 statistics, as appropriate. Unadjusted logistic regression models were fit to estimate the change in odds of each adverse event and a composite outcome of any event for patient admissions with OSA compared to those without OSA. Adjusted logistic regression models were then fit for each outcome to control for patient characteristics (age, sex, BMI, insurance status, and individual comorbidities), location immediately prior to ward admission, and admission severity of illness (as measured by CART score). In the adjusted model, CART score, age, and number of comorbidities were entered linearly, with the addition of squared terms for age and CART score, as these variables showed nonlinear associations with the outcomes of interest. Race, surgical status, insurance payer, location prior to ward, and BMI (underweight, <18.5 kg/m2; normal weight, 18.524.9 kg/m2; overweight, 25.029.9 kg/m2; obese, 3039.9 kg/m2; and severely obese, (40 kg/m2) were modeled as categorical variables.
Given that an individual patient could experience multiple hospitalizations during the study period, we performed a sensitivity analysis of all adjusted and unadjusted models using a single randomly selected hospitalization for each unique patient. In addition, we performed a sensitivity analysis of all patients who were not admitted to the ICU prior to their ward stay. Finally, we performed subgroup analyses of all unadjusted and adjusted models for each BMI category and surgical status.
All tests of significance used a 2‐sided P value <0.05. Statistical analyses were completed using Stata version 12.0 (StataCorp, College Station, TX).
RESULTS
Patient Characteristics
During the study period, 93,676 patient admissions from 53,150 unique patients resulted in the occurrence of 1,069 RRT activations, 6,305 ICU transfers, and 1,239 in‐hospital deaths. Within our sample, 40,034 patients had at least 1 inpatient record and at least 1 outpatient record. OSA diagnosis was present in 5,625 patients (10.6% of the total sample), with 4,748 patients having an OSA diagnosis code entered during a hospitalization, 2,143 with an OSA diagnosis code entered during an outpatient encounter, and 877 with both inpatient and outpatient diagnosis codes. These patients identified as having OSA contributed 12,745 (13.6%) hospital admissions.
Patients with an OSA diagnosis were more likely to be older (median age 59 years [interquartile range 4968] vs 55 years [3868]), male (49% vs 42%), overweight or obese (88% vs 62%), and more likely to carry diagnoses of diabetes (53.8% vs 25.5%), hypertension (45.3% vs 18.2%), arrhythmias (44.4% vs 26.7%), coronary artery disease (46.8% vs 23.5%), heart failure (35.8% vs 13.5%), and cerebrovascular disease (13.5% vs 8.1%) than patients without an OSA diagnosis (all comparisons significant, P < 0.001) (Table 2).
| Characteristic | Patient Admissions With OSA Diagnoses, n = 12,745 | Patient Admissions Without OSA Diagnoses, n = 80,931 | P Value |
|---|---|---|---|
| |||
| Age, y, median (IQR) | 59 (4968) | 55 (3868) | <0.001 |
| Female, n (%) | 6,514 (51%) | 47,202 (58%) | <0.001 |
| Race, n (%) | <0.001 | ||
| White | 4,205 (33%) | 30,119 (37%) | |
| Black/African American | 7,024 (55%) | 38,561 (48%) | |
| Asian | 561 (4.4%) | 3,419 (4.2%) | |
| American Indian or Native Alaskan | 20 (0.2%) | 113 (0.1%) | |
| More than 1 race | 127 (1%) | 843 (1%) | |
| Race unknown | 808 (6%) | 7,876 (10%) | |
| Insurance status, n (%) | <0.001 | ||
| Private | 4,484 (35%) | 32,467 (40%) | |
| Medicare/Medicaid | 8,201 (64%) | 42,208 (58%) | |
| Uninsured | 53 (0.4%) | 1,190 (1%) | |
| Unknown | 4 (<0.1%) | 16 (<0.1%) | |
| Location prior to wards, n (%) | <0.001 | ||
| ICU | 1,400 (11%) | 8,065 (10%) | |
| Emergency department | 4,633 (36%) | 25,170 (31%) | |
| Ambulatory admission | 6,712 (53%) | 47,696 (59%) | |
| Body mass index, kg/m2, n (%) | <0.001 | ||
| Normal (18.525) | 1,431 (11%) | 26,560 (33%) | |
| Underweight (<18.5) | 122 (1%) | 4,256 (5%) | |
| Overweight (2530) | 2,484 (20%) | 23,761 (29%) | |
| Obese (3040) | 4,959 (39%) | 19,132 (24%) | |
| Severely obese (40) | 3,745 (29%) | 7,171 (9%) | |
| Initial cardiac arrest risk triage score, median (IQR) | 4 (09) | 4 (09) | <0.001 |
| Underwent surgery, n (%) | 4,482 (35%) | 28,843 (36%) | 0.3 |
| Comorbidities | |||
| Number of comorbidities, median (IQR) | 2 (14) | 1 (02) | <0.001 |
| Arrhythmia | 5,659 (44%) | 21,581 (27%) | <0.001 |
| Diabetes mellitus | 6,855 (54%) | 20,641 (26%) | <0.001 |
| Hypertension | 5,777 (45%) | 14,728 (18%) | <0.001 |
| Coronary artery disease | 5,958 (47%) | 18,979 (23%) | <0.001 |
| Cerebrovascular accident | 1,725 (14%) | 6,556 (8%) | <0.001 |
| Congestive heart failure | 4,559 (36%) | 10,919 (13%) | <0.001 |
Complications and Adverse Outcomes
In the unadjusted analyses, the overall incidence of adverse outcomes was higher among patient admissions with a diagnosis of OSA compared to those without OSA (Table 3). Those with OSA were more likely to experience RRT activation (1.5% vs 1.1%), ICU transfer (8% vs 7%), and endotracheal intubation (3.9% vs 2.9%) than those without OSA diagnoses (P < 0.001 for all comparisons). There was no significant difference in the incidence of cardiac arrest between the 2 groups, nor was there a significant difference in length of stay. Unadjusted inpatient mortality for OSA patient admissions was lower than that for non‐OSA hospitalizations (1.1% vs 1.4%, P < 0.05). A diagnosis of OSA was associated with increased unadjusted odds for RRT activation (odds ratio [OR]: 1.36 [1.16‐1.59]) and ICU transfer (OR: 1.28 [1.20‐1.38]). However, after controlling for confounders, OSA was not associated with increased odds for RRT activation (OR: 1.14 [0.95‐1.36]) or intubation (OR: 1.06 [0.94‐1.19]), and was associated with slightly decreased odds for ICU transfer (OR: 0.91 [0.84‐0.99]) (Figure 1). Those with OSA had decreased adjusted odds of cardiac arrest (OR: 0.72 [0.55‐0.95]) compared to those without OSA. OSA was also associated with decreased odds of in‐hospital mortality before (OR: 0.83 [0.70‐0.99]) and after (OR: 0.70 [0.58‐0.85]) controlling for confounders.
| Characteristic | Patient Admissions With OSA Diagnoses, n = 12,745 | Patient Admissions Without OSA Diagnoses, n = 80,931 | P Value |
|---|---|---|---|
| |||
| Outcomes, n (%) | |||
| Composite outcomea | 1,137 (9%) | 5,792 (7%) | <0.001 |
| In‐hospital death | 144 (1.1%) | 1,095 (1.4%) | 0.04 |
| Rapid response team call | 188 (1.5%) | 881 (1.1%) | <0.001 |
| ICU transfer | 1,045 (8%) | 5,260 (7%) | <0.001 |
| Cardiac arrest | 413 (0.5%) | 73 (0.6%) | 0.36 |
Sensitivity Analyses
The sensitivity analysis involving 1 randomly selected hospitalization per patient included a total of 53,150 patients. The results were similar to the main analysis, with adjusted odds of 1.01 (0.77‐1.32) for RRT activation, 0.86 (0.76‐0.96) for ICU transfer, and 0.69 (0.53‐0.89) for inpatient mortality. An additional sensitivity analysis included only patients who were not admitted to the ICU prior to their ward stay. This analysis included 84,211 hospitalizations and demonstrated similar findings, with adjusted odds of 0.70 for in‐hospital mortality (0.57‐0.87). Adjusted odds for RRT activation (OR: 1.12 [0.92‐1.37]) and ICU transfer (OR: 0.88 [0.81‐0.96] were also similar to the results of our main analysis.
Subgroup Analyses
Surgical and Nonsurgical Patients
Subgroup analyses of surgical versus nonsurgical patients (Figure 2) revealed similarly decreased adjusted odds of in‐hospital death for OSA patients in both groups (surgical OR: 0.69 [0.49‐0.97]; nonsurgical OR: 0.72 [0.58‐0.91]). Surgical patients with OSA diagnoses had decreased adjusted odds for ICU transfer (surgical OR: 0.82 [0.73‐0.92], but this finding was not seen in nonsurgical patients (OR: 1.03 [0.92‐1.15]).
Patients Stratified by BMI
Examination across BMI categories (Figure 2) showed a significant decrease in adjusted odds of death for OSA patients with BMI 30 to 40 kg/m2 (OR: 0.60 [0.43‐0.84]). A nonsignificant decrease in adjusted odds of death was seen for OSA patients in all other groups. Adjusted odds ratios for the risk of RRT activation and ICU transfer in OSA patients within the different BMI categories were not statistically significant.
DISCUSSION
In this large observational single‐center cohort study, we found that OSA was associated with increased odds of adverse events, such as ICU transfers and RRT calls, but this risk was no longer present after adjusting for demographics, comorbidities, and presenting vital signs. Interestingly, we also found that patients with OSA had decreased adjusted odds for cardiac arrest and mortality. This mortality finding was robust to multiple sensitivity analyses and subgroup analyses. These results have significant implications for our understanding of the short‐term risks of sleep‐disordered breathing in hospitalized patients, and suggest the possibility that OSA is associated with a protective effect with regard to inpatient mortality.
Our findings are in line with other recent work in this area. In 2 large observational cohorts of surgical populations drawn from the nationally representative Nationwide Inpatient Sample administrative database, our group reported decreased odds of in‐hospital postoperative mortality in OSA patients.[10, 11] Using the same Nationwide Inpatient Sample, Lindenauer et al. showed that among inpatients hospitalized with pneumonia, OSA diagnosis was associated with increased rates of clinical deterioration but lower rates of inpatient mortality.[12] Although these 3 studies have identified decreased inpatient mortality among certain surgical populations and patients hospitalized with pneumonia, they are limited by using administrative databases that do not provide specific data on vital signs, presenting physiology, BMI, or race. Another important limitation of the Nationwide Inpatient Sample is the lack of any information on RRT activations and ICU transfers. Moreover, the database does not include information on outpatient diagnoses, which may have led to a significantly lower prevalence of OSA than expected in these studies. Despite the important methodological differences, our study corroborates this finding among a diverse cohort of hospitalized patients. Unlike these previous studies of postoperative patients or those hospitalized with pneumonia, we did not find an increased risk of adverse events associated with OSA after controlling for potential confounders.
The decreased mortality seen in OSA patients could be explained by these patients receiving more vigilant care, showing earlier signs of deterioration, or displaying more easily treatable forms of distress than patients without OSA. For example, earlier identification of deterioration could lead to earlier interventions, which could decrease inpatient mortality. In 2 studies of postsurgical patients,[10, 11] those with OSA diagnosis who developed respiratory failure were intubated earlier and received mechanical ventilation for a shorter period of time, suggesting that the cause of respiratory failure was rapidly reversible (eg, upper airway complications due to oversedation or excessive analgesia). However, we did not find increased adjusted odds of RRT activation or ICU transfer for OSA patients in our study, and so it is less likely that earlier recognition of decompensation occurred in our sample. In addition, our hospital did not have standardized practices for monitoring or managing OSA patients during the study period, which makes systematic early recognition of clinical deterioration among the OSA population in our study less likely.
Alternatively, there may be a true physiologic phenomenon providing a short‐term mortality benefit in those with OSA. It has been observed that patients with obesity (but without severe obesity) often have better outcomes after acute illness, whether by earlier or more frequent contact with medical care or heightened levels of metabolic reserve.[21, 22] However, our findings of decreased mortality for OSA patients remained even after controlling for BMI. An additional important possibility to consider is ischemic preconditioning, a well‐described phenomenon in which episodes of sublethal ischemia confer protection on tissues from subsequent ischemia/reperfusion damage.[23] Ischemic preconditioning has been demonstrated in models of cardiac and neural tissue[24, 25, 26] and has been shown to enhance stem cell survival by providing resistance to necrosis and lending functional benefits to heart, brain, and kidney models after transplantation.[25, 26, 27, 28, 29, 30, 31] The fundamentals of this concept may have applications in transplant and cardiac surgery,[32, 33] in the management of acute coronary syndromes and stroke,[32, 34, 35] and in athletic training and performance.[35, 36] Although OSA has been associated with long‐term cardiovascular morbidity and mortality,[2, 3, 4, 5, 6] the intermittent hypoxemia OSA patients experience could actually improve their ability to survive clinical deterioration in the short‐term (ie, during a hospitalization).
Limitations of our study include its conduction at a single center, which may prevent generalization to populations different than ours. Furthermore, during the study period, our hospital did not have formal guidelines or standardized management or monitoring practices for patients with OSA. Additionally, practices for managing OSA may vary across institutions. Therefore, our results may not be generalizable to hospitals with such protocols in place. However, as mentioned above, similar findings have been noted in studies using large, nationally representative administrative databases. In addition, we identified OSA via ICD‐9‐CM codes, which are likely insensitive for estimating the true prevalence of OSA in our sample. Despite this, our reported OSA prevalence of over 10% falls within the prevalence range reported in large epidemiological studies.[37, 38, 39] Finally, we did not have data on polysomnograms or treatment received for patients with OSA, so we do not know the severity of OSA or adequacy of treatment for these patients.
Notwithstanding our limitations, our study has several strengths. First, we included a large number of hospitalized patients across a diverse range of medical and surgical ward admissions, which increases the generalizability of our results. We also addressed potential confounders by including a large number of comorbidities and controlling for severity of presenting physiology with the CART score. The CART score, which contains physiologic variables such as respiratory rate, heart rate, and diastolic blood pressure, is an accurate predictor of cardiac arrest, ICU transfer, and in‐hospital mortality in our population.[40] Finally, we were able to obtain information about these diagnoses from outpatient as well as inpatient data.
In conclusion, we found that after adjustment for important confounders, OSA was associated with a decrease in hospital mortality and cardiac arrest but not with other adverse events on the wards. These results may suggest a protective benefit from OSA with regard to mortality, an advantage that could be explained by ischemic preconditioning or a higher level of care or vigilance not reflected by the number of RRT activations or ICU transfers experienced by these patients. Further research is needed to confirm these findings across other populations, to investigate the physiologic pathways by which OSA may produce these effects, and to examine the mechanisms by which treatment of OSA could influence these outcomes.
Acknowledgements
The authors thank Nicole Babuskow for administrative support, as well as Brian Furner and Timothy Holper for assistance with data acquisition.
Disclosures: Study concept and design: P.L., D.P.E, B.M., M.C.; acquisition of data: P.L.; analysis and interpretation of data: all authors; first drafting of the manuscript: P.L.; critical revision of the manuscript for important intellectual content: all authors; statistical analysis: P.L., F.Z., M.C.; obtained funding: D.P.E., M.C.; administrative, technical, and material support: F.Z., D.P.E.; study supervision: D.P.E, B.M., M.C.; data access and responsibility: P.L. and M.C. had full access to all the data in the study, and take responsibility for the integrity of the data and the accuracy of the data analysis. Drs. Churpek and Edelson have a patent pending (ARCD. P0535US.P2) for risk stratification algorithms for hospitalized patients. Dr. Churpek and Dr. Edelson are both supported by career development awards from the National Heart, Lung, and Blood Institute (K08 HL121080 and K23 HL097157, respectively). Dr. Churpek has received honoraria from Chest for invited speaking engagements. In addition, Dr. Edelson has received research support and honoraria from Philips Healthcare (Andover, MA), research support from the American Heart Association (Dallas, TX) and Laerdal Medical (Stavanger, Norway), and an honorarium from Early Sense (Tel Aviv, Israel). She has ownership interest in Quant HC (Chicago, IL), which is developing products for risk stratification of hospitalized patients. Dr. Mokhlesi is supported by National Institutes of Health grant R01HL119161. Dr. Mokhlesi has served as a consultant to Philips/Respironics and has received research support from Philips/Respironics.
- , , , , , . Increased prevalence of sleep‐disordered breathing in adults. Am J Epidemiol. 2013;177(9):1006–1014.
- , , , . Long‐term cardiovascular outcomes in men with obstructive sleep apnoea‐hypopnoea with or without treatment with continuous positive airway pressure: an observational study. Lancet. 2005;365(9464):1046–1053.
- , , , . Prospective study of the association between sleep‐disordered breathing and hypertension. N Engl J Med. 2000;342(19):1378–1384.
- , , , , , . Obstructive sleep apnea as a risk factor for stroke and death. N Engl J Med. 2005;353(19):2034–2041.
- , , , , . Obstructive sleep apnea and risk of cardiovascular events and all‐cause mortality: a decade‐long historical cohort study. PLoS Med. 2014;11(2):e1001599.
- , , , , , . Sleep apnea as an independent risk factor for all‐cause mortality: the Busselton Health Study. Sleep. 2008;31(8):1079–1085.
- , , , , . Postoperative complications in patients with obstructive sleep apnea. Chest. 2012;141(2):436–441.
- , , , , , . Meta‐analysis of the association between obstructive sleep apnoea and postoperative outcome. Br J Anaesth. 2012;109(6):897–906.
- , , , et al. The impact of sleep apnea on postoperative utilization of resources and adverse outcomes. Anesth Analg. 2014;118(2):407–418.
- , , , , , . Sleep‐disordered breathing and postoperative outcomes after bariatric surgery: analysis of the nationwide inpatient sample. Obes Surg. 2013;23(11):1842–1851.
- , , , , , . Sleep‐disordered breathing and postoperative outcomes after elective surgery: analysis of the nationwide inpatient sample. Chest. 2013;144:903–914.
- , , , , , . Prevalence, treatment and outcomes associated with obstructive sleep apnea among patients hospitalized with pneumonia. Chest. 2014;145(5):1032–1038.
- , , , et al. Experimental pain and opioid analgesia in volunteers at high risk for obstructive sleep apnea. PLoS One. 2013;8(1):e54807.
- , , , , . Increased CSF opioid activity in sleep apnea syndrome. Regression after successful treatment. Chest. 1989;96(2):250–254.
- , , , et al. Comparison of the relaxant effects of diazepam, flunitrazepam and midazolam on airway smooth muscle. Br J Anaesth. 1992;69(1):65–69.
- , . Effect of flurazepam on sleep‐disordered breathing and nocturnal oxygen desaturation in asymptomatic subjects. Am J Med. 1982;73(2):239–243.
- , , , , , . Derivation of a cardiac arrest prediction model using ward vital signs*. Crit Care Med. 2012;40(7):2102–2108.
- , , , , . Using electronic health record data to develop and validate a prediction model for adverse outcomes in the wards*. Crit Care Med. 2014;42(4):841–848.
- , , , et al. The APACHE III prognostic system. Risk prediction of hospital mortality for critically ill hospitalized adults. Chest. 1991;100(6):1619–1636.
- , , , , , . Predicting cardiac arrest on the wards: a nested case‐control study. Chest. 2012;141(5):1170–1176.
- , , , , , . Mortality of patients with respiratory insufficiency and adult respiratory distress syndrome after surgery: the obesity paradox. J Intensive Care Med. 2012;27(4):306–311.
- , , , et al. Body mass index and mortality in acute myocardial infarction patients. Am J Med. 2012(8);125:796–803.
- , , . Preconditioning with ischemia: a delay of lethal cell injury in ischemic myocardium. Circulation. 1986;74(5):1124–1136.
- , , , . Ischemic preconditioning slows energy metabolism and delays ultrastructural damage during a sustained ischemic episode. Circ Res. 1990;66(4):913–931.
- , , , et al. Transplantation of hypoxia‐preconditioned mesenchymal stem cells improves infarcted heart function via enhanced survival of implanted cells and angiogenesis. J Thorac Cardiovasc Surg. 2008;135(4):799–808.
- , , , et al. Hypoxic preconditioning with cobalt of bone marrow mesenchymal stem cells improves cell migration and enhances therapy for treatment of ischemic acute kidney injury. PLoS One. 2013;8(5):e62703.
- , . Human embryonic stem cell neural differentiation and enhanced cell survival promoted by hypoxic preconditioning. Cell Death Dis. 2010;1:e22.
- , , , et al. Ischemic pre‐conditioning enhances the mobilization and recruitment of bone marrow stem cells to protect against ischemia/reperfusion injury in the late phase. J Am Coll Cardiol. 2009;53(19):1814–1822.
- , , , et al. Hypoxic preconditioning enhances bone marrow mesenchymal stem cell migration via Kv2.1 channel and FAK activation. Am J Physiol Cell Physiol. 2011;301(2):C362–C372.
- , , , et al. In vitro hypoxic preconditioning of embryonic stem cells as a strategy of promoting cell survival and functional benefits after transplantation into the ischemic rat brain. Exp Neurol. 2008;210(2):656–670.
- , , , , . Transplantation of hypoxia preconditioned bone marrow mesenchymal stem cells enhances angiogenesis and neurogenesis after cerebral ischemia in rats. Neurobiol Dis. 2012;46(3):635–645.
- , , . Translation of remote ischaemic preconditioning into clinical practice. Lancet. 2009;374(9700):1557–1565.
- , , . Novel adjunctive treatments of myocardial infarction. World J Cardiol. 2014;6(6):434–443.
- , . Hypoxic‐preconditioning enhances the regenerative capacity of neural stem/progenitors in subventricular zone of newborn piglet brain. Stem Cell Res. 2013;11(2):669–686.
- , , , , . Ischemic preconditioning improves oxygen saturation and attenuates hypoxic pulmonary vasoconstriction at high altitude. High Alt Med Biol. 2014;15(2):155–161.
- , , , et al. Remote preconditioning improves maximal performance in highly trained athletes. Med Sci Sports Exerc. 2011;43(7):1280–1286.
- , , , . Obstructive sleep apnea‐hypopnea and related clinical features in a population‐based sample of subjects aged 30 to 70 yr. Am J Respir Crit Care Med. 2001;163(3 pt 1):685–689.
- , , , , , . The occurrence of sleep‐disordered breathing among middle‐aged adults. N Engl J Med. 1993;328(17):1230–1235.
- , , . Epidemiology of obstructive sleep apnea: a population health perspective. Am J Respir Crit Care Med. 2002;165(9):1217–1239.
- , , . Risk stratification of hospitalized patients on the wards. Chest. 2013;143(6):1758–1765.
© 2015 Society of Hospital Medicine
