User login
Effectiveness of SIESTA on Objective and Subjective Metrics of Nighttime Hospital Sleep Disruptors
Although sleep is critical to patient recovery in the hospital, hospitalization is not restful,1,2 and inpatient sleep deprivation has been linked to poor health outcomes.1-4 The American Academy of Nursing’s Choosing Wisely® campaign recommends nurses reduce unnecessary nocturnal care.5 However, interventions to improve inpatient sleep are not widely implemented.6 Targeting routine disruptions, such as overnight vital signs, by changing default settings in the electronic health record (EHR)with “nudges” could be a cost-effective strategy to improve inpatient sleep.4,7
We created Sleep for Inpatients: Empowering Staff to Act (SIESTA), which pairs nudges in the EHR with interprofessional education and empowerment,8 and tested its effectiveness on objectively and subjectively measured nocturnal sleep disruptors.
METHODS
Study Design
Two 18-room University of Chicago Medicine general-medicine units were used in this prospective study. The SIESTA-enhanced unit underwent the full sleep intervention: nursing education and empowerment, physician education, and EHR changes. The standard unit did not receive nursing interventions but received all other forms of intervention. Because physicians simultaneously cared for patients on both units, all internal medicine residents and hospitalists received the same education. The study population included physicians, nurses, and awake English-speaking patients who were cognitively intact and admitted to these two units. The University of Chicago Institutional Review Board approved this study (12-1766; 16685B).
Development of SIESTA
To develop SIESTA, patients were surveyed, and focus groups of staff were conducted; overnight vitals, medications, and phlebotomy were identified as major barriers to patient sleep.9 We found that physicians did not know how to change the default vital signs order “every 4 hours” or how to batch-order morning phlebotomy at a time other than 4:00
Behavioral Nudges
The SIESTA team worked with clinical informaticists to change the default orders in EpicTM (Epic Systems Corporation, 2017, Verona, Wisconsin) in September 2015 so that physicians would be asked, “Continue vital signs throughout the night?”10 Previously, this question was marked “Yes” by default and hidden. While the default protocol for heparin q8h was maintained, heparin q12h (9:00
SIESTA Physician Education
We created a 20-minute presentation on the consequences and causes of in-hospital sleep deprivation and evidence-based behavioral modification. We distributed pocket cards describing the mnemonic SIESTA (Screen patients for sleep disorders, Instruct patients on sleep hygiene, Eliminate disruptions, Shut doors, Treat pain, and Alarm and noise control). Physicians were instructed to consider forgoing overnight vitals, using clinical judgment to identify stable patients, use a sleep-promoting VTE prophylaxis option, and order daily labs at 10:00
SIESTA-Enhanced Unit
In the SIESTA-enhanced unit, nurses received education using pocket cards and were coached to collaborate with physicians to implement sleep-friendly orders. Customized signage depicting empowered nurses advocating for patients was posted near the huddle board. Because these nurses suggested adding SIESTA to the nurses’ ongoing daily huddles at 4:00
Data Collection
Objectively Measured Sleep Disruptors
Adoption of SIESTA orders from March 2015 to March 2016 was assessed with a monthly EpicTM Clarity report. From August 1, 2015 to April 1, 2016, nocturnal room entries were recorded using the GOJO SMARTLINKTM Hand Hygiene system (GOJO Industries Inc., 2017, Akron, Ohio). This system includes two components: the hand-sanitizer dispensers, which track dispenses (numerator), and door-mounted Activity Counters, which use heat sensors that react to body heat emitted by a person passing through the doorway (denominator for hand-hygiene compliance). For our analysis, we only used Activity Counter data, which count room entries and exits, regardless of whether sanitizer was dispensed.
Patient-Reported Nighttime Sleep Disruptions
From June 2015 to March 2016, research assistants administered a 10-item Potential Hospital Sleep Disruptions and Noises Questionnaire (PHSDNQ) to patients in both units. Responses to this questionnaire correlate with actigraphy-based sleep measurements.9,12,13 Surveys were administered every other weekday to patients available to participate (eg, willing to participate, on the unit, awake). Survey data were stored on the REDCap Database (Version 6.14.0; Vanderbilt University, 2016, Nashville, Tennessee). Pre- and post-intervention Hospital Consumer Assessment of Healthcare Providers and Systems (HCAHPS) “top-box ratings” for percent quiet at night and percent pain well controlled were also compared.
Data Analysis
Objectively Measured Potential Sleep Disruptors
The proportion of sleep-friendly orders was analyzed using a two-sample test for proportions pre-post for the SIESTA-enhanced and standard units. The difference in use of SIESTA orders between units was analyzed via multivariable logistic regression, testing for independent associations between post-period, SIESTA-enhanced unit, and an interaction term (post-period × SIESTA unit) on use of sleep-friendly orders.
Room entries per night (11:00
Patient-Reported Nighttime Sleep Disruptions
Per prior studies, we defined a score 2 or higher as “sleep disruption.”9 Differences between units were evaluated via multivariable logistic regression to examine the association between the interaction of post-period × SIESTA-enhanced unit and odds of not reporting a sleep disruption. Significance was denoted as P = .05.
RESULTS
Between March 2015 and March 2016, 1,083 general-medicine patients were admitted to the SIESTA-enhanced and standard units (Table).
Nocturnal Orders
From March 2015 to March 2016, 1,669 EpicTM general medicine orders were reviewed (Figure). In the SIESTA-enhanced unit, the mean percentage of sleep-friendly orders rose for both vital signs (+31% [95% CI = 25%, 36%]; P < .001, npre = 306, npost = 306] and VTE prophylaxis (+28% [95% CI = 18%, 37%]; P < .001, npre = 158, npost = 173]. Similar changes were observed in the standard unit for sleep-friendly vital signs (+20% [95% CI = 14%, 25%]; P < .001, npre = 252, npost = 219) and VTE prophylaxis (+16% [95% CI = 6%, 25%]; P = .002, npre = 130, npost = 125). Differences between the two units were not statistically significant, and no significant change in timing of laboratory orders postintervention was found.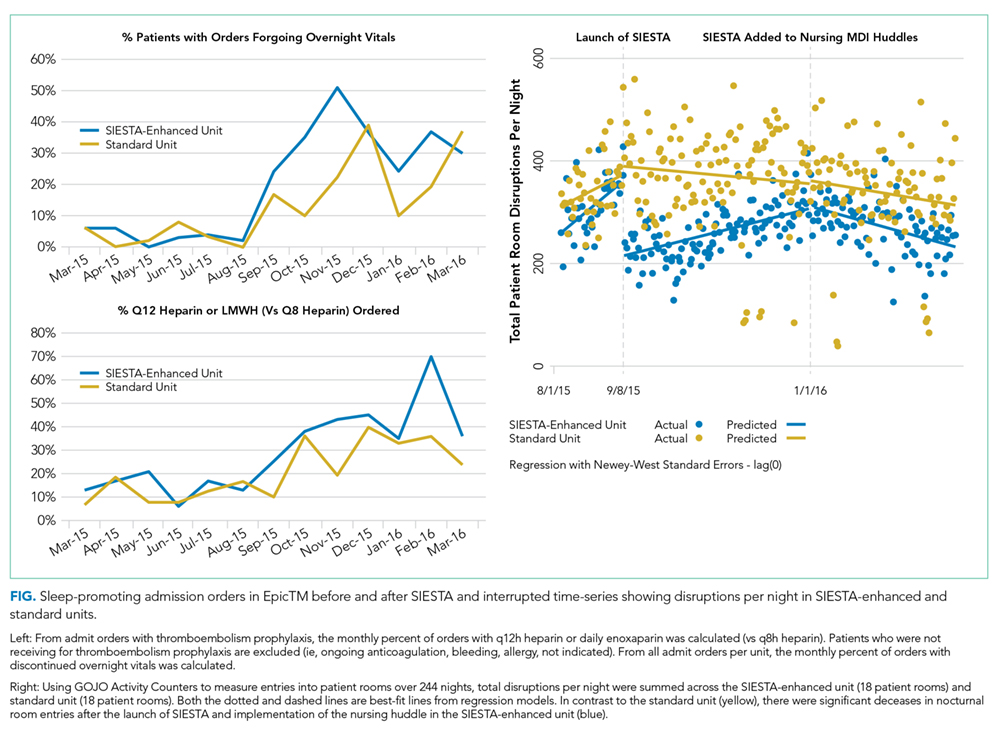
Nighttime Room Entries
Immediately after SIESTA launch, an average decrease of 114 total entries/night were noted in the SIESTA-enhanced unit, ([95% CI = −138, −91]; P < .001), corresponding to a 44% reduction (−6.3 entries/room) from the mean of 14.3 entries per patient room at baseline (Figure). No statistically significant change was seen in the standard unit. After SIESTA was incorporated into nursing huddles, total disruptions/night decreased by 1.31 disruptions/night ([95% CI = −1.64, −0.98]; P < .001) in the SIESTA-enhanced unit; by comparison, no significant changes were observed in the standard unit.
Patient-Reported Nighttime Sleep Disruptions
Between June 2015 and March 2016, 201 patient surveys were collected. A significant interaction was observed between the SIESTA-enhanced unit and post-period, and patients in the SIESTA-enhanced unit were more likely to report not being disrupted by medications (OR 4.08 [95% CI = 1.13–14.07]; P = .031) and vital signs (OR 3.35 [95% CI = 1.00–11.2]; P = .05) than those in the standard unit. HCAHPS top-box scores for the SIESTA unit increased by 7% for the “Quiet at night” category and 9% for the “Pain well controlled” category; by comparison, no major changes (>5%) were observed in the standard unit.
DISCUSSION
The present SIESTA intervention demonstrated that physician education coupled with EHR default changes are associated with a significant reduction in orders for overnight vital signs and medication administration in both units. However, addition of nursing education and empowerment in the SIESTA-enhanced unit was associated with fewer nocturnal room entries and improvements in patient-reported outcomes compared with those in the standard unit.
This study presents several implications for hospital initiatives aiming to improve patient sleep.14 Our study is consistent with other research highlighting the hypothesis that altering the default settings of EHR systems can influence physician behavior in a sustainable manner.15 However, our study also finds that, even when sleep-friendly orders are present, creating a sleep-friendly environment likely depends on the unit-based nurses championing the cause. While the initial decrease in nocturnal room entries post-SIESTA eventually faded, sustainable changes were observed only after SIESTA was added to nursing huddles, which illustrates the importance of using multiple methods to nudge staff.
Our study includes a number of limitations. It is not a randomized controlled trial, we cannot assume causality, and contamination was assumed, as residents and hospitalists worked in both units. Our single-site study may not be generalizable. Low HCAHPS response rates (10%-20%) also prevent demonstration of statistically significant differences. Finally, our convenience sampling strategy means not all inpatients were surveyed, and objective sleep duration was not measured.
In summary, at the University of Chicago, SIESTA could be associated with adoption of sleep-friendly vitals and medication orders, a decrease in nighttime room entries, and improved patient experience.
Disclosures
The authors have nothing to disclose.
Funding
This study was funded by the National Institute on Aging (NIA Grant No. T35AG029795) and the National Heart, Lung, and Blood Institute (NHLBI Grant Nos. R25HL116372 and K24HL136859).
1. Delaney LJ, Van Haren F, Lopez V. Sleeping on a problem: the impact of sleep disturbance on intensive care patients - a clinical review [published online ahead of print February 26, 2016]. Ann Intensive Care. 2015;5(3). doi: 10.1186/s13613-015-0043-2. PubMed
2. Arora VM, Chang KL, Fazal AZ, et al. Objective sleep duration and quality in hospitalized older adults: associations with blood pressure and mood. J Am Geriatr Soc. 2011;59(11):2185-2186. doi: 10.1111/j.1532-5415.2011.03644.x. PubMed
3. Knutson KL, Spiegel K, Penev P, Van Cauter E. The metabolic consequences of sleep deprivation. Sleep Med Rev. 2007;11(3):163-178. doi: 10.1016/j.smrv.2007.01.002. PubMed
4. Manian FA, Manian CJ. Sleep quality in adult hospitalized patients with infection: an observational study. Am J Med Sci. 2015;349(1):56-60. doi: 10.1097/MAJ.0000000000000355. PubMed
5. American Academy of Nursing announced engagement in National Choosing Wisely Campaign. Nurs Outlook. 2015;63(1):96-98. doi: 10.1016/j.outlook.2014.12.017. PubMed
6. Gathecha E, Rios R, Buenaver LF, Landis R, Howell E, Wright S. Pilot study aiming to support sleep quality and duration during hospitalizations. J Hosp Med. 2016;11(7):467-472. doi: 10.1002/jhm.2578. PubMed
7. Fillary J, Chaplin H, Jones G, Thompson A, Holme A, Wilson P. Noise at night in hospital general wards: a mapping of the literature. Br J Nurs. 2015;24(10):536-540. doi: 10.12968/bjon.2015.24.10.536. PubMed
8. Thaler R, Sunstein C. Nudge: Improving Decisions About Health, Wealth and Happiness. Yale University Press; 2008.
9. Grossman MN, Anderson SL, Worku A, et al. Awakenings? Patient and hospital staff perceptions of nighttime disruptions and their effect on patient sleep. J Clin Sleep Med. 2017;13(2):301-306. doi: 10.5664/jcsm.6468. PubMed
10. Yoder JC, Yuen TC, Churpek MM, Arora VM, Edelson DP. A prospective study of nighttime vital sign monitoring frequency and risk of clinical deterioration. JAMA Intern Med. 2013;173(16):1554-1555. doi: 10.1001/jamainternmed.2013.7791. PubMed
11. Phung OJ, Kahn SR, Cook DJ, Murad MH. Dosing frequency of unfractionated heparin thromboprophylaxis: a meta-analysis. Chest. 2011;140(2):374-381. doi: 10.1378/chest.10-3084. PubMed
12. Gabor JY, Cooper AB, Hanly PJ. Sleep disruption in the intensive care unit. Curr Opin Crit Care. 2001;7(1):21-27. PubMed
13. Topf M. Personal and environmental predictors of patient disturbance due to hospital noise. J Appl Psychol. 1985;70(1):22-28. doi: 10.1037/0021-9010.70.1.22. PubMed
14. Cho HJ, Wray CM, Maione S, et al. Right care in hospital medicine: co-creation of ten opportunities in overuse and underuse for improving value in hospital medicine. J Gen Intern Med. 2018;33(6):804-806. doi: 10.1007/s11606-018-4371-4. PubMed
15. Halpern SD, Ubel PA, Asch DA. Harnessing the power of default options to improve health care. N Engl J Med. 2007;357(13):1340-1344. doi: 10.1056/NEJMsb071595. PubMed
Although sleep is critical to patient recovery in the hospital, hospitalization is not restful,1,2 and inpatient sleep deprivation has been linked to poor health outcomes.1-4 The American Academy of Nursing’s Choosing Wisely® campaign recommends nurses reduce unnecessary nocturnal care.5 However, interventions to improve inpatient sleep are not widely implemented.6 Targeting routine disruptions, such as overnight vital signs, by changing default settings in the electronic health record (EHR)with “nudges” could be a cost-effective strategy to improve inpatient sleep.4,7
We created Sleep for Inpatients: Empowering Staff to Act (SIESTA), which pairs nudges in the EHR with interprofessional education and empowerment,8 and tested its effectiveness on objectively and subjectively measured nocturnal sleep disruptors.
METHODS
Study Design
Two 18-room University of Chicago Medicine general-medicine units were used in this prospective study. The SIESTA-enhanced unit underwent the full sleep intervention: nursing education and empowerment, physician education, and EHR changes. The standard unit did not receive nursing interventions but received all other forms of intervention. Because physicians simultaneously cared for patients on both units, all internal medicine residents and hospitalists received the same education. The study population included physicians, nurses, and awake English-speaking patients who were cognitively intact and admitted to these two units. The University of Chicago Institutional Review Board approved this study (12-1766; 16685B).
Development of SIESTA
To develop SIESTA, patients were surveyed, and focus groups of staff were conducted; overnight vitals, medications, and phlebotomy were identified as major barriers to patient sleep.9 We found that physicians did not know how to change the default vital signs order “every 4 hours” or how to batch-order morning phlebotomy at a time other than 4:00
Behavioral Nudges
The SIESTA team worked with clinical informaticists to change the default orders in EpicTM (Epic Systems Corporation, 2017, Verona, Wisconsin) in September 2015 so that physicians would be asked, “Continue vital signs throughout the night?”10 Previously, this question was marked “Yes” by default and hidden. While the default protocol for heparin q8h was maintained, heparin q12h (9:00
SIESTA Physician Education
We created a 20-minute presentation on the consequences and causes of in-hospital sleep deprivation and evidence-based behavioral modification. We distributed pocket cards describing the mnemonic SIESTA (Screen patients for sleep disorders, Instruct patients on sleep hygiene, Eliminate disruptions, Shut doors, Treat pain, and Alarm and noise control). Physicians were instructed to consider forgoing overnight vitals, using clinical judgment to identify stable patients, use a sleep-promoting VTE prophylaxis option, and order daily labs at 10:00
SIESTA-Enhanced Unit
In the SIESTA-enhanced unit, nurses received education using pocket cards and were coached to collaborate with physicians to implement sleep-friendly orders. Customized signage depicting empowered nurses advocating for patients was posted near the huddle board. Because these nurses suggested adding SIESTA to the nurses’ ongoing daily huddles at 4:00
Data Collection
Objectively Measured Sleep Disruptors
Adoption of SIESTA orders from March 2015 to March 2016 was assessed with a monthly EpicTM Clarity report. From August 1, 2015 to April 1, 2016, nocturnal room entries were recorded using the GOJO SMARTLINKTM Hand Hygiene system (GOJO Industries Inc., 2017, Akron, Ohio). This system includes two components: the hand-sanitizer dispensers, which track dispenses (numerator), and door-mounted Activity Counters, which use heat sensors that react to body heat emitted by a person passing through the doorway (denominator for hand-hygiene compliance). For our analysis, we only used Activity Counter data, which count room entries and exits, regardless of whether sanitizer was dispensed.
Patient-Reported Nighttime Sleep Disruptions
From June 2015 to March 2016, research assistants administered a 10-item Potential Hospital Sleep Disruptions and Noises Questionnaire (PHSDNQ) to patients in both units. Responses to this questionnaire correlate with actigraphy-based sleep measurements.9,12,13 Surveys were administered every other weekday to patients available to participate (eg, willing to participate, on the unit, awake). Survey data were stored on the REDCap Database (Version 6.14.0; Vanderbilt University, 2016, Nashville, Tennessee). Pre- and post-intervention Hospital Consumer Assessment of Healthcare Providers and Systems (HCAHPS) “top-box ratings” for percent quiet at night and percent pain well controlled were also compared.
Data Analysis
Objectively Measured Potential Sleep Disruptors
The proportion of sleep-friendly orders was analyzed using a two-sample test for proportions pre-post for the SIESTA-enhanced and standard units. The difference in use of SIESTA orders between units was analyzed via multivariable logistic regression, testing for independent associations between post-period, SIESTA-enhanced unit, and an interaction term (post-period × SIESTA unit) on use of sleep-friendly orders.
Room entries per night (11:00
Patient-Reported Nighttime Sleep Disruptions
Per prior studies, we defined a score 2 or higher as “sleep disruption.”9 Differences between units were evaluated via multivariable logistic regression to examine the association between the interaction of post-period × SIESTA-enhanced unit and odds of not reporting a sleep disruption. Significance was denoted as P = .05.
RESULTS
Between March 2015 and March 2016, 1,083 general-medicine patients were admitted to the SIESTA-enhanced and standard units (Table).
Nocturnal Orders
From March 2015 to March 2016, 1,669 EpicTM general medicine orders were reviewed (Figure). In the SIESTA-enhanced unit, the mean percentage of sleep-friendly orders rose for both vital signs (+31% [95% CI = 25%, 36%]; P < .001, npre = 306, npost = 306] and VTE prophylaxis (+28% [95% CI = 18%, 37%]; P < .001, npre = 158, npost = 173]. Similar changes were observed in the standard unit for sleep-friendly vital signs (+20% [95% CI = 14%, 25%]; P < .001, npre = 252, npost = 219) and VTE prophylaxis (+16% [95% CI = 6%, 25%]; P = .002, npre = 130, npost = 125). Differences between the two units were not statistically significant, and no significant change in timing of laboratory orders postintervention was found.
Nighttime Room Entries
Immediately after SIESTA launch, an average decrease of 114 total entries/night were noted in the SIESTA-enhanced unit, ([95% CI = −138, −91]; P < .001), corresponding to a 44% reduction (−6.3 entries/room) from the mean of 14.3 entries per patient room at baseline (Figure). No statistically significant change was seen in the standard unit. After SIESTA was incorporated into nursing huddles, total disruptions/night decreased by 1.31 disruptions/night ([95% CI = −1.64, −0.98]; P < .001) in the SIESTA-enhanced unit; by comparison, no significant changes were observed in the standard unit.
Patient-Reported Nighttime Sleep Disruptions
Between June 2015 and March 2016, 201 patient surveys were collected. A significant interaction was observed between the SIESTA-enhanced unit and post-period, and patients in the SIESTA-enhanced unit were more likely to report not being disrupted by medications (OR 4.08 [95% CI = 1.13–14.07]; P = .031) and vital signs (OR 3.35 [95% CI = 1.00–11.2]; P = .05) than those in the standard unit. HCAHPS top-box scores for the SIESTA unit increased by 7% for the “Quiet at night” category and 9% for the “Pain well controlled” category; by comparison, no major changes (>5%) were observed in the standard unit.
DISCUSSION
The present SIESTA intervention demonstrated that physician education coupled with EHR default changes are associated with a significant reduction in orders for overnight vital signs and medication administration in both units. However, addition of nursing education and empowerment in the SIESTA-enhanced unit was associated with fewer nocturnal room entries and improvements in patient-reported outcomes compared with those in the standard unit.
This study presents several implications for hospital initiatives aiming to improve patient sleep.14 Our study is consistent with other research highlighting the hypothesis that altering the default settings of EHR systems can influence physician behavior in a sustainable manner.15 However, our study also finds that, even when sleep-friendly orders are present, creating a sleep-friendly environment likely depends on the unit-based nurses championing the cause. While the initial decrease in nocturnal room entries post-SIESTA eventually faded, sustainable changes were observed only after SIESTA was added to nursing huddles, which illustrates the importance of using multiple methods to nudge staff.
Our study includes a number of limitations. It is not a randomized controlled trial, we cannot assume causality, and contamination was assumed, as residents and hospitalists worked in both units. Our single-site study may not be generalizable. Low HCAHPS response rates (10%-20%) also prevent demonstration of statistically significant differences. Finally, our convenience sampling strategy means not all inpatients were surveyed, and objective sleep duration was not measured.
In summary, at the University of Chicago, SIESTA could be associated with adoption of sleep-friendly vitals and medication orders, a decrease in nighttime room entries, and improved patient experience.
Disclosures
The authors have nothing to disclose.
Funding
This study was funded by the National Institute on Aging (NIA Grant No. T35AG029795) and the National Heart, Lung, and Blood Institute (NHLBI Grant Nos. R25HL116372 and K24HL136859).
1. Delaney LJ, Van Haren F, Lopez V. Sleeping on a problem: the impact of sleep disturbance on intensive care patients - a clinical review [published online ahead of print February 26, 2016]. Ann Intensive Care. 2015;5(3). doi: 10.1186/s13613-015-0043-2. PubMed
2. Arora VM, Chang KL, Fazal AZ, et al. Objective sleep duration and quality in hospitalized older adults: associations with blood pressure and mood. J Am Geriatr Soc. 2011;59(11):2185-2186. doi: 10.1111/j.1532-5415.2011.03644.x. PubMed
3. Knutson KL, Spiegel K, Penev P, Van Cauter E. The metabolic consequences of sleep deprivation. Sleep Med Rev. 2007;11(3):163-178. doi: 10.1016/j.smrv.2007.01.002. PubMed
4. Manian FA, Manian CJ. Sleep quality in adult hospitalized patients with infection: an observational study. Am J Med Sci. 2015;349(1):56-60. doi: 10.1097/MAJ.0000000000000355. PubMed
5. American Academy of Nursing announced engagement in National Choosing Wisely Campaign. Nurs Outlook. 2015;63(1):96-98. doi: 10.1016/j.outlook.2014.12.017. PubMed
6. Gathecha E, Rios R, Buenaver LF, Landis R, Howell E, Wright S. Pilot study aiming to support sleep quality and duration during hospitalizations. J Hosp Med. 2016;11(7):467-472. doi: 10.1002/jhm.2578. PubMed
7. Fillary J, Chaplin H, Jones G, Thompson A, Holme A, Wilson P. Noise at night in hospital general wards: a mapping of the literature. Br J Nurs. 2015;24(10):536-540. doi: 10.12968/bjon.2015.24.10.536. PubMed
8. Thaler R, Sunstein C. Nudge: Improving Decisions About Health, Wealth and Happiness. Yale University Press; 2008.
9. Grossman MN, Anderson SL, Worku A, et al. Awakenings? Patient and hospital staff perceptions of nighttime disruptions and their effect on patient sleep. J Clin Sleep Med. 2017;13(2):301-306. doi: 10.5664/jcsm.6468. PubMed
10. Yoder JC, Yuen TC, Churpek MM, Arora VM, Edelson DP. A prospective study of nighttime vital sign monitoring frequency and risk of clinical deterioration. JAMA Intern Med. 2013;173(16):1554-1555. doi: 10.1001/jamainternmed.2013.7791. PubMed
11. Phung OJ, Kahn SR, Cook DJ, Murad MH. Dosing frequency of unfractionated heparin thromboprophylaxis: a meta-analysis. Chest. 2011;140(2):374-381. doi: 10.1378/chest.10-3084. PubMed
12. Gabor JY, Cooper AB, Hanly PJ. Sleep disruption in the intensive care unit. Curr Opin Crit Care. 2001;7(1):21-27. PubMed
13. Topf M. Personal and environmental predictors of patient disturbance due to hospital noise. J Appl Psychol. 1985;70(1):22-28. doi: 10.1037/0021-9010.70.1.22. PubMed
14. Cho HJ, Wray CM, Maione S, et al. Right care in hospital medicine: co-creation of ten opportunities in overuse and underuse for improving value in hospital medicine. J Gen Intern Med. 2018;33(6):804-806. doi: 10.1007/s11606-018-4371-4. PubMed
15. Halpern SD, Ubel PA, Asch DA. Harnessing the power of default options to improve health care. N Engl J Med. 2007;357(13):1340-1344. doi: 10.1056/NEJMsb071595. PubMed
© 2019 Society of Hospital Medicine
Association between opioid and benzodiazepine use and clinical deterioration in ward patients
Chronic opioid and benzodiazepine use is common and increasing.1-5 Outpatient use of these medications has been associated with hospital readmission and death,6-12 with concurrent use associated with particularly increased risk.13,14 Less is known about outcomes for hospitalized patients receiving these medications.
More than half of hospital inpatients in the United States receive opioids,15 many of which are new prescriptions rather than continuation of chronic therapy.16,17 Less is known about inpatient benzodiazepine administration, but the prevalence may exceed 10% among elderly populations.18 Hospitalized patients often have comorbidities or physiological disturbances that might increase their risk related to use of these medications. Opioids can cause central and obstructive sleep apneas,19-21 and benzodiazepines contribute to respiratory depression and airway relaxation.22 Benzodiazepines also impair psychomotor function and recall,23 which could mediate the recognized risk for delirium and falls in the hospital.24,25 These findings suggest pathways by which these medications might contribute to clinical deterioration.
Most studies in hospitalized patients have been limited to specific populations15,26-28 and have not explicitly controlled for severity of illness over time. It remains unclear whether associations identified within particular groups of patients hold true for the broader population of general ward inpatients. Therefore, we aimed to determine the independent association between opioid and benzodiazepine administration and clinical deterioration in ward patients.
MATERIALS AND METHODS
Setting and Study Population
We performed an observational cohort study at a 500-bed urban academic hospital. Data were obtained from all adults hospitalized on the wards between November 1, 2008, and January 21, 2016. The study protocol was approved by the University of Chicago Institutional Review Board (IRB#15-0195).
Data Collection
The study utilized de-identified data from the electronic health record (EHR; Epic Systems Corporation, Verona, Wisconsin) and administrative databases collected by the University of Chicago Clinical Research Data Warehouse. Patient age, sex, race, body mass index (BMI), and ward admission source (ie, emergency department (ED), transferred from the intensive care unit (ICU), or directly admitted to the wards) were collected. International Classification of Diseases, 9th Revision, Clinical Modification (ICD-9-CM) codes were used to identify Elixhauser Comorbidity Index categories.29,30 Because patients with similar diagnoses (eg, active cancer) are cohorted within particular areas in our hospital, we obtained the ward unit for all patients. Patients who underwent surgery were identified using the hospital’s admission-transfer-discharge database.
To determine severity of illness, routinely collected vital signs and laboratory values were utilized to calculate the electronic cardiac arrest risk triage (eCART) score, an accurate risk score we previously developed and validated for predicting adverse events among ward patients.31 If any vital sign or laboratory value was missing, the next available measurement was carried forward. If any value remained missing after this change, the median value for that location (ie, wards, ICU, or ED) was imputed.32,33 Additionally, patient-reported pain scores at the time of opioid administration were extracted from nursing flowsheets. If no pain score was present at the time of opioid administration, the patient’s previous score was carried forward.
We excluded patients with sickle-cell disease or seizure history and admissions with diagnoses of alcohol withdrawal from the analysis, because these diagnoses were expected to be associated with different medication administration practices compared to other inpatients. We also excluded patients with a tracheostomy because we expected their respiratory monitoring to differ from the other patients in our cohort. Finally, because ward deaths resulting from a comfort care scenario often involve opioids and/or benzodiazepines, ward segments involving comfort care deaths (defined as death without attempted resuscitation) were excluded from the analysis (Supplemental Figure 1). Patients with sickle-cell disease were identified using ICD-9 codes, and encounters during which a seizure may have occurred were identified using a combination of ICD-9 codes and receipt of anti-epileptic medication (Supplemental Table 1). Patients at risk for alcohol withdrawal were identified by the presence of any Clinical Institute Withdrawal Assessment for Alcohol score within nursing flowsheets, and patients with tracheostomies were identified using documentation of ventilator support within their first 12 hours on the wards. In addition to these exclusion criteria, patients with obstructive sleep apnea (OSA) were identified by the following ICD-9 codes: 278.03, 327.23, 780.51, 780.53, and 780.57.
Medications
Ward administrations of opioids and benzodiazepines—dose, route, and administration time—were collected from the EHR. We excluded all administrations in nonward locations such as the ED, ICU, operating room, or procedure suite. Additionally, because patients emergently intubated may receive sedative and analgesic medications to facilitate intubation, and because patients experiencing cardiac arrest are frequently intubated periresuscitation, we a priori excluded all administrations within 15 minutes of a ward cardiac arrest or an intubation.
For consistent comparisons, opioid doses were converted to oral morphine equivalents34 and adjusted by a factor of 15 to reflect the smallest routinely available oral morphine tablet in our hospital (Supplemental Table 2). Benzodiazepine doses were converted to oral lorazepam equivalents (Supplemental Table 2).34 Thus, the independent variables were oral morphine or lorazepam equivalents administered within each 6-hour window. We a priori presumed opioid doses greater than the 99th percentile (1200 mg) or benzodiazepine doses greater than 10 mg oral lorazepam equivalents within a 6-hour window to be erroneous entries, and replaced these outlier values with the median value for each medication category.
Outcomes
The primary outcome was the composite of ICU transfer or cardiac arrest (loss of pulse with attempted resuscitation) on the wards, with individual outcomes investigated secondarily. An ICU transfer (patient movement from a ward directly to the ICU) was identified using the hospital’s admission-transfer-discharge database. Cardiac arrests were identified using a prospectively validated quality improvement database.35
Because deaths on the wards resulted either from cardiac arrest or from a comfort care scenario, mortality was not studied as an outcome.
Statistical Analysis
Patient characteristics were compared using Student t tests, Wilcoxon rank sum tests, and chi-squared statistics, as appropriate. Unadjusted and adjusted models were created using discrete-time survival analysis,36-39 which involved dividing time into discrete 6-hour intervals and employing the predictor variables chronologically closest to the beginning of each time window to forecast whether the outcome occurred within each interval. Predictor variables in the adjusted model included patient characteristics (age, sex, BMI, and Elixhauser Agency for Healthcare Research and Quality-Web comorbidities30 [a priori excluding comorbidities recorded for fewer than 1000 admissions from the model]), ward unit, surgical status, prior ICU admission during the hospitalization, cumulative opioid or benzodiazepine dose during the previous 24 hours, and severity of illness (measured by eCART score). The adjusted model for opioids also included the patient’s pain score. Age, eCART score, and pain score were entered linearly while race, BMI (underweight, less than 18.5 kg/m2; normal, 18.5-24.9 kg/m2; overweight, 25.0-29.9 kg/m2; obese, 30-39.9 kg/m2; and severely obese, 40 mg/m2 or greater), and ward unit were modeled as categorical variables.
Since repeat hospitalization could confound the results of our study, we performed a sensitivity analysis including only 1 randomly selected hospital admission per patient. We also performed a sensitivity analysis including receipt of both opioids and benzodiazepines, and an interaction term within each ward segment, as well as an analysis in which zolpidem—the most commonly administered nonbenzodiazepine hypnotic medication in our hospital—was included along with both opioids and benzodiazepines. Finally, we performed a sensitivity analysis replacing missing pain scores with imputed values ranging from 0 to the median ward pain score.
We also performed subgroup analyses of adjusted models across age quartiles and for each BMI category, as well as for surgical status, OSA status, gender, time of medication administration, and route of administration (intravenous vs. oral). We also performed an analysis across pain score severity40 to determine whether these medications produce differential effects at various levels of pain.
All tests of significance used a 2-sided P value less than 0.05. Statistical analyses were completed using Stata version 14.1 (StataCorp, LLC, College Station, Texas).

RESULTS
Patient Characteristics
A total of 144,895 admissions, from 75,369 patients, had ward vital signs or laboratory values documented during the study period. Ward segments from 634 admissions were excluded due to comfort care status, which resulted in exclusion of 479 complete patient admissions. Additionally, 139 patients with tracheostomies were excluded. Furthermore, 2934 patient admissions with a sickle-cell diagnosis were excluded, of which 95% (n = 2791) received an opioid and 11% (n = 310) received a benzodiazepine. Another 14,029 admissions associated with seizures, 6134 admissions involving alcohol withdrawal, and 1332 with both were excluded, of which 66% (n = 14,174) received an opioid and 35% (n = 7504) received a benzodiazepine. After exclusions, 120,518 admissions were included in the final analysis, with 67% (n = 80,463) associated with at least 1 administration of an opioid and 21% (n = 25,279) associated with at least 1 benzodiazepine administration.
In total, there were 672,851 intervals when an opioid was administered during the study, with a median dose of 12 mg oral morphine equivalents (interquartile range, 8-30). Of these, 21,634 doses were replaced due to outlier status outside the 99th percentile. Patients receiving opioids were younger (median age 56 vs 61 years), less likely to be African American (48% vs 59%), more likely to have undergone surgery (18% vs 6%), and less likely to have most noncancer medical comorbidities than those who never received an opioid (all P < 0.001) (Table 1).
Additionally, there were a total of 98,286 6-hour intervals in which a benzodiazepine was administered in the study, with a median dose of 1 mg oral lorazepam (interquartile range, 0.5-1). A total of 790 doses of benzodiazepines (less than 1%) were replaced due to outlier status. Patients who received benzodiazepines were more likely to be male (49% vs. 41%), less likely to be African-American, less likely to be obese or morbidly obese (33% vs. 39%), and more likely to have medical comorbidities compared to patients who never received a benzodiazepine (all P < 0.001) (Table 1).
The eCART scores were similar between all patient groups. The frequency of missing variables differed by data type, with vital signs rarely missing (all less than 1.1% except AVPU [10%]), followed by hematology labs (8%-9%), electrolytes and renal function results (12%-15%), and hepatic function tests (40%-45%). In addition to imputed data for missing vital signs and laboratory values, our model omitted human immunodeficiency virus/acquired immune deficiency syndrome and peptic ulcer disease from the adjusted models on the basis of fewer than 1000 admissions with these diagnoses listed.

Patient Outcomes
The incidence of the composite outcome was higher in admissions with at least 1 opioid medication than those without an opioid (7% vs. 4%, P < 0.001), and in admissions with at least 1 dose of benzodiazepines compared to those without a benzodiazepine (11% vs. 4%, P < 0.001) (Table 2).
Within 6-hour segments, increasing doses of opioids were associated with an initial decrease in the frequency of the composite outcome followed by a dose-related increase in the frequency of the composite outcome with morphine equivalents greater than 45 mg. By contrast, the frequency of the composite outcome increased with additional benzodiazepine equivalents (Figure).
In the adjusted model, opioid administration was associated with increased risk for the composite outcome (Table 3) in a dose-dependent fashion, with each 15 mg oral morphine equivalent associated with a 1.9% increase in the odds of ICU transfer or cardiac arrest within the subsequent 6-hour time interval (odds ratio [OR], 1.019; 95% confidence interval [CI], 1.013-1.026; P < 0.001).

Similarly, benzodiazepine administration was also associated with increased adjusted risk for the composite outcome within 6 hours in a dose-dependent manner. Each 1 mg oral lorazepam equivalent was associated with a 29% increase in the odds of ward cardiac arrest or ICU transfer (OR, 1.29; 95% CI, 1.16-1.44; P < 0.001) (Table 3).
Sensitivity Analyses
A sensitivity analysis including 1 randomly selected hospitalization per patient involved 67,097 admissions and found results similar to the primary analysis, with each 15 mg oral morphine equivalent associated with a 1.9% increase in the odds of the composite outcome (OR, 1.019; 95% CI, 1.011-1.028; P < 0.001) and each 1 mg oral lorazepam equivalent associated with a 41% increase in the odds of the composite outcome (OR, 1.41; 95% CI, 1.21-1.65; P < 0.001). Inclusion of both opioids and benzodiazepines in the adjusted model again yielded results similar to the main analysis for both opioids (OR, 1.020; 95% CI, 1.013-1.026; P < 0.001) and benzodiazepines (OR, 1.35; 95% CI, 1.18-1.54; P < 0.001), without a significant interaction detected (P = 0.09). These results were unchanged with the addition of zolpidem to the model as an additional potential confounder, and zolpidem did not increase the risk of the study outcomes (P = 0.2).
A final sensitivity analysis for the opioid model involved replacing missing pain scores with imputed values ranging from 0 to the median ward score, which was 5. The results of these analyses did not differ from the primary model and were consistent regardless of imputation value (OR, 1.018; 95% CI, 1.012-1.023; P < 0.001).
Subgroup Analyses
Analyses of opioid administration by subgroup (sex, age quartiles, BMI categories, OSA diagnosis, surgical status, daytime/nighttime medication administration, IV/PO administration, and pain severity) yielded similar results to the overall analysis (Supplemental Figure 2). Subgroup analysis of patients receiving benzodiazepines revealed similarly increased adjusted odds of the composite outcome across strata of gender, BMI, surgical status, and medication administration time (Supplemental Figure 3). Notably, patients older than 70 years who received a benzodiazepine were at 64% increased odds of the composite outcome (OR, 1.64; 95% CI, 1.30-2.08), compared to 2% to 38% increased risk for patients under 70 years. Finally, IV doses of benzodiazepines were associated with 48% increased odds for deterioration (OR, 1.48; 95% CI, 1.18-1.84; P = 0.001), compared to a nonsignificant 14% increase in the odds for PO doses (OR, 1.14; 95% CI, 0.99-1.31; P = 0.066).
DISCUSSION
In a large, single-center, observational study of ward inpatients, we found that opioid use was associated with a small but significant increased risk for clinical deterioration on the wards, with every 15 mg oral morphine equivalent increasing the odds of ICU transfer or cardiac arrest in the next 6 hours by 1.9%. Benzodiazepines were associated with a much higher risk: each equivalent of 1 mg of oral lorazepam increased the odds of ICU transfer or cardiac arrest by almost 30%. These results have important implications for care at the bedside of hospitalized ward patients and suggest the need for closer monitoring after receipt of these medications, particularly benzodiazepines.
Previous work has described negative effects of opioid medications among select inpatient populations. In surgical patients, opioids have been associated with hospital readmission, increased length of stay, and hospital mortality.26,28 More recently, Herzig et al.15 found more adverse events in nonsurgical ward patients within the hospitals prescribing opioids the most frequently. These studies may have been limited by the populations studied and the inability to control for confounders such as severity of illness and pain score. Our study expands these findings to a more generalizable population and shows that even after adjustment for potential confounders, such as severity of illness, pain score, and medication dose, opioids are associated with increased short-term risk of clinical deterioration.
By contrast, few studies have characterized the risks associated with benzodiazepine use among ward inpatients. Recently, Overdyk et al.27 found that inpatient use of opioids and sedatives was associated with increased risk for cardiac arrest and hospital death. However, this study included ICU patients, which may confound the results, as ICU patients often receive high doses of opioids or benzodiazepines to facilitate mechanical ventilation or other invasive procedures, while also having a particularly high risk of adverse outcomes like cardiac arrest and inhospital death.
Several mechanisms may explain the magnitude of effect seen with regard to benzodiazepines. First, benzodiazepines may directly produce clinical deterioration by decreased respiratory drive, diminished airway tone, or hemodynamic decompensation. It is possible that the broad spectrum of cardiorespiratory side effects of benzodiazepines—and potential unpredictability of these effects—increases the difficulty of observation and management for patients receiving them. This difficulty may be compounded with intravenous administration of benzodiazepines, which was associated with a higher risk for deterioration than oral doses in our cohort. Alternatively, benzodiazepines may contribute to clinical decompensation by masking signs of deterioration such as encephalopathy or vital sign instability like tachycardia or tachypnea that may be mistaken as anxiety. Notably, while our hospital has a nursing-driven protocol for monitoring patients receiving opioids (in which pain is serially assessed, leading to additional bedside observation), we do not have protocols for ward patients receiving benzodiazepines. Finally, although we found that orders for opioids and benzodiazepines were more common in white patients than African American patients, this finding may be due to differences in the types or number of medical comorbidities experienced by these patients.
Our study has several strengths, including the large number of admissions we included. Additionally, we included a broad range of medical and surgical ward admissions, which should increase the generalizability of our results. Further, our rates of ICU transfer are in line with data reported from other groups,41,42 which again may add to the generalizability of our findings. We also addressed many potential confounders by including patient characteristics, individual ward units, and (for opioids) pain score in our model, and by controlling for severity of illness with the eCART score, an accurate predictor of ICU transfer and ward cardiac arrest within our population.32,37 Finally, our robust methodology allowed us to include acute and cumulative medication doses, as well as time, in the model. By performing a discrete-time survival analysis, we were able to evaluate receipt of opioids and benzodiazepines—as well as risk for clinical deterioration—longitudinally, lending strength to our results.
Limitations of our study include its single-center cohort, which may reduce generalizability to other populations. Additionally, because we could not validate the accuracy of—or adherence to—outpatient medication lists, we were unable to identify chronic opioid or benzodiazepine users by these lists. However, patients chronically taking opioids or benzodiazepines would likely receive doses each hospital day; by including 24-hour cumulative doses in our model, we attempted to adjust for some portion of their chronic use. Also, because evaluation of delirium was not objectively recorded in our dataset, we were unable to evaluate the relationship between receipt of these medications and development of delirium, which is an important outcome for hospitalized patients. Finally, neither the diagnoses for which these medications were prescribed, nor the reason for ICU transfer, were present in our dataset, which leaves open the possibility of unmeasured confounding.
CONCLUSION
After adjustment for important confounders including severity of illness, medication dose, and time, opioids were associated with a slight increase in clinical deterioration on the wards, while benzodiazepines were associated with a much larger risk for deterioration. This finding raises concern about the safety of benzodiazepine use among ward patients and suggests that increased monitoring of patients receiving these medications may be warranted.
Acknowledgment
The authors thank Nicole Twu for administrative support.
Disclosure
Drs. Churpek and Edelson have a patent pending (ARCD. P0535US.P2) for risk stratification algorithms for hospitalized patients. Dr. Churpek is supported by a career development award from the National Heart, Lung, and Blood Institute (K08 HL121080). Dr. Churpek has received honoraria from Chest for invited speaking engagements. In addition, Dr. Edelson has received research support from Philips Healthcare (Andover, Massachusetts), research support from the American Heart Association (Dallas, Texas) and Laerdal Medical (Stavanger, Norway), and research support from Early Sense (Tel Aviv, Israel). She has ownership interest in Quant HC (Chicago, Illinois), which is developing products for risk stratification of hospitalized patients. Dr. Mokhlesi is supported by National Institutes of Health grant R01HL119161. Dr. Mokhlesi has served as a consultant to Philips/Respironics and has received research support from Philips/Respironics. Preliminary versions of these data were presented as a poster presentation at the 2016 meeting of the American Thoracic Society, May 17, 2016; San Francisco, California.
1. Substance Abuse and Mental Health Services Administration. Results from the 2013 National Survey on Drug Use and Health: Summary of National Findings. Rockville, MD: Substance Abuse and Mental Health Services Administration; 2014.
2. Bachhuber MA, Hennessy S, Cunningham CO, Starrels JL. Increasing benzodiazepine prescriptions and overdose mortality in the United States, 1996–2013. Am J Public Health. 2016;106(4):686-688. PubMed
3. Parsells Kelly J, Cook SF, Kaufman DW, Anderson T, Rosenberg L, Mitchell AA. Prevalence and characteristics of opioid use in the US adult population. Pain. 2008;138(3):507-513. PubMed
4. Olfson M, King M, Schoenbaum M. Benzodiazepine use in the United States. JAMA Psychiatry. 2015;72(2):136-142. PubMed
5. Hwang CS, Kang EM, Kornegay CJ, Staffa JA, Jones CM, McAninch JK. Trends in the concomitant prescribing of opioids and benzodiazepines, 2002−2014. Am J Prev Med. 2016;51(2):151-160. PubMed
6. Bohnert AS, Valenstein M, Bair MJ, et al. Association between opioid prescribing patterns and opioid overdose-related deaths. JAMA. 2011;305(13):1315-1321. PubMed
7. Dart RC, Surratt HL, Cicero TJ, et al. Trends in opioid analgesic abuse and mortality in the United States. N Engl J Med. 2015;372(3):241-248. PubMed
8. Centers for Disease Control and Prevention (CDC). Vital signs: overdoses of prescription opioid pain relievers---United States, 1999--2008. MMWR Morb Mortal Wkly Rep. 2011;60(43):1487-1492. PubMed
9. Lan TY, Zeng YF, Tang GJ, et al. The use of hypnotics and mortality - a population-based retrospective cohort study. PLoS One. 2015;10(12):e0145271. PubMed
10. Mosher HJ, Jiang L, Vaughan Sarrazin MS, Cram P, Kaboli P, Vander Weg MW. Prevalence and characteristics of hospitalized adults on chronic opioid therapy: prior opioid use among veterans. J Hosp Med. 2014;9(2):82-87. PubMed
11. Palmaro A, Dupouy J, Lapeyre-Mestre M. Benzodiazepines and risk of death: results from two large cohort studies in France and UK. Eur Neuropsychopharmacol. 2015;25(10):1566-1577. PubMed
12. Parsaik AK, Mascarenhas SS, Khosh-Chashm D, et al. Mortality associated with anxiolytic and hypnotic drugs–a systematic review and meta-analysis. Aust N Z J Psychiatry. 2016;50(6):520-533. PubMed
13. Park TW, Saitz R, Ganoczy D, Ilgen MA, Bohnert AS. Benzodiazepine prescribing patterns and deaths from drug overdose among US veterans receiving opioid analgesics: case-cohort study. BMJ. 2015;350:h2698. PubMed
14. Jones CM, McAninch JK. Emergency department visits and overdose deaths from combined use of opioids and benzodiazepines. Am J Prev Med. 2015;49(4):493-501. PubMed
15. Herzig SJ, Rothberg MB, Cheung M, Ngo LH, Marcantonio ER. Opioid utilization and opioid-related adverse events in nonsurgical patients in US hospitals. J Hosp Med. 2014;9(2):73-81. PubMed
16. Jena AB, Goldman D, Karaca-Mandic P. Hospital prescribing of opioids to Medicare beneficiaries. JAMA Intern Med. 2016;176(7):990-997. PubMed
17. Calcaterra SL, Yamashita TE, Min SJ, Keniston A, Frank JW, Binswanger IA. Opioid prescribing at hospital discharge contributes to chronic opioid use. J Gen Intern Med. 2016;31(5):478-485. PubMed
18. Garrido MM, Prigerson HG, Penrod JD, Jones SC, Boockvar KS. Benzodiazepine and sedative-hypnotic use among older seriously ill veterans: choosing wisely? Clin Ther. 2014;36(11):1547-1554. PubMed
19. Doufas AG, Tian L, Padrez KA, et al. Experimental pain and opioid analgesia in volunteers at high risk for obstructive sleep apnea. PloS One. 2013;8(1):e54807. PubMed
20. Gislason T, Almqvist M, Boman G, Lindholm CE, Terenius L. Increased CSF opioid activity in sleep apnea syndrome. Regression after successful treatment. Chest. 1989;96(2):250-254. PubMed
21. Van Ryswyk E, Antic N. Opioids and sleep disordered breathing. Chest. 2016;150(4):934-944. PubMed
22. Koga Y, Sato S, Sodeyama N, et al. Comparison of the relaxant effects of diazepam, flunitrazepam and midazolam on airway smooth muscle. Br J Anaesth. 1992;69(1):65-69. PubMed
23. Pomara N, Lee SH, Bruno D, et al. Adverse performance effects of acute lorazepam administration in elderly long-term users: pharmacokinetic and clinical predictors. Prog Neuropsychopharmacol Biol Psychiatry. 2015;56:129-135. PubMed
24. Pandharipande P, Shintani A, Peterson J, et al. Lorazepam is an independent risk factor for transitioning to delirium in intensive care unit patients. Anesthesiology. 2006;104(1):21-26. PubMed
25. O’Neil CA, Krauss MJ, Bettale J, et al. Medications and patient characteristics associated with falling in the hospital. J Patient Saf. 2015 (epub ahead of print). PubMed
26. Kessler ER, Shah M, K Gruschkus S, Raju A. Cost and quality implications of opioid-based postsurgical pain control using administrative claims data from a large health system: opioid-related adverse events and their impact on clinical and economic outcomes. Pharmacotherapy. 2013;33(4):383-391. PubMed
27. Overdyk FJ, Dowling O, Marino J, et al. Association of opioids and sedatives with increased risk of in-hospital cardiopulmonary arrest from an administrative database. PLoS One. 2016;11(2):e0150214. PubMed
28. Minkowitz HS, Gruschkus SK, Shah M, Raju A. Adverse drug events among patients receiving postsurgical opioids in a large health system: risk factors and outcomes. Am J Health Syst Pharm. 2014;71(18):1556-1565. PubMed
29. Elixhauser A, Steiner C, Harris DR, Coffey RM. Comorbidity measures for use with administrative data. Med Care. 1998;36(1):8-27. PubMed
30. Quan H, Sundararajan V, Halfon P, et al. Coding algorithms for defining comorbidities in ICD-9-CM and ICD-10 administrative data. Med Care. 2005;43(11):1130-1139. PubMed
31. Churpek MM, Yuen TC, Winslow C, et al. Multicenter development and validation of a risk stratification tool for ward patients. Am J Respir Crit Care Med. 2014;190(6):649-655. PubMed
32. Knaus WA, Wagner DP, Draper EA, Z et al. The APACHE III prognostic system. Risk prediction of hospital mortality for critically ill hospitalized adults. Chest. 1991;100(6):1619-1636. PubMed
33. van den Boogaard M, Pickkers P, Slooter AJC, et al. Development and validation
of PRE-DELIRIC (PREdiction of DELIRium in ICu patients) delirium prediction
model for intensive care patients: observational multicentre study. BMJ.
2012;344:e420. PubMed
34. Clinical calculators. ClinCalc.com. http://www.clincalc.com. Accessed February
21, 2016.
35. Churpek MM, Yuen TC, Huber MT, Park SY, Hall JB, Edelson DP. Predicting
cardiac arrest on the wards: a nested case-control study. Chest. 2012;141(5):
1170-1176. PubMed
36. Churpek MM, Yuen TC, Park SY, Gibbons R, Edelson DP. Using electronic
health record data to develop and validate a prediction model for adverse outcomes
in the wards. Crit Care Med. 2014;42(4):841-848. PubMed
37. Efron B. Logistic regression, survival analysis, and the Kaplan-Meier curve. J Am
Stat Assoc. 1988;83(402):414-425.
38. Gibbons RD, Duan N, Meltzer D, et al; Institute of Medicine Committee. Waiting
for organ transplantation: results of an analysis by an Institute of Medicine Committee.
Biostatistics. 2003;4(2):207-222. PubMed
39. Singer JD, Willett JB. It’s about time: using discrete-time survival analysis to study
duration and the timing of events. J Educ Behav Stat. 1993;18(2):155-195.
40. World Health Organization. Cancer pain relief and palliative care. Report of a
WHO Expert Committee. World Health Organ Tech Rep Ser. 1990;804:1-75. PubMed
41. Bailey TC, Chen Y, Mao Y, et al. A trial of a real-time alert for clinical deterioration
in patients hospitalized on general medical wards. J Hosp Med. 2013;8(5):236-242. PubMed
42. Liu V, Kipnis P, Rizk NW, Escobar GJ. Adverse outcomes associated with delayed
intensive care unit transfers in an integrated healthcare system. J Hosp Med.
2012;7(3):224-230. PubMed
Chronic opioid and benzodiazepine use is common and increasing.1-5 Outpatient use of these medications has been associated with hospital readmission and death,6-12 with concurrent use associated with particularly increased risk.13,14 Less is known about outcomes for hospitalized patients receiving these medications.
More than half of hospital inpatients in the United States receive opioids,15 many of which are new prescriptions rather than continuation of chronic therapy.16,17 Less is known about inpatient benzodiazepine administration, but the prevalence may exceed 10% among elderly populations.18 Hospitalized patients often have comorbidities or physiological disturbances that might increase their risk related to use of these medications. Opioids can cause central and obstructive sleep apneas,19-21 and benzodiazepines contribute to respiratory depression and airway relaxation.22 Benzodiazepines also impair psychomotor function and recall,23 which could mediate the recognized risk for delirium and falls in the hospital.24,25 These findings suggest pathways by which these medications might contribute to clinical deterioration.
Most studies in hospitalized patients have been limited to specific populations15,26-28 and have not explicitly controlled for severity of illness over time. It remains unclear whether associations identified within particular groups of patients hold true for the broader population of general ward inpatients. Therefore, we aimed to determine the independent association between opioid and benzodiazepine administration and clinical deterioration in ward patients.
MATERIALS AND METHODS
Setting and Study Population
We performed an observational cohort study at a 500-bed urban academic hospital. Data were obtained from all adults hospitalized on the wards between November 1, 2008, and January 21, 2016. The study protocol was approved by the University of Chicago Institutional Review Board (IRB#15-0195).
Data Collection
The study utilized de-identified data from the electronic health record (EHR; Epic Systems Corporation, Verona, Wisconsin) and administrative databases collected by the University of Chicago Clinical Research Data Warehouse. Patient age, sex, race, body mass index (BMI), and ward admission source (ie, emergency department (ED), transferred from the intensive care unit (ICU), or directly admitted to the wards) were collected. International Classification of Diseases, 9th Revision, Clinical Modification (ICD-9-CM) codes were used to identify Elixhauser Comorbidity Index categories.29,30 Because patients with similar diagnoses (eg, active cancer) are cohorted within particular areas in our hospital, we obtained the ward unit for all patients. Patients who underwent surgery were identified using the hospital’s admission-transfer-discharge database.
To determine severity of illness, routinely collected vital signs and laboratory values were utilized to calculate the electronic cardiac arrest risk triage (eCART) score, an accurate risk score we previously developed and validated for predicting adverse events among ward patients.31 If any vital sign or laboratory value was missing, the next available measurement was carried forward. If any value remained missing after this change, the median value for that location (ie, wards, ICU, or ED) was imputed.32,33 Additionally, patient-reported pain scores at the time of opioid administration were extracted from nursing flowsheets. If no pain score was present at the time of opioid administration, the patient’s previous score was carried forward.
We excluded patients with sickle-cell disease or seizure history and admissions with diagnoses of alcohol withdrawal from the analysis, because these diagnoses were expected to be associated with different medication administration practices compared to other inpatients. We also excluded patients with a tracheostomy because we expected their respiratory monitoring to differ from the other patients in our cohort. Finally, because ward deaths resulting from a comfort care scenario often involve opioids and/or benzodiazepines, ward segments involving comfort care deaths (defined as death without attempted resuscitation) were excluded from the analysis (Supplemental Figure 1). Patients with sickle-cell disease were identified using ICD-9 codes, and encounters during which a seizure may have occurred were identified using a combination of ICD-9 codes and receipt of anti-epileptic medication (Supplemental Table 1). Patients at risk for alcohol withdrawal were identified by the presence of any Clinical Institute Withdrawal Assessment for Alcohol score within nursing flowsheets, and patients with tracheostomies were identified using documentation of ventilator support within their first 12 hours on the wards. In addition to these exclusion criteria, patients with obstructive sleep apnea (OSA) were identified by the following ICD-9 codes: 278.03, 327.23, 780.51, 780.53, and 780.57.
Medications
Ward administrations of opioids and benzodiazepines—dose, route, and administration time—were collected from the EHR. We excluded all administrations in nonward locations such as the ED, ICU, operating room, or procedure suite. Additionally, because patients emergently intubated may receive sedative and analgesic medications to facilitate intubation, and because patients experiencing cardiac arrest are frequently intubated periresuscitation, we a priori excluded all administrations within 15 minutes of a ward cardiac arrest or an intubation.
For consistent comparisons, opioid doses were converted to oral morphine equivalents34 and adjusted by a factor of 15 to reflect the smallest routinely available oral morphine tablet in our hospital (Supplemental Table 2). Benzodiazepine doses were converted to oral lorazepam equivalents (Supplemental Table 2).34 Thus, the independent variables were oral morphine or lorazepam equivalents administered within each 6-hour window. We a priori presumed opioid doses greater than the 99th percentile (1200 mg) or benzodiazepine doses greater than 10 mg oral lorazepam equivalents within a 6-hour window to be erroneous entries, and replaced these outlier values with the median value for each medication category.
Outcomes
The primary outcome was the composite of ICU transfer or cardiac arrest (loss of pulse with attempted resuscitation) on the wards, with individual outcomes investigated secondarily. An ICU transfer (patient movement from a ward directly to the ICU) was identified using the hospital’s admission-transfer-discharge database. Cardiac arrests were identified using a prospectively validated quality improvement database.35
Because deaths on the wards resulted either from cardiac arrest or from a comfort care scenario, mortality was not studied as an outcome.
Statistical Analysis
Patient characteristics were compared using Student t tests, Wilcoxon rank sum tests, and chi-squared statistics, as appropriate. Unadjusted and adjusted models were created using discrete-time survival analysis,36-39 which involved dividing time into discrete 6-hour intervals and employing the predictor variables chronologically closest to the beginning of each time window to forecast whether the outcome occurred within each interval. Predictor variables in the adjusted model included patient characteristics (age, sex, BMI, and Elixhauser Agency for Healthcare Research and Quality-Web comorbidities30 [a priori excluding comorbidities recorded for fewer than 1000 admissions from the model]), ward unit, surgical status, prior ICU admission during the hospitalization, cumulative opioid or benzodiazepine dose during the previous 24 hours, and severity of illness (measured by eCART score). The adjusted model for opioids also included the patient’s pain score. Age, eCART score, and pain score were entered linearly while race, BMI (underweight, less than 18.5 kg/m2; normal, 18.5-24.9 kg/m2; overweight, 25.0-29.9 kg/m2; obese, 30-39.9 kg/m2; and severely obese, 40 mg/m2 or greater), and ward unit were modeled as categorical variables.
Since repeat hospitalization could confound the results of our study, we performed a sensitivity analysis including only 1 randomly selected hospital admission per patient. We also performed a sensitivity analysis including receipt of both opioids and benzodiazepines, and an interaction term within each ward segment, as well as an analysis in which zolpidem—the most commonly administered nonbenzodiazepine hypnotic medication in our hospital—was included along with both opioids and benzodiazepines. Finally, we performed a sensitivity analysis replacing missing pain scores with imputed values ranging from 0 to the median ward pain score.
We also performed subgroup analyses of adjusted models across age quartiles and for each BMI category, as well as for surgical status, OSA status, gender, time of medication administration, and route of administration (intravenous vs. oral). We also performed an analysis across pain score severity40 to determine whether these medications produce differential effects at various levels of pain.
All tests of significance used a 2-sided P value less than 0.05. Statistical analyses were completed using Stata version 14.1 (StataCorp, LLC, College Station, Texas).
RESULTS
Patient Characteristics
A total of 144,895 admissions, from 75,369 patients, had ward vital signs or laboratory values documented during the study period. Ward segments from 634 admissions were excluded due to comfort care status, which resulted in exclusion of 479 complete patient admissions. Additionally, 139 patients with tracheostomies were excluded. Furthermore, 2934 patient admissions with a sickle-cell diagnosis were excluded, of which 95% (n = 2791) received an opioid and 11% (n = 310) received a benzodiazepine. Another 14,029 admissions associated with seizures, 6134 admissions involving alcohol withdrawal, and 1332 with both were excluded, of which 66% (n = 14,174) received an opioid and 35% (n = 7504) received a benzodiazepine. After exclusions, 120,518 admissions were included in the final analysis, with 67% (n = 80,463) associated with at least 1 administration of an opioid and 21% (n = 25,279) associated with at least 1 benzodiazepine administration.
In total, there were 672,851 intervals when an opioid was administered during the study, with a median dose of 12 mg oral morphine equivalents (interquartile range, 8-30). Of these, 21,634 doses were replaced due to outlier status outside the 99th percentile. Patients receiving opioids were younger (median age 56 vs 61 years), less likely to be African American (48% vs 59%), more likely to have undergone surgery (18% vs 6%), and less likely to have most noncancer medical comorbidities than those who never received an opioid (all P < 0.001) (Table 1).
Additionally, there were a total of 98,286 6-hour intervals in which a benzodiazepine was administered in the study, with a median dose of 1 mg oral lorazepam (interquartile range, 0.5-1). A total of 790 doses of benzodiazepines (less than 1%) were replaced due to outlier status. Patients who received benzodiazepines were more likely to be male (49% vs. 41%), less likely to be African-American, less likely to be obese or morbidly obese (33% vs. 39%), and more likely to have medical comorbidities compared to patients who never received a benzodiazepine (all P < 0.001) (Table 1).
The eCART scores were similar between all patient groups. The frequency of missing variables differed by data type, with vital signs rarely missing (all less than 1.1% except AVPU [10%]), followed by hematology labs (8%-9%), electrolytes and renal function results (12%-15%), and hepatic function tests (40%-45%). In addition to imputed data for missing vital signs and laboratory values, our model omitted human immunodeficiency virus/acquired immune deficiency syndrome and peptic ulcer disease from the adjusted models on the basis of fewer than 1000 admissions with these diagnoses listed.
Patient Outcomes
The incidence of the composite outcome was higher in admissions with at least 1 opioid medication than those without an opioid (7% vs. 4%, P < 0.001), and in admissions with at least 1 dose of benzodiazepines compared to those without a benzodiazepine (11% vs. 4%, P < 0.001) (Table 2).
Within 6-hour segments, increasing doses of opioids were associated with an initial decrease in the frequency of the composite outcome followed by a dose-related increase in the frequency of the composite outcome with morphine equivalents greater than 45 mg. By contrast, the frequency of the composite outcome increased with additional benzodiazepine equivalents (Figure).
In the adjusted model, opioid administration was associated with increased risk for the composite outcome (Table 3) in a dose-dependent fashion, with each 15 mg oral morphine equivalent associated with a 1.9% increase in the odds of ICU transfer or cardiac arrest within the subsequent 6-hour time interval (odds ratio [OR], 1.019; 95% confidence interval [CI], 1.013-1.026; P < 0.001).
Similarly, benzodiazepine administration was also associated with increased adjusted risk for the composite outcome within 6 hours in a dose-dependent manner. Each 1 mg oral lorazepam equivalent was associated with a 29% increase in the odds of ward cardiac arrest or ICU transfer (OR, 1.29; 95% CI, 1.16-1.44; P < 0.001) (Table 3).
Sensitivity Analyses
A sensitivity analysis including 1 randomly selected hospitalization per patient involved 67,097 admissions and found results similar to the primary analysis, with each 15 mg oral morphine equivalent associated with a 1.9% increase in the odds of the composite outcome (OR, 1.019; 95% CI, 1.011-1.028; P < 0.001) and each 1 mg oral lorazepam equivalent associated with a 41% increase in the odds of the composite outcome (OR, 1.41; 95% CI, 1.21-1.65; P < 0.001). Inclusion of both opioids and benzodiazepines in the adjusted model again yielded results similar to the main analysis for both opioids (OR, 1.020; 95% CI, 1.013-1.026; P < 0.001) and benzodiazepines (OR, 1.35; 95% CI, 1.18-1.54; P < 0.001), without a significant interaction detected (P = 0.09). These results were unchanged with the addition of zolpidem to the model as an additional potential confounder, and zolpidem did not increase the risk of the study outcomes (P = 0.2).
A final sensitivity analysis for the opioid model involved replacing missing pain scores with imputed values ranging from 0 to the median ward score, which was 5. The results of these analyses did not differ from the primary model and were consistent regardless of imputation value (OR, 1.018; 95% CI, 1.012-1.023; P < 0.001).
Subgroup Analyses
Analyses of opioid administration by subgroup (sex, age quartiles, BMI categories, OSA diagnosis, surgical status, daytime/nighttime medication administration, IV/PO administration, and pain severity) yielded similar results to the overall analysis (Supplemental Figure 2). Subgroup analysis of patients receiving benzodiazepines revealed similarly increased adjusted odds of the composite outcome across strata of gender, BMI, surgical status, and medication administration time (Supplemental Figure 3). Notably, patients older than 70 years who received a benzodiazepine were at 64% increased odds of the composite outcome (OR, 1.64; 95% CI, 1.30-2.08), compared to 2% to 38% increased risk for patients under 70 years. Finally, IV doses of benzodiazepines were associated with 48% increased odds for deterioration (OR, 1.48; 95% CI, 1.18-1.84; P = 0.001), compared to a nonsignificant 14% increase in the odds for PO doses (OR, 1.14; 95% CI, 0.99-1.31; P = 0.066).
DISCUSSION
In a large, single-center, observational study of ward inpatients, we found that opioid use was associated with a small but significant increased risk for clinical deterioration on the wards, with every 15 mg oral morphine equivalent increasing the odds of ICU transfer or cardiac arrest in the next 6 hours by 1.9%. Benzodiazepines were associated with a much higher risk: each equivalent of 1 mg of oral lorazepam increased the odds of ICU transfer or cardiac arrest by almost 30%. These results have important implications for care at the bedside of hospitalized ward patients and suggest the need for closer monitoring after receipt of these medications, particularly benzodiazepines.
Previous work has described negative effects of opioid medications among select inpatient populations. In surgical patients, opioids have been associated with hospital readmission, increased length of stay, and hospital mortality.26,28 More recently, Herzig et al.15 found more adverse events in nonsurgical ward patients within the hospitals prescribing opioids the most frequently. These studies may have been limited by the populations studied and the inability to control for confounders such as severity of illness and pain score. Our study expands these findings to a more generalizable population and shows that even after adjustment for potential confounders, such as severity of illness, pain score, and medication dose, opioids are associated with increased short-term risk of clinical deterioration.
By contrast, few studies have characterized the risks associated with benzodiazepine use among ward inpatients. Recently, Overdyk et al.27 found that inpatient use of opioids and sedatives was associated with increased risk for cardiac arrest and hospital death. However, this study included ICU patients, which may confound the results, as ICU patients often receive high doses of opioids or benzodiazepines to facilitate mechanical ventilation or other invasive procedures, while also having a particularly high risk of adverse outcomes like cardiac arrest and inhospital death.
Several mechanisms may explain the magnitude of effect seen with regard to benzodiazepines. First, benzodiazepines may directly produce clinical deterioration by decreased respiratory drive, diminished airway tone, or hemodynamic decompensation. It is possible that the broad spectrum of cardiorespiratory side effects of benzodiazepines—and potential unpredictability of these effects—increases the difficulty of observation and management for patients receiving them. This difficulty may be compounded with intravenous administration of benzodiazepines, which was associated with a higher risk for deterioration than oral doses in our cohort. Alternatively, benzodiazepines may contribute to clinical decompensation by masking signs of deterioration such as encephalopathy or vital sign instability like tachycardia or tachypnea that may be mistaken as anxiety. Notably, while our hospital has a nursing-driven protocol for monitoring patients receiving opioids (in which pain is serially assessed, leading to additional bedside observation), we do not have protocols for ward patients receiving benzodiazepines. Finally, although we found that orders for opioids and benzodiazepines were more common in white patients than African American patients, this finding may be due to differences in the types or number of medical comorbidities experienced by these patients.
Our study has several strengths, including the large number of admissions we included. Additionally, we included a broad range of medical and surgical ward admissions, which should increase the generalizability of our results. Further, our rates of ICU transfer are in line with data reported from other groups,41,42 which again may add to the generalizability of our findings. We also addressed many potential confounders by including patient characteristics, individual ward units, and (for opioids) pain score in our model, and by controlling for severity of illness with the eCART score, an accurate predictor of ICU transfer and ward cardiac arrest within our population.32,37 Finally, our robust methodology allowed us to include acute and cumulative medication doses, as well as time, in the model. By performing a discrete-time survival analysis, we were able to evaluate receipt of opioids and benzodiazepines—as well as risk for clinical deterioration—longitudinally, lending strength to our results.
Limitations of our study include its single-center cohort, which may reduce generalizability to other populations. Additionally, because we could not validate the accuracy of—or adherence to—outpatient medication lists, we were unable to identify chronic opioid or benzodiazepine users by these lists. However, patients chronically taking opioids or benzodiazepines would likely receive doses each hospital day; by including 24-hour cumulative doses in our model, we attempted to adjust for some portion of their chronic use. Also, because evaluation of delirium was not objectively recorded in our dataset, we were unable to evaluate the relationship between receipt of these medications and development of delirium, which is an important outcome for hospitalized patients. Finally, neither the diagnoses for which these medications were prescribed, nor the reason for ICU transfer, were present in our dataset, which leaves open the possibility of unmeasured confounding.
CONCLUSION
After adjustment for important confounders including severity of illness, medication dose, and time, opioids were associated with a slight increase in clinical deterioration on the wards, while benzodiazepines were associated with a much larger risk for deterioration. This finding raises concern about the safety of benzodiazepine use among ward patients and suggests that increased monitoring of patients receiving these medications may be warranted.
Acknowledgment
The authors thank Nicole Twu for administrative support.
Disclosure
Drs. Churpek and Edelson have a patent pending (ARCD. P0535US.P2) for risk stratification algorithms for hospitalized patients. Dr. Churpek is supported by a career development award from the National Heart, Lung, and Blood Institute (K08 HL121080). Dr. Churpek has received honoraria from Chest for invited speaking engagements. In addition, Dr. Edelson has received research support from Philips Healthcare (Andover, Massachusetts), research support from the American Heart Association (Dallas, Texas) and Laerdal Medical (Stavanger, Norway), and research support from Early Sense (Tel Aviv, Israel). She has ownership interest in Quant HC (Chicago, Illinois), which is developing products for risk stratification of hospitalized patients. Dr. Mokhlesi is supported by National Institutes of Health grant R01HL119161. Dr. Mokhlesi has served as a consultant to Philips/Respironics and has received research support from Philips/Respironics. Preliminary versions of these data were presented as a poster presentation at the 2016 meeting of the American Thoracic Society, May 17, 2016; San Francisco, California.
1. Substance Abuse and Mental Health Services Administration. Results from the 2013 National Survey on Drug Use and Health: Summary of National Findings. Rockville, MD: Substance Abuse and Mental Health Services Administration; 2014.
2. Bachhuber MA, Hennessy S, Cunningham CO, Starrels JL. Increasing benzodiazepine prescriptions and overdose mortality in the United States, 1996–2013. Am J Public Health. 2016;106(4):686-688. PubMed
3. Parsells Kelly J, Cook SF, Kaufman DW, Anderson T, Rosenberg L, Mitchell AA. Prevalence and characteristics of opioid use in the US adult population. Pain. 2008;138(3):507-513. PubMed
4. Olfson M, King M, Schoenbaum M. Benzodiazepine use in the United States. JAMA Psychiatry. 2015;72(2):136-142. PubMed
5. Hwang CS, Kang EM, Kornegay CJ, Staffa JA, Jones CM, McAninch JK. Trends in the concomitant prescribing of opioids and benzodiazepines, 2002−2014. Am J Prev Med. 2016;51(2):151-160. PubMed
6. Bohnert AS, Valenstein M, Bair MJ, et al. Association between opioid prescribing patterns and opioid overdose-related deaths. JAMA. 2011;305(13):1315-1321. PubMed
7. Dart RC, Surratt HL, Cicero TJ, et al. Trends in opioid analgesic abuse and mortality in the United States. N Engl J Med. 2015;372(3):241-248. PubMed
8. Centers for Disease Control and Prevention (CDC). Vital signs: overdoses of prescription opioid pain relievers---United States, 1999--2008. MMWR Morb Mortal Wkly Rep. 2011;60(43):1487-1492. PubMed
9. Lan TY, Zeng YF, Tang GJ, et al. The use of hypnotics and mortality - a population-based retrospective cohort study. PLoS One. 2015;10(12):e0145271. PubMed
10. Mosher HJ, Jiang L, Vaughan Sarrazin MS, Cram P, Kaboli P, Vander Weg MW. Prevalence and characteristics of hospitalized adults on chronic opioid therapy: prior opioid use among veterans. J Hosp Med. 2014;9(2):82-87. PubMed
11. Palmaro A, Dupouy J, Lapeyre-Mestre M. Benzodiazepines and risk of death: results from two large cohort studies in France and UK. Eur Neuropsychopharmacol. 2015;25(10):1566-1577. PubMed
12. Parsaik AK, Mascarenhas SS, Khosh-Chashm D, et al. Mortality associated with anxiolytic and hypnotic drugs–a systematic review and meta-analysis. Aust N Z J Psychiatry. 2016;50(6):520-533. PubMed
13. Park TW, Saitz R, Ganoczy D, Ilgen MA, Bohnert AS. Benzodiazepine prescribing patterns and deaths from drug overdose among US veterans receiving opioid analgesics: case-cohort study. BMJ. 2015;350:h2698. PubMed
14. Jones CM, McAninch JK. Emergency department visits and overdose deaths from combined use of opioids and benzodiazepines. Am J Prev Med. 2015;49(4):493-501. PubMed
15. Herzig SJ, Rothberg MB, Cheung M, Ngo LH, Marcantonio ER. Opioid utilization and opioid-related adverse events in nonsurgical patients in US hospitals. J Hosp Med. 2014;9(2):73-81. PubMed
16. Jena AB, Goldman D, Karaca-Mandic P. Hospital prescribing of opioids to Medicare beneficiaries. JAMA Intern Med. 2016;176(7):990-997. PubMed
17. Calcaterra SL, Yamashita TE, Min SJ, Keniston A, Frank JW, Binswanger IA. Opioid prescribing at hospital discharge contributes to chronic opioid use. J Gen Intern Med. 2016;31(5):478-485. PubMed
18. Garrido MM, Prigerson HG, Penrod JD, Jones SC, Boockvar KS. Benzodiazepine and sedative-hypnotic use among older seriously ill veterans: choosing wisely? Clin Ther. 2014;36(11):1547-1554. PubMed
19. Doufas AG, Tian L, Padrez KA, et al. Experimental pain and opioid analgesia in volunteers at high risk for obstructive sleep apnea. PloS One. 2013;8(1):e54807. PubMed
20. Gislason T, Almqvist M, Boman G, Lindholm CE, Terenius L. Increased CSF opioid activity in sleep apnea syndrome. Regression after successful treatment. Chest. 1989;96(2):250-254. PubMed
21. Van Ryswyk E, Antic N. Opioids and sleep disordered breathing. Chest. 2016;150(4):934-944. PubMed
22. Koga Y, Sato S, Sodeyama N, et al. Comparison of the relaxant effects of diazepam, flunitrazepam and midazolam on airway smooth muscle. Br J Anaesth. 1992;69(1):65-69. PubMed
23. Pomara N, Lee SH, Bruno D, et al. Adverse performance effects of acute lorazepam administration in elderly long-term users: pharmacokinetic and clinical predictors. Prog Neuropsychopharmacol Biol Psychiatry. 2015;56:129-135. PubMed
24. Pandharipande P, Shintani A, Peterson J, et al. Lorazepam is an independent risk factor for transitioning to delirium in intensive care unit patients. Anesthesiology. 2006;104(1):21-26. PubMed
25. O’Neil CA, Krauss MJ, Bettale J, et al. Medications and patient characteristics associated with falling in the hospital. J Patient Saf. 2015 (epub ahead of print). PubMed
26. Kessler ER, Shah M, K Gruschkus S, Raju A. Cost and quality implications of opioid-based postsurgical pain control using administrative claims data from a large health system: opioid-related adverse events and their impact on clinical and economic outcomes. Pharmacotherapy. 2013;33(4):383-391. PubMed
27. Overdyk FJ, Dowling O, Marino J, et al. Association of opioids and sedatives with increased risk of in-hospital cardiopulmonary arrest from an administrative database. PLoS One. 2016;11(2):e0150214. PubMed
28. Minkowitz HS, Gruschkus SK, Shah M, Raju A. Adverse drug events among patients receiving postsurgical opioids in a large health system: risk factors and outcomes. Am J Health Syst Pharm. 2014;71(18):1556-1565. PubMed
29. Elixhauser A, Steiner C, Harris DR, Coffey RM. Comorbidity measures for use with administrative data. Med Care. 1998;36(1):8-27. PubMed
30. Quan H, Sundararajan V, Halfon P, et al. Coding algorithms for defining comorbidities in ICD-9-CM and ICD-10 administrative data. Med Care. 2005;43(11):1130-1139. PubMed
31. Churpek MM, Yuen TC, Winslow C, et al. Multicenter development and validation of a risk stratification tool for ward patients. Am J Respir Crit Care Med. 2014;190(6):649-655. PubMed
32. Knaus WA, Wagner DP, Draper EA, Z et al. The APACHE III prognostic system. Risk prediction of hospital mortality for critically ill hospitalized adults. Chest. 1991;100(6):1619-1636. PubMed
33. van den Boogaard M, Pickkers P, Slooter AJC, et al. Development and validation
of PRE-DELIRIC (PREdiction of DELIRium in ICu patients) delirium prediction
model for intensive care patients: observational multicentre study. BMJ.
2012;344:e420. PubMed
34. Clinical calculators. ClinCalc.com. http://www.clincalc.com. Accessed February
21, 2016.
35. Churpek MM, Yuen TC, Huber MT, Park SY, Hall JB, Edelson DP. Predicting
cardiac arrest on the wards: a nested case-control study. Chest. 2012;141(5):
1170-1176. PubMed
36. Churpek MM, Yuen TC, Park SY, Gibbons R, Edelson DP. Using electronic
health record data to develop and validate a prediction model for adverse outcomes
in the wards. Crit Care Med. 2014;42(4):841-848. PubMed
37. Efron B. Logistic regression, survival analysis, and the Kaplan-Meier curve. J Am
Stat Assoc. 1988;83(402):414-425.
38. Gibbons RD, Duan N, Meltzer D, et al; Institute of Medicine Committee. Waiting
for organ transplantation: results of an analysis by an Institute of Medicine Committee.
Biostatistics. 2003;4(2):207-222. PubMed
39. Singer JD, Willett JB. It’s about time: using discrete-time survival analysis to study
duration and the timing of events. J Educ Behav Stat. 1993;18(2):155-195.
40. World Health Organization. Cancer pain relief and palliative care. Report of a
WHO Expert Committee. World Health Organ Tech Rep Ser. 1990;804:1-75. PubMed
41. Bailey TC, Chen Y, Mao Y, et al. A trial of a real-time alert for clinical deterioration
in patients hospitalized on general medical wards. J Hosp Med. 2013;8(5):236-242. PubMed
42. Liu V, Kipnis P, Rizk NW, Escobar GJ. Adverse outcomes associated with delayed
intensive care unit transfers in an integrated healthcare system. J Hosp Med.
2012;7(3):224-230. PubMed
© 2017 Society of Hospital Medicine
OSA and Outcomes in Ward Patients
Obstructive sleep apnea (OSA) is an increasingly prevalent condition characterized by intermittent airway obstruction during sleep, which leads to hypoxemia, hypercapnia, and fragmented sleep. The current prevalence estimates of moderate to severe OSA (apnea‐hypopnea index 15, measured as events/hour) in middle‐aged adults are approximately 13% in men and 6% in women.[1] OSA is a well‐described independent risk factor for long‐term neurocognitive, cardiovascular, and cerebrovascular morbidity and mortality.[2, 3, 4, 5, 6]
Recent studies have also identified OSA as an independent risk factor for adverse perioperative outcomes, including endotracheal intubation, intensive care unit (ICU) transfer, and increased length of stay.[7, 8, 9, 10, 11] Paradoxically, despite an increase in the risk of complications, several of these studies did not find an association between in‐hospital death and OSA even after controlling for potential confounders.[9, 10, 11] Furthermore, a recent study of patients hospitalized for pneumonia reported increased rates of clinical deterioration and mechanical ventilation, but also lower odds of inpatient mortality in patients with OSA.[12]
These studies may have been limited by the absence of physiologic data, which prevented controlling for severity of illness. It is also unclear whether these previously described associations between OSA and adverse clinical outcomes hold true for general hospital inpatients. OSA may be worsened by medications frequently used in hospitals, such as narcotics and benzodiazepines. Opiate use contributes to both central and obstructive sleep apneas,[13, 14] and benzodiazepines are known to produce airway smooth muscle relaxation and can cause respiratory depression.[15] In fact, the use of benzodiazepines has been implicated in the unmasking of OSA in patients with previously undiagnosed sleep‐disordered breathing.[16] These findings suggest mechanisms by which OSA could contribute to an increased risk in hospital ward patients for rapid response team (RRT) activation, ICU transfer, cardiac arrest, and in‐hospital death.
The aim of this study was to determine the independent association between OSA and in‐hospital mortality in ward patients. We also aimed to investigate the association of OSA with clinical deterioration on the wards, while controlling for patient characteristics, initial physiology, and severity of illness.
MATERIALS AND METHODS
Setting and Study Population
This observational cohort study was performed at an academic tertiary care medical center with approximately 500 beds. Data were obtained from all adult patients hospitalized on the wards between November 1, 2008 and October 1, 2013. Our hospital has utilized an RRT, led by a critical care nurse and respiratory therapist with hospitalist and pharmacist consultation available upon request, since 2008. This team is separate from the team that responds to a cardiac arrest. Criteria for RRT activation include tachypnea, tachycardia, hypotension, and staff worry, but specific vital sign thresholds are not specified.
The study analyzed deidentified data from the hospital's Clinical Research Data Warehouse, which is maintained by the Center for Research Informatics at The University of Chicago. The study protocol was approved by the University of Chicago Institutional Review Board (IRB #16995A).
Data Collection
Patient age, sex, race, body mass index (BMI), and location prior to ward admission (ie, whether they were admitted from the emergency department, transferred from the ICU, or directly admitted from clinic or home) were collected. Patients who underwent surgery during their admission were identified using the hospital's admission‐transfer‐discharge database. In addition, routinely collected vital signs (eg, respiratory rate, blood pressure, heart rate) were obtained from the electronic health record (Epic, Verona, WI). To determine severity of illness, the first set of vital signs measured on hospital presentation were utilized to calculate the cardiac arrest risk triage (CART) score, a vital‐signbased early warning score we previously developed and validated for predicting adverse events in our population.[17] The CART score ranges from 0 to 57, with points assigned for abnormalities in respiratory rate, heart rate, diastolic blood pressure, and age. If any vital sign was missing, the next available measurement was pulled into the set. If any vital sign remained missing after this change, the median value for that particular location (ie, wards, ICU, or emergency department) was imputed as previously described.[18, 19]
Patients with OSA were identified by the following International Classification of Diseases, Ninth Revision, Clinical Modification (ICD‐9‐CM) codes using inpatient and outpatient medical records: 278.03, 327.20, 327.23, 327.29, 780.51, 780.53, and 780.57 (Table 1). Data on other patient comorbidities, including coronary artery disease, congestive heart failure, arrhythmias, uncomplicated and complicated diabetes mellitus, hypertension, and cerebrovascular disease were collected using specific ICD‐9‐CM codes from both inpatient and outpatient records. Information on insurance payer was also collected from the hospital's billing database. Insurance payers were grouped into the following categories: private payer, Medicare/Medicaid, and no insurance. Patients with both public and private payers were counted as being privately insured.
| Diagnosis Code | Description | % of Sleep Apnea Diagnosesa |
|---|---|---|
| ||
| 327.23 | Obstructive sleep apnea | 65.6 |
| 780.57 | Unspecified sleep apnea | 19.4 |
| 780.53 | Hypersomnia with sleep apnea, unspecified | 11.7 |
| 780.51 | Insomnia with sleep apnea, unspecified | 1.5 |
| 327.2 | Organic sleep apnea, unspecified | 0.2 |
| 278.03 | Obesity hypoventilation syndrome | 1.7 |
Outcomes
The primary outcome of the study was in‐hospital mortality. Secondary outcomes included length of stay, RRT activation, transfer to the ICU, endotracheal intubation, cardiac arrest (defined as a loss of pulse with attempted resuscitation) on the wards, and a composite outcome of RRT activation, ICU transfer, and death. Because cardiac arrests on the wards result either in death or ICU transfer following successful resuscitation, this variable was omitted from the composite outcome. Cardiac arrests were identified using a prospectively validated quality improvement database that has been described previously.[20] ICU transfer was identified using the hospital's admission‐transfer‐discharge database. Only the index cardiac arrest, intubation, RRT, or ICU transfer for each admission was used in the study, but more than 1 type of outcome could occur for each patient (eg, a patient who died following an unsuccessful resuscitation attempt would count as both a cardiac arrest and a death).
Statistical Analysis
Patient characteristics were compared using Student t tests, Wilcoxon rank sum tests, and 2 statistics, as appropriate. Unadjusted logistic regression models were fit to estimate the change in odds of each adverse event and a composite outcome of any event for patient admissions with OSA compared to those without OSA. Adjusted logistic regression models were then fit for each outcome to control for patient characteristics (age, sex, BMI, insurance status, and individual comorbidities), location immediately prior to ward admission, and admission severity of illness (as measured by CART score). In the adjusted model, CART score, age, and number of comorbidities were entered linearly, with the addition of squared terms for age and CART score, as these variables showed nonlinear associations with the outcomes of interest. Race, surgical status, insurance payer, location prior to ward, and BMI (underweight, <18.5 kg/m2; normal weight, 18.524.9 kg/m2; overweight, 25.029.9 kg/m2; obese, 3039.9 kg/m2; and severely obese, (40 kg/m2) were modeled as categorical variables.
Given that an individual patient could experience multiple hospitalizations during the study period, we performed a sensitivity analysis of all adjusted and unadjusted models using a single randomly selected hospitalization for each unique patient. In addition, we performed a sensitivity analysis of all patients who were not admitted to the ICU prior to their ward stay. Finally, we performed subgroup analyses of all unadjusted and adjusted models for each BMI category and surgical status.
All tests of significance used a 2‐sided P value <0.05. Statistical analyses were completed using Stata version 12.0 (StataCorp, College Station, TX).
RESULTS
Patient Characteristics
During the study period, 93,676 patient admissions from 53,150 unique patients resulted in the occurrence of 1,069 RRT activations, 6,305 ICU transfers, and 1,239 in‐hospital deaths. Within our sample, 40,034 patients had at least 1 inpatient record and at least 1 outpatient record. OSA diagnosis was present in 5,625 patients (10.6% of the total sample), with 4,748 patients having an OSA diagnosis code entered during a hospitalization, 2,143 with an OSA diagnosis code entered during an outpatient encounter, and 877 with both inpatient and outpatient diagnosis codes. These patients identified as having OSA contributed 12,745 (13.6%) hospital admissions.
Patients with an OSA diagnosis were more likely to be older (median age 59 years [interquartile range 4968] vs 55 years [3868]), male (49% vs 42%), overweight or obese (88% vs 62%), and more likely to carry diagnoses of diabetes (53.8% vs 25.5%), hypertension (45.3% vs 18.2%), arrhythmias (44.4% vs 26.7%), coronary artery disease (46.8% vs 23.5%), heart failure (35.8% vs 13.5%), and cerebrovascular disease (13.5% vs 8.1%) than patients without an OSA diagnosis (all comparisons significant, P < 0.001) (Table 2).
| Characteristic | Patient Admissions With OSA Diagnoses, n = 12,745 | Patient Admissions Without OSA Diagnoses, n = 80,931 | P Value |
|---|---|---|---|
| |||
| Age, y, median (IQR) | 59 (4968) | 55 (3868) | <0.001 |
| Female, n (%) | 6,514 (51%) | 47,202 (58%) | <0.001 |
| Race, n (%) | <0.001 | ||
| White | 4,205 (33%) | 30,119 (37%) | |
| Black/African American | 7,024 (55%) | 38,561 (48%) | |
| Asian | 561 (4.4%) | 3,419 (4.2%) | |
| American Indian or Native Alaskan | 20 (0.2%) | 113 (0.1%) | |
| More than 1 race | 127 (1%) | 843 (1%) | |
| Race unknown | 808 (6%) | 7,876 (10%) | |
| Insurance status, n (%) | <0.001 | ||
| Private | 4,484 (35%) | 32,467 (40%) | |
| Medicare/Medicaid | 8,201 (64%) | 42,208 (58%) | |
| Uninsured | 53 (0.4%) | 1,190 (1%) | |
| Unknown | 4 (<0.1%) | 16 (<0.1%) | |
| Location prior to wards, n (%) | <0.001 | ||
| ICU | 1,400 (11%) | 8,065 (10%) | |
| Emergency department | 4,633 (36%) | 25,170 (31%) | |
| Ambulatory admission | 6,712 (53%) | 47,696 (59%) | |
| Body mass index, kg/m2, n (%) | <0.001 | ||
| Normal (18.525) | 1,431 (11%) | 26,560 (33%) | |
| Underweight (<18.5) | 122 (1%) | 4,256 (5%) | |
| Overweight (2530) | 2,484 (20%) | 23,761 (29%) | |
| Obese (3040) | 4,959 (39%) | 19,132 (24%) | |
| Severely obese (40) | 3,745 (29%) | 7,171 (9%) | |
| Initial cardiac arrest risk triage score, median (IQR) | 4 (09) | 4 (09) | <0.001 |
| Underwent surgery, n (%) | 4,482 (35%) | 28,843 (36%) | 0.3 |
| Comorbidities | |||
| Number of comorbidities, median (IQR) | 2 (14) | 1 (02) | <0.001 |
| Arrhythmia | 5,659 (44%) | 21,581 (27%) | <0.001 |
| Diabetes mellitus | 6,855 (54%) | 20,641 (26%) | <0.001 |
| Hypertension | 5,777 (45%) | 14,728 (18%) | <0.001 |
| Coronary artery disease | 5,958 (47%) | 18,979 (23%) | <0.001 |
| Cerebrovascular accident | 1,725 (14%) | 6,556 (8%) | <0.001 |
| Congestive heart failure | 4,559 (36%) | 10,919 (13%) | <0.001 |
Complications and Adverse Outcomes
In the unadjusted analyses, the overall incidence of adverse outcomes was higher among patient admissions with a diagnosis of OSA compared to those without OSA (Table 3). Those with OSA were more likely to experience RRT activation (1.5% vs 1.1%), ICU transfer (8% vs 7%), and endotracheal intubation (3.9% vs 2.9%) than those without OSA diagnoses (P < 0.001 for all comparisons). There was no significant difference in the incidence of cardiac arrest between the 2 groups, nor was there a significant difference in length of stay. Unadjusted inpatient mortality for OSA patient admissions was lower than that for non‐OSA hospitalizations (1.1% vs 1.4%, P < 0.05). A diagnosis of OSA was associated with increased unadjusted odds for RRT activation (odds ratio [OR]: 1.36 [1.16‐1.59]) and ICU transfer (OR: 1.28 [1.20‐1.38]). However, after controlling for confounders, OSA was not associated with increased odds for RRT activation (OR: 1.14 [0.95‐1.36]) or intubation (OR: 1.06 [0.94‐1.19]), and was associated with slightly decreased odds for ICU transfer (OR: 0.91 [0.84‐0.99]) (Figure 1). Those with OSA had decreased adjusted odds of cardiac arrest (OR: 0.72 [0.55‐0.95]) compared to those without OSA. OSA was also associated with decreased odds of in‐hospital mortality before (OR: 0.83 [0.70‐0.99]) and after (OR: 0.70 [0.58‐0.85]) controlling for confounders.
| Characteristic | Patient Admissions With OSA Diagnoses, n = 12,745 | Patient Admissions Without OSA Diagnoses, n = 80,931 | P Value |
|---|---|---|---|
| |||
| Outcomes, n (%) | |||
| Composite outcomea | 1,137 (9%) | 5,792 (7%) | <0.001 |
| In‐hospital death | 144 (1.1%) | 1,095 (1.4%) | 0.04 |
| Rapid response team call | 188 (1.5%) | 881 (1.1%) | <0.001 |
| ICU transfer | 1,045 (8%) | 5,260 (7%) | <0.001 |
| Cardiac arrest | 413 (0.5%) | 73 (0.6%) | 0.36 |
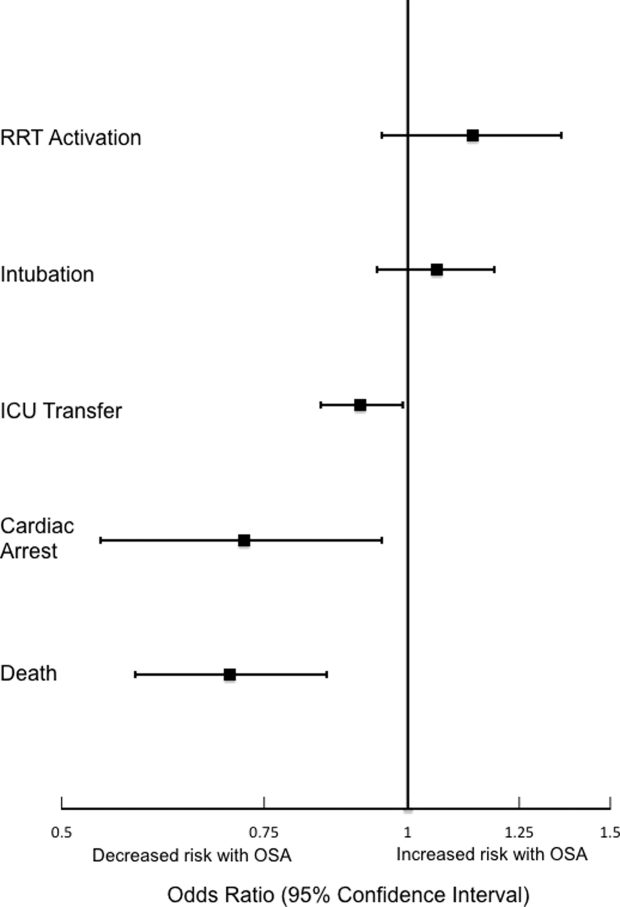
Sensitivity Analyses
The sensitivity analysis involving 1 randomly selected hospitalization per patient included a total of 53,150 patients. The results were similar to the main analysis, with adjusted odds of 1.01 (0.77‐1.32) for RRT activation, 0.86 (0.76‐0.96) for ICU transfer, and 0.69 (0.53‐0.89) for inpatient mortality. An additional sensitivity analysis included only patients who were not admitted to the ICU prior to their ward stay. This analysis included 84,211 hospitalizations and demonstrated similar findings, with adjusted odds of 0.70 for in‐hospital mortality (0.57‐0.87). Adjusted odds for RRT activation (OR: 1.12 [0.92‐1.37]) and ICU transfer (OR: 0.88 [0.81‐0.96] were also similar to the results of our main analysis.
Subgroup Analyses
Surgical and Nonsurgical Patients
Subgroup analyses of surgical versus nonsurgical patients (Figure 2) revealed similarly decreased adjusted odds of in‐hospital death for OSA patients in both groups (surgical OR: 0.69 [0.49‐0.97]; nonsurgical OR: 0.72 [0.58‐0.91]). Surgical patients with OSA diagnoses had decreased adjusted odds for ICU transfer (surgical OR: 0.82 [0.73‐0.92], but this finding was not seen in nonsurgical patients (OR: 1.03 [0.92‐1.15]).
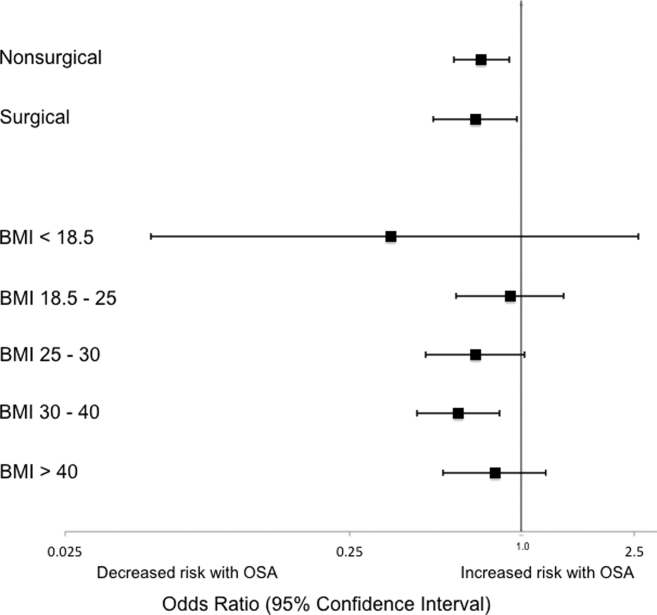
Patients Stratified by BMI
Examination across BMI categories (Figure 2) showed a significant decrease in adjusted odds of death for OSA patients with BMI 30 to 40 kg/m2 (OR: 0.60 [0.43‐0.84]). A nonsignificant decrease in adjusted odds of death was seen for OSA patients in all other groups. Adjusted odds ratios for the risk of RRT activation and ICU transfer in OSA patients within the different BMI categories were not statistically significant.
DISCUSSION
In this large observational single‐center cohort study, we found that OSA was associated with increased odds of adverse events, such as ICU transfers and RRT calls, but this risk was no longer present after adjusting for demographics, comorbidities, and presenting vital signs. Interestingly, we also found that patients with OSA had decreased adjusted odds for cardiac arrest and mortality. This mortality finding was robust to multiple sensitivity analyses and subgroup analyses. These results have significant implications for our understanding of the short‐term risks of sleep‐disordered breathing in hospitalized patients, and suggest the possibility that OSA is associated with a protective effect with regard to inpatient mortality.
Our findings are in line with other recent work in this area. In 2 large observational cohorts of surgical populations drawn from the nationally representative Nationwide Inpatient Sample administrative database, our group reported decreased odds of in‐hospital postoperative mortality in OSA patients.[10, 11] Using the same Nationwide Inpatient Sample, Lindenauer et al. showed that among inpatients hospitalized with pneumonia, OSA diagnosis was associated with increased rates of clinical deterioration but lower rates of inpatient mortality.[12] Although these 3 studies have identified decreased inpatient mortality among certain surgical populations and patients hospitalized with pneumonia, they are limited by using administrative databases that do not provide specific data on vital signs, presenting physiology, BMI, or race. Another important limitation of the Nationwide Inpatient Sample is the lack of any information on RRT activations and ICU transfers. Moreover, the database does not include information on outpatient diagnoses, which may have led to a significantly lower prevalence of OSA than expected in these studies. Despite the important methodological differences, our study corroborates this finding among a diverse cohort of hospitalized patients. Unlike these previous studies of postoperative patients or those hospitalized with pneumonia, we did not find an increased risk of adverse events associated with OSA after controlling for potential confounders.
The decreased mortality seen in OSA patients could be explained by these patients receiving more vigilant care, showing earlier signs of deterioration, or displaying more easily treatable forms of distress than patients without OSA. For example, earlier identification of deterioration could lead to earlier interventions, which could decrease inpatient mortality. In 2 studies of postsurgical patients,[10, 11] those with OSA diagnosis who developed respiratory failure were intubated earlier and received mechanical ventilation for a shorter period of time, suggesting that the cause of respiratory failure was rapidly reversible (eg, upper airway complications due to oversedation or excessive analgesia). However, we did not find increased adjusted odds of RRT activation or ICU transfer for OSA patients in our study, and so it is less likely that earlier recognition of decompensation occurred in our sample. In addition, our hospital did not have standardized practices for monitoring or managing OSA patients during the study period, which makes systematic early recognition of clinical deterioration among the OSA population in our study less likely.
Alternatively, there may be a true physiologic phenomenon providing a short‐term mortality benefit in those with OSA. It has been observed that patients with obesity (but without severe obesity) often have better outcomes after acute illness, whether by earlier or more frequent contact with medical care or heightened levels of metabolic reserve.[21, 22] However, our findings of decreased mortality for OSA patients remained even after controlling for BMI. An additional important possibility to consider is ischemic preconditioning, a well‐described phenomenon in which episodes of sublethal ischemia confer protection on tissues from subsequent ischemia/reperfusion damage.[23] Ischemic preconditioning has been demonstrated in models of cardiac and neural tissue[24, 25, 26] and has been shown to enhance stem cell survival by providing resistance to necrosis and lending functional benefits to heart, brain, and kidney models after transplantation.[25, 26, 27, 28, 29, 30, 31] The fundamentals of this concept may have applications in transplant and cardiac surgery,[32, 33] in the management of acute coronary syndromes and stroke,[32, 34, 35] and in athletic training and performance.[35, 36] Although OSA has been associated with long‐term cardiovascular morbidity and mortality,[2, 3, 4, 5, 6] the intermittent hypoxemia OSA patients experience could actually improve their ability to survive clinical deterioration in the short‐term (ie, during a hospitalization).
Limitations of our study include its conduction at a single center, which may prevent generalization to populations different than ours. Furthermore, during the study period, our hospital did not have formal guidelines or standardized management or monitoring practices for patients with OSA. Additionally, practices for managing OSA may vary across institutions. Therefore, our results may not be generalizable to hospitals with such protocols in place. However, as mentioned above, similar findings have been noted in studies using large, nationally representative administrative databases. In addition, we identified OSA via ICD‐9‐CM codes, which are likely insensitive for estimating the true prevalence of OSA in our sample. Despite this, our reported OSA prevalence of over 10% falls within the prevalence range reported in large epidemiological studies.[37, 38, 39] Finally, we did not have data on polysomnograms or treatment received for patients with OSA, so we do not know the severity of OSA or adequacy of treatment for these patients.
Notwithstanding our limitations, our study has several strengths. First, we included a large number of hospitalized patients across a diverse range of medical and surgical ward admissions, which increases the generalizability of our results. We also addressed potential confounders by including a large number of comorbidities and controlling for severity of presenting physiology with the CART score. The CART score, which contains physiologic variables such as respiratory rate, heart rate, and diastolic blood pressure, is an accurate predictor of cardiac arrest, ICU transfer, and in‐hospital mortality in our population.[40] Finally, we were able to obtain information about these diagnoses from outpatient as well as inpatient data.
In conclusion, we found that after adjustment for important confounders, OSA was associated with a decrease in hospital mortality and cardiac arrest but not with other adverse events on the wards. These results may suggest a protective benefit from OSA with regard to mortality, an advantage that could be explained by ischemic preconditioning or a higher level of care or vigilance not reflected by the number of RRT activations or ICU transfers experienced by these patients. Further research is needed to confirm these findings across other populations, to investigate the physiologic pathways by which OSA may produce these effects, and to examine the mechanisms by which treatment of OSA could influence these outcomes.
Acknowledgements
The authors thank Nicole Babuskow for administrative support, as well as Brian Furner and Timothy Holper for assistance with data acquisition.
Disclosures: Study concept and design: P.L., D.P.E, B.M., M.C.; acquisition of data: P.L.; analysis and interpretation of data: all authors; first drafting of the manuscript: P.L.; critical revision of the manuscript for important intellectual content: all authors; statistical analysis: P.L., F.Z., M.C.; obtained funding: D.P.E., M.C.; administrative, technical, and material support: F.Z., D.P.E.; study supervision: D.P.E, B.M., M.C.; data access and responsibility: P.L. and M.C. had full access to all the data in the study, and take responsibility for the integrity of the data and the accuracy of the data analysis. Drs. Churpek and Edelson have a patent pending (ARCD. P0535US.P2) for risk stratification algorithms for hospitalized patients. Dr. Churpek and Dr. Edelson are both supported by career development awards from the National Heart, Lung, and Blood Institute (K08 HL121080 and K23 HL097157, respectively). Dr. Churpek has received honoraria from Chest for invited speaking engagements. In addition, Dr. Edelson has received research support and honoraria from Philips Healthcare (Andover, MA), research support from the American Heart Association (Dallas, TX) and Laerdal Medical (Stavanger, Norway), and an honorarium from Early Sense (Tel Aviv, Israel). She has ownership interest in Quant HC (Chicago, IL), which is developing products for risk stratification of hospitalized patients. Dr. Mokhlesi is supported by National Institutes of Health grant R01HL119161. Dr. Mokhlesi has served as a consultant to Philips/Respironics and has received research support from Philips/Respironics.
- , , , , , . Increased prevalence of sleep‐disordered breathing in adults. Am J Epidemiol. 2013;177(9):1006–1014.
- , , , . Long‐term cardiovascular outcomes in men with obstructive sleep apnoea‐hypopnoea with or without treatment with continuous positive airway pressure: an observational study. Lancet. 2005;365(9464):1046–1053.
- , , , . Prospective study of the association between sleep‐disordered breathing and hypertension. N Engl J Med. 2000;342(19):1378–1384.
- , , , , , . Obstructive sleep apnea as a risk factor for stroke and death. N Engl J Med. 2005;353(19):2034–2041.
- , , , , . Obstructive sleep apnea and risk of cardiovascular events and all‐cause mortality: a decade‐long historical cohort study. PLoS Med. 2014;11(2):e1001599.
- , , , , , . Sleep apnea as an independent risk factor for all‐cause mortality: the Busselton Health Study. Sleep. 2008;31(8):1079–1085.
- , , , , . Postoperative complications in patients with obstructive sleep apnea. Chest. 2012;141(2):436–441.
- , , , , , . Meta‐analysis of the association between obstructive sleep apnoea and postoperative outcome. Br J Anaesth. 2012;109(6):897–906.
- , , , et al. The impact of sleep apnea on postoperative utilization of resources and adverse outcomes. Anesth Analg. 2014;118(2):407–418.
- , , , , , . Sleep‐disordered breathing and postoperative outcomes after bariatric surgery: analysis of the nationwide inpatient sample. Obes Surg. 2013;23(11):1842–1851.
- , , , , , . Sleep‐disordered breathing and postoperative outcomes after elective surgery: analysis of the nationwide inpatient sample. Chest. 2013;144:903–914.
- , , , , , . Prevalence, treatment and outcomes associated with obstructive sleep apnea among patients hospitalized with pneumonia. Chest. 2014;145(5):1032–1038.
- , , , et al. Experimental pain and opioid analgesia in volunteers at high risk for obstructive sleep apnea. PLoS One. 2013;8(1):e54807.
- , , , , . Increased CSF opioid activity in sleep apnea syndrome. Regression after successful treatment. Chest. 1989;96(2):250–254.
- , , , et al. Comparison of the relaxant effects of diazepam, flunitrazepam and midazolam on airway smooth muscle. Br J Anaesth. 1992;69(1):65–69.
- , . Effect of flurazepam on sleep‐disordered breathing and nocturnal oxygen desaturation in asymptomatic subjects. Am J Med. 1982;73(2):239–243.
- , , , , , . Derivation of a cardiac arrest prediction model using ward vital signs*. Crit Care Med. 2012;40(7):2102–2108.
- , , , , . Using electronic health record data to develop and validate a prediction model for adverse outcomes in the wards*. Crit Care Med. 2014;42(4):841–848.
- , , , et al. The APACHE III prognostic system. Risk prediction of hospital mortality for critically ill hospitalized adults. Chest. 1991;100(6):1619–1636.
- , , , , , . Predicting cardiac arrest on the wards: a nested case‐control study. Chest. 2012;141(5):1170–1176.
- , , , , , . Mortality of patients with respiratory insufficiency and adult respiratory distress syndrome after surgery: the obesity paradox. J Intensive Care Med. 2012;27(4):306–311.
- , , , et al. Body mass index and mortality in acute myocardial infarction patients. Am J Med. 2012(8);125:796–803.
- , , . Preconditioning with ischemia: a delay of lethal cell injury in ischemic myocardium. Circulation. 1986;74(5):1124–1136.
- , , , . Ischemic preconditioning slows energy metabolism and delays ultrastructural damage during a sustained ischemic episode. Circ Res. 1990;66(4):913–931.
- , , , et al. Transplantation of hypoxia‐preconditioned mesenchymal stem cells improves infarcted heart function via enhanced survival of implanted cells and angiogenesis. J Thorac Cardiovasc Surg. 2008;135(4):799–808.
- , , , et al. Hypoxic preconditioning with cobalt of bone marrow mesenchymal stem cells improves cell migration and enhances therapy for treatment of ischemic acute kidney injury. PLoS One. 2013;8(5):e62703.
- , . Human embryonic stem cell neural differentiation and enhanced cell survival promoted by hypoxic preconditioning. Cell Death Dis. 2010;1:e22.
- , , , et al. Ischemic pre‐conditioning enhances the mobilization and recruitment of bone marrow stem cells to protect against ischemia/reperfusion injury in the late phase. J Am Coll Cardiol. 2009;53(19):1814–1822.
- , , , et al. Hypoxic preconditioning enhances bone marrow mesenchymal stem cell migration via Kv2.1 channel and FAK activation. Am J Physiol Cell Physiol. 2011;301(2):C362–C372.
- , , , et al. In vitro hypoxic preconditioning of embryonic stem cells as a strategy of promoting cell survival and functional benefits after transplantation into the ischemic rat brain. Exp Neurol. 2008;210(2):656–670.
- , , , , . Transplantation of hypoxia preconditioned bone marrow mesenchymal stem cells enhances angiogenesis and neurogenesis after cerebral ischemia in rats. Neurobiol Dis. 2012;46(3):635–645.
- , , . Translation of remote ischaemic preconditioning into clinical practice. Lancet. 2009;374(9700):1557–1565.
- , , . Novel adjunctive treatments of myocardial infarction. World J Cardiol. 2014;6(6):434–443.
- , . Hypoxic‐preconditioning enhances the regenerative capacity of neural stem/progenitors in subventricular zone of newborn piglet brain. Stem Cell Res. 2013;11(2):669–686.
- , , , , . Ischemic preconditioning improves oxygen saturation and attenuates hypoxic pulmonary vasoconstriction at high altitude. High Alt Med Biol. 2014;15(2):155–161.
- , , , et al. Remote preconditioning improves maximal performance in highly trained athletes. Med Sci Sports Exerc. 2011;43(7):1280–1286.
- , , , . Obstructive sleep apnea‐hypopnea and related clinical features in a population‐based sample of subjects aged 30 to 70 yr. Am J Respir Crit Care Med. 2001;163(3 pt 1):685–689.
- , , , , , . The occurrence of sleep‐disordered breathing among middle‐aged adults. N Engl J Med. 1993;328(17):1230–1235.
- , , . Epidemiology of obstructive sleep apnea: a population health perspective. Am J Respir Crit Care Med. 2002;165(9):1217–1239.
- , , . Risk stratification of hospitalized patients on the wards. Chest. 2013;143(6):1758–1765.
Obstructive sleep apnea (OSA) is an increasingly prevalent condition characterized by intermittent airway obstruction during sleep, which leads to hypoxemia, hypercapnia, and fragmented sleep. The current prevalence estimates of moderate to severe OSA (apnea‐hypopnea index 15, measured as events/hour) in middle‐aged adults are approximately 13% in men and 6% in women.[1] OSA is a well‐described independent risk factor for long‐term neurocognitive, cardiovascular, and cerebrovascular morbidity and mortality.[2, 3, 4, 5, 6]
Recent studies have also identified OSA as an independent risk factor for adverse perioperative outcomes, including endotracheal intubation, intensive care unit (ICU) transfer, and increased length of stay.[7, 8, 9, 10, 11] Paradoxically, despite an increase in the risk of complications, several of these studies did not find an association between in‐hospital death and OSA even after controlling for potential confounders.[9, 10, 11] Furthermore, a recent study of patients hospitalized for pneumonia reported increased rates of clinical deterioration and mechanical ventilation, but also lower odds of inpatient mortality in patients with OSA.[12]
These studies may have been limited by the absence of physiologic data, which prevented controlling for severity of illness. It is also unclear whether these previously described associations between OSA and adverse clinical outcomes hold true for general hospital inpatients. OSA may be worsened by medications frequently used in hospitals, such as narcotics and benzodiazepines. Opiate use contributes to both central and obstructive sleep apneas,[13, 14] and benzodiazepines are known to produce airway smooth muscle relaxation and can cause respiratory depression.[15] In fact, the use of benzodiazepines has been implicated in the unmasking of OSA in patients with previously undiagnosed sleep‐disordered breathing.[16] These findings suggest mechanisms by which OSA could contribute to an increased risk in hospital ward patients for rapid response team (RRT) activation, ICU transfer, cardiac arrest, and in‐hospital death.
The aim of this study was to determine the independent association between OSA and in‐hospital mortality in ward patients. We also aimed to investigate the association of OSA with clinical deterioration on the wards, while controlling for patient characteristics, initial physiology, and severity of illness.
MATERIALS AND METHODS
Setting and Study Population
This observational cohort study was performed at an academic tertiary care medical center with approximately 500 beds. Data were obtained from all adult patients hospitalized on the wards between November 1, 2008 and October 1, 2013. Our hospital has utilized an RRT, led by a critical care nurse and respiratory therapist with hospitalist and pharmacist consultation available upon request, since 2008. This team is separate from the team that responds to a cardiac arrest. Criteria for RRT activation include tachypnea, tachycardia, hypotension, and staff worry, but specific vital sign thresholds are not specified.
The study analyzed deidentified data from the hospital's Clinical Research Data Warehouse, which is maintained by the Center for Research Informatics at The University of Chicago. The study protocol was approved by the University of Chicago Institutional Review Board (IRB #16995A).
Data Collection
Patient age, sex, race, body mass index (BMI), and location prior to ward admission (ie, whether they were admitted from the emergency department, transferred from the ICU, or directly admitted from clinic or home) were collected. Patients who underwent surgery during their admission were identified using the hospital's admission‐transfer‐discharge database. In addition, routinely collected vital signs (eg, respiratory rate, blood pressure, heart rate) were obtained from the electronic health record (Epic, Verona, WI). To determine severity of illness, the first set of vital signs measured on hospital presentation were utilized to calculate the cardiac arrest risk triage (CART) score, a vital‐signbased early warning score we previously developed and validated for predicting adverse events in our population.[17] The CART score ranges from 0 to 57, with points assigned for abnormalities in respiratory rate, heart rate, diastolic blood pressure, and age. If any vital sign was missing, the next available measurement was pulled into the set. If any vital sign remained missing after this change, the median value for that particular location (ie, wards, ICU, or emergency department) was imputed as previously described.[18, 19]
Patients with OSA were identified by the following International Classification of Diseases, Ninth Revision, Clinical Modification (ICD‐9‐CM) codes using inpatient and outpatient medical records: 278.03, 327.20, 327.23, 327.29, 780.51, 780.53, and 780.57 (Table 1). Data on other patient comorbidities, including coronary artery disease, congestive heart failure, arrhythmias, uncomplicated and complicated diabetes mellitus, hypertension, and cerebrovascular disease were collected using specific ICD‐9‐CM codes from both inpatient and outpatient records. Information on insurance payer was also collected from the hospital's billing database. Insurance payers were grouped into the following categories: private payer, Medicare/Medicaid, and no insurance. Patients with both public and private payers were counted as being privately insured.
| Diagnosis Code | Description | % of Sleep Apnea Diagnosesa |
|---|---|---|
| ||
| 327.23 | Obstructive sleep apnea | 65.6 |
| 780.57 | Unspecified sleep apnea | 19.4 |
| 780.53 | Hypersomnia with sleep apnea, unspecified | 11.7 |
| 780.51 | Insomnia with sleep apnea, unspecified | 1.5 |
| 327.2 | Organic sleep apnea, unspecified | 0.2 |
| 278.03 | Obesity hypoventilation syndrome | 1.7 |
Outcomes
The primary outcome of the study was in‐hospital mortality. Secondary outcomes included length of stay, RRT activation, transfer to the ICU, endotracheal intubation, cardiac arrest (defined as a loss of pulse with attempted resuscitation) on the wards, and a composite outcome of RRT activation, ICU transfer, and death. Because cardiac arrests on the wards result either in death or ICU transfer following successful resuscitation, this variable was omitted from the composite outcome. Cardiac arrests were identified using a prospectively validated quality improvement database that has been described previously.[20] ICU transfer was identified using the hospital's admission‐transfer‐discharge database. Only the index cardiac arrest, intubation, RRT, or ICU transfer for each admission was used in the study, but more than 1 type of outcome could occur for each patient (eg, a patient who died following an unsuccessful resuscitation attempt would count as both a cardiac arrest and a death).
Statistical Analysis
Patient characteristics were compared using Student t tests, Wilcoxon rank sum tests, and 2 statistics, as appropriate. Unadjusted logistic regression models were fit to estimate the change in odds of each adverse event and a composite outcome of any event for patient admissions with OSA compared to those without OSA. Adjusted logistic regression models were then fit for each outcome to control for patient characteristics (age, sex, BMI, insurance status, and individual comorbidities), location immediately prior to ward admission, and admission severity of illness (as measured by CART score). In the adjusted model, CART score, age, and number of comorbidities were entered linearly, with the addition of squared terms for age and CART score, as these variables showed nonlinear associations with the outcomes of interest. Race, surgical status, insurance payer, location prior to ward, and BMI (underweight, <18.5 kg/m2; normal weight, 18.524.9 kg/m2; overweight, 25.029.9 kg/m2; obese, 3039.9 kg/m2; and severely obese, (40 kg/m2) were modeled as categorical variables.
Given that an individual patient could experience multiple hospitalizations during the study period, we performed a sensitivity analysis of all adjusted and unadjusted models using a single randomly selected hospitalization for each unique patient. In addition, we performed a sensitivity analysis of all patients who were not admitted to the ICU prior to their ward stay. Finally, we performed subgroup analyses of all unadjusted and adjusted models for each BMI category and surgical status.
All tests of significance used a 2‐sided P value <0.05. Statistical analyses were completed using Stata version 12.0 (StataCorp, College Station, TX).
RESULTS
Patient Characteristics
During the study period, 93,676 patient admissions from 53,150 unique patients resulted in the occurrence of 1,069 RRT activations, 6,305 ICU transfers, and 1,239 in‐hospital deaths. Within our sample, 40,034 patients had at least 1 inpatient record and at least 1 outpatient record. OSA diagnosis was present in 5,625 patients (10.6% of the total sample), with 4,748 patients having an OSA diagnosis code entered during a hospitalization, 2,143 with an OSA diagnosis code entered during an outpatient encounter, and 877 with both inpatient and outpatient diagnosis codes. These patients identified as having OSA contributed 12,745 (13.6%) hospital admissions.
Patients with an OSA diagnosis were more likely to be older (median age 59 years [interquartile range 4968] vs 55 years [3868]), male (49% vs 42%), overweight or obese (88% vs 62%), and more likely to carry diagnoses of diabetes (53.8% vs 25.5%), hypertension (45.3% vs 18.2%), arrhythmias (44.4% vs 26.7%), coronary artery disease (46.8% vs 23.5%), heart failure (35.8% vs 13.5%), and cerebrovascular disease (13.5% vs 8.1%) than patients without an OSA diagnosis (all comparisons significant, P < 0.001) (Table 2).
| Characteristic | Patient Admissions With OSA Diagnoses, n = 12,745 | Patient Admissions Without OSA Diagnoses, n = 80,931 | P Value |
|---|---|---|---|
| |||
| Age, y, median (IQR) | 59 (4968) | 55 (3868) | <0.001 |
| Female, n (%) | 6,514 (51%) | 47,202 (58%) | <0.001 |
| Race, n (%) | <0.001 | ||
| White | 4,205 (33%) | 30,119 (37%) | |
| Black/African American | 7,024 (55%) | 38,561 (48%) | |
| Asian | 561 (4.4%) | 3,419 (4.2%) | |
| American Indian or Native Alaskan | 20 (0.2%) | 113 (0.1%) | |
| More than 1 race | 127 (1%) | 843 (1%) | |
| Race unknown | 808 (6%) | 7,876 (10%) | |
| Insurance status, n (%) | <0.001 | ||
| Private | 4,484 (35%) | 32,467 (40%) | |
| Medicare/Medicaid | 8,201 (64%) | 42,208 (58%) | |
| Uninsured | 53 (0.4%) | 1,190 (1%) | |
| Unknown | 4 (<0.1%) | 16 (<0.1%) | |
| Location prior to wards, n (%) | <0.001 | ||
| ICU | 1,400 (11%) | 8,065 (10%) | |
| Emergency department | 4,633 (36%) | 25,170 (31%) | |
| Ambulatory admission | 6,712 (53%) | 47,696 (59%) | |
| Body mass index, kg/m2, n (%) | <0.001 | ||
| Normal (18.525) | 1,431 (11%) | 26,560 (33%) | |
| Underweight (<18.5) | 122 (1%) | 4,256 (5%) | |
| Overweight (2530) | 2,484 (20%) | 23,761 (29%) | |
| Obese (3040) | 4,959 (39%) | 19,132 (24%) | |
| Severely obese (40) | 3,745 (29%) | 7,171 (9%) | |
| Initial cardiac arrest risk triage score, median (IQR) | 4 (09) | 4 (09) | <0.001 |
| Underwent surgery, n (%) | 4,482 (35%) | 28,843 (36%) | 0.3 |
| Comorbidities | |||
| Number of comorbidities, median (IQR) | 2 (14) | 1 (02) | <0.001 |
| Arrhythmia | 5,659 (44%) | 21,581 (27%) | <0.001 |
| Diabetes mellitus | 6,855 (54%) | 20,641 (26%) | <0.001 |
| Hypertension | 5,777 (45%) | 14,728 (18%) | <0.001 |
| Coronary artery disease | 5,958 (47%) | 18,979 (23%) | <0.001 |
| Cerebrovascular accident | 1,725 (14%) | 6,556 (8%) | <0.001 |
| Congestive heart failure | 4,559 (36%) | 10,919 (13%) | <0.001 |
Complications and Adverse Outcomes
In the unadjusted analyses, the overall incidence of adverse outcomes was higher among patient admissions with a diagnosis of OSA compared to those without OSA (Table 3). Those with OSA were more likely to experience RRT activation (1.5% vs 1.1%), ICU transfer (8% vs 7%), and endotracheal intubation (3.9% vs 2.9%) than those without OSA diagnoses (P < 0.001 for all comparisons). There was no significant difference in the incidence of cardiac arrest between the 2 groups, nor was there a significant difference in length of stay. Unadjusted inpatient mortality for OSA patient admissions was lower than that for non‐OSA hospitalizations (1.1% vs 1.4%, P < 0.05). A diagnosis of OSA was associated with increased unadjusted odds for RRT activation (odds ratio [OR]: 1.36 [1.16‐1.59]) and ICU transfer (OR: 1.28 [1.20‐1.38]). However, after controlling for confounders, OSA was not associated with increased odds for RRT activation (OR: 1.14 [0.95‐1.36]) or intubation (OR: 1.06 [0.94‐1.19]), and was associated with slightly decreased odds for ICU transfer (OR: 0.91 [0.84‐0.99]) (Figure 1). Those with OSA had decreased adjusted odds of cardiac arrest (OR: 0.72 [0.55‐0.95]) compared to those without OSA. OSA was also associated with decreased odds of in‐hospital mortality before (OR: 0.83 [0.70‐0.99]) and after (OR: 0.70 [0.58‐0.85]) controlling for confounders.
| Characteristic | Patient Admissions With OSA Diagnoses, n = 12,745 | Patient Admissions Without OSA Diagnoses, n = 80,931 | P Value |
|---|---|---|---|
| |||
| Outcomes, n (%) | |||
| Composite outcomea | 1,137 (9%) | 5,792 (7%) | <0.001 |
| In‐hospital death | 144 (1.1%) | 1,095 (1.4%) | 0.04 |
| Rapid response team call | 188 (1.5%) | 881 (1.1%) | <0.001 |
| ICU transfer | 1,045 (8%) | 5,260 (7%) | <0.001 |
| Cardiac arrest | 413 (0.5%) | 73 (0.6%) | 0.36 |
Sensitivity Analyses
The sensitivity analysis involving 1 randomly selected hospitalization per patient included a total of 53,150 patients. The results were similar to the main analysis, with adjusted odds of 1.01 (0.77‐1.32) for RRT activation, 0.86 (0.76‐0.96) for ICU transfer, and 0.69 (0.53‐0.89) for inpatient mortality. An additional sensitivity analysis included only patients who were not admitted to the ICU prior to their ward stay. This analysis included 84,211 hospitalizations and demonstrated similar findings, with adjusted odds of 0.70 for in‐hospital mortality (0.57‐0.87). Adjusted odds for RRT activation (OR: 1.12 [0.92‐1.37]) and ICU transfer (OR: 0.88 [0.81‐0.96] were also similar to the results of our main analysis.
Subgroup Analyses
Surgical and Nonsurgical Patients
Subgroup analyses of surgical versus nonsurgical patients (Figure 2) revealed similarly decreased adjusted odds of in‐hospital death for OSA patients in both groups (surgical OR: 0.69 [0.49‐0.97]; nonsurgical OR: 0.72 [0.58‐0.91]). Surgical patients with OSA diagnoses had decreased adjusted odds for ICU transfer (surgical OR: 0.82 [0.73‐0.92], but this finding was not seen in nonsurgical patients (OR: 1.03 [0.92‐1.15]).
Patients Stratified by BMI
Examination across BMI categories (Figure 2) showed a significant decrease in adjusted odds of death for OSA patients with BMI 30 to 40 kg/m2 (OR: 0.60 [0.43‐0.84]). A nonsignificant decrease in adjusted odds of death was seen for OSA patients in all other groups. Adjusted odds ratios for the risk of RRT activation and ICU transfer in OSA patients within the different BMI categories were not statistically significant.
DISCUSSION
In this large observational single‐center cohort study, we found that OSA was associated with increased odds of adverse events, such as ICU transfers and RRT calls, but this risk was no longer present after adjusting for demographics, comorbidities, and presenting vital signs. Interestingly, we also found that patients with OSA had decreased adjusted odds for cardiac arrest and mortality. This mortality finding was robust to multiple sensitivity analyses and subgroup analyses. These results have significant implications for our understanding of the short‐term risks of sleep‐disordered breathing in hospitalized patients, and suggest the possibility that OSA is associated with a protective effect with regard to inpatient mortality.
Our findings are in line with other recent work in this area. In 2 large observational cohorts of surgical populations drawn from the nationally representative Nationwide Inpatient Sample administrative database, our group reported decreased odds of in‐hospital postoperative mortality in OSA patients.[10, 11] Using the same Nationwide Inpatient Sample, Lindenauer et al. showed that among inpatients hospitalized with pneumonia, OSA diagnosis was associated with increased rates of clinical deterioration but lower rates of inpatient mortality.[12] Although these 3 studies have identified decreased inpatient mortality among certain surgical populations and patients hospitalized with pneumonia, they are limited by using administrative databases that do not provide specific data on vital signs, presenting physiology, BMI, or race. Another important limitation of the Nationwide Inpatient Sample is the lack of any information on RRT activations and ICU transfers. Moreover, the database does not include information on outpatient diagnoses, which may have led to a significantly lower prevalence of OSA than expected in these studies. Despite the important methodological differences, our study corroborates this finding among a diverse cohort of hospitalized patients. Unlike these previous studies of postoperative patients or those hospitalized with pneumonia, we did not find an increased risk of adverse events associated with OSA after controlling for potential confounders.
The decreased mortality seen in OSA patients could be explained by these patients receiving more vigilant care, showing earlier signs of deterioration, or displaying more easily treatable forms of distress than patients without OSA. For example, earlier identification of deterioration could lead to earlier interventions, which could decrease inpatient mortality. In 2 studies of postsurgical patients,[10, 11] those with OSA diagnosis who developed respiratory failure were intubated earlier and received mechanical ventilation for a shorter period of time, suggesting that the cause of respiratory failure was rapidly reversible (eg, upper airway complications due to oversedation or excessive analgesia). However, we did not find increased adjusted odds of RRT activation or ICU transfer for OSA patients in our study, and so it is less likely that earlier recognition of decompensation occurred in our sample. In addition, our hospital did not have standardized practices for monitoring or managing OSA patients during the study period, which makes systematic early recognition of clinical deterioration among the OSA population in our study less likely.
Alternatively, there may be a true physiologic phenomenon providing a short‐term mortality benefit in those with OSA. It has been observed that patients with obesity (but without severe obesity) often have better outcomes after acute illness, whether by earlier or more frequent contact with medical care or heightened levels of metabolic reserve.[21, 22] However, our findings of decreased mortality for OSA patients remained even after controlling for BMI. An additional important possibility to consider is ischemic preconditioning, a well‐described phenomenon in which episodes of sublethal ischemia confer protection on tissues from subsequent ischemia/reperfusion damage.[23] Ischemic preconditioning has been demonstrated in models of cardiac and neural tissue[24, 25, 26] and has been shown to enhance stem cell survival by providing resistance to necrosis and lending functional benefits to heart, brain, and kidney models after transplantation.[25, 26, 27, 28, 29, 30, 31] The fundamentals of this concept may have applications in transplant and cardiac surgery,[32, 33] in the management of acute coronary syndromes and stroke,[32, 34, 35] and in athletic training and performance.[35, 36] Although OSA has been associated with long‐term cardiovascular morbidity and mortality,[2, 3, 4, 5, 6] the intermittent hypoxemia OSA patients experience could actually improve their ability to survive clinical deterioration in the short‐term (ie, during a hospitalization).
Limitations of our study include its conduction at a single center, which may prevent generalization to populations different than ours. Furthermore, during the study period, our hospital did not have formal guidelines or standardized management or monitoring practices for patients with OSA. Additionally, practices for managing OSA may vary across institutions. Therefore, our results may not be generalizable to hospitals with such protocols in place. However, as mentioned above, similar findings have been noted in studies using large, nationally representative administrative databases. In addition, we identified OSA via ICD‐9‐CM codes, which are likely insensitive for estimating the true prevalence of OSA in our sample. Despite this, our reported OSA prevalence of over 10% falls within the prevalence range reported in large epidemiological studies.[37, 38, 39] Finally, we did not have data on polysomnograms or treatment received for patients with OSA, so we do not know the severity of OSA or adequacy of treatment for these patients.
Notwithstanding our limitations, our study has several strengths. First, we included a large number of hospitalized patients across a diverse range of medical and surgical ward admissions, which increases the generalizability of our results. We also addressed potential confounders by including a large number of comorbidities and controlling for severity of presenting physiology with the CART score. The CART score, which contains physiologic variables such as respiratory rate, heart rate, and diastolic blood pressure, is an accurate predictor of cardiac arrest, ICU transfer, and in‐hospital mortality in our population.[40] Finally, we were able to obtain information about these diagnoses from outpatient as well as inpatient data.
In conclusion, we found that after adjustment for important confounders, OSA was associated with a decrease in hospital mortality and cardiac arrest but not with other adverse events on the wards. These results may suggest a protective benefit from OSA with regard to mortality, an advantage that could be explained by ischemic preconditioning or a higher level of care or vigilance not reflected by the number of RRT activations or ICU transfers experienced by these patients. Further research is needed to confirm these findings across other populations, to investigate the physiologic pathways by which OSA may produce these effects, and to examine the mechanisms by which treatment of OSA could influence these outcomes.
Acknowledgements
The authors thank Nicole Babuskow for administrative support, as well as Brian Furner and Timothy Holper for assistance with data acquisition.
Disclosures: Study concept and design: P.L., D.P.E, B.M., M.C.; acquisition of data: P.L.; analysis and interpretation of data: all authors; first drafting of the manuscript: P.L.; critical revision of the manuscript for important intellectual content: all authors; statistical analysis: P.L., F.Z., M.C.; obtained funding: D.P.E., M.C.; administrative, technical, and material support: F.Z., D.P.E.; study supervision: D.P.E, B.M., M.C.; data access and responsibility: P.L. and M.C. had full access to all the data in the study, and take responsibility for the integrity of the data and the accuracy of the data analysis. Drs. Churpek and Edelson have a patent pending (ARCD. P0535US.P2) for risk stratification algorithms for hospitalized patients. Dr. Churpek and Dr. Edelson are both supported by career development awards from the National Heart, Lung, and Blood Institute (K08 HL121080 and K23 HL097157, respectively). Dr. Churpek has received honoraria from Chest for invited speaking engagements. In addition, Dr. Edelson has received research support and honoraria from Philips Healthcare (Andover, MA), research support from the American Heart Association (Dallas, TX) and Laerdal Medical (Stavanger, Norway), and an honorarium from Early Sense (Tel Aviv, Israel). She has ownership interest in Quant HC (Chicago, IL), which is developing products for risk stratification of hospitalized patients. Dr. Mokhlesi is supported by National Institutes of Health grant R01HL119161. Dr. Mokhlesi has served as a consultant to Philips/Respironics and has received research support from Philips/Respironics.
- , , , , , . Increased prevalence of sleep‐disordered breathing in adults. Am J Epidemiol. 2013;177(9):1006–1014.
- , , , . Long‐term cardiovascular outcomes in men with obstructive sleep apnoea‐hypopnoea with or without treatment with continuous positive airway pressure: an observational study. Lancet. 2005;365(9464):1046–1053.
- , , , . Prospective study of the association between sleep‐disordered breathing and hypertension. N Engl J Med. 2000;342(19):1378–1384.
- , , , , , . Obstructive sleep apnea as a risk factor for stroke and death. N Engl J Med. 2005;353(19):2034–2041.
- , , , , . Obstructive sleep apnea and risk of cardiovascular events and all‐cause mortality: a decade‐long historical cohort study. PLoS Med. 2014;11(2):e1001599.
- , , , , , . Sleep apnea as an independent risk factor for all‐cause mortality: the Busselton Health Study. Sleep. 2008;31(8):1079–1085.
- , , , , . Postoperative complications in patients with obstructive sleep apnea. Chest. 2012;141(2):436–441.
- , , , , , . Meta‐analysis of the association between obstructive sleep apnoea and postoperative outcome. Br J Anaesth. 2012;109(6):897–906.
- , , , et al. The impact of sleep apnea on postoperative utilization of resources and adverse outcomes. Anesth Analg. 2014;118(2):407–418.
- , , , , , . Sleep‐disordered breathing and postoperative outcomes after bariatric surgery: analysis of the nationwide inpatient sample. Obes Surg. 2013;23(11):1842–1851.
- , , , , , . Sleep‐disordered breathing and postoperative outcomes after elective surgery: analysis of the nationwide inpatient sample. Chest. 2013;144:903–914.
- , , , , , . Prevalence, treatment and outcomes associated with obstructive sleep apnea among patients hospitalized with pneumonia. Chest. 2014;145(5):1032–1038.
- , , , et al. Experimental pain and opioid analgesia in volunteers at high risk for obstructive sleep apnea. PLoS One. 2013;8(1):e54807.
- , , , , . Increased CSF opioid activity in sleep apnea syndrome. Regression after successful treatment. Chest. 1989;96(2):250–254.
- , , , et al. Comparison of the relaxant effects of diazepam, flunitrazepam and midazolam on airway smooth muscle. Br J Anaesth. 1992;69(1):65–69.
- , . Effect of flurazepam on sleep‐disordered breathing and nocturnal oxygen desaturation in asymptomatic subjects. Am J Med. 1982;73(2):239–243.
- , , , , , . Derivation of a cardiac arrest prediction model using ward vital signs*. Crit Care Med. 2012;40(7):2102–2108.
- , , , , . Using electronic health record data to develop and validate a prediction model for adverse outcomes in the wards*. Crit Care Med. 2014;42(4):841–848.
- , , , et al. The APACHE III prognostic system. Risk prediction of hospital mortality for critically ill hospitalized adults. Chest. 1991;100(6):1619–1636.
- , , , , , . Predicting cardiac arrest on the wards: a nested case‐control study. Chest. 2012;141(5):1170–1176.
- , , , , , . Mortality of patients with respiratory insufficiency and adult respiratory distress syndrome after surgery: the obesity paradox. J Intensive Care Med. 2012;27(4):306–311.
- , , , et al. Body mass index and mortality in acute myocardial infarction patients. Am J Med. 2012(8);125:796–803.
- , , . Preconditioning with ischemia: a delay of lethal cell injury in ischemic myocardium. Circulation. 1986;74(5):1124–1136.
- , , , . Ischemic preconditioning slows energy metabolism and delays ultrastructural damage during a sustained ischemic episode. Circ Res. 1990;66(4):913–931.
- , , , et al. Transplantation of hypoxia‐preconditioned mesenchymal stem cells improves infarcted heart function via enhanced survival of implanted cells and angiogenesis. J Thorac Cardiovasc Surg. 2008;135(4):799–808.
- , , , et al. Hypoxic preconditioning with cobalt of bone marrow mesenchymal stem cells improves cell migration and enhances therapy for treatment of ischemic acute kidney injury. PLoS One. 2013;8(5):e62703.
- , . Human embryonic stem cell neural differentiation and enhanced cell survival promoted by hypoxic preconditioning. Cell Death Dis. 2010;1:e22.
- , , , et al. Ischemic pre‐conditioning enhances the mobilization and recruitment of bone marrow stem cells to protect against ischemia/reperfusion injury in the late phase. J Am Coll Cardiol. 2009;53(19):1814–1822.
- , , , et al. Hypoxic preconditioning enhances bone marrow mesenchymal stem cell migration via Kv2.1 channel and FAK activation. Am J Physiol Cell Physiol. 2011;301(2):C362–C372.
- , , , et al. In vitro hypoxic preconditioning of embryonic stem cells as a strategy of promoting cell survival and functional benefits after transplantation into the ischemic rat brain. Exp Neurol. 2008;210(2):656–670.
- , , , , . Transplantation of hypoxia preconditioned bone marrow mesenchymal stem cells enhances angiogenesis and neurogenesis after cerebral ischemia in rats. Neurobiol Dis. 2012;46(3):635–645.
- , , . Translation of remote ischaemic preconditioning into clinical practice. Lancet. 2009;374(9700):1557–1565.
- , , . Novel adjunctive treatments of myocardial infarction. World J Cardiol. 2014;6(6):434–443.
- , . Hypoxic‐preconditioning enhances the regenerative capacity of neural stem/progenitors in subventricular zone of newborn piglet brain. Stem Cell Res. 2013;11(2):669–686.
- , , , , . Ischemic preconditioning improves oxygen saturation and attenuates hypoxic pulmonary vasoconstriction at high altitude. High Alt Med Biol. 2014;15(2):155–161.
- , , , et al. Remote preconditioning improves maximal performance in highly trained athletes. Med Sci Sports Exerc. 2011;43(7):1280–1286.
- , , , . Obstructive sleep apnea‐hypopnea and related clinical features in a population‐based sample of subjects aged 30 to 70 yr. Am J Respir Crit Care Med. 2001;163(3 pt 1):685–689.
- , , , , , . The occurrence of sleep‐disordered breathing among middle‐aged adults. N Engl J Med. 1993;328(17):1230–1235.
- , , . Epidemiology of obstructive sleep apnea: a population health perspective. Am J Respir Crit Care Med. 2002;165(9):1217–1239.
- , , . Risk stratification of hospitalized patients on the wards. Chest. 2013;143(6):1758–1765.
© 2015 Society of Hospital Medicine

Should we routinely screen for hypercapnia in sleep apnea patients before elective noncardiac surgery?
Yes. Obesity hypoventilation syndrome (OHS) is often undiagnosed and greatly increases perioperative risk. Therefore, we recommend trying to detect OHS in a timely manner. Treatment should begin without delay to avoid adverse perioperative outcomes, which can include acute-on-chronic respiratory failure requiring intensive-care monitoring and invasive mechanical ventilation, or death.
ALSO CALLED PICKWICKIAN SYNDROME
OHS is also known as Pickwickian syndrome, named for a character—a “fat boy” who is constantly falling asleep—in The Posthumous Papers of the Pickwick Club by Charles Dickens.
Salient features of OHS are:
- Obesity (body mass index ≥ 30 kg/m2)
- Sleep-disordered breathing (most patients with OHS are morbidly obese and have severe obstructive sleep apnea1)
- Chronic daytime alveolar hypoventilation: ie, Paco2 ≥ 45 mm Hg (normal range 35–45 mm Hg) and Pao2 < 70 mm Hg1 (normal range 85–95 mm Hg)
- No other identifiable cause of hypoventilation such as pulmonary disease (severe obstructive or restrictive), chest wall deformities, severe hypothyroidism, or neuromuscular disease.
WHY SCREEN FOR OHS?
Both obstructive sleep apnea and OHS worsen quality of life and increase the risk of serious disease and death.2–3 Patients with severe sleep apnea, particularly those with hypercapnia (ie, OHS) are at higher risk of cardiopulmonary complications in the perioperative period.
Compared with eucapnic patients with obstructive sleep apnea, patients with OHS have higher health care expenses, are at higher risk of developing serious cardiovascular diseases such as pulmonary hypertension and congestive heart failure, and are more likely to die sooner.4,5
Nowbar et al5 prospectively followed a group of severely obese patients after hospital discharge. At 18 months, 23% of those with OHS had died, compared with 9% of those without OHS. The groups were well matched for body mass index, age, and a number of comorbid conditions. Most of the deaths occurred in the first 3 months after hospital discharge. During the hospital stay, more patients with OHS were admitted to the intensive care unit and needed endotracheal intubation and mechanical ventilation, and more were discharged to a long-term facility.
A high level of suspicion can lead to early recognition and treatment, which may reduce the rate of adverse outcomes associated with undiagnosed and untreated OHS. Routine screening for hypercapnia in patients with sleep apnea might help to identify patients with OHS and allow for modifications in surgical approach, anesthetic technique, and postoperative monitoring, increasing patient safety.
HOW PREVALENT IS OHS?
Obstructive sleep apnea affects up to 20% of US adults and is undiagnosed and untreated in up to 90% of cases.6 Simple screening questionnaires have been shown to reliably identify patients at risk.7,8
To date, no population-based prevalence studies of OHS have been done.
The overall prevalence of OHS in patients with obstructive sleep apnea is better studied: multiple prospective and retrospective studies across various geographic regions with a variety of racial or ethnic populations have shown it to be between 10% and 20%.1,9 This range is very consistent among studies performed in Europe, the United States, and Japan, whether retrospective or prospective, and whether large or small.
The prevalence of OHS in the general adult population in the United States can, however, be estimated. If approximately 5% of the general US population has severe obesity (body mass index ≤ 40 kg/m2), if half of patients with severe obesity have obstructive sleep apnea,10 and if 15% of severely obese patients with sleep apnea have OHS, then a conservative estimated prevalence of OHS in the general adult US population is 0.37% (1 in 270 adults).
WHAT CAN BE DONE BEFORE ELECTIVE SURGERY?
Patients with OHS have an elevated serum bicarbonate level due to metabolic compensation for chronic respiratory acidosis. Moreover, they may have mild hypoxemia during wakefulness as measured by finger pulse oximetry.
The serum venous bicarbonate level is an easy and reasonable test to screen for hypercapnia in obese patients with obstructive sleep apnea because it is readily available, physiologically sensible, and less invasive than arterial puncture to measure blood gases.9
Arterial blood gas measurements, however, should be obtained to confirm the presence and severity of daytime hypercapnia in obese patients with hypoxemia during wakefulness or an elevated serum bicarbonate level.
Pulmonary function testing and chest imaging can exclude other causes of hypercapnia if hypercapnia is confirmed.
An overnight, attended polysomnographic study in a sleep laboratory is ultimately needed to establish the diagnosis and severity of obstructive sleep apnea and to titrate continuous positive airway pressure (CPAP) or bilevel positive airway pressure (BPAP) therapy. Since most patients with OHS have severe obstructive sleep apnea, in-laboratory attended polysomnography allows the clinician to both diagnose and intervene with PAP therapy (a “split-night” study). Home titration with an auto-CPAP device is not recommended because it does not have the ability to titrate PAP pressures in response to hypoxemia or hypoventilation. Patients with OHS require attended, laboratory-based PAP titration with or without supplemental oxygen.
CPAP or BPAP therapy should be started during the few days or weeks before surgery, and adherence should be emphasized. Anesthesiologists might reconsider the choice of anesthetic technique in favor of regional anesthesia and modify postoperative pain management to reduce opioid requirements. Reinstituting CPAP or BPAP therapy upon extubation or arrival in the postoperative recovery unit can further reduce the risk of respiratory complications. Additional monitoring such as continuous pulse oximetry when the patient is on the general ward should be considered.
- Mokhlesi B, Kryger MH, Grunstein RR. Assessment and management of patients with obesity hypoventilation syndrome. Proc Am Thorac Soc 2008; 5:218–225.
- Flegal KM, Graubard BI, Williamson DF, Gail MH. Excess deaths associated with underweight, overweight, and obesity. JAMA 2005; 293:1861–1867.
- Young T, Finn L, Peppard PE, et al. Sleep disordered breathing and mortality: eighteen-year follow-up of the Wisconsin sleep cohort. Sleep 2008; 31:1071–1078.
- Berg G, Delaive K, Manfreda J, Walld R, Kryger MH. The use of health-care resources in obesity-hypoventilation syndrome. Chest 2001; 120:377–383.
- Nowbar S, Burkart KM, Gonzales R, et al. Obesity-associated hypoventilation in hospitalized patients: prevalence, effects, and outcome. Am J Med 2004; 116:1–7.
- Kapur V, Strohl KP, Redline S, Iber C, O'Connor G, Nieto J. Underdiagnosis of sleep apnea syndrome in U.S. communities. Sleep Breath 2002; 6:49–54.
- Finkel KJ, Searleman AC, Tymkew H, et al. Prevalence of undiagnosed obstructive sleep apnea among adult surgical patients in an academic medical center. Sleep Med 2009; 10:753–758.
- Chung F, Yegneswaran B, Liao P, et al. STOP questionnaire: a tool to screen patients for obstructive sleep apnea. Anesthesiology 2008; 108:812–821.
- Mokhlesi B, Tulaimat A, Faibussowitsch I, Wang Y, Evans AT. Obesity hypoventilation syndrome: prevalence and predictors in patients with obstructive sleep apnea. Sleep Breath 2007; 11:117–124.
- Lee W, Nagubadi S, Kryger MH, Mokhlesi B. Epidemiology of obstructive sleep apnea: a population-based perspective. Expert Rev Respir Med 2008; 2:349–364.
Yes. Obesity hypoventilation syndrome (OHS) is often undiagnosed and greatly increases perioperative risk. Therefore, we recommend trying to detect OHS in a timely manner. Treatment should begin without delay to avoid adverse perioperative outcomes, which can include acute-on-chronic respiratory failure requiring intensive-care monitoring and invasive mechanical ventilation, or death.
ALSO CALLED PICKWICKIAN SYNDROME
OHS is also known as Pickwickian syndrome, named for a character—a “fat boy” who is constantly falling asleep—in The Posthumous Papers of the Pickwick Club by Charles Dickens.
Salient features of OHS are:
- Obesity (body mass index ≥ 30 kg/m2)
- Sleep-disordered breathing (most patients with OHS are morbidly obese and have severe obstructive sleep apnea1)
- Chronic daytime alveolar hypoventilation: ie, Paco2 ≥ 45 mm Hg (normal range 35–45 mm Hg) and Pao2 < 70 mm Hg1 (normal range 85–95 mm Hg)
- No other identifiable cause of hypoventilation such as pulmonary disease (severe obstructive or restrictive), chest wall deformities, severe hypothyroidism, or neuromuscular disease.
WHY SCREEN FOR OHS?
Both obstructive sleep apnea and OHS worsen quality of life and increase the risk of serious disease and death.2–3 Patients with severe sleep apnea, particularly those with hypercapnia (ie, OHS) are at higher risk of cardiopulmonary complications in the perioperative period.
Compared with eucapnic patients with obstructive sleep apnea, patients with OHS have higher health care expenses, are at higher risk of developing serious cardiovascular diseases such as pulmonary hypertension and congestive heart failure, and are more likely to die sooner.4,5
Nowbar et al5 prospectively followed a group of severely obese patients after hospital discharge. At 18 months, 23% of those with OHS had died, compared with 9% of those without OHS. The groups were well matched for body mass index, age, and a number of comorbid conditions. Most of the deaths occurred in the first 3 months after hospital discharge. During the hospital stay, more patients with OHS were admitted to the intensive care unit and needed endotracheal intubation and mechanical ventilation, and more were discharged to a long-term facility.
A high level of suspicion can lead to early recognition and treatment, which may reduce the rate of adverse outcomes associated with undiagnosed and untreated OHS. Routine screening for hypercapnia in patients with sleep apnea might help to identify patients with OHS and allow for modifications in surgical approach, anesthetic technique, and postoperative monitoring, increasing patient safety.
HOW PREVALENT IS OHS?
Obstructive sleep apnea affects up to 20% of US adults and is undiagnosed and untreated in up to 90% of cases.6 Simple screening questionnaires have been shown to reliably identify patients at risk.7,8
To date, no population-based prevalence studies of OHS have been done.
The overall prevalence of OHS in patients with obstructive sleep apnea is better studied: multiple prospective and retrospective studies across various geographic regions with a variety of racial or ethnic populations have shown it to be between 10% and 20%.1,9 This range is very consistent among studies performed in Europe, the United States, and Japan, whether retrospective or prospective, and whether large or small.
The prevalence of OHS in the general adult population in the United States can, however, be estimated. If approximately 5% of the general US population has severe obesity (body mass index ≤ 40 kg/m2), if half of patients with severe obesity have obstructive sleep apnea,10 and if 15% of severely obese patients with sleep apnea have OHS, then a conservative estimated prevalence of OHS in the general adult US population is 0.37% (1 in 270 adults).
WHAT CAN BE DONE BEFORE ELECTIVE SURGERY?
Patients with OHS have an elevated serum bicarbonate level due to metabolic compensation for chronic respiratory acidosis. Moreover, they may have mild hypoxemia during wakefulness as measured by finger pulse oximetry.
The serum venous bicarbonate level is an easy and reasonable test to screen for hypercapnia in obese patients with obstructive sleep apnea because it is readily available, physiologically sensible, and less invasive than arterial puncture to measure blood gases.9
Arterial blood gas measurements, however, should be obtained to confirm the presence and severity of daytime hypercapnia in obese patients with hypoxemia during wakefulness or an elevated serum bicarbonate level.
Pulmonary function testing and chest imaging can exclude other causes of hypercapnia if hypercapnia is confirmed.
An overnight, attended polysomnographic study in a sleep laboratory is ultimately needed to establish the diagnosis and severity of obstructive sleep apnea and to titrate continuous positive airway pressure (CPAP) or bilevel positive airway pressure (BPAP) therapy. Since most patients with OHS have severe obstructive sleep apnea, in-laboratory attended polysomnography allows the clinician to both diagnose and intervene with PAP therapy (a “split-night” study). Home titration with an auto-CPAP device is not recommended because it does not have the ability to titrate PAP pressures in response to hypoxemia or hypoventilation. Patients with OHS require attended, laboratory-based PAP titration with or without supplemental oxygen.
CPAP or BPAP therapy should be started during the few days or weeks before surgery, and adherence should be emphasized. Anesthesiologists might reconsider the choice of anesthetic technique in favor of regional anesthesia and modify postoperative pain management to reduce opioid requirements. Reinstituting CPAP or BPAP therapy upon extubation or arrival in the postoperative recovery unit can further reduce the risk of respiratory complications. Additional monitoring such as continuous pulse oximetry when the patient is on the general ward should be considered.
- Mokhlesi B, Kryger MH, Grunstein RR. Assessment and management of patients with obesity hypoventilation syndrome. Proc Am Thorac Soc 2008; 5:218–225.
- Flegal KM, Graubard BI, Williamson DF, Gail MH. Excess deaths associated with underweight, overweight, and obesity. JAMA 2005; 293:1861–1867.
- Young T, Finn L, Peppard PE, et al. Sleep disordered breathing and mortality: eighteen-year follow-up of the Wisconsin sleep cohort. Sleep 2008; 31:1071–1078.
- Berg G, Delaive K, Manfreda J, Walld R, Kryger MH. The use of health-care resources in obesity-hypoventilation syndrome. Chest 2001; 120:377–383.
- Nowbar S, Burkart KM, Gonzales R, et al. Obesity-associated hypoventilation in hospitalized patients: prevalence, effects, and outcome. Am J Med 2004; 116:1–7.
- Kapur V, Strohl KP, Redline S, Iber C, O'Connor G, Nieto J. Underdiagnosis of sleep apnea syndrome in U.S. communities. Sleep Breath 2002; 6:49–54.
- Finkel KJ, Searleman AC, Tymkew H, et al. Prevalence of undiagnosed obstructive sleep apnea among adult surgical patients in an academic medical center. Sleep Med 2009; 10:753–758.
- Chung F, Yegneswaran B, Liao P, et al. STOP questionnaire: a tool to screen patients for obstructive sleep apnea. Anesthesiology 2008; 108:812–821.
- Mokhlesi B, Tulaimat A, Faibussowitsch I, Wang Y, Evans AT. Obesity hypoventilation syndrome: prevalence and predictors in patients with obstructive sleep apnea. Sleep Breath 2007; 11:117–124.
- Lee W, Nagubadi S, Kryger MH, Mokhlesi B. Epidemiology of obstructive sleep apnea: a population-based perspective. Expert Rev Respir Med 2008; 2:349–364.