User login
Analysis of Hospitalist Discontinuity
Studies examining the importance of continuity of care have shown that patients who maintain a continuous relationship with a single physician have improved outcomes.[1, 2] However, most of these studies were performed in the outpatient, rather than the inpatient setting. With over 35 million patients admitted to hospitals in 2013, along with the significant increase in hospital discontinuity over recent years, the impact of inpatient continuity of care on quality outcomes and patient satisfaction is becoming increasingly relevant.[3, 4]
Service handoffs, when a physician hands over treatment responsibility for a panel of patients and is not expected to return, are a type of handoff that contributes to inpatient discontinuity. In particular, service handoffs between hospitalists are an especially common and inherently risky type of transition, as there is a severing of an established relationship during a patient's hospitalization. Unfortunately, due to the lack of evidence on the effects of service handoffs, current guidelines are limited in their recommendations.[5] Whereas several recent studies have begun to explore the effects of these handoffs, no prior study has examined this issue from a patient's perspective.[6, 7, 8]
Patients are uniquely positioned to inform us about their experiences in care transitions. Furthermore, with patient satisfaction now affecting Medicare reimbursement rates, patient experiences while in the hospital are becoming even more significant.[9] Despite this emphasis toward more patient‐centered care, no study has explored the hospitalized patient's experience with hospitalist service handoffs. Our goal was to qualitatively assess the hospitalized patients' experiences with transitions between hospitalists to develop a conceptual model to inform future work on improving inpatient transitions of care.
METHODS
Sampling and Recruitment
We conducted bedside interviews of hospitalized patients at an urban academic medical center from October 2014 through December 2014. The hospitalist service consists of a physician and an advanced nurse practitioner (ANP) who divide a panel of patients that consist of general medicine and subspecialty patients who are often comanaged with hepatology, oncology, and nephrology subspecialists. We performed a purposive selection of patients who could potentially comment on their experience with a hospitalist service transition using the following method: 48 hours after a service handoff (ie, an outgoing physician completing 1 week on service, then transfers the care of the patient to a new oncoming hospitalist), oncoming hospitalists were approached and asked if any patient on their service had experienced a service handoff and still remained in the hospital. A 48‐hour time period was chosen to give the patients time to familiarize themselves with their new hospitalist, allowing them to properly comment on the handoff. Patients who were managed by the ANP, who were non‐English speaking, or who were deemed to have an altered mental status based on clinical suspicion by the interviewing physician (C.M.W.) were excluded from participation. Following each weekly service transition, a list of patients who met the above criteria was collected from 4 nonteaching hospitalist services, and were approached by the primary investigator (C.M.W.) and asked if they would be willing to participate. All patients were general medicine patients and no exclusions were made based on physical location within the hospital. Those who agreed provided signed written consent prior to participation to allow access to the electronic health records (EHRs) by study personnel.
Data Collection
Patients were administered a 9‐question, semistructured interview that was informed by expert opinion and existing literature, which was developed to elicit their perspective regarding their transition between hospitalists.[10, 11] No formal changes were made to the interview guide during the study period, and all patients were asked the same questions. Outcomes from interim analysis guided further questioning in subsequent interviews so as to increase the depth of patient responses (ie, Can you explain your response in greater depth?). Prior to the interview, patients were read a description of a hospitalist, and were reminded which hospitalists had cared for them during their stay (see Supporting Information, Appendix 1, in the online version of this article). If family members or a caregiver were present at the time of interview, they were asked not to comment. No repeat interviews were carried out.
All interviews were performed privately in single‐occupancy rooms, digitally recorded using an iPad (Apple, Cupertino, CA) and professionally transcribed verbatim (Rev, San Francisco, CA). All analysis was performed using MAXQDA Software (VERBI Software GmbH, Berlin, Germany). We obtained demographic information about each patient through chart review
Data Analysis
Grounded theory was utilized, with an inductive approach with no a priori hypothesis.[12] The constant comparative method was used to generate emerging and reoccurring themes.[13] Units of analysis were sentences and phrases. Our research team consisted of 4 academic hospitalists, 2 with backgrounds in clinical medicine, medical education, and qualitative analysis (J.M.F., V.M.A.), 1 as a clinician (C.M.W.), and 1 in health economics (D.O.M.). Interim analysis was performed on a weekly basis (C.M.W.), during which time a coding template was created and refined through an iterative process (C.M.W., J.M.F.). All disagreements in coded themes were resolved through group discussion until full consensus was reached. Each week, responses were assessed for thematic saturation.[14] Interviews were continued if new themes arose during this analysis. Data collection was ended once we ceased to extract new topics from participants. A summary of all themes was then presented to a group of 10 patients who met the same inclusion criteria for respondent validation and member checking. All reporting was performed within the Standards for Reporting Qualitative Research, with additional guidance derived from the Consolidated Criteria for Reporting Qualitative Research.[15, 16] The University of Chicago Institutional Review Board approved this protocol.
RESULTS
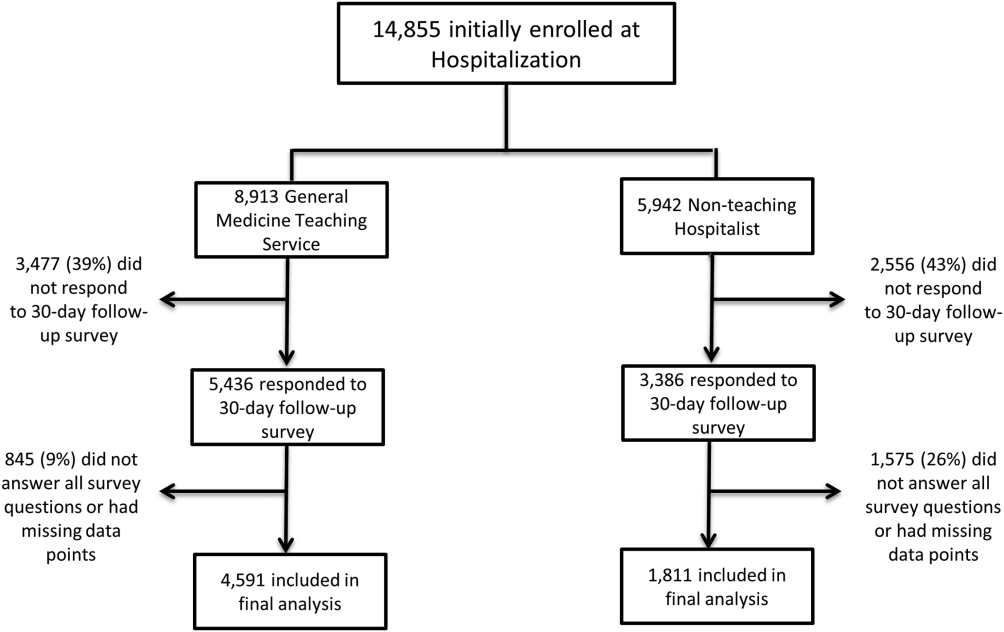
In total, 43 eligible patients were recruited, and 40 (93%) agreed to participate. Interviewed patients were between 51 and 65 (39%) years old, had a mean age of 54.5 (15) years, were predominantly female (65%), African American (58%), had a median length of stay at the time of interview of 6.5 days (interquartile range [IQR]: 48), and had an average of 2.0 (IQR: 13) hospitalists oversee their care at the time of interview (Table 1). Interview times ranged from 10:25 to 25:48 minutes, with an average of 15:32 minutes.
| Value | |
|---|---|
| |
| Response rate, n (%) | 40/43 (93) |
| Age, mean SD | 54.5 15 |
| Sex, n (%) | |
| Female | 26 (65) |
| Male | 14 (35) |
| Race, n (%) | |
| African American | 23 (58) |
| White | 16 (40) |
| Hispanic | 1 (2) |
| Median LOS at time of interview, d (IQR) | 6.5 (48) |
| Median no. of hospitalists at time of interview, n (IQR) | 2.0 (13) |
We identified 6 major themes on patient perceptions of hospitalist service handoffs including (1) physician‐patient communication, (2) transparency in the hospitalist transition process, (3) indifference toward the hospitalist transition, (4) hospitalist‐subspecialist communication, (5) recognition of new opportunities due to a transition, and (6) hospitalists' bedside manner (Table 2).
| Themes | Subthemes | Representative Quotes |
|---|---|---|
| Physician‐patient communication | Patients dislike redundant communication with oncoming hospitalist. | I mean it's just you always have to explain your situation over and over and over again. (patient 14) |
| When I said it once already, then you're repeating it to another doctor. I feel as if that hospitalist didn't talk to the other hospitalist. (patient 7) | ||
| Poor communication can negatively affect the doctor‐patient relationship. | They don't really want to explain things. They don't think I'll understand. I think & yeah, I'm okay. You don't even have to put it in layman's terms. I know medical. I'm in nursing school. I have a year left. But even if you didn't know that, I would still hope you would try to tell me what was going on instead of just doing it in your head, and treating it. (patient 2) | |
| I mean it's just you always have to explain your situation over and over and over again. After a while you just stop trusting them. (patient 20) | ||
| Good communication can positively affect the doctor‐patient relationship. | Just continue with the communication, the open communication, and always stress to me that I have a voice and just going out of their way to do whatever they can to help me through whatever I'm going through. (patient 1) | |
| Transparency in transition | Patients want to be informed prior to a service changeover. | I think they should be told immediately, even maybe given prior notice, like this may happen, just so you're not surprised when it happens. (patient 15) |
| When the doctor approached me, he let me know that he wasn't going to be here the next day and there was going to be another doctor coming in. That made me feel comfortable. (patient 9) | ||
| Patients desire a more formalized process in the service changeover. | People want things to be consistent. People don't like change. They like routine. So, if he's leaving, you're coming on, I'd like for him to bring you in, introduce you to me, and for you just assure me that I'll take care of you. (patient 4) | |
| Just like when you get a new medication, you're given all this information on it. So when you get a new hospitalist, shouldn't I get all the information on them? Like where they went to school, what they look like. (patient 23) | ||
| Patients want clearer definition of the roles the physicians will play in their care. | The first time I was hospitalized for the first time I had all these different doctors coming in, and I had the residency, and the specialists, and the department, and I don't know who's who. What I asked them to do is when they come in the room, which they did, but introduce it a little more for me. Write it down like these are the special team and these are the doctors because even though they come in and give me their name, I have no idea what they're doing. (patient 5) | |
| Someone should explain the setup and who people are. Someone would say, Okay when you're in a hospital this is your [doctor's] role. Like they should have booklets and everything. (patient 19) | ||
| Indifference toward transition | Many patients have trust in service changeovers. | [S]o as long as everybody's on board and communicates well and efficiently, I don't have a problem with it. (patient 6) |
| To me, it really wasn't no preference, as long as I was getting the care that I needed. (patient 21) | ||
| It's not a concern as long as they're on the same page. (patient 17) | ||
| Hospitalist‐specialist communication | Patients are concerned about communication between their hospitalist and their subspecialists. | The more cooks you get in the kitchen, the more things get to get lost, so I'm always concerned that they're not sharing the same information, especially when you're getting asked the same questions that you might have just answered the last hour ago. (patient 9) |
| I don't know if the hospitalist are talking to them [subspecialist]. They haven't got time. (patient 35) | ||
| Patients place trust in the communication between hospitalist and subspecialist. | I think among the teams themselveswhich is my pain doctor, Dr. K's group, the oncology group itself, they switch off and trade with each other and they all speak the same language so that works out good. (patient 3) | |
| Lack of interprofessional communication can lead to patient concern. | I was afraid that one was going to drop the ball on something and not pass something on, or you know. (patient 11) | |
| I had numerous doctors who all seemed to not communicate with each other at all or did so by email or whatever. They didn't just sit down together and say we feel this way and we feel that way. I didn't like that at all. (patient 10) | ||
| New opportunities due to transition | Patients see new doctor as opportunity for medical reevaluation. | I see it as two heads are better than one, three heads are better than one, four heads are better than one. When people put their heads together to work towards a common goal, especially when they're, you know, people working their craft, it can't be bad. (patient 9) |
| I finally got my ears looked atbecause I've asked to have my ears looked at since Mondayand the new doc is trying to make an effort to look at them. (patient 39) | ||
| Patients see service changeover as an opportunity to form a better personal relationship. | Having a new hospitalist it gives you opportunity for a new beginning. (patient 11) | |
| Bedside manner | Good bedside manner can assist in a service changeover. | Some of them are all business‐like but some of them are, Well how do you feel today? Hi, how are you? So this made a little difference. You feel more comfortable. You're going to be more comfortable with them. Their bedside manner helps. (patient 16) |
| It's just like when a doctor sits down and talks to you, they just seem more relaxed and more .... I know they're very busy and they have lots of things to do and other patients to see, but while they're in there with you, you know, you don't get too much time with them. So bedside manner is just so important. (patient 24) | ||
| Poor bedside manner can be detrimental in transition. | [B]ecause they be so busy they claim they don't have time just to sit and talk to a patient, and make sure they all right. (patient 17) |
Physician‐Patient Communication
Communication between the physician and the patient was an important element in patients' assessment of their experience. Patient's tended to divide physician‐patient communication into 2 categories: good communication, which consisted of open communication (patient 1) and patient engagement, and bad communication, which was described as physicians not sharing information or taking the time to explain the course of care in words that I'll understand (patient 2). Patients also described dissatisfaction with redundant communication between multiple hospitalists and the frustration of often having to describe their clinical course to multiple providers.
Transparency in Communication
The desire to have greater transparency in the handoff process was another common theme. This was likely due to the fact that 34/40 (85%) of surveyed patients were unaware that a service changeover had ever taken place. This lack of transparency was viewed to have further downstream consequences as patients stated that there should be a level of transparency, and when it's not, then there is always trust issues (patient 1). Upon further questioning as to how to make the process more transparent, many patients recommended a formalized, face‐to‐face introduction involving the patient and both hospitalists, in which the outgoing hospitalist would, bring you [oncoming hospitalist] in, and introduce you to me (patient 4).
Patients often stated that given the large spectrum of physicians they might encounter during their stay (ie, medical student, resident, hospitalist attending, subspecialty fellow, subspecialist attending), clearer definitions of physicians' roles are needed.
Hospitalist‐Specialist Communication
Concern about the communication between their hospitalist and subspecialist was another predominant theme. Conflicting and unclear directions from multiple services were especially frustrating, as a patient stated, One guy took me off this pill, the other guy wants me on that pill, I'm like okay, I can't do both (patient 8). Furthermore, a subset of patients referenced their subspecialist as their primary care provider and preferred their subspecialist for guidance in their hospital course, rather than their hospitalist. This often appeared in cases where the patient had an established relationship with the subspecialist prior to their hospitalization.
New Opportunities Due to Transition
Patients expressed positive feelings toward service handoffs by viewing the transition as an opportunity for medical reevaluation by a new physician. Patients told of instances in which a specific complaint was not being addressed by the first physician, but would be addressed by the second (oncoming) physician. A commonly expressed idea was that the oncoming physician might know something that he [Dr. B] didn't know, and since Dr. B was only here for a week, why not give him [oncoming hospitalist] a chance (patient 10). Patients would also describe the transition as an opportunity to form, and possibly improve, therapeutic alliances with a new hospitalist.
Bedside Manner
Bedside manner was another commonly mentioned thematic element. Patients were often quick to forget prior problems or issues that they may have suffered because of the transition if the oncoming physician was perceived to have a good bedside manner, often described as someone who formally introduced themselves, was considered relaxed, and would take the time to sit and talk with the patient. As a patient put it, [S]he sat down and got to know meand asked me what I wanted to do (patient 12). Conversely, patients described instances in which a perceived bad bedside manner led to a poor relationship between the physician and the patient, in which trust and comfort (patient 11) were sacrificed.
Indifference Toward Transition
In contrast to some of the previous findings, which called for improved interactions between physicians and patients, we also discovered a theme of indifference toward the transition. Several patients stated feelings of trust with the medical system, and were content with the service changeover as long as they felt that their medical needs were being met. Patients also tended to express a level of acceptance with the transition, and tended to believe that this was the price we pay for being here [in the hospital] (patient 7).
Conceptual Model
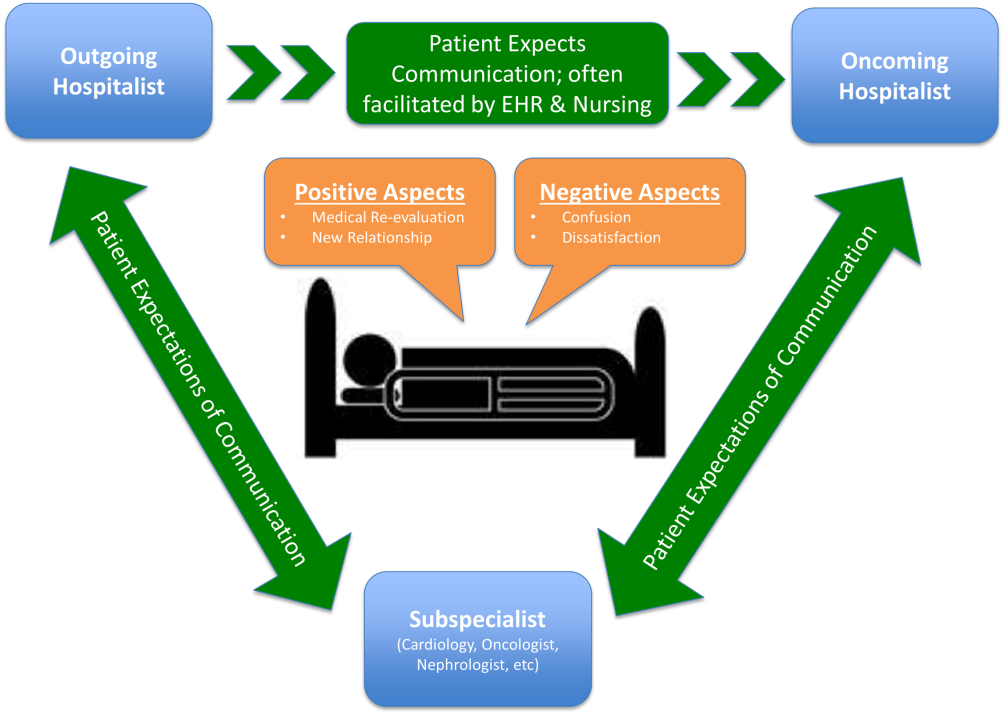
Following the collection and analysis of all patient responses, all themes were utilized to construct the ideal patient‐centered service handoff. The ideal transition describes open lines of communication between all involved parties, is facilitated by multiple modalities, such as the EHRs and nursing staff, and recognizes the patient as the primary stakeholder (Figure 1).
DISCUSSION
To our knowledge, this is the first qualitative investigation of the hospitalized patient's experience with service handoffs between hospitalists. The patient perspective adds a personal and first‐hand description of how fragmented care may impact the hospitalized patient experience.
Of the 6 themes, communication was found to be the most pertinent to our respondents. Because much of patient care is an inherently communicative activity, it is not surprising that patients, as well as patient safety experts, have focused on communication as an area in need of improvement in transition processes.[17, 18] Moreover, multiple medical societies have directly called for improvements within this area, and have specifically recommended clear and direct communication of treatment plans between the patient and physician, timely exchange of information, and knowledge of who is primarily in charge of the patients care.[11] Not surprisingly, each of these recommendations appears to be echoed by our participants. This theme is especially important given that good physician‐patient communication has been noted to be a major goal in achieving patient‐centered care, and has been positively correlated to medication adherence, patient satisfaction, and physical health outcomes.[19, 20, 21, 22, 23]
Although not a substitute for face‐to‐face interactions, other communication interventions between physicians and patients should be considered. For example, get to know me posters placed in patient rooms have been shown to encourage communication between patients and physicians.[24] Additionally, physician face cards have been used to improve patients' abilities to identify and clarify physicians' roles in patient care.[25] As a patient put it, If they got a new one [hospitalist], just as if I got a new medicationprint out information on themlike where they went to med school, and stuff(patient 13). These modalities may represent highly implementable, cost‐effective adjuncts to current handoff methods that may improve lines of communication between physicians and patients.
In addition to the importance placed on physician‐patient communication, interprofessional communication between hospitalists and subspecialists was also highly regarded. Studies have shown that practice‐based interprofessional communication, such as daily interdisciplinary rounds and the use of external facilitators, can improve healthcare processes and outcomes.[26] However, these interventions must be weighed with the many conflicting factors that both hospitalists and subspecialists face on daily basis, including high patient volumes, time limitations, patient availability, and scheduling conflicts.[27] None the less, the strong emphasis patients placed on this line of communication highlights this domain as an area in which hospitalist and subspecialist can work together for systematic improvement.
Patients also recognized the complexity of the transfer process between hospitalists and called for improved transparency. For example, patients repeatedly requested to be informed prior to any changes in their hospitalists, a request that remains consistent with current guidelines.[11] There also existed a strong desire for a more formalized process of transitioning between hospitalists, which often described a handoff procedure that would occur at the patient's bedside. This desire seems to be mirrored in the data that show that patients prefer to interact with their care team at the bedside and report higher satisfaction when they are involved with their care.[28, 29] Unfortunately, this desire for more direct interaction with physicians runs counter to the current paradigm of patient care, where most activities on rounds do not take place at the bedside.[30]
In contrast to patient's calls for improved transparency, an equally large portion of patients expressed relative indifference to the transition. Whereas on the surface this may seem salutary, some studies suggest that a lack of patient activation and engagement may have adverse effects toward patients' overall care.[31] Furthermore, others have shown evidence of better healthcare experiences, improved health outcomes, and lower costs in patients who are more active in their care.[30, 31] Altogether, this suggests that despite some patients' indifference, physicians should continue to engage patients in their hospital care.[32]
Although prevailing sentiments among patient safety advocates are that patient handoffs are inherently dangerous and place patients at increased risk of adverse events, patients did not always share this concern. A frequently occurring theme was that the transition is an opportunity for medical reevaluation or the establishment of a new, possibly improved therapeutic alliance. Recognizing this viewpoint offers oncoming hospitalists the opportunity to focus on issues that the patient may have felt were not being properly addressed with their prior physician.
Finally, although our conceptual model is not a strict guideline, we believe that any future studies should consider this framework when constructing interventions to improve service‐level handoffs. Several interventions already exist. For instance, educational interventions, such as patient‐centered interviewing, have been shown to improve patient satisfaction, compliance with medications, lead to fewer lawsuits, and improve health outcomes.[33, 34, 35] Additional methods of keeping the patient more informed include physician face sheets and performance of the handoff at the patient's bedside. Although well known in nursing literature, the idea of physicians performing handoffs at the patient's bedside is a particularly patient‐centric process.[36] This type of intervention may have the ability to transform the handoff from the current state of a 2‐way street, in which information is passed between 2 hospitalists, to a 3‐way stop, in which both hospitalists and the patient are able to communicate at this critical junction of care.
Although our study does offer new insight into the effects of discontinuous care, its exploratory nature does have limitations. First, being performed at a single academic center limits our ability to generalize our findings. Second, perspectives of those who did not wish to participate, patients' family members or caregivers, and those who were not queried, could highly differ from those we interviewed. Additionally, we did not collect data on patients' diagnoses or reason for admission, thus limiting our ability to assess if certain diagnosis or subpopulations predispose patients to experiencing a service handoff. Third, although our study was restricted to English‐speaking patients only, we must consider that non‐English speakers would likely suffer from even greater communication barriers than those who took part in our study. Finally, our interviews and data analysis were conducted by hospitalists, which could have subconsciously influenced the interview process, and the interpretation of patient responses. However, we tried to mitigate these issues by having the same individual interview all participants, by using an interview guide to ensure cross‐cohort consistency, by using open‐ended questions, and by attempting to give patients every opportunity to express themselves.
CONCLUSIONS
From a patients' perspective, inpatient service handoffs are often opaque experiences that are highlighted by poor communication between physicians and patients. Although deficits in communication and transparency acted as barriers to a patient‐centered handoff, physicians should recognize that service handoffs may also represent opportunities for improvement, and should focus on these domains when they start on a new service.
Disclosures
All funding for this project was provided by the Section of Hospital Medicine at The University of Chicago Medical Center. The data from this article were presented at the Society of Hospital Medicine Annual Conference, National Harbor, March 31, 2015, and at the Society of General Internal Medicine National Meeting in Toronto, Canada, April 23, 2015. The authors report that no conflicts of interest, financial or otherwise, exist.
- , , , , , . Continuity of outpatient and inpatient care by primary care physicians for hospitalized older adults. JAMA. 2009;301(16):1671–1680.
- , , , et al. Continuity of care and the risk of preventable hospitalization in older adults. JAMA Intern Med. 2013;173(20):1879–1885.
- Agency for Healthcare Research and Quality. HCUPnet: a tool for identifying, tracking, and analyzing national hospital statistics. Available at: http://hcupnet.ahrq.gov/HCUPnet.jsp?Id=82B37DA366A36BAD6(8):438–444.
- , , , , , . Hospitalist handoffs: a systematic review and task force recommendations. J Hosp Med. 2009;4(7):433–440.
- , , , , . The impact of fragmentation of hospitalist care on length of stay. J Hosp Med. 2010;5(6):335–338.
- , , , et al. The impact of hospitalist discontinuity on hospital cost, readmissions, and patient satisfaction. J Gen Intern Med. 2014;29(7):1004–1008.
- , , , et al. The effect of hospitalist discontinuity on adverse events. J Hosp Med. 2015;10(3):147–151.
- Agency for Healthcare Research and Quality. HCAHPS Fact Sheet. CAHPS Hospital Survey August 2013. Available at: http://www.hcahpsonline.org/files/August_2013_HCAHPS_Fact_Sheet3.pdf. Accessed February 2, 2015.
- , , , et al. A conceptual framework for studying the safety of transitions in emergency care. In: Henriksen K, Battles JB, Marks ES, eds. Advances in Patient Safety: From Research to Implementation. Rockville, MD: Agency for Healthcare Research and Quality; 2005:309–321. Concepts and Methodology; vol 2. Available at: http://www.ncbi.nlm.nih.gov/books/NBK20522. Accessed January 15, 2015.
- , , , et al. Transitions of care consensus policy statement American College of Physicians‐Society of General Internal Medicine‐Society of Hospital Medicine‐American Geriatrics Society‐American College of Emergency Physicians‐Society of Academic Emergency Medicine. J Gen Intern Med. 2009;24(8):971–976.
- , . Grounded theory in medical education research: AMEE guide no. 70. Med Teach. 2012;34(10):850–861.
- . A purposeful approach to the constant comparative method in the analysis of qualitative interviews. Qual Quant. 2002;36(4):391–409.
- . The significance of saturation. Qual Health Res. 1995;5(2):147–149.
- , , , , . Standards for reporting qualitative research: a synthesis of recommendations. Acad Med. 2014;89(9):1245–1251.
- , , . Consolidated criteria for reporting qualitative research (COREQ): a 32‐item checklist for interviews and focus groups. Int J Qual Health Care. 2007;19(6):349–357.
- , , , . Promoting effective transitions of care at hospital discharge: a review of key issues for hospitalists. J Hosp Med. 2007;2(5):314–323.
- The Joint Commission. Hot Topics in Healthcare, Issue 2. Transitions of care: the need for collaboration across entire care continuum. Available at: http://www.jointcommission.org/assets/1/6/TOC_Hot_Topics.pdf. Accessed April 9, 2015.
- , . Physician communication and patient adherence to treatment: a meta‐analysis. Med Care. 2009;47(8):826–834.
- , . Impediments to adherence to post myocardial infarction medications. Curr Cardiol Rep. 2013;15(1):322.
- , , , , . Medical specialists' patient‐centered communication and patient‐reported outcomes. Med Care. 2007;45(4):330–339.
- , , , . Does doctor‐patient communication affect patient satisfaction with hospital care? Results of an analysis with a novel instrumental variable. Health Serv Res. 2008;43(5 pt 1):1505–1519.
- , , . Patient‐centredness in chronic illness: what is it and does it matter? Patient Educ Couns. 2003;51(3):197–206.
- , , , et al. Merging cultures: palliative care specialists in the medical intensive care unit. Crit Care Med. 2006;34(11 suppl):S388–S393.
- , , , et al. Improving inpatients' identification of their doctors: use of FACE cards. Jt Comm J Qual Patient Saf. 2009;35(12):613–619.
- , , . Interprofessional collaboration: effects of practice‐based interventions on professional practice and healthcare outcomes. Cochrane Database Syst Rev. 2009;(3):CD000072.
- , , , et al. Identifying and overcoming the barriers to bedside rounds: a multicenter qualitative study. Acad Med. 2014;89(2):326–334.
- , , , , . The effect of bedside case presentations on patients' perceptions of their medical care. N Engl J Med. 1997;336(16):1150–1155.
- , , , . Patient‐centered interprofessional collaborative care: factors associated with bedside interprofessional rounds. J Gen Intern Med. 2014;29(7):1040–1047.
- , , , et al. Attending rounds in the current era: what is and is not happening. JAMA Intern Med. 2013;173(12):1084–1089.
- , . What the evidence shows about patient activation: better health outcomes and care experiences; fewer data on costs. Health Aff (Millwood). 2013;32(2):207–214.
- , , , , . When patient activation levels change, health outcomes and costs change, too. Health Aff Proj Hope. 2015;34(3):431–437.
- , , , et al. Evidence‐based guidelines for teaching patient‐centered interviewing. Patient Educ Couns. 2000;39(1):27–36.
- , , . Meta‐analysis of correlates of provider behavior in medical encounters. Med Care. 1988;26(7):657–675.
- , . Characteristics of potential plaintiffs in malpractice litigation. Ann Intern Med. 1994;120(9):792–798.
- , , , , . Bedside shift reports: what does the evidence say? J Nurs Adm. 2014;44(10):541–545.
Studies examining the importance of continuity of care have shown that patients who maintain a continuous relationship with a single physician have improved outcomes.[1, 2] However, most of these studies were performed in the outpatient, rather than the inpatient setting. With over 35 million patients admitted to hospitals in 2013, along with the significant increase in hospital discontinuity over recent years, the impact of inpatient continuity of care on quality outcomes and patient satisfaction is becoming increasingly relevant.[3, 4]
Service handoffs, when a physician hands over treatment responsibility for a panel of patients and is not expected to return, are a type of handoff that contributes to inpatient discontinuity. In particular, service handoffs between hospitalists are an especially common and inherently risky type of transition, as there is a severing of an established relationship during a patient's hospitalization. Unfortunately, due to the lack of evidence on the effects of service handoffs, current guidelines are limited in their recommendations.[5] Whereas several recent studies have begun to explore the effects of these handoffs, no prior study has examined this issue from a patient's perspective.[6, 7, 8]
Patients are uniquely positioned to inform us about their experiences in care transitions. Furthermore, with patient satisfaction now affecting Medicare reimbursement rates, patient experiences while in the hospital are becoming even more significant.[9] Despite this emphasis toward more patient‐centered care, no study has explored the hospitalized patient's experience with hospitalist service handoffs. Our goal was to qualitatively assess the hospitalized patients' experiences with transitions between hospitalists to develop a conceptual model to inform future work on improving inpatient transitions of care.
METHODS
Sampling and Recruitment
We conducted bedside interviews of hospitalized patients at an urban academic medical center from October 2014 through December 2014. The hospitalist service consists of a physician and an advanced nurse practitioner (ANP) who divide a panel of patients that consist of general medicine and subspecialty patients who are often comanaged with hepatology, oncology, and nephrology subspecialists. We performed a purposive selection of patients who could potentially comment on their experience with a hospitalist service transition using the following method: 48 hours after a service handoff (ie, an outgoing physician completing 1 week on service, then transfers the care of the patient to a new oncoming hospitalist), oncoming hospitalists were approached and asked if any patient on their service had experienced a service handoff and still remained in the hospital. A 48‐hour time period was chosen to give the patients time to familiarize themselves with their new hospitalist, allowing them to properly comment on the handoff. Patients who were managed by the ANP, who were non‐English speaking, or who were deemed to have an altered mental status based on clinical suspicion by the interviewing physician (C.M.W.) were excluded from participation. Following each weekly service transition, a list of patients who met the above criteria was collected from 4 nonteaching hospitalist services, and were approached by the primary investigator (C.M.W.) and asked if they would be willing to participate. All patients were general medicine patients and no exclusions were made based on physical location within the hospital. Those who agreed provided signed written consent prior to participation to allow access to the electronic health records (EHRs) by study personnel.
Data Collection
Patients were administered a 9‐question, semistructured interview that was informed by expert opinion and existing literature, which was developed to elicit their perspective regarding their transition between hospitalists.[10, 11] No formal changes were made to the interview guide during the study period, and all patients were asked the same questions. Outcomes from interim analysis guided further questioning in subsequent interviews so as to increase the depth of patient responses (ie, Can you explain your response in greater depth?). Prior to the interview, patients were read a description of a hospitalist, and were reminded which hospitalists had cared for them during their stay (see Supporting Information, Appendix 1, in the online version of this article). If family members or a caregiver were present at the time of interview, they were asked not to comment. No repeat interviews were carried out.
All interviews were performed privately in single‐occupancy rooms, digitally recorded using an iPad (Apple, Cupertino, CA) and professionally transcribed verbatim (Rev, San Francisco, CA). All analysis was performed using MAXQDA Software (VERBI Software GmbH, Berlin, Germany). We obtained demographic information about each patient through chart review
Data Analysis
Grounded theory was utilized, with an inductive approach with no a priori hypothesis.[12] The constant comparative method was used to generate emerging and reoccurring themes.[13] Units of analysis were sentences and phrases. Our research team consisted of 4 academic hospitalists, 2 with backgrounds in clinical medicine, medical education, and qualitative analysis (J.M.F., V.M.A.), 1 as a clinician (C.M.W.), and 1 in health economics (D.O.M.). Interim analysis was performed on a weekly basis (C.M.W.), during which time a coding template was created and refined through an iterative process (C.M.W., J.M.F.). All disagreements in coded themes were resolved through group discussion until full consensus was reached. Each week, responses were assessed for thematic saturation.[14] Interviews were continued if new themes arose during this analysis. Data collection was ended once we ceased to extract new topics from participants. A summary of all themes was then presented to a group of 10 patients who met the same inclusion criteria for respondent validation and member checking. All reporting was performed within the Standards for Reporting Qualitative Research, with additional guidance derived from the Consolidated Criteria for Reporting Qualitative Research.[15, 16] The University of Chicago Institutional Review Board approved this protocol.
RESULTS
In total, 43 eligible patients were recruited, and 40 (93%) agreed to participate. Interviewed patients were between 51 and 65 (39%) years old, had a mean age of 54.5 (15) years, were predominantly female (65%), African American (58%), had a median length of stay at the time of interview of 6.5 days (interquartile range [IQR]: 48), and had an average of 2.0 (IQR: 13) hospitalists oversee their care at the time of interview (Table 1). Interview times ranged from 10:25 to 25:48 minutes, with an average of 15:32 minutes.
| Value | |
|---|---|
| |
| Response rate, n (%) | 40/43 (93) |
| Age, mean SD | 54.5 15 |
| Sex, n (%) | |
| Female | 26 (65) |
| Male | 14 (35) |
| Race, n (%) | |
| African American | 23 (58) |
| White | 16 (40) |
| Hispanic | 1 (2) |
| Median LOS at time of interview, d (IQR) | 6.5 (48) |
| Median no. of hospitalists at time of interview, n (IQR) | 2.0 (13) |
We identified 6 major themes on patient perceptions of hospitalist service handoffs including (1) physician‐patient communication, (2) transparency in the hospitalist transition process, (3) indifference toward the hospitalist transition, (4) hospitalist‐subspecialist communication, (5) recognition of new opportunities due to a transition, and (6) hospitalists' bedside manner (Table 2).
| Themes | Subthemes | Representative Quotes |
|---|---|---|
| Physician‐patient communication | Patients dislike redundant communication with oncoming hospitalist. | I mean it's just you always have to explain your situation over and over and over again. (patient 14) |
| When I said it once already, then you're repeating it to another doctor. I feel as if that hospitalist didn't talk to the other hospitalist. (patient 7) | ||
| Poor communication can negatively affect the doctor‐patient relationship. | They don't really want to explain things. They don't think I'll understand. I think & yeah, I'm okay. You don't even have to put it in layman's terms. I know medical. I'm in nursing school. I have a year left. But even if you didn't know that, I would still hope you would try to tell me what was going on instead of just doing it in your head, and treating it. (patient 2) | |
| I mean it's just you always have to explain your situation over and over and over again. After a while you just stop trusting them. (patient 20) | ||
| Good communication can positively affect the doctor‐patient relationship. | Just continue with the communication, the open communication, and always stress to me that I have a voice and just going out of their way to do whatever they can to help me through whatever I'm going through. (patient 1) | |
| Transparency in transition | Patients want to be informed prior to a service changeover. | I think they should be told immediately, even maybe given prior notice, like this may happen, just so you're not surprised when it happens. (patient 15) |
| When the doctor approached me, he let me know that he wasn't going to be here the next day and there was going to be another doctor coming in. That made me feel comfortable. (patient 9) | ||
| Patients desire a more formalized process in the service changeover. | People want things to be consistent. People don't like change. They like routine. So, if he's leaving, you're coming on, I'd like for him to bring you in, introduce you to me, and for you just assure me that I'll take care of you. (patient 4) | |
| Just like when you get a new medication, you're given all this information on it. So when you get a new hospitalist, shouldn't I get all the information on them? Like where they went to school, what they look like. (patient 23) | ||
| Patients want clearer definition of the roles the physicians will play in their care. | The first time I was hospitalized for the first time I had all these different doctors coming in, and I had the residency, and the specialists, and the department, and I don't know who's who. What I asked them to do is when they come in the room, which they did, but introduce it a little more for me. Write it down like these are the special team and these are the doctors because even though they come in and give me their name, I have no idea what they're doing. (patient 5) | |
| Someone should explain the setup and who people are. Someone would say, Okay when you're in a hospital this is your [doctor's] role. Like they should have booklets and everything. (patient 19) | ||
| Indifference toward transition | Many patients have trust in service changeovers. | [S]o as long as everybody's on board and communicates well and efficiently, I don't have a problem with it. (patient 6) |
| To me, it really wasn't no preference, as long as I was getting the care that I needed. (patient 21) | ||
| It's not a concern as long as they're on the same page. (patient 17) | ||
| Hospitalist‐specialist communication | Patients are concerned about communication between their hospitalist and their subspecialists. | The more cooks you get in the kitchen, the more things get to get lost, so I'm always concerned that they're not sharing the same information, especially when you're getting asked the same questions that you might have just answered the last hour ago. (patient 9) |
| I don't know if the hospitalist are talking to them [subspecialist]. They haven't got time. (patient 35) | ||
| Patients place trust in the communication between hospitalist and subspecialist. | I think among the teams themselveswhich is my pain doctor, Dr. K's group, the oncology group itself, they switch off and trade with each other and they all speak the same language so that works out good. (patient 3) | |
| Lack of interprofessional communication can lead to patient concern. | I was afraid that one was going to drop the ball on something and not pass something on, or you know. (patient 11) | |
| I had numerous doctors who all seemed to not communicate with each other at all or did so by email or whatever. They didn't just sit down together and say we feel this way and we feel that way. I didn't like that at all. (patient 10) | ||
| New opportunities due to transition | Patients see new doctor as opportunity for medical reevaluation. | I see it as two heads are better than one, three heads are better than one, four heads are better than one. When people put their heads together to work towards a common goal, especially when they're, you know, people working their craft, it can't be bad. (patient 9) |
| I finally got my ears looked atbecause I've asked to have my ears looked at since Mondayand the new doc is trying to make an effort to look at them. (patient 39) | ||
| Patients see service changeover as an opportunity to form a better personal relationship. | Having a new hospitalist it gives you opportunity for a new beginning. (patient 11) | |
| Bedside manner | Good bedside manner can assist in a service changeover. | Some of them are all business‐like but some of them are, Well how do you feel today? Hi, how are you? So this made a little difference. You feel more comfortable. You're going to be more comfortable with them. Their bedside manner helps. (patient 16) |
| It's just like when a doctor sits down and talks to you, they just seem more relaxed and more .... I know they're very busy and they have lots of things to do and other patients to see, but while they're in there with you, you know, you don't get too much time with them. So bedside manner is just so important. (patient 24) | ||
| Poor bedside manner can be detrimental in transition. | [B]ecause they be so busy they claim they don't have time just to sit and talk to a patient, and make sure they all right. (patient 17) |
Physician‐Patient Communication
Communication between the physician and the patient was an important element in patients' assessment of their experience. Patient's tended to divide physician‐patient communication into 2 categories: good communication, which consisted of open communication (patient 1) and patient engagement, and bad communication, which was described as physicians not sharing information or taking the time to explain the course of care in words that I'll understand (patient 2). Patients also described dissatisfaction with redundant communication between multiple hospitalists and the frustration of often having to describe their clinical course to multiple providers.
Transparency in Communication
The desire to have greater transparency in the handoff process was another common theme. This was likely due to the fact that 34/40 (85%) of surveyed patients were unaware that a service changeover had ever taken place. This lack of transparency was viewed to have further downstream consequences as patients stated that there should be a level of transparency, and when it's not, then there is always trust issues (patient 1). Upon further questioning as to how to make the process more transparent, many patients recommended a formalized, face‐to‐face introduction involving the patient and both hospitalists, in which the outgoing hospitalist would, bring you [oncoming hospitalist] in, and introduce you to me (patient 4).
Patients often stated that given the large spectrum of physicians they might encounter during their stay (ie, medical student, resident, hospitalist attending, subspecialty fellow, subspecialist attending), clearer definitions of physicians' roles are needed.
Hospitalist‐Specialist Communication
Concern about the communication between their hospitalist and subspecialist was another predominant theme. Conflicting and unclear directions from multiple services were especially frustrating, as a patient stated, One guy took me off this pill, the other guy wants me on that pill, I'm like okay, I can't do both (patient 8). Furthermore, a subset of patients referenced their subspecialist as their primary care provider and preferred their subspecialist for guidance in their hospital course, rather than their hospitalist. This often appeared in cases where the patient had an established relationship with the subspecialist prior to their hospitalization.
New Opportunities Due to Transition
Patients expressed positive feelings toward service handoffs by viewing the transition as an opportunity for medical reevaluation by a new physician. Patients told of instances in which a specific complaint was not being addressed by the first physician, but would be addressed by the second (oncoming) physician. A commonly expressed idea was that the oncoming physician might know something that he [Dr. B] didn't know, and since Dr. B was only here for a week, why not give him [oncoming hospitalist] a chance (patient 10). Patients would also describe the transition as an opportunity to form, and possibly improve, therapeutic alliances with a new hospitalist.
Bedside Manner
Bedside manner was another commonly mentioned thematic element. Patients were often quick to forget prior problems or issues that they may have suffered because of the transition if the oncoming physician was perceived to have a good bedside manner, often described as someone who formally introduced themselves, was considered relaxed, and would take the time to sit and talk with the patient. As a patient put it, [S]he sat down and got to know meand asked me what I wanted to do (patient 12). Conversely, patients described instances in which a perceived bad bedside manner led to a poor relationship between the physician and the patient, in which trust and comfort (patient 11) were sacrificed.
Indifference Toward Transition
In contrast to some of the previous findings, which called for improved interactions between physicians and patients, we also discovered a theme of indifference toward the transition. Several patients stated feelings of trust with the medical system, and were content with the service changeover as long as they felt that their medical needs were being met. Patients also tended to express a level of acceptance with the transition, and tended to believe that this was the price we pay for being here [in the hospital] (patient 7).
Conceptual Model
Following the collection and analysis of all patient responses, all themes were utilized to construct the ideal patient‐centered service handoff. The ideal transition describes open lines of communication between all involved parties, is facilitated by multiple modalities, such as the EHRs and nursing staff, and recognizes the patient as the primary stakeholder (Figure 1).
DISCUSSION
To our knowledge, this is the first qualitative investigation of the hospitalized patient's experience with service handoffs between hospitalists. The patient perspective adds a personal and first‐hand description of how fragmented care may impact the hospitalized patient experience.
Of the 6 themes, communication was found to be the most pertinent to our respondents. Because much of patient care is an inherently communicative activity, it is not surprising that patients, as well as patient safety experts, have focused on communication as an area in need of improvement in transition processes.[17, 18] Moreover, multiple medical societies have directly called for improvements within this area, and have specifically recommended clear and direct communication of treatment plans between the patient and physician, timely exchange of information, and knowledge of who is primarily in charge of the patients care.[11] Not surprisingly, each of these recommendations appears to be echoed by our participants. This theme is especially important given that good physician‐patient communication has been noted to be a major goal in achieving patient‐centered care, and has been positively correlated to medication adherence, patient satisfaction, and physical health outcomes.[19, 20, 21, 22, 23]
Although not a substitute for face‐to‐face interactions, other communication interventions between physicians and patients should be considered. For example, get to know me posters placed in patient rooms have been shown to encourage communication between patients and physicians.[24] Additionally, physician face cards have been used to improve patients' abilities to identify and clarify physicians' roles in patient care.[25] As a patient put it, If they got a new one [hospitalist], just as if I got a new medicationprint out information on themlike where they went to med school, and stuff(patient 13). These modalities may represent highly implementable, cost‐effective adjuncts to current handoff methods that may improve lines of communication between physicians and patients.
In addition to the importance placed on physician‐patient communication, interprofessional communication between hospitalists and subspecialists was also highly regarded. Studies have shown that practice‐based interprofessional communication, such as daily interdisciplinary rounds and the use of external facilitators, can improve healthcare processes and outcomes.[26] However, these interventions must be weighed with the many conflicting factors that both hospitalists and subspecialists face on daily basis, including high patient volumes, time limitations, patient availability, and scheduling conflicts.[27] None the less, the strong emphasis patients placed on this line of communication highlights this domain as an area in which hospitalist and subspecialist can work together for systematic improvement.
Patients also recognized the complexity of the transfer process between hospitalists and called for improved transparency. For example, patients repeatedly requested to be informed prior to any changes in their hospitalists, a request that remains consistent with current guidelines.[11] There also existed a strong desire for a more formalized process of transitioning between hospitalists, which often described a handoff procedure that would occur at the patient's bedside. This desire seems to be mirrored in the data that show that patients prefer to interact with their care team at the bedside and report higher satisfaction when they are involved with their care.[28, 29] Unfortunately, this desire for more direct interaction with physicians runs counter to the current paradigm of patient care, where most activities on rounds do not take place at the bedside.[30]
In contrast to patient's calls for improved transparency, an equally large portion of patients expressed relative indifference to the transition. Whereas on the surface this may seem salutary, some studies suggest that a lack of patient activation and engagement may have adverse effects toward patients' overall care.[31] Furthermore, others have shown evidence of better healthcare experiences, improved health outcomes, and lower costs in patients who are more active in their care.[30, 31] Altogether, this suggests that despite some patients' indifference, physicians should continue to engage patients in their hospital care.[32]
Although prevailing sentiments among patient safety advocates are that patient handoffs are inherently dangerous and place patients at increased risk of adverse events, patients did not always share this concern. A frequently occurring theme was that the transition is an opportunity for medical reevaluation or the establishment of a new, possibly improved therapeutic alliance. Recognizing this viewpoint offers oncoming hospitalists the opportunity to focus on issues that the patient may have felt were not being properly addressed with their prior physician.
Finally, although our conceptual model is not a strict guideline, we believe that any future studies should consider this framework when constructing interventions to improve service‐level handoffs. Several interventions already exist. For instance, educational interventions, such as patient‐centered interviewing, have been shown to improve patient satisfaction, compliance with medications, lead to fewer lawsuits, and improve health outcomes.[33, 34, 35] Additional methods of keeping the patient more informed include physician face sheets and performance of the handoff at the patient's bedside. Although well known in nursing literature, the idea of physicians performing handoffs at the patient's bedside is a particularly patient‐centric process.[36] This type of intervention may have the ability to transform the handoff from the current state of a 2‐way street, in which information is passed between 2 hospitalists, to a 3‐way stop, in which both hospitalists and the patient are able to communicate at this critical junction of care.
Although our study does offer new insight into the effects of discontinuous care, its exploratory nature does have limitations. First, being performed at a single academic center limits our ability to generalize our findings. Second, perspectives of those who did not wish to participate, patients' family members or caregivers, and those who were not queried, could highly differ from those we interviewed. Additionally, we did not collect data on patients' diagnoses or reason for admission, thus limiting our ability to assess if certain diagnosis or subpopulations predispose patients to experiencing a service handoff. Third, although our study was restricted to English‐speaking patients only, we must consider that non‐English speakers would likely suffer from even greater communication barriers than those who took part in our study. Finally, our interviews and data analysis were conducted by hospitalists, which could have subconsciously influenced the interview process, and the interpretation of patient responses. However, we tried to mitigate these issues by having the same individual interview all participants, by using an interview guide to ensure cross‐cohort consistency, by using open‐ended questions, and by attempting to give patients every opportunity to express themselves.
CONCLUSIONS
From a patients' perspective, inpatient service handoffs are often opaque experiences that are highlighted by poor communication between physicians and patients. Although deficits in communication and transparency acted as barriers to a patient‐centered handoff, physicians should recognize that service handoffs may also represent opportunities for improvement, and should focus on these domains when they start on a new service.
Disclosures
All funding for this project was provided by the Section of Hospital Medicine at The University of Chicago Medical Center. The data from this article were presented at the Society of Hospital Medicine Annual Conference, National Harbor, March 31, 2015, and at the Society of General Internal Medicine National Meeting in Toronto, Canada, April 23, 2015. The authors report that no conflicts of interest, financial or otherwise, exist.
- , , , , , . Continuity of outpatient and inpatient care by primary care physicians for hospitalized older adults. JAMA. 2009;301(16):1671–1680.
- , , , et al. Continuity of care and the risk of preventable hospitalization in older adults. JAMA Intern Med. 2013;173(20):1879–1885.
- Agency for Healthcare Research and Quality. HCUPnet: a tool for identifying, tracking, and analyzing national hospital statistics. Available at: http://hcupnet.ahrq.gov/HCUPnet.jsp?Id=82B37DA366A36BAD6(8):438–444.
- , , , , , . Hospitalist handoffs: a systematic review and task force recommendations. J Hosp Med. 2009;4(7):433–440.
- , , , , . The impact of fragmentation of hospitalist care on length of stay. J Hosp Med. 2010;5(6):335–338.
- , , , et al. The impact of hospitalist discontinuity on hospital cost, readmissions, and patient satisfaction. J Gen Intern Med. 2014;29(7):1004–1008.
- , , , et al. The effect of hospitalist discontinuity on adverse events. J Hosp Med. 2015;10(3):147–151.
- Agency for Healthcare Research and Quality. HCAHPS Fact Sheet. CAHPS Hospital Survey August 2013. Available at: http://www.hcahpsonline.org/files/August_2013_HCAHPS_Fact_Sheet3.pdf. Accessed February 2, 2015.
- , , , et al. A conceptual framework for studying the safety of transitions in emergency care. In: Henriksen K, Battles JB, Marks ES, eds. Advances in Patient Safety: From Research to Implementation. Rockville, MD: Agency for Healthcare Research and Quality; 2005:309–321. Concepts and Methodology; vol 2. Available at: http://www.ncbi.nlm.nih.gov/books/NBK20522. Accessed January 15, 2015.
- , , , et al. Transitions of care consensus policy statement American College of Physicians‐Society of General Internal Medicine‐Society of Hospital Medicine‐American Geriatrics Society‐American College of Emergency Physicians‐Society of Academic Emergency Medicine. J Gen Intern Med. 2009;24(8):971–976.
- , . Grounded theory in medical education research: AMEE guide no. 70. Med Teach. 2012;34(10):850–861.
- . A purposeful approach to the constant comparative method in the analysis of qualitative interviews. Qual Quant. 2002;36(4):391–409.
- . The significance of saturation. Qual Health Res. 1995;5(2):147–149.
- , , , , . Standards for reporting qualitative research: a synthesis of recommendations. Acad Med. 2014;89(9):1245–1251.
- , , . Consolidated criteria for reporting qualitative research (COREQ): a 32‐item checklist for interviews and focus groups. Int J Qual Health Care. 2007;19(6):349–357.
- , , , . Promoting effective transitions of care at hospital discharge: a review of key issues for hospitalists. J Hosp Med. 2007;2(5):314–323.
- The Joint Commission. Hot Topics in Healthcare, Issue 2. Transitions of care: the need for collaboration across entire care continuum. Available at: http://www.jointcommission.org/assets/1/6/TOC_Hot_Topics.pdf. Accessed April 9, 2015.
- , . Physician communication and patient adherence to treatment: a meta‐analysis. Med Care. 2009;47(8):826–834.
- , . Impediments to adherence to post myocardial infarction medications. Curr Cardiol Rep. 2013;15(1):322.
- , , , , . Medical specialists' patient‐centered communication and patient‐reported outcomes. Med Care. 2007;45(4):330–339.
- , , , . Does doctor‐patient communication affect patient satisfaction with hospital care? Results of an analysis with a novel instrumental variable. Health Serv Res. 2008;43(5 pt 1):1505–1519.
- , , . Patient‐centredness in chronic illness: what is it and does it matter? Patient Educ Couns. 2003;51(3):197–206.
- , , , et al. Merging cultures: palliative care specialists in the medical intensive care unit. Crit Care Med. 2006;34(11 suppl):S388–S393.
- , , , et al. Improving inpatients' identification of their doctors: use of FACE cards. Jt Comm J Qual Patient Saf. 2009;35(12):613–619.
- , , . Interprofessional collaboration: effects of practice‐based interventions on professional practice and healthcare outcomes. Cochrane Database Syst Rev. 2009;(3):CD000072.
- , , , et al. Identifying and overcoming the barriers to bedside rounds: a multicenter qualitative study. Acad Med. 2014;89(2):326–334.
- , , , , . The effect of bedside case presentations on patients' perceptions of their medical care. N Engl J Med. 1997;336(16):1150–1155.
- , , , . Patient‐centered interprofessional collaborative care: factors associated with bedside interprofessional rounds. J Gen Intern Med. 2014;29(7):1040–1047.
- , , , et al. Attending rounds in the current era: what is and is not happening. JAMA Intern Med. 2013;173(12):1084–1089.
- , . What the evidence shows about patient activation: better health outcomes and care experiences; fewer data on costs. Health Aff (Millwood). 2013;32(2):207–214.
- , , , , . When patient activation levels change, health outcomes and costs change, too. Health Aff Proj Hope. 2015;34(3):431–437.
- , , , et al. Evidence‐based guidelines for teaching patient‐centered interviewing. Patient Educ Couns. 2000;39(1):27–36.
- , , . Meta‐analysis of correlates of provider behavior in medical encounters. Med Care. 1988;26(7):657–675.
- , . Characteristics of potential plaintiffs in malpractice litigation. Ann Intern Med. 1994;120(9):792–798.
- , , , , . Bedside shift reports: what does the evidence say? J Nurs Adm. 2014;44(10):541–545.

Measuring Patient Experiences
The hospitalized patient experience has become an area of increased focus for hospitals given the recent coupling of patient satisfaction to reimbursement rates for Medicare patients.[1] Although patient experiences are multifactorial, 1 component is the relationship that hospitalized patients develop with their inpatient physicians. In recognition of the importance of this relationship, several organizations including the Society of Hospital Medicine, Society of General Internal Medicine, American College of Physicians, the American College of Emergency Physicians, and the Accreditation Council for Graduate Medical Education have recommended that patients know and understand who is guiding their care at all times during their hospitalization.[2, 3] Unfortunately, previous studies have shown that hospitalized patients often lack the ability to identify[4, 5] and understand their course of care.[6, 7] This may be due to numerous clinical factors including lack of a prior relationship, rapid pace of clinical care, and the frequent transitions of care found in both hospitalists and general medicine teaching services.[5, 8, 9] Regardless of the cause, one could hypothesize that patients who are unable to identify or understand the role of their physician may be less informed about their hospitalization, which may lead to further confusion, dissatisfaction, and ultimately a poor experience.
Given the proliferation of nonteaching hospitalist services in teaching hospitals, it is important to understand if patient experiences differ between general medicine teaching and hospitalist services. Several reasons could explain why patient experiences may vary on these services. For example, patients on a hospitalist service will likely interact with a single physician caretaker, which may give a feeling of more personalized care. In contrast, patients on general medicine teaching services are cared for by larger teams of residents under the supervision of an attending physician. Residents are also subjected to duty‐hour restrictions, clinic responsibilities, and other educational requirements that may impede the continuity of care for hospitalized patients.[10, 11, 12] Although 1 study has shown that hospitalist‐intensive hospitals perform better on patient satisfaction measures,[13] no study to date has compared patient‐reported experiences on general medicine teaching and nonteaching hospitalist services. This study aimed to evaluate the hospitalized patient experience on both teaching and nonteaching hospitalist services by assessing several patient‐reported measures of their experience, namely their confidence in their ability to identify their physician(s), understand their roles, and their rating of both the coordination and overall care.
METHODS
Study Design
We performed a retrospective cohort analysis at the University of Chicago Medical Center between July 2007 and June 2013. Data were acquired as part of the Hospitalist Project, an ongoing study that is used to evaluate the impact of hospitalists, and now serves as infrastructure to continue research related to hospital care at University of Chicago.[14] Patients were cared for by either the general medicine teaching service or the nonteaching hospitalist service. General medicine teaching services were composed of an attending physician who rotates for 2 weeks at a time, a second‐ or third‐year medicine resident, 1 to 2 medicine interns, and 1 to 2 medical students.[15] The attending physician assigned to the patient's hospitalization was the attending listed on the first day of hospitalization, regardless of the length of hospitalization. Nonteaching hospitalist services consisted of a single hospitalist who worked 7‐day shifts, and were assisted by a nurse practitioner/physician's assistant (NPA). The majority of attendings on the hospitalist service were less than 5 years out of residency. Both services admitted 7 days a week, with patients initially admitted to the general medicine teaching service until resident caps were met, after which all subsequent admissions were admitted to the hospitalist service. In addition, the hospitalist service is also responsible for specific patient subpopulations, such as lung and renal transplants, and oncologic patients who have previously established care with our institution.
Data Collection
During a 30‐day posthospitalization follow‐up questionnaire, patients were surveyed regarding their confidence in their ability to identify and understand the roles of their physician(s) and their perceptions of the overall coordination of care and their overall care, using a 5‐point Likert scale (1 = poor understanding to 5 = excellent understanding). Questions related to satisfaction with care and coordination were derived from the Picker‐Commonwealth Survey, a previously validated survey meant to evaluate patient‐centered care.[16] Patients were also asked to report their race, level of education, comorbid diseases, and whether they had any prior hospitalizations within 1 year. Chart review was performed to obtain patient age, gender, and hospital length of stay (LOS), and calculated Charlson Comorbidity Index (CCI).[17] Patients with missing data or responses to survey questions were excluded from final analysis. The University of Chicago Institutional Review Board approved the study protocol, and all patients provided written consented prior to participation.
Data Analysis
After initial analysis noted that outcomes were skewed, the decision was made to dichotomize the data and use logistic rather than linear regression models. Patient responses to the follow‐up phone questionnaire were dichotomized to reflect the top 2 categories (excellent and very good). Pearson 2 analysis was used to assess for any differences in demographic characteristics, disease severity, and measures of patient experience between the 2 services. To assess if service type was associated with differences in our 4 measures of patient experience, we created a 3‐level mixed‐effects logistic regression using a logit function while controlling for age, gender, race, CCI, LOS, previous hospitalizations within 1 year, level of education, and academic year. These models studied the longitudinal association between teaching service and the 4 outcome measures, while also controlling for the cluster effect of time nested within individual patients who were clustered within physicians. The model included random intercepts at both the patient and physician level and also included a random effect of service (teaching vs nonteaching) at the patient level. A Hausman test was used to determine if these random‐effects models improved fit over a fixed‐effects model, and the intraclass correlations were compared using likelihood ratio tests to determine the appropriateness of a 3‐level versus 2‐level model. Data management and 2 analyses were performed using Stata version 13.0 (StataCorp, College Station, TX), and mixed‐effects regression models were done in SuperMix (Scientific Software International, Skokie, IL).
RESULTS
In total, 14,855 patients were enrolled during their hospitalization with 57% and 61% completing the 30‐day follow‐up survey on the hospitalist and general medicine teaching service, respectively. In total, 4131 (69%) and 4322 (48%) of the hospitalist and general medicine services, respectively, either did not answer all survey questions, or were missing basic demographic data, and thus were excluded. Data from 4591 patients on the general medicine teaching (52% of those enrolled at hospitalization) and 1811 on the hospitalist service (31% of those enrolled at hospitalization) were used for final analysis (Figure 1). Respondents were predominantly female (61% and 56%), African American (75% and 63%), with a mean age of 56.2 (19.4) and 57.1 (16.1) years, for the general medicine teaching and hospitalist services, respectively. A majority of patients (71% and 66%) had a CCI of 0 to 3 on both services. There were differences in self‐reported comorbidities between the 2 groups, with hospitalist services having a higher prevalence of cancer (20% vs 7%), renal disease (25% vs 18%), and liver disease (23% vs 7%). Patients on the hospitalist service had a longer mean LOS (5.5 vs 4.8 days), a greater percentage of a hospitalization within 1 year (58% vs 52%), and a larger proportion who were admitted in 2011 to 2013 compared to 2007 to 2010 (75% vs 39%), when compared to the general medicine teaching services. Median LOS and interquartile ranges were similar between both groups. Although most baseline demographics were statistically different between the 2 groups (Table 1), these differences were likely clinically insignificant. Compared to those who responded to the follow‐up survey, nonresponders were more likely to be African American (73% and 64%, P < 0.001) and female (60% and 56%, P < 0.01). The nonresponders were more likely to be hospitalized in the past 1 year (62% and 53%, P < 0.001) and have a lower CCI (CCI 03 [75% and 80%, P < 0.001]) compared to responders. Demographics between responders and nonresponders were also statistically different from one another.
| Variable | General Medicine Teaching | Nonteaching Hospitalist | P Value |
|---|---|---|---|
| |||
| Total (n) | 4,591 | 1,811 | <0.001 |
| Attending classification, hospitalist, n (%) | 1,147 (25) | 1,811 (100) | |
| Response rate, % | 61 | 57 | <0.01 |
| Age, y, mean SD | 56.2 19.4 | 57.1 16.1 | <0.01 |
| Gender, n (%) | <0.01 | ||
| Male | 1,796 (39) | 805 (44) | |
| Female | 2,795 (61) | 1,004 (56) | |
| Race, n (%) | <0.01 | ||
| African American | 3,440 (75) | 1,092 (63) | |
| White | 900 (20) | 571 (32) | |
| Asian/Pacific | 38 (1) | 17 (1) | |
| Other | 20 (1) | 10 (1) | |
| Unknown | 134 (3) | 52 (3) | |
| Charlson Comorbidity Index, n (%) | <0.001 | ||
| 0 | 1,635 (36) | 532 (29) | |
| 12 | 1,590 (35) | 675 (37) | |
| 39 | 1,366 (30) | 602 (33) | |
| Self‐reported comorbidities | |||
| Anemia/sickle cell disease | 1,201 (26) | 408 (23) | 0.003 |
| Asthma/COPD | 1,251 (28) | 432 (24) | 0.006 |
| Cancer* | 300 (7) | 371 (20) | <0.001 |
| Depression | 1,035 (23) | 411 (23) | 0.887 |
| Diabetes | 1,381 (30) | 584 (32) | 0.087 |
| Gastrointestinal | 1,140 (25) | 485 (27) | 0.104 |
| Cardiac | 1,336 (29) | 520 (29) | 0.770 |
| Hypertension | 2,566 (56) | 1,042 (58) | 0.222 |
| HIV/AIDS | 151 (3) | 40 (2) | 0.022 |
| Kidney disease | 828 (18) | 459 (25) | <0.001 |
| Liver disease | 313 (7) | 417 (23) | <0.001 |
| Stroke | 543 (12) | 201 (11) | 0.417 |
| Education level | 0.066 | ||
| High school | 2,248 (49) | 832 (46) | |
| Junior college/college | 1,878 (41) | 781 (43) | |
| Postgraduate | 388 (8) | 173 (10) | |
| Don't know | 77 (2) | 23 (1) | |
| Academic year, n (%) | <0.001 | ||
| July 2007 June 2008 | 938 (20) | 90 (5) | |
| July 2008 June 2009 | 702 (15) | 148 (8) | |
| July 2009 June 2010 | 576(13) | 85 (5) | |
| July 2010 June 2011 | 602 (13) | 138 (8) | |
| July 2011 June 2012 | 769 (17) | 574 (32) | |
| July 2012 June 2013 | 1,004 (22) | 774 (43) | |
| Length of stay, d, mean SD | 4.8 7.3 | 5.5 6.4 | <0.01 |
| Prior hospitalization (within 1 year), yes, n (%) | 2,379 (52) | 1,039 (58) | <0.01 |

Unadjusted results revealed that patients on the hospitalist service were more confident in their abilities to identify their physician(s) (50% vs 45%, P < 0.001), perceived greater ability in understanding the role of their physician(s) (54% vs 50%, P < 0.001), and reported greater satisfaction with coordination and teamwork (68% vs 64%, P = 0.006) and with overall care (73% vs 67%, P < 0.001) (Figure 2).
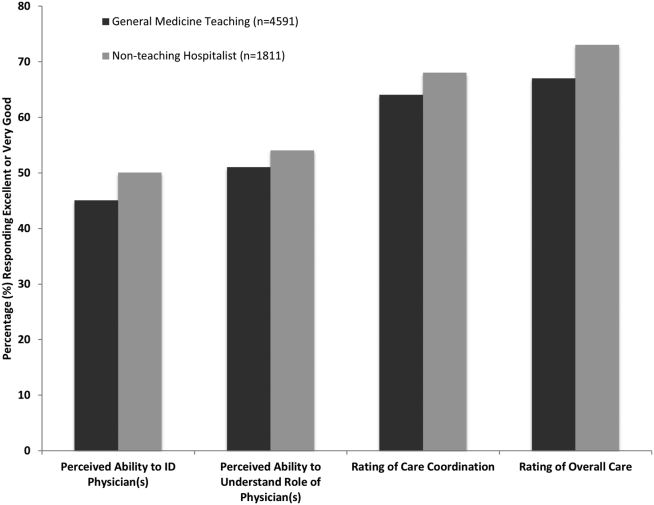
From the mixed‐effects regression models it was discovered that admission to the hospitalist service was associated with a higher odds ratio (OR) of reporting overall care as excellent or very good (OR: 1.33; 95% confidence interval [CI]: 1.15‐1.47). There was no difference between services in patients' ability to identify their physician(s) (OR: 0.89; 95% CI: 0.61‐1.11), in patients reporting a better understanding of the role of their physician(s) (OR: 1.09; 95% CI: 0.94‐1.23), or in their rating of overall coordination and teamwork (OR: 0.71; 95% CI: 0.42‐1.89).
A subgroup analysis was performed on the 25% of hospitalist attendings in the general medicine teaching service comparing this cohort to the hospitalist services, and it was found that patients perceived better overall care on the hospitalist service (OR: 1.17; 95% CI: 1.01‐ 1.31) than on the general medicine service (Table 2). All other domains in the subgroup analysis were not statistically significant. Finally, an ordinal logistic regression was performed for each of these outcomes, but it did not show any major differences compared to the logistic regression of dichotomous outcomes.
| Domains in Patient Experience* | Odds Ratio (95% CI) | P Value |
|---|---|---|
| ||
| How would you rate your ability to identify the physicians and trainees on your general medicine team during the hospitalization? | ||
| Model 1 | 0.89 (0.611.11) | 0.32 |
| Model 2 | 0.98 (0.671.22) | 0.86 |
| How would you rate your understanding of the roles of the physicians and trainees on your general medicine team? | ||
| Model 1 | 1.09 (0.941.23) | 0.25 |
| Model 2 | 1.19 (0.981.36) | 0.08 |
| How would you rate the overall coordination and teamwork among the doctors and nurses who care for you during your hospital stay? | ||
| Model 1 | 0.71 (0.421.89) | 0.18 |
| Model 2 | 0.82 (0.651.20) | 0.23 |
| Overall, how would you rate the care you received at the hospital? | ||
| Model 1 | 1.33 (1.151.47) | 0.001 |
| Model 2 | 1.17 (1.011.31) | 0.04 |
DISCUSSION
This study is the first to directly compare measures of patient experience on hospitalist and general medicine teaching services in a large, multiyear comparison across multiple domains. In adjusted analysis, we found that patients on nonteaching hospitalist services rated their overall care better than those on general medicine teaching services, whereas no differences in patients' ability to identify their physician(s), understand their role in their care, or rating of coordination of care were found. Although the magnitude of the differences in rating of overall care may appear small, it remains noteworthy because of the recent focus on patient experience at the reimbursement level, where small differences in performance can lead to large changes in payment. Because of the observational design of this study, it is important to consider mechanisms that could account for our findings.
The first are the structural differences between the 2 services. Our subgroup analysis comparing patients rating of overall care on a general medicine service with a hospitalist attending to a pure hospitalist cohort found a significant difference between the groups, indicating that the structural differences between the 2 groups may be a significant contributor to patient satisfaction ratings. Under the care of a hospitalist service, a patient would only interact with a single physician on a daily basis, possibly leading to a more meaningful relationship and improved communication between patient and provider. Alternatively, while on a general medicine teaching service, patients would likely interact with multiple physicians, as a result making their confidence in their ability to identify and perception at understanding physicians' roles more challenging.[18] This dilemma is further compounded by duty hour restrictions, which have subsequently led to increased fragmentation in housestaff scheduling. The patient experience on the general medicine teaching service may be further complicated by recent data that show residents spend a minority of time in direct patient care,[19, 20] which could additionally contribute to patients' inability to understand who their physicians are and to the decreased satisfaction with their care. This combination of structural complexity, duty hour reform, and reduced direct patient interaction would likely decrease the chance a patient will interact with the same resident on a consistent basis,[5, 21] thus making the ability to truly understand who their caretakers are, and the role they play, more difficult.
Another contributing factor could be the use of NPAs on our hospitalist service. Given that these providers often see the patient on a more continual basis, hospitalized patients' exposure to a single, continuous caretaker may be a factor in our findings.[22] Furthermore, with studies showing that hospitalists also spend a small fraction of their day in direct patient care,[23, 24, 25] the use of NPAs may allow our hospitalists to spend greater amounts of time with their patients, thus improving patients' rating of their overall care and influencing their perceived ability to understand their physician's role.
Although there was no difference between general medicine teaching and hospitalist services with respect to patient understanding of their roles, our data suggest that both groups would benefit from interventions to target this area. Focused attempts at improving patient's ability to identify and explain the roles of their inpatient physician(s) have been performed. For example, previous studies have attempted to improve a patient's ability to identify their physician through physician facecards[8, 9] or the use of other simple interventions (ie, bedside whiteboards).[4, 26] Results from such interventions are mixed, as they have demonstrated the capacity to improve patients' ability to identify who their physician is, whereas few have shown any appreciable improvement in patient satisfaction.[26]
Although our findings suggest that structural differences in team composition may be a possible explanation, it is also important to consider how the quality of care a patient receives affects their experience. For instance, hospitalists have been shown to produce moderate improvements in patient‐centered outcomes such as 30‐day readmission[27] and hospital length of stay[14, 28, 29, 30, 31] when compared to other care providers, which in turn could be reflected in the patient's perception of their overall care. In a large national study of acute care hospitals using the Hospital Consumer Assessment of Healthcare Providers and Systems survey, Chen and colleagues found that for most measures of patient satisfaction, hospitals with greater use of hospitalist care were associated with better patient‐centered care.[13] These outcomes were in part driven by patient‐centered domains such as discharge planning, pain control, and medication management. It is possible that patients are sensitive to the improved outcomes that are associated with hospitalist services, and reflect this in their measures of patient satisfaction.
Last, because this is an observational study and not a randomized trial, it is possible that the clinical differences in the patients cared for by these services could have led to our findings. Although the clinical significance of the differences in patient demographics were small, patients seen on the hospitalist service were more likely to be older white males, with a slightly longer LOS, greater comorbidities, and more hospitalizations in the previous year than those seen on the general medicine teaching service. Additionally, our hospitalist service frequently cares for highly specific subpopulations (ie, liver and renal transplant patients, and oncology patients), which could have influenced our results. For example, transplant patients who may be very grateful for their second chance, are preferentially admitted to the hospitalist service, which could have biased our results in favor of hospitalists.[32] Unfortunately, we were unable to control for all such factors.
Although we hope that multivariable analysis can adjust for many of these differences, we are not able to account for possible unmeasured confounders such as time of day of admission, health literacy, personality differences, physician turnover, or nursing and other ancillary care that could contribute to these findings. In addition to its observational study design, our study has several other limitations. First, our study was performed at a single institution, thus limiting its generalizability. Second, as a retrospective study based on observational data, no definitive conclusions regarding causality can be made. Third, although our response rate was low, it is comparable to other studies that have examined underserved populations.[33, 34] Fourth, because our survey was performed 30 days after hospitalization, this may impart imprecision on our outcomes measures. Finally, we were not able to mitigate selection bias through imputation for missing data .
All together, given the small absolute differences between the groups in patients' ratings of their overall care compared to large differences in possible confounders, these findings call for further exploration into the significance and possible mechanisms of these outcomes. Our study raises the potential possibility that the structural component of a care team may play a role in overall patient satisfaction. If this is the case, future studies of team structure could help inform how best to optimize this component for the patient experience. On the other hand, if process differences are to explain our findings, it is important to distill the types of processes hospitalists are using to improve the patient experience and potentially export this to resident services.
Finally, if similar results were found in other institutions, these findings could have implications on how hospitals respond to new payment models that are linked to patient‐experience measures. For example, the Hospital Value‐Based Purchasing Program currently links the Centers for Medicare and Medicaid Services payments to a set of quality measures that consist of (1) clinical processes of care (70%) and (2) the patient experience (30%).[1] Given this linkage, any small changes in the domain of patient satisfaction could have large payment implications on a national level.
CONCLUSION
In summary, in this large‐scale multiyear study, patients cared for by a nonteaching hospitalist service reported greater satisfaction with their overall care than patients cared for by a general medicine teaching service. This difference could be mediated by the structural differences between these 2 services. As hospitals seek to optimize patient experiences in an era where reimbursement models are now being linked to patient‐experience measures, future work should focus on further understanding the mechanisms for these findings.
Disclosures
Financial support for this work was provided by the Robert Wood Johnson Investigator Program (RWJF Grant ID 63910 PI Meltzer), a Midcareer Career Development Award from the National Institute of Aging (1 K24 AG031326‐01, PI Meltzer), and a Clinical and Translational Science Award (NIH/NCATS 2UL1TR000430‐08, PI Solway, Meltzer Core Leader). The authors report no conflicts of interest.
- Hospital Consumer Assessment of Healthcare Providers and Systems. HCAHPS fact sheet. CAHPS hospital survey August 2013. Available at: http://www.hcahpsonline.org/files/August_2013_HCAHPS_Fact_Sheet3.pdf. Accessed February 2, 2015.
- , , , et al. Transitions of Care Consensus policy statement: American College of Physicians, Society of General Internal Medicine, Society of Hospital Medicine, American Geriatrics Society, American College Of Emergency Physicians, and Society for Academic Emergency Medicine. J Hosp Med. 2009;4(6):364–370.
- Accreditation Council for Graduate Medical Education. Common program requirements. Available at: http://www.acgme.org/acgmeweb/Portals/0/PFAssets/ProgramRequirements/CPRs2013.pdf. Accessed January 15, 2015.
- , , . Increasing a patient's ability to identify his or her attending physician using a patient room display. Arch Intern Med. 2010;170(12):1084–1085.
- , , , , , . Ability of hospitalized patients to identify their in‐hospital physicians. Arch Intern Med. 2009;169(2):199–201.
- , , , et al. Hospitalized patients' understanding of their plan of care. Mayo Clin Proc. 2010;85(1):47–52.
- , , , et al. Patient‐physician communication at hospital discharge and patients' understanding of the postdischarge treatment plan. Arch Intern Med. 1997;157(9):1026–1030.
- , , , et al. Improving inpatients' identification of their doctors: use of FACE cards. Jt Comm J Qual Patient Saf. 2009;35(12):613–619.
- , , , , , . The impact of facecards on patients' knowledge, satisfaction, trust, and agreement with hospital physicians: a pilot study. J Hosp Med. 2014;9(3):137–141.
- , , . Restructuring an inpatient resident service to improve outcomes for residents, students, and patients. Acad Med. 2011;86(12):1500–1507.
- , , . Residency training in the modern era: the pipe dream of less time to learn more, care better, and be more professional. Arch Intern Med. 2005;165(22):2561–2562.
- , , , , . Managing discontinuity in academic medical centers: strategies for a safe and effective resident sign‐out. J Hosp Med. 2006;1(4):257–266.
- , , , . Hospitalist staffing and patient satisfaction in the national Medicare population. J Hosp Med. 2013;8(3):126–131.
- , , , et al. Effects of physician experience on costs and outcomes on an academic general medicine service: results of a trial of hospitalists. Ann Intern Med. 2002;137(11):866–874.
- , , , , , . The Effects of on‐duty napping on intern sleep time and fatigue. Ann Intern Med. 2006;144(11):792–798.
- , , , et al. Patients evaluate their hospital care: a national survey. Health Aff (Millwood). 1991;10(4):254–267.
- , , , . A new method of classifying prognostic comorbidity in longitudinal studies: development and validation. J Chronic Dis. 1987;40(5):373–383.
- Agency for Healthcare Research and Quality. Welcome to HCUPnet. Available at: http://hcupnet.ahrq.gov/HCUPnet.jsp?Id=F70FC59C286BADCB371(4):293–295.
- , , , et al. In the wake of the 2003 and 2011 duty hours regulations, how do internal medicine interns spend their time? J Gen Intern Med. 2013;28(8):1042–1047.
- , , , , , . The composition of intern work while on call. J Gen Intern Med. 2012;27(11):1432–1437.
- , , , et al. Effect of the 2011 vs 2003 duty hour regulation‐compliant models on sleep duration, trainee education, and continuity of patient care among internal medicine house staff: a randomized trial. JAMA Intern Med. 2013;173(8):649–655.
- , , , et al. The impact of hospitalist discontinuity on hospital cost, readmissions, and patient satisfaction. J Gen Intern Med. 2014;29(7):1004–1008.
- , , , , . Hospitalist time usage and cyclicality: opportunities to improve efficiency. J Hosp Med. 2010;5(6):329–334.
- , , , et al. Where did the day go?—a time‐motion study of hospitalists. J Hosp Med. 2010;5(6):323–328.
- , , . How hospitalists spend their time: insights on efficiency and safety. J Hosp Med. 2006;1(2):88–93.
- , , . Patient satisfaction associated with correct identification of physician's photographs. Mayo Clin Proc. 2001;76(6):604–608.
- , , , . Comparing patient outcomes of academician‐preceptors, hospitalist‐preceptors, and hospitalists on internal medicine services in an academic medical center. J Gen Intern Med. 2014;29(12):1672–1678.
- , , , . Comparison of processes and outcomes of pneumonia care between hospitalists and community‐based primary care physicians. Mayo Clin Proc. 2002;77(10):1053–1058.
- , , , , , . Outcomes of care by hospitalists, general internists, and family physicians. N Engl J Med. 2007;357(25):2589–2600.
- . A systematic review of outcomes and quality measures in adult patients cared for by hospitalists vs nonhospitalists. Mayo Clin Proc. 2009;84(3):248–254.
- , . Do hospitalist physicians improve the quality of inpatient care delivery? A systematic review of process, efficiency and outcome measures. BMC Med. 2011;9(1):58.
- , . Patients' experiences of everyday life after lung transplantation. J Clin Nurs. 2009;18(24):3472–3479.
- , , , et al. Optimal design features for surveying low‐income populations. J Health Care Poor Underserved. 2005;16(4):677–690.
The hospitalized patient experience has become an area of increased focus for hospitals given the recent coupling of patient satisfaction to reimbursement rates for Medicare patients.[1] Although patient experiences are multifactorial, 1 component is the relationship that hospitalized patients develop with their inpatient physicians. In recognition of the importance of this relationship, several organizations including the Society of Hospital Medicine, Society of General Internal Medicine, American College of Physicians, the American College of Emergency Physicians, and the Accreditation Council for Graduate Medical Education have recommended that patients know and understand who is guiding their care at all times during their hospitalization.[2, 3] Unfortunately, previous studies have shown that hospitalized patients often lack the ability to identify[4, 5] and understand their course of care.[6, 7] This may be due to numerous clinical factors including lack of a prior relationship, rapid pace of clinical care, and the frequent transitions of care found in both hospitalists and general medicine teaching services.[5, 8, 9] Regardless of the cause, one could hypothesize that patients who are unable to identify or understand the role of their physician may be less informed about their hospitalization, which may lead to further confusion, dissatisfaction, and ultimately a poor experience.
Given the proliferation of nonteaching hospitalist services in teaching hospitals, it is important to understand if patient experiences differ between general medicine teaching and hospitalist services. Several reasons could explain why patient experiences may vary on these services. For example, patients on a hospitalist service will likely interact with a single physician caretaker, which may give a feeling of more personalized care. In contrast, patients on general medicine teaching services are cared for by larger teams of residents under the supervision of an attending physician. Residents are also subjected to duty‐hour restrictions, clinic responsibilities, and other educational requirements that may impede the continuity of care for hospitalized patients.[10, 11, 12] Although 1 study has shown that hospitalist‐intensive hospitals perform better on patient satisfaction measures,[13] no study to date has compared patient‐reported experiences on general medicine teaching and nonteaching hospitalist services. This study aimed to evaluate the hospitalized patient experience on both teaching and nonteaching hospitalist services by assessing several patient‐reported measures of their experience, namely their confidence in their ability to identify their physician(s), understand their roles, and their rating of both the coordination and overall care.
METHODS
Study Design
We performed a retrospective cohort analysis at the University of Chicago Medical Center between July 2007 and June 2013. Data were acquired as part of the Hospitalist Project, an ongoing study that is used to evaluate the impact of hospitalists, and now serves as infrastructure to continue research related to hospital care at University of Chicago.[14] Patients were cared for by either the general medicine teaching service or the nonteaching hospitalist service. General medicine teaching services were composed of an attending physician who rotates for 2 weeks at a time, a second‐ or third‐year medicine resident, 1 to 2 medicine interns, and 1 to 2 medical students.[15] The attending physician assigned to the patient's hospitalization was the attending listed on the first day of hospitalization, regardless of the length of hospitalization. Nonteaching hospitalist services consisted of a single hospitalist who worked 7‐day shifts, and were assisted by a nurse practitioner/physician's assistant (NPA). The majority of attendings on the hospitalist service were less than 5 years out of residency. Both services admitted 7 days a week, with patients initially admitted to the general medicine teaching service until resident caps were met, after which all subsequent admissions were admitted to the hospitalist service. In addition, the hospitalist service is also responsible for specific patient subpopulations, such as lung and renal transplants, and oncologic patients who have previously established care with our institution.
Data Collection
During a 30‐day posthospitalization follow‐up questionnaire, patients were surveyed regarding their confidence in their ability to identify and understand the roles of their physician(s) and their perceptions of the overall coordination of care and their overall care, using a 5‐point Likert scale (1 = poor understanding to 5 = excellent understanding). Questions related to satisfaction with care and coordination were derived from the Picker‐Commonwealth Survey, a previously validated survey meant to evaluate patient‐centered care.[16] Patients were also asked to report their race, level of education, comorbid diseases, and whether they had any prior hospitalizations within 1 year. Chart review was performed to obtain patient age, gender, and hospital length of stay (LOS), and calculated Charlson Comorbidity Index (CCI).[17] Patients with missing data or responses to survey questions were excluded from final analysis. The University of Chicago Institutional Review Board approved the study protocol, and all patients provided written consented prior to participation.
Data Analysis
After initial analysis noted that outcomes were skewed, the decision was made to dichotomize the data and use logistic rather than linear regression models. Patient responses to the follow‐up phone questionnaire were dichotomized to reflect the top 2 categories (excellent and very good). Pearson 2 analysis was used to assess for any differences in demographic characteristics, disease severity, and measures of patient experience between the 2 services. To assess if service type was associated with differences in our 4 measures of patient experience, we created a 3‐level mixed‐effects logistic regression using a logit function while controlling for age, gender, race, CCI, LOS, previous hospitalizations within 1 year, level of education, and academic year. These models studied the longitudinal association between teaching service and the 4 outcome measures, while also controlling for the cluster effect of time nested within individual patients who were clustered within physicians. The model included random intercepts at both the patient and physician level and also included a random effect of service (teaching vs nonteaching) at the patient level. A Hausman test was used to determine if these random‐effects models improved fit over a fixed‐effects model, and the intraclass correlations were compared using likelihood ratio tests to determine the appropriateness of a 3‐level versus 2‐level model. Data management and 2 analyses were performed using Stata version 13.0 (StataCorp, College Station, TX), and mixed‐effects regression models were done in SuperMix (Scientific Software International, Skokie, IL).
RESULTS
In total, 14,855 patients were enrolled during their hospitalization with 57% and 61% completing the 30‐day follow‐up survey on the hospitalist and general medicine teaching service, respectively. In total, 4131 (69%) and 4322 (48%) of the hospitalist and general medicine services, respectively, either did not answer all survey questions, or were missing basic demographic data, and thus were excluded. Data from 4591 patients on the general medicine teaching (52% of those enrolled at hospitalization) and 1811 on the hospitalist service (31% of those enrolled at hospitalization) were used for final analysis (Figure 1). Respondents were predominantly female (61% and 56%), African American (75% and 63%), with a mean age of 56.2 (19.4) and 57.1 (16.1) years, for the general medicine teaching and hospitalist services, respectively. A majority of patients (71% and 66%) had a CCI of 0 to 3 on both services. There were differences in self‐reported comorbidities between the 2 groups, with hospitalist services having a higher prevalence of cancer (20% vs 7%), renal disease (25% vs 18%), and liver disease (23% vs 7%). Patients on the hospitalist service had a longer mean LOS (5.5 vs 4.8 days), a greater percentage of a hospitalization within 1 year (58% vs 52%), and a larger proportion who were admitted in 2011 to 2013 compared to 2007 to 2010 (75% vs 39%), when compared to the general medicine teaching services. Median LOS and interquartile ranges were similar between both groups. Although most baseline demographics were statistically different between the 2 groups (Table 1), these differences were likely clinically insignificant. Compared to those who responded to the follow‐up survey, nonresponders were more likely to be African American (73% and 64%, P < 0.001) and female (60% and 56%, P < 0.01). The nonresponders were more likely to be hospitalized in the past 1 year (62% and 53%, P < 0.001) and have a lower CCI (CCI 03 [75% and 80%, P < 0.001]) compared to responders. Demographics between responders and nonresponders were also statistically different from one another.
| Variable | General Medicine Teaching | Nonteaching Hospitalist | P Value |
|---|---|---|---|
| |||
| Total (n) | 4,591 | 1,811 | <0.001 |
| Attending classification, hospitalist, n (%) | 1,147 (25) | 1,811 (100) | |
| Response rate, % | 61 | 57 | <0.01 |
| Age, y, mean SD | 56.2 19.4 | 57.1 16.1 | <0.01 |
| Gender, n (%) | <0.01 | ||
| Male | 1,796 (39) | 805 (44) | |
| Female | 2,795 (61) | 1,004 (56) | |
| Race, n (%) | <0.01 | ||
| African American | 3,440 (75) | 1,092 (63) | |
| White | 900 (20) | 571 (32) | |
| Asian/Pacific | 38 (1) | 17 (1) | |
| Other | 20 (1) | 10 (1) | |
| Unknown | 134 (3) | 52 (3) | |
| Charlson Comorbidity Index, n (%) | <0.001 | ||
| 0 | 1,635 (36) | 532 (29) | |
| 12 | 1,590 (35) | 675 (37) | |
| 39 | 1,366 (30) | 602 (33) | |
| Self‐reported comorbidities | |||
| Anemia/sickle cell disease | 1,201 (26) | 408 (23) | 0.003 |
| Asthma/COPD | 1,251 (28) | 432 (24) | 0.006 |
| Cancer* | 300 (7) | 371 (20) | <0.001 |
| Depression | 1,035 (23) | 411 (23) | 0.887 |
| Diabetes | 1,381 (30) | 584 (32) | 0.087 |
| Gastrointestinal | 1,140 (25) | 485 (27) | 0.104 |
| Cardiac | 1,336 (29) | 520 (29) | 0.770 |
| Hypertension | 2,566 (56) | 1,042 (58) | 0.222 |
| HIV/AIDS | 151 (3) | 40 (2) | 0.022 |
| Kidney disease | 828 (18) | 459 (25) | <0.001 |
| Liver disease | 313 (7) | 417 (23) | <0.001 |
| Stroke | 543 (12) | 201 (11) | 0.417 |
| Education level | 0.066 | ||
| High school | 2,248 (49) | 832 (46) | |
| Junior college/college | 1,878 (41) | 781 (43) | |
| Postgraduate | 388 (8) | 173 (10) | |
| Don't know | 77 (2) | 23 (1) | |
| Academic year, n (%) | <0.001 | ||
| July 2007 June 2008 | 938 (20) | 90 (5) | |
| July 2008 June 2009 | 702 (15) | 148 (8) | |
| July 2009 June 2010 | 576(13) | 85 (5) | |
| July 2010 June 2011 | 602 (13) | 138 (8) | |
| July 2011 June 2012 | 769 (17) | 574 (32) | |
| July 2012 June 2013 | 1,004 (22) | 774 (43) | |
| Length of stay, d, mean SD | 4.8 7.3 | 5.5 6.4 | <0.01 |
| Prior hospitalization (within 1 year), yes, n (%) | 2,379 (52) | 1,039 (58) | <0.01 |
Unadjusted results revealed that patients on the hospitalist service were more confident in their abilities to identify their physician(s) (50% vs 45%, P < 0.001), perceived greater ability in understanding the role of their physician(s) (54% vs 50%, P < 0.001), and reported greater satisfaction with coordination and teamwork (68% vs 64%, P = 0.006) and with overall care (73% vs 67%, P < 0.001) (Figure 2).
From the mixed‐effects regression models it was discovered that admission to the hospitalist service was associated with a higher odds ratio (OR) of reporting overall care as excellent or very good (OR: 1.33; 95% confidence interval [CI]: 1.15‐1.47). There was no difference between services in patients' ability to identify their physician(s) (OR: 0.89; 95% CI: 0.61‐1.11), in patients reporting a better understanding of the role of their physician(s) (OR: 1.09; 95% CI: 0.94‐1.23), or in their rating of overall coordination and teamwork (OR: 0.71; 95% CI: 0.42‐1.89).
A subgroup analysis was performed on the 25% of hospitalist attendings in the general medicine teaching service comparing this cohort to the hospitalist services, and it was found that patients perceived better overall care on the hospitalist service (OR: 1.17; 95% CI: 1.01‐ 1.31) than on the general medicine service (Table 2). All other domains in the subgroup analysis were not statistically significant. Finally, an ordinal logistic regression was performed for each of these outcomes, but it did not show any major differences compared to the logistic regression of dichotomous outcomes.
| Domains in Patient Experience* | Odds Ratio (95% CI) | P Value |
|---|---|---|
| ||
| How would you rate your ability to identify the physicians and trainees on your general medicine team during the hospitalization? | ||
| Model 1 | 0.89 (0.611.11) | 0.32 |
| Model 2 | 0.98 (0.671.22) | 0.86 |
| How would you rate your understanding of the roles of the physicians and trainees on your general medicine team? | ||
| Model 1 | 1.09 (0.941.23) | 0.25 |
| Model 2 | 1.19 (0.981.36) | 0.08 |
| How would you rate the overall coordination and teamwork among the doctors and nurses who care for you during your hospital stay? | ||
| Model 1 | 0.71 (0.421.89) | 0.18 |
| Model 2 | 0.82 (0.651.20) | 0.23 |
| Overall, how would you rate the care you received at the hospital? | ||
| Model 1 | 1.33 (1.151.47) | 0.001 |
| Model 2 | 1.17 (1.011.31) | 0.04 |
DISCUSSION
This study is the first to directly compare measures of patient experience on hospitalist and general medicine teaching services in a large, multiyear comparison across multiple domains. In adjusted analysis, we found that patients on nonteaching hospitalist services rated their overall care better than those on general medicine teaching services, whereas no differences in patients' ability to identify their physician(s), understand their role in their care, or rating of coordination of care were found. Although the magnitude of the differences in rating of overall care may appear small, it remains noteworthy because of the recent focus on patient experience at the reimbursement level, where small differences in performance can lead to large changes in payment. Because of the observational design of this study, it is important to consider mechanisms that could account for our findings.
The first are the structural differences between the 2 services. Our subgroup analysis comparing patients rating of overall care on a general medicine service with a hospitalist attending to a pure hospitalist cohort found a significant difference between the groups, indicating that the structural differences between the 2 groups may be a significant contributor to patient satisfaction ratings. Under the care of a hospitalist service, a patient would only interact with a single physician on a daily basis, possibly leading to a more meaningful relationship and improved communication between patient and provider. Alternatively, while on a general medicine teaching service, patients would likely interact with multiple physicians, as a result making their confidence in their ability to identify and perception at understanding physicians' roles more challenging.[18] This dilemma is further compounded by duty hour restrictions, which have subsequently led to increased fragmentation in housestaff scheduling. The patient experience on the general medicine teaching service may be further complicated by recent data that show residents spend a minority of time in direct patient care,[19, 20] which could additionally contribute to patients' inability to understand who their physicians are and to the decreased satisfaction with their care. This combination of structural complexity, duty hour reform, and reduced direct patient interaction would likely decrease the chance a patient will interact with the same resident on a consistent basis,[5, 21] thus making the ability to truly understand who their caretakers are, and the role they play, more difficult.
Another contributing factor could be the use of NPAs on our hospitalist service. Given that these providers often see the patient on a more continual basis, hospitalized patients' exposure to a single, continuous caretaker may be a factor in our findings.[22] Furthermore, with studies showing that hospitalists also spend a small fraction of their day in direct patient care,[23, 24, 25] the use of NPAs may allow our hospitalists to spend greater amounts of time with their patients, thus improving patients' rating of their overall care and influencing their perceived ability to understand their physician's role.
Although there was no difference between general medicine teaching and hospitalist services with respect to patient understanding of their roles, our data suggest that both groups would benefit from interventions to target this area. Focused attempts at improving patient's ability to identify and explain the roles of their inpatient physician(s) have been performed. For example, previous studies have attempted to improve a patient's ability to identify their physician through physician facecards[8, 9] or the use of other simple interventions (ie, bedside whiteboards).[4, 26] Results from such interventions are mixed, as they have demonstrated the capacity to improve patients' ability to identify who their physician is, whereas few have shown any appreciable improvement in patient satisfaction.[26]
Although our findings suggest that structural differences in team composition may be a possible explanation, it is also important to consider how the quality of care a patient receives affects their experience. For instance, hospitalists have been shown to produce moderate improvements in patient‐centered outcomes such as 30‐day readmission[27] and hospital length of stay[14, 28, 29, 30, 31] when compared to other care providers, which in turn could be reflected in the patient's perception of their overall care. In a large national study of acute care hospitals using the Hospital Consumer Assessment of Healthcare Providers and Systems survey, Chen and colleagues found that for most measures of patient satisfaction, hospitals with greater use of hospitalist care were associated with better patient‐centered care.[13] These outcomes were in part driven by patient‐centered domains such as discharge planning, pain control, and medication management. It is possible that patients are sensitive to the improved outcomes that are associated with hospitalist services, and reflect this in their measures of patient satisfaction.
Last, because this is an observational study and not a randomized trial, it is possible that the clinical differences in the patients cared for by these services could have led to our findings. Although the clinical significance of the differences in patient demographics were small, patients seen on the hospitalist service were more likely to be older white males, with a slightly longer LOS, greater comorbidities, and more hospitalizations in the previous year than those seen on the general medicine teaching service. Additionally, our hospitalist service frequently cares for highly specific subpopulations (ie, liver and renal transplant patients, and oncology patients), which could have influenced our results. For example, transplant patients who may be very grateful for their second chance, are preferentially admitted to the hospitalist service, which could have biased our results in favor of hospitalists.[32] Unfortunately, we were unable to control for all such factors.
Although we hope that multivariable analysis can adjust for many of these differences, we are not able to account for possible unmeasured confounders such as time of day of admission, health literacy, personality differences, physician turnover, or nursing and other ancillary care that could contribute to these findings. In addition to its observational study design, our study has several other limitations. First, our study was performed at a single institution, thus limiting its generalizability. Second, as a retrospective study based on observational data, no definitive conclusions regarding causality can be made. Third, although our response rate was low, it is comparable to other studies that have examined underserved populations.[33, 34] Fourth, because our survey was performed 30 days after hospitalization, this may impart imprecision on our outcomes measures. Finally, we were not able to mitigate selection bias through imputation for missing data .
All together, given the small absolute differences between the groups in patients' ratings of their overall care compared to large differences in possible confounders, these findings call for further exploration into the significance and possible mechanisms of these outcomes. Our study raises the potential possibility that the structural component of a care team may play a role in overall patient satisfaction. If this is the case, future studies of team structure could help inform how best to optimize this component for the patient experience. On the other hand, if process differences are to explain our findings, it is important to distill the types of processes hospitalists are using to improve the patient experience and potentially export this to resident services.
Finally, if similar results were found in other institutions, these findings could have implications on how hospitals respond to new payment models that are linked to patient‐experience measures. For example, the Hospital Value‐Based Purchasing Program currently links the Centers for Medicare and Medicaid Services payments to a set of quality measures that consist of (1) clinical processes of care (70%) and (2) the patient experience (30%).[1] Given this linkage, any small changes in the domain of patient satisfaction could have large payment implications on a national level.
CONCLUSION
In summary, in this large‐scale multiyear study, patients cared for by a nonteaching hospitalist service reported greater satisfaction with their overall care than patients cared for by a general medicine teaching service. This difference could be mediated by the structural differences between these 2 services. As hospitals seek to optimize patient experiences in an era where reimbursement models are now being linked to patient‐experience measures, future work should focus on further understanding the mechanisms for these findings.
Disclosures
Financial support for this work was provided by the Robert Wood Johnson Investigator Program (RWJF Grant ID 63910 PI Meltzer), a Midcareer Career Development Award from the National Institute of Aging (1 K24 AG031326‐01, PI Meltzer), and a Clinical and Translational Science Award (NIH/NCATS 2UL1TR000430‐08, PI Solway, Meltzer Core Leader). The authors report no conflicts of interest.
- Hospital Consumer Assessment of Healthcare Providers and Systems. HCAHPS fact sheet. CAHPS hospital survey August 2013. Available at: http://www.hcahpsonline.org/files/August_2013_HCAHPS_Fact_Sheet3.pdf. Accessed February 2, 2015.
- , , , et al. Transitions of Care Consensus policy statement: American College of Physicians, Society of General Internal Medicine, Society of Hospital Medicine, American Geriatrics Society, American College Of Emergency Physicians, and Society for Academic Emergency Medicine. J Hosp Med. 2009;4(6):364–370.
- Accreditation Council for Graduate Medical Education. Common program requirements. Available at: http://www.acgme.org/acgmeweb/Portals/0/PFAssets/ProgramRequirements/CPRs2013.pdf. Accessed January 15, 2015.
- , , . Increasing a patient's ability to identify his or her attending physician using a patient room display. Arch Intern Med. 2010;170(12):1084–1085.
- , , , , , . Ability of hospitalized patients to identify their in‐hospital physicians. Arch Intern Med. 2009;169(2):199–201.
- , , , et al. Hospitalized patients' understanding of their plan of care. Mayo Clin Proc. 2010;85(1):47–52.
- , , , et al. Patient‐physician communication at hospital discharge and patients' understanding of the postdischarge treatment plan. Arch Intern Med. 1997;157(9):1026–1030.
- , , , et al. Improving inpatients' identification of their doctors: use of FACE cards. Jt Comm J Qual Patient Saf. 2009;35(12):613–619.
- , , , , , . The impact of facecards on patients' knowledge, satisfaction, trust, and agreement with hospital physicians: a pilot study. J Hosp Med. 2014;9(3):137–141.
- , , . Restructuring an inpatient resident service to improve outcomes for residents, students, and patients. Acad Med. 2011;86(12):1500–1507.
- , , . Residency training in the modern era: the pipe dream of less time to learn more, care better, and be more professional. Arch Intern Med. 2005;165(22):2561–2562.
- , , , , . Managing discontinuity in academic medical centers: strategies for a safe and effective resident sign‐out. J Hosp Med. 2006;1(4):257–266.
- , , , . Hospitalist staffing and patient satisfaction in the national Medicare population. J Hosp Med. 2013;8(3):126–131.
- , , , et al. Effects of physician experience on costs and outcomes on an academic general medicine service: results of a trial of hospitalists. Ann Intern Med. 2002;137(11):866–874.
- , , , , , . The Effects of on‐duty napping on intern sleep time and fatigue. Ann Intern Med. 2006;144(11):792–798.
- , , , et al. Patients evaluate their hospital care: a national survey. Health Aff (Millwood). 1991;10(4):254–267.
- , , , . A new method of classifying prognostic comorbidity in longitudinal studies: development and validation. J Chronic Dis. 1987;40(5):373–383.
- Agency for Healthcare Research and Quality. Welcome to HCUPnet. Available at: http://hcupnet.ahrq.gov/HCUPnet.jsp?Id=F70FC59C286BADCB371(4):293–295.
- , , , et al. In the wake of the 2003 and 2011 duty hours regulations, how do internal medicine interns spend their time? J Gen Intern Med. 2013;28(8):1042–1047.
- , , , , , . The composition of intern work while on call. J Gen Intern Med. 2012;27(11):1432–1437.
- , , , et al. Effect of the 2011 vs 2003 duty hour regulation‐compliant models on sleep duration, trainee education, and continuity of patient care among internal medicine house staff: a randomized trial. JAMA Intern Med. 2013;173(8):649–655.
- , , , et al. The impact of hospitalist discontinuity on hospital cost, readmissions, and patient satisfaction. J Gen Intern Med. 2014;29(7):1004–1008.
- , , , , . Hospitalist time usage and cyclicality: opportunities to improve efficiency. J Hosp Med. 2010;5(6):329–334.
- , , , et al. Where did the day go?—a time‐motion study of hospitalists. J Hosp Med. 2010;5(6):323–328.
- , , . How hospitalists spend their time: insights on efficiency and safety. J Hosp Med. 2006;1(2):88–93.
- , , . Patient satisfaction associated with correct identification of physician's photographs. Mayo Clin Proc. 2001;76(6):604–608.
- , , , . Comparing patient outcomes of academician‐preceptors, hospitalist‐preceptors, and hospitalists on internal medicine services in an academic medical center. J Gen Intern Med. 2014;29(12):1672–1678.
- , , , . Comparison of processes and outcomes of pneumonia care between hospitalists and community‐based primary care physicians. Mayo Clin Proc. 2002;77(10):1053–1058.
- , , , , , . Outcomes of care by hospitalists, general internists, and family physicians. N Engl J Med. 2007;357(25):2589–2600.
- . A systematic review of outcomes and quality measures in adult patients cared for by hospitalists vs nonhospitalists. Mayo Clin Proc. 2009;84(3):248–254.
- , . Do hospitalist physicians improve the quality of inpatient care delivery? A systematic review of process, efficiency and outcome measures. BMC Med. 2011;9(1):58.
- , . Patients' experiences of everyday life after lung transplantation. J Clin Nurs. 2009;18(24):3472–3479.
- , , , et al. Optimal design features for surveying low‐income populations. J Health Care Poor Underserved. 2005;16(4):677–690.
© 2015 Society of Hospital Medicine