User login
Association Between Anemia and Fatigue in Hospitalized Patients: Does the Measure of Anemia Matter?
Fatigue is the most common clinical symptom of anemia and is a significant concern to patients.1,2 In ambulatory patients, lower hemoglobin (Hb) concentration is associated with increased fatigue.2,3 Accordingly, therapies that treat anemia by increasing Hb concentration, such as erythropoiesis stimulating agents,4-7 often use fatigue as an outcome measure.
In hospitalized patients, transfusion of red blood cell increases Hb concentration and is the primary treatment for anemia. However, the extent to which transfusion and changes in Hb concentration affect hospitalized patients’ fatigue levels is not well established. Guidelines support transfusing patients with symptoms of anemia, such as fatigue, on the assumption that the increased oxygen delivery will improve the symptoms of anemia. While transfusion studies in hospitalized patients have consistently reported that transfusion at lower or “restrictive” Hb concentrations is safe compared with transfusion at higher Hb concentrations,8-10 these studies have mainly used cardiac events and mortality as outcomes rather than patient symptoms, such as fatigue. Nevertheless, they have resulted in hospitals increasingly adopting restrictive transfusion policies that discourage transfusion at higher Hb levels.11,12 Consequently, the rate of transfusion in hospitalized patients has decreased,13 raising questions of whether some patients with lower Hb concentrations may experience increased fatigue as a result of restrictive transfusion policies. Fatigue among hospitalized patients is important not only because it is an adverse symptom but because it may result in decreased activity levels, deconditioning, and losses in functional status.14,15While the effect of alternative transfusion policies on fatigue in hospitalized patients could be answered by a randomized clinical trial using fatigue and functional status as outcomes, an important first step is to assess whether the Hb concentration of hospitalized patients is associated with their fatigue level during hospitalization. Because hospitalized patients often have acute illnesses that can cause fatigue in and of themselves, it is possible that anemia is not associated with fatigue in hospitalized patients despite anemia’s association with fatigue in ambulatory patients. Additionally, Hb concentration varies during hospitalization,16 raising the question of what measures of Hb during hospitalization might be most associated with anemia-related fatigue.
The objective of this study is to explore multiple Hb measures in hospitalized medical patients with anemia and test whether any of these Hb measures are associated with patients’ fatigue level.
METHODS
Study Design
We performed a prospective, observational study of hospitalized patients with anemia on the general medicine services at The University of Chicago Medical Center (UCMC). The institutional review board approved the study procedures, and all study subjects provided informed consent.
Study Eligibility
Between April 2014 and June 2015, all general medicine inpatients were approached for written consent for The University of Chicago Hospitalist Project,17 a research infrastructure at UCMC. Among patients consenting to participate in the Hospitalist Project, patients were eligible if they had Hb <9 g/dL at any point during their hospitalization and were age ≥50 years. Hb concentration of <9 g/dL was chosen to include the range of Hb values covered by most restrictive transfusion policies.8-10,18 Age ≥50 years was an inclusion criteria because anemia is more strongly associated with poor outcomes, including functional impairment, among older patients compared with younger patients.14,19-21 If patients were not eligible for inclusion at the time of consent for the Hospitalist Project, their Hb values were reviewed twice daily until hospital discharge to assess if their Hb was <9 g/dL. Proxies were sought to answer questions for patients who failed the Short Portable Mental Status Questionnaire.22
Patient Demographic Data Collection
Research assistants abstracted patient age and sex from the electronic health record (EHR), and asked patients to self-identify their race. The individual comorbidities included as part of the Charlson Comorbidity Index were identified using International Classification of Diseases, 9th Revision codes from hospital administrative data for each encounter and specifically included the following: myocardial infarction, congestive heart failure, peripheral vascular disease, cerebrovascular disease, dementia, chronic pulmonary disease, rheumatic disease, peptic ulcer disease, liver disease, diabetes, hemiplegia and/or paraplegia, renal disease, cancer, and human immunodeficiency virus/acquired immunodeficiency syndrome.23 We also used Healthcare Cost and Utilization Project (www.hcup-us.ahrq.gov/toolssoftware/ccs/ccs.jsp) diagnosis categories to identify whether patients had sickle cell (SC) anemia, gastrointestinal bleeding (GIB), or a depressive disorder (DD) because these conditions are associated with anemia (SC and GIB) and fatigue (DD).24
Measuring Anemia
Hb measures were available only when hospital providers ordered them as part of routine practice. The first Hb concentration <9 g/dL during a patient’s hospitalization, which made them eligible for study participation, was obtained through manual review of the EHR. All additional Hb values during the patient’s hospitalization were obtained from the hospital’s administrative data mart. All Hb values collected for each patient during the hospitalization were used to calculate summary measures of Hb during the hospitalization, including the mean Hb, median Hb, minimum Hb, maximum Hb, admission (first recorded) Hb, and discharge (last recorded) Hb. Hb measures were analyzed both as a continuous variable and as a categorical variable created by dividing the continuous Hb measures into integer ranges of 3 groups of approximately the same size.
Measuring Fatigue
Our primary outcome was patients’ level of fatigue reported during hospitalization, measured using the Functional Assessment of Chronic Illness Therapy (FACIT)-Anemia questionnaire. Fatigue was measured using a 13-question fatigue subscale,1,2,25 which measures fatigue within the past 7 days. Scores on the fatigue subscale range from 0 to 52, with lower scores reflecting greater levels of fatigue. As soon as patients met the eligibility criteria for study participation during their hospitalization (age ≥50 years and Hb <9 g/dL), they were approached to answer the FACIT questions. Values for missing data in the fatigue subscale for individual subjects were filled in using a prorated score from their answered questions as long as >50% of the items in the fatigue subscale were answered, in accordance with recommendations for addressing missing data in the FACIT.26 Fatigue was analyzed as a continuous variable and as a dichotomous variable created by dividing the sample into high (FACIT <27) and low (FACIT ≥27) levels of fatigue based on the median FACIT score of the population. Previous literature has shown a FACIT fatigue subscale score between 23 and 26 to be associated with an Eastern Cooperative Oncology Group (ECOG)27 C Performance Status rating of 2 to 33 compared to scores ≥27.
Statistical Analysis
Statistical analysis was performed using Stata statistical software (StataCorp, College Station, TX). Descriptive statistics were used to characterize patient demographics. Analysis of variance was used to test for differences in the mean fatigue levels across Hb measures. χ2 tests were performed to test for associations between high fatigue levels and the Hb measures. Multivariable analysis, including both linear and logistic regression models, were used to test the association of Hb concentration and fatigue. P values <0.05 using a 2-tailed test were deemed statistically significant.
RESULTS
Patient Characteristics
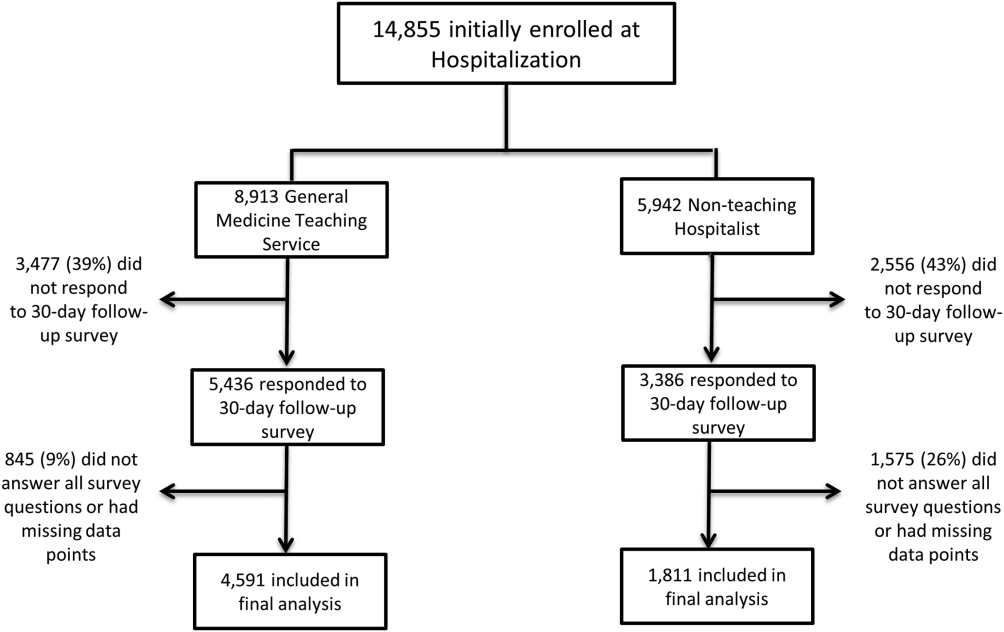
During the study period, 8559 patients were admitted to the general medicine service. Of those, 5073 (59%) consented for participation in the Hospitalist Project, and 3670 (72%) completed the Hospitalist Project inpatient interview. Of these patients, 1292 (35%) had Hb <9 g/dL, and 784 (61%) were 50 years or older and completed the FACIT questionnaire.
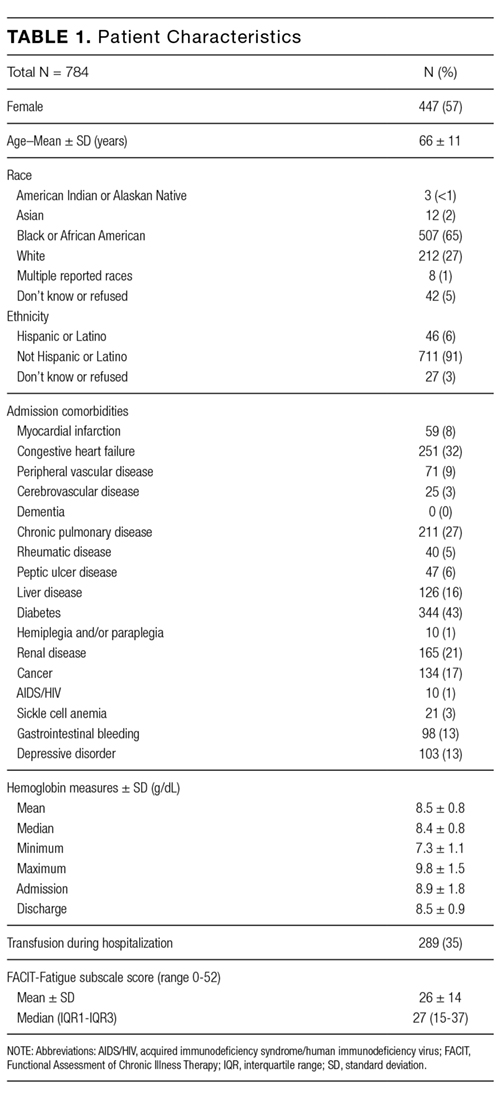
Table 1 reports the demographic characteristics and comorbidities for the sample, the mean (standard deviation [SD]) for the 6 Hb measures, and mean (SD) and median FACIT scores.
Bivariate Association of Fatigue and Hb
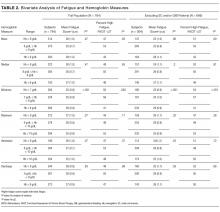
Categorizing patients into low, middle, or high Hb for each of the 6 Hb measures, minimum Hb was strongly associated with fatigue, with a weaker association for mean Hb and no statistically significant association for the other measures.
Minimum Hb. Patients with a minimum Hb <7 g/dL and patients with Hb 7-8 g/dL had higher fatigue levels (FACIT = 25 for each) than patients with a minimum Hb ≥8 g/dL (FACIT = 29; P < 0.001; Table 2). When excluding patients with SC and/or GIB because their average minimum Hb differed from the average minimum Hb of the full population (P < 0.001), patients with a minimum Hb <7 g/dL or 7-8 g/dL had even higher fatigue levels (FACIT = 23 and FACIT = 24, respectively), with no change in the fatigue level of patients with a minimum Hb ≥8 g/dL (FACIT = 29; P < 0.001; Table 2). Lower minimum Hb continued to be associated with higher fatigue levels when analyzed in 0.5 g/dL increments (Figure).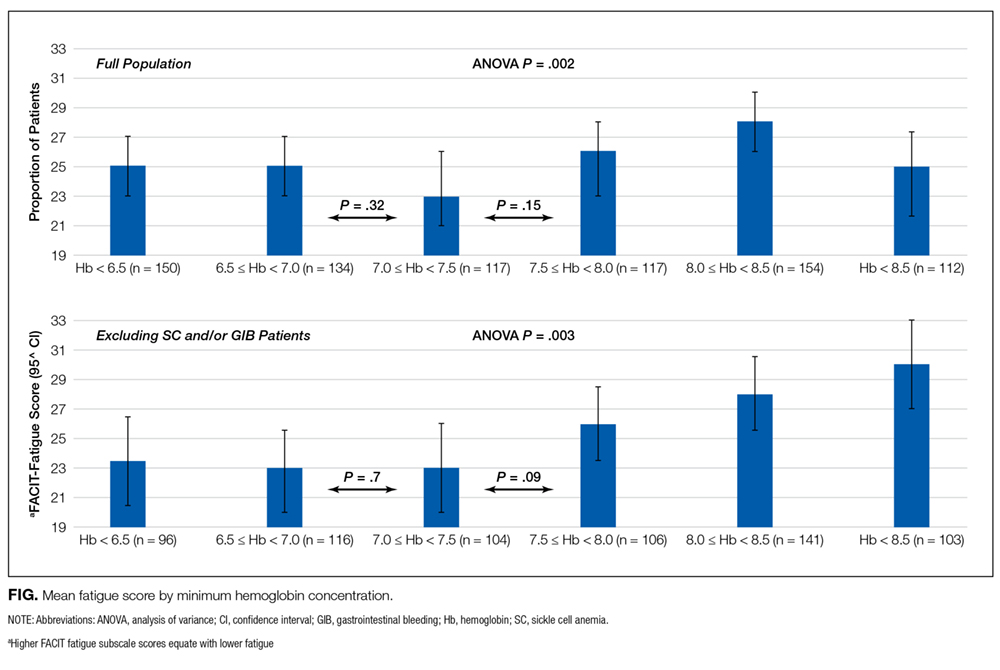
Mean Hb and Other Measures. Fatigue levels were high for 47% of patients with a mean Hb <8g /dL and 53% of patients with a mean Hb 8-9 g/dL compared with 43% of patients with a mean Hb ≥9 g/dL (P = 0.05). However, the association between high fatigue and mean Hb was not statistically significant when patients with SC and/or GIB were excluded (Table 2). None of the other 4 Hb measures was significantly associated with fatigue.
Linear Regression of Fatigue on Hb

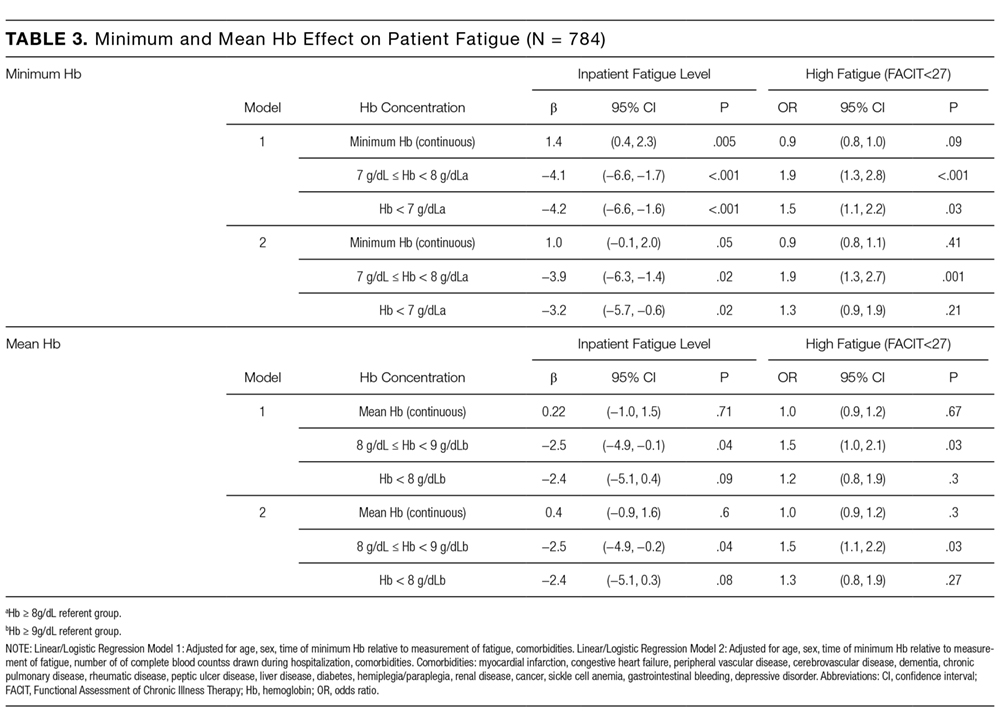
In linear regression models, minimum Hb consistently predicted patient fatigue, mean Hb had a less robust association with fatigue, and the other Hb measures were not associated with patient fatigue. Increases in minimum Hb (analyzed as a continuous variable) were associated with reduced fatigue (higher FACIT score; β = 1.4; P = 0.005). In models in which minimum Hb was a categorical variable, patients with a minimum Hb of <7 g/dL or 7-8 g/dL had greater fatigue (lower FACIT score) than patients whose minimum Hb was ≥8 g/dL (Hb <7 g/dL: β = −4.2; P ≤ 0.001; Hb 7-8 g/dL: β = −4.1; P < 0.001). These results control for patients’ age, sex, individual comorbidities, and whether their minimum Hb occurred before or after the measurement of fatigue during hospitalization (Model 1), and the results are unchanged when also controlling for the number of Hb laboratory draws patients had during their hospitalization (Model 2; Table 3). In a stratified analysis excluding patients with either SC and/or GIB, changes in minimum Hb were associated with larger changes in patient fatigue levels (Supplemental Table 1). We also stratified our analysis to include only patients whose minimum Hb occurred before the measurement of their fatigue level during hospitalization to avoid a spurious association of fatigue with minimum Hb occurring after fatigue was measured. In both Models 1 and 2, minimum Hb remained a predictor of patients’ fatigue levels with similar effect sizes, although in Model 2, the results did not quite reach a statistically significant level, in part due to larger confidence intervals from the smaller sample size of this stratified analysis (Supplemental Table 2a). We further stratified this analysis to include only patients whose transfusion, if they received one, occurred after their minimum Hb and the measurement of their fatigue level to account for the possibility that a transfusion could affect the fatigue level patients report. In this analysis, most of the estimates of the effect of minimum Hb on fatigue were larger than those seen when only analyzing patients whose minimum Hb occurred before the measurement of their fatigue level, although again, the smaller sample size of this additional stratified analysis does produce larger confidence intervals for these estimates (Supplemental Table 2b).
No Hb measure other than minimum or mean had significant association with patient fatigue levels in linear regression models.
Logistic Regression of High Fatigue Level on Hb
Using logistic regression, minimum Hb analyzed as a categorical variable predicted increased odds of a high fatigue level. Patients with a minimum Hb <7 g/dL were 50% (odds ratio [OR] = 1.5; P = 0.03) more likely to have high fatigue and patients with a minimum Hb 7-8 g/dL were 90% (OR = 1.9; P < 0.001) more likely to have high fatigue compared with patients with a minimum Hb ≥8 g/dL in Model 1. These results were similar in Model 2, although the effect was only statistically significant in the 7-8 g/dL Hb group (Table 3). When excluding SC and/or GIB patients, the odds of having high fatigue as minimum Hb decreased were the same or higher for both models compared to the full population of patients. However, again, in Model 2, the effect was only statistically significant in the 7-8 g/dL Hb group (Supplemental Table 1).
Patients with a mean Hb <8 g/dL were 20% to 30% more likely to have high fatigue and patients with mean Hb 8-9 g/dL were 50% more likely to have high fatigue compared with patients with a mean Hb ≥9 g/dL, but the effects were only statistically significant for patients with a mean Hb 8-9 g/dL in both Models 1 and 2 (Table 3). These results were similar when excluding patients with SC and/or GIB, but they were only significant for patients with a mean Hb 8-9 g/dL in Model 1 and patients with a mean Hb <8 g/dL in the Model 2 (Supplemental Table 3).
DISCUSSION
These results demonstrate that minimum Hb during hospitalization is associated with fatigue in hospitalized patients age ≥50 years, and the association is stronger among patients without SC and/or GIB as comorbidities. The analysis of Hb as a continuous and categorical variable and the use of both linear and logistic regression models support the robustness of these associations and illuminate their clinical significance. For example, in linear regression with minimum Hb a continuous variable, the coefficient of 1.4 suggests that an increase of 2 g/dL in Hb, as might be expected from transfusion of 2 units of red blood cells, would be associated with about a 3-point improvement in fatigue. Additionally, as a categorical variable, a minimum Hb ≥8 g/dL compared with a minimum Hb <7 g/dL or 7-8 g/dL is associated with a 3- to 4-point improvement in fatigue. Previous literature suggests that a difference of 3 in the FACIT score is the minimum clinically important difference in fatigue,3 and changes in minimum Hb in either model predict changes in fatigue that are in the range of potential clinical significance.
The clinical significance of the findings is also reflected in the results of the logistic regressions, which may be mapped to potential effects on functional status. Specifically, the odds of having a high fatigue level (FACIT <27) increase 90% for persons with a minimum Hb 7–8 g/dL compared with persons with a minimum Hb ≥8 g/dL. For persons with a minimum Hb <7 g/dL, point estimates suggest a smaller (50%) increase in the odds of high fatigue, but the 95% confidence interval overlaps heavily with the estimate of patients whose minimum Hb is 7-8 g/dL. While it might be expected that patients with a minimum Hb <7 g/dL have greater levels of fatigue compared with patients with a minimum Hb 7-8 g/dL, we did not observe such a pattern. One reason may be that the confidence intervals of our estimated effects are wide enough that we cannot exclude such a pattern. Another possible explanation is that in both groups, the fatigue levels are sufficiently severe, such that the difference in their fatigue levels may not be clinically meaningful. For example, a FACIT score of 23 to 26 has been shown to be associated with an ECOG performance status of 2 to 3, requiring bed rest for at least part of the day.3 Therefore, patients with a minimum Hb 7-8 g/dL (mean FACIT score = 24; Table 2) or a minimum Hb of <7 g/dL (mean FACIT score = 23; Table 2) are already functionally limited to the point of being partially bed bound, such that further decreases in their Hb may not produce additional fatigue in part because they reduce their activity sufficiently to prevent an increase in fatigue. In such cases, the potential benefits of increased Hb may be better assessed by measuring fatigue in response to a specific and provoked activity level, a concept known as fatigability.20
That minimum Hb is more strongly associated with fatigue than any other measure of Hb during hospitalization may not be surprising. Mean, median, maximum, and discharge Hb may all be affected by transfusion during hospitalization that could affect fatigue. Admission Hb may not reflect true oxygen-carrying capacity because of hemoconcentration.
The association between Hb and fatigue in hospitalized patients is important because increased fatigue could contribute to slower clinical recovery in hospitalized patients. Additionally, increased fatigue during hospitalization and at hospital discharge could exacerbate the known deleterious consequences of fatigue on patients and their health outcomes14,15 after hospital discharge. Although one previous study, the Functional Outcomes in Cardiovascular Patients Undergoing Surgical Hip Fracture Repair (FOCUS)8 trial, did not report differences in patients’ fatigue levels at 30 and 60 days postdischarge when transfused at restrictive (8 g/dL) compared with liberal (10 g/dL) Hb thresholds, confidence in the validity of this finding is reduced by the fact that more than half of the patients were lost to follow-up at the 30- and 60-day time points. Further, patients in the restrictive transfusion arm of FOCUS were transfused to maintain Hb levels at or above 8 g/dL. This transfusion threshold of 8 g/dL may have mitigated the high levels of fatigue that are seen in our study when patients’ Hb drops below 8 g/dL, and maintaining a Hb level of 7 g/dL is now the standard of care in stable hospitalized patients. Lastly, FOCUS was limited to postoperative hip fracture patients, and the generalizability of FOCUS to hospitalized medicine patients with anemia is limited.
Therefore, our results support guideline suggestions that practitioners incorporate the presence of patient symptoms such as fatigue into transfusion decisions, particularly if patients’ Hb is <8 g/dL.18 Though reasonable, the suggestion to incorporate symptoms such as fatigue into transfusion decisions has not been strongly supported by evidence so far, and it may often be neglected in practice. Definitive evidence to support such recommendations would benefit from study through an optimal trial18 that incorporates symptoms into decision making. Our findings add support for a study of transfusion strategies that incorporates patients’ fatigue level in addition to Hb concentration.
This study has several limitations. Although our sample size is large and includes patients with a range of comorbidities that we believe are representative of hospitalized general medicine patients, as a single-center, observational study, our results may not be generalizable to other centers. Additionally, although these data support a reliable association between hospitalized patients’ minimum Hb and fatigue level, the observational design of this study cannot prove that this relationship is causal. Also, patients’ Hb values were measured at the discretion of their clinician, and therefore, the measures of Hb were not uniformly measured for participating patients. In addition, fatigue was only measured at one time point during a patient’s hospitalization, and it is possible that patients’ fatigue levels change during hospitalization in relation to variables we did not consider. Finally, our study was not designed to assess the association of Hb with longer-term functional outcomes, which may be of greater concern than fatigue.
CONCLUSION
In hospitalized patients ≥50 years old, minimum Hb is reliably associated with patients’ fatigue level. Patients whose minimum Hb is <8 g/dL experience higher fatigue levels compared to patients whose minimum Hb is ≥8 g/dL. Additional studies are warranted to understand if patients may benefit from improved fatigue levels by correcting their anemia through transfusion.
1. Yellen SB, Cella DF, Webster K, Blendowski C, Kaplan E. Measuring fatigue and other anemia-related symptoms with the Functional Assessment of Cancer Therapy (FACT) measurement system. J Pain Symptom Manage. 1997;13(2):63-74.
2. Cella D, Lai JS, Chang CH, Peterman A, Slavin M. Fatigue in cancer patients compared with fatigue in the general United States population. Cancer. 2002;94(2):528-538. doi:10.1002/cncr.10245.
3. Cella D, Eton DT, Lai J-S, Peterman AH, Merkel DE. Combining anchor and distribution-based methods to derive minimal clinically important differences on the Functional Assessment of Cancer Therapy (FACT) anemia and fatigue scales. J Pain Symptom Manage. 2002;24(6):547-561.
4. Tonelli M, Hemmelgarn B, Reiman T, et al. Benefits and harms of erythropoiesis-stimulating agents for anemia related to cancer: a meta-analysis. CMAJ Can Med Assoc J J Assoc Medicale Can. 2009;180(11):E62-E71. doi:10.1503/cmaj.090470.
5. Foley RN, Curtis BM, Parfrey PS. Erythropoietin Therapy, Hemoglobin Targets, and Quality of Life in Healthy Hemodialysis Patients: A Randomized Trial. Clin J Am Soc Nephrol. 2009;4(4):726-733. doi:10.2215/CJN.04950908.
6. Keown PA, Churchill DN, Poulin-Costello M, et al. Dialysis patients treated with Epoetin alfa show improved anemia symptoms: A new analysis of the Canadian Erythropoietin Study Group trial. Hemodial Int Int Symp Home Hemodial. 2010;14(2):168-173. doi:10.1111/j.1542-4758.2009.00422.x.
7. Palmer SC, Saglimbene V, Mavridis D, et al. Erythropoiesis-stimulating agents for anaemia in adults with chronic kidney disease: a network meta-analysis. Cochrane Database Syst Rev. 2014:CD010590.
8. Carson JL, Terrin ML, Noveck H, et al. Liberal or Restrictive Transfusion in high-risk patients after hip surgery. N Engl J Med. 2011;365(26):2453-2462. doi:10.1056/NEJMoa1012452.
9. Holst LB, Haase N, Wetterslev J, et al. Transfusion requirements in septic shock (TRISS) trial – comparing the effects and safety of liberal versus restrictive red blood cell transfusion in septic shock patients in the ICU: protocol for a randomised controlled trial. Trials. 2013;14:150. doi:10.1186/1745-6215-14-150.
10. Hébert PC, Wells G, Blajchman MA, et al. A multicenter, randomized, controlled clinical trial of transfusion requirements in critical care. N Engl J Med. 1999;340(6):409-417. doi:10.1056/NEJM199902113400601.
11. Corwin HL, Theus JW, Cargile CS, Lang NP. Red blood cell transfusion: Impact of an education program and a clinical guideline on transfusion practice. J Hosp Med. 2014;9(12):745-749. doi:10.1002/jhm.2237.
12. Saxena, S, editor. The Transfusion Committee: Putting Patient Safety First, 2nd Edition. Bethesda (MD): American Association of Blood Banks; 2013.
13. The 2011 National Blood Collection and Utilization Report. http://www.hhs.gov/ash/bloodsafety/2011-nbcus.pdf. Accessed August 16, 2017.
14. Vestergaard S, Nayfield SG, Patel KV, et al. Fatigue in a Representative Population of Older Persons and Its Association With Functional Impairment, Functional Limitation, and Disability. J Gerontol A Biol Sci Med Sci. 2009;64A(1):76-82. doi:10.1093/gerona/gln017.
15. Gill TM, Desai MM, Gahbauer EA, Holford TR, Williams CS. Restricted activity among community-living older persons: incidence, precipitants, and health care utilization. Ann Intern Med. 2001;135(5):313-321.
16. Koch CG, Li L, Sun Z, et al. Hospital-acquired anemia: Prevalence, outcomes, and healthcare implications. J Hosp Med. 2013;8(9):506-512. doi:10.1002/jhm.2061.
17. Meltzer D, Manning WG, Morrison J, et al. Effects of Physician Experience on Costs and Outcomes on an Academic General Medicine Service: Results of a Trial of Hospitalists. Ann Intern Med. 2002;137(11):866-874. doi:10.7326/0003-4819-137-11-200212030-00007.
18. Carson JL, Grossman BJ, Kleinman S, et al. Red Blood Cell Transfusion: A Clinical Practice Guideline From the AABB*. Ann Intern Med. 2012;157(1):49-58. doi:10.7326/0003-4819-157-1-201206190-00429.
19. Moreh E, Jacobs JM, Stessman J. Fatigue, function, and mortality in older adults. J Gerontol A Biol Sci Med Sci. 2010;65(8):887-895. doi:10.1093/gerona/glq064.
20. Eldadah BA. Fatigue and Fatigability in Older Adults. PM&R. 2010;2(5):406-413. doi:10.1016/j.pmrj.2010.03.022.
21. Hardy SE, Studenski SA. Fatigue Predicts Mortality among Older Adults. J Am Geriatr Soc. 2008;56(10):1910-1914. doi:10.1111/j.1532-5415.2008.01957.x.
22. Pfeiffer E. A short portable mental status questionnaire for the assessment of organic brain deficit in elderly patients. J Am Geriatr Soc. 1975;23(10):433-441.
23. Quan H, Sundararajan V, Halfon P, et al. Coding algorithms for defining comorbidities in ICD-9-CM and ICD-10 administrative data. Med Care. 2005;43(11):1130-1139.
24. HCUP Clinical Classifications Software (CCS) for ICD-9-CM. Healthcare Cost and Utilization Project (HCUP). 2006-2009. Agency for Healthcare Research and Quality, Rockville, MD. https://www.hcup-us.ahrq.gov/toolssoftware/ccs/ccs.jsp. Accessed November 22, 2016.
25. Cella DF, Tulsky DS, Gray G, et al. The Functional Assessment of Cancer Therapy scale: development and validation of the general measure. J Clin Oncol Off J Am Soc Clin Oncol. 1993;11(3):570-579.
26. Webster K, Cella D, Yost K. The Functional Assessment of Chronic Illness Therapy (FACIT) Measurement System: properties, applications, and interpretation. Health Qual Life Outcomes. 2003;1:79. doi:10.1186/1477-7525-1-79.
27. Oken MMMD a, Creech RHMD b, Tormey DCMD, et al. Toxicity and response criteria of the Eastern Cooperative Oncology Group. J Clin Oncol. 1982;5(6):649-656.
Fatigue is the most common clinical symptom of anemia and is a significant concern to patients.1,2 In ambulatory patients, lower hemoglobin (Hb) concentration is associated with increased fatigue.2,3 Accordingly, therapies that treat anemia by increasing Hb concentration, such as erythropoiesis stimulating agents,4-7 often use fatigue as an outcome measure.
In hospitalized patients, transfusion of red blood cell increases Hb concentration and is the primary treatment for anemia. However, the extent to which transfusion and changes in Hb concentration affect hospitalized patients’ fatigue levels is not well established. Guidelines support transfusing patients with symptoms of anemia, such as fatigue, on the assumption that the increased oxygen delivery will improve the symptoms of anemia. While transfusion studies in hospitalized patients have consistently reported that transfusion at lower or “restrictive” Hb concentrations is safe compared with transfusion at higher Hb concentrations,8-10 these studies have mainly used cardiac events and mortality as outcomes rather than patient symptoms, such as fatigue. Nevertheless, they have resulted in hospitals increasingly adopting restrictive transfusion policies that discourage transfusion at higher Hb levels.11,12 Consequently, the rate of transfusion in hospitalized patients has decreased,13 raising questions of whether some patients with lower Hb concentrations may experience increased fatigue as a result of restrictive transfusion policies. Fatigue among hospitalized patients is important not only because it is an adverse symptom but because it may result in decreased activity levels, deconditioning, and losses in functional status.14,15While the effect of alternative transfusion policies on fatigue in hospitalized patients could be answered by a randomized clinical trial using fatigue and functional status as outcomes, an important first step is to assess whether the Hb concentration of hospitalized patients is associated with their fatigue level during hospitalization. Because hospitalized patients often have acute illnesses that can cause fatigue in and of themselves, it is possible that anemia is not associated with fatigue in hospitalized patients despite anemia’s association with fatigue in ambulatory patients. Additionally, Hb concentration varies during hospitalization,16 raising the question of what measures of Hb during hospitalization might be most associated with anemia-related fatigue.
The objective of this study is to explore multiple Hb measures in hospitalized medical patients with anemia and test whether any of these Hb measures are associated with patients’ fatigue level.
METHODS
Study Design
We performed a prospective, observational study of hospitalized patients with anemia on the general medicine services at The University of Chicago Medical Center (UCMC). The institutional review board approved the study procedures, and all study subjects provided informed consent.
Study Eligibility
Between April 2014 and June 2015, all general medicine inpatients were approached for written consent for The University of Chicago Hospitalist Project,17 a research infrastructure at UCMC. Among patients consenting to participate in the Hospitalist Project, patients were eligible if they had Hb <9 g/dL at any point during their hospitalization and were age ≥50 years. Hb concentration of <9 g/dL was chosen to include the range of Hb values covered by most restrictive transfusion policies.8-10,18 Age ≥50 years was an inclusion criteria because anemia is more strongly associated with poor outcomes, including functional impairment, among older patients compared with younger patients.14,19-21 If patients were not eligible for inclusion at the time of consent for the Hospitalist Project, their Hb values were reviewed twice daily until hospital discharge to assess if their Hb was <9 g/dL. Proxies were sought to answer questions for patients who failed the Short Portable Mental Status Questionnaire.22
Patient Demographic Data Collection
Research assistants abstracted patient age and sex from the electronic health record (EHR), and asked patients to self-identify their race. The individual comorbidities included as part of the Charlson Comorbidity Index were identified using International Classification of Diseases, 9th Revision codes from hospital administrative data for each encounter and specifically included the following: myocardial infarction, congestive heart failure, peripheral vascular disease, cerebrovascular disease, dementia, chronic pulmonary disease, rheumatic disease, peptic ulcer disease, liver disease, diabetes, hemiplegia and/or paraplegia, renal disease, cancer, and human immunodeficiency virus/acquired immunodeficiency syndrome.23 We also used Healthcare Cost and Utilization Project (www.hcup-us.ahrq.gov/toolssoftware/ccs/ccs.jsp) diagnosis categories to identify whether patients had sickle cell (SC) anemia, gastrointestinal bleeding (GIB), or a depressive disorder (DD) because these conditions are associated with anemia (SC and GIB) and fatigue (DD).24
Measuring Anemia
Hb measures were available only when hospital providers ordered them as part of routine practice. The first Hb concentration <9 g/dL during a patient’s hospitalization, which made them eligible for study participation, was obtained through manual review of the EHR. All additional Hb values during the patient’s hospitalization were obtained from the hospital’s administrative data mart. All Hb values collected for each patient during the hospitalization were used to calculate summary measures of Hb during the hospitalization, including the mean Hb, median Hb, minimum Hb, maximum Hb, admission (first recorded) Hb, and discharge (last recorded) Hb. Hb measures were analyzed both as a continuous variable and as a categorical variable created by dividing the continuous Hb measures into integer ranges of 3 groups of approximately the same size.
Measuring Fatigue
Our primary outcome was patients’ level of fatigue reported during hospitalization, measured using the Functional Assessment of Chronic Illness Therapy (FACIT)-Anemia questionnaire. Fatigue was measured using a 13-question fatigue subscale,1,2,25 which measures fatigue within the past 7 days. Scores on the fatigue subscale range from 0 to 52, with lower scores reflecting greater levels of fatigue. As soon as patients met the eligibility criteria for study participation during their hospitalization (age ≥50 years and Hb <9 g/dL), they were approached to answer the FACIT questions. Values for missing data in the fatigue subscale for individual subjects were filled in using a prorated score from their answered questions as long as >50% of the items in the fatigue subscale were answered, in accordance with recommendations for addressing missing data in the FACIT.26 Fatigue was analyzed as a continuous variable and as a dichotomous variable created by dividing the sample into high (FACIT <27) and low (FACIT ≥27) levels of fatigue based on the median FACIT score of the population. Previous literature has shown a FACIT fatigue subscale score between 23 and 26 to be associated with an Eastern Cooperative Oncology Group (ECOG)27 C Performance Status rating of 2 to 33 compared to scores ≥27.
Statistical Analysis
Statistical analysis was performed using Stata statistical software (StataCorp, College Station, TX). Descriptive statistics were used to characterize patient demographics. Analysis of variance was used to test for differences in the mean fatigue levels across Hb measures. χ2 tests were performed to test for associations between high fatigue levels and the Hb measures. Multivariable analysis, including both linear and logistic regression models, were used to test the association of Hb concentration and fatigue. P values <0.05 using a 2-tailed test were deemed statistically significant.
RESULTS
Patient Characteristics
During the study period, 8559 patients were admitted to the general medicine service. Of those, 5073 (59%) consented for participation in the Hospitalist Project, and 3670 (72%) completed the Hospitalist Project inpatient interview. Of these patients, 1292 (35%) had Hb <9 g/dL, and 784 (61%) were 50 years or older and completed the FACIT questionnaire.
Table 1 reports the demographic characteristics and comorbidities for the sample, the mean (standard deviation [SD]) for the 6 Hb measures, and mean (SD) and median FACIT scores.
Bivariate Association of Fatigue and Hb
Categorizing patients into low, middle, or high Hb for each of the 6 Hb measures, minimum Hb was strongly associated with fatigue, with a weaker association for mean Hb and no statistically significant association for the other measures.
Minimum Hb. Patients with a minimum Hb <7 g/dL and patients with Hb 7-8 g/dL had higher fatigue levels (FACIT = 25 for each) than patients with a minimum Hb ≥8 g/dL (FACIT = 29; P < 0.001; Table 2). When excluding patients with SC and/or GIB because their average minimum Hb differed from the average minimum Hb of the full population (P < 0.001), patients with a minimum Hb <7 g/dL or 7-8 g/dL had even higher fatigue levels (FACIT = 23 and FACIT = 24, respectively), with no change in the fatigue level of patients with a minimum Hb ≥8 g/dL (FACIT = 29; P < 0.001; Table 2). Lower minimum Hb continued to be associated with higher fatigue levels when analyzed in 0.5 g/dL increments (Figure).
Mean Hb and Other Measures. Fatigue levels were high for 47% of patients with a mean Hb <8g /dL and 53% of patients with a mean Hb 8-9 g/dL compared with 43% of patients with a mean Hb ≥9 g/dL (P = 0.05). However, the association between high fatigue and mean Hb was not statistically significant when patients with SC and/or GIB were excluded (Table 2). None of the other 4 Hb measures was significantly associated with fatigue.
Linear Regression of Fatigue on Hb
In linear regression models, minimum Hb consistently predicted patient fatigue, mean Hb had a less robust association with fatigue, and the other Hb measures were not associated with patient fatigue. Increases in minimum Hb (analyzed as a continuous variable) were associated with reduced fatigue (higher FACIT score; β = 1.4; P = 0.005). In models in which minimum Hb was a categorical variable, patients with a minimum Hb of <7 g/dL or 7-8 g/dL had greater fatigue (lower FACIT score) than patients whose minimum Hb was ≥8 g/dL (Hb <7 g/dL: β = −4.2; P ≤ 0.001; Hb 7-8 g/dL: β = −4.1; P < 0.001). These results control for patients’ age, sex, individual comorbidities, and whether their minimum Hb occurred before or after the measurement of fatigue during hospitalization (Model 1), and the results are unchanged when also controlling for the number of Hb laboratory draws patients had during their hospitalization (Model 2; Table 3). In a stratified analysis excluding patients with either SC and/or GIB, changes in minimum Hb were associated with larger changes in patient fatigue levels (Supplemental Table 1). We also stratified our analysis to include only patients whose minimum Hb occurred before the measurement of their fatigue level during hospitalization to avoid a spurious association of fatigue with minimum Hb occurring after fatigue was measured. In both Models 1 and 2, minimum Hb remained a predictor of patients’ fatigue levels with similar effect sizes, although in Model 2, the results did not quite reach a statistically significant level, in part due to larger confidence intervals from the smaller sample size of this stratified analysis (Supplemental Table 2a). We further stratified this analysis to include only patients whose transfusion, if they received one, occurred after their minimum Hb and the measurement of their fatigue level to account for the possibility that a transfusion could affect the fatigue level patients report. In this analysis, most of the estimates of the effect of minimum Hb on fatigue were larger than those seen when only analyzing patients whose minimum Hb occurred before the measurement of their fatigue level, although again, the smaller sample size of this additional stratified analysis does produce larger confidence intervals for these estimates (Supplemental Table 2b).
No Hb measure other than minimum or mean had significant association with patient fatigue levels in linear regression models.
Logistic Regression of High Fatigue Level on Hb
Using logistic regression, minimum Hb analyzed as a categorical variable predicted increased odds of a high fatigue level. Patients with a minimum Hb <7 g/dL were 50% (odds ratio [OR] = 1.5; P = 0.03) more likely to have high fatigue and patients with a minimum Hb 7-8 g/dL were 90% (OR = 1.9; P < 0.001) more likely to have high fatigue compared with patients with a minimum Hb ≥8 g/dL in Model 1. These results were similar in Model 2, although the effect was only statistically significant in the 7-8 g/dL Hb group (Table 3). When excluding SC and/or GIB patients, the odds of having high fatigue as minimum Hb decreased were the same or higher for both models compared to the full population of patients. However, again, in Model 2, the effect was only statistically significant in the 7-8 g/dL Hb group (Supplemental Table 1).
Patients with a mean Hb <8 g/dL were 20% to 30% more likely to have high fatigue and patients with mean Hb 8-9 g/dL were 50% more likely to have high fatigue compared with patients with a mean Hb ≥9 g/dL, but the effects were only statistically significant for patients with a mean Hb 8-9 g/dL in both Models 1 and 2 (Table 3). These results were similar when excluding patients with SC and/or GIB, but they were only significant for patients with a mean Hb 8-9 g/dL in Model 1 and patients with a mean Hb <8 g/dL in the Model 2 (Supplemental Table 3).
DISCUSSION
These results demonstrate that minimum Hb during hospitalization is associated with fatigue in hospitalized patients age ≥50 years, and the association is stronger among patients without SC and/or GIB as comorbidities. The analysis of Hb as a continuous and categorical variable and the use of both linear and logistic regression models support the robustness of these associations and illuminate their clinical significance. For example, in linear regression with minimum Hb a continuous variable, the coefficient of 1.4 suggests that an increase of 2 g/dL in Hb, as might be expected from transfusion of 2 units of red blood cells, would be associated with about a 3-point improvement in fatigue. Additionally, as a categorical variable, a minimum Hb ≥8 g/dL compared with a minimum Hb <7 g/dL or 7-8 g/dL is associated with a 3- to 4-point improvement in fatigue. Previous literature suggests that a difference of 3 in the FACIT score is the minimum clinically important difference in fatigue,3 and changes in minimum Hb in either model predict changes in fatigue that are in the range of potential clinical significance.
The clinical significance of the findings is also reflected in the results of the logistic regressions, which may be mapped to potential effects on functional status. Specifically, the odds of having a high fatigue level (FACIT <27) increase 90% for persons with a minimum Hb 7–8 g/dL compared with persons with a minimum Hb ≥8 g/dL. For persons with a minimum Hb <7 g/dL, point estimates suggest a smaller (50%) increase in the odds of high fatigue, but the 95% confidence interval overlaps heavily with the estimate of patients whose minimum Hb is 7-8 g/dL. While it might be expected that patients with a minimum Hb <7 g/dL have greater levels of fatigue compared with patients with a minimum Hb 7-8 g/dL, we did not observe such a pattern. One reason may be that the confidence intervals of our estimated effects are wide enough that we cannot exclude such a pattern. Another possible explanation is that in both groups, the fatigue levels are sufficiently severe, such that the difference in their fatigue levels may not be clinically meaningful. For example, a FACIT score of 23 to 26 has been shown to be associated with an ECOG performance status of 2 to 3, requiring bed rest for at least part of the day.3 Therefore, patients with a minimum Hb 7-8 g/dL (mean FACIT score = 24; Table 2) or a minimum Hb of <7 g/dL (mean FACIT score = 23; Table 2) are already functionally limited to the point of being partially bed bound, such that further decreases in their Hb may not produce additional fatigue in part because they reduce their activity sufficiently to prevent an increase in fatigue. In such cases, the potential benefits of increased Hb may be better assessed by measuring fatigue in response to a specific and provoked activity level, a concept known as fatigability.20
That minimum Hb is more strongly associated with fatigue than any other measure of Hb during hospitalization may not be surprising. Mean, median, maximum, and discharge Hb may all be affected by transfusion during hospitalization that could affect fatigue. Admission Hb may not reflect true oxygen-carrying capacity because of hemoconcentration.
The association between Hb and fatigue in hospitalized patients is important because increased fatigue could contribute to slower clinical recovery in hospitalized patients. Additionally, increased fatigue during hospitalization and at hospital discharge could exacerbate the known deleterious consequences of fatigue on patients and their health outcomes14,15 after hospital discharge. Although one previous study, the Functional Outcomes in Cardiovascular Patients Undergoing Surgical Hip Fracture Repair (FOCUS)8 trial, did not report differences in patients’ fatigue levels at 30 and 60 days postdischarge when transfused at restrictive (8 g/dL) compared with liberal (10 g/dL) Hb thresholds, confidence in the validity of this finding is reduced by the fact that more than half of the patients were lost to follow-up at the 30- and 60-day time points. Further, patients in the restrictive transfusion arm of FOCUS were transfused to maintain Hb levels at or above 8 g/dL. This transfusion threshold of 8 g/dL may have mitigated the high levels of fatigue that are seen in our study when patients’ Hb drops below 8 g/dL, and maintaining a Hb level of 7 g/dL is now the standard of care in stable hospitalized patients. Lastly, FOCUS was limited to postoperative hip fracture patients, and the generalizability of FOCUS to hospitalized medicine patients with anemia is limited.
Therefore, our results support guideline suggestions that practitioners incorporate the presence of patient symptoms such as fatigue into transfusion decisions, particularly if patients’ Hb is <8 g/dL.18 Though reasonable, the suggestion to incorporate symptoms such as fatigue into transfusion decisions has not been strongly supported by evidence so far, and it may often be neglected in practice. Definitive evidence to support such recommendations would benefit from study through an optimal trial18 that incorporates symptoms into decision making. Our findings add support for a study of transfusion strategies that incorporates patients’ fatigue level in addition to Hb concentration.
This study has several limitations. Although our sample size is large and includes patients with a range of comorbidities that we believe are representative of hospitalized general medicine patients, as a single-center, observational study, our results may not be generalizable to other centers. Additionally, although these data support a reliable association between hospitalized patients’ minimum Hb and fatigue level, the observational design of this study cannot prove that this relationship is causal. Also, patients’ Hb values were measured at the discretion of their clinician, and therefore, the measures of Hb were not uniformly measured for participating patients. In addition, fatigue was only measured at one time point during a patient’s hospitalization, and it is possible that patients’ fatigue levels change during hospitalization in relation to variables we did not consider. Finally, our study was not designed to assess the association of Hb with longer-term functional outcomes, which may be of greater concern than fatigue.
CONCLUSION
In hospitalized patients ≥50 years old, minimum Hb is reliably associated with patients’ fatigue level. Patients whose minimum Hb is <8 g/dL experience higher fatigue levels compared to patients whose minimum Hb is ≥8 g/dL. Additional studies are warranted to understand if patients may benefit from improved fatigue levels by correcting their anemia through transfusion.
1. Yellen SB, Cella DF, Webster K, Blendowski C, Kaplan E. Measuring fatigue and other anemia-related symptoms with the Functional Assessment of Cancer Therapy (FACT) measurement system. J Pain Symptom Manage. 1997;13(2):63-74.
2. Cella D, Lai JS, Chang CH, Peterman A, Slavin M. Fatigue in cancer patients compared with fatigue in the general United States population. Cancer. 2002;94(2):528-538. doi:10.1002/cncr.10245.
3. Cella D, Eton DT, Lai J-S, Peterman AH, Merkel DE. Combining anchor and distribution-based methods to derive minimal clinically important differences on the Functional Assessment of Cancer Therapy (FACT) anemia and fatigue scales. J Pain Symptom Manage. 2002;24(6):547-561.
4. Tonelli M, Hemmelgarn B, Reiman T, et al. Benefits and harms of erythropoiesis-stimulating agents for anemia related to cancer: a meta-analysis. CMAJ Can Med Assoc J J Assoc Medicale Can. 2009;180(11):E62-E71. doi:10.1503/cmaj.090470.
5. Foley RN, Curtis BM, Parfrey PS. Erythropoietin Therapy, Hemoglobin Targets, and Quality of Life in Healthy Hemodialysis Patients: A Randomized Trial. Clin J Am Soc Nephrol. 2009;4(4):726-733. doi:10.2215/CJN.04950908.
6. Keown PA, Churchill DN, Poulin-Costello M, et al. Dialysis patients treated with Epoetin alfa show improved anemia symptoms: A new analysis of the Canadian Erythropoietin Study Group trial. Hemodial Int Int Symp Home Hemodial. 2010;14(2):168-173. doi:10.1111/j.1542-4758.2009.00422.x.
7. Palmer SC, Saglimbene V, Mavridis D, et al. Erythropoiesis-stimulating agents for anaemia in adults with chronic kidney disease: a network meta-analysis. Cochrane Database Syst Rev. 2014:CD010590.
8. Carson JL, Terrin ML, Noveck H, et al. Liberal or Restrictive Transfusion in high-risk patients after hip surgery. N Engl J Med. 2011;365(26):2453-2462. doi:10.1056/NEJMoa1012452.
9. Holst LB, Haase N, Wetterslev J, et al. Transfusion requirements in septic shock (TRISS) trial – comparing the effects and safety of liberal versus restrictive red blood cell transfusion in septic shock patients in the ICU: protocol for a randomised controlled trial. Trials. 2013;14:150. doi:10.1186/1745-6215-14-150.
10. Hébert PC, Wells G, Blajchman MA, et al. A multicenter, randomized, controlled clinical trial of transfusion requirements in critical care. N Engl J Med. 1999;340(6):409-417. doi:10.1056/NEJM199902113400601.
11. Corwin HL, Theus JW, Cargile CS, Lang NP. Red blood cell transfusion: Impact of an education program and a clinical guideline on transfusion practice. J Hosp Med. 2014;9(12):745-749. doi:10.1002/jhm.2237.
12. Saxena, S, editor. The Transfusion Committee: Putting Patient Safety First, 2nd Edition. Bethesda (MD): American Association of Blood Banks; 2013.
13. The 2011 National Blood Collection and Utilization Report. http://www.hhs.gov/ash/bloodsafety/2011-nbcus.pdf. Accessed August 16, 2017.
14. Vestergaard S, Nayfield SG, Patel KV, et al. Fatigue in a Representative Population of Older Persons and Its Association With Functional Impairment, Functional Limitation, and Disability. J Gerontol A Biol Sci Med Sci. 2009;64A(1):76-82. doi:10.1093/gerona/gln017.
15. Gill TM, Desai MM, Gahbauer EA, Holford TR, Williams CS. Restricted activity among community-living older persons: incidence, precipitants, and health care utilization. Ann Intern Med. 2001;135(5):313-321.
16. Koch CG, Li L, Sun Z, et al. Hospital-acquired anemia: Prevalence, outcomes, and healthcare implications. J Hosp Med. 2013;8(9):506-512. doi:10.1002/jhm.2061.
17. Meltzer D, Manning WG, Morrison J, et al. Effects of Physician Experience on Costs and Outcomes on an Academic General Medicine Service: Results of a Trial of Hospitalists. Ann Intern Med. 2002;137(11):866-874. doi:10.7326/0003-4819-137-11-200212030-00007.
18. Carson JL, Grossman BJ, Kleinman S, et al. Red Blood Cell Transfusion: A Clinical Practice Guideline From the AABB*. Ann Intern Med. 2012;157(1):49-58. doi:10.7326/0003-4819-157-1-201206190-00429.
19. Moreh E, Jacobs JM, Stessman J. Fatigue, function, and mortality in older adults. J Gerontol A Biol Sci Med Sci. 2010;65(8):887-895. doi:10.1093/gerona/glq064.
20. Eldadah BA. Fatigue and Fatigability in Older Adults. PM&R. 2010;2(5):406-413. doi:10.1016/j.pmrj.2010.03.022.
21. Hardy SE, Studenski SA. Fatigue Predicts Mortality among Older Adults. J Am Geriatr Soc. 2008;56(10):1910-1914. doi:10.1111/j.1532-5415.2008.01957.x.
22. Pfeiffer E. A short portable mental status questionnaire for the assessment of organic brain deficit in elderly patients. J Am Geriatr Soc. 1975;23(10):433-441.
23. Quan H, Sundararajan V, Halfon P, et al. Coding algorithms for defining comorbidities in ICD-9-CM and ICD-10 administrative data. Med Care. 2005;43(11):1130-1139.
24. HCUP Clinical Classifications Software (CCS) for ICD-9-CM. Healthcare Cost and Utilization Project (HCUP). 2006-2009. Agency for Healthcare Research and Quality, Rockville, MD. https://www.hcup-us.ahrq.gov/toolssoftware/ccs/ccs.jsp. Accessed November 22, 2016.
25. Cella DF, Tulsky DS, Gray G, et al. The Functional Assessment of Cancer Therapy scale: development and validation of the general measure. J Clin Oncol Off J Am Soc Clin Oncol. 1993;11(3):570-579.
26. Webster K, Cella D, Yost K. The Functional Assessment of Chronic Illness Therapy (FACIT) Measurement System: properties, applications, and interpretation. Health Qual Life Outcomes. 2003;1:79. doi:10.1186/1477-7525-1-79.
27. Oken MMMD a, Creech RHMD b, Tormey DCMD, et al. Toxicity and response criteria of the Eastern Cooperative Oncology Group. J Clin Oncol. 1982;5(6):649-656.
© 2017 Society of Hospital Medicine
Measuring Patient Experiences
The hospitalized patient experience has become an area of increased focus for hospitals given the recent coupling of patient satisfaction to reimbursement rates for Medicare patients.[1] Although patient experiences are multifactorial, 1 component is the relationship that hospitalized patients develop with their inpatient physicians. In recognition of the importance of this relationship, several organizations including the Society of Hospital Medicine, Society of General Internal Medicine, American College of Physicians, the American College of Emergency Physicians, and the Accreditation Council for Graduate Medical Education have recommended that patients know and understand who is guiding their care at all times during their hospitalization.[2, 3] Unfortunately, previous studies have shown that hospitalized patients often lack the ability to identify[4, 5] and understand their course of care.[6, 7] This may be due to numerous clinical factors including lack of a prior relationship, rapid pace of clinical care, and the frequent transitions of care found in both hospitalists and general medicine teaching services.[5, 8, 9] Regardless of the cause, one could hypothesize that patients who are unable to identify or understand the role of their physician may be less informed about their hospitalization, which may lead to further confusion, dissatisfaction, and ultimately a poor experience.
Given the proliferation of nonteaching hospitalist services in teaching hospitals, it is important to understand if patient experiences differ between general medicine teaching and hospitalist services. Several reasons could explain why patient experiences may vary on these services. For example, patients on a hospitalist service will likely interact with a single physician caretaker, which may give a feeling of more personalized care. In contrast, patients on general medicine teaching services are cared for by larger teams of residents under the supervision of an attending physician. Residents are also subjected to duty‐hour restrictions, clinic responsibilities, and other educational requirements that may impede the continuity of care for hospitalized patients.[10, 11, 12] Although 1 study has shown that hospitalist‐intensive hospitals perform better on patient satisfaction measures,[13] no study to date has compared patient‐reported experiences on general medicine teaching and nonteaching hospitalist services. This study aimed to evaluate the hospitalized patient experience on both teaching and nonteaching hospitalist services by assessing several patient‐reported measures of their experience, namely their confidence in their ability to identify their physician(s), understand their roles, and their rating of both the coordination and overall care.
METHODS
Study Design
We performed a retrospective cohort analysis at the University of Chicago Medical Center between July 2007 and June 2013. Data were acquired as part of the Hospitalist Project, an ongoing study that is used to evaluate the impact of hospitalists, and now serves as infrastructure to continue research related to hospital care at University of Chicago.[14] Patients were cared for by either the general medicine teaching service or the nonteaching hospitalist service. General medicine teaching services were composed of an attending physician who rotates for 2 weeks at a time, a second‐ or third‐year medicine resident, 1 to 2 medicine interns, and 1 to 2 medical students.[15] The attending physician assigned to the patient's hospitalization was the attending listed on the first day of hospitalization, regardless of the length of hospitalization. Nonteaching hospitalist services consisted of a single hospitalist who worked 7‐day shifts, and were assisted by a nurse practitioner/physician's assistant (NPA). The majority of attendings on the hospitalist service were less than 5 years out of residency. Both services admitted 7 days a week, with patients initially admitted to the general medicine teaching service until resident caps were met, after which all subsequent admissions were admitted to the hospitalist service. In addition, the hospitalist service is also responsible for specific patient subpopulations, such as lung and renal transplants, and oncologic patients who have previously established care with our institution.
Data Collection
During a 30‐day posthospitalization follow‐up questionnaire, patients were surveyed regarding their confidence in their ability to identify and understand the roles of their physician(s) and their perceptions of the overall coordination of care and their overall care, using a 5‐point Likert scale (1 = poor understanding to 5 = excellent understanding). Questions related to satisfaction with care and coordination were derived from the Picker‐Commonwealth Survey, a previously validated survey meant to evaluate patient‐centered care.[16] Patients were also asked to report their race, level of education, comorbid diseases, and whether they had any prior hospitalizations within 1 year. Chart review was performed to obtain patient age, gender, and hospital length of stay (LOS), and calculated Charlson Comorbidity Index (CCI).[17] Patients with missing data or responses to survey questions were excluded from final analysis. The University of Chicago Institutional Review Board approved the study protocol, and all patients provided written consented prior to participation.
Data Analysis
After initial analysis noted that outcomes were skewed, the decision was made to dichotomize the data and use logistic rather than linear regression models. Patient responses to the follow‐up phone questionnaire were dichotomized to reflect the top 2 categories (excellent and very good). Pearson 2 analysis was used to assess for any differences in demographic characteristics, disease severity, and measures of patient experience between the 2 services. To assess if service type was associated with differences in our 4 measures of patient experience, we created a 3‐level mixed‐effects logistic regression using a logit function while controlling for age, gender, race, CCI, LOS, previous hospitalizations within 1 year, level of education, and academic year. These models studied the longitudinal association between teaching service and the 4 outcome measures, while also controlling for the cluster effect of time nested within individual patients who were clustered within physicians. The model included random intercepts at both the patient and physician level and also included a random effect of service (teaching vs nonteaching) at the patient level. A Hausman test was used to determine if these random‐effects models improved fit over a fixed‐effects model, and the intraclass correlations were compared using likelihood ratio tests to determine the appropriateness of a 3‐level versus 2‐level model. Data management and 2 analyses were performed using Stata version 13.0 (StataCorp, College Station, TX), and mixed‐effects regression models were done in SuperMix (Scientific Software International, Skokie, IL).
RESULTS
In total, 14,855 patients were enrolled during their hospitalization with 57% and 61% completing the 30‐day follow‐up survey on the hospitalist and general medicine teaching service, respectively. In total, 4131 (69%) and 4322 (48%) of the hospitalist and general medicine services, respectively, either did not answer all survey questions, or were missing basic demographic data, and thus were excluded. Data from 4591 patients on the general medicine teaching (52% of those enrolled at hospitalization) and 1811 on the hospitalist service (31% of those enrolled at hospitalization) were used for final analysis (Figure 1). Respondents were predominantly female (61% and 56%), African American (75% and 63%), with a mean age of 56.2 (19.4) and 57.1 (16.1) years, for the general medicine teaching and hospitalist services, respectively. A majority of patients (71% and 66%) had a CCI of 0 to 3 on both services. There were differences in self‐reported comorbidities between the 2 groups, with hospitalist services having a higher prevalence of cancer (20% vs 7%), renal disease (25% vs 18%), and liver disease (23% vs 7%). Patients on the hospitalist service had a longer mean LOS (5.5 vs 4.8 days), a greater percentage of a hospitalization within 1 year (58% vs 52%), and a larger proportion who were admitted in 2011 to 2013 compared to 2007 to 2010 (75% vs 39%), when compared to the general medicine teaching services. Median LOS and interquartile ranges were similar between both groups. Although most baseline demographics were statistically different between the 2 groups (Table 1), these differences were likely clinically insignificant. Compared to those who responded to the follow‐up survey, nonresponders were more likely to be African American (73% and 64%, P < 0.001) and female (60% and 56%, P < 0.01). The nonresponders were more likely to be hospitalized in the past 1 year (62% and 53%, P < 0.001) and have a lower CCI (CCI 03 [75% and 80%, P < 0.001]) compared to responders. Demographics between responders and nonresponders were also statistically different from one another.
| Variable | General Medicine Teaching | Nonteaching Hospitalist | P Value |
|---|---|---|---|
| |||
| Total (n) | 4,591 | 1,811 | <0.001 |
| Attending classification, hospitalist, n (%) | 1,147 (25) | 1,811 (100) | |
| Response rate, % | 61 | 57 | <0.01 |
| Age, y, mean SD | 56.2 19.4 | 57.1 16.1 | <0.01 |
| Gender, n (%) | <0.01 | ||
| Male | 1,796 (39) | 805 (44) | |
| Female | 2,795 (61) | 1,004 (56) | |
| Race, n (%) | <0.01 | ||
| African American | 3,440 (75) | 1,092 (63) | |
| White | 900 (20) | 571 (32) | |
| Asian/Pacific | 38 (1) | 17 (1) | |
| Other | 20 (1) | 10 (1) | |
| Unknown | 134 (3) | 52 (3) | |
| Charlson Comorbidity Index, n (%) | <0.001 | ||
| 0 | 1,635 (36) | 532 (29) | |
| 12 | 1,590 (35) | 675 (37) | |
| 39 | 1,366 (30) | 602 (33) | |
| Self‐reported comorbidities | |||
| Anemia/sickle cell disease | 1,201 (26) | 408 (23) | 0.003 |
| Asthma/COPD | 1,251 (28) | 432 (24) | 0.006 |
| Cancer* | 300 (7) | 371 (20) | <0.001 |
| Depression | 1,035 (23) | 411 (23) | 0.887 |
| Diabetes | 1,381 (30) | 584 (32) | 0.087 |
| Gastrointestinal | 1,140 (25) | 485 (27) | 0.104 |
| Cardiac | 1,336 (29) | 520 (29) | 0.770 |
| Hypertension | 2,566 (56) | 1,042 (58) | 0.222 |
| HIV/AIDS | 151 (3) | 40 (2) | 0.022 |
| Kidney disease | 828 (18) | 459 (25) | <0.001 |
| Liver disease | 313 (7) | 417 (23) | <0.001 |
| Stroke | 543 (12) | 201 (11) | 0.417 |
| Education level | 0.066 | ||
| High school | 2,248 (49) | 832 (46) | |
| Junior college/college | 1,878 (41) | 781 (43) | |
| Postgraduate | 388 (8) | 173 (10) | |
| Don't know | 77 (2) | 23 (1) | |
| Academic year, n (%) | <0.001 | ||
| July 2007 June 2008 | 938 (20) | 90 (5) | |
| July 2008 June 2009 | 702 (15) | 148 (8) | |
| July 2009 June 2010 | 576(13) | 85 (5) | |
| July 2010 June 2011 | 602 (13) | 138 (8) | |
| July 2011 June 2012 | 769 (17) | 574 (32) | |
| July 2012 June 2013 | 1,004 (22) | 774 (43) | |
| Length of stay, d, mean SD | 4.8 7.3 | 5.5 6.4 | <0.01 |
| Prior hospitalization (within 1 year), yes, n (%) | 2,379 (52) | 1,039 (58) | <0.01 |

Unadjusted results revealed that patients on the hospitalist service were more confident in their abilities to identify their physician(s) (50% vs 45%, P < 0.001), perceived greater ability in understanding the role of their physician(s) (54% vs 50%, P < 0.001), and reported greater satisfaction with coordination and teamwork (68% vs 64%, P = 0.006) and with overall care (73% vs 67%, P < 0.001) (Figure 2).
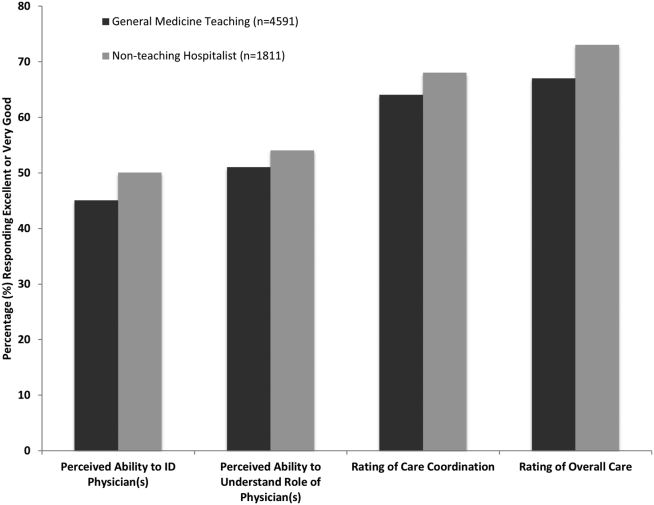
From the mixed‐effects regression models it was discovered that admission to the hospitalist service was associated with a higher odds ratio (OR) of reporting overall care as excellent or very good (OR: 1.33; 95% confidence interval [CI]: 1.15‐1.47). There was no difference between services in patients' ability to identify their physician(s) (OR: 0.89; 95% CI: 0.61‐1.11), in patients reporting a better understanding of the role of their physician(s) (OR: 1.09; 95% CI: 0.94‐1.23), or in their rating of overall coordination and teamwork (OR: 0.71; 95% CI: 0.42‐1.89).
A subgroup analysis was performed on the 25% of hospitalist attendings in the general medicine teaching service comparing this cohort to the hospitalist services, and it was found that patients perceived better overall care on the hospitalist service (OR: 1.17; 95% CI: 1.01‐ 1.31) than on the general medicine service (Table 2). All other domains in the subgroup analysis were not statistically significant. Finally, an ordinal logistic regression was performed for each of these outcomes, but it did not show any major differences compared to the logistic regression of dichotomous outcomes.
| Domains in Patient Experience* | Odds Ratio (95% CI) | P Value |
|---|---|---|
| ||
| How would you rate your ability to identify the physicians and trainees on your general medicine team during the hospitalization? | ||
| Model 1 | 0.89 (0.611.11) | 0.32 |
| Model 2 | 0.98 (0.671.22) | 0.86 |
| How would you rate your understanding of the roles of the physicians and trainees on your general medicine team? | ||
| Model 1 | 1.09 (0.941.23) | 0.25 |
| Model 2 | 1.19 (0.981.36) | 0.08 |
| How would you rate the overall coordination and teamwork among the doctors and nurses who care for you during your hospital stay? | ||
| Model 1 | 0.71 (0.421.89) | 0.18 |
| Model 2 | 0.82 (0.651.20) | 0.23 |
| Overall, how would you rate the care you received at the hospital? | ||
| Model 1 | 1.33 (1.151.47) | 0.001 |
| Model 2 | 1.17 (1.011.31) | 0.04 |
DISCUSSION
This study is the first to directly compare measures of patient experience on hospitalist and general medicine teaching services in a large, multiyear comparison across multiple domains. In adjusted analysis, we found that patients on nonteaching hospitalist services rated their overall care better than those on general medicine teaching services, whereas no differences in patients' ability to identify their physician(s), understand their role in their care, or rating of coordination of care were found. Although the magnitude of the differences in rating of overall care may appear small, it remains noteworthy because of the recent focus on patient experience at the reimbursement level, where small differences in performance can lead to large changes in payment. Because of the observational design of this study, it is important to consider mechanisms that could account for our findings.
The first are the structural differences between the 2 services. Our subgroup analysis comparing patients rating of overall care on a general medicine service with a hospitalist attending to a pure hospitalist cohort found a significant difference between the groups, indicating that the structural differences between the 2 groups may be a significant contributor to patient satisfaction ratings. Under the care of a hospitalist service, a patient would only interact with a single physician on a daily basis, possibly leading to a more meaningful relationship and improved communication between patient and provider. Alternatively, while on a general medicine teaching service, patients would likely interact with multiple physicians, as a result making their confidence in their ability to identify and perception at understanding physicians' roles more challenging.[18] This dilemma is further compounded by duty hour restrictions, which have subsequently led to increased fragmentation in housestaff scheduling. The patient experience on the general medicine teaching service may be further complicated by recent data that show residents spend a minority of time in direct patient care,[19, 20] which could additionally contribute to patients' inability to understand who their physicians are and to the decreased satisfaction with their care. This combination of structural complexity, duty hour reform, and reduced direct patient interaction would likely decrease the chance a patient will interact with the same resident on a consistent basis,[5, 21] thus making the ability to truly understand who their caretakers are, and the role they play, more difficult.
Another contributing factor could be the use of NPAs on our hospitalist service. Given that these providers often see the patient on a more continual basis, hospitalized patients' exposure to a single, continuous caretaker may be a factor in our findings.[22] Furthermore, with studies showing that hospitalists also spend a small fraction of their day in direct patient care,[23, 24, 25] the use of NPAs may allow our hospitalists to spend greater amounts of time with their patients, thus improving patients' rating of their overall care and influencing their perceived ability to understand their physician's role.
Although there was no difference between general medicine teaching and hospitalist services with respect to patient understanding of their roles, our data suggest that both groups would benefit from interventions to target this area. Focused attempts at improving patient's ability to identify and explain the roles of their inpatient physician(s) have been performed. For example, previous studies have attempted to improve a patient's ability to identify their physician through physician facecards[8, 9] or the use of other simple interventions (ie, bedside whiteboards).[4, 26] Results from such interventions are mixed, as they have demonstrated the capacity to improve patients' ability to identify who their physician is, whereas few have shown any appreciable improvement in patient satisfaction.[26]
Although our findings suggest that structural differences in team composition may be a possible explanation, it is also important to consider how the quality of care a patient receives affects their experience. For instance, hospitalists have been shown to produce moderate improvements in patient‐centered outcomes such as 30‐day readmission[27] and hospital length of stay[14, 28, 29, 30, 31] when compared to other care providers, which in turn could be reflected in the patient's perception of their overall care. In a large national study of acute care hospitals using the Hospital Consumer Assessment of Healthcare Providers and Systems survey, Chen and colleagues found that for most measures of patient satisfaction, hospitals with greater use of hospitalist care were associated with better patient‐centered care.[13] These outcomes were in part driven by patient‐centered domains such as discharge planning, pain control, and medication management. It is possible that patients are sensitive to the improved outcomes that are associated with hospitalist services, and reflect this in their measures of patient satisfaction.
Last, because this is an observational study and not a randomized trial, it is possible that the clinical differences in the patients cared for by these services could have led to our findings. Although the clinical significance of the differences in patient demographics were small, patients seen on the hospitalist service were more likely to be older white males, with a slightly longer LOS, greater comorbidities, and more hospitalizations in the previous year than those seen on the general medicine teaching service. Additionally, our hospitalist service frequently cares for highly specific subpopulations (ie, liver and renal transplant patients, and oncology patients), which could have influenced our results. For example, transplant patients who may be very grateful for their second chance, are preferentially admitted to the hospitalist service, which could have biased our results in favor of hospitalists.[32] Unfortunately, we were unable to control for all such factors.
Although we hope that multivariable analysis can adjust for many of these differences, we are not able to account for possible unmeasured confounders such as time of day of admission, health literacy, personality differences, physician turnover, or nursing and other ancillary care that could contribute to these findings. In addition to its observational study design, our study has several other limitations. First, our study was performed at a single institution, thus limiting its generalizability. Second, as a retrospective study based on observational data, no definitive conclusions regarding causality can be made. Third, although our response rate was low, it is comparable to other studies that have examined underserved populations.[33, 34] Fourth, because our survey was performed 30 days after hospitalization, this may impart imprecision on our outcomes measures. Finally, we were not able to mitigate selection bias through imputation for missing data .
All together, given the small absolute differences between the groups in patients' ratings of their overall care compared to large differences in possible confounders, these findings call for further exploration into the significance and possible mechanisms of these outcomes. Our study raises the potential possibility that the structural component of a care team may play a role in overall patient satisfaction. If this is the case, future studies of team structure could help inform how best to optimize this component for the patient experience. On the other hand, if process differences are to explain our findings, it is important to distill the types of processes hospitalists are using to improve the patient experience and potentially export this to resident services.
Finally, if similar results were found in other institutions, these findings could have implications on how hospitals respond to new payment models that are linked to patient‐experience measures. For example, the Hospital Value‐Based Purchasing Program currently links the Centers for Medicare and Medicaid Services payments to a set of quality measures that consist of (1) clinical processes of care (70%) and (2) the patient experience (30%).[1] Given this linkage, any small changes in the domain of patient satisfaction could have large payment implications on a national level.
CONCLUSION
In summary, in this large‐scale multiyear study, patients cared for by a nonteaching hospitalist service reported greater satisfaction with their overall care than patients cared for by a general medicine teaching service. This difference could be mediated by the structural differences between these 2 services. As hospitals seek to optimize patient experiences in an era where reimbursement models are now being linked to patient‐experience measures, future work should focus on further understanding the mechanisms for these findings.
Disclosures
Financial support for this work was provided by the Robert Wood Johnson Investigator Program (RWJF Grant ID 63910 PI Meltzer), a Midcareer Career Development Award from the National Institute of Aging (1 K24 AG031326‐01, PI Meltzer), and a Clinical and Translational Science Award (NIH/NCATS 2UL1TR000430‐08, PI Solway, Meltzer Core Leader). The authors report no conflicts of interest.
- Hospital Consumer Assessment of Healthcare Providers and Systems. HCAHPS fact sheet. CAHPS hospital survey August 2013. Available at: http://www.hcahpsonline.org/files/August_2013_HCAHPS_Fact_Sheet3.pdf. Accessed February 2, 2015.
- , , , et al. Transitions of Care Consensus policy statement: American College of Physicians, Society of General Internal Medicine, Society of Hospital Medicine, American Geriatrics Society, American College Of Emergency Physicians, and Society for Academic Emergency Medicine. J Hosp Med. 2009;4(6):364–370.
- Accreditation Council for Graduate Medical Education. Common program requirements. Available at: http://www.acgme.org/acgmeweb/Portals/0/PFAssets/ProgramRequirements/CPRs2013.pdf. Accessed January 15, 2015.
- , , . Increasing a patient's ability to identify his or her attending physician using a patient room display. Arch Intern Med. 2010;170(12):1084–1085.
- , , , , , . Ability of hospitalized patients to identify their in‐hospital physicians. Arch Intern Med. 2009;169(2):199–201.
- , , , et al. Hospitalized patients' understanding of their plan of care. Mayo Clin Proc. 2010;85(1):47–52.
- , , , et al. Patient‐physician communication at hospital discharge and patients' understanding of the postdischarge treatment plan. Arch Intern Med. 1997;157(9):1026–1030.
- , , , et al. Improving inpatients' identification of their doctors: use of FACE cards. Jt Comm J Qual Patient Saf. 2009;35(12):613–619.
- , , , , , . The impact of facecards on patients' knowledge, satisfaction, trust, and agreement with hospital physicians: a pilot study. J Hosp Med. 2014;9(3):137–141.
- , , . Restructuring an inpatient resident service to improve outcomes for residents, students, and patients. Acad Med. 2011;86(12):1500–1507.
- , , . Residency training in the modern era: the pipe dream of less time to learn more, care better, and be more professional. Arch Intern Med. 2005;165(22):2561–2562.
- , , , , . Managing discontinuity in academic medical centers: strategies for a safe and effective resident sign‐out. J Hosp Med. 2006;1(4):257–266.
- , , , . Hospitalist staffing and patient satisfaction in the national Medicare population. J Hosp Med. 2013;8(3):126–131.
- , , , et al. Effects of physician experience on costs and outcomes on an academic general medicine service: results of a trial of hospitalists. Ann Intern Med. 2002;137(11):866–874.
- , , , , , . The Effects of on‐duty napping on intern sleep time and fatigue. Ann Intern Med. 2006;144(11):792–798.
- , , , et al. Patients evaluate their hospital care: a national survey. Health Aff (Millwood). 1991;10(4):254–267.
- , , , . A new method of classifying prognostic comorbidity in longitudinal studies: development and validation. J Chronic Dis. 1987;40(5):373–383.
- Agency for Healthcare Research and Quality. Welcome to HCUPnet. Available at: http://hcupnet.ahrq.gov/HCUPnet.jsp?Id=F70FC59C286BADCB371(4):293–295.
- , , , et al. In the wake of the 2003 and 2011 duty hours regulations, how do internal medicine interns spend their time? J Gen Intern Med. 2013;28(8):1042–1047.
- , , , , , . The composition of intern work while on call. J Gen Intern Med. 2012;27(11):1432–1437.
- , , , et al. Effect of the 2011 vs 2003 duty hour regulation‐compliant models on sleep duration, trainee education, and continuity of patient care among internal medicine house staff: a randomized trial. JAMA Intern Med. 2013;173(8):649–655.
- , , , et al. The impact of hospitalist discontinuity on hospital cost, readmissions, and patient satisfaction. J Gen Intern Med. 2014;29(7):1004–1008.
- , , , , . Hospitalist time usage and cyclicality: opportunities to improve efficiency. J Hosp Med. 2010;5(6):329–334.
- , , , et al. Where did the day go?—a time‐motion study of hospitalists. J Hosp Med. 2010;5(6):323–328.
- , , . How hospitalists spend their time: insights on efficiency and safety. J Hosp Med. 2006;1(2):88–93.
- , , . Patient satisfaction associated with correct identification of physician's photographs. Mayo Clin Proc. 2001;76(6):604–608.
- , , , . Comparing patient outcomes of academician‐preceptors, hospitalist‐preceptors, and hospitalists on internal medicine services in an academic medical center. J Gen Intern Med. 2014;29(12):1672–1678.
- , , , . Comparison of processes and outcomes of pneumonia care between hospitalists and community‐based primary care physicians. Mayo Clin Proc. 2002;77(10):1053–1058.
- , , , , , . Outcomes of care by hospitalists, general internists, and family physicians. N Engl J Med. 2007;357(25):2589–2600.
- . A systematic review of outcomes and quality measures in adult patients cared for by hospitalists vs nonhospitalists. Mayo Clin Proc. 2009;84(3):248–254.
- , . Do hospitalist physicians improve the quality of inpatient care delivery? A systematic review of process, efficiency and outcome measures. BMC Med. 2011;9(1):58.
- , . Patients' experiences of everyday life after lung transplantation. J Clin Nurs. 2009;18(24):3472–3479.
- , , , et al. Optimal design features for surveying low‐income populations. J Health Care Poor Underserved. 2005;16(4):677–690.
The hospitalized patient experience has become an area of increased focus for hospitals given the recent coupling of patient satisfaction to reimbursement rates for Medicare patients.[1] Although patient experiences are multifactorial, 1 component is the relationship that hospitalized patients develop with their inpatient physicians. In recognition of the importance of this relationship, several organizations including the Society of Hospital Medicine, Society of General Internal Medicine, American College of Physicians, the American College of Emergency Physicians, and the Accreditation Council for Graduate Medical Education have recommended that patients know and understand who is guiding their care at all times during their hospitalization.[2, 3] Unfortunately, previous studies have shown that hospitalized patients often lack the ability to identify[4, 5] and understand their course of care.[6, 7] This may be due to numerous clinical factors including lack of a prior relationship, rapid pace of clinical care, and the frequent transitions of care found in both hospitalists and general medicine teaching services.[5, 8, 9] Regardless of the cause, one could hypothesize that patients who are unable to identify or understand the role of their physician may be less informed about their hospitalization, which may lead to further confusion, dissatisfaction, and ultimately a poor experience.
Given the proliferation of nonteaching hospitalist services in teaching hospitals, it is important to understand if patient experiences differ between general medicine teaching and hospitalist services. Several reasons could explain why patient experiences may vary on these services. For example, patients on a hospitalist service will likely interact with a single physician caretaker, which may give a feeling of more personalized care. In contrast, patients on general medicine teaching services are cared for by larger teams of residents under the supervision of an attending physician. Residents are also subjected to duty‐hour restrictions, clinic responsibilities, and other educational requirements that may impede the continuity of care for hospitalized patients.[10, 11, 12] Although 1 study has shown that hospitalist‐intensive hospitals perform better on patient satisfaction measures,[13] no study to date has compared patient‐reported experiences on general medicine teaching and nonteaching hospitalist services. This study aimed to evaluate the hospitalized patient experience on both teaching and nonteaching hospitalist services by assessing several patient‐reported measures of their experience, namely their confidence in their ability to identify their physician(s), understand their roles, and their rating of both the coordination and overall care.
METHODS
Study Design
We performed a retrospective cohort analysis at the University of Chicago Medical Center between July 2007 and June 2013. Data were acquired as part of the Hospitalist Project, an ongoing study that is used to evaluate the impact of hospitalists, and now serves as infrastructure to continue research related to hospital care at University of Chicago.[14] Patients were cared for by either the general medicine teaching service or the nonteaching hospitalist service. General medicine teaching services were composed of an attending physician who rotates for 2 weeks at a time, a second‐ or third‐year medicine resident, 1 to 2 medicine interns, and 1 to 2 medical students.[15] The attending physician assigned to the patient's hospitalization was the attending listed on the first day of hospitalization, regardless of the length of hospitalization. Nonteaching hospitalist services consisted of a single hospitalist who worked 7‐day shifts, and were assisted by a nurse practitioner/physician's assistant (NPA). The majority of attendings on the hospitalist service were less than 5 years out of residency. Both services admitted 7 days a week, with patients initially admitted to the general medicine teaching service until resident caps were met, after which all subsequent admissions were admitted to the hospitalist service. In addition, the hospitalist service is also responsible for specific patient subpopulations, such as lung and renal transplants, and oncologic patients who have previously established care with our institution.
Data Collection
During a 30‐day posthospitalization follow‐up questionnaire, patients were surveyed regarding their confidence in their ability to identify and understand the roles of their physician(s) and their perceptions of the overall coordination of care and their overall care, using a 5‐point Likert scale (1 = poor understanding to 5 = excellent understanding). Questions related to satisfaction with care and coordination were derived from the Picker‐Commonwealth Survey, a previously validated survey meant to evaluate patient‐centered care.[16] Patients were also asked to report their race, level of education, comorbid diseases, and whether they had any prior hospitalizations within 1 year. Chart review was performed to obtain patient age, gender, and hospital length of stay (LOS), and calculated Charlson Comorbidity Index (CCI).[17] Patients with missing data or responses to survey questions were excluded from final analysis. The University of Chicago Institutional Review Board approved the study protocol, and all patients provided written consented prior to participation.
Data Analysis
After initial analysis noted that outcomes were skewed, the decision was made to dichotomize the data and use logistic rather than linear regression models. Patient responses to the follow‐up phone questionnaire were dichotomized to reflect the top 2 categories (excellent and very good). Pearson 2 analysis was used to assess for any differences in demographic characteristics, disease severity, and measures of patient experience between the 2 services. To assess if service type was associated with differences in our 4 measures of patient experience, we created a 3‐level mixed‐effects logistic regression using a logit function while controlling for age, gender, race, CCI, LOS, previous hospitalizations within 1 year, level of education, and academic year. These models studied the longitudinal association between teaching service and the 4 outcome measures, while also controlling for the cluster effect of time nested within individual patients who were clustered within physicians. The model included random intercepts at both the patient and physician level and also included a random effect of service (teaching vs nonteaching) at the patient level. A Hausman test was used to determine if these random‐effects models improved fit over a fixed‐effects model, and the intraclass correlations were compared using likelihood ratio tests to determine the appropriateness of a 3‐level versus 2‐level model. Data management and 2 analyses were performed using Stata version 13.0 (StataCorp, College Station, TX), and mixed‐effects regression models were done in SuperMix (Scientific Software International, Skokie, IL).
RESULTS
In total, 14,855 patients were enrolled during their hospitalization with 57% and 61% completing the 30‐day follow‐up survey on the hospitalist and general medicine teaching service, respectively. In total, 4131 (69%) and 4322 (48%) of the hospitalist and general medicine services, respectively, either did not answer all survey questions, or were missing basic demographic data, and thus were excluded. Data from 4591 patients on the general medicine teaching (52% of those enrolled at hospitalization) and 1811 on the hospitalist service (31% of those enrolled at hospitalization) were used for final analysis (Figure 1). Respondents were predominantly female (61% and 56%), African American (75% and 63%), with a mean age of 56.2 (19.4) and 57.1 (16.1) years, for the general medicine teaching and hospitalist services, respectively. A majority of patients (71% and 66%) had a CCI of 0 to 3 on both services. There were differences in self‐reported comorbidities between the 2 groups, with hospitalist services having a higher prevalence of cancer (20% vs 7%), renal disease (25% vs 18%), and liver disease (23% vs 7%). Patients on the hospitalist service had a longer mean LOS (5.5 vs 4.8 days), a greater percentage of a hospitalization within 1 year (58% vs 52%), and a larger proportion who were admitted in 2011 to 2013 compared to 2007 to 2010 (75% vs 39%), when compared to the general medicine teaching services. Median LOS and interquartile ranges were similar between both groups. Although most baseline demographics were statistically different between the 2 groups (Table 1), these differences were likely clinically insignificant. Compared to those who responded to the follow‐up survey, nonresponders were more likely to be African American (73% and 64%, P < 0.001) and female (60% and 56%, P < 0.01). The nonresponders were more likely to be hospitalized in the past 1 year (62% and 53%, P < 0.001) and have a lower CCI (CCI 03 [75% and 80%, P < 0.001]) compared to responders. Demographics between responders and nonresponders were also statistically different from one another.
| Variable | General Medicine Teaching | Nonteaching Hospitalist | P Value |
|---|---|---|---|
| |||
| Total (n) | 4,591 | 1,811 | <0.001 |
| Attending classification, hospitalist, n (%) | 1,147 (25) | 1,811 (100) | |
| Response rate, % | 61 | 57 | <0.01 |
| Age, y, mean SD | 56.2 19.4 | 57.1 16.1 | <0.01 |
| Gender, n (%) | <0.01 | ||
| Male | 1,796 (39) | 805 (44) | |
| Female | 2,795 (61) | 1,004 (56) | |
| Race, n (%) | <0.01 | ||
| African American | 3,440 (75) | 1,092 (63) | |
| White | 900 (20) | 571 (32) | |
| Asian/Pacific | 38 (1) | 17 (1) | |
| Other | 20 (1) | 10 (1) | |
| Unknown | 134 (3) | 52 (3) | |
| Charlson Comorbidity Index, n (%) | <0.001 | ||
| 0 | 1,635 (36) | 532 (29) | |
| 12 | 1,590 (35) | 675 (37) | |
| 39 | 1,366 (30) | 602 (33) | |
| Self‐reported comorbidities | |||
| Anemia/sickle cell disease | 1,201 (26) | 408 (23) | 0.003 |
| Asthma/COPD | 1,251 (28) | 432 (24) | 0.006 |
| Cancer* | 300 (7) | 371 (20) | <0.001 |
| Depression | 1,035 (23) | 411 (23) | 0.887 |
| Diabetes | 1,381 (30) | 584 (32) | 0.087 |
| Gastrointestinal | 1,140 (25) | 485 (27) | 0.104 |
| Cardiac | 1,336 (29) | 520 (29) | 0.770 |
| Hypertension | 2,566 (56) | 1,042 (58) | 0.222 |
| HIV/AIDS | 151 (3) | 40 (2) | 0.022 |
| Kidney disease | 828 (18) | 459 (25) | <0.001 |
| Liver disease | 313 (7) | 417 (23) | <0.001 |
| Stroke | 543 (12) | 201 (11) | 0.417 |
| Education level | 0.066 | ||
| High school | 2,248 (49) | 832 (46) | |
| Junior college/college | 1,878 (41) | 781 (43) | |
| Postgraduate | 388 (8) | 173 (10) | |
| Don't know | 77 (2) | 23 (1) | |
| Academic year, n (%) | <0.001 | ||
| July 2007 June 2008 | 938 (20) | 90 (5) | |
| July 2008 June 2009 | 702 (15) | 148 (8) | |
| July 2009 June 2010 | 576(13) | 85 (5) | |
| July 2010 June 2011 | 602 (13) | 138 (8) | |
| July 2011 June 2012 | 769 (17) | 574 (32) | |
| July 2012 June 2013 | 1,004 (22) | 774 (43) | |
| Length of stay, d, mean SD | 4.8 7.3 | 5.5 6.4 | <0.01 |
| Prior hospitalization (within 1 year), yes, n (%) | 2,379 (52) | 1,039 (58) | <0.01 |
Unadjusted results revealed that patients on the hospitalist service were more confident in their abilities to identify their physician(s) (50% vs 45%, P < 0.001), perceived greater ability in understanding the role of their physician(s) (54% vs 50%, P < 0.001), and reported greater satisfaction with coordination and teamwork (68% vs 64%, P = 0.006) and with overall care (73% vs 67%, P < 0.001) (Figure 2).
From the mixed‐effects regression models it was discovered that admission to the hospitalist service was associated with a higher odds ratio (OR) of reporting overall care as excellent or very good (OR: 1.33; 95% confidence interval [CI]: 1.15‐1.47). There was no difference between services in patients' ability to identify their physician(s) (OR: 0.89; 95% CI: 0.61‐1.11), in patients reporting a better understanding of the role of their physician(s) (OR: 1.09; 95% CI: 0.94‐1.23), or in their rating of overall coordination and teamwork (OR: 0.71; 95% CI: 0.42‐1.89).
A subgroup analysis was performed on the 25% of hospitalist attendings in the general medicine teaching service comparing this cohort to the hospitalist services, and it was found that patients perceived better overall care on the hospitalist service (OR: 1.17; 95% CI: 1.01‐ 1.31) than on the general medicine service (Table 2). All other domains in the subgroup analysis were not statistically significant. Finally, an ordinal logistic regression was performed for each of these outcomes, but it did not show any major differences compared to the logistic regression of dichotomous outcomes.
| Domains in Patient Experience* | Odds Ratio (95% CI) | P Value |
|---|---|---|
| ||
| How would you rate your ability to identify the physicians and trainees on your general medicine team during the hospitalization? | ||
| Model 1 | 0.89 (0.611.11) | 0.32 |
| Model 2 | 0.98 (0.671.22) | 0.86 |
| How would you rate your understanding of the roles of the physicians and trainees on your general medicine team? | ||
| Model 1 | 1.09 (0.941.23) | 0.25 |
| Model 2 | 1.19 (0.981.36) | 0.08 |
| How would you rate the overall coordination and teamwork among the doctors and nurses who care for you during your hospital stay? | ||
| Model 1 | 0.71 (0.421.89) | 0.18 |
| Model 2 | 0.82 (0.651.20) | 0.23 |
| Overall, how would you rate the care you received at the hospital? | ||
| Model 1 | 1.33 (1.151.47) | 0.001 |
| Model 2 | 1.17 (1.011.31) | 0.04 |
DISCUSSION
This study is the first to directly compare measures of patient experience on hospitalist and general medicine teaching services in a large, multiyear comparison across multiple domains. In adjusted analysis, we found that patients on nonteaching hospitalist services rated their overall care better than those on general medicine teaching services, whereas no differences in patients' ability to identify their physician(s), understand their role in their care, or rating of coordination of care were found. Although the magnitude of the differences in rating of overall care may appear small, it remains noteworthy because of the recent focus on patient experience at the reimbursement level, where small differences in performance can lead to large changes in payment. Because of the observational design of this study, it is important to consider mechanisms that could account for our findings.
The first are the structural differences between the 2 services. Our subgroup analysis comparing patients rating of overall care on a general medicine service with a hospitalist attending to a pure hospitalist cohort found a significant difference between the groups, indicating that the structural differences between the 2 groups may be a significant contributor to patient satisfaction ratings. Under the care of a hospitalist service, a patient would only interact with a single physician on a daily basis, possibly leading to a more meaningful relationship and improved communication between patient and provider. Alternatively, while on a general medicine teaching service, patients would likely interact with multiple physicians, as a result making their confidence in their ability to identify and perception at understanding physicians' roles more challenging.[18] This dilemma is further compounded by duty hour restrictions, which have subsequently led to increased fragmentation in housestaff scheduling. The patient experience on the general medicine teaching service may be further complicated by recent data that show residents spend a minority of time in direct patient care,[19, 20] which could additionally contribute to patients' inability to understand who their physicians are and to the decreased satisfaction with their care. This combination of structural complexity, duty hour reform, and reduced direct patient interaction would likely decrease the chance a patient will interact with the same resident on a consistent basis,[5, 21] thus making the ability to truly understand who their caretakers are, and the role they play, more difficult.
Another contributing factor could be the use of NPAs on our hospitalist service. Given that these providers often see the patient on a more continual basis, hospitalized patients' exposure to a single, continuous caretaker may be a factor in our findings.[22] Furthermore, with studies showing that hospitalists also spend a small fraction of their day in direct patient care,[23, 24, 25] the use of NPAs may allow our hospitalists to spend greater amounts of time with their patients, thus improving patients' rating of their overall care and influencing their perceived ability to understand their physician's role.
Although there was no difference between general medicine teaching and hospitalist services with respect to patient understanding of their roles, our data suggest that both groups would benefit from interventions to target this area. Focused attempts at improving patient's ability to identify and explain the roles of their inpatient physician(s) have been performed. For example, previous studies have attempted to improve a patient's ability to identify their physician through physician facecards[8, 9] or the use of other simple interventions (ie, bedside whiteboards).[4, 26] Results from such interventions are mixed, as they have demonstrated the capacity to improve patients' ability to identify who their physician is, whereas few have shown any appreciable improvement in patient satisfaction.[26]
Although our findings suggest that structural differences in team composition may be a possible explanation, it is also important to consider how the quality of care a patient receives affects their experience. For instance, hospitalists have been shown to produce moderate improvements in patient‐centered outcomes such as 30‐day readmission[27] and hospital length of stay[14, 28, 29, 30, 31] when compared to other care providers, which in turn could be reflected in the patient's perception of their overall care. In a large national study of acute care hospitals using the Hospital Consumer Assessment of Healthcare Providers and Systems survey, Chen and colleagues found that for most measures of patient satisfaction, hospitals with greater use of hospitalist care were associated with better patient‐centered care.[13] These outcomes were in part driven by patient‐centered domains such as discharge planning, pain control, and medication management. It is possible that patients are sensitive to the improved outcomes that are associated with hospitalist services, and reflect this in their measures of patient satisfaction.
Last, because this is an observational study and not a randomized trial, it is possible that the clinical differences in the patients cared for by these services could have led to our findings. Although the clinical significance of the differences in patient demographics were small, patients seen on the hospitalist service were more likely to be older white males, with a slightly longer LOS, greater comorbidities, and more hospitalizations in the previous year than those seen on the general medicine teaching service. Additionally, our hospitalist service frequently cares for highly specific subpopulations (ie, liver and renal transplant patients, and oncology patients), which could have influenced our results. For example, transplant patients who may be very grateful for their second chance, are preferentially admitted to the hospitalist service, which could have biased our results in favor of hospitalists.[32] Unfortunately, we were unable to control for all such factors.
Although we hope that multivariable analysis can adjust for many of these differences, we are not able to account for possible unmeasured confounders such as time of day of admission, health literacy, personality differences, physician turnover, or nursing and other ancillary care that could contribute to these findings. In addition to its observational study design, our study has several other limitations. First, our study was performed at a single institution, thus limiting its generalizability. Second, as a retrospective study based on observational data, no definitive conclusions regarding causality can be made. Third, although our response rate was low, it is comparable to other studies that have examined underserved populations.[33, 34] Fourth, because our survey was performed 30 days after hospitalization, this may impart imprecision on our outcomes measures. Finally, we were not able to mitigate selection bias through imputation for missing data .
All together, given the small absolute differences between the groups in patients' ratings of their overall care compared to large differences in possible confounders, these findings call for further exploration into the significance and possible mechanisms of these outcomes. Our study raises the potential possibility that the structural component of a care team may play a role in overall patient satisfaction. If this is the case, future studies of team structure could help inform how best to optimize this component for the patient experience. On the other hand, if process differences are to explain our findings, it is important to distill the types of processes hospitalists are using to improve the patient experience and potentially export this to resident services.
Finally, if similar results were found in other institutions, these findings could have implications on how hospitals respond to new payment models that are linked to patient‐experience measures. For example, the Hospital Value‐Based Purchasing Program currently links the Centers for Medicare and Medicaid Services payments to a set of quality measures that consist of (1) clinical processes of care (70%) and (2) the patient experience (30%).[1] Given this linkage, any small changes in the domain of patient satisfaction could have large payment implications on a national level.
CONCLUSION
In summary, in this large‐scale multiyear study, patients cared for by a nonteaching hospitalist service reported greater satisfaction with their overall care than patients cared for by a general medicine teaching service. This difference could be mediated by the structural differences between these 2 services. As hospitals seek to optimize patient experiences in an era where reimbursement models are now being linked to patient‐experience measures, future work should focus on further understanding the mechanisms for these findings.
Disclosures
Financial support for this work was provided by the Robert Wood Johnson Investigator Program (RWJF Grant ID 63910 PI Meltzer), a Midcareer Career Development Award from the National Institute of Aging (1 K24 AG031326‐01, PI Meltzer), and a Clinical and Translational Science Award (NIH/NCATS 2UL1TR000430‐08, PI Solway, Meltzer Core Leader). The authors report no conflicts of interest.
- Hospital Consumer Assessment of Healthcare Providers and Systems. HCAHPS fact sheet. CAHPS hospital survey August 2013. Available at: http://www.hcahpsonline.org/files/August_2013_HCAHPS_Fact_Sheet3.pdf. Accessed February 2, 2015.
- , , , et al. Transitions of Care Consensus policy statement: American College of Physicians, Society of General Internal Medicine, Society of Hospital Medicine, American Geriatrics Society, American College Of Emergency Physicians, and Society for Academic Emergency Medicine. J Hosp Med. 2009;4(6):364–370.
- Accreditation Council for Graduate Medical Education. Common program requirements. Available at: http://www.acgme.org/acgmeweb/Portals/0/PFAssets/ProgramRequirements/CPRs2013.pdf. Accessed January 15, 2015.
- , , . Increasing a patient's ability to identify his or her attending physician using a patient room display. Arch Intern Med. 2010;170(12):1084–1085.
- , , , , , . Ability of hospitalized patients to identify their in‐hospital physicians. Arch Intern Med. 2009;169(2):199–201.
- , , , et al. Hospitalized patients' understanding of their plan of care. Mayo Clin Proc. 2010;85(1):47–52.
- , , , et al. Patient‐physician communication at hospital discharge and patients' understanding of the postdischarge treatment plan. Arch Intern Med. 1997;157(9):1026–1030.
- , , , et al. Improving inpatients' identification of their doctors: use of FACE cards. Jt Comm J Qual Patient Saf. 2009;35(12):613–619.
- , , , , , . The impact of facecards on patients' knowledge, satisfaction, trust, and agreement with hospital physicians: a pilot study. J Hosp Med. 2014;9(3):137–141.
- , , . Restructuring an inpatient resident service to improve outcomes for residents, students, and patients. Acad Med. 2011;86(12):1500–1507.
- , , . Residency training in the modern era: the pipe dream of less time to learn more, care better, and be more professional. Arch Intern Med. 2005;165(22):2561–2562.
- , , , , . Managing discontinuity in academic medical centers: strategies for a safe and effective resident sign‐out. J Hosp Med. 2006;1(4):257–266.
- , , , . Hospitalist staffing and patient satisfaction in the national Medicare population. J Hosp Med. 2013;8(3):126–131.
- , , , et al. Effects of physician experience on costs and outcomes on an academic general medicine service: results of a trial of hospitalists. Ann Intern Med. 2002;137(11):866–874.
- , , , , , . The Effects of on‐duty napping on intern sleep time and fatigue. Ann Intern Med. 2006;144(11):792–798.
- , , , et al. Patients evaluate their hospital care: a national survey. Health Aff (Millwood). 1991;10(4):254–267.
- , , , . A new method of classifying prognostic comorbidity in longitudinal studies: development and validation. J Chronic Dis. 1987;40(5):373–383.
- Agency for Healthcare Research and Quality. Welcome to HCUPnet. Available at: http://hcupnet.ahrq.gov/HCUPnet.jsp?Id=F70FC59C286BADCB371(4):293–295.
- , , , et al. In the wake of the 2003 and 2011 duty hours regulations, how do internal medicine interns spend their time? J Gen Intern Med. 2013;28(8):1042–1047.
- , , , , , . The composition of intern work while on call. J Gen Intern Med. 2012;27(11):1432–1437.
- , , , et al. Effect of the 2011 vs 2003 duty hour regulation‐compliant models on sleep duration, trainee education, and continuity of patient care among internal medicine house staff: a randomized trial. JAMA Intern Med. 2013;173(8):649–655.
- , , , et al. The impact of hospitalist discontinuity on hospital cost, readmissions, and patient satisfaction. J Gen Intern Med. 2014;29(7):1004–1008.
- , , , , . Hospitalist time usage and cyclicality: opportunities to improve efficiency. J Hosp Med. 2010;5(6):329–334.
- , , , et al. Where did the day go?—a time‐motion study of hospitalists. J Hosp Med. 2010;5(6):323–328.
- , , . How hospitalists spend their time: insights on efficiency and safety. J Hosp Med. 2006;1(2):88–93.
- , , . Patient satisfaction associated with correct identification of physician's photographs. Mayo Clin Proc. 2001;76(6):604–608.
- , , , . Comparing patient outcomes of academician‐preceptors, hospitalist‐preceptors, and hospitalists on internal medicine services in an academic medical center. J Gen Intern Med. 2014;29(12):1672–1678.
- , , , . Comparison of processes and outcomes of pneumonia care between hospitalists and community‐based primary care physicians. Mayo Clin Proc. 2002;77(10):1053–1058.
- , , , , , . Outcomes of care by hospitalists, general internists, and family physicians. N Engl J Med. 2007;357(25):2589–2600.
- . A systematic review of outcomes and quality measures in adult patients cared for by hospitalists vs nonhospitalists. Mayo Clin Proc. 2009;84(3):248–254.
- , . Do hospitalist physicians improve the quality of inpatient care delivery? A systematic review of process, efficiency and outcome measures. BMC Med. 2011;9(1):58.
- , . Patients' experiences of everyday life after lung transplantation. J Clin Nurs. 2009;18(24):3472–3479.
- , , , et al. Optimal design features for surveying low‐income populations. J Health Care Poor Underserved. 2005;16(4):677–690.
© 2015 Society of Hospital Medicine