User login
Journal of Hospital Medicine – Dec. 2017
BACKGROUND: Identifying hospitals that are both early and consistent adopters of high-value care can help shed light on the culture and practices at those institutions that are necessary to promote high-value care nationwide. The use of troponin testing to diagnose acute myocardial infarction (AMI), and not testing for myoglobin or creatine kinase-MB (CK-MB), is a high-value recommendation of the Choosing Wisely® campaign.
OBJECTIVE: To examine the variation in cardiac biomarker testing and the effect of the Choosing Wisely® troponin-only testing recommendation for the diagnosis of AMI.
DESIGN: A retrospective, observational study using administrative ordering data from Vizient’s Clinical Database/Resource Manager.

PATIENTS: Hospitalized patients with a principal discharge diagnosis of AMI.
INTERVENTION: The Choosing Wisely® recommendation to order troponin-only testing to diagnose AMI was released during the first quarter of 2015.
RESULTS: In 19 hospitals, troponin-only testing was consistently ordered to diagnose AMI before the Choosing Wisely® recommendation and throughout the study period. In 34 hospitals, both troponin testing and myoglobin/CK-MB testing were ordered to diagnose AMI even after the Choosing Wisely® recommendation. In 26 hospitals with low rates of troponin-only testing before the Choosing Wisely® recommendation, the release of the recommendation was associated with a statistically significant increase in the rate of troponin-only testing to diagnose AMI.
CONCLUSION: In institutions with low rates of troponin-only testing prior to the Choosing Wisely® recommendation, the recommendation was associated with a significant increase in the rate of troponin-only testing.
Read the entire article in the Dec. 2017 issue of the Journal of Hospital Medicine.
Also in JHM this month
Hospital perceptions of Medicare’s Sepsis Quality Reporting Initiative
AUTHORS: Ian J. Barbash, MD, MS; Kimberly J. Rak, PhD; Courtney C. Kuza, MPH; and Jeremy M. Kahn, MD, MS
Health literacy and hospital length of stay: An inpatient cohort study
AUTHORS: Ethan G. Jaffee, MD; Vineet M. Arora, MD, MAPP; Madeleine I. Matthiesen, MD; David O. Meltzer, MD, PhD, MHM; and Valerie G. Press, MD, FAAP, FACP, MPH
How exemplary teaching physicians interact with hospitalized patients
AUTHORS: Sanjay Saint, MD, MPH, FHM; Molly Harrod, PhD; Karen E. Fowler, MPH; and Nathan Houchens, MD, FACP, FHM
A randomized cohort controlled trial to compare intern sign-out training interventions
AUTHORS: Soo-Hoon Lee, PhD; Christopher Terndrup, MD; Phillip H. Phan, PhD; Sandra E. Zaeh, MD; Kwame Atsina, MD; Nicole Minkove, MD; Alexander Billioux, MD; DPhil, Souvik Chatterjee, MD; Idoreyin Montague, MD; Bennett Clark, MD; Andrew Hughes, MD; and Sanjay V. Desai, MD
BACKGROUND: Identifying hospitals that are both early and consistent adopters of high-value care can help shed light on the culture and practices at those institutions that are necessary to promote high-value care nationwide. The use of troponin testing to diagnose acute myocardial infarction (AMI), and not testing for myoglobin or creatine kinase-MB (CK-MB), is a high-value recommendation of the Choosing Wisely® campaign.
OBJECTIVE: To examine the variation in cardiac biomarker testing and the effect of the Choosing Wisely® troponin-only testing recommendation for the diagnosis of AMI.
DESIGN: A retrospective, observational study using administrative ordering data from Vizient’s Clinical Database/Resource Manager.
PATIENTS: Hospitalized patients with a principal discharge diagnosis of AMI.
INTERVENTION: The Choosing Wisely® recommendation to order troponin-only testing to diagnose AMI was released during the first quarter of 2015.
RESULTS: In 19 hospitals, troponin-only testing was consistently ordered to diagnose AMI before the Choosing Wisely® recommendation and throughout the study period. In 34 hospitals, both troponin testing and myoglobin/CK-MB testing were ordered to diagnose AMI even after the Choosing Wisely® recommendation. In 26 hospitals with low rates of troponin-only testing before the Choosing Wisely® recommendation, the release of the recommendation was associated with a statistically significant increase in the rate of troponin-only testing to diagnose AMI.
CONCLUSION: In institutions with low rates of troponin-only testing prior to the Choosing Wisely® recommendation, the recommendation was associated with a significant increase in the rate of troponin-only testing.
Read the entire article in the Dec. 2017 issue of the Journal of Hospital Medicine.
Also in JHM this month
Hospital perceptions of Medicare’s Sepsis Quality Reporting Initiative
AUTHORS: Ian J. Barbash, MD, MS; Kimberly J. Rak, PhD; Courtney C. Kuza, MPH; and Jeremy M. Kahn, MD, MS
Health literacy and hospital length of stay: An inpatient cohort study
AUTHORS: Ethan G. Jaffee, MD; Vineet M. Arora, MD, MAPP; Madeleine I. Matthiesen, MD; David O. Meltzer, MD, PhD, MHM; and Valerie G. Press, MD, FAAP, FACP, MPH
How exemplary teaching physicians interact with hospitalized patients
AUTHORS: Sanjay Saint, MD, MPH, FHM; Molly Harrod, PhD; Karen E. Fowler, MPH; and Nathan Houchens, MD, FACP, FHM
A randomized cohort controlled trial to compare intern sign-out training interventions
AUTHORS: Soo-Hoon Lee, PhD; Christopher Terndrup, MD; Phillip H. Phan, PhD; Sandra E. Zaeh, MD; Kwame Atsina, MD; Nicole Minkove, MD; Alexander Billioux, MD; DPhil, Souvik Chatterjee, MD; Idoreyin Montague, MD; Bennett Clark, MD; Andrew Hughes, MD; and Sanjay V. Desai, MD
Trends in Troponin-Only Testing for AMI in Academic Teaching Hospitals and the Impact of Choosing Wisely®
Evidence suggests that troponin-only testing is the superior strategy to diagnose acute myocardial infarction (AMI).1 Because of this, in February 2015, the Choosing Wisely® campaign issued a recommendation to use troponin I or T to diagnose AMI, and not to test for myoglobin or creatine kinase-MB (CK-MB).2 This recommendation was in line with guidelines from the American Heart Association and the American College of Cardiology, which recommended that myoglobin and CK-MB are not useful and offer no benefit for the diagnosis of acute coronary syndrome.3 Some institutions have developed interventions to promote troponin-only testing, reporting substantial cost savings and no negative consequences.4,5
Despite these successes, it is likely that institutions vary with respect to the adoption of the Choosing Wisely® troponin-only testing recommendation.6 Implementing this recommendation requires both promoting clinician behavior change and a strong institutional culture of high-value care.7 Understanding the variation across institutions of troponin-only testing could inform how to promote high-value care recommendations nationwide. We aimed to describe patterns of troponin, myoglobin, and CK-MB testing in a sample of academic teaching hospitals before and after the Choosing Wisely® recommendation.
METHODS
Troponin, myoglobin, and CK-MB ordering data were extracted from Vizient’s (formerly University HealthSystem Consortium, Chicago, IL) Clinical Database/Resource Manager (CDB/RM®) for all patients with a principal discharge diagnosis of AMI at all hospitals reporting all 36 months from the fourth quarter of 2013 through the third quarter of 2016. This period includes time both before and after the Choosing Wisely® recommendation, which was released in the first quarter of 2015. Vizient’s CDB/RM contains ordering data for 300 academic medical centers and their affiliated hospitals and includes the discharge diagnoses for patients cared for by these institutions. Only patients with a principal discharge diagnosis of AMI were included because the Choosing Wisely® recommendation is specific with regard to troponin-only testing for the diagnosis of AMI. Patients with a principal diagnosis code for subcategories of myocardial ischemia (eg, stable angina, unstable angina) were not included because of the large number of diagnosis codes for these subcategories (more than 100 in the International Classification of Diseases, Ninth Revision and the International Classification of Diseases, Tenth Revision) and because the variation in their use across institutions within the dataset limited the utility of using these codes to consistently and accurately identify patients with myocardial ischemia. Moreover, the diagnosis of AMI encompasses the subcategories of myocardial ischemia.8
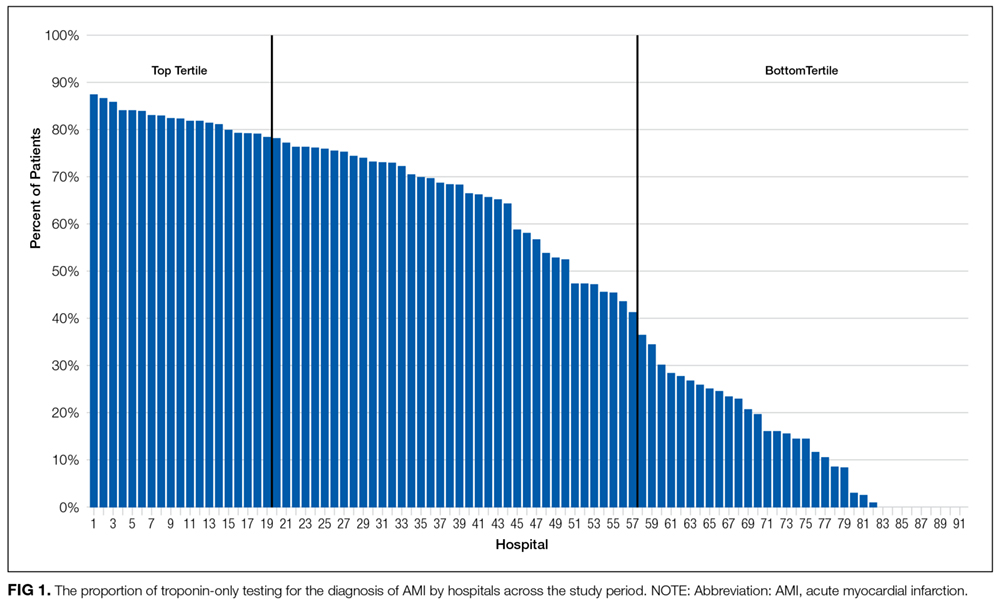
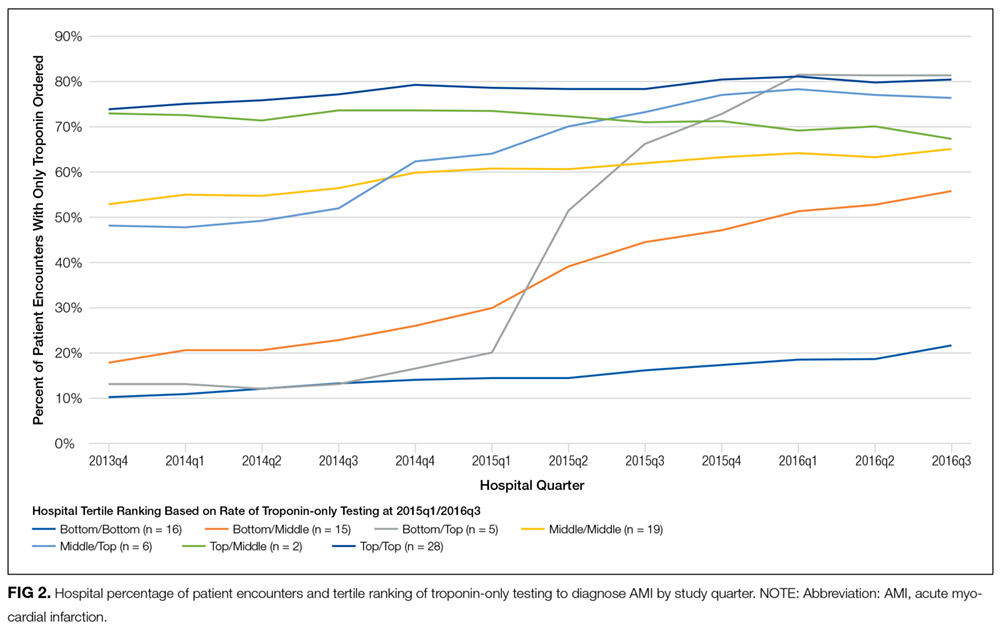
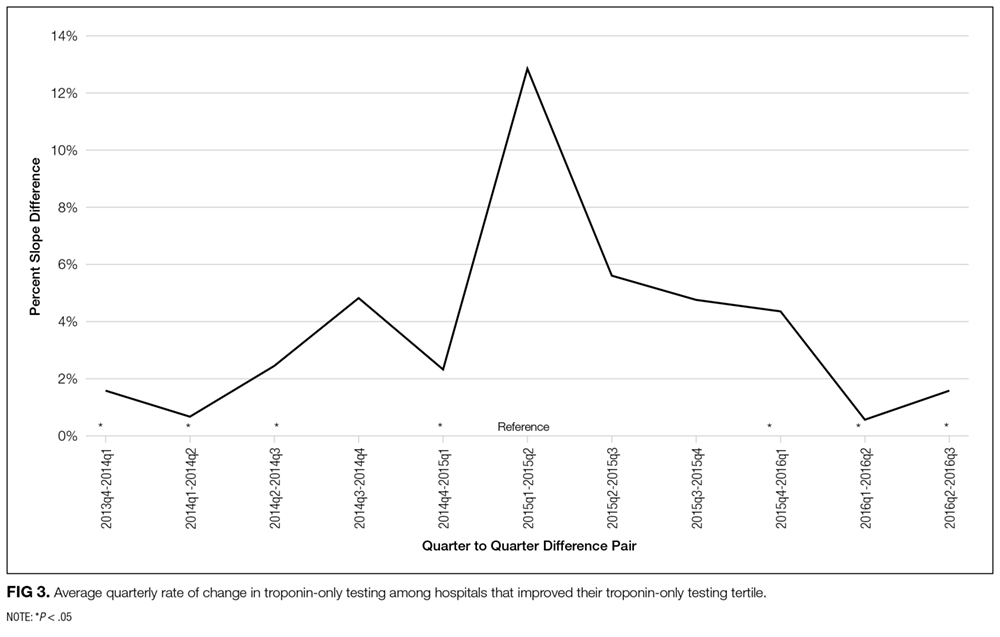
Hospital rates of ordering cardiac biomarkers (troponin-only or troponin and myoglobin/CK-MB) were determined overall for the entire study period and for each quarter of the study period based on the total patients with a discharge diagnosis of AMI. For each quarter of the 12 study quarters, all the hospitals were divided into tertiles based on their rate of troponin-only testing per discharge diagnosis of AMI. Hospitals were then classified into 3 groups based on their tertile ranking over the full 12 study quarters. The first group included hospitals whose rate of troponin-only testing placed them in the top tertile for each and all quarters throughout the study period. The second group included hospitals whose troponin-only testing rate placed them in the bottom tertile for each and all quarters throughout the study period. The third group included hospitals whose troponin-only testing rate each quarter led to either an increase or decrease in their tertile ranking throughout the study period. χ2 tests were used to test for bivariate associations among hospitals based on their rate of troponin-only testing and hospital size (number of beds), their regional geographic location, the volume of AMI patients seen at the hospital, whether the primary physician during the hospitalization was a cardiologist or other provider, and the hospitals’ quality ratings. Quality rating was based on an internal Vizient rating and the “Best Hospitals for Cardiology and Heart Surgery Rankings” as published in the US News & World Report.9 The Vizient quality rating is based on a composite score that combines scores from the domains of quality (hospital quality incentive scores), safety (patient safety indicators), patient-centeredness (Hospital Consumer Assessment of Healthcare Providers and Systems Hospital Survey), and equity (distribution of care by race/ethnicity, gender, and age). Simple slopes were calculated to determine the rate of change in troponin-only testing for each study quarter, and Student t tests were used to compare the rates of change of these simple slopes across study quarters.
RESULTS
Pattern of Troponin-Only Testing by Hospital Size
Pattern of Troponin-Only Testing by Geographic Region
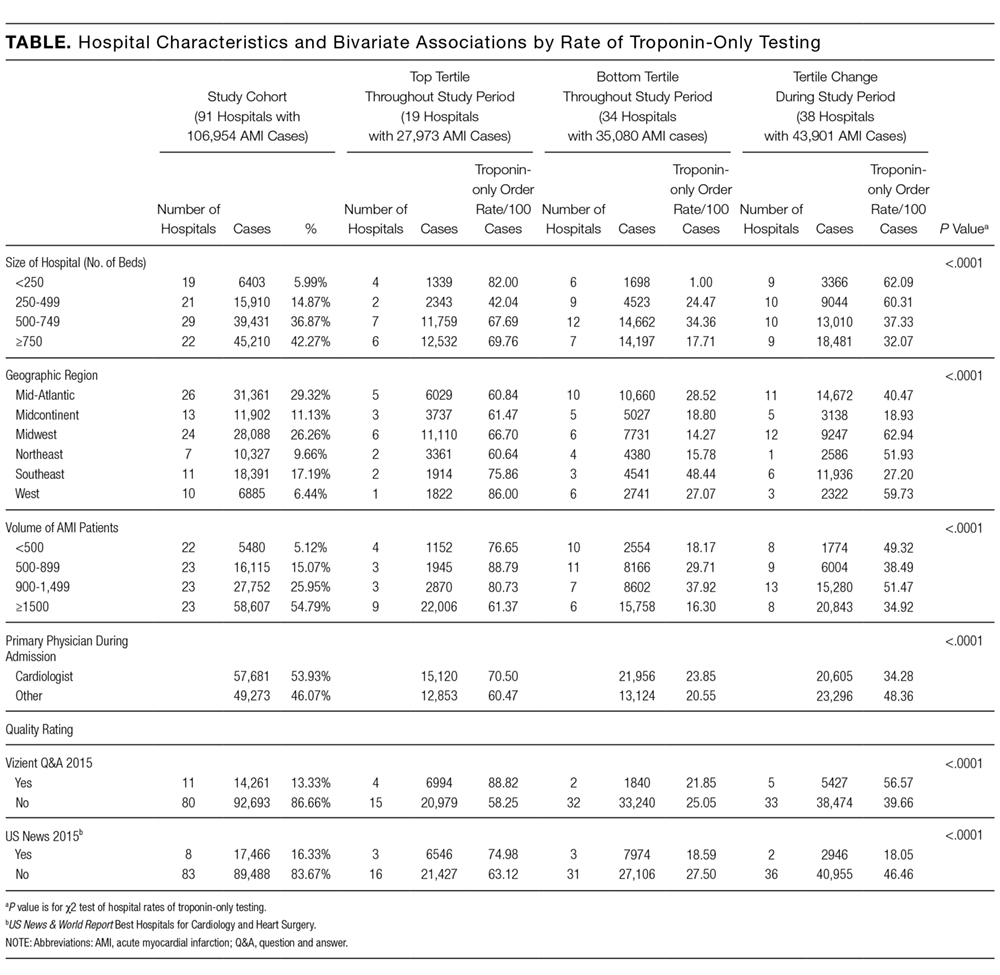
The rate of troponin-only testing also varied and was statistically significantly different when comparing the 3 groups of hospitals across geographic regions of the country (P < 0.0001). Of the hospitals in the top tertile of troponin-only testing throughout the study period, the majority were in the Midwest (n = 6) and Mid-Atlantic (n = 5) regions. However, the rate of troponin-only testing for AMI in this group was highest in hospitals in the West (86/100 patients) and/or Southeast (75/100 patients) regions, although this rate was based on a small number of hospitals in these geographic areas (n = 1 in the West, n = 2 in the Southeast). Of hospitals in the bottom tertile of troponin-only testing throughout the study period, the majority were in the Mid-Atlantic region (n = 10). Hospitals that increased their troponin-only testing during the study period were predominantly in the Midwest (n = 12) and Mid-Atlantic regions (n = 11; Table), with the hospitals in the Midwest having the highest rate of troponin-only testing in this group.
Pattern of Troponin-Only Testing by Volume of AMI Patients
Of the hospitals in the top tertile of troponin-only testing during the study period, the majority cared for ≥1500 AMI patients (n = 9), but interestingly, among these hospitals, those caring for a smaller volume of AMI patients all had higher rates of troponin-only testing per 100 patients (P < 0.0001; Table). There was no other obvious pattern of troponin-only testing based on the volume of AMI patients cared for in hospitals in either the bottom tertile of troponin-only testing or hospitals that improved troponin-only testing during the study period.
Pattern of Troponin-Only Testing by Physician Type
Of the hospitals in the top tertile of troponin-only testing throughout the study period, those where a cardiologist cared for patients with AMI had higher rates of troponin-only testing (71/100 patients) than did hospitals where patients were cared for by a noncardiologist (60/100 patients). However, of the hospitals that improved their troponin-only testing during the study period, higher rates of troponin-only testing were seen in hospitals where patients were cared for by a noncardiologist (48/100 patients) compared with patients cared for by a cardiologist (34/100 patients; Table). These differences in hospital rates of troponin-only testing during the study period based on physician type were statistically significant (P < 0.0001; Table).
Pattern of Troponin-Only Testing by Quality Rating
Hospitals that were in the top tertile of troponin-only testing and were rated highly by Vizient’s quality rating or recognized as a top hospital by the US News & World Report had higher rates of troponin-only testing per 100 patients than did hospitals in the top tertile that were not ranked highly by Vizient’s quality rating or recognized as a top hospital by the US News & World Report. However, the majority of hospitals in the top tertile of troponin-only testing were not rated highly by Vizient (n = 15) or recognized as a top hospital by the US News & World Report (n = 16). The large majority of hospitals in the bottom tertile of troponin-only testing were not recognized as high-quality hospitals by Vizient (n = 32) or the US News & World Report (n = 31). Of the hospitals that improved their troponin-only testing during the study period, the majority were not recognized as high-quality hospitals by Vizient (n = 33) or the US News & World Report (n = 36), but among this group, those hospitals recognized by Vizient as high quality (n = 5) had the highest rate of troponin-only testing (57/100 patients). The differences in the rate of troponin-only testing across the different groups of hospitals and quality ratings were statistically significant (P < 0.0001; Table).
The Effect of Choosing Wisely® on Troponin-Only Testing
DISCUSSION
In the hospitals that demonstrated increasing adoption of troponin-only testing, there are several interesting patterns. First, among these hospitals, smaller hospitals tended to have higher overall rates of troponin-only testing per 100 patients than larger hospitals. Additionally, the hospitals with the highest rates were located in the Midwest region. These hospitals may be learning from and following the high-performing institutions observed in our data that are also located in the Midwest. Additionally, among the hospitals that significantly increased their rate of troponin-only testing, we see that the Choosing Wisely® recommendation appeared to facilitate accelerated adoption of troponin-only testing. In these institutions, it is likely that the impact of Choosing Wisely® was significant because there was attention to high-value care and already an existing movement underway to institute such high-value practices. For example, natural champions, leadership, infrastructure, and a supportive culture may all be prerequisites for Choosing Wisely® recommendations to become institutionally adopted.
Lastly, in the hospitals that have continued to order myoglobin and CK-MB, future work is needed to understand and overcome barriers to adopting high-value care practices.
There are several limitations to this study. First, because this was an observational study, we cannot prove a causal relationship between the Choosing Wisely® recommendation and the increased rates of troponin-only testing. Additionally, the Vizient CDB/RM contains reporting data for a limited number of academic medical centers only, and therefore, these results may not represent practices at nonacademic or even other academic medical centers. Our study only included patients with a principal discharge diagnosis of AMI because the Choosing Wisely® recommendation to order troponin-only is specific for diagnosing patients with AMI. However, it is possible that the Choosing Wisely® recommendation also has affected provider ordering in patients with diagnoses such as chest pain or angina, and these affects would not be captured in our study. Lastly, because instituting high-value care practices take time, our follow-up time may not have been long enough to capture improvement in troponin-only testing at institutions responding to and attempting to adhere to the Choosing Wisely® recommendation to order troponin-only testing for patients with AMI.
Disclosure
No other individuals besides the authors contributed to this work. This project was not funded or supported by any external grant or agency. Dr. Prochaska’s institute received funding from the Agency for Research Healthcare and Quality for a K12 Career Development Grant (AHRQ K12 HS023007) outside the submitted work. Dr. Hohmann and Dr Modes have nothing to disclose. Dr. Arora receives financial compensation as a member of the Board of Directors for the American Board of Internal Medicine and has received grant funding from the ABIM Foundation. She also receives royalties from McGraw Hill.
1. Pickering JW, Than MP, Cullen L, et al. Rapid rule-out of acute myocardial infarction with a single high-sensitivity cardiac troponin t measurement below the limit of detection: A collaborative meta-analysis. Ann Intern Med. 2017;166(10):715-724. PubMed
2. American Society for Clinical Pathology. Don’t test for myoglobin or CK-MB in the diagnosis of acute myocardial infarction (AMI). Instead, use troponin I or T. http://www.choosingwisely.org/clinician-lists/american-society-clinical-pathology-myoglobin-to-diagnose-acute-myocardial-infarction/. Accessed August 3, 2016.
3. Amsterdam EA, Wenger NK, Brindis RG, et al. 2014 AHA/ACC guideline for the management of patients with non–st-elevation acute coronary syndromes. Circulation. 2014;130(25):e344-e426. PubMed
4. Larochelle MR, Knight AM, Pantle H, Riedel S, Trost JC. Reducing excess cardiac biomarker testing at an academic medical center. J Gen Intern Med. 2014;29(11):1468-1474. PubMed
5. Le RD, Kosowsky JM, Landman AB, Bixho I, Melanson SEF, Tanasijevic MJ. Clinical and financial impact of removing creatine kinase-MB from the routine testing menu in the emergency setting. Am J Emerg Med. 2015;33(1):72-75. PubMed
6. Rosenberg A, Agiro A, Gottlieb M, et al. Early trends among seven recommendations from the choosing wisely campaign. JAMA Intern Med. 2015;175(12):1913. PubMed
7. Wolfson DB. Choosing Wisely recommendations using administrative claims data. JAMA Intern Med. 2016;176(4):565-565. PubMed
8. Thygesen K, Alpert JS, Jaffe AS, Simoons ML, Chaitman BR, White HD. Third universal definition of myocardial infarction. Circulation. 2012;126(16):2020-2035. PubMed
9. US News & World Report. Best hospitals for cardiology & heart surgery. http://health.usnews.com/best-hospitals/rankings/cardiology-and-heart-surgery. Accessed April 19, 2017.
10. Bradley EH, Curry LA, Ramanadhan S, Rowe L, Nembhard IM, Krumholz HM. Research in action: using positive deviance to improve quality of health care. Implement Sci IS. 2009;4:25. PubMed
Evidence suggests that troponin-only testing is the superior strategy to diagnose acute myocardial infarction (AMI).1 Because of this, in February 2015, the Choosing Wisely® campaign issued a recommendation to use troponin I or T to diagnose AMI, and not to test for myoglobin or creatine kinase-MB (CK-MB).2 This recommendation was in line with guidelines from the American Heart Association and the American College of Cardiology, which recommended that myoglobin and CK-MB are not useful and offer no benefit for the diagnosis of acute coronary syndrome.3 Some institutions have developed interventions to promote troponin-only testing, reporting substantial cost savings and no negative consequences.4,5
Despite these successes, it is likely that institutions vary with respect to the adoption of the Choosing Wisely® troponin-only testing recommendation.6 Implementing this recommendation requires both promoting clinician behavior change and a strong institutional culture of high-value care.7 Understanding the variation across institutions of troponin-only testing could inform how to promote high-value care recommendations nationwide. We aimed to describe patterns of troponin, myoglobin, and CK-MB testing in a sample of academic teaching hospitals before and after the Choosing Wisely® recommendation.
METHODS
Troponin, myoglobin, and CK-MB ordering data were extracted from Vizient’s (formerly University HealthSystem Consortium, Chicago, IL) Clinical Database/Resource Manager (CDB/RM®) for all patients with a principal discharge diagnosis of AMI at all hospitals reporting all 36 months from the fourth quarter of 2013 through the third quarter of 2016. This period includes time both before and after the Choosing Wisely® recommendation, which was released in the first quarter of 2015. Vizient’s CDB/RM contains ordering data for 300 academic medical centers and their affiliated hospitals and includes the discharge diagnoses for patients cared for by these institutions. Only patients with a principal discharge diagnosis of AMI were included because the Choosing Wisely® recommendation is specific with regard to troponin-only testing for the diagnosis of AMI. Patients with a principal diagnosis code for subcategories of myocardial ischemia (eg, stable angina, unstable angina) were not included because of the large number of diagnosis codes for these subcategories (more than 100 in the International Classification of Diseases, Ninth Revision and the International Classification of Diseases, Tenth Revision) and because the variation in their use across institutions within the dataset limited the utility of using these codes to consistently and accurately identify patients with myocardial ischemia. Moreover, the diagnosis of AMI encompasses the subcategories of myocardial ischemia.8
Hospital rates of ordering cardiac biomarkers (troponin-only or troponin and myoglobin/CK-MB) were determined overall for the entire study period and for each quarter of the study period based on the total patients with a discharge diagnosis of AMI. For each quarter of the 12 study quarters, all the hospitals were divided into tertiles based on their rate of troponin-only testing per discharge diagnosis of AMI. Hospitals were then classified into 3 groups based on their tertile ranking over the full 12 study quarters. The first group included hospitals whose rate of troponin-only testing placed them in the top tertile for each and all quarters throughout the study period. The second group included hospitals whose troponin-only testing rate placed them in the bottom tertile for each and all quarters throughout the study period. The third group included hospitals whose troponin-only testing rate each quarter led to either an increase or decrease in their tertile ranking throughout the study period. χ2 tests were used to test for bivariate associations among hospitals based on their rate of troponin-only testing and hospital size (number of beds), their regional geographic location, the volume of AMI patients seen at the hospital, whether the primary physician during the hospitalization was a cardiologist or other provider, and the hospitals’ quality ratings. Quality rating was based on an internal Vizient rating and the “Best Hospitals for Cardiology and Heart Surgery Rankings” as published in the US News & World Report.9 The Vizient quality rating is based on a composite score that combines scores from the domains of quality (hospital quality incentive scores), safety (patient safety indicators), patient-centeredness (Hospital Consumer Assessment of Healthcare Providers and Systems Hospital Survey), and equity (distribution of care by race/ethnicity, gender, and age). Simple slopes were calculated to determine the rate of change in troponin-only testing for each study quarter, and Student t tests were used to compare the rates of change of these simple slopes across study quarters.
RESULTS
Pattern of Troponin-Only Testing by Hospital Size
Pattern of Troponin-Only Testing by Geographic Region
The rate of troponin-only testing also varied and was statistically significantly different when comparing the 3 groups of hospitals across geographic regions of the country (P < 0.0001). Of the hospitals in the top tertile of troponin-only testing throughout the study period, the majority were in the Midwest (n = 6) and Mid-Atlantic (n = 5) regions. However, the rate of troponin-only testing for AMI in this group was highest in hospitals in the West (86/100 patients) and/or Southeast (75/100 patients) regions, although this rate was based on a small number of hospitals in these geographic areas (n = 1 in the West, n = 2 in the Southeast). Of hospitals in the bottom tertile of troponin-only testing throughout the study period, the majority were in the Mid-Atlantic region (n = 10). Hospitals that increased their troponin-only testing during the study period were predominantly in the Midwest (n = 12) and Mid-Atlantic regions (n = 11; Table), with the hospitals in the Midwest having the highest rate of troponin-only testing in this group.
Pattern of Troponin-Only Testing by Volume of AMI Patients
Of the hospitals in the top tertile of troponin-only testing during the study period, the majority cared for ≥1500 AMI patients (n = 9), but interestingly, among these hospitals, those caring for a smaller volume of AMI patients all had higher rates of troponin-only testing per 100 patients (P < 0.0001; Table). There was no other obvious pattern of troponin-only testing based on the volume of AMI patients cared for in hospitals in either the bottom tertile of troponin-only testing or hospitals that improved troponin-only testing during the study period.
Pattern of Troponin-Only Testing by Physician Type
Of the hospitals in the top tertile of troponin-only testing throughout the study period, those where a cardiologist cared for patients with AMI had higher rates of troponin-only testing (71/100 patients) than did hospitals where patients were cared for by a noncardiologist (60/100 patients). However, of the hospitals that improved their troponin-only testing during the study period, higher rates of troponin-only testing were seen in hospitals where patients were cared for by a noncardiologist (48/100 patients) compared with patients cared for by a cardiologist (34/100 patients; Table). These differences in hospital rates of troponin-only testing during the study period based on physician type were statistically significant (P < 0.0001; Table).
Pattern of Troponin-Only Testing by Quality Rating
Hospitals that were in the top tertile of troponin-only testing and were rated highly by Vizient’s quality rating or recognized as a top hospital by the US News & World Report had higher rates of troponin-only testing per 100 patients than did hospitals in the top tertile that were not ranked highly by Vizient’s quality rating or recognized as a top hospital by the US News & World Report. However, the majority of hospitals in the top tertile of troponin-only testing were not rated highly by Vizient (n = 15) or recognized as a top hospital by the US News & World Report (n = 16). The large majority of hospitals in the bottom tertile of troponin-only testing were not recognized as high-quality hospitals by Vizient (n = 32) or the US News & World Report (n = 31). Of the hospitals that improved their troponin-only testing during the study period, the majority were not recognized as high-quality hospitals by Vizient (n = 33) or the US News & World Report (n = 36), but among this group, those hospitals recognized by Vizient as high quality (n = 5) had the highest rate of troponin-only testing (57/100 patients). The differences in the rate of troponin-only testing across the different groups of hospitals and quality ratings were statistically significant (P < 0.0001; Table).
The Effect of Choosing Wisely® on Troponin-Only Testing
DISCUSSION
In the hospitals that demonstrated increasing adoption of troponin-only testing, there are several interesting patterns. First, among these hospitals, smaller hospitals tended to have higher overall rates of troponin-only testing per 100 patients than larger hospitals. Additionally, the hospitals with the highest rates were located in the Midwest region. These hospitals may be learning from and following the high-performing institutions observed in our data that are also located in the Midwest. Additionally, among the hospitals that significantly increased their rate of troponin-only testing, we see that the Choosing Wisely® recommendation appeared to facilitate accelerated adoption of troponin-only testing. In these institutions, it is likely that the impact of Choosing Wisely® was significant because there was attention to high-value care and already an existing movement underway to institute such high-value practices. For example, natural champions, leadership, infrastructure, and a supportive culture may all be prerequisites for Choosing Wisely® recommendations to become institutionally adopted.
Lastly, in the hospitals that have continued to order myoglobin and CK-MB, future work is needed to understand and overcome barriers to adopting high-value care practices.
There are several limitations to this study. First, because this was an observational study, we cannot prove a causal relationship between the Choosing Wisely® recommendation and the increased rates of troponin-only testing. Additionally, the Vizient CDB/RM contains reporting data for a limited number of academic medical centers only, and therefore, these results may not represent practices at nonacademic or even other academic medical centers. Our study only included patients with a principal discharge diagnosis of AMI because the Choosing Wisely® recommendation to order troponin-only is specific for diagnosing patients with AMI. However, it is possible that the Choosing Wisely® recommendation also has affected provider ordering in patients with diagnoses such as chest pain or angina, and these affects would not be captured in our study. Lastly, because instituting high-value care practices take time, our follow-up time may not have been long enough to capture improvement in troponin-only testing at institutions responding to and attempting to adhere to the Choosing Wisely® recommendation to order troponin-only testing for patients with AMI.
Disclosure
No other individuals besides the authors contributed to this work. This project was not funded or supported by any external grant or agency. Dr. Prochaska’s institute received funding from the Agency for Research Healthcare and Quality for a K12 Career Development Grant (AHRQ K12 HS023007) outside the submitted work. Dr. Hohmann and Dr Modes have nothing to disclose. Dr. Arora receives financial compensation as a member of the Board of Directors for the American Board of Internal Medicine and has received grant funding from the ABIM Foundation. She also receives royalties from McGraw Hill.
1. Pickering JW, Than MP, Cullen L, et al. Rapid rule-out of acute myocardial infarction with a single high-sensitivity cardiac troponin t measurement below the limit of detection: A collaborative meta-analysis. Ann Intern Med. 2017;166(10):715-724. PubMed
2. American Society for Clinical Pathology. Don’t test for myoglobin or CK-MB in the diagnosis of acute myocardial infarction (AMI). Instead, use troponin I or T. http://www.choosingwisely.org/clinician-lists/american-society-clinical-pathology-myoglobin-to-diagnose-acute-myocardial-infarction/. Accessed August 3, 2016.
3. Amsterdam EA, Wenger NK, Brindis RG, et al. 2014 AHA/ACC guideline for the management of patients with non–st-elevation acute coronary syndromes. Circulation. 2014;130(25):e344-e426. PubMed
4. Larochelle MR, Knight AM, Pantle H, Riedel S, Trost JC. Reducing excess cardiac biomarker testing at an academic medical center. J Gen Intern Med. 2014;29(11):1468-1474. PubMed
5. Le RD, Kosowsky JM, Landman AB, Bixho I, Melanson SEF, Tanasijevic MJ. Clinical and financial impact of removing creatine kinase-MB from the routine testing menu in the emergency setting. Am J Emerg Med. 2015;33(1):72-75. PubMed
6. Rosenberg A, Agiro A, Gottlieb M, et al. Early trends among seven recommendations from the choosing wisely campaign. JAMA Intern Med. 2015;175(12):1913. PubMed
7. Wolfson DB. Choosing Wisely recommendations using administrative claims data. JAMA Intern Med. 2016;176(4):565-565. PubMed
8. Thygesen K, Alpert JS, Jaffe AS, Simoons ML, Chaitman BR, White HD. Third universal definition of myocardial infarction. Circulation. 2012;126(16):2020-2035. PubMed
9. US News & World Report. Best hospitals for cardiology & heart surgery. http://health.usnews.com/best-hospitals/rankings/cardiology-and-heart-surgery. Accessed April 19, 2017.
10. Bradley EH, Curry LA, Ramanadhan S, Rowe L, Nembhard IM, Krumholz HM. Research in action: using positive deviance to improve quality of health care. Implement Sci IS. 2009;4:25. PubMed
© 2017 Society of Hospital Medicine
Association Between Anemia and Fatigue in Hospitalized Patients: Does the Measure of Anemia Matter?
Fatigue is the most common clinical symptom of anemia and is a significant concern to patients.1,2 In ambulatory patients, lower hemoglobin (Hb) concentration is associated with increased fatigue.2,3 Accordingly, therapies that treat anemia by increasing Hb concentration, such as erythropoiesis stimulating agents,4-7 often use fatigue as an outcome measure.
In hospitalized patients, transfusion of red blood cell increases Hb concentration and is the primary treatment for anemia. However, the extent to which transfusion and changes in Hb concentration affect hospitalized patients’ fatigue levels is not well established. Guidelines support transfusing patients with symptoms of anemia, such as fatigue, on the assumption that the increased oxygen delivery will improve the symptoms of anemia. While transfusion studies in hospitalized patients have consistently reported that transfusion at lower or “restrictive” Hb concentrations is safe compared with transfusion at higher Hb concentrations,8-10 these studies have mainly used cardiac events and mortality as outcomes rather than patient symptoms, such as fatigue. Nevertheless, they have resulted in hospitals increasingly adopting restrictive transfusion policies that discourage transfusion at higher Hb levels.11,12 Consequently, the rate of transfusion in hospitalized patients has decreased,13 raising questions of whether some patients with lower Hb concentrations may experience increased fatigue as a result of restrictive transfusion policies. Fatigue among hospitalized patients is important not only because it is an adverse symptom but because it may result in decreased activity levels, deconditioning, and losses in functional status.14,15While the effect of alternative transfusion policies on fatigue in hospitalized patients could be answered by a randomized clinical trial using fatigue and functional status as outcomes, an important first step is to assess whether the Hb concentration of hospitalized patients is associated with their fatigue level during hospitalization. Because hospitalized patients often have acute illnesses that can cause fatigue in and of themselves, it is possible that anemia is not associated with fatigue in hospitalized patients despite anemia’s association with fatigue in ambulatory patients. Additionally, Hb concentration varies during hospitalization,16 raising the question of what measures of Hb during hospitalization might be most associated with anemia-related fatigue.
The objective of this study is to explore multiple Hb measures in hospitalized medical patients with anemia and test whether any of these Hb measures are associated with patients’ fatigue level.
METHODS
Study Design
We performed a prospective, observational study of hospitalized patients with anemia on the general medicine services at The University of Chicago Medical Center (UCMC). The institutional review board approved the study procedures, and all study subjects provided informed consent.
Study Eligibility
Between April 2014 and June 2015, all general medicine inpatients were approached for written consent for The University of Chicago Hospitalist Project,17 a research infrastructure at UCMC. Among patients consenting to participate in the Hospitalist Project, patients were eligible if they had Hb <9 g/dL at any point during their hospitalization and were age ≥50 years. Hb concentration of <9 g/dL was chosen to include the range of Hb values covered by most restrictive transfusion policies.8-10,18 Age ≥50 years was an inclusion criteria because anemia is more strongly associated with poor outcomes, including functional impairment, among older patients compared with younger patients.14,19-21 If patients were not eligible for inclusion at the time of consent for the Hospitalist Project, their Hb values were reviewed twice daily until hospital discharge to assess if their Hb was <9 g/dL. Proxies were sought to answer questions for patients who failed the Short Portable Mental Status Questionnaire.22
Patient Demographic Data Collection
Research assistants abstracted patient age and sex from the electronic health record (EHR), and asked patients to self-identify their race. The individual comorbidities included as part of the Charlson Comorbidity Index were identified using International Classification of Diseases, 9th Revision codes from hospital administrative data for each encounter and specifically included the following: myocardial infarction, congestive heart failure, peripheral vascular disease, cerebrovascular disease, dementia, chronic pulmonary disease, rheumatic disease, peptic ulcer disease, liver disease, diabetes, hemiplegia and/or paraplegia, renal disease, cancer, and human immunodeficiency virus/acquired immunodeficiency syndrome.23 We also used Healthcare Cost and Utilization Project (www.hcup-us.ahrq.gov/toolssoftware/ccs/ccs.jsp) diagnosis categories to identify whether patients had sickle cell (SC) anemia, gastrointestinal bleeding (GIB), or a depressive disorder (DD) because these conditions are associated with anemia (SC and GIB) and fatigue (DD).24
Measuring Anemia
Hb measures were available only when hospital providers ordered them as part of routine practice. The first Hb concentration <9 g/dL during a patient’s hospitalization, which made them eligible for study participation, was obtained through manual review of the EHR. All additional Hb values during the patient’s hospitalization were obtained from the hospital’s administrative data mart. All Hb values collected for each patient during the hospitalization were used to calculate summary measures of Hb during the hospitalization, including the mean Hb, median Hb, minimum Hb, maximum Hb, admission (first recorded) Hb, and discharge (last recorded) Hb. Hb measures were analyzed both as a continuous variable and as a categorical variable created by dividing the continuous Hb measures into integer ranges of 3 groups of approximately the same size.
Measuring Fatigue
Our primary outcome was patients’ level of fatigue reported during hospitalization, measured using the Functional Assessment of Chronic Illness Therapy (FACIT)-Anemia questionnaire. Fatigue was measured using a 13-question fatigue subscale,1,2,25 which measures fatigue within the past 7 days. Scores on the fatigue subscale range from 0 to 52, with lower scores reflecting greater levels of fatigue. As soon as patients met the eligibility criteria for study participation during their hospitalization (age ≥50 years and Hb <9 g/dL), they were approached to answer the FACIT questions. Values for missing data in the fatigue subscale for individual subjects were filled in using a prorated score from their answered questions as long as >50% of the items in the fatigue subscale were answered, in accordance with recommendations for addressing missing data in the FACIT.26 Fatigue was analyzed as a continuous variable and as a dichotomous variable created by dividing the sample into high (FACIT <27) and low (FACIT ≥27) levels of fatigue based on the median FACIT score of the population. Previous literature has shown a FACIT fatigue subscale score between 23 and 26 to be associated with an Eastern Cooperative Oncology Group (ECOG)27 C Performance Status rating of 2 to 33 compared to scores ≥27.
Statistical Analysis
Statistical analysis was performed using Stata statistical software (StataCorp, College Station, Texas). Descriptive statistics were used to characterize patient demographics. Analysis of variance was used to test for differences in the mean fatigue levels across Hb measures. χ2 tests were performed to test for associations between high fatigue levels and the Hb measures. Multivariable analysis, including both linear and logistic regression models, were used to test the association of Hb concentration and fatigue. P values <0.05 using a 2-tailed test were deemed statistically significant.
RESULTS
Patient Characteristics
During the study period, 8559 patients were admitted to the general medicine service. Of those, 5073 (59%) consented for participation in the Hospitalist Project, and 3670 (72%) completed the Hospitalist Project inpatient interview. Of these patients, 1292 (35%) had Hb <9 g/dL, and 784 (61%) were 50 years or older and completed the FACIT questionnaire.
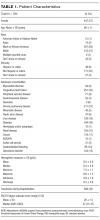
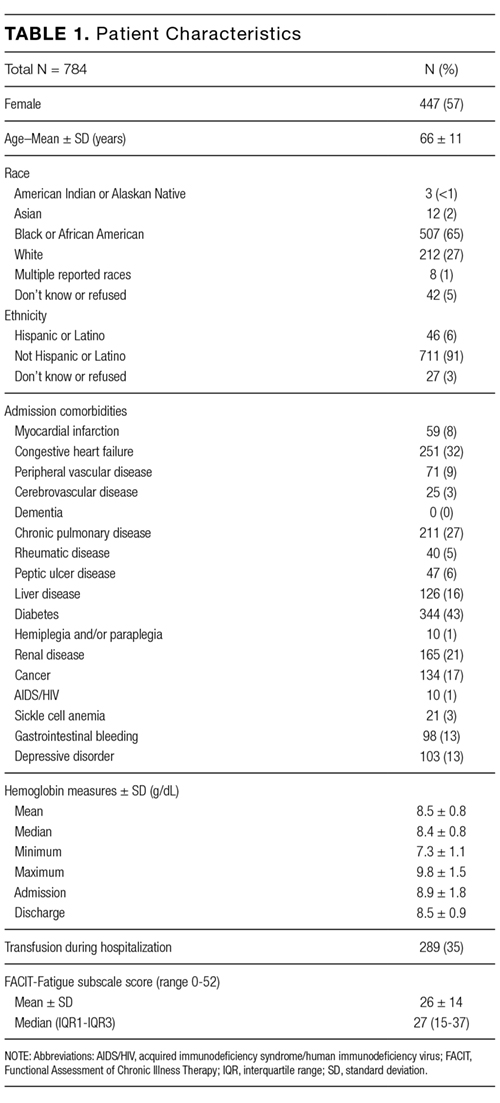
Table 1 reports the demographic characteristics and comorbidities for the sample, the mean (standard deviation [SD]) for the 6 Hb measures, and mean (SD) and median FACIT scores.
Bivariate Association of Fatigue and Hb
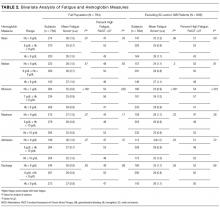
Categorizing patients into low, middle, or high Hb for each of the 6 Hb measures, minimum Hb was strongly associated with fatigue, with a weaker association for mean Hb and no statistically significant association for the other measures.
Minimum Hb
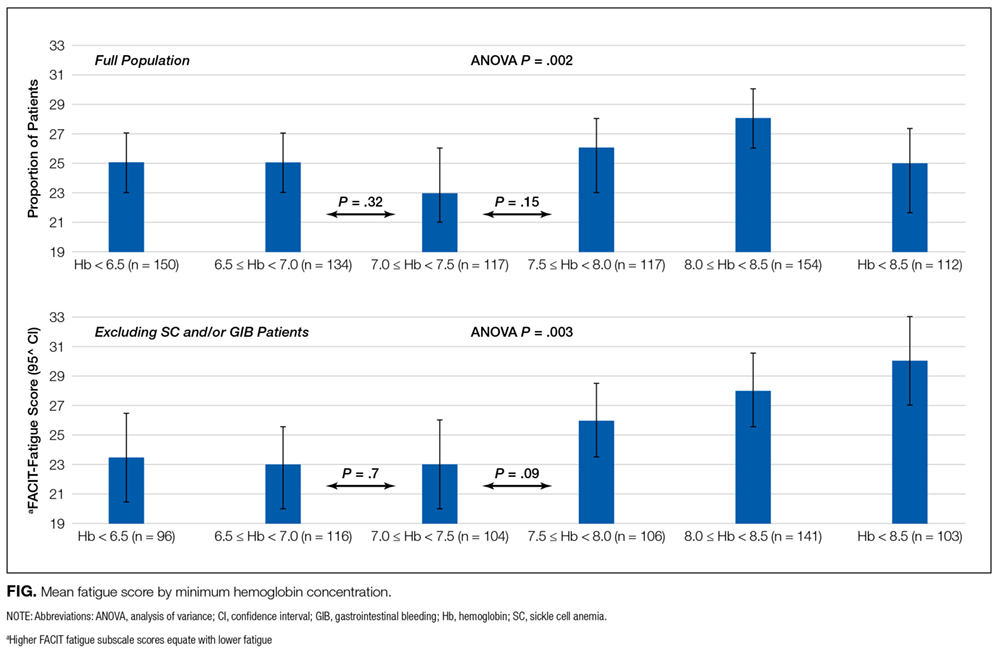
Patients with a minimum Hb <7 g/dL and patients with Hb 7-8 g/dL had higher fatigue levels (FACIT = 25 for each) than patients with a minimum Hb ≥8 g/dL (FACIT = 29; P < 0.001; Table 2). When excluding patients with SC and/or GIB because their average minimum Hb differed from the average minimum Hb of the full population (P < 0.001), patients with a minimum Hb <7 g/dL or 7-8 g/dL had even higher fatigue levels (FACIT = 23 and FACIT = 24, respectively), with no change in the fatigue level of patients with a minimum Hb ≥8 g/dL (FACIT = 29; P < 0.001; Table 2). Lower minimum Hb continued to be associated with higher fatigue levels when analyzed in 0.5 g/dL increments (Figure).
Mean Hb and Other Measures
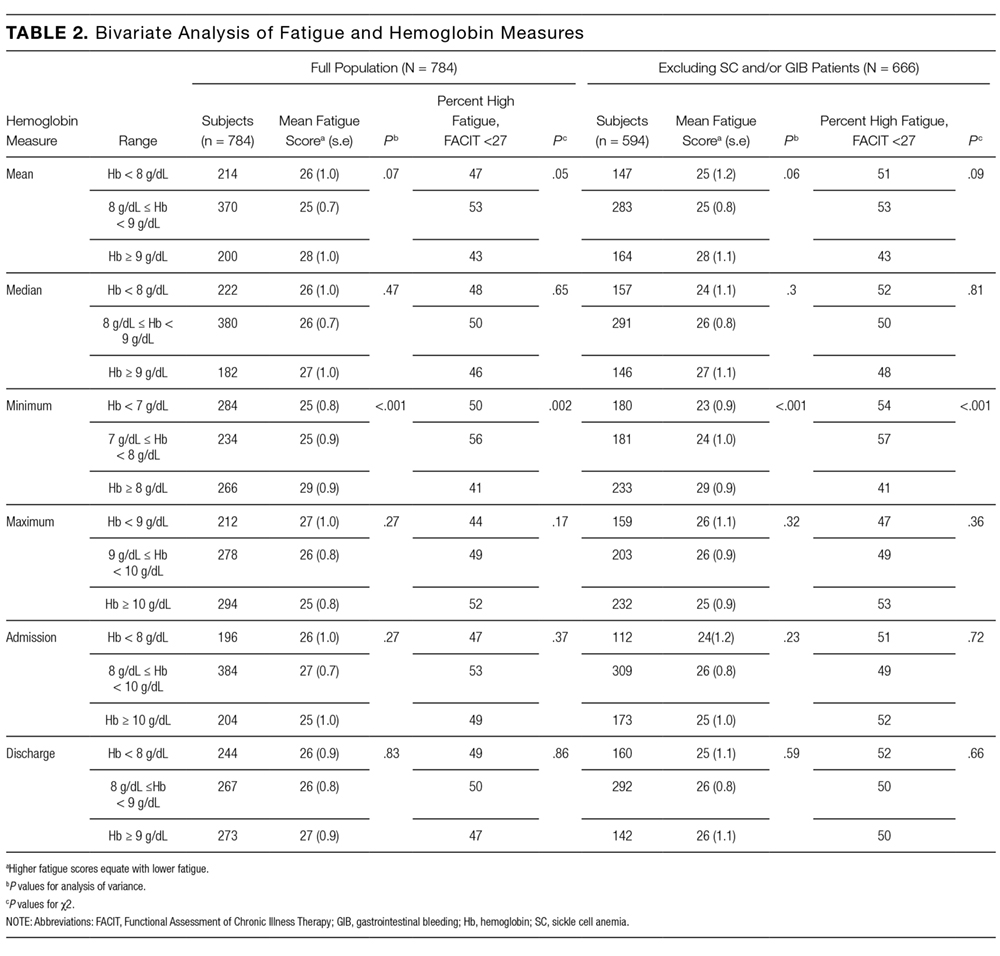
Fatigue levels were high for 47% of patients with a mean Hb <8g /dL and 53% of patients with a mean Hb 8-9 g/dL compared with 43% of patients with a mean Hb ≥9 g/dL (P = 0.05). However, the association between high fatigue and mean Hb was not statistically significant when patients with SC and/or GIB were excluded (Table 2). None of the other 4 Hb measures was significantly associated with fatigue.
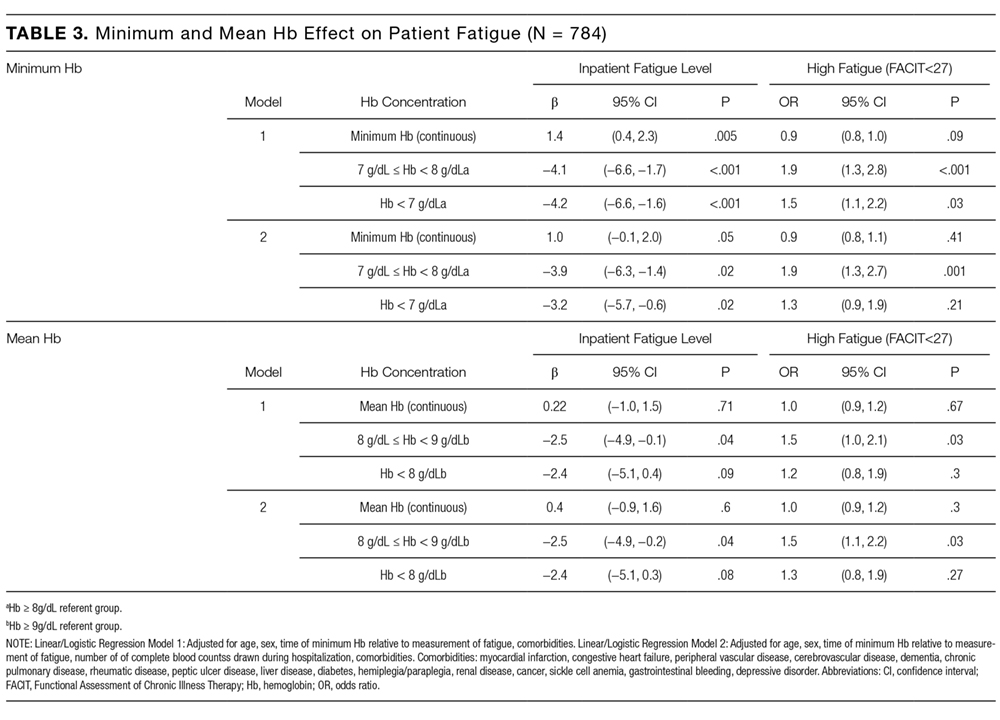
Linear Regression of Fatigue on Hb
In linear regression models, minimum Hb consistently predicted patient fatigue, mean Hb had a less robust association with fatigue, and the other Hb measures were not associated with patient fatigue. Increases in minimum Hb (analyzed as a continuous variable) were associated with reduced fatigue (higher FACIT score; β = 1.4; P = 0.005). In models in which minimum Hb was a categorical variable, patients with a minimum Hb of <7 g/dL or 7-8 g/dL had greater fatigue (lower FACIT score) than patients whose minimum Hb was ≥8 g/dL (Hb <7 g/dL: β = −4.2; P ≤ 0.001; Hb 7-8 g/dL: β = −4.1; P < 0.001). These results control for patients’ age, sex, individual comorbidities, and whether their minimum Hb occurred before or after the measurement of fatigue during hospitalization (Model 1), and the results are unchanged when also controlling for the number of Hb laboratory draws patients had during their hospitalization (Model 2; Table 3). In a stratified analysis excluding patients with either SC and/or GIB, changes in minimum Hb were associated with larger changes in patient fatigue levels (Supplemental Table 1). We also stratified our analysis to include only patients whose minimum Hb occurred before the measurement of their fatigue level during hospitalization to avoid a spurious association of fatigue with minimum Hb occurring after fatigue was measured. In both Models 1 and 2, minimum Hb remained a predictor of patients’ fatigue levels with similar effect sizes, although in Model 2, the results did not quite reach a statistically significant level, in part due to larger confidence intervals from the smaller sample size of this stratified analysis (Supplemental Table 2a). We further stratified this analysis to include only patients whose transfusion, if they received one, occurred after their minimum Hb and the measurement of their fatigue level to account for the possibility that a transfusion could affect the fatigue level patients report. In this analysis, most of the estimates of the effect of minimum Hb on fatigue were larger than those seen when only analyzing patients whose minimum Hb occurred before the measurement of their fatigue level, although again, the smaller sample size of this additional stratified analysis does produce larger confidence intervals for these estimates (Supplemental Table 2b).
No Hb measure other than minimum or mean had significant association with patient fatigue levels in linear regression models.
Logistic Regression of High Fatigue Level on Hb
Using logistic regression, minimum Hb analyzed as a categorical variable predicted increased odds of a high fatigue level. Patients with a minimum Hb <7 g/dL were 50% (odds ratio [OR] = 1.5; P = 0.03) more likely to have high fatigue and patients with a minimum Hb 7-8 g/dL were 90% (OR = 1.9; P < 0.001) more likely to have high fatigue compared with patients with a minimum Hb ≥8 g/dL in Model 1. These results were similar in Model 2, although the effect was only statistically significant in the 7-8 g/dL Hb group (Table 3). When excluding SC and/or GIB patients, the odds of having high fatigue as minimum Hb decreased were the same or higher for both models compared to the full population of patients. However, again, in Model 2, the effect was only statistically significant in the 7-8 g/dL Hb group (Supplemental Table 1).
Patients with a mean Hb <8 g/dL were 20% to 30% more likely to have high fatigue and patients with mean Hb 8-9 g/dL were 50% more likely to have high fatigue compared with patients with a mean Hb ≥9 g/dL, but the effects were only statistically significant for patients with a mean Hb 8-9 g/dL in both Models 1 and 2 (Table 3). These results were similar when excluding patients with SC and/or GIB, but they were only significant for patients with a mean Hb 8-9 g/dL in Model 1 and patients with a mean Hb <8 g/dL in the Model 2 (Supplemental Table 3).
DISCUSSION
These results demonstrate that minimum Hb during hospitalization is associated with fatigue in hospitalized patients age ≥50 years, and the association is stronger among patients without SC and/or GIB as comorbidities. The analysis of Hb as a continuous and categorical variable and the use of both linear and logistic regression models support the robustness of these associations and illuminate their clinical significance. For example, in linear regression with minimum Hb a continuous variable, the coefficient of 1.4 suggests that an increase of 2 g/dL in Hb, as might be expected from transfusion of 2 units of red blood cells, would be associated with about a 3-point improvement in fatigue. Additionally, as a categorical variable, a minimum Hb ≥8 g/dL compared with a minimum Hb <7 g/dL or 7-8 g/dL is associated with a 3- to 4-point improvement in fatigue. Previous literature suggests that a difference of 3 in the FACIT score is the minimum clinically important difference in fatigue,3 and changes in minimum Hb in either model predict changes in fatigue that are in the range of potential clinical significance.
The clinical significance of the findings is also reflected in the results of the logistic regressions, which may be mapped to potential effects on functional status. Specifically, the odds of having a high fatigue level (FACIT <27) increase 90% for persons with a minimum Hb 7–8 g/dL compared with persons with a minimum Hb ≥8 g/dL. For persons with a minimum Hb <7 g/dL, point estimates suggest a smaller (50%) increase in the odds of high fatigue, but the 95% confidence interval overlaps heavily with the estimate of patients whose minimum Hb is 7-8 g/dL. While it might be expected that patients with a minimum Hb <7 g/dL have greater levels of fatigue compared with patients with a minimum Hb 7-8 g/dL, we did not observe such a pattern. One reason may be that the confidence intervals of our estimated effects are wide enough that we cannot exclude such a pattern. Another possible explanation is that in both groups, the fatigue levels are sufficiently severe, such that the difference in their fatigue levels may not be clinically meaningful. For example, a FACIT score of 23 to 26 has been shown to be associated with an ECOG performance status of 2 to 3, requiring bed rest for at least part of the day.3 Therefore, patients with a minimum Hb 7-8 g/dL (mean FACIT score = 24; Table 2) or a minimum Hb of <7 g/dL (mean FACIT score = 23; Table 2) are already functionally limited to the point of being partially bed bound, such that further decreases in their Hb may not produce additional fatigue in part because they reduce their activity sufficiently to prevent an increase in fatigue. In such cases, the potential benefits of increased Hb may be better assessed by measuring fatigue in response to a specific and provoked activity level, a concept known as fatigability.20
That minimum Hb is more strongly associated with fatigue than any other measure of Hb during hospitalization may not be surprising. Mean, median, maximum, and discharge Hb may all be affected by transfusion during hospitalization that could affect fatigue. Admission Hb may not reflect true oxygen-carrying capacity because of hemoconcentration.
The association between Hb and fatigue in hospitalized patients is important because increased fatigue could contribute to slower clinical recovery in hospitalized patients. Additionally, increased fatigue during hospitalization and at hospital discharge could exacerbate the known deleterious consequences of fatigue on patients and their health outcomes14,15 after hospital discharge. Although one previous study, the Functional Outcomes in Cardiovascular Patients Undergoing Surgical Hip Fracture Repair (FOCUS)8 trial, did not report differences in patients’ fatigue levels at 30 and 60 days postdischarge when transfused at restrictive (8 g/dL) compared with liberal (10 g/dL) Hb thresholds, confidence in the validity of this finding is reduced by the fact that more than half of the patients were lost to follow-up at the 30- and 60-day time points. Further, patients in the restrictive transfusion arm of FOCUS were transfused to maintain Hb levels at or above 8 g/dL. This transfusion threshold of 8 g/dL may have mitigated the high levels of fatigue that are seen in our study when patients’ Hb drops below 8 g/dL, and maintaining a Hb level of 7 g/dL is now the standard of care in stable hospitalized patients. Lastly, FOCUS was limited to postoperative hip fracture patients, and the generalizability of FOCUS to hospitalized medicine patients with anemia is limited.
Therefore, our results support guideline suggestions that practitioners incorporate the presence of patient symptoms such as fatigue into transfusion decisions, particularly if patients’ Hb is <8 g/dL.18 Though reasonable, the suggestion to incorporate symptoms such as fatigue into transfusion decisions has not been strongly supported by evidence so far, and it may often be neglected in practice. Definitive evidence to support such recommendations would benefit from study through an optimal trial18 that incorporates symptoms into decision making. Our findings add support for a study of transfusion strategies that incorporates patients’ fatigue level in addition to Hb concentration.
This study has several limitations. Although our sample size is large and includes patients with a range of comorbidities that we believe are representative of hospitalized general medicine patients, as a single-center, observational study, our results may not be generalizable to other centers. Additionally, although these data support a reliable association between hospitalized patients’ minimum Hb and fatigue level, the observational design of this study cannot prove that this relationship is causal. Also, patients’ Hb values were measured at the discretion of their clinician, and therefore, the measures of Hb were not uniformly measured for participating patients. In addition, fatigue was only measured at one time point during a patient’s hospitalization, and it is possible that patients’ fatigue levels change during hospitalization in relation to variables we did not consider. Finally, our study was not designed to assess the association of Hb with longer-term functional outcomes, which may be of greater concern than fatigue.
CONCLUSION
In hospitalized patients ≥50 years old, minimum Hb is reliably associated with patients’ fatigue level. Patients whose minimum Hb is <8 g/dL experience higher fatigue levels compared to patients whose minimum Hb is ≥8 g/dL. Additional studies are warranted to understand if patients may benefit from improved fatigue levels by correcting their anemia through transfusion.
Disclosure
Dr. Prochaska is supported by an Agency for Healthcare Research and Quality Patient-Centered Outcomes Research Institutional K12 Award (1K12HS023007-01, principal investigator Meltzer). Dr. Meltzer is supported by a National Institutes of Health Clinical and Translational Science Award (2UL1TR000430-06, principal investigator Solway) and a grant from the Patient-Centered Outcomes Research Network in support of the Chicago Patient-Centered Outcomes Research Network. The authors report no conflicts of interest.
1. Yellen SB, Cella DF, Webster K, Blendowski C, Kaplan E. Measuring fatigue and other anemia-related symptoms with the Functional Assessment of Cancer Therapy (FACT) measurement system. J Pain Symptom Manage. 1997;13(2):63-74. PubMed
2. Cella D, Lai JS, Chang CH, Peterman A, Slavin M. Fatigue in cancer patients compared with fatigue in the general United States population. Cancer. 2002;94(2):528-538. doi:10.1002/cncr.10245. PubMed
3. Cella D, Eton DT, Lai J-S, Peterman AH, Merkel DE. Combining anchor and distribution-based methods to derive minimal clinically important differences on the Functional Assessment of Cancer Therapy (FACT) anemia and fatigue scales. J Pain Symptom Manage. 2002;24(6):547-561. PubMed
4. Tonelli M, Hemmelgarn B, Reiman T, et al. Benefits and harms of erythropoiesis-stimulating agents for anemia related to cancer: a meta-analysis. CMAJ Can Med Assoc J J Assoc Medicale Can. 2009;180(11):E62-E71. doi:10.1503/cmaj.090470. PubMed
5. Foley RN, Curtis BM, Parfrey PS. Erythropoietin Therapy, Hemoglobin Targets, and Quality of Life in Healthy Hemodialysis Patients: A Randomized Trial. Clin J Am Soc Nephrol. 2009;4(4):726-733. doi:10.2215/CJN.04950908. PubMed
6. Keown PA, Churchill DN, Poulin-Costello M, et al. Dialysis patients treated with Epoetin alfa show improved anemia symptoms: A new analysis of the Canadian Erythropoietin Study Group trial. Hemodial Int Int Symp Home Hemodial. 2010;14(2):168-173. doi:10.1111/j.1542-4758.2009.00422.x. PubMed
7. Palmer SC, Saglimbene V, Mavridis D, et al. Erythropoiesis-stimulating agents for anaemia in adults with chronic kidney disease: a network meta-analysis. Cochrane Database Syst Rev. 2014:CD010590. PubMed
8. Carson JL, Terrin ML, Noveck H, et al. Liberal or Restrictive Transfusion in high-risk patients after hip surgery. N Engl J Med. 2011;365(26):2453-2462. doi:10.1056/NEJMoa1012452. PubMed
9. Holst LB, Haase N, Wetterslev J, et al. Transfusion requirements in septic shock (TRISS) trial – comparing the effects and safety of liberal versus restrictive red blood cell transfusion in septic shock patients in the ICU: protocol for a randomised controlled trial. Trials. 2013;14:150. doi:10.1186/1745-6215-14-150. PubMed
10. Hébert PC, Wells G, Blajchman MA, et al. A multicenter, randomized, controlled clinical trial of transfusion requirements in critical care. N Engl J Med. 1999;340(6):409-417. doi:10.1056/NEJM199902113400601. PubMed
11. Corwin HL, Theus JW, Cargile CS, Lang NP. Red blood cell transfusion: Impact of an education program and a clinical guideline on transfusion practice. J Hosp Med. 2014;9(12):745-749. doi:10.1002/jhm.2237. PubMed
12. Saxena, S, editor. The Transfusion Committee: Putting Patient Safety First, 2nd Edition. Bethesda (MD): American Association of Blood Banks; 2013.
13. The 2011 National Blood Collection and Utilization Report. http://www.hhs.gov/ash/bloodsafety/2011-nbcus.pdf. Accessed August 16, 2017.
14. Vestergaard S, Nayfield SG, Patel KV, et al. Fatigue in a Representative Population of Older Persons and Its Association With Functional Impairment, Functional Limitation, and Disability. J Gerontol A Biol Sci Med Sci. 2009;64A(1):76-82. doi:10.1093/gerona/gln017. PubMed
15. Gill TM, Desai MM, Gahbauer EA, Holford TR, Williams CS. Restricted activity among community-living older persons: incidence, precipitants, and health care utilization. Ann Intern Med. 2001;135(5):313-321. PubMed
16. Koch CG, Li L, Sun Z, et al. Hospital-acquired anemia: Prevalence, outcomes, and healthcare implications. J Hosp Med. 2013;8(9):506-512. doi:10.1002/jhm.2061. PubMed
17. Meltzer D, Manning WG, Morrison J, et al. Effects of Physician Experience on Costs and Outcomes on an Academic General Medicine Service: Results of a Trial of Hospitalists. Ann Intern Med. 2002;137(11):866-874. doi:10.7326/0003-4819-137-11-200212030-00007. PubMed
18. Carson JL, Grossman BJ, Kleinman S, et al. Red Blood Cell Transfusion: A Clinical Practice Guideline From the AABB*. Ann Intern Med. 2012;157(1):49-58. doi:10.7326/0003-4819-157-1-201206190-00429. PubMed
19. Moreh E, Jacobs JM, Stessman J. Fatigue, function, and mortality in older adults. J Gerontol A Biol Sci Med Sci. 2010;65(8):887-895. doi:10.1093/gerona/glq064. PubMed
20. Eldadah BA. Fatigue and Fatigability in Older Adults. PM&R. 2010;2(5):406-413. doi:10.1016/j.pmrj.2010.03.022. PubMed
21. Hardy SE, Studenski SA. Fatigue Predicts Mortality among Older Adults. J Am Geriatr Soc. 2008;56(10):1910-1914. doi:10.1111/j.1532-5415.2008.01957.x. PubMed
22. Pfeiffer E. A short portable mental status questionnaire for the assessment of organic brain deficit in elderly patients. J Am Geriatr Soc. 1975;23(10):433-441. PubMed
23. Quan H, Sundararajan V, Halfon P, et al. Coding algorithms for defining comorbidities in ICD-9-CM and ICD-10 administrative data. Med Care. 2005;43(11):1130-1139. PubMed
24. HCUP Clinical Classifications Software (CCS) for ICD-9-CM. Healthcare Cost and Utilization Project (HCUP). 2006-2009. Agency for Healthcare Research and Quality, Rockville, MD. https://www.hcup-us.ahrq.gov/toolssoftware/ccs/ccs.jsp. Accessed November 22, 2016.
25. Cella DF, Tulsky DS, Gray G, et al. The Functional Assessment of Cancer Therapy scale: development and validation of the general measure. J Clin Oncol Off J Am Soc Clin Oncol. 1993;11(3):570-579. PubMed
26. Webster K, Cella D, Yost K. The Functional Assessment of Chronic Illness Therapy (FACIT) Measurement System: properties, applications, and interpretation. Health Qual Life Outcomes. 2003;1:79. doi:10.1186/1477-7525-1-79. PubMed
27. Oken MMMD a, Creech RHMD b, Tormey DCMD, et al. Toxicity and response criteria of the Eastern Cooperative Oncology Group. J Clin Oncol. 1982;5(6):649-656. PubMed
Fatigue is the most common clinical symptom of anemia and is a significant concern to patients.1,2 In ambulatory patients, lower hemoglobin (Hb) concentration is associated with increased fatigue.2,3 Accordingly, therapies that treat anemia by increasing Hb concentration, such as erythropoiesis stimulating agents,4-7 often use fatigue as an outcome measure.
In hospitalized patients, transfusion of red blood cell increases Hb concentration and is the primary treatment for anemia. However, the extent to which transfusion and changes in Hb concentration affect hospitalized patients’ fatigue levels is not well established. Guidelines support transfusing patients with symptoms of anemia, such as fatigue, on the assumption that the increased oxygen delivery will improve the symptoms of anemia. While transfusion studies in hospitalized patients have consistently reported that transfusion at lower or “restrictive” Hb concentrations is safe compared with transfusion at higher Hb concentrations,8-10 these studies have mainly used cardiac events and mortality as outcomes rather than patient symptoms, such as fatigue. Nevertheless, they have resulted in hospitals increasingly adopting restrictive transfusion policies that discourage transfusion at higher Hb levels.11,12 Consequently, the rate of transfusion in hospitalized patients has decreased,13 raising questions of whether some patients with lower Hb concentrations may experience increased fatigue as a result of restrictive transfusion policies. Fatigue among hospitalized patients is important not only because it is an adverse symptom but because it may result in decreased activity levels, deconditioning, and losses in functional status.14,15While the effect of alternative transfusion policies on fatigue in hospitalized patients could be answered by a randomized clinical trial using fatigue and functional status as outcomes, an important first step is to assess whether the Hb concentration of hospitalized patients is associated with their fatigue level during hospitalization. Because hospitalized patients often have acute illnesses that can cause fatigue in and of themselves, it is possible that anemia is not associated with fatigue in hospitalized patients despite anemia’s association with fatigue in ambulatory patients. Additionally, Hb concentration varies during hospitalization,16 raising the question of what measures of Hb during hospitalization might be most associated with anemia-related fatigue.
The objective of this study is to explore multiple Hb measures in hospitalized medical patients with anemia and test whether any of these Hb measures are associated with patients’ fatigue level.
METHODS
Study Design
We performed a prospective, observational study of hospitalized patients with anemia on the general medicine services at The University of Chicago Medical Center (UCMC). The institutional review board approved the study procedures, and all study subjects provided informed consent.
Study Eligibility
Between April 2014 and June 2015, all general medicine inpatients were approached for written consent for The University of Chicago Hospitalist Project,17 a research infrastructure at UCMC. Among patients consenting to participate in the Hospitalist Project, patients were eligible if they had Hb <9 g/dL at any point during their hospitalization and were age ≥50 years. Hb concentration of <9 g/dL was chosen to include the range of Hb values covered by most restrictive transfusion policies.8-10,18 Age ≥50 years was an inclusion criteria because anemia is more strongly associated with poor outcomes, including functional impairment, among older patients compared with younger patients.14,19-21 If patients were not eligible for inclusion at the time of consent for the Hospitalist Project, their Hb values were reviewed twice daily until hospital discharge to assess if their Hb was <9 g/dL. Proxies were sought to answer questions for patients who failed the Short Portable Mental Status Questionnaire.22
Patient Demographic Data Collection
Research assistants abstracted patient age and sex from the electronic health record (EHR), and asked patients to self-identify their race. The individual comorbidities included as part of the Charlson Comorbidity Index were identified using International Classification of Diseases, 9th Revision codes from hospital administrative data for each encounter and specifically included the following: myocardial infarction, congestive heart failure, peripheral vascular disease, cerebrovascular disease, dementia, chronic pulmonary disease, rheumatic disease, peptic ulcer disease, liver disease, diabetes, hemiplegia and/or paraplegia, renal disease, cancer, and human immunodeficiency virus/acquired immunodeficiency syndrome.23 We also used Healthcare Cost and Utilization Project (www.hcup-us.ahrq.gov/toolssoftware/ccs/ccs.jsp) diagnosis categories to identify whether patients had sickle cell (SC) anemia, gastrointestinal bleeding (GIB), or a depressive disorder (DD) because these conditions are associated with anemia (SC and GIB) and fatigue (DD).24
Measuring Anemia
Hb measures were available only when hospital providers ordered them as part of routine practice. The first Hb concentration <9 g/dL during a patient’s hospitalization, which made them eligible for study participation, was obtained through manual review of the EHR. All additional Hb values during the patient’s hospitalization were obtained from the hospital’s administrative data mart. All Hb values collected for each patient during the hospitalization were used to calculate summary measures of Hb during the hospitalization, including the mean Hb, median Hb, minimum Hb, maximum Hb, admission (first recorded) Hb, and discharge (last recorded) Hb. Hb measures were analyzed both as a continuous variable and as a categorical variable created by dividing the continuous Hb measures into integer ranges of 3 groups of approximately the same size.
Measuring Fatigue
Our primary outcome was patients’ level of fatigue reported during hospitalization, measured using the Functional Assessment of Chronic Illness Therapy (FACIT)-Anemia questionnaire. Fatigue was measured using a 13-question fatigue subscale,1,2,25 which measures fatigue within the past 7 days. Scores on the fatigue subscale range from 0 to 52, with lower scores reflecting greater levels of fatigue. As soon as patients met the eligibility criteria for study participation during their hospitalization (age ≥50 years and Hb <9 g/dL), they were approached to answer the FACIT questions. Values for missing data in the fatigue subscale for individual subjects were filled in using a prorated score from their answered questions as long as >50% of the items in the fatigue subscale were answered, in accordance with recommendations for addressing missing data in the FACIT.26 Fatigue was analyzed as a continuous variable and as a dichotomous variable created by dividing the sample into high (FACIT <27) and low (FACIT ≥27) levels of fatigue based on the median FACIT score of the population. Previous literature has shown a FACIT fatigue subscale score between 23 and 26 to be associated with an Eastern Cooperative Oncology Group (ECOG)27 C Performance Status rating of 2 to 33 compared to scores ≥27.
Statistical Analysis
Statistical analysis was performed using Stata statistical software (StataCorp, College Station, Texas). Descriptive statistics were used to characterize patient demographics. Analysis of variance was used to test for differences in the mean fatigue levels across Hb measures. χ2 tests were performed to test for associations between high fatigue levels and the Hb measures. Multivariable analysis, including both linear and logistic regression models, were used to test the association of Hb concentration and fatigue. P values <0.05 using a 2-tailed test were deemed statistically significant.
RESULTS
Patient Characteristics
During the study period, 8559 patients were admitted to the general medicine service. Of those, 5073 (59%) consented for participation in the Hospitalist Project, and 3670 (72%) completed the Hospitalist Project inpatient interview. Of these patients, 1292 (35%) had Hb <9 g/dL, and 784 (61%) were 50 years or older and completed the FACIT questionnaire.
Table 1 reports the demographic characteristics and comorbidities for the sample, the mean (standard deviation [SD]) for the 6 Hb measures, and mean (SD) and median FACIT scores.
Bivariate Association of Fatigue and Hb
Categorizing patients into low, middle, or high Hb for each of the 6 Hb measures, minimum Hb was strongly associated with fatigue, with a weaker association for mean Hb and no statistically significant association for the other measures.
Minimum Hb
Patients with a minimum Hb <7 g/dL and patients with Hb 7-8 g/dL had higher fatigue levels (FACIT = 25 for each) than patients with a minimum Hb ≥8 g/dL (FACIT = 29; P < 0.001; Table 2). When excluding patients with SC and/or GIB because their average minimum Hb differed from the average minimum Hb of the full population (P < 0.001), patients with a minimum Hb <7 g/dL or 7-8 g/dL had even higher fatigue levels (FACIT = 23 and FACIT = 24, respectively), with no change in the fatigue level of patients with a minimum Hb ≥8 g/dL (FACIT = 29; P < 0.001; Table 2). Lower minimum Hb continued to be associated with higher fatigue levels when analyzed in 0.5 g/dL increments (Figure).
Mean Hb and Other Measures
Fatigue levels were high for 47% of patients with a mean Hb <8g /dL and 53% of patients with a mean Hb 8-9 g/dL compared with 43% of patients with a mean Hb ≥9 g/dL (P = 0.05). However, the association between high fatigue and mean Hb was not statistically significant when patients with SC and/or GIB were excluded (Table 2). None of the other 4 Hb measures was significantly associated with fatigue.
Linear Regression of Fatigue on Hb
In linear regression models, minimum Hb consistently predicted patient fatigue, mean Hb had a less robust association with fatigue, and the other Hb measures were not associated with patient fatigue. Increases in minimum Hb (analyzed as a continuous variable) were associated with reduced fatigue (higher FACIT score; β = 1.4; P = 0.005). In models in which minimum Hb was a categorical variable, patients with a minimum Hb of <7 g/dL or 7-8 g/dL had greater fatigue (lower FACIT score) than patients whose minimum Hb was ≥8 g/dL (Hb <7 g/dL: β = −4.2; P ≤ 0.001; Hb 7-8 g/dL: β = −4.1; P < 0.001). These results control for patients’ age, sex, individual comorbidities, and whether their minimum Hb occurred before or after the measurement of fatigue during hospitalization (Model 1), and the results are unchanged when also controlling for the number of Hb laboratory draws patients had during their hospitalization (Model 2; Table 3). In a stratified analysis excluding patients with either SC and/or GIB, changes in minimum Hb were associated with larger changes in patient fatigue levels (Supplemental Table 1). We also stratified our analysis to include only patients whose minimum Hb occurred before the measurement of their fatigue level during hospitalization to avoid a spurious association of fatigue with minimum Hb occurring after fatigue was measured. In both Models 1 and 2, minimum Hb remained a predictor of patients’ fatigue levels with similar effect sizes, although in Model 2, the results did not quite reach a statistically significant level, in part due to larger confidence intervals from the smaller sample size of this stratified analysis (Supplemental Table 2a). We further stratified this analysis to include only patients whose transfusion, if they received one, occurred after their minimum Hb and the measurement of their fatigue level to account for the possibility that a transfusion could affect the fatigue level patients report. In this analysis, most of the estimates of the effect of minimum Hb on fatigue were larger than those seen when only analyzing patients whose minimum Hb occurred before the measurement of their fatigue level, although again, the smaller sample size of this additional stratified analysis does produce larger confidence intervals for these estimates (Supplemental Table 2b).
No Hb measure other than minimum or mean had significant association with patient fatigue levels in linear regression models.
Logistic Regression of High Fatigue Level on Hb
Using logistic regression, minimum Hb analyzed as a categorical variable predicted increased odds of a high fatigue level. Patients with a minimum Hb <7 g/dL were 50% (odds ratio [OR] = 1.5; P = 0.03) more likely to have high fatigue and patients with a minimum Hb 7-8 g/dL were 90% (OR = 1.9; P < 0.001) more likely to have high fatigue compared with patients with a minimum Hb ≥8 g/dL in Model 1. These results were similar in Model 2, although the effect was only statistically significant in the 7-8 g/dL Hb group (Table 3). When excluding SC and/or GIB patients, the odds of having high fatigue as minimum Hb decreased were the same or higher for both models compared to the full population of patients. However, again, in Model 2, the effect was only statistically significant in the 7-8 g/dL Hb group (Supplemental Table 1).
Patients with a mean Hb <8 g/dL were 20% to 30% more likely to have high fatigue and patients with mean Hb 8-9 g/dL were 50% more likely to have high fatigue compared with patients with a mean Hb ≥9 g/dL, but the effects were only statistically significant for patients with a mean Hb 8-9 g/dL in both Models 1 and 2 (Table 3). These results were similar when excluding patients with SC and/or GIB, but they were only significant for patients with a mean Hb 8-9 g/dL in Model 1 and patients with a mean Hb <8 g/dL in the Model 2 (Supplemental Table 3).
DISCUSSION
These results demonstrate that minimum Hb during hospitalization is associated with fatigue in hospitalized patients age ≥50 years, and the association is stronger among patients without SC and/or GIB as comorbidities. The analysis of Hb as a continuous and categorical variable and the use of both linear and logistic regression models support the robustness of these associations and illuminate their clinical significance. For example, in linear regression with minimum Hb a continuous variable, the coefficient of 1.4 suggests that an increase of 2 g/dL in Hb, as might be expected from transfusion of 2 units of red blood cells, would be associated with about a 3-point improvement in fatigue. Additionally, as a categorical variable, a minimum Hb ≥8 g/dL compared with a minimum Hb <7 g/dL or 7-8 g/dL is associated with a 3- to 4-point improvement in fatigue. Previous literature suggests that a difference of 3 in the FACIT score is the minimum clinically important difference in fatigue,3 and changes in minimum Hb in either model predict changes in fatigue that are in the range of potential clinical significance.
The clinical significance of the findings is also reflected in the results of the logistic regressions, which may be mapped to potential effects on functional status. Specifically, the odds of having a high fatigue level (FACIT <27) increase 90% for persons with a minimum Hb 7–8 g/dL compared with persons with a minimum Hb ≥8 g/dL. For persons with a minimum Hb <7 g/dL, point estimates suggest a smaller (50%) increase in the odds of high fatigue, but the 95% confidence interval overlaps heavily with the estimate of patients whose minimum Hb is 7-8 g/dL. While it might be expected that patients with a minimum Hb <7 g/dL have greater levels of fatigue compared with patients with a minimum Hb 7-8 g/dL, we did not observe such a pattern. One reason may be that the confidence intervals of our estimated effects are wide enough that we cannot exclude such a pattern. Another possible explanation is that in both groups, the fatigue levels are sufficiently severe, such that the difference in their fatigue levels may not be clinically meaningful. For example, a FACIT score of 23 to 26 has been shown to be associated with an ECOG performance status of 2 to 3, requiring bed rest for at least part of the day.3 Therefore, patients with a minimum Hb 7-8 g/dL (mean FACIT score = 24; Table 2) or a minimum Hb of <7 g/dL (mean FACIT score = 23; Table 2) are already functionally limited to the point of being partially bed bound, such that further decreases in their Hb may not produce additional fatigue in part because they reduce their activity sufficiently to prevent an increase in fatigue. In such cases, the potential benefits of increased Hb may be better assessed by measuring fatigue in response to a specific and provoked activity level, a concept known as fatigability.20
That minimum Hb is more strongly associated with fatigue than any other measure of Hb during hospitalization may not be surprising. Mean, median, maximum, and discharge Hb may all be affected by transfusion during hospitalization that could affect fatigue. Admission Hb may not reflect true oxygen-carrying capacity because of hemoconcentration.
The association between Hb and fatigue in hospitalized patients is important because increased fatigue could contribute to slower clinical recovery in hospitalized patients. Additionally, increased fatigue during hospitalization and at hospital discharge could exacerbate the known deleterious consequences of fatigue on patients and their health outcomes14,15 after hospital discharge. Although one previous study, the Functional Outcomes in Cardiovascular Patients Undergoing Surgical Hip Fracture Repair (FOCUS)8 trial, did not report differences in patients’ fatigue levels at 30 and 60 days postdischarge when transfused at restrictive (8 g/dL) compared with liberal (10 g/dL) Hb thresholds, confidence in the validity of this finding is reduced by the fact that more than half of the patients were lost to follow-up at the 30- and 60-day time points. Further, patients in the restrictive transfusion arm of FOCUS were transfused to maintain Hb levels at or above 8 g/dL. This transfusion threshold of 8 g/dL may have mitigated the high levels of fatigue that are seen in our study when patients’ Hb drops below 8 g/dL, and maintaining a Hb level of 7 g/dL is now the standard of care in stable hospitalized patients. Lastly, FOCUS was limited to postoperative hip fracture patients, and the generalizability of FOCUS to hospitalized medicine patients with anemia is limited.
Therefore, our results support guideline suggestions that practitioners incorporate the presence of patient symptoms such as fatigue into transfusion decisions, particularly if patients’ Hb is <8 g/dL.18 Though reasonable, the suggestion to incorporate symptoms such as fatigue into transfusion decisions has not been strongly supported by evidence so far, and it may often be neglected in practice. Definitive evidence to support such recommendations would benefit from study through an optimal trial18 that incorporates symptoms into decision making. Our findings add support for a study of transfusion strategies that incorporates patients’ fatigue level in addition to Hb concentration.
This study has several limitations. Although our sample size is large and includes patients with a range of comorbidities that we believe are representative of hospitalized general medicine patients, as a single-center, observational study, our results may not be generalizable to other centers. Additionally, although these data support a reliable association between hospitalized patients’ minimum Hb and fatigue level, the observational design of this study cannot prove that this relationship is causal. Also, patients’ Hb values were measured at the discretion of their clinician, and therefore, the measures of Hb were not uniformly measured for participating patients. In addition, fatigue was only measured at one time point during a patient’s hospitalization, and it is possible that patients’ fatigue levels change during hospitalization in relation to variables we did not consider. Finally, our study was not designed to assess the association of Hb with longer-term functional outcomes, which may be of greater concern than fatigue.
CONCLUSION
In hospitalized patients ≥50 years old, minimum Hb is reliably associated with patients’ fatigue level. Patients whose minimum Hb is <8 g/dL experience higher fatigue levels compared to patients whose minimum Hb is ≥8 g/dL. Additional studies are warranted to understand if patients may benefit from improved fatigue levels by correcting their anemia through transfusion.
Disclosure
Dr. Prochaska is supported by an Agency for Healthcare Research and Quality Patient-Centered Outcomes Research Institutional K12 Award (1K12HS023007-01, principal investigator Meltzer). Dr. Meltzer is supported by a National Institutes of Health Clinical and Translational Science Award (2UL1TR000430-06, principal investigator Solway) and a grant from the Patient-Centered Outcomes Research Network in support of the Chicago Patient-Centered Outcomes Research Network. The authors report no conflicts of interest.
1. Yellen SB, Cella DF, Webster K, Blendowski C, Kaplan E. Measuring fatigue and other anemia-related symptoms with the Functional Assessment of Cancer Therapy (FACT) measurement system. J Pain Symptom Manage. 1997;13(2):63-74. PubMed
2. Cella D, Lai JS, Chang CH, Peterman A, Slavin M. Fatigue in cancer patients compared with fatigue in the general United States population. Cancer. 2002;94(2):528-538. doi:10.1002/cncr.10245. PubMed
3. Cella D, Eton DT, Lai J-S, Peterman AH, Merkel DE. Combining anchor and distribution-based methods to derive minimal clinically important differences on the Functional Assessment of Cancer Therapy (FACT) anemia and fatigue scales. J Pain Symptom Manage. 2002;24(6):547-561. PubMed
4. Tonelli M, Hemmelgarn B, Reiman T, et al. Benefits and harms of erythropoiesis-stimulating agents for anemia related to cancer: a meta-analysis. CMAJ Can Med Assoc J J Assoc Medicale Can. 2009;180(11):E62-E71. doi:10.1503/cmaj.090470. PubMed
5. Foley RN, Curtis BM, Parfrey PS. Erythropoietin Therapy, Hemoglobin Targets, and Quality of Life in Healthy Hemodialysis Patients: A Randomized Trial. Clin J Am Soc Nephrol. 2009;4(4):726-733. doi:10.2215/CJN.04950908. PubMed
6. Keown PA, Churchill DN, Poulin-Costello M, et al. Dialysis patients treated with Epoetin alfa show improved anemia symptoms: A new analysis of the Canadian Erythropoietin Study Group trial. Hemodial Int Int Symp Home Hemodial. 2010;14(2):168-173. doi:10.1111/j.1542-4758.2009.00422.x. PubMed
7. Palmer SC, Saglimbene V, Mavridis D, et al. Erythropoiesis-stimulating agents for anaemia in adults with chronic kidney disease: a network meta-analysis. Cochrane Database Syst Rev. 2014:CD010590. PubMed
8. Carson JL, Terrin ML, Noveck H, et al. Liberal or Restrictive Transfusion in high-risk patients after hip surgery. N Engl J Med. 2011;365(26):2453-2462. doi:10.1056/NEJMoa1012452. PubMed
9. Holst LB, Haase N, Wetterslev J, et al. Transfusion requirements in septic shock (TRISS) trial – comparing the effects and safety of liberal versus restrictive red blood cell transfusion in septic shock patients in the ICU: protocol for a randomised controlled trial. Trials. 2013;14:150. doi:10.1186/1745-6215-14-150. PubMed
10. Hébert PC, Wells G, Blajchman MA, et al. A multicenter, randomized, controlled clinical trial of transfusion requirements in critical care. N Engl J Med. 1999;340(6):409-417. doi:10.1056/NEJM199902113400601. PubMed
11. Corwin HL, Theus JW, Cargile CS, Lang NP. Red blood cell transfusion: Impact of an education program and a clinical guideline on transfusion practice. J Hosp Med. 2014;9(12):745-749. doi:10.1002/jhm.2237. PubMed
12. Saxena, S, editor. The Transfusion Committee: Putting Patient Safety First, 2nd Edition. Bethesda (MD): American Association of Blood Banks; 2013.
13. The 2011 National Blood Collection and Utilization Report. http://www.hhs.gov/ash/bloodsafety/2011-nbcus.pdf. Accessed August 16, 2017.
14. Vestergaard S, Nayfield SG, Patel KV, et al. Fatigue in a Representative Population of Older Persons and Its Association With Functional Impairment, Functional Limitation, and Disability. J Gerontol A Biol Sci Med Sci. 2009;64A(1):76-82. doi:10.1093/gerona/gln017. PubMed
15. Gill TM, Desai MM, Gahbauer EA, Holford TR, Williams CS. Restricted activity among community-living older persons: incidence, precipitants, and health care utilization. Ann Intern Med. 2001;135(5):313-321. PubMed
16. Koch CG, Li L, Sun Z, et al. Hospital-acquired anemia: Prevalence, outcomes, and healthcare implications. J Hosp Med. 2013;8(9):506-512. doi:10.1002/jhm.2061. PubMed
17. Meltzer D, Manning WG, Morrison J, et al. Effects of Physician Experience on Costs and Outcomes on an Academic General Medicine Service: Results of a Trial of Hospitalists. Ann Intern Med. 2002;137(11):866-874. doi:10.7326/0003-4819-137-11-200212030-00007. PubMed
18. Carson JL, Grossman BJ, Kleinman S, et al. Red Blood Cell Transfusion: A Clinical Practice Guideline From the AABB*. Ann Intern Med. 2012;157(1):49-58. doi:10.7326/0003-4819-157-1-201206190-00429. PubMed
19. Moreh E, Jacobs JM, Stessman J. Fatigue, function, and mortality in older adults. J Gerontol A Biol Sci Med Sci. 2010;65(8):887-895. doi:10.1093/gerona/glq064. PubMed
20. Eldadah BA. Fatigue and Fatigability in Older Adults. PM&R. 2010;2(5):406-413. doi:10.1016/j.pmrj.2010.03.022. PubMed
21. Hardy SE, Studenski SA. Fatigue Predicts Mortality among Older Adults. J Am Geriatr Soc. 2008;56(10):1910-1914. doi:10.1111/j.1532-5415.2008.01957.x. PubMed
22. Pfeiffer E. A short portable mental status questionnaire for the assessment of organic brain deficit in elderly patients. J Am Geriatr Soc. 1975;23(10):433-441. PubMed
23. Quan H, Sundararajan V, Halfon P, et al. Coding algorithms for defining comorbidities in ICD-9-CM and ICD-10 administrative data. Med Care. 2005;43(11):1130-1139. PubMed
24. HCUP Clinical Classifications Software (CCS) for ICD-9-CM. Healthcare Cost and Utilization Project (HCUP). 2006-2009. Agency for Healthcare Research and Quality, Rockville, MD. https://www.hcup-us.ahrq.gov/toolssoftware/ccs/ccs.jsp. Accessed November 22, 2016.
25. Cella DF, Tulsky DS, Gray G, et al. The Functional Assessment of Cancer Therapy scale: development and validation of the general measure. J Clin Oncol Off J Am Soc Clin Oncol. 1993;11(3):570-579. PubMed
26. Webster K, Cella D, Yost K. The Functional Assessment of Chronic Illness Therapy (FACIT) Measurement System: properties, applications, and interpretation. Health Qual Life Outcomes. 2003;1:79. doi:10.1186/1477-7525-1-79. PubMed
27. Oken MMMD a, Creech RHMD b, Tormey DCMD, et al. Toxicity and response criteria of the Eastern Cooperative Oncology Group. J Clin Oncol. 1982;5(6):649-656. PubMed
© 2017 Society of Hospital Medicine