User login
Inpatients With Poor Vision
Vision impairment is an under‐recognized risk factor for adverse events among hospitalized patients.[1, 2, 3] Inpatients with poor vision are at increased risk for falls and delirium[1, 3] and have more difficulty taking medications.[4, 5] They may also be at risk for being unable to read critical health information, including consent forms and discharge instructions, or decreased quality of life such as simply ordering food from menus. However, vision is neither routinely tested nor documented for inpatients. Low‐cost ($8 and up) nonprescription reading glasses, known as readers may be a simple, high‐value intervention to improve inpatients' vision. We aimed to study initial feasibility and efficacy of screening and correcting inpatients' vision.
METHODS
From June 2012 through January 2014, research assistants (RAs) identified eligible (adults [18 years], English speaking) participants daily from electronic medical records as part of an ongoing study of general medicine inpatients measuring quality‐of‐care at the University of Chicago Medicine.[6] RAs tested visual acuity using Snellen pocket charts (participants wore corrective lenses if available). For eligible participants, readers were tested with sequential fitting (+2/+2.25/+2.75/+3.25) until vision was corrected (sufficient vision: at least 20/50 acuity in at least 1 eye).[7] Eligible participants included those with insufficient vision who were not already wearing corrective lenses and had no documented blindness or medically severe vision loss, for whom nonprescription readers would be unlikely to correct vision deficiencies such as cataracts or glaucoma. The study was approved by the University of Chicago Institutional Review Board (IRB #9967).
Of note, although readers are typically used in populations over 40 years of age, readers were fitted for all participants to assess their utility for any hospitalized adult patient. Upon completing the vision screening and readers interventions, participants received instruction on how to access vision care and how to obtain readers (if they corrected vision) after hospital discharge.
Descriptive statistics and tests of comparison, including t tests and [2] tests, were used when appropriate. All analyses were performed using Stata version 12 (StataCorp, College Station, TX).
RESULTS
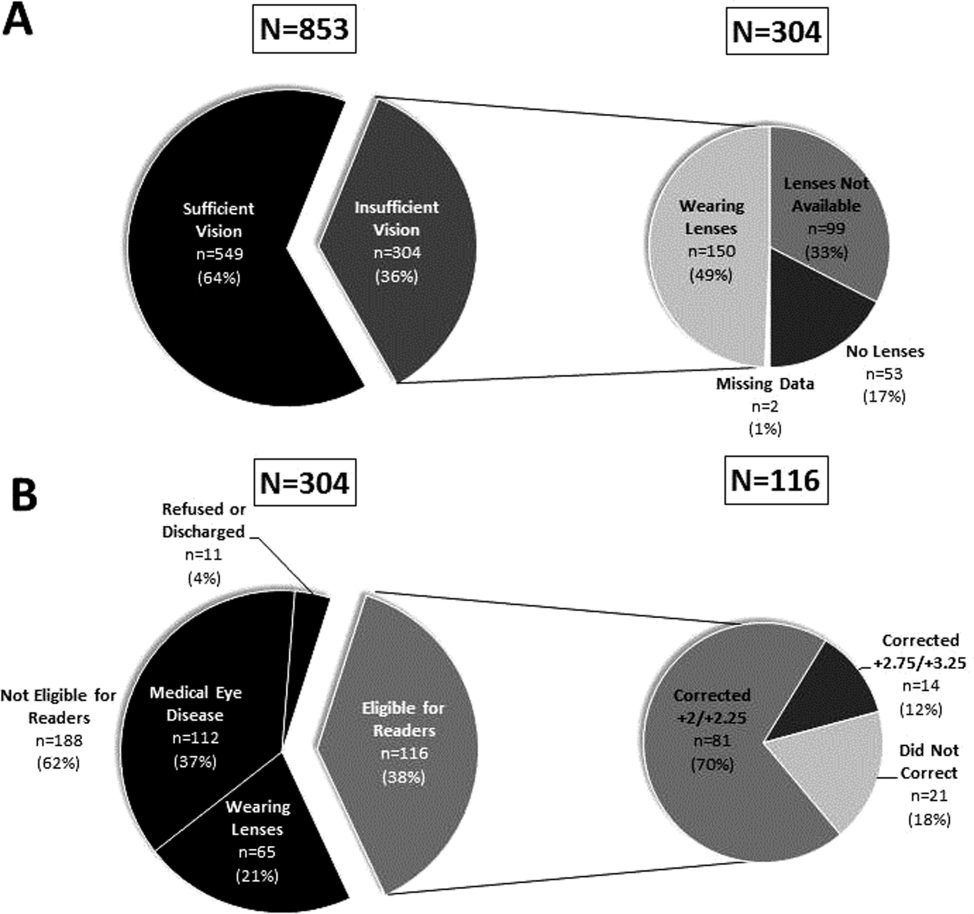
Over 800 participants' vision was screened (n=853); the majority were female (56%, 480/853), African American (76%, 650/853), with a mean age of 53.4 years (standard deviation 18.7), consistent with our study site's demographics. Over one‐third (36%, 304/853) of participants had insufficient vision. Older (65 years) participants (56%, 136/244) were more likely to have insufficient vision than younger participants (28%, 168/608; P<0.001).
Participants with insufficient vision were wearing their own corrective lenses during the testing (150/304, 49%), did not use corrective lenses (53/304, 17%), or were without available corrective lenses (99/304, 33%) (Figure 1A).

One‐hundred sixteen of 304 participants approached for the readers intervention were eligible (112 reported medical eye disease, 65 were wearing lenses, and 11 refused or were discharged before intervention implementation).
Nonprescription readers corrected the majority of eligible participants' vision (82%, 95/116). Most participants' (81/116, 70%) vision was corrected using the 2 lowest calibration readers (+2/+2.25); another 14 participants' (12%) vision was corrected with higher‐strength lenses (+2.75/+3.25) (Figure 1B)
DISCUSSION
We found that over one‐third of the inpatients we examined have poor vision. Furthermore, among an easily identified subgroup of inpatients with poor vision, low‐cost readers successfully corrected most participants' vision. Although preventive health is not commonly considered an inpatient issue, hospitalists and other clinicians working in the inpatient setting can play an important role in identifying opportunities to provide high‐value care related to patients' vision.
Several important ethical, safety, and cost considerations related to these findings exist. Hospitalized patients commonly sign written informed consent; therefore, due diligence to ensure patients' ability to read and understand the forms is imperative. Further, inpatient delirium is common, particularly among older patients.[8] Existing or new onset delirium occurs in up to 24% to 35% of elderly inpatients.[8] Vision is an important risk factor for multifactorial inpatient delirium, and early vision correction has been shown to improve delirium rates, as part of a multicomponent intervention.[9] Hospital‐related patient costs per delirium episode have been estimated at $16,303 to $64,421.[10] The cost of a multicomponent intervention was $6341 per case of delirium prevented,[9] whereas only 1 potentially critical component, the cost of readers ($8+), would pale in comparison.[1] Vision screening takes approximately 2.25 minutes plus 2 to 6 minutes for the readers' assessment, with little training and high fidelity. Therefore, this easily implemented, potentially cost saving, intervention targeting inpatients with poor vision may improve patient safety and quality of life in the hospital and even after discharge.
Limitations of the study include considerations of generalizability, as participants were from a single, urban, academic medical center. Additionally, long‐term benefits of the readers intervention were not assessed in this study. Finally, RAs provided the assessments; therefore, further work is required to determine costs of efficient large‐scale clinical implementation through nurse‐led programs.
Despite these study limitations, the surprisingly high prevalence of poor vision among inpatients is a call to action for hospitalists. Future work should investigate the impact and cost of vision correction on hospital outcomes such as patient satisfaction, reduced rehospitalizations, and decreased delirium.[11]
Acknowledgements
The authors thank several individuals for their assistance with this project. Andrea Flores, MA, Senior Programmer, helped with programming and data support. Kristin Constantine, BA, Project Manager, helped with developing and implementing the database for this project. Edward Kim, BA, Project Manager, helped with management of the database and data collection. The authors also thank Ainoa Coltri and the Hospitalist Project research assistants for assistance with data collection, Frank Zadravecz, MPH, for assistance with the creation of figures, and Nicole Twu, MS, for assistance with the project. The authors thank other students who helped to collect data for this project, including Allison Louis, Victoria Moreira, and Esther Schoenfeld.
Disclosures: Dr. Press is supported by a career development award from the National Heart Lung and Blood Institute (NIH K23HL118151). A pilot award from The Center on the Demography and Economics of Aging (CoA, National Institute of Aging P30 AG012857) supported this project. Dr. Matthiesen and Ms. Ranadive received support from the Summer Research Program funded by the National Institutes on Aging Short‐Term Aging‐Related Research Program (T35AG029795). Dr. Matthiesen also received funding from the Calvin Fentress Fellowship Program. Dr. Hariprasad reports being a consultant or participating on a speaker's bureau for Alcon, Allergan, Regeneron, Genentech, Optos, OD‐OS, Bayer, Clearside Biomedical, and Ocular Therapeutix. Dr. Meltzer received funding from the National Institutes on Aging Short‐Term Aging‐Related Research Program (T35AG029795), and from the Agency for Healthcare Quality and Research through the Hospital Medicine and Economics Center for Education and Research in Therapeutics (U18 HS016967‐01), and from the National Institute of Aging through a Midcareer Career Development Award (K24 AG031326‐01), from the National Cancer Institute (KM1 CA156717), and from the National Center for Advancing Translational Science (2UL1TR000430‐06). Dr. Arora received funding from the National Institutes on Aging Short‐Term Aging‐Related Research Program (T35AG029795) and National Institutes on Aging (K23AG033763).
- , , , . Risk factors and risk assessment tools for falls in hospital in‐patients: a systematic review. Age Ageing. 2004;33(2):122–130.
- , , , , . More than meets the eye: relationship between low health literacy and poor vision in hospitalized patients. J Health Commun. 2013;18(suppl 1):197–204.
- , , , , , . Risk factors for delirium at discharge: development and validation of a predictive model. Arch Intern Med. 2007;167(13):1406–1413.
- , , , et al. Misuse of respiratory inhalers in hospitalized patients with asthma or COPD. J Gen Intern Med. 2011;26(6):635–642.
- , , . Can elderly people take their medicine? Patient Educ Couns. 2005;59(2):186–191.
- , , , et al. Effects of physician experience on costs and outcomes on an academic general medicine service: results of a trial of hospitalists. Ann Intern Med. 2002;137(11):866–874.
- . Prospective evaluation of visual acuity assessment: a comparison of Snellen versus ETDRS charts in clinical practice (An AOS Thesis). Trans Am Ophthalmol Soc. 2009;107:311–324.
- , , , et al. Delirium. The occurrence and persistence of symptoms among elderly hospitalized patients. Arch Intern Med. 1992;152(2):334–340.
- , , , et al. A multicomponent intervention to prevent delirium in hospitalized older patients. N Engl J Med. 1999;340(9):669–676.
- , , , , . One‐year health care costs associated with delirium in the elderly population. Arch Intern Med. 2008;168(1):27–32.
- , , , et al. A low‐vision rehabilitation program for patients with mild cognitive deficits. JAMA Ophthalmol. 2013;131(7):912–919.
Vision impairment is an under‐recognized risk factor for adverse events among hospitalized patients.[1, 2, 3] Inpatients with poor vision are at increased risk for falls and delirium[1, 3] and have more difficulty taking medications.[4, 5] They may also be at risk for being unable to read critical health information, including consent forms and discharge instructions, or decreased quality of life such as simply ordering food from menus. However, vision is neither routinely tested nor documented for inpatients. Low‐cost ($8 and up) nonprescription reading glasses, known as readers may be a simple, high‐value intervention to improve inpatients' vision. We aimed to study initial feasibility and efficacy of screening and correcting inpatients' vision.
METHODS
From June 2012 through January 2014, research assistants (RAs) identified eligible (adults [18 years], English speaking) participants daily from electronic medical records as part of an ongoing study of general medicine inpatients measuring quality‐of‐care at the University of Chicago Medicine.[6] RAs tested visual acuity using Snellen pocket charts (participants wore corrective lenses if available). For eligible participants, readers were tested with sequential fitting (+2/+2.25/+2.75/+3.25) until vision was corrected (sufficient vision: at least 20/50 acuity in at least 1 eye).[7] Eligible participants included those with insufficient vision who were not already wearing corrective lenses and had no documented blindness or medically severe vision loss, for whom nonprescription readers would be unlikely to correct vision deficiencies such as cataracts or glaucoma. The study was approved by the University of Chicago Institutional Review Board (IRB #9967).
Of note, although readers are typically used in populations over 40 years of age, readers were fitted for all participants to assess their utility for any hospitalized adult patient. Upon completing the vision screening and readers interventions, participants received instruction on how to access vision care and how to obtain readers (if they corrected vision) after hospital discharge.
Descriptive statistics and tests of comparison, including t tests and [2] tests, were used when appropriate. All analyses were performed using Stata version 12 (StataCorp, College Station, TX).
RESULTS
Over 800 participants' vision was screened (n=853); the majority were female (56%, 480/853), African American (76%, 650/853), with a mean age of 53.4 years (standard deviation 18.7), consistent with our study site's demographics. Over one‐third (36%, 304/853) of participants had insufficient vision. Older (65 years) participants (56%, 136/244) were more likely to have insufficient vision than younger participants (28%, 168/608; P<0.001).
Participants with insufficient vision were wearing their own corrective lenses during the testing (150/304, 49%), did not use corrective lenses (53/304, 17%), or were without available corrective lenses (99/304, 33%) (Figure 1A).
One‐hundred sixteen of 304 participants approached for the readers intervention were eligible (112 reported medical eye disease, 65 were wearing lenses, and 11 refused or were discharged before intervention implementation).
Nonprescription readers corrected the majority of eligible participants' vision (82%, 95/116). Most participants' (81/116, 70%) vision was corrected using the 2 lowest calibration readers (+2/+2.25); another 14 participants' (12%) vision was corrected with higher‐strength lenses (+2.75/+3.25) (Figure 1B)
DISCUSSION
We found that over one‐third of the inpatients we examined have poor vision. Furthermore, among an easily identified subgroup of inpatients with poor vision, low‐cost readers successfully corrected most participants' vision. Although preventive health is not commonly considered an inpatient issue, hospitalists and other clinicians working in the inpatient setting can play an important role in identifying opportunities to provide high‐value care related to patients' vision.
Several important ethical, safety, and cost considerations related to these findings exist. Hospitalized patients commonly sign written informed consent; therefore, due diligence to ensure patients' ability to read and understand the forms is imperative. Further, inpatient delirium is common, particularly among older patients.[8] Existing or new onset delirium occurs in up to 24% to 35% of elderly inpatients.[8] Vision is an important risk factor for multifactorial inpatient delirium, and early vision correction has been shown to improve delirium rates, as part of a multicomponent intervention.[9] Hospital‐related patient costs per delirium episode have been estimated at $16,303 to $64,421.[10] The cost of a multicomponent intervention was $6341 per case of delirium prevented,[9] whereas only 1 potentially critical component, the cost of readers ($8+), would pale in comparison.[1] Vision screening takes approximately 2.25 minutes plus 2 to 6 minutes for the readers' assessment, with little training and high fidelity. Therefore, this easily implemented, potentially cost saving, intervention targeting inpatients with poor vision may improve patient safety and quality of life in the hospital and even after discharge.
Limitations of the study include considerations of generalizability, as participants were from a single, urban, academic medical center. Additionally, long‐term benefits of the readers intervention were not assessed in this study. Finally, RAs provided the assessments; therefore, further work is required to determine costs of efficient large‐scale clinical implementation through nurse‐led programs.
Despite these study limitations, the surprisingly high prevalence of poor vision among inpatients is a call to action for hospitalists. Future work should investigate the impact and cost of vision correction on hospital outcomes such as patient satisfaction, reduced rehospitalizations, and decreased delirium.[11]
Acknowledgements
The authors thank several individuals for their assistance with this project. Andrea Flores, MA, Senior Programmer, helped with programming and data support. Kristin Constantine, BA, Project Manager, helped with developing and implementing the database for this project. Edward Kim, BA, Project Manager, helped with management of the database and data collection. The authors also thank Ainoa Coltri and the Hospitalist Project research assistants for assistance with data collection, Frank Zadravecz, MPH, for assistance with the creation of figures, and Nicole Twu, MS, for assistance with the project. The authors thank other students who helped to collect data for this project, including Allison Louis, Victoria Moreira, and Esther Schoenfeld.
Disclosures: Dr. Press is supported by a career development award from the National Heart Lung and Blood Institute (NIH K23HL118151). A pilot award from The Center on the Demography and Economics of Aging (CoA, National Institute of Aging P30 AG012857) supported this project. Dr. Matthiesen and Ms. Ranadive received support from the Summer Research Program funded by the National Institutes on Aging Short‐Term Aging‐Related Research Program (T35AG029795). Dr. Matthiesen also received funding from the Calvin Fentress Fellowship Program. Dr. Hariprasad reports being a consultant or participating on a speaker's bureau for Alcon, Allergan, Regeneron, Genentech, Optos, OD‐OS, Bayer, Clearside Biomedical, and Ocular Therapeutix. Dr. Meltzer received funding from the National Institutes on Aging Short‐Term Aging‐Related Research Program (T35AG029795), and from the Agency for Healthcare Quality and Research through the Hospital Medicine and Economics Center for Education and Research in Therapeutics (U18 HS016967‐01), and from the National Institute of Aging through a Midcareer Career Development Award (K24 AG031326‐01), from the National Cancer Institute (KM1 CA156717), and from the National Center for Advancing Translational Science (2UL1TR000430‐06). Dr. Arora received funding from the National Institutes on Aging Short‐Term Aging‐Related Research Program (T35AG029795) and National Institutes on Aging (K23AG033763).
- , , , . Risk factors and risk assessment tools for falls in hospital in‐patients: a systematic review. Age Ageing. 2004;33(2):122–130.
- , , , , . More than meets the eye: relationship between low health literacy and poor vision in hospitalized patients. J Health Commun. 2013;18(suppl 1):197–204.
- , , , , , . Risk factors for delirium at discharge: development and validation of a predictive model. Arch Intern Med. 2007;167(13):1406–1413.
- , , , et al. Misuse of respiratory inhalers in hospitalized patients with asthma or COPD. J Gen Intern Med. 2011;26(6):635–642.
- , , . Can elderly people take their medicine? Patient Educ Couns. 2005;59(2):186–191.
- , , , et al. Effects of physician experience on costs and outcomes on an academic general medicine service: results of a trial of hospitalists. Ann Intern Med. 2002;137(11):866–874.
- . Prospective evaluation of visual acuity assessment: a comparison of Snellen versus ETDRS charts in clinical practice (An AOS Thesis). Trans Am Ophthalmol Soc. 2009;107:311–324.
- , , , et al. Delirium. The occurrence and persistence of symptoms among elderly hospitalized patients. Arch Intern Med. 1992;152(2):334–340.
- , , , et al. A multicomponent intervention to prevent delirium in hospitalized older patients. N Engl J Med. 1999;340(9):669–676.
- , , , , . One‐year health care costs associated with delirium in the elderly population. Arch Intern Med. 2008;168(1):27–32.
- , , , et al. A low‐vision rehabilitation program for patients with mild cognitive deficits. JAMA Ophthalmol. 2013;131(7):912–919.
Using Video to Validate Handoff Quality
Over the last decade, there has been an unprecedented focus on physician handoffs in US hospitals. One major reason for this are the reductions in residency duty hours that have been mandated by the American Council for Graduate Medical Education (ACGME), first in 2003 and subsequently revised in 2011.[1, 2] As residents work fewer hours, experts believe that potential safety gains from reduced fatigue are countered by an increase in the number of handoffs, which represent a risk due to the potential miscommunication. Prior studies show that critical patient information is often lost or altered during this transfer of clinical information and professional responsibility, which can result in patient harm.[3, 4] As a result of these concerns, the ACGME now requires residency programs to ensure and monitor effective, structured hand‐over processes to facilitate both continuity of care and patient safety. Programs must ensure that residents are competent in communicating with team members in the hand‐over process.[2] Moreover, handoffs have also been a major improvement focus for organizations with broader scope than teaching hospitals, including the World Health Organization, Joint Commission, and the Society for Hospital Medicine (SHM).[5, 6, 7]
Despite this focus on handoffs, monitoring quality of handoffs has proven challenging due to lack of a reliable and validated tool to measure handoff quality. More recently, the Accreditation Council of Graduate Medical Education's introduction of the Next Accreditation System, with its focus on direct observation of clinical skills to achieve milestones, makes it crucial for residency educators to have valid tools to measure competence in handoffs. As a result, it is critical that instruments to measure handoff performance are not only created but also validated.[8]
To help fill this gap, we previously reported on the development of a 9‐item Handoff Clinical Examination Exercise (CEX) assessment tool. The Handoff CEX, designed for use by those participating in the handoff or by a third‐party observer, can be used to rate the quality of patient handoffs in domains such as professionalism and communication skills between the receiver and sender of patient information.[9, 10] Despite prior demonstration of feasibility of use, the initial tool was perceived as lengthy and redundant. In addition, although the tool has been shown to discriminate between performance of novice and expert nurses, the construct validity of this tool has not been established.[11] Establishing construct validity is important to ensuring that the tool can measure the construct in question, namely whether it detects those who are actually competent to perform handoffs safely and effectively. We present here the results of the development of a shorter Handoff Mini‐CEX, along with the formal establishment of its construct validity, namely its ability to distinguish between levels of performance in 3 domains of handoff quality.
METHODS
Adaption of the Handoff CEX and Development of the Abbreviated Tool
The 9‐item Handoff CEX is a paper‐based instrument that was created by the investigators (L.I.H., J.M.F., V.M.A.) to evaluate either the sender or the receiver of handoff communications and has been used in prior studies (see Supporting Information, Appendix 1, in the online version of this article).[9, 10] The evaluation may be conducted by either an observer or by a handoff participant. The instrument includes 6 domains: (1) setting, (2) organization and efficiency, (3) communication skills, (4) content, (5) clinical judgment, and (6) humanistic skills/professionalism. Each domain is graded on a 9‐point rating scale, modeled on the widely used Mini‐CEX (Clinical Evaluation Exercise) for real‐time observation of clinical history and exam skills in internal medicine clerkships and residencies (13=unsatisfactory, 46=marginal/satisfactory, 79=superior).[12] This familiar 9‐point scale is utilized in graduate medical education evaluation of the ACGME core competencies.
To standardize the evaluation, the instrument uses performance‐based anchors for evaluating both the sender and the receiver of the handoff information. The anchors are derived from functional evaluation of the roles of senders and receivers in our preliminary work at both the University of Chicago and Yale University, best practices in other high‐reliability industries, guidelines from the Joint Commission and the SHM, and prior studies of effective communication in clinical systems.[5, 6, 13]
After piloting the Handoff CEX with the University of Chicago's internal medicine residency program (n=280 handoff evaluations), a strong correlation was noted between the measures of content (medical knowledge), patient care, clinical judgment, organization/efficiency, and communication skills. Moreover, the Handoff CEX's Cronbach , or measurement of internal reliability and consistency, was very high (=0.95). Given the potential of redundant items, and to increase ease of use of the instrument, factor analysis was used to reduce the instrument to yield a shorter 3‐item tool, the Handoff Mini‐CEX, that assessed 3 of the initial items: setting, communication skills, and professionalism. Overall, performance on these 3 items were responsible for 82% of the variance of overall sign‐out quality (see Supporting Information, Appendix 2, in the online version of this article).
Establishing Construct Validity of the Handoff Mini‐CEX
To establish construct validity of the Handoff Mini‐CEX, we adapted a protocol used by Holmboe and colleagues to report the construct validity of the Handoff Mini‐CEX, which is based on the development and use of video scenarios depicting varying levels of clinical performance.[14] A clinical scenario script, based on prior observational work, was developed, which represented an internal medicine resident (the sender) signing out 3 different patients to colleagues (intern [postgraduate year 1] and resident). This scenario was developed to explicitly include observable components of professionalism, communication, and setting. Three levels of performancesuperior, satisfactory, and unsatisfactorywere defined and described for the 3 domains. These levels were defined, and separate scripts were written using this information, demonstrating varying levels of performance in each of the domains of interest, using the descriptive anchors of the Handoff Mini‐CEX.
After constructing the superior, or gold standard, script that showcases superior communication, professionalism, and setting, individual domains of performance were changed (eg, to satisfactory or unsatisfactory), while holding the other 2 constant at the superior level of performance. For example, superior communication requires that the sender provides anticipatory guidance and includes clinical rationale, whereas unsatisfactory communication includes vague language about overnight events and a disorganized presentation of patients. Superior professionalism requires no inappropriate comments by the sender about patients, family, and staff as well as a presentation focused on the most urgent patients. Unsatisfactory professionalism is shown by a hurried and inattentive sign‐out, with inappropriate comments about patients, family, and staff. Finally, a superior setting is one in which the receiver is listening attentively and discourages interruptions, whereas an unsatisfactory setting finds the sender or receiver answering pages during the handoff surrounded by background noise. We omitted the satisfactory level for setting due to the difficulties in creating subtleties in the environment.
Permutations of each of these domains resulted in 6 scripts depicting different levels of sender performance (see Supporting Information, Appendix 3, in the online version of this article). Only the performance level of the sender was changed, and the receivers of the handoff performance remained consistent, using best practices for receivers, such as attentive listening, asking questions, reading back, and taking notes during the handoff. The scripts were developed by 2 investigators (V.M.A., S.B.), then reviewed and edited independently by other investigators (J.M.F., P.S.) to achieve consensus. Actors were recruited to perform the video scenarios and were trained by the physician investigators (J.M.F., V.M.A.). The part of the sender was played by a study investigator (P.S.) with prior acting experience, and who had accrued over 40 hours of experience observing handoffs to depict varying levels of handoff performance. The digital video recordings ranged in length from 2.00 minutes to 4.08 minutes. All digital videos were recorded using a Sony XDCAM PMW‐EX3 HD camcorder (Sony Corp., Tokyo, Japan.
Participants
Faculty from the University of Chicago Medical Center and Yale University were included. At the University of Chicago, faculty were recruited to participate via email by the study investigators to the Research in Medical Education (RIME) listhost, which includes program directors, clerkship directors, and medical educators. Two sessions were offered and administered. Continuing medical education (CME) credit was provided for participation, as this workshop was given in conjunction with the RIME CME conference. Evaluations were deidentified using a unique identifier for each rater. At Yale University, the workshop on handoffs was offered as part of 2 seminars for program directors and chief residents from all specialties. During these seminars, program directors and chief residents used anonymous evaluation rating forms that did not capture rater identifiers. No other incentive was provided for participation. Although neither faculty at the University of Chicago nor Yale University received any formal training on handoff evaluation, they did receive a short introduction to the importance of handoffs and the goals of the workshop. The protocol was deemed exempt by the institutional review board at the University of Chicago.
Workshop Protocol
After a brief introduction, faculty viewed the tapes in random order on a projected screen. Participants were instructed to use the Handoff Mini‐CEX to rate whichever element(s) of handoff quality they believed they could suitably evaluate while watching the tapes. The videos were rated on the Handoff Mini‐CEX form, and participants anonymously completed the forms independently without any contact with other participants. The lead investigators proctored all sessions. At University of Chicago, participants viewed and rated all 6 videos over the course of an hour. At Yale University, due to time constraints in the program director and chief resident seminars, participants reviewed 1 of the videos in seminar 1 (unsatisfactory professionalism) and 2 in the other seminar (unsatisfactory communication, unsatisfactory professionalism) (Table 1).
| Unsatisfactory | Satisfactory | Superior | |
|---|---|---|---|
| |||
| Communication | Script 3 (n=36)a | Script 2 (n=13) | Script 1 (n=13) |
| Uses vague language about overnight events, missing critical patient information, disorganized. | Insufficient level of clinical detail, directions are not as thorough, handoff is generally on task and sufficient. | Anticipatory guidance provided, rationale explained; important information is included, highlights sick patients. | |
| Look in the record; I'm sure it's in there. And oh yeah, I need you to check enzymes and finish ruling her out. | So the only thing to do is to check labs; you know, check CBC and cardiac enzymes. | So for today, I need you to check post‐transfusion hemoglobin to make sure it's back to the baseline of 10. If it's under 10, then transfuse her 2 units, but hopefully it will be bumped up. Also continue to check cardiac enzymes; the next set is coming at 2 pm, and we need to continue the rule out. If her enzymes are positive or she has other ECG changes, definitely call the cardio fellow, since they'll want to take her to the CCU. | |
| Professionalism | Script 5 (n=39)a | Script 4 (n=22)a | Script 1 |
| Hurried, inattentive, rushing to leave, inappropriate comments (re: patients, family, staff). | Some tangential comments (re: patients, family, staff). | Appropriate comments (re: patients, family, staff), focused on task. | |
| [D]efinitely call the cards fellow, since they'll want to take her to the CCU. And let me tell you, if you don't call her, she'll rip you a new one. | Let's breeze through them quickly so I can get out of here, I've had a rough day. I'll start with the sickest first, and oh my God she's a train wreck! | ||
| Setting | Script 6 (n=13) | Script 1 | |
| Answering pages during handoff, interruptions (people entering room, phone ringing). | Attentive listening, no interruptions, pager silenced. | ||
Data Collection and Statistical Analysis
Using combined data from University of Chicago and Yale University, descriptive statistics were reported as raw scores on the Handoff Mini‐CEX. To assess internal consistency of the tool, Cronbach was used. To assess inter‐rater reliability of these attending physician ratings on the tool, we performed a Kendall coefficient of concordance analysis after collapsing the ratings into 3 categories (unsatisfactory, satisfactory, superior). In addition, we also calculated intraclass correlation coefficients for each item using the raw data and generalizability analysis to calculate the number of raters that would be needed to achieve a desired reliability of 0.95. To ascertain if faculty were able to detect varying levels of performance depicted in the video, an ordinal test of trend on the communication, professionalism, and setting scores was performed.
To assess for rater bias, we were able to use the identifiers on the University of Chicago data to perform a 2‐way analysis of variance (ANOVA) to assess if faculty scores were associated with performance level after controlling for faculty. The results of the faculty rater coefficients and P values in the 2‐way ANOVA were also examined for any evidence of rater bias. All calculations were performed in Stata 11.0 (StataCorp, College Station, TX) with statistical significance defined as P<0.05.
RESULTS
Forty‐seven faculty members (14=site 1; 33=site 2) participated in the validation workshops (2 at the University of Chicago, and 2 at Yale University), which were held in August 2011 and September 2011, providing a total of 172 observations of a possible 191 (90%).
The overall handoff quality ratings for the superior, gold standard video (superior communication, professionalism, and communication) ranged from 7 to 9 with a mean of 8.5 (standard deviation [SD] 0.7). The overall ratings for the video depicting satisfactory communication (satisfactory communication, superior professionalism and setting) ranged from 5 to 9 with a mean of 7.3 (SD 1.1). The overall ratings for the unsatisfactory communication (unsatisfactory communication, superior professionalism and setting) video ranged from 1 to 7 with a mean of 2.6 (SD 1.2). The overall ratings for the satisfactory professionalism video (satisfactory professionalism, superior communication and setting) ranged from 4 to 8 with a mean of 5.7 (SD 1.3). The overall ratings for the unsatisfactory professionalism (unsatisfactory professionalism, superior communication and setting) video ranged from 2 to 5 with a mean of 2.4 (SD 1.03). Finally, the overall ratings for the unsatisfactory setting (unsatisfactory setting, superior communication and professionalism) video ranged from 1 to 8 with a mean of 3.1 (SD 1.7).
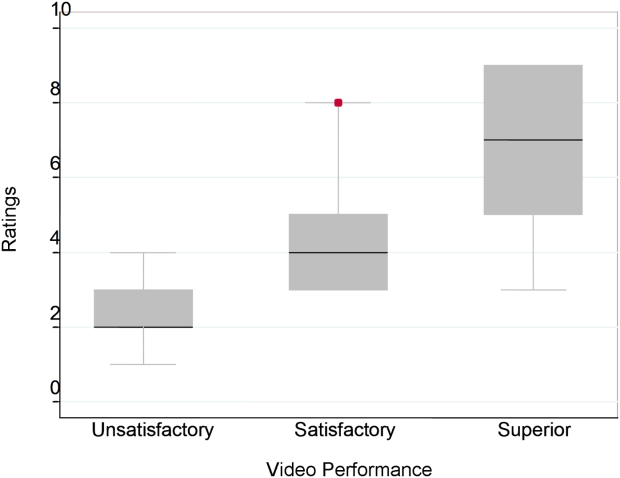
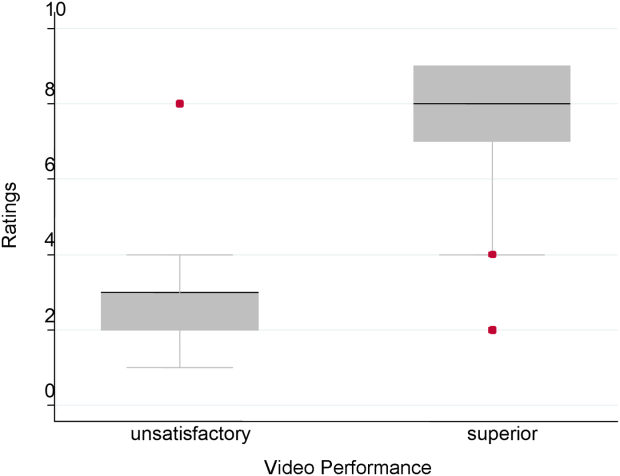
Figure 1 demonstrates that for the domain of communication, the raters were able to discern the unsatisfactory performance but had difficulty reliably distinguishing between superior and satisfactory performance. Figure 2 illustrates that for the domain of professionalism, raters were able to detect the videos' changing levels of performance at the extremes of behavior, with unsatisfactory and superior displays more readily identified. Figure 3 shows that for the domain of setting, the raters were able to discern the unsatisfactory versus superior level of the changing setting. Of note, we also found a moderate significant correlation between ratings of professionalism and communication (r=0.47, P<0.001).

The Cronbach , or measurement of internal reliability and consistency, for the Handoff Mini‐CEX (3 items plus overall) was 0.77, indicating high internal reliability and consistency. Using data from University of Chicago, where raters were labeled with a unique identifier, the Kendall coefficient of concordance was calculated to be 0.79, demonstrating high inter‐rater reliability of the faculty raters. High inter‐rater reliability was also seen using intraclass coefficients for each domain: communication (0.84), professionalism (0.68), setting (0.83), and overall (0.89). Using generalizability analysis, the average reliability was determined to be above 0.9 for all domains (0.99 for overall).
Last, the 2‐way ANOVA (n=75 observations from 13 raters) revealed no evidence of rater bias when examining the coefficient for attending rater (P=0.55 for professionalism, P=0.45 for communication, P=0.92 for setting). The range of scores for each video, however, was broad (Table 2).
| Unsatisfactory | Satisfactory | Superior | ||||||||
|---|---|---|---|---|---|---|---|---|---|---|
| Mean | Median | Range | Mean | Median | Range | Mean | Median | Range | Pb | |
| ||||||||||
| Professionalism | 2.3 | 2 | 14 | 4.4 | 4 | 38 | 7.0 | 7 | 39 | 0.026 |
| Communication | 2.8 | 3 | 16 | 7 | 8 | 59 | 6.6 | 7 | 19 | 0.005 |
| Setting | 3.1 | 3 | 18 | 7.5 | 8 | 29 | 0.005 | |||
DISCUSSION
This study demonstrates that valid conclusions on handoff performance can be drawn using the Handoff CEX as the instrument to rate handoff quality. Utilizing standardized videos depicting varying levels of performance communication, professionalism, and setting, the Handoff Mini‐CEX has demonstrated potential to discern between increasing levels of performance, providing evidence for the construct validity of the instrument.
We observed that faculty could reliably detect unsatisfactory professionalism with ease, and that there was a distinct correlation between faculty ratings and the internally set levels of performance displayed in the videos. This trend demonstrated that faculty were able to discern different levels of professionalism using the Handoff Mini‐CEX. It became more difficult, however, for faculty to detect superior professionalism when the domain of communication was permuted. If the sender of the handoff was professional but the information delivered was disorganized, inaccurate, and missing crucial pieces of information, the faculty perceived this ineffective communication as unprofessional. Prior literature on professionalism has found that communication is a necessary component of professional behavior, and consequently, being a competent communicator is necessary to fulfill ones duty as a professional physician.[15, 16]
This is of note because we did find a moderate significant correlation between ratings of professionalism and communication. It is possible that this distinction would be made clearer with formal rater training in the future prior to any evaluations. However, it is also possible that professionalism and communication, due to a synergistic role between the 2 domains, cannot be separated. If this is the case, it would be important to educate clinicians to present patients in a concise, clear, and accurate way with a professional demeanor. Acknowledging professional responsibility as an integral piece of patient care is also critical in effectively communicating patient information.[5]
We also noted that faculty could detect unsatisfactory communication consistently; however, they were unable to differentiate between satisfactory and superior communication reliably or consistently. Because the unsatisfactory professionalism, unsatisfactory setting, and satisfactory professionalism videos all demonstrated superior communication, we believe that the faculty penalized communication when distractions, in the form of interruptions and rude behavior by the resident giving the handoff, interrupted the flow of the handoff. Thus, the wide ranges in scores observed by some raters may be attributed to this interaction between the Handoff Mini‐CEX domains. In the future, definitions of the anchors, including at the middle spectrum of performance, and rater training may improve the ability of raters to distinguish performance between each domain.
The overall value of the Handoff Mini‐CEX is in its ease of use, in part due to its brevity, as well as evidence for its validity in distinguishing between varying levels of performance. Given the emphasis on monitoring handoff quality and performance, the Handoff Mini‐CEX provides a standard foundation from which baseline handoff performance can be easily measured and improved. Moreover, it can also be used to give individual feedback to a specific practicing clinician on their practices and an opportunity to improve. This is particularly important given current recommendations by the Joint Commission, that handoffs are standardized, and by the ACGME, that residents are competent in handoff skills. Moreover, given the creation of the SHM's handoff recommendations and handoffs as a core competency for hospitalists, the tool provides the ability for hospitalist programs to actually assess their handoff practices as baseline measurements for any quality improvement activities that may take place.
Faculty were able to discern the superior and unsatisfactory levels of setting with ease. After watching and rating the videos, participants said that the chaotic scene of the unsatisfactory setting video had significant authenticity, and that they were constantly interrupted during their own handoffs by pages, phone calls, and people entering the handoff space. System‐level fixes, such as protected time and dedicated space for handoffs, and discouraging pages to be sent during the designated handoff time, could mitigate the reality of unsatisfactory settings.[17, 18]
Our study has several limitations. First, although this study was held at 2 sites, it included a small number of faculty, which can impact the generalizability of our findings. Implementation varied at Yale University and the University of Chicago, preventing use of all data for all analyses. Furthermore, institutional culture may also impact faculty raters' perceptions, so future work aims at repeating our protocol at partner institutions, increasing both the number and diversity of participants. We were also unable to compare the new shorter Handoff Mini‐CEX to the larger 9‐item Handoff CEX in this study.
Despite these limitations, we believe that the Handoff Mini‐CEX, has future potential as an instrument with which to make valid and reliable conclusions about handoff quality, and could be used to both evaluate handoff quality and as an educational tool for trainees and faculty on effective handoff communication.
Disclosures
This work was supported by the National Institute on Aging Short‐Term Aging‐Related Research Program (5T35AG029795), Agency for Healthcare Research and Quality (1 R03HS018278‐01), and the University of Chicago Department of Medicine Excellence in Medical Education Award. Dr. Horwitz is supported by the National Institute on Aging (K08 AG038336) and by the American Federation for Aging Research through the Paul B. Beeson Career Development Award Program. Dr. Arora is funded by National Institute on Aging Career Development Award K23AG033763. Prior presentations of these data include the 2011 Association of American Medical Colleges meeting in Denver, Colorado, the 2012 Association of Program Directors of Internal Medicine meeting in Atlanta, Georgia, and the 2012 Society of General Internal Medicine Meeting in Orlando, Florida.
- , , . The new recommendations on duty hours from the ACGME task force. New Engl J Med. 2010;363(2):e3.
- ACGME common program requirements. Effective July 1, 2011. Available at: http://www.acgme.org/acgmeweb/Portals/0/PDFs/Common_Program_Requirements_07012011[2].pdf. Accessed February 8, 2014.
- , , , , . Consequences of inadequate sign‐out for patient care. Arch Intern Med. 2008;168(16):1755–1760.
- , , , , . Communication failures in patient sign‐out and suggestions for improvement: a critical incident analysis. Qual Saf Healthcare. 2005;14(6):401–407.
- , , , , , . Hospitalist handoffs: a systematic review and task force recommendations. J Hosp Med. 2009;4(7):433–440.
- , . A model for building a standardized hand‐off protocol. Jt Comm J Qual Patient Saf. 2006;32(11):646–655.
- World Health Organization Collaborating Centre for Patient Safety. Solutions on communication during patient hand‐overs. 2007; Volume 1, Solution 1. Available at: http://www.who.int/patientsafety/solutions/patientsafety/PS‐Solution3.pdf. Accessed February 8, 2014.
- , . Patient handoffs: standardized and reliable measurement tools remain elusive. Jt Comm J Qual Patient Saf. 2010;36(2):52–61.
- , , , et al. Development of a handoff evaluation tool for shift‐to‐shift physician handoffs: the handoff CEX. J Hosp Med. 2013;8(4):191–200.
- , , , et al. Hand‐off education and evaluation: piloting the observed simulated hand‐off experience (OSHE). J Gen Intern Med. 2010;25(2):129–134.
- , , , , , . Validation of a handoff tool: the Handoff CEX. J Clin Nurs. 2013;22(9‐10):1477–1486.
- , , , . The mini‐CEX: a method for assessing clinical skills. Ann Intern Med. 2003;138(6):476–481.
- , , , , . Handoff strategies in settings with high consequences for failure: lessons for health care operations. Int J Qual Health Care. 2004;16(2):125–132.
- , , , , . Construct validity of the miniclinical evaluation exercise (miniCEX). Acad Med. 2003;78(8):826–830.
- , , , et al. Third‐year medical students' participation in and perceptions of unprofessional behaviors. Acad Med. 2007;82(10 suppl):S35–S39.
- . Professionalism—the next wave. N Engl J Med. 2006;355(20):2151–2152.
- , , , , . Interns overestimate the effectiveness of their hand‐off communication. Pediatrics. 2010;125(3):491–496.
- , , , , . Characterising physician listening behaviour during hospitalist handoffs using the HEAR checklist. BMJ Qual Saf. 2013;22(3):203–209.
Over the last decade, there has been an unprecedented focus on physician handoffs in US hospitals. One major reason for this are the reductions in residency duty hours that have been mandated by the American Council for Graduate Medical Education (ACGME), first in 2003 and subsequently revised in 2011.[1, 2] As residents work fewer hours, experts believe that potential safety gains from reduced fatigue are countered by an increase in the number of handoffs, which represent a risk due to the potential miscommunication. Prior studies show that critical patient information is often lost or altered during this transfer of clinical information and professional responsibility, which can result in patient harm.[3, 4] As a result of these concerns, the ACGME now requires residency programs to ensure and monitor effective, structured hand‐over processes to facilitate both continuity of care and patient safety. Programs must ensure that residents are competent in communicating with team members in the hand‐over process.[2] Moreover, handoffs have also been a major improvement focus for organizations with broader scope than teaching hospitals, including the World Health Organization, Joint Commission, and the Society for Hospital Medicine (SHM).[5, 6, 7]
Despite this focus on handoffs, monitoring quality of handoffs has proven challenging due to lack of a reliable and validated tool to measure handoff quality. More recently, the Accreditation Council of Graduate Medical Education's introduction of the Next Accreditation System, with its focus on direct observation of clinical skills to achieve milestones, makes it crucial for residency educators to have valid tools to measure competence in handoffs. As a result, it is critical that instruments to measure handoff performance are not only created but also validated.[8]
To help fill this gap, we previously reported on the development of a 9‐item Handoff Clinical Examination Exercise (CEX) assessment tool. The Handoff CEX, designed for use by those participating in the handoff or by a third‐party observer, can be used to rate the quality of patient handoffs in domains such as professionalism and communication skills between the receiver and sender of patient information.[9, 10] Despite prior demonstration of feasibility of use, the initial tool was perceived as lengthy and redundant. In addition, although the tool has been shown to discriminate between performance of novice and expert nurses, the construct validity of this tool has not been established.[11] Establishing construct validity is important to ensuring that the tool can measure the construct in question, namely whether it detects those who are actually competent to perform handoffs safely and effectively. We present here the results of the development of a shorter Handoff Mini‐CEX, along with the formal establishment of its construct validity, namely its ability to distinguish between levels of performance in 3 domains of handoff quality.
METHODS
Adaption of the Handoff CEX and Development of the Abbreviated Tool
The 9‐item Handoff CEX is a paper‐based instrument that was created by the investigators (L.I.H., J.M.F., V.M.A.) to evaluate either the sender or the receiver of handoff communications and has been used in prior studies (see Supporting Information, Appendix 1, in the online version of this article).[9, 10] The evaluation may be conducted by either an observer or by a handoff participant. The instrument includes 6 domains: (1) setting, (2) organization and efficiency, (3) communication skills, (4) content, (5) clinical judgment, and (6) humanistic skills/professionalism. Each domain is graded on a 9‐point rating scale, modeled on the widely used Mini‐CEX (Clinical Evaluation Exercise) for real‐time observation of clinical history and exam skills in internal medicine clerkships and residencies (13=unsatisfactory, 46=marginal/satisfactory, 79=superior).[12] This familiar 9‐point scale is utilized in graduate medical education evaluation of the ACGME core competencies.
To standardize the evaluation, the instrument uses performance‐based anchors for evaluating both the sender and the receiver of the handoff information. The anchors are derived from functional evaluation of the roles of senders and receivers in our preliminary work at both the University of Chicago and Yale University, best practices in other high‐reliability industries, guidelines from the Joint Commission and the SHM, and prior studies of effective communication in clinical systems.[5, 6, 13]
After piloting the Handoff CEX with the University of Chicago's internal medicine residency program (n=280 handoff evaluations), a strong correlation was noted between the measures of content (medical knowledge), patient care, clinical judgment, organization/efficiency, and communication skills. Moreover, the Handoff CEX's Cronbach , or measurement of internal reliability and consistency, was very high (=0.95). Given the potential of redundant items, and to increase ease of use of the instrument, factor analysis was used to reduce the instrument to yield a shorter 3‐item tool, the Handoff Mini‐CEX, that assessed 3 of the initial items: setting, communication skills, and professionalism. Overall, performance on these 3 items were responsible for 82% of the variance of overall sign‐out quality (see Supporting Information, Appendix 2, in the online version of this article).
Establishing Construct Validity of the Handoff Mini‐CEX
To establish construct validity of the Handoff Mini‐CEX, we adapted a protocol used by Holmboe and colleagues to report the construct validity of the Handoff Mini‐CEX, which is based on the development and use of video scenarios depicting varying levels of clinical performance.[14] A clinical scenario script, based on prior observational work, was developed, which represented an internal medicine resident (the sender) signing out 3 different patients to colleagues (intern [postgraduate year 1] and resident). This scenario was developed to explicitly include observable components of professionalism, communication, and setting. Three levels of performancesuperior, satisfactory, and unsatisfactorywere defined and described for the 3 domains. These levels were defined, and separate scripts were written using this information, demonstrating varying levels of performance in each of the domains of interest, using the descriptive anchors of the Handoff Mini‐CEX.
After constructing the superior, or gold standard, script that showcases superior communication, professionalism, and setting, individual domains of performance were changed (eg, to satisfactory or unsatisfactory), while holding the other 2 constant at the superior level of performance. For example, superior communication requires that the sender provides anticipatory guidance and includes clinical rationale, whereas unsatisfactory communication includes vague language about overnight events and a disorganized presentation of patients. Superior professionalism requires no inappropriate comments by the sender about patients, family, and staff as well as a presentation focused on the most urgent patients. Unsatisfactory professionalism is shown by a hurried and inattentive sign‐out, with inappropriate comments about patients, family, and staff. Finally, a superior setting is one in which the receiver is listening attentively and discourages interruptions, whereas an unsatisfactory setting finds the sender or receiver answering pages during the handoff surrounded by background noise. We omitted the satisfactory level for setting due to the difficulties in creating subtleties in the environment.
Permutations of each of these domains resulted in 6 scripts depicting different levels of sender performance (see Supporting Information, Appendix 3, in the online version of this article). Only the performance level of the sender was changed, and the receivers of the handoff performance remained consistent, using best practices for receivers, such as attentive listening, asking questions, reading back, and taking notes during the handoff. The scripts were developed by 2 investigators (V.M.A., S.B.), then reviewed and edited independently by other investigators (J.M.F., P.S.) to achieve consensus. Actors were recruited to perform the video scenarios and were trained by the physician investigators (J.M.F., V.M.A.). The part of the sender was played by a study investigator (P.S.) with prior acting experience, and who had accrued over 40 hours of experience observing handoffs to depict varying levels of handoff performance. The digital video recordings ranged in length from 2.00 minutes to 4.08 minutes. All digital videos were recorded using a Sony XDCAM PMW‐EX3 HD camcorder (Sony Corp., Tokyo, Japan.
Participants
Faculty from the University of Chicago Medical Center and Yale University were included. At the University of Chicago, faculty were recruited to participate via email by the study investigators to the Research in Medical Education (RIME) listhost, which includes program directors, clerkship directors, and medical educators. Two sessions were offered and administered. Continuing medical education (CME) credit was provided for participation, as this workshop was given in conjunction with the RIME CME conference. Evaluations were deidentified using a unique identifier for each rater. At Yale University, the workshop on handoffs was offered as part of 2 seminars for program directors and chief residents from all specialties. During these seminars, program directors and chief residents used anonymous evaluation rating forms that did not capture rater identifiers. No other incentive was provided for participation. Although neither faculty at the University of Chicago nor Yale University received any formal training on handoff evaluation, they did receive a short introduction to the importance of handoffs and the goals of the workshop. The protocol was deemed exempt by the institutional review board at the University of Chicago.
Workshop Protocol
After a brief introduction, faculty viewed the tapes in random order on a projected screen. Participants were instructed to use the Handoff Mini‐CEX to rate whichever element(s) of handoff quality they believed they could suitably evaluate while watching the tapes. The videos were rated on the Handoff Mini‐CEX form, and participants anonymously completed the forms independently without any contact with other participants. The lead investigators proctored all sessions. At University of Chicago, participants viewed and rated all 6 videos over the course of an hour. At Yale University, due to time constraints in the program director and chief resident seminars, participants reviewed 1 of the videos in seminar 1 (unsatisfactory professionalism) and 2 in the other seminar (unsatisfactory communication, unsatisfactory professionalism) (Table 1).
| Unsatisfactory | Satisfactory | Superior | |
|---|---|---|---|
| |||
| Communication | Script 3 (n=36)a | Script 2 (n=13) | Script 1 (n=13) |
| Uses vague language about overnight events, missing critical patient information, disorganized. | Insufficient level of clinical detail, directions are not as thorough, handoff is generally on task and sufficient. | Anticipatory guidance provided, rationale explained; important information is included, highlights sick patients. | |
| Look in the record; I'm sure it's in there. And oh yeah, I need you to check enzymes and finish ruling her out. | So the only thing to do is to check labs; you know, check CBC and cardiac enzymes. | So for today, I need you to check post‐transfusion hemoglobin to make sure it's back to the baseline of 10. If it's under 10, then transfuse her 2 units, but hopefully it will be bumped up. Also continue to check cardiac enzymes; the next set is coming at 2 pm, and we need to continue the rule out. If her enzymes are positive or she has other ECG changes, definitely call the cardio fellow, since they'll want to take her to the CCU. | |
| Professionalism | Script 5 (n=39)a | Script 4 (n=22)a | Script 1 |
| Hurried, inattentive, rushing to leave, inappropriate comments (re: patients, family, staff). | Some tangential comments (re: patients, family, staff). | Appropriate comments (re: patients, family, staff), focused on task. | |
| [D]efinitely call the cards fellow, since they'll want to take her to the CCU. And let me tell you, if you don't call her, she'll rip you a new one. | Let's breeze through them quickly so I can get out of here, I've had a rough day. I'll start with the sickest first, and oh my God she's a train wreck! | ||
| Setting | Script 6 (n=13) | Script 1 | |
| Answering pages during handoff, interruptions (people entering room, phone ringing). | Attentive listening, no interruptions, pager silenced. | ||
Data Collection and Statistical Analysis
Using combined data from University of Chicago and Yale University, descriptive statistics were reported as raw scores on the Handoff Mini‐CEX. To assess internal consistency of the tool, Cronbach was used. To assess inter‐rater reliability of these attending physician ratings on the tool, we performed a Kendall coefficient of concordance analysis after collapsing the ratings into 3 categories (unsatisfactory, satisfactory, superior). In addition, we also calculated intraclass correlation coefficients for each item using the raw data and generalizability analysis to calculate the number of raters that would be needed to achieve a desired reliability of 0.95. To ascertain if faculty were able to detect varying levels of performance depicted in the video, an ordinal test of trend on the communication, professionalism, and setting scores was performed.
To assess for rater bias, we were able to use the identifiers on the University of Chicago data to perform a 2‐way analysis of variance (ANOVA) to assess if faculty scores were associated with performance level after controlling for faculty. The results of the faculty rater coefficients and P values in the 2‐way ANOVA were also examined for any evidence of rater bias. All calculations were performed in Stata 11.0 (StataCorp, College Station, TX) with statistical significance defined as P<0.05.
RESULTS
Forty‐seven faculty members (14=site 1; 33=site 2) participated in the validation workshops (2 at the University of Chicago, and 2 at Yale University), which were held in August 2011 and September 2011, providing a total of 172 observations of a possible 191 (90%).
The overall handoff quality ratings for the superior, gold standard video (superior communication, professionalism, and communication) ranged from 7 to 9 with a mean of 8.5 (standard deviation [SD] 0.7). The overall ratings for the video depicting satisfactory communication (satisfactory communication, superior professionalism and setting) ranged from 5 to 9 with a mean of 7.3 (SD 1.1). The overall ratings for the unsatisfactory communication (unsatisfactory communication, superior professionalism and setting) video ranged from 1 to 7 with a mean of 2.6 (SD 1.2). The overall ratings for the satisfactory professionalism video (satisfactory professionalism, superior communication and setting) ranged from 4 to 8 with a mean of 5.7 (SD 1.3). The overall ratings for the unsatisfactory professionalism (unsatisfactory professionalism, superior communication and setting) video ranged from 2 to 5 with a mean of 2.4 (SD 1.03). Finally, the overall ratings for the unsatisfactory setting (unsatisfactory setting, superior communication and professionalism) video ranged from 1 to 8 with a mean of 3.1 (SD 1.7).
Figure 1 demonstrates that for the domain of communication, the raters were able to discern the unsatisfactory performance but had difficulty reliably distinguishing between superior and satisfactory performance. Figure 2 illustrates that for the domain of professionalism, raters were able to detect the videos' changing levels of performance at the extremes of behavior, with unsatisfactory and superior displays more readily identified. Figure 3 shows that for the domain of setting, the raters were able to discern the unsatisfactory versus superior level of the changing setting. Of note, we also found a moderate significant correlation between ratings of professionalism and communication (r=0.47, P<0.001).
The Cronbach , or measurement of internal reliability and consistency, for the Handoff Mini‐CEX (3 items plus overall) was 0.77, indicating high internal reliability and consistency. Using data from University of Chicago, where raters were labeled with a unique identifier, the Kendall coefficient of concordance was calculated to be 0.79, demonstrating high inter‐rater reliability of the faculty raters. High inter‐rater reliability was also seen using intraclass coefficients for each domain: communication (0.84), professionalism (0.68), setting (0.83), and overall (0.89). Using generalizability analysis, the average reliability was determined to be above 0.9 for all domains (0.99 for overall).
Last, the 2‐way ANOVA (n=75 observations from 13 raters) revealed no evidence of rater bias when examining the coefficient for attending rater (P=0.55 for professionalism, P=0.45 for communication, P=0.92 for setting). The range of scores for each video, however, was broad (Table 2).
| Unsatisfactory | Satisfactory | Superior | ||||||||
|---|---|---|---|---|---|---|---|---|---|---|
| Mean | Median | Range | Mean | Median | Range | Mean | Median | Range | Pb | |
| ||||||||||
| Professionalism | 2.3 | 2 | 14 | 4.4 | 4 | 38 | 7.0 | 7 | 39 | 0.026 |
| Communication | 2.8 | 3 | 16 | 7 | 8 | 59 | 6.6 | 7 | 19 | 0.005 |
| Setting | 3.1 | 3 | 18 | 7.5 | 8 | 29 | 0.005 | |||
DISCUSSION
This study demonstrates that valid conclusions on handoff performance can be drawn using the Handoff CEX as the instrument to rate handoff quality. Utilizing standardized videos depicting varying levels of performance communication, professionalism, and setting, the Handoff Mini‐CEX has demonstrated potential to discern between increasing levels of performance, providing evidence for the construct validity of the instrument.
We observed that faculty could reliably detect unsatisfactory professionalism with ease, and that there was a distinct correlation between faculty ratings and the internally set levels of performance displayed in the videos. This trend demonstrated that faculty were able to discern different levels of professionalism using the Handoff Mini‐CEX. It became more difficult, however, for faculty to detect superior professionalism when the domain of communication was permuted. If the sender of the handoff was professional but the information delivered was disorganized, inaccurate, and missing crucial pieces of information, the faculty perceived this ineffective communication as unprofessional. Prior literature on professionalism has found that communication is a necessary component of professional behavior, and consequently, being a competent communicator is necessary to fulfill ones duty as a professional physician.[15, 16]
This is of note because we did find a moderate significant correlation between ratings of professionalism and communication. It is possible that this distinction would be made clearer with formal rater training in the future prior to any evaluations. However, it is also possible that professionalism and communication, due to a synergistic role between the 2 domains, cannot be separated. If this is the case, it would be important to educate clinicians to present patients in a concise, clear, and accurate way with a professional demeanor. Acknowledging professional responsibility as an integral piece of patient care is also critical in effectively communicating patient information.[5]
We also noted that faculty could detect unsatisfactory communication consistently; however, they were unable to differentiate between satisfactory and superior communication reliably or consistently. Because the unsatisfactory professionalism, unsatisfactory setting, and satisfactory professionalism videos all demonstrated superior communication, we believe that the faculty penalized communication when distractions, in the form of interruptions and rude behavior by the resident giving the handoff, interrupted the flow of the handoff. Thus, the wide ranges in scores observed by some raters may be attributed to this interaction between the Handoff Mini‐CEX domains. In the future, definitions of the anchors, including at the middle spectrum of performance, and rater training may improve the ability of raters to distinguish performance between each domain.
The overall value of the Handoff Mini‐CEX is in its ease of use, in part due to its brevity, as well as evidence for its validity in distinguishing between varying levels of performance. Given the emphasis on monitoring handoff quality and performance, the Handoff Mini‐CEX provides a standard foundation from which baseline handoff performance can be easily measured and improved. Moreover, it can also be used to give individual feedback to a specific practicing clinician on their practices and an opportunity to improve. This is particularly important given current recommendations by the Joint Commission, that handoffs are standardized, and by the ACGME, that residents are competent in handoff skills. Moreover, given the creation of the SHM's handoff recommendations and handoffs as a core competency for hospitalists, the tool provides the ability for hospitalist programs to actually assess their handoff practices as baseline measurements for any quality improvement activities that may take place.
Faculty were able to discern the superior and unsatisfactory levels of setting with ease. After watching and rating the videos, participants said that the chaotic scene of the unsatisfactory setting video had significant authenticity, and that they were constantly interrupted during their own handoffs by pages, phone calls, and people entering the handoff space. System‐level fixes, such as protected time and dedicated space for handoffs, and discouraging pages to be sent during the designated handoff time, could mitigate the reality of unsatisfactory settings.[17, 18]
Our study has several limitations. First, although this study was held at 2 sites, it included a small number of faculty, which can impact the generalizability of our findings. Implementation varied at Yale University and the University of Chicago, preventing use of all data for all analyses. Furthermore, institutional culture may also impact faculty raters' perceptions, so future work aims at repeating our protocol at partner institutions, increasing both the number and diversity of participants. We were also unable to compare the new shorter Handoff Mini‐CEX to the larger 9‐item Handoff CEX in this study.
Despite these limitations, we believe that the Handoff Mini‐CEX, has future potential as an instrument with which to make valid and reliable conclusions about handoff quality, and could be used to both evaluate handoff quality and as an educational tool for trainees and faculty on effective handoff communication.
Disclosures
This work was supported by the National Institute on Aging Short‐Term Aging‐Related Research Program (5T35AG029795), Agency for Healthcare Research and Quality (1 R03HS018278‐01), and the University of Chicago Department of Medicine Excellence in Medical Education Award. Dr. Horwitz is supported by the National Institute on Aging (K08 AG038336) and by the American Federation for Aging Research through the Paul B. Beeson Career Development Award Program. Dr. Arora is funded by National Institute on Aging Career Development Award K23AG033763. Prior presentations of these data include the 2011 Association of American Medical Colleges meeting in Denver, Colorado, the 2012 Association of Program Directors of Internal Medicine meeting in Atlanta, Georgia, and the 2012 Society of General Internal Medicine Meeting in Orlando, Florida.
- , , . The new recommendations on duty hours from the ACGME task force. New Engl J Med. 2010;363(2):e3.
- ACGME common program requirements. Effective July 1, 2011. Available at: http://www.acgme.org/acgmeweb/Portals/0/PDFs/Common_Program_Requirements_07012011[2].pdf. Accessed February 8, 2014.
- , , , , . Consequences of inadequate sign‐out for patient care. Arch Intern Med. 2008;168(16):1755–1760.
- , , , , . Communication failures in patient sign‐out and suggestions for improvement: a critical incident analysis. Qual Saf Healthcare. 2005;14(6):401–407.
- , , , , , . Hospitalist handoffs: a systematic review and task force recommendations. J Hosp Med. 2009;4(7):433–440.
- , . A model for building a standardized hand‐off protocol. Jt Comm J Qual Patient Saf. 2006;32(11):646–655.
- World Health Organization Collaborating Centre for Patient Safety. Solutions on communication during patient hand‐overs. 2007; Volume 1, Solution 1. Available at: http://www.who.int/patientsafety/solutions/patientsafety/PS‐Solution3.pdf. Accessed February 8, 2014.
- , . Patient handoffs: standardized and reliable measurement tools remain elusive. Jt Comm J Qual Patient Saf. 2010;36(2):52–61.
- , , , et al. Development of a handoff evaluation tool for shift‐to‐shift physician handoffs: the handoff CEX. J Hosp Med. 2013;8(4):191–200.
- , , , et al. Hand‐off education and evaluation: piloting the observed simulated hand‐off experience (OSHE). J Gen Intern Med. 2010;25(2):129–134.
- , , , , , . Validation of a handoff tool: the Handoff CEX. J Clin Nurs. 2013;22(9‐10):1477–1486.
- , , , . The mini‐CEX: a method for assessing clinical skills. Ann Intern Med. 2003;138(6):476–481.
- , , , , . Handoff strategies in settings with high consequences for failure: lessons for health care operations. Int J Qual Health Care. 2004;16(2):125–132.
- , , , , . Construct validity of the miniclinical evaluation exercise (miniCEX). Acad Med. 2003;78(8):826–830.
- , , , et al. Third‐year medical students' participation in and perceptions of unprofessional behaviors. Acad Med. 2007;82(10 suppl):S35–S39.
- . Professionalism—the next wave. N Engl J Med. 2006;355(20):2151–2152.
- , , , , . Interns overestimate the effectiveness of their hand‐off communication. Pediatrics. 2010;125(3):491–496.
- , , , , . Characterising physician listening behaviour during hospitalist handoffs using the HEAR checklist. BMJ Qual Saf. 2013;22(3):203–209.
© 2014 Society of Hospital Medicine
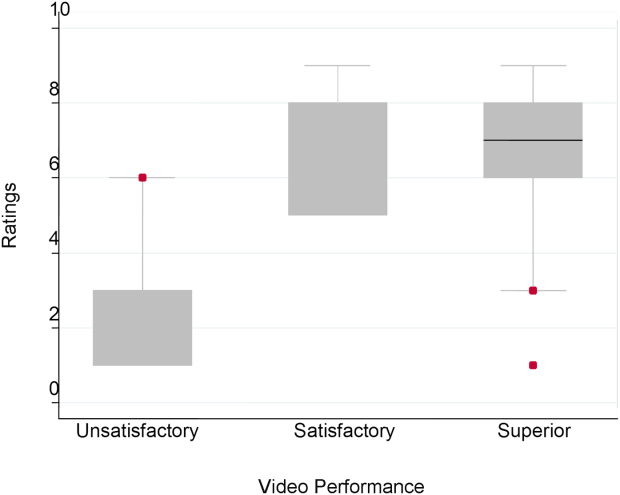
Peer‐Reviewed Journals and Social Media
Only 20 years ago, science from peer‐reviewed journals was still distributed and consumed in the same fashion that evolved from the earliest days of medical science: in print at monthly or weekly intervals. The Internet radically accelerated this paradigm but left the essential processes intact; journals could publish the information and readers could read it more easily, but the basic forums for interaction and discussion over the content remained the same. Enter Web 2.0 and the era of social media. Authors, editors, and readers can now interact easily with each other over the content in real time and across great distances.
Social media may not have changed the way science is produced and reviewed, but it is certainly changing how people consume and use the science. Some have suggested that social media activity around particular articles or journals may be a more important measure of impact than traditional measures of citation,[1] and others have suggested that Twitter activity in particular has changed both the speed and quality of discussion about new studies within the scientific community.[2] In the face of these trends, the Journal of Hospital Medicine (JHM) has decided to develop a bold strategy for leadership in this emerging area, with an initial focus on increasing JHM's activity and visibility on Twitter.
As part of this initial focus, JHM has successfully developed and implemented a protocol for use by authors to compose 2 Tweets describing their publications: the first announces the article's publication (e.g., New evidence on white coats and risk for hospital‐acquired infections), and the second promotes a key point from the article (e.g., Does the doctor's white coat spread hospital infection?). These Tweets are encouraged (but not required) from the corresponding author for every article in every edition, and JHM's editorial staff works with individual authors to refine their message and maximize their impact. To help authors, we have developed several tips for effective tweeting (Table 1).
| 1. Make it short:The limit is 140 characters, but getting retweets requires additional room for others to add their 2 cents, so try to get it under 100 characters. |
| 2. Make it simple: If your tweet includes complex terminology or analytic methods, it is not likely to get picked up. Make it easy to read for the lay public. |
| 3. Make it clear: Your article may have several conclusions, but pick the most newsworthy for the general public. It is usually best to focus on the main finding. |
| 4. Pose a question: Raise interest by piquing the curiosity of potential readers. A good question can motivate readers to click on your article to find the answer. |
| 5. Add a hashtag: Hashtags index tweets on Twitter. It is best to pick 1 or 2 existing tags from the healthcare hashtag project that fit the focus of your article ( |
| 6. Build your following: Include your Twitter handle to alert current/prospective followers of your publication. |
Even after just 1 year of this Twitter‐focused strategy, we are already seeing noteworthy impact and have learned several lessons.
AUTHORS CAN AND WILL GENERATE TWEETS FOR THEIR ARTICLES
When we started asking authors to generate tweets for their articles, Twitter was relatively new, and we were unsure if authors would be willing and able to participate. Since we started, we have noticed a steady increase in the number of author‐generated tweets. Today, more than three‐quarters of tweets per issue are author generated. Anecdotal feedback has been very positive, and authors have expressed interest in the plan for tweeting as well as feedback on how well their tweets were written. If authors or institutions are on Twitter, we also encourage using the Twitter name or handle in the tweet, which serves as a way for others on Twitter to identify directly with the author or institution and often results in greater interest in a particular tweet. Of note, authors have no obligation to become regular users of Twitter or engage with followers of JHM's Twitter feed, but many find themselves following the journal's feed more closely (and responding to posts by other authors) once they have joined Twitter and tweeted about their own work via JHM.
#HASHTAGS MAKE IT HAPPEN
Because Twitter users are a very large crowd of people with diverse interests, it is important to target tweets to the groups that would be most interested in studies. The use of hashtags makes it easy to index tweets. One of the major edits of author‐generated tweets that we provide is to index the articles to the most popular hashtags. For example, medical education studies can be indexed under #meded, which is a popular hashtag for clinician educators. Other important hashtags for hospitalists include #ptsafety, #readmissions, #healthpolicy, #healthcosts, or #infectiousdisease. To select hashtags, we have found the healthcare hashtag directory maintained by Symplur (Upland, CA;
HIGH IMPACT STUDIES MAKE A BIGGER IMPACT ON TWITTER
We observed a high number of retweets and comments about articles that were the most viewed studies on JHM online, referring to Project BOOST (Better Outcomes for Older Adults Through Safe Transitions) and the Society of Hospital Medicine's Choosing Wisely campaign. This is not surprising given the national focus on readmissions as well as cost‐conscious care. Moreover, our experience is in line with observations that Twitter provides an additional source of page views and article downloads for medical journals[3] and research, which demonstrates that studies that are tweeted will eventually be cited more.[4, 5]
TECHNOLOGY STUDIES ARE ADORED BY TWITTER
Studies and research examining the use of smartphones, apps, or social media in healthcare draw a lot of attention on Twitter, particularly from other technophiles in healthcare who often use the #hscm healthcare social media hashtag. Such studies often resonate with Twitter users, who tend to be engaged in technology at a high level and are interested in how to advance the use of technology in the healthcare workplace.
JHM's social media strategy has already been very successful in its early implementation; the JHM twitter feed has >600 followers. Although most authors submit their own tweets (71/117 or 61% of articles over the last year), JHM has also created social media roles for editors to fill in tweets when missing and ensure timely and consistent output from the JHM feed. We have also started a Facebook page, with a rapidly growing number of followers, and we continue to see our social media influence scores rise. In the next year we hope to develop a JHM blog, with invited commentary as well as a process for unsolicited submissions from our readership.
Increasingly, a journal's impact (small i) is measured not only in the traditional metric of impact factor (a representation of the number of papers cited in a given journal publication year), but also by the journal's ability to disseminate knowledge and awareness of issues key to the field. Social media is a major element of the next phase of evidence dissemination, and JHM is pleased to be developing and growing its footprint in the digital world.
- , . Exploring the use of social media to measure journal article impact. AMIA Annu Symp Proc. 2011;2011:374–381.
- . Peer review: trial by Twitter. Nature. 2011;469(7330):286–287.
- , , , . Social media release increases dissemination of original articles in the clinical pain sciences. PLoS One. 2013;8(7):e68914.
- . Can tweets predict citations? Metrics of social impact based on Twitter and correlation with traditional metrics of scientific impact. J Med Internet Res. 2011;13(4):e123.
- , , , . Do altmetrics work? Twitter and ten other social web services. PLoS One. 2013;8(5):e64841.
Only 20 years ago, science from peer‐reviewed journals was still distributed and consumed in the same fashion that evolved from the earliest days of medical science: in print at monthly or weekly intervals. The Internet radically accelerated this paradigm but left the essential processes intact; journals could publish the information and readers could read it more easily, but the basic forums for interaction and discussion over the content remained the same. Enter Web 2.0 and the era of social media. Authors, editors, and readers can now interact easily with each other over the content in real time and across great distances.
Social media may not have changed the way science is produced and reviewed, but it is certainly changing how people consume and use the science. Some have suggested that social media activity around particular articles or journals may be a more important measure of impact than traditional measures of citation,[1] and others have suggested that Twitter activity in particular has changed both the speed and quality of discussion about new studies within the scientific community.[2] In the face of these trends, the Journal of Hospital Medicine (JHM) has decided to develop a bold strategy for leadership in this emerging area, with an initial focus on increasing JHM's activity and visibility on Twitter.
As part of this initial focus, JHM has successfully developed and implemented a protocol for use by authors to compose 2 Tweets describing their publications: the first announces the article's publication (e.g., New evidence on white coats and risk for hospital‐acquired infections), and the second promotes a key point from the article (e.g., Does the doctor's white coat spread hospital infection?). These Tweets are encouraged (but not required) from the corresponding author for every article in every edition, and JHM's editorial staff works with individual authors to refine their message and maximize their impact. To help authors, we have developed several tips for effective tweeting (Table 1).
| 1. Make it short:The limit is 140 characters, but getting retweets requires additional room for others to add their 2 cents, so try to get it under 100 characters. |
| 2. Make it simple: If your tweet includes complex terminology or analytic methods, it is not likely to get picked up. Make it easy to read for the lay public. |
| 3. Make it clear: Your article may have several conclusions, but pick the most newsworthy for the general public. It is usually best to focus on the main finding. |
| 4. Pose a question: Raise interest by piquing the curiosity of potential readers. A good question can motivate readers to click on your article to find the answer. |
| 5. Add a hashtag: Hashtags index tweets on Twitter. It is best to pick 1 or 2 existing tags from the healthcare hashtag project that fit the focus of your article ( |
| 6. Build your following: Include your Twitter handle to alert current/prospective followers of your publication. |
Even after just 1 year of this Twitter‐focused strategy, we are already seeing noteworthy impact and have learned several lessons.
AUTHORS CAN AND WILL GENERATE TWEETS FOR THEIR ARTICLES
When we started asking authors to generate tweets for their articles, Twitter was relatively new, and we were unsure if authors would be willing and able to participate. Since we started, we have noticed a steady increase in the number of author‐generated tweets. Today, more than three‐quarters of tweets per issue are author generated. Anecdotal feedback has been very positive, and authors have expressed interest in the plan for tweeting as well as feedback on how well their tweets were written. If authors or institutions are on Twitter, we also encourage using the Twitter name or handle in the tweet, which serves as a way for others on Twitter to identify directly with the author or institution and often results in greater interest in a particular tweet. Of note, authors have no obligation to become regular users of Twitter or engage with followers of JHM's Twitter feed, but many find themselves following the journal's feed more closely (and responding to posts by other authors) once they have joined Twitter and tweeted about their own work via JHM.
#HASHTAGS MAKE IT HAPPEN
Because Twitter users are a very large crowd of people with diverse interests, it is important to target tweets to the groups that would be most interested in studies. The use of hashtags makes it easy to index tweets. One of the major edits of author‐generated tweets that we provide is to index the articles to the most popular hashtags. For example, medical education studies can be indexed under #meded, which is a popular hashtag for clinician educators. Other important hashtags for hospitalists include #ptsafety, #readmissions, #healthpolicy, #healthcosts, or #infectiousdisease. To select hashtags, we have found the healthcare hashtag directory maintained by Symplur (Upland, CA;
HIGH IMPACT STUDIES MAKE A BIGGER IMPACT ON TWITTER
We observed a high number of retweets and comments about articles that were the most viewed studies on JHM online, referring to Project BOOST (Better Outcomes for Older Adults Through Safe Transitions) and the Society of Hospital Medicine's Choosing Wisely campaign. This is not surprising given the national focus on readmissions as well as cost‐conscious care. Moreover, our experience is in line with observations that Twitter provides an additional source of page views and article downloads for medical journals[3] and research, which demonstrates that studies that are tweeted will eventually be cited more.[4, 5]
TECHNOLOGY STUDIES ARE ADORED BY TWITTER
Studies and research examining the use of smartphones, apps, or social media in healthcare draw a lot of attention on Twitter, particularly from other technophiles in healthcare who often use the #hscm healthcare social media hashtag. Such studies often resonate with Twitter users, who tend to be engaged in technology at a high level and are interested in how to advance the use of technology in the healthcare workplace.
JHM's social media strategy has already been very successful in its early implementation; the JHM twitter feed has >600 followers. Although most authors submit their own tweets (71/117 or 61% of articles over the last year), JHM has also created social media roles for editors to fill in tweets when missing and ensure timely and consistent output from the JHM feed. We have also started a Facebook page, with a rapidly growing number of followers, and we continue to see our social media influence scores rise. In the next year we hope to develop a JHM blog, with invited commentary as well as a process for unsolicited submissions from our readership.
Increasingly, a journal's impact (small i) is measured not only in the traditional metric of impact factor (a representation of the number of papers cited in a given journal publication year), but also by the journal's ability to disseminate knowledge and awareness of issues key to the field. Social media is a major element of the next phase of evidence dissemination, and JHM is pleased to be developing and growing its footprint in the digital world.
- , . Exploring the use of social media to measure journal article impact. AMIA Annu Symp Proc. 2011;2011:374–381.
- . Peer review: trial by Twitter. Nature. 2011;469(7330):286–287.
- , , , . Social media release increases dissemination of original articles in the clinical pain sciences. PLoS One. 2013;8(7):e68914.
- . Can tweets predict citations? Metrics of social impact based on Twitter and correlation with traditional metrics of scientific impact. J Med Internet Res. 2011;13(4):e123.
- , , , . Do altmetrics work? Twitter and ten other social web services. PLoS One. 2013;8(5):e64841.
Time to Introduce Yourself to Patients
At the core of a good physician is mastery of critical communication skills. Good communication establishes rapport and can also heal patients. As communication is an essential ingredient of good physicianship, the recipe starts with a fundamental staplethe physician introduction. The physician introduction is step 2 of Kahn's etiquette‐based medicine checklist to promote good doctoring.[1] Although such rudimentary communication skills are cemented in kindergarten, sadly, more training is needed for doctors. In a recent Journal of Hospital Medicine study, interns failed to introduce themselves in 3 out of 5 inpatient encounters.[2]
Despite waning introductions, increasing importance is being placed on hospitalized patient's knowledge of their treating physician's name and role for patient safety. The Transitions of Care Consensus Policy Statement endorsed by 6 medical societies, including the Society of Hospital Medicine, recommend patients know who their treating physician is while caring for them at every step across the continuum, including hospitalization.[3] The Accreditation Council for Graduate Medical Education requires that patients be informed of who the supervising physician is and understand the roles of any trainees in their care.[4] Last, the death of young Lewis Blackman in South Carolina resulted in state legislation requiring clear identification of physicians and their roles for patients.[5] Given these recommendations, tools to remind physicians to introduce themselves and explain their role to patients are worth consideration. In this issue of the Journal of Hospital Medicine, the effectiveness of 2 interventions using physician photo tools is described.[6, 7]
Even though both studies advance our knowledge on the effectiveness of such interventions, nonrandom variable uptake by physicians represents a major common hurdle. Physician workload, competing priorities, and time pressures prevent physicians from distributing such tools. Consistent adopters of the cards likely already introduce themselves regularly. Interestingly, physicians likely withhold the cards from patients they perceive as unsatisfied, who ironically have the most to gain. System changes, such as increasing handoffs and transient coverage with resident duty hours, can also hamper tool effectiveness through the introduction of more physicians to remember, inherently decreasing the ability of patients to identify their treating physicians.[8]
Patient factors also affect the success of such interventions. Interestingly, patients' baseline ability to identify their physician ranged from 11% to 51% in these studies. Such differences can be readily attributed to previous disparities noted by age, race, gender, and education level in patient recall of their physician.[8] Future work should target interventions for these subgroups, while also accounting for the high prevalence of low health literacy, memory impairment, sleep loss, and poor vision among inpatients, all of which can hamper such interventions.[9, 10]
Although neither intervention improved overall patient satisfaction, patient satisfaction is influenced by a variety of factors unrelated to physician care, such as nursing or the environment. Given the inherent ceiling effect in patient satisfaction metrics, both studies were underpowered to show minor differences. It is also worth noting that complex social interventions depend on their context. Although some patients may enjoy receiving the cards, others may feel that it is not critical to their patient satisfaction. Using a realist evaluation would ask patients what they thought of the cards and why.[11] Like one of the authors, we noted that patients do like the cards, suggesting the problem is not the cards but the metrics of evaluation.[12]
In addition to robust evaluation metrics, future interventions should incorporate patient‐centered approaches to empower patients to ask their doctors about their name and role. With the request coming from patients, doctors are much more likely to comply. Using lessons from marketing and advertising, the hospital is full of artifacts, such as white boards, wristbands, remote controls, and monitors, that can be repurposed to advertise the doctor's name to the patient. Future advances can exploit new mobile technologies and repurpose old ones, such as the hospital television, to remind patients of their care team and other critical information. Regardless of what the future may bring, let's face itintroducing yourself properly to your patients is always good medicine.
- . Etiquette‐based medicine. N Engl J Med. 2008;358(19):1988–1989.
- , , , et al. Do internal medicine interns practice etiquette‐based communication? A critical look at the inpatient encounter. J Hosp Med. 2013;8(11):631–634.
- , , , et al. Transitions of Care Consensus policy statement: American College of Physicians, Society of General Internal Medicine, Society of Hospital Medicine, American Geriatrics Society, American College of Emergency Physicians, and Society for Academic Emergency Medicine. J Hosp Med. 2009;4(6):364–370.
- ACGME Common Program Requirements. Available at: http://www.acgme.org/acgmeweb/Portals/0/PFAssets/ProgramRequirements/CPRs2013.pdf. Accessed November 12, 2013.
- . The Informed Patient. Patients Get Power of Fast Response. Available at: http://online.wsj.com/news/articles/SB10001424052970204047504574384591232799668. Accessed November 12, 2013.
- , , . The impact of facecards on patients' knowledge, satisfaction, trust, and agreement with hospital physicians: a pilot study. J Hosp Med. 2014;9(3):137–141.
- , , . Effect of a face sheet tool on medical team provider identification and family satisfaction. J Hosp Med. 2014;9(3):186–188.
- , , , , , . Ability of hospitalized patients to identify their in‐hospital physicians. Arch Intern Med. 2009;169(2):199–201.
- , , , , . Noise and sleep among adult medical inpatients: far from a quiet night. Arch Intern Med. 2012;172(1):68–70.
- , , , , . More than meets the eye: relationship between low health literacy and poor vision in hospitalized patients. J Health Commun. 2013;18(suppl 1):197–204.
- , . Realist evaluation as a framework for the assessment of teaching about the improvement of care. J Nurs Educ. 2009;48(12):661–667.
- , , , et al. Improving inpatients' identification of their doctors: use of FACE cards. Jt Comm J Qual Patient Saf. 2009;35(12):613–619.
At the core of a good physician is mastery of critical communication skills. Good communication establishes rapport and can also heal patients. As communication is an essential ingredient of good physicianship, the recipe starts with a fundamental staplethe physician introduction. The physician introduction is step 2 of Kahn's etiquette‐based medicine checklist to promote good doctoring.[1] Although such rudimentary communication skills are cemented in kindergarten, sadly, more training is needed for doctors. In a recent Journal of Hospital Medicine study, interns failed to introduce themselves in 3 out of 5 inpatient encounters.[2]
Despite waning introductions, increasing importance is being placed on hospitalized patient's knowledge of their treating physician's name and role for patient safety. The Transitions of Care Consensus Policy Statement endorsed by 6 medical societies, including the Society of Hospital Medicine, recommend patients know who their treating physician is while caring for them at every step across the continuum, including hospitalization.[3] The Accreditation Council for Graduate Medical Education requires that patients be informed of who the supervising physician is and understand the roles of any trainees in their care.[4] Last, the death of young Lewis Blackman in South Carolina resulted in state legislation requiring clear identification of physicians and their roles for patients.[5] Given these recommendations, tools to remind physicians to introduce themselves and explain their role to patients are worth consideration. In this issue of the Journal of Hospital Medicine, the effectiveness of 2 interventions using physician photo tools is described.[6, 7]
Even though both studies advance our knowledge on the effectiveness of such interventions, nonrandom variable uptake by physicians represents a major common hurdle. Physician workload, competing priorities, and time pressures prevent physicians from distributing such tools. Consistent adopters of the cards likely already introduce themselves regularly. Interestingly, physicians likely withhold the cards from patients they perceive as unsatisfied, who ironically have the most to gain. System changes, such as increasing handoffs and transient coverage with resident duty hours, can also hamper tool effectiveness through the introduction of more physicians to remember, inherently decreasing the ability of patients to identify their treating physicians.[8]
Patient factors also affect the success of such interventions. Interestingly, patients' baseline ability to identify their physician ranged from 11% to 51% in these studies. Such differences can be readily attributed to previous disparities noted by age, race, gender, and education level in patient recall of their physician.[8] Future work should target interventions for these subgroups, while also accounting for the high prevalence of low health literacy, memory impairment, sleep loss, and poor vision among inpatients, all of which can hamper such interventions.[9, 10]
Although neither intervention improved overall patient satisfaction, patient satisfaction is influenced by a variety of factors unrelated to physician care, such as nursing or the environment. Given the inherent ceiling effect in patient satisfaction metrics, both studies were underpowered to show minor differences. It is also worth noting that complex social interventions depend on their context. Although some patients may enjoy receiving the cards, others may feel that it is not critical to their patient satisfaction. Using a realist evaluation would ask patients what they thought of the cards and why.[11] Like one of the authors, we noted that patients do like the cards, suggesting the problem is not the cards but the metrics of evaluation.[12]
In addition to robust evaluation metrics, future interventions should incorporate patient‐centered approaches to empower patients to ask their doctors about their name and role. With the request coming from patients, doctors are much more likely to comply. Using lessons from marketing and advertising, the hospital is full of artifacts, such as white boards, wristbands, remote controls, and monitors, that can be repurposed to advertise the doctor's name to the patient. Future advances can exploit new mobile technologies and repurpose old ones, such as the hospital television, to remind patients of their care team and other critical information. Regardless of what the future may bring, let's face itintroducing yourself properly to your patients is always good medicine.
- . Etiquette‐based medicine. N Engl J Med. 2008;358(19):1988–1989.
- , , , et al. Do internal medicine interns practice etiquette‐based communication? A critical look at the inpatient encounter. J Hosp Med. 2013;8(11):631–634.
- , , , et al. Transitions of Care Consensus policy statement: American College of Physicians, Society of General Internal Medicine, Society of Hospital Medicine, American Geriatrics Society, American College of Emergency Physicians, and Society for Academic Emergency Medicine. J Hosp Med. 2009;4(6):364–370.
- ACGME Common Program Requirements. Available at: http://www.acgme.org/acgmeweb/Portals/0/PFAssets/ProgramRequirements/CPRs2013.pdf. Accessed November 12, 2013.
- . The Informed Patient. Patients Get Power of Fast Response. Available at: http://online.wsj.com/news/articles/SB10001424052970204047504574384591232799668. Accessed November 12, 2013.
- , , . The impact of facecards on patients' knowledge, satisfaction, trust, and agreement with hospital physicians: a pilot study. J Hosp Med. 2014;9(3):137–141.
- , , . Effect of a face sheet tool on medical team provider identification and family satisfaction. J Hosp Med. 2014;9(3):186–188.
- , , , , , . Ability of hospitalized patients to identify their in‐hospital physicians. Arch Intern Med. 2009;169(2):199–201.
- , , , , . Noise and sleep among adult medical inpatients: far from a quiet night. Arch Intern Med. 2012;172(1):68–70.
- , , , , . More than meets the eye: relationship between low health literacy and poor vision in hospitalized patients. J Health Commun. 2013;18(suppl 1):197–204.
- , . Realist evaluation as a framework for the assessment of teaching about the improvement of care. J Nurs Educ. 2009;48(12):661–667.
- , , , et al. Improving inpatients' identification of their doctors: use of FACE cards. Jt Comm J Qual Patient Saf. 2009;35(12):613–619.
Promoting Professionalism
Unprofessional behavior in the inpatient setting has the potential to impact care delivery and the quality of trainee's educational experience. These behaviors, from disparaging colleagues to blocking admissions, can negatively impact the learning environment. The learning environment or conditions created by the patient care team's actions play a critical role in the development of trainees.[1, 2] The rising presence of hospitalists in the inpatient setting raises the question of how their actions impact the learning environment. Professional behavior has been defined as a core competency for hospitalists by the Society of Hospital Medicine.[3] Professional behavior of all team members, from faculty to trainee, can impact the learning environment and patient safety.[4, 5] However, few educational materials exist to train faculty and housestaff on recognizing and ameliorating unprofessional behaviors.
A prior assessment regarding hospitalists' lapses in professionalism identified scenarios that demonstrated increased participation by hospitalists at 3 institutions.[6] Participants reported observation or participation in specific unprofessional behaviors and rated their perception of these behaviors. Additional work within those residency environments demonstrated that residents' perceptions of and participation in these behaviors increased throughout training, with environmental characteristics, specifically faculty behavior, influencing trainee professional development and acclimation of these behaviors.[7, 8]
Although overall participation in egregious behavior was low, resident participation in 3 categories of unprofessional behavior increased during internship. Those scenarios included disparaging the emergency room or primary care physician for missed findings or management decisions, blocking or not taking admissions appropriate for the service in question, and misrepresenting a test as urgent to expedite obtaining the test. We developed our intervention focused on these areas to address professionalism lapses that occur during internship. Our earlier work showed faculty role models influenced trainee behavior. For this reason, we provided education to both residents and hospitalists to maximize the impact of the intervention.
We present here a novel, interactive, video‐based workshop curriculum for faculty and trainees that aims to illustrate unprofessional behaviors and outlines the role faculty may play in promoting such behaviors. In addition, we review the result of postworkshop evaluation on intent to change behavior and satisfaction.
METHODS
A grant from the American Board of Internal Medicine Foundation supported this project. The working group that resulted, the Chicago Professional Practice Project and Outcomes, included faculty representation from 3 Chicago‐area hospitals: the University of Chicago, Northwestern University, and NorthShore University HealthSystem. Academic hospitalists at these sites were invited to participate. Each site also has an internal medicine residency program in which hospitalists were expected to attend the teaching service. Given this, resident trainees at all participating sites, and 1 community teaching affiliate program (Mercy Hospital and Medical Center) where academic hospitalists at the University of Chicago rotate, were recruited for participation. Faculty champions were identified for each site, and 1 internal and external faculty representative from the working group served to debrief and facilitate. Trainee workshops were administered by 1 internal and external collaborator, and for the community site, 2 external faculty members. Workshops were held during established educational conference times, and lunch was provided.
Scripts highlighting each of the behaviors identified in the prior survey were developed and peer reviewed for clarity and face validity across the 3 sites. Medical student and resident actors were trained utilizing the finalized scripts, and a performance artist affiliated with the Screen Actors Guild assisted in their preparation for filming. All videos were filmed at the University of Chicago Pritzker School of Medicine Clinical Performance Center. The final videos ranged in length from 4 to 7 minutes and included title, cast, and funding source. As an example, 1 video highlighted the unprofessional behavior of misrepresenting a test as urgent to prioritize one's patient in the queue. This video included a resident, intern, and attending on inpatient rounds during which the resident encouraged the intern to misrepresent the patient's status to expedite obtaining the study and facilitate the patient's discharge. The resident stressed that he would be in the clinic and had many patients to see, highlighting the impact of workload on unprofessional behavior, and aggressively persuaded the intern to sell her test to have it performed the same day. When this occurred, the attending applauded the intern for her strong work.
A moderator guide and debriefing tools were developed to facilitate discussion. The duration of each of the workshops was approximately 60 minutes. After welcoming remarks, participants were provided tools to utilize during the viewing of each video. These checklists noted the roles of those depicted in the video, asked to identify positive or negative behaviors displayed, and included questions regarding how behaviors could be detrimental and how the situation could have been prevented. After viewing the videos, participants divided into small groups to discuss the individual exhibiting the unprofessional behavior, their perceived motivation for said behavior, and its impact on the team culture and patient care. Following a small‐group discussion, large‐group debriefing was performed, addressing the barriers and facilitators to professional behavior. Two videos were shown at each workshop, and participants completed a postworkshop evaluation. Videos chosen for viewing were based upon preworkshop survey results that highlighted areas of concern at that specific site.
Postworkshop paper‐based evaluations assessed participants' perception of displayed behaviors on a Likert‐type scale (1=unprofessional to 5=professional) utilizing items validated in prior work,[6, 7, 8] their level of agreement regarding the impact of video‐based exercises, and intent to change behavior using a Likert‐type scale (1=strongly disagree to 5=strongly agree). A constructed‐response section for comments regarding their experience was included. Descriptive statistics and Wilcoxon rank sum analyses were performed.
RESULTS
Forty‐four academic hospitalist faculty members (44/83; 53%) and 244 resident trainees (244/356; 68%) participated. When queried regarding their perception of the displayed behaviors in the videos, nearly 100% of faculty and trainees felt disparaging the emergency department or primary care physician for missed findings or clinical decisions was somewhat unprofessional or unprofessional. Ninety percent of hospitalists and 93% of trainees rated celebrating a blocked admission as somewhat unprofessional or unprofessional (Table 1).
| Behavior | Faculty Rated as Unprofessional or Somewhat Unprofessional (n = 44) | Housestaff Rated as Unprofessional or Somewhat Unprofessional (n=244) |
|---|---|---|
| ||
| Disparaging the ED/PCP to colleagues for findings later discovered on the floor or patient care management decisions | 95.6% | 97.5% |
| Refusing an admission that could be considered appropriate for your service (eg, blocking) | 86.4% | 95.1% |
| Celebrating a blocked admission | 90.1% | 93.0% |
| Ordering a routine test as urgent to get it expedited | 77.2% | 80.3% |
The scenarios portrayed were well received, with more than 85% of faculty and trainees agreeing that the behaviors displayed were realistic. Those who perceived videos as very realistic were more likely to report intent to change behavior (93% vs 53%, P=0.01). Nearly two‐thirds of faculty and 67% of housestaff expressed agreement that they intended to change behavior based upon the experience (Table 2).
| Evaluation Item | Faculty Level of Agreement (StronglyAgree or Agree) (n=44) | Housestaff Level of Agreement (Strongly Agree or Agree) (n=244) |
|---|---|---|
| The scenarios portrayed in the videos were realistic | 86.4% | 86.9% |
| I will change my behavior as a result of this exercise | 65.9% | 67.2% |
| I feel that this was a useful and effective exercise | 65.9% | 77.1% |
Qualitative comments in the constructed‐response portion of the evaluation noted the effectiveness of the interactive materials. In addition, the need for focused faculty development was identified by 1 respondent who stated: If unprofessional behavior is the unwritten curriculum, there needs to be an explicit, written curriculum to address it. Finally, the aim of facilitating self‐reflection is echoed in this faculty respondent's comment: Always good to be reminded of our behaviors and the influence they have on others and from this resident physician It helps to re‐evaluate how you talk to people.
CONCLUSIONS
Faculty can be a large determinant of the learning environment and impact trainees' professional development.[9] Hospitalists should be encouraged to embrace faculty role‐modeling of effective professional behaviors, especially given their increased presence in the inpatient learning environment. In addition, resident trainees and their behaviors contribute to the learning environment and influence the further professional development of more junior trainees.[10] Targeting professionalism education toward previously identified and prevalent unprofessional behaviors in the inpatient care of patients may serve to affect the most change among providers who practice in this setting. Individualized assessment of the learning environment may aid in identifying common scenarios that may plague a specific learning culture, allowing for relevant and targeted discussion of factors that promote and perpetuate such behaviors.[11]
Interactive, video‐based modules provided an effective way to promote interactive reflection and robust discussion. This model of experiential learning is an effective form of professional development as it engages the learner and stimulates ongoing incorporation of the topics addressed.[12, 13] Creating a shared concrete experience among targeted learners, using the video‐based scenarios, stimulates reflective observation, and ultimately experimentation, or incorporation into practice.[14]
There are several limitations to our evaluation including that we focused solely on academic hospitalist programs, and our sample size for faculty and residents was small. Also, we only addressed a small, though representative, sample of unprofessional behaviors and have not yet linked intervention to actual behavior change. Finally, the script scenarios that we used in this study were not previously published as they were created specifically for this intervention. Validity evidence for these scenarios include that they were based upon the results of earlier work from our institutions and underwent thorough peer review for content and clarity. Further studies will be required to do this. However, we do believe that these are positive findings for utilizing this type of interactive curriculum for professionalism education to promote self‐reflection and behavior change.
Video‐based professionalism education is a feasible, interactive mechanism to encourage self‐reflection and intent to change behavior among faculty and resident physicians. Future study is underway to conduct longitudinal assessments of the learning environments at the participating institutions to assess culture change, perceptions of behaviors, and sustainability of this type of intervention.
Disclosures: The authors acknowledge funding from the American Board of Internal Medicine. The funders had no role in the design of the study; the collection, analysis, and interpretation of the data; or the decision to approve publication of the finished manuscript. Results from this work have been presented at the Midwest Society of General Internal Medicine Regional Meeting, Chicago, Illinois, September 2011; Midwest Society of Hospital Medicine Regional Meeting, Chicago, Illinois, October 2011, and Society of Hospital Medicine Annual Meeting, San Diego, California, April 2012. The authors declare that they do not have any conflicts of interest to disclose.
- Liaison Committee on Medical Education. Functions and structure of a medical school. Available at: http://www.lcme.org/functions.pdf. Accessed October 10, 2012.
- , , , , . Residents' perceptions of their own professionalism and the professionalism of their learning environment. J Grad Med Educ. 2009;1:208–215.
- Society of Hospital Medicine. The core competencies in hospital medicine. http://www.hospitalmedicine.org/Content/NavigationMenu/Education/CoreCurriculum/Core_Competencies.htm. Accessed October 10, 2012.
- The Joint Commission. Behaviors that undermine a culture of safety. Sentinel Event Alert. 2008;(40):1–3. http://www.jointcommission.org/assets/1/18/SEA_40.pdf. Accessed October 10, 2012.
- , . A survey of the impact of disruptive behaviors and communication defects on patient safety. Jt Comm J Qual Patient Saf. 2008;34:464–471.
- , , , et al. Participation in unprofessional behaviors among hospitalists: a multicenter study. J Hosp Med. 2012;7(7):543–550.
- , , et al. Participation in and perceptions of unprofessional behaviors among incoming internal medicine interns. JAMA. 2008;300:1132–1134.
- , , , et al., Changes in perception of and participation in unprofessional behaviors during internship. Acad Med. 2010;85:S76–S80.
- , , , et al. Perspective: beyond counting hours: the importance of supervision, professionalism, transitions of care, and workload in residency training. Acad Med. 2012;87(7):883–888.
- , . The role of the student‐teacher relationship in the formation of physicians: the hidden curriculum as process. J Gen Intern Med. 2006;21:S16–S20.
- , , , et al. Evidence for validity of a survey to measure the learning environment for professionalism. Med Teach. 2011;33(12):e683–e688.
- . Experiential Learning: Experience as the Source of Learning and Development. Englewood Cliffs, NJ: Prentice Hall; 1984.
- , . How can physicians' learning style drive educational planning? Acad Med. 2005;80:680–84.
- , . Twenty years of experience using trigger films as a teaching tool. Acad Med. 2001;76:656–658.
Unprofessional behavior in the inpatient setting has the potential to impact care delivery and the quality of trainee's educational experience. These behaviors, from disparaging colleagues to blocking admissions, can negatively impact the learning environment. The learning environment or conditions created by the patient care team's actions play a critical role in the development of trainees.[1, 2] The rising presence of hospitalists in the inpatient setting raises the question of how their actions impact the learning environment. Professional behavior has been defined as a core competency for hospitalists by the Society of Hospital Medicine.[3] Professional behavior of all team members, from faculty to trainee, can impact the learning environment and patient safety.[4, 5] However, few educational materials exist to train faculty and housestaff on recognizing and ameliorating unprofessional behaviors.
A prior assessment regarding hospitalists' lapses in professionalism identified scenarios that demonstrated increased participation by hospitalists at 3 institutions.[6] Participants reported observation or participation in specific unprofessional behaviors and rated their perception of these behaviors. Additional work within those residency environments demonstrated that residents' perceptions of and participation in these behaviors increased throughout training, with environmental characteristics, specifically faculty behavior, influencing trainee professional development and acclimation of these behaviors.[7, 8]
Although overall participation in egregious behavior was low, resident participation in 3 categories of unprofessional behavior increased during internship. Those scenarios included disparaging the emergency room or primary care physician for missed findings or management decisions, blocking or not taking admissions appropriate for the service in question, and misrepresenting a test as urgent to expedite obtaining the test. We developed our intervention focused on these areas to address professionalism lapses that occur during internship. Our earlier work showed faculty role models influenced trainee behavior. For this reason, we provided education to both residents and hospitalists to maximize the impact of the intervention.
We present here a novel, interactive, video‐based workshop curriculum for faculty and trainees that aims to illustrate unprofessional behaviors and outlines the role faculty may play in promoting such behaviors. In addition, we review the result of postworkshop evaluation on intent to change behavior and satisfaction.
METHODS
A grant from the American Board of Internal Medicine Foundation supported this project. The working group that resulted, the Chicago Professional Practice Project and Outcomes, included faculty representation from 3 Chicago‐area hospitals: the University of Chicago, Northwestern University, and NorthShore University HealthSystem. Academic hospitalists at these sites were invited to participate. Each site also has an internal medicine residency program in which hospitalists were expected to attend the teaching service. Given this, resident trainees at all participating sites, and 1 community teaching affiliate program (Mercy Hospital and Medical Center) where academic hospitalists at the University of Chicago rotate, were recruited for participation. Faculty champions were identified for each site, and 1 internal and external faculty representative from the working group served to debrief and facilitate. Trainee workshops were administered by 1 internal and external collaborator, and for the community site, 2 external faculty members. Workshops were held during established educational conference times, and lunch was provided.
Scripts highlighting each of the behaviors identified in the prior survey were developed and peer reviewed for clarity and face validity across the 3 sites. Medical student and resident actors were trained utilizing the finalized scripts, and a performance artist affiliated with the Screen Actors Guild assisted in their preparation for filming. All videos were filmed at the University of Chicago Pritzker School of Medicine Clinical Performance Center. The final videos ranged in length from 4 to 7 minutes and included title, cast, and funding source. As an example, 1 video highlighted the unprofessional behavior of misrepresenting a test as urgent to prioritize one's patient in the queue. This video included a resident, intern, and attending on inpatient rounds during which the resident encouraged the intern to misrepresent the patient's status to expedite obtaining the study and facilitate the patient's discharge. The resident stressed that he would be in the clinic and had many patients to see, highlighting the impact of workload on unprofessional behavior, and aggressively persuaded the intern to sell her test to have it performed the same day. When this occurred, the attending applauded the intern for her strong work.
A moderator guide and debriefing tools were developed to facilitate discussion. The duration of each of the workshops was approximately 60 minutes. After welcoming remarks, participants were provided tools to utilize during the viewing of each video. These checklists noted the roles of those depicted in the video, asked to identify positive or negative behaviors displayed, and included questions regarding how behaviors could be detrimental and how the situation could have been prevented. After viewing the videos, participants divided into small groups to discuss the individual exhibiting the unprofessional behavior, their perceived motivation for said behavior, and its impact on the team culture and patient care. Following a small‐group discussion, large‐group debriefing was performed, addressing the barriers and facilitators to professional behavior. Two videos were shown at each workshop, and participants completed a postworkshop evaluation. Videos chosen for viewing were based upon preworkshop survey results that highlighted areas of concern at that specific site.
Postworkshop paper‐based evaluations assessed participants' perception of displayed behaviors on a Likert‐type scale (1=unprofessional to 5=professional) utilizing items validated in prior work,[6, 7, 8] their level of agreement regarding the impact of video‐based exercises, and intent to change behavior using a Likert‐type scale (1=strongly disagree to 5=strongly agree). A constructed‐response section for comments regarding their experience was included. Descriptive statistics and Wilcoxon rank sum analyses were performed.
RESULTS
Forty‐four academic hospitalist faculty members (44/83; 53%) and 244 resident trainees (244/356; 68%) participated. When queried regarding their perception of the displayed behaviors in the videos, nearly 100% of faculty and trainees felt disparaging the emergency department or primary care physician for missed findings or clinical decisions was somewhat unprofessional or unprofessional. Ninety percent of hospitalists and 93% of trainees rated celebrating a blocked admission as somewhat unprofessional or unprofessional (Table 1).
| Behavior | Faculty Rated as Unprofessional or Somewhat Unprofessional (n = 44) | Housestaff Rated as Unprofessional or Somewhat Unprofessional (n=244) |
|---|---|---|
| ||
| Disparaging the ED/PCP to colleagues for findings later discovered on the floor or patient care management decisions | 95.6% | 97.5% |
| Refusing an admission that could be considered appropriate for your service (eg, blocking) | 86.4% | 95.1% |
| Celebrating a blocked admission | 90.1% | 93.0% |
| Ordering a routine test as urgent to get it expedited | 77.2% | 80.3% |
The scenarios portrayed were well received, with more than 85% of faculty and trainees agreeing that the behaviors displayed were realistic. Those who perceived videos as very realistic were more likely to report intent to change behavior (93% vs 53%, P=0.01). Nearly two‐thirds of faculty and 67% of housestaff expressed agreement that they intended to change behavior based upon the experience (Table 2).
| Evaluation Item | Faculty Level of Agreement (StronglyAgree or Agree) (n=44) | Housestaff Level of Agreement (Strongly Agree or Agree) (n=244) |
|---|---|---|
| The scenarios portrayed in the videos were realistic | 86.4% | 86.9% |
| I will change my behavior as a result of this exercise | 65.9% | 67.2% |
| I feel that this was a useful and effective exercise | 65.9% | 77.1% |
Qualitative comments in the constructed‐response portion of the evaluation noted the effectiveness of the interactive materials. In addition, the need for focused faculty development was identified by 1 respondent who stated: If unprofessional behavior is the unwritten curriculum, there needs to be an explicit, written curriculum to address it. Finally, the aim of facilitating self‐reflection is echoed in this faculty respondent's comment: Always good to be reminded of our behaviors and the influence they have on others and from this resident physician It helps to re‐evaluate how you talk to people.
CONCLUSIONS
Faculty can be a large determinant of the learning environment and impact trainees' professional development.[9] Hospitalists should be encouraged to embrace faculty role‐modeling of effective professional behaviors, especially given their increased presence in the inpatient learning environment. In addition, resident trainees and their behaviors contribute to the learning environment and influence the further professional development of more junior trainees.[10] Targeting professionalism education toward previously identified and prevalent unprofessional behaviors in the inpatient care of patients may serve to affect the most change among providers who practice in this setting. Individualized assessment of the learning environment may aid in identifying common scenarios that may plague a specific learning culture, allowing for relevant and targeted discussion of factors that promote and perpetuate such behaviors.[11]
Interactive, video‐based modules provided an effective way to promote interactive reflection and robust discussion. This model of experiential learning is an effective form of professional development as it engages the learner and stimulates ongoing incorporation of the topics addressed.[12, 13] Creating a shared concrete experience among targeted learners, using the video‐based scenarios, stimulates reflective observation, and ultimately experimentation, or incorporation into practice.[14]
There are several limitations to our evaluation including that we focused solely on academic hospitalist programs, and our sample size for faculty and residents was small. Also, we only addressed a small, though representative, sample of unprofessional behaviors and have not yet linked intervention to actual behavior change. Finally, the script scenarios that we used in this study were not previously published as they were created specifically for this intervention. Validity evidence for these scenarios include that they were based upon the results of earlier work from our institutions and underwent thorough peer review for content and clarity. Further studies will be required to do this. However, we do believe that these are positive findings for utilizing this type of interactive curriculum for professionalism education to promote self‐reflection and behavior change.
Video‐based professionalism education is a feasible, interactive mechanism to encourage self‐reflection and intent to change behavior among faculty and resident physicians. Future study is underway to conduct longitudinal assessments of the learning environments at the participating institutions to assess culture change, perceptions of behaviors, and sustainability of this type of intervention.
Disclosures: The authors acknowledge funding from the American Board of Internal Medicine. The funders had no role in the design of the study; the collection, analysis, and interpretation of the data; or the decision to approve publication of the finished manuscript. Results from this work have been presented at the Midwest Society of General Internal Medicine Regional Meeting, Chicago, Illinois, September 2011; Midwest Society of Hospital Medicine Regional Meeting, Chicago, Illinois, October 2011, and Society of Hospital Medicine Annual Meeting, San Diego, California, April 2012. The authors declare that they do not have any conflicts of interest to disclose.
- Liaison Committee on Medical Education. Functions and structure of a medical school. Available at: http://www.lcme.org/functions.pdf. Accessed October 10, 2012.
- , , , , . Residents' perceptions of their own professionalism and the professionalism of their learning environment. J Grad Med Educ. 2009;1:208–215.
- Society of Hospital Medicine. The core competencies in hospital medicine. http://www.hospitalmedicine.org/Content/NavigationMenu/Education/CoreCurriculum/Core_Competencies.htm. Accessed October 10, 2012.
- The Joint Commission. Behaviors that undermine a culture of safety. Sentinel Event Alert. 2008;(40):1–3. http://www.jointcommission.org/assets/1/18/SEA_40.pdf. Accessed October 10, 2012.
- , . A survey of the impact of disruptive behaviors and communication defects on patient safety. Jt Comm J Qual Patient Saf. 2008;34:464–471.
- , , , et al. Participation in unprofessional behaviors among hospitalists: a multicenter study. J Hosp Med. 2012;7(7):543–550.
- , , et al. Participation in and perceptions of unprofessional behaviors among incoming internal medicine interns. JAMA. 2008;300:1132–1134.
- , , , et al., Changes in perception of and participation in unprofessional behaviors during internship. Acad Med. 2010;85:S76–S80.
- , , , et al. Perspective: beyond counting hours: the importance of supervision, professionalism, transitions of care, and workload in residency training. Acad Med. 2012;87(7):883–888.
- , . The role of the student‐teacher relationship in the formation of physicians: the hidden curriculum as process. J Gen Intern Med. 2006;21:S16–S20.
- , , , et al. Evidence for validity of a survey to measure the learning environment for professionalism. Med Teach. 2011;33(12):e683–e688.
- . Experiential Learning: Experience as the Source of Learning and Development. Englewood Cliffs, NJ: Prentice Hall; 1984.
- , . How can physicians' learning style drive educational planning? Acad Med. 2005;80:680–84.
- , . Twenty years of experience using trigger films as a teaching tool. Acad Med. 2001;76:656–658.
Hospitalist Teaching Rounds for FUTURE
The implementation of resident duty hour restrictions has created a clinical learning environment on the wards quite different from any previous era. The Accreditation Council for Graduate Medical Education issued its first set of regulations limiting consecutive hours worked for residents in 2003, and further restricted hours in 2011.[1] These restrictions have had many implications across several aspects of patient care, education, and clinical training, particularly for hospitalists who spend the majority of their time in this setting and are heavily involved in undergraduate and graduate clinical education in academic medical centers.[2, 3]
As learning environments have been shifting, so has the composition of learners. The Millennial Generation (or Generation Y), defined as those born approximately between 1980 and 2000, represents those young clinicians currently filling the halls of medical schools and ranks of residency and fellowship programs.[4] Interestingly, the current system of restricted work hours is the only system under which the Millennial Generation has ever trained.
As this new generation represents the bulk of current trainees, hospitalist faculty must consider how their teaching styles can be adapted to accommodate these learners. For teaching hospitalists, an approach that considers the learning environment as affected by duty hours, as well as the preferences of Millennial learners, is necessary to educate the next generation of trainees. This article aimed to introduce potential strategies for hospitalists to better align teaching on the wards with the preferences of Millennial learners under the constraints of residency duty hours.
THE NEWEST GENERATION OF LEARNERS
The Millennial Generation has been well described.[4, 5, 6, 7, 8, 9, 10] Broadly speaking, this generation is thought to have been raised by attentive and involved parents, influencing relationships with educators and mentors; they respect authority but do not hesitate to question the relevance of assignments or decisions. Millennials prefer structured learning environments that focus heavily on interaction and experiential learning, and they value design and appearance in how material is presented.[7] Millennials also seek clear expectations and immediate feedback on their performance, and though they have sometimes been criticized for a strong sense of entitlement, they have a strong desire for collaboration and group‐based activity.[5, 6]
One of the most notable and defining characteristics of the Millennial Generation is an affinity for technology and innovation.[7, 8, 9] Web‐based learning tools that are interactive and engaging, such as blogs, podcasts, or streaming videos are familiar and favored methods of learning. Millennials are skilled at finding information and providing answers and data, but may need help with synthesis and application.[5] They take pride in their ability to multitask, but can be prone to doing so inappropriately, particularly with technology that is readily available.[11]
Few studies have explored characteristics of the Millennial Generation specific to medical trainees. One study examined personality characteristics of Millennial medical students compared to Generation X students (those born from 19651980) at a single institution. Millennial students scored higher on warmth, reasoning, emotional stability, rule consciousness, social boldness, sensitivity, apprehension, openness to change, and perfectionism compared to Generation X students. They scored lower on measures for self‐reliance.[12] Additionally, when motives for behavior were studied, Millennial medical students scored higher on needs for affiliation and achievement, and lower on needs for power.[13]
DUTY HOURS: A GENERATION APART
As noted previously, the Millennial Generation is the first to train exclusively in the era of duty hours restrictions. The oldest members of this generation, those born in 1981, were entering medical school at the time of the first duty hours restrictions in 2003, and thus have always been educated, trained, and practiced in an environment in which work hours were an essential part of residency training.
Though duty hours have been an omnipresent part of training for the Millennial Generation, the clinical learning environment that they have known continues to evolve and change. Time for teaching, in particular, has been especially strained by work hour limits, and this has been noted by both attending physicians and trainees with each iteration of work hours limits. Attendings in one study estimated that time spent teaching on general medicine wards was reduced by about 20% following the 2003 limits, and over 40% of residents in a national survey reported that the 2011 limits had worsened the quality of education.[14, 15]
GENERATIONAL STRATEGIES FOR SUCCESS FOR HOSPITALIST TEACHING ATTENDINGS
The time limitations imposed by duty hours restrictions have compelled teaching rounds to become more patient‐care centered and often less learner‐centered, as providing patient care becomes the prime obligation for this limited time period. Millennial learners are accustomed to being the center of attention in educational environments, and changing the focus from education to patient care in the wards setting may be an abrupt transition for some learners.[6] However, hospitalists can help restructure teaching opportunities on the clinical wards by using teaching methods of the highest value to Millennial learners to promote learning under the conditions of duty hours limitations.
An approach using these methods was developed by reviewing recent literature as well as educational innovations that have been presented at scholarly meetings (eg, Sal Khan's presentation at the 2012 Association of American Medical Colleges meeting).[16] The authors discussed potential teaching techniques that were thought to be feasible to implement in the context of the current learning environment, with consideration of learning theories that would be most effective for the target group of learners (eg, adult learning theory).[17] A mnemonic was created to consolidate strategies thought to best represent these techniques. FUTURE is a group of teaching strategies that can be used by hospitalists to improve teaching rounds by Flipping the Wards, Using Documentation to Teach, Technology‐Enabled Teaching, Using Guerilla Teaching Tactics, Rainy Day Teaching, and Embedding Teaching Moments into Rounds.
Flipping the Wards
Millennial learners prefer novel methods of delivery that are interactive and technology based.[7, 8, 9] Lectures and slide‐based presentations frequently do not feature the degree of interactive engagement that they seek, and methods such as case‐based presentations and simulation may be more suitable. The Khan Academy is a not‐for‐profit organization that has been proposed as a model for future directions for medical education.[18] The academy's global classroom houses over 4000 videos and interactive modules to allow students to progress through topics on their own time.[19] Teaching rounds can be similarly flipped such that discussion and group work take place during rounds, whereas lectures, modules, and reading are reserved for individual study.[18]
As time pressures shift the focus of rounds exclusively toward discussion of patient‐care tasks, finding time for teaching outside of rounds can be emphasized to inspire self‐directed learning. When residents need time to tend to immediate patient‐care issues, hospitalist attendings could take the time to search for articles to send to team members. Rather than distributing paper copies that may be lost, cloud‐based data management systems such as Dropbox (Dropbox, San Francisco, CA) or Google Drive (Google Inc., Mountain View, CA) can be used to disseminate articles, which can be pulled up in real time on mobile devices during rounds and later deposited in shared folders accessible to all team members.[20, 21] The advantage of this approach is that it does not require all learners to be present on rounds, which may not be possible with duty hours.
Using Documentation to Teach
Trainees report that one of the most desirable attributes of clinical teachers is when they delineate their clinical reasoning and thought process.[22] Similarly, Millennial learners specifically desire to understand the rationale behind their teachers' actions.[6] Documentation in the medical chart or electronic health record (EHR) can be used to enhance teaching and role‐model clinical reasoning in a transparent and readily available fashion.
Billing requirements necessitate daily attending documentation in the form of an attestation. Hospitalist attendings can use attestations to model thought process and clinical synthesis in the daily assessment of a patient. For example, an attestation one‐liner can be used to concisely summarize the patient's course or highlight the most pressing issue of the day, rather than simply serve as a placeholder for billing or agree with above in reference to housestaff documentation. This practice can demonstrate to residents how to write a short snapshot of a patient's care in addition to improving communication.
Additionally, the EHR can be a useful platform to guide feedback for residents on their clinical performance. Millennial learners prefer specific, immediate feedback, and trainee documentation can serve as a template to show examples of good documentation and clinical reasoning as well as areas needing improvement.[5] These tangible examples of clinical performance are specific and understandable for trainees to guide their self‐learning and improvement.
Technology‐Enabled Teaching
Using technology wisely on the wards can improve efficiency while also taking advantage of teaching methods familiar to Millennial learners. Technology can be used in a positive manner to keep the focus on the patient and enhance teaching when time is limited on rounds. Smartphones and tablets have become an omnipresent part of the clinical environment.[23] Rather than distracting from rounds, these tools can be used to answer clinical questions in real time, thus directly linking the question to the patient's care.
The EHR is a powerful technological resource that is readily available to enhance teaching during a busy ward schedule. Clinical information is electronically accessible at all hours for both trainees and attendings, rather than only at prespecified times on daily rounds, and the Millennial Generation is accustomed to receiving and sharing information in this fashion.[24] Technology platforms that enable simultaneous sharing of information among multiple members of a team can also be used to assist in sharing clinical information in this manner. Health Insurance Portability and Accountability Act‐compliant group text‐messaging applications for smartphones and tablets such as GroupMD (GroupMD, San Francisco, CA) allow members of a team to connect through 1 portal.[25] These discussions can foster communication, inspire clinical questions, and model the practice of timely response to new information.
Using Guerilla Teaching Tactics
Though time may be limited by work hours, there are opportunities embedded into clinical practice to create teaching moments. The principle of guerilla marketing uses unconventional marketing tactics in everyday locales to aggressively promote a product.[26] Similarly, guerilla teaching might be employed on rounds to make teaching points about common patient care issues that occur at nearly every room, such as Foley catheters after seeing one at the beside or hand hygiene after leaving a room. These types of topics are familiar to trainees as well as hospitalist attendings and fulfill the relevance that Millennial learners seek by easily applying them to the patient at hand.
Memory triggers or checklists are another way to systematically introduce guerilla teaching on commonplace topics. The IBCD checklist, for example, has been successfully implemented at our institution to promote adherence to 4 quality measures.[27] IBCD, which stands for immunizations, bedsores, catheters, and deep vein thrombosis prophylaxis, is easily and quickly tacked on as a checklist item at the end of the problem list during a presentation. Similar checklists can serve as teaching points on quality and safety in inpatient care, as well as reminders to consider these issues for every patient.
Rainy Day Teaching
Hospitalist teaching attendings recognize that duty hours have shifted the preferred time for teaching away from busy admission periods such as postcall rounds.[28] The limited time spent reviewing new admissions is now often focused on patient care issues, with much of the discussion eliminated. However, hospitalist attendings can be proactive and save certain teaching moments for rainy day teaching, anticipating topics to introduce during lower census times. Additionally, attending access to the EHRs allows attendings to preview cases the residents have admitted during a call period and may facilitate planning teaching topics for future opportunities.[23]
Though teaching is an essential part of the hospitalist teaching attending role, the Millennial Generation's affinity for teamwork makes it possible to utilize additional team members as teachers for the group. This type of distribution of responsibility, or outsourcing of teaching, can be done in the form of a teaching or float resident. These individuals can be directed to search the literature to answer clinical questions the team may have during rounds and report back, which may influence decision making and patient care as well as provide education.[29]
Embedding Teaching Moments Into Rounds
Dr. Francis W. Peabody may have been addressing students many generations removed from Millennial learners when he implored them to remember that the secret of the care of the patient is in caring for the patient, but his maxim still rings true today.[30] This advice provides an important insight on how the focus can be kept on the patient by emphasizing physical examination and history‐taking skills, which engages learners in hands‐on activity and grounds that education in a patient‐based experience.[31] The Stanford 25 represents a successful project that refocuses the doctorpatient encounter on the bedside.[32] Using a Web‐based platform, this initiative instructs on 25 physical examination maneuvers, utilizing teaching methods that are familiar to Millennial learners and are patient focused.
In addition to emphasizing bedside teaching, smaller moments can be used during rounds to establish an expectation for learning. Hospitalist attendings can create a routine with daily teaching moments, such as an electrocardiogram or a daily Medical Knowledge Self‐Assessment Program question, a source of internal medicine board preparation material published by the American College of Physicians.[33] These are opportunities to inject a quick educational moment that is easily relatable to the patients on the team's service. Using teaching moments that are routine, accessible, and relevant to patient care can help shape Millennial learners' expectations that teaching be a daily occurrence interwoven within clinical care provided during rounds.
There are several limitations to our work. These strategies do not represent a systematic review, and there is little evidence to support that our approach is more effective than conventional teaching methods. Though we address hospitalists specifically, these strategies are likely suitable for all inpatient educators as they have not been well studied in specific groups. With the paucity of literature regarding learning preferences of Millennial medical trainees, it is difficult to know what methods may truly be most desirable in the wards setting, as many of the needs and learning styles considered in our approach are borrowed from other more traditional learning environments. It is unclear how adoptable our strategies may be for educators from other generations; these faculty may have different approaches to teaching. Further research is necessary to identify areas for faculty development in learning new techniques as well as compare the efficacy of our approach to conventional methods with respect to standardized educational outcomes such as In‐Training Exam performance, as well as patient outcomes.
ACCEPTING THE CHALLENGE
The landscape of clinical teaching has shifted considerably in recent years, in both the makeup of learners for whom educators are responsible for teaching as well as the challenges in teaching under the duty hours restrictions. Though rounds are more focused on patient care than in the past, it is possible to work within the current structure to promote successful learning with an approach that considers the preferences of today's learners.
A hospitalist's natural habitat, the busy inpatient wards, is a clinical learning environment with rich potential for innovation and excellence in teaching. The challenges in practicing hospital medicine closely parallel the challenges in teaching under the constraints of duty hours restrictions; both require a creative approach to problem solving and an affinity for teamwork. The hospitalist community is well suited to not only meet these challenges but become leaders in embracing how to teach effectively on today's wards. Maximizing interaction, embracing technology, and encouraging group‐based learning may represent the keys to a successful approach to teaching the Millennial Generation in a post‐duty hours world.
- , , ; ACGME Duty Hour Task Force. The new recommendations on duty hours from the ACGME Task Force. N Engl J Med. 2010;363(2):e3.
- , . The emerging role of “hospitalists” in the American health care system. N Engl J Med. 1996;335(7):514–517.
- , , , et al. Hospital medicine in the internal medicine clerkship: results from a national survey. J Hosp Med. 2012;7(7):557–561.
- , . Millennials Rising: The Next Great Generation. New York, NY: Random House/Vintage Books; 2000.
- Eckleberry‐Hunt J, Tucciarone J. The challenges and opportunities of teaching “Generation Y.” J Grad Med Educ.2011;3(4):458–461.
- . Generational changes and their impact in the classroom: teaching Generation Me. Med Educ. 2009;43(5):398–405.
- , , . Twelve tips for facilitating Millennials' learning. Med Teach. 2012;34(4):274–278.
- Pew Research Center. Millennials: a portrait of generation next. Available at: http://pewsocialtrends.org/files/2010/10/millennials‐confident‐connected‐open‐to‐change.pdf. Accessed February 28, 2013.
- , , , et al. Generational influences in academic emergency medicine: teaching and learning, mentoring, and technology (part I). Acad Emerg Med. 2011;18(2):190–199.
- , , , et al. Generational influences in academic emergency medicine: structure, function, and culture (part II). Acad Emerg Med. 2011;18(2):200–207.
- , , , . Smartphone use during inpatient attending rounds: prevalence, patterns, and potential for distraction. J Hosp Med. 2012;8:595–599.
- , , , et al. Comparing millennial and generation X medical students at one medical school. Acad Med. 2006;81(6):571–576.
- , , , . Differences in motives between Millennial and Generation X students. Med Educ. 2010;44(6):570–576.
- , . Effect of ACGME duty hours on attending physician teaching and satisfaction. Arch Intern Med. 2008;168(11):1226–1227.
- , , . Residents' response to duty‐hours regulations—a follow‐up national survey. N Engl J Med. 2012; 366(24):e35.
- . Innovation arc: new approaches. Presented at: Association of American Colleges of Medicine National Meeting; November 2012; San Francisco, CA.
- , . Learner‐centered approaches in medical education. BMJ. 1999;318:1280–1283.
- , . Lecture halls without lectures—a proposal for medical education. N Engl J Med. 2012;366(18):1657–1659.
- The Khan Academy. Available at: https://www.khanacademy.org/. Accessed March 4, 2013.
- Dropbox. Dropbox Inc. Available at: https://www.dropbox.com/. Accessed April 19, 2013.
- Google Drive. Google Inc. Available at: https://drive.google.com/. Accessed April 19, 2013.
- , , , et al. What makes a good clinical teacher in medicine? A review of the literature. Acad Med. 2008;83(5):452–466.
- . Smartphones in clinical practice, medical education, and research. Arch Intern Med. 2011;171(14):1294–1296.
- , , , et al. Attending use of the electronic health record (EHR) and implications for housestaff supervision. Presented at: Midwest Society of General Internal Medicine Regional Meeting; September 2012; Chicago, IL.
- GroupMD. GroupMD Inc. Available at http://group.md. Accessed April 19, 2013.
- . Guerilla Marketing: Secrets for Making Big Profits From Your Small Business. Boston, MA: Houghton Mifflin; 1984.
- , , , et al. IBCD: development and testing of a checklist to improve quality of care for hospitalized general medical patients. Jt Comm J Qual Patient Saf. 2013;39(4):147–156.
- , . Ice cream rounds. Acad Med. 2013;88(1):66.
- , , , et al. The impact of evidence on physicians' inpatient treatment decisions. J Gen Intern Med. 2004; 19(5 pt 1):402–409.
- . Landmark article March 19, 1927: the care of the patient. By Francis W. Peabody. JAMA. 1984;252(6):813–818.
- , , , et al. The art of bedside rounds: a multi‐center qualitative study of strategies used by experienced bedside teachers. J Gen Intern Med. 2013;28(3):412–420.
- Stanford University School of Medicine. Stanford Medicine 25. Available at: http://stanfordmedicine25.stanford.edu/. Accessed February 28, 2013.
- Medical Knowledge Self‐Assessment Program 16. The American College of Physicians. Available at: https://mksap.acponline.org. Accessed April 19, 2013.
The implementation of resident duty hour restrictions has created a clinical learning environment on the wards quite different from any previous era. The Accreditation Council for Graduate Medical Education issued its first set of regulations limiting consecutive hours worked for residents in 2003, and further restricted hours in 2011.[1] These restrictions have had many implications across several aspects of patient care, education, and clinical training, particularly for hospitalists who spend the majority of their time in this setting and are heavily involved in undergraduate and graduate clinical education in academic medical centers.[2, 3]
As learning environments have been shifting, so has the composition of learners. The Millennial Generation (or Generation Y), defined as those born approximately between 1980 and 2000, represents those young clinicians currently filling the halls of medical schools and ranks of residency and fellowship programs.[4] Interestingly, the current system of restricted work hours is the only system under which the Millennial Generation has ever trained.
As this new generation represents the bulk of current trainees, hospitalist faculty must consider how their teaching styles can be adapted to accommodate these learners. For teaching hospitalists, an approach that considers the learning environment as affected by duty hours, as well as the preferences of Millennial learners, is necessary to educate the next generation of trainees. This article aimed to introduce potential strategies for hospitalists to better align teaching on the wards with the preferences of Millennial learners under the constraints of residency duty hours.
THE NEWEST GENERATION OF LEARNERS
The Millennial Generation has been well described.[4, 5, 6, 7, 8, 9, 10] Broadly speaking, this generation is thought to have been raised by attentive and involved parents, influencing relationships with educators and mentors; they respect authority but do not hesitate to question the relevance of assignments or decisions. Millennials prefer structured learning environments that focus heavily on interaction and experiential learning, and they value design and appearance in how material is presented.[7] Millennials also seek clear expectations and immediate feedback on their performance, and though they have sometimes been criticized for a strong sense of entitlement, they have a strong desire for collaboration and group‐based activity.[5, 6]
One of the most notable and defining characteristics of the Millennial Generation is an affinity for technology and innovation.[7, 8, 9] Web‐based learning tools that are interactive and engaging, such as blogs, podcasts, or streaming videos are familiar and favored methods of learning. Millennials are skilled at finding information and providing answers and data, but may need help with synthesis and application.[5] They take pride in their ability to multitask, but can be prone to doing so inappropriately, particularly with technology that is readily available.[11]
Few studies have explored characteristics of the Millennial Generation specific to medical trainees. One study examined personality characteristics of Millennial medical students compared to Generation X students (those born from 19651980) at a single institution. Millennial students scored higher on warmth, reasoning, emotional stability, rule consciousness, social boldness, sensitivity, apprehension, openness to change, and perfectionism compared to Generation X students. They scored lower on measures for self‐reliance.[12] Additionally, when motives for behavior were studied, Millennial medical students scored higher on needs for affiliation and achievement, and lower on needs for power.[13]
DUTY HOURS: A GENERATION APART
As noted previously, the Millennial Generation is the first to train exclusively in the era of duty hours restrictions. The oldest members of this generation, those born in 1981, were entering medical school at the time of the first duty hours restrictions in 2003, and thus have always been educated, trained, and practiced in an environment in which work hours were an essential part of residency training.
Though duty hours have been an omnipresent part of training for the Millennial Generation, the clinical learning environment that they have known continues to evolve and change. Time for teaching, in particular, has been especially strained by work hour limits, and this has been noted by both attending physicians and trainees with each iteration of work hours limits. Attendings in one study estimated that time spent teaching on general medicine wards was reduced by about 20% following the 2003 limits, and over 40% of residents in a national survey reported that the 2011 limits had worsened the quality of education.[14, 15]
GENERATIONAL STRATEGIES FOR SUCCESS FOR HOSPITALIST TEACHING ATTENDINGS
The time limitations imposed by duty hours restrictions have compelled teaching rounds to become more patient‐care centered and often less learner‐centered, as providing patient care becomes the prime obligation for this limited time period. Millennial learners are accustomed to being the center of attention in educational environments, and changing the focus from education to patient care in the wards setting may be an abrupt transition for some learners.[6] However, hospitalists can help restructure teaching opportunities on the clinical wards by using teaching methods of the highest value to Millennial learners to promote learning under the conditions of duty hours limitations.
An approach using these methods was developed by reviewing recent literature as well as educational innovations that have been presented at scholarly meetings (eg, Sal Khan's presentation at the 2012 Association of American Medical Colleges meeting).[16] The authors discussed potential teaching techniques that were thought to be feasible to implement in the context of the current learning environment, with consideration of learning theories that would be most effective for the target group of learners (eg, adult learning theory).[17] A mnemonic was created to consolidate strategies thought to best represent these techniques. FUTURE is a group of teaching strategies that can be used by hospitalists to improve teaching rounds by Flipping the Wards, Using Documentation to Teach, Technology‐Enabled Teaching, Using Guerilla Teaching Tactics, Rainy Day Teaching, and Embedding Teaching Moments into Rounds.
Flipping the Wards
Millennial learners prefer novel methods of delivery that are interactive and technology based.[7, 8, 9] Lectures and slide‐based presentations frequently do not feature the degree of interactive engagement that they seek, and methods such as case‐based presentations and simulation may be more suitable. The Khan Academy is a not‐for‐profit organization that has been proposed as a model for future directions for medical education.[18] The academy's global classroom houses over 4000 videos and interactive modules to allow students to progress through topics on their own time.[19] Teaching rounds can be similarly flipped such that discussion and group work take place during rounds, whereas lectures, modules, and reading are reserved for individual study.[18]
As time pressures shift the focus of rounds exclusively toward discussion of patient‐care tasks, finding time for teaching outside of rounds can be emphasized to inspire self‐directed learning. When residents need time to tend to immediate patient‐care issues, hospitalist attendings could take the time to search for articles to send to team members. Rather than distributing paper copies that may be lost, cloud‐based data management systems such as Dropbox (Dropbox, San Francisco, CA) or Google Drive (Google Inc., Mountain View, CA) can be used to disseminate articles, which can be pulled up in real time on mobile devices during rounds and later deposited in shared folders accessible to all team members.[20, 21] The advantage of this approach is that it does not require all learners to be present on rounds, which may not be possible with duty hours.
Using Documentation to Teach
Trainees report that one of the most desirable attributes of clinical teachers is when they delineate their clinical reasoning and thought process.[22] Similarly, Millennial learners specifically desire to understand the rationale behind their teachers' actions.[6] Documentation in the medical chart or electronic health record (EHR) can be used to enhance teaching and role‐model clinical reasoning in a transparent and readily available fashion.
Billing requirements necessitate daily attending documentation in the form of an attestation. Hospitalist attendings can use attestations to model thought process and clinical synthesis in the daily assessment of a patient. For example, an attestation one‐liner can be used to concisely summarize the patient's course or highlight the most pressing issue of the day, rather than simply serve as a placeholder for billing or agree with above in reference to housestaff documentation. This practice can demonstrate to residents how to write a short snapshot of a patient's care in addition to improving communication.
Additionally, the EHR can be a useful platform to guide feedback for residents on their clinical performance. Millennial learners prefer specific, immediate feedback, and trainee documentation can serve as a template to show examples of good documentation and clinical reasoning as well as areas needing improvement.[5] These tangible examples of clinical performance are specific and understandable for trainees to guide their self‐learning and improvement.
Technology‐Enabled Teaching
Using technology wisely on the wards can improve efficiency while also taking advantage of teaching methods familiar to Millennial learners. Technology can be used in a positive manner to keep the focus on the patient and enhance teaching when time is limited on rounds. Smartphones and tablets have become an omnipresent part of the clinical environment.[23] Rather than distracting from rounds, these tools can be used to answer clinical questions in real time, thus directly linking the question to the patient's care.
The EHR is a powerful technological resource that is readily available to enhance teaching during a busy ward schedule. Clinical information is electronically accessible at all hours for both trainees and attendings, rather than only at prespecified times on daily rounds, and the Millennial Generation is accustomed to receiving and sharing information in this fashion.[24] Technology platforms that enable simultaneous sharing of information among multiple members of a team can also be used to assist in sharing clinical information in this manner. Health Insurance Portability and Accountability Act‐compliant group text‐messaging applications for smartphones and tablets such as GroupMD (GroupMD, San Francisco, CA) allow members of a team to connect through 1 portal.[25] These discussions can foster communication, inspire clinical questions, and model the practice of timely response to new information.
Using Guerilla Teaching Tactics
Though time may be limited by work hours, there are opportunities embedded into clinical practice to create teaching moments. The principle of guerilla marketing uses unconventional marketing tactics in everyday locales to aggressively promote a product.[26] Similarly, guerilla teaching might be employed on rounds to make teaching points about common patient care issues that occur at nearly every room, such as Foley catheters after seeing one at the beside or hand hygiene after leaving a room. These types of topics are familiar to trainees as well as hospitalist attendings and fulfill the relevance that Millennial learners seek by easily applying them to the patient at hand.
Memory triggers or checklists are another way to systematically introduce guerilla teaching on commonplace topics. The IBCD checklist, for example, has been successfully implemented at our institution to promote adherence to 4 quality measures.[27] IBCD, which stands for immunizations, bedsores, catheters, and deep vein thrombosis prophylaxis, is easily and quickly tacked on as a checklist item at the end of the problem list during a presentation. Similar checklists can serve as teaching points on quality and safety in inpatient care, as well as reminders to consider these issues for every patient.
Rainy Day Teaching
Hospitalist teaching attendings recognize that duty hours have shifted the preferred time for teaching away from busy admission periods such as postcall rounds.[28] The limited time spent reviewing new admissions is now often focused on patient care issues, with much of the discussion eliminated. However, hospitalist attendings can be proactive and save certain teaching moments for rainy day teaching, anticipating topics to introduce during lower census times. Additionally, attending access to the EHRs allows attendings to preview cases the residents have admitted during a call period and may facilitate planning teaching topics for future opportunities.[23]
Though teaching is an essential part of the hospitalist teaching attending role, the Millennial Generation's affinity for teamwork makes it possible to utilize additional team members as teachers for the group. This type of distribution of responsibility, or outsourcing of teaching, can be done in the form of a teaching or float resident. These individuals can be directed to search the literature to answer clinical questions the team may have during rounds and report back, which may influence decision making and patient care as well as provide education.[29]
Embedding Teaching Moments Into Rounds
Dr. Francis W. Peabody may have been addressing students many generations removed from Millennial learners when he implored them to remember that the secret of the care of the patient is in caring for the patient, but his maxim still rings true today.[30] This advice provides an important insight on how the focus can be kept on the patient by emphasizing physical examination and history‐taking skills, which engages learners in hands‐on activity and grounds that education in a patient‐based experience.[31] The Stanford 25 represents a successful project that refocuses the doctorpatient encounter on the bedside.[32] Using a Web‐based platform, this initiative instructs on 25 physical examination maneuvers, utilizing teaching methods that are familiar to Millennial learners and are patient focused.
In addition to emphasizing bedside teaching, smaller moments can be used during rounds to establish an expectation for learning. Hospitalist attendings can create a routine with daily teaching moments, such as an electrocardiogram or a daily Medical Knowledge Self‐Assessment Program question, a source of internal medicine board preparation material published by the American College of Physicians.[33] These are opportunities to inject a quick educational moment that is easily relatable to the patients on the team's service. Using teaching moments that are routine, accessible, and relevant to patient care can help shape Millennial learners' expectations that teaching be a daily occurrence interwoven within clinical care provided during rounds.
There are several limitations to our work. These strategies do not represent a systematic review, and there is little evidence to support that our approach is more effective than conventional teaching methods. Though we address hospitalists specifically, these strategies are likely suitable for all inpatient educators as they have not been well studied in specific groups. With the paucity of literature regarding learning preferences of Millennial medical trainees, it is difficult to know what methods may truly be most desirable in the wards setting, as many of the needs and learning styles considered in our approach are borrowed from other more traditional learning environments. It is unclear how adoptable our strategies may be for educators from other generations; these faculty may have different approaches to teaching. Further research is necessary to identify areas for faculty development in learning new techniques as well as compare the efficacy of our approach to conventional methods with respect to standardized educational outcomes such as In‐Training Exam performance, as well as patient outcomes.
ACCEPTING THE CHALLENGE
The landscape of clinical teaching has shifted considerably in recent years, in both the makeup of learners for whom educators are responsible for teaching as well as the challenges in teaching under the duty hours restrictions. Though rounds are more focused on patient care than in the past, it is possible to work within the current structure to promote successful learning with an approach that considers the preferences of today's learners.
A hospitalist's natural habitat, the busy inpatient wards, is a clinical learning environment with rich potential for innovation and excellence in teaching. The challenges in practicing hospital medicine closely parallel the challenges in teaching under the constraints of duty hours restrictions; both require a creative approach to problem solving and an affinity for teamwork. The hospitalist community is well suited to not only meet these challenges but become leaders in embracing how to teach effectively on today's wards. Maximizing interaction, embracing technology, and encouraging group‐based learning may represent the keys to a successful approach to teaching the Millennial Generation in a post‐duty hours world.
- , , ; ACGME Duty Hour Task Force. The new recommendations on duty hours from the ACGME Task Force. N Engl J Med. 2010;363(2):e3.
- , . The emerging role of “hospitalists” in the American health care system. N Engl J Med. 1996;335(7):514–517.
- , , , et al. Hospital medicine in the internal medicine clerkship: results from a national survey. J Hosp Med. 2012;7(7):557–561.
- , . Millennials Rising: The Next Great Generation. New York, NY: Random House/Vintage Books; 2000.
- Eckleberry‐Hunt J, Tucciarone J. The challenges and opportunities of teaching “Generation Y.” J Grad Med Educ.2011;3(4):458–461.
- . Generational changes and their impact in the classroom: teaching Generation Me. Med Educ. 2009;43(5):398–405.
- , , . Twelve tips for facilitating Millennials' learning. Med Teach. 2012;34(4):274–278.
- Pew Research Center. Millennials: a portrait of generation next. Available at: http://pewsocialtrends.org/files/2010/10/millennials‐confident‐connected‐open‐to‐change.pdf. Accessed February 28, 2013.
- , , , et al. Generational influences in academic emergency medicine: teaching and learning, mentoring, and technology (part I). Acad Emerg Med. 2011;18(2):190–199.
- , , , et al. Generational influences in academic emergency medicine: structure, function, and culture (part II). Acad Emerg Med. 2011;18(2):200–207.
- , , , . Smartphone use during inpatient attending rounds: prevalence, patterns, and potential for distraction. J Hosp Med. 2012;8:595–599.
- , , , et al. Comparing millennial and generation X medical students at one medical school. Acad Med. 2006;81(6):571–576.
- , , , . Differences in motives between Millennial and Generation X students. Med Educ. 2010;44(6):570–576.
- , . Effect of ACGME duty hours on attending physician teaching and satisfaction. Arch Intern Med. 2008;168(11):1226–1227.
- , , . Residents' response to duty‐hours regulations—a follow‐up national survey. N Engl J Med. 2012; 366(24):e35.
- . Innovation arc: new approaches. Presented at: Association of American Colleges of Medicine National Meeting; November 2012; San Francisco, CA.
- , . Learner‐centered approaches in medical education. BMJ. 1999;318:1280–1283.
- , . Lecture halls without lectures—a proposal for medical education. N Engl J Med. 2012;366(18):1657–1659.
- The Khan Academy. Available at: https://www.khanacademy.org/. Accessed March 4, 2013.
- Dropbox. Dropbox Inc. Available at: https://www.dropbox.com/. Accessed April 19, 2013.
- Google Drive. Google Inc. Available at: https://drive.google.com/. Accessed April 19, 2013.
- , , , et al. What makes a good clinical teacher in medicine? A review of the literature. Acad Med. 2008;83(5):452–466.
- . Smartphones in clinical practice, medical education, and research. Arch Intern Med. 2011;171(14):1294–1296.
- , , , et al. Attending use of the electronic health record (EHR) and implications for housestaff supervision. Presented at: Midwest Society of General Internal Medicine Regional Meeting; September 2012; Chicago, IL.
- GroupMD. GroupMD Inc. Available at http://group.md. Accessed April 19, 2013.
- . Guerilla Marketing: Secrets for Making Big Profits From Your Small Business. Boston, MA: Houghton Mifflin; 1984.
- , , , et al. IBCD: development and testing of a checklist to improve quality of care for hospitalized general medical patients. Jt Comm J Qual Patient Saf. 2013;39(4):147–156.
- , . Ice cream rounds. Acad Med. 2013;88(1):66.
- , , , et al. The impact of evidence on physicians' inpatient treatment decisions. J Gen Intern Med. 2004; 19(5 pt 1):402–409.
- . Landmark article March 19, 1927: the care of the patient. By Francis W. Peabody. JAMA. 1984;252(6):813–818.
- , , , et al. The art of bedside rounds: a multi‐center qualitative study of strategies used by experienced bedside teachers. J Gen Intern Med. 2013;28(3):412–420.
- Stanford University School of Medicine. Stanford Medicine 25. Available at: http://stanfordmedicine25.stanford.edu/. Accessed February 28, 2013.
- Medical Knowledge Self‐Assessment Program 16. The American College of Physicians. Available at: https://mksap.acponline.org. Accessed April 19, 2013.
Handoff CEX
Transfers among trainee physicians within the hospital typically occur at least twice a day and have been increasing among trainees as work hours have declined.[1] The 2011 Accreditation Council for Graduate Medical Education (ACGME) guidelines,[2] which restrict intern working hours to 16 hours from a previous maximum of 30, have likely increased the frequency of physician trainee handoffs even further. Similarly, transfers among hospitalist attendings occur at least twice a day, given typical shifts of 8 to 12 hours.
Given the frequency of transfers, and the potential for harm generated by failed transitions,[3, 4, 5, 6] the end‐of‐shift written and verbal handoffs have assumed increasingly greater importance in hospital care among both trainees and hospitalist attendings.
The ACGME now requires that programs assess the competency of trainees in handoff communication.[2] Yet, there are few tools for assessing the quality of sign‐out communication. Those that exist primarily focus on the written sign‐out, and are rarely validated.[7, 8, 9, 10, 11, 12] Furthermore, it is uncertain whether such assessments must be done by supervisors or whether peers can participate in the evaluation. In this prospective multi‐institutional study we assess the performance characteristics of a verbal sign‐out evaluation tool for internal medicine housestaff and hospitalist attendings, and examine whether it can be used by peers as well as by external evaluators. This tool has previously been found to effectively discriminate between experienced and inexperienced nurses conducting nursing handoffs.[13]
METHODS
Tool Design and Measures
The Handoff CEX (clinical evaluation exercise) is a structured assessment based on the format of the mini‐CEX, an instrument used to assess the quality of history and physical examination by trainees for which validation studies have previously been conducted.[14, 15, 16, 17] We developed the tool based on themes we identified from our own expertise,[1, 5, 6, 8, 18, 19, 20, 21, 22, 23, 24, 25, 26, 27, 28, 29] the ACGME core competencies for trainees,[2] and the literature to maximize content validity. First, standardization has numerous demonstrable benefits for safety in general and handoffs in particular.[30, 31, 32] Consequently we created a domain for organization in which standardization was a characteristic of high performance.
Second, there is evidence that people engaged in conversation routinely overestimate peer comprehension,[27] and that explicit strategies to combat this overestimation, such as confirming understanding, explicitly assigning tasks rather than using open‐ended language, and using concrete language, are effective.[33] Accordingly we created a domain for communication skills, which is also an ACGME competency.
Third, although there were no formal guidelines for sign‐out content when we developed this tool, our own research had demonstrated that the content elements most often missing and felt to be important by stakeholders were related to clinical condition and explicating thinking processes,[5, 6] so we created a domain for content that highlighted these areas and met the ACGME competency of medical knowledge. In accordance with standards for evaluation of learners, we incorporated a domain for judgment to identify where trainees were in the RIME spectrum of reporter, interpreter, master, and educator.
Next, we added a section for professionalism in accordance with the ACGME core competencies of professionalism and patient care.[34] To avoid the disinclination of peers to label each other unprofessional, we labeled the professionalism domain as patient‐focused on the tool.
Finally, we included a domain for setting because of an extensive literature demonstrating increased handoff failures in noisy or interruptive settings.[35, 36, 37] We then revised the tool slightly based on our experiences among nurses and students.[13, 38] The final tool included the 6 domains described above and an assessment of overall competency. Each domain was scored on a 9‐point scale and included descriptive anchors at high and low ends of performance. We further divided the scale into 3 main sections: unsatisfactory (score 13), satisfactory (46), and superior (79). We designed 2 tools, 1 to assess the person providing the handoff and 1 to assess the handoff recipient, each with its own descriptive anchors. The recipient tool did not include a content domain (see Supporting Information, Appendix 1, in the online version of this article).
Setting and Subjects
We tested the tool in 2 different urban academic medical centers: the University of Chicago Medicine (UCM) and Yale‐New Haven Hospital (Yale). At UCM, we tested the tool among hospitalists, nurse practitioners, and physician assistants during the Monday and Tuesday morning and Friday evening sign‐out sessions. At Yale, we tested the tool among housestaff during the evening sign‐out session from the primary team to the on‐call covering team.
The UCM is a 550‐bed urban academic medical center in which the nonteaching hospitalist service cares for patients with liver disease, or end‐stage renal or lung disease awaiting transplant, and a small fraction of general medicine and oncology patients when the housestaff service exceeds its cap. No formal training on sign‐out is provided to attending or midlevel providers. The nonteaching hospitalist service operates as a separate service from the housestaff service and consists of 38 hospitalist clinicians (hospitalist attendings, nurse practitioners, and physicians assistants). There are 2 handoffs each day. In the morning the departing night hospitalist hands off to the incoming daytime hospitalist or midlevel provider. These handoffs occur at 7:30 am in a dedicated room. In the evening the daytime hospitalist or midlevel provider hands off to an incoming night hospitalist. This handoff occurs at 5:30 pm or 7:30 pm in a dedicated location. The written sign‐out is maintained on a Microsoft Word (Microsoft Corp., Redmond, WA) document on a password‐protected server and updated daily.
Yale is a 946‐bed urban academic medical center with a large internal medicine training program. Formal sign‐out education that covers the main domains of the tool is provided to new interns during the first 3 months of the year,[19] and a templated electronic medical record‐based electronic written handoff report is produced by the housestaff for all patients.[22] Approximately half of inpatient medicine patients are cared for by housestaff teams, which are entirely separate from the hospitalist service. Housestaff sign‐out occurs between 4 pm and 7 pm every night. At a minimum, the departing intern signs out to the incoming intern; this handoff is typically supervised by at least 1 second‐ or third‐year resident. All patients are signed out verbally; in addition, the written handoff report is provided to the incoming team. Most handoffs occur in a quiet charting room.
Data Collection
Data collection at UCM occurred between March and December 2010 on 3 days of each week: Mondays, Tuesdays, and Fridays. On Mondays and Tuesdays the morning handoffs were observed; on Fridays the evening handoffs were observed. Data collection at Yale occurred between March and May 2011. Only evening handoffs from the primary team to the overnight coverage were observed. At both sites, participants provided verbal informed consent prior to data collection. At the time of an eligible sign‐out session, a research assistant (D.R. at Yale, P.S. at UCM) provided the evaluation tools to all members of the incoming and outgoing teams, and observed the sign‐out session himself. Each person providing a handoff was asked to evaluate the recipient of the handoff; each person receiving a handoff was asked to evaluate the provider of the handoff. In addition, the trained third‐party observer (D.R., P.S.) evaluated both the provider and recipient of the handoff. The external evaluators were trained in principles of effective communication and the use of the tool, with specific review of anchors at each end of each domain. One evaluator had a DO degree and was completing an MPH degree. The second evaluator was an experienced clinical research assistant whose training consisted of supervised observation of 10 handoffs by a physician investigator. At Yale, if a resident was present, she or he was also asked to evaluate both the provider and recipient of the handoff. Consequently, every sign‐out session included at least 2 evaluations of each participant, 1 by a peer evaluator and 1 by a consistent external evaluator who did not know the patients. At Yale, many sign‐outs also included a third evaluation by a resident supervisor.
The study was approved by the institutional review boards at both UCM and Yale.
Statistical Analysis
We obtained mean, median, and interquartile range of scores for each subdomain of the tool as well as the overall assessment of handoff quality. We assessed convergent construct validity by assessing performance of the tool in different contexts. To do so, we determined whether scores differed by type of participant (provider or recipient), by site, by training level of evaluatee, or by type of evaluator (external, resident supervisor, or peer) by using Wilcoxon rank sum tests and Kruskal‐Wallis tests. For the assessment of differences in ratings by training level, we used evaluations of sign‐out providers only, because the 2 sites differed in scores for recipients. We also assessed construct validity by using Spearman rank correlation coefficients to describe the internal consistency of the tool in terms of the correlation between domains of the tool, and we conducted an exploratory factor analysis to gain insight into whether the subdomains of the tool were measuring the same construct. In conducting this analysis, we restricted the dataset to evaluations of sign‐out providers only, and used a principal components estimation method, a promax rotation, and squared multiple correlation communality priors. Finally, we conducted some preliminary studies of reliability by testing whether different types of evaluators provided similar assessments. We calculated a weighted kappa using Fleiss‐Cohen weights for external versus peer scores and again for supervising resident versus peer scores (Yale only). We were not able to assess test‐retest reliability by nature of the sign‐out process. Statistical significance was defined by a P value 0.05, and analyses were performed using SAS 9.2 (SAS Institute, Cary, NC).
RESULTS
A total of 149 handoff sessions were observed: 89 at UCM and 60 at Yale. Each site conducted a similar total number of evaluations: 336 at UCM, 337 at Yale. These sessions involved 97 unique individuals, 34 at UCM and 63 at Yale. Overall scores were high at both sites, but a wide range of scores was applied (Table 1).
| Domain | Provider, N=343 | Recipient, N=330 | P Value | ||||
|---|---|---|---|---|---|---|---|
| Median (IQR) | Mean (SD) | Range | Median (IQR) | Mean (SD) | Range | ||
| |||||||
| Setting | 7 (69) | 7.0 (1.7) | 29 | 7 (69) | 7.3 (1.6) | 29 | 0.05 |
| Organization | 7 (68) | 7.2 (1.5) | 29 | 8 (69) | 7.4 (1.4) | 29 | 0.07 |
| Communication | 7 (69) | 7.2 (1.6) | 19 | 8 (79) | 7.4 (1.5) | 29 | 0.22 |
| Content | 7 (68) | 7.0 (1.6) | 29 | ||||
| Judgment | 8 (68) | 7.3 (1.4) | 39 | 8 (79) | 7.5 (1.4) | 39 | 0.06 |
| Professionalism | 8 (79) | 7.4 (1.5) | 29 | 8 (79) | 7.6 (1.4) | 39 | 0.23 |
| Overall | 7 (68) | 7.1 (1.5) | 29 | 7 (68) | 7.4 (1.4) | 29 | 0.02 |
Handoff Providers
A total of 343 evaluations of handoff providers were completed regarding 67 unique individuals. For each domain, scores spanned the full range from unsatisfactory to superior. The highest rated domain on the handoff provider evaluation tool was professionalism (median: 8; interquartile range [IQR]: 79). The lowest rated domain was content (median: 7; IQR: 68) (Table 1).
Handoff Recipients
A total of 330 evaluations of handoff recipients were completed regarding 58 unique individuals. For each domain, scores spanned the full range from unsatisfactory to superior. The highest rated domain on the handoff provider evaluation tool was professionalism, with a median of 8 (IQR: 79). The lowest rated domain was setting, with a median score of 7 (IQR: 6‐9) (Table 1).
Validity Testing
Comparing provider scores to recipient scores, recipients received significantly higher scores for overall assessment (Table 1). Scores at UCM and Yale were similar in all domains for providers but were slightly lower at UCM in several domains for recipients (see Supporting Information, Appendix 2, in the online version of this article). Scores did not differ significantly by training level (Table 2). Third‐party external evaluators consistently gave lower marks for the same handoff than peer evaluators did (Table 3).
| Domain | Median (Range) | P Value | |||
|---|---|---|---|---|---|
| NP/PA, N=33 | Subintern or Intern, N=170 | Resident, N=44 | Hospitalist, N=95 | ||
| |||||
| Setting | 7 (29) | 7 (39) | 7 (49) | 7 (29) | 0.89 |
| Organization | 8 (49) | 7 (29) | 7 (49) | 8 (39) | 0.11 |
| Communication | 8 (49) | 7 (29) | 7 (49) | 8 (19) | 0.72 |
| Content | 7 (39) | 7 (29) | 7 (49) | 7 (29) | 0.92 |
| Judgment | 8 (59) | 7 (39) | 8 (49) | 8 (49) | 0.09 |
| Professionalism | 8 (49) | 7 (29) | 8 (39) | 8 (49) | 0.82 |
| Overall | 7 (39) | 7 (29) | 8 (49) | 7 (29) | 0.28 |
| Provider, Median (Range) | Recipient, Median (Range) | |||||||
|---|---|---|---|---|---|---|---|---|
| Domain | Peer, N=152 | Resident, Supervisor, N=43 | External, N=147 | P Value | Peer, N=145 | Resident Supervisor, N=43 | External, N=142 | P Value |
| ||||||||
| Setting | 8 (39) | 7 (39) | 7 (29) | 0.02 | 8 (29) | 7 (39) | 7 (29) | <0.001 |
| Organization | 8 (39) | 8 (39) | 7 (29) | 0.18 | 8 (39) | 8 (69) | 7 (29) | <0.001 |
| Communication | 8 (39) | 8 (39) | 7 (19) | <0.001 | 8 (39) | 8 (49) | 7 (29) | <0.001 |
| Content | 8 (39) | 8 (29) | 7 (29) | <0.001 | N/A | N/A | N/A | N/A |
| Judgment | 8 (49) | 8 (39) | 7 (39) | <0.001 | 8 (39) | 8 (49) | 7 (39) | <0.001 |
| Professionalism | 8 (39) | 8 (59) | 7 (29) | 0.02 | 8 (39) | 8 (69) | 7 (39) | <0.001 |
| Overall | 8 (39) | 8 (39) | 7 (29) | 0.001 | 8 (29) | 8 (49) | 7 (29) | <0.001 |
Spearman rank correlation coefficients among the CEX subdomains for provider scores ranged from 0.71 to 0.86, except for setting (Table 4). Setting was less well correlated with the other subdomains, with correlation coefficients ranging from 0.39 to 0.41. Correlations between individual domains and the overall rating ranged from 0.80 to 0.86, except setting, which had a correlation of 0.55. Every correlation was significant at P<0.001. Correlation coefficients for recipient scores were very similar to those for provider scores (see Supporting Information, Appendix 3, in the online version of this article).
| Spearman Correlation Coefficients | ||||||
|---|---|---|---|---|---|---|
| Setting | Organization | Communication | Content | Judgment | Professionalism | |
| ||||||
| Setting | 1.000 | 0.40 | 0.40 | 0.39 | 0.39 | 0.41 |
| Organization | 0.40 | 1.00 | 0.80 | 0.71 | 0.77 | 0.73 |
| Communication | 0.40 | 0.80 | 1.00 | 0.79 | 0.82 | 0.77 |
| Content | 0.39 | 0.71 | 0.79 | 1.00 | 0.80 | 0.74 |
| Judgment | 0.39 | 0.77 | 0.82 | 0.80 | 1.00 | 0.78 |
| Professionalism | 0.41 | 0.73 | 0.77 | 0.74 | 0.78 | 1.00 |
| Overall | 0.55 | 0.80 | 0.84 | 0.83 | 0.86 | 0.82 |
We analyzed 343 provider evaluations in the factor analysis; there were 6 missing values. The scree plot of eigenvalues did not support more than 1 factor; however, the rotated factor pattern for standardized regression coefficients for the first factor and the final communality estimates showed the setting component yielding smaller values than did other scale components (see Supporting Information, Appendix 4, in the online version of this article).
Reliability Testing
Weighted kappa scores for provider evaluations ranged from 0.28 (95% confidence interval [CI]: 0.01, 0.56) for setting to 0.59 (95% CI: 0.38, 0.80) for organization, and were generally higher for resident versus peer comparisons than for external versus peer comparisons. Weighted kappa scores for recipient evaluation were slightly lower for external versus peer evaluations, but agreement was no better than chance for resident versus peer evaluations (Table 5).
| Domain | Provider | Recipient | ||
|---|---|---|---|---|
| External vs Peer, N=144 (95% CI) | Resident vs Peer, N=42 (95% CI) | External vs Peer, N=134 (95% CI) | Resident vs Peer, N=43 (95% CI) | |
| ||||
| Setting | 0.39 (0.24, 0.54) | 0.28 (0.01, 0.56) | 0.34 (0.20, 0.48) | 0.48 (0.27, 0.69) |
| Organization | 0.43 (0.29, 0.58) | 0.59 (0.39, 0.80) | 0.39 (0.22, 0.55) | 0.03 (0.23, 0.29) |
| Communication | 0.34 (0.19, 0.49) | 0.52 (0.37, 0.68) | 0.36 (0.22, 0.51) | 0.02 (0.18, 0.23) |
| Content | 0.38 (0.25, 0.51) | 0.53 (0.27, 0.80) | N/A (N/A) | N/A (N/A) |
| Judgment | 0.36 (0.22, 0.49) | 0.54 (0.25, 0.83) | 0.28 (0.15, 0.42) | 0.12 (0.34, 0.09) |
| Professionalism | 0.47 (0.32, 0.63) | 0.47 (0.23, 0.72) | 0.35 (0.18, 0.51) | 0.01 (0.29, 0.26) |
| Overall | 0.50 (0.36, 0.64) | 0.45 (0.24, 0.67) | 0.31 (0.16, 0.48) | 0.07 (0.20, 0.34) |
DISCUSSION
In this study we found that an evaluation tool for direct observation of housestaff and hospitalists generated a range of scores and was well validated in the sense of performing similarly across 2 different institutions and among both trainees and attendings, while having high internal consistency. However, external evaluators gave consistently lower marks than peer evaluators at both sites, resulting in low reliability when comparing these 2 groups of raters.
It has traditionally been difficult to conduct direct evaluations of handoffs, because they may occur at haphazard times, in variable locations, and without very much advance notice. For this reason, several attempts have been made to incorporate peers in evaluations of handoff practices.[5, 39, 40] Using peers to conduct evaluations also has the advantage that peers are more likely to be familiar with the patients being handed off and might recognize handoff flaws that external evaluators would miss. Nonetheless, peer evaluations have some important liabilities. Peers may be unwilling or unable to provide honest critiques of their colleagues given that they must work closely together for years. Trainee peers may also lack sufficient clinical expertise or experience to accurately assess competence. In our study, we found that peers gave consistently higher marks to their colleagues than did external evaluators, suggesting they may have found it difficult to criticize their colleagues. We conclude that peer evaluation alone is likely an insufficient means of evaluating handoff quality.
Supervising residents gave very similar marks as intern peers, suggesting that they also are unwilling to criticize, are insufficiently experienced to evaluate, or alternatively, that the peer evaluations were reasonable. We suspect the latter is unlikely given that external evaluator scores were consistently lower than peers. One would expect the external evaluators to be biased toward higher scores given that they are not familiar with the patients and are not able to comment on inaccuracies or omissions in the sign‐out.
The tool appeared to perform less well in most cases for recipients than for providers, with a narrower range of scores and low‐weighted kappa scores. Although recipients play a key role in ensuring a high‐quality sign‐out by paying close attention, ensuring it is a bidirectional conversation, asking appropriate questions, and reading back key information, it may be that evaluators were unable to place these activities within the same domains that were used for the provider evaluation. An altogether different recipient evaluation approach may be necessary.[41]
In general, scores were clustered at the top of the score range, as is typical for evaluations. One strategy to spread out scores further would be to refine the tool by adding anchors for satisfactory performance not just the extremes. A second approach might be to reduce the grading scale to only 3 points (unsatisfactory, satisfactory, superior) to force more scores to the middle. However, this approach might limit the discrimination ability of the tool.
We have previously studied the use of this tool among nurses. In that study, we also found consistently higher scores by peers than by external evaluators. We did, however, find a positive effect of experience, in which more experienced nurses received higher scores on average. We did not observe a similar training effect in this study. There are several possible explanations for the lack of a training effect. It is possible that the types of handoffs assessed played a role. At UCM, some assessed handoffs were night staff to day staff, which might be lower quality than day staff to night staff handoffs, whereas at Yale, all handoffs were day to night teams. Thus, average scores at UCM (primarily hospitalists) might have been lowered by the type of handoff provided. Given that hospitalist evaluations were conducted exclusively at UCM and housestaff evaluations exclusively at Yale, lack of difference between hospitalists and housestaff may also have been related to differences in evaluation practice or handoff practice at the 2 sites, not necessarily related to training level. Third, in our experience, attending physicians provide briefer less‐comprehensive sign‐outs than trainees, particularly when communicating with equally experienced attendings; these sign‐outs may appropriately be scored lower on the tool. Fourth, the great majority of the hospitalists at UCM were within 5 years of residency and therefore not very much more experienced than the trainees. Finally, it is possible that skills do not improve over time given widespread lack of observation and feedback during training years for this important skill.
The high internal consistency of most of the subdomains and the loading of all subdomains except setting onto 1 factor are evidence of convergent construct validity, but also suggest that evaluators have difficulty distinguishing among components of sign‐out quality. Internal consistency may also reflect a halo effect, in which scores on different domains are all influenced by a common overall judgment.[42] We are currently testing a shorter version of the tool including domains only for content, professionalism, and setting in addition to overall score. The fact that setting did not correlate as well with the other domains suggests that sign‐out practitioners may not have or exercise control over their surroundings. Consequently, it may ultimately be reasonable to drop this domain from the tool, or alternatively, to refocus on the need to ensure a quiet setting during sign‐out skills training.
There are several limitations to this study. External evaluations were conducted by personnel who were not familiar with the patients, and they may therefore have overestimated the quality of sign‐out. Studying different types of physicians at different sites might have limited our ability to identify differences by training level. As is commonly seen in evaluation studies, scores were skewed to the high end, although we did observe some use of the full range of the tool. Finally, we were limited in our ability to test inter‐rater reliability because of the multiple sources of variability in the data (numerous different raters, with different backgrounds at different settings, rating different individuals).
In summary, we developed a handoff evaluation tool that was easily completed by housestaff and attendings without training, that performed similarly in a variety of different settings at 2 institutions, and that can in principle be used either for peer evaluations or for external evaluations, although peer evaluations may be positively biased. Further work will be done to refine and simplify the tool.
ACKNOWLEDGMENTS
Disclosures: Development and evaluation of the sign‐out CEX was supported by a grant from the Agency for Healthcare Research and Quality (1R03HS018278‐01). Dr. Arora is supported by a National Institute on Aging (K23 AG033763). Dr. Horwitz is supported by the National Institute on Aging (K08 AG038336) and by the American Federation for Aging Research through the Paul B. Beeson Career Development Award Program. Dr. Horwitz is also a Pepper Scholar with support from the Claude D. Pepper Older Americans Independence Center at Yale University School of Medicine (P30AG021342 NIH/NIA). No funding source had any role in the study design; in the collection, analysis, and interpretation of data; in the writing of the report; or in the decision to submit the article for publication. The content is solely the responsibility of the authors and does not necessarily represent the official views of the Agency for Healthcare Research and Quality, the National Institute on Aging, the National Institutes of Health, or the American Federation for Aging Research. Dr. Horwitz had full access to all of the data in the study and takes responsibility for the integrity of the data and the accuracy of the data analysis. An earlier version of this work was presented as a poster presentation at the Society of General Internal Medicine Annual Meeting in Orlando, Florida on May 9, 2012. Dr. Rand is now with the Department of Medicine, University of Vermont College of Medicine, Burlington, Vermont. Mr. Staisiunas is now with the Law School, Marquette University, Milwaukee, Wisconsin. The authors declare they have no conflicts of interest.
Appendix
A
PROVIDER HAND‐OFF CEX TOOL
RECIPIENT HAND‐OFF CEX TOOL
Appendix
B
Handoff CEX scores by site of evaluation
| Domain | Provider | Recipient | ||||
| Median (Range) | P‐value | Median (Range) | P‐value | |||
| UC | Yale | UC | Yale | |||
| N=172 | N=170 | N=163 | N=167 | |||
| Setting | 7 (29) | 7 (39) | 0.32 | 7 (29) | 7 (39) | 0.36 |
| Organization | 8 (29) | 7 (39) | 0.30 | 7 (29) | 8 (59) | 0.001 |
| Communication | 7 (19) | 7 (39) | 0.67 | 7 (29) | 8 (49) | 0.03 |
| Content | 7 (29) | 7 (29) | N/A | N/A | N/A | |
| Judgment | 8 (39) | 7 (39) | 0.60 | 7 (39) | 8 (49) | 0.001 |
| Professionalism | 8 (29) | 8 (39) | 0.67 | 8 (39) | 8 (49) | 0.35 |
| Overall | 7 (29) | 7 (39) | 0.41 | 7 (29) | 8 (49) | 0.005 |
Appendix
C
Spearman correlation, recipients (N=330)
| SpearmanCorrelationCoefficients | |||||
| Setting | Organization | Communication | Judgment | Professionalism | |
| Setting | 1.0 | 0.46 | 0.48 | 0.47 | 0.40 |
| Organization | 0.46 | 1.00 | 0.78 | 0.75 | 0.75 |
| Communication | 0.48 | 0.78 | 1.00 | 0.85 | 0.77 |
| Judgment | 0.47 | 0.75 | 0.85 | 1.00 | 0.74 |
| Professionalism | 0.40 | 0.75 | 0.77 | 0.74 | 1.00 |
| Overall | 0.60 | 0.77 | 0.84 | 0.82 | 0.77 |
All p values <0.0001
Appendix
D
Factor analysis results for provider evaluations
| Rotated Factor Pattern (Standardized Regression Coefficients) N=336 | ||
| Factor1 | Factor2 | |
| Organization | 0.64 | 0.27 |
| Communication | 0.79 | 0.16 |
| Content | 0.82 | 0.06 |
| Judgment | 0.86 | 0.06 |
| Professionalism | 0.66 | 0.23 |
| Setting | 0.18 | 0.29 |
- , , , . Transfers of patient care between house staff on internal medicine wards: a national survey. Arch Intern Med. 2006;166(11):1173–1177.
- Accreditation Council for Graduate Medical Education. Common program requirements. 2011; http://www.acgme‐2010standards.org/pdf/Common_Program_Requirements_07012011.pdf. Accessed August 23, 2011.
- , , , , . Does housestaff discontinuity of care increase the risk for preventable adverse events? Ann Intern Med. 1994;121(11):866–872.
- , , . Communication failures: an insidious contributor to medical mishaps. Acad Med. 2004;79(2):186–194.
- , , , , . Communication failures in patient sign‐out and suggestions for improvement: a critical incident analysis. Qual Saf Health Care. 2005;14(6):401–407.
- , , , , . Consequences of inadequate sign‐out for patient care. Arch Intern Med. 2008;168(16):1755–1760.
- , , , . Adequacy of information transferred at resident sign‐out (in‐hospital handover of care): a prospective survey. Qual Saf Health Care. 2008;17(1):6–10.
- , , , , . What are covering doctors told about their patients? Analysis of sign‐out among internal medicine house staff. Qual Saf Health Care. 2009;18(4):248–255.
- , . Using direct observation, formal evaluation, and an interactive curriculum to improve the sign‐out practices of internal medicine interns. Acad Med. 2010;85(7):1182–1188.
- , , , . Doctors' handovers in hospitals: a literature review. Qual Saf Health Care. 2011;20(2):128–133.
- , , , et al. Resident sign‐out and patient hand‐offs: opportunities for improvement. Teach Learn Med. 2011;23(2):105–111.
- , , , et al. Use of an appreciative inquiry approach to improve resident sign‐out in an era of multiple shift changes. J Gen Intern Med. 2012;27(3):287–291.
- , , , , , . Validation of a handoff assessment tool: the Handoff CEX [published online ahead of print June 7, 2012]. J Clin Nurs. doi: 10.1111/j.1365–2702.2012.04131.x.
- , , , . The mini‐CEX (clinical evaluation exercise): a preliminary investigation. Ann Intern Med. 1995;123(10):795–799.
- , , , . Examiner differences in the mini‐CEX. Adv Health Sci Educ Theory Pract. 1997;2(1):27–33.
- , , , . Assessing the reliability and validity of the mini‐clinical evaluation exercise for internal medicine residency training. Acad Med. 2002;77(9):900–904.
- , , , , . Construct validity of the miniclinical evaluation exercise (miniCEX). Acad Med. 2003;78(8):826–830.
- , , , , , . Dropping the baton: a qualitative analysis of failures during the transition from emergency department to inpatient care. Ann Emerg Med. 2009;53(6):701–710.e4.
- , , . Development and implementation of an oral sign‐out skills curriculum. J Gen Intern Med. 2007;22(10):1470–1474.
- , , , . Mixed methods evaluation of oral sign‐out practices. J Gen Intern Med. 2007;22(S1):S114.
- , , , et al. Evaluation of an asynchronous physician voicemail sign‐out for emergency department admissions. Ann Emerg Med. 2009;54(3):368–378.
- , , , et al. An institution‐wide handoff task force to standardise and improve physician handoffs. BMJ Qual Saf. 2012;21(10):863–871.
- , . A model for building a standardized hand‐off protocol. Jt Comm J Qual Patient Saf. 2006;32(11):646–655.
- , , , , . Medication discrepancies in resident sign‐outs and their potential to harm. J Gen Intern Med. 2007;22(12):1751–1755.
- , , , . A theoretical framework and competency‐based approach to improving handoffs. Qual Saf Health Care. 2008;17(1):11–14.
- , , , , , . Hospitalist handoffs: a systematic review and task force recommendations. J Hosp Med. 2009;4(7):433–440.
- , , , , . Interns overestimate the effectiveness of their hand‐off communication. Pediatrics. 2010;125(3):491–496.
- , . Improving clinical handovers: creating local solutions for a global problem. Qual Saf Health Care. 2009;18(4):244–245.
- , , , , . Managing discontinuity in academic medical centers: strategies for a safe and effective resident sign‐out. J Hosp Med. 2006;1(4):257–266.
- , , . Standardized sign‐out reduces intern perception of medical errors on the general internal medicine ward. Teach Learn Med. 2009;21(2):121–126.
- , , . SBAR: a shared mental model for improving communication between clinicians. Jt Comm J Qual Patient Saf. 2006;32(3):167–175.
- . Structuring flexibility: the potential good, bad and ugly in standardisation of handovers. Qual Saf Health Care. 2008;17(1):4–5.
- , , , , . Handoff strategies in settings with high consequences for failure: lessons for health care operations. Int J Qual Health Care. 2004;16(2):125–132.
- , , , , , . Residents' perceptions of professionalism in training and practice: barriers, promoters, and duty hour requirements. J Gen Intern Med. 2006;21(7):758–763.
- , . Communication behaviours in a hospital setting: an observational study. BMJ. 1998;316(7132):673–676.
- , , , , . Communication loads on clinical staff in the emergency department. Med J Aust. 2002;176(9):415–418.
- , . A systematic review of failures in handoff communication during intrahospital transfers. Jt Comm J Qual Patient Saf. 2011;37(6):274–284.
- , , , et al. Hand‐off education and evaluation: piloting the observed simulated hand‐off experience (OSHE). J Gen Intern Med. 2010;25(2):129–134.
- , , , et al. Handoffs causing patient harm: a survey of medical and surgical house staff. Jt Comm J Qual Patient Saf. 2008;34(10):563–570.
- , , . A prospective observational study of physician handoff for intensive‐care‐unit‐to‐ward patient transfers. Am J Med. 2011;124(9):860–867.
- , , , , . Characterizing physician listening behavior during hospitalist handoffs using the HEAR checklist (published online ahead of print December 20, 2012]. BMJ Qual Saf. doi:10.1136/bmjqs‐2012‐001138.
- . A constant error in psychological ratings. J Appl Psychol. 1920;4(1):25.
Transfers among trainee physicians within the hospital typically occur at least twice a day and have been increasing among trainees as work hours have declined.[1] The 2011 Accreditation Council for Graduate Medical Education (ACGME) guidelines,[2] which restrict intern working hours to 16 hours from a previous maximum of 30, have likely increased the frequency of physician trainee handoffs even further. Similarly, transfers among hospitalist attendings occur at least twice a day, given typical shifts of 8 to 12 hours.
Given the frequency of transfers, and the potential for harm generated by failed transitions,[3, 4, 5, 6] the end‐of‐shift written and verbal handoffs have assumed increasingly greater importance in hospital care among both trainees and hospitalist attendings.
The ACGME now requires that programs assess the competency of trainees in handoff communication.[2] Yet, there are few tools for assessing the quality of sign‐out communication. Those that exist primarily focus on the written sign‐out, and are rarely validated.[7, 8, 9, 10, 11, 12] Furthermore, it is uncertain whether such assessments must be done by supervisors or whether peers can participate in the evaluation. In this prospective multi‐institutional study we assess the performance characteristics of a verbal sign‐out evaluation tool for internal medicine housestaff and hospitalist attendings, and examine whether it can be used by peers as well as by external evaluators. This tool has previously been found to effectively discriminate between experienced and inexperienced nurses conducting nursing handoffs.[13]
METHODS
Tool Design and Measures
The Handoff CEX (clinical evaluation exercise) is a structured assessment based on the format of the mini‐CEX, an instrument used to assess the quality of history and physical examination by trainees for which validation studies have previously been conducted.[14, 15, 16, 17] We developed the tool based on themes we identified from our own expertise,[1, 5, 6, 8, 18, 19, 20, 21, 22, 23, 24, 25, 26, 27, 28, 29] the ACGME core competencies for trainees,[2] and the literature to maximize content validity. First, standardization has numerous demonstrable benefits for safety in general and handoffs in particular.[30, 31, 32] Consequently we created a domain for organization in which standardization was a characteristic of high performance.
Second, there is evidence that people engaged in conversation routinely overestimate peer comprehension,[27] and that explicit strategies to combat this overestimation, such as confirming understanding, explicitly assigning tasks rather than using open‐ended language, and using concrete language, are effective.[33] Accordingly we created a domain for communication skills, which is also an ACGME competency.
Third, although there were no formal guidelines for sign‐out content when we developed this tool, our own research had demonstrated that the content elements most often missing and felt to be important by stakeholders were related to clinical condition and explicating thinking processes,[5, 6] so we created a domain for content that highlighted these areas and met the ACGME competency of medical knowledge. In accordance with standards for evaluation of learners, we incorporated a domain for judgment to identify where trainees were in the RIME spectrum of reporter, interpreter, master, and educator.
Next, we added a section for professionalism in accordance with the ACGME core competencies of professionalism and patient care.[34] To avoid the disinclination of peers to label each other unprofessional, we labeled the professionalism domain as patient‐focused on the tool.
Finally, we included a domain for setting because of an extensive literature demonstrating increased handoff failures in noisy or interruptive settings.[35, 36, 37] We then revised the tool slightly based on our experiences among nurses and students.[13, 38] The final tool included the 6 domains described above and an assessment of overall competency. Each domain was scored on a 9‐point scale and included descriptive anchors at high and low ends of performance. We further divided the scale into 3 main sections: unsatisfactory (score 13), satisfactory (46), and superior (79). We designed 2 tools, 1 to assess the person providing the handoff and 1 to assess the handoff recipient, each with its own descriptive anchors. The recipient tool did not include a content domain (see Supporting Information, Appendix 1, in the online version of this article).
Setting and Subjects
We tested the tool in 2 different urban academic medical centers: the University of Chicago Medicine (UCM) and Yale‐New Haven Hospital (Yale). At UCM, we tested the tool among hospitalists, nurse practitioners, and physician assistants during the Monday and Tuesday morning and Friday evening sign‐out sessions. At Yale, we tested the tool among housestaff during the evening sign‐out session from the primary team to the on‐call covering team.
The UCM is a 550‐bed urban academic medical center in which the nonteaching hospitalist service cares for patients with liver disease, or end‐stage renal or lung disease awaiting transplant, and a small fraction of general medicine and oncology patients when the housestaff service exceeds its cap. No formal training on sign‐out is provided to attending or midlevel providers. The nonteaching hospitalist service operates as a separate service from the housestaff service and consists of 38 hospitalist clinicians (hospitalist attendings, nurse practitioners, and physicians assistants). There are 2 handoffs each day. In the morning the departing night hospitalist hands off to the incoming daytime hospitalist or midlevel provider. These handoffs occur at 7:30 am in a dedicated room. In the evening the daytime hospitalist or midlevel provider hands off to an incoming night hospitalist. This handoff occurs at 5:30 pm or 7:30 pm in a dedicated location. The written sign‐out is maintained on a Microsoft Word (Microsoft Corp., Redmond, WA) document on a password‐protected server and updated daily.
Yale is a 946‐bed urban academic medical center with a large internal medicine training program. Formal sign‐out education that covers the main domains of the tool is provided to new interns during the first 3 months of the year,[19] and a templated electronic medical record‐based electronic written handoff report is produced by the housestaff for all patients.[22] Approximately half of inpatient medicine patients are cared for by housestaff teams, which are entirely separate from the hospitalist service. Housestaff sign‐out occurs between 4 pm and 7 pm every night. At a minimum, the departing intern signs out to the incoming intern; this handoff is typically supervised by at least 1 second‐ or third‐year resident. All patients are signed out verbally; in addition, the written handoff report is provided to the incoming team. Most handoffs occur in a quiet charting room.
Data Collection
Data collection at UCM occurred between March and December 2010 on 3 days of each week: Mondays, Tuesdays, and Fridays. On Mondays and Tuesdays the morning handoffs were observed; on Fridays the evening handoffs were observed. Data collection at Yale occurred between March and May 2011. Only evening handoffs from the primary team to the overnight coverage were observed. At both sites, participants provided verbal informed consent prior to data collection. At the time of an eligible sign‐out session, a research assistant (D.R. at Yale, P.S. at UCM) provided the evaluation tools to all members of the incoming and outgoing teams, and observed the sign‐out session himself. Each person providing a handoff was asked to evaluate the recipient of the handoff; each person receiving a handoff was asked to evaluate the provider of the handoff. In addition, the trained third‐party observer (D.R., P.S.) evaluated both the provider and recipient of the handoff. The external evaluators were trained in principles of effective communication and the use of the tool, with specific review of anchors at each end of each domain. One evaluator had a DO degree and was completing an MPH degree. The second evaluator was an experienced clinical research assistant whose training consisted of supervised observation of 10 handoffs by a physician investigator. At Yale, if a resident was present, she or he was also asked to evaluate both the provider and recipient of the handoff. Consequently, every sign‐out session included at least 2 evaluations of each participant, 1 by a peer evaluator and 1 by a consistent external evaluator who did not know the patients. At Yale, many sign‐outs also included a third evaluation by a resident supervisor.
The study was approved by the institutional review boards at both UCM and Yale.
Statistical Analysis
We obtained mean, median, and interquartile range of scores for each subdomain of the tool as well as the overall assessment of handoff quality. We assessed convergent construct validity by assessing performance of the tool in different contexts. To do so, we determined whether scores differed by type of participant (provider or recipient), by site, by training level of evaluatee, or by type of evaluator (external, resident supervisor, or peer) by using Wilcoxon rank sum tests and Kruskal‐Wallis tests. For the assessment of differences in ratings by training level, we used evaluations of sign‐out providers only, because the 2 sites differed in scores for recipients. We also assessed construct validity by using Spearman rank correlation coefficients to describe the internal consistency of the tool in terms of the correlation between domains of the tool, and we conducted an exploratory factor analysis to gain insight into whether the subdomains of the tool were measuring the same construct. In conducting this analysis, we restricted the dataset to evaluations of sign‐out providers only, and used a principal components estimation method, a promax rotation, and squared multiple correlation communality priors. Finally, we conducted some preliminary studies of reliability by testing whether different types of evaluators provided similar assessments. We calculated a weighted kappa using Fleiss‐Cohen weights for external versus peer scores and again for supervising resident versus peer scores (Yale only). We were not able to assess test‐retest reliability by nature of the sign‐out process. Statistical significance was defined by a P value 0.05, and analyses were performed using SAS 9.2 (SAS Institute, Cary, NC).
RESULTS
A total of 149 handoff sessions were observed: 89 at UCM and 60 at Yale. Each site conducted a similar total number of evaluations: 336 at UCM, 337 at Yale. These sessions involved 97 unique individuals, 34 at UCM and 63 at Yale. Overall scores were high at both sites, but a wide range of scores was applied (Table 1).
| Domain | Provider, N=343 | Recipient, N=330 | P Value | ||||
|---|---|---|---|---|---|---|---|
| Median (IQR) | Mean (SD) | Range | Median (IQR) | Mean (SD) | Range | ||
| |||||||
| Setting | 7 (69) | 7.0 (1.7) | 29 | 7 (69) | 7.3 (1.6) | 29 | 0.05 |
| Organization | 7 (68) | 7.2 (1.5) | 29 | 8 (69) | 7.4 (1.4) | 29 | 0.07 |
| Communication | 7 (69) | 7.2 (1.6) | 19 | 8 (79) | 7.4 (1.5) | 29 | 0.22 |
| Content | 7 (68) | 7.0 (1.6) | 29 | ||||
| Judgment | 8 (68) | 7.3 (1.4) | 39 | 8 (79) | 7.5 (1.4) | 39 | 0.06 |
| Professionalism | 8 (79) | 7.4 (1.5) | 29 | 8 (79) | 7.6 (1.4) | 39 | 0.23 |
| Overall | 7 (68) | 7.1 (1.5) | 29 | 7 (68) | 7.4 (1.4) | 29 | 0.02 |
Handoff Providers
A total of 343 evaluations of handoff providers were completed regarding 67 unique individuals. For each domain, scores spanned the full range from unsatisfactory to superior. The highest rated domain on the handoff provider evaluation tool was professionalism (median: 8; interquartile range [IQR]: 79). The lowest rated domain was content (median: 7; IQR: 68) (Table 1).
Handoff Recipients
A total of 330 evaluations of handoff recipients were completed regarding 58 unique individuals. For each domain, scores spanned the full range from unsatisfactory to superior. The highest rated domain on the handoff provider evaluation tool was professionalism, with a median of 8 (IQR: 79). The lowest rated domain was setting, with a median score of 7 (IQR: 6‐9) (Table 1).
Validity Testing
Comparing provider scores to recipient scores, recipients received significantly higher scores for overall assessment (Table 1). Scores at UCM and Yale were similar in all domains for providers but were slightly lower at UCM in several domains for recipients (see Supporting Information, Appendix 2, in the online version of this article). Scores did not differ significantly by training level (Table 2). Third‐party external evaluators consistently gave lower marks for the same handoff than peer evaluators did (Table 3).
| Domain | Median (Range) | P Value | |||
|---|---|---|---|---|---|
| NP/PA, N=33 | Subintern or Intern, N=170 | Resident, N=44 | Hospitalist, N=95 | ||
| |||||
| Setting | 7 (29) | 7 (39) | 7 (49) | 7 (29) | 0.89 |
| Organization | 8 (49) | 7 (29) | 7 (49) | 8 (39) | 0.11 |
| Communication | 8 (49) | 7 (29) | 7 (49) | 8 (19) | 0.72 |
| Content | 7 (39) | 7 (29) | 7 (49) | 7 (29) | 0.92 |
| Judgment | 8 (59) | 7 (39) | 8 (49) | 8 (49) | 0.09 |
| Professionalism | 8 (49) | 7 (29) | 8 (39) | 8 (49) | 0.82 |
| Overall | 7 (39) | 7 (29) | 8 (49) | 7 (29) | 0.28 |
| Provider, Median (Range) | Recipient, Median (Range) | |||||||
|---|---|---|---|---|---|---|---|---|
| Domain | Peer, N=152 | Resident, Supervisor, N=43 | External, N=147 | P Value | Peer, N=145 | Resident Supervisor, N=43 | External, N=142 | P Value |
| ||||||||
| Setting | 8 (39) | 7 (39) | 7 (29) | 0.02 | 8 (29) | 7 (39) | 7 (29) | <0.001 |
| Organization | 8 (39) | 8 (39) | 7 (29) | 0.18 | 8 (39) | 8 (69) | 7 (29) | <0.001 |
| Communication | 8 (39) | 8 (39) | 7 (19) | <0.001 | 8 (39) | 8 (49) | 7 (29) | <0.001 |
| Content | 8 (39) | 8 (29) | 7 (29) | <0.001 | N/A | N/A | N/A | N/A |
| Judgment | 8 (49) | 8 (39) | 7 (39) | <0.001 | 8 (39) | 8 (49) | 7 (39) | <0.001 |
| Professionalism | 8 (39) | 8 (59) | 7 (29) | 0.02 | 8 (39) | 8 (69) | 7 (39) | <0.001 |
| Overall | 8 (39) | 8 (39) | 7 (29) | 0.001 | 8 (29) | 8 (49) | 7 (29) | <0.001 |
Spearman rank correlation coefficients among the CEX subdomains for provider scores ranged from 0.71 to 0.86, except for setting (Table 4). Setting was less well correlated with the other subdomains, with correlation coefficients ranging from 0.39 to 0.41. Correlations between individual domains and the overall rating ranged from 0.80 to 0.86, except setting, which had a correlation of 0.55. Every correlation was significant at P<0.001. Correlation coefficients for recipient scores were very similar to those for provider scores (see Supporting Information, Appendix 3, in the online version of this article).
| Spearman Correlation Coefficients | ||||||
|---|---|---|---|---|---|---|
| Setting | Organization | Communication | Content | Judgment | Professionalism | |
| ||||||
| Setting | 1.000 | 0.40 | 0.40 | 0.39 | 0.39 | 0.41 |
| Organization | 0.40 | 1.00 | 0.80 | 0.71 | 0.77 | 0.73 |
| Communication | 0.40 | 0.80 | 1.00 | 0.79 | 0.82 | 0.77 |
| Content | 0.39 | 0.71 | 0.79 | 1.00 | 0.80 | 0.74 |
| Judgment | 0.39 | 0.77 | 0.82 | 0.80 | 1.00 | 0.78 |
| Professionalism | 0.41 | 0.73 | 0.77 | 0.74 | 0.78 | 1.00 |
| Overall | 0.55 | 0.80 | 0.84 | 0.83 | 0.86 | 0.82 |
We analyzed 343 provider evaluations in the factor analysis; there were 6 missing values. The scree plot of eigenvalues did not support more than 1 factor; however, the rotated factor pattern for standardized regression coefficients for the first factor and the final communality estimates showed the setting component yielding smaller values than did other scale components (see Supporting Information, Appendix 4, in the online version of this article).
Reliability Testing
Weighted kappa scores for provider evaluations ranged from 0.28 (95% confidence interval [CI]: 0.01, 0.56) for setting to 0.59 (95% CI: 0.38, 0.80) for organization, and were generally higher for resident versus peer comparisons than for external versus peer comparisons. Weighted kappa scores for recipient evaluation were slightly lower for external versus peer evaluations, but agreement was no better than chance for resident versus peer evaluations (Table 5).
| Domain | Provider | Recipient | ||
|---|---|---|---|---|
| External vs Peer, N=144 (95% CI) | Resident vs Peer, N=42 (95% CI) | External vs Peer, N=134 (95% CI) | Resident vs Peer, N=43 (95% CI) | |
| ||||
| Setting | 0.39 (0.24, 0.54) | 0.28 (0.01, 0.56) | 0.34 (0.20, 0.48) | 0.48 (0.27, 0.69) |
| Organization | 0.43 (0.29, 0.58) | 0.59 (0.39, 0.80) | 0.39 (0.22, 0.55) | 0.03 (0.23, 0.29) |
| Communication | 0.34 (0.19, 0.49) | 0.52 (0.37, 0.68) | 0.36 (0.22, 0.51) | 0.02 (0.18, 0.23) |
| Content | 0.38 (0.25, 0.51) | 0.53 (0.27, 0.80) | N/A (N/A) | N/A (N/A) |
| Judgment | 0.36 (0.22, 0.49) | 0.54 (0.25, 0.83) | 0.28 (0.15, 0.42) | 0.12 (0.34, 0.09) |
| Professionalism | 0.47 (0.32, 0.63) | 0.47 (0.23, 0.72) | 0.35 (0.18, 0.51) | 0.01 (0.29, 0.26) |
| Overall | 0.50 (0.36, 0.64) | 0.45 (0.24, 0.67) | 0.31 (0.16, 0.48) | 0.07 (0.20, 0.34) |
DISCUSSION
In this study we found that an evaluation tool for direct observation of housestaff and hospitalists generated a range of scores and was well validated in the sense of performing similarly across 2 different institutions and among both trainees and attendings, while having high internal consistency. However, external evaluators gave consistently lower marks than peer evaluators at both sites, resulting in low reliability when comparing these 2 groups of raters.
It has traditionally been difficult to conduct direct evaluations of handoffs, because they may occur at haphazard times, in variable locations, and without very much advance notice. For this reason, several attempts have been made to incorporate peers in evaluations of handoff practices.[5, 39, 40] Using peers to conduct evaluations also has the advantage that peers are more likely to be familiar with the patients being handed off and might recognize handoff flaws that external evaluators would miss. Nonetheless, peer evaluations have some important liabilities. Peers may be unwilling or unable to provide honest critiques of their colleagues given that they must work closely together for years. Trainee peers may also lack sufficient clinical expertise or experience to accurately assess competence. In our study, we found that peers gave consistently higher marks to their colleagues than did external evaluators, suggesting they may have found it difficult to criticize their colleagues. We conclude that peer evaluation alone is likely an insufficient means of evaluating handoff quality.
Supervising residents gave very similar marks as intern peers, suggesting that they also are unwilling to criticize, are insufficiently experienced to evaluate, or alternatively, that the peer evaluations were reasonable. We suspect the latter is unlikely given that external evaluator scores were consistently lower than peers. One would expect the external evaluators to be biased toward higher scores given that they are not familiar with the patients and are not able to comment on inaccuracies or omissions in the sign‐out.
The tool appeared to perform less well in most cases for recipients than for providers, with a narrower range of scores and low‐weighted kappa scores. Although recipients play a key role in ensuring a high‐quality sign‐out by paying close attention, ensuring it is a bidirectional conversation, asking appropriate questions, and reading back key information, it may be that evaluators were unable to place these activities within the same domains that were used for the provider evaluation. An altogether different recipient evaluation approach may be necessary.[41]
In general, scores were clustered at the top of the score range, as is typical for evaluations. One strategy to spread out scores further would be to refine the tool by adding anchors for satisfactory performance not just the extremes. A second approach might be to reduce the grading scale to only 3 points (unsatisfactory, satisfactory, superior) to force more scores to the middle. However, this approach might limit the discrimination ability of the tool.
We have previously studied the use of this tool among nurses. In that study, we also found consistently higher scores by peers than by external evaluators. We did, however, find a positive effect of experience, in which more experienced nurses received higher scores on average. We did not observe a similar training effect in this study. There are several possible explanations for the lack of a training effect. It is possible that the types of handoffs assessed played a role. At UCM, some assessed handoffs were night staff to day staff, which might be lower quality than day staff to night staff handoffs, whereas at Yale, all handoffs were day to night teams. Thus, average scores at UCM (primarily hospitalists) might have been lowered by the type of handoff provided. Given that hospitalist evaluations were conducted exclusively at UCM and housestaff evaluations exclusively at Yale, lack of difference between hospitalists and housestaff may also have been related to differences in evaluation practice or handoff practice at the 2 sites, not necessarily related to training level. Third, in our experience, attending physicians provide briefer less‐comprehensive sign‐outs than trainees, particularly when communicating with equally experienced attendings; these sign‐outs may appropriately be scored lower on the tool. Fourth, the great majority of the hospitalists at UCM were within 5 years of residency and therefore not very much more experienced than the trainees. Finally, it is possible that skills do not improve over time given widespread lack of observation and feedback during training years for this important skill.
The high internal consistency of most of the subdomains and the loading of all subdomains except setting onto 1 factor are evidence of convergent construct validity, but also suggest that evaluators have difficulty distinguishing among components of sign‐out quality. Internal consistency may also reflect a halo effect, in which scores on different domains are all influenced by a common overall judgment.[42] We are currently testing a shorter version of the tool including domains only for content, professionalism, and setting in addition to overall score. The fact that setting did not correlate as well with the other domains suggests that sign‐out practitioners may not have or exercise control over their surroundings. Consequently, it may ultimately be reasonable to drop this domain from the tool, or alternatively, to refocus on the need to ensure a quiet setting during sign‐out skills training.
There are several limitations to this study. External evaluations were conducted by personnel who were not familiar with the patients, and they may therefore have overestimated the quality of sign‐out. Studying different types of physicians at different sites might have limited our ability to identify differences by training level. As is commonly seen in evaluation studies, scores were skewed to the high end, although we did observe some use of the full range of the tool. Finally, we were limited in our ability to test inter‐rater reliability because of the multiple sources of variability in the data (numerous different raters, with different backgrounds at different settings, rating different individuals).
In summary, we developed a handoff evaluation tool that was easily completed by housestaff and attendings without training, that performed similarly in a variety of different settings at 2 institutions, and that can in principle be used either for peer evaluations or for external evaluations, although peer evaluations may be positively biased. Further work will be done to refine and simplify the tool.
ACKNOWLEDGMENTS
Disclosures: Development and evaluation of the sign‐out CEX was supported by a grant from the Agency for Healthcare Research and Quality (1R03HS018278‐01). Dr. Arora is supported by a National Institute on Aging (K23 AG033763). Dr. Horwitz is supported by the National Institute on Aging (K08 AG038336) and by the American Federation for Aging Research through the Paul B. Beeson Career Development Award Program. Dr. Horwitz is also a Pepper Scholar with support from the Claude D. Pepper Older Americans Independence Center at Yale University School of Medicine (P30AG021342 NIH/NIA). No funding source had any role in the study design; in the collection, analysis, and interpretation of data; in the writing of the report; or in the decision to submit the article for publication. The content is solely the responsibility of the authors and does not necessarily represent the official views of the Agency for Healthcare Research and Quality, the National Institute on Aging, the National Institutes of Health, or the American Federation for Aging Research. Dr. Horwitz had full access to all of the data in the study and takes responsibility for the integrity of the data and the accuracy of the data analysis. An earlier version of this work was presented as a poster presentation at the Society of General Internal Medicine Annual Meeting in Orlando, Florida on May 9, 2012. Dr. Rand is now with the Department of Medicine, University of Vermont College of Medicine, Burlington, Vermont. Mr. Staisiunas is now with the Law School, Marquette University, Milwaukee, Wisconsin. The authors declare they have no conflicts of interest.
Appendix
A
PROVIDER HAND‐OFF CEX TOOL
RECIPIENT HAND‐OFF CEX TOOL
Appendix
B
Handoff CEX scores by site of evaluation
| Domain | Provider | Recipient | ||||
| Median (Range) | P‐value | Median (Range) | P‐value | |||
| UC | Yale | UC | Yale | |||
| N=172 | N=170 | N=163 | N=167 | |||
| Setting | 7 (29) | 7 (39) | 0.32 | 7 (29) | 7 (39) | 0.36 |
| Organization | 8 (29) | 7 (39) | 0.30 | 7 (29) | 8 (59) | 0.001 |
| Communication | 7 (19) | 7 (39) | 0.67 | 7 (29) | 8 (49) | 0.03 |
| Content | 7 (29) | 7 (29) | N/A | N/A | N/A | |
| Judgment | 8 (39) | 7 (39) | 0.60 | 7 (39) | 8 (49) | 0.001 |
| Professionalism | 8 (29) | 8 (39) | 0.67 | 8 (39) | 8 (49) | 0.35 |
| Overall | 7 (29) | 7 (39) | 0.41 | 7 (29) | 8 (49) | 0.005 |
Appendix
C
Spearman correlation, recipients (N=330)
| SpearmanCorrelationCoefficients | |||||
| Setting | Organization | Communication | Judgment | Professionalism | |
| Setting | 1.0 | 0.46 | 0.48 | 0.47 | 0.40 |
| Organization | 0.46 | 1.00 | 0.78 | 0.75 | 0.75 |
| Communication | 0.48 | 0.78 | 1.00 | 0.85 | 0.77 |
| Judgment | 0.47 | 0.75 | 0.85 | 1.00 | 0.74 |
| Professionalism | 0.40 | 0.75 | 0.77 | 0.74 | 1.00 |
| Overall | 0.60 | 0.77 | 0.84 | 0.82 | 0.77 |
All p values <0.0001
Appendix
D
Factor analysis results for provider evaluations
| Rotated Factor Pattern (Standardized Regression Coefficients) N=336 | ||
| Factor1 | Factor2 | |
| Organization | 0.64 | 0.27 |
| Communication | 0.79 | 0.16 |
| Content | 0.82 | 0.06 |
| Judgment | 0.86 | 0.06 |
| Professionalism | 0.66 | 0.23 |
| Setting | 0.18 | 0.29 |
- , , , . Transfers of patient care between house staff on internal medicine wards: a national survey. Arch Intern Med. 2006;166(11):1173–1177.
- Accreditation Council for Graduate Medical Education. Common program requirements. 2011; http://www.acgme‐2010standards.org/pdf/Common_Program_Requirements_07012011.pdf. Accessed August 23, 2011.
- , , , , . Does housestaff discontinuity of care increase the risk for preventable adverse events? Ann Intern Med. 1994;121(11):866–872.
- , , . Communication failures: an insidious contributor to medical mishaps. Acad Med. 2004;79(2):186–194.
- , , , , . Communication failures in patient sign‐out and suggestions for improvement: a critical incident analysis. Qual Saf Health Care. 2005;14(6):401–407.
- , , , , . Consequences of inadequate sign‐out for patient care. Arch Intern Med. 2008;168(16):1755–1760.
- , , , . Adequacy of information transferred at resident sign‐out (in‐hospital handover of care): a prospective survey. Qual Saf Health Care. 2008;17(1):6–10.
- , , , , . What are covering doctors told about their patients? Analysis of sign‐out among internal medicine house staff. Qual Saf Health Care. 2009;18(4):248–255.
- , . Using direct observation, formal evaluation, and an interactive curriculum to improve the sign‐out practices of internal medicine interns. Acad Med. 2010;85(7):1182–1188.
- , , , . Doctors' handovers in hospitals: a literature review. Qual Saf Health Care. 2011;20(2):128–133.
- , , , et al. Resident sign‐out and patient hand‐offs: opportunities for improvement. Teach Learn Med. 2011;23(2):105–111.
- , , , et al. Use of an appreciative inquiry approach to improve resident sign‐out in an era of multiple shift changes. J Gen Intern Med. 2012;27(3):287–291.
- , , , , , . Validation of a handoff assessment tool: the Handoff CEX [published online ahead of print June 7, 2012]. J Clin Nurs. doi: 10.1111/j.1365–2702.2012.04131.x.
- , , , . The mini‐CEX (clinical evaluation exercise): a preliminary investigation. Ann Intern Med. 1995;123(10):795–799.
- , , , . Examiner differences in the mini‐CEX. Adv Health Sci Educ Theory Pract. 1997;2(1):27–33.
- , , , . Assessing the reliability and validity of the mini‐clinical evaluation exercise for internal medicine residency training. Acad Med. 2002;77(9):900–904.
- , , , , . Construct validity of the miniclinical evaluation exercise (miniCEX). Acad Med. 2003;78(8):826–830.
- , , , , , . Dropping the baton: a qualitative analysis of failures during the transition from emergency department to inpatient care. Ann Emerg Med. 2009;53(6):701–710.e4.
- , , . Development and implementation of an oral sign‐out skills curriculum. J Gen Intern Med. 2007;22(10):1470–1474.
- , , , . Mixed methods evaluation of oral sign‐out practices. J Gen Intern Med. 2007;22(S1):S114.
- , , , et al. Evaluation of an asynchronous physician voicemail sign‐out for emergency department admissions. Ann Emerg Med. 2009;54(3):368–378.
- , , , et al. An institution‐wide handoff task force to standardise and improve physician handoffs. BMJ Qual Saf. 2012;21(10):863–871.
- , . A model for building a standardized hand‐off protocol. Jt Comm J Qual Patient Saf. 2006;32(11):646–655.
- , , , , . Medication discrepancies in resident sign‐outs and their potential to harm. J Gen Intern Med. 2007;22(12):1751–1755.
- , , , . A theoretical framework and competency‐based approach to improving handoffs. Qual Saf Health Care. 2008;17(1):11–14.
- , , , , , . Hospitalist handoffs: a systematic review and task force recommendations. J Hosp Med. 2009;4(7):433–440.
- , , , , . Interns overestimate the effectiveness of their hand‐off communication. Pediatrics. 2010;125(3):491–496.
- , . Improving clinical handovers: creating local solutions for a global problem. Qual Saf Health Care. 2009;18(4):244–245.
- , , , , . Managing discontinuity in academic medical centers: strategies for a safe and effective resident sign‐out. J Hosp Med. 2006;1(4):257–266.
- , , . Standardized sign‐out reduces intern perception of medical errors on the general internal medicine ward. Teach Learn Med. 2009;21(2):121–126.
- , , . SBAR: a shared mental model for improving communication between clinicians. Jt Comm J Qual Patient Saf. 2006;32(3):167–175.
- . Structuring flexibility: the potential good, bad and ugly in standardisation of handovers. Qual Saf Health Care. 2008;17(1):4–5.
- , , , , . Handoff strategies in settings with high consequences for failure: lessons for health care operations. Int J Qual Health Care. 2004;16(2):125–132.
- , , , , , . Residents' perceptions of professionalism in training and practice: barriers, promoters, and duty hour requirements. J Gen Intern Med. 2006;21(7):758–763.
- , . Communication behaviours in a hospital setting: an observational study. BMJ. 1998;316(7132):673–676.
- , , , , . Communication loads on clinical staff in the emergency department. Med J Aust. 2002;176(9):415–418.
- , . A systematic review of failures in handoff communication during intrahospital transfers. Jt Comm J Qual Patient Saf. 2011;37(6):274–284.
- , , , et al. Hand‐off education and evaluation: piloting the observed simulated hand‐off experience (OSHE). J Gen Intern Med. 2010;25(2):129–134.
- , , , et al. Handoffs causing patient harm: a survey of medical and surgical house staff. Jt Comm J Qual Patient Saf. 2008;34(10):563–570.
- , , . A prospective observational study of physician handoff for intensive‐care‐unit‐to‐ward patient transfers. Am J Med. 2011;124(9):860–867.
- , , , , . Characterizing physician listening behavior during hospitalist handoffs using the HEAR checklist (published online ahead of print December 20, 2012]. BMJ Qual Saf. doi:10.1136/bmjqs‐2012‐001138.
- . A constant error in psychological ratings. J Appl Psychol. 1920;4(1):25.
Copyright © 2013 Society of Hospital Medicine
Sleep in Hospitalized Adults
Lack of sleep is a common problem in hospitalized patients and is associated with poorer health outcomes, especially in older patients.[1, 2, 3] Prior studies highlight a multitude of factors that can result in sleep loss in the hospital[3, 4, 5, 6] with 1 of the most common causes of sleep disruption in the hospital being noise.[7, 8, 9]
In addition to external factors, such as hospital noise, there may be inherent characteristics that predispose certain patients to greater sleep loss when hospitalized. One such measure is the construct of perceived control or the psychological measure of how much individuals expect themselves to be capable of bringing about desired outcomes.[10] Among older patients, low perceived control is associated with increased rates of physician visits, hospitalizations, and death.[11, 12] In contrast, patients who feel more in control of their environment may experience positive health benefits.[13]
Yet, when patients are placed in a hospital setting, they experience a significant reduction in control over their environment along with an increase in dependency on medical staff and therapies.[14, 15] For example, hospitalized patients are restricted in their personal decisions, such as what clothes they can wear and what they can eat and are not in charge of their own schedules, including their sleep time.
Although prior studies suggest that perceived control over sleep is related to actual sleep among community‐dwelling adults,[16, 17] no study has examined this relationship in hospitalized adults. Therefore, the aim of our study was to examine the possible association between perceived control, noise levels, and sleep in hospitalized middle‐aged and older patients.
METHODS
Study Design
We conducted a prospective cohort study of subjects recruited from a large ongoing study of admitted patients at the University of Chicago inpatient general medicine service.[18] Because we were interested in middle‐aged and older adults who are most sensitive to sleep disruptions, patients who were age 50 years and over, ambulatory, and living in the community were eligible for the study.[19] Exclusion criteria were cognitive impairment (telephone version of the Mini‐Mental State Exam <17 out of 22), preexisting sleeping disorders identified via patient charts, such as obstructive sleep apnea and narcolepsy, transfer from the intensive care unit (ICU), and admission to the hospital more than 72 hours prior to enrollment.[20] These inclusion and exclusion criteria were selected to identify a patient population with minimal sleep disturbances at baseline. Patients under isolation were excluded because they are not visited as frequently by the healthcare team.[21, 22] Most general medicine rooms were double occupancy but efforts were made to make patient rooms single when possible or required (ie, isolation for infection control). The study was approved by the University of Chicago Institutional Review Board.
Subjective Data Collection
Baseline levels of perceived control over sleep, or the amount of control patients believe they have over their sleep, were assessed using 2 different scales. The first tool was the 8‐item Sleep Locus of Control (SLOC) scale,[17] which ranges from 8 to 48, with higher values corresponding to a greater internal locus of control over sleep. An internal sleep locus of control indicates beliefs that patients feel that they are primarily responsible for their own sleep as opposed to an external locus of control which indicates beliefs that good sleep is due to luck or chance. For example, patients were asked how strongly they agree or disagree with statements, such as, If I take care of myself, I can avoid insomnia and People who never get insomnia are just plain lucky (see Supporting Information, Appendix 2, in the online version of this article). The second tool was the 9‐item Sleep Self‐Efficacy (SSE) scale,[23] which ranges from 9 to 45, with higher values corresponding to greater confidence patients have in their ability to sleep. One of the items asks, How confident are you that you can lie in bed feeling physically relaxed (see Supporting Information, Appendix 1, in the online version of this article)? Both instruments have been validated in an outpatient setting.[23] These surveys were given immediately on enrollment in the study to measure baseline perceived control.
Baseline sleep habits were also collected on enrollment using the Epworth Sleepiness Scale,[24, 25] a standard validated survey that assesses excess daytime sleepiness in various common situations. For each day in the hospital, patients were asked to report in‐hospital sleep quality using the Karolinska Sleep Log.[26] The Karolinska Sleep Quality Index (KSQI) is calculated from 4 items on the Karolinska Sleep Log (sleep quality, sleep restlessness, slept throughout the night, ease of falling asleep). The questions are on a 5‐point scale and the 4 items are averaged for a final score out of 5 with a higher number indicating better subjective sleep quality. The item How much was your sleep disturbed by noise? on the Karolinska Sleep Log was used to assess the degree to which noise was a disruptor of sleep. This question was also on a 5‐point scale with higher scores indicating greater disruptiveness of noise. Patients were also asked how disruptive noise from roommates was on a nightly basis using this same scale.
Objective Data Collection
Wrist activity monitors (Actiwatch 2; Respironics, Inc., Murrysville, PA)[27, 28, 29, 30] were used to measure patient sleep. Actiware 5 software (Respironics, Inc.)[31] was used to estimate quantitative measures of sleep time and efficiency. Sleep time is defined as the total duration of time spent sleeping at night and sleep efficiency is defined as the fraction of time, reported as a percentage, spent sleeping by actigraphy out of the total time patients reported they were sleeping.
Sound levels in patient rooms were recorded using Larson Davis 720 Sound Level Monitors (Larson Davis, Inc., Provo, UT). These monitors store functional average sound pressure levels in A‐weighted decibels called the Leq over 1‐hour intervals. The Leq is the average sound level over the given time interval. Minimum (Lmin) and maximum (Lmax) sound levels are also stored. The LD SLM Utility Program (Larson Davis, Inc.) was used to extract the sound level measurements recorded by the monitors.
Demographic information (age, gender, race, ethnicity, highest level of education, length of stay in the hospital, and comorbidities) was obtained from hospital charts via an ongoing study of admitted patients at the University of Chicago Medical Center inpatient general medicine service.[18] Chart audits were performed to determine whether patients received pharmacologic sleep aids in the hospital.
Data Analysis
Descriptive statistics were used to summarize mean sleep duration and sleep efficiency in the hospital as well as SLOC and SSE. Because the SSE scores were not normally distributed, the scores were dichotomized at the median to create a variable denoting high and low SSE. Additionally, because the distribution of responses to the noise disruption question was skewed to the right, reports of noise disruptions were grouped into not disruptive (score=1) and disruptive (score>1).
Two‐sample t tests with equal variances were used to assess the relationship between perceived control measures (high/low SLOC, SSE) and objective sleep measures (sleep time, sleep efficiency). Multivariate linear regression was used to test the association between high SSE (independent variable) and sleep time (dependent variable), clustering for multiple nights of data within the subject. Multivariate logistic regression, also adjusting for subject, was used to test the association between high SSE and noise disruptiveness and the association between high SSE and Karolinska scores. Leq, Lmax, and Lmin were all tested using stepwise forward regression. Because our prior work[9] demonstrated that noise levels separated into tertiles were significantly associated with sleep time, our analysis also used noise levels separated into tertiles. Stepwise forward regression was used to add basic patient demographics (gender, race, age) to the models. Statistical significance was defined as P<0.05, and all statistical analysis was done using Stata 11.0 (StataCorp, College Station, TX).
RESULTS
From April 2010 to May 2012, 1134 patients were screened by study personnel for this study via an ongoing study of hospitalized patients on the inpatient general medicine ward. Of the 361 (31.8%) eligible patients, 206 (57.1%) consented to participate. Of the subjects enrolled in the study, 118 were able to complete at least 1 night of actigraphy, sound monitoring, and subjective assessment for a total of 185 patient nights (Figure 1).
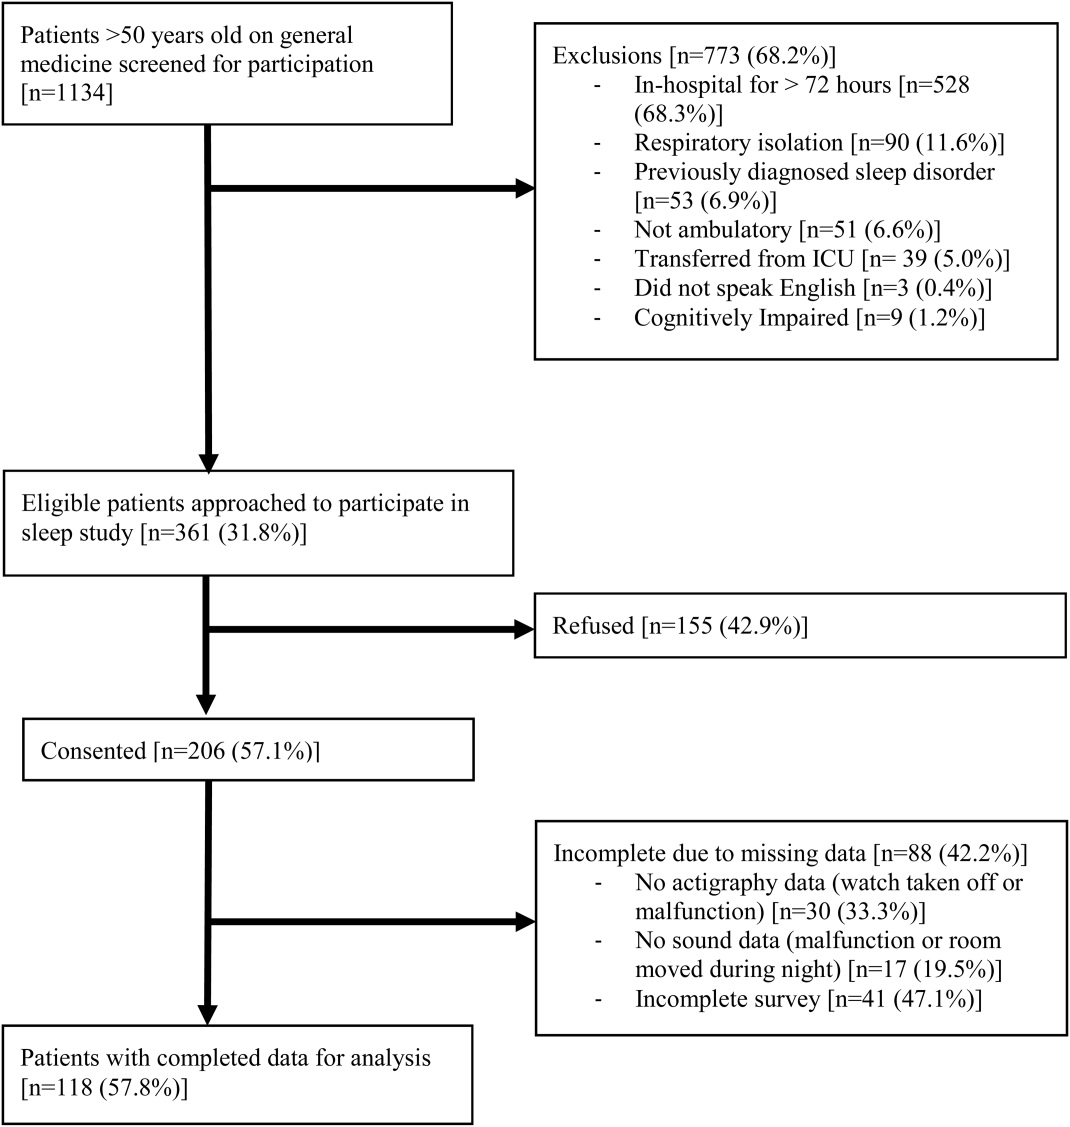
The majority of patients were female (57%), African American (67%), and non‐Hispanic (97%). The mean age was 65 years (standard deviation [SD], 11.6 years), and the median length of stay was 4 days (interquartile range [IQR], 36). The majority of patients also had hypertension (67%), with chronic obstructive pulmonary disease [COPD] (31%) and congestive heart failure (31%) being the next most common comorbidities. About two‐thirds of subjects (64%) were characterized as average or above average sleepers with Epworth Sleepiness Scale scores 9[20] (Table 1). Only 5% of patients received pharmacological sleep aids.
| Value, n (%)a | |
|---|---|
| |
| Patient characteristics | |
| Age, mean (SD), y | 63 (12) |
| Length of stay, median (IQR), db | 4 (36) |
| Female | 67 (57) |
| African American | 79 (67) |
| Hispanic | 3 (3) |
| High school graduate | 92 (78) |
| Comorbidities | |
| Hypertension | 79 (66) |
| Chronic obstructive pulmonary disease | 37 (31) |
| Congestive heart failure | 37 (31) |
| Diabetes | 36 (30) |
| End stage renal disease | 23 (19) |
| Baseline sleep characteristics | |
| Sleep duration, mean (SD), minc | 333 (128) |
| Epworth Sleepiness Scale, score 9d | 73 (64) |
The mean baseline SLOC score was 30.4 (SD, 6.7), with a median of 31 (IQR, 2735). The mean baseline SSE score was 32.1 (SD, 9.4), with a median of 34 (IQR, 2441). Fifty‐four patients were categorized as having high sleep self‐efficacy (high SSE), which we defined as scoring above the median of 34.
Average in‐hospital sleep was 5.5 hours (333 minutes; SD, 128 minutes) which was significantly shorter than the self‐reported sleep duration of 6.5 hours prior to admission (387 minutes, SD, 125 minutes; P=0.0001). The mean sleep efficiency was 73% (SD, 19%) with 55% of actigraphy nights below the normal range of 80% efficiency for adults.[19] Median KSQI was 3.5 (IQR, 2.254.75), with 41% of the patients with a KSQI 3, putting them in the insomniac range.[32] The median score on the noise disruptiveness question was 1 (IQR, 14) with 42% of reports coded as disruptive defined as a score >1 on the 5‐point scale. The median score on the roommate disruptiveness question was 1 (IQR, 11) with 77% of responses coded as not disruptive defined as a score of 1 on the 5‐point scale.
A 2‐sample t test with equal variances showed that those patients reporting high SSE were more likely to sleep longer in the hospital than those reporting low SSE (364 minutes 95% confidence interval [CI]: 340, 388 vs 309 minutes 95% CI: 283, 336; P=0.003) (Figure 2). Patients with high SSE were also more likely to have a normal sleep efficiency (above 80%) compared to those with low SSE (54% 95% CI: 43, 65 vs 38% 95% CI: 28,47; P=0.028). Last, there was a trend toward patients reporting higher SSE to also report less noise disruption compared to those patients with low SSE ([42%] 95% CI: 31, 53 vs [56%] 95% CI: 46, 65; P=0.063) (Figure 3).
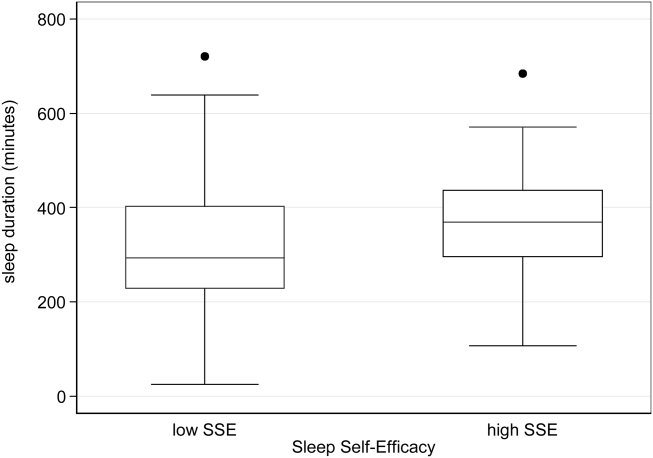
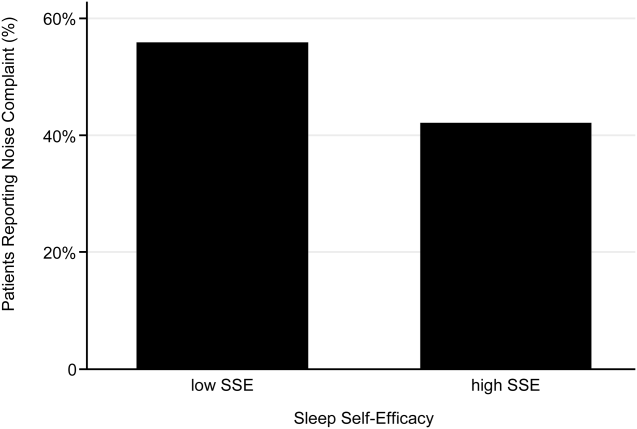
Linear regression clustered by subject showed that high SSE was associated with longer sleep duration (55 minutes 95% CI: 14, 97; P=0.010). Furthermore, high SSE was significantly associated with longer sleep duration after controlling for both objective noise level and patient demographics in the model using stepwise forward regression (50 minutes 95% CI: 11, 90; P=0.014) (Table 2).
| Sleep Duration (min) | Model 1 Beta [95% CI]a | Model 2 Beta [95% CI]a |
|---|---|---|
| ||
| High SSE | 55 [14, 97]b | 50 [11, 90]b |
| Lmin tert 3 | 14 [59, 29] | |
| Lmin tert 2 | 21 [65, 23] | |
| Female | 49 [10, 89]b | |
| African American | 16 [59, 27] | |
| Age | 1 [0.9, 3] | |
| Karolinska Sleep Quality | Model 1 OR [95% CI]c | Model 2 OR [95% CI]c |
| High SSE | 2.04 [1.12, 3.71]b | 2.01 [1.06, 3.79]b |
| Lmin tert 3 | 0.90 [0.37, 2.2] | |
| Lmin tert 2 | 0.86 [0.38, 1.94] | |
| Female | 1.78 [0.90, 3.52] | |
| African American | 1.19 [0.60, 2.38] | |
| Age | 1.02 [0.99, 1.05] | |
| Noise Complaints | Model 1 OR [95% CI]d | Model 2 OR [95% CI]d |
| High SSE | 0.57 [0.30, 1.12] | 0.49 [0.25, 0.96]b |
| Lmin tert 3 | 0.85 [0.39, 1.84] | |
| Lmin tert 2 | 0.91 [0.43, 1.93] | |
| Female | 1.40 [0.71, 2.78] | |
| African American | 0.35 [0.17, 0.70] | |
| Age | 1.00 [0.96, 1.03] | |
| Age2e | 1.00 [1.00, 1.00] | |
Logistic regression clustered by subject demonstrated that patients with high SSE had 2 times higher odds of having a KSQI score above 3 (95% CI: 1.12, 3.71; P=0.020). This association was still significant after controlling for noise and patient demographics (OR: 2.01; 95% CI: 1.06, 3.79; P=0.032). After controlling for noise levels and patient demographics, there was a statistically significant association between high SSE and lower odds of noise complaints (OR: 0.49; 95% CI: 0.25, 0.96; P=0.039) (Table 2). Although demographic characteristics were not associated with high SSE, those patients with high SSE had lower odds of being in the loudest tertile rooms (OR: 0.34; 95% CI: 0.15, 0.74; P=0.007).
In multivariate linear regression analyses, there were no significant relationships between SLOC scores and KSQI, reported noise disruptiveness, and markers of sleep (sleep duration or sleep efficiency).
DISCUSSION
This study is the first to examine the relationship between perceived control, noise levels, and objective measurements of sleep in a hospital setting. One measure of perceived control, namely SSE, was associated with objective sleep duration, subjective and objective sleep quality, noise levels in patient rooms, and perhaps also patient complaints of noise. These associations remained significant after controlling for objective noise levels and patient demographics, suggesting that SSE is independently related to sleep.
In contrast to SSE, SLOC was not found to be significantly associated with either subjective or objective measures of sleep quality. The lack of association may be due to the fact that the SLOC questionnaire does not translate as well to the inpatient setting as the SSE questionnaire. The SLOC questionnaire focuses on general beliefs about sleep whereas the SSE questionnaire focuses on personal beliefs about one's own ability sleep in the immediate future, which may make it more relevant in the inpatient setting (see Supporting Information, Appendix 1 and 2, in the online version of this article).
Given our findings, it is important to identify why patients with high SSE have better sleep and fewer noise complaints. One possibility is that sleep self‐efficacy is an inherited trait unique to each person that is also predictive of a patient's sleep patterns. However, is it also possible that those patients with high SSE feel more empowered to take control of their environment, allowing them to advocate for better sleep? This hypothesis is further strengthened by the finding that those patients with high SSE on study entry were less likely to be in the noisiest rooms. This raises the possibility that at least 1 of the mechanisms by which high SSE may be protective against sleep loss is through patients taking an active role in noise reduction, such as closing the door or advocating for their sleep with staff. However, we did not directly observe or ask patients whether doors of patient rooms were open or closed or whether the patients took other measures to advocate for their own sleep. Thus, further work is necessary to understand the mechanisms by which sleep self‐efficacy may influence sleep.
One potential avenue for future research is to explore possible interventions for boosting sleep self‐efficacy in the hospital. Although most interventions have focused on environmental noise and staff‐based education, empowering patients through boosting SSE may be a helpful adjunct to improving hospital sleep.[33, 34] Currently, the SSE scale is not commonly used in the inpatient setting. Motivational interviewing and patient coaching could be explored as potential tools for boosting SSE. Furthermore, even if SSE is not easily changed, measuring SSE in patients newly admitted to the hospital may be useful in identifying patients most susceptible to sleep disruptions. Efforts to identify patients with low SSE should go hand‐in‐hand with measures to reduce noise. Addressing both patient‐level and environmental factors simultaneously may be the best strategy for improving sleep in an inpatient hospital setting.
In contrast to our prior study, it is worth noting that we did not find any significant relationships between overall noise levels and sleep.[9] In this dataset, nighttime noise is still a predictor of sleep loss in the hospital. However, when we restrict our sample to those who answered the SSE questionnaire and had nighttime noise recorded, we lose a significant number of observations. Because of our interest in testing the relationship between SSE and sleep, we chose to control for overall noise (which enabled us to retain more observations). We also did not find any interactions between SSE and noise in our regression models. Further work is warranted with larger sample sizes to better understand the role of SSE in the context of sleep and noise levels. In addition, females also received more sleep than males in our study.
There are several limitations to this study. This study was carried out at a single service at a single institution, limiting the ability to generalize the findings to other hospital settings. This study had a relatively high rate of patients who were unable to complete at least 1 night of data collection (42%), often due to watch removal for imaging or procedures, which may also affect the representativeness of our sample. Moreover, we can only examine associations and not causal relationships. The SSE scale has never been used in hospitalized patients, making comparisons between scores from hospitalized patients and population controls difficult. In addition, the SSE scale also has not been dichotomized in previous studies into high and low SSE. However, a sensitivity analysis with raw SSE scores did not change the results of our study. It can be difficult to perform actigraphy measurements in the hospital because many patients spend most of their time in bed. Because we chose a relatively healthy cohort of patients without significant limitations in mobility, actigraphy could still be used to differentiate time spent awake from time spent sleeping. Because we did not perform polysomnography, we cannot explore the role of sleep architecture which is an important component of sleep quality. Although the use of pharmacologic sleep aids is a potential confounding factor, the rate of use was very low in our cohort and unlikely to significantly affect our results. Continued study of this patient population is warranted to further develop the findings.
In conclusion, patients with high SSE sleep better in the hospital, tend to be in quieter rooms, and may report fewer noise complaints. Our findings suggest that a greater confidence in the ability to sleep may be beneficial in hospitalized adults. In addition to noise control, hospitals should also consider targeting patients with low SSE when designing novel interventions to improve in‐hospital sleep.
Disclosures
This work was supported by funding from the National Institute on Aging through a Short‐Term Aging‐Related Research Program (1 T35 AG029795), National Institute on Aging career development award (K23AG033763), a midcareer career development award (1K24AG031326), a program project (P01AG‐11412), an Agency for Healthcare Research and Quality Centers for Education and Research on Therapeutics grant (1U18HS016967), and a National Institute on Aging Clinical Translational Sciences award (UL1 RR024999). Dr. Arora had full access to all of the data in the study and takes responsibility for the integrity of the data and the accuracy of the statistical analysis. The funding agencies had no role in the design of the study; the collection, analysis, and interpretation of the data; or the decision to approve publication of the finished manuscript. The authors report no conflicts of interest.
- , , , . The metabolic consequences of sleep deprivation. Sleep Med Rev. 2007;11(3):163–178.
- , , , , , . Poor self‐reported sleep quality predicts mortality within one year of inpatient post‐acute rehabilitation among older adults. Sleep. 2011;34(12):1715–1721.
- , , , et al. The sleep of older people in hospital and nursing homes. J Clin Nurs. 1999;8:360–368.
- , , et al. Sleep in hospitalized medical patients, part 1: factors affecting sleep. J Hosp Med. 2008; 3:473–482.
- , , , et al. Nocturnal care interactions with patients in critical care units. Am J Crit Care. 2004;13:102–112; quiz 114–115.
- , , . Patient perception of sleep quality and etiology of sleep disruption in the intensive care unit. Am J Respir Crit Care Med. 1999;159:1155–1162.
- . Sleep in acute care settings: an integrative review. J Nurs Scholarsh. 2000;32(1):31–38.
- , , , et al. Sleep disruption due to hospital noises: a prospective evaluation. Ann Int Med. 2012;157(3): 170–179.
- , , , et al. Noise and sleep among adult medical inpatients: far from a quiet night. Arch Intern Med. 2012;172:68–70.
- . Generalized expectancies for internal versus external control of reinforcement. Psychol Monogr. 1966;80:1–28.
- , . Psychosocial risk factors and mortality: a prospective study with special focus on social support, social participation, and locus of control in Norway. J Epidemiol Community Health. 1998;52:476–481.
- , . The interactive effect of perceived control and functional status on health and mortality among young‐old and old‐old adults. J Gerontol B Psychol Sci Soc Sci. 1997;52:P118–P126.
- , . Role‐specific feelings of control and mortality. Psychol Aging. 2000;15:617–626.
- , , . Patient empowerment in intensive care—an interview study. Intensive Crit Care Nurs. 2006;22:370–377.
- , , . Exploring the relationship between personal control and the hospital environment. J Clin Nurs. 2008;17:1601–1609.
- , , , et al. Effects of volitional lifestyle on sleep‐life habits in the aged. Psychiatry Clin Neurosci. 1998;52:183–184.
- , , , et al. Sleep locus of control: report on a new scale. Behav Sleep Med. 2004;2:79–93.
- , , , et al. Effects of physician experience on costs and outcomes on an academic general medicine service: results of a trial of hospitalists. Ann Intern Med. 2002;137:866–874.
- , , , et al. The effects of age, sex, ethnicity, and sleep‐disordered breathing on sleep architecture. Arch Intern Med. 2004;164:406–418.
- , , , et al. Validation of a telephone version of the mini‐mental state examination. J Am Geriatr Soc. 1992;40:697–702.
- , , , et al. Contact isolation in surgical patients: a barrier to care? Surgery. 2003;134:180–188.
- , . Adverse effects of contact isolation. Lancet. 1999;354:1177–1178.
- . Behavioral Treatment for Persistent Insomnia. Elmsford, NY: Pergamon Press; 1987.
- . A new method for measuring daytime sleepiness: the Epworth sleepiness scale. Sleep. 1991;14:540–545.
- . Reliability and factor analysis of the Epworth Sleepiness Scale. Sleep. 1992;15:376–381.
- , . Objective components of individual differences in subjective sleep quality. J Sleep Res. 1997;6:217–220.
- , , , et al. The role of actigraphy in the study of sleep and circadian rhythms. Sleep. 2003;26:342–392.
- , , , et al. Practice parameters for the use of actigraphy in the assessment of sleep and sleep disorders: an update for 2007. Sleep. 2007;30:519–529.
- , , , et al. The role of actigraphy in the evaluation of sleep disorders. Sleep. 1995;18:288–302.
- , , , et al. Clinical review: sleep measurement in critical care patients: research and clinical implications. Crit Care. 2007;11:226.
- , , , et al. Evaluation of immobility time for sleep latency in actigraphy. Sleep Med. 2009;10:621–625.
- , , , et al. The subjective meaning of sleep quality: a comparison of individuals with and without insomnia. Sleep. 2008;31:383–393.
- , , , et al. Sleep in hospitalized medical patients, part 2: behavioral and pharmacological management of sleep disturbances. J Hosp Med. 2009;4:50–59.
- , , , . A nonpharmacologic sleep protocol for hospitalized older patients. J Am Geriatr Soc. 1998;46(6):700–705.
Lack of sleep is a common problem in hospitalized patients and is associated with poorer health outcomes, especially in older patients.[1, 2, 3] Prior studies highlight a multitude of factors that can result in sleep loss in the hospital[3, 4, 5, 6] with 1 of the most common causes of sleep disruption in the hospital being noise.[7, 8, 9]
In addition to external factors, such as hospital noise, there may be inherent characteristics that predispose certain patients to greater sleep loss when hospitalized. One such measure is the construct of perceived control or the psychological measure of how much individuals expect themselves to be capable of bringing about desired outcomes.[10] Among older patients, low perceived control is associated with increased rates of physician visits, hospitalizations, and death.[11, 12] In contrast, patients who feel more in control of their environment may experience positive health benefits.[13]
Yet, when patients are placed in a hospital setting, they experience a significant reduction in control over their environment along with an increase in dependency on medical staff and therapies.[14, 15] For example, hospitalized patients are restricted in their personal decisions, such as what clothes they can wear and what they can eat and are not in charge of their own schedules, including their sleep time.
Although prior studies suggest that perceived control over sleep is related to actual sleep among community‐dwelling adults,[16, 17] no study has examined this relationship in hospitalized adults. Therefore, the aim of our study was to examine the possible association between perceived control, noise levels, and sleep in hospitalized middle‐aged and older patients.
METHODS
Study Design
We conducted a prospective cohort study of subjects recruited from a large ongoing study of admitted patients at the University of Chicago inpatient general medicine service.[18] Because we were interested in middle‐aged and older adults who are most sensitive to sleep disruptions, patients who were age 50 years and over, ambulatory, and living in the community were eligible for the study.[19] Exclusion criteria were cognitive impairment (telephone version of the Mini‐Mental State Exam <17 out of 22), preexisting sleeping disorders identified via patient charts, such as obstructive sleep apnea and narcolepsy, transfer from the intensive care unit (ICU), and admission to the hospital more than 72 hours prior to enrollment.[20] These inclusion and exclusion criteria were selected to identify a patient population with minimal sleep disturbances at baseline. Patients under isolation were excluded because they are not visited as frequently by the healthcare team.[21, 22] Most general medicine rooms were double occupancy but efforts were made to make patient rooms single when possible or required (ie, isolation for infection control). The study was approved by the University of Chicago Institutional Review Board.
Subjective Data Collection
Baseline levels of perceived control over sleep, or the amount of control patients believe they have over their sleep, were assessed using 2 different scales. The first tool was the 8‐item Sleep Locus of Control (SLOC) scale,[17] which ranges from 8 to 48, with higher values corresponding to a greater internal locus of control over sleep. An internal sleep locus of control indicates beliefs that patients feel that they are primarily responsible for their own sleep as opposed to an external locus of control which indicates beliefs that good sleep is due to luck or chance. For example, patients were asked how strongly they agree or disagree with statements, such as, If I take care of myself, I can avoid insomnia and People who never get insomnia are just plain lucky (see Supporting Information, Appendix 2, in the online version of this article). The second tool was the 9‐item Sleep Self‐Efficacy (SSE) scale,[23] which ranges from 9 to 45, with higher values corresponding to greater confidence patients have in their ability to sleep. One of the items asks, How confident are you that you can lie in bed feeling physically relaxed (see Supporting Information, Appendix 1, in the online version of this article)? Both instruments have been validated in an outpatient setting.[23] These surveys were given immediately on enrollment in the study to measure baseline perceived control.
Baseline sleep habits were also collected on enrollment using the Epworth Sleepiness Scale,[24, 25] a standard validated survey that assesses excess daytime sleepiness in various common situations. For each day in the hospital, patients were asked to report in‐hospital sleep quality using the Karolinska Sleep Log.[26] The Karolinska Sleep Quality Index (KSQI) is calculated from 4 items on the Karolinska Sleep Log (sleep quality, sleep restlessness, slept throughout the night, ease of falling asleep). The questions are on a 5‐point scale and the 4 items are averaged for a final score out of 5 with a higher number indicating better subjective sleep quality. The item How much was your sleep disturbed by noise? on the Karolinska Sleep Log was used to assess the degree to which noise was a disruptor of sleep. This question was also on a 5‐point scale with higher scores indicating greater disruptiveness of noise. Patients were also asked how disruptive noise from roommates was on a nightly basis using this same scale.
Objective Data Collection
Wrist activity monitors (Actiwatch 2; Respironics, Inc., Murrysville, PA)[27, 28, 29, 30] were used to measure patient sleep. Actiware 5 software (Respironics, Inc.)[31] was used to estimate quantitative measures of sleep time and efficiency. Sleep time is defined as the total duration of time spent sleeping at night and sleep efficiency is defined as the fraction of time, reported as a percentage, spent sleeping by actigraphy out of the total time patients reported they were sleeping.
Sound levels in patient rooms were recorded using Larson Davis 720 Sound Level Monitors (Larson Davis, Inc., Provo, UT). These monitors store functional average sound pressure levels in A‐weighted decibels called the Leq over 1‐hour intervals. The Leq is the average sound level over the given time interval. Minimum (Lmin) and maximum (Lmax) sound levels are also stored. The LD SLM Utility Program (Larson Davis, Inc.) was used to extract the sound level measurements recorded by the monitors.
Demographic information (age, gender, race, ethnicity, highest level of education, length of stay in the hospital, and comorbidities) was obtained from hospital charts via an ongoing study of admitted patients at the University of Chicago Medical Center inpatient general medicine service.[18] Chart audits were performed to determine whether patients received pharmacologic sleep aids in the hospital.
Data Analysis
Descriptive statistics were used to summarize mean sleep duration and sleep efficiency in the hospital as well as SLOC and SSE. Because the SSE scores were not normally distributed, the scores were dichotomized at the median to create a variable denoting high and low SSE. Additionally, because the distribution of responses to the noise disruption question was skewed to the right, reports of noise disruptions were grouped into not disruptive (score=1) and disruptive (score>1).
Two‐sample t tests with equal variances were used to assess the relationship between perceived control measures (high/low SLOC, SSE) and objective sleep measures (sleep time, sleep efficiency). Multivariate linear regression was used to test the association between high SSE (independent variable) and sleep time (dependent variable), clustering for multiple nights of data within the subject. Multivariate logistic regression, also adjusting for subject, was used to test the association between high SSE and noise disruptiveness and the association between high SSE and Karolinska scores. Leq, Lmax, and Lmin were all tested using stepwise forward regression. Because our prior work[9] demonstrated that noise levels separated into tertiles were significantly associated with sleep time, our analysis also used noise levels separated into tertiles. Stepwise forward regression was used to add basic patient demographics (gender, race, age) to the models. Statistical significance was defined as P<0.05, and all statistical analysis was done using Stata 11.0 (StataCorp, College Station, TX).
RESULTS
From April 2010 to May 2012, 1134 patients were screened by study personnel for this study via an ongoing study of hospitalized patients on the inpatient general medicine ward. Of the 361 (31.8%) eligible patients, 206 (57.1%) consented to participate. Of the subjects enrolled in the study, 118 were able to complete at least 1 night of actigraphy, sound monitoring, and subjective assessment for a total of 185 patient nights (Figure 1).
The majority of patients were female (57%), African American (67%), and non‐Hispanic (97%). The mean age was 65 years (standard deviation [SD], 11.6 years), and the median length of stay was 4 days (interquartile range [IQR], 36). The majority of patients also had hypertension (67%), with chronic obstructive pulmonary disease [COPD] (31%) and congestive heart failure (31%) being the next most common comorbidities. About two‐thirds of subjects (64%) were characterized as average or above average sleepers with Epworth Sleepiness Scale scores 9[20] (Table 1). Only 5% of patients received pharmacological sleep aids.
| Value, n (%)a | |
|---|---|
| |
| Patient characteristics | |
| Age, mean (SD), y | 63 (12) |
| Length of stay, median (IQR), db | 4 (36) |
| Female | 67 (57) |
| African American | 79 (67) |
| Hispanic | 3 (3) |
| High school graduate | 92 (78) |
| Comorbidities | |
| Hypertension | 79 (66) |
| Chronic obstructive pulmonary disease | 37 (31) |
| Congestive heart failure | 37 (31) |
| Diabetes | 36 (30) |
| End stage renal disease | 23 (19) |
| Baseline sleep characteristics | |
| Sleep duration, mean (SD), minc | 333 (128) |
| Epworth Sleepiness Scale, score 9d | 73 (64) |
The mean baseline SLOC score was 30.4 (SD, 6.7), with a median of 31 (IQR, 2735). The mean baseline SSE score was 32.1 (SD, 9.4), with a median of 34 (IQR, 2441). Fifty‐four patients were categorized as having high sleep self‐efficacy (high SSE), which we defined as scoring above the median of 34.
Average in‐hospital sleep was 5.5 hours (333 minutes; SD, 128 minutes) which was significantly shorter than the self‐reported sleep duration of 6.5 hours prior to admission (387 minutes, SD, 125 minutes; P=0.0001). The mean sleep efficiency was 73% (SD, 19%) with 55% of actigraphy nights below the normal range of 80% efficiency for adults.[19] Median KSQI was 3.5 (IQR, 2.254.75), with 41% of the patients with a KSQI 3, putting them in the insomniac range.[32] The median score on the noise disruptiveness question was 1 (IQR, 14) with 42% of reports coded as disruptive defined as a score >1 on the 5‐point scale. The median score on the roommate disruptiveness question was 1 (IQR, 11) with 77% of responses coded as not disruptive defined as a score of 1 on the 5‐point scale.
A 2‐sample t test with equal variances showed that those patients reporting high SSE were more likely to sleep longer in the hospital than those reporting low SSE (364 minutes 95% confidence interval [CI]: 340, 388 vs 309 minutes 95% CI: 283, 336; P=0.003) (Figure 2). Patients with high SSE were also more likely to have a normal sleep efficiency (above 80%) compared to those with low SSE (54% 95% CI: 43, 65 vs 38% 95% CI: 28,47; P=0.028). Last, there was a trend toward patients reporting higher SSE to also report less noise disruption compared to those patients with low SSE ([42%] 95% CI: 31, 53 vs [56%] 95% CI: 46, 65; P=0.063) (Figure 3).
Linear regression clustered by subject showed that high SSE was associated with longer sleep duration (55 minutes 95% CI: 14, 97; P=0.010). Furthermore, high SSE was significantly associated with longer sleep duration after controlling for both objective noise level and patient demographics in the model using stepwise forward regression (50 minutes 95% CI: 11, 90; P=0.014) (Table 2).
| Sleep Duration (min) | Model 1 Beta [95% CI]a | Model 2 Beta [95% CI]a |
|---|---|---|
| ||
| High SSE | 55 [14, 97]b | 50 [11, 90]b |
| Lmin tert 3 | 14 [59, 29] | |
| Lmin tert 2 | 21 [65, 23] | |
| Female | 49 [10, 89]b | |
| African American | 16 [59, 27] | |
| Age | 1 [0.9, 3] | |
| Karolinska Sleep Quality | Model 1 OR [95% CI]c | Model 2 OR [95% CI]c |
| High SSE | 2.04 [1.12, 3.71]b | 2.01 [1.06, 3.79]b |
| Lmin tert 3 | 0.90 [0.37, 2.2] | |
| Lmin tert 2 | 0.86 [0.38, 1.94] | |
| Female | 1.78 [0.90, 3.52] | |
| African American | 1.19 [0.60, 2.38] | |
| Age | 1.02 [0.99, 1.05] | |
| Noise Complaints | Model 1 OR [95% CI]d | Model 2 OR [95% CI]d |
| High SSE | 0.57 [0.30, 1.12] | 0.49 [0.25, 0.96]b |
| Lmin tert 3 | 0.85 [0.39, 1.84] | |
| Lmin tert 2 | 0.91 [0.43, 1.93] | |
| Female | 1.40 [0.71, 2.78] | |
| African American | 0.35 [0.17, 0.70] | |
| Age | 1.00 [0.96, 1.03] | |
| Age2e | 1.00 [1.00, 1.00] | |
Logistic regression clustered by subject demonstrated that patients with high SSE had 2 times higher odds of having a KSQI score above 3 (95% CI: 1.12, 3.71; P=0.020). This association was still significant after controlling for noise and patient demographics (OR: 2.01; 95% CI: 1.06, 3.79; P=0.032). After controlling for noise levels and patient demographics, there was a statistically significant association between high SSE and lower odds of noise complaints (OR: 0.49; 95% CI: 0.25, 0.96; P=0.039) (Table 2). Although demographic characteristics were not associated with high SSE, those patients with high SSE had lower odds of being in the loudest tertile rooms (OR: 0.34; 95% CI: 0.15, 0.74; P=0.007).
In multivariate linear regression analyses, there were no significant relationships between SLOC scores and KSQI, reported noise disruptiveness, and markers of sleep (sleep duration or sleep efficiency).
DISCUSSION
This study is the first to examine the relationship between perceived control, noise levels, and objective measurements of sleep in a hospital setting. One measure of perceived control, namely SSE, was associated with objective sleep duration, subjective and objective sleep quality, noise levels in patient rooms, and perhaps also patient complaints of noise. These associations remained significant after controlling for objective noise levels and patient demographics, suggesting that SSE is independently related to sleep.
In contrast to SSE, SLOC was not found to be significantly associated with either subjective or objective measures of sleep quality. The lack of association may be due to the fact that the SLOC questionnaire does not translate as well to the inpatient setting as the SSE questionnaire. The SLOC questionnaire focuses on general beliefs about sleep whereas the SSE questionnaire focuses on personal beliefs about one's own ability sleep in the immediate future, which may make it more relevant in the inpatient setting (see Supporting Information, Appendix 1 and 2, in the online version of this article).
Given our findings, it is important to identify why patients with high SSE have better sleep and fewer noise complaints. One possibility is that sleep self‐efficacy is an inherited trait unique to each person that is also predictive of a patient's sleep patterns. However, is it also possible that those patients with high SSE feel more empowered to take control of their environment, allowing them to advocate for better sleep? This hypothesis is further strengthened by the finding that those patients with high SSE on study entry were less likely to be in the noisiest rooms. This raises the possibility that at least 1 of the mechanisms by which high SSE may be protective against sleep loss is through patients taking an active role in noise reduction, such as closing the door or advocating for their sleep with staff. However, we did not directly observe or ask patients whether doors of patient rooms were open or closed or whether the patients took other measures to advocate for their own sleep. Thus, further work is necessary to understand the mechanisms by which sleep self‐efficacy may influence sleep.
One potential avenue for future research is to explore possible interventions for boosting sleep self‐efficacy in the hospital. Although most interventions have focused on environmental noise and staff‐based education, empowering patients through boosting SSE may be a helpful adjunct to improving hospital sleep.[33, 34] Currently, the SSE scale is not commonly used in the inpatient setting. Motivational interviewing and patient coaching could be explored as potential tools for boosting SSE. Furthermore, even if SSE is not easily changed, measuring SSE in patients newly admitted to the hospital may be useful in identifying patients most susceptible to sleep disruptions. Efforts to identify patients with low SSE should go hand‐in‐hand with measures to reduce noise. Addressing both patient‐level and environmental factors simultaneously may be the best strategy for improving sleep in an inpatient hospital setting.
In contrast to our prior study, it is worth noting that we did not find any significant relationships between overall noise levels and sleep.[9] In this dataset, nighttime noise is still a predictor of sleep loss in the hospital. However, when we restrict our sample to those who answered the SSE questionnaire and had nighttime noise recorded, we lose a significant number of observations. Because of our interest in testing the relationship between SSE and sleep, we chose to control for overall noise (which enabled us to retain more observations). We also did not find any interactions between SSE and noise in our regression models. Further work is warranted with larger sample sizes to better understand the role of SSE in the context of sleep and noise levels. In addition, females also received more sleep than males in our study.
There are several limitations to this study. This study was carried out at a single service at a single institution, limiting the ability to generalize the findings to other hospital settings. This study had a relatively high rate of patients who were unable to complete at least 1 night of data collection (42%), often due to watch removal for imaging or procedures, which may also affect the representativeness of our sample. Moreover, we can only examine associations and not causal relationships. The SSE scale has never been used in hospitalized patients, making comparisons between scores from hospitalized patients and population controls difficult. In addition, the SSE scale also has not been dichotomized in previous studies into high and low SSE. However, a sensitivity analysis with raw SSE scores did not change the results of our study. It can be difficult to perform actigraphy measurements in the hospital because many patients spend most of their time in bed. Because we chose a relatively healthy cohort of patients without significant limitations in mobility, actigraphy could still be used to differentiate time spent awake from time spent sleeping. Because we did not perform polysomnography, we cannot explore the role of sleep architecture which is an important component of sleep quality. Although the use of pharmacologic sleep aids is a potential confounding factor, the rate of use was very low in our cohort and unlikely to significantly affect our results. Continued study of this patient population is warranted to further develop the findings.
In conclusion, patients with high SSE sleep better in the hospital, tend to be in quieter rooms, and may report fewer noise complaints. Our findings suggest that a greater confidence in the ability to sleep may be beneficial in hospitalized adults. In addition to noise control, hospitals should also consider targeting patients with low SSE when designing novel interventions to improve in‐hospital sleep.
Disclosures
This work was supported by funding from the National Institute on Aging through a Short‐Term Aging‐Related Research Program (1 T35 AG029795), National Institute on Aging career development award (K23AG033763), a midcareer career development award (1K24AG031326), a program project (P01AG‐11412), an Agency for Healthcare Research and Quality Centers for Education and Research on Therapeutics grant (1U18HS016967), and a National Institute on Aging Clinical Translational Sciences award (UL1 RR024999). Dr. Arora had full access to all of the data in the study and takes responsibility for the integrity of the data and the accuracy of the statistical analysis. The funding agencies had no role in the design of the study; the collection, analysis, and interpretation of the data; or the decision to approve publication of the finished manuscript. The authors report no conflicts of interest.
- , , , . The metabolic consequences of sleep deprivation. Sleep Med Rev. 2007;11(3):163–178.
- , , , , , . Poor self‐reported sleep quality predicts mortality within one year of inpatient post‐acute rehabilitation among older adults. Sleep. 2011;34(12):1715–1721.
- , , , et al. The sleep of older people in hospital and nursing homes. J Clin Nurs. 1999;8:360–368.
- , , et al. Sleep in hospitalized medical patients, part 1: factors affecting sleep. J Hosp Med. 2008; 3:473–482.
- , , , et al. Nocturnal care interactions with patients in critical care units. Am J Crit Care. 2004;13:102–112; quiz 114–115.
- , , . Patient perception of sleep quality and etiology of sleep disruption in the intensive care unit. Am J Respir Crit Care Med. 1999;159:1155–1162.
- . Sleep in acute care settings: an integrative review. J Nurs Scholarsh. 2000;32(1):31–38.
- , , , et al. Sleep disruption due to hospital noises: a prospective evaluation. Ann Int Med. 2012;157(3): 170–179.
- , , , et al. Noise and sleep among adult medical inpatients: far from a quiet night. Arch Intern Med. 2012;172:68–70.
- . Generalized expectancies for internal versus external control of reinforcement. Psychol Monogr. 1966;80:1–28.
- , . Psychosocial risk factors and mortality: a prospective study with special focus on social support, social participation, and locus of control in Norway. J Epidemiol Community Health. 1998;52:476–481.
- , . The interactive effect of perceived control and functional status on health and mortality among young‐old and old‐old adults. J Gerontol B Psychol Sci Soc Sci. 1997;52:P118–P126.
- , . Role‐specific feelings of control and mortality. Psychol Aging. 2000;15:617–626.
- , , . Patient empowerment in intensive care—an interview study. Intensive Crit Care Nurs. 2006;22:370–377.
- , , . Exploring the relationship between personal control and the hospital environment. J Clin Nurs. 2008;17:1601–1609.
- , , , et al. Effects of volitional lifestyle on sleep‐life habits in the aged. Psychiatry Clin Neurosci. 1998;52:183–184.
- , , , et al. Sleep locus of control: report on a new scale. Behav Sleep Med. 2004;2:79–93.
- , , , et al. Effects of physician experience on costs and outcomes on an academic general medicine service: results of a trial of hospitalists. Ann Intern Med. 2002;137:866–874.
- , , , et al. The effects of age, sex, ethnicity, and sleep‐disordered breathing on sleep architecture. Arch Intern Med. 2004;164:406–418.
- , , , et al. Validation of a telephone version of the mini‐mental state examination. J Am Geriatr Soc. 1992;40:697–702.
- , , , et al. Contact isolation in surgical patients: a barrier to care? Surgery. 2003;134:180–188.
- , . Adverse effects of contact isolation. Lancet. 1999;354:1177–1178.
- . Behavioral Treatment for Persistent Insomnia. Elmsford, NY: Pergamon Press; 1987.
- . A new method for measuring daytime sleepiness: the Epworth sleepiness scale. Sleep. 1991;14:540–545.
- . Reliability and factor analysis of the Epworth Sleepiness Scale. Sleep. 1992;15:376–381.
- , . Objective components of individual differences in subjective sleep quality. J Sleep Res. 1997;6:217–220.
- , , , et al. The role of actigraphy in the study of sleep and circadian rhythms. Sleep. 2003;26:342–392.
- , , , et al. Practice parameters for the use of actigraphy in the assessment of sleep and sleep disorders: an update for 2007. Sleep. 2007;30:519–529.
- , , , et al. The role of actigraphy in the evaluation of sleep disorders. Sleep. 1995;18:288–302.
- , , , et al. Clinical review: sleep measurement in critical care patients: research and clinical implications. Crit Care. 2007;11:226.
- , , , et al. Evaluation of immobility time for sleep latency in actigraphy. Sleep Med. 2009;10:621–625.
- , , , et al. The subjective meaning of sleep quality: a comparison of individuals with and without insomnia. Sleep. 2008;31:383–393.
- , , , et al. Sleep in hospitalized medical patients, part 2: behavioral and pharmacological management of sleep disturbances. J Hosp Med. 2009;4:50–59.
- , , , . A nonpharmacologic sleep protocol for hospitalized older patients. J Am Geriatr Soc. 1998;46(6):700–705.
Copyright © 2013 Society of Hospital Medicine

Attendings' Perception of Housestaff
Clinical supervision in graduate medical education (GME) emphasizes patient safety while promoting development of clinical expertise by allowing trainees progressive independence.[1, 2, 3] The importance of the balance between supervision and autonomy has been recognized by accreditation organizations, namely the Institute of Medicine and the Accreditation Council for Graduate Medical Education (ACGME).[4, 5] However, little is known of best practices in supervision, and the model of progressive independence in clinical training lacks empirical support.[3] Limited evidence suggests that enhanced clinical supervision may have positive effects on patient and education‐related outcomes.[6, 7, 8, 9, 10, 11, 12, 13, 14, 15] However, a more nuanced understanding of potential effects of enhanced supervision on resident autonomy and decision making is still required, particularly as preliminary work on increased on‐site hospitalist supervision has yielded mixed results.[16, 17, 18, 19]
Understanding how trainees are entrusted with autonomy will be integral to the ACGME's Next Accreditation System.[20] Entrustable Professional Activities are benchmarks by which resident readiness to progress through training will be judged.[21] The extent to which trainees are entrusted with autonomy is largely determined by the subjective assessment of immediate supervisors, as autonomy is rarely measured or quantified.[3, 22, 23] This judgment of autonomy, most frequently performed by ward attendings, may be subject to significant variation and influenced by factors other than the resident's competence and clinical abilities.
To that end, it is worth considering what factors may affect attending perception of housestaff autonomy and decision making. Recent changes in the GME environment and policy implementation have altered the landscape of the attending workforce considerably. The growth of the hospitalist movement in teaching hospitals, in part due to duty hours, has led to more residents being supervised by hospitalists, who may perceive trainee autonomy differently than other attendings do.[24] This study aims to examine whether factors such as attending demographics and short‐term and long‐term secular trends influence attending perception of housestaff autonomy and participation in decision making.
METHODS
Study Design
From 2001 to 2008, attending physicians at a single academic institution were surveyed at the end of inpatient general medicine teaching rotations.[25] The University of Chicago general medicine service consists of ward teams of an attending physician (internists, hospitalists, or subspecialists), 1 senior resident, and 1 or 2 interns. Attendings serve for 2‐ or 4‐week rotations. Attendings were consented for participation and received a 40‐item, paper‐based survey at the rotation's end. The institutional review board approved this study.
Data Collection
From the 40 survey items, 2 statements were selected for analysis: The intern(s) were truly involved in decision making about their patients and My resident felt that s/he had sufficient autonomy this month. These items have been used in previous work studying attending‐resident dynamics.[19, 26] Attendings also reported demographic and professional information as well as self‐identified hospitalist status, ascertained by the question Do you consider yourself to be a hospitalist? Survey month and year were also recorded. We conducted a secondary data analysis of an inclusive sample of responses to the questions of interest.
Statistical Analysis
Descriptive statistics were used to summarize survey responses and demographics. Survey questions consisted of Likert‐type items. Because the distribution of responses was skewed toward strong agreement for both questions, we collapsed scores into 2 categories (Strongly Agree and Do Not Strongly Agree).[19] Perception of sufficient trainee autonomy was defined as a response of Strongly Agree. The Pearson 2 test was used to compare proportions, and t tests were used to compare mean years since completion of residency and weeks on service between different groups.
Multivariate logistic regression with stepwise forward regression was used to model the relationship between attending sex, institutional hospitalist designation, years of experience, implementation of duty‐hours restrictions, and academic season, and perception of trainee autonomy and decision making. Academic seasons were defined as summer (JulySeptember), fall (OctoberDecember), winter (JanuaryMarch) and spring (AprilJune).[26] Years of experience were divided into tertiles of years since residency: 04 years, 511 years, and >11 years. To account for the possibility that the effect of hospitalist specialty varied by experience, interaction terms were constructed. The interaction term hospitalist*early‐career was used as the reference group.
RESULTS
Seven hundred thirty‐eight surveys were distributed to attendings on inpatient general medicine teaching services from 2001 to 2008; 70% (n=514) were included in the analysis. Table 1 provides demographic characteristics of the respondents. Roughly half (47%) were female, and 23% were hospitalists. Experience ranged from 0 to 35 years, with a median of 7 years. Weeks on service per year ranged from 1 to 27, with a median of 6 weeks. Hospitalists represented a less‐experienced group of attendings, as their mean experience was 4.5 years (standard deviation [SD] 4.5) compared with 11.2 years (SD 7.7) for nonhospitalists (P<0.001). Hospitalists attended more frequently, with a mean 14.2 weeks on service (SD 6.5) compared with 5.8 weeks (SD 3.4) for nonhospitalists (P<0.001). Nineteen percent (n=98) of surveys were completed prior to the first ACGME duty‐hours restriction in 2003. Responses were distributed fairly equally across the academic year, with 29% completed in summer, 26% in fall, 24% in winter, and 21% in spring.
| Characteristics | Value |
|---|---|
| |
| Female, n (%) | 275 (47) |
| Hospitalist, n (%) | 125 (23) |
| Years since completion of residency | |
| Mean, median, SD | 9.3, 7, 7.6 |
| IQR | 314 |
| 04, n (%) | 167 (36) |
| 511, n (%) | 146 (32) |
| >11, n (%) | 149 (32) |
| Weeks on service per yearb | |
| Mean, median, SD | 8.1, 6, 5.8 |
| IQR | 412 |
Forty‐four percent (n=212) of attendings perceived adequate intern involvement in decision making, and 50% (n=238) perceived sufficient resident autonomy. The correlation coefficient between these 2 measures was 0.66.
Attending Factors Associated With Perception of Trainee Autonomy
In univariate analysis, hospitalists perceived sufficient trainee autonomy less frequently than nonhospitalists; 33% perceived adequate intern involvement in decision making compared with 48% of nonhospitalists (21=6.7, P=0.01), and 42% perceived sufficient resident autonomy compared with 54% of nonhospitalists (21=3.9, P=0.048) (Table 2).
| Attending Characteristics, n (%) | Agree With Intern Involvement in Decision Making | Agree With Sufficient Resident Autonomy |
|---|---|---|
| ||
| Designation | ||
| Hospitalist | 29 (33) | 37 (42) |
| Nonhospitalist | 163 (48) | 180 (54) |
| Years since completion of residency | ||
| 04 | 37 (27) | 49 (36) |
| 511 | 77 (53) | 88 (61) |
| >11 | 77 (53) | 81 (56) |
| Sex | ||
| F | 98 (46) | 100 (47) |
| M | 113 (43) | 138 (53) |
| Secular factors, n (%) | ||
| Pre‐2003 duty‐hours restrictions | 56 (57) | 62 (65) |
| Post‐2003 duty‐hours restrictions | 156 (41) | 176 (46) |
| Season of survey | ||
| Summer (JulySeptember) | 61 (45) | 69 (51) |
| Fall (OctoberDecember) | 53 (42) | 59 (48) |
| Winter (JanuaryMarch) | 42 (37) | 52 (46) |
| Spring (AprilJune) | 56 (54) | 58 (57) |
Perception of trainee autonomy increased with experience (Table 2). About 30% of early‐career attendings (04 years experience) perceived sufficient autonomy and involvement in decision making compared with >50% agreement in the later‐career tertiles (intern decision making: 22=25.1, P<0.001; resident autonomy: 22=18.9, P<0.001). Attendings perceiving more intern decision making involvement had a mean 11 years of experience (SD 7.1), whereas those perceiving less had a mean of 8.8 years (SD 7.8; P=0.003). Mean years of experience were similar for perception of resident autonomy (10.6 years [SD 7.2] vs 8.9 years [SD 7.8], P=0.021).
Sex was not associated with differences in perception of intern decision making (21=0.39, P=0.53) or resident autonomy (21=1.4, P=0.236) (Table 2).
Secular Factors Associated With Perception of Trainee Autonomy
The implementation of duty‐hour restrictions in 2003 was associated with decreased attending perception of autonomy. Only 41% of attendings perceived adequate intern involvement in decision making following the restrictions, compared with 57% before the restrictions were instituted (21=8.2, P=0.004). Similarly, 46% of attendings agreed with sufficient resident autonomy post‐duty hours, compared with 65% prior (21=10.1, P=0.001) (Table 2).
Academic season was also associated with differences in perception of autonomy (Table 2). In spring, 54% of attendings perceived adequate intern involvement in decision making, compared with 42% in the other seasons combined (21=5.34, P=0.021). Perception of resident autonomy was also higher in spring, though this was not statistically significant (57% in spring vs 48% in the other seasons; 21=2.37, P=0.123).
Multivariate Analyses
Variation in attending perception of housestaff autonomy by attending characteristics persisted in multivariate analysis. Table 3 shows ORs for perception of adequate intern involvement in decision making and sufficient resident autonomy. Sex was not a significant predictor of agreement with either statement. The odds that an attending would perceive adequate intern involvement in decision making were higher for later‐career attendings compared with early‐career attendings (ie, 04 years); attendings who completed residency 511 years ago were 2.16 more likely to perceive adequate involvement (OR: 2.16, 95% CI: 1.17‐3.97, P=0.013), and those >11 years from residency were 2.05 more likely (OR: 2.05, 95% CI: 1.16‐3.63, P=0.014). Later‐career attendings also had nonsignificant higher odds of perceiving sufficient resident autonomy compared with early‐career attendings (511 years, OR: 1.73, 95% CI: 0.963.14, P=0.07; >11 years, OR: 1.50, 95% CI: 0.862.62, P=0.154).
| Interns Involved With Decision Making | Resident Had Sufficient Autonomy | |||
|---|---|---|---|---|
| ||||
| Covariate | OR (95% CI) | P Value | OR (95% CI) | P Value |
| Attending characteristics | ||||
| 04 years of experience | ||||
| 511 years of experience | 2.16 (1.17‐3.97) | 0.013 | 1.73 (0.96‐3.14) | 0.07 |
| >11 years of experience | 2.05 (1.16‐3.63) | 0.014 | 1.50 (0.86‐2.62) | 0.154 |
| Hospitalist | 0.19 (0.06‐0.58) | 0.004 | 0.27 (0.11‐0.66) | 0.004 |
| Hospitalist 04 years of experiencea | ||||
| Hospitalist 511 years of experiencea | 7.36 (1.86‐29.1) | 0.004 | 5.85 (1.75‐19.6) | 0.004 |
| Hospitalist >11 years of experiencea | 21.2 (1.73‐260) | 0.017 | 14.4 (1.31‐159) | 0.029 |
| Female sex | 1.41 (0.92‐2.17) | 0.115 | 0.92 (0.60‐1.40) | 0.69 |
| Secular factors | ||||
| Post‐2003 duty hours | 0.51 (0.29‐0.87) | 0.014 | 0.49 (0.28‐0.86) | 0.012 |
| Spring academic season | 1.94 (1.18‐3.19) | 0.009 | 1.59 (0.97‐2.60) | 0.064 |
Hospitalists were associated with 81% lower odds of perceiving adequate intern involvement in decision making (OR: 0.19, 95% CI: 0.060.58, P=0.004) and 73% lower odds of perceiving sufficient resident autonomy compared with nonhospitalists (OR: 0.27, 95% CI: 0.110.66, P=0.004). However, there was a significant interaction between hospitalists and experience; compared with early‐career hospitalists, experienced hospitalists had higher odds of perceiving both adequate intern involvement in decision making (511 years, OR: 7.36, 95% CI: 1.8629.1, P=0.004; >11 years, OR: 21.2, 95% CI: 1.73260, P=0.017) and sufficient resident autonomy (511 years, OR: 5.85, 95% CI: 1.7519.6, P=0.004; >11 years, OR: 14.4, 95% CI: 1.3159, P=0.029) (Table 3).
Secular trends also remained associated with differences in perception of housestaff autonomy (Table 3). Attendings had 49% lower odds of perceiving adequate intern involvement in decision making in the years following duty‐hour limits compared with the years prior (OR: 0.51, 95% CI: 0.29‐0.87, P=0.014). Similarly, odds of perceiving sufficient resident autonomy were 51% lower post‐duty hours (OR: 0.49, 95% CI: 0.280.86, P=0.012). Spring season was associated with 94% higher odds of perceiving adequate intern involvement in decision making compared with other seasons (OR: 1.94, 95% 1.183.19, P=0.009). There were also nonsignificant higher odds of perception of sufficient resident autonomy in spring (OR: 1.59, 95% CI: 0.972.60, P=0.064). To address the possibility of associations due to secular trends resulting from repeated measures of attendings, models using attending fixed effects were also used. Clustering by attending, the associations between duty hours and perceiving sufficient resident autonomy and intern decision making both remained significant, but the association of spring season did not.
DISCUSSION
This study highlights that attendings' perception of housestaff autonomy varies by attending characteristics and secular trends. Specifically, early‐career attendings and hospitalists were less likely to perceive sufficient housestaff autonomy and involvement in decision making. However, there was a significant hospitalist‐experience interaction, such that more‐experienced hospitalists were associated with higher odds of perceiving sufficient autonomy than would be expected from the effect of experience alone. With respect to secular trends, attendings perceived more trainee autonomy in the last quarter of the academic year, and less autonomy after implementation of resident duty‐hour restrictions in 2003.
As Entrustable Professional Activities unveil a new emphasis on the notion of entrustment, it will be critical to ensure that attending assessment of resident performance is uniform and a valid judge of when to entrust autonomy.[27, 28] If, as suggested by these findings, perception of autonomy varies based on attending characteristics, all faculty may benefit from strategies to standardize assessment and evaluation skills to ensure trainees are appropriately progressing through various milestones to achieve competence. Our results suggest that faculty development may be particularly important for early‐career attendings and especially hospitalists.
Early‐career attendings may perceive less housestaff autonomy due to a reluctance to relinquish control over patient‐care duties and decision making when the attending is only a few years from residency. Hospitalists are relatively junior in most institutions and may be similar to early‐career attendings in that regard. It is noteworthy, however, that experienced hospitalists are associated with even greater perception of autonomy than would be predicted by years of experience alone. Hospitalists may gain experience at a rate faster than nonhospitalists, which could affect how they perceive autonomy and decision making in trainees and may make them more comfortable entrusting autonomy to housestaff. Early‐career hospitalists likely represent a heterogeneous group of physicians, in both 1‐year clinical hospitalists as well as academic‐career hospitalists, who may have different approaches to managing housestaff teams. Residents are less likely to fear hospitalists limiting their autonomy after exposure to working with hospitalists as teaching attendings, and our findings may suggest a corollary in that hospitalists may be more likely to perceive sufficient autonomy with more exposure to working with housestaff.[19]
Attendings perceived less housestaff autonomy following the 2003 duty‐hour limits. This may be due to attendings assuming more responsibilities that were traditionally performed by residents.[26, 29] This shifting of responsibility may lead to perception of less‐active housestaff decision making and less‐evident autonomy. These findings suggest autonomy may become even more restricted after implementation of the 2011 duty‐hour restrictions, which included 16‐hour shifts for interns.[5] Further studies are warranted in examining the effect of these new limits. Entrustment of autonomy and allowance for decision making is an essential part of any learning environment that allows residents to develop clinical reasoning skills, and it will be critical to adopt new strategies to encourage professional growth of housestaff in this new era.[30]
Attendings also perceived autonomy differently by academic season. Spring represents the season by which housestaff are most experienced and by which attendings may be most familiar with individual team members. Additionally, there may be a stronger emphasis on supervision and adherence to traditional hierarchy earlier in the academic year as interns and junior residents are learning their new roles.[30] These findings may have implications for system changes to support development of more functional educational dyads between attendings and trainees, especially early in the academic year.[31]
There are several limitations to our findings. This is a single‐institution study restricted to the general‐medicine service; thus generalizability is limited. Our outcome measures, the survey items of interest, question perception of housestaff autonomy but do not query the appropriateness of that autonomy, an important construct in entrustment. Additionally, self‐reported answers could be subject to recall bias. Although data were collected over 8 years, the most recent trends of residency training are not reflected. Although there was a significant interaction involving experienced hospitalists, wide confidence intervals and large standard errors likely reflect the relatively few individuals in this category. Though there was a large number of overall respondents, our interaction terms included few advanced‐career hospitalists, likely secondary to hospital medicine's relative youth as a specialty.
As this study focuses only on perception of autonomy, future work must investigate autonomy from a practical standpoint. It is conceivable that if factors such as attending characteristics and secular trends influence perception, they may also be associated with variation in how attendings entrust autonomy and provide supervision. To what extent perception and practice are linked remains to be studied, but it will be important to determine if variation due to these factors may also be associated with inconsistent and uneven supervisory practices that would adversely affect resident education and patient safety.
Finally, future work must include the viewpoint of the recipients of autonomy: the residents and interns. A significant limitation of the current study is the lack of the resident perspective, as our survey was only administered to attendings. Autonomy is clearly a 2‐way relationship, and attending perception must be corroborated by the resident's experience. It is possible attendings may perceive that their housestaff have sufficient autonomy, but residents may view this autonomy as inappropriate or unavoidable due an absentee attending who does not adequately supervise.[32] Future work must examine how resident and attending perceptions of autonomy correlate, and whether discordance or concordance in these perceptions influence satisfaction with attending‐resident relationships, education, and patient care.
In conclusion, significant variation existed among attending physicians with respect to perception of housestaff autonomy, an important aspect of entrustment and clinical supervision. This variation was present for hospitalists, among different levels of attending experience, and a significant interaction was found between these 2 factors. Additionally, secular trends were associated with differences in perception of autonomy. As entrustment of residents with progressive levels of autonomy becomes more integrated within the requirements for advancement in residency, a greater understanding of factors affecting entrustment will be critical in helping faculty develop skills to appropriately assess trainee professional growth and development.
Acknowledgments
The authors thank all members of the Multicenter Hospitalist Project for their assistance with this project.
Disclosures: The authors acknowledge funding from the AHRQ/CERT 5 U18 HS016967‐01. The funder had no role in the design of the study; the collection, analysis, and interpretation of the data; or the decision to approve publication of the finished manuscript. Prior presentations of the data include the 2012 Department of Medicine Research Day at the University of Chicago, the 2012 Society of Hospital Medicine Annual Meeting in San Diego, California, and the 2012 Midwest Society of General Medicine Meeting in Chicago, Illinois. All coauthors have seen and agree with the contents of the manuscript. The submission was not under review by any other publication. The authors report no conflicts of interest.
- , . Effective supervision in clinical practice settings: a literature review. Med Educ. 2000;34(10):827–840.
- . Deliberate practice and acquisition of expert performance: a general overview. Acad Emerg Med. 2008;15(11):988–994.
- , , , et al. Progressive independence in clinical training: a tradition worth defending? Acad Med. 2005;80(10 suppl):S106–S111.
- Committee on Optimizing Graduate Medical Trainee (Resident) Hours and Work Schedules to Improve Patient Safety, Institute of Medicine. Ulmer C, Wolman D, Johns M, eds. Resident Duty Hours: Enhancing Sleep, Supervision, and Safety. Washington, DC: National Academies Press; 2008.
- , , ; ACGME Duty Hour Task Force. The new recommendations on duty hours from the ACGME Task Force. N Engl J Med. 2010;363(2):e3.
- . Positive impact of pediatric critical care fellows on mortality: is it merely a function of resident supervision? Crit Care Med. 1997;25(10):1622–1623.
- , , , et al. The effect of supervision of residents on quality of care in five university‐affiliated emergency departments. Acad Med. 1998;73(7):776–782.
- , , , et al. Increased faculty presence on inpatient teaching services. Mayo Clin Proc. 2004;79(3):332–336.
- , , , et al. How medical residents perceive the quality of supervision provided by attending doctors in the clinical setting. Med Educ. 2005;39(7):696–703.
- , , . Resident supervision in the operating room: does this impact on outcome? J Trauma. 1993;35(4):556–560.
- , , , et al. Effects of supervision by attending anesthesiologists on complications of emergency tracheal intubation. Anesthesiology. 2008;109(6):973–937.
- , , , et al. Around‐the‐clock attending radiology coverage is essential to avoid mistakes in the care of trauma patients. Am Surg. 2001;67(12):1175–1177.
- , . Supervision in the outpatient clinic: effects on teaching and patient care. J Gen Int Med. 1993;8(7):378–380.
- , . How medical students and residents describe the roles and characteristics of their influential clinical teachers. Acad Med. 2000;75(8):843–845.
- , , , et al. A systematic review: the effect of clinical supervision on patient and residency education outcomes. Acad Med. 2012;87(4):428–442.
- , , , et al; for the SGIM Housestaff Oversight Subcommittee. Survey of overnight academic hospitalist supervision of trainees. J Hosp Med. 2012;7(7):521–523.
- , , , et al. Effects of increased overnight supervision on resident education, decision‐making, and autonomy. J Hosp Med. 2012;7(8):606–610.
- , , , et al. The effect of overnight in‐house attending coverage on perceptions of care and education on a general medical service. J Grad Med Educ. 2010;2(1):53–56.
- , , , et al. Resident satisfaction on an academic hospitalist service: time to teach. Am J Med. 2002;112(7):597–601.
- , , , et al. The next GME accreditation system—rationale and benefits. N Engl J Med. 2012;366(11):1051–1056.
- , . Competency‐based postgraduate training: can we bridge the gap between theory and clinical practice? Acad Med. 2007;82(6):542–547.
- . Trust, competence, and the supervisor's role in postgraduate training. BMJ. 2006;333(7571):748–751.
- , , , et al. Measuring progressive independence with the resident supervision index: empirical approach. J Grad Med Educ. 2010;2(1):17–30.
- , . The emerging role of “hospitalists” in the American health care system. N Engl J Med. 1996;335(7):514–517.
- , . Effect of ACGME duty hours on attending physician teaching and satisfaction. Arch Intern Med. 2008;168(11):1226–1227.
- , , , et al. Association of workload of on‐call interns with on‐call sleep duration, shift duration, and participation in educational activities. JAMA. 2008;300(10):1146–1153.
- . Entrustability of professional activities and competency‐based training. Med Educ. 2005;39:1176–1177.
- , , , et al. When do supervising physicians decide to entrust residents with unsupervised tasks? Acad Med. 2010;85(9):1399–1400.
- , , et al. Effect of residency duty‐hour limits. Arch Intern Med. 2007;167(14):1487–1492.
- , . Strategies for improving teaching practices: a comprehensive approach to faculty development. Acad Med. 1998;73:387–396.
- , , . A framework for effective training for supervisors. Med Teach. 2002;24:385–389.
- , , , et al. On‐call supervision and resident autonomy: from micromanager to absentee attending. Am J Med. 2009;122(8):784–788.
Clinical supervision in graduate medical education (GME) emphasizes patient safety while promoting development of clinical expertise by allowing trainees progressive independence.[1, 2, 3] The importance of the balance between supervision and autonomy has been recognized by accreditation organizations, namely the Institute of Medicine and the Accreditation Council for Graduate Medical Education (ACGME).[4, 5] However, little is known of best practices in supervision, and the model of progressive independence in clinical training lacks empirical support.[3] Limited evidence suggests that enhanced clinical supervision may have positive effects on patient and education‐related outcomes.[6, 7, 8, 9, 10, 11, 12, 13, 14, 15] However, a more nuanced understanding of potential effects of enhanced supervision on resident autonomy and decision making is still required, particularly as preliminary work on increased on‐site hospitalist supervision has yielded mixed results.[16, 17, 18, 19]
Understanding how trainees are entrusted with autonomy will be integral to the ACGME's Next Accreditation System.[20] Entrustable Professional Activities are benchmarks by which resident readiness to progress through training will be judged.[21] The extent to which trainees are entrusted with autonomy is largely determined by the subjective assessment of immediate supervisors, as autonomy is rarely measured or quantified.[3, 22, 23] This judgment of autonomy, most frequently performed by ward attendings, may be subject to significant variation and influenced by factors other than the resident's competence and clinical abilities.
To that end, it is worth considering what factors may affect attending perception of housestaff autonomy and decision making. Recent changes in the GME environment and policy implementation have altered the landscape of the attending workforce considerably. The growth of the hospitalist movement in teaching hospitals, in part due to duty hours, has led to more residents being supervised by hospitalists, who may perceive trainee autonomy differently than other attendings do.[24] This study aims to examine whether factors such as attending demographics and short‐term and long‐term secular trends influence attending perception of housestaff autonomy and participation in decision making.
METHODS
Study Design
From 2001 to 2008, attending physicians at a single academic institution were surveyed at the end of inpatient general medicine teaching rotations.[25] The University of Chicago general medicine service consists of ward teams of an attending physician (internists, hospitalists, or subspecialists), 1 senior resident, and 1 or 2 interns. Attendings serve for 2‐ or 4‐week rotations. Attendings were consented for participation and received a 40‐item, paper‐based survey at the rotation's end. The institutional review board approved this study.
Data Collection
From the 40 survey items, 2 statements were selected for analysis: The intern(s) were truly involved in decision making about their patients and My resident felt that s/he had sufficient autonomy this month. These items have been used in previous work studying attending‐resident dynamics.[19, 26] Attendings also reported demographic and professional information as well as self‐identified hospitalist status, ascertained by the question Do you consider yourself to be a hospitalist? Survey month and year were also recorded. We conducted a secondary data analysis of an inclusive sample of responses to the questions of interest.
Statistical Analysis
Descriptive statistics were used to summarize survey responses and demographics. Survey questions consisted of Likert‐type items. Because the distribution of responses was skewed toward strong agreement for both questions, we collapsed scores into 2 categories (Strongly Agree and Do Not Strongly Agree).[19] Perception of sufficient trainee autonomy was defined as a response of Strongly Agree. The Pearson 2 test was used to compare proportions, and t tests were used to compare mean years since completion of residency and weeks on service between different groups.
Multivariate logistic regression with stepwise forward regression was used to model the relationship between attending sex, institutional hospitalist designation, years of experience, implementation of duty‐hours restrictions, and academic season, and perception of trainee autonomy and decision making. Academic seasons were defined as summer (JulySeptember), fall (OctoberDecember), winter (JanuaryMarch) and spring (AprilJune).[26] Years of experience were divided into tertiles of years since residency: 04 years, 511 years, and >11 years. To account for the possibility that the effect of hospitalist specialty varied by experience, interaction terms were constructed. The interaction term hospitalist*early‐career was used as the reference group.
RESULTS
Seven hundred thirty‐eight surveys were distributed to attendings on inpatient general medicine teaching services from 2001 to 2008; 70% (n=514) were included in the analysis. Table 1 provides demographic characteristics of the respondents. Roughly half (47%) were female, and 23% were hospitalists. Experience ranged from 0 to 35 years, with a median of 7 years. Weeks on service per year ranged from 1 to 27, with a median of 6 weeks. Hospitalists represented a less‐experienced group of attendings, as their mean experience was 4.5 years (standard deviation [SD] 4.5) compared with 11.2 years (SD 7.7) for nonhospitalists (P<0.001). Hospitalists attended more frequently, with a mean 14.2 weeks on service (SD 6.5) compared with 5.8 weeks (SD 3.4) for nonhospitalists (P<0.001). Nineteen percent (n=98) of surveys were completed prior to the first ACGME duty‐hours restriction in 2003. Responses were distributed fairly equally across the academic year, with 29% completed in summer, 26% in fall, 24% in winter, and 21% in spring.
| Characteristics | Value |
|---|---|
| |
| Female, n (%) | 275 (47) |
| Hospitalist, n (%) | 125 (23) |
| Years since completion of residency | |
| Mean, median, SD | 9.3, 7, 7.6 |
| IQR | 314 |
| 04, n (%) | 167 (36) |
| 511, n (%) | 146 (32) |
| >11, n (%) | 149 (32) |
| Weeks on service per yearb | |
| Mean, median, SD | 8.1, 6, 5.8 |
| IQR | 412 |
Forty‐four percent (n=212) of attendings perceived adequate intern involvement in decision making, and 50% (n=238) perceived sufficient resident autonomy. The correlation coefficient between these 2 measures was 0.66.
Attending Factors Associated With Perception of Trainee Autonomy
In univariate analysis, hospitalists perceived sufficient trainee autonomy less frequently than nonhospitalists; 33% perceived adequate intern involvement in decision making compared with 48% of nonhospitalists (21=6.7, P=0.01), and 42% perceived sufficient resident autonomy compared with 54% of nonhospitalists (21=3.9, P=0.048) (Table 2).
| Attending Characteristics, n (%) | Agree With Intern Involvement in Decision Making | Agree With Sufficient Resident Autonomy |
|---|---|---|
| ||
| Designation | ||
| Hospitalist | 29 (33) | 37 (42) |
| Nonhospitalist | 163 (48) | 180 (54) |
| Years since completion of residency | ||
| 04 | 37 (27) | 49 (36) |
| 511 | 77 (53) | 88 (61) |
| >11 | 77 (53) | 81 (56) |
| Sex | ||
| F | 98 (46) | 100 (47) |
| M | 113 (43) | 138 (53) |
| Secular factors, n (%) | ||
| Pre‐2003 duty‐hours restrictions | 56 (57) | 62 (65) |
| Post‐2003 duty‐hours restrictions | 156 (41) | 176 (46) |
| Season of survey | ||
| Summer (JulySeptember) | 61 (45) | 69 (51) |
| Fall (OctoberDecember) | 53 (42) | 59 (48) |
| Winter (JanuaryMarch) | 42 (37) | 52 (46) |
| Spring (AprilJune) | 56 (54) | 58 (57) |
Perception of trainee autonomy increased with experience (Table 2). About 30% of early‐career attendings (04 years experience) perceived sufficient autonomy and involvement in decision making compared with >50% agreement in the later‐career tertiles (intern decision making: 22=25.1, P<0.001; resident autonomy: 22=18.9, P<0.001). Attendings perceiving more intern decision making involvement had a mean 11 years of experience (SD 7.1), whereas those perceiving less had a mean of 8.8 years (SD 7.8; P=0.003). Mean years of experience were similar for perception of resident autonomy (10.6 years [SD 7.2] vs 8.9 years [SD 7.8], P=0.021).
Sex was not associated with differences in perception of intern decision making (21=0.39, P=0.53) or resident autonomy (21=1.4, P=0.236) (Table 2).
Secular Factors Associated With Perception of Trainee Autonomy
The implementation of duty‐hour restrictions in 2003 was associated with decreased attending perception of autonomy. Only 41% of attendings perceived adequate intern involvement in decision making following the restrictions, compared with 57% before the restrictions were instituted (21=8.2, P=0.004). Similarly, 46% of attendings agreed with sufficient resident autonomy post‐duty hours, compared with 65% prior (21=10.1, P=0.001) (Table 2).
Academic season was also associated with differences in perception of autonomy (Table 2). In spring, 54% of attendings perceived adequate intern involvement in decision making, compared with 42% in the other seasons combined (21=5.34, P=0.021). Perception of resident autonomy was also higher in spring, though this was not statistically significant (57% in spring vs 48% in the other seasons; 21=2.37, P=0.123).
Multivariate Analyses
Variation in attending perception of housestaff autonomy by attending characteristics persisted in multivariate analysis. Table 3 shows ORs for perception of adequate intern involvement in decision making and sufficient resident autonomy. Sex was not a significant predictor of agreement with either statement. The odds that an attending would perceive adequate intern involvement in decision making were higher for later‐career attendings compared with early‐career attendings (ie, 04 years); attendings who completed residency 511 years ago were 2.16 more likely to perceive adequate involvement (OR: 2.16, 95% CI: 1.17‐3.97, P=0.013), and those >11 years from residency were 2.05 more likely (OR: 2.05, 95% CI: 1.16‐3.63, P=0.014). Later‐career attendings also had nonsignificant higher odds of perceiving sufficient resident autonomy compared with early‐career attendings (511 years, OR: 1.73, 95% CI: 0.963.14, P=0.07; >11 years, OR: 1.50, 95% CI: 0.862.62, P=0.154).
| Interns Involved With Decision Making | Resident Had Sufficient Autonomy | |||
|---|---|---|---|---|
| ||||
| Covariate | OR (95% CI) | P Value | OR (95% CI) | P Value |
| Attending characteristics | ||||
| 04 years of experience | ||||
| 511 years of experience | 2.16 (1.17‐3.97) | 0.013 | 1.73 (0.96‐3.14) | 0.07 |
| >11 years of experience | 2.05 (1.16‐3.63) | 0.014 | 1.50 (0.86‐2.62) | 0.154 |
| Hospitalist | 0.19 (0.06‐0.58) | 0.004 | 0.27 (0.11‐0.66) | 0.004 |
| Hospitalist 04 years of experiencea | ||||
| Hospitalist 511 years of experiencea | 7.36 (1.86‐29.1) | 0.004 | 5.85 (1.75‐19.6) | 0.004 |
| Hospitalist >11 years of experiencea | 21.2 (1.73‐260) | 0.017 | 14.4 (1.31‐159) | 0.029 |
| Female sex | 1.41 (0.92‐2.17) | 0.115 | 0.92 (0.60‐1.40) | 0.69 |
| Secular factors | ||||
| Post‐2003 duty hours | 0.51 (0.29‐0.87) | 0.014 | 0.49 (0.28‐0.86) | 0.012 |
| Spring academic season | 1.94 (1.18‐3.19) | 0.009 | 1.59 (0.97‐2.60) | 0.064 |
Hospitalists were associated with 81% lower odds of perceiving adequate intern involvement in decision making (OR: 0.19, 95% CI: 0.060.58, P=0.004) and 73% lower odds of perceiving sufficient resident autonomy compared with nonhospitalists (OR: 0.27, 95% CI: 0.110.66, P=0.004). However, there was a significant interaction between hospitalists and experience; compared with early‐career hospitalists, experienced hospitalists had higher odds of perceiving both adequate intern involvement in decision making (511 years, OR: 7.36, 95% CI: 1.8629.1, P=0.004; >11 years, OR: 21.2, 95% CI: 1.73260, P=0.017) and sufficient resident autonomy (511 years, OR: 5.85, 95% CI: 1.7519.6, P=0.004; >11 years, OR: 14.4, 95% CI: 1.3159, P=0.029) (Table 3).
Secular trends also remained associated with differences in perception of housestaff autonomy (Table 3). Attendings had 49% lower odds of perceiving adequate intern involvement in decision making in the years following duty‐hour limits compared with the years prior (OR: 0.51, 95% CI: 0.29‐0.87, P=0.014). Similarly, odds of perceiving sufficient resident autonomy were 51% lower post‐duty hours (OR: 0.49, 95% CI: 0.280.86, P=0.012). Spring season was associated with 94% higher odds of perceiving adequate intern involvement in decision making compared with other seasons (OR: 1.94, 95% 1.183.19, P=0.009). There were also nonsignificant higher odds of perception of sufficient resident autonomy in spring (OR: 1.59, 95% CI: 0.972.60, P=0.064). To address the possibility of associations due to secular trends resulting from repeated measures of attendings, models using attending fixed effects were also used. Clustering by attending, the associations between duty hours and perceiving sufficient resident autonomy and intern decision making both remained significant, but the association of spring season did not.
DISCUSSION
This study highlights that attendings' perception of housestaff autonomy varies by attending characteristics and secular trends. Specifically, early‐career attendings and hospitalists were less likely to perceive sufficient housestaff autonomy and involvement in decision making. However, there was a significant hospitalist‐experience interaction, such that more‐experienced hospitalists were associated with higher odds of perceiving sufficient autonomy than would be expected from the effect of experience alone. With respect to secular trends, attendings perceived more trainee autonomy in the last quarter of the academic year, and less autonomy after implementation of resident duty‐hour restrictions in 2003.
As Entrustable Professional Activities unveil a new emphasis on the notion of entrustment, it will be critical to ensure that attending assessment of resident performance is uniform and a valid judge of when to entrust autonomy.[27, 28] If, as suggested by these findings, perception of autonomy varies based on attending characteristics, all faculty may benefit from strategies to standardize assessment and evaluation skills to ensure trainees are appropriately progressing through various milestones to achieve competence. Our results suggest that faculty development may be particularly important for early‐career attendings and especially hospitalists.
Early‐career attendings may perceive less housestaff autonomy due to a reluctance to relinquish control over patient‐care duties and decision making when the attending is only a few years from residency. Hospitalists are relatively junior in most institutions and may be similar to early‐career attendings in that regard. It is noteworthy, however, that experienced hospitalists are associated with even greater perception of autonomy than would be predicted by years of experience alone. Hospitalists may gain experience at a rate faster than nonhospitalists, which could affect how they perceive autonomy and decision making in trainees and may make them more comfortable entrusting autonomy to housestaff. Early‐career hospitalists likely represent a heterogeneous group of physicians, in both 1‐year clinical hospitalists as well as academic‐career hospitalists, who may have different approaches to managing housestaff teams. Residents are less likely to fear hospitalists limiting their autonomy after exposure to working with hospitalists as teaching attendings, and our findings may suggest a corollary in that hospitalists may be more likely to perceive sufficient autonomy with more exposure to working with housestaff.[19]
Attendings perceived less housestaff autonomy following the 2003 duty‐hour limits. This may be due to attendings assuming more responsibilities that were traditionally performed by residents.[26, 29] This shifting of responsibility may lead to perception of less‐active housestaff decision making and less‐evident autonomy. These findings suggest autonomy may become even more restricted after implementation of the 2011 duty‐hour restrictions, which included 16‐hour shifts for interns.[5] Further studies are warranted in examining the effect of these new limits. Entrustment of autonomy and allowance for decision making is an essential part of any learning environment that allows residents to develop clinical reasoning skills, and it will be critical to adopt new strategies to encourage professional growth of housestaff in this new era.[30]
Attendings also perceived autonomy differently by academic season. Spring represents the season by which housestaff are most experienced and by which attendings may be most familiar with individual team members. Additionally, there may be a stronger emphasis on supervision and adherence to traditional hierarchy earlier in the academic year as interns and junior residents are learning their new roles.[30] These findings may have implications for system changes to support development of more functional educational dyads between attendings and trainees, especially early in the academic year.[31]
There are several limitations to our findings. This is a single‐institution study restricted to the general‐medicine service; thus generalizability is limited. Our outcome measures, the survey items of interest, question perception of housestaff autonomy but do not query the appropriateness of that autonomy, an important construct in entrustment. Additionally, self‐reported answers could be subject to recall bias. Although data were collected over 8 years, the most recent trends of residency training are not reflected. Although there was a significant interaction involving experienced hospitalists, wide confidence intervals and large standard errors likely reflect the relatively few individuals in this category. Though there was a large number of overall respondents, our interaction terms included few advanced‐career hospitalists, likely secondary to hospital medicine's relative youth as a specialty.
As this study focuses only on perception of autonomy, future work must investigate autonomy from a practical standpoint. It is conceivable that if factors such as attending characteristics and secular trends influence perception, they may also be associated with variation in how attendings entrust autonomy and provide supervision. To what extent perception and practice are linked remains to be studied, but it will be important to determine if variation due to these factors may also be associated with inconsistent and uneven supervisory practices that would adversely affect resident education and patient safety.
Finally, future work must include the viewpoint of the recipients of autonomy: the residents and interns. A significant limitation of the current study is the lack of the resident perspective, as our survey was only administered to attendings. Autonomy is clearly a 2‐way relationship, and attending perception must be corroborated by the resident's experience. It is possible attendings may perceive that their housestaff have sufficient autonomy, but residents may view this autonomy as inappropriate or unavoidable due an absentee attending who does not adequately supervise.[32] Future work must examine how resident and attending perceptions of autonomy correlate, and whether discordance or concordance in these perceptions influence satisfaction with attending‐resident relationships, education, and patient care.
In conclusion, significant variation existed among attending physicians with respect to perception of housestaff autonomy, an important aspect of entrustment and clinical supervision. This variation was present for hospitalists, among different levels of attending experience, and a significant interaction was found between these 2 factors. Additionally, secular trends were associated with differences in perception of autonomy. As entrustment of residents with progressive levels of autonomy becomes more integrated within the requirements for advancement in residency, a greater understanding of factors affecting entrustment will be critical in helping faculty develop skills to appropriately assess trainee professional growth and development.
Acknowledgments
The authors thank all members of the Multicenter Hospitalist Project for their assistance with this project.
Disclosures: The authors acknowledge funding from the AHRQ/CERT 5 U18 HS016967‐01. The funder had no role in the design of the study; the collection, analysis, and interpretation of the data; or the decision to approve publication of the finished manuscript. Prior presentations of the data include the 2012 Department of Medicine Research Day at the University of Chicago, the 2012 Society of Hospital Medicine Annual Meeting in San Diego, California, and the 2012 Midwest Society of General Medicine Meeting in Chicago, Illinois. All coauthors have seen and agree with the contents of the manuscript. The submission was not under review by any other publication. The authors report no conflicts of interest.
- , . Effective supervision in clinical practice settings: a literature review. Med Educ. 2000;34(10):827–840.
- . Deliberate practice and acquisition of expert performance: a general overview. Acad Emerg Med. 2008;15(11):988–994.
- , , , et al. Progressive independence in clinical training: a tradition worth defending? Acad Med. 2005;80(10 suppl):S106–S111.
- Committee on Optimizing Graduate Medical Trainee (Resident) Hours and Work Schedules to Improve Patient Safety, Institute of Medicine. Ulmer C, Wolman D, Johns M, eds. Resident Duty Hours: Enhancing Sleep, Supervision, and Safety. Washington, DC: National Academies Press; 2008.
- , , ; ACGME Duty Hour Task Force. The new recommendations on duty hours from the ACGME Task Force. N Engl J Med. 2010;363(2):e3.
- . Positive impact of pediatric critical care fellows on mortality: is it merely a function of resident supervision? Crit Care Med. 1997;25(10):1622–1623.
- , , , et al. The effect of supervision of residents on quality of care in five university‐affiliated emergency departments. Acad Med. 1998;73(7):776–782.
- , , , et al. Increased faculty presence on inpatient teaching services. Mayo Clin Proc. 2004;79(3):332–336.
- , , , et al. How medical residents perceive the quality of supervision provided by attending doctors in the clinical setting. Med Educ. 2005;39(7):696–703.
- , , . Resident supervision in the operating room: does this impact on outcome? J Trauma. 1993;35(4):556–560.
- , , , et al. Effects of supervision by attending anesthesiologists on complications of emergency tracheal intubation. Anesthesiology. 2008;109(6):973–937.
- , , , et al. Around‐the‐clock attending radiology coverage is essential to avoid mistakes in the care of trauma patients. Am Surg. 2001;67(12):1175–1177.
- , . Supervision in the outpatient clinic: effects on teaching and patient care. J Gen Int Med. 1993;8(7):378–380.
- , . How medical students and residents describe the roles and characteristics of their influential clinical teachers. Acad Med. 2000;75(8):843–845.
- , , , et al. A systematic review: the effect of clinical supervision on patient and residency education outcomes. Acad Med. 2012;87(4):428–442.
- , , , et al; for the SGIM Housestaff Oversight Subcommittee. Survey of overnight academic hospitalist supervision of trainees. J Hosp Med. 2012;7(7):521–523.
- , , , et al. Effects of increased overnight supervision on resident education, decision‐making, and autonomy. J Hosp Med. 2012;7(8):606–610.
- , , , et al. The effect of overnight in‐house attending coverage on perceptions of care and education on a general medical service. J Grad Med Educ. 2010;2(1):53–56.
- , , , et al. Resident satisfaction on an academic hospitalist service: time to teach. Am J Med. 2002;112(7):597–601.
- , , , et al. The next GME accreditation system—rationale and benefits. N Engl J Med. 2012;366(11):1051–1056.
- , . Competency‐based postgraduate training: can we bridge the gap between theory and clinical practice? Acad Med. 2007;82(6):542–547.
- . Trust, competence, and the supervisor's role in postgraduate training. BMJ. 2006;333(7571):748–751.
- , , , et al. Measuring progressive independence with the resident supervision index: empirical approach. J Grad Med Educ. 2010;2(1):17–30.
- , . The emerging role of “hospitalists” in the American health care system. N Engl J Med. 1996;335(7):514–517.
- , . Effect of ACGME duty hours on attending physician teaching and satisfaction. Arch Intern Med. 2008;168(11):1226–1227.
- , , , et al. Association of workload of on‐call interns with on‐call sleep duration, shift duration, and participation in educational activities. JAMA. 2008;300(10):1146–1153.
- . Entrustability of professional activities and competency‐based training. Med Educ. 2005;39:1176–1177.
- , , , et al. When do supervising physicians decide to entrust residents with unsupervised tasks? Acad Med. 2010;85(9):1399–1400.
- , , et al. Effect of residency duty‐hour limits. Arch Intern Med. 2007;167(14):1487–1492.
- , . Strategies for improving teaching practices: a comprehensive approach to faculty development. Acad Med. 1998;73:387–396.
- , , . A framework for effective training for supervisors. Med Teach. 2002;24:385–389.
- , , , et al. On‐call supervision and resident autonomy: from micromanager to absentee attending. Am J Med. 2009;122(8):784–788.
Copyright © 2013 Society of Hospital Medicine
Implementing Peer Evaluation of Handoffs
The advent of restricted residency duty hours has thrust the safety risks of handoffs into the spotlight. More recently, the Accreditation Council of Graduate Medical Education (ACGME) has restricted hours even further to a maximum of 16 hours for first‐year residents and up to 28 hours for residents beyond their first year.[1] Although the focus on these mandates has been scheduling and staffing in residency programs, another important area of attention is for handoff education and evaluation. The Common Program Requirements for the ACGME state that all residency programs should ensure that residents are competent in handoff communications and that programs should monitor handoffs to ensure that they are safe.[2] Moreover, recent efforts have defined milestones for handoffs, specifically that by 12 months, residents should be able to effectively communicate with other caregivers to maintain continuity during transitions of care.[3] Although more detailed handoff‐specific milestones have to be flushed out, a need for evaluation instruments to assess milestones is critical. In addition, handoffs continue to represent a vulnerable time for patients in many specialties, such as surgery and pediatrics.[4, 5]
Evaluating handoffs poses specific challenges for internal medicine residency programs because handoffs are often conducted on the fly or wherever convenient, and not always at a dedicated time and place.[6] Even when evaluations could be conducted at a dedicated time and place, program faculty and leadership may not be comfortable evaluating handoffs in real time due to lack of faculty development and recent experience with handoffs. Although supervising faculty may be in the most ideal position due to their intimate knowledge of the patient and their ability to evaluate the clinical judgment of trainees, they may face additional pressures of supervision and direct patient care that prevent their attendance at the time of the handoff. For these reasons, potential people to evaluate the quality of a resident handoff may be the peers to whom they frequently handoff. Because handoffs are also conceptualized as an interactive dialogue between sender and receiver, an ideal handoff performance evaluation would capture both of these roles.[7] For these reasons, peer evaluation may be a viable modality to assist programs in evaluating handoffs. Peer evaluation has been shown to be an effective method of rating performance of medical students,[8] practicing physicians,[9] and residents.[10] Moreover, peer evaluation is now a required feature in assessing internal medicine resident performance.[11] Although enthusiasm for peer evaluation has grown in residency training, the use of it can still be limited by a variety of problems, such as reluctance to rate peers poorly, difficulty obtaining evaluations, and the utility of such evaluations. For these reasons, it is important to understand whether peer evaluation of handoffs is feasible. Therefore, the aim of this study was to assess feasibility of an online peer evaluation survey tool of handoffs in an internal medicine residency and to characterize performance over time as well and associations between workload and performance.
METHODS
From July 2009 to March 2010, all interns on the general medicine inpatient service at 2 hospitals were asked to complete an end‐of‐month anonymous peer evaluation that included 14‐items addressing all core competencies. The evaluation tool was administered electronically using New Innovations (New Innovations, Inc., Uniontown, OH). Interns signed out to each other in a cross‐cover circuit that included 3 other interns on an every fourth night call cycle.[12] Call teams included 1 resident and 1 intern who worked from 7 am on the on‐call day to noon on the postcall day. Therefore, postcall interns were expected to hand off to the next on‐call intern before noon. Although attendings and senior residents were not required to formally supervise the handoff, supervising senior residents were often present during postcall intern sign‐out to facilitate departure of the team. When interns were not postcall, they were expected to sign out before they went to the clinic in the afternoon or when their foreseeable work was complete. The interns were provided with a 45‐minute lecture on handoffs and introduced to the peer evaluation tool in July 2009 at an intern orientation. They were also prompted to complete the tool to the best of their ability after their general medicine rotation. We chose the general medicine rotation because each intern completed approximately 2 months of general medicine in their first year. This would provide ratings over time without overburdening interns to complete 3 additional evaluations after every inpatient rotation.
The peer evaluation was constructed to correspond to specific ACGME core competencies and was also linked to specific handoff behaviors that were known to be effective. The questions were adapted from prior items used in a validated direct‐observation tool previously developed by the authors (the Handoff Clinical Evaluation Exercise), which was based on literature review as well as expert opinion.[13, 14] For example, under the core competency of communication, interns were asked to rate each other on communication skills using the anchors of No questions, no acknowledgement of to do tasks, transfer of information face to face is not a priority for low unsatisfactory (1) and Appropriate use of questions, acknowledgement and read‐back of to‐do and priority tasks, face to face communication a priority for high superior (9). Items that referred to behaviors related to both giving handoff and receiving handoff were used to capture the interactive dialogue between senders and receivers that characterize ideal handoffs. In addition, specific items referring to written sign‐out and verbal sign‐out were developed to capture the specific differences. For instance, for the patient care competency in written sign‐out, low unsatisfactory (1) was defined as Incomplete written content; to do's omitted or requested with no rationale or plan, or with inadequate preparation (ie, request to transfuse but consent not obtained), and high superior (9) was defined as Content is complete with to do's accompanied by clear plan of action and rationale. Pilot testing with trainees was conducted, including residents not involved in the study and clinical students. The tool was also reviewed by the residency program leadership, and in an effort to standardize the reporting of the items with our other evaluation forms, each item was mapped to a core competency that it was most related to. Debriefing of the instrument experience following usage was performed with 3 residents who had an interest in medical education and handoff performance.
The tool was deployed to interns following a brief educational session for interns, in which the tool was previewed and reviewed. Interns were counseled to use the form as a global performance assessment over the course of the month, in contrast to an episodic evaluation. This would also avoid the use of negative event bias by raters, in which the rater allows a single negative event to influence the perception of the person's performance, even long after the event has passed into history.
To analyze the data, descriptive statistics were used to summarize mean performance across domains. To assess whether intern performance improved over time, we split the academic year into 3 time periods of 3 months each, which we have used in earlier studies assessing intern experience.[15] Prior to analysis, postcall interns were identified by using the intern monthly call schedule located in the AMiON software program (Norwich, VT) to label the evaluation of the postcall intern. Then, all names were removed and replaced with a unique identifier for the evaluator and the evaluatee. In addition, each evaluation was also categorized as either having come from the main teaching hospital or the community hospital affiliate.
Multivariate random effects linear regression models, controlling for evaluator, evaluatee, and hospital, were used to assess the association between time (using indicator variables for season) and postcall status on intern performance. In addition, because of the skewness in the ratings, we also undertook additional analysis by transforming our data into dichotomous variables reflecting superior performance. After conducting conditional ordinal logistic regression, the main findings did not change. We also investigated within‐subject and between‐subject variation using intraclass correlation coefficients. Within‐subject intraclass correlation enabled assessment of inter‐rater reliability. Between‐subject intraclass correlation enabled the assessment of evaluator effects. Evaluator effects can encompass a variety of forms of rater bias such as leniency (in which evaluators tended to rate individuals uniformly positively), severity (rater tends to significantly avoid using positive ratings), or the halo effect (the individual being evaluated has 1 significantly positive attribute that overrides that which is being evaluated). All analyses were completed using STATA 10.0 (StataCorp, College Station, TX) with statistical significance defined as P < 0.05. This study was deemed to be exempt from institutional review board review after all data were deidentified prior to analysis.
RESULTS
From July 2009 to March 2010, 31 interns (78%) returned 60% (172/288) of the peer evaluations they received. Almost all (39/40, 98%) interns were evaluated at least once with a median of 4 ratings per intern (range, 19). Thirty‐five percent of ratings occurred when an intern was rotating at the community hospital. Ratings were very high on all domains (mean, 8.38.6). Overall sign‐out performance was rated as 8.4 (95% confidence interval [CI], 8.3‐8.5), with over 55% rating peers as 9 (maximal score). The lowest score given was 5. Individual items ranged from a low of 8.34 (95% CI, 8.21‐8.47) for updating written sign‐outs, to a high of 8.60 (95% CI, 8.50‐8.69) for collegiality (Table 1) The internal consistency of the instrument was calculated using all items and was very high, with a Cronbach = 0.98.
| ACGME Core Competency | Role | Items | Item | Mean | 95% CI | Range | % Receiving 9 as Rating |
|---|---|---|---|---|---|---|---|
| |||||||
| Patient care | Sender | Written sign‐out | Q1 | 8.34 | 8.25 to 8.48 | 69 | 53.2 |
| Sender | Updated content | Q2 | 8.35 | 8.22 to 8.47 | 59 | 54.4 | |
| Receiver | Documentation of overnight events | Q6 | 8.41 | 8.30 to 8.52 | 69 | 56.3 | |
| Medical knowledge | Sender | Anticipatory guidance | Q3 | 8.40 | 8.28 to 8.51 | 69 | 56.3 |
| Receiver | Clinical decision making during cross‐cover | Q7 | 8.45 | 8.35 to 8.55 | 69 | 56.0 | |
| Professionalism | Sender | Collegiality | Q4 | 8.60 | 8.51 to 8.68 | 69 | 65.7 |
| Receiver | Acknowledgement of professional responsibility | Q10 | 8.53 | 8.43 to 8.62 | 69 | 62.4 | |
| Receiver | Timeliness/responsiveness | Q11 | 8.50 | 8.39 to 8.60 | 69 | 61.9 | |
| Interpersonal and communication skills | Receiver | Listening behavior when receiving sign‐outs | Q8 | 8.52 | 8.42 to 8.62 | 69 | 63.6 |
| Receiver | Communication when receiving sign‐out | Q9 | 8.52 | 8.43 to 8.62 | 69 | 63.0 | |
| Systems‐based practice | Receiver | Resource use | Q12 | 8.45 | 8.35 to 8.55 | 69 | 55.6 |
| Practice‐based learning and improvement | Sender | Accepting of feedback | Q5 | 8.45 | 8.34 to 8.55 | 69 | 58.7 |
| Overall | Both | Overall sign‐out quality | Q13 | 8.44 | 8.34 to 8.54 | 69 | 55.3 |
Mean ratings for each item increased in season 2 and 3 and were statistically significant using a test for trend across ordered groups. However, in multivariate regression models, improvements remained statistically significant for only 4 items (Figure 1): 1) communication skills, 2) listening behavior, 3) accepting professional responsibility, and 4) accessing the system (Table 2). Specifically, when compared to season 1, improvements in communication skill were seen in season 2 (+0.34 [95% CI, 0.08‐0.60], P = 0.009) and were sustained in season 3 (+0.34 [95% CI, 0.06‐0.61], P = 0.018). A similar pattern was observed for listening behavior, with improvement in ratings that were similar in magnitude with increasing intern experience (season 2, +0.29 [95% CI, 0.04‐0.55], P = 0.025 compared to season 1). Although accessing the system scores showed a similar pattern of improvement with an increase in season 2 compared to season 1, the magnitude of this change was smaller (season 2, +0.21 [95% CI, 0.03‐0.39], P = 0.023). Interestingly, improvements in accepting professional responsibility rose during season 2, but the difference did not reach statistical significance until season 3 (+0.37 [95% CI, 0.08‐0.65], P = 0.012 compared to season 1).
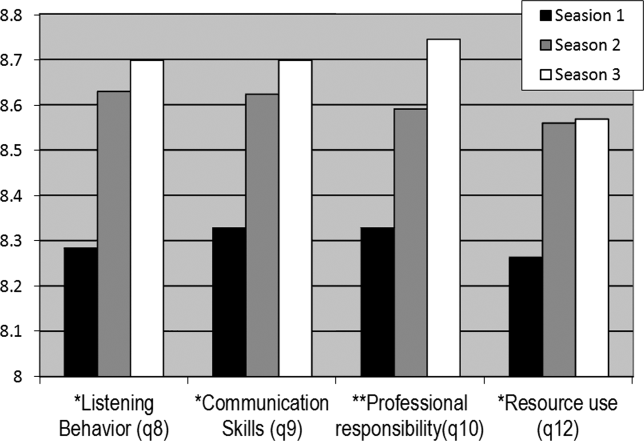
| Outcome | |||||
|---|---|---|---|---|---|
| Coefficient (95% CI) | |||||
| Predictor | Communication Skills | Listening Behavior | Professional Responsibility | Accessing the System | Written Sign‐out Quality |
| |||||
| Season 1 | Ref | Ref | Ref | Ref | Ref |
| Season 2 | 0.29 (0.04 to 0.55)a | 0.34 (0.08 to 0.60)a | 0.24 (0.03 to 0.51) | 0.21 (0.03 to 0.39)a | 0.05 (0.25 to 0.15) |
| Season 3 | 0.29 (0.02 to 0.56)a | 0.34 (0.06 to 0.61)a | 0.37 (0.08 to 0.65)a | 0.18 (0.01 to 0.36)a | 0.08 (0.13 to 0.30) |
| Community hospital | 0.18 (0.00 to 0.37) | 0.23 (0.04 to 0.43)a | 0.06 (0.13 to 0.26) | 0.13 (0.00 to 0.25) | 0.24 (0.08 to 0.39)a |
| Postcall | 0.10 (0.25 to 0.05) | 0.04 (0.21 to 0.13) | 0.02 (0.18 to 0.13) | 0.05 (0.16 to 0.05) | 0.18 (0.31,0.05)a |
| Constant | 7.04 (6.51 to 7.58) | 6.81 (6.23 to 7.38) | 7.04 (6.50 to 7.60) | 7.02 (6.59 to 7.45) | 6.49 (6.04 to 6.94) |
In addition to increasing experience, postcall interns were rated significantly lower than nonpostcall interns in 2 items: 1) written sign‐out quality (8.21 vs 8.39, P = 0.008) and 2) accepting feedback (practice‐based learning and improvement) (8.25 vs 8.42, P = 0.006). Interestingly, when interns were at the community hospital general medicine rotation, where overall census was much lower than at the teaching hospital, peer ratings were significantly higher for overall handoff performance and 7 (written sign‐out, update content, collegiality, accepting feedback, documentation of overnight events, clinical decision making during cross‐cover, and listening behavior) of the remaining 12 specific handoff domains (P < 0.05 for all, data not shown).
Last, significant evaluator effects were observed, which contributed to the variance in ratings given. For example, using intraclass correlation coefficients (ICC), we found that there was greater within‐intern variation than between‐intern variation, highlighting that evaluator scores tended to be strongly correlated with each other (eg, ICC overall performance = 0.64) and more so than scores of multiple evaluations of the same intern (eg, ICC overall performance = 0.18).
Because ratings of handoff performance were skewed, we also conducted a sensitivity analysis using ordinal logistic regression to ascertain if our findings remained significant. Using ordinal logistic regression models, significant improvements were seen in season 3 for 3 of the above‐listed behaviors, specifically listening behavior, professional responsibility, and accessing the system. Although there was no improvement in communication, there was an improvement observed in collegiality scores that were significant in season 3.
DISCUSSION
Using an end‐of‐rotation online peer assessment of handoff skills, it is feasible to obtain ratings of intern handoff performance from peers. Although there is evidence of rater bias toward leniency and low inter‐rater reliability, peer ratings of intern performance did increase over time. In addition, peer ratings were lower for interns who were handing off their postcall service. Working on a rotation at a community affiliate with a lower census was associated with higher peer ratings of handoffs.
It is worth considering the mechanism of these findings. First, the leniency observed in peer ratings likely reflects peers unwilling to critique each other due to a desire for an esprit de corps among their classmates. The low intraclass correlation coefficient for ratings of the same intern highlight that peers do not easily converge on their ratings of the same intern. Nevertheless, the ratings on the peer evaluation did demonstrate improvements over time. This improvement could easily reflect on‐the‐job learning, as interns become more acquainted with their roles and efficient and competent in their tasks. Together, these data provide a foundation for developing milestone handoffs that reflect the natural progression of intern competence in handoffs. For example, communication appeared to improve at 3 months, whereas transfer of professional responsibility improved at 6 months after beginning internship. However, alternative explanations are also important to consider. Although it is easy and somewhat reassuring to assume that increases over time reflect a learning effect, it is also possible that interns are unwilling to critique their peers as familiarity with them increases.
There are several reasons why postcall interns could have been universally rated lower than nonpostcall interns. First, postcall interns likely had the sickest patients with the most to‐do tasks or work associated with their sign‐out because they were handing off newly admitted patients. Because the postcall sign‐out is associated with the highest workload, it may be that interns perceive that a good handoff is nothing to do, and handoffs associated with more work are not highly rated. It is also important to note that postcall interns, who in this study were at the end of a 30‐hour duty shift, were also most fatigued and overworked, which may have also affected the handoff, especially in the 2 domains of interest. Due to the time pressure to leave coupled with fatigue, they may have had less time to invest in written sign‐out quality and may not have been receptive to feedback on their performance. Likewise, performance on handoffs was rated higher when at the community hospital, which could be due to several reasons. The most plausible explanation is that the workload associated with that sign‐out is less due to lower patient census and lower patient acuity. In the community hospital, fewer residents were also geographically co‐located on a quieter ward and work room area, which may contribute to higher ratings across domains.
This study also has implications for future efforts to improve and evaluate handoff performance in residency trainees. For example, our findings suggest the importance of enhancing supervision and training for handoffs during high workload rotations or certain times of the year. In addition, evaluation systems for handoff performance that rely solely on peer evaluation will not likely yield an accurate picture of handoff performance, difficulty obtaining peer evaluations, the halo effect, and other forms of evaluator bias in ratings. Accurate handoff evaluation may require direct observation of verbal communication and faculty audit of written sign‐outs.[16, 17] Moreover, methods such as appreciative inquiry can help identify the peers with the best practices to emulate.[18] Future efforts to validate peer assessment of handoffs against these other assessment methods, such as direct observation by service attendings, are needed.
There are limitations to this study. First, although we have limited our findings to 1 residency program with 1 type of rotation, we have already expanded to a community residency program that used a float system and have disseminated our tool to several other institutions. In addition, we have a small number of participants, and our 60% return rate on monthly peer evaluations raises concerns of nonresponse bias. For example, a peer who perceived the handoff performance of an intern to be poor may be less likely to return the evaluation. Because our dataset has been deidentified per institutional review board request, we do not have any information to differentiate systematic reasons for not responding to the evaluation. Anecdotally, a critique of the tool is that it is lengthy, especially in light of the fact that 1 intern completes 3 additional handoff evaluations. It is worth understanding why the instrument had such a high internal consistency. Although the items were designed to address different competencies initially, peers may make a global assessment about someone's ability to perform a handoff and then fill out the evaluation accordingly. This speaks to the difficulty in evaluating the subcomponents of various actions related to the handoff. Because of the high internal consistency, we were able to shorten the survey to a 5‐item instrument with a Cronbach of 0.93, which we are currently using in our program and have disseminated to other programs. Although it is currently unclear if the ratings of performance on the longer peer evaluation are valid, we are investigating concurrent validity of the shorter tool by comparing peer evaluations to other measures of handoff quality as part of our current work. Last, we are only able to test associations and not make causal inferences.
CONCLUSION
Peer assessment of handoff skills is feasible via an electronic competency‐based tool. Although there is evidence of score inflation, intern performance does increase over time and is associated with various aspects of workload, such as postcall status or working on a rotation at a community affiliate with a lower census. Together, these data can provide a foundation for developing milestones handoffs that reflect the natural progression of intern competence in handoffs.
Acknowledgments
The authors thank the University of Chicago Medicine residents and chief residents, the members of the Curriculum and Housestaff Evaluation Committee, Tyrece Hunter and Amy Ice‐Gibson, and Meryl Prochaska and Laura Ruth Venable for assistance with manuscript preparation.
Disclosures
This study was funded by the University of Chicago Department of Medicine Clinical Excellence and Medical Education Award and AHRQ R03 5R03HS018278‐02 Development of and Validation of a Tool to Evaluate Hand‐off Quality.
- , , ; the ACGME Duty Hour Task Force. The new recommendations on duty hours from the ACGME Task Force. N Engl J Med. 2010; 363.
- Common program requirements. Available at: http://acgme‐2010standards.org/pdf/Common_Program_Requirements_07012011.pdf. Accessed December 10, 2012.
- , , , et al. Charting the road to competence: developmental milestones for internal medicine residency training. J Grad Med Educ. 2009;1(1):5–20.
- , , , et al. Patterns of communication breakdowns resulting in injury to surgical patients. J Am Coll Surg. 2007;204(4):533–540.
- , , , . Patient handoffs: pediatric resident experiences and lessons learned. Clin Pediatr (Phila). 2011;50(1):57–63.
- , , , , . Managing discontinuity in academic medical centers: strategies for a safe and effective resident sign‐out. J Hosp Med. 2006;1(4):257–266.
- , , , , . Communication, communication, communication: the art of the handoff. Ann Emerg Med. 2010;55(2):181–183.
- , , , , . Use of peer evaluation in the assessment of medical students. J Med Educ. 1981;56:35–42.
- , , , , , . Use of peer ratings to evaluate physician performance. JAMA. 1993;269:1655–1660.
- , , . A pilot study of peer review in residency training. J Gen Intern Med. 1999;14(9):551–554.
- ACGME Program Requirements for Graduate Medical Education in Internal Medicine Effective July 1, 2009. Available at: http://www.acgme.org/acgmeweb/Portals/0/PFAssets/ProgramRequirements/140_internal_medicine_07012009.pdf. Accessed December 10, 2012.
- , , , , , . The effects of on‐duty napping on intern sleep time and fatigue. Ann Intern Med. 2006;144(11):792–798.
- , , , et al. Hand‐off education and evaluation: piloting the observed simulated hand‐off experience (OSHE). J Gen Intern Med. 2010;25(2):129–134.
- , , , , , . Validation of a handoff assessment tool: the Handoff CEX [published online ahead of print June 7, 2012]. J Clin Nurs. doi: 10.1111/j.1365‐2702.2012.04131.x.
- , , , et al. Association of workload of on‐call medical interns with on‐call sleep duration, shift duration, and participation in educational activities. JAMA. 2008;300(10):1146–1153.
- , . Using direct observation, formal evaluation, and an interactive curriculum to improve the sign‐out practices of internal medicine interns. Acad Med. 2010;85(7):1182–1188.
- , , , . Faculty member review and feedback using a sign‐out checklist: improving intern written sign‐out. Acad Med. 2012;87(8):1125–1131.
- , , , et al. Use of an appreciative inquiry approach to improve resident sign‐out in an era of multiple shift changes. J Gen Intern Med. 2012;27(3):287–291.
The advent of restricted residency duty hours has thrust the safety risks of handoffs into the spotlight. More recently, the Accreditation Council of Graduate Medical Education (ACGME) has restricted hours even further to a maximum of 16 hours for first‐year residents and up to 28 hours for residents beyond their first year.[1] Although the focus on these mandates has been scheduling and staffing in residency programs, another important area of attention is for handoff education and evaluation. The Common Program Requirements for the ACGME state that all residency programs should ensure that residents are competent in handoff communications and that programs should monitor handoffs to ensure that they are safe.[2] Moreover, recent efforts have defined milestones for handoffs, specifically that by 12 months, residents should be able to effectively communicate with other caregivers to maintain continuity during transitions of care.[3] Although more detailed handoff‐specific milestones have to be flushed out, a need for evaluation instruments to assess milestones is critical. In addition, handoffs continue to represent a vulnerable time for patients in many specialties, such as surgery and pediatrics.[4, 5]
Evaluating handoffs poses specific challenges for internal medicine residency programs because handoffs are often conducted on the fly or wherever convenient, and not always at a dedicated time and place.[6] Even when evaluations could be conducted at a dedicated time and place, program faculty and leadership may not be comfortable evaluating handoffs in real time due to lack of faculty development and recent experience with handoffs. Although supervising faculty may be in the most ideal position due to their intimate knowledge of the patient and their ability to evaluate the clinical judgment of trainees, they may face additional pressures of supervision and direct patient care that prevent their attendance at the time of the handoff. For these reasons, potential people to evaluate the quality of a resident handoff may be the peers to whom they frequently handoff. Because handoffs are also conceptualized as an interactive dialogue between sender and receiver, an ideal handoff performance evaluation would capture both of these roles.[7] For these reasons, peer evaluation may be a viable modality to assist programs in evaluating handoffs. Peer evaluation has been shown to be an effective method of rating performance of medical students,[8] practicing physicians,[9] and residents.[10] Moreover, peer evaluation is now a required feature in assessing internal medicine resident performance.[11] Although enthusiasm for peer evaluation has grown in residency training, the use of it can still be limited by a variety of problems, such as reluctance to rate peers poorly, difficulty obtaining evaluations, and the utility of such evaluations. For these reasons, it is important to understand whether peer evaluation of handoffs is feasible. Therefore, the aim of this study was to assess feasibility of an online peer evaluation survey tool of handoffs in an internal medicine residency and to characterize performance over time as well and associations between workload and performance.
METHODS
From July 2009 to March 2010, all interns on the general medicine inpatient service at 2 hospitals were asked to complete an end‐of‐month anonymous peer evaluation that included 14‐items addressing all core competencies. The evaluation tool was administered electronically using New Innovations (New Innovations, Inc., Uniontown, OH). Interns signed out to each other in a cross‐cover circuit that included 3 other interns on an every fourth night call cycle.[12] Call teams included 1 resident and 1 intern who worked from 7 am on the on‐call day to noon on the postcall day. Therefore, postcall interns were expected to hand off to the next on‐call intern before noon. Although attendings and senior residents were not required to formally supervise the handoff, supervising senior residents were often present during postcall intern sign‐out to facilitate departure of the team. When interns were not postcall, they were expected to sign out before they went to the clinic in the afternoon or when their foreseeable work was complete. The interns were provided with a 45‐minute lecture on handoffs and introduced to the peer evaluation tool in July 2009 at an intern orientation. They were also prompted to complete the tool to the best of their ability after their general medicine rotation. We chose the general medicine rotation because each intern completed approximately 2 months of general medicine in their first year. This would provide ratings over time without overburdening interns to complete 3 additional evaluations after every inpatient rotation.
The peer evaluation was constructed to correspond to specific ACGME core competencies and was also linked to specific handoff behaviors that were known to be effective. The questions were adapted from prior items used in a validated direct‐observation tool previously developed by the authors (the Handoff Clinical Evaluation Exercise), which was based on literature review as well as expert opinion.[13, 14] For example, under the core competency of communication, interns were asked to rate each other on communication skills using the anchors of No questions, no acknowledgement of to do tasks, transfer of information face to face is not a priority for low unsatisfactory (1) and Appropriate use of questions, acknowledgement and read‐back of to‐do and priority tasks, face to face communication a priority for high superior (9). Items that referred to behaviors related to both giving handoff and receiving handoff were used to capture the interactive dialogue between senders and receivers that characterize ideal handoffs. In addition, specific items referring to written sign‐out and verbal sign‐out were developed to capture the specific differences. For instance, for the patient care competency in written sign‐out, low unsatisfactory (1) was defined as Incomplete written content; to do's omitted or requested with no rationale or plan, or with inadequate preparation (ie, request to transfuse but consent not obtained), and high superior (9) was defined as Content is complete with to do's accompanied by clear plan of action and rationale. Pilot testing with trainees was conducted, including residents not involved in the study and clinical students. The tool was also reviewed by the residency program leadership, and in an effort to standardize the reporting of the items with our other evaluation forms, each item was mapped to a core competency that it was most related to. Debriefing of the instrument experience following usage was performed with 3 residents who had an interest in medical education and handoff performance.
The tool was deployed to interns following a brief educational session for interns, in which the tool was previewed and reviewed. Interns were counseled to use the form as a global performance assessment over the course of the month, in contrast to an episodic evaluation. This would also avoid the use of negative event bias by raters, in which the rater allows a single negative event to influence the perception of the person's performance, even long after the event has passed into history.
To analyze the data, descriptive statistics were used to summarize mean performance across domains. To assess whether intern performance improved over time, we split the academic year into 3 time periods of 3 months each, which we have used in earlier studies assessing intern experience.[15] Prior to analysis, postcall interns were identified by using the intern monthly call schedule located in the AMiON software program (Norwich, VT) to label the evaluation of the postcall intern. Then, all names were removed and replaced with a unique identifier for the evaluator and the evaluatee. In addition, each evaluation was also categorized as either having come from the main teaching hospital or the community hospital affiliate.
Multivariate random effects linear regression models, controlling for evaluator, evaluatee, and hospital, were used to assess the association between time (using indicator variables for season) and postcall status on intern performance. In addition, because of the skewness in the ratings, we also undertook additional analysis by transforming our data into dichotomous variables reflecting superior performance. After conducting conditional ordinal logistic regression, the main findings did not change. We also investigated within‐subject and between‐subject variation using intraclass correlation coefficients. Within‐subject intraclass correlation enabled assessment of inter‐rater reliability. Between‐subject intraclass correlation enabled the assessment of evaluator effects. Evaluator effects can encompass a variety of forms of rater bias such as leniency (in which evaluators tended to rate individuals uniformly positively), severity (rater tends to significantly avoid using positive ratings), or the halo effect (the individual being evaluated has 1 significantly positive attribute that overrides that which is being evaluated). All analyses were completed using STATA 10.0 (StataCorp, College Station, TX) with statistical significance defined as P < 0.05. This study was deemed to be exempt from institutional review board review after all data were deidentified prior to analysis.
RESULTS
From July 2009 to March 2010, 31 interns (78%) returned 60% (172/288) of the peer evaluations they received. Almost all (39/40, 98%) interns were evaluated at least once with a median of 4 ratings per intern (range, 19). Thirty‐five percent of ratings occurred when an intern was rotating at the community hospital. Ratings were very high on all domains (mean, 8.38.6). Overall sign‐out performance was rated as 8.4 (95% confidence interval [CI], 8.3‐8.5), with over 55% rating peers as 9 (maximal score). The lowest score given was 5. Individual items ranged from a low of 8.34 (95% CI, 8.21‐8.47) for updating written sign‐outs, to a high of 8.60 (95% CI, 8.50‐8.69) for collegiality (Table 1) The internal consistency of the instrument was calculated using all items and was very high, with a Cronbach = 0.98.
| ACGME Core Competency | Role | Items | Item | Mean | 95% CI | Range | % Receiving 9 as Rating |
|---|---|---|---|---|---|---|---|
| |||||||
| Patient care | Sender | Written sign‐out | Q1 | 8.34 | 8.25 to 8.48 | 69 | 53.2 |
| Sender | Updated content | Q2 | 8.35 | 8.22 to 8.47 | 59 | 54.4 | |
| Receiver | Documentation of overnight events | Q6 | 8.41 | 8.30 to 8.52 | 69 | 56.3 | |
| Medical knowledge | Sender | Anticipatory guidance | Q3 | 8.40 | 8.28 to 8.51 | 69 | 56.3 |
| Receiver | Clinical decision making during cross‐cover | Q7 | 8.45 | 8.35 to 8.55 | 69 | 56.0 | |
| Professionalism | Sender | Collegiality | Q4 | 8.60 | 8.51 to 8.68 | 69 | 65.7 |
| Receiver | Acknowledgement of professional responsibility | Q10 | 8.53 | 8.43 to 8.62 | 69 | 62.4 | |
| Receiver | Timeliness/responsiveness | Q11 | 8.50 | 8.39 to 8.60 | 69 | 61.9 | |
| Interpersonal and communication skills | Receiver | Listening behavior when receiving sign‐outs | Q8 | 8.52 | 8.42 to 8.62 | 69 | 63.6 |
| Receiver | Communication when receiving sign‐out | Q9 | 8.52 | 8.43 to 8.62 | 69 | 63.0 | |
| Systems‐based practice | Receiver | Resource use | Q12 | 8.45 | 8.35 to 8.55 | 69 | 55.6 |
| Practice‐based learning and improvement | Sender | Accepting of feedback | Q5 | 8.45 | 8.34 to 8.55 | 69 | 58.7 |
| Overall | Both | Overall sign‐out quality | Q13 | 8.44 | 8.34 to 8.54 | 69 | 55.3 |
Mean ratings for each item increased in season 2 and 3 and were statistically significant using a test for trend across ordered groups. However, in multivariate regression models, improvements remained statistically significant for only 4 items (Figure 1): 1) communication skills, 2) listening behavior, 3) accepting professional responsibility, and 4) accessing the system (Table 2). Specifically, when compared to season 1, improvements in communication skill were seen in season 2 (+0.34 [95% CI, 0.08‐0.60], P = 0.009) and were sustained in season 3 (+0.34 [95% CI, 0.06‐0.61], P = 0.018). A similar pattern was observed for listening behavior, with improvement in ratings that were similar in magnitude with increasing intern experience (season 2, +0.29 [95% CI, 0.04‐0.55], P = 0.025 compared to season 1). Although accessing the system scores showed a similar pattern of improvement with an increase in season 2 compared to season 1, the magnitude of this change was smaller (season 2, +0.21 [95% CI, 0.03‐0.39], P = 0.023). Interestingly, improvements in accepting professional responsibility rose during season 2, but the difference did not reach statistical significance until season 3 (+0.37 [95% CI, 0.08‐0.65], P = 0.012 compared to season 1).
| Outcome | |||||
|---|---|---|---|---|---|
| Coefficient (95% CI) | |||||
| Predictor | Communication Skills | Listening Behavior | Professional Responsibility | Accessing the System | Written Sign‐out Quality |
| |||||
| Season 1 | Ref | Ref | Ref | Ref | Ref |
| Season 2 | 0.29 (0.04 to 0.55)a | 0.34 (0.08 to 0.60)a | 0.24 (0.03 to 0.51) | 0.21 (0.03 to 0.39)a | 0.05 (0.25 to 0.15) |
| Season 3 | 0.29 (0.02 to 0.56)a | 0.34 (0.06 to 0.61)a | 0.37 (0.08 to 0.65)a | 0.18 (0.01 to 0.36)a | 0.08 (0.13 to 0.30) |
| Community hospital | 0.18 (0.00 to 0.37) | 0.23 (0.04 to 0.43)a | 0.06 (0.13 to 0.26) | 0.13 (0.00 to 0.25) | 0.24 (0.08 to 0.39)a |
| Postcall | 0.10 (0.25 to 0.05) | 0.04 (0.21 to 0.13) | 0.02 (0.18 to 0.13) | 0.05 (0.16 to 0.05) | 0.18 (0.31,0.05)a |
| Constant | 7.04 (6.51 to 7.58) | 6.81 (6.23 to 7.38) | 7.04 (6.50 to 7.60) | 7.02 (6.59 to 7.45) | 6.49 (6.04 to 6.94) |
In addition to increasing experience, postcall interns were rated significantly lower than nonpostcall interns in 2 items: 1) written sign‐out quality (8.21 vs 8.39, P = 0.008) and 2) accepting feedback (practice‐based learning and improvement) (8.25 vs 8.42, P = 0.006). Interestingly, when interns were at the community hospital general medicine rotation, where overall census was much lower than at the teaching hospital, peer ratings were significantly higher for overall handoff performance and 7 (written sign‐out, update content, collegiality, accepting feedback, documentation of overnight events, clinical decision making during cross‐cover, and listening behavior) of the remaining 12 specific handoff domains (P < 0.05 for all, data not shown).
Last, significant evaluator effects were observed, which contributed to the variance in ratings given. For example, using intraclass correlation coefficients (ICC), we found that there was greater within‐intern variation than between‐intern variation, highlighting that evaluator scores tended to be strongly correlated with each other (eg, ICC overall performance = 0.64) and more so than scores of multiple evaluations of the same intern (eg, ICC overall performance = 0.18).
Because ratings of handoff performance were skewed, we also conducted a sensitivity analysis using ordinal logistic regression to ascertain if our findings remained significant. Using ordinal logistic regression models, significant improvements were seen in season 3 for 3 of the above‐listed behaviors, specifically listening behavior, professional responsibility, and accessing the system. Although there was no improvement in communication, there was an improvement observed in collegiality scores that were significant in season 3.
DISCUSSION
Using an end‐of‐rotation online peer assessment of handoff skills, it is feasible to obtain ratings of intern handoff performance from peers. Although there is evidence of rater bias toward leniency and low inter‐rater reliability, peer ratings of intern performance did increase over time. In addition, peer ratings were lower for interns who were handing off their postcall service. Working on a rotation at a community affiliate with a lower census was associated with higher peer ratings of handoffs.
It is worth considering the mechanism of these findings. First, the leniency observed in peer ratings likely reflects peers unwilling to critique each other due to a desire for an esprit de corps among their classmates. The low intraclass correlation coefficient for ratings of the same intern highlight that peers do not easily converge on their ratings of the same intern. Nevertheless, the ratings on the peer evaluation did demonstrate improvements over time. This improvement could easily reflect on‐the‐job learning, as interns become more acquainted with their roles and efficient and competent in their tasks. Together, these data provide a foundation for developing milestone handoffs that reflect the natural progression of intern competence in handoffs. For example, communication appeared to improve at 3 months, whereas transfer of professional responsibility improved at 6 months after beginning internship. However, alternative explanations are also important to consider. Although it is easy and somewhat reassuring to assume that increases over time reflect a learning effect, it is also possible that interns are unwilling to critique their peers as familiarity with them increases.
There are several reasons why postcall interns could have been universally rated lower than nonpostcall interns. First, postcall interns likely had the sickest patients with the most to‐do tasks or work associated with their sign‐out because they were handing off newly admitted patients. Because the postcall sign‐out is associated with the highest workload, it may be that interns perceive that a good handoff is nothing to do, and handoffs associated with more work are not highly rated. It is also important to note that postcall interns, who in this study were at the end of a 30‐hour duty shift, were also most fatigued and overworked, which may have also affected the handoff, especially in the 2 domains of interest. Due to the time pressure to leave coupled with fatigue, they may have had less time to invest in written sign‐out quality and may not have been receptive to feedback on their performance. Likewise, performance on handoffs was rated higher when at the community hospital, which could be due to several reasons. The most plausible explanation is that the workload associated with that sign‐out is less due to lower patient census and lower patient acuity. In the community hospital, fewer residents were also geographically co‐located on a quieter ward and work room area, which may contribute to higher ratings across domains.
This study also has implications for future efforts to improve and evaluate handoff performance in residency trainees. For example, our findings suggest the importance of enhancing supervision and training for handoffs during high workload rotations or certain times of the year. In addition, evaluation systems for handoff performance that rely solely on peer evaluation will not likely yield an accurate picture of handoff performance, difficulty obtaining peer evaluations, the halo effect, and other forms of evaluator bias in ratings. Accurate handoff evaluation may require direct observation of verbal communication and faculty audit of written sign‐outs.[16, 17] Moreover, methods such as appreciative inquiry can help identify the peers with the best practices to emulate.[18] Future efforts to validate peer assessment of handoffs against these other assessment methods, such as direct observation by service attendings, are needed.
There are limitations to this study. First, although we have limited our findings to 1 residency program with 1 type of rotation, we have already expanded to a community residency program that used a float system and have disseminated our tool to several other institutions. In addition, we have a small number of participants, and our 60% return rate on monthly peer evaluations raises concerns of nonresponse bias. For example, a peer who perceived the handoff performance of an intern to be poor may be less likely to return the evaluation. Because our dataset has been deidentified per institutional review board request, we do not have any information to differentiate systematic reasons for not responding to the evaluation. Anecdotally, a critique of the tool is that it is lengthy, especially in light of the fact that 1 intern completes 3 additional handoff evaluations. It is worth understanding why the instrument had such a high internal consistency. Although the items were designed to address different competencies initially, peers may make a global assessment about someone's ability to perform a handoff and then fill out the evaluation accordingly. This speaks to the difficulty in evaluating the subcomponents of various actions related to the handoff. Because of the high internal consistency, we were able to shorten the survey to a 5‐item instrument with a Cronbach of 0.93, which we are currently using in our program and have disseminated to other programs. Although it is currently unclear if the ratings of performance on the longer peer evaluation are valid, we are investigating concurrent validity of the shorter tool by comparing peer evaluations to other measures of handoff quality as part of our current work. Last, we are only able to test associations and not make causal inferences.
CONCLUSION
Peer assessment of handoff skills is feasible via an electronic competency‐based tool. Although there is evidence of score inflation, intern performance does increase over time and is associated with various aspects of workload, such as postcall status or working on a rotation at a community affiliate with a lower census. Together, these data can provide a foundation for developing milestones handoffs that reflect the natural progression of intern competence in handoffs.
Acknowledgments
The authors thank the University of Chicago Medicine residents and chief residents, the members of the Curriculum and Housestaff Evaluation Committee, Tyrece Hunter and Amy Ice‐Gibson, and Meryl Prochaska and Laura Ruth Venable for assistance with manuscript preparation.
Disclosures
This study was funded by the University of Chicago Department of Medicine Clinical Excellence and Medical Education Award and AHRQ R03 5R03HS018278‐02 Development of and Validation of a Tool to Evaluate Hand‐off Quality.
- , , ; the ACGME Duty Hour Task Force. The new recommendations on duty hours from the ACGME Task Force. N Engl J Med. 2010; 363.
- Common program requirements. Available at: http://acgme‐2010standards.org/pdf/Common_Program_Requirements_07012011.pdf. Accessed December 10, 2012.
- , , , et al. Charting the road to competence: developmental milestones for internal medicine residency training. J Grad Med Educ. 2009;1(1):5–20.
- , , , et al. Patterns of communication breakdowns resulting in injury to surgical patients. J Am Coll Surg. 2007;204(4):533–540.
- , , , . Patient handoffs: pediatric resident experiences and lessons learned. Clin Pediatr (Phila). 2011;50(1):57–63.
- , , , , . Managing discontinuity in academic medical centers: strategies for a safe and effective resident sign‐out. J Hosp Med. 2006;1(4):257–266.
- , , , , . Communication, communication, communication: the art of the handoff. Ann Emerg Med. 2010;55(2):181–183.
- , , , , . Use of peer evaluation in the assessment of medical students. J Med Educ. 1981;56:35–42.
- , , , , , . Use of peer ratings to evaluate physician performance. JAMA. 1993;269:1655–1660.
- , , . A pilot study of peer review in residency training. J Gen Intern Med. 1999;14(9):551–554.
- ACGME Program Requirements for Graduate Medical Education in Internal Medicine Effective July 1, 2009. Available at: http://www.acgme.org/acgmeweb/Portals/0/PFAssets/ProgramRequirements/140_internal_medicine_07012009.pdf. Accessed December 10, 2012.
- , , , , , . The effects of on‐duty napping on intern sleep time and fatigue. Ann Intern Med. 2006;144(11):792–798.
- , , , et al. Hand‐off education and evaluation: piloting the observed simulated hand‐off experience (OSHE). J Gen Intern Med. 2010;25(2):129–134.
- , , , , , . Validation of a handoff assessment tool: the Handoff CEX [published online ahead of print June 7, 2012]. J Clin Nurs. doi: 10.1111/j.1365‐2702.2012.04131.x.
- , , , et al. Association of workload of on‐call medical interns with on‐call sleep duration, shift duration, and participation in educational activities. JAMA. 2008;300(10):1146–1153.
- , . Using direct observation, formal evaluation, and an interactive curriculum to improve the sign‐out practices of internal medicine interns. Acad Med. 2010;85(7):1182–1188.
- , , , . Faculty member review and feedback using a sign‐out checklist: improving intern written sign‐out. Acad Med. 2012;87(8):1125–1131.
- , , , et al. Use of an appreciative inquiry approach to improve resident sign‐out in an era of multiple shift changes. J Gen Intern Med. 2012;27(3):287–291.
Copyright © 2012 Society of Hospital Medicine
