User login
Sleep in Hospitalized Adults
Lack of sleep is a common problem in hospitalized patients and is associated with poorer health outcomes, especially in older patients.[1, 2, 3] Prior studies highlight a multitude of factors that can result in sleep loss in the hospital[3, 4, 5, 6] with 1 of the most common causes of sleep disruption in the hospital being noise.[7, 8, 9]
In addition to external factors, such as hospital noise, there may be inherent characteristics that predispose certain patients to greater sleep loss when hospitalized. One such measure is the construct of perceived control or the psychological measure of how much individuals expect themselves to be capable of bringing about desired outcomes.[10] Among older patients, low perceived control is associated with increased rates of physician visits, hospitalizations, and death.[11, 12] In contrast, patients who feel more in control of their environment may experience positive health benefits.[13]
Yet, when patients are placed in a hospital setting, they experience a significant reduction in control over their environment along with an increase in dependency on medical staff and therapies.[14, 15] For example, hospitalized patients are restricted in their personal decisions, such as what clothes they can wear and what they can eat and are not in charge of their own schedules, including their sleep time.
Although prior studies suggest that perceived control over sleep is related to actual sleep among community‐dwelling adults,[16, 17] no study has examined this relationship in hospitalized adults. Therefore, the aim of our study was to examine the possible association between perceived control, noise levels, and sleep in hospitalized middle‐aged and older patients.
METHODS
Study Design
We conducted a prospective cohort study of subjects recruited from a large ongoing study of admitted patients at the University of Chicago inpatient general medicine service.[18] Because we were interested in middle‐aged and older adults who are most sensitive to sleep disruptions, patients who were age 50 years and over, ambulatory, and living in the community were eligible for the study.[19] Exclusion criteria were cognitive impairment (telephone version of the Mini‐Mental State Exam <17 out of 22), preexisting sleeping disorders identified via patient charts, such as obstructive sleep apnea and narcolepsy, transfer from the intensive care unit (ICU), and admission to the hospital more than 72 hours prior to enrollment.[20] These inclusion and exclusion criteria were selected to identify a patient population with minimal sleep disturbances at baseline. Patients under isolation were excluded because they are not visited as frequently by the healthcare team.[21, 22] Most general medicine rooms were double occupancy but efforts were made to make patient rooms single when possible or required (ie, isolation for infection control). The study was approved by the University of Chicago Institutional Review Board.
Subjective Data Collection
Baseline levels of perceived control over sleep, or the amount of control patients believe they have over their sleep, were assessed using 2 different scales. The first tool was the 8‐item Sleep Locus of Control (SLOC) scale,[17] which ranges from 8 to 48, with higher values corresponding to a greater internal locus of control over sleep. An internal sleep locus of control indicates beliefs that patients feel that they are primarily responsible for their own sleep as opposed to an external locus of control which indicates beliefs that good sleep is due to luck or chance. For example, patients were asked how strongly they agree or disagree with statements, such as, If I take care of myself, I can avoid insomnia and People who never get insomnia are just plain lucky (see Supporting Information, Appendix 2, in the online version of this article). The second tool was the 9‐item Sleep Self‐Efficacy (SSE) scale,[23] which ranges from 9 to 45, with higher values corresponding to greater confidence patients have in their ability to sleep. One of the items asks, How confident are you that you can lie in bed feeling physically relaxed (see Supporting Information, Appendix 1, in the online version of this article)? Both instruments have been validated in an outpatient setting.[23] These surveys were given immediately on enrollment in the study to measure baseline perceived control.
Baseline sleep habits were also collected on enrollment using the Epworth Sleepiness Scale,[24, 25] a standard validated survey that assesses excess daytime sleepiness in various common situations. For each day in the hospital, patients were asked to report in‐hospital sleep quality using the Karolinska Sleep Log.[26] The Karolinska Sleep Quality Index (KSQI) is calculated from 4 items on the Karolinska Sleep Log (sleep quality, sleep restlessness, slept throughout the night, ease of falling asleep). The questions are on a 5‐point scale and the 4 items are averaged for a final score out of 5 with a higher number indicating better subjective sleep quality. The item How much was your sleep disturbed by noise? on the Karolinska Sleep Log was used to assess the degree to which noise was a disruptor of sleep. This question was also on a 5‐point scale with higher scores indicating greater disruptiveness of noise. Patients were also asked how disruptive noise from roommates was on a nightly basis using this same scale.
Objective Data Collection
Wrist activity monitors (Actiwatch 2; Respironics, Inc., Murrysville, PA)[27, 28, 29, 30] were used to measure patient sleep. Actiware 5 software (Respironics, Inc.)[31] was used to estimate quantitative measures of sleep time and efficiency. Sleep time is defined as the total duration of time spent sleeping at night and sleep efficiency is defined as the fraction of time, reported as a percentage, spent sleeping by actigraphy out of the total time patients reported they were sleeping.
Sound levels in patient rooms were recorded using Larson Davis 720 Sound Level Monitors (Larson Davis, Inc., Provo, UT). These monitors store functional average sound pressure levels in A‐weighted decibels called the Leq over 1‐hour intervals. The Leq is the average sound level over the given time interval. Minimum (Lmin) and maximum (Lmax) sound levels are also stored. The LD SLM Utility Program (Larson Davis, Inc.) was used to extract the sound level measurements recorded by the monitors.
Demographic information (age, gender, race, ethnicity, highest level of education, length of stay in the hospital, and comorbidities) was obtained from hospital charts via an ongoing study of admitted patients at the University of Chicago Medical Center inpatient general medicine service.[18] Chart audits were performed to determine whether patients received pharmacologic sleep aids in the hospital.
Data Analysis
Descriptive statistics were used to summarize mean sleep duration and sleep efficiency in the hospital as well as SLOC and SSE. Because the SSE scores were not normally distributed, the scores were dichotomized at the median to create a variable denoting high and low SSE. Additionally, because the distribution of responses to the noise disruption question was skewed to the right, reports of noise disruptions were grouped into not disruptive (score=1) and disruptive (score>1).
Two‐sample t tests with equal variances were used to assess the relationship between perceived control measures (high/low SLOC, SSE) and objective sleep measures (sleep time, sleep efficiency). Multivariate linear regression was used to test the association between high SSE (independent variable) and sleep time (dependent variable), clustering for multiple nights of data within the subject. Multivariate logistic regression, also adjusting for subject, was used to test the association between high SSE and noise disruptiveness and the association between high SSE and Karolinska scores. Leq, Lmax, and Lmin were all tested using stepwise forward regression. Because our prior work[9] demonstrated that noise levels separated into tertiles were significantly associated with sleep time, our analysis also used noise levels separated into tertiles. Stepwise forward regression was used to add basic patient demographics (gender, race, age) to the models. Statistical significance was defined as P<0.05, and all statistical analysis was done using Stata 11.0 (StataCorp, College Station, TX).
RESULTS
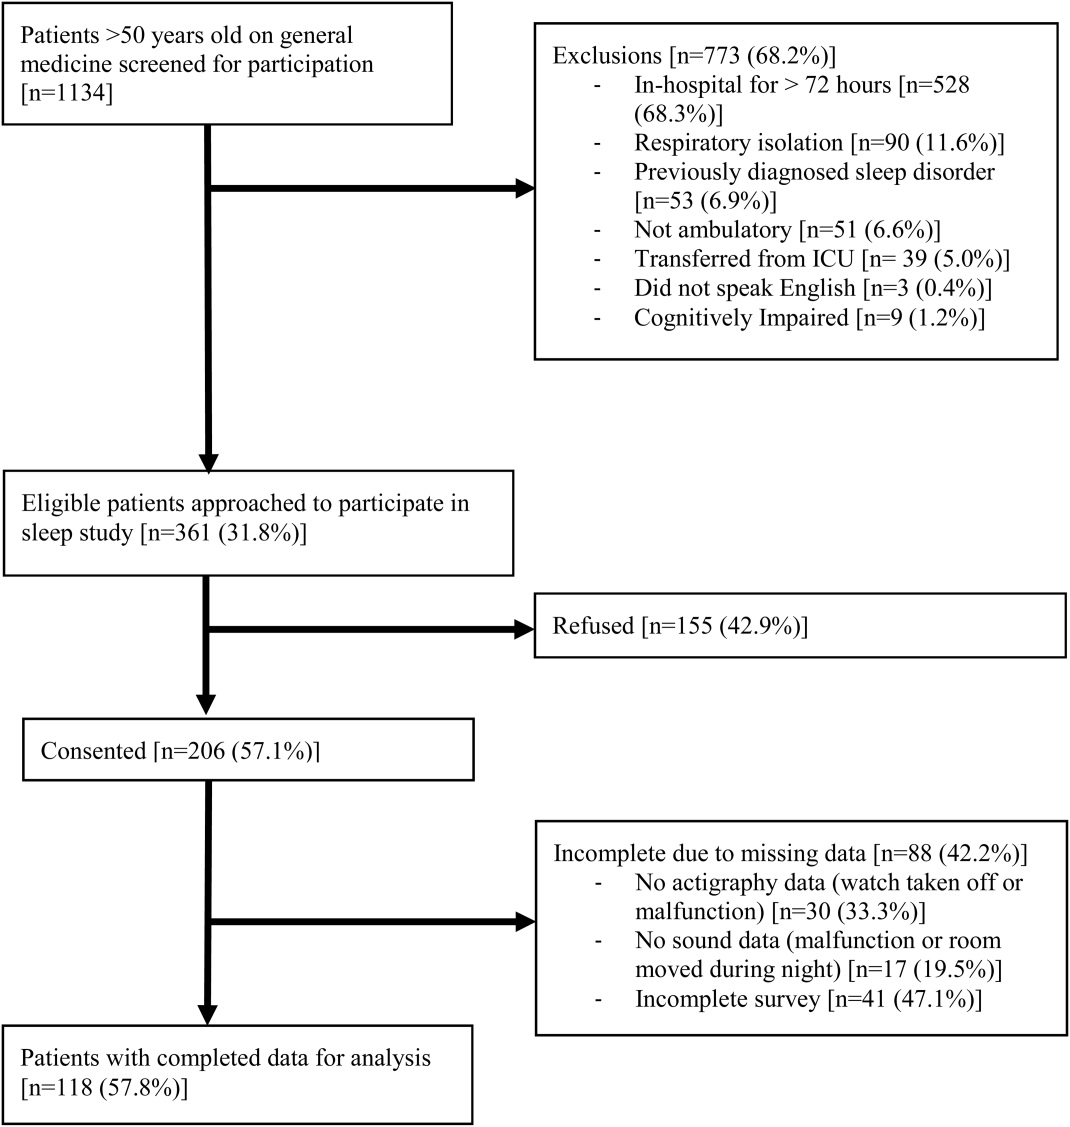
From April 2010 to May 2012, 1134 patients were screened by study personnel for this study via an ongoing study of hospitalized patients on the inpatient general medicine ward. Of the 361 (31.8%) eligible patients, 206 (57.1%) consented to participate. Of the subjects enrolled in the study, 118 were able to complete at least 1 night of actigraphy, sound monitoring, and subjective assessment for a total of 185 patient nights (Figure 1).
The majority of patients were female (57%), African American (67%), and non‐Hispanic (97%). The mean age was 65 years (standard deviation [SD], 11.6 years), and the median length of stay was 4 days (interquartile range [IQR], 36). The majority of patients also had hypertension (67%), with chronic obstructive pulmonary disease [COPD] (31%) and congestive heart failure (31%) being the next most common comorbidities. About two‐thirds of subjects (64%) were characterized as average or above average sleepers with Epworth Sleepiness Scale scores 9[20] (Table 1). Only 5% of patients received pharmacological sleep aids.
| Value, n (%)a | |
|---|---|
| |
| Patient characteristics | |
| Age, mean (SD), y | 63 (12) |
| Length of stay, median (IQR), db | 4 (36) |
| Female | 67 (57) |
| African American | 79 (67) |
| Hispanic | 3 (3) |
| High school graduate | 92 (78) |
| Comorbidities | |
| Hypertension | 79 (66) |
| Chronic obstructive pulmonary disease | 37 (31) |
| Congestive heart failure | 37 (31) |
| Diabetes | 36 (30) |
| End stage renal disease | 23 (19) |
| Baseline sleep characteristics | |
| Sleep duration, mean (SD), minc | 333 (128) |
| Epworth Sleepiness Scale, score 9d | 73 (64) |
The mean baseline SLOC score was 30.4 (SD, 6.7), with a median of 31 (IQR, 2735). The mean baseline SSE score was 32.1 (SD, 9.4), with a median of 34 (IQR, 2441). Fifty‐four patients were categorized as having high sleep self‐efficacy (high SSE), which we defined as scoring above the median of 34.
Average in‐hospital sleep was 5.5 hours (333 minutes; SD, 128 minutes) which was significantly shorter than the self‐reported sleep duration of 6.5 hours prior to admission (387 minutes, SD, 125 minutes; P=0.0001). The mean sleep efficiency was 73% (SD, 19%) with 55% of actigraphy nights below the normal range of 80% efficiency for adults.[19] Median KSQI was 3.5 (IQR, 2.254.75), with 41% of the patients with a KSQI 3, putting them in the insomniac range.[32] The median score on the noise disruptiveness question was 1 (IQR, 14) with 42% of reports coded as disruptive defined as a score >1 on the 5‐point scale. The median score on the roommate disruptiveness question was 1 (IQR, 11) with 77% of responses coded as not disruptive defined as a score of 1 on the 5‐point scale.
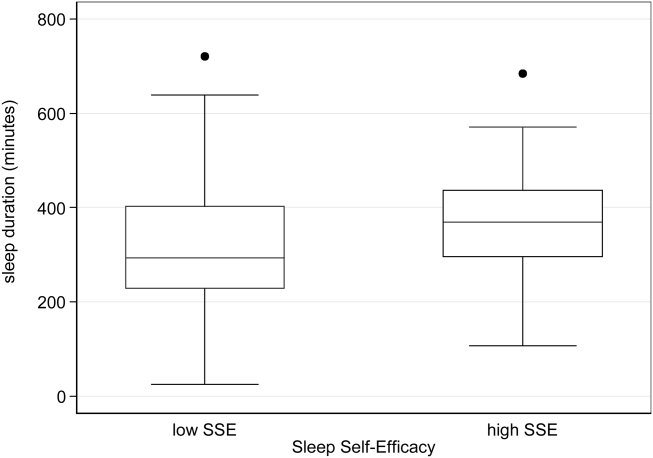
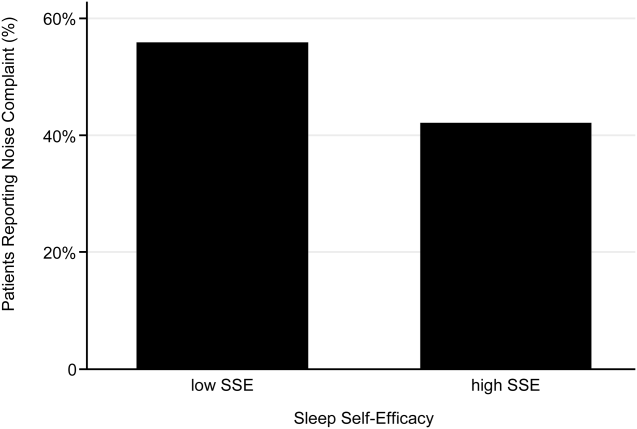
A 2‐sample t test with equal variances showed that those patients reporting high SSE were more likely to sleep longer in the hospital than those reporting low SSE (364 minutes 95% confidence interval [CI]: 340, 388 vs 309 minutes 95% CI: 283, 336; P=0.003) (Figure 2). Patients with high SSE were also more likely to have a normal sleep efficiency (above 80%) compared to those with low SSE (54% 95% CI: 43, 65 vs 38% 95% CI: 28,47; P=0.028). Last, there was a trend toward patients reporting higher SSE to also report less noise disruption compared to those patients with low SSE ([42%] 95% CI: 31, 53 vs [56%] 95% CI: 46, 65; P=0.063) (Figure 3).
Linear regression clustered by subject showed that high SSE was associated with longer sleep duration (55 minutes 95% CI: 14, 97; P=0.010). Furthermore, high SSE was significantly associated with longer sleep duration after controlling for both objective noise level and patient demographics in the model using stepwise forward regression (50 minutes 95% CI: 11, 90; P=0.014) (Table 2).
| Sleep Duration (min) | Model 1 Beta [95% CI]a | Model 2 Beta [95% CI]a |
|---|---|---|
| ||
| High SSE | 55 [14, 97]b | 50 [11, 90]b |
| Lmin tert 3 | 14 [59, 29] | |
| Lmin tert 2 | 21 [65, 23] | |
| Female | 49 [10, 89]b | |
| African American | 16 [59, 27] | |
| Age | 1 [0.9, 3] | |
| Karolinska Sleep Quality | Model 1 OR [95% CI]c | Model 2 OR [95% CI]c |
| High SSE | 2.04 [1.12, 3.71]b | 2.01 [1.06, 3.79]b |
| Lmin tert 3 | 0.90 [0.37, 2.2] | |
| Lmin tert 2 | 0.86 [0.38, 1.94] | |
| Female | 1.78 [0.90, 3.52] | |
| African American | 1.19 [0.60, 2.38] | |
| Age | 1.02 [0.99, 1.05] | |
| Noise Complaints | Model 1 OR [95% CI]d | Model 2 OR [95% CI]d |
| High SSE | 0.57 [0.30, 1.12] | 0.49 [0.25, 0.96]b |
| Lmin tert 3 | 0.85 [0.39, 1.84] | |
| Lmin tert 2 | 0.91 [0.43, 1.93] | |
| Female | 1.40 [0.71, 2.78] | |
| African American | 0.35 [0.17, 0.70] | |
| Age | 1.00 [0.96, 1.03] | |
| Age2e | 1.00 [1.00, 1.00] | |
Logistic regression clustered by subject demonstrated that patients with high SSE had 2 times higher odds of having a KSQI score above 3 (95% CI: 1.12, 3.71; P=0.020). This association was still significant after controlling for noise and patient demographics (OR: 2.01; 95% CI: 1.06, 3.79; P=0.032). After controlling for noise levels and patient demographics, there was a statistically significant association between high SSE and lower odds of noise complaints (OR: 0.49; 95% CI: 0.25, 0.96; P=0.039) (Table 2). Although demographic characteristics were not associated with high SSE, those patients with high SSE had lower odds of being in the loudest tertile rooms (OR: 0.34; 95% CI: 0.15, 0.74; P=0.007).
In multivariate linear regression analyses, there were no significant relationships between SLOC scores and KSQI, reported noise disruptiveness, and markers of sleep (sleep duration or sleep efficiency).
DISCUSSION
This study is the first to examine the relationship between perceived control, noise levels, and objective measurements of sleep in a hospital setting. One measure of perceived control, namely SSE, was associated with objective sleep duration, subjective and objective sleep quality, noise levels in patient rooms, and perhaps also patient complaints of noise. These associations remained significant after controlling for objective noise levels and patient demographics, suggesting that SSE is independently related to sleep.
In contrast to SSE, SLOC was not found to be significantly associated with either subjective or objective measures of sleep quality. The lack of association may be due to the fact that the SLOC questionnaire does not translate as well to the inpatient setting as the SSE questionnaire. The SLOC questionnaire focuses on general beliefs about sleep whereas the SSE questionnaire focuses on personal beliefs about one's own ability sleep in the immediate future, which may make it more relevant in the inpatient setting (see Supporting Information, Appendix 1 and 2, in the online version of this article).
Given our findings, it is important to identify why patients with high SSE have better sleep and fewer noise complaints. One possibility is that sleep self‐efficacy is an inherited trait unique to each person that is also predictive of a patient's sleep patterns. However, is it also possible that those patients with high SSE feel more empowered to take control of their environment, allowing them to advocate for better sleep? This hypothesis is further strengthened by the finding that those patients with high SSE on study entry were less likely to be in the noisiest rooms. This raises the possibility that at least 1 of the mechanisms by which high SSE may be protective against sleep loss is through patients taking an active role in noise reduction, such as closing the door or advocating for their sleep with staff. However, we did not directly observe or ask patients whether doors of patient rooms were open or closed or whether the patients took other measures to advocate for their own sleep. Thus, further work is necessary to understand the mechanisms by which sleep self‐efficacy may influence sleep.
One potential avenue for future research is to explore possible interventions for boosting sleep self‐efficacy in the hospital. Although most interventions have focused on environmental noise and staff‐based education, empowering patients through boosting SSE may be a helpful adjunct to improving hospital sleep.[33, 34] Currently, the SSE scale is not commonly used in the inpatient setting. Motivational interviewing and patient coaching could be explored as potential tools for boosting SSE. Furthermore, even if SSE is not easily changed, measuring SSE in patients newly admitted to the hospital may be useful in identifying patients most susceptible to sleep disruptions. Efforts to identify patients with low SSE should go hand‐in‐hand with measures to reduce noise. Addressing both patient‐level and environmental factors simultaneously may be the best strategy for improving sleep in an inpatient hospital setting.
In contrast to our prior study, it is worth noting that we did not find any significant relationships between overall noise levels and sleep.[9] In this dataset, nighttime noise is still a predictor of sleep loss in the hospital. However, when we restrict our sample to those who answered the SSE questionnaire and had nighttime noise recorded, we lose a significant number of observations. Because of our interest in testing the relationship between SSE and sleep, we chose to control for overall noise (which enabled us to retain more observations). We also did not find any interactions between SSE and noise in our regression models. Further work is warranted with larger sample sizes to better understand the role of SSE in the context of sleep and noise levels. In addition, females also received more sleep than males in our study.
There are several limitations to this study. This study was carried out at a single service at a single institution, limiting the ability to generalize the findings to other hospital settings. This study had a relatively high rate of patients who were unable to complete at least 1 night of data collection (42%), often due to watch removal for imaging or procedures, which may also affect the representativeness of our sample. Moreover, we can only examine associations and not causal relationships. The SSE scale has never been used in hospitalized patients, making comparisons between scores from hospitalized patients and population controls difficult. In addition, the SSE scale also has not been dichotomized in previous studies into high and low SSE. However, a sensitivity analysis with raw SSE scores did not change the results of our study. It can be difficult to perform actigraphy measurements in the hospital because many patients spend most of their time in bed. Because we chose a relatively healthy cohort of patients without significant limitations in mobility, actigraphy could still be used to differentiate time spent awake from time spent sleeping. Because we did not perform polysomnography, we cannot explore the role of sleep architecture which is an important component of sleep quality. Although the use of pharmacologic sleep aids is a potential confounding factor, the rate of use was very low in our cohort and unlikely to significantly affect our results. Continued study of this patient population is warranted to further develop the findings.
In conclusion, patients with high SSE sleep better in the hospital, tend to be in quieter rooms, and may report fewer noise complaints. Our findings suggest that a greater confidence in the ability to sleep may be beneficial in hospitalized adults. In addition to noise control, hospitals should also consider targeting patients with low SSE when designing novel interventions to improve in‐hospital sleep.
Disclosures
This work was supported by funding from the National Institute on Aging through a Short‐Term Aging‐Related Research Program (1 T35 AG029795), National Institute on Aging career development award (K23AG033763), a midcareer career development award (1K24AG031326), a program project (P01AG‐11412), an Agency for Healthcare Research and Quality Centers for Education and Research on Therapeutics grant (1U18HS016967), and a National Institute on Aging Clinical Translational Sciences award (UL1 RR024999). Dr. Arora had full access to all of the data in the study and takes responsibility for the integrity of the data and the accuracy of the statistical analysis. The funding agencies had no role in the design of the study; the collection, analysis, and interpretation of the data; or the decision to approve publication of the finished manuscript. The authors report no conflicts of interest.
- , , , . The metabolic consequences of sleep deprivation. Sleep Med Rev. 2007;11(3):163–178.
- , , , , , . Poor self‐reported sleep quality predicts mortality within one year of inpatient post‐acute rehabilitation among older adults. Sleep. 2011;34(12):1715–1721.
- , , , et al. The sleep of older people in hospital and nursing homes. J Clin Nurs. 1999;8:360–368.
- , , et al. Sleep in hospitalized medical patients, part 1: factors affecting sleep. J Hosp Med. 2008; 3:473–482.
- , , , et al. Nocturnal care interactions with patients in critical care units. Am J Crit Care. 2004;13:102–112; quiz 114–115.
- , , . Patient perception of sleep quality and etiology of sleep disruption in the intensive care unit. Am J Respir Crit Care Med. 1999;159:1155–1162.
- . Sleep in acute care settings: an integrative review. J Nurs Scholarsh. 2000;32(1):31–38.
- , , , et al. Sleep disruption due to hospital noises: a prospective evaluation. Ann Int Med. 2012;157(3): 170–179.
- , , , et al. Noise and sleep among adult medical inpatients: far from a quiet night. Arch Intern Med. 2012;172:68–70.
- . Generalized expectancies for internal versus external control of reinforcement. Psychol Monogr. 1966;80:1–28.
- , . Psychosocial risk factors and mortality: a prospective study with special focus on social support, social participation, and locus of control in Norway. J Epidemiol Community Health. 1998;52:476–481.
- , . The interactive effect of perceived control and functional status on health and mortality among young‐old and old‐old adults. J Gerontol B Psychol Sci Soc Sci. 1997;52:P118–P126.
- , . Role‐specific feelings of control and mortality. Psychol Aging. 2000;15:617–626.
- , , . Patient empowerment in intensive care—an interview study. Intensive Crit Care Nurs. 2006;22:370–377.
- , , . Exploring the relationship between personal control and the hospital environment. J Clin Nurs. 2008;17:1601–1609.
- , , , et al. Effects of volitional lifestyle on sleep‐life habits in the aged. Psychiatry Clin Neurosci. 1998;52:183–184.
- , , , et al. Sleep locus of control: report on a new scale. Behav Sleep Med. 2004;2:79–93.
- , , , et al. Effects of physician experience on costs and outcomes on an academic general medicine service: results of a trial of hospitalists. Ann Intern Med. 2002;137:866–874.
- , , , et al. The effects of age, sex, ethnicity, and sleep‐disordered breathing on sleep architecture. Arch Intern Med. 2004;164:406–418.
- , , , et al. Validation of a telephone version of the mini‐mental state examination. J Am Geriatr Soc. 1992;40:697–702.
- , , , et al. Contact isolation in surgical patients: a barrier to care? Surgery. 2003;134:180–188.
- , . Adverse effects of contact isolation. Lancet. 1999;354:1177–1178.
- . Behavioral Treatment for Persistent Insomnia. Elmsford, NY: Pergamon Press; 1987.
- . A new method for measuring daytime sleepiness: the Epworth sleepiness scale. Sleep. 1991;14:540–545.
- . Reliability and factor analysis of the Epworth Sleepiness Scale. Sleep. 1992;15:376–381.
- , . Objective components of individual differences in subjective sleep quality. J Sleep Res. 1997;6:217–220.
- , , , et al. The role of actigraphy in the study of sleep and circadian rhythms. Sleep. 2003;26:342–392.
- , , , et al. Practice parameters for the use of actigraphy in the assessment of sleep and sleep disorders: an update for 2007. Sleep. 2007;30:519–529.
- , , , et al. The role of actigraphy in the evaluation of sleep disorders. Sleep. 1995;18:288–302.
- , , , et al. Clinical review: sleep measurement in critical care patients: research and clinical implications. Crit Care. 2007;11:226.
- , , , et al. Evaluation of immobility time for sleep latency in actigraphy. Sleep Med. 2009;10:621–625.
- , , , et al. The subjective meaning of sleep quality: a comparison of individuals with and without insomnia. Sleep. 2008;31:383–393.
- , , , et al. Sleep in hospitalized medical patients, part 2: behavioral and pharmacological management of sleep disturbances. J Hosp Med. 2009;4:50–59.
- , , , . A nonpharmacologic sleep protocol for hospitalized older patients. J Am Geriatr Soc. 1998;46(6):700–705.
Lack of sleep is a common problem in hospitalized patients and is associated with poorer health outcomes, especially in older patients.[1, 2, 3] Prior studies highlight a multitude of factors that can result in sleep loss in the hospital[3, 4, 5, 6] with 1 of the most common causes of sleep disruption in the hospital being noise.[7, 8, 9]
In addition to external factors, such as hospital noise, there may be inherent characteristics that predispose certain patients to greater sleep loss when hospitalized. One such measure is the construct of perceived control or the psychological measure of how much individuals expect themselves to be capable of bringing about desired outcomes.[10] Among older patients, low perceived control is associated with increased rates of physician visits, hospitalizations, and death.[11, 12] In contrast, patients who feel more in control of their environment may experience positive health benefits.[13]
Yet, when patients are placed in a hospital setting, they experience a significant reduction in control over their environment along with an increase in dependency on medical staff and therapies.[14, 15] For example, hospitalized patients are restricted in their personal decisions, such as what clothes they can wear and what they can eat and are not in charge of their own schedules, including their sleep time.
Although prior studies suggest that perceived control over sleep is related to actual sleep among community‐dwelling adults,[16, 17] no study has examined this relationship in hospitalized adults. Therefore, the aim of our study was to examine the possible association between perceived control, noise levels, and sleep in hospitalized middle‐aged and older patients.
METHODS
Study Design
We conducted a prospective cohort study of subjects recruited from a large ongoing study of admitted patients at the University of Chicago inpatient general medicine service.[18] Because we were interested in middle‐aged and older adults who are most sensitive to sleep disruptions, patients who were age 50 years and over, ambulatory, and living in the community were eligible for the study.[19] Exclusion criteria were cognitive impairment (telephone version of the Mini‐Mental State Exam <17 out of 22), preexisting sleeping disorders identified via patient charts, such as obstructive sleep apnea and narcolepsy, transfer from the intensive care unit (ICU), and admission to the hospital more than 72 hours prior to enrollment.[20] These inclusion and exclusion criteria were selected to identify a patient population with minimal sleep disturbances at baseline. Patients under isolation were excluded because they are not visited as frequently by the healthcare team.[21, 22] Most general medicine rooms were double occupancy but efforts were made to make patient rooms single when possible or required (ie, isolation for infection control). The study was approved by the University of Chicago Institutional Review Board.
Subjective Data Collection
Baseline levels of perceived control over sleep, or the amount of control patients believe they have over their sleep, were assessed using 2 different scales. The first tool was the 8‐item Sleep Locus of Control (SLOC) scale,[17] which ranges from 8 to 48, with higher values corresponding to a greater internal locus of control over sleep. An internal sleep locus of control indicates beliefs that patients feel that they are primarily responsible for their own sleep as opposed to an external locus of control which indicates beliefs that good sleep is due to luck or chance. For example, patients were asked how strongly they agree or disagree with statements, such as, If I take care of myself, I can avoid insomnia and People who never get insomnia are just plain lucky (see Supporting Information, Appendix 2, in the online version of this article). The second tool was the 9‐item Sleep Self‐Efficacy (SSE) scale,[23] which ranges from 9 to 45, with higher values corresponding to greater confidence patients have in their ability to sleep. One of the items asks, How confident are you that you can lie in bed feeling physically relaxed (see Supporting Information, Appendix 1, in the online version of this article)? Both instruments have been validated in an outpatient setting.[23] These surveys were given immediately on enrollment in the study to measure baseline perceived control.
Baseline sleep habits were also collected on enrollment using the Epworth Sleepiness Scale,[24, 25] a standard validated survey that assesses excess daytime sleepiness in various common situations. For each day in the hospital, patients were asked to report in‐hospital sleep quality using the Karolinska Sleep Log.[26] The Karolinska Sleep Quality Index (KSQI) is calculated from 4 items on the Karolinska Sleep Log (sleep quality, sleep restlessness, slept throughout the night, ease of falling asleep). The questions are on a 5‐point scale and the 4 items are averaged for a final score out of 5 with a higher number indicating better subjective sleep quality. The item How much was your sleep disturbed by noise? on the Karolinska Sleep Log was used to assess the degree to which noise was a disruptor of sleep. This question was also on a 5‐point scale with higher scores indicating greater disruptiveness of noise. Patients were also asked how disruptive noise from roommates was on a nightly basis using this same scale.
Objective Data Collection
Wrist activity monitors (Actiwatch 2; Respironics, Inc., Murrysville, PA)[27, 28, 29, 30] were used to measure patient sleep. Actiware 5 software (Respironics, Inc.)[31] was used to estimate quantitative measures of sleep time and efficiency. Sleep time is defined as the total duration of time spent sleeping at night and sleep efficiency is defined as the fraction of time, reported as a percentage, spent sleeping by actigraphy out of the total time patients reported they were sleeping.
Sound levels in patient rooms were recorded using Larson Davis 720 Sound Level Monitors (Larson Davis, Inc., Provo, UT). These monitors store functional average sound pressure levels in A‐weighted decibels called the Leq over 1‐hour intervals. The Leq is the average sound level over the given time interval. Minimum (Lmin) and maximum (Lmax) sound levels are also stored. The LD SLM Utility Program (Larson Davis, Inc.) was used to extract the sound level measurements recorded by the monitors.
Demographic information (age, gender, race, ethnicity, highest level of education, length of stay in the hospital, and comorbidities) was obtained from hospital charts via an ongoing study of admitted patients at the University of Chicago Medical Center inpatient general medicine service.[18] Chart audits were performed to determine whether patients received pharmacologic sleep aids in the hospital.
Data Analysis
Descriptive statistics were used to summarize mean sleep duration and sleep efficiency in the hospital as well as SLOC and SSE. Because the SSE scores were not normally distributed, the scores were dichotomized at the median to create a variable denoting high and low SSE. Additionally, because the distribution of responses to the noise disruption question was skewed to the right, reports of noise disruptions were grouped into not disruptive (score=1) and disruptive (score>1).
Two‐sample t tests with equal variances were used to assess the relationship between perceived control measures (high/low SLOC, SSE) and objective sleep measures (sleep time, sleep efficiency). Multivariate linear regression was used to test the association between high SSE (independent variable) and sleep time (dependent variable), clustering for multiple nights of data within the subject. Multivariate logistic regression, also adjusting for subject, was used to test the association between high SSE and noise disruptiveness and the association between high SSE and Karolinska scores. Leq, Lmax, and Lmin were all tested using stepwise forward regression. Because our prior work[9] demonstrated that noise levels separated into tertiles were significantly associated with sleep time, our analysis also used noise levels separated into tertiles. Stepwise forward regression was used to add basic patient demographics (gender, race, age) to the models. Statistical significance was defined as P<0.05, and all statistical analysis was done using Stata 11.0 (StataCorp, College Station, TX).
RESULTS
From April 2010 to May 2012, 1134 patients were screened by study personnel for this study via an ongoing study of hospitalized patients on the inpatient general medicine ward. Of the 361 (31.8%) eligible patients, 206 (57.1%) consented to participate. Of the subjects enrolled in the study, 118 were able to complete at least 1 night of actigraphy, sound monitoring, and subjective assessment for a total of 185 patient nights (Figure 1).
The majority of patients were female (57%), African American (67%), and non‐Hispanic (97%). The mean age was 65 years (standard deviation [SD], 11.6 years), and the median length of stay was 4 days (interquartile range [IQR], 36). The majority of patients also had hypertension (67%), with chronic obstructive pulmonary disease [COPD] (31%) and congestive heart failure (31%) being the next most common comorbidities. About two‐thirds of subjects (64%) were characterized as average or above average sleepers with Epworth Sleepiness Scale scores 9[20] (Table 1). Only 5% of patients received pharmacological sleep aids.
| Value, n (%)a | |
|---|---|
| |
| Patient characteristics | |
| Age, mean (SD), y | 63 (12) |
| Length of stay, median (IQR), db | 4 (36) |
| Female | 67 (57) |
| African American | 79 (67) |
| Hispanic | 3 (3) |
| High school graduate | 92 (78) |
| Comorbidities | |
| Hypertension | 79 (66) |
| Chronic obstructive pulmonary disease | 37 (31) |
| Congestive heart failure | 37 (31) |
| Diabetes | 36 (30) |
| End stage renal disease | 23 (19) |
| Baseline sleep characteristics | |
| Sleep duration, mean (SD), minc | 333 (128) |
| Epworth Sleepiness Scale, score 9d | 73 (64) |
The mean baseline SLOC score was 30.4 (SD, 6.7), with a median of 31 (IQR, 2735). The mean baseline SSE score was 32.1 (SD, 9.4), with a median of 34 (IQR, 2441). Fifty‐four patients were categorized as having high sleep self‐efficacy (high SSE), which we defined as scoring above the median of 34.
Average in‐hospital sleep was 5.5 hours (333 minutes; SD, 128 minutes) which was significantly shorter than the self‐reported sleep duration of 6.5 hours prior to admission (387 minutes, SD, 125 minutes; P=0.0001). The mean sleep efficiency was 73% (SD, 19%) with 55% of actigraphy nights below the normal range of 80% efficiency for adults.[19] Median KSQI was 3.5 (IQR, 2.254.75), with 41% of the patients with a KSQI 3, putting them in the insomniac range.[32] The median score on the noise disruptiveness question was 1 (IQR, 14) with 42% of reports coded as disruptive defined as a score >1 on the 5‐point scale. The median score on the roommate disruptiveness question was 1 (IQR, 11) with 77% of responses coded as not disruptive defined as a score of 1 on the 5‐point scale.
A 2‐sample t test with equal variances showed that those patients reporting high SSE were more likely to sleep longer in the hospital than those reporting low SSE (364 minutes 95% confidence interval [CI]: 340, 388 vs 309 minutes 95% CI: 283, 336; P=0.003) (Figure 2). Patients with high SSE were also more likely to have a normal sleep efficiency (above 80%) compared to those with low SSE (54% 95% CI: 43, 65 vs 38% 95% CI: 28,47; P=0.028). Last, there was a trend toward patients reporting higher SSE to also report less noise disruption compared to those patients with low SSE ([42%] 95% CI: 31, 53 vs [56%] 95% CI: 46, 65; P=0.063) (Figure 3).
Linear regression clustered by subject showed that high SSE was associated with longer sleep duration (55 minutes 95% CI: 14, 97; P=0.010). Furthermore, high SSE was significantly associated with longer sleep duration after controlling for both objective noise level and patient demographics in the model using stepwise forward regression (50 minutes 95% CI: 11, 90; P=0.014) (Table 2).
| Sleep Duration (min) | Model 1 Beta [95% CI]a | Model 2 Beta [95% CI]a |
|---|---|---|
| ||
| High SSE | 55 [14, 97]b | 50 [11, 90]b |
| Lmin tert 3 | 14 [59, 29] | |
| Lmin tert 2 | 21 [65, 23] | |
| Female | 49 [10, 89]b | |
| African American | 16 [59, 27] | |
| Age | 1 [0.9, 3] | |
| Karolinska Sleep Quality | Model 1 OR [95% CI]c | Model 2 OR [95% CI]c |
| High SSE | 2.04 [1.12, 3.71]b | 2.01 [1.06, 3.79]b |
| Lmin tert 3 | 0.90 [0.37, 2.2] | |
| Lmin tert 2 | 0.86 [0.38, 1.94] | |
| Female | 1.78 [0.90, 3.52] | |
| African American | 1.19 [0.60, 2.38] | |
| Age | 1.02 [0.99, 1.05] | |
| Noise Complaints | Model 1 OR [95% CI]d | Model 2 OR [95% CI]d |
| High SSE | 0.57 [0.30, 1.12] | 0.49 [0.25, 0.96]b |
| Lmin tert 3 | 0.85 [0.39, 1.84] | |
| Lmin tert 2 | 0.91 [0.43, 1.93] | |
| Female | 1.40 [0.71, 2.78] | |
| African American | 0.35 [0.17, 0.70] | |
| Age | 1.00 [0.96, 1.03] | |
| Age2e | 1.00 [1.00, 1.00] | |
Logistic regression clustered by subject demonstrated that patients with high SSE had 2 times higher odds of having a KSQI score above 3 (95% CI: 1.12, 3.71; P=0.020). This association was still significant after controlling for noise and patient demographics (OR: 2.01; 95% CI: 1.06, 3.79; P=0.032). After controlling for noise levels and patient demographics, there was a statistically significant association between high SSE and lower odds of noise complaints (OR: 0.49; 95% CI: 0.25, 0.96; P=0.039) (Table 2). Although demographic characteristics were not associated with high SSE, those patients with high SSE had lower odds of being in the loudest tertile rooms (OR: 0.34; 95% CI: 0.15, 0.74; P=0.007).
In multivariate linear regression analyses, there were no significant relationships between SLOC scores and KSQI, reported noise disruptiveness, and markers of sleep (sleep duration or sleep efficiency).
DISCUSSION
This study is the first to examine the relationship between perceived control, noise levels, and objective measurements of sleep in a hospital setting. One measure of perceived control, namely SSE, was associated with objective sleep duration, subjective and objective sleep quality, noise levels in patient rooms, and perhaps also patient complaints of noise. These associations remained significant after controlling for objective noise levels and patient demographics, suggesting that SSE is independently related to sleep.
In contrast to SSE, SLOC was not found to be significantly associated with either subjective or objective measures of sleep quality. The lack of association may be due to the fact that the SLOC questionnaire does not translate as well to the inpatient setting as the SSE questionnaire. The SLOC questionnaire focuses on general beliefs about sleep whereas the SSE questionnaire focuses on personal beliefs about one's own ability sleep in the immediate future, which may make it more relevant in the inpatient setting (see Supporting Information, Appendix 1 and 2, in the online version of this article).
Given our findings, it is important to identify why patients with high SSE have better sleep and fewer noise complaints. One possibility is that sleep self‐efficacy is an inherited trait unique to each person that is also predictive of a patient's sleep patterns. However, is it also possible that those patients with high SSE feel more empowered to take control of their environment, allowing them to advocate for better sleep? This hypothesis is further strengthened by the finding that those patients with high SSE on study entry were less likely to be in the noisiest rooms. This raises the possibility that at least 1 of the mechanisms by which high SSE may be protective against sleep loss is through patients taking an active role in noise reduction, such as closing the door or advocating for their sleep with staff. However, we did not directly observe or ask patients whether doors of patient rooms were open or closed or whether the patients took other measures to advocate for their own sleep. Thus, further work is necessary to understand the mechanisms by which sleep self‐efficacy may influence sleep.
One potential avenue for future research is to explore possible interventions for boosting sleep self‐efficacy in the hospital. Although most interventions have focused on environmental noise and staff‐based education, empowering patients through boosting SSE may be a helpful adjunct to improving hospital sleep.[33, 34] Currently, the SSE scale is not commonly used in the inpatient setting. Motivational interviewing and patient coaching could be explored as potential tools for boosting SSE. Furthermore, even if SSE is not easily changed, measuring SSE in patients newly admitted to the hospital may be useful in identifying patients most susceptible to sleep disruptions. Efforts to identify patients with low SSE should go hand‐in‐hand with measures to reduce noise. Addressing both patient‐level and environmental factors simultaneously may be the best strategy for improving sleep in an inpatient hospital setting.
In contrast to our prior study, it is worth noting that we did not find any significant relationships between overall noise levels and sleep.[9] In this dataset, nighttime noise is still a predictor of sleep loss in the hospital. However, when we restrict our sample to those who answered the SSE questionnaire and had nighttime noise recorded, we lose a significant number of observations. Because of our interest in testing the relationship between SSE and sleep, we chose to control for overall noise (which enabled us to retain more observations). We also did not find any interactions between SSE and noise in our regression models. Further work is warranted with larger sample sizes to better understand the role of SSE in the context of sleep and noise levels. In addition, females also received more sleep than males in our study.
There are several limitations to this study. This study was carried out at a single service at a single institution, limiting the ability to generalize the findings to other hospital settings. This study had a relatively high rate of patients who were unable to complete at least 1 night of data collection (42%), often due to watch removal for imaging or procedures, which may also affect the representativeness of our sample. Moreover, we can only examine associations and not causal relationships. The SSE scale has never been used in hospitalized patients, making comparisons between scores from hospitalized patients and population controls difficult. In addition, the SSE scale also has not been dichotomized in previous studies into high and low SSE. However, a sensitivity analysis with raw SSE scores did not change the results of our study. It can be difficult to perform actigraphy measurements in the hospital because many patients spend most of their time in bed. Because we chose a relatively healthy cohort of patients without significant limitations in mobility, actigraphy could still be used to differentiate time spent awake from time spent sleeping. Because we did not perform polysomnography, we cannot explore the role of sleep architecture which is an important component of sleep quality. Although the use of pharmacologic sleep aids is a potential confounding factor, the rate of use was very low in our cohort and unlikely to significantly affect our results. Continued study of this patient population is warranted to further develop the findings.
In conclusion, patients with high SSE sleep better in the hospital, tend to be in quieter rooms, and may report fewer noise complaints. Our findings suggest that a greater confidence in the ability to sleep may be beneficial in hospitalized adults. In addition to noise control, hospitals should also consider targeting patients with low SSE when designing novel interventions to improve in‐hospital sleep.
Disclosures
This work was supported by funding from the National Institute on Aging through a Short‐Term Aging‐Related Research Program (1 T35 AG029795), National Institute on Aging career development award (K23AG033763), a midcareer career development award (1K24AG031326), a program project (P01AG‐11412), an Agency for Healthcare Research and Quality Centers for Education and Research on Therapeutics grant (1U18HS016967), and a National Institute on Aging Clinical Translational Sciences award (UL1 RR024999). Dr. Arora had full access to all of the data in the study and takes responsibility for the integrity of the data and the accuracy of the statistical analysis. The funding agencies had no role in the design of the study; the collection, analysis, and interpretation of the data; or the decision to approve publication of the finished manuscript. The authors report no conflicts of interest.
- , , , . The metabolic consequences of sleep deprivation. Sleep Med Rev. 2007;11(3):163–178.
- , , , , , . Poor self‐reported sleep quality predicts mortality within one year of inpatient post‐acute rehabilitation among older adults. Sleep. 2011;34(12):1715–1721.
- , , , et al. The sleep of older people in hospital and nursing homes. J Clin Nurs. 1999;8:360–368.
- , , et al. Sleep in hospitalized medical patients, part 1: factors affecting sleep. J Hosp Med. 2008; 3:473–482.
- , , , et al. Nocturnal care interactions with patients in critical care units. Am J Crit Care. 2004;13:102–112; quiz 114–115.
- , , . Patient perception of sleep quality and etiology of sleep disruption in the intensive care unit. Am J Respir Crit Care Med. 1999;159:1155–1162.
- . Sleep in acute care settings: an integrative review. J Nurs Scholarsh. 2000;32(1):31–38.
- , , , et al. Sleep disruption due to hospital noises: a prospective evaluation. Ann Int Med. 2012;157(3): 170–179.
- , , , et al. Noise and sleep among adult medical inpatients: far from a quiet night. Arch Intern Med. 2012;172:68–70.
- . Generalized expectancies for internal versus external control of reinforcement. Psychol Monogr. 1966;80:1–28.
- , . Psychosocial risk factors and mortality: a prospective study with special focus on social support, social participation, and locus of control in Norway. J Epidemiol Community Health. 1998;52:476–481.
- , . The interactive effect of perceived control and functional status on health and mortality among young‐old and old‐old adults. J Gerontol B Psychol Sci Soc Sci. 1997;52:P118–P126.
- , . Role‐specific feelings of control and mortality. Psychol Aging. 2000;15:617–626.
- , , . Patient empowerment in intensive care—an interview study. Intensive Crit Care Nurs. 2006;22:370–377.
- , , . Exploring the relationship between personal control and the hospital environment. J Clin Nurs. 2008;17:1601–1609.
- , , , et al. Effects of volitional lifestyle on sleep‐life habits in the aged. Psychiatry Clin Neurosci. 1998;52:183–184.
- , , , et al. Sleep locus of control: report on a new scale. Behav Sleep Med. 2004;2:79–93.
- , , , et al. Effects of physician experience on costs and outcomes on an academic general medicine service: results of a trial of hospitalists. Ann Intern Med. 2002;137:866–874.
- , , , et al. The effects of age, sex, ethnicity, and sleep‐disordered breathing on sleep architecture. Arch Intern Med. 2004;164:406–418.
- , , , et al. Validation of a telephone version of the mini‐mental state examination. J Am Geriatr Soc. 1992;40:697–702.
- , , , et al. Contact isolation in surgical patients: a barrier to care? Surgery. 2003;134:180–188.
- , . Adverse effects of contact isolation. Lancet. 1999;354:1177–1178.
- . Behavioral Treatment for Persistent Insomnia. Elmsford, NY: Pergamon Press; 1987.
- . A new method for measuring daytime sleepiness: the Epworth sleepiness scale. Sleep. 1991;14:540–545.
- . Reliability and factor analysis of the Epworth Sleepiness Scale. Sleep. 1992;15:376–381.
- , . Objective components of individual differences in subjective sleep quality. J Sleep Res. 1997;6:217–220.
- , , , et al. The role of actigraphy in the study of sleep and circadian rhythms. Sleep. 2003;26:342–392.
- , , , et al. Practice parameters for the use of actigraphy in the assessment of sleep and sleep disorders: an update for 2007. Sleep. 2007;30:519–529.
- , , , et al. The role of actigraphy in the evaluation of sleep disorders. Sleep. 1995;18:288–302.
- , , , et al. Clinical review: sleep measurement in critical care patients: research and clinical implications. Crit Care. 2007;11:226.
- , , , et al. Evaluation of immobility time for sleep latency in actigraphy. Sleep Med. 2009;10:621–625.
- , , , et al. The subjective meaning of sleep quality: a comparison of individuals with and without insomnia. Sleep. 2008;31:383–393.
- , , , et al. Sleep in hospitalized medical patients, part 2: behavioral and pharmacological management of sleep disturbances. J Hosp Med. 2009;4:50–59.
- , , , . A nonpharmacologic sleep protocol for hospitalized older patients. J Am Geriatr Soc. 1998;46(6):700–705.
Copyright © 2013 Society of Hospital Medicine

Implementing Peer Evaluation of Handoffs
The advent of restricted residency duty hours has thrust the safety risks of handoffs into the spotlight. More recently, the Accreditation Council of Graduate Medical Education (ACGME) has restricted hours even further to a maximum of 16 hours for first‐year residents and up to 28 hours for residents beyond their first year.[1] Although the focus on these mandates has been scheduling and staffing in residency programs, another important area of attention is for handoff education and evaluation. The Common Program Requirements for the ACGME state that all residency programs should ensure that residents are competent in handoff communications and that programs should monitor handoffs to ensure that they are safe.[2] Moreover, recent efforts have defined milestones for handoffs, specifically that by 12 months, residents should be able to effectively communicate with other caregivers to maintain continuity during transitions of care.[3] Although more detailed handoff‐specific milestones have to be flushed out, a need for evaluation instruments to assess milestones is critical. In addition, handoffs continue to represent a vulnerable time for patients in many specialties, such as surgery and pediatrics.[4, 5]
Evaluating handoffs poses specific challenges for internal medicine residency programs because handoffs are often conducted on the fly or wherever convenient, and not always at a dedicated time and place.[6] Even when evaluations could be conducted at a dedicated time and place, program faculty and leadership may not be comfortable evaluating handoffs in real time due to lack of faculty development and recent experience with handoffs. Although supervising faculty may be in the most ideal position due to their intimate knowledge of the patient and their ability to evaluate the clinical judgment of trainees, they may face additional pressures of supervision and direct patient care that prevent their attendance at the time of the handoff. For these reasons, potential people to evaluate the quality of a resident handoff may be the peers to whom they frequently handoff. Because handoffs are also conceptualized as an interactive dialogue between sender and receiver, an ideal handoff performance evaluation would capture both of these roles.[7] For these reasons, peer evaluation may be a viable modality to assist programs in evaluating handoffs. Peer evaluation has been shown to be an effective method of rating performance of medical students,[8] practicing physicians,[9] and residents.[10] Moreover, peer evaluation is now a required feature in assessing internal medicine resident performance.[11] Although enthusiasm for peer evaluation has grown in residency training, the use of it can still be limited by a variety of problems, such as reluctance to rate peers poorly, difficulty obtaining evaluations, and the utility of such evaluations. For these reasons, it is important to understand whether peer evaluation of handoffs is feasible. Therefore, the aim of this study was to assess feasibility of an online peer evaluation survey tool of handoffs in an internal medicine residency and to characterize performance over time as well and associations between workload and performance.
METHODS
From July 2009 to March 2010, all interns on the general medicine inpatient service at 2 hospitals were asked to complete an end‐of‐month anonymous peer evaluation that included 14‐items addressing all core competencies. The evaluation tool was administered electronically using New Innovations (New Innovations, Inc., Uniontown, OH). Interns signed out to each other in a cross‐cover circuit that included 3 other interns on an every fourth night call cycle.[12] Call teams included 1 resident and 1 intern who worked from 7 am on the on‐call day to noon on the postcall day. Therefore, postcall interns were expected to hand off to the next on‐call intern before noon. Although attendings and senior residents were not required to formally supervise the handoff, supervising senior residents were often present during postcall intern sign‐out to facilitate departure of the team. When interns were not postcall, they were expected to sign out before they went to the clinic in the afternoon or when their foreseeable work was complete. The interns were provided with a 45‐minute lecture on handoffs and introduced to the peer evaluation tool in July 2009 at an intern orientation. They were also prompted to complete the tool to the best of their ability after their general medicine rotation. We chose the general medicine rotation because each intern completed approximately 2 months of general medicine in their first year. This would provide ratings over time without overburdening interns to complete 3 additional evaluations after every inpatient rotation.
The peer evaluation was constructed to correspond to specific ACGME core competencies and was also linked to specific handoff behaviors that were known to be effective. The questions were adapted from prior items used in a validated direct‐observation tool previously developed by the authors (the Handoff Clinical Evaluation Exercise), which was based on literature review as well as expert opinion.[13, 14] For example, under the core competency of communication, interns were asked to rate each other on communication skills using the anchors of No questions, no acknowledgement of to do tasks, transfer of information face to face is not a priority for low unsatisfactory (1) and Appropriate use of questions, acknowledgement and read‐back of to‐do and priority tasks, face to face communication a priority for high superior (9). Items that referred to behaviors related to both giving handoff and receiving handoff were used to capture the interactive dialogue between senders and receivers that characterize ideal handoffs. In addition, specific items referring to written sign‐out and verbal sign‐out were developed to capture the specific differences. For instance, for the patient care competency in written sign‐out, low unsatisfactory (1) was defined as Incomplete written content; to do's omitted or requested with no rationale or plan, or with inadequate preparation (ie, request to transfuse but consent not obtained), and high superior (9) was defined as Content is complete with to do's accompanied by clear plan of action and rationale. Pilot testing with trainees was conducted, including residents not involved in the study and clinical students. The tool was also reviewed by the residency program leadership, and in an effort to standardize the reporting of the items with our other evaluation forms, each item was mapped to a core competency that it was most related to. Debriefing of the instrument experience following usage was performed with 3 residents who had an interest in medical education and handoff performance.
The tool was deployed to interns following a brief educational session for interns, in which the tool was previewed and reviewed. Interns were counseled to use the form as a global performance assessment over the course of the month, in contrast to an episodic evaluation. This would also avoid the use of negative event bias by raters, in which the rater allows a single negative event to influence the perception of the person's performance, even long after the event has passed into history.
To analyze the data, descriptive statistics were used to summarize mean performance across domains. To assess whether intern performance improved over time, we split the academic year into 3 time periods of 3 months each, which we have used in earlier studies assessing intern experience.[15] Prior to analysis, postcall interns were identified by using the intern monthly call schedule located in the AMiON software program (Norwich, VT) to label the evaluation of the postcall intern. Then, all names were removed and replaced with a unique identifier for the evaluator and the evaluatee. In addition, each evaluation was also categorized as either having come from the main teaching hospital or the community hospital affiliate.
Multivariate random effects linear regression models, controlling for evaluator, evaluatee, and hospital, were used to assess the association between time (using indicator variables for season) and postcall status on intern performance. In addition, because of the skewness in the ratings, we also undertook additional analysis by transforming our data into dichotomous variables reflecting superior performance. After conducting conditional ordinal logistic regression, the main findings did not change. We also investigated within‐subject and between‐subject variation using intraclass correlation coefficients. Within‐subject intraclass correlation enabled assessment of inter‐rater reliability. Between‐subject intraclass correlation enabled the assessment of evaluator effects. Evaluator effects can encompass a variety of forms of rater bias such as leniency (in which evaluators tended to rate individuals uniformly positively), severity (rater tends to significantly avoid using positive ratings), or the halo effect (the individual being evaluated has 1 significantly positive attribute that overrides that which is being evaluated). All analyses were completed using STATA 10.0 (StataCorp, College Station, TX) with statistical significance defined as P < 0.05. This study was deemed to be exempt from institutional review board review after all data were deidentified prior to analysis.
RESULTS
From July 2009 to March 2010, 31 interns (78%) returned 60% (172/288) of the peer evaluations they received. Almost all (39/40, 98%) interns were evaluated at least once with a median of 4 ratings per intern (range, 19). Thirty‐five percent of ratings occurred when an intern was rotating at the community hospital. Ratings were very high on all domains (mean, 8.38.6). Overall sign‐out performance was rated as 8.4 (95% confidence interval [CI], 8.3‐8.5), with over 55% rating peers as 9 (maximal score). The lowest score given was 5. Individual items ranged from a low of 8.34 (95% CI, 8.21‐8.47) for updating written sign‐outs, to a high of 8.60 (95% CI, 8.50‐8.69) for collegiality (Table 1) The internal consistency of the instrument was calculated using all items and was very high, with a Cronbach = 0.98.
| ACGME Core Competency | Role | Items | Item | Mean | 95% CI | Range | % Receiving 9 as Rating |
|---|---|---|---|---|---|---|---|
| |||||||
| Patient care | Sender | Written sign‐out | Q1 | 8.34 | 8.25 to 8.48 | 69 | 53.2 |
| Sender | Updated content | Q2 | 8.35 | 8.22 to 8.47 | 59 | 54.4 | |
| Receiver | Documentation of overnight events | Q6 | 8.41 | 8.30 to 8.52 | 69 | 56.3 | |
| Medical knowledge | Sender | Anticipatory guidance | Q3 | 8.40 | 8.28 to 8.51 | 69 | 56.3 |
| Receiver | Clinical decision making during cross‐cover | Q7 | 8.45 | 8.35 to 8.55 | 69 | 56.0 | |
| Professionalism | Sender | Collegiality | Q4 | 8.60 | 8.51 to 8.68 | 69 | 65.7 |
| Receiver | Acknowledgement of professional responsibility | Q10 | 8.53 | 8.43 to 8.62 | 69 | 62.4 | |
| Receiver | Timeliness/responsiveness | Q11 | 8.50 | 8.39 to 8.60 | 69 | 61.9 | |
| Interpersonal and communication skills | Receiver | Listening behavior when receiving sign‐outs | Q8 | 8.52 | 8.42 to 8.62 | 69 | 63.6 |
| Receiver | Communication when receiving sign‐out | Q9 | 8.52 | 8.43 to 8.62 | 69 | 63.0 | |
| Systems‐based practice | Receiver | Resource use | Q12 | 8.45 | 8.35 to 8.55 | 69 | 55.6 |
| Practice‐based learning and improvement | Sender | Accepting of feedback | Q5 | 8.45 | 8.34 to 8.55 | 69 | 58.7 |
| Overall | Both | Overall sign‐out quality | Q13 | 8.44 | 8.34 to 8.54 | 69 | 55.3 |
Mean ratings for each item increased in season 2 and 3 and were statistically significant using a test for trend across ordered groups. However, in multivariate regression models, improvements remained statistically significant for only 4 items (Figure 1): 1) communication skills, 2) listening behavior, 3) accepting professional responsibility, and 4) accessing the system (Table 2). Specifically, when compared to season 1, improvements in communication skill were seen in season 2 (+0.34 [95% CI, 0.08‐0.60], P = 0.009) and were sustained in season 3 (+0.34 [95% CI, 0.06‐0.61], P = 0.018). A similar pattern was observed for listening behavior, with improvement in ratings that were similar in magnitude with increasing intern experience (season 2, +0.29 [95% CI, 0.04‐0.55], P = 0.025 compared to season 1). Although accessing the system scores showed a similar pattern of improvement with an increase in season 2 compared to season 1, the magnitude of this change was smaller (season 2, +0.21 [95% CI, 0.03‐0.39], P = 0.023). Interestingly, improvements in accepting professional responsibility rose during season 2, but the difference did not reach statistical significance until season 3 (+0.37 [95% CI, 0.08‐0.65], P = 0.012 compared to season 1).
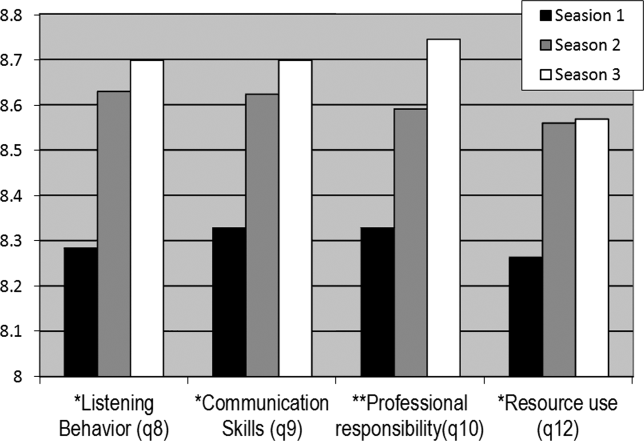
| Outcome | |||||
|---|---|---|---|---|---|
| Coefficient (95% CI) | |||||
| Predictor | Communication Skills | Listening Behavior | Professional Responsibility | Accessing the System | Written Sign‐out Quality |
| |||||
| Season 1 | Ref | Ref | Ref | Ref | Ref |
| Season 2 | 0.29 (0.04 to 0.55)a | 0.34 (0.08 to 0.60)a | 0.24 (0.03 to 0.51) | 0.21 (0.03 to 0.39)a | 0.05 (0.25 to 0.15) |
| Season 3 | 0.29 (0.02 to 0.56)a | 0.34 (0.06 to 0.61)a | 0.37 (0.08 to 0.65)a | 0.18 (0.01 to 0.36)a | 0.08 (0.13 to 0.30) |
| Community hospital | 0.18 (0.00 to 0.37) | 0.23 (0.04 to 0.43)a | 0.06 (0.13 to 0.26) | 0.13 (0.00 to 0.25) | 0.24 (0.08 to 0.39)a |
| Postcall | 0.10 (0.25 to 0.05) | 0.04 (0.21 to 0.13) | 0.02 (0.18 to 0.13) | 0.05 (0.16 to 0.05) | 0.18 (0.31,0.05)a |
| Constant | 7.04 (6.51 to 7.58) | 6.81 (6.23 to 7.38) | 7.04 (6.50 to 7.60) | 7.02 (6.59 to 7.45) | 6.49 (6.04 to 6.94) |
In addition to increasing experience, postcall interns were rated significantly lower than nonpostcall interns in 2 items: 1) written sign‐out quality (8.21 vs 8.39, P = 0.008) and 2) accepting feedback (practice‐based learning and improvement) (8.25 vs 8.42, P = 0.006). Interestingly, when interns were at the community hospital general medicine rotation, where overall census was much lower than at the teaching hospital, peer ratings were significantly higher for overall handoff performance and 7 (written sign‐out, update content, collegiality, accepting feedback, documentation of overnight events, clinical decision making during cross‐cover, and listening behavior) of the remaining 12 specific handoff domains (P < 0.05 for all, data not shown).
Last, significant evaluator effects were observed, which contributed to the variance in ratings given. For example, using intraclass correlation coefficients (ICC), we found that there was greater within‐intern variation than between‐intern variation, highlighting that evaluator scores tended to be strongly correlated with each other (eg, ICC overall performance = 0.64) and more so than scores of multiple evaluations of the same intern (eg, ICC overall performance = 0.18).
Because ratings of handoff performance were skewed, we also conducted a sensitivity analysis using ordinal logistic regression to ascertain if our findings remained significant. Using ordinal logistic regression models, significant improvements were seen in season 3 for 3 of the above‐listed behaviors, specifically listening behavior, professional responsibility, and accessing the system. Although there was no improvement in communication, there was an improvement observed in collegiality scores that were significant in season 3.
DISCUSSION
Using an end‐of‐rotation online peer assessment of handoff skills, it is feasible to obtain ratings of intern handoff performance from peers. Although there is evidence of rater bias toward leniency and low inter‐rater reliability, peer ratings of intern performance did increase over time. In addition, peer ratings were lower for interns who were handing off their postcall service. Working on a rotation at a community affiliate with a lower census was associated with higher peer ratings of handoffs.
It is worth considering the mechanism of these findings. First, the leniency observed in peer ratings likely reflects peers unwilling to critique each other due to a desire for an esprit de corps among their classmates. The low intraclass correlation coefficient for ratings of the same intern highlight that peers do not easily converge on their ratings of the same intern. Nevertheless, the ratings on the peer evaluation did demonstrate improvements over time. This improvement could easily reflect on‐the‐job learning, as interns become more acquainted with their roles and efficient and competent in their tasks. Together, these data provide a foundation for developing milestone handoffs that reflect the natural progression of intern competence in handoffs. For example, communication appeared to improve at 3 months, whereas transfer of professional responsibility improved at 6 months after beginning internship. However, alternative explanations are also important to consider. Although it is easy and somewhat reassuring to assume that increases over time reflect a learning effect, it is also possible that interns are unwilling to critique their peers as familiarity with them increases.
There are several reasons why postcall interns could have been universally rated lower than nonpostcall interns. First, postcall interns likely had the sickest patients with the most to‐do tasks or work associated with their sign‐out because they were handing off newly admitted patients. Because the postcall sign‐out is associated with the highest workload, it may be that interns perceive that a good handoff is nothing to do, and handoffs associated with more work are not highly rated. It is also important to note that postcall interns, who in this study were at the end of a 30‐hour duty shift, were also most fatigued and overworked, which may have also affected the handoff, especially in the 2 domains of interest. Due to the time pressure to leave coupled with fatigue, they may have had less time to invest in written sign‐out quality and may not have been receptive to feedback on their performance. Likewise, performance on handoffs was rated higher when at the community hospital, which could be due to several reasons. The most plausible explanation is that the workload associated with that sign‐out is less due to lower patient census and lower patient acuity. In the community hospital, fewer residents were also geographically co‐located on a quieter ward and work room area, which may contribute to higher ratings across domains.
This study also has implications for future efforts to improve and evaluate handoff performance in residency trainees. For example, our findings suggest the importance of enhancing supervision and training for handoffs during high workload rotations or certain times of the year. In addition, evaluation systems for handoff performance that rely solely on peer evaluation will not likely yield an accurate picture of handoff performance, difficulty obtaining peer evaluations, the halo effect, and other forms of evaluator bias in ratings. Accurate handoff evaluation may require direct observation of verbal communication and faculty audit of written sign‐outs.[16, 17] Moreover, methods such as appreciative inquiry can help identify the peers with the best practices to emulate.[18] Future efforts to validate peer assessment of handoffs against these other assessment methods, such as direct observation by service attendings, are needed.
There are limitations to this study. First, although we have limited our findings to 1 residency program with 1 type of rotation, we have already expanded to a community residency program that used a float system and have disseminated our tool to several other institutions. In addition, we have a small number of participants, and our 60% return rate on monthly peer evaluations raises concerns of nonresponse bias. For example, a peer who perceived the handoff performance of an intern to be poor may be less likely to return the evaluation. Because our dataset has been deidentified per institutional review board request, we do not have any information to differentiate systematic reasons for not responding to the evaluation. Anecdotally, a critique of the tool is that it is lengthy, especially in light of the fact that 1 intern completes 3 additional handoff evaluations. It is worth understanding why the instrument had such a high internal consistency. Although the items were designed to address different competencies initially, peers may make a global assessment about someone's ability to perform a handoff and then fill out the evaluation accordingly. This speaks to the difficulty in evaluating the subcomponents of various actions related to the handoff. Because of the high internal consistency, we were able to shorten the survey to a 5‐item instrument with a Cronbach of 0.93, which we are currently using in our program and have disseminated to other programs. Although it is currently unclear if the ratings of performance on the longer peer evaluation are valid, we are investigating concurrent validity of the shorter tool by comparing peer evaluations to other measures of handoff quality as part of our current work. Last, we are only able to test associations and not make causal inferences.
CONCLUSION
Peer assessment of handoff skills is feasible via an electronic competency‐based tool. Although there is evidence of score inflation, intern performance does increase over time and is associated with various aspects of workload, such as postcall status or working on a rotation at a community affiliate with a lower census. Together, these data can provide a foundation for developing milestones handoffs that reflect the natural progression of intern competence in handoffs.
Acknowledgments
The authors thank the University of Chicago Medicine residents and chief residents, the members of the Curriculum and Housestaff Evaluation Committee, Tyrece Hunter and Amy Ice‐Gibson, and Meryl Prochaska and Laura Ruth Venable for assistance with manuscript preparation.
Disclosures
This study was funded by the University of Chicago Department of Medicine Clinical Excellence and Medical Education Award and AHRQ R03 5R03HS018278‐02 Development of and Validation of a Tool to Evaluate Hand‐off Quality.
- , , ; the ACGME Duty Hour Task Force. The new recommendations on duty hours from the ACGME Task Force. N Engl J Med. 2010; 363.
- Common program requirements. Available at: http://acgme‐2010standards.org/pdf/Common_Program_Requirements_07012011.pdf. Accessed December 10, 2012.
- , , , et al. Charting the road to competence: developmental milestones for internal medicine residency training. J Grad Med Educ. 2009;1(1):5–20.
- , , , et al. Patterns of communication breakdowns resulting in injury to surgical patients. J Am Coll Surg. 2007;204(4):533–540.
- , , , . Patient handoffs: pediatric resident experiences and lessons learned. Clin Pediatr (Phila). 2011;50(1):57–63.
- , , , , . Managing discontinuity in academic medical centers: strategies for a safe and effective resident sign‐out. J Hosp Med. 2006;1(4):257–266.
- , , , , . Communication, communication, communication: the art of the handoff. Ann Emerg Med. 2010;55(2):181–183.
- , , , , . Use of peer evaluation in the assessment of medical students. J Med Educ. 1981;56:35–42.
- , , , , , . Use of peer ratings to evaluate physician performance. JAMA. 1993;269:1655–1660.
- , , . A pilot study of peer review in residency training. J Gen Intern Med. 1999;14(9):551–554.
- ACGME Program Requirements for Graduate Medical Education in Internal Medicine Effective July 1, 2009. Available at: http://www.acgme.org/acgmeweb/Portals/0/PFAssets/ProgramRequirements/140_internal_medicine_07012009.pdf. Accessed December 10, 2012.
- , , , , , . The effects of on‐duty napping on intern sleep time and fatigue. Ann Intern Med. 2006;144(11):792–798.
- , , , et al. Hand‐off education and evaluation: piloting the observed simulated hand‐off experience (OSHE). J Gen Intern Med. 2010;25(2):129–134.
- , , , , , . Validation of a handoff assessment tool: the Handoff CEX [published online ahead of print June 7, 2012]. J Clin Nurs. doi: 10.1111/j.1365‐2702.2012.04131.x.
- , , , et al. Association of workload of on‐call medical interns with on‐call sleep duration, shift duration, and participation in educational activities. JAMA. 2008;300(10):1146–1153.
- , . Using direct observation, formal evaluation, and an interactive curriculum to improve the sign‐out practices of internal medicine interns. Acad Med. 2010;85(7):1182–1188.
- , , , . Faculty member review and feedback using a sign‐out checklist: improving intern written sign‐out. Acad Med. 2012;87(8):1125–1131.
- , , , et al. Use of an appreciative inquiry approach to improve resident sign‐out in an era of multiple shift changes. J Gen Intern Med. 2012;27(3):287–291.
The advent of restricted residency duty hours has thrust the safety risks of handoffs into the spotlight. More recently, the Accreditation Council of Graduate Medical Education (ACGME) has restricted hours even further to a maximum of 16 hours for first‐year residents and up to 28 hours for residents beyond their first year.[1] Although the focus on these mandates has been scheduling and staffing in residency programs, another important area of attention is for handoff education and evaluation. The Common Program Requirements for the ACGME state that all residency programs should ensure that residents are competent in handoff communications and that programs should monitor handoffs to ensure that they are safe.[2] Moreover, recent efforts have defined milestones for handoffs, specifically that by 12 months, residents should be able to effectively communicate with other caregivers to maintain continuity during transitions of care.[3] Although more detailed handoff‐specific milestones have to be flushed out, a need for evaluation instruments to assess milestones is critical. In addition, handoffs continue to represent a vulnerable time for patients in many specialties, such as surgery and pediatrics.[4, 5]
Evaluating handoffs poses specific challenges for internal medicine residency programs because handoffs are often conducted on the fly or wherever convenient, and not always at a dedicated time and place.[6] Even when evaluations could be conducted at a dedicated time and place, program faculty and leadership may not be comfortable evaluating handoffs in real time due to lack of faculty development and recent experience with handoffs. Although supervising faculty may be in the most ideal position due to their intimate knowledge of the patient and their ability to evaluate the clinical judgment of trainees, they may face additional pressures of supervision and direct patient care that prevent their attendance at the time of the handoff. For these reasons, potential people to evaluate the quality of a resident handoff may be the peers to whom they frequently handoff. Because handoffs are also conceptualized as an interactive dialogue between sender and receiver, an ideal handoff performance evaluation would capture both of these roles.[7] For these reasons, peer evaluation may be a viable modality to assist programs in evaluating handoffs. Peer evaluation has been shown to be an effective method of rating performance of medical students,[8] practicing physicians,[9] and residents.[10] Moreover, peer evaluation is now a required feature in assessing internal medicine resident performance.[11] Although enthusiasm for peer evaluation has grown in residency training, the use of it can still be limited by a variety of problems, such as reluctance to rate peers poorly, difficulty obtaining evaluations, and the utility of such evaluations. For these reasons, it is important to understand whether peer evaluation of handoffs is feasible. Therefore, the aim of this study was to assess feasibility of an online peer evaluation survey tool of handoffs in an internal medicine residency and to characterize performance over time as well and associations between workload and performance.
METHODS
From July 2009 to March 2010, all interns on the general medicine inpatient service at 2 hospitals were asked to complete an end‐of‐month anonymous peer evaluation that included 14‐items addressing all core competencies. The evaluation tool was administered electronically using New Innovations (New Innovations, Inc., Uniontown, OH). Interns signed out to each other in a cross‐cover circuit that included 3 other interns on an every fourth night call cycle.[12] Call teams included 1 resident and 1 intern who worked from 7 am on the on‐call day to noon on the postcall day. Therefore, postcall interns were expected to hand off to the next on‐call intern before noon. Although attendings and senior residents were not required to formally supervise the handoff, supervising senior residents were often present during postcall intern sign‐out to facilitate departure of the team. When interns were not postcall, they were expected to sign out before they went to the clinic in the afternoon or when their foreseeable work was complete. The interns were provided with a 45‐minute lecture on handoffs and introduced to the peer evaluation tool in July 2009 at an intern orientation. They were also prompted to complete the tool to the best of their ability after their general medicine rotation. We chose the general medicine rotation because each intern completed approximately 2 months of general medicine in their first year. This would provide ratings over time without overburdening interns to complete 3 additional evaluations after every inpatient rotation.
The peer evaluation was constructed to correspond to specific ACGME core competencies and was also linked to specific handoff behaviors that were known to be effective. The questions were adapted from prior items used in a validated direct‐observation tool previously developed by the authors (the Handoff Clinical Evaluation Exercise), which was based on literature review as well as expert opinion.[13, 14] For example, under the core competency of communication, interns were asked to rate each other on communication skills using the anchors of No questions, no acknowledgement of to do tasks, transfer of information face to face is not a priority for low unsatisfactory (1) and Appropriate use of questions, acknowledgement and read‐back of to‐do and priority tasks, face to face communication a priority for high superior (9). Items that referred to behaviors related to both giving handoff and receiving handoff were used to capture the interactive dialogue between senders and receivers that characterize ideal handoffs. In addition, specific items referring to written sign‐out and verbal sign‐out were developed to capture the specific differences. For instance, for the patient care competency in written sign‐out, low unsatisfactory (1) was defined as Incomplete written content; to do's omitted or requested with no rationale or plan, or with inadequate preparation (ie, request to transfuse but consent not obtained), and high superior (9) was defined as Content is complete with to do's accompanied by clear plan of action and rationale. Pilot testing with trainees was conducted, including residents not involved in the study and clinical students. The tool was also reviewed by the residency program leadership, and in an effort to standardize the reporting of the items with our other evaluation forms, each item was mapped to a core competency that it was most related to. Debriefing of the instrument experience following usage was performed with 3 residents who had an interest in medical education and handoff performance.
The tool was deployed to interns following a brief educational session for interns, in which the tool was previewed and reviewed. Interns were counseled to use the form as a global performance assessment over the course of the month, in contrast to an episodic evaluation. This would also avoid the use of negative event bias by raters, in which the rater allows a single negative event to influence the perception of the person's performance, even long after the event has passed into history.
To analyze the data, descriptive statistics were used to summarize mean performance across domains. To assess whether intern performance improved over time, we split the academic year into 3 time periods of 3 months each, which we have used in earlier studies assessing intern experience.[15] Prior to analysis, postcall interns were identified by using the intern monthly call schedule located in the AMiON software program (Norwich, VT) to label the evaluation of the postcall intern. Then, all names were removed and replaced with a unique identifier for the evaluator and the evaluatee. In addition, each evaluation was also categorized as either having come from the main teaching hospital or the community hospital affiliate.
Multivariate random effects linear regression models, controlling for evaluator, evaluatee, and hospital, were used to assess the association between time (using indicator variables for season) and postcall status on intern performance. In addition, because of the skewness in the ratings, we also undertook additional analysis by transforming our data into dichotomous variables reflecting superior performance. After conducting conditional ordinal logistic regression, the main findings did not change. We also investigated within‐subject and between‐subject variation using intraclass correlation coefficients. Within‐subject intraclass correlation enabled assessment of inter‐rater reliability. Between‐subject intraclass correlation enabled the assessment of evaluator effects. Evaluator effects can encompass a variety of forms of rater bias such as leniency (in which evaluators tended to rate individuals uniformly positively), severity (rater tends to significantly avoid using positive ratings), or the halo effect (the individual being evaluated has 1 significantly positive attribute that overrides that which is being evaluated). All analyses were completed using STATA 10.0 (StataCorp, College Station, TX) with statistical significance defined as P < 0.05. This study was deemed to be exempt from institutional review board review after all data were deidentified prior to analysis.
RESULTS
From July 2009 to March 2010, 31 interns (78%) returned 60% (172/288) of the peer evaluations they received. Almost all (39/40, 98%) interns were evaluated at least once with a median of 4 ratings per intern (range, 19). Thirty‐five percent of ratings occurred when an intern was rotating at the community hospital. Ratings were very high on all domains (mean, 8.38.6). Overall sign‐out performance was rated as 8.4 (95% confidence interval [CI], 8.3‐8.5), with over 55% rating peers as 9 (maximal score). The lowest score given was 5. Individual items ranged from a low of 8.34 (95% CI, 8.21‐8.47) for updating written sign‐outs, to a high of 8.60 (95% CI, 8.50‐8.69) for collegiality (Table 1) The internal consistency of the instrument was calculated using all items and was very high, with a Cronbach = 0.98.
| ACGME Core Competency | Role | Items | Item | Mean | 95% CI | Range | % Receiving 9 as Rating |
|---|---|---|---|---|---|---|---|
| |||||||
| Patient care | Sender | Written sign‐out | Q1 | 8.34 | 8.25 to 8.48 | 69 | 53.2 |
| Sender | Updated content | Q2 | 8.35 | 8.22 to 8.47 | 59 | 54.4 | |
| Receiver | Documentation of overnight events | Q6 | 8.41 | 8.30 to 8.52 | 69 | 56.3 | |
| Medical knowledge | Sender | Anticipatory guidance | Q3 | 8.40 | 8.28 to 8.51 | 69 | 56.3 |
| Receiver | Clinical decision making during cross‐cover | Q7 | 8.45 | 8.35 to 8.55 | 69 | 56.0 | |
| Professionalism | Sender | Collegiality | Q4 | 8.60 | 8.51 to 8.68 | 69 | 65.7 |
| Receiver | Acknowledgement of professional responsibility | Q10 | 8.53 | 8.43 to 8.62 | 69 | 62.4 | |
| Receiver | Timeliness/responsiveness | Q11 | 8.50 | 8.39 to 8.60 | 69 | 61.9 | |
| Interpersonal and communication skills | Receiver | Listening behavior when receiving sign‐outs | Q8 | 8.52 | 8.42 to 8.62 | 69 | 63.6 |
| Receiver | Communication when receiving sign‐out | Q9 | 8.52 | 8.43 to 8.62 | 69 | 63.0 | |
| Systems‐based practice | Receiver | Resource use | Q12 | 8.45 | 8.35 to 8.55 | 69 | 55.6 |
| Practice‐based learning and improvement | Sender | Accepting of feedback | Q5 | 8.45 | 8.34 to 8.55 | 69 | 58.7 |
| Overall | Both | Overall sign‐out quality | Q13 | 8.44 | 8.34 to 8.54 | 69 | 55.3 |
Mean ratings for each item increased in season 2 and 3 and were statistically significant using a test for trend across ordered groups. However, in multivariate regression models, improvements remained statistically significant for only 4 items (Figure 1): 1) communication skills, 2) listening behavior, 3) accepting professional responsibility, and 4) accessing the system (Table 2). Specifically, when compared to season 1, improvements in communication skill were seen in season 2 (+0.34 [95% CI, 0.08‐0.60], P = 0.009) and were sustained in season 3 (+0.34 [95% CI, 0.06‐0.61], P = 0.018). A similar pattern was observed for listening behavior, with improvement in ratings that were similar in magnitude with increasing intern experience (season 2, +0.29 [95% CI, 0.04‐0.55], P = 0.025 compared to season 1). Although accessing the system scores showed a similar pattern of improvement with an increase in season 2 compared to season 1, the magnitude of this change was smaller (season 2, +0.21 [95% CI, 0.03‐0.39], P = 0.023). Interestingly, improvements in accepting professional responsibility rose during season 2, but the difference did not reach statistical significance until season 3 (+0.37 [95% CI, 0.08‐0.65], P = 0.012 compared to season 1).
| Outcome | |||||
|---|---|---|---|---|---|
| Coefficient (95% CI) | |||||
| Predictor | Communication Skills | Listening Behavior | Professional Responsibility | Accessing the System | Written Sign‐out Quality |
| |||||
| Season 1 | Ref | Ref | Ref | Ref | Ref |
| Season 2 | 0.29 (0.04 to 0.55)a | 0.34 (0.08 to 0.60)a | 0.24 (0.03 to 0.51) | 0.21 (0.03 to 0.39)a | 0.05 (0.25 to 0.15) |
| Season 3 | 0.29 (0.02 to 0.56)a | 0.34 (0.06 to 0.61)a | 0.37 (0.08 to 0.65)a | 0.18 (0.01 to 0.36)a | 0.08 (0.13 to 0.30) |
| Community hospital | 0.18 (0.00 to 0.37) | 0.23 (0.04 to 0.43)a | 0.06 (0.13 to 0.26) | 0.13 (0.00 to 0.25) | 0.24 (0.08 to 0.39)a |
| Postcall | 0.10 (0.25 to 0.05) | 0.04 (0.21 to 0.13) | 0.02 (0.18 to 0.13) | 0.05 (0.16 to 0.05) | 0.18 (0.31,0.05)a |
| Constant | 7.04 (6.51 to 7.58) | 6.81 (6.23 to 7.38) | 7.04 (6.50 to 7.60) | 7.02 (6.59 to 7.45) | 6.49 (6.04 to 6.94) |
In addition to increasing experience, postcall interns were rated significantly lower than nonpostcall interns in 2 items: 1) written sign‐out quality (8.21 vs 8.39, P = 0.008) and 2) accepting feedback (practice‐based learning and improvement) (8.25 vs 8.42, P = 0.006). Interestingly, when interns were at the community hospital general medicine rotation, where overall census was much lower than at the teaching hospital, peer ratings were significantly higher for overall handoff performance and 7 (written sign‐out, update content, collegiality, accepting feedback, documentation of overnight events, clinical decision making during cross‐cover, and listening behavior) of the remaining 12 specific handoff domains (P < 0.05 for all, data not shown).
Last, significant evaluator effects were observed, which contributed to the variance in ratings given. For example, using intraclass correlation coefficients (ICC), we found that there was greater within‐intern variation than between‐intern variation, highlighting that evaluator scores tended to be strongly correlated with each other (eg, ICC overall performance = 0.64) and more so than scores of multiple evaluations of the same intern (eg, ICC overall performance = 0.18).
Because ratings of handoff performance were skewed, we also conducted a sensitivity analysis using ordinal logistic regression to ascertain if our findings remained significant. Using ordinal logistic regression models, significant improvements were seen in season 3 for 3 of the above‐listed behaviors, specifically listening behavior, professional responsibility, and accessing the system. Although there was no improvement in communication, there was an improvement observed in collegiality scores that were significant in season 3.
DISCUSSION
Using an end‐of‐rotation online peer assessment of handoff skills, it is feasible to obtain ratings of intern handoff performance from peers. Although there is evidence of rater bias toward leniency and low inter‐rater reliability, peer ratings of intern performance did increase over time. In addition, peer ratings were lower for interns who were handing off their postcall service. Working on a rotation at a community affiliate with a lower census was associated with higher peer ratings of handoffs.
It is worth considering the mechanism of these findings. First, the leniency observed in peer ratings likely reflects peers unwilling to critique each other due to a desire for an esprit de corps among their classmates. The low intraclass correlation coefficient for ratings of the same intern highlight that peers do not easily converge on their ratings of the same intern. Nevertheless, the ratings on the peer evaluation did demonstrate improvements over time. This improvement could easily reflect on‐the‐job learning, as interns become more acquainted with their roles and efficient and competent in their tasks. Together, these data provide a foundation for developing milestone handoffs that reflect the natural progression of intern competence in handoffs. For example, communication appeared to improve at 3 months, whereas transfer of professional responsibility improved at 6 months after beginning internship. However, alternative explanations are also important to consider. Although it is easy and somewhat reassuring to assume that increases over time reflect a learning effect, it is also possible that interns are unwilling to critique their peers as familiarity with them increases.
There are several reasons why postcall interns could have been universally rated lower than nonpostcall interns. First, postcall interns likely had the sickest patients with the most to‐do tasks or work associated with their sign‐out because they were handing off newly admitted patients. Because the postcall sign‐out is associated with the highest workload, it may be that interns perceive that a good handoff is nothing to do, and handoffs associated with more work are not highly rated. It is also important to note that postcall interns, who in this study were at the end of a 30‐hour duty shift, were also most fatigued and overworked, which may have also affected the handoff, especially in the 2 domains of interest. Due to the time pressure to leave coupled with fatigue, they may have had less time to invest in written sign‐out quality and may not have been receptive to feedback on their performance. Likewise, performance on handoffs was rated higher when at the community hospital, which could be due to several reasons. The most plausible explanation is that the workload associated with that sign‐out is less due to lower patient census and lower patient acuity. In the community hospital, fewer residents were also geographically co‐located on a quieter ward and work room area, which may contribute to higher ratings across domains.
This study also has implications for future efforts to improve and evaluate handoff performance in residency trainees. For example, our findings suggest the importance of enhancing supervision and training for handoffs during high workload rotations or certain times of the year. In addition, evaluation systems for handoff performance that rely solely on peer evaluation will not likely yield an accurate picture of handoff performance, difficulty obtaining peer evaluations, the halo effect, and other forms of evaluator bias in ratings. Accurate handoff evaluation may require direct observation of verbal communication and faculty audit of written sign‐outs.[16, 17] Moreover, methods such as appreciative inquiry can help identify the peers with the best practices to emulate.[18] Future efforts to validate peer assessment of handoffs against these other assessment methods, such as direct observation by service attendings, are needed.
There are limitations to this study. First, although we have limited our findings to 1 residency program with 1 type of rotation, we have already expanded to a community residency program that used a float system and have disseminated our tool to several other institutions. In addition, we have a small number of participants, and our 60% return rate on monthly peer evaluations raises concerns of nonresponse bias. For example, a peer who perceived the handoff performance of an intern to be poor may be less likely to return the evaluation. Because our dataset has been deidentified per institutional review board request, we do not have any information to differentiate systematic reasons for not responding to the evaluation. Anecdotally, a critique of the tool is that it is lengthy, especially in light of the fact that 1 intern completes 3 additional handoff evaluations. It is worth understanding why the instrument had such a high internal consistency. Although the items were designed to address different competencies initially, peers may make a global assessment about someone's ability to perform a handoff and then fill out the evaluation accordingly. This speaks to the difficulty in evaluating the subcomponents of various actions related to the handoff. Because of the high internal consistency, we were able to shorten the survey to a 5‐item instrument with a Cronbach of 0.93, which we are currently using in our program and have disseminated to other programs. Although it is currently unclear if the ratings of performance on the longer peer evaluation are valid, we are investigating concurrent validity of the shorter tool by comparing peer evaluations to other measures of handoff quality as part of our current work. Last, we are only able to test associations and not make causal inferences.
CONCLUSION
Peer assessment of handoff skills is feasible via an electronic competency‐based tool. Although there is evidence of score inflation, intern performance does increase over time and is associated with various aspects of workload, such as postcall status or working on a rotation at a community affiliate with a lower census. Together, these data can provide a foundation for developing milestones handoffs that reflect the natural progression of intern competence in handoffs.
Acknowledgments
The authors thank the University of Chicago Medicine residents and chief residents, the members of the Curriculum and Housestaff Evaluation Committee, Tyrece Hunter and Amy Ice‐Gibson, and Meryl Prochaska and Laura Ruth Venable for assistance with manuscript preparation.
Disclosures
This study was funded by the University of Chicago Department of Medicine Clinical Excellence and Medical Education Award and AHRQ R03 5R03HS018278‐02 Development of and Validation of a Tool to Evaluate Hand‐off Quality.
- , , ; the ACGME Duty Hour Task Force. The new recommendations on duty hours from the ACGME Task Force. N Engl J Med. 2010; 363.
- Common program requirements. Available at: http://acgme‐2010standards.org/pdf/Common_Program_Requirements_07012011.pdf. Accessed December 10, 2012.
- , , , et al. Charting the road to competence: developmental milestones for internal medicine residency training. J Grad Med Educ. 2009;1(1):5–20.
- , , , et al. Patterns of communication breakdowns resulting in injury to surgical patients. J Am Coll Surg. 2007;204(4):533–540.
- , , , . Patient handoffs: pediatric resident experiences and lessons learned. Clin Pediatr (Phila). 2011;50(1):57–63.
- , , , , . Managing discontinuity in academic medical centers: strategies for a safe and effective resident sign‐out. J Hosp Med. 2006;1(4):257–266.
- , , , , . Communication, communication, communication: the art of the handoff. Ann Emerg Med. 2010;55(2):181–183.
- , , , , . Use of peer evaluation in the assessment of medical students. J Med Educ. 1981;56:35–42.
- , , , , , . Use of peer ratings to evaluate physician performance. JAMA. 1993;269:1655–1660.
- , , . A pilot study of peer review in residency training. J Gen Intern Med. 1999;14(9):551–554.
- ACGME Program Requirements for Graduate Medical Education in Internal Medicine Effective July 1, 2009. Available at: http://www.acgme.org/acgmeweb/Portals/0/PFAssets/ProgramRequirements/140_internal_medicine_07012009.pdf. Accessed December 10, 2012.
- , , , , , . The effects of on‐duty napping on intern sleep time and fatigue. Ann Intern Med. 2006;144(11):792–798.
- , , , et al. Hand‐off education and evaluation: piloting the observed simulated hand‐off experience (OSHE). J Gen Intern Med. 2010;25(2):129–134.
- , , , , , . Validation of a handoff assessment tool: the Handoff CEX [published online ahead of print June 7, 2012]. J Clin Nurs. doi: 10.1111/j.1365‐2702.2012.04131.x.
- , , , et al. Association of workload of on‐call medical interns with on‐call sleep duration, shift duration, and participation in educational activities. JAMA. 2008;300(10):1146–1153.
- , . Using direct observation, formal evaluation, and an interactive curriculum to improve the sign‐out practices of internal medicine interns. Acad Med. 2010;85(7):1182–1188.
- , , , . Faculty member review and feedback using a sign‐out checklist: improving intern written sign‐out. Acad Med. 2012;87(8):1125–1131.
- , , , et al. Use of an appreciative inquiry approach to improve resident sign‐out in an era of multiple shift changes. J Gen Intern Med. 2012;27(3):287–291.
Copyright © 2012 Society of Hospital Medicine
