User login
Lack of sleep is a common problem in hospitalized patients and is associated with poorer health outcomes, especially in older patients.[1, 2, 3] Prior studies highlight a multitude of factors that can result in sleep loss in the hospital[3, 4, 5, 6] with 1 of the most common causes of sleep disruption in the hospital being noise.[7, 8, 9]
In addition to external factors, such as hospital noise, there may be inherent characteristics that predispose certain patients to greater sleep loss when hospitalized. One such measure is the construct of perceived control or the psychological measure of how much individuals expect themselves to be capable of bringing about desired outcomes.[10] Among older patients, low perceived control is associated with increased rates of physician visits, hospitalizations, and death.[11, 12] In contrast, patients who feel more in control of their environment may experience positive health benefits.[13]
Yet, when patients are placed in a hospital setting, they experience a significant reduction in control over their environment along with an increase in dependency on medical staff and therapies.[14, 15] For example, hospitalized patients are restricted in their personal decisions, such as what clothes they can wear and what they can eat and are not in charge of their own schedules, including their sleep time.
Although prior studies suggest that perceived control over sleep is related to actual sleep among community‐dwelling adults,[16, 17] no study has examined this relationship in hospitalized adults. Therefore, the aim of our study was to examine the possible association between perceived control, noise levels, and sleep in hospitalized middle‐aged and older patients.
METHODS
Study Design
We conducted a prospective cohort study of subjects recruited from a large ongoing study of admitted patients at the University of Chicago inpatient general medicine service.[18] Because we were interested in middle‐aged and older adults who are most sensitive to sleep disruptions, patients who were age 50 years and over, ambulatory, and living in the community were eligible for the study.[19] Exclusion criteria were cognitive impairment (telephone version of the Mini‐Mental State Exam <17 out of 22), preexisting sleeping disorders identified via patient charts, such as obstructive sleep apnea and narcolepsy, transfer from the intensive care unit (ICU), and admission to the hospital more than 72 hours prior to enrollment.[20] These inclusion and exclusion criteria were selected to identify a patient population with minimal sleep disturbances at baseline. Patients under isolation were excluded because they are not visited as frequently by the healthcare team.[21, 22] Most general medicine rooms were double occupancy but efforts were made to make patient rooms single when possible or required (ie, isolation for infection control). The study was approved by the University of Chicago Institutional Review Board.
Subjective Data Collection
Baseline levels of perceived control over sleep, or the amount of control patients believe they have over their sleep, were assessed using 2 different scales. The first tool was the 8‐item Sleep Locus of Control (SLOC) scale,[17] which ranges from 8 to 48, with higher values corresponding to a greater internal locus of control over sleep. An internal sleep locus of control indicates beliefs that patients feel that they are primarily responsible for their own sleep as opposed to an external locus of control which indicates beliefs that good sleep is due to luck or chance. For example, patients were asked how strongly they agree or disagree with statements, such as, If I take care of myself, I can avoid insomnia and People who never get insomnia are just plain lucky (see Supporting Information, Appendix 2, in the online version of this article). The second tool was the 9‐item Sleep Self‐Efficacy (SSE) scale,[23] which ranges from 9 to 45, with higher values corresponding to greater confidence patients have in their ability to sleep. One of the items asks, How confident are you that you can lie in bed feeling physically relaxed (see Supporting Information, Appendix 1, in the online version of this article)? Both instruments have been validated in an outpatient setting.[23] These surveys were given immediately on enrollment in the study to measure baseline perceived control.
Baseline sleep habits were also collected on enrollment using the Epworth Sleepiness Scale,[24, 25] a standard validated survey that assesses excess daytime sleepiness in various common situations. For each day in the hospital, patients were asked to report in‐hospital sleep quality using the Karolinska Sleep Log.[26] The Karolinska Sleep Quality Index (KSQI) is calculated from 4 items on the Karolinska Sleep Log (sleep quality, sleep restlessness, slept throughout the night, ease of falling asleep). The questions are on a 5‐point scale and the 4 items are averaged for a final score out of 5 with a higher number indicating better subjective sleep quality. The item How much was your sleep disturbed by noise? on the Karolinska Sleep Log was used to assess the degree to which noise was a disruptor of sleep. This question was also on a 5‐point scale with higher scores indicating greater disruptiveness of noise. Patients were also asked how disruptive noise from roommates was on a nightly basis using this same scale.
Objective Data Collection
Wrist activity monitors (Actiwatch 2; Respironics, Inc., Murrysville, PA)[27, 28, 29, 30] were used to measure patient sleep. Actiware 5 software (Respironics, Inc.)[31] was used to estimate quantitative measures of sleep time and efficiency. Sleep time is defined as the total duration of time spent sleeping at night and sleep efficiency is defined as the fraction of time, reported as a percentage, spent sleeping by actigraphy out of the total time patients reported they were sleeping.
Sound levels in patient rooms were recorded using Larson Davis 720 Sound Level Monitors (Larson Davis, Inc., Provo, UT). These monitors store functional average sound pressure levels in A‐weighted decibels called the Leq over 1‐hour intervals. The Leq is the average sound level over the given time interval. Minimum (Lmin) and maximum (Lmax) sound levels are also stored. The LD SLM Utility Program (Larson Davis, Inc.) was used to extract the sound level measurements recorded by the monitors.
Demographic information (age, gender, race, ethnicity, highest level of education, length of stay in the hospital, and comorbidities) was obtained from hospital charts via an ongoing study of admitted patients at the University of Chicago Medical Center inpatient general medicine service.[18] Chart audits were performed to determine whether patients received pharmacologic sleep aids in the hospital.
Data Analysis
Descriptive statistics were used to summarize mean sleep duration and sleep efficiency in the hospital as well as SLOC and SSE. Because the SSE scores were not normally distributed, the scores were dichotomized at the median to create a variable denoting high and low SSE. Additionally, because the distribution of responses to the noise disruption question was skewed to the right, reports of noise disruptions were grouped into not disruptive (score=1) and disruptive (score>1).
Two‐sample t tests with equal variances were used to assess the relationship between perceived control measures (high/low SLOC, SSE) and objective sleep measures (sleep time, sleep efficiency). Multivariate linear regression was used to test the association between high SSE (independent variable) and sleep time (dependent variable), clustering for multiple nights of data within the subject. Multivariate logistic regression, also adjusting for subject, was used to test the association between high SSE and noise disruptiveness and the association between high SSE and Karolinska scores. Leq, Lmax, and Lmin were all tested using stepwise forward regression. Because our prior work[9] demonstrated that noise levels separated into tertiles were significantly associated with sleep time, our analysis also used noise levels separated into tertiles. Stepwise forward regression was used to add basic patient demographics (gender, race, age) to the models. Statistical significance was defined as P<0.05, and all statistical analysis was done using Stata 11.0 (StataCorp, College Station, TX).
RESULTS
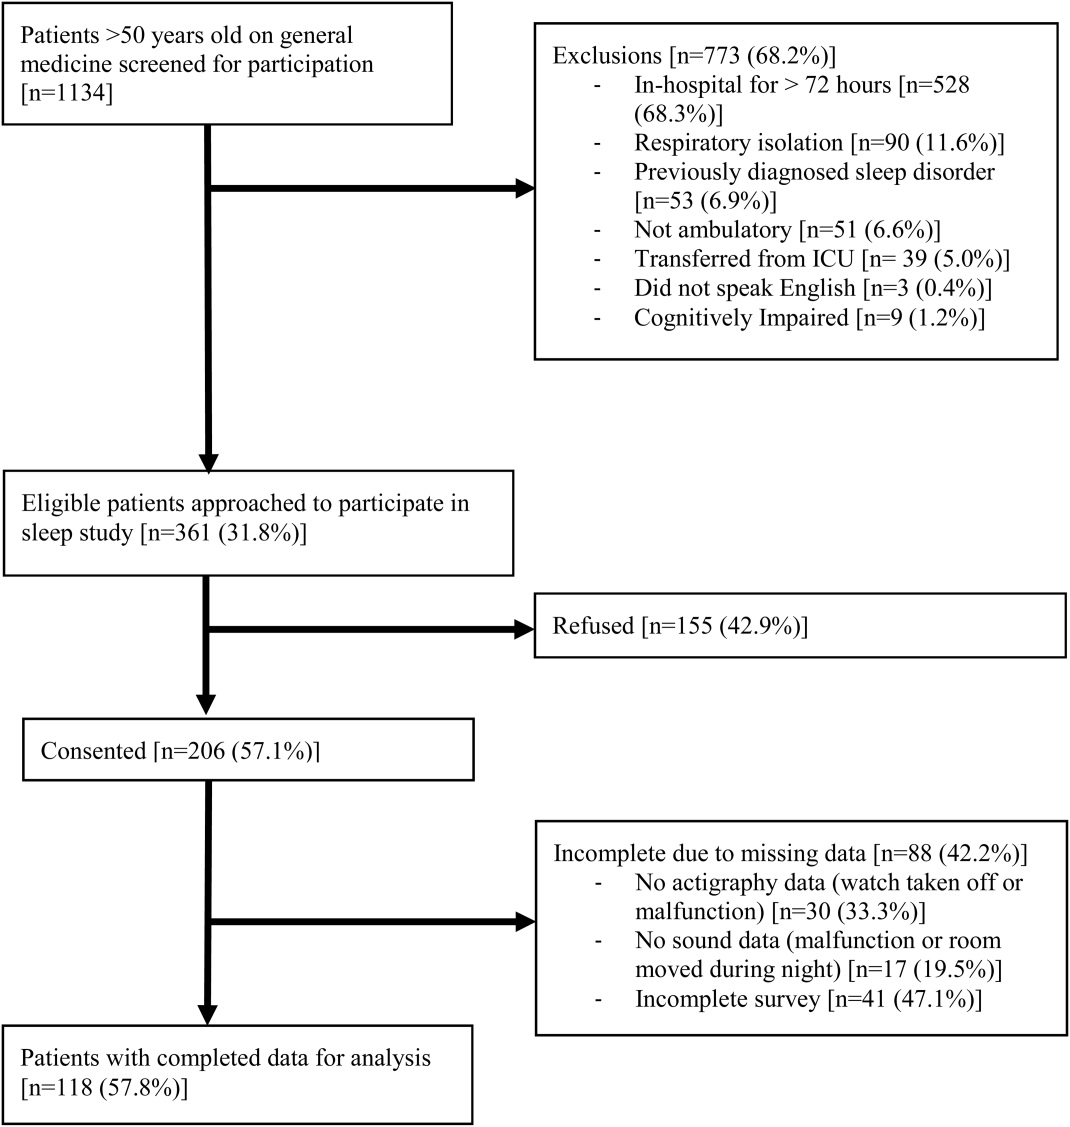
From April 2010 to May 2012, 1134 patients were screened by study personnel for this study via an ongoing study of hospitalized patients on the inpatient general medicine ward. Of the 361 (31.8%) eligible patients, 206 (57.1%) consented to participate. Of the subjects enrolled in the study, 118 were able to complete at least 1 night of actigraphy, sound monitoring, and subjective assessment for a total of 185 patient nights (Figure 1).
The majority of patients were female (57%), African American (67%), and non‐Hispanic (97%). The mean age was 65 years (standard deviation [SD], 11.6 years), and the median length of stay was 4 days (interquartile range [IQR], 36). The majority of patients also had hypertension (67%), with chronic obstructive pulmonary disease [COPD] (31%) and congestive heart failure (31%) being the next most common comorbidities. About two‐thirds of subjects (64%) were characterized as average or above average sleepers with Epworth Sleepiness Scale scores 9[20] (Table 1). Only 5% of patients received pharmacological sleep aids.
| Value, n (%)a | |
|---|---|
| |
| Patient characteristics | |
| Age, mean (SD), y | 63 (12) |
| Length of stay, median (IQR), db | 4 (36) |
| Female | 67 (57) |
| African American | 79 (67) |
| Hispanic | 3 (3) |
| High school graduate | 92 (78) |
| Comorbidities | |
| Hypertension | 79 (66) |
| Chronic obstructive pulmonary disease | 37 (31) |
| Congestive heart failure | 37 (31) |
| Diabetes | 36 (30) |
| End stage renal disease | 23 (19) |
| Baseline sleep characteristics | |
| Sleep duration, mean (SD), minc | 333 (128) |
| Epworth Sleepiness Scale, score 9d | 73 (64) |
The mean baseline SLOC score was 30.4 (SD, 6.7), with a median of 31 (IQR, 2735). The mean baseline SSE score was 32.1 (SD, 9.4), with a median of 34 (IQR, 2441). Fifty‐four patients were categorized as having high sleep self‐efficacy (high SSE), which we defined as scoring above the median of 34.
Average in‐hospital sleep was 5.5 hours (333 minutes; SD, 128 minutes) which was significantly shorter than the self‐reported sleep duration of 6.5 hours prior to admission (387 minutes, SD, 125 minutes; P=0.0001). The mean sleep efficiency was 73% (SD, 19%) with 55% of actigraphy nights below the normal range of 80% efficiency for adults.[19] Median KSQI was 3.5 (IQR, 2.254.75), with 41% of the patients with a KSQI 3, putting them in the insomniac range.[32] The median score on the noise disruptiveness question was 1 (IQR, 14) with 42% of reports coded as disruptive defined as a score >1 on the 5‐point scale. The median score on the roommate disruptiveness question was 1 (IQR, 11) with 77% of responses coded as not disruptive defined as a score of 1 on the 5‐point scale.
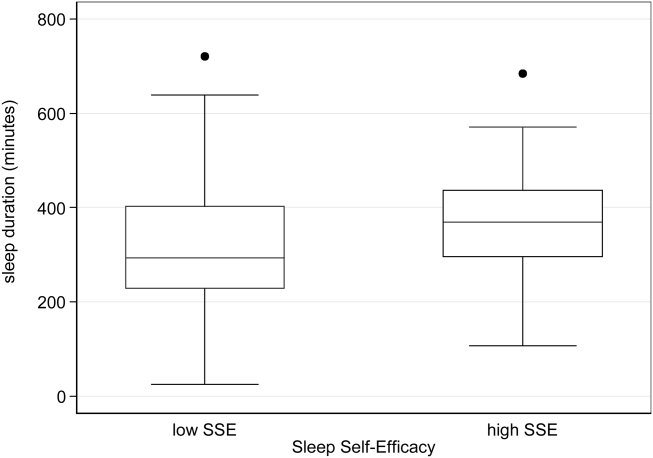
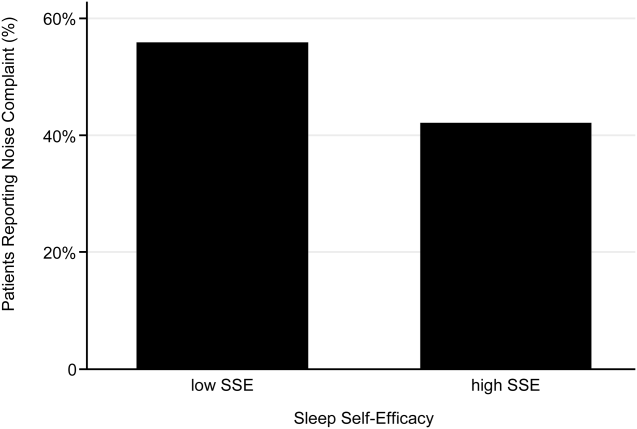
A 2‐sample t test with equal variances showed that those patients reporting high SSE were more likely to sleep longer in the hospital than those reporting low SSE (364 minutes 95% confidence interval [CI]: 340, 388 vs 309 minutes 95% CI: 283, 336; P=0.003) (Figure 2). Patients with high SSE were also more likely to have a normal sleep efficiency (above 80%) compared to those with low SSE (54% 95% CI: 43, 65 vs 38% 95% CI: 28,47; P=0.028). Last, there was a trend toward patients reporting higher SSE to also report less noise disruption compared to those patients with low SSE ([42%] 95% CI: 31, 53 vs [56%] 95% CI: 46, 65; P=0.063) (Figure 3).
Linear regression clustered by subject showed that high SSE was associated with longer sleep duration (55 minutes 95% CI: 14, 97; P=0.010). Furthermore, high SSE was significantly associated with longer sleep duration after controlling for both objective noise level and patient demographics in the model using stepwise forward regression (50 minutes 95% CI: 11, 90; P=0.014) (Table 2).
| Sleep Duration (min) | Model 1 Beta [95% CI]a | Model 2 Beta [95% CI]a |
|---|---|---|
| ||
| High SSE | 55 [14, 97]b | 50 [11, 90]b |
| Lmin tert 3 | 14 [59, 29] | |
| Lmin tert 2 | 21 [65, 23] | |
| Female | 49 [10, 89]b | |
| African American | 16 [59, 27] | |
| Age | 1 [0.9, 3] | |
| Karolinska Sleep Quality | Model 1 OR [95% CI]c | Model 2 OR [95% CI]c |
| High SSE | 2.04 [1.12, 3.71]b | 2.01 [1.06, 3.79]b |
| Lmin tert 3 | 0.90 [0.37, 2.2] | |
| Lmin tert 2 | 0.86 [0.38, 1.94] | |
| Female | 1.78 [0.90, 3.52] | |
| African American | 1.19 [0.60, 2.38] | |
| Age | 1.02 [0.99, 1.05] | |
| Noise Complaints | Model 1 OR [95% CI]d | Model 2 OR [95% CI]d |
| High SSE | 0.57 [0.30, 1.12] | 0.49 [0.25, 0.96]b |
| Lmin tert 3 | 0.85 [0.39, 1.84] | |
| Lmin tert 2 | 0.91 [0.43, 1.93] | |
| Female | 1.40 [0.71, 2.78] | |
| African American | 0.35 [0.17, 0.70] | |
| Age | 1.00 [0.96, 1.03] | |
| Age2e | 1.00 [1.00, 1.00] | |
Logistic regression clustered by subject demonstrated that patients with high SSE had 2 times higher odds of having a KSQI score above 3 (95% CI: 1.12, 3.71; P=0.020). This association was still significant after controlling for noise and patient demographics (OR: 2.01; 95% CI: 1.06, 3.79; P=0.032). After controlling for noise levels and patient demographics, there was a statistically significant association between high SSE and lower odds of noise complaints (OR: 0.49; 95% CI: 0.25, 0.96; P=0.039) (Table 2). Although demographic characteristics were not associated with high SSE, those patients with high SSE had lower odds of being in the loudest tertile rooms (OR: 0.34; 95% CI: 0.15, 0.74; P=0.007).
In multivariate linear regression analyses, there were no significant relationships between SLOC scores and KSQI, reported noise disruptiveness, and markers of sleep (sleep duration or sleep efficiency).
DISCUSSION
This study is the first to examine the relationship between perceived control, noise levels, and objective measurements of sleep in a hospital setting. One measure of perceived control, namely SSE, was associated with objective sleep duration, subjective and objective sleep quality, noise levels in patient rooms, and perhaps also patient complaints of noise. These associations remained significant after controlling for objective noise levels and patient demographics, suggesting that SSE is independently related to sleep.
In contrast to SSE, SLOC was not found to be significantly associated with either subjective or objective measures of sleep quality. The lack of association may be due to the fact that the SLOC questionnaire does not translate as well to the inpatient setting as the SSE questionnaire. The SLOC questionnaire focuses on general beliefs about sleep whereas the SSE questionnaire focuses on personal beliefs about one's own ability sleep in the immediate future, which may make it more relevant in the inpatient setting (see Supporting Information, Appendix 1 and 2, in the online version of this article).
Given our findings, it is important to identify why patients with high SSE have better sleep and fewer noise complaints. One possibility is that sleep self‐efficacy is an inherited trait unique to each person that is also predictive of a patient's sleep patterns. However, is it also possible that those patients with high SSE feel more empowered to take control of their environment, allowing them to advocate for better sleep? This hypothesis is further strengthened by the finding that those patients with high SSE on study entry were less likely to be in the noisiest rooms. This raises the possibility that at least 1 of the mechanisms by which high SSE may be protective against sleep loss is through patients taking an active role in noise reduction, such as closing the door or advocating for their sleep with staff. However, we did not directly observe or ask patients whether doors of patient rooms were open or closed or whether the patients took other measures to advocate for their own sleep. Thus, further work is necessary to understand the mechanisms by which sleep self‐efficacy may influence sleep.
One potential avenue for future research is to explore possible interventions for boosting sleep self‐efficacy in the hospital. Although most interventions have focused on environmental noise and staff‐based education, empowering patients through boosting SSE may be a helpful adjunct to improving hospital sleep.[33, 34] Currently, the SSE scale is not commonly used in the inpatient setting. Motivational interviewing and patient coaching could be explored as potential tools for boosting SSE. Furthermore, even if SSE is not easily changed, measuring SSE in patients newly admitted to the hospital may be useful in identifying patients most susceptible to sleep disruptions. Efforts to identify patients with low SSE should go hand‐in‐hand with measures to reduce noise. Addressing both patient‐level and environmental factors simultaneously may be the best strategy for improving sleep in an inpatient hospital setting.
In contrast to our prior study, it is worth noting that we did not find any significant relationships between overall noise levels and sleep.[9] In this dataset, nighttime noise is still a predictor of sleep loss in the hospital. However, when we restrict our sample to those who answered the SSE questionnaire and had nighttime noise recorded, we lose a significant number of observations. Because of our interest in testing the relationship between SSE and sleep, we chose to control for overall noise (which enabled us to retain more observations). We also did not find any interactions between SSE and noise in our regression models. Further work is warranted with larger sample sizes to better understand the role of SSE in the context of sleep and noise levels. In addition, females also received more sleep than males in our study.
There are several limitations to this study. This study was carried out at a single service at a single institution, limiting the ability to generalize the findings to other hospital settings. This study had a relatively high rate of patients who were unable to complete at least 1 night of data collection (42%), often due to watch removal for imaging or procedures, which may also affect the representativeness of our sample. Moreover, we can only examine associations and not causal relationships. The SSE scale has never been used in hospitalized patients, making comparisons between scores from hospitalized patients and population controls difficult. In addition, the SSE scale also has not been dichotomized in previous studies into high and low SSE. However, a sensitivity analysis with raw SSE scores did not change the results of our study. It can be difficult to perform actigraphy measurements in the hospital because many patients spend most of their time in bed. Because we chose a relatively healthy cohort of patients without significant limitations in mobility, actigraphy could still be used to differentiate time spent awake from time spent sleeping. Because we did not perform polysomnography, we cannot explore the role of sleep architecture which is an important component of sleep quality. Although the use of pharmacologic sleep aids is a potential confounding factor, the rate of use was very low in our cohort and unlikely to significantly affect our results. Continued study of this patient population is warranted to further develop the findings.
In conclusion, patients with high SSE sleep better in the hospital, tend to be in quieter rooms, and may report fewer noise complaints. Our findings suggest that a greater confidence in the ability to sleep may be beneficial in hospitalized adults. In addition to noise control, hospitals should also consider targeting patients with low SSE when designing novel interventions to improve in‐hospital sleep.
Disclosures
This work was supported by funding from the National Institute on Aging through a Short‐Term Aging‐Related Research Program (1 T35 AG029795), National Institute on Aging career development award (K23AG033763), a midcareer career development award (1K24AG031326), a program project (P01AG‐11412), an Agency for Healthcare Research and Quality Centers for Education and Research on Therapeutics grant (1U18HS016967), and a National Institute on Aging Clinical Translational Sciences award (UL1 RR024999). Dr. Arora had full access to all of the data in the study and takes responsibility for the integrity of the data and the accuracy of the statistical analysis. The funding agencies had no role in the design of the study; the collection, analysis, and interpretation of the data; or the decision to approve publication of the finished manuscript. The authors report no conflicts of interest.
- , , , . The metabolic consequences of sleep deprivation. Sleep Med Rev. 2007;11(3):163–178.
- , , , , , . Poor self‐reported sleep quality predicts mortality within one year of inpatient post‐acute rehabilitation among older adults. Sleep. 2011;34(12):1715–1721.
- , , , et al. The sleep of older people in hospital and nursing homes. J Clin Nurs. 1999;8:360–368.
- , , et al. Sleep in hospitalized medical patients, part 1: factors affecting sleep. J Hosp Med. 2008; 3:473–482.
- , , , et al. Nocturnal care interactions with patients in critical care units. Am J Crit Care. 2004;13:102–112; quiz 114–115.
- , , . Patient perception of sleep quality and etiology of sleep disruption in the intensive care unit. Am J Respir Crit Care Med. 1999;159:1155–1162.
- . Sleep in acute care settings: an integrative review. J Nurs Scholarsh. 2000;32(1):31–38.
- , , , et al. Sleep disruption due to hospital noises: a prospective evaluation. Ann Int Med. 2012;157(3): 170–179.
- , , , et al. Noise and sleep among adult medical inpatients: far from a quiet night. Arch Intern Med. 2012;172:68–70.
- . Generalized expectancies for internal versus external control of reinforcement. Psychol Monogr. 1966;80:1–28.
- , . Psychosocial risk factors and mortality: a prospective study with special focus on social support, social participation, and locus of control in Norway. J Epidemiol Community Health. 1998;52:476–481.
- , . The interactive effect of perceived control and functional status on health and mortality among young‐old and old‐old adults. J Gerontol B Psychol Sci Soc Sci. 1997;52:P118–P126.
- , . Role‐specific feelings of control and mortality. Psychol Aging. 2000;15:617–626.
- , , . Patient empowerment in intensive care—an interview study. Intensive Crit Care Nurs. 2006;22:370–377.
- , , . Exploring the relationship between personal control and the hospital environment. J Clin Nurs. 2008;17:1601–1609.
- , , , et al. Effects of volitional lifestyle on sleep‐life habits in the aged. Psychiatry Clin Neurosci. 1998;52:183–184.
- , , , et al. Sleep locus of control: report on a new scale. Behav Sleep Med. 2004;2:79–93.
- , , , et al. Effects of physician experience on costs and outcomes on an academic general medicine service: results of a trial of hospitalists. Ann Intern Med. 2002;137:866–874.
- , , , et al. The effects of age, sex, ethnicity, and sleep‐disordered breathing on sleep architecture. Arch Intern Med. 2004;164:406–418.
- , , , et al. Validation of a telephone version of the mini‐mental state examination. J Am Geriatr Soc. 1992;40:697–702.
- , , , et al. Contact isolation in surgical patients: a barrier to care? Surgery. 2003;134:180–188.
- , . Adverse effects of contact isolation. Lancet. 1999;354:1177–1178.
- . Behavioral Treatment for Persistent Insomnia. Elmsford, NY: Pergamon Press; 1987.
- . A new method for measuring daytime sleepiness: the Epworth sleepiness scale. Sleep. 1991;14:540–545.
- . Reliability and factor analysis of the Epworth Sleepiness Scale. Sleep. 1992;15:376–381.
- , . Objective components of individual differences in subjective sleep quality. J Sleep Res. 1997;6:217–220.
- , , , et al. The role of actigraphy in the study of sleep and circadian rhythms. Sleep. 2003;26:342–392.
- , , , et al. Practice parameters for the use of actigraphy in the assessment of sleep and sleep disorders: an update for 2007. Sleep. 2007;30:519–529.
- , , , et al. The role of actigraphy in the evaluation of sleep disorders. Sleep. 1995;18:288–302.
- , , , et al. Clinical review: sleep measurement in critical care patients: research and clinical implications. Crit Care. 2007;11:226.
- , , , et al. Evaluation of immobility time for sleep latency in actigraphy. Sleep Med. 2009;10:621–625.
- , , , et al. The subjective meaning of sleep quality: a comparison of individuals with and without insomnia. Sleep. 2008;31:383–393.
- , , , et al. Sleep in hospitalized medical patients, part 2: behavioral and pharmacological management of sleep disturbances. J Hosp Med. 2009;4:50–59.
- , , , . A nonpharmacologic sleep protocol for hospitalized older patients. J Am Geriatr Soc. 1998;46(6):700–705.
Lack of sleep is a common problem in hospitalized patients and is associated with poorer health outcomes, especially in older patients.[1, 2, 3] Prior studies highlight a multitude of factors that can result in sleep loss in the hospital[3, 4, 5, 6] with 1 of the most common causes of sleep disruption in the hospital being noise.[7, 8, 9]
In addition to external factors, such as hospital noise, there may be inherent characteristics that predispose certain patients to greater sleep loss when hospitalized. One such measure is the construct of perceived control or the psychological measure of how much individuals expect themselves to be capable of bringing about desired outcomes.[10] Among older patients, low perceived control is associated with increased rates of physician visits, hospitalizations, and death.[11, 12] In contrast, patients who feel more in control of their environment may experience positive health benefits.[13]
Yet, when patients are placed in a hospital setting, they experience a significant reduction in control over their environment along with an increase in dependency on medical staff and therapies.[14, 15] For example, hospitalized patients are restricted in their personal decisions, such as what clothes they can wear and what they can eat and are not in charge of their own schedules, including their sleep time.
Although prior studies suggest that perceived control over sleep is related to actual sleep among community‐dwelling adults,[16, 17] no study has examined this relationship in hospitalized adults. Therefore, the aim of our study was to examine the possible association between perceived control, noise levels, and sleep in hospitalized middle‐aged and older patients.
METHODS
Study Design
We conducted a prospective cohort study of subjects recruited from a large ongoing study of admitted patients at the University of Chicago inpatient general medicine service.[18] Because we were interested in middle‐aged and older adults who are most sensitive to sleep disruptions, patients who were age 50 years and over, ambulatory, and living in the community were eligible for the study.[19] Exclusion criteria were cognitive impairment (telephone version of the Mini‐Mental State Exam <17 out of 22), preexisting sleeping disorders identified via patient charts, such as obstructive sleep apnea and narcolepsy, transfer from the intensive care unit (ICU), and admission to the hospital more than 72 hours prior to enrollment.[20] These inclusion and exclusion criteria were selected to identify a patient population with minimal sleep disturbances at baseline. Patients under isolation were excluded because they are not visited as frequently by the healthcare team.[21, 22] Most general medicine rooms were double occupancy but efforts were made to make patient rooms single when possible or required (ie, isolation for infection control). The study was approved by the University of Chicago Institutional Review Board.
Subjective Data Collection
Baseline levels of perceived control over sleep, or the amount of control patients believe they have over their sleep, were assessed using 2 different scales. The first tool was the 8‐item Sleep Locus of Control (SLOC) scale,[17] which ranges from 8 to 48, with higher values corresponding to a greater internal locus of control over sleep. An internal sleep locus of control indicates beliefs that patients feel that they are primarily responsible for their own sleep as opposed to an external locus of control which indicates beliefs that good sleep is due to luck or chance. For example, patients were asked how strongly they agree or disagree with statements, such as, If I take care of myself, I can avoid insomnia and People who never get insomnia are just plain lucky (see Supporting Information, Appendix 2, in the online version of this article). The second tool was the 9‐item Sleep Self‐Efficacy (SSE) scale,[23] which ranges from 9 to 45, with higher values corresponding to greater confidence patients have in their ability to sleep. One of the items asks, How confident are you that you can lie in bed feeling physically relaxed (see Supporting Information, Appendix 1, in the online version of this article)? Both instruments have been validated in an outpatient setting.[23] These surveys were given immediately on enrollment in the study to measure baseline perceived control.
Baseline sleep habits were also collected on enrollment using the Epworth Sleepiness Scale,[24, 25] a standard validated survey that assesses excess daytime sleepiness in various common situations. For each day in the hospital, patients were asked to report in‐hospital sleep quality using the Karolinska Sleep Log.[26] The Karolinska Sleep Quality Index (KSQI) is calculated from 4 items on the Karolinska Sleep Log (sleep quality, sleep restlessness, slept throughout the night, ease of falling asleep). The questions are on a 5‐point scale and the 4 items are averaged for a final score out of 5 with a higher number indicating better subjective sleep quality. The item How much was your sleep disturbed by noise? on the Karolinska Sleep Log was used to assess the degree to which noise was a disruptor of sleep. This question was also on a 5‐point scale with higher scores indicating greater disruptiveness of noise. Patients were also asked how disruptive noise from roommates was on a nightly basis using this same scale.
Objective Data Collection
Wrist activity monitors (Actiwatch 2; Respironics, Inc., Murrysville, PA)[27, 28, 29, 30] were used to measure patient sleep. Actiware 5 software (Respironics, Inc.)[31] was used to estimate quantitative measures of sleep time and efficiency. Sleep time is defined as the total duration of time spent sleeping at night and sleep efficiency is defined as the fraction of time, reported as a percentage, spent sleeping by actigraphy out of the total time patients reported they were sleeping.
Sound levels in patient rooms were recorded using Larson Davis 720 Sound Level Monitors (Larson Davis, Inc., Provo, UT). These monitors store functional average sound pressure levels in A‐weighted decibels called the Leq over 1‐hour intervals. The Leq is the average sound level over the given time interval. Minimum (Lmin) and maximum (Lmax) sound levels are also stored. The LD SLM Utility Program (Larson Davis, Inc.) was used to extract the sound level measurements recorded by the monitors.
Demographic information (age, gender, race, ethnicity, highest level of education, length of stay in the hospital, and comorbidities) was obtained from hospital charts via an ongoing study of admitted patients at the University of Chicago Medical Center inpatient general medicine service.[18] Chart audits were performed to determine whether patients received pharmacologic sleep aids in the hospital.
Data Analysis
Descriptive statistics were used to summarize mean sleep duration and sleep efficiency in the hospital as well as SLOC and SSE. Because the SSE scores were not normally distributed, the scores were dichotomized at the median to create a variable denoting high and low SSE. Additionally, because the distribution of responses to the noise disruption question was skewed to the right, reports of noise disruptions were grouped into not disruptive (score=1) and disruptive (score>1).
Two‐sample t tests with equal variances were used to assess the relationship between perceived control measures (high/low SLOC, SSE) and objective sleep measures (sleep time, sleep efficiency). Multivariate linear regression was used to test the association between high SSE (independent variable) and sleep time (dependent variable), clustering for multiple nights of data within the subject. Multivariate logistic regression, also adjusting for subject, was used to test the association between high SSE and noise disruptiveness and the association between high SSE and Karolinska scores. Leq, Lmax, and Lmin were all tested using stepwise forward regression. Because our prior work[9] demonstrated that noise levels separated into tertiles were significantly associated with sleep time, our analysis also used noise levels separated into tertiles. Stepwise forward regression was used to add basic patient demographics (gender, race, age) to the models. Statistical significance was defined as P<0.05, and all statistical analysis was done using Stata 11.0 (StataCorp, College Station, TX).
RESULTS
From April 2010 to May 2012, 1134 patients were screened by study personnel for this study via an ongoing study of hospitalized patients on the inpatient general medicine ward. Of the 361 (31.8%) eligible patients, 206 (57.1%) consented to participate. Of the subjects enrolled in the study, 118 were able to complete at least 1 night of actigraphy, sound monitoring, and subjective assessment for a total of 185 patient nights (Figure 1).
The majority of patients were female (57%), African American (67%), and non‐Hispanic (97%). The mean age was 65 years (standard deviation [SD], 11.6 years), and the median length of stay was 4 days (interquartile range [IQR], 36). The majority of patients also had hypertension (67%), with chronic obstructive pulmonary disease [COPD] (31%) and congestive heart failure (31%) being the next most common comorbidities. About two‐thirds of subjects (64%) were characterized as average or above average sleepers with Epworth Sleepiness Scale scores 9[20] (Table 1). Only 5% of patients received pharmacological sleep aids.
| Value, n (%)a | |
|---|---|
| |
| Patient characteristics | |
| Age, mean (SD), y | 63 (12) |
| Length of stay, median (IQR), db | 4 (36) |
| Female | 67 (57) |
| African American | 79 (67) |
| Hispanic | 3 (3) |
| High school graduate | 92 (78) |
| Comorbidities | |
| Hypertension | 79 (66) |
| Chronic obstructive pulmonary disease | 37 (31) |
| Congestive heart failure | 37 (31) |
| Diabetes | 36 (30) |
| End stage renal disease | 23 (19) |
| Baseline sleep characteristics | |
| Sleep duration, mean (SD), minc | 333 (128) |
| Epworth Sleepiness Scale, score 9d | 73 (64) |
The mean baseline SLOC score was 30.4 (SD, 6.7), with a median of 31 (IQR, 2735). The mean baseline SSE score was 32.1 (SD, 9.4), with a median of 34 (IQR, 2441). Fifty‐four patients were categorized as having high sleep self‐efficacy (high SSE), which we defined as scoring above the median of 34.
Average in‐hospital sleep was 5.5 hours (333 minutes; SD, 128 minutes) which was significantly shorter than the self‐reported sleep duration of 6.5 hours prior to admission (387 minutes, SD, 125 minutes; P=0.0001). The mean sleep efficiency was 73% (SD, 19%) with 55% of actigraphy nights below the normal range of 80% efficiency for adults.[19] Median KSQI was 3.5 (IQR, 2.254.75), with 41% of the patients with a KSQI 3, putting them in the insomniac range.[32] The median score on the noise disruptiveness question was 1 (IQR, 14) with 42% of reports coded as disruptive defined as a score >1 on the 5‐point scale. The median score on the roommate disruptiveness question was 1 (IQR, 11) with 77% of responses coded as not disruptive defined as a score of 1 on the 5‐point scale.
A 2‐sample t test with equal variances showed that those patients reporting high SSE were more likely to sleep longer in the hospital than those reporting low SSE (364 minutes 95% confidence interval [CI]: 340, 388 vs 309 minutes 95% CI: 283, 336; P=0.003) (Figure 2). Patients with high SSE were also more likely to have a normal sleep efficiency (above 80%) compared to those with low SSE (54% 95% CI: 43, 65 vs 38% 95% CI: 28,47; P=0.028). Last, there was a trend toward patients reporting higher SSE to also report less noise disruption compared to those patients with low SSE ([42%] 95% CI: 31, 53 vs [56%] 95% CI: 46, 65; P=0.063) (Figure 3).
Linear regression clustered by subject showed that high SSE was associated with longer sleep duration (55 minutes 95% CI: 14, 97; P=0.010). Furthermore, high SSE was significantly associated with longer sleep duration after controlling for both objective noise level and patient demographics in the model using stepwise forward regression (50 minutes 95% CI: 11, 90; P=0.014) (Table 2).
| Sleep Duration (min) | Model 1 Beta [95% CI]a | Model 2 Beta [95% CI]a |
|---|---|---|
| ||
| High SSE | 55 [14, 97]b | 50 [11, 90]b |
| Lmin tert 3 | 14 [59, 29] | |
| Lmin tert 2 | 21 [65, 23] | |
| Female | 49 [10, 89]b | |
| African American | 16 [59, 27] | |
| Age | 1 [0.9, 3] | |
| Karolinska Sleep Quality | Model 1 OR [95% CI]c | Model 2 OR [95% CI]c |
| High SSE | 2.04 [1.12, 3.71]b | 2.01 [1.06, 3.79]b |
| Lmin tert 3 | 0.90 [0.37, 2.2] | |
| Lmin tert 2 | 0.86 [0.38, 1.94] | |
| Female | 1.78 [0.90, 3.52] | |
| African American | 1.19 [0.60, 2.38] | |
| Age | 1.02 [0.99, 1.05] | |
| Noise Complaints | Model 1 OR [95% CI]d | Model 2 OR [95% CI]d |
| High SSE | 0.57 [0.30, 1.12] | 0.49 [0.25, 0.96]b |
| Lmin tert 3 | 0.85 [0.39, 1.84] | |
| Lmin tert 2 | 0.91 [0.43, 1.93] | |
| Female | 1.40 [0.71, 2.78] | |
| African American | 0.35 [0.17, 0.70] | |
| Age | 1.00 [0.96, 1.03] | |
| Age2e | 1.00 [1.00, 1.00] | |
Logistic regression clustered by subject demonstrated that patients with high SSE had 2 times higher odds of having a KSQI score above 3 (95% CI: 1.12, 3.71; P=0.020). This association was still significant after controlling for noise and patient demographics (OR: 2.01; 95% CI: 1.06, 3.79; P=0.032). After controlling for noise levels and patient demographics, there was a statistically significant association between high SSE and lower odds of noise complaints (OR: 0.49; 95% CI: 0.25, 0.96; P=0.039) (Table 2). Although demographic characteristics were not associated with high SSE, those patients with high SSE had lower odds of being in the loudest tertile rooms (OR: 0.34; 95% CI: 0.15, 0.74; P=0.007).
In multivariate linear regression analyses, there were no significant relationships between SLOC scores and KSQI, reported noise disruptiveness, and markers of sleep (sleep duration or sleep efficiency).
DISCUSSION
This study is the first to examine the relationship between perceived control, noise levels, and objective measurements of sleep in a hospital setting. One measure of perceived control, namely SSE, was associated with objective sleep duration, subjective and objective sleep quality, noise levels in patient rooms, and perhaps also patient complaints of noise. These associations remained significant after controlling for objective noise levels and patient demographics, suggesting that SSE is independently related to sleep.
In contrast to SSE, SLOC was not found to be significantly associated with either subjective or objective measures of sleep quality. The lack of association may be due to the fact that the SLOC questionnaire does not translate as well to the inpatient setting as the SSE questionnaire. The SLOC questionnaire focuses on general beliefs about sleep whereas the SSE questionnaire focuses on personal beliefs about one's own ability sleep in the immediate future, which may make it more relevant in the inpatient setting (see Supporting Information, Appendix 1 and 2, in the online version of this article).
Given our findings, it is important to identify why patients with high SSE have better sleep and fewer noise complaints. One possibility is that sleep self‐efficacy is an inherited trait unique to each person that is also predictive of a patient's sleep patterns. However, is it also possible that those patients with high SSE feel more empowered to take control of their environment, allowing them to advocate for better sleep? This hypothesis is further strengthened by the finding that those patients with high SSE on study entry were less likely to be in the noisiest rooms. This raises the possibility that at least 1 of the mechanisms by which high SSE may be protective against sleep loss is through patients taking an active role in noise reduction, such as closing the door or advocating for their sleep with staff. However, we did not directly observe or ask patients whether doors of patient rooms were open or closed or whether the patients took other measures to advocate for their own sleep. Thus, further work is necessary to understand the mechanisms by which sleep self‐efficacy may influence sleep.
One potential avenue for future research is to explore possible interventions for boosting sleep self‐efficacy in the hospital. Although most interventions have focused on environmental noise and staff‐based education, empowering patients through boosting SSE may be a helpful adjunct to improving hospital sleep.[33, 34] Currently, the SSE scale is not commonly used in the inpatient setting. Motivational interviewing and patient coaching could be explored as potential tools for boosting SSE. Furthermore, even if SSE is not easily changed, measuring SSE in patients newly admitted to the hospital may be useful in identifying patients most susceptible to sleep disruptions. Efforts to identify patients with low SSE should go hand‐in‐hand with measures to reduce noise. Addressing both patient‐level and environmental factors simultaneously may be the best strategy for improving sleep in an inpatient hospital setting.
In contrast to our prior study, it is worth noting that we did not find any significant relationships between overall noise levels and sleep.[9] In this dataset, nighttime noise is still a predictor of sleep loss in the hospital. However, when we restrict our sample to those who answered the SSE questionnaire and had nighttime noise recorded, we lose a significant number of observations. Because of our interest in testing the relationship between SSE and sleep, we chose to control for overall noise (which enabled us to retain more observations). We also did not find any interactions between SSE and noise in our regression models. Further work is warranted with larger sample sizes to better understand the role of SSE in the context of sleep and noise levels. In addition, females also received more sleep than males in our study.
There are several limitations to this study. This study was carried out at a single service at a single institution, limiting the ability to generalize the findings to other hospital settings. This study had a relatively high rate of patients who were unable to complete at least 1 night of data collection (42%), often due to watch removal for imaging or procedures, which may also affect the representativeness of our sample. Moreover, we can only examine associations and not causal relationships. The SSE scale has never been used in hospitalized patients, making comparisons between scores from hospitalized patients and population controls difficult. In addition, the SSE scale also has not been dichotomized in previous studies into high and low SSE. However, a sensitivity analysis with raw SSE scores did not change the results of our study. It can be difficult to perform actigraphy measurements in the hospital because many patients spend most of their time in bed. Because we chose a relatively healthy cohort of patients without significant limitations in mobility, actigraphy could still be used to differentiate time spent awake from time spent sleeping. Because we did not perform polysomnography, we cannot explore the role of sleep architecture which is an important component of sleep quality. Although the use of pharmacologic sleep aids is a potential confounding factor, the rate of use was very low in our cohort and unlikely to significantly affect our results. Continued study of this patient population is warranted to further develop the findings.
In conclusion, patients with high SSE sleep better in the hospital, tend to be in quieter rooms, and may report fewer noise complaints. Our findings suggest that a greater confidence in the ability to sleep may be beneficial in hospitalized adults. In addition to noise control, hospitals should also consider targeting patients with low SSE when designing novel interventions to improve in‐hospital sleep.
Disclosures
This work was supported by funding from the National Institute on Aging through a Short‐Term Aging‐Related Research Program (1 T35 AG029795), National Institute on Aging career development award (K23AG033763), a midcareer career development award (1K24AG031326), a program project (P01AG‐11412), an Agency for Healthcare Research and Quality Centers for Education and Research on Therapeutics grant (1U18HS016967), and a National Institute on Aging Clinical Translational Sciences award (UL1 RR024999). Dr. Arora had full access to all of the data in the study and takes responsibility for the integrity of the data and the accuracy of the statistical analysis. The funding agencies had no role in the design of the study; the collection, analysis, and interpretation of the data; or the decision to approve publication of the finished manuscript. The authors report no conflicts of interest.
- , , , . The metabolic consequences of sleep deprivation. Sleep Med Rev. 2007;11(3):163–178.
- , , , , , . Poor self‐reported sleep quality predicts mortality within one year of inpatient post‐acute rehabilitation among older adults. Sleep. 2011;34(12):1715–1721.
- , , , et al. The sleep of older people in hospital and nursing homes. J Clin Nurs. 1999;8:360–368.
- , , et al. Sleep in hospitalized medical patients, part 1: factors affecting sleep. J Hosp Med. 2008; 3:473–482.
- , , , et al. Nocturnal care interactions with patients in critical care units. Am J Crit Care. 2004;13:102–112; quiz 114–115.
- , , . Patient perception of sleep quality and etiology of sleep disruption in the intensive care unit. Am J Respir Crit Care Med. 1999;159:1155–1162.
- . Sleep in acute care settings: an integrative review. J Nurs Scholarsh. 2000;32(1):31–38.
- , , , et al. Sleep disruption due to hospital noises: a prospective evaluation. Ann Int Med. 2012;157(3): 170–179.
- , , , et al. Noise and sleep among adult medical inpatients: far from a quiet night. Arch Intern Med. 2012;172:68–70.
- . Generalized expectancies for internal versus external control of reinforcement. Psychol Monogr. 1966;80:1–28.
- , . Psychosocial risk factors and mortality: a prospective study with special focus on social support, social participation, and locus of control in Norway. J Epidemiol Community Health. 1998;52:476–481.
- , . The interactive effect of perceived control and functional status on health and mortality among young‐old and old‐old adults. J Gerontol B Psychol Sci Soc Sci. 1997;52:P118–P126.
- , . Role‐specific feelings of control and mortality. Psychol Aging. 2000;15:617–626.
- , , . Patient empowerment in intensive care—an interview study. Intensive Crit Care Nurs. 2006;22:370–377.
- , , . Exploring the relationship between personal control and the hospital environment. J Clin Nurs. 2008;17:1601–1609.
- , , , et al. Effects of volitional lifestyle on sleep‐life habits in the aged. Psychiatry Clin Neurosci. 1998;52:183–184.
- , , , et al. Sleep locus of control: report on a new scale. Behav Sleep Med. 2004;2:79–93.
- , , , et al. Effects of physician experience on costs and outcomes on an academic general medicine service: results of a trial of hospitalists. Ann Intern Med. 2002;137:866–874.
- , , , et al. The effects of age, sex, ethnicity, and sleep‐disordered breathing on sleep architecture. Arch Intern Med. 2004;164:406–418.
- , , , et al. Validation of a telephone version of the mini‐mental state examination. J Am Geriatr Soc. 1992;40:697–702.
- , , , et al. Contact isolation in surgical patients: a barrier to care? Surgery. 2003;134:180–188.
- , . Adverse effects of contact isolation. Lancet. 1999;354:1177–1178.
- . Behavioral Treatment for Persistent Insomnia. Elmsford, NY: Pergamon Press; 1987.
- . A new method for measuring daytime sleepiness: the Epworth sleepiness scale. Sleep. 1991;14:540–545.
- . Reliability and factor analysis of the Epworth Sleepiness Scale. Sleep. 1992;15:376–381.
- , . Objective components of individual differences in subjective sleep quality. J Sleep Res. 1997;6:217–220.
- , , , et al. The role of actigraphy in the study of sleep and circadian rhythms. Sleep. 2003;26:342–392.
- , , , et al. Practice parameters for the use of actigraphy in the assessment of sleep and sleep disorders: an update for 2007. Sleep. 2007;30:519–529.
- , , , et al. The role of actigraphy in the evaluation of sleep disorders. Sleep. 1995;18:288–302.
- , , , et al. Clinical review: sleep measurement in critical care patients: research and clinical implications. Crit Care. 2007;11:226.
- , , , et al. Evaluation of immobility time for sleep latency in actigraphy. Sleep Med. 2009;10:621–625.
- , , , et al. The subjective meaning of sleep quality: a comparison of individuals with and without insomnia. Sleep. 2008;31:383–393.
- , , , et al. Sleep in hospitalized medical patients, part 2: behavioral and pharmacological management of sleep disturbances. J Hosp Med. 2009;4:50–59.
- , , , . A nonpharmacologic sleep protocol for hospitalized older patients. J Am Geriatr Soc. 1998;46(6):700–705.
Copyright © 2013 Society of Hospital Medicine
