User login
Erratum: Investing in the future: Building an academic hospitalist faculty development program
The disclosure statement for the following article, Investing in the Future: Building an Academic Hospitalist Faculty Development Program, by Niraj L. Sehgal, MD, MPH, Bradley A. Sharpe, MD, Andrew A. Auerbach, MD, MPH, Robert M. Wachter, MD, that published in Volume 6, Issue 3 pages 161166 of the Journal of Hospital Medicine, was incorrect. The correct disclosure statement is: All authors report no relevant conflicts of interest. The publisher regrets this error.
The disclosure statement for the following article, Investing in the Future: Building an Academic Hospitalist Faculty Development Program, by Niraj L. Sehgal, MD, MPH, Bradley A. Sharpe, MD, Andrew A. Auerbach, MD, MPH, Robert M. Wachter, MD, that published in Volume 6, Issue 3 pages 161166 of the Journal of Hospital Medicine, was incorrect. The correct disclosure statement is: All authors report no relevant conflicts of interest. The publisher regrets this error.
The disclosure statement for the following article, Investing in the Future: Building an Academic Hospitalist Faculty Development Program, by Niraj L. Sehgal, MD, MPH, Bradley A. Sharpe, MD, Andrew A. Auerbach, MD, MPH, Robert M. Wachter, MD, that published in Volume 6, Issue 3 pages 161166 of the Journal of Hospital Medicine, was incorrect. The correct disclosure statement is: All authors report no relevant conflicts of interest. The publisher regrets this error.
The Hospitalist Field Turns 15
Many people date the start of the hospitalist field to my 1996 New England Journal of Medicine article,1 which first introduced the concept to a broad audience. That makes 2011 the field's 15th year, andif you have kidsyou know this is a tough and exciting age. The cuteness of childhood has faded, and bad decisions can no longer be excused as youthful indiscretions.
That's an apt metaphor for our field as we celebrate our 15th birthday. We are now an established part of the health care landscape, with a clear place in the House of Medicine. All of the measures of a successful specialty are ours: a thriving professional society, high‐quality training programs, increasingly robust research, a flourishing journal, and more. The field has truly arrived.
But these successes are also tempered by several challenges that have become more evident in recent years. In this article, I'll reflect on some of these successes and challenges.
The Hospitalist Field's Successes and Growth
In our 1996 article, Goldman and I1 wrote about the forces promoting the hospitalist model:
It seems unlikelythat high value care can be delivered in the hospital by physicians who spend only a small fraction of their time in this setting. As hospital stays become shorter and inpatient care becomes more intensive, a greater premium will be placed on the skill, experience, and availability of physicians caring for inpatients.
When we cited the search for value as a driving force in 1996, we were a bit ahead of our time, since there was relatively little skin in this game at the time. Remember that when our field launched, none of these value‐promoting forces existed: robust unannounced hospital inspections by the Joint Commission, public reporting of quality data, pay for performance, no pay for errors, state reporting of sentinel events, and more. In other words, until recently, neither a hospital's income stream nor its reputation was threatened by poor performance.
But this landscape is undergoing a sea change. By 2015, fully 9% of a hospital's Medicare reimbursements will be at risk through a variety of initiatives, including value‐based purchasing and meaningful use standards. And private payers are beginning to replicate Medicare's standards, particularly when they perceive that they may lead to both improved quality and lower costs.
Hospitals and health systems increasingly recognize how indispensable hospitalists can be as they demonstrate that their presence improves value. But this is only one of the forces driving the fieldalready the fastest growing specialty in medical historyto even higher levels of growth. These others include: the exodus of primary care physicians from the hospital, the fact that the specialists have left the building, comanagement of nonmedical patients, new opportunities in systems leadership, and dealing with housestaff duty hours reductions. I'll say a word about each.
The Exodus of Primary Care Physicians
In the early days of our field, one of the major sources of pushback was the desire of many primary care doctors to continue managing their own inpatients. Beginning a decade ago, this pressure began to abate, as many primary care physicians began to recognize the potential advantages of working with hospitalists.2
Over the next several years, I predict that the growth in the patient‐centered medical home model3with the physician's new responsibilities to provide comprehensive patient‐centered carewill make it even less likely that primary care doctors will have the time to manage their own inpatients. Luckily, information systems now being installed throughout the country (fueled by federal subsidies) will lead to unprecedented connectivity between the inpatient and outpatient worlds,4 hopefully resulting in improving handoffs.
Moreover, the increasing scrutiny of, and upcoming penalties for, high readmission rates are driving hospitals and clinics into creating more robust systems of care to improve inpatientoutpatient communications. The bottom line is that the main Achilles heel of hospitalist systemsthe handoff at hospital admission and dischargeshould improve over the next few years, making it easier than ever for primary care doctors to forego hospital care without losing track of critical patient information.
The Specialists Have Left the Building
One of the more interesting phenomena in the recent history of the hospitalist field is the growth of what I call hyphenated hospitalists: neurology hospitalists, ob‐gyn hospitalists, surgical hospitalists, and the like. The forces promoting these models are similar to those that catalyzed the hospitalist model: the recognition that bifurcating inpatient and outpatient care sometimes makes sense when several conditions are met (Table 1).
|
| 1) Is the number of inpatients who require the services of that specialty (either for consults or principal care) large enough to justify having at least one doctor in the house during daytime? |
| 2) Is the specialist frequently needed to see an inpatient urgently? |
| 3) Under the usual model of mixed inpatient and outpatient care, is the specialist frequently busy in the office, operating room, or procedural suite at times where they are urgently needed in the hospital (see #2)? |
| 4) Has the field become sub‐sub specialized, such that many covering physicians are now uncomfortable managing common acute inpatient problems (i.e., the headache neurologist asked to handle an acute stroke)? |
The emergence of hyphenated hospitalists raises all sorts of questions for the hospitalist field, many of which I have addressed elsewhere.5 But the bottom line is that the growth of specialty hospitalists may help create a new hospital home teama group of dedicated inpatient physicians spanning virtually every specialty who share best practices, work together on systems improvements, and operate under similar accountabilities. This development may well be the most exciting one in the field's recent history.
Comanagement of Nonmedical Patients
The same forces that led to the emergence of the hospitalist field are also catalyzing the growth of hospitalist comanagement programs. There is a shortage of general surgeons, and in teaching hospitals, there are fewer surgical residents available to help provide floor‐based pre‐ and post‐operative care. And surgical patients are under the same value pressures as medical patients, with increasing public reporting of quality processes and outcomes and new pay for performance programs coming on line. Although the evidence of benefit is mixed,68 many hospitalists are finding that increasing parts of their work involve comanagement.
Comanagement raises several issues, all of which need to be addressed. How do we define clear boundaries between what the hospitalist does and what the specialist does? Comanagement programs, to be effective, need very clear rules of engagement and open lines of communication to work through inevitable conflicts.6 How does the money flow? Most hospitalist programs receive hospital support, but it is legitimate to wonder whether the specialists, particularly surgeons, should chip in to support the program, particularly if they continue to collect a global case rate that was predicated on their provision of pre‐ and post‐operative care. How do comanagement programs and specialty hospitalist programs interrelate, and what are the relative advantages and disadvantages of each? To my mind, programs that meet the conditions outlined in Table 1 probably would do well to start a specialty hospitalist program, assuming that they can find high‐quality specialists to staff it. But there will be myriad variations on these themes. In my hospital, for example, we have both neurohospitalists and medical hospitalists who co‐manage neurosurgery patients.
New Opportunities in Systems Leadership
The growth of the hospitalist field will partly come from individuals who begin their careers performing clinical work, but who transition over time to managerial and leadership roles. This is a natural transition: Who better than a hospitalist to help organize and deliver educational programs, manage clinical operations, implement information technology systems, or lead quality, safety, or utilization management efforts? Of course, as hospitalists assume these roles, others need to take their places covering their clinical shifts.
This might seem like a relatively unimportant driver of personnel growth, but in more advanced systems, it can become a major one. Table 2 lists the faculty in my Division of Hospital Medicine at the University of California, San Francisco (UCSF) who have major institutional (i.e., nondivisional) roles. These roles, spread across eight faculty, account for 3.7 full‐time equivalents (FTEs).
| Role | Works for Whom? | Approximate % FTE |
|---|---|---|
| ||
| Associate Chief Medical Officer | Medical Center | 80% |
| Associate Medical Director for Information Technology | Medical Center | 80% |
| Associate Chair for Quality and Safety | Department of Medicine | 50% |
| Director of Quality and Patient Safety | Department of Neurosurgery | 50% |
| Associate Medicine Residency Director (two people) | Department of Medicine | 30% (for each) |
| Director of Medical Student Clerkships | Department of Medicine | 25% |
| Director of Patient Safety/Quality Programs | Office of Graduate Medical Education, School of Medicine | 25% |
| Total FTEs: 3.7 | ||
Dealing with New ACGME Regulations
In 2003, the Accreditation Council for Graduate Medical Education (ACGME) issued its first housestaff duty hours reductions (limiting housestaff to a maximum of 80 hours per week, with no single shift lasting longer than 30 hours). This reduction led to the development of nonteaching services in most teaching hospitals; the vast majority of such programs have hospitalists at their core.
In July 2011, new ACGME regulations go into effect,10 which will further cut the availability of housestaff to cover clinical services. Although the 80‐hour weekly limit remains, intern shifts are now limited to 16 hours, meaning that the traditional long call system involving interns must be replaced by a shift‐based system. Like the earlier changes, these new regulations are leading to additional hospitalist growth in the nation's teaching hospitals. By the time the changes are fully implemented, many hospitalist programs will have half or more of their hospitalist FTEs devoted to covering patients previously cared for by residents.
Challenges for Hospitalist Programs
These powerful forces promoting the growth in the hospitalist field continue to ensure that hospitalists are in high demand. As a practical matter, this has resulted in increasing salaries and improved job conditions for hospitalists.
But this growth brings many challenges. Many hospitalist programs are poorly managed, often because the leaders lack the training and experience to effectively run such a rapidly growing and complex enterprise. One manifestation of these leadership challenges is that schedules are often created around the convenience and desires of the physicians rather than the needs of the patients. For example, the increasingly prevalent seven‐days‐on, seven‐days‐off schedule often leads to burnout and a feeling by the hospitalists that they are working too hard. Yet many groups are unwilling to consider modifications to the schedule that might decrease the intensity, if the cost is fewer days off.
On the other hand, some groups pay little attention to patient continuity in constructing their schedules. I know of programs that schedule their hospitalists in 24‐hour shifts (followed by a few days off), which means that admitted patients will see a different hospitalist every day. I see this as highly problematic, particularly because the most common complaint I hear from patients about hospitalist programs is that I saw a different doctor every day.
Many of the field's challenges stem from hospitalists' near‐total dependency on hospital funding to create sustainable job descriptions.11 While I continue to believe that this bit of financial happenstance has been good for both hospitalists and hospitalssince it has driven uncommon degrees of interdependency and alignmentit does mean that a difficult budget battle is virtually assured every year. As hospital finances become tighter, one can expect these battles to grow even more heated. Speaking for hospitalists, I am not too worried about the outcomes of these battles, since hospitalists provide a mission‐critical service at a fair price, there are no viable lower‐priced replacements (expect perhaps for nonphysician providers such as nurse practitioners for the less‐complex patients), and hospitalists are extraordinarily mobilethere are virtually no barriers for a hospitalist, or an entire group, to transfer to another institution. Nevertheless, it seems inevitable that these battles will leave scars, scars that may ultimately compromise the crucial collaboration that both hospitalists and hospitals depend on.
The Bottom Line
Even at age 15, an age at which many adolescents are irredeemably cynical, the hospitalist field retains much of its sense of limitless possibility and exuberance. This is not because things are perfectthey are not. Some hospitalist jobs are poorly constructed, some groups have poor leadership, some hospitalists are burning out, there are examples of spotty quality and collaboration, and hospitalists continue to have to work to earn the respect of colleagues and patients that other specialists take for granted.
That said, the field of hospital medicine remains uniquely exciting, in part because it is so tightly linked to the broader changes in the health care policy landscape. Many other specialties see the profound changes underway in health care as an existential threat to their professional values and incomes. Hospitalists, on the other hand, see these changes as raising the pressure on hospitals to deliver the highest quality, most satisfying, and safest care at the lowest cost. Framed this way, forward‐thinking hospitalists quite naturally see these changes as yet another catalyst for the growth and indispensability of their field.
- ,.The emerging role of “hospitalists” in the American health care system.N Engl J Med.1996;335:514–517.
- ,,,.How physicians perceive hospitalist services after implementation: Anticipation vs reality.Arch Intern Med.2003;163:2330–2336.
- ,,.Medical homes: Challenges in translating theory into practice.Med Care.2009;47:714–722.
- ,.Improving safety with information technology.N Engl J Med.2003;348:2526–2534.
- The New Home Team: The Remarkable Rise of the Hyphenated Hospitalist. Wachter's World blog, January 16,2011. Available at: http://tinyurl. com/4h2jy7e. Accessed February 12, 2011.
- ,,, et al.Comanagement of surgical patients between neurosurgeons and hospitalists.Arch Intern Med.2010;170:2004–2010.
- ,,, et al.Medical and surgical comanagement after elective hip and knee arthroplasty: A randomized, controlled trial.Ann Intern Med.2004;141:28–38.
- ,,,,.Comanagement of hospitalized surgical patients by medicine physicians in the United States.Arch Intern Med.2010;170:363–368.
- ,,.Neurohospitalists: An emerging model for inpatient neurological care.Ann Neurol.2008;63:135–140.
- ,,;ACGME Duty Hour Task Force. The new recommendations on duty hours from the ACGME Task Force.N Engl J Med.2010 Jul 8;363(2):e3. Epub 2010 Jun 23. PubMed PMID: 20573917. The website is here: http://www.nejm.org/doi/full/10.1056/NEJMsb1005800.
- .Elevated expectations.The Hospitalist. January2011. Available at: http://www.the‐hospitalist.org/details/article/972781/Elevated_Expectations.html. Accessed February 12, 2011.
Many people date the start of the hospitalist field to my 1996 New England Journal of Medicine article,1 which first introduced the concept to a broad audience. That makes 2011 the field's 15th year, andif you have kidsyou know this is a tough and exciting age. The cuteness of childhood has faded, and bad decisions can no longer be excused as youthful indiscretions.
That's an apt metaphor for our field as we celebrate our 15th birthday. We are now an established part of the health care landscape, with a clear place in the House of Medicine. All of the measures of a successful specialty are ours: a thriving professional society, high‐quality training programs, increasingly robust research, a flourishing journal, and more. The field has truly arrived.
But these successes are also tempered by several challenges that have become more evident in recent years. In this article, I'll reflect on some of these successes and challenges.
The Hospitalist Field's Successes and Growth
In our 1996 article, Goldman and I1 wrote about the forces promoting the hospitalist model:
It seems unlikelythat high value care can be delivered in the hospital by physicians who spend only a small fraction of their time in this setting. As hospital stays become shorter and inpatient care becomes more intensive, a greater premium will be placed on the skill, experience, and availability of physicians caring for inpatients.
When we cited the search for value as a driving force in 1996, we were a bit ahead of our time, since there was relatively little skin in this game at the time. Remember that when our field launched, none of these value‐promoting forces existed: robust unannounced hospital inspections by the Joint Commission, public reporting of quality data, pay for performance, no pay for errors, state reporting of sentinel events, and more. In other words, until recently, neither a hospital's income stream nor its reputation was threatened by poor performance.
But this landscape is undergoing a sea change. By 2015, fully 9% of a hospital's Medicare reimbursements will be at risk through a variety of initiatives, including value‐based purchasing and meaningful use standards. And private payers are beginning to replicate Medicare's standards, particularly when they perceive that they may lead to both improved quality and lower costs.
Hospitals and health systems increasingly recognize how indispensable hospitalists can be as they demonstrate that their presence improves value. But this is only one of the forces driving the fieldalready the fastest growing specialty in medical historyto even higher levels of growth. These others include: the exodus of primary care physicians from the hospital, the fact that the specialists have left the building, comanagement of nonmedical patients, new opportunities in systems leadership, and dealing with housestaff duty hours reductions. I'll say a word about each.
The Exodus of Primary Care Physicians
In the early days of our field, one of the major sources of pushback was the desire of many primary care doctors to continue managing their own inpatients. Beginning a decade ago, this pressure began to abate, as many primary care physicians began to recognize the potential advantages of working with hospitalists.2
Over the next several years, I predict that the growth in the patient‐centered medical home model3with the physician's new responsibilities to provide comprehensive patient‐centered carewill make it even less likely that primary care doctors will have the time to manage their own inpatients. Luckily, information systems now being installed throughout the country (fueled by federal subsidies) will lead to unprecedented connectivity between the inpatient and outpatient worlds,4 hopefully resulting in improving handoffs.
Moreover, the increasing scrutiny of, and upcoming penalties for, high readmission rates are driving hospitals and clinics into creating more robust systems of care to improve inpatientoutpatient communications. The bottom line is that the main Achilles heel of hospitalist systemsthe handoff at hospital admission and dischargeshould improve over the next few years, making it easier than ever for primary care doctors to forego hospital care without losing track of critical patient information.
The Specialists Have Left the Building
One of the more interesting phenomena in the recent history of the hospitalist field is the growth of what I call hyphenated hospitalists: neurology hospitalists, ob‐gyn hospitalists, surgical hospitalists, and the like. The forces promoting these models are similar to those that catalyzed the hospitalist model: the recognition that bifurcating inpatient and outpatient care sometimes makes sense when several conditions are met (Table 1).
|
| 1) Is the number of inpatients who require the services of that specialty (either for consults or principal care) large enough to justify having at least one doctor in the house during daytime? |
| 2) Is the specialist frequently needed to see an inpatient urgently? |
| 3) Under the usual model of mixed inpatient and outpatient care, is the specialist frequently busy in the office, operating room, or procedural suite at times where they are urgently needed in the hospital (see #2)? |
| 4) Has the field become sub‐sub specialized, such that many covering physicians are now uncomfortable managing common acute inpatient problems (i.e., the headache neurologist asked to handle an acute stroke)? |
The emergence of hyphenated hospitalists raises all sorts of questions for the hospitalist field, many of which I have addressed elsewhere.5 But the bottom line is that the growth of specialty hospitalists may help create a new hospital home teama group of dedicated inpatient physicians spanning virtually every specialty who share best practices, work together on systems improvements, and operate under similar accountabilities. This development may well be the most exciting one in the field's recent history.
Comanagement of Nonmedical Patients
The same forces that led to the emergence of the hospitalist field are also catalyzing the growth of hospitalist comanagement programs. There is a shortage of general surgeons, and in teaching hospitals, there are fewer surgical residents available to help provide floor‐based pre‐ and post‐operative care. And surgical patients are under the same value pressures as medical patients, with increasing public reporting of quality processes and outcomes and new pay for performance programs coming on line. Although the evidence of benefit is mixed,68 many hospitalists are finding that increasing parts of their work involve comanagement.
Comanagement raises several issues, all of which need to be addressed. How do we define clear boundaries between what the hospitalist does and what the specialist does? Comanagement programs, to be effective, need very clear rules of engagement and open lines of communication to work through inevitable conflicts.6 How does the money flow? Most hospitalist programs receive hospital support, but it is legitimate to wonder whether the specialists, particularly surgeons, should chip in to support the program, particularly if they continue to collect a global case rate that was predicated on their provision of pre‐ and post‐operative care. How do comanagement programs and specialty hospitalist programs interrelate, and what are the relative advantages and disadvantages of each? To my mind, programs that meet the conditions outlined in Table 1 probably would do well to start a specialty hospitalist program, assuming that they can find high‐quality specialists to staff it. But there will be myriad variations on these themes. In my hospital, for example, we have both neurohospitalists and medical hospitalists who co‐manage neurosurgery patients.
New Opportunities in Systems Leadership
The growth of the hospitalist field will partly come from individuals who begin their careers performing clinical work, but who transition over time to managerial and leadership roles. This is a natural transition: Who better than a hospitalist to help organize and deliver educational programs, manage clinical operations, implement information technology systems, or lead quality, safety, or utilization management efforts? Of course, as hospitalists assume these roles, others need to take their places covering their clinical shifts.
This might seem like a relatively unimportant driver of personnel growth, but in more advanced systems, it can become a major one. Table 2 lists the faculty in my Division of Hospital Medicine at the University of California, San Francisco (UCSF) who have major institutional (i.e., nondivisional) roles. These roles, spread across eight faculty, account for 3.7 full‐time equivalents (FTEs).
| Role | Works for Whom? | Approximate % FTE |
|---|---|---|
| ||
| Associate Chief Medical Officer | Medical Center | 80% |
| Associate Medical Director for Information Technology | Medical Center | 80% |
| Associate Chair for Quality and Safety | Department of Medicine | 50% |
| Director of Quality and Patient Safety | Department of Neurosurgery | 50% |
| Associate Medicine Residency Director (two people) | Department of Medicine | 30% (for each) |
| Director of Medical Student Clerkships | Department of Medicine | 25% |
| Director of Patient Safety/Quality Programs | Office of Graduate Medical Education, School of Medicine | 25% |
| Total FTEs: 3.7 | ||
Dealing with New ACGME Regulations
In 2003, the Accreditation Council for Graduate Medical Education (ACGME) issued its first housestaff duty hours reductions (limiting housestaff to a maximum of 80 hours per week, with no single shift lasting longer than 30 hours). This reduction led to the development of nonteaching services in most teaching hospitals; the vast majority of such programs have hospitalists at their core.
In July 2011, new ACGME regulations go into effect,10 which will further cut the availability of housestaff to cover clinical services. Although the 80‐hour weekly limit remains, intern shifts are now limited to 16 hours, meaning that the traditional long call system involving interns must be replaced by a shift‐based system. Like the earlier changes, these new regulations are leading to additional hospitalist growth in the nation's teaching hospitals. By the time the changes are fully implemented, many hospitalist programs will have half or more of their hospitalist FTEs devoted to covering patients previously cared for by residents.
Challenges for Hospitalist Programs
These powerful forces promoting the growth in the hospitalist field continue to ensure that hospitalists are in high demand. As a practical matter, this has resulted in increasing salaries and improved job conditions for hospitalists.
But this growth brings many challenges. Many hospitalist programs are poorly managed, often because the leaders lack the training and experience to effectively run such a rapidly growing and complex enterprise. One manifestation of these leadership challenges is that schedules are often created around the convenience and desires of the physicians rather than the needs of the patients. For example, the increasingly prevalent seven‐days‐on, seven‐days‐off schedule often leads to burnout and a feeling by the hospitalists that they are working too hard. Yet many groups are unwilling to consider modifications to the schedule that might decrease the intensity, if the cost is fewer days off.
On the other hand, some groups pay little attention to patient continuity in constructing their schedules. I know of programs that schedule their hospitalists in 24‐hour shifts (followed by a few days off), which means that admitted patients will see a different hospitalist every day. I see this as highly problematic, particularly because the most common complaint I hear from patients about hospitalist programs is that I saw a different doctor every day.
Many of the field's challenges stem from hospitalists' near‐total dependency on hospital funding to create sustainable job descriptions.11 While I continue to believe that this bit of financial happenstance has been good for both hospitalists and hospitalssince it has driven uncommon degrees of interdependency and alignmentit does mean that a difficult budget battle is virtually assured every year. As hospital finances become tighter, one can expect these battles to grow even more heated. Speaking for hospitalists, I am not too worried about the outcomes of these battles, since hospitalists provide a mission‐critical service at a fair price, there are no viable lower‐priced replacements (expect perhaps for nonphysician providers such as nurse practitioners for the less‐complex patients), and hospitalists are extraordinarily mobilethere are virtually no barriers for a hospitalist, or an entire group, to transfer to another institution. Nevertheless, it seems inevitable that these battles will leave scars, scars that may ultimately compromise the crucial collaboration that both hospitalists and hospitals depend on.
The Bottom Line
Even at age 15, an age at which many adolescents are irredeemably cynical, the hospitalist field retains much of its sense of limitless possibility and exuberance. This is not because things are perfectthey are not. Some hospitalist jobs are poorly constructed, some groups have poor leadership, some hospitalists are burning out, there are examples of spotty quality and collaboration, and hospitalists continue to have to work to earn the respect of colleagues and patients that other specialists take for granted.
That said, the field of hospital medicine remains uniquely exciting, in part because it is so tightly linked to the broader changes in the health care policy landscape. Many other specialties see the profound changes underway in health care as an existential threat to their professional values and incomes. Hospitalists, on the other hand, see these changes as raising the pressure on hospitals to deliver the highest quality, most satisfying, and safest care at the lowest cost. Framed this way, forward‐thinking hospitalists quite naturally see these changes as yet another catalyst for the growth and indispensability of their field.
- ,.The emerging role of “hospitalists” in the American health care system.N Engl J Med.1996;335:514–517.
- ,,,.How physicians perceive hospitalist services after implementation: Anticipation vs reality.Arch Intern Med.2003;163:2330–2336.
- ,,.Medical homes: Challenges in translating theory into practice.Med Care.2009;47:714–722.
- ,.Improving safety with information technology.N Engl J Med.2003;348:2526–2534.
- The New Home Team: The Remarkable Rise of the Hyphenated Hospitalist. Wachter's World blog, January 16,2011. Available at: http://tinyurl. com/4h2jy7e. Accessed February 12, 2011.
- ,,, et al.Comanagement of surgical patients between neurosurgeons and hospitalists.Arch Intern Med.2010;170:2004–2010.
- ,,, et al.Medical and surgical comanagement after elective hip and knee arthroplasty: A randomized, controlled trial.Ann Intern Med.2004;141:28–38.
- ,,,,.Comanagement of hospitalized surgical patients by medicine physicians in the United States.Arch Intern Med.2010;170:363–368.
- ,,.Neurohospitalists: An emerging model for inpatient neurological care.Ann Neurol.2008;63:135–140.
- ,,;ACGME Duty Hour Task Force. The new recommendations on duty hours from the ACGME Task Force.N Engl J Med.2010 Jul 8;363(2):e3. Epub 2010 Jun 23. PubMed PMID: 20573917. The website is here: http://www.nejm.org/doi/full/10.1056/NEJMsb1005800.
- .Elevated expectations.The Hospitalist. January2011. Available at: http://www.the‐hospitalist.org/details/article/972781/Elevated_Expectations.html. Accessed February 12, 2011.
Nonprocedural “Time Out”
Communication and teamwork failures are the most frequently cited cause of adverse events.1, 2 Strategies to improve communication have focused on implementing formal teamwork training programs and/or teaching specific communication skills.36 For instance, many institutions have adopted SBAR (Situation‐Background‐Assessment‐Recommendation) as a method for providers to deliver critical clinical information in a structured format.7 SBAR focuses on the immediate and urgent event at hand and can occur between any 2 providers. The situation is a brief description of the event (eg, Hi Dr. Smith, this is Paul from 14‐Long, I'm calling about Mrs. Jones in 1427 who is in acute respiratory distress). The background describes details relevant to the situation (eg, She was admitted with a COPD exacerbation yesterday night, and, for the past couple hours, she appears in more distress. Her vital signs are). The assessment (eg, Her breath sounds are diminished and she's moving less air) and recommendation (eg, I'd like to call respiratory therapy and would like you to come assess her now) drive toward having an action defined at the end. Given the professional silos that exist in healthcare, the advent of a shared set of communication tools helps bridge existing gaps in training, experience, and teamwork between different providers.
Regulatory agencies have been heavily invested in attempts to standardize communication in healthcare settings. In 2003, the Joint Commission elevated the concerns for wrong‐site surgery by making its prevention a National Patient Safety Goal, and the following year required compliance with a Universal Protocol (UP).8 In addition to adequate preoperative identification of the patient and marking of their surgical site, the UP called for a time out (TO) just prior to the surgery or procedure. The UP states that a TO requires active communication among all members of the surgical/procedure team, consistently initiated by a designated member of the team, conducted in a fail‐safe mode, so that the planned procedure is not started if a member of the team has concerns.8 Simply, the TO provides an opportunity to clarify plans for care and discuss events anticipated during the procedure among all members of the team (eg, surgeons, anesthesiologists, nurses, technicians). This all‐important pause point ensures that each team member is on the same page.
Whereas a TO involves many high‐risk procedural settings, a significant proportion of hospital care occurs outside of procedures. Patients are often evaluated in an emergency department, admitted to a medical/surgical ward, treated without the need for a procedure, and ultimately discharged home or transferred to another healthcare facility (eg, skilled nursing or acute rehabilitation). In this paper, we introduce the concept of Critical Conversations, a form of nonprocedural time out, as a tool, intervention, and policy that promotes communication and teamwork at the most vulnerable junctures in a patient's hospitalization.
Rationale for Critical Conversations: a Case Scenario
An 82‐year‐old man with hypertension and chronic obstructive pulmonary disease (COPD) is admitted to the hospital with community‐acquired pneumonia and an exacerbation of his COPD. The admitting physician evaluates the patient in the emergency department and completes admission orders. The patient arrives on the medical/surgical unit and the unit clerk processes the orders, stimulating a cascade of downstream events for different providers.
Nurse
The nurse reviews the medication list, notices antibiotics and bronchodilators, and wonders why aren't we administering steroids for his COPD? Do any of these medications need to be given now? Is there anything the physician is worried about? What specific things should prompt me to call the physician with an update or change in condition? I'm not sure if it's safe to send the patient down for the ordered radiographic study because he still looks pretty short of breath. I hate paging the physician several times to get these questions answered because I know that person is busy as well. I also know the patient will have questions about the care plans, which I won't be able to answer. I wonder if I should finish administering evening medications for my other patients as I'm running behind schedule on my other tasks.
Respiratory therapist
At the same time, the respiratory therapist (RT) is contacted to assist with nebulizer therapy for the patient. In reviewing the order for bronchodilators, the RT silently asks, do we think he is going to need continuous nebulizers? What is our oxygen saturation goaldo we want him at 90% or above 95%? I wonder if this patient has a history of CO2 retention and if I should have a BiPAP machine at the bedside.
Physician
After completing the orders for the patient, the physician remains in the emergency department to admit a different patient with a gastrointestinal bleed. This is the fifth admission in the past few hours. The physician feels the impact of constant paging interruptions. A unit clerk pages asking for clarification about a radiographic study that was ordered. A bedside nurse pages and asks if the physician can come and speak to the family about the diagnosis and treatment plans for an earlier admission (something the nurse is not clear about, either). A second bedside nurse pages, stating a different admission is still tachycardic after 3 liters of intravenous fluids and wants to know whether the fluids should be continued. Finally, the bedside nurse pages about whether the new COPD admission can go off the floor for the ordered chest CT or remain on continuous pulse oximetry because of shortness of breath.
Our case scenario is representative of most non‐surgical admissions to a hospital. The hypothetical questions posed from different provider perspectives are also common and often remain unanswered in a timely fashion. Partly because there is no site to mark and no anesthesia to deliver, the clinical encounter escapes attention as an opportunity for error prevention. In our experience, there are specific times during a hospitalization when communication failures are most likely to compromise patient care: the time of admission, the time of discharge,9 and any time when a patient's clinical condition changes acutely. Whereas handoff communications focus on transitions between providers (eg, shift changes), these circumstances are driven by patient transitions. Indirect communications, such as phone, email, or faxes, are suboptimal forms of communication at such times.10 We believe that there should be an expectation for direct communication at these junctures, and we define these direct communications as Critical Conversations.
Description of a Critical Conversation
In the hours that follow an admission, providers (and often the patients or their family as well) invariably exchange any number of inefficient calls or pages to clarify care plans, discuss a suspected diagnosis, anticipate concerns in the first night, and/or highlight which orders should be prioritized, such as medications or diagnostic studies. A Critical Conversation at time of admission does in this circumstance exactly what a TO attempts to provide before a procedure foster communication and teamwork as a patient is about to be placed at risk for adverse events. The exchange involves discussion of the following:
Admitting diagnosis
Immediate treatment plan
Medications ordered (particularly those new to a patient to anticipate an adverse event)
Priority for completing any admitting orders
Guidelines for physician notification when a change in patient condition occurs.
At the other end of a hospitalization, with the known complications arising from a patient's discharge,11, 12 the same process is needed. Rather than having each discipline focus on an individual role or task in getting a patient safely discharged, Critical Conversations allow the entire team, including the patient,13 to ensure that concerns have been addressed. This might help clarify simple measures around follow‐up appointments, whom to call with questions after discharge, or symptoms to watch for that may warrant a repeat evaluation. Nurses anecdotally lament that they first learn about a planned discharge only when the discharge order is written in the chart or if a patient informs them. Both scenarios reflect poorly on the teamwork required to assure patients we're working together, and that key providers are on the same page with respect to discharge planning. The exchange at discharge involves discussion of these elements:
Discharge diagnosis
Follow‐up plans
Need for education/training prior to discharge
Necessary paperwork completed
Anticipated time of discharge.
Finally, where many patients are admitted to a hospital, improve, and then return home, others develop acute changes during their hospitalization. For example, the patient in our case scenario could develop respiratory failure and require transfer to the intensive care unit (ICU). Or a different patient might have an acute change in mental status, a new fever, a new abnormal vital sign (eg, tachycardia or hypoxia), or an acute change re existing abdominal painall of which may require a battery of diagnostic tests. These circumstances define the third time for a Critical Conversation: a change in clinical condition. Such situations often require a change in the care plan, a change in priorities for delivering care at that time (for the patient in need and for other patients being cared for by the same nurse and physician), a need for additional resources (eg, respiratory therapist, phlebotomist, pharmacist), and, ultimately, a well‐orchestrated team effort to make it all happen. The specific item prompting the Critical Conversation may impact the nature of the exchange, which involves discussion of these components:
Suspected diagnosis
Immediate treatment plan
Medications ordered (particularly those new to a patient to anticipate an adverse event)
Priority for completing any new orders
Guidelines for physician notification when a change in patient condition occurs.
In addition to the above checklist for each Critical Conversation, each exchange should also address two open‐ended questions: 1) what do you anticipate happening in the next 24 hours, and 2) what questions might the patient/family have?
One may ask, and we did, why not have a direct communication daily between a physician and a bedside nurse on each patient? Most physicians and nurses know the importance of direct communication, but there are also times when each is prioritizing work in competing fashions. Adopting Critical Conversations isn't meant to deter from communications that are vital to patient care; rather, it is intended to codify distinct times when a direct communication is required for patient safety.
Lessons Learned
Table 1 provides an example of a Critical Conversation using the sample case scenario. Table 2 lists the most frequent outcomes that resulted from providers engaging in Critical Conversations. These were captured from discussions with bedside nurses and internal medicine residents on our primary medical unit. Both tables highlight how these deliberate and direct communications can create a shared understanding of the patient's medical problems, can help prioritize what tasks should take place (eg, radiology study, medication administration, calling another provider), can improve communication between providers and patients, and potentially accomplish all of these goals in a more efficient manner.
| Physician: Hi Nurse X, I'm Dr. Y, and I just wrote admission orders for Mr. Z whom, I understand, you'll be admitting. He's 82 with a history of COPD and is having an exacerbation related to a community‐acquired pneumonia. He looks comfortable right now as he's received his first dose of antibiotics, a liter of IVF, and 2 nebulizer treatments with some relief of his dyspnea. The main thing he needs up on the floor right now is to have respiratory therapy evaluate him. He's apparently been intubated before for his COPD, so I'd like to have them on board early and consider placing a BiPAP machine at the bedside for the next few hours. I don't anticipate an acute worsening of his condition given his initial improvements in the ED, but you should call me with any change in his condition. I haven't met the family yet because they were not at the bedside, but please convey the plans to them as well. I'll be up later to talk to them directly. Do you have any questions for me right now? |
| Nurse: I'll call the respiratory therapist right now and we'll make sure to contact you with any changes in his respiratory status. It looks like a chest CT was ordered, but not completed yet. Would you like him to go down for it off monitor? |
| Physician: Actually, let's watch him for a few hours to make sure he's continuing to improve. I initially ordered the chest CT to exclude a pulmonary embolus, but his history, exam, and chest x‐ray seem consistent with pneumonia. Let's reassess in a few hours. |
| Nurse: Sounds good. I'll text‐message you a set of his vital signs in 3‐4 hours to give you an update on his respiratory status. |
| General Themes | Specific Examples |
|---|---|
| Clarity on plan of care | Clear understanding of action steps at critical junctures of hospitalization |
| Goals of admission discussed rather than gleaned from chart or less direct modes of communication | |
| Discharge planning more proactive with better anticipation of timing among patients and providers | |
| Expectation for shared understanding of care plans | |
| Assistance with prioritization of tasks (as well as for competing tasks) | Allows RNs to prioritize tasks for new admissions or planned discharges, to determine whether these tasks outweigh tasks for other patients, and to provide early planning when additional resources will be required |
| Allows MDs to prioritize communications to ensure critical orders receive attention, to obtain support for care plans that require multiple disciplines, and to confirm that intended care plans are implemented with shared sense of priority | |
| Ability to communicate plans to patient and family members | Improved consistency in information provided to patients at critical hospital junctures |
| Increased engagement of patients in understanding their care plans | |
| Better model for teamwork curative for patients when providers on the same page with communication | |
| More efficient and effective use of resources | Fewer pages between admitting RN and MD with time saved from paging and waiting for responses |
| Less time trying to interpret plans of care from chart and other less direct modes of communication | |
| Improved sharing and knowledge of information with less duplication of gathering from patients and among providers | |
| Improved teamwork | Fosters a culture for direct communication and opens lines for questioning and speaking up when care plans are not clear |
Making Critical Conversations Happen
Integrating Critical Conversations into practice requires both buy‐in among providers and a plan for monitoring the interactions. We recommend beginning with educational efforts (eg, at a physician or nurse staff meeting) and reinforcing them with visual cues, such as posters on the unit (Figure 1). These actions promote awareness and generate expectations that this new clinical policy is being supported by clinical and hospital leadership. Our experiences have demonstrated tremendous learning, including numerous anecdotes about the value of Critical Conversations (Table 3). Our implementation efforts also raised a number of questions that ultimately led to improved clarity in later iterations.

| Nothing is worse than meeting a patient for the first time at admission and not being able to answer the basic question of why they were admitted or what the plan is. It gives the impression that we don't talk to each other in caring for patients. [Critical Conversations] can really minimize that interaction and reassure patients, rather than make them worried about the apparent mixed messages or lack of communication and teamwork.Bedside Nurse |
| [Critical Conversations] seemed like an additional timely responsibility, and not always a part of my workflow, when sitting in the emergency department admitting patients. But, I found that the often 60 second conversations decreased the number of pages I would get for the same patientactually saving me time.Physician |
| I don't need to have direct communications for every order written. In fact, it would be inefficient for me and the doctors. On the other hand, being engaged in a Critical Conversation provides an opportunity for me to prioritize not only my tasks for the patient in need, but also in context of the other patients I'm caring for.Bedside Nurse |
| Late in the afternoon, there will often be several admissions coming to our unit simultaneously. Prioritizing what orders need to be processed or faxed is a typically blind task based on the way charts get organizedrather than someone telling me this is a priority.Unit Clerk |
| There are so many times when I'm trying to determine what the care plans are for a new admission, and simply having a quick conversation allows me to feel part of the team, and, more importantly, allows me to reinforce education and support for the patients and their family members.Bedside Nurse |
| Discharge always seems chaotic with everyone racing to fill out forms and meet their own tasks and requirements. Invariably, you get called to fix, change, or add new information to the discharge process that would have been easily averted by actually having a brief conversation with the bedside nurse or case manager. Every time I have [a Critical Conversation], I realize its importance for patient care.Physician |
Who should be involved in a Critical Conversation?
Identifying which healthcare team members should be involved in Critical Conversations is best determined by the conversation owner. That is, we found communication was most effective when the individual initiating the Critical Conversation directed others who needed to be involved. At admission, the physician writing the admission orders is best suited to make this determination; at a minimum, he or she should engage the bedside nurse but, as in the case example presented, the physician may also need to engage other services in particularly complex situations (eg, respiratory therapy, pharmacy). At time of discharge, there should be a physiciannurse Critical Conversation; however, the owner of the discharge process may determine that other conversations should occur, and this may be inclusive of or driven by a case manager or social worker. Because local culture and practices may drive specific ownership, it's key to outline a protocol for how this should occur. For instance, at admission, we asked the admitting physicians to take responsibility in contacting the bedside nurse. In other venues, this may work more effectively if the bedside nurse pages the physician once the orders are received and reviewed.
Conclusions
We introduced Critical Conversations as an innovative tool and policy that promotes communication and teamwork in a structured format and at a consistent time. Developing formal systems that decrease communication failures in high‐risk circumstances remains a focus in patient safety, evidenced by guidelines for TOs in procedural settings, handoffs in patient care (eg, sign‐out between providers),14, 15 and transitions into and from the hospital setting.16 Furthermore, there is growing evidence that such structured times for communication and teamwork, such as with briefings, can improve efficiency and reduce delays in care.17, 18 However, handoffs, which address provider transitions, and daily multidisciplinary rounds, which bring providers together regularly, are provider‐centered rather than patient‐centered. Critical Conversations focus on times when patients require direct communication about their care plans to ensure safe and high quality outcomes.
Implementation of Critical Conversations provides an opportunity to codify a professional standard for patient‐centered communication at times when it should be expected. Critical Conversations also help build a system that supports a positive safety culture and encourages teamwork and direct communication. This is particularly true at a time when rapid adoption of information technology may have the unintended and opposite effect. For instance, as our hospital moved toward an entirely electronic health record, providers were increasingly relocating from patient care units into remote offices, corner hideaways, or designated computer rooms to complete orders and documentation. Although this may reduce many related errors in these processes and potentially improve communication via shared access to an electronic record, it does allow for less direct communicationa circumstance that traditionally occurs (even informally) when providers share the same clinical work areas. This situation is aggravated where the nurses are unit‐based and other providers (eg, physicians, therapists, case managers) are service‐based.
Integrating Critical Conversations into practice comes with expected challenges, most notably around workflow (eg, adds a step, although may save steps down the line) and the expectations concomitant with any change in standard of care (possible enforcement or auditing of their occurrence). Certain cultural barriers may also play a significant role, such as the presence of hierarchies that can hinder open communication and the related ability to speak up with concerns, as related in the TO literature. Where these cultural barriers highlight historical descriptions of the doctornurse relationship and its effect on patient care,1921 Critical Conversations provide an opportunity to improve such interdisciplinary relationships by providing a shared tool for direct communication.
In summary, we described an innovative communication tool that promotes direct communication at critical junctures during a hospitalization. With the growing complexity of hospital care and greater interdependence between teams that deliver this care, Critical Conversations provide an opportunity to further address the known communication failures that contribute to medical errors.
Acknowledgements
Critical Conversations was developed during the Triad for Optimal Patient Safety (TOPS) project, an effort focused on improving unit‐based safety culture through improved teamwork and communication. We thank the Gordon and Betty Moore Foundation for their active support and funding of the TOPS project, which was a collaboration between the Schools of Medicine, Nursing, and Pharmacy at the University of California, San Francisco.
- ,,,,.Communication failures in patient sign‐out and suggestions for improvement: a critical incident analysis.Qual Saf Health Care.2005;14(6):401–407.
- ,,.Communication failures: an insidious contributor to medical mishaps.Acad Med.2004;79(2):186–194.
- ,.TeamSTEPPS: assuring optimal teamwork in clinical settings.Am J Med Qual.2007;22(3):214–217.
- ,,,,,.Medical team training: applying crew resource management in the Veterans Health Administration.Jt Comm J Qual Patient Saf.2007;33(6):317–325.
- ,,,,,,,,,.A multidisciplinary teamwork training program: the Triad for Optimal Patient Safety (TOPS) Experience.J Gen Intern Med.2008;23(12):2053–2057.
- ,,.The human factor: the critical importance of effective teamwork and communication in providing safe care.Qual Saf Health Care.2004;13Suppl‐1:i85–90.
- ,,.SBAR: a shared mental model for improving communication between clinicians.Jt Comm J Qual Patient Saf.2006;32(3):167–175.
- The Joint Commission Universal Protocol for Preventing Wrong Site, Wrong Procedure, Wrong Person Surgery. Available at: http://www.jointcommission.org/NR/rdonlyres/E3C600EB‐043B‐4E86‐B04E‐CA4A89AD5433/0/universal_protocol.pdf. Accessed January 24, 2010.
- ,,.The hospital discharge: a review of a high risk care transition with highlights of a reengineered discharge process.J Patient Saf.2007;3:97–106.
- How do we communicate? Communication on Agile Software Projects. Available at: www.agilemodeling.com/essays/communication.htm. Accessed January 24, 2010.
- ,,,.Promoting effective transitions of care at hospital discharge: a review of key issues for hospitalists.J Hosp Med.2007;2(5):314–323.
- ,,,,,.Deficits in communication and information transfer between hospital‐based and primary care physicians: implications for patient safety and continuity of care.JAMA.2007;297(8):831–841.
- .Engaging patients at hospital discharge.J Hosp Med.2008;3(6):498–500.
- ,,,,.Managing discontinuity in academic medical centers: strategies for a safe and effective resident sign‐out.J Hosp Med.2006;1(4):257–266.
- ,.Lost in transition: challenges and opportunities for improving the quality of transitional care.Ann Intern Med.2004;141(7):533–536.
- ,,, et al.Transition of care for hospitalized elderly patients—development of a discharge checklist for hospitalists.J Hosp Med.2006;1(6):354–360.
- ,,, et al.Impact of preoperative briefings on operating room delays.Arch Surg.2008;143(11):1068–1072.
- ,,, et al.Operating room briefings: working on the same page.Jt Comm J Qual Patient Saf.2006;32(6):351–355.
- .Doctors and nurses: a troubled partnership.Ann Surg.1999;230(3):279–288.
- ,,, et al.Association between nurse‐physician collaboration and patient outcomes in three intensive care units.Crit Care Med.1999;27(9):1991–1998.
- ,,, et al.Evaluation of a preoperative checklist and team briefing among surgeons, nurses, and anesthesiologists to reduce failures in communication.Arch Surg.2008;143(1):12–17.
Communication and teamwork failures are the most frequently cited cause of adverse events.1, 2 Strategies to improve communication have focused on implementing formal teamwork training programs and/or teaching specific communication skills.36 For instance, many institutions have adopted SBAR (Situation‐Background‐Assessment‐Recommendation) as a method for providers to deliver critical clinical information in a structured format.7 SBAR focuses on the immediate and urgent event at hand and can occur between any 2 providers. The situation is a brief description of the event (eg, Hi Dr. Smith, this is Paul from 14‐Long, I'm calling about Mrs. Jones in 1427 who is in acute respiratory distress). The background describes details relevant to the situation (eg, She was admitted with a COPD exacerbation yesterday night, and, for the past couple hours, she appears in more distress. Her vital signs are). The assessment (eg, Her breath sounds are diminished and she's moving less air) and recommendation (eg, I'd like to call respiratory therapy and would like you to come assess her now) drive toward having an action defined at the end. Given the professional silos that exist in healthcare, the advent of a shared set of communication tools helps bridge existing gaps in training, experience, and teamwork between different providers.
Regulatory agencies have been heavily invested in attempts to standardize communication in healthcare settings. In 2003, the Joint Commission elevated the concerns for wrong‐site surgery by making its prevention a National Patient Safety Goal, and the following year required compliance with a Universal Protocol (UP).8 In addition to adequate preoperative identification of the patient and marking of their surgical site, the UP called for a time out (TO) just prior to the surgery or procedure. The UP states that a TO requires active communication among all members of the surgical/procedure team, consistently initiated by a designated member of the team, conducted in a fail‐safe mode, so that the planned procedure is not started if a member of the team has concerns.8 Simply, the TO provides an opportunity to clarify plans for care and discuss events anticipated during the procedure among all members of the team (eg, surgeons, anesthesiologists, nurses, technicians). This all‐important pause point ensures that each team member is on the same page.
Whereas a TO involves many high‐risk procedural settings, a significant proportion of hospital care occurs outside of procedures. Patients are often evaluated in an emergency department, admitted to a medical/surgical ward, treated without the need for a procedure, and ultimately discharged home or transferred to another healthcare facility (eg, skilled nursing or acute rehabilitation). In this paper, we introduce the concept of Critical Conversations, a form of nonprocedural time out, as a tool, intervention, and policy that promotes communication and teamwork at the most vulnerable junctures in a patient's hospitalization.
Rationale for Critical Conversations: a Case Scenario
An 82‐year‐old man with hypertension and chronic obstructive pulmonary disease (COPD) is admitted to the hospital with community‐acquired pneumonia and an exacerbation of his COPD. The admitting physician evaluates the patient in the emergency department and completes admission orders. The patient arrives on the medical/surgical unit and the unit clerk processes the orders, stimulating a cascade of downstream events for different providers.
Nurse
The nurse reviews the medication list, notices antibiotics and bronchodilators, and wonders why aren't we administering steroids for his COPD? Do any of these medications need to be given now? Is there anything the physician is worried about? What specific things should prompt me to call the physician with an update or change in condition? I'm not sure if it's safe to send the patient down for the ordered radiographic study because he still looks pretty short of breath. I hate paging the physician several times to get these questions answered because I know that person is busy as well. I also know the patient will have questions about the care plans, which I won't be able to answer. I wonder if I should finish administering evening medications for my other patients as I'm running behind schedule on my other tasks.
Respiratory therapist
At the same time, the respiratory therapist (RT) is contacted to assist with nebulizer therapy for the patient. In reviewing the order for bronchodilators, the RT silently asks, do we think he is going to need continuous nebulizers? What is our oxygen saturation goaldo we want him at 90% or above 95%? I wonder if this patient has a history of CO2 retention and if I should have a BiPAP machine at the bedside.
Physician
After completing the orders for the patient, the physician remains in the emergency department to admit a different patient with a gastrointestinal bleed. This is the fifth admission in the past few hours. The physician feels the impact of constant paging interruptions. A unit clerk pages asking for clarification about a radiographic study that was ordered. A bedside nurse pages and asks if the physician can come and speak to the family about the diagnosis and treatment plans for an earlier admission (something the nurse is not clear about, either). A second bedside nurse pages, stating a different admission is still tachycardic after 3 liters of intravenous fluids and wants to know whether the fluids should be continued. Finally, the bedside nurse pages about whether the new COPD admission can go off the floor for the ordered chest CT or remain on continuous pulse oximetry because of shortness of breath.
Our case scenario is representative of most non‐surgical admissions to a hospital. The hypothetical questions posed from different provider perspectives are also common and often remain unanswered in a timely fashion. Partly because there is no site to mark and no anesthesia to deliver, the clinical encounter escapes attention as an opportunity for error prevention. In our experience, there are specific times during a hospitalization when communication failures are most likely to compromise patient care: the time of admission, the time of discharge,9 and any time when a patient's clinical condition changes acutely. Whereas handoff communications focus on transitions between providers (eg, shift changes), these circumstances are driven by patient transitions. Indirect communications, such as phone, email, or faxes, are suboptimal forms of communication at such times.10 We believe that there should be an expectation for direct communication at these junctures, and we define these direct communications as Critical Conversations.
Description of a Critical Conversation
In the hours that follow an admission, providers (and often the patients or their family as well) invariably exchange any number of inefficient calls or pages to clarify care plans, discuss a suspected diagnosis, anticipate concerns in the first night, and/or highlight which orders should be prioritized, such as medications or diagnostic studies. A Critical Conversation at time of admission does in this circumstance exactly what a TO attempts to provide before a procedure foster communication and teamwork as a patient is about to be placed at risk for adverse events. The exchange involves discussion of the following:
Admitting diagnosis
Immediate treatment plan
Medications ordered (particularly those new to a patient to anticipate an adverse event)
Priority for completing any admitting orders
Guidelines for physician notification when a change in patient condition occurs.
At the other end of a hospitalization, with the known complications arising from a patient's discharge,11, 12 the same process is needed. Rather than having each discipline focus on an individual role or task in getting a patient safely discharged, Critical Conversations allow the entire team, including the patient,13 to ensure that concerns have been addressed. This might help clarify simple measures around follow‐up appointments, whom to call with questions after discharge, or symptoms to watch for that may warrant a repeat evaluation. Nurses anecdotally lament that they first learn about a planned discharge only when the discharge order is written in the chart or if a patient informs them. Both scenarios reflect poorly on the teamwork required to assure patients we're working together, and that key providers are on the same page with respect to discharge planning. The exchange at discharge involves discussion of these elements:
Discharge diagnosis
Follow‐up plans
Need for education/training prior to discharge
Necessary paperwork completed
Anticipated time of discharge.
Finally, where many patients are admitted to a hospital, improve, and then return home, others develop acute changes during their hospitalization. For example, the patient in our case scenario could develop respiratory failure and require transfer to the intensive care unit (ICU). Or a different patient might have an acute change in mental status, a new fever, a new abnormal vital sign (eg, tachycardia or hypoxia), or an acute change re existing abdominal painall of which may require a battery of diagnostic tests. These circumstances define the third time for a Critical Conversation: a change in clinical condition. Such situations often require a change in the care plan, a change in priorities for delivering care at that time (for the patient in need and for other patients being cared for by the same nurse and physician), a need for additional resources (eg, respiratory therapist, phlebotomist, pharmacist), and, ultimately, a well‐orchestrated team effort to make it all happen. The specific item prompting the Critical Conversation may impact the nature of the exchange, which involves discussion of these components:
Suspected diagnosis
Immediate treatment plan
Medications ordered (particularly those new to a patient to anticipate an adverse event)
Priority for completing any new orders
Guidelines for physician notification when a change in patient condition occurs.
In addition to the above checklist for each Critical Conversation, each exchange should also address two open‐ended questions: 1) what do you anticipate happening in the next 24 hours, and 2) what questions might the patient/family have?
One may ask, and we did, why not have a direct communication daily between a physician and a bedside nurse on each patient? Most physicians and nurses know the importance of direct communication, but there are also times when each is prioritizing work in competing fashions. Adopting Critical Conversations isn't meant to deter from communications that are vital to patient care; rather, it is intended to codify distinct times when a direct communication is required for patient safety.
Lessons Learned
Table 1 provides an example of a Critical Conversation using the sample case scenario. Table 2 lists the most frequent outcomes that resulted from providers engaging in Critical Conversations. These were captured from discussions with bedside nurses and internal medicine residents on our primary medical unit. Both tables highlight how these deliberate and direct communications can create a shared understanding of the patient's medical problems, can help prioritize what tasks should take place (eg, radiology study, medication administration, calling another provider), can improve communication between providers and patients, and potentially accomplish all of these goals in a more efficient manner.
| Physician: Hi Nurse X, I'm Dr. Y, and I just wrote admission orders for Mr. Z whom, I understand, you'll be admitting. He's 82 with a history of COPD and is having an exacerbation related to a community‐acquired pneumonia. He looks comfortable right now as he's received his first dose of antibiotics, a liter of IVF, and 2 nebulizer treatments with some relief of his dyspnea. The main thing he needs up on the floor right now is to have respiratory therapy evaluate him. He's apparently been intubated before for his COPD, so I'd like to have them on board early and consider placing a BiPAP machine at the bedside for the next few hours. I don't anticipate an acute worsening of his condition given his initial improvements in the ED, but you should call me with any change in his condition. I haven't met the family yet because they were not at the bedside, but please convey the plans to them as well. I'll be up later to talk to them directly. Do you have any questions for me right now? |
| Nurse: I'll call the respiratory therapist right now and we'll make sure to contact you with any changes in his respiratory status. It looks like a chest CT was ordered, but not completed yet. Would you like him to go down for it off monitor? |
| Physician: Actually, let's watch him for a few hours to make sure he's continuing to improve. I initially ordered the chest CT to exclude a pulmonary embolus, but his history, exam, and chest x‐ray seem consistent with pneumonia. Let's reassess in a few hours. |
| Nurse: Sounds good. I'll text‐message you a set of his vital signs in 3‐4 hours to give you an update on his respiratory status. |
| General Themes | Specific Examples |
|---|---|
| Clarity on plan of care | Clear understanding of action steps at critical junctures of hospitalization |
| Goals of admission discussed rather than gleaned from chart or less direct modes of communication | |
| Discharge planning more proactive with better anticipation of timing among patients and providers | |
| Expectation for shared understanding of care plans | |
| Assistance with prioritization of tasks (as well as for competing tasks) | Allows RNs to prioritize tasks for new admissions or planned discharges, to determine whether these tasks outweigh tasks for other patients, and to provide early planning when additional resources will be required |
| Allows MDs to prioritize communications to ensure critical orders receive attention, to obtain support for care plans that require multiple disciplines, and to confirm that intended care plans are implemented with shared sense of priority | |
| Ability to communicate plans to patient and family members | Improved consistency in information provided to patients at critical hospital junctures |
| Increased engagement of patients in understanding their care plans | |
| Better model for teamwork curative for patients when providers on the same page with communication | |
| More efficient and effective use of resources | Fewer pages between admitting RN and MD with time saved from paging and waiting for responses |
| Less time trying to interpret plans of care from chart and other less direct modes of communication | |
| Improved sharing and knowledge of information with less duplication of gathering from patients and among providers | |
| Improved teamwork | Fosters a culture for direct communication and opens lines for questioning and speaking up when care plans are not clear |
Making Critical Conversations Happen
Integrating Critical Conversations into practice requires both buy‐in among providers and a plan for monitoring the interactions. We recommend beginning with educational efforts (eg, at a physician or nurse staff meeting) and reinforcing them with visual cues, such as posters on the unit (Figure 1). These actions promote awareness and generate expectations that this new clinical policy is being supported by clinical and hospital leadership. Our experiences have demonstrated tremendous learning, including numerous anecdotes about the value of Critical Conversations (Table 3). Our implementation efforts also raised a number of questions that ultimately led to improved clarity in later iterations.
| Nothing is worse than meeting a patient for the first time at admission and not being able to answer the basic question of why they were admitted or what the plan is. It gives the impression that we don't talk to each other in caring for patients. [Critical Conversations] can really minimize that interaction and reassure patients, rather than make them worried about the apparent mixed messages or lack of communication and teamwork.Bedside Nurse |
| [Critical Conversations] seemed like an additional timely responsibility, and not always a part of my workflow, when sitting in the emergency department admitting patients. But, I found that the often 60 second conversations decreased the number of pages I would get for the same patientactually saving me time.Physician |
| I don't need to have direct communications for every order written. In fact, it would be inefficient for me and the doctors. On the other hand, being engaged in a Critical Conversation provides an opportunity for me to prioritize not only my tasks for the patient in need, but also in context of the other patients I'm caring for.Bedside Nurse |
| Late in the afternoon, there will often be several admissions coming to our unit simultaneously. Prioritizing what orders need to be processed or faxed is a typically blind task based on the way charts get organizedrather than someone telling me this is a priority.Unit Clerk |
| There are so many times when I'm trying to determine what the care plans are for a new admission, and simply having a quick conversation allows me to feel part of the team, and, more importantly, allows me to reinforce education and support for the patients and their family members.Bedside Nurse |
| Discharge always seems chaotic with everyone racing to fill out forms and meet their own tasks and requirements. Invariably, you get called to fix, change, or add new information to the discharge process that would have been easily averted by actually having a brief conversation with the bedside nurse or case manager. Every time I have [a Critical Conversation], I realize its importance for patient care.Physician |
Who should be involved in a Critical Conversation?
Identifying which healthcare team members should be involved in Critical Conversations is best determined by the conversation owner. That is, we found communication was most effective when the individual initiating the Critical Conversation directed others who needed to be involved. At admission, the physician writing the admission orders is best suited to make this determination; at a minimum, he or she should engage the bedside nurse but, as in the case example presented, the physician may also need to engage other services in particularly complex situations (eg, respiratory therapy, pharmacy). At time of discharge, there should be a physiciannurse Critical Conversation; however, the owner of the discharge process may determine that other conversations should occur, and this may be inclusive of or driven by a case manager or social worker. Because local culture and practices may drive specific ownership, it's key to outline a protocol for how this should occur. For instance, at admission, we asked the admitting physicians to take responsibility in contacting the bedside nurse. In other venues, this may work more effectively if the bedside nurse pages the physician once the orders are received and reviewed.
Conclusions
We introduced Critical Conversations as an innovative tool and policy that promotes communication and teamwork in a structured format and at a consistent time. Developing formal systems that decrease communication failures in high‐risk circumstances remains a focus in patient safety, evidenced by guidelines for TOs in procedural settings, handoffs in patient care (eg, sign‐out between providers),14, 15 and transitions into and from the hospital setting.16 Furthermore, there is growing evidence that such structured times for communication and teamwork, such as with briefings, can improve efficiency and reduce delays in care.17, 18 However, handoffs, which address provider transitions, and daily multidisciplinary rounds, which bring providers together regularly, are provider‐centered rather than patient‐centered. Critical Conversations focus on times when patients require direct communication about their care plans to ensure safe and high quality outcomes.
Implementation of Critical Conversations provides an opportunity to codify a professional standard for patient‐centered communication at times when it should be expected. Critical Conversations also help build a system that supports a positive safety culture and encourages teamwork and direct communication. This is particularly true at a time when rapid adoption of information technology may have the unintended and opposite effect. For instance, as our hospital moved toward an entirely electronic health record, providers were increasingly relocating from patient care units into remote offices, corner hideaways, or designated computer rooms to complete orders and documentation. Although this may reduce many related errors in these processes and potentially improve communication via shared access to an electronic record, it does allow for less direct communicationa circumstance that traditionally occurs (even informally) when providers share the same clinical work areas. This situation is aggravated where the nurses are unit‐based and other providers (eg, physicians, therapists, case managers) are service‐based.
Integrating Critical Conversations into practice comes with expected challenges, most notably around workflow (eg, adds a step, although may save steps down the line) and the expectations concomitant with any change in standard of care (possible enforcement or auditing of their occurrence). Certain cultural barriers may also play a significant role, such as the presence of hierarchies that can hinder open communication and the related ability to speak up with concerns, as related in the TO literature. Where these cultural barriers highlight historical descriptions of the doctornurse relationship and its effect on patient care,1921 Critical Conversations provide an opportunity to improve such interdisciplinary relationships by providing a shared tool for direct communication.
In summary, we described an innovative communication tool that promotes direct communication at critical junctures during a hospitalization. With the growing complexity of hospital care and greater interdependence between teams that deliver this care, Critical Conversations provide an opportunity to further address the known communication failures that contribute to medical errors.
Acknowledgements
Critical Conversations was developed during the Triad for Optimal Patient Safety (TOPS) project, an effort focused on improving unit‐based safety culture through improved teamwork and communication. We thank the Gordon and Betty Moore Foundation for their active support and funding of the TOPS project, which was a collaboration between the Schools of Medicine, Nursing, and Pharmacy at the University of California, San Francisco.
- ,,,,.Communication failures in patient sign‐out and suggestions for improvement: a critical incident analysis.Qual Saf Health Care.2005;14(6):401–407.
- ,,.Communication failures: an insidious contributor to medical mishaps.Acad Med.2004;79(2):186–194.
- ,.TeamSTEPPS: assuring optimal teamwork in clinical settings.Am J Med Qual.2007;22(3):214–217.
- ,,,,,.Medical team training: applying crew resource management in the Veterans Health Administration.Jt Comm J Qual Patient Saf.2007;33(6):317–325.
- ,,,,,,,,,.A multidisciplinary teamwork training program: the Triad for Optimal Patient Safety (TOPS) Experience.J Gen Intern Med.2008;23(12):2053–2057.
- ,,.The human factor: the critical importance of effective teamwork and communication in providing safe care.Qual Saf Health Care.2004;13Suppl‐1:i85–90.
- ,,.SBAR: a shared mental model for improving communication between clinicians.Jt Comm J Qual Patient Saf.2006;32(3):167–175.
- The Joint Commission Universal Protocol for Preventing Wrong Site, Wrong Procedure, Wrong Person Surgery. Available at: http://www.jointcommission.org/NR/rdonlyres/E3C600EB‐043B‐4E86‐B04E‐CA4A89AD5433/0/universal_protocol.pdf. Accessed January 24, 2010.
- ,,.The hospital discharge: a review of a high risk care transition with highlights of a reengineered discharge process.J Patient Saf.2007;3:97–106.
- How do we communicate? Communication on Agile Software Projects. Available at: www.agilemodeling.com/essays/communication.htm. Accessed January 24, 2010.
- ,,,.Promoting effective transitions of care at hospital discharge: a review of key issues for hospitalists.J Hosp Med.2007;2(5):314–323.
- ,,,,,.Deficits in communication and information transfer between hospital‐based and primary care physicians: implications for patient safety and continuity of care.JAMA.2007;297(8):831–841.
- .Engaging patients at hospital discharge.J Hosp Med.2008;3(6):498–500.
- ,,,,.Managing discontinuity in academic medical centers: strategies for a safe and effective resident sign‐out.J Hosp Med.2006;1(4):257–266.
- ,.Lost in transition: challenges and opportunities for improving the quality of transitional care.Ann Intern Med.2004;141(7):533–536.
- ,,, et al.Transition of care for hospitalized elderly patients—development of a discharge checklist for hospitalists.J Hosp Med.2006;1(6):354–360.
- ,,, et al.Impact of preoperative briefings on operating room delays.Arch Surg.2008;143(11):1068–1072.
- ,,, et al.Operating room briefings: working on the same page.Jt Comm J Qual Patient Saf.2006;32(6):351–355.
- .Doctors and nurses: a troubled partnership.Ann Surg.1999;230(3):279–288.
- ,,, et al.Association between nurse‐physician collaboration and patient outcomes in three intensive care units.Crit Care Med.1999;27(9):1991–1998.
- ,,, et al.Evaluation of a preoperative checklist and team briefing among surgeons, nurses, and anesthesiologists to reduce failures in communication.Arch Surg.2008;143(1):12–17.
Copyright © 2011 Society of Hospital Medicine
Faculty Development for Hospitalists
The growth of hospitalists nationally continues at an unprecedented pace.1 In academic medical centers, the development of hospital medicine groups either as independent divisions or as part of divisions of general internal medicine (DGIM) reflects this trend. Drivers for growth in the academic setting include housestaff work hour restrictions, increased need for oversight on teaching services, development of nonhousestaff services, surgical comanagement, and greater emphasis on efficiency, quality, and safety.26 These drivers have created tremendous opportunities for hospitalists, but the rapid growth has also created challenges to achieving traditional academic success.7, 8
While hospitalists feel the traditional academic pressures to produce new knowledge and teach, the extraordinary need to expand clinical services has resulted in a young hospitalist workforce, with most lacking fellowship training. At the same time, there are few senior mentors available. Taken together, many academic hospital medicine (AHM) programs find themselves populated by large cadres of junior faculty without the support, training, and mentoring they need to succeed in a faculty career.9 For hospital medicine groups, the risk to faculty recruitment, retention, productivity, and morale is high.
In this article, we describe the development and implementation of a multifaceted Faculty Development (FD) program whose goal was to provide our faculty with clinical, educational, leadership, and scholarly skills that would promote academic output and foster work satisfaction.
Methods
Problem Identification
The University of California, San Francisco (UCSF) Medical Center operates nearly 800 beds across 2 hospitals (Parnassus and Mount Zion campuses). The UCSF Division of Hospital Medicine (DHM) provides care on the teaching service (90% of all ward months covered by a hospitalist faculty), a nonhousestaff medical service based at Mount Zion,4 a palliative care service,10 a medical consultation service, a neurosurgical comanagement service, a procedure service, and comanagement on advanced heart failure and cancer services. Like many AHM groups, ours has experienced explosive growth, more than doubling in faculty size in 3 years (50+ faculty by July 2010).
In addition, many of our new faculty joined the division directly after residency training whereas our early hospitalists were mostly former chief residents and/or fellowship‐trained. During a 2‐year period, our division lost several faculty to burnout from clinically heavy positions or because they felt their ultimate academic success was in doubt. During a 2008 divisional retreat, the single greatest need identified was to invest in the development of our first‐year faculty who were felt to be at greatest risk for burnout, dissatisfaction, and failing to integrate into the divisional mission. Based on this result, we set out to develop a program to meet this pressing need.
Needs Assessment
We formed a FD steering committee comprised of faculty from all ranks and career paths in our division (eg, educator, administrator, and investigator), with overrepresentation of recent hires to ascertain how best to meet their needs. Information from the division retreat provided the basis for the program and its priorities. The FD steering committee then outlined ideas that guided program development, which included:
New faculty should be required to meet regularly with assigned faculty mentors during their first year, and expectations for that relationship should be outlined for both parties
New faculty should be required to attend dedicated sessions that build their teaching skills
New faculty should receive a specially designed first year curriculum to provide learnings focused on high‐yield and relevant topics
New faculty should receive a set of goals, or scholarly expectations, for their first year that would foster a partnership between individual faculty and the division to meet those goals
The division should create new structures for FD that promote collaboration, sharing of personal and professional growth and challenges, and a culture of continuous learning
All of the activities that comprise our new FD program must be aligned with our stated mission: to provide the highest quality clinical care, education, system improvements, and research that benefit our patients and trainees by developing successful academic hospitalist faculty.
Program Goals and Objectives
Our DHM FD program established the goal to provide our new faculty with clinical, educational, leadership, and scholarly skills that would promote academic output and foster work satisfaction. From a broader divisional standpoint, the goal was simply to create new FD structures that fostered the division's commitment to the program. The primary objectives of the program were for new faculty to:
Increase their knowledge, skills, and attitudes about key academic hospitalist domains following participation in the program;
Demonstrate successful production of scholarly output, participation in a hospital committee, and participation in a quality or safety improvement initiative by the end of their first year;
Report high levels of satisfaction with the FD program and their first year on faculty.
Program Development Principles
We began by conducting a literature review to draw on the successes and lessons learned from existing FD programs, particularly in large departments, academic centers, and the hospitalist field.1115 We focused our program development on a set of FD principles, which included instructional improvement, organizational development, the development of professional academic skills, and the teaching of specific content.11 Furthermore, whereas many FD programs traditionally focus on mentoring or a longitudinal set of seminars, we believed a multifaceted approach could help shift our culture towards one that prioritized FD and generated a sense of community. We hoped this cultural shift would create an environment that increased faculty satisfaction with their work, with their colleagues, and in our division.
This context drove us to build programmatic activities that not only targeted new faculty, the initial focus of our planning efforts, but also the division more broadly. We wanted to adopt known strategies (eg, mentoring relationships, teaching methods for FD, and grand rounds) but also weave in new ones that targeted AHM and our Division. It was clear that successful programs used a variety of instructional methods, and often combined methods, to create active and engaged faculty. We similarly wanted to create venues for didactic and small‐group learning, but also opportunities for peer learning and facilitated discussions around important topics. Allowing new faculty to learn from each other, and having them observe more senior faculty do the same, would be an important and explicit programmatic element.
Program Description and Implementation
All new faculty meet with Divisional leadership (RMW/BAS), administrative staff (they receive an orientation binder that highlights frequently asked questions and provides service‐specific orientation documents), and the Director of FD (NLS). The latter introduces the DHM FD Program and provides the road map for their first year (Supporting Information). The checklist serves to orient, guide, and emphasize the various programmatic goals, expectations, and logistics. Discussion focuses on the activities targeted to new faculty followed by wider divisional offerings. New faculty activities include:
Coaching Program
Rather than having new faculty independently seek out an appropriate mentor, we explicitly paired each with a more senior hospitalist (eg, 3 years on faculty). We provided explicit goals and expectations for the faculty coach and used a similar road map to guide their role (Supporting Information). We chose to call them coaches rather than mentors because in the first year, we felt a new faculty member needed nuts and bolts support from a big sibling more than they needed formal academic mentoring. We placed the burden of organizing the coaching sessions on the faculty coach and provided them with periodic reminders and suggestions for topics to discuss over the course the year, including supporting the junior faculty's performance against their scholarly benchmarks. Finally, we also organized a peer mentoring session for new facultydesigned to create additional peer support and shared learnings, and establish the importance of these relationships moving forward.
Core Seminars
We created a 12‐hour curriculum to cover a broad range of relevant AHM topics (Table 1). The choice of topics was informed by our needs assessment, suggestions of the FD Steering Committee, and the new faculty themselves. The sessions included a few didactic presentations, but they were largely interactive in a workshop‐style format to allow new faculty to engage the content. For instance, a session on quality improvement asked new faculty to bring a project idea and then work through creating a project plan. We coupled three half‐day sessions with a divisional social activity and made every attempt to ensure new faculty were not distracted by clinical responsibilities (eg, not on a clinical service or coverage was provided).
|
| Core Seminars |
| Being an academic hospitalist: The nuts & bolts |
| Tools for the master clinician |
| Documentation pearls & practices: Clinical, billing, and medico‐legal issues |
| Preparing your first talk: From topic selection to power point presentation |
| Choosing a case and writing it up for a clinical vignette abstract submission |
| Searching for clinical answers: An interactive computer‐lab workshop |
| Introduction to quality improvement |
| Leadership 101: Self‐awareness, your Myers‐Briggs, and leading change |
| Project Management: An exercise in team building |
| Thinking about systems and creating a culture of safety |
| Lunch Seminars |
| Managing and updating your academic CV |
| What to do when a patient on your service dies? |
| Evaluating students & housestaffAnd giving feedback |
| Being an effective ward attending |
| Medical‐legal consultative work & being an expert witness |
| Getting involved in professional societies |
| Understanding the promotion tracks: Practical tips and career preparation |
| Getting involved in hospital committee work |
| Caring for sick family members & navigating the healthcare system as a physician |
| Retirement planning 101: Life after UCSF |
| Time management & creating scholarly work |
| Teaching medical students on the wards |
| Clinical resources: What do you use to find answers? |
Teaching Course
One of our faculty (BAS) delivered the Stanford Faculty Development Clinical Teaching program16 (a train the trainer model designed to teach faculty how to become more effective teachers) to all new faculty. The program consisted of 14 hours of highly interactive curricula, video review, and role plays. The course was offered after hours (4 PM or 5 PM) and with input from the new faculty to ensure availability and participation.
Feedback and Observation
Each new faculty received directed feedback about their teaching and supervision on the housestaff service following their first rotation. Feedback was based on housestaff evaluations and direct observation of the new faculty during patient care and teaching rounds. One of our faculty (BAS) observed each new faculty member during rounds, and met with them individually to provide feedback and generate a discussion about teaching style and improvement opportunities.
Scholarly Expectations
We developed a set of scholarly expectations for new faculty. These helped inform the coach‐new faculty meetings and our selection of content for the Core Seminars. We initially had concerns that these expectations could overwhelm new faculty, but those junior faculty (years 2‐4) on the FD steering committee urged this practice, wishing they had similar guidance in their first year.
From the divisional perspective, we also added a number of new structures.
Grand Rounds
We established a monthly continuing medical education (CME) credit‐granting DHM Grand Rounds that combined a 10‐minute Hospital Medicine Update with a 45‐minute didactic presentation. The updates were presented by new faculty in order to provide them with an opportunity to receive feedback on their teaching and presentation skills (eg, how to give a talk, make PowerPoint slides, etc.). Didactic presentations were given by senior DHM faculty as well as subspecialty colleagues or ones from other departments (eg, dermatology or neurology), disciplines (eg, risk management), or campuses.
FD Lunch Seminar Series
Our division traditionally meets each Monday over the lunch hour to talk about service or academic issues. With a growing division, we believed there was an opportunity to better organize the content of these meetings. Once monthly, we dedicated a lunch session to a Faculty Development Seminar with topics that spanned a variety of interest areas, were driven by faculty suggestions, and were focused on being facilitated discussions rather than didactics. Table 1 provides examples of these seminar topics.
| Survey Statements Reporting Level of Comfort With(% responding somewhat agree or agree) | Previous Faculty, % (n = 11) | New Faculty, % (n = 6) |
|---|---|---|
| Identifying important resources within the School of Medicine | 64 | 83 |
| Identifying important resources within the Department of Medicine | 63 | 100 |
| Identifying important resources within the Division of Hospital Medicine | 90 | 100 |
| Identifying important resources within UCSF Medical Center | 72 | 67 |
| Having a system to effectively manage my email | 64 | 67 |
| Having a system to keep my CV updated | 64 | 84 |
| Using my non‐clinical time for academic success | 54 | 67 |
| Best practices for clinical/medico‐legal documentation | 54 | 67 |
| Best practices for billing documentation | 62 | 84 |
| Being an effective supervising ward attending | 90 | 84 |
| Being an effective teacher | 90 | 84 |
| Evaluating students and housestaff performance | 90 | 83 |
| Providing feedback to students and housestaff | 90 | 100 |
| Getting involved in professional societies | 27 | 100 |
| Understanding the difference between promotion pathways | 36 | 67 |
| Getting involved in hospital committee work | 54 | 84 |
| Choosing a good case for a clinical vignette submission to a regional/national meeting | 54 | 83 |
| Creating a poster for presentation at a regional/national meeting | 36 | 84 |
| Giving a lecture to students or residents | 64 | 84 |
| Developing a PowerPoint presentation for a lecture | 45 | 100 |
| Describing my personality type and how it relates to my work | 45 | 100 |
| Understanding important aspects of being a leader | 54 | 100 |
| Explaining the basic principles of quality improvement | 45 | 84 |
| Participating and contributing to a quality improvement project | 54 | 67 |
| Explaining the basic principles of patient safety | 45 | 67 |
| Understanding the factors that contribute to medical errors | 36 | 84 |
| Creating scholarly products from my work | 27 | 50 |
| Identifying what kind of mentors I need for the future | 45 | 100 |
| Category (% completed during first year) | Previous Faculty, % (n = 11) | New Faculty, % (n = 6) |
|---|---|---|
| Medical student teaching | 90 | 100 |
| Talk for trainees | 45 | 100 |
| Hospital committee involvement | 63 | 100 |
| Participation in a quality or safety project | 33 | 67 |
| Abstract submission | 27 | 50 |
| Identified mentor for year 2 | 63 | 83 |
Quality and Safety Lunch Seminars
In addition to our FD seminars, we also used one lunch session each month to provide updates on performance measures, ongoing quality or safety improvement initiatives, or a broader quality or safety topic. Speakers were either divisional or outside experts, depending on the topic, and organized by our director for quality and safety.
Incubator Sessions
Our director of research (AA) organized a weekly works in progress meeting, to which faculty and fellows brought ideas, grant applications, early manuscript drafts, or other potential scholarship products to obtain feedback and further group mentorship.
Divisional Retreats
We began alternating annual full‐day and mini half‐day retreats as a method to bring the division together, build camaraderie, set strategic priorities, identify divisional goals, and assess needs. These helped guide the creation of additional FD opportunities as well as our overall division's strategy to achieve our academic mission. The outcomes of these retreats led to many significant initiatives and policies, such as changes in compensation models, new scheduling processes, and decisions to spend resources on areas such as quality improvement.
Program Evaluation
Our evaluation focused on measuring the FD program's impact on our new faculty. We tracked their success in completing the stated scholarly expectations and surveyed them about their satisfaction with the programmatic activities, their first year on faculty, and their preparation for year 2. Prior to implementing the program, we surveyed the previous 2 years of new faculty to provide a comparison.
Results
Seven faculty participated in the inaugural program. We compared their scholarly output and experiences (6 faculty completed the survey; 87% response rate) with that of 11 more senior faculty who completed the comparison survey. Of note, the response rate of the comparison group was 69% (5 faculty who departed from our division during the previous 2 years were not surveyed). New faculty were surveyed at the start of the academic year with the follow‐up survey completed the following June. The more senior faculty completed the survey once at the same time as the baseline survey for the new faculty. All new faculty participated in each of the Core Seminars, the Teaching Course, the required number of Coaching sessions, and the observed teaching activity. We did not track their attendance at Divisional activities such as Grand Rounds or the Lunch Seminars.
Overall, the FD programmatic offerings were rated highly by new faculty (on a scale of 1 [lowest] to 5 [highest] for a global rating of each FD activity): Core Seminars 4.83 0.41, Coaching Program 4.5 0.84, Teaching Course 4.5 0.55, Grand Rounds 4.83 0.41, and Lunch Seminars 4.5 0.84. Table 2, which compares responses to a series of end of the year statements posed to new faculty, highlights notable differences in their level of comfort with specific skills and resource awareness. Given the small sample size, statistical significance was not calculated. Table 3 illustrates similar comparisons focused on academic output, which demonstrate that new faculty gave more talks to trainees, had greater involvement in hospital committees, more actively participated in quality and safety projects, and submitted more abstracts to regional or national meetings. New faculty also responded differently to which part of the FD program was most influential with 1 suggesting the Coaching Program, 2 the Core Seminars, 2 the entire program efforts, and 1 did not specify.
Table 4 illustrates comparison responses to a series of directed statements. New faculty all reported greater degrees of satisfaction overall, measured by the above responses, compared to previous faculty.
| Categories | Previous Faculty, % (n = 11) | New Faculty, % (n = 6) |
|---|---|---|
| ||
| Success: To what degree do you feel successful as an academic hospitalist at the end of your first year? (% responding successful or very successful) | 27 | 67 |
| Prepared: To what degree do you feel prepared for academic success moving into your second year on faculty? (% responding prepared or very prepared) | 27 | 100 |
| Part of DHM: I felt like an integral part of our division after my first year on faculty (% responding somewhat agree or agree) | 45 | 84 |
| Expectations: My first year on faculty exceeded my expectations (% responding somewhat agree or agree) | 27 | 84 |
Discussion
We implemented an FD program to foster the academic development of new faculty, and to mitigate the effects of growing clinical demands and a rapid group expansion on our academic mission. The impact of the program was measured by increased work satisfaction and academic output in first year faculty, greater self‐reported comfort in a variety of skills and knowledge of resources, and an improvement in our sense of purpose behind our academic mission. Though the program is only in its second year, we believe the model is of value for other AHM groups, and perhaps even nonacademic groups, all of whom may use such an investment in their hospitalists as a method to improve recruitment, job satisfaction, and retention.
Reviewing our program's first year suggests there were at least 3 keys to our success. First, we benefited tremendously from the time spent crafting a vision for the program and relying heavily on input from the target audience of junior faculty. Moreover, we made every effort to leverage existing resources (eg, using faculty who already taught about a given topic) and time commitments (eg, reshaping our existing Monday lunch meeting). Finally, we increasingly used our FD venues to connect and build networks with colleagues outside our division and within the hospital. This was a deliberate effort to create opportunities for individual faculty to be exposed to and collaborate with nonhospitalists for academic output.
Our research has some limitations, most notably the small sample size in evaluating the program for statistical significance, and the incomplete survey return rates. However, the results were quite consistent and the nonresponses of departed faculty would tend to bias our results toward the null. We also acknowledge the possibility of other confounding factors (eg, changes in clinical compensation models) that may have played a role, although compensation changes were relatively minor during the period studied and faculty did attribute many of the benefits in job satisfaction and skill building to the FD program itself.
Hospital medicine is an unusual field in that there is low barrier to entry and exit. Providers can change jobs without having to say goodbye to a large panel of patients, and in the continued mismatch between available positions and hospitalists, alternative positions can easily and quickly be found if they are dissatisfied.17 In the academic arena, even as hospitalists are hired to fill clinical gaps, they still have to perform under more traditional academic rules in order to be promoted and receive the support and kudos of colleagues and trainees. For both these reasons, early nurturing and socialization is critical to retention and academic success. While some opportunities for FD will be offered by national organizations,18 groups also have local responsibilities to support, mentor, and develop their junior faculty. Not only is such support crucial for the junior faculty themselves, but in our young field, the mentored very quickly become the mentors. Our decision to invest in both mentees and mentors reinforced the importance of mentorship for academic success and retention while planting the seeds for continued success and growth.1923 A recent study suggested that the environment for mentoring may be as important as the mentoring itself, a finding we did not specifically measure, but would support based our anecdotal experiences.24 This orientation toward future needs and creating the right milieu is crucial because demands for continued hospitalist growth are likely to remain.
Moving into year 2 of our FD program and reflecting on the lessons learned from year 1, we've adopted the same multifaceted approach with only minor adjustments to the curriculum, greater expansion of faculty involved in teaching and coaching, and a continued focus on building a sense of community around our academic mission. For the Core Seminars, we moved away from the 3 half‐day sessions and chose to host 2‐hour sessions every other month. This allowed for the same curriculum to be delivered but was much easier to logistically orchestrate. It also had the intended effect of bringing the new faculty together more regularly. In addition, we created dedicated sessions in preparation for our national meeting to allow faculty to bring abstract submissions for review and later, posters and oral presentations for feedback. These added sessions came partly as a suggestion from new faculty in our first year program, and seemed to further energize junior faculty around converting their projects into scholarship. Finally, we continue to further develop coaching and mentoring relationships in our division, partly a result of successful new facultycoach pairings.
In conclusion, our FD program had a noted impact on our new faculty and had a meaningful impact on our division in terms of camaraderie and cohesion, a shared commitment to an academic mission, and a mechanism for recruitment and retention. We hope our practical description for development and implementation of an FD program, including our specific tools, are useful to other groups considering such an initiative.
Acknowledgements
The authors thank Katherine Li for her invaluable assistance in coordinating the DHM FD program. They are also indebted to their faculty colleagues for their time and roles in teaching and mentoring within the program. Dr. Sehgal partly developed this program as part of a project during his California Healthcare Foundation Leadership Fellowship. Dr. Sharpe delivered the teaching workshops at UCSF after completing the Stanford Faculty Development Teaching Program.
- ,,,.The status of Hospital Medicine Groups in the United States.J Hosp Med.2006;1(2):75–80.
- Accreditation Council for Graduate Medical Education: information related to the ACGME's effort to address resident duty hours and other relevant resource materials. Available at: http://www.acgme.org/acWebsite/dutyHours/dh_index.asp. Accessed August 2010.
- ,,, et al.Effects of work hour reduction on residents' lives: a systematic review.JAMA.2005;294(9):1088–1100.
- ,,,,.Non‐housestaff medicine services in academic centers: models and challenges.J Hosp Med.2008;3(3):247–255.
- ,.Surgical comanagement: a natural evolution of hospitalist practice.J Hosp Med.2008;3(5):394–397.
- ,.The expanding role of hospitalists in the United States.Swiss Med Wkly.2006;136(37–38):591–596.
- 2007–08 Hospital Medicine Survey. Society of Hospital Medicine. Available at: http://www.hospitalmedicine.org/AM/Template.cfm?Section=Survey19(4):392–393.
- ,,, et al.Challenges and opportunities in Academic Hospital Medicine: report from the Academic Hospital Medicine Summit.J Hosp Med.2009;4(4):240–246.
- .Palliative care and hospitalists: a partnership for hope.J Hosp Med.2006;1(1):5–6.
- ,.Faculty development: principles and practices.J Vet Med Educ.2006;33(3):317–324.
- ,,, et al.A systematic review of faculty development initiatives designed to improve teaching effectiveness in medical education: BEME Guide No. 8.Med Teach.2006;28(6):497–526.
- ,.A successful approach to faculty development at an independent academic medical center.Med Teach.2008;30:e10–e14.
- ,,,.An innovative approach to supporting hospitalist physicians towards academic success.J Hosp Med.2008;3(4):314–318.
- ,,, et al.The curriculum for the Hospitalized Aging Medical Patient program: a collaborative faculty development program for hospitalists, general internists, and geriatricians.J Hosp Med.2008;3(5):384–393.
- Stanford Faculty Development Clinical Teaching Program. Available at: http://www.stanford.edu/group/SFDP. Accessed August 2010.
- ,,, et al.Trends in market demand for internal medicine 1999–2004: an analysis of physician job advertisements.J Gen Intern Med.2006;21(10):1079–1085.
- The Academic Hospitalist Academy. Available at: http://www.sgim.org/index.cfm?pageId=815. Accessed August 2010.
- ,,.Mentoring in academic medicine: a systematic review.JAMA.2006;296(9):1103–1115.
- ,,.Facilitating faculty success: outcomes and cost benefit of the UCSD National Center of Leadership in Academic Medicine.Acad Med.2004;79(10 Suppl):S9–S11.
- ,,, et al.Retention of junior faculty in academic medicine at the University of California, San Diego.Acad Med.2009;84(1):37–41.
- ,,,.Helping medical school faculty realize their dreams: an innovative, collaborative mentoring program.Acad Med.2002;77:377–384.
- ,,, et al.Physicians' perceptions of institutional and leadership factors influencing their job satisfaction at one academic medical center.Acad Med.2002;77:1235–1240.
- ,,.A systematic review of qualitative research on the meaning and characteristics of mentoring in academic medicine.J Gen Intern Med.2010;25(1);72–78.
The growth of hospitalists nationally continues at an unprecedented pace.1 In academic medical centers, the development of hospital medicine groups either as independent divisions or as part of divisions of general internal medicine (DGIM) reflects this trend. Drivers for growth in the academic setting include housestaff work hour restrictions, increased need for oversight on teaching services, development of nonhousestaff services, surgical comanagement, and greater emphasis on efficiency, quality, and safety.26 These drivers have created tremendous opportunities for hospitalists, but the rapid growth has also created challenges to achieving traditional academic success.7, 8
While hospitalists feel the traditional academic pressures to produce new knowledge and teach, the extraordinary need to expand clinical services has resulted in a young hospitalist workforce, with most lacking fellowship training. At the same time, there are few senior mentors available. Taken together, many academic hospital medicine (AHM) programs find themselves populated by large cadres of junior faculty without the support, training, and mentoring they need to succeed in a faculty career.9 For hospital medicine groups, the risk to faculty recruitment, retention, productivity, and morale is high.
In this article, we describe the development and implementation of a multifaceted Faculty Development (FD) program whose goal was to provide our faculty with clinical, educational, leadership, and scholarly skills that would promote academic output and foster work satisfaction.
Methods
Problem Identification
The University of California, San Francisco (UCSF) Medical Center operates nearly 800 beds across 2 hospitals (Parnassus and Mount Zion campuses). The UCSF Division of Hospital Medicine (DHM) provides care on the teaching service (90% of all ward months covered by a hospitalist faculty), a nonhousestaff medical service based at Mount Zion,4 a palliative care service,10 a medical consultation service, a neurosurgical comanagement service, a procedure service, and comanagement on advanced heart failure and cancer services. Like many AHM groups, ours has experienced explosive growth, more than doubling in faculty size in 3 years (50+ faculty by July 2010).
In addition, many of our new faculty joined the division directly after residency training whereas our early hospitalists were mostly former chief residents and/or fellowship‐trained. During a 2‐year period, our division lost several faculty to burnout from clinically heavy positions or because they felt their ultimate academic success was in doubt. During a 2008 divisional retreat, the single greatest need identified was to invest in the development of our first‐year faculty who were felt to be at greatest risk for burnout, dissatisfaction, and failing to integrate into the divisional mission. Based on this result, we set out to develop a program to meet this pressing need.
Needs Assessment
We formed a FD steering committee comprised of faculty from all ranks and career paths in our division (eg, educator, administrator, and investigator), with overrepresentation of recent hires to ascertain how best to meet their needs. Information from the division retreat provided the basis for the program and its priorities. The FD steering committee then outlined ideas that guided program development, which included:
New faculty should be required to meet regularly with assigned faculty mentors during their first year, and expectations for that relationship should be outlined for both parties
New faculty should be required to attend dedicated sessions that build their teaching skills
New faculty should receive a specially designed first year curriculum to provide learnings focused on high‐yield and relevant topics
New faculty should receive a set of goals, or scholarly expectations, for their first year that would foster a partnership between individual faculty and the division to meet those goals
The division should create new structures for FD that promote collaboration, sharing of personal and professional growth and challenges, and a culture of continuous learning
All of the activities that comprise our new FD program must be aligned with our stated mission: to provide the highest quality clinical care, education, system improvements, and research that benefit our patients and trainees by developing successful academic hospitalist faculty.
Program Goals and Objectives
Our DHM FD program established the goal to provide our new faculty with clinical, educational, leadership, and scholarly skills that would promote academic output and foster work satisfaction. From a broader divisional standpoint, the goal was simply to create new FD structures that fostered the division's commitment to the program. The primary objectives of the program were for new faculty to:
Increase their knowledge, skills, and attitudes about key academic hospitalist domains following participation in the program;
Demonstrate successful production of scholarly output, participation in a hospital committee, and participation in a quality or safety improvement initiative by the end of their first year;
Report high levels of satisfaction with the FD program and their first year on faculty.
Program Development Principles
We began by conducting a literature review to draw on the successes and lessons learned from existing FD programs, particularly in large departments, academic centers, and the hospitalist field.1115 We focused our program development on a set of FD principles, which included instructional improvement, organizational development, the development of professional academic skills, and the teaching of specific content.11 Furthermore, whereas many FD programs traditionally focus on mentoring or a longitudinal set of seminars, we believed a multifaceted approach could help shift our culture towards one that prioritized FD and generated a sense of community. We hoped this cultural shift would create an environment that increased faculty satisfaction with their work, with their colleagues, and in our division.
This context drove us to build programmatic activities that not only targeted new faculty, the initial focus of our planning efforts, but also the division more broadly. We wanted to adopt known strategies (eg, mentoring relationships, teaching methods for FD, and grand rounds) but also weave in new ones that targeted AHM and our Division. It was clear that successful programs used a variety of instructional methods, and often combined methods, to create active and engaged faculty. We similarly wanted to create venues for didactic and small‐group learning, but also opportunities for peer learning and facilitated discussions around important topics. Allowing new faculty to learn from each other, and having them observe more senior faculty do the same, would be an important and explicit programmatic element.
Program Description and Implementation
All new faculty meet with Divisional leadership (RMW/BAS), administrative staff (they receive an orientation binder that highlights frequently asked questions and provides service‐specific orientation documents), and the Director of FD (NLS). The latter introduces the DHM FD Program and provides the road map for their first year (Supporting Information). The checklist serves to orient, guide, and emphasize the various programmatic goals, expectations, and logistics. Discussion focuses on the activities targeted to new faculty followed by wider divisional offerings. New faculty activities include:
Coaching Program
Rather than having new faculty independently seek out an appropriate mentor, we explicitly paired each with a more senior hospitalist (eg, 3 years on faculty). We provided explicit goals and expectations for the faculty coach and used a similar road map to guide their role (Supporting Information). We chose to call them coaches rather than mentors because in the first year, we felt a new faculty member needed nuts and bolts support from a big sibling more than they needed formal academic mentoring. We placed the burden of organizing the coaching sessions on the faculty coach and provided them with periodic reminders and suggestions for topics to discuss over the course the year, including supporting the junior faculty's performance against their scholarly benchmarks. Finally, we also organized a peer mentoring session for new facultydesigned to create additional peer support and shared learnings, and establish the importance of these relationships moving forward.
Core Seminars
We created a 12‐hour curriculum to cover a broad range of relevant AHM topics (Table 1). The choice of topics was informed by our needs assessment, suggestions of the FD Steering Committee, and the new faculty themselves. The sessions included a few didactic presentations, but they were largely interactive in a workshop‐style format to allow new faculty to engage the content. For instance, a session on quality improvement asked new faculty to bring a project idea and then work through creating a project plan. We coupled three half‐day sessions with a divisional social activity and made every attempt to ensure new faculty were not distracted by clinical responsibilities (eg, not on a clinical service or coverage was provided).
|
| Core Seminars |
| Being an academic hospitalist: The nuts & bolts |
| Tools for the master clinician |
| Documentation pearls & practices: Clinical, billing, and medico‐legal issues |
| Preparing your first talk: From topic selection to power point presentation |
| Choosing a case and writing it up for a clinical vignette abstract submission |
| Searching for clinical answers: An interactive computer‐lab workshop |
| Introduction to quality improvement |
| Leadership 101: Self‐awareness, your Myers‐Briggs, and leading change |
| Project Management: An exercise in team building |
| Thinking about systems and creating a culture of safety |
| Lunch Seminars |
| Managing and updating your academic CV |
| What to do when a patient on your service dies? |
| Evaluating students & housestaffAnd giving feedback |
| Being an effective ward attending |
| Medical‐legal consultative work & being an expert witness |
| Getting involved in professional societies |
| Understanding the promotion tracks: Practical tips and career preparation |
| Getting involved in hospital committee work |
| Caring for sick family members & navigating the healthcare system as a physician |
| Retirement planning 101: Life after UCSF |
| Time management & creating scholarly work |
| Teaching medical students on the wards |
| Clinical resources: What do you use to find answers? |
Teaching Course
One of our faculty (BAS) delivered the Stanford Faculty Development Clinical Teaching program16 (a train the trainer model designed to teach faculty how to become more effective teachers) to all new faculty. The program consisted of 14 hours of highly interactive curricula, video review, and role plays. The course was offered after hours (4 PM or 5 PM) and with input from the new faculty to ensure availability and participation.
Feedback and Observation
Each new faculty received directed feedback about their teaching and supervision on the housestaff service following their first rotation. Feedback was based on housestaff evaluations and direct observation of the new faculty during patient care and teaching rounds. One of our faculty (BAS) observed each new faculty member during rounds, and met with them individually to provide feedback and generate a discussion about teaching style and improvement opportunities.
Scholarly Expectations
We developed a set of scholarly expectations for new faculty. These helped inform the coach‐new faculty meetings and our selection of content for the Core Seminars. We initially had concerns that these expectations could overwhelm new faculty, but those junior faculty (years 2‐4) on the FD steering committee urged this practice, wishing they had similar guidance in their first year.
From the divisional perspective, we also added a number of new structures.
Grand Rounds
We established a monthly continuing medical education (CME) credit‐granting DHM Grand Rounds that combined a 10‐minute Hospital Medicine Update with a 45‐minute didactic presentation. The updates were presented by new faculty in order to provide them with an opportunity to receive feedback on their teaching and presentation skills (eg, how to give a talk, make PowerPoint slides, etc.). Didactic presentations were given by senior DHM faculty as well as subspecialty colleagues or ones from other departments (eg, dermatology or neurology), disciplines (eg, risk management), or campuses.
FD Lunch Seminar Series
Our division traditionally meets each Monday over the lunch hour to talk about service or academic issues. With a growing division, we believed there was an opportunity to better organize the content of these meetings. Once monthly, we dedicated a lunch session to a Faculty Development Seminar with topics that spanned a variety of interest areas, were driven by faculty suggestions, and were focused on being facilitated discussions rather than didactics. Table 1 provides examples of these seminar topics.
| Survey Statements Reporting Level of Comfort With(% responding somewhat agree or agree) | Previous Faculty, % (n = 11) | New Faculty, % (n = 6) |
|---|---|---|
| Identifying important resources within the School of Medicine | 64 | 83 |
| Identifying important resources within the Department of Medicine | 63 | 100 |
| Identifying important resources within the Division of Hospital Medicine | 90 | 100 |
| Identifying important resources within UCSF Medical Center | 72 | 67 |
| Having a system to effectively manage my email | 64 | 67 |
| Having a system to keep my CV updated | 64 | 84 |
| Using my non‐clinical time for academic success | 54 | 67 |
| Best practices for clinical/medico‐legal documentation | 54 | 67 |
| Best practices for billing documentation | 62 | 84 |
| Being an effective supervising ward attending | 90 | 84 |
| Being an effective teacher | 90 | 84 |
| Evaluating students and housestaff performance | 90 | 83 |
| Providing feedback to students and housestaff | 90 | 100 |
| Getting involved in professional societies | 27 | 100 |
| Understanding the difference between promotion pathways | 36 | 67 |
| Getting involved in hospital committee work | 54 | 84 |
| Choosing a good case for a clinical vignette submission to a regional/national meeting | 54 | 83 |
| Creating a poster for presentation at a regional/national meeting | 36 | 84 |
| Giving a lecture to students or residents | 64 | 84 |
| Developing a PowerPoint presentation for a lecture | 45 | 100 |
| Describing my personality type and how it relates to my work | 45 | 100 |
| Understanding important aspects of being a leader | 54 | 100 |
| Explaining the basic principles of quality improvement | 45 | 84 |
| Participating and contributing to a quality improvement project | 54 | 67 |
| Explaining the basic principles of patient safety | 45 | 67 |
| Understanding the factors that contribute to medical errors | 36 | 84 |
| Creating scholarly products from my work | 27 | 50 |
| Identifying what kind of mentors I need for the future | 45 | 100 |
| Category (% completed during first year) | Previous Faculty, % (n = 11) | New Faculty, % (n = 6) |
|---|---|---|
| Medical student teaching | 90 | 100 |
| Talk for trainees | 45 | 100 |
| Hospital committee involvement | 63 | 100 |
| Participation in a quality or safety project | 33 | 67 |
| Abstract submission | 27 | 50 |
| Identified mentor for year 2 | 63 | 83 |
Quality and Safety Lunch Seminars
In addition to our FD seminars, we also used one lunch session each month to provide updates on performance measures, ongoing quality or safety improvement initiatives, or a broader quality or safety topic. Speakers were either divisional or outside experts, depending on the topic, and organized by our director for quality and safety.
Incubator Sessions
Our director of research (AA) organized a weekly works in progress meeting, to which faculty and fellows brought ideas, grant applications, early manuscript drafts, or other potential scholarship products to obtain feedback and further group mentorship.
Divisional Retreats
We began alternating annual full‐day and mini half‐day retreats as a method to bring the division together, build camaraderie, set strategic priorities, identify divisional goals, and assess needs. These helped guide the creation of additional FD opportunities as well as our overall division's strategy to achieve our academic mission. The outcomes of these retreats led to many significant initiatives and policies, such as changes in compensation models, new scheduling processes, and decisions to spend resources on areas such as quality improvement.
Program Evaluation
Our evaluation focused on measuring the FD program's impact on our new faculty. We tracked their success in completing the stated scholarly expectations and surveyed them about their satisfaction with the programmatic activities, their first year on faculty, and their preparation for year 2. Prior to implementing the program, we surveyed the previous 2 years of new faculty to provide a comparison.
Results
Seven faculty participated in the inaugural program. We compared their scholarly output and experiences (6 faculty completed the survey; 87% response rate) with that of 11 more senior faculty who completed the comparison survey. Of note, the response rate of the comparison group was 69% (5 faculty who departed from our division during the previous 2 years were not surveyed). New faculty were surveyed at the start of the academic year with the follow‐up survey completed the following June. The more senior faculty completed the survey once at the same time as the baseline survey for the new faculty. All new faculty participated in each of the Core Seminars, the Teaching Course, the required number of Coaching sessions, and the observed teaching activity. We did not track their attendance at Divisional activities such as Grand Rounds or the Lunch Seminars.
Overall, the FD programmatic offerings were rated highly by new faculty (on a scale of 1 [lowest] to 5 [highest] for a global rating of each FD activity): Core Seminars 4.83 0.41, Coaching Program 4.5 0.84, Teaching Course 4.5 0.55, Grand Rounds 4.83 0.41, and Lunch Seminars 4.5 0.84. Table 2, which compares responses to a series of end of the year statements posed to new faculty, highlights notable differences in their level of comfort with specific skills and resource awareness. Given the small sample size, statistical significance was not calculated. Table 3 illustrates similar comparisons focused on academic output, which demonstrate that new faculty gave more talks to trainees, had greater involvement in hospital committees, more actively participated in quality and safety projects, and submitted more abstracts to regional or national meetings. New faculty also responded differently to which part of the FD program was most influential with 1 suggesting the Coaching Program, 2 the Core Seminars, 2 the entire program efforts, and 1 did not specify.
Table 4 illustrates comparison responses to a series of directed statements. New faculty all reported greater degrees of satisfaction overall, measured by the above responses, compared to previous faculty.
| Categories | Previous Faculty, % (n = 11) | New Faculty, % (n = 6) |
|---|---|---|
| ||
| Success: To what degree do you feel successful as an academic hospitalist at the end of your first year? (% responding successful or very successful) | 27 | 67 |
| Prepared: To what degree do you feel prepared for academic success moving into your second year on faculty? (% responding prepared or very prepared) | 27 | 100 |
| Part of DHM: I felt like an integral part of our division after my first year on faculty (% responding somewhat agree or agree) | 45 | 84 |
| Expectations: My first year on faculty exceeded my expectations (% responding somewhat agree or agree) | 27 | 84 |
Discussion
We implemented an FD program to foster the academic development of new faculty, and to mitigate the effects of growing clinical demands and a rapid group expansion on our academic mission. The impact of the program was measured by increased work satisfaction and academic output in first year faculty, greater self‐reported comfort in a variety of skills and knowledge of resources, and an improvement in our sense of purpose behind our academic mission. Though the program is only in its second year, we believe the model is of value for other AHM groups, and perhaps even nonacademic groups, all of whom may use such an investment in their hospitalists as a method to improve recruitment, job satisfaction, and retention.
Reviewing our program's first year suggests there were at least 3 keys to our success. First, we benefited tremendously from the time spent crafting a vision for the program and relying heavily on input from the target audience of junior faculty. Moreover, we made every effort to leverage existing resources (eg, using faculty who already taught about a given topic) and time commitments (eg, reshaping our existing Monday lunch meeting). Finally, we increasingly used our FD venues to connect and build networks with colleagues outside our division and within the hospital. This was a deliberate effort to create opportunities for individual faculty to be exposed to and collaborate with nonhospitalists for academic output.
Our research has some limitations, most notably the small sample size in evaluating the program for statistical significance, and the incomplete survey return rates. However, the results were quite consistent and the nonresponses of departed faculty would tend to bias our results toward the null. We also acknowledge the possibility of other confounding factors (eg, changes in clinical compensation models) that may have played a role, although compensation changes were relatively minor during the period studied and faculty did attribute many of the benefits in job satisfaction and skill building to the FD program itself.
Hospital medicine is an unusual field in that there is low barrier to entry and exit. Providers can change jobs without having to say goodbye to a large panel of patients, and in the continued mismatch between available positions and hospitalists, alternative positions can easily and quickly be found if they are dissatisfied.17 In the academic arena, even as hospitalists are hired to fill clinical gaps, they still have to perform under more traditional academic rules in order to be promoted and receive the support and kudos of colleagues and trainees. For both these reasons, early nurturing and socialization is critical to retention and academic success. While some opportunities for FD will be offered by national organizations,18 groups also have local responsibilities to support, mentor, and develop their junior faculty. Not only is such support crucial for the junior faculty themselves, but in our young field, the mentored very quickly become the mentors. Our decision to invest in both mentees and mentors reinforced the importance of mentorship for academic success and retention while planting the seeds for continued success and growth.1923 A recent study suggested that the environment for mentoring may be as important as the mentoring itself, a finding we did not specifically measure, but would support based our anecdotal experiences.24 This orientation toward future needs and creating the right milieu is crucial because demands for continued hospitalist growth are likely to remain.
Moving into year 2 of our FD program and reflecting on the lessons learned from year 1, we've adopted the same multifaceted approach with only minor adjustments to the curriculum, greater expansion of faculty involved in teaching and coaching, and a continued focus on building a sense of community around our academic mission. For the Core Seminars, we moved away from the 3 half‐day sessions and chose to host 2‐hour sessions every other month. This allowed for the same curriculum to be delivered but was much easier to logistically orchestrate. It also had the intended effect of bringing the new faculty together more regularly. In addition, we created dedicated sessions in preparation for our national meeting to allow faculty to bring abstract submissions for review and later, posters and oral presentations for feedback. These added sessions came partly as a suggestion from new faculty in our first year program, and seemed to further energize junior faculty around converting their projects into scholarship. Finally, we continue to further develop coaching and mentoring relationships in our division, partly a result of successful new facultycoach pairings.
In conclusion, our FD program had a noted impact on our new faculty and had a meaningful impact on our division in terms of camaraderie and cohesion, a shared commitment to an academic mission, and a mechanism for recruitment and retention. We hope our practical description for development and implementation of an FD program, including our specific tools, are useful to other groups considering such an initiative.
Acknowledgements
The authors thank Katherine Li for her invaluable assistance in coordinating the DHM FD program. They are also indebted to their faculty colleagues for their time and roles in teaching and mentoring within the program. Dr. Sehgal partly developed this program as part of a project during his California Healthcare Foundation Leadership Fellowship. Dr. Sharpe delivered the teaching workshops at UCSF after completing the Stanford Faculty Development Teaching Program.
- ,,,.The status of Hospital Medicine Groups in the United States.J Hosp Med.2006;1(2):75–80.
- Accreditation Council for Graduate Medical Education: information related to the ACGME's effort to address resident duty hours and other relevant resource materials. Available at: http://www.acgme.org/acWebsite/dutyHours/dh_index.asp. Accessed August 2010.
- ,,, et al.Effects of work hour reduction on residents' lives: a systematic review.JAMA.2005;294(9):1088–1100.
- ,,,,.Non‐housestaff medicine services in academic centers: models and challenges.J Hosp Med.2008;3(3):247–255.
- ,.Surgical comanagement: a natural evolution of hospitalist practice.J Hosp Med.2008;3(5):394–397.
- ,.The expanding role of hospitalists in the United States.Swiss Med Wkly.2006;136(37–38):591–596.
- 2007–08 Hospital Medicine Survey. Society of Hospital Medicine. Available at: http://www.hospitalmedicine.org/AM/Template.cfm?Section=Survey19(4):392–393.
- ,,, et al.Challenges and opportunities in Academic Hospital Medicine: report from the Academic Hospital Medicine Summit.J Hosp Med.2009;4(4):240–246.
- .Palliative care and hospitalists: a partnership for hope.J Hosp Med.2006;1(1):5–6.
- ,.Faculty development: principles and practices.J Vet Med Educ.2006;33(3):317–324.
- ,,, et al.A systematic review of faculty development initiatives designed to improve teaching effectiveness in medical education: BEME Guide No. 8.Med Teach.2006;28(6):497–526.
- ,.A successful approach to faculty development at an independent academic medical center.Med Teach.2008;30:e10–e14.
- ,,,.An innovative approach to supporting hospitalist physicians towards academic success.J Hosp Med.2008;3(4):314–318.
- ,,, et al.The curriculum for the Hospitalized Aging Medical Patient program: a collaborative faculty development program for hospitalists, general internists, and geriatricians.J Hosp Med.2008;3(5):384–393.
- Stanford Faculty Development Clinical Teaching Program. Available at: http://www.stanford.edu/group/SFDP. Accessed August 2010.
- ,,, et al.Trends in market demand for internal medicine 1999–2004: an analysis of physician job advertisements.J Gen Intern Med.2006;21(10):1079–1085.
- The Academic Hospitalist Academy. Available at: http://www.sgim.org/index.cfm?pageId=815. Accessed August 2010.
- ,,.Mentoring in academic medicine: a systematic review.JAMA.2006;296(9):1103–1115.
- ,,.Facilitating faculty success: outcomes and cost benefit of the UCSD National Center of Leadership in Academic Medicine.Acad Med.2004;79(10 Suppl):S9–S11.
- ,,, et al.Retention of junior faculty in academic medicine at the University of California, San Diego.Acad Med.2009;84(1):37–41.
- ,,,.Helping medical school faculty realize their dreams: an innovative, collaborative mentoring program.Acad Med.2002;77:377–384.
- ,,, et al.Physicians' perceptions of institutional and leadership factors influencing their job satisfaction at one academic medical center.Acad Med.2002;77:1235–1240.
- ,,.A systematic review of qualitative research on the meaning and characteristics of mentoring in academic medicine.J Gen Intern Med.2010;25(1);72–78.
Copyright © 2011 Society of Hospital Medicine
A Novel Approach to Physician Shortages
The demand for physician talent is intensifying as the US healthcare system confronts an unprecedented confluence of demographic pressures. Not only will 78 million retiring baby‐boomers require significant healthcare resources, but tens of thousands of practicing physicians will themselves reach retirement age within the next decade.1 At the same time, factors like the large increase in the percentage of female physicians (who are more likely to work part time), the growth of nonpractice opportunities for MDs, and generational demands for greater worklife balance are creating a major supply‐demand mismatch within the physician workforce.2 In this demographic atmosphere, the ability to recruit and retain physician leaders confers tremendous value to healthcare enterprisesboth public and private. Recruiting and retaining strategies already weigh heavily in the most palpable shortage areas, like primary care, but the system faces widespread unmet demand for a variety of specialist and generalist practitioners.36
This article does not address the public policy implications of the upcoming physician shortage, recognition of which will lead to the largest increase in new medical school slots in decades.7 Rather, we set out to illustrate how successful nonmedical businesses are embracing a thoughtful, systematic approach to retaining talent, based on the philosophy that keeping and engaging valued employees is more efficient than recruiting and orienting replacements. We posit that the innovations used by progressive companies could apply to recruitment and retention challenges confronting medicine.
How Industry Approaches the Talent Vacuum: Talent Facilitation
Leaders outside of medicine have long acknowledged that changing demographics and a global economy are driving unprecedented employee turnover.8 In confronting a talent vacuum, forward‐thinking managers have prioritized retaining key talent (rather than hiring anew) in planning for the future.9, 10 Doing so begins with attempts to understand the relationship between workers and the workplace, with a particular emphasis on appreciating workers' priorities. Indeed, new executive positions with titles like Chief Learning Officer and Chief Experience Officer are appearing as companies realize a need for focused expertise beyond traditional human resource departments. These companies understand that offering higher salaries is not the only retention strategyand often not even the most effective one.
The Four Actions of Talent Facilitation
The talent facilitation process centers on four actions: attract, engage, develop, and retain. None of these actions can stand alone, and all should be present, to some degree, at all stages of a worker's tenure. To attract or engage an employee or practice partner is not a 1‐time hook, but a constant and dynamic process.
Importantly, the concepts addressed here are not specific to 1 type of corporate system, size, or management level. Although the early business focus had been on upper‐level and executive talent within large corporate settings, there is an increasing recognition that a dedicated talent strategy is useful wherever recruiting and retaining talented people is important (and where is it not?).
The ideas presented here may seem most applicable to leaders of large physician corporations, hospital‐owned physician groups, or large integrated healthcare systems (such as Kaiser) that employ physicians. However, we also believe that the ideas apply across‐the‐board in medicine, including entities such as small, private, physician‐owned groups. We argue that regardless of the exact practice structure, a limited pool of resources must be dedicated to the attraction and retention of talented partners or employees, or to the cost of replacing those people if they pursue other opportunities (or the cost of inefficient and disengaged physicians). While an integrated health system may have the resources and scale to hire a Chief Experience Officer, we do not anticipate that a 5‐partner private practice would. Rather, we point to examples to illustrate the talent facilitation paradigm as a tool to systematically frame the allocation of those resources. Undoubtedly, the specific shape of a thoughtful talent facilitation effort will vary when applied in a large urban academic medical center vs. an integrated healthcare system vs. a small physician private practice, but the basic principles remain the same.
Attract
Increasingly, companies approach talented prospects with dedicated marketing campaigns to convey the value of a work environment.11 Silicon Valley employee lounges with free massages and foosball tables are the iconic example of attraction, but the concept runs deeper. Today's workers seek access to state‐of‐the‐art ideas and technology and often want to be part of a larger vision. Many seek opportunities to integrate their own professional and personal aspirations into a particular job description.
Hospital executives have long recognized the importance of attracting physicians to their facility (after all, the physicians draw patients and thus generate revenue). The traditional approach has surrounded perks, from comfortable doctor's lounges to the latest in surgical technology. But, the stakes seem greater now than before, and successful talent facilitation strategies are going beyond the tried and true.
Clearly, physicians seek financially stable practice settings with historical success. But they may also seek evidence of a defined strategic plan focused on more than mere profitability. Physicians may gravitate to practice environments that endorse progressive movements like the No One Dies Alone campaign.12 Similarly, recognition of movements beyond healthcarea commitment to Leadership in Energy and Environmental Design (LEED) (Green Building Rating System; US Green Building Council [USGBC];
The current recruitment campaign of California's prison healthcare system offers an unlikely source of inspiration. The prison system was placed in receivership to address a shortage of competent physician staff and other inadequacies. A central feature of the campaign is an attractive starting salary and good benefits. But, the campaign does not rely on money alone. For example, the campaign's website (

Engage
The corporate tool being employed at this stage is a strategy called on‐boarding, which emphasizes a streamlined integration of newcomers with existing workers and culture, and prioritizes aligning organizational roles with a worker's specific skills and interests. On‐boarding also emphasizes the value of early and frequent provision of constructive feedback from same‐level peers or managers with advanced coaching skills.
Many companies use formal survey tools to measure employee engagement and regularly evaluate the proficiency of system leaders in the ability to engage their employees. An engineering firm executive recently told us (P.K., C.K.) that he performs detailed and frequent on‐the‐job interviews, even with company veterans. The primary goal of these interviews is to ensure that engineers spend at least 85% of their time on work that: (1) they find interesting and (2) allows for the application of their best skills. Wherever possible, traditional job descriptions are altered to achieve this. Inevitably, there is still work (15% in this particular corporate vision) that no one prefers but needs to get done, but this process of active recalibration minimizes this fraction to the degree possible.
Even within a small physician practice group, one can imagine how a strategic approach of inviting and acknowledging individual physician's professional goals and particular talents may challenge the long‐held belief that everyone within a group enjoys and must do the exact same job. Once these goals and talents are articulated, groups may find that allowing for more customized roles within the practice enhances professional satisfaction.
Social networking, collaboration, and sharing of best practices are staples of engaging companies. The Cisco and Qualcomm companies, for example, utilize elaborate e‐networks (rough corporate equivalents to Facebook) to foster collegial interaction within and across traditional hierarchical boundaries so that managers and executives directly engage the ideas of employees at every level.14 The premise is logical: engaged employees will be more likely to contribute innovative ideas which, when listened to, are more likely to engage employees.
Most physicians will recognize the traditional resident report as a model for engagement. Beyond its educational value, interaction with program leadership, social bonding, collaborative effort, and exploration of best practices add tremendous value. Many companies would jump at the chance to engrain a similar cultural staple. Enhancing this type of interaction in a postresidency setting may promote engagement in a given system, especially if it facilitates interactions between physicians and senior hospital leaders. Absent these types of interactions, ensuring regular provision of peer review and/or constructive feedback can help systematically enhance 2‐way communication and enhance engagement.
Develop
Talent development relies on mentorship reflecting a genuine interest in an individual's future. Development strategies include pairing formal annual talent reviews or (in the case of practice partners) formal peer review with strategic development plans. Effective development strategy may include transparent succession planning so that individuals are aware they are being groomed for future roles.
A well‐known adage suggests, People quit the manager or administrator, not the job. Development in this sense relies on presenting new opportunities and knowing that people flourish when allowed to explore multiple paths forward. In many companies, the role of Chief Experience or Chief Learning Officers is to enhance development planning. Consider how career coaching of young hospitalists could transform an infinitely portable and volatile commodity job, prone to burnout, into an engaged specialist of sorts with immense value to a hospital. Hospitalists have already demonstrated their potential as quality improvement leaders.15 Imagine if hospital leadership enlisted a young hospitalist in a relevant quality improvement task force, such as one working on preventing falls. With appropriate support, the physician could obtain skills for quality improvement evaluation that would not only enhance his or her engagement with the hospital system but also provide a valuable analysis for the hospital.
As an example of development strategy within a small practice setting, consider the following real‐life anecdote: a group of 4 physicians recently completed a long and expensive recruitment of a new partner. The new partner, intrigued by the local hospital's surgical robot technology, sought the support of her partners (who are not currently using the technology) to partake in an expensive robotics training program. The partners decided not to provide the financial support. The new partner subsequently left the group for a nearby practice opportunity that would provide for the training, and the group was faced with the loss of a partner (one‐fourth of the practice!) and the cost of repeating the recruiting process. A preemptive evaluation of the value of investing in the development of the new partner and enhancing that partner's professional development may have proven wise despite the significant up‐front costs. In this case the manager the new partner quit was the inflexibility of the practice trajectory.
Retain
The economic incentive to retain talented workers is not subtle. If it was, companies would not be funneling resources into Chief Experience Officers. Likewise, the estimated cost for a medical practice to replace an individual physician is as at least $250,000.16, 17
In retention, as in attraction, salary is only part of the equation.18 People want fair and competitive compensation, and may leave if they are not getting it, but they will not stay (and will not stay engaged) only for a salary bump. Retention is enhanced when workers can advance according to skills and talent, rather than mere tenure. An effective retention policy responds to people's desire to incorporate individual professional goals into their work and allows for people to customize their career rather than simply occupy a job class. Effective retention policy respects worklife balance and recognizes that this balance might look different for 2 people with the same job. It may take the form of positive reinforcement (rather than subtle disdain) for using vacation time or allowing for participation in international service projects. Many literally feel that they need to quit their job in order to take time off or explore other interests.
Worklife balance has been a longstanding issue in medicine, and innovative augmentation strategies may well help retain top talent. Today's successful medical school applicants not only show aptitude in the classroom, they often have many well‐developed nonmedical skills. No one can expect that medical training will somehow convince them to leave everything else behind. Moreover, today's residency graduates, already with Generation Y sensibilities, have completed their entire training under the auspices of the Accreditation Council for Graduate Medical Education (ACGME) duty hours regulations, which has made residents far more comfortable with shift work and defined hours.
At the other end of the generation spectrum, as large numbers of physicians ready for retirement, effective talent facilitation strategies may evaluate how to reoffer medicine as a valid option for senior physicians who still wish to work. Retaining these physicians will require an appreciation of their lifestyle goals, as they will likely find continuing a traditional practice role untenable. A recent survey of orthopedic surgeons 50 years of age or older found that having a part‐time option was a common reason they continued practicing, and that the option to work part‐time would have the most impact on keeping these surgeons working past age 65 years.19 Those working part‐time were doing so in a wide range of practice arrangements including private practice. However, one‐third of those surveyed said a part‐time option was not available to them. Clearly, in an environment of workforce shortages, physician‐leaders must begin to think about worklife balance not only for new doctors but for those considering retirement.
Critics will point out the financial drawbacks in the provision of worklife balance. But the cost may pale in comparison to the cost of replacing physician leaders. Moreover, engaged physicians are more likely to add value in the form of intangible capital such as patient satisfaction and practice innovation. As such, we argue that effective retention strategy in medicine is likely to be cost‐effective, even if it requires significant new up‐front resources.
Lessons From Industry
Doctors frequently assume that the challenges and obstacles confronted in healthcare are unique to medicine. But, for every phrase like When I started practice, I decided how long office visits were, not the insurance company, or Young doctors just don't want to work as hard, there is a parallel utterance in the greater business world. Luckily, there are now examples of the healthcare world learning lessons from business. For example, innovators in medical quality improvement found value in the experience of other industries.20 Airlines and automakers have long honed systems for error prevention and possess expertise that may curb errors in the hospital.2123
We suspect that the ideas and practice of talent facilitation have already made their way into some medical settings. A Google search reveals multiple opportunities for hospital‐based talent managers, and websites advertise the availability of talent consultants ready to lend their expertise to the medical world. In the arena of academic medicine, the University of California, San Francisco (UCSF) Division of Hospital Medicine put some of the ideas of talent facilitation into practice over the past year, in part in response to an increasingly competitive market for academic hospitalists.24 Leaders introduced a formal faculty development program that links junior faculty with mentors and facilitates early and frequent feedback across hierarchical boundaries.25 These more intentional mentoring efforts were accompanied by a seminar series aimed at the needs of new faculty members, a research incubator program, divisional grand rounds, and other web‐based and in‐person forums for sharing best practices and innovations. Less formal social events have also been promoted. Importantly, these sweeping strategies seek to encompass the needs of both teaching and nonteaching hospitalists within UCSF.26
Clearly, an academic hospitalist group with 45 faculty physicians has unique characteristics that inform the specifics of its talent facilitation strategy. The interventions discussed above are meant to represent examples of the types of strategies that may be utilized by physician groups once a decision is made to focus on talent management. Undoubtedly, the shape of such efforts will vary in diverse practice settings, but physician leaders have much to gain through further exploration of where these core principles already exist within medicine and where they may be more effectively deployed. By examining how multinational businesses are systematically applying the concepts of talent facilitation to address a global talent shortage, the doctoring profession might again take an outside hint to help inform its future.
- Long Term Care: Aging Baby Boom Generation Will Increase Demand and Burden on Federal and State Budgets. United States General Accounting Office Testimony before the Special Committee on Aging, US Senate. Hearing Before the Special Committee on Aging of the US Senate,2002. Available at:http://www.gao.gov/new.items/d02544t.pdf. Accessed July 2009.
- ,.Physician workforce shortages: implications and issues for academic health centers and policymakers.Acad Med.2006;81(9):782–787.
- .New York moves to tackle shortage of primary‐care doctors.Lancet.2008;371(9615):801–802.
- ,.The US dermatology workforce: a specialty remains in shortage.J Am Acad Dermatol.2008;59(5):741–745.
- ,.Challenges and opportunities for recruiting a new generation of neurosurgeons.Neurosurgery.2007;61(6):1314–1319.
- ,.The developing crisis in the national general surgery workforce.J Am Coll Surg.2008;206(5):790–795.
- Medical School Enrollment Plans: Analysis of the 2007 AAMC Survey. Publication of the Association of American Medical Colleges, Center for Workforce Studies, April2008. Available at:http://www.aamc.org/workforce. Accessed July 2009.
- It's 2008: Do You Know Where Your Talent Is? Why acquisition and retention strategies don't work. Part 1 of a Deloitte Research Series on Talent Management.2008. Available at: http://www.deloitte.com/dtt/cda/content/UKConsulting_TalentMgtResearchReport.pdf. Accessed August 2009.
- ,,.The race for talent: retaining and engaging workers in the 21st century.Hum Resour Plann.2004;27(3):12–25.
- Expecting sales growth, CEOs cite worker retention as critical to success. March 1,2004. Available at:http://www.barometersurveys.com/production/barsurv.nsf/89343582e94adb6185256b84006c8ffe/9672ab2f54cf99f885256e5500768232?OpenDocument. Accessed July 2009.
- Jet Blue announces aviation university gateway program for pilot candidates: airline partners with Embry‐Riddle Aeronautical University, University of North Dakota, and Cape Air to fill pilot pipeline. January 30, 2008. Available at:http://investor.jetblue.com/phoenix.zhtml?c=131045287(4):487–494.
- ,,.A review of physician turnover: rates, causes, and consequences.Am J Med Qual.2004;19(2):56–66.
- ,,.The impact on revenue of physician turnover: an assessment model and experience in a large healthcare center.J Med Pract Manage.2006;21(6):351–355.
- ,,.Employee motivation: a powerful new model.Harv Bus Rev.2008;86(7–8):78,84,160.
- ,,.Work satisfaction and retirement plans of orthopaedic surgeons 50 years of age or older.Clin Orthop Relat Res.2008;466(1):231–238.
- ,,,.The long road to patient safety: a status report on patient safety systems.JAMA.2005(22);294:2858–2865.
- .Error reduction through team leadership: what surgeons can learn from the airline industry.Clin Neurosurg.2007;54:195–199.
- ,.Applying the Toyota production system: using a patient safety alert system to reduce error.Jt Comm J Qual Patient Saf.2007;33(7):376–386.
- ,,,.Improving Papanikolaou test quality and reducing medical errors by using Toyota production system methods.Am J Obstet Gynecol.2006;194(1):57–64.
- Society of Hospital Medicine Career Satisfaction Task Force. White Paper on Hospitalist Career Satisfaction.2006; 1–45. Available at: http://www.hospitalmedicine.org. Accessed July 2009.
- UCSF Department of Medicine, Division of Hospital Medicine, Faculty Development. Available at: http://hospsrvr.ucsf.edu/cme/fds.html. Accessed July 2009.
- ,,, et al. Non‐housestaff medicine services in academic centers: models and challenges.J Hosp Med.2008;3(3):247–245.
The demand for physician talent is intensifying as the US healthcare system confronts an unprecedented confluence of demographic pressures. Not only will 78 million retiring baby‐boomers require significant healthcare resources, but tens of thousands of practicing physicians will themselves reach retirement age within the next decade.1 At the same time, factors like the large increase in the percentage of female physicians (who are more likely to work part time), the growth of nonpractice opportunities for MDs, and generational demands for greater worklife balance are creating a major supply‐demand mismatch within the physician workforce.2 In this demographic atmosphere, the ability to recruit and retain physician leaders confers tremendous value to healthcare enterprisesboth public and private. Recruiting and retaining strategies already weigh heavily in the most palpable shortage areas, like primary care, but the system faces widespread unmet demand for a variety of specialist and generalist practitioners.36
This article does not address the public policy implications of the upcoming physician shortage, recognition of which will lead to the largest increase in new medical school slots in decades.7 Rather, we set out to illustrate how successful nonmedical businesses are embracing a thoughtful, systematic approach to retaining talent, based on the philosophy that keeping and engaging valued employees is more efficient than recruiting and orienting replacements. We posit that the innovations used by progressive companies could apply to recruitment and retention challenges confronting medicine.
How Industry Approaches the Talent Vacuum: Talent Facilitation
Leaders outside of medicine have long acknowledged that changing demographics and a global economy are driving unprecedented employee turnover.8 In confronting a talent vacuum, forward‐thinking managers have prioritized retaining key talent (rather than hiring anew) in planning for the future.9, 10 Doing so begins with attempts to understand the relationship between workers and the workplace, with a particular emphasis on appreciating workers' priorities. Indeed, new executive positions with titles like Chief Learning Officer and Chief Experience Officer are appearing as companies realize a need for focused expertise beyond traditional human resource departments. These companies understand that offering higher salaries is not the only retention strategyand often not even the most effective one.
The Four Actions of Talent Facilitation
The talent facilitation process centers on four actions: attract, engage, develop, and retain. None of these actions can stand alone, and all should be present, to some degree, at all stages of a worker's tenure. To attract or engage an employee or practice partner is not a 1‐time hook, but a constant and dynamic process.
Importantly, the concepts addressed here are not specific to 1 type of corporate system, size, or management level. Although the early business focus had been on upper‐level and executive talent within large corporate settings, there is an increasing recognition that a dedicated talent strategy is useful wherever recruiting and retaining talented people is important (and where is it not?).
The ideas presented here may seem most applicable to leaders of large physician corporations, hospital‐owned physician groups, or large integrated healthcare systems (such as Kaiser) that employ physicians. However, we also believe that the ideas apply across‐the‐board in medicine, including entities such as small, private, physician‐owned groups. We argue that regardless of the exact practice structure, a limited pool of resources must be dedicated to the attraction and retention of talented partners or employees, or to the cost of replacing those people if they pursue other opportunities (or the cost of inefficient and disengaged physicians). While an integrated health system may have the resources and scale to hire a Chief Experience Officer, we do not anticipate that a 5‐partner private practice would. Rather, we point to examples to illustrate the talent facilitation paradigm as a tool to systematically frame the allocation of those resources. Undoubtedly, the specific shape of a thoughtful talent facilitation effort will vary when applied in a large urban academic medical center vs. an integrated healthcare system vs. a small physician private practice, but the basic principles remain the same.
Attract
Increasingly, companies approach talented prospects with dedicated marketing campaigns to convey the value of a work environment.11 Silicon Valley employee lounges with free massages and foosball tables are the iconic example of attraction, but the concept runs deeper. Today's workers seek access to state‐of‐the‐art ideas and technology and often want to be part of a larger vision. Many seek opportunities to integrate their own professional and personal aspirations into a particular job description.
Hospital executives have long recognized the importance of attracting physicians to their facility (after all, the physicians draw patients and thus generate revenue). The traditional approach has surrounded perks, from comfortable doctor's lounges to the latest in surgical technology. But, the stakes seem greater now than before, and successful talent facilitation strategies are going beyond the tried and true.
Clearly, physicians seek financially stable practice settings with historical success. But they may also seek evidence of a defined strategic plan focused on more than mere profitability. Physicians may gravitate to practice environments that endorse progressive movements like the No One Dies Alone campaign.12 Similarly, recognition of movements beyond healthcarea commitment to Leadership in Energy and Environmental Design (LEED) (Green Building Rating System; US Green Building Council [USGBC];
The current recruitment campaign of California's prison healthcare system offers an unlikely source of inspiration. The prison system was placed in receivership to address a shortage of competent physician staff and other inadequacies. A central feature of the campaign is an attractive starting salary and good benefits. But, the campaign does not rely on money alone. For example, the campaign's website (
Engage
The corporate tool being employed at this stage is a strategy called on‐boarding, which emphasizes a streamlined integration of newcomers with existing workers and culture, and prioritizes aligning organizational roles with a worker's specific skills and interests. On‐boarding also emphasizes the value of early and frequent provision of constructive feedback from same‐level peers or managers with advanced coaching skills.
Many companies use formal survey tools to measure employee engagement and regularly evaluate the proficiency of system leaders in the ability to engage their employees. An engineering firm executive recently told us (P.K., C.K.) that he performs detailed and frequent on‐the‐job interviews, even with company veterans. The primary goal of these interviews is to ensure that engineers spend at least 85% of their time on work that: (1) they find interesting and (2) allows for the application of their best skills. Wherever possible, traditional job descriptions are altered to achieve this. Inevitably, there is still work (15% in this particular corporate vision) that no one prefers but needs to get done, but this process of active recalibration minimizes this fraction to the degree possible.
Even within a small physician practice group, one can imagine how a strategic approach of inviting and acknowledging individual physician's professional goals and particular talents may challenge the long‐held belief that everyone within a group enjoys and must do the exact same job. Once these goals and talents are articulated, groups may find that allowing for more customized roles within the practice enhances professional satisfaction.
Social networking, collaboration, and sharing of best practices are staples of engaging companies. The Cisco and Qualcomm companies, for example, utilize elaborate e‐networks (rough corporate equivalents to Facebook) to foster collegial interaction within and across traditional hierarchical boundaries so that managers and executives directly engage the ideas of employees at every level.14 The premise is logical: engaged employees will be more likely to contribute innovative ideas which, when listened to, are more likely to engage employees.
Most physicians will recognize the traditional resident report as a model for engagement. Beyond its educational value, interaction with program leadership, social bonding, collaborative effort, and exploration of best practices add tremendous value. Many companies would jump at the chance to engrain a similar cultural staple. Enhancing this type of interaction in a postresidency setting may promote engagement in a given system, especially if it facilitates interactions between physicians and senior hospital leaders. Absent these types of interactions, ensuring regular provision of peer review and/or constructive feedback can help systematically enhance 2‐way communication and enhance engagement.
Develop
Talent development relies on mentorship reflecting a genuine interest in an individual's future. Development strategies include pairing formal annual talent reviews or (in the case of practice partners) formal peer review with strategic development plans. Effective development strategy may include transparent succession planning so that individuals are aware they are being groomed for future roles.
A well‐known adage suggests, People quit the manager or administrator, not the job. Development in this sense relies on presenting new opportunities and knowing that people flourish when allowed to explore multiple paths forward. In many companies, the role of Chief Experience or Chief Learning Officers is to enhance development planning. Consider how career coaching of young hospitalists could transform an infinitely portable and volatile commodity job, prone to burnout, into an engaged specialist of sorts with immense value to a hospital. Hospitalists have already demonstrated their potential as quality improvement leaders.15 Imagine if hospital leadership enlisted a young hospitalist in a relevant quality improvement task force, such as one working on preventing falls. With appropriate support, the physician could obtain skills for quality improvement evaluation that would not only enhance his or her engagement with the hospital system but also provide a valuable analysis for the hospital.
As an example of development strategy within a small practice setting, consider the following real‐life anecdote: a group of 4 physicians recently completed a long and expensive recruitment of a new partner. The new partner, intrigued by the local hospital's surgical robot technology, sought the support of her partners (who are not currently using the technology) to partake in an expensive robotics training program. The partners decided not to provide the financial support. The new partner subsequently left the group for a nearby practice opportunity that would provide for the training, and the group was faced with the loss of a partner (one‐fourth of the practice!) and the cost of repeating the recruiting process. A preemptive evaluation of the value of investing in the development of the new partner and enhancing that partner's professional development may have proven wise despite the significant up‐front costs. In this case the manager the new partner quit was the inflexibility of the practice trajectory.
Retain
The economic incentive to retain talented workers is not subtle. If it was, companies would not be funneling resources into Chief Experience Officers. Likewise, the estimated cost for a medical practice to replace an individual physician is as at least $250,000.16, 17
In retention, as in attraction, salary is only part of the equation.18 People want fair and competitive compensation, and may leave if they are not getting it, but they will not stay (and will not stay engaged) only for a salary bump. Retention is enhanced when workers can advance according to skills and talent, rather than mere tenure. An effective retention policy responds to people's desire to incorporate individual professional goals into their work and allows for people to customize their career rather than simply occupy a job class. Effective retention policy respects worklife balance and recognizes that this balance might look different for 2 people with the same job. It may take the form of positive reinforcement (rather than subtle disdain) for using vacation time or allowing for participation in international service projects. Many literally feel that they need to quit their job in order to take time off or explore other interests.
Worklife balance has been a longstanding issue in medicine, and innovative augmentation strategies may well help retain top talent. Today's successful medical school applicants not only show aptitude in the classroom, they often have many well‐developed nonmedical skills. No one can expect that medical training will somehow convince them to leave everything else behind. Moreover, today's residency graduates, already with Generation Y sensibilities, have completed their entire training under the auspices of the Accreditation Council for Graduate Medical Education (ACGME) duty hours regulations, which has made residents far more comfortable with shift work and defined hours.
At the other end of the generation spectrum, as large numbers of physicians ready for retirement, effective talent facilitation strategies may evaluate how to reoffer medicine as a valid option for senior physicians who still wish to work. Retaining these physicians will require an appreciation of their lifestyle goals, as they will likely find continuing a traditional practice role untenable. A recent survey of orthopedic surgeons 50 years of age or older found that having a part‐time option was a common reason they continued practicing, and that the option to work part‐time would have the most impact on keeping these surgeons working past age 65 years.19 Those working part‐time were doing so in a wide range of practice arrangements including private practice. However, one‐third of those surveyed said a part‐time option was not available to them. Clearly, in an environment of workforce shortages, physician‐leaders must begin to think about worklife balance not only for new doctors but for those considering retirement.
Critics will point out the financial drawbacks in the provision of worklife balance. But the cost may pale in comparison to the cost of replacing physician leaders. Moreover, engaged physicians are more likely to add value in the form of intangible capital such as patient satisfaction and practice innovation. As such, we argue that effective retention strategy in medicine is likely to be cost‐effective, even if it requires significant new up‐front resources.
Lessons From Industry
Doctors frequently assume that the challenges and obstacles confronted in healthcare are unique to medicine. But, for every phrase like When I started practice, I decided how long office visits were, not the insurance company, or Young doctors just don't want to work as hard, there is a parallel utterance in the greater business world. Luckily, there are now examples of the healthcare world learning lessons from business. For example, innovators in medical quality improvement found value in the experience of other industries.20 Airlines and automakers have long honed systems for error prevention and possess expertise that may curb errors in the hospital.2123
We suspect that the ideas and practice of talent facilitation have already made their way into some medical settings. A Google search reveals multiple opportunities for hospital‐based talent managers, and websites advertise the availability of talent consultants ready to lend their expertise to the medical world. In the arena of academic medicine, the University of California, San Francisco (UCSF) Division of Hospital Medicine put some of the ideas of talent facilitation into practice over the past year, in part in response to an increasingly competitive market for academic hospitalists.24 Leaders introduced a formal faculty development program that links junior faculty with mentors and facilitates early and frequent feedback across hierarchical boundaries.25 These more intentional mentoring efforts were accompanied by a seminar series aimed at the needs of new faculty members, a research incubator program, divisional grand rounds, and other web‐based and in‐person forums for sharing best practices and innovations. Less formal social events have also been promoted. Importantly, these sweeping strategies seek to encompass the needs of both teaching and nonteaching hospitalists within UCSF.26
Clearly, an academic hospitalist group with 45 faculty physicians has unique characteristics that inform the specifics of its talent facilitation strategy. The interventions discussed above are meant to represent examples of the types of strategies that may be utilized by physician groups once a decision is made to focus on talent management. Undoubtedly, the shape of such efforts will vary in diverse practice settings, but physician leaders have much to gain through further exploration of where these core principles already exist within medicine and where they may be more effectively deployed. By examining how multinational businesses are systematically applying the concepts of talent facilitation to address a global talent shortage, the doctoring profession might again take an outside hint to help inform its future.
- Long Term Care: Aging Baby Boom Generation Will Increase Demand and Burden on Federal and State Budgets. United States General Accounting Office Testimony before the Special Committee on Aging, US Senate. Hearing Before the Special Committee on Aging of the US Senate,2002. Available at:http://www.gao.gov/new.items/d02544t.pdf. Accessed July 2009.
- ,.Physician workforce shortages: implications and issues for academic health centers and policymakers.Acad Med.2006;81(9):782–787.
- .New York moves to tackle shortage of primary‐care doctors.Lancet.2008;371(9615):801–802.
- ,.The US dermatology workforce: a specialty remains in shortage.J Am Acad Dermatol.2008;59(5):741–745.
- ,.Challenges and opportunities for recruiting a new generation of neurosurgeons.Neurosurgery.2007;61(6):1314–1319.
- ,.The developing crisis in the national general surgery workforce.J Am Coll Surg.2008;206(5):790–795.
- Medical School Enrollment Plans: Analysis of the 2007 AAMC Survey. Publication of the Association of American Medical Colleges, Center for Workforce Studies, April2008. Available at:http://www.aamc.org/workforce. Accessed July 2009.
- It's 2008: Do You Know Where Your Talent Is? Why acquisition and retention strategies don't work. Part 1 of a Deloitte Research Series on Talent Management.2008. Available at: http://www.deloitte.com/dtt/cda/content/UKConsulting_TalentMgtResearchReport.pdf. Accessed August 2009.
- ,,.The race for talent: retaining and engaging workers in the 21st century.Hum Resour Plann.2004;27(3):12–25.
- Expecting sales growth, CEOs cite worker retention as critical to success. March 1,2004. Available at:http://www.barometersurveys.com/production/barsurv.nsf/89343582e94adb6185256b84006c8ffe/9672ab2f54cf99f885256e5500768232?OpenDocument. Accessed July 2009.
- Jet Blue announces aviation university gateway program for pilot candidates: airline partners with Embry‐Riddle Aeronautical University, University of North Dakota, and Cape Air to fill pilot pipeline. January 30, 2008. Available at:http://investor.jetblue.com/phoenix.zhtml?c=131045287(4):487–494.
- ,,.A review of physician turnover: rates, causes, and consequences.Am J Med Qual.2004;19(2):56–66.
- ,,.The impact on revenue of physician turnover: an assessment model and experience in a large healthcare center.J Med Pract Manage.2006;21(6):351–355.
- ,,.Employee motivation: a powerful new model.Harv Bus Rev.2008;86(7–8):78,84,160.
- ,,.Work satisfaction and retirement plans of orthopaedic surgeons 50 years of age or older.Clin Orthop Relat Res.2008;466(1):231–238.
- ,,,.The long road to patient safety: a status report on patient safety systems.JAMA.2005(22);294:2858–2865.
- .Error reduction through team leadership: what surgeons can learn from the airline industry.Clin Neurosurg.2007;54:195–199.
- ,.Applying the Toyota production system: using a patient safety alert system to reduce error.Jt Comm J Qual Patient Saf.2007;33(7):376–386.
- ,,,.Improving Papanikolaou test quality and reducing medical errors by using Toyota production system methods.Am J Obstet Gynecol.2006;194(1):57–64.
- Society of Hospital Medicine Career Satisfaction Task Force. White Paper on Hospitalist Career Satisfaction.2006; 1–45. Available at: http://www.hospitalmedicine.org. Accessed July 2009.
- UCSF Department of Medicine, Division of Hospital Medicine, Faculty Development. Available at: http://hospsrvr.ucsf.edu/cme/fds.html. Accessed July 2009.
- ,,, et al. Non‐housestaff medicine services in academic centers: models and challenges.J Hosp Med.2008;3(3):247–245.
Hospitalists and Quality of Care
Quality of care in US hospitals is inconsistent and often below accepted standards.1 This observation has catalyzed a number of performance measurement initiatives intended to publicize gaps and spur quality improvement.2 As the field has evolved, organizational factors such as teaching status, ownership model, nurse staffing levels, and hospital volume have been found to be associated with performance on quality measures.1, 3‐7 Hospitalists represent a more recent change in the organization of inpatient care8 that may impact hospital‐level performance. In fact, most hospitals provide financial support to hospitalists, not only for hopes of improving efficiency, but also for improving quality and safety.9
Only a few single‐site studies have examined the impact of hospitalists on quality of care for common medical conditions (ie, pneumonia, congestive heart failure, and acute myocardial infarction), and each has focused on patient‐level effects. Rifkin et al.10, 11 did not find differences between hospitalists' and nonhospitalists' patients in terms of pneumonia process measures. Roytman et al.12 found hospitalists more frequently prescribed afterload‐reducing agents for congestive heart failure (CHF), but other studies have shown no differences in care quality for heart failure.13, 14 Importantly, no studies have examined the role of hospitalists in the care of patients with acute myocardial infarction (AMI). In addition, studies have not addressed the effect of hospitalists at the hospital level to understand whether hospitalists have broader system‐level effects reflected by overall hospital performance.
We hypothesized that the presence of hospitalists within a hospital would be associated with improvements in hospital‐level adherence to publicly reported quality process measures, and having a greater percentage of patients admitted by hospitalists would be associated with improved performance. To test these hypotheses, we linked data from a statewide census of hospitalists with data collected as part of a hospital quality‐reporting initiative.
Materials and Methods
Study Sites
We examined the performance of 209 hospitals (63% of all 334 non‐federal facilities in California) participating in the California Hospital Assessment and Reporting Taskforce (CHART) at the time of the survey. CHART is a voluntary quality reporting initiative that began publicly reporting hospital quality data in January 2006.
Hospital‐level Organizational, Case‐mix, and Quality Data
Hospital organizational characteristics (eg, bed size) were obtained from publicly available discharge and utilization data sets from the California Office of Statewide Health Planning and Development (OSHPD). We also linked hospital‐level patient‐mix data (eg, race) from these OSHPD files.
We obtained quality of care data from CHART for January 2006 through June 2007, the time period corresponding to the survey. Quality metrics included 16 measures collected by the Center for Medicare and Medicaid Services (www.cms.hhs.gov) and extensively used in quality research.1, 4, 13, 15‐17 Rather than define a single measure, we examined multiple process measures, anticipating differential impacts of hospitalists on various processes of care for AMI, CHF, and pneumonia. Measures were further divided among those that are usually measured upon initial presentation to the hospital and those that are measured throughout the entire hospitalization and discharge. This division reflects the division of care in the hospital, where emergency room physicians are likely to have a more critical role for admission processes.
Survey Process
We surveyed all nonfederal, acute care hospitals in California that participated in CHART.2 We first identified contacts at each site via professional society mailing lists. We then sent web‐based surveys to all with available email addresses and a fax/paper survey to the remainder. We surveyed individuals between October 2006 and April 2007 and repeated the process at intervals of 1 to 3 weeks. For remaining nonrespondents, we placed a direct call unless consent to survey had been specifically refused. We contacted the following persons in sequence: (1) hospital executives or administrative leaders; (2) hospital medicine department leaders; (3) admitting emergency room personnel or medical staff officers; and (4) hospital website information. In the case of multiple responses with disagreement, the hospital/hospitalist leader's response was treated as the primary source. At each step, respondents were asked to answer questions only if they had a direct working knowledge of their hospitalist services.
Survey Data
Our key survey question to all respondents included whether the respondents could confirm their hospitals had at least one hospitalist medicine group. Hospital leaders were also asked to participate in a more comprehensive survey of their organizational and clinical characteristics. Within the comprehensive survey, leaders also provided estimates of the percent of general medical patients admitted by hospitalists. This measure, used in prior surveys of hospital leaders,9 was intended to be an easily understood approximation of the intensity of hospitalist utilization in any given hospital. A more rigorous, direct measure was not feasible due to the complexity of obtaining admission data over such a large, diverse set of hospitals.
Process Performance Measures
AMI measures assessed at admission included aspirin and ‐blocker administration within 24 hours of arrival. AMI measures assessed at discharge included aspirin administration, ‐blocker administration, angiotensin converting enzyme inhibitor (ACE‐I) (or angiotensin receptor blocker [ARB]) administration for left ventricular (LV) dysfunction, and smoking cessation counseling. There were no CHF admission measures. CHF discharge measures included assessment of LV function, the use of an ACE‐I or ARB for LV dysfunction, and smoking cessation counseling. Pneumonia admission measures included the drawing of blood cultures prior to the receipt of antibiotics, timely administration of initial antibiotics (<8 hours), and antibiotics consistent with recommendations. Pneumonia discharge measures included pneumococcal vaccination, flu vaccination, and smoking cessation counseling.
For each performance measure, we quantified the percentage of missed quality opportunities, defined as the number of patients who did not receive a care process divided by the number of eligible patients, multiplied by 100. In addition, we calculated composite scores for admission and discharge measures across each condition. We summed the numerators and denominators of individual performance measures to generate a disease‐specific composite numerator and denominator. Both individual and composite scores were produced using methodology outlined by the Center for Medicare & Medicaid Services.18 In order to retain as representative a sample of hospitals as possible, we calculated composite scores for hospitals that had a minimum of 25 observations in at least 2 of the quality indicators that made up each composite score.
Statistical Analysis
We used chi‐square tests, Student t tests, and Mann‐Whitney tests, where appropriate, to compare hospital‐level characteristics of hospitals that utilized hospitalists vs. those that did not. Similar analyses were performed among the subset of hospitals that utilized hospitalists. Among this subgroup of hospitals, we compared hospital‐level characteristics between hospitals that provided information regarding the percent of patients admitted by hospitalists vs. those who did not provide this information.
We used multivariable, generalized linear regression models to assess the relationship between having at least 1 hospitalist group and the percentage of missed quality of care measures. Because percentages were not normally distributed (ie, a majority of hospitals had few missed opportunities, while a minority had many), multivariable models employed log‐link functions with a gamma distribution.19, 20 Coefficients for our key predictor (presence of hospitalists) were transformed back to the original units (percentage of missed quality opportunities) so that a positive coefficient represented a higher number of quality measures missed relative to hospitals without hospitalists. Models were adjusted for factors previously reported to be associated with care quality. Hospital organizational characteristics included the number of beds, teaching status, registered nursing (RN) hours per adjusted patient day, and hospital ownership (for‐profit vs. not‐for‐profit). Hospital patient mix factors included annual percentage of admissions by insurance status (Medicare, Medicaid, other), annual percentage of admissions by race (white vs. nonwhite), annual percentage of do‐not‐resuscitate status at admission, and mean diagnosis‐related group‐based case‐mix index.21 We additionally adjusted for the number of cardiac catheterizations, a measure that moderately correlates with the number of cardiologists and technology utilization.22‐24 In our subset analysis among those hospitals with hospitalists, our key predictor for regression analyses was the percentage of patients admitted by hospitalists. For ease of interpretation, the percentage of patients admitted by hospitalists was centered on the mean across all respondent hospitals, and we report the effect of increasing by 10% the percentage of patients admitted by hospitalists. Models were adjusted for the same hospital organizational characteristics listed above. For those models, a positive coefficient also meant a higher number of measures missed.
For both sets of predictors, we additionally tested for the presence of interactions between the predictors and hospital bed size (both continuous as well as dichotomized at 150 beds) in composite measure performance, given the possibility that any hospitalist effect may be greater among smaller, resource‐limited hospitals. Tests for interaction were performed with the likelihood ratio test. In addition, to minimize any potential bias or loss of power that might result from limiting the analysis to hospitals with complete data, we used the multivariate imputation by chained equations method, as implemented in STATA 9.2 (StataCorp, College Station, TX), to create 10 imputed datasets.25 Imputation of missing values was restricted to confounding variables. Standard methods were then used to combine results over the 10 imputed datasets. We also applied Bonferroni corrections to composite measure tests based on the number of composites generated (n = 5). Thus, for the 5 inpatient composites created, standard definitions of significance (P 0.05) were corrected by dividing composite P values by 5, requiring P 0.01 for significance. The institutional review board of the University of California, San Francisco, approved the study. All analyses were performed using STATA 9.2.
Results
Characteristics of Participating Sites
There were 209 eligible hospitals. All 209 (100%) hospitals provided data about the presence or absence of hospitalists via at least 1 of our survey strategies. The majority of identification of hospitalist utilization was via contact with either hospital or hospitalist leaders, n = 147 (70.3%). Web‐sites informed hospitalist prevalence in only 3 (1.4%) hospitals. There were 8 (3.8%) occurrences of disagreement between sources, all of which had available hospital/hospitalist leader responses. Only 1 (0.5%) hospital did not have the minimum 25 patients eligible for any disease‐specific quality measures during the data reporting period. Collectively, the remaining 208 hospitals accounted for 81% of California's acute care hospital population.
Comparisons of Sites With Hospitalists and Those Without
A total of 170 hospitals (82%) participating in CHART used hospitalists. Hospitals with and without hospitalists differed by a variety of characteristics (Table 1). Sites with hospitalists were larger, less likely to be for‐profit, had more registered nursing hours per day, and performed more cardiac catheterizations.
| Characteristic | Hospitals Without Hospitalists (n = 38) | Hospitals With Hospitalists (n = 170) | P Value* |
|---|---|---|---|
| |||
| Number of beds, n (% of hospitals) | <0.001 | ||
| 0‐99 | 16 (42.1) | 14 (8.2) | |
| 100‐199 | 8 (21.1) | 44 (25.9) | |
| 200‐299 | 7 (18.4) | 42 (24.7) | |
| 300+ | 7 (18.4) | 70 (41.2) | |
| For profit, n (% of hospitals) | 9 (23.7) | 18 (10.6) | 0.03 |
| Teaching hospital, n (% of hospitals) | 7 (18.4) | 55 (32.4) | 0.09 |
| RN hours per adjusted patient day, number of hours (IQR) | 7.4 (5.7‐8.6) | 8.5 (7.4‐9.9) | <0.001 |
| Annual cardiac catheterizations, n (IQR) | 0 (0‐356) | 210 (0‐813) | 0.007 |
| Hospital total census days, n (IQR) | 37161 (14910‐59750) | 60626 (34402‐87950) | <0.001 |
| ICU total census, n (IQR) | 2193 (1132‐4289) | 3855 (2489‐6379) | <0.001 |
| Medicare insurance, % patients (IQR) | 36.9 (28.5‐48.0) | 35.3(28.2‐44.3) | 0.95 |
| Medicaid insurance, % patients (IQR) | 21.0 (12.7‐48.3) | 16.6 (5.6‐27.6) | 0.02 |
| Race, white, % patients (IQR) | 53.7 (26.0‐82.7) | 59.1 (45.6‐74.3) | 0.73 |
| DNR at admission, % patients (IQR) | 3.6 (2.0‐6.4) | 4.4 (2.7‐7.1) | 0.12 |
| Case‐mix index, index (IQR) | 1.05 (0.90‐1.21) | 1.13 (1.01‐1.26) | 0.11 |
Relationship Between Hospitalist Group Utilization and the Percentage of Missed Quality Opportunities
Table 2 shows the frequency of missed quality opportunities in sites with hospitalists compared to those without. In general, for both individual and composite measures of quality, multivariable adjustment modestly attenuated the observed differences between the 2 groups of hospitals. We present only the more conservative adjusted estimates.
| Quality Measure | Number of Hospitals | Adjusted Mean % Missed Quality Opportunities (95% CI) | Difference With Hospitalists | Relative % Change | P Value | |
|---|---|---|---|---|---|---|
| Hospitals Without Hospitalists | Hospitals With Hospitalists | |||||
| ||||||
| Acute myocardial infarction | ||||||
| Admission measures | ||||||
| Aspirin at admission | 193 | 3.7 (2.4‐5.1) | 3.4 (2.3‐4.4) | 0.3 | 10.0 | 0.44 |
| Beta‐blocker at admission | 186 | 7.8 (4.7‐10.9) | 6.4 (4.4‐8.3) | 1.4 | 18.3 | 0.19 |
| AMI admission composite | 186 | 5.5 (3.6‐7.5) | 4.8 (3.4‐6.1) | 0.7 | 14.3 | 0.26 |
| Hospital/discharge measures | ||||||
| Aspirin at discharge | 173 | 7.5 (4.5‐10.4) | 5.2 (3.4‐6.9) | 2.3 | 31.0 | 0.02 |
| Beta‐blocker at discharge | 179 | 6.6 (3.8‐9.4) | 5.9 (3.6‐8.2) | 0.7 | 9.6 | 0.54 |
| ACE‐I/ARB at discharge | 119 | 20.7 (9.5‐31.8) | 11.8 (6.6‐17.0) | 8.9 | 43.0 | 0.006 |
| Smoking cessation counseling | 193 | 3.8 (2.4‐5.1) | 3.4 (2.4‐4.4) | 0.4 | 10.0 | 0.44 |
| AMI hospital/discharge composite | 179 | 6.4 (4.1‐8.6) | 5.3 (3.7‐6.8) | 1.1 | 17.6 | 0.16 |
| Congestive heart failure | ||||||
| Hospital/discharge measures | ||||||
| Ejection fraction assessment | 208 | 12.6 (7.7‐17.6) | 6.5 (4.6‐8.4) | 6.1 | 48.2 | <0.001 |
| ACE‐I/ARB at discharge | 201 | 14.7 (10.0‐19.4) | 12.9 (9.8‐16.1) | 1.8 | 12.1 | 0.31 |
| Smoking cessation counseling | 168 | 9.1 (2.9‐15.4) | 9.0 (4.2‐13.8) | 0.1 | 1.8 | 0.98 |
| CHF hospital/discharge composite | 201 | 12.2 (7.9‐16.5) | 8.2 (6.2‐10.2) | 4.0 | 33.1 | 0.006* |
| Pneumonia | ||||||
| Admission measures | ||||||
| Blood culture before antibiotics | 206 | 12.0 (9.1‐14.9) | 10.9 (8.8‐13.0) | 1.1 | 9.1 | 0.29 |
| Timing of antibiotics <8 hours | 208 | 5.8 (4.1‐7.5) | 6.2 (4.7‐7.7) | 0.4 | 6.9 | 0.56 |
| Initial antibiotic consistent with recommendations | 207 | 15.0 (11.6‐18.6) | 13.8 (10.9‐16.8) | 1.2 | 8.1 | 0.27 |
| Pneumonia admission composite | 207 | 10.5 (8.5‐12.5) | 9.9 (8.3‐11.5) | 0.6 | 5.9 | 0.37 |
| Hospital/discharge measures | ||||||
| Pneumonia vaccine | 208 | 29.4 (19.5‐39.2) | 27.1 (19.9‐34.3) | 2.3 | 7.7 | 0.54 |
| Influenza vaccine | 207 | 36.9 (25.4‐48.4) | 35.0 (27.0‐43.1) | 1.9 | 5.2 | 0.67 |
| Smoking cessation counseling | 196 | 15.4 (7.8‐23.1) | 13.9 (8.9‐18.9) | 1.5 | 10.2 | 0.59 |
| Pneumonia hospital/discharge composite | 207 | 29.6 (20.5‐38.7) | 27.3 (20.9‐33.6) | 2.3 | 7.8 | 0.51 |
Compared to hospitals without hospitalists, those with hospitalists did not have any statistically significant differences in the individual and composite admission measures for each of the disease processes. In contrast, there were statistically significant differences between hospitalist and nonhospitalist sites for many individual cardiac processes of care that typically occur after admission from the emergency room (ie, LV function assessment for CHF) or those that occurred at discharge (ie, aspirin and ACE‐I/ARB at discharge for AMI). Similarly, the composite discharge scores for AMI and CHF revealed better overall process measure performance at sites with hospitalists, although the AMI composite did not meet statistical significance. There were no statistically significant differences between groups for the pneumonia process measures assessed at discharge. In addition, for composite measures there were no statistically significant interactions between hospitalist prevalence and bed size, although there was a trend (P = 0.06) for the CHF discharge composite, with a larger effect of hospitalists among smaller hospitals.
Percent of Patients Admitted by Hospitalists
Of the 171 hospitals with hospitalists, 71 (42%) estimated the percent of patients admitted by their hospitalist physicians. Among the respondents, the mean and median percentages of medical patients admitted by hospitalists were 51% (SD = 25%) and 49% (IQR = 30‐70%), respectively. Thirty hospitals were above the sample mean. Compared to nonrespondent sites, respondent hospitals took care of more white patients; otherwise, respondent and nonrespondent hospitals were similar in terms of bed size, location, performance across each measure, and other observable characteristics (Supporting Information, Appendix 1).
Relationship Between the Estimated Percentages of Medical Patients Admitted by Hospitalists and Missed Quality Opportunities
Table 3 displays the change in missed quality measures associated with each additional 10% of patients estimated to be admitted by hospitalists. A higher estimated percentage of patients admitted by hospitalists was associated with statistically significant improvements in quality of care across a majority of individual measures and for all composite discharge measures regardless of condition. For example, every 10% increase in the mean estimated number of patients admitted by hospitalists was associated with a mean of 0.6% (P < 0.001), 0.5% (P = 0.004), and 1.5% (P = 0.006) fewer missed quality opportunities for AMI, CHF, and pneumonia discharge process measures composites, respectively. In addition, for these composite measures, there were no statistically significant interactions between the estimated percentage of patients admitted by hospitalists and bed size (dichotomized at 150 beds), although there was a trend (P = 0.09) for the AMI discharge composite, with a larger effect of hospitalists among smaller hospitals.
| Quality Measure | Number of Hospitals | Adjusted % Missed Quality Opportunities (95% CI) | Difference With Hospitalists | Relative Percent Change | P Value | |
|---|---|---|---|---|---|---|
| Among Hospitals With Mean % of Patients Admitted by Hospitalists | Among Hospitals With Mean + 10% of Patients Admitted by Hospitalists | |||||
| ||||||
| Acute myocardial infarction | ||||||
| Admission measures | ||||||
| Aspirin at admission | 70 | 3.4 (2.3‐4.6) | 3.1 (2.0‐3.1) | 0.3 | 10.2 | 0.001 |
| Beta‐blocker at admission | 65 | 5.8 (3.4‐8.2) | 5.1 (3.0‐7.3) | 0.7 | 11.9 | <0.001 |
| AMI admission composite | 65 | 4.5 (2.9‐6.1) | 4.0 (2.6‐5.5) | 0.5 | 11.1 | <0.001* |
| Hospital/discharge measures | ||||||
| Aspirin at discharge | 62 | 5.1 (3.3‐6.9) | 4.6 (3.1‐6.2) | 0.5 | 9.0 | 0.03 |
| Beta‐blocker at discharge | 63 | 5.1 (2.9‐7.2) | 4.3 (2.5‐6.0) | 0.8 | 15.4 | <0.001 |
| ACE‐I/ARB at discharge | 44 | 11.4 (6.2‐16.6) | 10.3 (5.4‐15.1) | 1.1 | 10.0 | 0.02 |
| Smoking cessation counseling | 70 | 3.4 (2.3‐4.6) | 3.1 (2.0‐4.1) | 0.3 | 10.2 | 0.001 |
| AMI hospital/discharge composite | 63 | 5.0 (3.3‐6.7) | 4.4 (3.0‐5.8) | 0.6 | 11.3 | 0.001* |
| Congestive heart failure | ||||||
| Hospital/discharge measures | ||||||
| Ejection fraction assessment | 71 | 5.9 (4.1‐7.6) | 5.6 (3.9‐7.2) | 0.3 | 2.9 | 0.07 |
| ACE‐I/ARB at discharge | 70 | 12.3 (8.6‐16.0) | 11.4 (7.9‐15.0) | 0.9 | 7.1 | 0.008* |
| Smoking cessation counseling | 56 | 8.4 (4.1‐12.6) | 8.2 (4.2‐12.3) | 0.2 | 1.7 | 0.67 |
| CHF hospital/discharge composite | 70 | 7.7 (5.8‐9.6) | 7.2 (5.4‐9.0) | 0.5 | 6.0 | 0.004* |
| Pneumonia | ||||||
| Admission measures | ||||||
| Timing of antibiotics <8 hours | 71 | 5.9 (4.2‐7.6) | 5.9 (4.1‐7.7) | 0.0 | 0.0 | 0.98 |
| Blood culture before antibiotics | 71 | 10.0 (8.0‐12.0) | 9.8 (7.7‐11.8) | 0.2 | 2.6 | 0.18 |
| Initial antibiotic consistent with recommendations | 71 | 13.3 (10.4‐16.2) | 12.9 (9.9‐15.9) | 0.4 | 2.8 | 0.20 |
| Pneumonia admission composite | 71 | 9.4 (7.7‐11.1) | 9.2 (7.6‐10.9) | 0.2 | 1.8 | 0.23 |
| Hospital/discharge measures | ||||||
| Pneumonia vaccine | 71 | 27.0 (19.2‐34.8) | 24.7 (17.2‐32.2) | 2.3 | 8.4 | 0.006 |
| Influenza vaccine | 71 | 34.1 (25.9‐42.2) | 32.6 (24.7‐40.5) | 1.5 | 4.3 | 0.03 |
| Smoking cessation counseling | 67 | 15.2 (9.8‐20.7) | 15.0 (9.6‐20.4) | 0.2 | 2.0 | 0.56 |
| Pneumonia hospital/discharge composite | 71 | 26.7 (20.3‐33.1) | 25.2 (19.0‐31.3) | 1.5 | 5.8 | 0.006* |
In order to test the robustness of our results, we carried out 2 secondary analyses. First, we used multivariable models to generate a propensity score representing the predicted probability of being assigned to a hospital with hospitalists. We then used the propensity score as an additional covariate in subsequent multivariable models. In addition, we performed a complete‐case analysis (including only hospitals with complete data, n = 204) as a check on the sensitivity of our results to missing data. Neither analysis produced results substantially different from those presented.
Discussion
In this cross‐sectional analysis of hospitals participating in a voluntary quality reporting initiative, hospitals with at least 1 hospitalist group had fewer missed discharge care process measures for CHF, even after adjusting for hospital‐level characteristics. In addition, as the estimated percentage of patients admitted by hospitalists increased, the percentage of missed quality opportunities decreased across all measures. The observed relationships were most apparent for measures that could be completed at any time during the hospitalization and at discharge. While it is likely that hospitalists are a marker of a hospital's ability to invest in systems (and as a result, care improvement initiatives), the presence of a potential dose‐response relationship suggests that hospitalists themselves may have a role in improving processes of care.
Our study suggests a generally positive, but mixed, picture of hospitalists' effects on quality process measure performance. Lack of uniformity across measures may depend on the timing of the process measure (eg, whether or not the process is measured at admission or discharge). For example, in contrast to admission process measures, we more commonly observed a positive association between hospitalists and care quality on process measures targeting processes that generally took place later in hospitalization or at discharge. Many admission process measures (eg, door to antibiotic time, blood cultures, and appropriate initial antibiotics) likely occurred prior to hospitalist involvement in most cases and were instead under the direction of emergency medicine physicians. Performance on these measures would not be expected to relate to use of hospitalists, and that is what we observed.
In addition to the timing of when a process was measured or took place, associations between hospitalists and care quality vary by disease. The apparent variation in impact of hospitalists by disease (more impact for cardiac conditions, less for pneumonia) may relate primarily to the characteristics of the processes of care that were measured for each condition. For example, one‐half of the pneumonia process measures related to care occurring within a few hours of admission, while the other one‐half (smoking cessation advice and streptococcal and influenza vaccines) were often administered per protocol or by nonphysician providers.26‐29 However, more of the cardiac measures required physician action (eg, prescription of an ACE‐I at discharge). Alternatively, unmeasured confounders important in the delivery of cardiac care might play an important role in the relationship between hospitalists and cardiac process measure performance.
Our approach to defining hospitalists bears mention as well. While a dichotomous measure of having hospitalists available was only statistically significant for the single CHF discharge composite measure, our measure of hospitalist availabilitythe percentage of patients admitted by hospitalistswas more strongly associated with a larger number of quality measures. Contrast between the dichotomous and continuous measures may have statistical explanations (the power to see differences between 2 groups is more limited with use of a binary predictor, which itself can be subject to bias),30 but may also indicate a dose‐response relationship. A larger number of admissions to hospitalists may help standardize practices, as care is concentrated in a smaller number of physicians' hands. Moreover, larger hospitalist programs may be more likely to have implemented care standardization or quality improvement processes or to have been incorporated into (or lead) hospitals' quality infrastructures. Finally, presence of larger hospitalist groups may be a marker for a hospital's capacity to make hospital‐wide investments in improvement. However, the association between the percentage of patients admitted by hospitalists and care quality persisted even after adjustment for many measures plausibly associated with ability to invest in care quality.
Our study has several limitations. First, although we used a widely accepted definition of hospitalists endorsed by the Society of Hospital Medicine, there are no gold standard definitions for a hospitalist's job description or skill set. As a result, it is possible that a model utilizing rotating internists (from a multispecialty group) might have been misidentified as a hospitalist model. Second, our findings represent a convenience sample of hospitals in a voluntary reporting initiative (CHART) and may not be applicable to hospitals that are less able to participate in such an endeavor. CHART hospitals are recognized to be better performers than the overall California population of hospitals, potentially decreasing variability in our quality of care measures.2 Third, there were significant differences between our comparison groups within the CHART hospitals, including sample size. Although we attempted to adjust our analyses for many important potential confounders and applied conservative measures to assess statistical significance, given the baseline differences, we cannot rule out the possibility of residual confounding by unmeasured factors. Fourth, as described above, this observational study cannot provide robust evidence to support conclusions regarding causality. Fifth, the estimation of the percent of patients admitted by hospitalists is unvalidated and based upon self‐reported and incomplete (41% of respondents) data. We are somewhat reassured by the fact that respondents and nonresponders were similar across all hospital characteristics, as well as outcomes. Sixth, misclassification of the estimated percentage of patients admitted by hospitalists may have influenced our results. Although possible, misclassification often biases results toward the null, potentially weakening any observed association. Given that our respondents were not aware of our hypotheses, there is no reason to expect recall issues to bias the results one way or the other. Finally, for many performance measures, overall performance was excellent among all hospitals (eg, aspirin at admission) with limited variability, thus limiting the ability to assess for differences.
In summary, in a large, cross‐sectional study of California hospitals participating in a voluntary quality reporting initiative, the presence of hospitalists was associated with modest improvements in hospital‐level performance of quality process measures. In addition, we found a relationship between the percentage of patients admitted by hospitalists and improved process measure adherence. Although we cannot determine causality, our data support the hypothesis that dedicated hospital physicians can positively affect the quality of care. Future research should examine this relationship in other settings and should address causality using broader measures of quality including both processes and outcomes.
Acknowledgements
The authors acknowledge Teresa Chipps, BS, Center for Health Services Research, Division of General Internal Medicine and Public Health, Department of Medicine, Vanderbilt University, Nashville, TN, for her administrative and editorial assistance in the preparation of this manuscript.
- ,,,.Care in U.S. hospitals—the Hospital Quality Alliance Program.N Engl J Med.2005;353:265–274.
- CalHospitalCompare.org: online report card simplifies the search for quality hospital care. Available at: http://www.chcf.org/topics/hospitals/index.cfm?itemID=131387. Accessed September 2009.
- ,,, et al.Hospital characteristics and quality of care.JAMA.1992;268:1709–1714.
- ,,,,.Patient and hospital characteristics associated with recommended processes of care for elderly patients hospitalized with pneumonia: results from the Medicare quality indicator system pneumonia module.Arch Intern Med.2002;162:827–833.
- ,,, et al.A systematic review and meta‐analysis of studies comparing mortality rates of private for‐profit and private not‐for‐profit hospitals.CMAJ.2002;166:1399–1406.
- ,.Teaching hospitals and quality of care: a review of the literature.Milbank Q.2002;80:569–593.
- ,,,,.Nurse‐staffing levels and the quality of care in hospitals.N Engl J Med.2002;346:1715–1722.
- ,,,.Growth in the care of older patients by hospitalists in the United States.N Engl J Med.2009;360:1102–1112.
- ,,,.Health care market trends and the evolution of hospitalist use and roles.J Gen Intern Med.2005;20:101–107.
- ,,,.Comparison of processes and outcomes of pneumonia care between hospitalists and community‐based primary care physicians.Mayo Clin Proc.2002;77:1053–1058.
- ,,,.Comparison of hospitalists and nonhospitalists regarding core measures of pneumonia care.Am J Manag Care.2007;13:129–132.
- ,,.Comparison of practice patterns of hospitalists and community physicians in the care of patients with congestive heart failure.J Hosp Med.2008;3:35–41.
- ,,, et al.Quality of care for decompensated heart failure: comparable performance between academic hospitalists and non‐hospitalists.J Gen Intern Med.2008;23:1399–1406.
- ,,,,.Quality of care for patients hospitalized with heart failure: assessing the impact of hospitalists.Arch Intern Med.2002;162:1251–1256.
- ,,,.The inverse relationship between mortality rates and performance in the Hospital Quality Alliance measures.Health Aff.2007;26:1104–1110.
- ,,,,.Does the Leapfrog program help identify high‐quality hospitals?Jt Comm J Qual Patient Saf.2008;34:318–325.
- ,,,,,.Outcomes of care by hospitalists, general internists, and family physicians.N Engl J Med.2007;357:2589–2600.
- CMS HQI demonstration project—composite quality score methodology overview. Available at: http://www.cms.hhs.gov/HospitalQualityInits/downloads/HospitalCompositeQualityScoreMethodologyOverview.pdf. Accessed September 2009.
- ,,.Modeling risk using generalized linear models.J Health Econ.1999;18:153–171.
- ,,.Generalized modeling approaches to risk adjustment of skewed outcomes data.J Health Econ.2005;24:465–488.
- ,,, et al.Quality of care for the treatment of acute medical conditions in US hospitals.Arch Intern Med.2006;166:2511–2517.
- ,,, et al.The Dartmouth Atlas of Cardiovascular Health Care.Chicago:AHA Press;1999. Current data from the Dartmouth Institute for Health Policy and Clinical Practice, Lebanon, NH. Available at: http://www.dartmouthatlas.org/atlases/atlas_ series.shtm. Accessed September 2009.
- ,,.Differences in per capita rates of revascularization and in choice of revascularization procedure for eleven states.BMC Health Serv Res.2006;6:35.
- ,,.The relationship between physician supply, cardiovascular health service use and cardiac disease burden in Ontario: supply‐need mismatch.Can J Card.2008;24:187.
- .Multiple imputation: a primer.Stat Methods Med Res.1999;8:3–15.
- .Nursing intervention and smoking cessation: Meta‐analysis update.Heart Lung.2006;35:147–163.
- .Ten‐year durability and success of an organized program to increase influenza and pneumococcal vaccination rates among high‐risk adults.Am J Med.1998;105:385–392.
- ,,, et al.Role of student pharmacist interns in hospital‐based standing orders pneumococcal vaccination program.J Am Pharm Assoc.2007;47:404–409.
- ,,,.Effect of a pharmacist‐managed program of pneumococcal and influenza immunization on vaccination rates among adult inpatients.Am J Health Syst Pharm.2003;60:1767–1771.
- ,,.Dichotomizing continuous predictors in multiple regression: a bad idea.Stat Med.2006;25:127–141.
Quality of care in US hospitals is inconsistent and often below accepted standards.1 This observation has catalyzed a number of performance measurement initiatives intended to publicize gaps and spur quality improvement.2 As the field has evolved, organizational factors such as teaching status, ownership model, nurse staffing levels, and hospital volume have been found to be associated with performance on quality measures.1, 3‐7 Hospitalists represent a more recent change in the organization of inpatient care8 that may impact hospital‐level performance. In fact, most hospitals provide financial support to hospitalists, not only for hopes of improving efficiency, but also for improving quality and safety.9
Only a few single‐site studies have examined the impact of hospitalists on quality of care for common medical conditions (ie, pneumonia, congestive heart failure, and acute myocardial infarction), and each has focused on patient‐level effects. Rifkin et al.10, 11 did not find differences between hospitalists' and nonhospitalists' patients in terms of pneumonia process measures. Roytman et al.12 found hospitalists more frequently prescribed afterload‐reducing agents for congestive heart failure (CHF), but other studies have shown no differences in care quality for heart failure.13, 14 Importantly, no studies have examined the role of hospitalists in the care of patients with acute myocardial infarction (AMI). In addition, studies have not addressed the effect of hospitalists at the hospital level to understand whether hospitalists have broader system‐level effects reflected by overall hospital performance.
We hypothesized that the presence of hospitalists within a hospital would be associated with improvements in hospital‐level adherence to publicly reported quality process measures, and having a greater percentage of patients admitted by hospitalists would be associated with improved performance. To test these hypotheses, we linked data from a statewide census of hospitalists with data collected as part of a hospital quality‐reporting initiative.
Materials and Methods
Study Sites
We examined the performance of 209 hospitals (63% of all 334 non‐federal facilities in California) participating in the California Hospital Assessment and Reporting Taskforce (CHART) at the time of the survey. CHART is a voluntary quality reporting initiative that began publicly reporting hospital quality data in January 2006.
Hospital‐level Organizational, Case‐mix, and Quality Data
Hospital organizational characteristics (eg, bed size) were obtained from publicly available discharge and utilization data sets from the California Office of Statewide Health Planning and Development (OSHPD). We also linked hospital‐level patient‐mix data (eg, race) from these OSHPD files.
We obtained quality of care data from CHART for January 2006 through June 2007, the time period corresponding to the survey. Quality metrics included 16 measures collected by the Center for Medicare and Medicaid Services (www.cms.hhs.gov) and extensively used in quality research.1, 4, 13, 15‐17 Rather than define a single measure, we examined multiple process measures, anticipating differential impacts of hospitalists on various processes of care for AMI, CHF, and pneumonia. Measures were further divided among those that are usually measured upon initial presentation to the hospital and those that are measured throughout the entire hospitalization and discharge. This division reflects the division of care in the hospital, where emergency room physicians are likely to have a more critical role for admission processes.
Survey Process
We surveyed all nonfederal, acute care hospitals in California that participated in CHART.2 We first identified contacts at each site via professional society mailing lists. We then sent web‐based surveys to all with available email addresses and a fax/paper survey to the remainder. We surveyed individuals between October 2006 and April 2007 and repeated the process at intervals of 1 to 3 weeks. For remaining nonrespondents, we placed a direct call unless consent to survey had been specifically refused. We contacted the following persons in sequence: (1) hospital executives or administrative leaders; (2) hospital medicine department leaders; (3) admitting emergency room personnel or medical staff officers; and (4) hospital website information. In the case of multiple responses with disagreement, the hospital/hospitalist leader's response was treated as the primary source. At each step, respondents were asked to answer questions only if they had a direct working knowledge of their hospitalist services.
Survey Data
Our key survey question to all respondents included whether the respondents could confirm their hospitals had at least one hospitalist medicine group. Hospital leaders were also asked to participate in a more comprehensive survey of their organizational and clinical characteristics. Within the comprehensive survey, leaders also provided estimates of the percent of general medical patients admitted by hospitalists. This measure, used in prior surveys of hospital leaders,9 was intended to be an easily understood approximation of the intensity of hospitalist utilization in any given hospital. A more rigorous, direct measure was not feasible due to the complexity of obtaining admission data over such a large, diverse set of hospitals.
Process Performance Measures
AMI measures assessed at admission included aspirin and ‐blocker administration within 24 hours of arrival. AMI measures assessed at discharge included aspirin administration, ‐blocker administration, angiotensin converting enzyme inhibitor (ACE‐I) (or angiotensin receptor blocker [ARB]) administration for left ventricular (LV) dysfunction, and smoking cessation counseling. There were no CHF admission measures. CHF discharge measures included assessment of LV function, the use of an ACE‐I or ARB for LV dysfunction, and smoking cessation counseling. Pneumonia admission measures included the drawing of blood cultures prior to the receipt of antibiotics, timely administration of initial antibiotics (<8 hours), and antibiotics consistent with recommendations. Pneumonia discharge measures included pneumococcal vaccination, flu vaccination, and smoking cessation counseling.
For each performance measure, we quantified the percentage of missed quality opportunities, defined as the number of patients who did not receive a care process divided by the number of eligible patients, multiplied by 100. In addition, we calculated composite scores for admission and discharge measures across each condition. We summed the numerators and denominators of individual performance measures to generate a disease‐specific composite numerator and denominator. Both individual and composite scores were produced using methodology outlined by the Center for Medicare & Medicaid Services.18 In order to retain as representative a sample of hospitals as possible, we calculated composite scores for hospitals that had a minimum of 25 observations in at least 2 of the quality indicators that made up each composite score.
Statistical Analysis
We used chi‐square tests, Student t tests, and Mann‐Whitney tests, where appropriate, to compare hospital‐level characteristics of hospitals that utilized hospitalists vs. those that did not. Similar analyses were performed among the subset of hospitals that utilized hospitalists. Among this subgroup of hospitals, we compared hospital‐level characteristics between hospitals that provided information regarding the percent of patients admitted by hospitalists vs. those who did not provide this information.
We used multivariable, generalized linear regression models to assess the relationship between having at least 1 hospitalist group and the percentage of missed quality of care measures. Because percentages were not normally distributed (ie, a majority of hospitals had few missed opportunities, while a minority had many), multivariable models employed log‐link functions with a gamma distribution.19, 20 Coefficients for our key predictor (presence of hospitalists) were transformed back to the original units (percentage of missed quality opportunities) so that a positive coefficient represented a higher number of quality measures missed relative to hospitals without hospitalists. Models were adjusted for factors previously reported to be associated with care quality. Hospital organizational characteristics included the number of beds, teaching status, registered nursing (RN) hours per adjusted patient day, and hospital ownership (for‐profit vs. not‐for‐profit). Hospital patient mix factors included annual percentage of admissions by insurance status (Medicare, Medicaid, other), annual percentage of admissions by race (white vs. nonwhite), annual percentage of do‐not‐resuscitate status at admission, and mean diagnosis‐related group‐based case‐mix index.21 We additionally adjusted for the number of cardiac catheterizations, a measure that moderately correlates with the number of cardiologists and technology utilization.22‐24 In our subset analysis among those hospitals with hospitalists, our key predictor for regression analyses was the percentage of patients admitted by hospitalists. For ease of interpretation, the percentage of patients admitted by hospitalists was centered on the mean across all respondent hospitals, and we report the effect of increasing by 10% the percentage of patients admitted by hospitalists. Models were adjusted for the same hospital organizational characteristics listed above. For those models, a positive coefficient also meant a higher number of measures missed.
For both sets of predictors, we additionally tested for the presence of interactions between the predictors and hospital bed size (both continuous as well as dichotomized at 150 beds) in composite measure performance, given the possibility that any hospitalist effect may be greater among smaller, resource‐limited hospitals. Tests for interaction were performed with the likelihood ratio test. In addition, to minimize any potential bias or loss of power that might result from limiting the analysis to hospitals with complete data, we used the multivariate imputation by chained equations method, as implemented in STATA 9.2 (StataCorp, College Station, TX), to create 10 imputed datasets.25 Imputation of missing values was restricted to confounding variables. Standard methods were then used to combine results over the 10 imputed datasets. We also applied Bonferroni corrections to composite measure tests based on the number of composites generated (n = 5). Thus, for the 5 inpatient composites created, standard definitions of significance (P 0.05) were corrected by dividing composite P values by 5, requiring P 0.01 for significance. The institutional review board of the University of California, San Francisco, approved the study. All analyses were performed using STATA 9.2.
Results
Characteristics of Participating Sites
There were 209 eligible hospitals. All 209 (100%) hospitals provided data about the presence or absence of hospitalists via at least 1 of our survey strategies. The majority of identification of hospitalist utilization was via contact with either hospital or hospitalist leaders, n = 147 (70.3%). Web‐sites informed hospitalist prevalence in only 3 (1.4%) hospitals. There were 8 (3.8%) occurrences of disagreement between sources, all of which had available hospital/hospitalist leader responses. Only 1 (0.5%) hospital did not have the minimum 25 patients eligible for any disease‐specific quality measures during the data reporting period. Collectively, the remaining 208 hospitals accounted for 81% of California's acute care hospital population.
Comparisons of Sites With Hospitalists and Those Without
A total of 170 hospitals (82%) participating in CHART used hospitalists. Hospitals with and without hospitalists differed by a variety of characteristics (Table 1). Sites with hospitalists were larger, less likely to be for‐profit, had more registered nursing hours per day, and performed more cardiac catheterizations.
| Characteristic | Hospitals Without Hospitalists (n = 38) | Hospitals With Hospitalists (n = 170) | P Value* |
|---|---|---|---|
| |||
| Number of beds, n (% of hospitals) | <0.001 | ||
| 0‐99 | 16 (42.1) | 14 (8.2) | |
| 100‐199 | 8 (21.1) | 44 (25.9) | |
| 200‐299 | 7 (18.4) | 42 (24.7) | |
| 300+ | 7 (18.4) | 70 (41.2) | |
| For profit, n (% of hospitals) | 9 (23.7) | 18 (10.6) | 0.03 |
| Teaching hospital, n (% of hospitals) | 7 (18.4) | 55 (32.4) | 0.09 |
| RN hours per adjusted patient day, number of hours (IQR) | 7.4 (5.7‐8.6) | 8.5 (7.4‐9.9) | <0.001 |
| Annual cardiac catheterizations, n (IQR) | 0 (0‐356) | 210 (0‐813) | 0.007 |
| Hospital total census days, n (IQR) | 37161 (14910‐59750) | 60626 (34402‐87950) | <0.001 |
| ICU total census, n (IQR) | 2193 (1132‐4289) | 3855 (2489‐6379) | <0.001 |
| Medicare insurance, % patients (IQR) | 36.9 (28.5‐48.0) | 35.3(28.2‐44.3) | 0.95 |
| Medicaid insurance, % patients (IQR) | 21.0 (12.7‐48.3) | 16.6 (5.6‐27.6) | 0.02 |
| Race, white, % patients (IQR) | 53.7 (26.0‐82.7) | 59.1 (45.6‐74.3) | 0.73 |
| DNR at admission, % patients (IQR) | 3.6 (2.0‐6.4) | 4.4 (2.7‐7.1) | 0.12 |
| Case‐mix index, index (IQR) | 1.05 (0.90‐1.21) | 1.13 (1.01‐1.26) | 0.11 |
Relationship Between Hospitalist Group Utilization and the Percentage of Missed Quality Opportunities
Table 2 shows the frequency of missed quality opportunities in sites with hospitalists compared to those without. In general, for both individual and composite measures of quality, multivariable adjustment modestly attenuated the observed differences between the 2 groups of hospitals. We present only the more conservative adjusted estimates.
| Quality Measure | Number of Hospitals | Adjusted Mean % Missed Quality Opportunities (95% CI) | Difference With Hospitalists | Relative % Change | P Value | |
|---|---|---|---|---|---|---|
| Hospitals Without Hospitalists | Hospitals With Hospitalists | |||||
| ||||||
| Acute myocardial infarction | ||||||
| Admission measures | ||||||
| Aspirin at admission | 193 | 3.7 (2.4‐5.1) | 3.4 (2.3‐4.4) | 0.3 | 10.0 | 0.44 |
| Beta‐blocker at admission | 186 | 7.8 (4.7‐10.9) | 6.4 (4.4‐8.3) | 1.4 | 18.3 | 0.19 |
| AMI admission composite | 186 | 5.5 (3.6‐7.5) | 4.8 (3.4‐6.1) | 0.7 | 14.3 | 0.26 |
| Hospital/discharge measures | ||||||
| Aspirin at discharge | 173 | 7.5 (4.5‐10.4) | 5.2 (3.4‐6.9) | 2.3 | 31.0 | 0.02 |
| Beta‐blocker at discharge | 179 | 6.6 (3.8‐9.4) | 5.9 (3.6‐8.2) | 0.7 | 9.6 | 0.54 |
| ACE‐I/ARB at discharge | 119 | 20.7 (9.5‐31.8) | 11.8 (6.6‐17.0) | 8.9 | 43.0 | 0.006 |
| Smoking cessation counseling | 193 | 3.8 (2.4‐5.1) | 3.4 (2.4‐4.4) | 0.4 | 10.0 | 0.44 |
| AMI hospital/discharge composite | 179 | 6.4 (4.1‐8.6) | 5.3 (3.7‐6.8) | 1.1 | 17.6 | 0.16 |
| Congestive heart failure | ||||||
| Hospital/discharge measures | ||||||
| Ejection fraction assessment | 208 | 12.6 (7.7‐17.6) | 6.5 (4.6‐8.4) | 6.1 | 48.2 | <0.001 |
| ACE‐I/ARB at discharge | 201 | 14.7 (10.0‐19.4) | 12.9 (9.8‐16.1) | 1.8 | 12.1 | 0.31 |
| Smoking cessation counseling | 168 | 9.1 (2.9‐15.4) | 9.0 (4.2‐13.8) | 0.1 | 1.8 | 0.98 |
| CHF hospital/discharge composite | 201 | 12.2 (7.9‐16.5) | 8.2 (6.2‐10.2) | 4.0 | 33.1 | 0.006* |
| Pneumonia | ||||||
| Admission measures | ||||||
| Blood culture before antibiotics | 206 | 12.0 (9.1‐14.9) | 10.9 (8.8‐13.0) | 1.1 | 9.1 | 0.29 |
| Timing of antibiotics <8 hours | 208 | 5.8 (4.1‐7.5) | 6.2 (4.7‐7.7) | 0.4 | 6.9 | 0.56 |
| Initial antibiotic consistent with recommendations | 207 | 15.0 (11.6‐18.6) | 13.8 (10.9‐16.8) | 1.2 | 8.1 | 0.27 |
| Pneumonia admission composite | 207 | 10.5 (8.5‐12.5) | 9.9 (8.3‐11.5) | 0.6 | 5.9 | 0.37 |
| Hospital/discharge measures | ||||||
| Pneumonia vaccine | 208 | 29.4 (19.5‐39.2) | 27.1 (19.9‐34.3) | 2.3 | 7.7 | 0.54 |
| Influenza vaccine | 207 | 36.9 (25.4‐48.4) | 35.0 (27.0‐43.1) | 1.9 | 5.2 | 0.67 |
| Smoking cessation counseling | 196 | 15.4 (7.8‐23.1) | 13.9 (8.9‐18.9) | 1.5 | 10.2 | 0.59 |
| Pneumonia hospital/discharge composite | 207 | 29.6 (20.5‐38.7) | 27.3 (20.9‐33.6) | 2.3 | 7.8 | 0.51 |
Compared to hospitals without hospitalists, those with hospitalists did not have any statistically significant differences in the individual and composite admission measures for each of the disease processes. In contrast, there were statistically significant differences between hospitalist and nonhospitalist sites for many individual cardiac processes of care that typically occur after admission from the emergency room (ie, LV function assessment for CHF) or those that occurred at discharge (ie, aspirin and ACE‐I/ARB at discharge for AMI). Similarly, the composite discharge scores for AMI and CHF revealed better overall process measure performance at sites with hospitalists, although the AMI composite did not meet statistical significance. There were no statistically significant differences between groups for the pneumonia process measures assessed at discharge. In addition, for composite measures there were no statistically significant interactions between hospitalist prevalence and bed size, although there was a trend (P = 0.06) for the CHF discharge composite, with a larger effect of hospitalists among smaller hospitals.
Percent of Patients Admitted by Hospitalists
Of the 171 hospitals with hospitalists, 71 (42%) estimated the percent of patients admitted by their hospitalist physicians. Among the respondents, the mean and median percentages of medical patients admitted by hospitalists were 51% (SD = 25%) and 49% (IQR = 30‐70%), respectively. Thirty hospitals were above the sample mean. Compared to nonrespondent sites, respondent hospitals took care of more white patients; otherwise, respondent and nonrespondent hospitals were similar in terms of bed size, location, performance across each measure, and other observable characteristics (Supporting Information, Appendix 1).
Relationship Between the Estimated Percentages of Medical Patients Admitted by Hospitalists and Missed Quality Opportunities
Table 3 displays the change in missed quality measures associated with each additional 10% of patients estimated to be admitted by hospitalists. A higher estimated percentage of patients admitted by hospitalists was associated with statistically significant improvements in quality of care across a majority of individual measures and for all composite discharge measures regardless of condition. For example, every 10% increase in the mean estimated number of patients admitted by hospitalists was associated with a mean of 0.6% (P < 0.001), 0.5% (P = 0.004), and 1.5% (P = 0.006) fewer missed quality opportunities for AMI, CHF, and pneumonia discharge process measures composites, respectively. In addition, for these composite measures, there were no statistically significant interactions between the estimated percentage of patients admitted by hospitalists and bed size (dichotomized at 150 beds), although there was a trend (P = 0.09) for the AMI discharge composite, with a larger effect of hospitalists among smaller hospitals.
| Quality Measure | Number of Hospitals | Adjusted % Missed Quality Opportunities (95% CI) | Difference With Hospitalists | Relative Percent Change | P Value | |
|---|---|---|---|---|---|---|
| Among Hospitals With Mean % of Patients Admitted by Hospitalists | Among Hospitals With Mean + 10% of Patients Admitted by Hospitalists | |||||
| ||||||
| Acute myocardial infarction | ||||||
| Admission measures | ||||||
| Aspirin at admission | 70 | 3.4 (2.3‐4.6) | 3.1 (2.0‐3.1) | 0.3 | 10.2 | 0.001 |
| Beta‐blocker at admission | 65 | 5.8 (3.4‐8.2) | 5.1 (3.0‐7.3) | 0.7 | 11.9 | <0.001 |
| AMI admission composite | 65 | 4.5 (2.9‐6.1) | 4.0 (2.6‐5.5) | 0.5 | 11.1 | <0.001* |
| Hospital/discharge measures | ||||||
| Aspirin at discharge | 62 | 5.1 (3.3‐6.9) | 4.6 (3.1‐6.2) | 0.5 | 9.0 | 0.03 |
| Beta‐blocker at discharge | 63 | 5.1 (2.9‐7.2) | 4.3 (2.5‐6.0) | 0.8 | 15.4 | <0.001 |
| ACE‐I/ARB at discharge | 44 | 11.4 (6.2‐16.6) | 10.3 (5.4‐15.1) | 1.1 | 10.0 | 0.02 |
| Smoking cessation counseling | 70 | 3.4 (2.3‐4.6) | 3.1 (2.0‐4.1) | 0.3 | 10.2 | 0.001 |
| AMI hospital/discharge composite | 63 | 5.0 (3.3‐6.7) | 4.4 (3.0‐5.8) | 0.6 | 11.3 | 0.001* |
| Congestive heart failure | ||||||
| Hospital/discharge measures | ||||||
| Ejection fraction assessment | 71 | 5.9 (4.1‐7.6) | 5.6 (3.9‐7.2) | 0.3 | 2.9 | 0.07 |
| ACE‐I/ARB at discharge | 70 | 12.3 (8.6‐16.0) | 11.4 (7.9‐15.0) | 0.9 | 7.1 | 0.008* |
| Smoking cessation counseling | 56 | 8.4 (4.1‐12.6) | 8.2 (4.2‐12.3) | 0.2 | 1.7 | 0.67 |
| CHF hospital/discharge composite | 70 | 7.7 (5.8‐9.6) | 7.2 (5.4‐9.0) | 0.5 | 6.0 | 0.004* |
| Pneumonia | ||||||
| Admission measures | ||||||
| Timing of antibiotics <8 hours | 71 | 5.9 (4.2‐7.6) | 5.9 (4.1‐7.7) | 0.0 | 0.0 | 0.98 |
| Blood culture before antibiotics | 71 | 10.0 (8.0‐12.0) | 9.8 (7.7‐11.8) | 0.2 | 2.6 | 0.18 |
| Initial antibiotic consistent with recommendations | 71 | 13.3 (10.4‐16.2) | 12.9 (9.9‐15.9) | 0.4 | 2.8 | 0.20 |
| Pneumonia admission composite | 71 | 9.4 (7.7‐11.1) | 9.2 (7.6‐10.9) | 0.2 | 1.8 | 0.23 |
| Hospital/discharge measures | ||||||
| Pneumonia vaccine | 71 | 27.0 (19.2‐34.8) | 24.7 (17.2‐32.2) | 2.3 | 8.4 | 0.006 |
| Influenza vaccine | 71 | 34.1 (25.9‐42.2) | 32.6 (24.7‐40.5) | 1.5 | 4.3 | 0.03 |
| Smoking cessation counseling | 67 | 15.2 (9.8‐20.7) | 15.0 (9.6‐20.4) | 0.2 | 2.0 | 0.56 |
| Pneumonia hospital/discharge composite | 71 | 26.7 (20.3‐33.1) | 25.2 (19.0‐31.3) | 1.5 | 5.8 | 0.006* |
In order to test the robustness of our results, we carried out 2 secondary analyses. First, we used multivariable models to generate a propensity score representing the predicted probability of being assigned to a hospital with hospitalists. We then used the propensity score as an additional covariate in subsequent multivariable models. In addition, we performed a complete‐case analysis (including only hospitals with complete data, n = 204) as a check on the sensitivity of our results to missing data. Neither analysis produced results substantially different from those presented.
Discussion
In this cross‐sectional analysis of hospitals participating in a voluntary quality reporting initiative, hospitals with at least 1 hospitalist group had fewer missed discharge care process measures for CHF, even after adjusting for hospital‐level characteristics. In addition, as the estimated percentage of patients admitted by hospitalists increased, the percentage of missed quality opportunities decreased across all measures. The observed relationships were most apparent for measures that could be completed at any time during the hospitalization and at discharge. While it is likely that hospitalists are a marker of a hospital's ability to invest in systems (and as a result, care improvement initiatives), the presence of a potential dose‐response relationship suggests that hospitalists themselves may have a role in improving processes of care.
Our study suggests a generally positive, but mixed, picture of hospitalists' effects on quality process measure performance. Lack of uniformity across measures may depend on the timing of the process measure (eg, whether or not the process is measured at admission or discharge). For example, in contrast to admission process measures, we more commonly observed a positive association between hospitalists and care quality on process measures targeting processes that generally took place later in hospitalization or at discharge. Many admission process measures (eg, door to antibiotic time, blood cultures, and appropriate initial antibiotics) likely occurred prior to hospitalist involvement in most cases and were instead under the direction of emergency medicine physicians. Performance on these measures would not be expected to relate to use of hospitalists, and that is what we observed.
In addition to the timing of when a process was measured or took place, associations between hospitalists and care quality vary by disease. The apparent variation in impact of hospitalists by disease (more impact for cardiac conditions, less for pneumonia) may relate primarily to the characteristics of the processes of care that were measured for each condition. For example, one‐half of the pneumonia process measures related to care occurring within a few hours of admission, while the other one‐half (smoking cessation advice and streptococcal and influenza vaccines) were often administered per protocol or by nonphysician providers.26‐29 However, more of the cardiac measures required physician action (eg, prescription of an ACE‐I at discharge). Alternatively, unmeasured confounders important in the delivery of cardiac care might play an important role in the relationship between hospitalists and cardiac process measure performance.
Our approach to defining hospitalists bears mention as well. While a dichotomous measure of having hospitalists available was only statistically significant for the single CHF discharge composite measure, our measure of hospitalist availabilitythe percentage of patients admitted by hospitalistswas more strongly associated with a larger number of quality measures. Contrast between the dichotomous and continuous measures may have statistical explanations (the power to see differences between 2 groups is more limited with use of a binary predictor, which itself can be subject to bias),30 but may also indicate a dose‐response relationship. A larger number of admissions to hospitalists may help standardize practices, as care is concentrated in a smaller number of physicians' hands. Moreover, larger hospitalist programs may be more likely to have implemented care standardization or quality improvement processes or to have been incorporated into (or lead) hospitals' quality infrastructures. Finally, presence of larger hospitalist groups may be a marker for a hospital's capacity to make hospital‐wide investments in improvement. However, the association between the percentage of patients admitted by hospitalists and care quality persisted even after adjustment for many measures plausibly associated with ability to invest in care quality.
Our study has several limitations. First, although we used a widely accepted definition of hospitalists endorsed by the Society of Hospital Medicine, there are no gold standard definitions for a hospitalist's job description or skill set. As a result, it is possible that a model utilizing rotating internists (from a multispecialty group) might have been misidentified as a hospitalist model. Second, our findings represent a convenience sample of hospitals in a voluntary reporting initiative (CHART) and may not be applicable to hospitals that are less able to participate in such an endeavor. CHART hospitals are recognized to be better performers than the overall California population of hospitals, potentially decreasing variability in our quality of care measures.2 Third, there were significant differences between our comparison groups within the CHART hospitals, including sample size. Although we attempted to adjust our analyses for many important potential confounders and applied conservative measures to assess statistical significance, given the baseline differences, we cannot rule out the possibility of residual confounding by unmeasured factors. Fourth, as described above, this observational study cannot provide robust evidence to support conclusions regarding causality. Fifth, the estimation of the percent of patients admitted by hospitalists is unvalidated and based upon self‐reported and incomplete (41% of respondents) data. We are somewhat reassured by the fact that respondents and nonresponders were similar across all hospital characteristics, as well as outcomes. Sixth, misclassification of the estimated percentage of patients admitted by hospitalists may have influenced our results. Although possible, misclassification often biases results toward the null, potentially weakening any observed association. Given that our respondents were not aware of our hypotheses, there is no reason to expect recall issues to bias the results one way or the other. Finally, for many performance measures, overall performance was excellent among all hospitals (eg, aspirin at admission) with limited variability, thus limiting the ability to assess for differences.
In summary, in a large, cross‐sectional study of California hospitals participating in a voluntary quality reporting initiative, the presence of hospitalists was associated with modest improvements in hospital‐level performance of quality process measures. In addition, we found a relationship between the percentage of patients admitted by hospitalists and improved process measure adherence. Although we cannot determine causality, our data support the hypothesis that dedicated hospital physicians can positively affect the quality of care. Future research should examine this relationship in other settings and should address causality using broader measures of quality including both processes and outcomes.
Acknowledgements
The authors acknowledge Teresa Chipps, BS, Center for Health Services Research, Division of General Internal Medicine and Public Health, Department of Medicine, Vanderbilt University, Nashville, TN, for her administrative and editorial assistance in the preparation of this manuscript.
- ,,,.Care in U.S. hospitals—the Hospital Quality Alliance Program.N Engl J Med.2005;353:265–274.
- CalHospitalCompare.org: online report card simplifies the search for quality hospital care. Available at: http://www.chcf.org/topics/hospitals/index.cfm?itemID=131387. Accessed September 2009.
- ,,, et al.Hospital characteristics and quality of care.JAMA.1992;268:1709–1714.
- ,,,,.Patient and hospital characteristics associated with recommended processes of care for elderly patients hospitalized with pneumonia: results from the Medicare quality indicator system pneumonia module.Arch Intern Med.2002;162:827–833.
- ,,, et al.A systematic review and meta‐analysis of studies comparing mortality rates of private for‐profit and private not‐for‐profit hospitals.CMAJ.2002;166:1399–1406.
- ,.Teaching hospitals and quality of care: a review of the literature.Milbank Q.2002;80:569–593.
- ,,,,.Nurse‐staffing levels and the quality of care in hospitals.N Engl J Med.2002;346:1715–1722.
- ,,,.Growth in the care of older patients by hospitalists in the United States.N Engl J Med.2009;360:1102–1112.
- ,,,.Health care market trends and the evolution of hospitalist use and roles.J Gen Intern Med.2005;20:101–107.
- ,,,.Comparison of processes and outcomes of pneumonia care between hospitalists and community‐based primary care physicians.Mayo Clin Proc.2002;77:1053–1058.
- ,,,.Comparison of hospitalists and nonhospitalists regarding core measures of pneumonia care.Am J Manag Care.2007;13:129–132.
- ,,.Comparison of practice patterns of hospitalists and community physicians in the care of patients with congestive heart failure.J Hosp Med.2008;3:35–41.
- ,,, et al.Quality of care for decompensated heart failure: comparable performance between academic hospitalists and non‐hospitalists.J Gen Intern Med.2008;23:1399–1406.
- ,,,,.Quality of care for patients hospitalized with heart failure: assessing the impact of hospitalists.Arch Intern Med.2002;162:1251–1256.
- ,,,.The inverse relationship between mortality rates and performance in the Hospital Quality Alliance measures.Health Aff.2007;26:1104–1110.
- ,,,,.Does the Leapfrog program help identify high‐quality hospitals?Jt Comm J Qual Patient Saf.2008;34:318–325.
- ,,,,,.Outcomes of care by hospitalists, general internists, and family physicians.N Engl J Med.2007;357:2589–2600.
- CMS HQI demonstration project—composite quality score methodology overview. Available at: http://www.cms.hhs.gov/HospitalQualityInits/downloads/HospitalCompositeQualityScoreMethodologyOverview.pdf. Accessed September 2009.
- ,,.Modeling risk using generalized linear models.J Health Econ.1999;18:153–171.
- ,,.Generalized modeling approaches to risk adjustment of skewed outcomes data.J Health Econ.2005;24:465–488.
- ,,, et al.Quality of care for the treatment of acute medical conditions in US hospitals.Arch Intern Med.2006;166:2511–2517.
- ,,, et al.The Dartmouth Atlas of Cardiovascular Health Care.Chicago:AHA Press;1999. Current data from the Dartmouth Institute for Health Policy and Clinical Practice, Lebanon, NH. Available at: http://www.dartmouthatlas.org/atlases/atlas_ series.shtm. Accessed September 2009.
- ,,.Differences in per capita rates of revascularization and in choice of revascularization procedure for eleven states.BMC Health Serv Res.2006;6:35.
- ,,.The relationship between physician supply, cardiovascular health service use and cardiac disease burden in Ontario: supply‐need mismatch.Can J Card.2008;24:187.
- .Multiple imputation: a primer.Stat Methods Med Res.1999;8:3–15.
- .Nursing intervention and smoking cessation: Meta‐analysis update.Heart Lung.2006;35:147–163.
- .Ten‐year durability and success of an organized program to increase influenza and pneumococcal vaccination rates among high‐risk adults.Am J Med.1998;105:385–392.
- ,,, et al.Role of student pharmacist interns in hospital‐based standing orders pneumococcal vaccination program.J Am Pharm Assoc.2007;47:404–409.
- ,,,.Effect of a pharmacist‐managed program of pneumococcal and influenza immunization on vaccination rates among adult inpatients.Am J Health Syst Pharm.2003;60:1767–1771.
- ,,.Dichotomizing continuous predictors in multiple regression: a bad idea.Stat Med.2006;25:127–141.
Copyright © 2010 Society of Hospital Medicine
Patient Whiteboards in the Hospital Setting
Communication failures are a frequent cause of adverse events14; the Joint Commission (TJC) reports that such failures contributed to 65% of reported sentinel events.5 Strategies to improve communication have focused on implementing formal teamwork training programs and/or teaching specific communication skills.613 While these strategies largely address communication between healthcare providers, there is a growing emphasis on developing strategies to engage patients in their care, and improving communication with them and their families.
In 2007, TJC announced a new National Patient Safety Goal (NPSG) that encourage(s) patients' active involvement in their own care as a patient safety strategy.14 This builds upon a landmark Institute of Medicine report that highlighted patient‐centeredness as 1 of the 6 domains for delivering high‐quality care.15 Current literature on developing such patient‐centered strategies enumerates several approaches, including better access to health information, use of innovative technology solutions, and focused efforts at improving communication.1618
The placement of whiteboards in patient rooms is an increasingly common strategy to improve communication. These boards, typically placed on a wall near a patient's hospital bed, allow any number of providers to communicate a wide range of information. Both Kaiser Permanente's Nurse Knowledge Exchange program and the Institute for Healthcare Improvement's Transforming Care at the Bedside promote whiteboard use, though with little specific guidance about practical implementation.19,20 Despite their growing prevalence, there is no published literature guiding the most effective uses of whiteboards, or describing their impact on communication, teamwork, or patient satisfaction and care. We present findings from a survey of patient whiteboard use on an academic medical service, and offer a series of recommendations based on our findings and experiences.
Methods
We anonymously surveyed bedside nurses from 3 inpatient medical units, internal medicine housestaff, and faculty from the Division of Hospital Medicine at the University of California, San Francisco (UCSF). We solicited experiences of physician and nursing leaders who were engaged in whiteboard interventions over the past 2 years to identify relevant topics for study. Their experiences were based on isolated unit‐based efforts to implement whiteboards through a variety of strategies (eg, whiteboard templates, simple identification of provider teams, goals for the day). Their input guided the survey development and the suggested recommendations. The topics identified were then translated into multiple‐choice questions, and further edited for clarity by the authors. A Likert scale was used that measured frequency of use, usefulness, and attitudes toward patient whiteboards. An open‐ended question seeking additional comments about patient whiteboards was also asked. The survey was administered to nurses at staff meetings and through physical mailboxes on their respective patient care units with a 1‐month collection period. The survey was administered to housestaff and attendings via e‐mail listserves using an online commercial survey administration tool.21 The nursing surveys were later entered into the same online survey administration tool, which ultimately provided summary reports and descriptive findings to meet the study objectives. Our project was reviewed and approved by the UCSF Committee on Human Research.
Results
Survey responses were collected from 104 nurse respondents (81% response rate), 118 internal medicine housestaff (74% response rate), and 31 hospitalists (86% response rate). Nurses were far more likely to write on whiteboards, read what was written on them, and find the related information useful (Figure 1A‐C). Nurses, housestaff, and attendings all believed the bedside nurse was the single most important provider name listed on a whiteboard. However, the respondents differed in their rated value of other providers listed on the whiteboard (Figure 2). Nurses gave higher ratings to the utility of having patient care assistants (PCAs) listed as compared to housestaff and attendings. Overall, respondents felt it would be less useful to list consultants and pharmacists than the nurse, attending, and housestaff. All of the respondents believed family contact information was the most useful information on a whiteboard, whereas more nurses rated a goal for the day and anticipated discharge date as more useful than housestaff and attendings (Figure 3).
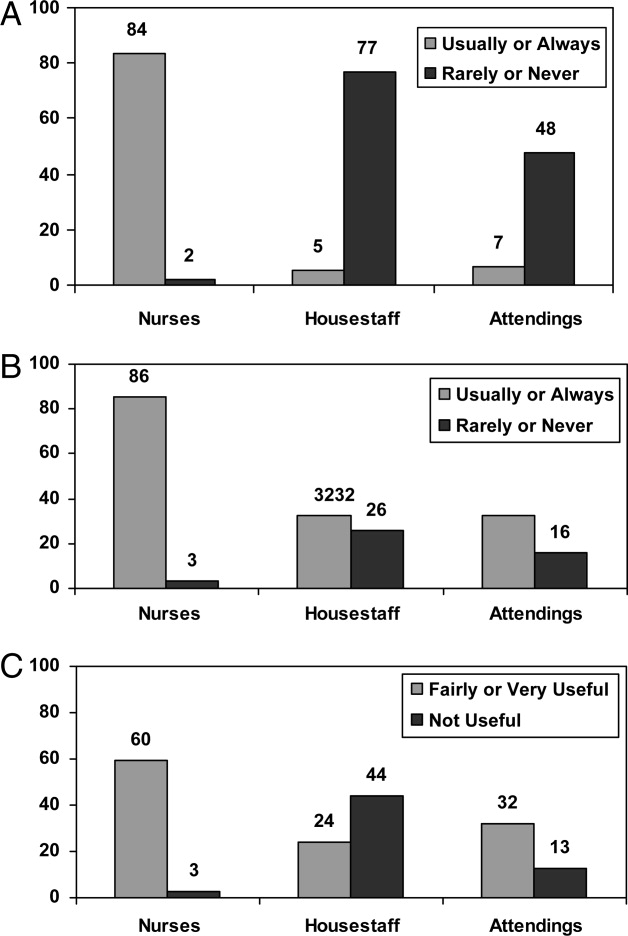
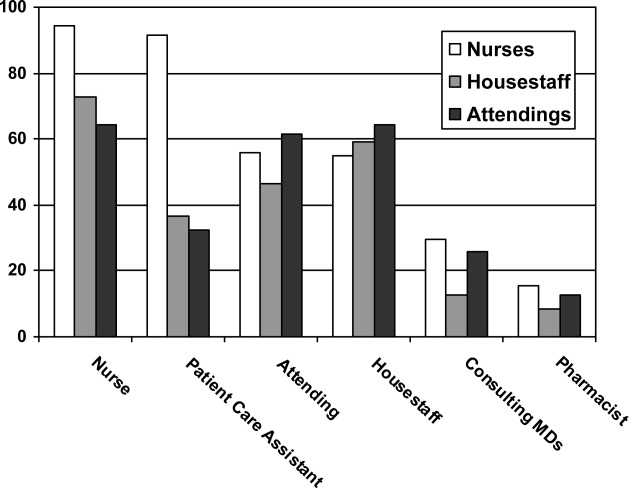

From an operational standpoint, the majority of respondents felt that nurses should be responsible for the information on a whiteboard, nurses and physicians together should create goals for the day, and the greatest barrier to using whiteboards was not having pens easily available (Figure 4A‐C). Most respondents also agreed that using templated whiteboards (with predefined fields) to guide content would increase their use (Figure 4D). All respondents believed that whiteboard use could improve teamwork and communication as well as patient care (Figure 5). Respondents also offered a variety of specific comments in response to an open‐ended question about whiteboard use (Table 1).
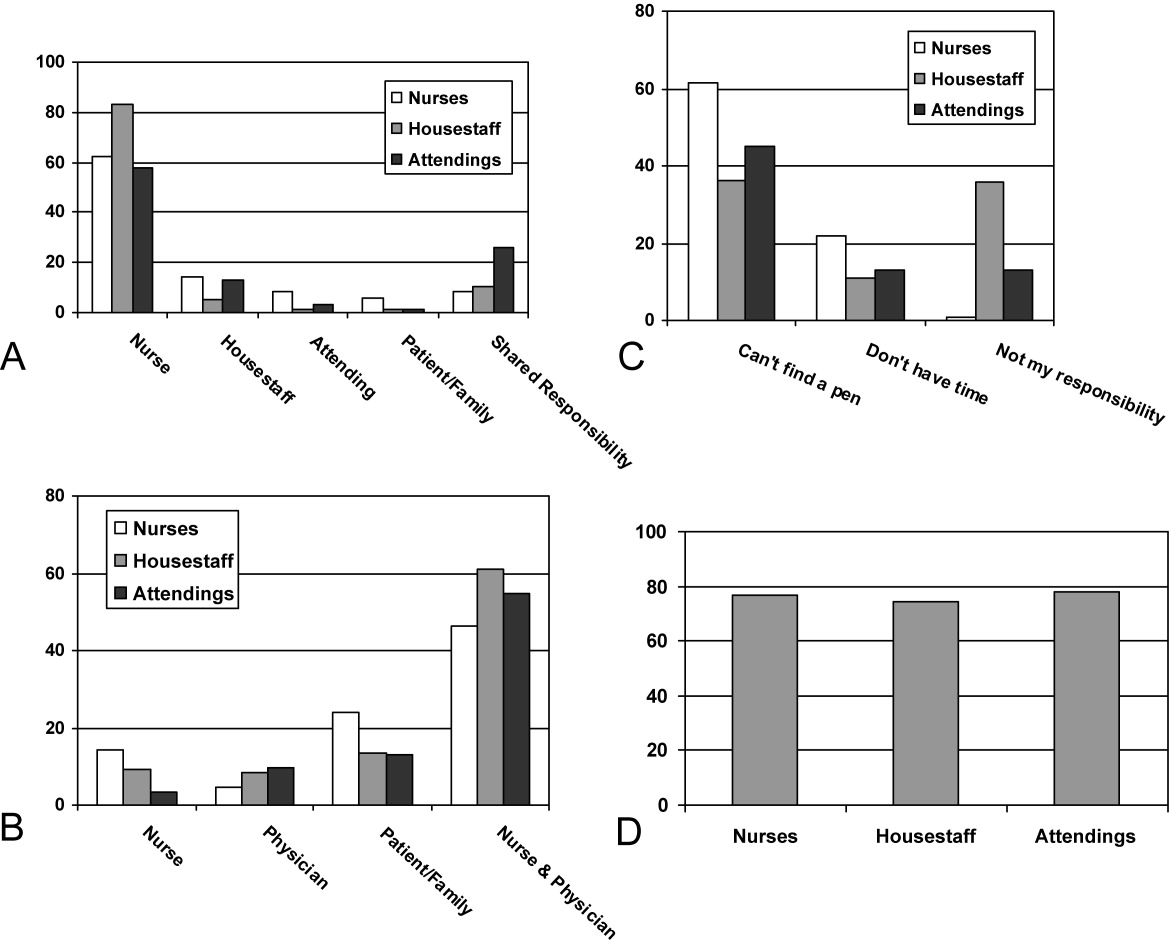
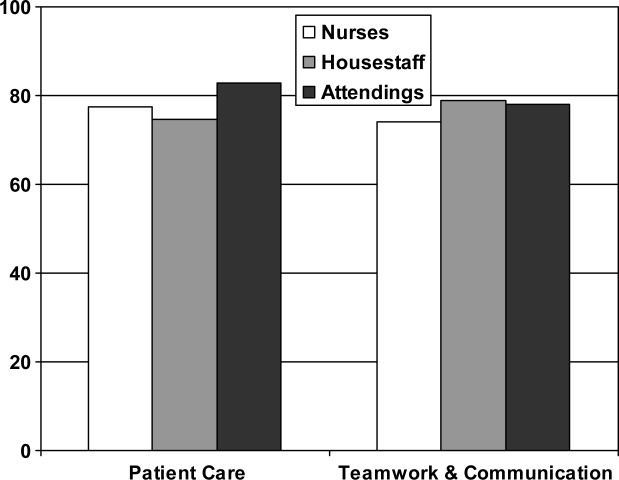
| From nurses | If MDs were engaged in using (or reviewing the information on) whiteboards more, it might reduce the number of times we page them to clarify care plans |
| It might be helpful to have a dedicated section on the whiteboard where families can write questions that are separate from other information that the nurse writes on them | |
| Part of the bedside nurse role is to be a patient advocate and the whiteboard can be a tool to assist in this important responsibility | |
| Nothing is worse than a patient (or family member) asking me, What's the plan for the day?and being unable to do so because a goal (or scheduled procedure) hasn't been communicated to me by the MD or written on the whiteboard | |
| I would use [whiteboards] more if they were clearly being used as a patient‐centered communication tool rather than trying to improve communication between us and the MDs. | |
| From physicians | The boards need to be kept simple for success. |
| There needs to be specific training to make this a cultural norm across care providers and reinforced on a regular basis. If it's a priority, there should be audits, tracking for performance (accuracy and updated info), and feedback to providers. I would also ask patients what info they would like to see, as [whiteboards] should be patient‐centered, not provider‐centered. | |
| Having providers intermittently write on whiteboards should not be considered a substitute for communication. In fact, this would likely only further display our lack of cohesive communication to patients and families. | |
| I have been skeptical that the goals for the day for an ill patient can be satisfactorily reduced to a statement that fits on a whiteboard and that forecasting a day of discharge well in advance is frequently wrong and may create more confusion than it alleviates. I am also concerned that if a goal for the day on a whiteboard is intended for the nurse, this is substituting for richer channels of communications, such as the nurse reading the progress notes, speaking with the physicians, or communicating through the charge nurse who attends our case management rounds. | |
| Whiteboards are frequently not accurate, underused, and they require patients to have visual acuity, cognition, and speak Englishall challenges depending on your patient population. |
Discussion
Our findings demonstrate the potential value of patient whiteboards, which is supported by the vast majority of respondents, who agreed their use may improve patient care and teamwork. It is also clear that whiteboard use is not achieving this potential or being used as a patient‐centered tool. This is best illustrated by findings of their low rate of use and completion among attendings and housestaff (Figure 1A, B) and the lack of consensus as to what information on the whiteboards is useful. Patient whiteboards require defined goals, thoughtful planning, regular monitoring, and ongoing evaluation. The challenges around effective adoption and implementation is perhaps more about ensuring compliance and completion rather than simply gaining buy‐in and engagement for their value.
While the differential use of whiteboards between nurses and physicians was not surprising, a few specific findings warrant further discussion. First, it is interesting that nurses rated their own names and that of PCAs as the most useful, while physicians rated the nurse's name as being of equal value to their own. This may speak to the role PCAs play for nurses in helping the latter provide bedside care, rather than a reflection of the nurses' perception of the value of PCAs for patients. Second, while all respondents rated highly the value of family contact information on the whiteboard, nurses valued a goal for the day and anticipated discharge date more highly than did physicians. These findings likely reflect that nurses desire an understanding about plans of care and if they are not communicated face‐to‐face as the most effective strategy,22 they should at least be spelled out clearly on a whiteboard. This is supported by evidence that better collaboration between nurses and physicians improves patient outcomes.23 It may also be that physicians place more value on their own progress notes (rather than whiteboards) as a vehicle for communicating daily goals and discharge planning.
Other practical considerations involve who owns it and, if we do create goals for the day, whose goals should they represent? The majority of nurse and physician responses advocated for nurses to be responsible for accurate and complete information being updated on whiteboards. A larger percentage of attendings favored shared responsibility of the whiteboard, which was reinforced by their support of having goals for the day created jointly by nurses and physicians. Interestingly, a much smaller percentage of respondents felt goals for the day should be driven by patients (or family members). These data may point to the different perspectives that each individual provider bringsphysician, nurse, pharmacist, discharge plannerwith their respective goals differing in nature. Finally, it is also interesting that while attendings and housestaff believed that whiteboards can improve patient care teamwork/communication (Figure 5), a much smaller percentage actually read what is on them (Figure 1B). This may reflect the unclear goals of whiteboards, its absence as part of daily workflow, the infrequency of updated information on them, or perhaps an institution‐specific phenomenon that we will use to drive further improvement strategies.
Selected respondent comments (Table 1) highlight important messages about whiteboard use and provide helpful context to the survey responses. We found that the goal of whiteboard use is not always clear; is it to improve communication among providers, to improve communication with patients, a tool to engage patients in their care, or some combination of the above? Without a clear goal, providers are left to wonder whether whiteboard use is simply another task or really an intervention to improve care. This may in part, or perhaps fully, explain the differences discovered in whiteboard use and practices among our surveyed providers.
If, however, one were to make clear that the goal of patient whiteboards is to engage patients in their care and help achieve an important NPSG, methods to implement their use become better guided. A limitation of our study is that we did not survey patients about their perceptions of whiteboards use, an important needs assessment that would further drive this patient‐centered intervention. Regardless, we can draw a number of lessons from our findings and devise a set of reasonable recommendations.
Recommendations
We provide the following set of recommendations for hospitals adopting patient whiteboards, drawing on our survey findings and experiences with implementation at our own institution. We also acknowledge the role that local hospital cultures may play in adopting whiteboard use, and our recommendations are simply guidelines that can be applied or used in planning efforts. We believe effective use of a patient whiteboard requires a patient‐centered approach and the following:
-
Whiteboards should be placed in clear view of patients from their hospital bed
A simple yet critical issue as placing a whiteboard behind a patient's bed or off to the side fails to provide them with a constant visual cue to engage in the information.
-
Buy and fasten erasable pens to the whiteboards themselves
In our institution, purchasing pens for each provider was a less effective strategy than simply affixing the pen to the whiteboard itself. A supply of erasable pens must be available at the nursing station to quickly replace those with fading ink.
-
Create whiteboard templates
Our findings and experience suggest that structured formats for whiteboards may be more effective in ensuring both important and accurate information gets included. Blank whiteboards lead to less standardization in practice and fail to create prompts for providers to both write and review the content available. Anecdotally, we created a number of whiteboards with templated information, and this did seem to increase the consistency, standardization, and ease of use.
-
Whiteboard templates should include the following items:
-
Day and Date
This serves to orient patients (and their families) as well as providers with the date of information written on the whiteboard. It is also an important mechanism to ensure information is updated daily.
-
Patient's name (or initials)
With bed turnover (or patient transfers to different beds and units) commonplace in hospital care, we believe that listing the patient's name on the board prevents the potential for patients (and their families) or providers to mistakenly take information from a previous patient's care on the whiteboard for their own.
-
Bedside nurse
This was noted as the most useful provider listed on a patient whiteboard, which is quite logical given the role bedside nurses play for hospitalized patients.
-
Primary physician(s) (attending, resident, and intern, if applicable)
This was noted as the next most important provider(s) and perhaps increasingly important both in teaching and nonteaching settings where shift‐work and signouts are growing in frequency among physicians.
-
Goal for the day
While this was not a consensus from our survey respondents, we believe patients (rather than providers) should ultimately guide determination of their goal for the day as this engages them directly with the planachieving a patient‐centered initiative. In our experience, an effective strategy was having the bedside nurse directly engage patients each morning to help place a goal for the day on their whiteboard.
-
Anticipated discharge date
While understanding the potential for this date to change, we believe the benefits of having patients (and their families) thinking about discharge, rather than feeling surprised by it on the morning of discharge, serves as an important mechanism to bridge communication about the discharge process.24
-
Family member's contact information (phone number)
-
Questions for providers
This last entry allows a space for families to engage the healthcare team and, once again, create an opportunity for clarification of treatment and discharge plans.
-
Bedside nurses should facilitate writing and updating information on the whiteboard
Without our survey findings, this might have generated debate or controversy over whether nurses should be burdened with one more task to their responsibilities. However, our nurse respondents embraced this responsibility with spontaneous comments about their patient advocate role, and stated that whiteboards can serve as a tool to assist in that responsibility. Furthermore, not a single nurse respondent stated as barrier to use that I didn't think it was my responsibility. Nonetheless, whiteboard use must be a shared communication tool and not simply a tool between nurse and patient. Practically, we would recommend that bedside nurses facilitate updating whiteboards each morning, at a time when they are already helping patients create a goal for the day. Other providers must be trained to review information on the whiteboard, engage patients about their specific goal, and share the responsibility of keeping the information on the whiteboard updated.
-
Create a system for auditing utilization and providing feedback early during rollout
We found that adoption was very slow at the outset. One strategy to consider is having designated auditors check whiteboards in each room, measuring weekly compliance and providing this feedback to nurse managers. This auditing process may help identify barriers that can be addressed quickly (eg, unavailability of pens).
Finally, it is important to comment on the confidentiality concerns often raised in the context of whiteboard use. Confidentiality concerns largely arise from personal health information being used without a patient's explicit consent. If our recommendations are adopted, they require whiteboard use to be a patient‐centered and patient‐driven initiative. The type of information on the whiteboard should be determined with sensitivity but also with consent of the patient. We have not experienced any concerns by patients or providers in this regard because patients are told about the goals of the whiteboard initiative with our above principles in mind.
Conclusions
Patient whiteboards may improve communication among members of the healthcare team (eg, nurses, physicians, and others) and between providers and their patients (and family members). Further investigation is warranted to determine if adopting our recommendations leads to improved communication, teamwork, or patient satisfaction and care. In the meantime, as many hospitals continue to install and implement whiteboards, we hope our recommendations, accompanied by an emphasis on creating a patient‐centered communication tool, offer a roadmap for considering best practices in their use.
Acknowledgements
This study of patient whiteboards developed during the Triad for Optimal Patient Safety (TOPS) project, an effort focused on improving unit‐based safety culture through improved teamwork and communication. The authors thank the Gordon and Betty Moore Foundation for their active support and funding of the TOPS project, which was a collaboration between the Schools of Medicine, Nursing, and Pharmacy at the University of California, San Francisco.
- ,,,,.Communication failures in patient sign‐out and suggestions for improvement: a critical incident analysis.Qual Saf Health Care.2005;14(6):401–407.
- ,,,.Analysis of errors reported by surgeons at three teaching hospitals.Surgery.2003;133(6):614–621.
- ,,, et al.Patterns of communication breakdowns resulting in injury to surgical patients.J Am Coll Surg.2007;204(4):533–540.
- ,,.Communication failures: an insidious contributor to medical mishaps.Acad Med.2004;79(2):186–194.
- The Joint Commission: Sentinel Event Statistics, March 31,2009. Available at: http://www.jointcommission.org/SentinelEvents/Statistics. Accessed October 2009.
- ,,, et al.Bridging the communication gap in the operating room with medical team training.Am J Surg.2005;190(5):770–774.
- ,,, et al.Error reduction and performance improvement in the emergency department through formal teamwork training: evaluation results of the MedTeams project.Health Serv Res.2002;37(6):1553–1581.
- ,.TeamSTEPPS: assuring optimal teamwork in clinical settings.Am J Med Qual.2007;22(3):214–217.
- ,,,,,.Medical team training: applying crew resource management in the Veterans Health Administration.Jt Comm J Qual Patient Saf.2007;33(6):317–325.
- ,,,,.Enhancing patient safety through teamwork training.J Healthc Risk Manag.2001;21(4):57–65.
- ,,.The human factor: the critical importance of effective teamwork and communication in providing safe care.Qual Saf Health Care.2004;13(suppl 1):i85–i90.
- ,,.SBAR: a shared mental model for improving communication between clinicians.Jt Comm J Qual Patient Saf.2006;32(3):167–175.
- ,,, et al.A multidisciplinary teamwork training program: the Triad for Optimal Patient Safety (TOPS) experience.J Gen Intern Med.2008;23(12):2053–2057.
- The Joint Commission's National Patient Safety Goals 2007 for Hospital/Critical Access Hospital. Available at:http://www.jointcommission.org/PatientSafety/NationalPatientSafetyGoals/07_hap_cah_npsgs.htm. Accessed October 2009.
- Institute of Medicine (U.S.). Committee on Quality of Health Care in America.Crossing the Quality Chasm: A New Health System for the 21st Century.Washington, DC:National Academy Press;2001.
- ,.A systems approach to patient‐centered care.JAMA.2006;296(23):2848–2851.
- ,,,,.Microsystems in health care: Part 4. Planning patient‐centered care.Jt Comm J Qual Saf.2003;29(5):227–237.
- Gerteis M, Edgman‐Levitan S, Daley J, Delbanco TL, eds.Through the Patient's Eyes: Understanding and Promoting Patient‐Centered Care.San Francisco, CA:Jossey‐Bass;1993.
- ,,.Transforming Care at the Bedside. IHI Innovation Series white paper. Boston, MA: Institute for Healthcare Improvement;2004. Available at: http://www.ihi.org. Accessed October 2009.
- ..Nurse Knowledge Exchange: Patient Hand Offs. American Academy of Ambulatory Care Nursing (AAACN) Viewpoint. Sep/Oct 2007. Available at: http://findarticles.com/p/articles/mi_qa4022/is_200709/ai_n21137476. Accessed October 2009.
- Survey Console. Available at: http://www.surveyconsole.com. Accessed October 2009.
- How do we communicate?Communication on Agile Software Projects. Available at: www.agilemodeling.com/essays/communication.htm. Accessed October 2009.
- ,,, et al.Association between nurse‐physician collaboration and patient outcomes in three intensive care units.Crit Care Med.1999;27(9):1991–1998.
- .Engaging patients at hospital discharge.J Hosp Med.2008;3(6):498–500.
Communication failures are a frequent cause of adverse events14; the Joint Commission (TJC) reports that such failures contributed to 65% of reported sentinel events.5 Strategies to improve communication have focused on implementing formal teamwork training programs and/or teaching specific communication skills.613 While these strategies largely address communication between healthcare providers, there is a growing emphasis on developing strategies to engage patients in their care, and improving communication with them and their families.
In 2007, TJC announced a new National Patient Safety Goal (NPSG) that encourage(s) patients' active involvement in their own care as a patient safety strategy.14 This builds upon a landmark Institute of Medicine report that highlighted patient‐centeredness as 1 of the 6 domains for delivering high‐quality care.15 Current literature on developing such patient‐centered strategies enumerates several approaches, including better access to health information, use of innovative technology solutions, and focused efforts at improving communication.1618
The placement of whiteboards in patient rooms is an increasingly common strategy to improve communication. These boards, typically placed on a wall near a patient's hospital bed, allow any number of providers to communicate a wide range of information. Both Kaiser Permanente's Nurse Knowledge Exchange program and the Institute for Healthcare Improvement's Transforming Care at the Bedside promote whiteboard use, though with little specific guidance about practical implementation.19,20 Despite their growing prevalence, there is no published literature guiding the most effective uses of whiteboards, or describing their impact on communication, teamwork, or patient satisfaction and care. We present findings from a survey of patient whiteboard use on an academic medical service, and offer a series of recommendations based on our findings and experiences.
Methods
We anonymously surveyed bedside nurses from 3 inpatient medical units, internal medicine housestaff, and faculty from the Division of Hospital Medicine at the University of California, San Francisco (UCSF). We solicited experiences of physician and nursing leaders who were engaged in whiteboard interventions over the past 2 years to identify relevant topics for study. Their experiences were based on isolated unit‐based efforts to implement whiteboards through a variety of strategies (eg, whiteboard templates, simple identification of provider teams, goals for the day). Their input guided the survey development and the suggested recommendations. The topics identified were then translated into multiple‐choice questions, and further edited for clarity by the authors. A Likert scale was used that measured frequency of use, usefulness, and attitudes toward patient whiteboards. An open‐ended question seeking additional comments about patient whiteboards was also asked. The survey was administered to nurses at staff meetings and through physical mailboxes on their respective patient care units with a 1‐month collection period. The survey was administered to housestaff and attendings via e‐mail listserves using an online commercial survey administration tool.21 The nursing surveys were later entered into the same online survey administration tool, which ultimately provided summary reports and descriptive findings to meet the study objectives. Our project was reviewed and approved by the UCSF Committee on Human Research.
Results
Survey responses were collected from 104 nurse respondents (81% response rate), 118 internal medicine housestaff (74% response rate), and 31 hospitalists (86% response rate). Nurses were far more likely to write on whiteboards, read what was written on them, and find the related information useful (Figure 1A‐C). Nurses, housestaff, and attendings all believed the bedside nurse was the single most important provider name listed on a whiteboard. However, the respondents differed in their rated value of other providers listed on the whiteboard (Figure 2). Nurses gave higher ratings to the utility of having patient care assistants (PCAs) listed as compared to housestaff and attendings. Overall, respondents felt it would be less useful to list consultants and pharmacists than the nurse, attending, and housestaff. All of the respondents believed family contact information was the most useful information on a whiteboard, whereas more nurses rated a goal for the day and anticipated discharge date as more useful than housestaff and attendings (Figure 3).
From an operational standpoint, the majority of respondents felt that nurses should be responsible for the information on a whiteboard, nurses and physicians together should create goals for the day, and the greatest barrier to using whiteboards was not having pens easily available (Figure 4A‐C). Most respondents also agreed that using templated whiteboards (with predefined fields) to guide content would increase their use (Figure 4D). All respondents believed that whiteboard use could improve teamwork and communication as well as patient care (Figure 5). Respondents also offered a variety of specific comments in response to an open‐ended question about whiteboard use (Table 1).
| From nurses | If MDs were engaged in using (or reviewing the information on) whiteboards more, it might reduce the number of times we page them to clarify care plans |
| It might be helpful to have a dedicated section on the whiteboard where families can write questions that are separate from other information that the nurse writes on them | |
| Part of the bedside nurse role is to be a patient advocate and the whiteboard can be a tool to assist in this important responsibility | |
| Nothing is worse than a patient (or family member) asking me, What's the plan for the day?and being unable to do so because a goal (or scheduled procedure) hasn't been communicated to me by the MD or written on the whiteboard | |
| I would use [whiteboards] more if they were clearly being used as a patient‐centered communication tool rather than trying to improve communication between us and the MDs. | |
| From physicians | The boards need to be kept simple for success. |
| There needs to be specific training to make this a cultural norm across care providers and reinforced on a regular basis. If it's a priority, there should be audits, tracking for performance (accuracy and updated info), and feedback to providers. I would also ask patients what info they would like to see, as [whiteboards] should be patient‐centered, not provider‐centered. | |
| Having providers intermittently write on whiteboards should not be considered a substitute for communication. In fact, this would likely only further display our lack of cohesive communication to patients and families. | |
| I have been skeptical that the goals for the day for an ill patient can be satisfactorily reduced to a statement that fits on a whiteboard and that forecasting a day of discharge well in advance is frequently wrong and may create more confusion than it alleviates. I am also concerned that if a goal for the day on a whiteboard is intended for the nurse, this is substituting for richer channels of communications, such as the nurse reading the progress notes, speaking with the physicians, or communicating through the charge nurse who attends our case management rounds. | |
| Whiteboards are frequently not accurate, underused, and they require patients to have visual acuity, cognition, and speak Englishall challenges depending on your patient population. |
Discussion
Our findings demonstrate the potential value of patient whiteboards, which is supported by the vast majority of respondents, who agreed their use may improve patient care and teamwork. It is also clear that whiteboard use is not achieving this potential or being used as a patient‐centered tool. This is best illustrated by findings of their low rate of use and completion among attendings and housestaff (Figure 1A, B) and the lack of consensus as to what information on the whiteboards is useful. Patient whiteboards require defined goals, thoughtful planning, regular monitoring, and ongoing evaluation. The challenges around effective adoption and implementation is perhaps more about ensuring compliance and completion rather than simply gaining buy‐in and engagement for their value.
While the differential use of whiteboards between nurses and physicians was not surprising, a few specific findings warrant further discussion. First, it is interesting that nurses rated their own names and that of PCAs as the most useful, while physicians rated the nurse's name as being of equal value to their own. This may speak to the role PCAs play for nurses in helping the latter provide bedside care, rather than a reflection of the nurses' perception of the value of PCAs for patients. Second, while all respondents rated highly the value of family contact information on the whiteboard, nurses valued a goal for the day and anticipated discharge date more highly than did physicians. These findings likely reflect that nurses desire an understanding about plans of care and if they are not communicated face‐to‐face as the most effective strategy,22 they should at least be spelled out clearly on a whiteboard. This is supported by evidence that better collaboration between nurses and physicians improves patient outcomes.23 It may also be that physicians place more value on their own progress notes (rather than whiteboards) as a vehicle for communicating daily goals and discharge planning.
Other practical considerations involve who owns it and, if we do create goals for the day, whose goals should they represent? The majority of nurse and physician responses advocated for nurses to be responsible for accurate and complete information being updated on whiteboards. A larger percentage of attendings favored shared responsibility of the whiteboard, which was reinforced by their support of having goals for the day created jointly by nurses and physicians. Interestingly, a much smaller percentage of respondents felt goals for the day should be driven by patients (or family members). These data may point to the different perspectives that each individual provider bringsphysician, nurse, pharmacist, discharge plannerwith their respective goals differing in nature. Finally, it is also interesting that while attendings and housestaff believed that whiteboards can improve patient care teamwork/communication (Figure 5), a much smaller percentage actually read what is on them (Figure 1B). This may reflect the unclear goals of whiteboards, its absence as part of daily workflow, the infrequency of updated information on them, or perhaps an institution‐specific phenomenon that we will use to drive further improvement strategies.
Selected respondent comments (Table 1) highlight important messages about whiteboard use and provide helpful context to the survey responses. We found that the goal of whiteboard use is not always clear; is it to improve communication among providers, to improve communication with patients, a tool to engage patients in their care, or some combination of the above? Without a clear goal, providers are left to wonder whether whiteboard use is simply another task or really an intervention to improve care. This may in part, or perhaps fully, explain the differences discovered in whiteboard use and practices among our surveyed providers.
If, however, one were to make clear that the goal of patient whiteboards is to engage patients in their care and help achieve an important NPSG, methods to implement their use become better guided. A limitation of our study is that we did not survey patients about their perceptions of whiteboards use, an important needs assessment that would further drive this patient‐centered intervention. Regardless, we can draw a number of lessons from our findings and devise a set of reasonable recommendations.
Recommendations
We provide the following set of recommendations for hospitals adopting patient whiteboards, drawing on our survey findings and experiences with implementation at our own institution. We also acknowledge the role that local hospital cultures may play in adopting whiteboard use, and our recommendations are simply guidelines that can be applied or used in planning efforts. We believe effective use of a patient whiteboard requires a patient‐centered approach and the following:
-
Whiteboards should be placed in clear view of patients from their hospital bed
A simple yet critical issue as placing a whiteboard behind a patient's bed or off to the side fails to provide them with a constant visual cue to engage in the information.
-
Buy and fasten erasable pens to the whiteboards themselves
In our institution, purchasing pens for each provider was a less effective strategy than simply affixing the pen to the whiteboard itself. A supply of erasable pens must be available at the nursing station to quickly replace those with fading ink.
-
Create whiteboard templates
Our findings and experience suggest that structured formats for whiteboards may be more effective in ensuring both important and accurate information gets included. Blank whiteboards lead to less standardization in practice and fail to create prompts for providers to both write and review the content available. Anecdotally, we created a number of whiteboards with templated information, and this did seem to increase the consistency, standardization, and ease of use.
-
Whiteboard templates should include the following items:
-
Day and Date
This serves to orient patients (and their families) as well as providers with the date of information written on the whiteboard. It is also an important mechanism to ensure information is updated daily.
-
Patient's name (or initials)
With bed turnover (or patient transfers to different beds and units) commonplace in hospital care, we believe that listing the patient's name on the board prevents the potential for patients (and their families) or providers to mistakenly take information from a previous patient's care on the whiteboard for their own.
-
Bedside nurse
This was noted as the most useful provider listed on a patient whiteboard, which is quite logical given the role bedside nurses play for hospitalized patients.
-
Primary physician(s) (attending, resident, and intern, if applicable)
This was noted as the next most important provider(s) and perhaps increasingly important both in teaching and nonteaching settings where shift‐work and signouts are growing in frequency among physicians.
-
Goal for the day
While this was not a consensus from our survey respondents, we believe patients (rather than providers) should ultimately guide determination of their goal for the day as this engages them directly with the planachieving a patient‐centered initiative. In our experience, an effective strategy was having the bedside nurse directly engage patients each morning to help place a goal for the day on their whiteboard.
-
Anticipated discharge date
While understanding the potential for this date to change, we believe the benefits of having patients (and their families) thinking about discharge, rather than feeling surprised by it on the morning of discharge, serves as an important mechanism to bridge communication about the discharge process.24
-
Family member's contact information (phone number)
-
Questions for providers
This last entry allows a space for families to engage the healthcare team and, once again, create an opportunity for clarification of treatment and discharge plans.
-
Bedside nurses should facilitate writing and updating information on the whiteboard
Without our survey findings, this might have generated debate or controversy over whether nurses should be burdened with one more task to their responsibilities. However, our nurse respondents embraced this responsibility with spontaneous comments about their patient advocate role, and stated that whiteboards can serve as a tool to assist in that responsibility. Furthermore, not a single nurse respondent stated as barrier to use that I didn't think it was my responsibility. Nonetheless, whiteboard use must be a shared communication tool and not simply a tool between nurse and patient. Practically, we would recommend that bedside nurses facilitate updating whiteboards each morning, at a time when they are already helping patients create a goal for the day. Other providers must be trained to review information on the whiteboard, engage patients about their specific goal, and share the responsibility of keeping the information on the whiteboard updated.
-
Create a system for auditing utilization and providing feedback early during rollout
We found that adoption was very slow at the outset. One strategy to consider is having designated auditors check whiteboards in each room, measuring weekly compliance and providing this feedback to nurse managers. This auditing process may help identify barriers that can be addressed quickly (eg, unavailability of pens).
Finally, it is important to comment on the confidentiality concerns often raised in the context of whiteboard use. Confidentiality concerns largely arise from personal health information being used without a patient's explicit consent. If our recommendations are adopted, they require whiteboard use to be a patient‐centered and patient‐driven initiative. The type of information on the whiteboard should be determined with sensitivity but also with consent of the patient. We have not experienced any concerns by patients or providers in this regard because patients are told about the goals of the whiteboard initiative with our above principles in mind.
Conclusions
Patient whiteboards may improve communication among members of the healthcare team (eg, nurses, physicians, and others) and between providers and their patients (and family members). Further investigation is warranted to determine if adopting our recommendations leads to improved communication, teamwork, or patient satisfaction and care. In the meantime, as many hospitals continue to install and implement whiteboards, we hope our recommendations, accompanied by an emphasis on creating a patient‐centered communication tool, offer a roadmap for considering best practices in their use.
Acknowledgements
This study of patient whiteboards developed during the Triad for Optimal Patient Safety (TOPS) project, an effort focused on improving unit‐based safety culture through improved teamwork and communication. The authors thank the Gordon and Betty Moore Foundation for their active support and funding of the TOPS project, which was a collaboration between the Schools of Medicine, Nursing, and Pharmacy at the University of California, San Francisco.
- ,,,,.Communication failures in patient sign‐out and suggestions for improvement: a critical incident analysis.Qual Saf Health Care.2005;14(6):401–407.
- ,,,.Analysis of errors reported by surgeons at three teaching hospitals.Surgery.2003;133(6):614–621.
- ,,, et al.Patterns of communication breakdowns resulting in injury to surgical patients.J Am Coll Surg.2007;204(4):533–540.
- ,,.Communication failures: an insidious contributor to medical mishaps.Acad Med.2004;79(2):186–194.
- The Joint Commission: Sentinel Event Statistics, March 31,2009. Available at: http://www.jointcommission.org/SentinelEvents/Statistics. Accessed October 2009.
- ,,, et al.Bridging the communication gap in the operating room with medical team training.Am J Surg.2005;190(5):770–774.
- ,,, et al.Error reduction and performance improvement in the emergency department through formal teamwork training: evaluation results of the MedTeams project.Health Serv Res.2002;37(6):1553–1581.
- ,.TeamSTEPPS: assuring optimal teamwork in clinical settings.Am J Med Qual.2007;22(3):214–217.
- ,,,,,.Medical team training: applying crew resource management in the Veterans Health Administration.Jt Comm J Qual Patient Saf.2007;33(6):317–325.
- ,,,,.Enhancing patient safety through teamwork training.J Healthc Risk Manag.2001;21(4):57–65.
- ,,.The human factor: the critical importance of effective teamwork and communication in providing safe care.Qual Saf Health Care.2004;13(suppl 1):i85–i90.
- ,,.SBAR: a shared mental model for improving communication between clinicians.Jt Comm J Qual Patient Saf.2006;32(3):167–175.
- ,,, et al.A multidisciplinary teamwork training program: the Triad for Optimal Patient Safety (TOPS) experience.J Gen Intern Med.2008;23(12):2053–2057.
- The Joint Commission's National Patient Safety Goals 2007 for Hospital/Critical Access Hospital. Available at:http://www.jointcommission.org/PatientSafety/NationalPatientSafetyGoals/07_hap_cah_npsgs.htm. Accessed October 2009.
- Institute of Medicine (U.S.). Committee on Quality of Health Care in America.Crossing the Quality Chasm: A New Health System for the 21st Century.Washington, DC:National Academy Press;2001.
- ,.A systems approach to patient‐centered care.JAMA.2006;296(23):2848–2851.
- ,,,,.Microsystems in health care: Part 4. Planning patient‐centered care.Jt Comm J Qual Saf.2003;29(5):227–237.
- Gerteis M, Edgman‐Levitan S, Daley J, Delbanco TL, eds.Through the Patient's Eyes: Understanding and Promoting Patient‐Centered Care.San Francisco, CA:Jossey‐Bass;1993.
- ,,.Transforming Care at the Bedside. IHI Innovation Series white paper. Boston, MA: Institute for Healthcare Improvement;2004. Available at: http://www.ihi.org. Accessed October 2009.
- ..Nurse Knowledge Exchange: Patient Hand Offs. American Academy of Ambulatory Care Nursing (AAACN) Viewpoint. Sep/Oct 2007. Available at: http://findarticles.com/p/articles/mi_qa4022/is_200709/ai_n21137476. Accessed October 2009.
- Survey Console. Available at: http://www.surveyconsole.com. Accessed October 2009.
- How do we communicate?Communication on Agile Software Projects. Available at: www.agilemodeling.com/essays/communication.htm. Accessed October 2009.
- ,,, et al.Association between nurse‐physician collaboration and patient outcomes in three intensive care units.Crit Care Med.1999;27(9):1991–1998.
- .Engaging patients at hospital discharge.J Hosp Med.2008;3(6):498–500.

The New Vocabulary of Healthcare Reform
On March 21, 2010, the United States Congress passed the most comprehensive healthcare reform bill since the formation of Medicare. The legislation's greatest impact will be to improve access for nearly 50 million Americans who are presently uninsured. Yet the bill does little to tackle the fundamental problems of the payment and delivery systemsproblems that have resulted in major quality gaps, large numbers of medical errors, fragmented care, and backbreaking costs.
While these tough questions were mostly kicked down the road, the debate did bring many of the key questions and potential solutions into high relief. Our political leaders, pundits, and health policy scholars introduced or popularized a number of terms during the healthcare debates of 2009‐2010 (Table 1). I will attempt to place them in context and discuss their implications for future healthcare reform efforts.
|
| Value‐based purchasing |
| Bending the cost curve |
| Comparative effectiveness research (see also NICE) |
| Dartmouth atlas (see also McAllen, Texas) |
| Death panels (see also rationing) |
| Bundled payments |
| Accountable care organizations (see also Mayo Clinic, Cleveland Clinic, Geisinger; replaces HMOs) |
Some Context for the Healthcare Reform Debate
In our capitalistic economy, we make most purchases based on considerations of value: quality divided by cost. There are few among us wealthy enough to always buy the best product, or cheap enough to always buy the least expensive. Instead, we try to determine value when we purchase a restaurant meal, a house, or a vacation.
Healthcare has traditionally been the major exception to this rule, both because healthcare insurance has partly insulated consumers (patients or their proxies) from the cost consequences of their decisions, and because it is so difficult to determine the quality of healthcare. But, over the past 10 to 15 years, problems with both the numerator and denominator of this equation have created widespread recognition of the need for change.
In the numerator, we now appreciate that there are nearly 100,000 deaths per year from medical mistakes;1 that we deliver evidence‐based care only about half the time,2 and that our healthcare system is extraordinarily fragmented and chaotic. We also know that there are more than 40 million people without healthcare insurance, a uniquely American problem, since other industrialized countries manage to guarantee coverage.
This is the fundamental conundrum that needs to be addressed by healthcare reform: we have a system that produces surprisingly low‐quality, unreliable care at an exorbitant and ever‐increasing cost, and does so while leaving more than 1 out of 8 citizens without coverage. Although government is a large payer (through Medicare, Medicaid, the Veterans Affairs [VA] programs and others), most Americans receive healthcare coverage as an employee benefit; a smaller number pay for health insurance themselves. The government has a key role even in these nongovernment‐sponsored payment systems, by providing tax breaks for healthcare coverage, creating a regulatory framework, and often defining the market through its actions in its public programs.
The end result is that all the involved partiesgovernments, businesses, providers, and patientsare crying out for change. An observer of this situation feels compelled to invoke the popular version of Stein's Law: if a trend can't continue, it won't.
Bending the Cost Curve
Everyone is now familiar with the scary trends (such as in Figure 1) demonstrating the unsustainable rate of healthcare inflation in the US, trends that are projected to lead to the insolvency of the Medicare Trust Fund within a decade. The term bending the cost curve implies that our solvency depends not on lowering total costs (a political impossibility), but rather on simply decreasing the rate of rise. There are only so many ways to do this.
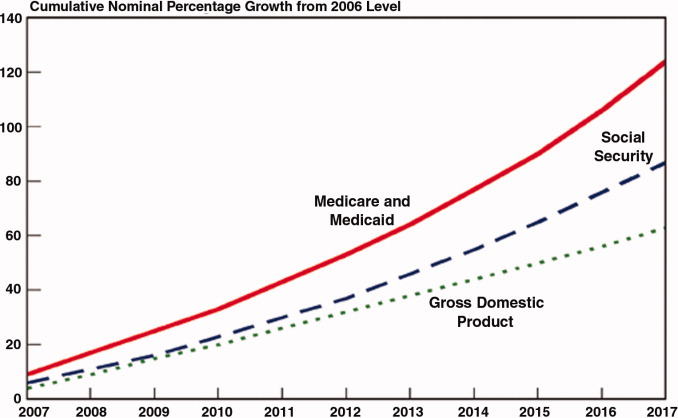
The most attractive, of course, is to stop providing expensive care that adds no or little value in terms of patient outcomes. The term comparative effectiveness research (CER) emerged over the past few years to describe research that pits one approach against another (or, presumably, against no treatment) on both outcomes and cost.3 Obviously, one would favor the less expensive treatment if the efficacy were equal. However, the more common (and politically fraught) question is whether a more expensive but slightly better approach is worth its additional cost.
This, of course, makes complete sense in a world of limited resources, and some countries, mostly notably the United Kingdom, are using CER to inform healthcare coverage decisions. In the United Kingdom, the research is analyzed, and coverage recommendations made, by an organization called the National Institute for Health and Clinical Excellence (NICE).4 While NICE appears to be working well, all signs indicate that the US political system is not ready for such an approach. In fact, although Medicare generally supports CER, most of the healthcare reform proposals considered by Congress explicitly prohibited Medicare from using CER results to influence payment decisions.
If an overall CER approach is too politically difficult for the US, how about focusing on 1 small segment of healthcare: expensive care at the end of life? Over the past 30 years, a group of Dartmouth researchers has examined the costs and quality of care across the entire country, demonstrating a ubiquitous pattern of highly variable costs (varying up to 2‐fold) that is unassociated with quality and outcomes (and sometimes even inversely associated).5 The findings, well known among healthcare researchers but relatively unknown by the public until recently, were brought to public attention by a 2009 New Yorker article that made the border town of McAllen, Texas the poster child for a medical culture that produces high costs without comparable benefits.6 The Dartmouth researchers, who publish their data in a document known as The Dartmouth Atlas, have found striking variations in care at the end of life. For example, even among academic medical centers (which presumably have similarly sick patient populations), the number of hospital days in the last 6 months of life varies strikingly: patients at New York University average 27.1 days, whereas those in my hospital average 11.5 days.7
So promoting better end‐of‐life carebeing sure that patients are aware of their options and that high‐quality palliative care is availableseemed like an obvious solution to part of our cost‐quality conundrum. Some early drafts of reform bills in Congress contained provisions to pay for physicians' time to discuss end‐of‐life options. This, of course, was caricaturized into the now famous Death Panelsproving that American political discourse is not yet mature enough to support realistic discussions about difficult subjects.8
It seems like having payers (government, insurance companies) make formal decisions about which services to cover (ie, rationing) is too hard. Is there another way to force these tough choices but do so without creating a political piata?
Encircling a Population
Rather than explicitly rationing care (using CER results, for example), another way of constraining costs is to place a population of patients on a fixed budget. There is evidence that provider organizations, working within such a budget (structured in a way that permits the providers to pocket any savings), are able to reorganize and change their practice style in a way that can cut costs.9 In the 1990s, we conducted a national experiment by promoting managed care, working through integrated delivery systems called Health Maintenance Organizations (HMOs) that received fixed, capitated payments for every patient. And, in fact, these organizations did cut overall costs.
The problem was that patients neither liked HMOs nor trusted that they were acting in their best interests. Ultimately, managed care became a less important delivery mechanism, and even patients who remained in HMOs had fewer constraints on their choices. Of course, the softening of the managed care market resulted in an uptick in healthcare inflation, contributing to our present predicament.
The concept of fixed payments has resurfaced, but with some modern twists. It appears that organizations that perform best on the Dartmouth measures (namely, they provide high quality care at lower costs) are generally large delivery systems with advanced information technology, strong primary care infrastructures, andprobably most importantlytight integration between physicians and the rest of the organization. During the healthcare debate, the organizations that received the most attention were the Mayo and Cleveland Clinics and the Geisinger system in central Pennsylvania. The problem is that the defining characteristic of these organizations (and others like them) is that they have been at this business of integrated care for more than 50 years! Can the model be emulated?
Two main policy changes have been promoted to try to achieve this integration: one is a change in payment structure, the other a change in organization. The first is known as bundlingin which multiple providers are reimbursed a single sum for all the care related to an episode of illness (such as a hospitalization and a 60‐ or 90‐day period afterwards). You will recognize this as a new form of capitation, but, rather than covering all of a patient's care, a more circumscribed version, focusing on a single illness or procedure. There is some evidence that bundling does reduce costs and may improve quality, by forcing hospitals, post‐acute care facilities, and doctors into collaborative arrangements (both to deliver care and, just as complex, to split the single payment without undue acrimony).10 Fisher et al.11 have promoted a new structure to deliver this kind of bundled care more effectively: The Accountable Care Organization (ACO), which is best thought of as a less ambitious, and potentially more virtual, incarnation of the HMO.
Interestingly, while many healthcare organizations have struggled to remake themselves in Mayo's image in preparation for upcoming pressures to form ACOs, some organizations with hospitalist programs need look no further than these programs to chart a course toward more effective physician‐hospital integration.12 Why? The majority of US hospitals now have hospitalists, and virtually all hospitalist programs receive support payments from their hospital (a sizable minority are on salary from the hospital). Hospitalists recognize that part of their value equation (which justifies the hospital support dollars) is that they help the hospital deliver higher quality care more efficiently. Because of this relationship, a well‐functioning hospitalist program can assume many of the attributes of an ACO, even in organizations with otherwise challenging physician‐hospital relations. It may be that hospitals and doctors need not look to Rochester, Minnesota or Danville, Pennsylvania for positive examples of physician‐hospital integration, but simply to their own local hospitalist groups.
The Bottom Line
While proponents of the Obama reform plan celebrate its passage, virtually all experts agree that it left fundamental problems with the healthcare system unaddressed. Although the 20092010 debate did not solve these problems, the new vocabulary introduced during the debateboth reasonable policy ideas like bundling and ACOs and cynical caricatures like death panelsare here to stay. Understanding these terms and the context that shaped them will be critical for hospitalists and other stakeholders interested in the future of the American healthcare system.
- ,,, eds.To Err is Human: Building a Safer Health System.Washington DC:Committee on Quality of Health Care in America, Institute of Medicine. National Academy Press,2000.
- ,,, et al.The quality of health care delivered to adults in the United States.N Engl J Med.2003;348:2635–2645.
- ,.Health care reform and the need for comparative‐effectiveness research.N Engl J Med.2010;362:e6.
- .Saying no isn't NICE—the travails of Britain's National Institute for health and clinical excellence.N Engl J Med.2008;359:1977–1981.
- .Wrestling with variation: an interview with Jack Wennberg [interviewed by Fitzhugh Mullan].Health Aff (Millwood).2004; Suppl Web Exclsives:VAR73–80.
- .The cost conundrum. What a Texas town can teach us about health care.The New Yorker2009. Available at: http://www.newyorker. com/reporting/2009/06/01/090601fa_fact_gawande. Accessed February 2010.
- .Researchers find huge variations in end‐of‐life treatment.New York Times.2008. Available at: http://www.nytimes.com/2008/04/07/health/policy/07care.html?_r=1. Accessed February 2010.
- .Ending end‐of‐life phobia—a prescription for enlightened health care reform.N Engl J Med.2009. Available at: http://healthcarere form.nejm.org/?p=2580. Accessed February 2010.
- ,.The RAND Health Insurance Experiment and HMOs.Med Care.1990;28:191–200.
- ,,.Cost savings and physician responses to global bundled payments for Medicare heart bypass surgery.Health Care Fin Rev.1997;19:41–57.
- ,,,.Creating accountable care organizations: the extended hospital medical staff.Health Aff (Millwood).2007;26(1):w44–w57.
- . Hospitalists: a little slice of Mayo. Available at: http://community.the‐hospitalist.org/blogs/wachters_world/archive/2009/08/30/hospitalists‐a‐little‐slice‐of‐mayo.aspx. Accessed February 2010.
On March 21, 2010, the United States Congress passed the most comprehensive healthcare reform bill since the formation of Medicare. The legislation's greatest impact will be to improve access for nearly 50 million Americans who are presently uninsured. Yet the bill does little to tackle the fundamental problems of the payment and delivery systemsproblems that have resulted in major quality gaps, large numbers of medical errors, fragmented care, and backbreaking costs.
While these tough questions were mostly kicked down the road, the debate did bring many of the key questions and potential solutions into high relief. Our political leaders, pundits, and health policy scholars introduced or popularized a number of terms during the healthcare debates of 2009‐2010 (Table 1). I will attempt to place them in context and discuss their implications for future healthcare reform efforts.
|
| Value‐based purchasing |
| Bending the cost curve |
| Comparative effectiveness research (see also NICE) |
| Dartmouth atlas (see also McAllen, Texas) |
| Death panels (see also rationing) |
| Bundled payments |
| Accountable care organizations (see also Mayo Clinic, Cleveland Clinic, Geisinger; replaces HMOs) |
Some Context for the Healthcare Reform Debate
In our capitalistic economy, we make most purchases based on considerations of value: quality divided by cost. There are few among us wealthy enough to always buy the best product, or cheap enough to always buy the least expensive. Instead, we try to determine value when we purchase a restaurant meal, a house, or a vacation.
Healthcare has traditionally been the major exception to this rule, both because healthcare insurance has partly insulated consumers (patients or their proxies) from the cost consequences of their decisions, and because it is so difficult to determine the quality of healthcare. But, over the past 10 to 15 years, problems with both the numerator and denominator of this equation have created widespread recognition of the need for change.
In the numerator, we now appreciate that there are nearly 100,000 deaths per year from medical mistakes;1 that we deliver evidence‐based care only about half the time,2 and that our healthcare system is extraordinarily fragmented and chaotic. We also know that there are more than 40 million people without healthcare insurance, a uniquely American problem, since other industrialized countries manage to guarantee coverage.
This is the fundamental conundrum that needs to be addressed by healthcare reform: we have a system that produces surprisingly low‐quality, unreliable care at an exorbitant and ever‐increasing cost, and does so while leaving more than 1 out of 8 citizens without coverage. Although government is a large payer (through Medicare, Medicaid, the Veterans Affairs [VA] programs and others), most Americans receive healthcare coverage as an employee benefit; a smaller number pay for health insurance themselves. The government has a key role even in these nongovernment‐sponsored payment systems, by providing tax breaks for healthcare coverage, creating a regulatory framework, and often defining the market through its actions in its public programs.
The end result is that all the involved partiesgovernments, businesses, providers, and patientsare crying out for change. An observer of this situation feels compelled to invoke the popular version of Stein's Law: if a trend can't continue, it won't.
Bending the Cost Curve
Everyone is now familiar with the scary trends (such as in Figure 1) demonstrating the unsustainable rate of healthcare inflation in the US, trends that are projected to lead to the insolvency of the Medicare Trust Fund within a decade. The term bending the cost curve implies that our solvency depends not on lowering total costs (a political impossibility), but rather on simply decreasing the rate of rise. There are only so many ways to do this.
The most attractive, of course, is to stop providing expensive care that adds no or little value in terms of patient outcomes. The term comparative effectiveness research (CER) emerged over the past few years to describe research that pits one approach against another (or, presumably, against no treatment) on both outcomes and cost.3 Obviously, one would favor the less expensive treatment if the efficacy were equal. However, the more common (and politically fraught) question is whether a more expensive but slightly better approach is worth its additional cost.
This, of course, makes complete sense in a world of limited resources, and some countries, mostly notably the United Kingdom, are using CER to inform healthcare coverage decisions. In the United Kingdom, the research is analyzed, and coverage recommendations made, by an organization called the National Institute for Health and Clinical Excellence (NICE).4 While NICE appears to be working well, all signs indicate that the US political system is not ready for such an approach. In fact, although Medicare generally supports CER, most of the healthcare reform proposals considered by Congress explicitly prohibited Medicare from using CER results to influence payment decisions.
If an overall CER approach is too politically difficult for the US, how about focusing on 1 small segment of healthcare: expensive care at the end of life? Over the past 30 years, a group of Dartmouth researchers has examined the costs and quality of care across the entire country, demonstrating a ubiquitous pattern of highly variable costs (varying up to 2‐fold) that is unassociated with quality and outcomes (and sometimes even inversely associated).5 The findings, well known among healthcare researchers but relatively unknown by the public until recently, were brought to public attention by a 2009 New Yorker article that made the border town of McAllen, Texas the poster child for a medical culture that produces high costs without comparable benefits.6 The Dartmouth researchers, who publish their data in a document known as The Dartmouth Atlas, have found striking variations in care at the end of life. For example, even among academic medical centers (which presumably have similarly sick patient populations), the number of hospital days in the last 6 months of life varies strikingly: patients at New York University average 27.1 days, whereas those in my hospital average 11.5 days.7
So promoting better end‐of‐life carebeing sure that patients are aware of their options and that high‐quality palliative care is availableseemed like an obvious solution to part of our cost‐quality conundrum. Some early drafts of reform bills in Congress contained provisions to pay for physicians' time to discuss end‐of‐life options. This, of course, was caricaturized into the now famous Death Panelsproving that American political discourse is not yet mature enough to support realistic discussions about difficult subjects.8
It seems like having payers (government, insurance companies) make formal decisions about which services to cover (ie, rationing) is too hard. Is there another way to force these tough choices but do so without creating a political piata?
Encircling a Population
Rather than explicitly rationing care (using CER results, for example), another way of constraining costs is to place a population of patients on a fixed budget. There is evidence that provider organizations, working within such a budget (structured in a way that permits the providers to pocket any savings), are able to reorganize and change their practice style in a way that can cut costs.9 In the 1990s, we conducted a national experiment by promoting managed care, working through integrated delivery systems called Health Maintenance Organizations (HMOs) that received fixed, capitated payments for every patient. And, in fact, these organizations did cut overall costs.
The problem was that patients neither liked HMOs nor trusted that they were acting in their best interests. Ultimately, managed care became a less important delivery mechanism, and even patients who remained in HMOs had fewer constraints on their choices. Of course, the softening of the managed care market resulted in an uptick in healthcare inflation, contributing to our present predicament.
The concept of fixed payments has resurfaced, but with some modern twists. It appears that organizations that perform best on the Dartmouth measures (namely, they provide high quality care at lower costs) are generally large delivery systems with advanced information technology, strong primary care infrastructures, andprobably most importantlytight integration between physicians and the rest of the organization. During the healthcare debate, the organizations that received the most attention were the Mayo and Cleveland Clinics and the Geisinger system in central Pennsylvania. The problem is that the defining characteristic of these organizations (and others like them) is that they have been at this business of integrated care for more than 50 years! Can the model be emulated?
Two main policy changes have been promoted to try to achieve this integration: one is a change in payment structure, the other a change in organization. The first is known as bundlingin which multiple providers are reimbursed a single sum for all the care related to an episode of illness (such as a hospitalization and a 60‐ or 90‐day period afterwards). You will recognize this as a new form of capitation, but, rather than covering all of a patient's care, a more circumscribed version, focusing on a single illness or procedure. There is some evidence that bundling does reduce costs and may improve quality, by forcing hospitals, post‐acute care facilities, and doctors into collaborative arrangements (both to deliver care and, just as complex, to split the single payment without undue acrimony).10 Fisher et al.11 have promoted a new structure to deliver this kind of bundled care more effectively: The Accountable Care Organization (ACO), which is best thought of as a less ambitious, and potentially more virtual, incarnation of the HMO.
Interestingly, while many healthcare organizations have struggled to remake themselves in Mayo's image in preparation for upcoming pressures to form ACOs, some organizations with hospitalist programs need look no further than these programs to chart a course toward more effective physician‐hospital integration.12 Why? The majority of US hospitals now have hospitalists, and virtually all hospitalist programs receive support payments from their hospital (a sizable minority are on salary from the hospital). Hospitalists recognize that part of their value equation (which justifies the hospital support dollars) is that they help the hospital deliver higher quality care more efficiently. Because of this relationship, a well‐functioning hospitalist program can assume many of the attributes of an ACO, even in organizations with otherwise challenging physician‐hospital relations. It may be that hospitals and doctors need not look to Rochester, Minnesota or Danville, Pennsylvania for positive examples of physician‐hospital integration, but simply to their own local hospitalist groups.
The Bottom Line
While proponents of the Obama reform plan celebrate its passage, virtually all experts agree that it left fundamental problems with the healthcare system unaddressed. Although the 20092010 debate did not solve these problems, the new vocabulary introduced during the debateboth reasonable policy ideas like bundling and ACOs and cynical caricatures like death panelsare here to stay. Understanding these terms and the context that shaped them will be critical for hospitalists and other stakeholders interested in the future of the American healthcare system.
- ,,, eds.To Err is Human: Building a Safer Health System.Washington DC:Committee on Quality of Health Care in America, Institute of Medicine. National Academy Press,2000.
- ,,, et al.The quality of health care delivered to adults in the United States.N Engl J Med.2003;348:2635–2645.
- ,.Health care reform and the need for comparative‐effectiveness research.N Engl J Med.2010;362:e6.
- .Saying no isn't NICE—the travails of Britain's National Institute for health and clinical excellence.N Engl J Med.2008;359:1977–1981.
- .Wrestling with variation: an interview with Jack Wennberg [interviewed by Fitzhugh Mullan].Health Aff (Millwood).2004; Suppl Web Exclsives:VAR73–80.
- .The cost conundrum. What a Texas town can teach us about health care.The New Yorker2009. Available at: http://www.newyorker. com/reporting/2009/06/01/090601fa_fact_gawande. Accessed February 2010.
- .Researchers find huge variations in end‐of‐life treatment.New York Times.2008. Available at: http://www.nytimes.com/2008/04/07/health/policy/07care.html?_r=1. Accessed February 2010.
- .Ending end‐of‐life phobia—a prescription for enlightened health care reform.N Engl J Med.2009. Available at: http://healthcarere form.nejm.org/?p=2580. Accessed February 2010.
- ,.The RAND Health Insurance Experiment and HMOs.Med Care.1990;28:191–200.
- ,,.Cost savings and physician responses to global bundled payments for Medicare heart bypass surgery.Health Care Fin Rev.1997;19:41–57.
- ,,,.Creating accountable care organizations: the extended hospital medical staff.Health Aff (Millwood).2007;26(1):w44–w57.
- . Hospitalists: a little slice of Mayo. Available at: http://community.the‐hospitalist.org/blogs/wachters_world/archive/2009/08/30/hospitalists‐a‐little‐slice‐of‐mayo.aspx. Accessed February 2010.

Hospital Leader Survey
In the late 1990s, hospitalist systems grew rapidly in an environment where cost containment was paramount, complexity of patients increased, and outpatient practices experienced increasing productivity and efficiency pressures.15 While the healthcare delivery environment has changed significantly since that time,68 hospitalists have continued to become more common. In fact, the field's present size of more than 25,000 has already exceeded early projections, and there are no signs of slackening demand.911
Growth has been attributed to primary care physicians' increasing focus on outpatient care, hospitals' response to financial pressures, and the need to facilitate improved communication among various hospital care providers.1216 Hospital leadership has played a similarly important role in fueling the growth of hospitalists, particularly since the vast majority of programs require and receive institutional (usually hospital) support.17 However, the factors that continue to influence leaders' decisions to utilize hospitalists and the current and future needs that hospitalists are fulfilling are unknown. Each of these factors is likely to impact growth of the field, as well as the clinical and organizational identity of hospitalists. In addition, an understanding of the market demand for hospitalists' competencies and the roles they play in the hospital may inform any changes in board certification and training for hospitalists.11, 1821
To gain a more complete understanding of a key part of the engine driving the growth of hospitalists, we performed a cross‐sectional survey of California hospital leaders who were involved with the funding or administration of their hospitalist groups. Our survey aimed to understand: (1) the prevalence of hospitalist groups in California hospitals, (2) hospital leaders' rationale for initiating the use of hospitalists, (3) the scope of clinical and nonclinical practice of hospitalists, and 4) hospital leaders' perspective on the need for further training and/or certification.
Materials and Methods
Sites and Subjects
We targeted all nonfederal, nonspecialty, acute care hospitals in California (n = 334) for this survey. We limited our survey to California in order to maximize our local resources and to improve implementation of and response to the survey. Additionally, California's size and diversity gives it disproportionate impact and potential generalizability. At each site, we focused our efforts on identifying and surveying executives or administrative leaders involved in organizational and staff decisions, specifically the decision whether or not to hire and/or fund a hospitalist program and potentially direct its activities (described in more detail below). The University of California, San Francisco, Committee on Human Research approved the research protocol.
We identified hospital leaders at each site by merging information from multiple sources. These included the American Hospital Association database, the California Hospital Association, the Hospital Association of Southern California (HASC), the California Health Care Safety Net Institute, and individual hospital websites.
Survey Development
Our survey was based upon instruments used in previous research examining hospital medicine group organizational structure15, 22 and enhanced with questions developed by the research team (A.D.A., E.E.V., R.M.W.). The survey was pretested in an advisory group of 5 hospital Chief Executive Officers (CEOs), Chief Medical Officers (CMOs), and Vice Presidents for Medical Affairs (VPMAs) from sites across California. Based on their input, we removed, edited, or added questions to our survey. This advisory group also helped the research team design our survey process.
Our final survey defined a hospitalist as a physician who spends all or the majority of his or her clinical, administrative, educational, or research activities in the care of hospitalized patients.4 We collected data in 4 areas: (1) We asked hospital leaders to confirm the presence or absence of at least 1 hospitalist group practicing within the surveyed hospital. We also asked for the year the first hospitalist group began practicing within the specified hospital. (2) We asked hospital leaders to indicate, among a prespecified list of 11 choices, the reason(s) they implemented a hospitalist group at the surveyed hospital. Surveyed categories included: (a) care for uncovered patients (patients without an identified doctor and/or uninsured), (b) improve costs, (c) improve length of stay, (d) improve emergency department throughput, (e) primary care provider demand, (f) improve patient satisfaction, (g) improve emergency room staffing, (h) quality improvement needs, (i) specialist physician demand, (j) overnight coverage, and (k) surgical comanagement. Due to the close relationship between cost and length of stay, we combined these 2 categories into a single category for reporting and analysis. This resulted in 10 final categories. We asked leaders who did not identify a practicing hospitalist group about the likelihood of hospitalists practicing at their hospital within the next 5 years and the reason(s) for future implementation. (3) We asked leaders to describe the services currently provided among a prespecified list of clinical care duties that go beyond the scope of inpatient general internal medicine (eg, surgical comanagement, rapid response team leadership) as well as nonclinical duties (eg, quality improvement activities, systems project implementation). If hospitalists did not currently provide the identified service, we asked leaders to indicate if they would be inclined to involve hospitalists in the specified service in the future. (4) Finally, we asked hospital leaders their opinion regarding the need for further training or certification for hospitalists.
Survey Protocol
We administered surveys between October 2006 and April 2007. We initially emailed the survey. We repeated this process for nonrespondents at intervals of 1 to 3 weeks after the initial emailing. Next, we sent nonrespondents a physical mailing with a reminder letter. Finally, we made phone calls to those who had not responded within 4 weeks of the last mailed letter. We asked survey recipients to respond only if they felt they had an adequate working knowledge of the hospitalist service at their hospital. If they did not feel they could adequately answer all questions, we allowed them to forward the instrument to others with a better working knowledge of the service.
Because we allowed recipients to forward the survey, we occasionally received 2 surveys from 1 site. In this case, we selected the survey according to the following prioritization order: (1) CEOs/COOs, (2) CMOs, (3) VPMAs, and (4) other vice presidents (VPs) or executive/administrative leaders with staff organization knowledge and responsibilities.
Hospital Descriptive Data
We obtained hospital organizational data from the California Office of Statewide Health Planning and Development's (OSHPD) publicly available Case Mix Index Data, hospital Annual Financial Data, aggregated Patient Discharge Data, and Utilization Data from 2006.23 Organizational characteristics included hospital size, location, profit status, payor mix, and diagnosis‐related groupbased case‐mix. Teaching status was determined from the 2005 American Hospital Association database. Membership status in California's voluntary quality reporting initiative, California Hospital Assessment and Reporting Taskforce (CHART), was publicly available at
Statistical Analyses
We performed univariable analyses to characterize survey respondents, followed by bivariable analyses to compare hospital characteristics and patient mix of responding and nonresponding hospitals. We used similar methods to characterize respondent hospitals with and without at least 1 hospitalist group. We compared continuous data with the Students t tests or Mann‐Whitney tests as appropriate and categorical data with chi‐square tests.
We then summarized the number of times a specific rationale was cited by hospital leaders for implementing a hospitalist group. Among hospitals that did not have a hospitalist system in place at the time of the survey, we asked if they were planning on starting one within the next 5 years. For these hospitals, we used content analysis to summarize open‐ended responses in order to understand factors that are currently influencing these hospital leaders to consider implementing a hospitalist group.
Next, we aimed to understand what clinical and nonclinical roles hospitalists were performing in hospitals with established hospitalist programs. Clinical activities were divided into general clinical areas, triage/emergency‐related, or administrative activities. First, we summarized the number and percent of programs performing each clinical and nonclinical activity. This was followed by logistic regression analyses to assess whether the time period that hospitalist groups began practicing or additional hospital characteristics predicted the performance of individual hospitalist activities. To guard against overfitting of models, analyses were limited to rationales that were cited a minimum of 50 times.24 Hospital factors were selected on the basis of face validity and advisory group input and included hospital bed size, ownership status (public vs. private), teaching status, and membership status in CHART. We divided the year of hospitalist program implementation into 3 time periods: (1) before 2002, (2) between 2002 and 2004, and (3) 2005 or later.
Finally, we described the percentage of hospitals that favored having their hospitalist group(s) perform each of the identified clinical or nonclinical activities, if they were not already performing them. We performed analyses with statistical software (Stata Version 9.2, College Station, TX).
Results
Respondent Characteristics
We received 200 survey responses. Of those, we excluded 15 duplicates (eg, a survey from both the CEO and VPMA) and 6 responses identified as coming from hospitalists who did not have a leadership position in the hospital. Thus, the final hospital leader survey response rate was 54% (n = 179). Forty‐six percent of the final responses were from CEOs or COOs; 37% of responses were from CMOs, VPMAs, and medical directors; and the remaining 17% of responses were from other VPs or administrative directors.
Respondent and nonrespondent hospitals were statistically similar in terms of teaching status and participation in CHART. Hospital patient census, intensive care unit census, payer mix, and diagnosis‐related groupbased case‐mix revealed no statistically significant differences between groups (P > 0.05). Respondent hospitals tended to have fewer beds and were more often for‐profit compared to nonrespondents (P = 0.05 and P < 0.01, respectively).
Descriptive Characteristics of Hospitals with Hospitalists
Sixty‐four percent (n = 115) of hospital leaders stated that they utilized hospitalists for at least some patients. Hospitals with hospitalists were statistically more likely (P < 0.05) to be larger, a major teaching hospital, or a member of a voluntary quality reporting initiative (Table 1).
| Variable | Hospitals without Hospitalists (n = 64) [n (%)] | Hospitals with Hospitalists (n = 115) [n (%)] | P Value* |
|---|---|---|---|
| |||
| Hospital size (total number of beds) | |||
| 0‐99 | 33 (51.6) | 18 (15.7) | <0.001 |
| 100‐199 | 19 (29.7) | 32 (27.8) | |
| 200‐299 | 5 (7.8) | 23 (20.0) | |
| 300+ | 7 (10.9) | 42 (36.5) | |
| Hospital control | 0.12 | ||
| City/county | 8 (12.5) | 7 (6.1) | |
| District | 15 (23.4) | 17 (14.8) | |
| For‐profit | 10 (15.6) | 16 (13.9) | |
| Non‐profit | 31 (48.4) | 71 (61.7) | |
| University of California | 0 (0.0) | 4 (3.5) | |
| Teaching hospital | 8 (12.5) | 30 (26.1) | 0.03 |
| Member of voluntary quality reporting initiative | 27 (42.2) | 93 (80.9) | <0.001 |
Among all hospitals with hospitalists, 39% estimated that hospitalists cared for at least one‐half of admitted medical patients, and 7% stated that hospitalists cared for all patients. Twenty‐four percent of respondents were unable to provide a quantitative estimate of the percent of patients cared for by hospitalists. When asked about expectations of growth in the coming year, 57% of respondents with hospitalists expected to see increases in the number of hospitalists at their hospital, and none expected a decrease. Among the 64 respondent hospitals that currently did not have a hospitalist program, 44% (n = 28) of the hospital leaders felt hospitalists would be managing patients in the future. Of those, 93% felt this would occur within the next 2 years.
Reasons for Implementing Hospitalists
Hospital leaders reported that the most important reasons for implementing a hospitalist model included caring for uncovered patients (68%), decreasing hospital costs and length of stay (63%), and improving throughput in the emergency room (62%). We provide additional reasons in Figure 1. In addition, leaders often identified multiple factors in the decision to utilize hospitalists, including demand from primary care doctors, patient satisfaction, and quality improvement. Among the 28 hospitals that currently did not have hospitalists but anticipated that they would soon (data not shown), the need to improve quality was the most commonly cited reason (54% of respondents) for expecting to start a program within 2 years, followed by demand from primary care doctors (46% of respondents).

Clinical Practice of Hospitalists and Expectations for Future Growth
Hospitalists perform a wide array of clinical and nonclinical duties (Figure 2). In addition to general medical care, the most common clinical activities of hospitalists included screening medical admissions from the emergency room for appropriateness of admission and triaging to appropriate level of care (67%), triaging patients transferred from an outside hospital (72%), and comanaging surgical patients (66%). The most common nonclinical activity was participation in quality improvement activities (72%). Multivariable analyses demonstrated that the performance of the most prevalent activities was not usually associated with the year of hospitalist implementation or hospital characteristics. An exception was that newly initiated programs had a statistically significant decreased odds of involvement in clinical guideline development (odds ratio [OR], 0.3; 95% confidence interval [CI], 0.1‐0.9) and a trend toward decreased leadership in quality improvement (OR, 0.3; 95% CI, 0.1‐1.1). Hospitalists at teaching hospitals had increased odds of managing patient transfers (OR, 4.7; 95% CI, 1.0‐21.2), whereas for‐profit hospitals had lower odds of screening patients in the emergency room (OR, 0.1; 95% CI, 0.0‐0.7).
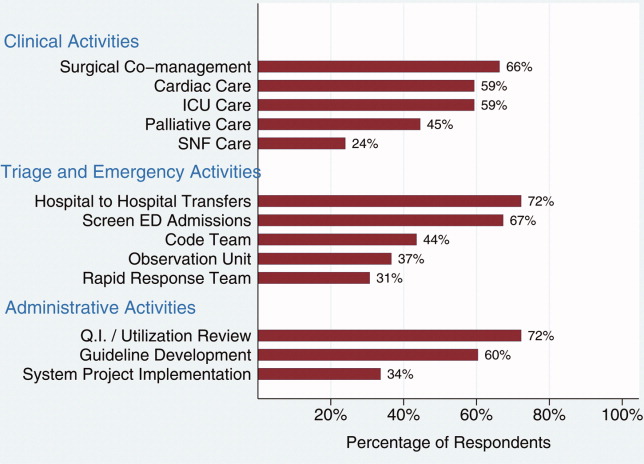
Among those hospitals with hospitalists who were not presently involved in any of the above activities, there was a widespread interest among hospital leaders to have their hospitalist group(s) lead or participate in them (Figure 3). The most commonly cited activities included participation in inpatient clinical guideline development (85%), implementation of system‐wide projects (81%) (eg, computerized physician order entry system), participation on a rapid response team (80%), and caring for patients in an observation unit (80%).
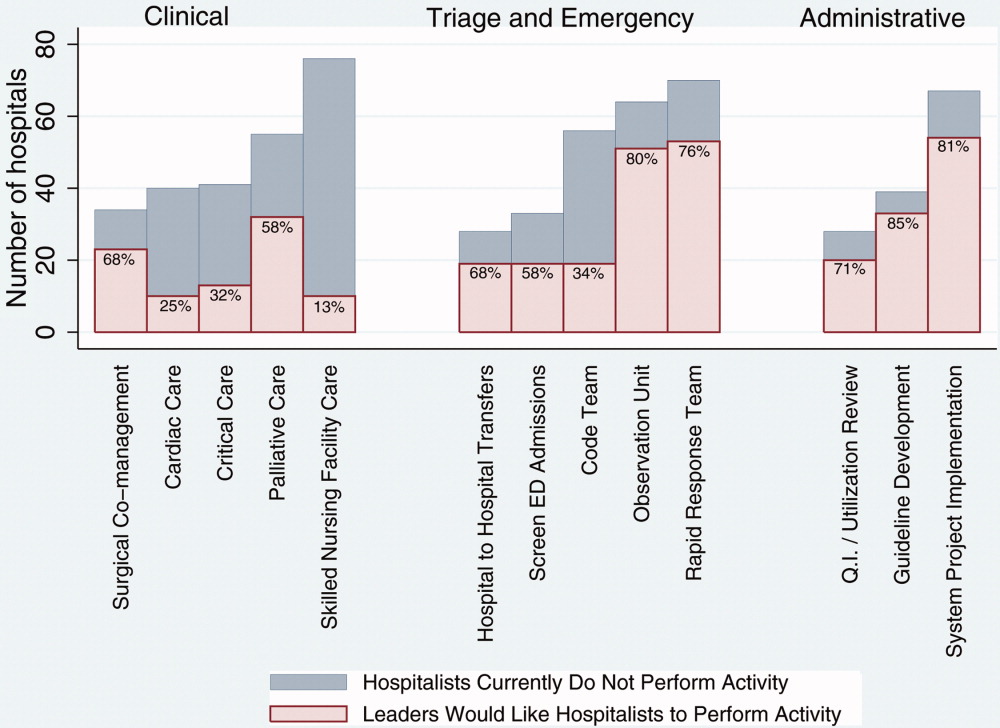
Training and Certification for Hospitalists
About two‐thirds (64%) of hospital leaders with a hospitalist group(s) agreed or strongly agreed that hospitalists should have additional training and/or certification. Seventeen percent were undecided, whereas 11% either disagreed or strongly disagreed, and the remaining 8% did not provide an opinion.
Discussion
Most California hospital leaders reported utilizing hospitalists, and a substantial number of those without a hospitalist service plan to implement one in the next 5 years. Our data suggest that the number of hospitalists and their roles will continue to expand, with quality improvement activities and participation in clinical roles outside of general medical care being key priorities for future growth. Interestingly, much of this growth may not be catalyzed by past drivers (such as need to contain costs or length of stay) but by increasing need to implement quality and safety initiatives, as well as demand from other physicians. As a result, the field of hospital medicine will grow in numbers and breadth of practice. Defining the typical practice of a hospitalist may become more challenging.
Consistent with previous work,11, 16 our data suggest widespread adoption of hospitalists. While our data demonstrates that academic hospitals in California were more likely to have hospitalists, it is also important to note that hospitalist systems were widespread across a wide range of hospital sizes and ownership types. The prevalence appears likely to increase in the future. None of the hospitals surveyed planned to eliminate or reduce the size of their programs. Among hospitals without a hospitalist program, 44% (n = 28) reported they were going to implement a hospitalist group within the next 2 years. Future workforce development must consider this growth in order to increase physician supply to meet the demands of hospitalist growth.
Consistent with prior surveys of hospitalists and the healthcare marketplace,13, 15, 16, 25 our survey of hospital leaders suggests that the care of uncovered patients and the goal of improving hospital efficiency are key reasons for implementing hospitalists. Although these are important, we found that hospital leaders have additional intentions when implementing or expanding hospitalist systems, including improving patient satisfaction and quality. Although quality improvement activities were not among the most common reasons that leaders originally implemented programs, the most established programs had increased odds (relative to the most recently implemented programs) of leading quality improvement and clinical guideline activities. This may reflect a natural progression over time for hospitalist groups to develop from a patient‐focused clinical role to one that incorporates responsibilities that increasingly impact the hospital system and organization. The interest in utilizing hospitalists for leadership in quality improvement was widely expressed among those leaders who had yet to utilize hospitalists. Interestingly, this driver remains even as evidence for whether hospitalist practices produce measurable differences in care outcomes is mixed.26, 27 Nevertheless, hospital leaders are under increasing pressure to improve quality and safety (driven by public reporting and pay‐for‐performance initiatives), and many leaders appear to believe that hospitalists will be a key part of the solution.13, 28
In addition to quality improvement, continued demand for hospitalists may result from growing clinical demands, including clinical support for medical specialists and surgeons. A majority of leaders acknowledged current or future interest in having hospitalists comanage surgical patients, with the hope that such practices will improve surgeons' productivity and clinical outcomes.16, 29, 30 In addition, hospitalists may address potential shortages in specialty areas. For example, having hospitalists participate in critical care may partly ameliorate the impact of a large national shortage of critical care physicians.12, 31 If hospitalists are to assume major roles in the provision of critical care (particularly if not comanaging patients with intensivists), they may require some augmented training in the intensive care unit.
Our results paint a picture of a rapidly expanding field, both in scope and in number. Hospitalists appear to be performing a wide range of clinical, triage, and administrative activities, and there is demand among hospital leadership for hospitalists to take on additional responsibilities. Interestingly, it appears that participation in most clinical and nonclinical activities occur across the spectrum of organizational characteristics, and demand is not limited only to large or academic hospitals. Participation in such a broad array of activities brings into question the need for additional training and certification of hospitalists. While the need for hospitalists to receive additional training has been posited in the past, our data suggest there is a perceived need from the hospital administration as well. This additional training (and subsequent certification) would likely need to encompass many of the practices we have identified as core to hospitalists' practice. In addition to ensuring adequate training, policymakers will need to consider the supply of physicians necessary to meet the present and, likely, future demand for hospitalists. This is especially important in light of recent evidence of continued decreasing interest in general internal medicine, the main pool from which hospitalists are drawn.32 A shortage of internists is likely to influence expansion plans by hospitals in terms of activities in which leaders ask hospitalists to engage, or the number of hospitalists overall.
Our study has several limitations. First, a substantial number of nonrespondents may potentially bias our results. Despite this, we have drawn results across a wide range of hospitals, and the characteristics of responders and nonresponders are very similar. In addition, our study exclusively examines the responses of leaders in California hospitals. Although we sampled a large and heterogeneous group of hospitals, these results may not be entirely generalizable to other regions. As a cross‐sectional survey of hospital executives, responses are subject to leaders' recall. In particular, the reasons for implementation provided by leaders of older programs may potentially reflect contemporary reasons for hospitalist utilization rather than the original reasons. Another limitation of our study is our focus on hospital leaders' reports of prevalence and the clinical/nonclinical activities of hospitalists. Since senior executives often help begin a program but become less involved over time, executives' answers may well underestimate the prevalence of hospitalists and the breadth of their clinical practices, particularly in more mature programs. For instance, hospitalists that are part of an independent practice association (IPA) may provide functions for the IPA group that the hospital itself does not direct or fund. This effect may be more pronounced among the largest hospitals that may be organizationally complex, perhaps making suspect the responses from 7 very large hospitals that claimed not to utilize hospitalists. Finally, we collected information regarding the reasons for hospitalist group implementation and the services they provide by means of a prespecified list of answers. Although a thorough literature review and expert advisory panel guided the development of prespecified lists, they are by no means exhaustive. As a result, our prespecified lists may miss some important reasons for implementation, or services provided by hospitalists, that one could identify using an open‐ended survey. In addition, in the case of multiple responses from hospital leaders, we gave equal weight to responses. This has the effect of overestimating the weight of reasons that were less important, while underestimating the weight of reasons that may have been more important in the decision making process of implementing a hospitalist group.
While nonhospitalist physicians continue to provide a considerable proportion of hospital care for medical patients, hospitalists are assuming a larger role in the care of a growing number of patients in the hospital. The ongoing need to increase care efficiency drives some of this growth, but pressures to improve care quality and demand from other physicians are increasingly important drivers of growth. As the field grows and clinical roles diversify, there must be increased focus placed on the training requirements of hospitalists to reflect the scope of current practice and meet hospital needs to improve quality and efficiency.
Acknowledgements
The authors acknowledge Teresa Chipps, BS, Department of Medicine (General Internal Medicine and Public Health), Center for Health Services Research, Vanderbilt University, Nashville, TN, for her administrative and editorial assistance in the preparation of the manuscript.
- ,,,,,.Implementation of a hospitalist system in a large health maintenance organization: the Kaiser Permanente experience.Ann Intern Med.1999;130:355–359.
- ,,.Primary care family physicians and 2 hospitalist models: comparison of outcomes, processes, and costs.J Fam Pract.2002;51:1021–1027.
- ,.Effects of an HMO hospitalist program on inpatient utilization.Am J Manag Care.2001;7:1051–1057.
- ,.The emerging role of “hospitalists” in the American health care system.N Engl J Med.1996;335:514–517.
- .The hospitalist model: perspectives of the patient, the internist, and internal medicine.Ann Intern Med.1999;130:368–372.
- ,,,.The changing face of managed care.Health Aff.2002;21:11–23.
- .The death of managed care: a regulatory autopsy.J Health Polit Policy Law.2005;30:427–452.
- .The end of managed care.JAMA.2001;285:2622–2628.
- ,,,,,.Trends in market demand for internal medicine 1999 to 2004: an analysis of physician job advertisements.J Gen Intern Med.2006;21:1079–1085.
- ,,,.Growth in the care of older patients by hospitalists in the United States.N Engl J Med.2009;360:1102–1112.
- ,,,.The status of hospital medicine groups in the United States.J Hosp Med.2006;1:75–80.
- .Leapfrog and critical care: evidence‐ and reality‐based intensive care for the 21st century.Am J Med.2004;116:188–193.
- ,,,.Health care market trends and the evolution of hospitalist use and roles.J Gen Intern Med.2005;20:101–107.
- ,,,.Financial pressures spur physician entrepreneurialism.Health Aff.2004;23:70–81.
- ,,,,,.Physician attitudes toward and prevalence of the hospitalist model of care: results of a national survey.Am J Med.2000;109:648–653.
- ,,,.Hospitalists and care transitions: the divorce of inpatient and outpatient care.Health Aff.2008;27:1315–1327.
- Society of Hospital Medicine. 2005‐2006 SHM Survey: State of the Hospital Medicine Movement. Available at: http://dev.hospitalmedicine.org/AM/Template.cfm?Section=Survey2:102–104.
- ,,,.Hospitalists' perceptions of their residency training needs: results of a national survey.Am J Med.2001;111:247–254.
- ,,,,.The spectrum of community‐based hospitalist practice: A call to tailor internal medicine residency training.Arch Intern Med.2007;167:727–728.
- ,,,,.Fulfilling the promise of hospital medicine: tailoring internal medicine training to address hospitalists' needs.J Gen Intern Med.2008;23:1110–1115.
- ,,,.Hospitalists and the practice of inpatient medicine: results of a survey of the national association of inpatient physicians.Ann Intern Med.1999;130:343–349.
- Office of Statewide Health Planning and Development. Healthcare Information Division ‐ Data Products. Available at: http://www.oshpd.ca.gov/HID/DataFlow/HospMain.html. Accessed May2009.
- ,.Relaxing the rule of ten events per variable in logistic and Cox regression.Am J Epidemiol.2007;165:710–718.
- ,,.Hospital‐physician relations: cooperation, competition, or separation?Health Aff.2007;26:w31–w43.
- ,,,,,.Outcomes of care by hospitalists, general internists, and family physicians.N Engl J Med.2007;357:2589–2600.
- ,,, et al.Quality of care for decompensated heart failure: comparable performance between academic hospitalists and non‐hospitalists.J Gen Intern Med.2008;23:1399–1406.
- ,,.The impact of quality‐reporting programs on hospital operations.Health Aff.2006;25:1412–1422.
- ,,, et al.Medical and surgical comanagement after elective hip and knee arthroplasty: a randomized, controlled trial.Ann Intern Med.2004;141:28–38.
- ,,.Associations between the hospitalist model of care and quality‐of‐care‐related outcomes in patients undergoing hip fracture surgery.Mayo Clin Proc.2006;81:28–31.
- ,,, et al.The critical care crisis in the United States: a report from the profession.Chest.2004;125:1514–1517.
- ,,, et al.Factors associated with medical students' career choices regarding internal medicine.JAMA.2008;300:1154–1164.
In the late 1990s, hospitalist systems grew rapidly in an environment where cost containment was paramount, complexity of patients increased, and outpatient practices experienced increasing productivity and efficiency pressures.15 While the healthcare delivery environment has changed significantly since that time,68 hospitalists have continued to become more common. In fact, the field's present size of more than 25,000 has already exceeded early projections, and there are no signs of slackening demand.911
Growth has been attributed to primary care physicians' increasing focus on outpatient care, hospitals' response to financial pressures, and the need to facilitate improved communication among various hospital care providers.1216 Hospital leadership has played a similarly important role in fueling the growth of hospitalists, particularly since the vast majority of programs require and receive institutional (usually hospital) support.17 However, the factors that continue to influence leaders' decisions to utilize hospitalists and the current and future needs that hospitalists are fulfilling are unknown. Each of these factors is likely to impact growth of the field, as well as the clinical and organizational identity of hospitalists. In addition, an understanding of the market demand for hospitalists' competencies and the roles they play in the hospital may inform any changes in board certification and training for hospitalists.11, 1821
To gain a more complete understanding of a key part of the engine driving the growth of hospitalists, we performed a cross‐sectional survey of California hospital leaders who were involved with the funding or administration of their hospitalist groups. Our survey aimed to understand: (1) the prevalence of hospitalist groups in California hospitals, (2) hospital leaders' rationale for initiating the use of hospitalists, (3) the scope of clinical and nonclinical practice of hospitalists, and 4) hospital leaders' perspective on the need for further training and/or certification.
Materials and Methods
Sites and Subjects
We targeted all nonfederal, nonspecialty, acute care hospitals in California (n = 334) for this survey. We limited our survey to California in order to maximize our local resources and to improve implementation of and response to the survey. Additionally, California's size and diversity gives it disproportionate impact and potential generalizability. At each site, we focused our efforts on identifying and surveying executives or administrative leaders involved in organizational and staff decisions, specifically the decision whether or not to hire and/or fund a hospitalist program and potentially direct its activities (described in more detail below). The University of California, San Francisco, Committee on Human Research approved the research protocol.
We identified hospital leaders at each site by merging information from multiple sources. These included the American Hospital Association database, the California Hospital Association, the Hospital Association of Southern California (HASC), the California Health Care Safety Net Institute, and individual hospital websites.
Survey Development
Our survey was based upon instruments used in previous research examining hospital medicine group organizational structure15, 22 and enhanced with questions developed by the research team (A.D.A., E.E.V., R.M.W.). The survey was pretested in an advisory group of 5 hospital Chief Executive Officers (CEOs), Chief Medical Officers (CMOs), and Vice Presidents for Medical Affairs (VPMAs) from sites across California. Based on their input, we removed, edited, or added questions to our survey. This advisory group also helped the research team design our survey process.
Our final survey defined a hospitalist as a physician who spends all or the majority of his or her clinical, administrative, educational, or research activities in the care of hospitalized patients.4 We collected data in 4 areas: (1) We asked hospital leaders to confirm the presence or absence of at least 1 hospitalist group practicing within the surveyed hospital. We also asked for the year the first hospitalist group began practicing within the specified hospital. (2) We asked hospital leaders to indicate, among a prespecified list of 11 choices, the reason(s) they implemented a hospitalist group at the surveyed hospital. Surveyed categories included: (a) care for uncovered patients (patients without an identified doctor and/or uninsured), (b) improve costs, (c) improve length of stay, (d) improve emergency department throughput, (e) primary care provider demand, (f) improve patient satisfaction, (g) improve emergency room staffing, (h) quality improvement needs, (i) specialist physician demand, (j) overnight coverage, and (k) surgical comanagement. Due to the close relationship between cost and length of stay, we combined these 2 categories into a single category for reporting and analysis. This resulted in 10 final categories. We asked leaders who did not identify a practicing hospitalist group about the likelihood of hospitalists practicing at their hospital within the next 5 years and the reason(s) for future implementation. (3) We asked leaders to describe the services currently provided among a prespecified list of clinical care duties that go beyond the scope of inpatient general internal medicine (eg, surgical comanagement, rapid response team leadership) as well as nonclinical duties (eg, quality improvement activities, systems project implementation). If hospitalists did not currently provide the identified service, we asked leaders to indicate if they would be inclined to involve hospitalists in the specified service in the future. (4) Finally, we asked hospital leaders their opinion regarding the need for further training or certification for hospitalists.
Survey Protocol
We administered surveys between October 2006 and April 2007. We initially emailed the survey. We repeated this process for nonrespondents at intervals of 1 to 3 weeks after the initial emailing. Next, we sent nonrespondents a physical mailing with a reminder letter. Finally, we made phone calls to those who had not responded within 4 weeks of the last mailed letter. We asked survey recipients to respond only if they felt they had an adequate working knowledge of the hospitalist service at their hospital. If they did not feel they could adequately answer all questions, we allowed them to forward the instrument to others with a better working knowledge of the service.
Because we allowed recipients to forward the survey, we occasionally received 2 surveys from 1 site. In this case, we selected the survey according to the following prioritization order: (1) CEOs/COOs, (2) CMOs, (3) VPMAs, and (4) other vice presidents (VPs) or executive/administrative leaders with staff organization knowledge and responsibilities.
Hospital Descriptive Data
We obtained hospital organizational data from the California Office of Statewide Health Planning and Development's (OSHPD) publicly available Case Mix Index Data, hospital Annual Financial Data, aggregated Patient Discharge Data, and Utilization Data from 2006.23 Organizational characteristics included hospital size, location, profit status, payor mix, and diagnosis‐related groupbased case‐mix. Teaching status was determined from the 2005 American Hospital Association database. Membership status in California's voluntary quality reporting initiative, California Hospital Assessment and Reporting Taskforce (CHART), was publicly available at
Statistical Analyses
We performed univariable analyses to characterize survey respondents, followed by bivariable analyses to compare hospital characteristics and patient mix of responding and nonresponding hospitals. We used similar methods to characterize respondent hospitals with and without at least 1 hospitalist group. We compared continuous data with the Students t tests or Mann‐Whitney tests as appropriate and categorical data with chi‐square tests.
We then summarized the number of times a specific rationale was cited by hospital leaders for implementing a hospitalist group. Among hospitals that did not have a hospitalist system in place at the time of the survey, we asked if they were planning on starting one within the next 5 years. For these hospitals, we used content analysis to summarize open‐ended responses in order to understand factors that are currently influencing these hospital leaders to consider implementing a hospitalist group.
Next, we aimed to understand what clinical and nonclinical roles hospitalists were performing in hospitals with established hospitalist programs. Clinical activities were divided into general clinical areas, triage/emergency‐related, or administrative activities. First, we summarized the number and percent of programs performing each clinical and nonclinical activity. This was followed by logistic regression analyses to assess whether the time period that hospitalist groups began practicing or additional hospital characteristics predicted the performance of individual hospitalist activities. To guard against overfitting of models, analyses were limited to rationales that were cited a minimum of 50 times.24 Hospital factors were selected on the basis of face validity and advisory group input and included hospital bed size, ownership status (public vs. private), teaching status, and membership status in CHART. We divided the year of hospitalist program implementation into 3 time periods: (1) before 2002, (2) between 2002 and 2004, and (3) 2005 or later.
Finally, we described the percentage of hospitals that favored having their hospitalist group(s) perform each of the identified clinical or nonclinical activities, if they were not already performing them. We performed analyses with statistical software (Stata Version 9.2, College Station, TX).
Results
Respondent Characteristics
We received 200 survey responses. Of those, we excluded 15 duplicates (eg, a survey from both the CEO and VPMA) and 6 responses identified as coming from hospitalists who did not have a leadership position in the hospital. Thus, the final hospital leader survey response rate was 54% (n = 179). Forty‐six percent of the final responses were from CEOs or COOs; 37% of responses were from CMOs, VPMAs, and medical directors; and the remaining 17% of responses were from other VPs or administrative directors.
Respondent and nonrespondent hospitals were statistically similar in terms of teaching status and participation in CHART. Hospital patient census, intensive care unit census, payer mix, and diagnosis‐related groupbased case‐mix revealed no statistically significant differences between groups (P > 0.05). Respondent hospitals tended to have fewer beds and were more often for‐profit compared to nonrespondents (P = 0.05 and P < 0.01, respectively).
Descriptive Characteristics of Hospitals with Hospitalists
Sixty‐four percent (n = 115) of hospital leaders stated that they utilized hospitalists for at least some patients. Hospitals with hospitalists were statistically more likely (P < 0.05) to be larger, a major teaching hospital, or a member of a voluntary quality reporting initiative (Table 1).
| Variable | Hospitals without Hospitalists (n = 64) [n (%)] | Hospitals with Hospitalists (n = 115) [n (%)] | P Value* |
|---|---|---|---|
| |||
| Hospital size (total number of beds) | |||
| 0‐99 | 33 (51.6) | 18 (15.7) | <0.001 |
| 100‐199 | 19 (29.7) | 32 (27.8) | |
| 200‐299 | 5 (7.8) | 23 (20.0) | |
| 300+ | 7 (10.9) | 42 (36.5) | |
| Hospital control | 0.12 | ||
| City/county | 8 (12.5) | 7 (6.1) | |
| District | 15 (23.4) | 17 (14.8) | |
| For‐profit | 10 (15.6) | 16 (13.9) | |
| Non‐profit | 31 (48.4) | 71 (61.7) | |
| University of California | 0 (0.0) | 4 (3.5) | |
| Teaching hospital | 8 (12.5) | 30 (26.1) | 0.03 |
| Member of voluntary quality reporting initiative | 27 (42.2) | 93 (80.9) | <0.001 |
Among all hospitals with hospitalists, 39% estimated that hospitalists cared for at least one‐half of admitted medical patients, and 7% stated that hospitalists cared for all patients. Twenty‐four percent of respondents were unable to provide a quantitative estimate of the percent of patients cared for by hospitalists. When asked about expectations of growth in the coming year, 57% of respondents with hospitalists expected to see increases in the number of hospitalists at their hospital, and none expected a decrease. Among the 64 respondent hospitals that currently did not have a hospitalist program, 44% (n = 28) of the hospital leaders felt hospitalists would be managing patients in the future. Of those, 93% felt this would occur within the next 2 years.
Reasons for Implementing Hospitalists
Hospital leaders reported that the most important reasons for implementing a hospitalist model included caring for uncovered patients (68%), decreasing hospital costs and length of stay (63%), and improving throughput in the emergency room (62%). We provide additional reasons in Figure 1. In addition, leaders often identified multiple factors in the decision to utilize hospitalists, including demand from primary care doctors, patient satisfaction, and quality improvement. Among the 28 hospitals that currently did not have hospitalists but anticipated that they would soon (data not shown), the need to improve quality was the most commonly cited reason (54% of respondents) for expecting to start a program within 2 years, followed by demand from primary care doctors (46% of respondents).
Clinical Practice of Hospitalists and Expectations for Future Growth
Hospitalists perform a wide array of clinical and nonclinical duties (Figure 2). In addition to general medical care, the most common clinical activities of hospitalists included screening medical admissions from the emergency room for appropriateness of admission and triaging to appropriate level of care (67%), triaging patients transferred from an outside hospital (72%), and comanaging surgical patients (66%). The most common nonclinical activity was participation in quality improvement activities (72%). Multivariable analyses demonstrated that the performance of the most prevalent activities was not usually associated with the year of hospitalist implementation or hospital characteristics. An exception was that newly initiated programs had a statistically significant decreased odds of involvement in clinical guideline development (odds ratio [OR], 0.3; 95% confidence interval [CI], 0.1‐0.9) and a trend toward decreased leadership in quality improvement (OR, 0.3; 95% CI, 0.1‐1.1). Hospitalists at teaching hospitals had increased odds of managing patient transfers (OR, 4.7; 95% CI, 1.0‐21.2), whereas for‐profit hospitals had lower odds of screening patients in the emergency room (OR, 0.1; 95% CI, 0.0‐0.7).
Among those hospitals with hospitalists who were not presently involved in any of the above activities, there was a widespread interest among hospital leaders to have their hospitalist group(s) lead or participate in them (Figure 3). The most commonly cited activities included participation in inpatient clinical guideline development (85%), implementation of system‐wide projects (81%) (eg, computerized physician order entry system), participation on a rapid response team (80%), and caring for patients in an observation unit (80%).
Training and Certification for Hospitalists
About two‐thirds (64%) of hospital leaders with a hospitalist group(s) agreed or strongly agreed that hospitalists should have additional training and/or certification. Seventeen percent were undecided, whereas 11% either disagreed or strongly disagreed, and the remaining 8% did not provide an opinion.
Discussion
Most California hospital leaders reported utilizing hospitalists, and a substantial number of those without a hospitalist service plan to implement one in the next 5 years. Our data suggest that the number of hospitalists and their roles will continue to expand, with quality improvement activities and participation in clinical roles outside of general medical care being key priorities for future growth. Interestingly, much of this growth may not be catalyzed by past drivers (such as need to contain costs or length of stay) but by increasing need to implement quality and safety initiatives, as well as demand from other physicians. As a result, the field of hospital medicine will grow in numbers and breadth of practice. Defining the typical practice of a hospitalist may become more challenging.
Consistent with previous work,11, 16 our data suggest widespread adoption of hospitalists. While our data demonstrates that academic hospitals in California were more likely to have hospitalists, it is also important to note that hospitalist systems were widespread across a wide range of hospital sizes and ownership types. The prevalence appears likely to increase in the future. None of the hospitals surveyed planned to eliminate or reduce the size of their programs. Among hospitals without a hospitalist program, 44% (n = 28) reported they were going to implement a hospitalist group within the next 2 years. Future workforce development must consider this growth in order to increase physician supply to meet the demands of hospitalist growth.
Consistent with prior surveys of hospitalists and the healthcare marketplace,13, 15, 16, 25 our survey of hospital leaders suggests that the care of uncovered patients and the goal of improving hospital efficiency are key reasons for implementing hospitalists. Although these are important, we found that hospital leaders have additional intentions when implementing or expanding hospitalist systems, including improving patient satisfaction and quality. Although quality improvement activities were not among the most common reasons that leaders originally implemented programs, the most established programs had increased odds (relative to the most recently implemented programs) of leading quality improvement and clinical guideline activities. This may reflect a natural progression over time for hospitalist groups to develop from a patient‐focused clinical role to one that incorporates responsibilities that increasingly impact the hospital system and organization. The interest in utilizing hospitalists for leadership in quality improvement was widely expressed among those leaders who had yet to utilize hospitalists. Interestingly, this driver remains even as evidence for whether hospitalist practices produce measurable differences in care outcomes is mixed.26, 27 Nevertheless, hospital leaders are under increasing pressure to improve quality and safety (driven by public reporting and pay‐for‐performance initiatives), and many leaders appear to believe that hospitalists will be a key part of the solution.13, 28
In addition to quality improvement, continued demand for hospitalists may result from growing clinical demands, including clinical support for medical specialists and surgeons. A majority of leaders acknowledged current or future interest in having hospitalists comanage surgical patients, with the hope that such practices will improve surgeons' productivity and clinical outcomes.16, 29, 30 In addition, hospitalists may address potential shortages in specialty areas. For example, having hospitalists participate in critical care may partly ameliorate the impact of a large national shortage of critical care physicians.12, 31 If hospitalists are to assume major roles in the provision of critical care (particularly if not comanaging patients with intensivists), they may require some augmented training in the intensive care unit.
Our results paint a picture of a rapidly expanding field, both in scope and in number. Hospitalists appear to be performing a wide range of clinical, triage, and administrative activities, and there is demand among hospital leadership for hospitalists to take on additional responsibilities. Interestingly, it appears that participation in most clinical and nonclinical activities occur across the spectrum of organizational characteristics, and demand is not limited only to large or academic hospitals. Participation in such a broad array of activities brings into question the need for additional training and certification of hospitalists. While the need for hospitalists to receive additional training has been posited in the past, our data suggest there is a perceived need from the hospital administration as well. This additional training (and subsequent certification) would likely need to encompass many of the practices we have identified as core to hospitalists' practice. In addition to ensuring adequate training, policymakers will need to consider the supply of physicians necessary to meet the present and, likely, future demand for hospitalists. This is especially important in light of recent evidence of continued decreasing interest in general internal medicine, the main pool from which hospitalists are drawn.32 A shortage of internists is likely to influence expansion plans by hospitals in terms of activities in which leaders ask hospitalists to engage, or the number of hospitalists overall.
Our study has several limitations. First, a substantial number of nonrespondents may potentially bias our results. Despite this, we have drawn results across a wide range of hospitals, and the characteristics of responders and nonresponders are very similar. In addition, our study exclusively examines the responses of leaders in California hospitals. Although we sampled a large and heterogeneous group of hospitals, these results may not be entirely generalizable to other regions. As a cross‐sectional survey of hospital executives, responses are subject to leaders' recall. In particular, the reasons for implementation provided by leaders of older programs may potentially reflect contemporary reasons for hospitalist utilization rather than the original reasons. Another limitation of our study is our focus on hospital leaders' reports of prevalence and the clinical/nonclinical activities of hospitalists. Since senior executives often help begin a program but become less involved over time, executives' answers may well underestimate the prevalence of hospitalists and the breadth of their clinical practices, particularly in more mature programs. For instance, hospitalists that are part of an independent practice association (IPA) may provide functions for the IPA group that the hospital itself does not direct or fund. This effect may be more pronounced among the largest hospitals that may be organizationally complex, perhaps making suspect the responses from 7 very large hospitals that claimed not to utilize hospitalists. Finally, we collected information regarding the reasons for hospitalist group implementation and the services they provide by means of a prespecified list of answers. Although a thorough literature review and expert advisory panel guided the development of prespecified lists, they are by no means exhaustive. As a result, our prespecified lists may miss some important reasons for implementation, or services provided by hospitalists, that one could identify using an open‐ended survey. In addition, in the case of multiple responses from hospital leaders, we gave equal weight to responses. This has the effect of overestimating the weight of reasons that were less important, while underestimating the weight of reasons that may have been more important in the decision making process of implementing a hospitalist group.
While nonhospitalist physicians continue to provide a considerable proportion of hospital care for medical patients, hospitalists are assuming a larger role in the care of a growing number of patients in the hospital. The ongoing need to increase care efficiency drives some of this growth, but pressures to improve care quality and demand from other physicians are increasingly important drivers of growth. As the field grows and clinical roles diversify, there must be increased focus placed on the training requirements of hospitalists to reflect the scope of current practice and meet hospital needs to improve quality and efficiency.
Acknowledgements
The authors acknowledge Teresa Chipps, BS, Department of Medicine (General Internal Medicine and Public Health), Center for Health Services Research, Vanderbilt University, Nashville, TN, for her administrative and editorial assistance in the preparation of the manuscript.
- ,,,,,.Implementation of a hospitalist system in a large health maintenance organization: the Kaiser Permanente experience.Ann Intern Med.1999;130:355–359.
- ,,.Primary care family physicians and 2 hospitalist models: comparison of outcomes, processes, and costs.J Fam Pract.2002;51:1021–1027.
- ,.Effects of an HMO hospitalist program on inpatient utilization.Am J Manag Care.2001;7:1051–1057.
- ,.The emerging role of “hospitalists” in the American health care system.N Engl J Med.1996;335:514–517.
- .The hospitalist model: perspectives of the patient, the internist, and internal medicine.Ann Intern Med.1999;130:368–372.
- ,,,.The changing face of managed care.Health Aff.2002;21:11–23.
- .The death of managed care: a regulatory autopsy.J Health Polit Policy Law.2005;30:427–452.
- .The end of managed care.JAMA.2001;285:2622–2628.
- ,,,,,.Trends in market demand for internal medicine 1999 to 2004: an analysis of physician job advertisements.J Gen Intern Med.2006;21:1079–1085.
- ,,,.Growth in the care of older patients by hospitalists in the United States.N Engl J Med.2009;360:1102–1112.
- ,,,.The status of hospital medicine groups in the United States.J Hosp Med.2006;1:75–80.
- .Leapfrog and critical care: evidence‐ and reality‐based intensive care for the 21st century.Am J Med.2004;116:188–193.
- ,,,.Health care market trends and the evolution of hospitalist use and roles.J Gen Intern Med.2005;20:101–107.
- ,,,.Financial pressures spur physician entrepreneurialism.Health Aff.2004;23:70–81.
- ,,,,,.Physician attitudes toward and prevalence of the hospitalist model of care: results of a national survey.Am J Med.2000;109:648–653.
- ,,,.Hospitalists and care transitions: the divorce of inpatient and outpatient care.Health Aff.2008;27:1315–1327.
- Society of Hospital Medicine. 2005‐2006 SHM Survey: State of the Hospital Medicine Movement. Available at: http://dev.hospitalmedicine.org/AM/Template.cfm?Section=Survey2:102–104.
- ,,,.Hospitalists' perceptions of their residency training needs: results of a national survey.Am J Med.2001;111:247–254.
- ,,,,.The spectrum of community‐based hospitalist practice: A call to tailor internal medicine residency training.Arch Intern Med.2007;167:727–728.
- ,,,,.Fulfilling the promise of hospital medicine: tailoring internal medicine training to address hospitalists' needs.J Gen Intern Med.2008;23:1110–1115.
- ,,,.Hospitalists and the practice of inpatient medicine: results of a survey of the national association of inpatient physicians.Ann Intern Med.1999;130:343–349.
- Office of Statewide Health Planning and Development. Healthcare Information Division ‐ Data Products. Available at: http://www.oshpd.ca.gov/HID/DataFlow/HospMain.html. Accessed May2009.
- ,.Relaxing the rule of ten events per variable in logistic and Cox regression.Am J Epidemiol.2007;165:710–718.
- ,,.Hospital‐physician relations: cooperation, competition, or separation?Health Aff.2007;26:w31–w43.
- ,,,,,.Outcomes of care by hospitalists, general internists, and family physicians.N Engl J Med.2007;357:2589–2600.
- ,,, et al.Quality of care for decompensated heart failure: comparable performance between academic hospitalists and non‐hospitalists.J Gen Intern Med.2008;23:1399–1406.
- ,,.The impact of quality‐reporting programs on hospital operations.Health Aff.2006;25:1412–1422.
- ,,, et al.Medical and surgical comanagement after elective hip and knee arthroplasty: a randomized, controlled trial.Ann Intern Med.2004;141:28–38.
- ,,.Associations between the hospitalist model of care and quality‐of‐care‐related outcomes in patients undergoing hip fracture surgery.Mayo Clin Proc.2006;81:28–31.
- ,,, et al.The critical care crisis in the United States: a report from the profession.Chest.2004;125:1514–1517.
- ,,, et al.Factors associated with medical students' career choices regarding internal medicine.JAMA.2008;300:1154–1164.
Copyright © 2009 Society of Hospital Medicine
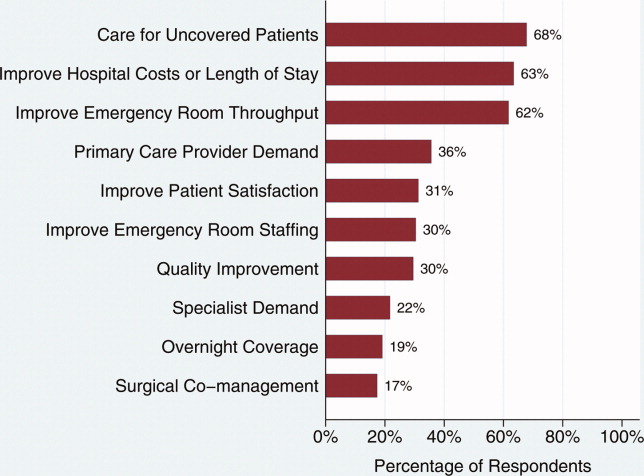
Duty Hours and Resident Inpatient Teaching
Hospital medicine is the fastest growing specialty in the history of medicine, and nearly 20% of hospitalists work in academic settings.1 Academic hospitalists often wear many hats; one of their main responsibilities is to supervise and teach residents and students. Hospitalists have responded to a number of changes to the landscape of medicine over the last 5 years, but none has had a more profound impact on an academic hospitalist's clinical teaching duties than the mandated reduction in duty hours (duty‐hour restrictions [DHR]).
In 2003, the Accreditation Council for Graduate Medical Education (ACGME) limited resident duty hours to 80 per week with no more than 30 consecutive hours,2 as a response to concerns about the impact of long duty hours on resident education, well‐being, and patient safety and pressures from impending legislation.3, 4 Data suggest many positive outcomes of these mandates,510 but one unforeseen consequence may be diminished time residents spend on teaching.1114
Academic hospitalists partner with residents to provide care and contribute to the learning of the medical team. The time spent teaching has many merits for residents, as they are valuable teachers of medical students15 and many find teaching enjoyable.16 Teaching also increases residents' own medical knowledge.17
Previous studies have demonstrated that some residents report teaching less since DHR.11, 13 Furthermore, greater than 75% of faculty educators, specifically those in Internal Medicine where the majority of academic hospitalists practice, perceive that since DHR, residents are teaching less.13 Given these concerns, and the benefits of resident teaching, it is important for academic hospitalists to understand the effects that DHR may have regarding the amount of time residents spend teaching and its consequences, in order to respond to this shift in the educational landscape and ensure trainee education while delivering exemplary patient care.
To better understand the factors related to and impact of resident teaching time since DHR, we performed a cross‐sectional survey of internal medicine residents at the University of California, San Francisco (UCSF). We hypothesize that workload elements of resident life are associated with the amount of time spent teaching. We also posit that the amount of time spent teaching may impact resident well‐being and perceptions of patient care.
Methods
Sites and Subjects
Descriptions of the survey protocol, including development and methods, have been published.11, 18 This study was performed at UCSF. The study was approved by the institutional review board at UCSF, and all 164 residents in internal medicine were eligible to participate. Data were collected beginning 1 month after DHR were implemented in February 2003 and collected for a total of 4 months.
Survey Development
After reviewing the literature and observing the residents over 1 month, the investigators identified domains pertaining to resident workload, quality of life, and patient care practices. An open‐ended question survey was created with questions regarding these domains, and given as a pilot survey to a group of residents ineligible for the study. Based on responses to the open‐ended questions, the investigators then developed a set of closed‐response items to the original questions. To establish content validity, the survey was reviewed by experts in medical education, outcomes research, and psychometrics, after which items were eliminated or reformatted if necessary. As a final check for usability and clarity, the survey was then pretested on non‐internal medicine house‐staff at the medical center and recent graduates of residency programs.
Survey Measures
Demographics
Residents were asked to report their age (30 or >30 years), sex, postgraduate year (PGY), and training program (primary care, categorical, or preliminary).
Teaching Time
Residents were asked, compared to the same (or equivalent) inpatient rotation BEFORE February 2003, how much time did you spend teaching during your most recent inpatient rotation? Answers rated on a 5‐point scale, 1 being much less, and 5 being much more. Responses were dichotomized into less or same or more as described in the Results section.
Hours Worked
Residents were asked, During your most recent inpatient rotation, how many hours did you work in 1 average week? Possible answers: 50‐59, 60‐69, 70‐79, 80‐89, 90‐99, and 100. Responses were dichotomized into <80 or 80.
Time Spent on Nonphysician Administrative Tasks
Residents were asked to report, What percent of your time is spent doing tasks that could be completed by a non‐MD? Answers ranging between 0 and 100% were filled into a blank space by the resident.
Emotional Exhaustion
A single score defined as being emotionally overextended and exhausted by work. Constructed as the mean of two highly‐correlated item responses (Cronbach's alpha = 0.84): During your most recent workweek, how often did you feel overwhelmed at work? and During your most recent workweek, how often did you feel worn out? Responses ranged from 1 (never) to 5 (very often).
Satisfaction with Patient Care
During your most recent inpatient rotation workweek, how satisfied were you with the quality of patient care you provided? Rated on a 10‐point scale with 1 being completely unsatisfied and 10 being completely satisfied.
Statistical Analyses
Univariate statistics were used first to characterize the distribution and frequency of the residents' responses. Bivariate associations among variables were assessed with correlation analyses and t‐tests.
Three regression models were constructed. First, a multivariate logistic regression model identified factors independently associated with self‐reported decreased teaching time. Variables were selected for the model based on prior hypotheses regarding factors related to decreased teaching time, observed relationships among variables, or to retain face validity of the model: age (30 versus >30 years), sex, PGY (PGY1 versus PGY2, PGY3), program (primary care versus categorical), hours worked/week, and percentage of time spent on administrative tasks. Next, a linear regression model examined the relationship between teaching time and emotional exhaustion, controlling for age, sex, PGY, program, hours worked, and time spent on administrative tasks. Finally, a linear regression model determined which of the factors in the second model, plus emotional exhaustion, were independently associated with satisfaction with patient care. All variables were retained in each model.
Results
The Residents
Of 164 eligible residents, 125 (76%) returned the survey. Sex, PGY, and program were similar between respondents and nonrespondents (P > 0.2, P > 0.45, and P > 0.6, respectively). Respondents were equally distributed among year of training, with 36.6% PGY‐1, 35.8% PGY‐2, and 27.6% PGY‐3. Most respondents were female (60%), younger than age 30 years (70%), and enrolled in the categorical residency program (62%). All (100%) reported being aware of the system changes intended to reduce hours to <80 hours/week, and 35% reported working >80 hours/week after DHR. All PGY‐1s had completed inpatient months prior to being surveyed.
Factors Associated With Spending Less Time Teaching
Of the 126 respondents, 107 completed the question regarding time teaching; 8 don't know responses were coded as missing, yielding an analytic n of 99 (60%). Twenty‐four (24.2%) residents reported spending less (n = 21) or much less (n = 3) time teaching after DHR began. Because only three individuals reported much less teaching time after DHR, the group was not large enough to yield meaningful or stable analytic results, so the groups were combined. Bivariate comparisons between those who reported less teaching compared to those who reported the same or more are shown in Table 1.
| Characteristic | Those Who Teach Same or More (n = 75) | Those Who Teach Less or Much Less (n = 24) | P Value* |
|---|---|---|---|
| |||
| PGY, n (%) | 0.0013 | ||
| PGY‐1 | 41 (93.2) | 3 (6.8) | |
| PGY‐2 | 23 (63.9) | 13 (36.1) | |
| PGY‐3 | 11 (57.9) | 8 (42.1) | |
| Training program, primary care, n (%) | 29 (38.7) | 6 (25.0) | 0.33 |
| Sex, female, n (%) | 43 (57.3) | 11 (45.8) | 0.35 |
| Age 30 years, n (%) | 55 (75.3) | 16 (66.7) | 0.43 |
| Number of hours worked <80, n (%) | 43 (58.1) | 22 (91.7) | 0.002 |
In multivariate models, working <80 hours/week (odds ratio [OR], 5.99; 95% confidence interval [CI], 1.11‐32.48]), being a PGY‐2 (OR, 7.14; 95% CI, 1.56‐32.79]) or PGY‐3 (OR, 8.23; 95% CI, 1.44‐47.09), and reporting more time on administrative tasks (OR, 1.03; 95% CI, 1.00‐1.06) were associated with reports of spending less time teaching (Table 2).
| Characteristic | OR (CI) |
|---|---|
| |
| Number of hours worked <80 | 5.99 (1.11‐32.48) |
| Age >30 years | 0.91 (0.28‐2.45) |
| Female | 0.83 (0.28‐2.45) |
| PGY‐2 | 7.14 (1.56‐32.79) |
| PGY‐3 | 8.23 (1.44‐47.09) |
| Primary care program | 0.75 (0.22‐2.51) |
| Time spent on nonphysician administrative tasks | 1.03 (1.00‐1.06) |
Impacts of Spending Less Time Teaching
In bivariate comparisons, residents who reported reduced teaching time were less emotionally exhausted (P = 0.006) and more satisfied with the patient care they provided (P = 0.003) (Table 3). In the multivariate analysis, emotional exhaustion was significantly associated with satisfaction with patient care ( = 0.52; P = 0.01), but spending less time teaching was not ( = 0.32; P = 0.46). These analyses reveal that while there was a direct relationship between emotional exhaustion and satisfaction with patient care, the relationship between teaching time and satisfaction with patient care was mediated through emotional exhaustion.
| Time Spent Teaching | P Value | ||
|---|---|---|---|
| Less or Much Less [Mean (SD)] | Same or More [Mean (SD)] | ||
| |||
| Frequency of emotional exhaustion* | 2.6 (0.8) | 3.2 (0.9) | 0.006 |
| Satisfaction with patient care | 8.1 (1.2) | 7.1 (1.8) | 0.003 |
Discussion
In this cross‐sectional survey of internal medicine residents, we found that roughly 25% of residents report spending less time teaching since DHR. Spending less time teaching was associated with working <80 hours/week, being PGY‐2 or PGY‐3 residents, and spending more time on administrative tasks. Residents' reports of spending less time teaching were in turn associated with less emotional exhaustion and more satisfaction with the quality of patient care they provided.
As hospitalists have been shown to be more effective, and possibly better, teachers than nonhospitalists,19 and are increasingly responsible for teaching duties on academic medical services,1 our findings of some residents spending less time teaching since DHR may necessitate changes in hospitalist teaching roles to adapt to this previously unrecognized shift. Although the majority of the residents in our cohort did not experience diminished teaching time, the educational impact of diminished teaching time for the quarter of our cohort that taught less frequently post‐DHR is noteworthy, as these changes affect over 22,000 internal medicine residents. Our findings enhance previous work suggesting that DHR may have some negative effects on resident education.68, 1114, 20 We also found that those who spend less time teaching are more likely to be senior residents, the main teachers of medical students,21 and therefore a reduction in time spent teaching may adversely impact medical students, as previously described.22 Academic hospitalists, in order to maintain and ensure high levels of education and educational satisfaction in the post‐DHR era will likely benefit from recognizing and responding to this change.
Our study also found that spending less time teaching was associated with fewer reports of emotional exhaustion and perceptions of higher quality patient care. Though residents enjoy teaching and would prefer to spend more time teaching if service responsibilities were fewer and if time allowed,16 it is possible that when the total amount of time to accomplish tasks in a week or day are limited, spending time teaching may lead to increased stress and pressure, overwhelming residents and leading to increased emotional exhaustion. Less emotional exhaustion and higher perceptions of patient care are positive outcomes that are, in fact, aligned with the ACGME DHR goals24 and are of prime importance to academic hospitalists as educators, role‐models, and care providers.
Balancing the challenges of a reduction of time spent teaching and the possible benefits of the reduction will necessitate both individual and system‐wide responses. Hospitalists are uniquely poised to develop these responses, which will likely have widespread impacts not only in education but also in patient care and satisfaction with the inpatient experience. Some of these responses may include teaching innovations, such as honing skills for brief teaching, incorporating focused, patient‐driven teaching and emphasizing teachable moments,2325 or workflow innovations, including decreased administrative tasks for residents or changes to the workday schedule to enhance protected teaching time. Hospitalists may also need to increase their time contribution to teaching the medical team or structure more planned didactic sessions for residents and students to ensure that educational sessions are occurring.
Many new hospitalists were trained during duty hour limitations, but the majority were not.1 The landscape of teaching on the medical wards since DHR is dramatically different, speckled with the discontinuities of multiple cross‐coverage residents.26 Residents may have unconsciously acclimated to the system change, and our findings, which give a time‐specific glimpse of the changes that took place with DHR, may inform some of the reasons behind the educational concerns of late.
Our study has several limitations. As a cross‐sectional study, we describe associations and cannot discern causal pathways, but we believe that these associations themselves enhance our understanding of the consequences of DHR. We relied upon self‐reports of teaching time, which are subject to bias. These self‐reports, however, give insight into the resident's perspective of their experience, which is, in and of itself, noteworthy. This study is also subject to recall bias, and we attempted to minimize this by administering the survey just after DHR was implemented and by carefully framing the comparisons. Findings may be sensing secular events such as the challenges of a large system change or a difficult ward month. That said, our findings are consistent with other current survey studies of resident teaching time,1114 thus validating many of the conclusions from our collected data. As the survey was given shortly after DHR, it may not have accounted for initial obstacles of the new system; however, the survey was given over 4 months following DHR implementation at our institution, which we believe allowed the residency program time to adjust to the new organizational system while allowing for real‐time feedback. Our study was conducted at a single site; however, because the medical system studied is comprised of three hospitals, each of which used a variety of dayfloat and nightfloat interventions similar to systems at other institutions, we believe the variability within our system increases the generalizability of this study to other institutions. Finally, these data were collected in 2003, and since that time, programs have likely made significant adjustments in their rotation schedules and team structure and may look different now than previously. We believe that the timing of this study adequately characterizes the potential loss of teaching time pre‐DHR and post‐DHR in a way that current data cannot, due to resident acclimatization to culture change, and therefore may better inform hospitalists regarding changes that may be implicit as opposed to explicit in resident teaching.
In conclusion, DHR has resulted in profound changes in teaching hospitals. Since education and patient care are central to the mission of academic hospitalists, they need to be aware of the potential for diminished teaching time by some of their residents, the factors that effect that change, and its impact on patient care. Hospitalists can use this information to create new systems of care delivery and education to optimize the resident and patient experience. As the duty hour issue has come again to the forefront, with the new Institute of Medicine Committee on Optimizing Graduated Medical Trainee (Resident) Hours and Work Schedules to Improve Patient Safety recommendations policies regarding duty hours,27 it is keenly important that hospitalists understand the potentially unforeseen consequences of DHR on important aspects of resident work such as teaching.
- Society of Hospital Medicine (SHM). 2008. 2007‐2008 SHM Bi‐Annual Survey: The Authoritative Source on the State of the Hospital Medicine Movement. Philadelphia, PA: Society of Hospital Medicine.
- Accreditation Council for Graduate Medical Education. Resident Duty Hours Common Program Requirements. Available at: http://www. acgme.org/acWebsite/dutyHours/dh_dutyHoursCommonPR.pdf). Accessed December2008.
- , , ;ACGME Work Group on Resident Duty Hours.Accreditation Council for Graduate Medical Education. New requirements for resident duty hours.JAMA.2002;288(9):1112–1114.
- , , , .The impact of duty hours on resident self reports of errors.J Gen Intern Med.2007;22(2):205–209.
- , , , , .The effects of work‐hour limitations on resident well‐being, patient care, and education in an internal medicine residency program.Arch Intern Med.2005;165(22):2601–2606.
- , , , .Burnout and internal medicine resident work‐hour restrictions.Arch Intern Med.2005;165(22):2595–2600.
- , , , .Resident perceptions of the impact of work hour limitations.J Gen Intern Med.2007;22(7):969–975.
- , , , , .Implementing duty hour restrictions without diminishing patient care or education.Acad Med.2006;81(1):68–75.
- , , , .Changes in outcomes for internal medicine inpatients after work‐hour regulations.Ann Intern Med.2007;147:97–103.
- , .Changes in hospital mortality associated with residency work hour regulations.Ann Intern Med.2007;147:73–80.
- , , , , .Impact of reduced duty hours on residents' educational satisfaction at the University of California, San Francisco.Acad Med.2006;81(1):76–81.
- , , , , , .The impact of resident duty hours reform on the internal medicine core clerkship: results from the clerkship directors in internal medicine survey.Acad Med.2006;81(12):1038–1044.
- , , , , , .Too little time to teach? Medical student education and work‐hour restriction.Mil Med.2007;172(10):1053–1057.
- , , .Impact of duty hour limitations on resident and student education in obstetrics and gynecology.J Reprod Med.2007;52(5):345–348.
- , .Medical students' perceptions of themselves and residents as teachers.Med Teach.1992;14:133–138.
- , , .Teaching in the clinical setting: factors influencing residents' perceptions, confidence and behavior.J Med Educ.1984;18:360–365.
- , , .Residents' perceptions of their role as teachers.J Med Educ.1988;63:900–905.
- , , , .The impact of duty hours on resident self reports of errors.J Gen Intern Med.2007;22(2):205–209.
- , , , , .Effects of hospitalist attending physicians on trainee satisfaction with teaching and with internal medicine rotations.Arch Intern Med.2004;164(17):1866–1871.
- , , .Resident job satisfaction: one year of duty hours.Am J Obstet Gynecol.2005;193(5):1823–1826.
- .House staff attitudes toward teaching.J Med Educ.1970;45(3):156–159.
- , , , .Medical students' perceptions of resident teaching: have duty hours regulations had an impact?Ann Surg.2005;242(4):548–553.
- , .Teaching internal medicine residents in the new era.J Gen Intern Med.2006;21:447–452.
- , , , .A five‐step “microskills” model of clinical teaching.J Am Board Fam Pract.1992;5(4):419–424.
- , , , , .Strategies for efficient and effective teaching in the ambulatory care setting.Acad Med.1997;72(4):277–280.
- , , , , .Managing discontinuity in academic medical centers: strategies for a safe and effective resident sign‐out.J Hosp Med.2006;1(4):257–266.
- Resident Duty Hours: Enhancing Sleep, Supervision, and Safety. Ulmer C, Wolman DM, Johns MME, eds.Committee on Optimizing Graduate Medical Trainee (Resident) Hours and Work Schedule to Improve Patient Safety, Institutes of Medicine.Washington, D.C.The National Academics Press,2008.
Hospital medicine is the fastest growing specialty in the history of medicine, and nearly 20% of hospitalists work in academic settings.1 Academic hospitalists often wear many hats; one of their main responsibilities is to supervise and teach residents and students. Hospitalists have responded to a number of changes to the landscape of medicine over the last 5 years, but none has had a more profound impact on an academic hospitalist's clinical teaching duties than the mandated reduction in duty hours (duty‐hour restrictions [DHR]).
In 2003, the Accreditation Council for Graduate Medical Education (ACGME) limited resident duty hours to 80 per week with no more than 30 consecutive hours,2 as a response to concerns about the impact of long duty hours on resident education, well‐being, and patient safety and pressures from impending legislation.3, 4 Data suggest many positive outcomes of these mandates,510 but one unforeseen consequence may be diminished time residents spend on teaching.1114
Academic hospitalists partner with residents to provide care and contribute to the learning of the medical team. The time spent teaching has many merits for residents, as they are valuable teachers of medical students15 and many find teaching enjoyable.16 Teaching also increases residents' own medical knowledge.17
Previous studies have demonstrated that some residents report teaching less since DHR.11, 13 Furthermore, greater than 75% of faculty educators, specifically those in Internal Medicine where the majority of academic hospitalists practice, perceive that since DHR, residents are teaching less.13 Given these concerns, and the benefits of resident teaching, it is important for academic hospitalists to understand the effects that DHR may have regarding the amount of time residents spend teaching and its consequences, in order to respond to this shift in the educational landscape and ensure trainee education while delivering exemplary patient care.
To better understand the factors related to and impact of resident teaching time since DHR, we performed a cross‐sectional survey of internal medicine residents at the University of California, San Francisco (UCSF). We hypothesize that workload elements of resident life are associated with the amount of time spent teaching. We also posit that the amount of time spent teaching may impact resident well‐being and perceptions of patient care.
Methods
Sites and Subjects
Descriptions of the survey protocol, including development and methods, have been published.11, 18 This study was performed at UCSF. The study was approved by the institutional review board at UCSF, and all 164 residents in internal medicine were eligible to participate. Data were collected beginning 1 month after DHR were implemented in February 2003 and collected for a total of 4 months.
Survey Development
After reviewing the literature and observing the residents over 1 month, the investigators identified domains pertaining to resident workload, quality of life, and patient care practices. An open‐ended question survey was created with questions regarding these domains, and given as a pilot survey to a group of residents ineligible for the study. Based on responses to the open‐ended questions, the investigators then developed a set of closed‐response items to the original questions. To establish content validity, the survey was reviewed by experts in medical education, outcomes research, and psychometrics, after which items were eliminated or reformatted if necessary. As a final check for usability and clarity, the survey was then pretested on non‐internal medicine house‐staff at the medical center and recent graduates of residency programs.
Survey Measures
Demographics
Residents were asked to report their age (30 or >30 years), sex, postgraduate year (PGY), and training program (primary care, categorical, or preliminary).
Teaching Time
Residents were asked, compared to the same (or equivalent) inpatient rotation BEFORE February 2003, how much time did you spend teaching during your most recent inpatient rotation? Answers rated on a 5‐point scale, 1 being much less, and 5 being much more. Responses were dichotomized into less or same or more as described in the Results section.
Hours Worked
Residents were asked, During your most recent inpatient rotation, how many hours did you work in 1 average week? Possible answers: 50‐59, 60‐69, 70‐79, 80‐89, 90‐99, and 100. Responses were dichotomized into <80 or 80.
Time Spent on Nonphysician Administrative Tasks
Residents were asked to report, What percent of your time is spent doing tasks that could be completed by a non‐MD? Answers ranging between 0 and 100% were filled into a blank space by the resident.
Emotional Exhaustion
A single score defined as being emotionally overextended and exhausted by work. Constructed as the mean of two highly‐correlated item responses (Cronbach's alpha = 0.84): During your most recent workweek, how often did you feel overwhelmed at work? and During your most recent workweek, how often did you feel worn out? Responses ranged from 1 (never) to 5 (very often).
Satisfaction with Patient Care
During your most recent inpatient rotation workweek, how satisfied were you with the quality of patient care you provided? Rated on a 10‐point scale with 1 being completely unsatisfied and 10 being completely satisfied.
Statistical Analyses
Univariate statistics were used first to characterize the distribution and frequency of the residents' responses. Bivariate associations among variables were assessed with correlation analyses and t‐tests.
Three regression models were constructed. First, a multivariate logistic regression model identified factors independently associated with self‐reported decreased teaching time. Variables were selected for the model based on prior hypotheses regarding factors related to decreased teaching time, observed relationships among variables, or to retain face validity of the model: age (30 versus >30 years), sex, PGY (PGY1 versus PGY2, PGY3), program (primary care versus categorical), hours worked/week, and percentage of time spent on administrative tasks. Next, a linear regression model examined the relationship between teaching time and emotional exhaustion, controlling for age, sex, PGY, program, hours worked, and time spent on administrative tasks. Finally, a linear regression model determined which of the factors in the second model, plus emotional exhaustion, were independently associated with satisfaction with patient care. All variables were retained in each model.
Results
The Residents
Of 164 eligible residents, 125 (76%) returned the survey. Sex, PGY, and program were similar between respondents and nonrespondents (P > 0.2, P > 0.45, and P > 0.6, respectively). Respondents were equally distributed among year of training, with 36.6% PGY‐1, 35.8% PGY‐2, and 27.6% PGY‐3. Most respondents were female (60%), younger than age 30 years (70%), and enrolled in the categorical residency program (62%). All (100%) reported being aware of the system changes intended to reduce hours to <80 hours/week, and 35% reported working >80 hours/week after DHR. All PGY‐1s had completed inpatient months prior to being surveyed.
Factors Associated With Spending Less Time Teaching
Of the 126 respondents, 107 completed the question regarding time teaching; 8 don't know responses were coded as missing, yielding an analytic n of 99 (60%). Twenty‐four (24.2%) residents reported spending less (n = 21) or much less (n = 3) time teaching after DHR began. Because only three individuals reported much less teaching time after DHR, the group was not large enough to yield meaningful or stable analytic results, so the groups were combined. Bivariate comparisons between those who reported less teaching compared to those who reported the same or more are shown in Table 1.
| Characteristic | Those Who Teach Same or More (n = 75) | Those Who Teach Less or Much Less (n = 24) | P Value* |
|---|---|---|---|
| |||
| PGY, n (%) | 0.0013 | ||
| PGY‐1 | 41 (93.2) | 3 (6.8) | |
| PGY‐2 | 23 (63.9) | 13 (36.1) | |
| PGY‐3 | 11 (57.9) | 8 (42.1) | |
| Training program, primary care, n (%) | 29 (38.7) | 6 (25.0) | 0.33 |
| Sex, female, n (%) | 43 (57.3) | 11 (45.8) | 0.35 |
| Age 30 years, n (%) | 55 (75.3) | 16 (66.7) | 0.43 |
| Number of hours worked <80, n (%) | 43 (58.1) | 22 (91.7) | 0.002 |
In multivariate models, working <80 hours/week (odds ratio [OR], 5.99; 95% confidence interval [CI], 1.11‐32.48]), being a PGY‐2 (OR, 7.14; 95% CI, 1.56‐32.79]) or PGY‐3 (OR, 8.23; 95% CI, 1.44‐47.09), and reporting more time on administrative tasks (OR, 1.03; 95% CI, 1.00‐1.06) were associated with reports of spending less time teaching (Table 2).
| Characteristic | OR (CI) |
|---|---|
| |
| Number of hours worked <80 | 5.99 (1.11‐32.48) |
| Age >30 years | 0.91 (0.28‐2.45) |
| Female | 0.83 (0.28‐2.45) |
| PGY‐2 | 7.14 (1.56‐32.79) |
| PGY‐3 | 8.23 (1.44‐47.09) |
| Primary care program | 0.75 (0.22‐2.51) |
| Time spent on nonphysician administrative tasks | 1.03 (1.00‐1.06) |
Impacts of Spending Less Time Teaching
In bivariate comparisons, residents who reported reduced teaching time were less emotionally exhausted (P = 0.006) and more satisfied with the patient care they provided (P = 0.003) (Table 3). In the multivariate analysis, emotional exhaustion was significantly associated with satisfaction with patient care ( = 0.52; P = 0.01), but spending less time teaching was not ( = 0.32; P = 0.46). These analyses reveal that while there was a direct relationship between emotional exhaustion and satisfaction with patient care, the relationship between teaching time and satisfaction with patient care was mediated through emotional exhaustion.
| Time Spent Teaching | P Value | ||
|---|---|---|---|
| Less or Much Less [Mean (SD)] | Same or More [Mean (SD)] | ||
| |||
| Frequency of emotional exhaustion* | 2.6 (0.8) | 3.2 (0.9) | 0.006 |
| Satisfaction with patient care | 8.1 (1.2) | 7.1 (1.8) | 0.003 |
Discussion
In this cross‐sectional survey of internal medicine residents, we found that roughly 25% of residents report spending less time teaching since DHR. Spending less time teaching was associated with working <80 hours/week, being PGY‐2 or PGY‐3 residents, and spending more time on administrative tasks. Residents' reports of spending less time teaching were in turn associated with less emotional exhaustion and more satisfaction with the quality of patient care they provided.
As hospitalists have been shown to be more effective, and possibly better, teachers than nonhospitalists,19 and are increasingly responsible for teaching duties on academic medical services,1 our findings of some residents spending less time teaching since DHR may necessitate changes in hospitalist teaching roles to adapt to this previously unrecognized shift. Although the majority of the residents in our cohort did not experience diminished teaching time, the educational impact of diminished teaching time for the quarter of our cohort that taught less frequently post‐DHR is noteworthy, as these changes affect over 22,000 internal medicine residents. Our findings enhance previous work suggesting that DHR may have some negative effects on resident education.68, 1114, 20 We also found that those who spend less time teaching are more likely to be senior residents, the main teachers of medical students,21 and therefore a reduction in time spent teaching may adversely impact medical students, as previously described.22 Academic hospitalists, in order to maintain and ensure high levels of education and educational satisfaction in the post‐DHR era will likely benefit from recognizing and responding to this change.
Our study also found that spending less time teaching was associated with fewer reports of emotional exhaustion and perceptions of higher quality patient care. Though residents enjoy teaching and would prefer to spend more time teaching if service responsibilities were fewer and if time allowed,16 it is possible that when the total amount of time to accomplish tasks in a week or day are limited, spending time teaching may lead to increased stress and pressure, overwhelming residents and leading to increased emotional exhaustion. Less emotional exhaustion and higher perceptions of patient care are positive outcomes that are, in fact, aligned with the ACGME DHR goals24 and are of prime importance to academic hospitalists as educators, role‐models, and care providers.
Balancing the challenges of a reduction of time spent teaching and the possible benefits of the reduction will necessitate both individual and system‐wide responses. Hospitalists are uniquely poised to develop these responses, which will likely have widespread impacts not only in education but also in patient care and satisfaction with the inpatient experience. Some of these responses may include teaching innovations, such as honing skills for brief teaching, incorporating focused, patient‐driven teaching and emphasizing teachable moments,2325 or workflow innovations, including decreased administrative tasks for residents or changes to the workday schedule to enhance protected teaching time. Hospitalists may also need to increase their time contribution to teaching the medical team or structure more planned didactic sessions for residents and students to ensure that educational sessions are occurring.
Many new hospitalists were trained during duty hour limitations, but the majority were not.1 The landscape of teaching on the medical wards since DHR is dramatically different, speckled with the discontinuities of multiple cross‐coverage residents.26 Residents may have unconsciously acclimated to the system change, and our findings, which give a time‐specific glimpse of the changes that took place with DHR, may inform some of the reasons behind the educational concerns of late.
Our study has several limitations. As a cross‐sectional study, we describe associations and cannot discern causal pathways, but we believe that these associations themselves enhance our understanding of the consequences of DHR. We relied upon self‐reports of teaching time, which are subject to bias. These self‐reports, however, give insight into the resident's perspective of their experience, which is, in and of itself, noteworthy. This study is also subject to recall bias, and we attempted to minimize this by administering the survey just after DHR was implemented and by carefully framing the comparisons. Findings may be sensing secular events such as the challenges of a large system change or a difficult ward month. That said, our findings are consistent with other current survey studies of resident teaching time,1114 thus validating many of the conclusions from our collected data. As the survey was given shortly after DHR, it may not have accounted for initial obstacles of the new system; however, the survey was given over 4 months following DHR implementation at our institution, which we believe allowed the residency program time to adjust to the new organizational system while allowing for real‐time feedback. Our study was conducted at a single site; however, because the medical system studied is comprised of three hospitals, each of which used a variety of dayfloat and nightfloat interventions similar to systems at other institutions, we believe the variability within our system increases the generalizability of this study to other institutions. Finally, these data were collected in 2003, and since that time, programs have likely made significant adjustments in their rotation schedules and team structure and may look different now than previously. We believe that the timing of this study adequately characterizes the potential loss of teaching time pre‐DHR and post‐DHR in a way that current data cannot, due to resident acclimatization to culture change, and therefore may better inform hospitalists regarding changes that may be implicit as opposed to explicit in resident teaching.
In conclusion, DHR has resulted in profound changes in teaching hospitals. Since education and patient care are central to the mission of academic hospitalists, they need to be aware of the potential for diminished teaching time by some of their residents, the factors that effect that change, and its impact on patient care. Hospitalists can use this information to create new systems of care delivery and education to optimize the resident and patient experience. As the duty hour issue has come again to the forefront, with the new Institute of Medicine Committee on Optimizing Graduated Medical Trainee (Resident) Hours and Work Schedules to Improve Patient Safety recommendations policies regarding duty hours,27 it is keenly important that hospitalists understand the potentially unforeseen consequences of DHR on important aspects of resident work such as teaching.
- Society of Hospital Medicine (SHM). 2008. 2007‐2008 SHM Bi‐Annual Survey: The Authoritative Source on the State of the Hospital Medicine Movement. Philadelphia, PA: Society of Hospital Medicine.
- Accreditation Council for Graduate Medical Education. Resident Duty Hours Common Program Requirements. Available at: http://www. acgme.org/acWebsite/dutyHours/dh_dutyHoursCommonPR.pdf). Accessed December2008.
- , , ;ACGME Work Group on Resident Duty Hours.Accreditation Council for Graduate Medical Education. New requirements for resident duty hours.JAMA.2002;288(9):1112–1114.
- , , , .The impact of duty hours on resident self reports of errors.J Gen Intern Med.2007;22(2):205–209.
- , , , , .The effects of work‐hour limitations on resident well‐being, patient care, and education in an internal medicine residency program.Arch Intern Med.2005;165(22):2601–2606.
- , , , .Burnout and internal medicine resident work‐hour restrictions.Arch Intern Med.2005;165(22):2595–2600.
- , , , .Resident perceptions of the impact of work hour limitations.J Gen Intern Med.2007;22(7):969–975.
- , , , , .Implementing duty hour restrictions without diminishing patient care or education.Acad Med.2006;81(1):68–75.
- , , , .Changes in outcomes for internal medicine inpatients after work‐hour regulations.Ann Intern Med.2007;147:97–103.
- , .Changes in hospital mortality associated with residency work hour regulations.Ann Intern Med.2007;147:73–80.
- , , , , .Impact of reduced duty hours on residents' educational satisfaction at the University of California, San Francisco.Acad Med.2006;81(1):76–81.
- , , , , , .The impact of resident duty hours reform on the internal medicine core clerkship: results from the clerkship directors in internal medicine survey.Acad Med.2006;81(12):1038–1044.
- , , , , , .Too little time to teach? Medical student education and work‐hour restriction.Mil Med.2007;172(10):1053–1057.
- , , .Impact of duty hour limitations on resident and student education in obstetrics and gynecology.J Reprod Med.2007;52(5):345–348.
- , .Medical students' perceptions of themselves and residents as teachers.Med Teach.1992;14:133–138.
- , , .Teaching in the clinical setting: factors influencing residents' perceptions, confidence and behavior.J Med Educ.1984;18:360–365.
- , , .Residents' perceptions of their role as teachers.J Med Educ.1988;63:900–905.
- , , , .The impact of duty hours on resident self reports of errors.J Gen Intern Med.2007;22(2):205–209.
- , , , , .Effects of hospitalist attending physicians on trainee satisfaction with teaching and with internal medicine rotations.Arch Intern Med.2004;164(17):1866–1871.
- , , .Resident job satisfaction: one year of duty hours.Am J Obstet Gynecol.2005;193(5):1823–1826.
- .House staff attitudes toward teaching.J Med Educ.1970;45(3):156–159.
- , , , .Medical students' perceptions of resident teaching: have duty hours regulations had an impact?Ann Surg.2005;242(4):548–553.
- , .Teaching internal medicine residents in the new era.J Gen Intern Med.2006;21:447–452.
- , , , .A five‐step “microskills” model of clinical teaching.J Am Board Fam Pract.1992;5(4):419–424.
- , , , , .Strategies for efficient and effective teaching in the ambulatory care setting.Acad Med.1997;72(4):277–280.
- , , , , .Managing discontinuity in academic medical centers: strategies for a safe and effective resident sign‐out.J Hosp Med.2006;1(4):257–266.
- Resident Duty Hours: Enhancing Sleep, Supervision, and Safety. Ulmer C, Wolman DM, Johns MME, eds.Committee on Optimizing Graduate Medical Trainee (Resident) Hours and Work Schedule to Improve Patient Safety, Institutes of Medicine.Washington, D.C.The National Academics Press,2008.
Copyright © 2009 Society of Hospital Medicine