User login
An uptrend in financial support
Since the inception of hospital medicine more than 2 decades ago, the total number of hospitalists has rapidly increased to more than 60,000. The Society of Hospital Medicine’s State of Hospital Medicine Report (SoHM), published biennially, captures new changes in our growing field and sheds light on current practice trends.

Among its findings, the 2018 SoHM Report reassuringly reveals that financial support from hospitals to hospital medicine groups (HMGs) continues to climb, even in the setting of rising health care costs and ongoing budget pressure.
The median amount of financial support per full-time equivalent (FTE) physician for HMGs serving adults was $176,658, according to the 2018 SoHM Report, which is up 12% from the 2016 median of $157,535. While there is no correlation between group sizes and the amount of financial support per FTE physician, there are significant differences across regions, with HMGs in the Midwest garnering the highest median support, at $193,121 per FTE physician.
The report also reveals big differences by employment model. For example, private multispecialty and primary care medical groups receive much less financial support ($58,396 per FTE physician) than HMGs employed by hospitals. This likely signifies that their main source of revenue is from professional service fees. Regardless of the types of employment models, past surveys have reported more than 95% of HMGs receive support from their hospitals to help cover expenses.
The median amount of financial support per FTE provider (including nurse practitioners, physician assistants, and locum tenens) was $134,300, which represents a 3.3% decrease, compared with the 2016 SoHM Report. For the first time, the 2018 SoHM also collected data on financial support per “work relative value unit” (wRVU) in addition to support per FTE physician and support per FTE provider. HMGs and their hospitals can use support per wRVU data to evaluate the support per unit of work, regardless of who (whether it is a physician, an advanced practice provider, and/or others) performed that work.
The median amount of financial support per wRVU for HMGs serving adults in 2018 was $41.92, with academic HMGs reporting a higher amount ($45.81) than nonacademic HMGs ($41.28). It will be interesting to track these numbers over time.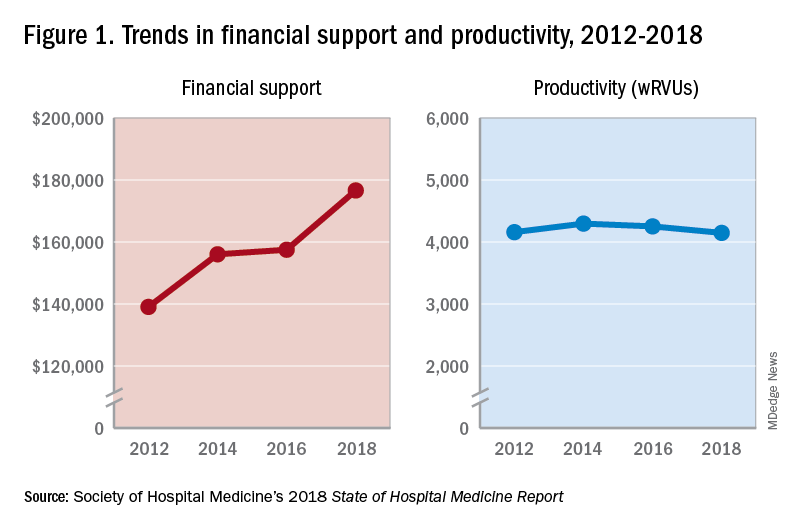
One of the most intriguing findings from the SHM’s 2018 SoHM Report is that financial support has risen despite relatively flat professional fee productivity (see Figure 1). Productivity, calculated as work relative value units (wRVUs) per physician declined slightly from 4,252 in 2016 to 4,147 in 2018.
There may be a few reasons why wRVUs per physician has remained relatively unchanged over the years. Many hospitals emphasize quality of care above provider productivity. The volume-to-value shift in theory serves as a means to reduce hospital-associated complications, length of stay, and readmission rates, thereby avoiding penalties and saving the overall costs for the hospitals in the long run.
Hospitalists involved in quality improvement projects and other essential nonclinical work perform tasks that are rarely captured in the wRVU metric. Improving patient experience, one of the Triple Aim components, necessitates extra time and effort, which also are nonbillable. In addition, increasing productivity can be challenging, a double-edged sword that may further escalate burnout and turnover rates. The static productivity may portend that it has leveled off or hit the ceiling in spite of ongoing efforts to improve efficacy.
In my view, the decision to invest in hospitalists for their contributions and dedications should not be determined based on a single metric such as wRVUs per physician. Hospitalist work on quality improvements; patient safety; efficiency, from direct bedside patient care to nonclinical efforts; teaching; research; involvements in various committees; administrative tasks; and leadership roles in improving health care systems are immeasurable. These are the reasons that most hospitals chose to adopt the hospitalist model and continue to support it. In fact, demand for hospitalists still outstrips supply, as evidenced by more than half of the hospital medicine groups with unfilled positions and an overall high turnover rate per 2018 SoHM data.
Although hospitalists are needed for the value that they provide, they should not take the status quo for granted. Instead, in return for the favorable financial support and in appreciation of being valued, hospitalists have a responsibility to prove that they are the right group chosen to do the work and help achieve their hospital’s mission and goals.
Dr. Vuong is a hospitalist at HealthPartners Medical Group in St Paul, Minn., and an assistant professor of medicine at the University of Minnesota. He is a member of SHM’s Practice Analysis Committee.
References
Afsar N. Looking into the Future and Making History. Hospitalist. 2019;23(1):31.
Beresford L. The State of Hospital Medicine in 2018. Hospitalist. 2019;23(1):1-11.
FitzGerald S. Not a Time for Modesty. Oct. 2009. Retrieved from https://acphospitalist.org/archives/2009/10/value.htm.
Watcher RM et al. Zero to 50,000 – The 20th Anniversary of the Hospitalist. N Eng J Med. 2016. 375(11):1009-11.
An uptrend in financial support
An uptrend in financial support
Since the inception of hospital medicine more than 2 decades ago, the total number of hospitalists has rapidly increased to more than 60,000. The Society of Hospital Medicine’s State of Hospital Medicine Report (SoHM), published biennially, captures new changes in our growing field and sheds light on current practice trends.
Among its findings, the 2018 SoHM Report reassuringly reveals that financial support from hospitals to hospital medicine groups (HMGs) continues to climb, even in the setting of rising health care costs and ongoing budget pressure.
The median amount of financial support per full-time equivalent (FTE) physician for HMGs serving adults was $176,658, according to the 2018 SoHM Report, which is up 12% from the 2016 median of $157,535. While there is no correlation between group sizes and the amount of financial support per FTE physician, there are significant differences across regions, with HMGs in the Midwest garnering the highest median support, at $193,121 per FTE physician.
The report also reveals big differences by employment model. For example, private multispecialty and primary care medical groups receive much less financial support ($58,396 per FTE physician) than HMGs employed by hospitals. This likely signifies that their main source of revenue is from professional service fees. Regardless of the types of employment models, past surveys have reported more than 95% of HMGs receive support from their hospitals to help cover expenses.
The median amount of financial support per FTE provider (including nurse practitioners, physician assistants, and locum tenens) was $134,300, which represents a 3.3% decrease, compared with the 2016 SoHM Report. For the first time, the 2018 SoHM also collected data on financial support per “work relative value unit” (wRVU) in addition to support per FTE physician and support per FTE provider. HMGs and their hospitals can use support per wRVU data to evaluate the support per unit of work, regardless of who (whether it is a physician, an advanced practice provider, and/or others) performed that work.
The median amount of financial support per wRVU for HMGs serving adults in 2018 was $41.92, with academic HMGs reporting a higher amount ($45.81) than nonacademic HMGs ($41.28). It will be interesting to track these numbers over time.
One of the most intriguing findings from the SHM’s 2018 SoHM Report is that financial support has risen despite relatively flat professional fee productivity (see Figure 1). Productivity, calculated as work relative value units (wRVUs) per physician declined slightly from 4,252 in 2016 to 4,147 in 2018.
There may be a few reasons why wRVUs per physician has remained relatively unchanged over the years. Many hospitals emphasize quality of care above provider productivity. The volume-to-value shift in theory serves as a means to reduce hospital-associated complications, length of stay, and readmission rates, thereby avoiding penalties and saving the overall costs for the hospitals in the long run.
Hospitalists involved in quality improvement projects and other essential nonclinical work perform tasks that are rarely captured in the wRVU metric. Improving patient experience, one of the Triple Aim components, necessitates extra time and effort, which also are nonbillable. In addition, increasing productivity can be challenging, a double-edged sword that may further escalate burnout and turnover rates. The static productivity may portend that it has leveled off or hit the ceiling in spite of ongoing efforts to improve efficacy.
In my view, the decision to invest in hospitalists for their contributions and dedications should not be determined based on a single metric such as wRVUs per physician. Hospitalist work on quality improvements; patient safety; efficiency, from direct bedside patient care to nonclinical efforts; teaching; research; involvements in various committees; administrative tasks; and leadership roles in improving health care systems are immeasurable. These are the reasons that most hospitals chose to adopt the hospitalist model and continue to support it. In fact, demand for hospitalists still outstrips supply, as evidenced by more than half of the hospital medicine groups with unfilled positions and an overall high turnover rate per 2018 SoHM data.
Although hospitalists are needed for the value that they provide, they should not take the status quo for granted. Instead, in return for the favorable financial support and in appreciation of being valued, hospitalists have a responsibility to prove that they are the right group chosen to do the work and help achieve their hospital’s mission and goals.
Dr. Vuong is a hospitalist at HealthPartners Medical Group in St Paul, Minn., and an assistant professor of medicine at the University of Minnesota. He is a member of SHM’s Practice Analysis Committee.
References
Afsar N. Looking into the Future and Making History. Hospitalist. 2019;23(1):31.
Beresford L. The State of Hospital Medicine in 2018. Hospitalist. 2019;23(1):1-11.
FitzGerald S. Not a Time for Modesty. Oct. 2009. Retrieved from https://acphospitalist.org/archives/2009/10/value.htm.
Watcher RM et al. Zero to 50,000 – The 20th Anniversary of the Hospitalist. N Eng J Med. 2016. 375(11):1009-11.