User login
Payers and policymakers are increasingly holding hospitals accountable for patients' experiences with their care. Since 2006, the Centers for Medicare and Medicaid Services (CMS) have collected data on patients' experiences with inpatient care using the Hospital Consumer Assessment of Healthcare Providers and Systems (HCAHPS) survey, a well‐validated and widely used tool. In 2008, these data on patient experience began to be publicly reported, and CMS now plans to base part of its payments to hospitals on HCAHPS performance scores. In this context, hospitals are looking for ways to improve patient satisfaction.
The effort to hold hospitals accountable for patient experience may conflict with another major trend in US hospitals: the increasing use of hospitalists.[1] Although hospitalists may have greater expertise in the day‐to‐day care of the hospitalized patient, they generally do not know the patient and cannot cater to patients' preferences in ways that the primary‐care provider might. Therefore, given that patients may prefer to be seen by their primary‐care provider,[2] greater use of hospitalists may actually lead to a decrease in patient satisfaction. Unfortunately, we are unaware of any national examination of the relationship between hospitalist use in an institution and that entity's performance on patient‐experience scores.
To better understand the relationship between greater hospitalist staffing and patient‐centered care, we examined the association between hospitalist staffing and patient satisfaction with both overall care and specific domains of patient‐centered care. We hypothesized that hospitals that used a high proportion of hospitalists would generally have lower patient‐experience scores. Further, we expected that the relationship would be monotonic (greater use of hospitalists associated with lower scores) and particularly pronounced in 2 domains: patient experience with discharge planning and patient experience with physician communication.
METHODS
Data
We sought to identify acute‐care hospitals with elderly medical patients cared for by hospitalists, non‐hospitalists, or some combination of the 2. To construct this cohort, we used 3 2009 Medicare files. The Beneficiary Summary File contains demographic information on Medicare beneficiaries and data on enrollment in managed‐care plans. To identify medical hospitalizations, we used the Medicare Provider Analysis and Review (MedPAR) 100% Files, which contain the clinical diagnoses and payments for all fee‐for‐service Medicare beneficiaries discharged from acute‐care hospitals. To identify hospitalists and non‐hospitalists, we used the 5% Carrier File, which contains physician billing data for a 5% random sample of fee‐for‐service Medicare beneficiaries. We also obtained information on hospital characteristics from the American Hospital Association (AHA) Annual Survey. We supplemented this with hospital‐level data on patient satisfaction from the HCAHPS survey conducted in 2009. The HCAHPS is a standard survey developed by the Agency for Healthcare Research and Quality (AHRQ) and administered by hospitals to a random sample of adult patients 48 hours to 6 weeks after discharge. The HCAHPS results are adjusted for patient mix and have been tested for nonresponse bias.[3] Details about the development and design of HCAHPS have been described previously.[4]
Patient and Hospital Sample
We started with 48,861,000 Medicare beneficiaries in the Beneficiary Summary File and excluded 38% either because their age was <65 years or they were members of an HMO. At the same time, from the 1,850,000 patients in the 5% Carrier File, we excluded 55% who had not been cared for by a general internist. Finally, we used the MedPAR File to identify 17,387,000 hospital admissions by fee‐for‐service Medicare beneficiaries. From MedPAR, we excluded admissions to a facility other than an acute‐care hospital (24%), surgical admissions identified by diagnosis‐related group (DRG) (29%), and admissions to hospitals with <5 medicine admissions in 2009 (<0.1%). After merging these 3 files (Beneficiary Summary, MedPAR, and 5% Carrier), we were left with 229,496 admissions among 180,399 patients at 3365 hospitals. We subsequently excluded readmissions and were left with 156,333 admissions at 3244 hospitals. Finally, we excluded those patients cared for by both hospitalists and non‐hospitalists during the same hospitalization, and those hospitals missing AHA or HCAHPS data, leaving us with 132,814 patients at 2843 hospitals.
Definition of Hospitalist
We used the claims‐based definition developed and validated by Kuo and Goodwin in earlier work.[1] Hospitalists are defined as those general internists (providers in general practice or internal medicine) who had 5 evaluation and management (E&M) billings (in a 5% sample of Medicare beneficiaries) in 2009 and generated >90% of their claims from the care of hospitalized patients in 2009.
Measures of Patient Satisfaction
There are 2 HCAHPS questions about overall satisfaction, one that asks patients to rate their experience on a scale of 0 to 10 and another that asks whether they would recommend the hospital. Not surprisingly, hospitals' performance on these 2 questions is highly correlated.[5] We measured overall patient experience using commonly used approaches: the proportion of patients who gave the hospital a 9 or 10 (on the 10‐point scale) or the proportion of patients who reported that they would definitely recommend the hospital. The HCAHPS also contains 24 questions, which are reported by CMS in 8 domains: communication with nurse, communication with physician, responsiveness of the staff, pain control, communication about medications, adequacy of discharge planning, cleanliness of the room, and quietness of the room. The patient‐satisfaction score for each of these domains represents the proportion of patients who answered always to each of the questions, or who answered yes to the question about discharge.
Potentially Confounding Variables
Because we were worried that hospitals with hospitalists would be different from hospitals without hospitalists, we identified a series of covariates for adjustment in a multivariable model. We extracted data from the AHA on hospitals' structural characteristics that we assumed might be associated both with having a hospitalist and with patient experience. These variables were size (number of beds), teaching status (membership in the Council of Teaching Hospitals vs no membership), location (urban vs rural), region (the 4 census regions), ownership (for profit, private nonprofit, or public), and presence of advanced clinical capabilities (as measured by having a medical, surgical, and/or cardiac intensive care unit [ICU]). We also used information about the patient population (proportion of patients with Medicare or with Medicaid) as well as nurse‐staffing level (ratio of full‐time equivalent registered nurses to total hospital beds).
Statistical Analyses
We first quantified hospital variation in the proportion of general‐medicine patients cared for by hospitalists, using basic descriptive statistics. Based on these analyses, we categorized hospitals into 3 groups: non‐hospitalist, mixed, and hospitalist (corresponding to lowest, middle, and highest tertile of hospitalist use respectively). We used bivariate techniques to describe the patient and hospital characteristics of hospitals in each group. Patient characteristics included number of comorbidities, which were calculated using software from the Healthcare Cost and Utilization Project (HCUP),[6] based on methods developed by Elixhauser et al.[7] We used the ‐square test to assess whether hospital or patient characteristics differed between hospitalist, mixed, and non‐hospitalist hospitals.
To examine the association between hospitalist care and patient satisfaction, we first constructed bivariate models for each measure of patient satisfaction. In these models, hospital type (hospitalist, mixed, and non‐hospitalist) was our predictor. We next constructed multivariable models, which adjusted for each of the hospital characteristics described above in order to assess the independent relationship between hospitalist care and HCAHPS performance.
In sensitivity analyses, we first examined hospitalist use as a continuous variable and had qualitatively very similar results. Those data are not presented. Additionally, we conducted a propensity score analysis, with results presented in the Appendix (see Supporting Information, Appendix 1, in the online version of this article). In our first‐stage logistic regression model, being a hospitalist hospital (defined as being in the top tertile of hospitalist use vs bottom 2 tertiles) was the outcome. Hospital structural factors were covariates. Based on this first‐stage model, each hospital was assigned a propensity of being a hospitalist hospital. We divided the hospitals into 3 groups (highest propensity tertile, middle propensity tertile, and lowest propensity tertile). In a second‐stage linear regression model, patient satisfaction score was the outcome. The predictors were hospital type (dichotomized, and defined as being in the top tertile of hospitalist use vs bottom 2 tertiles), and propensity of being a hospitalist hospital (3 categories, with low propensity as the reference).
All analyses were performed using SAS version 9.2. The project was reviewed by the Institutional Review Board at the University of Michigan and determined to be not regulated given our use of publicly available datasets.
RESULTS
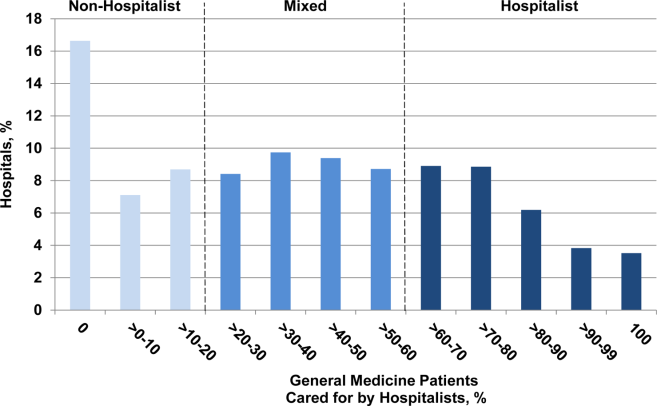
Among all hospitals, the median proportion of general‐medicine admissions cared for by hospitalists was 41.2% (interquartile range [IQR], 11.5%67.4%). However, US hospitals varied widely in the proportion of general‐medicine patients cared for by hospitalists (Figure 1). Whereas 3.5% of hospitals had all of their general‐medicine patients cared for by hospitalists, 16.6% had none of their general‐medicine patients seen by hospitalists. For hospitals with at least some hospitalist care, the proportion of patients cared for by hospitalists was distributed fairly evenly across the range of possibilities (Figure 1).

Because hospitalist care varied widely among hospitals, we categorized hospitals into 3 groups (non‐hospitalist, mixed, and hospitalist). The median proportion of patients cared for by hospitalists in the 3 groups was 0%, 39.5%, and 76.5%, respectively (Table 1). The non‐hospitalist hospitals, when compared with mixed and hospitalist hospitals, were more likely to be small, nonteaching, for‐profit institutions located in the Midwestern United States. They also were less likely to have an ICU and had lower nurse‐to‐bed ratios.
| Hospital Characteristics | Hospital Type | P Value | ||
|---|---|---|---|---|
| Non‐Hospitalist (N = 943) | Mixed (N = 948) | Hospitalist (N = 952) | ||
| ||||
| GM admissions cared for by hospitalists, median (range), % | 0 (021) | 40 (2158) | 77 (58100) | <0.001 |
| Nurse‐to‐bed ratio | 1 | 1 | 2 | <0.001 |
| Presence of MICU, % | 79 | 84 | 85 | 0.001 |
| Medicaid patients, % | 19 | 18 | 18 | 0.06 |
| Hospital beds, % | <0.001 | |||
| Small (99) | 36 | 16 | 24 | |
| Medium (100399) | 59 | 64 | 58 | |
| Large (400) | 6 | 21 | 18 | |
| COTH membership, % | <0.001 | |||
| Yes | 3 | 13 | 11 | |
| No | 97 | 87 | 89 | |
| Urban, % | 0.10 | |||
| Yes | 88 | 89 | 91 | |
| No | 12 | 11 | 9 | |
| Profit status, % | <0.001 | |||
| For profit | 21 | 17 | 18 | |
| Not for profit, private | 62 | 71 | 67 | |
| Other | 18 | 12 | 15 | |
| Region, % | <0.001 | |||
| South | 41 | 42 | 42 | |
| Northeast | 14 | 21 | 16 | |
| Midwest | 30 | 22 | 18 | |
| West | 15 | 15 | 24 | |
The types of patients cared for at all 3 hospital types (non‐hospitalist, mixed, and hospitalist) were similar in age and day of admission (Table 2). Patients cared for at non‐hospitalist hospitals were slightly more likely to be female and non‐White, and less likely to be admitted from the emergency department or another hospital or healthcare facility.
| Patient Characteristics | Hospital Type | P Value | ||
|---|---|---|---|---|
| Non‐Hospitalist (N = 33,265) | Mixed (N = 52,844) | Hospitalist (N = 46,705) | ||
| ||||
| Age, y | 0.51 | |||
| 6574 | 27 | 27 | 27 | |
| 7584 | 39 | 39 | 39 | |
| 85 | 34 | 34 | 34 | |
| Sex | <0.001 | |||
| M | 35 | 35 | 36 | |
| F | 65 | 65 | 64 | |
| Race/ethnicity | <0.001 | |||
| White | 85 | 85 | 87 | |
| Black | 10 | 11 | 9 | |
| Other | 5 | 4 | 4 | |
| Unknown | 0 | 0 | 0 | |
| Comorbidities, % | <0.001 | |||
| 0 | 8 | 8 | 7 | |
| 1 | 23 | 23 | 22 | |
| 2+ | 69 | 69 | 71 | |
| Day of admission | 0.08 | |||
| Weekday | 73 | 73 | 73 | |
| Weekend | 27 | 27 | 27 | |
| Admission source | <0.001 | |||
| ED | 75 | 78 | 80 | |
| Another ACH | 1 | 2 | 3 | |
| Other healthcare facility | 4 | 4 | 4 | |
| Other | 20 | 17 | 13 | |
| ICU stay | <0.001 | |||
| Yes | 13 | 12 | 12 | |
| No | 87 | 88 | 88 | |
| Length of stay, d | <0.001 | |||
| Median (Q1, Q3) | 4 (3, 6) | 4 (2, 6) | 3 (2, 5) | |
| DRG | <0.001 | |||
| Septicemia or severe sepsis | 3 | 4 | 4 | |
| Esophagitis, gastroenteritis | 3 | 3 | 3 | |
| Kidney and urinary tract infections | 3 | 3 | 3 | |
| Syncope | 3 | 3 | 3 | |
| Pneumonia | 3 | 3 | 3 | |
When we examined unadjusted relationships between type of hospital and patient experience, we found that patients at hospitalist vs non‐hospitalist hospitals were more likely to recommend the hospital (69.4% vs 65.1%: P < 0.001), and report higher overall satisfaction (65.9% vs 63.6%: P < 0.001) ((see Supporting Information, Appendix, Table A1, in the online version of this article)). Care at hospitalist hospitals was associated with higher satisfaction with discharge, but lower satisfaction with room cleanliness and communication with doctors. These differences were statistically significant at the P < 0.05 level.
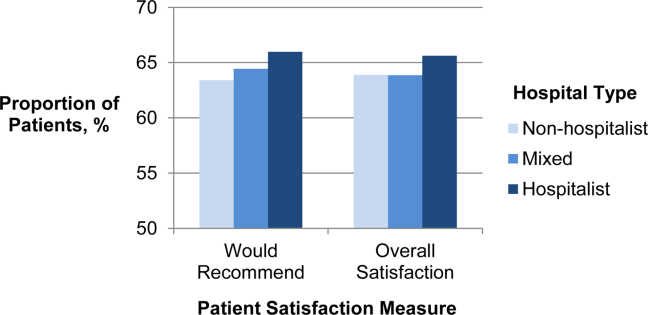
When we examined the relationship between having more hospitalists and patient experience using multivariable models that accounted for differences in hospital characteristics, we found largely similar results: The proportion of patients who were satisfied with their overall care was still higher at hospitalist compared with non‐hospitalist hospitals (65.6% vs 63.9%: P < 0.001) (Figure 2). Similarly, patients were more likely to definitely recommend their hospital if they had been cared for at a hospitalist vs non‐hospitalist hospital (66.0% vs 63.4%: P < 0.001).
To better understand which domains of care might be contributing to greater overall satisfaction, we also examined patient satisfaction with specific domains of care at hospitalist vs non‐hospitalist hospitals (Table 3) in our adjusted analyses. Among 8 domains, the largest difference in satisfaction between patients cared for at hospitalist vs non‐hospitalist hospitals occurred with discharge. At hospitalist hospitals, 80.3% of patients said they were satisfied with the quality of the discharge planning compared with 78.1% at non‐hospitalist hospitals (P < 0.001). Patients at hospitalist hospitals were more satisfied with most other domains of care as well. Patients cared for at hospitalist hospitals were slightly less likely to be satisfied with communication with doctors, but this difference was not statistically significant (P = 0.45). Results were qualitatively similar in propensity‐score analyses (see Supporting Information, Appendix, Table A2, in the online version of this article).
| Specific Domains of Care | Hospital Type, % Satisfied | Hospitalist vs Non‐Hospitalist | |||
|---|---|---|---|---|---|
| Non‐Hospitalist | Mixed | Hospitalist | Difference in % Satisfied | P Value | |
| |||||
| Discharge | 78.1 | 79.1 | 80.3 | 2.1 | <0.001 |
| Nursing services | 66.0 | 65.8 | 67.1 | 1.1 | <0.001 |
| Quiet | 63.3 | 63.1 | 64.4 | 1.1 | 0.001 |
| Communication, nurse | 76.7 | 76.7 | 77.7 | 1.0 | <0.001 |
| Pain control | 69.7 | 69.7 | 70.4 | 0.7 | 0.001 |
| Medications | 60.5 | 60.5 | 61.2 | 0.7 | 0.002 |
| Cleanliness | 72.7 | 72.1 | 72.9 | 0.2 | 0.56 |
| Communication, physician | 83.6 | 83.1 | 83.5 | 0.2 | 0.45 |
DISCUSSION
We found that in 2009, US hospitals varied widely in the proportion of general medicine patients cared for by hospitalists. Hospitals with higher levels of hospitalist care did better on most measures of patient satisfaction. Differences were largest in overall satisfaction and for discharge planning. In 5 other domains of care, differences were smaller, but hospitals with more hospitalist care consistently performed better than non‐hospitalist hospitals. Hospitalist care was not associated with patient satisfaction in 2 domains: communication with doctors and cleanliness of room.
Our findings of modestly higher patient satisfaction at hospitalist hospitals along most dimensions of care are surprising and reassuring. Indeed, when hospitalists first began caring for inpatients, some expressed concerns that hospitalist care would decrease patient satisfaction.[8, 9] Though this has been an ongoing concern, we found no evidence to support this contention. It may be that as a response to the concern, hospitals with hospitalists have paid particular attention to issues such as effective handoffs to primary‐care providers.[10, 11, 12, 13] Whether due to these efforts or other factors such as the 24/7 inpatient presence of hospitalists, we found that patients at hospitalist hospitals were more likely to be satisfied with their inpatient care, including their experience at discharge. In contrast, one area that may offer room for improvement for hospitalist hospitals is communication with physicians. It may be that patients cared for by hospitalists do not know their physicians as well as patients whose care is being orchestrated by their primary‐care provider, and thus the benefits of having an ever‐present hospitalist are diminished.
The magnitude of the associations that we found should also be placed in the context of existing research on patient satisfaction. Prior work has described baseline hospital performance, changes over time, and factors associated with greater inpatient satisfaction.[5, 14, 15] The associations that we found between hospitalist care and satisfaction with care at discharge were larger than those found for teaching (vs non‐teaching) hospitals.[5] However, compared with other hospital characteristics such as nurse staffing or profit status, hospitalist care was associated with smaller differences in patient satisfaction. In one study, hospitals in the highest quartile of nurse staffing had HCAHPS scores (ie, willingness to recommend measure) that were 6.7 points higher than those in the lowest quartile of nurse staffing, and similar differences existed between not‐for‐profit, public hospitals vs for‐profit hospitals.[5]
Taken together, our findings address an important gap in knowledge about hospitalist care. Prior research has documented growth in the use of hospitalist care[1] and described the association of hospitalist care with outcomes such as mortality and resource use, and receipt of recommended care.[16, 17, 18, 19] However, we are unaware of any national study that has examined the association of hospitalist care with patient satisfaction. One study surveyed patients in a single health system and found that patients were similarly satisfied with care provided by hospitalists and primary‐care physicians.[20] Our findings should be reassuring to clinical leaders and policymakers who have advocated greater use of hospitalists: the results suggest that there need be no tradeoff between greater use of hospitalist services and patient satisfaction. Indeed, patients appear to be even more satisfied in hospitals that have greater use of hospitalist physicians.
Our study has several limitations. First, it was a cross‐sectional study, and thus we cannot make any conclusions about causality. Although we adjusted for several potential confounders (eg, teaching status, advanced care capabilities, nurse staffing), it is possible that hospitalist care is a surrogate marker for features of hospitals that we could not measure but that directly influence patient experience. In addition, it is possible that patients cared for at hospitalist hospitals differ in unmeasured ways from patients cared for at other types of hospitals. Second, we constructed our primary predictor and outcome from different cohorts. Our primary predictor was derived from the proportion of general‐medicine patients cared for by hospitalists in Medicare claims data. In contrast, our primary outcome was based on HCAHPS responses from a random sampling of all hospital admissions. This misclassification likely would have biased us towards finding small or no associations. Therefore, we are likely underestimating the true association between hospitalist use and patient experience. Third, our findings may not be generalizable to hospitals that serve younger patients or have a large number of specialist hospitalists (who were not included in our definition of hospitalists). For example, compared with older patients with multiple comorbidities, relatively healthy younger patients may derive less benefit from an ever‐present hospitalist who can explain discharge plans or an attentive nurse.
In summary, we found that US hospitals varied widely in their use of hospitalist physicians, and those which a greater proportion of care was delivered by hospitalists generally had better scores on patient experience, especially on the global assessment of satisfaction and in discharge care. Our findings suggest that adoption of the hospitalist modelone of the strategies employed by US hospitals in the past 2 decades to provide efficient careshould not detract from achieving the goal of more patient‐centered care.
Disclosures
Dr. Chen's work is supported in part by the National Institutes of Health/National Institute on Aging (AG024824, University of Michigan Claude D. Pepper Older Americans Independence Center), and the National Institutes of Health/National Center for Research Resources (UL1‐RR024986, Michigan Institute for Clinical and Health Research). Dr. Chen is also supported by a Career Development Grant Award (K08HS020671) from the Agency for Healthcare Research and Quality.
- , , , . Growth in the care of older patients by hospitalists in the United States. N Engl J Med. 2009;360(11):1102–1112.
- , , . How do patients view the role of the primary care physician in inpatient care? Dis Mon. 2002;48(4):230–238.
- , , , et al. Effects of survey mode, patient mix, and nonresponse on CAHPS hospital survey scores. Health Serv Res. 2009;44(2 pt 1):501–518.
- , , , , . Development, implementation, and public reporting of the HCAHPS survey. Med Care Res Rev. 2010;67(1):27–37.
- , , , . Patients' perception of hospital care in the United States. N Engl J Med. 2008;359(18):1921–1931.
- Agency for Healthcare Research and Quality. Healthcare Cost and Utilization Project (HCUP). HCUP Comorbidity Software. http://www.hcup‐us.ahrq.gov/toolssoftware/comorbidity/comorbidity.jsp Accessed November 12, 2012.
- , , , . Comorbidity measures for use with administrative data. Med Care. 1998;36(1):8–27.
- , , . Physician views on caring for hospitalized patients and the hospitalist model of inpatient care. J Gen Intern Med. 2001;16(2):116–119.
- , , , . How physicians perceive hospitalist services after implementation: anticipation vs reality. Arch Intern Med. 2003;163(19):2330–2336.
- , , , et al. Association of communication between hospital‐based physicians and primary care providers with patient outcomes. J Gen Intern Med. 2009;24(3):381–386.
- , , . Passing the clinical baton: 6 principles to guide the hospitalist. Dis Mon. 2002;48(4):260–266.
- , , , . Primary care physician attitudes regarding communication with hospitalists. Am J Med. 2001;111(9B):15S–20S.
- , , , et al. Transitions of Care Consensus policy statement: American College of Physicians, Society of General Internal Medicine, Society of Hospital Medicine, American Geriatrics Society, American College Of Emergency Physicians, and Society for Academic Emergency Medicine. J Hosp Med. 2009;4(6):364–370.
- , , , et al. Hospital survey shows improvements in patient experience. Health Aff (Millwood). 2010;29(11):2061–2067.
- , , , , , . Characteristics of hospitals demonstrating superior performance in patient experience and clinical process measures of care. Med Care Res Rev. 2010;67(1):38–55.
- , . The impact of hospitalists on the cost and quality of inpatient care in the United States: a research synthesis. Med Care Res Rev. 2005;62(4):379–406.
- , , , , . Quality of care for patients hospitalized with heart failure: assessing the impact of hospitalists. Arch Intern Med. 2002;162(11):1251–1256.
- , , , , . Hospitalists and the quality of care in hospitals. Arch Intern Med. 2009;169(15):1389–1394.
- , , , et al. Quality of care for decompensated heart failure: comparable performance between academic hospitalists and non‐hospitalists. J Gen Intern Med. 2008;23(9):1399–1406.
- , , , et al. Patient satisfaction with hospital care provided by hospitalists and primary care physicians. J Hosp Med. 2012;7(2):131–136.
Payers and policymakers are increasingly holding hospitals accountable for patients' experiences with their care. Since 2006, the Centers for Medicare and Medicaid Services (CMS) have collected data on patients' experiences with inpatient care using the Hospital Consumer Assessment of Healthcare Providers and Systems (HCAHPS) survey, a well‐validated and widely used tool. In 2008, these data on patient experience began to be publicly reported, and CMS now plans to base part of its payments to hospitals on HCAHPS performance scores. In this context, hospitals are looking for ways to improve patient satisfaction.
The effort to hold hospitals accountable for patient experience may conflict with another major trend in US hospitals: the increasing use of hospitalists.[1] Although hospitalists may have greater expertise in the day‐to‐day care of the hospitalized patient, they generally do not know the patient and cannot cater to patients' preferences in ways that the primary‐care provider might. Therefore, given that patients may prefer to be seen by their primary‐care provider,[2] greater use of hospitalists may actually lead to a decrease in patient satisfaction. Unfortunately, we are unaware of any national examination of the relationship between hospitalist use in an institution and that entity's performance on patient‐experience scores.
To better understand the relationship between greater hospitalist staffing and patient‐centered care, we examined the association between hospitalist staffing and patient satisfaction with both overall care and specific domains of patient‐centered care. We hypothesized that hospitals that used a high proportion of hospitalists would generally have lower patient‐experience scores. Further, we expected that the relationship would be monotonic (greater use of hospitalists associated with lower scores) and particularly pronounced in 2 domains: patient experience with discharge planning and patient experience with physician communication.
METHODS
Data
We sought to identify acute‐care hospitals with elderly medical patients cared for by hospitalists, non‐hospitalists, or some combination of the 2. To construct this cohort, we used 3 2009 Medicare files. The Beneficiary Summary File contains demographic information on Medicare beneficiaries and data on enrollment in managed‐care plans. To identify medical hospitalizations, we used the Medicare Provider Analysis and Review (MedPAR) 100% Files, which contain the clinical diagnoses and payments for all fee‐for‐service Medicare beneficiaries discharged from acute‐care hospitals. To identify hospitalists and non‐hospitalists, we used the 5% Carrier File, which contains physician billing data for a 5% random sample of fee‐for‐service Medicare beneficiaries. We also obtained information on hospital characteristics from the American Hospital Association (AHA) Annual Survey. We supplemented this with hospital‐level data on patient satisfaction from the HCAHPS survey conducted in 2009. The HCAHPS is a standard survey developed by the Agency for Healthcare Research and Quality (AHRQ) and administered by hospitals to a random sample of adult patients 48 hours to 6 weeks after discharge. The HCAHPS results are adjusted for patient mix and have been tested for nonresponse bias.[3] Details about the development and design of HCAHPS have been described previously.[4]
Patient and Hospital Sample
We started with 48,861,000 Medicare beneficiaries in the Beneficiary Summary File and excluded 38% either because their age was <65 years or they were members of an HMO. At the same time, from the 1,850,000 patients in the 5% Carrier File, we excluded 55% who had not been cared for by a general internist. Finally, we used the MedPAR File to identify 17,387,000 hospital admissions by fee‐for‐service Medicare beneficiaries. From MedPAR, we excluded admissions to a facility other than an acute‐care hospital (24%), surgical admissions identified by diagnosis‐related group (DRG) (29%), and admissions to hospitals with <5 medicine admissions in 2009 (<0.1%). After merging these 3 files (Beneficiary Summary, MedPAR, and 5% Carrier), we were left with 229,496 admissions among 180,399 patients at 3365 hospitals. We subsequently excluded readmissions and were left with 156,333 admissions at 3244 hospitals. Finally, we excluded those patients cared for by both hospitalists and non‐hospitalists during the same hospitalization, and those hospitals missing AHA or HCAHPS data, leaving us with 132,814 patients at 2843 hospitals.
Definition of Hospitalist
We used the claims‐based definition developed and validated by Kuo and Goodwin in earlier work.[1] Hospitalists are defined as those general internists (providers in general practice or internal medicine) who had 5 evaluation and management (E&M) billings (in a 5% sample of Medicare beneficiaries) in 2009 and generated >90% of their claims from the care of hospitalized patients in 2009.
Measures of Patient Satisfaction
There are 2 HCAHPS questions about overall satisfaction, one that asks patients to rate their experience on a scale of 0 to 10 and another that asks whether they would recommend the hospital. Not surprisingly, hospitals' performance on these 2 questions is highly correlated.[5] We measured overall patient experience using commonly used approaches: the proportion of patients who gave the hospital a 9 or 10 (on the 10‐point scale) or the proportion of patients who reported that they would definitely recommend the hospital. The HCAHPS also contains 24 questions, which are reported by CMS in 8 domains: communication with nurse, communication with physician, responsiveness of the staff, pain control, communication about medications, adequacy of discharge planning, cleanliness of the room, and quietness of the room. The patient‐satisfaction score for each of these domains represents the proportion of patients who answered always to each of the questions, or who answered yes to the question about discharge.
Potentially Confounding Variables
Because we were worried that hospitals with hospitalists would be different from hospitals without hospitalists, we identified a series of covariates for adjustment in a multivariable model. We extracted data from the AHA on hospitals' structural characteristics that we assumed might be associated both with having a hospitalist and with patient experience. These variables were size (number of beds), teaching status (membership in the Council of Teaching Hospitals vs no membership), location (urban vs rural), region (the 4 census regions), ownership (for profit, private nonprofit, or public), and presence of advanced clinical capabilities (as measured by having a medical, surgical, and/or cardiac intensive care unit [ICU]). We also used information about the patient population (proportion of patients with Medicare or with Medicaid) as well as nurse‐staffing level (ratio of full‐time equivalent registered nurses to total hospital beds).
Statistical Analyses
We first quantified hospital variation in the proportion of general‐medicine patients cared for by hospitalists, using basic descriptive statistics. Based on these analyses, we categorized hospitals into 3 groups: non‐hospitalist, mixed, and hospitalist (corresponding to lowest, middle, and highest tertile of hospitalist use respectively). We used bivariate techniques to describe the patient and hospital characteristics of hospitals in each group. Patient characteristics included number of comorbidities, which were calculated using software from the Healthcare Cost and Utilization Project (HCUP),[6] based on methods developed by Elixhauser et al.[7] We used the ‐square test to assess whether hospital or patient characteristics differed between hospitalist, mixed, and non‐hospitalist hospitals.
To examine the association between hospitalist care and patient satisfaction, we first constructed bivariate models for each measure of patient satisfaction. In these models, hospital type (hospitalist, mixed, and non‐hospitalist) was our predictor. We next constructed multivariable models, which adjusted for each of the hospital characteristics described above in order to assess the independent relationship between hospitalist care and HCAHPS performance.
In sensitivity analyses, we first examined hospitalist use as a continuous variable and had qualitatively very similar results. Those data are not presented. Additionally, we conducted a propensity score analysis, with results presented in the Appendix (see Supporting Information, Appendix 1, in the online version of this article). In our first‐stage logistic regression model, being a hospitalist hospital (defined as being in the top tertile of hospitalist use vs bottom 2 tertiles) was the outcome. Hospital structural factors were covariates. Based on this first‐stage model, each hospital was assigned a propensity of being a hospitalist hospital. We divided the hospitals into 3 groups (highest propensity tertile, middle propensity tertile, and lowest propensity tertile). In a second‐stage linear regression model, patient satisfaction score was the outcome. The predictors were hospital type (dichotomized, and defined as being in the top tertile of hospitalist use vs bottom 2 tertiles), and propensity of being a hospitalist hospital (3 categories, with low propensity as the reference).
All analyses were performed using SAS version 9.2. The project was reviewed by the Institutional Review Board at the University of Michigan and determined to be not regulated given our use of publicly available datasets.
RESULTS
Among all hospitals, the median proportion of general‐medicine admissions cared for by hospitalists was 41.2% (interquartile range [IQR], 11.5%67.4%). However, US hospitals varied widely in the proportion of general‐medicine patients cared for by hospitalists (Figure 1). Whereas 3.5% of hospitals had all of their general‐medicine patients cared for by hospitalists, 16.6% had none of their general‐medicine patients seen by hospitalists. For hospitals with at least some hospitalist care, the proportion of patients cared for by hospitalists was distributed fairly evenly across the range of possibilities (Figure 1).
Because hospitalist care varied widely among hospitals, we categorized hospitals into 3 groups (non‐hospitalist, mixed, and hospitalist). The median proportion of patients cared for by hospitalists in the 3 groups was 0%, 39.5%, and 76.5%, respectively (Table 1). The non‐hospitalist hospitals, when compared with mixed and hospitalist hospitals, were more likely to be small, nonteaching, for‐profit institutions located in the Midwestern United States. They also were less likely to have an ICU and had lower nurse‐to‐bed ratios.
| Hospital Characteristics | Hospital Type | P Value | ||
|---|---|---|---|---|
| Non‐Hospitalist (N = 943) | Mixed (N = 948) | Hospitalist (N = 952) | ||
| ||||
| GM admissions cared for by hospitalists, median (range), % | 0 (021) | 40 (2158) | 77 (58100) | <0.001 |
| Nurse‐to‐bed ratio | 1 | 1 | 2 | <0.001 |
| Presence of MICU, % | 79 | 84 | 85 | 0.001 |
| Medicaid patients, % | 19 | 18 | 18 | 0.06 |
| Hospital beds, % | <0.001 | |||
| Small (99) | 36 | 16 | 24 | |
| Medium (100399) | 59 | 64 | 58 | |
| Large (400) | 6 | 21 | 18 | |
| COTH membership, % | <0.001 | |||
| Yes | 3 | 13 | 11 | |
| No | 97 | 87 | 89 | |
| Urban, % | 0.10 | |||
| Yes | 88 | 89 | 91 | |
| No | 12 | 11 | 9 | |
| Profit status, % | <0.001 | |||
| For profit | 21 | 17 | 18 | |
| Not for profit, private | 62 | 71 | 67 | |
| Other | 18 | 12 | 15 | |
| Region, % | <0.001 | |||
| South | 41 | 42 | 42 | |
| Northeast | 14 | 21 | 16 | |
| Midwest | 30 | 22 | 18 | |
| West | 15 | 15 | 24 | |
The types of patients cared for at all 3 hospital types (non‐hospitalist, mixed, and hospitalist) were similar in age and day of admission (Table 2). Patients cared for at non‐hospitalist hospitals were slightly more likely to be female and non‐White, and less likely to be admitted from the emergency department or another hospital or healthcare facility.
| Patient Characteristics | Hospital Type | P Value | ||
|---|---|---|---|---|
| Non‐Hospitalist (N = 33,265) | Mixed (N = 52,844) | Hospitalist (N = 46,705) | ||
| ||||
| Age, y | 0.51 | |||
| 6574 | 27 | 27 | 27 | |
| 7584 | 39 | 39 | 39 | |
| 85 | 34 | 34 | 34 | |
| Sex | <0.001 | |||
| M | 35 | 35 | 36 | |
| F | 65 | 65 | 64 | |
| Race/ethnicity | <0.001 | |||
| White | 85 | 85 | 87 | |
| Black | 10 | 11 | 9 | |
| Other | 5 | 4 | 4 | |
| Unknown | 0 | 0 | 0 | |
| Comorbidities, % | <0.001 | |||
| 0 | 8 | 8 | 7 | |
| 1 | 23 | 23 | 22 | |
| 2+ | 69 | 69 | 71 | |
| Day of admission | 0.08 | |||
| Weekday | 73 | 73 | 73 | |
| Weekend | 27 | 27 | 27 | |
| Admission source | <0.001 | |||
| ED | 75 | 78 | 80 | |
| Another ACH | 1 | 2 | 3 | |
| Other healthcare facility | 4 | 4 | 4 | |
| Other | 20 | 17 | 13 | |
| ICU stay | <0.001 | |||
| Yes | 13 | 12 | 12 | |
| No | 87 | 88 | 88 | |
| Length of stay, d | <0.001 | |||
| Median (Q1, Q3) | 4 (3, 6) | 4 (2, 6) | 3 (2, 5) | |
| DRG | <0.001 | |||
| Septicemia or severe sepsis | 3 | 4 | 4 | |
| Esophagitis, gastroenteritis | 3 | 3 | 3 | |
| Kidney and urinary tract infections | 3 | 3 | 3 | |
| Syncope | 3 | 3 | 3 | |
| Pneumonia | 3 | 3 | 3 | |
When we examined unadjusted relationships between type of hospital and patient experience, we found that patients at hospitalist vs non‐hospitalist hospitals were more likely to recommend the hospital (69.4% vs 65.1%: P < 0.001), and report higher overall satisfaction (65.9% vs 63.6%: P < 0.001) ((see Supporting Information, Appendix, Table A1, in the online version of this article)). Care at hospitalist hospitals was associated with higher satisfaction with discharge, but lower satisfaction with room cleanliness and communication with doctors. These differences were statistically significant at the P < 0.05 level.
When we examined the relationship between having more hospitalists and patient experience using multivariable models that accounted for differences in hospital characteristics, we found largely similar results: The proportion of patients who were satisfied with their overall care was still higher at hospitalist compared with non‐hospitalist hospitals (65.6% vs 63.9%: P < 0.001) (Figure 2). Similarly, patients were more likely to definitely recommend their hospital if they had been cared for at a hospitalist vs non‐hospitalist hospital (66.0% vs 63.4%: P < 0.001).
To better understand which domains of care might be contributing to greater overall satisfaction, we also examined patient satisfaction with specific domains of care at hospitalist vs non‐hospitalist hospitals (Table 3) in our adjusted analyses. Among 8 domains, the largest difference in satisfaction between patients cared for at hospitalist vs non‐hospitalist hospitals occurred with discharge. At hospitalist hospitals, 80.3% of patients said they were satisfied with the quality of the discharge planning compared with 78.1% at non‐hospitalist hospitals (P < 0.001). Patients at hospitalist hospitals were more satisfied with most other domains of care as well. Patients cared for at hospitalist hospitals were slightly less likely to be satisfied with communication with doctors, but this difference was not statistically significant (P = 0.45). Results were qualitatively similar in propensity‐score analyses (see Supporting Information, Appendix, Table A2, in the online version of this article).
| Specific Domains of Care | Hospital Type, % Satisfied | Hospitalist vs Non‐Hospitalist | |||
|---|---|---|---|---|---|
| Non‐Hospitalist | Mixed | Hospitalist | Difference in % Satisfied | P Value | |
| |||||
| Discharge | 78.1 | 79.1 | 80.3 | 2.1 | <0.001 |
| Nursing services | 66.0 | 65.8 | 67.1 | 1.1 | <0.001 |
| Quiet | 63.3 | 63.1 | 64.4 | 1.1 | 0.001 |
| Communication, nurse | 76.7 | 76.7 | 77.7 | 1.0 | <0.001 |
| Pain control | 69.7 | 69.7 | 70.4 | 0.7 | 0.001 |
| Medications | 60.5 | 60.5 | 61.2 | 0.7 | 0.002 |
| Cleanliness | 72.7 | 72.1 | 72.9 | 0.2 | 0.56 |
| Communication, physician | 83.6 | 83.1 | 83.5 | 0.2 | 0.45 |
DISCUSSION
We found that in 2009, US hospitals varied widely in the proportion of general medicine patients cared for by hospitalists. Hospitals with higher levels of hospitalist care did better on most measures of patient satisfaction. Differences were largest in overall satisfaction and for discharge planning. In 5 other domains of care, differences were smaller, but hospitals with more hospitalist care consistently performed better than non‐hospitalist hospitals. Hospitalist care was not associated with patient satisfaction in 2 domains: communication with doctors and cleanliness of room.
Our findings of modestly higher patient satisfaction at hospitalist hospitals along most dimensions of care are surprising and reassuring. Indeed, when hospitalists first began caring for inpatients, some expressed concerns that hospitalist care would decrease patient satisfaction.[8, 9] Though this has been an ongoing concern, we found no evidence to support this contention. It may be that as a response to the concern, hospitals with hospitalists have paid particular attention to issues such as effective handoffs to primary‐care providers.[10, 11, 12, 13] Whether due to these efforts or other factors such as the 24/7 inpatient presence of hospitalists, we found that patients at hospitalist hospitals were more likely to be satisfied with their inpatient care, including their experience at discharge. In contrast, one area that may offer room for improvement for hospitalist hospitals is communication with physicians. It may be that patients cared for by hospitalists do not know their physicians as well as patients whose care is being orchestrated by their primary‐care provider, and thus the benefits of having an ever‐present hospitalist are diminished.
The magnitude of the associations that we found should also be placed in the context of existing research on patient satisfaction. Prior work has described baseline hospital performance, changes over time, and factors associated with greater inpatient satisfaction.[5, 14, 15] The associations that we found between hospitalist care and satisfaction with care at discharge were larger than those found for teaching (vs non‐teaching) hospitals.[5] However, compared with other hospital characteristics such as nurse staffing or profit status, hospitalist care was associated with smaller differences in patient satisfaction. In one study, hospitals in the highest quartile of nurse staffing had HCAHPS scores (ie, willingness to recommend measure) that were 6.7 points higher than those in the lowest quartile of nurse staffing, and similar differences existed between not‐for‐profit, public hospitals vs for‐profit hospitals.[5]
Taken together, our findings address an important gap in knowledge about hospitalist care. Prior research has documented growth in the use of hospitalist care[1] and described the association of hospitalist care with outcomes such as mortality and resource use, and receipt of recommended care.[16, 17, 18, 19] However, we are unaware of any national study that has examined the association of hospitalist care with patient satisfaction. One study surveyed patients in a single health system and found that patients were similarly satisfied with care provided by hospitalists and primary‐care physicians.[20] Our findings should be reassuring to clinical leaders and policymakers who have advocated greater use of hospitalists: the results suggest that there need be no tradeoff between greater use of hospitalist services and patient satisfaction. Indeed, patients appear to be even more satisfied in hospitals that have greater use of hospitalist physicians.
Our study has several limitations. First, it was a cross‐sectional study, and thus we cannot make any conclusions about causality. Although we adjusted for several potential confounders (eg, teaching status, advanced care capabilities, nurse staffing), it is possible that hospitalist care is a surrogate marker for features of hospitals that we could not measure but that directly influence patient experience. In addition, it is possible that patients cared for at hospitalist hospitals differ in unmeasured ways from patients cared for at other types of hospitals. Second, we constructed our primary predictor and outcome from different cohorts. Our primary predictor was derived from the proportion of general‐medicine patients cared for by hospitalists in Medicare claims data. In contrast, our primary outcome was based on HCAHPS responses from a random sampling of all hospital admissions. This misclassification likely would have biased us towards finding small or no associations. Therefore, we are likely underestimating the true association between hospitalist use and patient experience. Third, our findings may not be generalizable to hospitals that serve younger patients or have a large number of specialist hospitalists (who were not included in our definition of hospitalists). For example, compared with older patients with multiple comorbidities, relatively healthy younger patients may derive less benefit from an ever‐present hospitalist who can explain discharge plans or an attentive nurse.
In summary, we found that US hospitals varied widely in their use of hospitalist physicians, and those which a greater proportion of care was delivered by hospitalists generally had better scores on patient experience, especially on the global assessment of satisfaction and in discharge care. Our findings suggest that adoption of the hospitalist modelone of the strategies employed by US hospitals in the past 2 decades to provide efficient careshould not detract from achieving the goal of more patient‐centered care.
Disclosures
Dr. Chen's work is supported in part by the National Institutes of Health/National Institute on Aging (AG024824, University of Michigan Claude D. Pepper Older Americans Independence Center), and the National Institutes of Health/National Center for Research Resources (UL1‐RR024986, Michigan Institute for Clinical and Health Research). Dr. Chen is also supported by a Career Development Grant Award (K08HS020671) from the Agency for Healthcare Research and Quality.
- , , , . Growth in the care of older patients by hospitalists in the United States. N Engl J Med. 2009;360(11):1102–1112.
- , , . How do patients view the role of the primary care physician in inpatient care? Dis Mon. 2002;48(4):230–238.
- , , , et al. Effects of survey mode, patient mix, and nonresponse on CAHPS hospital survey scores. Health Serv Res. 2009;44(2 pt 1):501–518.
- , , , , . Development, implementation, and public reporting of the HCAHPS survey. Med Care Res Rev. 2010;67(1):27–37.
- , , , . Patients' perception of hospital care in the United States. N Engl J Med. 2008;359(18):1921–1931.
- Agency for Healthcare Research and Quality. Healthcare Cost and Utilization Project (HCUP). HCUP Comorbidity Software. http://www.hcup‐us.ahrq.gov/toolssoftware/comorbidity/comorbidity.jsp Accessed November 12, 2012.
- , , , . Comorbidity measures for use with administrative data. Med Care. 1998;36(1):8–27.
- , , . Physician views on caring for hospitalized patients and the hospitalist model of inpatient care. J Gen Intern Med. 2001;16(2):116–119.
- , , , . How physicians perceive hospitalist services after implementation: anticipation vs reality. Arch Intern Med. 2003;163(19):2330–2336.
- , , , et al. Association of communication between hospital‐based physicians and primary care providers with patient outcomes. J Gen Intern Med. 2009;24(3):381–386.
- , , . Passing the clinical baton: 6 principles to guide the hospitalist. Dis Mon. 2002;48(4):260–266.
- , , , . Primary care physician attitudes regarding communication with hospitalists. Am J Med. 2001;111(9B):15S–20S.
- , , , et al. Transitions of Care Consensus policy statement: American College of Physicians, Society of General Internal Medicine, Society of Hospital Medicine, American Geriatrics Society, American College Of Emergency Physicians, and Society for Academic Emergency Medicine. J Hosp Med. 2009;4(6):364–370.
- , , , et al. Hospital survey shows improvements in patient experience. Health Aff (Millwood). 2010;29(11):2061–2067.
- , , , , , . Characteristics of hospitals demonstrating superior performance in patient experience and clinical process measures of care. Med Care Res Rev. 2010;67(1):38–55.
- , . The impact of hospitalists on the cost and quality of inpatient care in the United States: a research synthesis. Med Care Res Rev. 2005;62(4):379–406.
- , , , , . Quality of care for patients hospitalized with heart failure: assessing the impact of hospitalists. Arch Intern Med. 2002;162(11):1251–1256.
- , , , , . Hospitalists and the quality of care in hospitals. Arch Intern Med. 2009;169(15):1389–1394.
- , , , et al. Quality of care for decompensated heart failure: comparable performance between academic hospitalists and non‐hospitalists. J Gen Intern Med. 2008;23(9):1399–1406.
- , , , et al. Patient satisfaction with hospital care provided by hospitalists and primary care physicians. J Hosp Med. 2012;7(2):131–136.
Copyright © 2012 Society of Hospital Medicine