User login
Spiral computed tomographic pulmonary angiography (CTPA) is a common first‐line test for the evaluation of suspected pulmonary embolism (PE). At our institution CTPA became the initial diagnostic study in 83% of patients with suspected PE within 3 years of the introduction of CT,1 and by 2001 CTPA had become the most common diagnostic test performed nationwide in patients diagnosed with PE.2 Most scans are interpreted as either positive or negative for pulmonary embolism, providing clinicians with a greater sense of diagnostic certainty than with the probabilistic results of lung scintigraphy. Initial studies of CTPA supported this appearance of diagnostic certainty, reporting sensitivity and specificity of greater than 90%,3, 4 but several subsequent studies have failed to reproduce these results.57 Newer multidetector CT scans are believed to be more accurate than earlier single‐detector CT,8 but true estimates of CTPA test characteristics will not be known until publication of the forthcoming PIOPED II study.9
Even without these data, CT‐based diagnostic algorithms have already appeared.1014 These algorithms generally focus on minimizing the false‐negative rate through use of serial testing (involving combinations of serum D‐dimer, lower‐extremity ultrasound, and CTPA). A recent meta‐analysis demonstrated that negative CTPA is highly accurate at ruling out PE, with test characteristics similar to conventional pulmonary angiography.15 Another meta‐analysis found that the 3‐month rate of subsequent venous thromboembolism after negative CTPA was 1.4% (95% CI 1.1%‐1.8%),16 supporting the strategy of withholding anticoagulants after negative CTPA in combination with other tests. However, use of serial testing to establish the diagnosis of PE and initiate anticoagulation has not been systematically evaluated or recommended, even for patients with a low pretest probability of PE.17
To assess the potential impact of these algorithms on the diagnosis of PE in clinical practice, we analyzed the clinical presentation and treatment of a cohort of patients at our institution who underwent CTPA for suspected PE.1 We calculated a range of posttest probabilities for pulmonary embolism for these patients, given the pretest probabilities, test results, and estimates of CTPA test characteristics. We then compared the treatment decisions of clinicians to the posttest probabilities of PE in order to establish the potential frequency of false‐positive and false‐negative diagnoses and to determine if patients were treated appropriately based on these estimates.
METHODS
Sites and Subjects
Details of the sites, subjects, and methods used to collect patient‐level data in this analysis have been previously published.1 The study was performed at Moffitt‐Long Hospital and San Francisco General Hospital, teaching hospitals affiliated with the University of California San Francisco School of Medicine. At both sites, single‐detector CT scans were available 24 hours a day throughout the study period and were read by attending radiologists who specialized in thoracic imaging. We excluded patients whose CTPA was not completed as the initial test in the evaluation of suspected PE, those who underwent testing for any indication other than suspected acute PE, and those with incomplete medical records or technically inadequate CTPA.
We randomly selected 345 patients who underwent CTPA between January 1, 1998, and December 31, 2000, from the Radiology Department databases. One investigator (R.L.T.) then abstracted charts of all patients. For each subject, we collected data about history and clinical presentation, diagnostic impressions of the treating clinicians, treatments administered both before and after diagnostic testing, CTPA result, results of other diagnostic tests for PE, and final clinical diagnosis. During the study period, there were no institution‐ or department‐specific guidelines or decision aids available for the diagnosis of PE. Ventilation‐perfusion scan, lower extremity ultrasound, and pulmonary angiography were available, but highly sensitive D‐dimer assays were not in use. The study was approved by the Institutional Review Boards of both sites, and requirement for written informed consent from patients was waived.
Estimates of Pretest Probabilities of Pulmonary Embolism and CTPA Test Characteristics
Several prediction rules1820 generate clinical pretest probabilities for patients with suspected PE. We used the Wells score18 to assign a pretest probability of low, moderate, or high to each patient on the basis of the following clinical variables: leg swelling, hemoptysis, tachycardia, history of recent immobilization, history of prior DVT or PE, active malignancy, and lack of a more likely alternative diagnosis. We chose this rule as (unlike other prediction rules such as the Geneva rule20) the Wells score has been validated for hospitalized patients with suspected PE and does not require arterial blood gas measurements. The prevalence of PE reported in the evaluation of the Wells score was 3.4%, 27.8%, and 78.3% for low, moderate, and high pretest probabilities, respectively.18
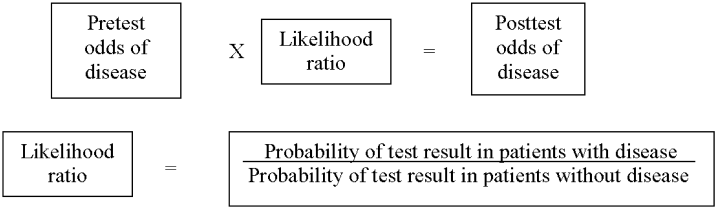
As in our previous study,1 we assumed CTPA to be 90% sensitive and 95% specific based on published estimates.3, 17 These values correspond to a positive likelihood ratio of 18 and a negative likelihood ratio of 0.1.21 We chose these values as a best‐case estimate of the test characteristics of CTPA, although other studies have found less impressive results.7 Using these pretest probabilities and likelihood ratios, we then used Bayes' theorem (Figure 1) to calculate the range of expected posttest probabilities of pulmonary embolism.
Calculation of Posttest Probabilities and Comparison to Treatment Outcomes
For each pretest probability category, we used the posttest probabilities calculated above to determine the number of true‐positive pulmonary emboli, as follows:
RESULTS
Patient Characteristics
After excluding 23 patients receiving anticoagulants for other indications prior to CTPA, the study cohort included 322 patients (57.7% female), with an average age of 58.6 years, of whom 20.5% had cancer and 4.5% had a prior history of thromboembolic disease. Scans were primarily ordered by the medicine service (47.7% of cases) and emergency department (22.9%). CTPA was the initial test for 9% of patients evaluated for suspected acute PE during the first 6 months of the study period, increasing to 83% by the end of 2000.1 The overall pretest probability distribution remained the same throughout the entire study period.1
Test Results and Treatment Decisions
Most patients in our cohort had a low (n = 184, 57.1%) or a moderate (n = 101, 31.4%) pretest probability of PE (Table 1). The likelihood of a positive CTPA increased as the pretest probability increased, but even among patients with high clinical risk, only 35.1% had positive CT scans. In total, scans were positive in 57 patients and negative in 265 patients. Clinicians treated 55 patients with a positive CTPA (96.5%); none of these patients underwent additional testing for DVT or PE after the imaging study. Among patients with a negative CTPA, 254 (95.8%) were not treated; none of the patients in whom anticoagulation was withheld underwent further testing, whereas the other 11 patients were treated on the basis of other tests (5 high‐probability ventilation‐perfusion scans, 3 positive leg ultrasounds, and 3 for unclear reasons). Overall, 66 patients (20.5%) were treated for pulmonary embolism.
| Pretest probability of PE (number of CTPA performed) | Low (N = 184) | Moderate (N = 101) | High (N = 37) | Total (N = 322) |
|---|---|---|---|---|
| ||||
| CTPA positive for PE (% of pretest probability group) | 22 (12.0%) | 22 (21.8%) | 13 (35.1%) | 57 (17.7%) |
| CTPA negative for PE (% of pretest probability group) | 162 (88.0%) | 79 (78.2%) | 24 (64.9%) | 265 (82.3%) |
| Patients with positive CT subsequently treated for PE (% of pretest probability group) | 21 (11.4%) | 21 (20.8%) | 13 (35.1%) | 55 (17.1%) |
| Patients treated for PE despite negative CT (% of pretest probability group) | 5 (2.7%) | 3 (3.0%) | 3 (8.1%) | 11 (3.4%) |
| Total patients treated for PE (% of pretest probability group) | 26 (14.1%) | 24 (23.8%) | 16 (43.2%) | 66 (20.5%) |
Literature‐Derived Estimates of Posttest Probabilities of Pulmonary Embolism
Patients who have a low pretest probability of PE and a positive CTPA have a posttest probability of 41.6% under our estimate of CTPA test characteristics. Patients with moderate pretest probability have a posttest probability of 87.4% and patients with a high pretest probability will have a 98.5% probability of embolism with a positive scan. The traditional treatment threshold for PE is a posttest probability of 90%.22
Observed Versus Expected PE Rates and Subsequent Treatment
Only 9 of the 22 patients (41%) with a low pretest probability and a positive CTPA likely represent true‐positive emboli. However, clinicians chose to treat 21 of the 22 patients with this combination of pretest probability and imaging findings. Thus, 12 emboli would be considered possible false‐positive diagnoses. Similarly, in the moderate pretest probability group, 2 of 21 patients with moderate pretest probability and 0 of 13 patients with high pretest probability treated for PE had a possibly false‐positive diagnosis. Thus, in total, 25.4% (14 of 55) patients treated for PE had a possible false‐positive diagnosis of pulmonary embolism and may have been unnecessarily administered anticoagulants (Table 2). All patients who potentially had a false‐positive PE had either a low or moderate pretest probability of PE; in fact, the majority (57.1%) of patients with a low pretest probability of PE who were subsequently treated for PE likely had a false‐positive diagnosis.
| Pretest probability | ||||
|---|---|---|---|---|
| Low (n = 184) | Moderate (n = 101) | High (n = 37) | Total (n = 322) | |
| ||||
| CTPA positive for PE (% of pretest probability group) | 22 (12.0%) | 22 (21.8%) | 13 (35.1%) | 57 (17.7%) |
| Patients with positive CTPA treated for pulmonary embolism (n, % treated in risk group) | 21 (95.4%) | 21 (95.4%) | 13 (100%) | 55 (96.5%) |
| Calculated number and rate of probable true‐positive evaluations | ||||
| Number of true‐positive PE (n, % treated in risk group) | 9 (42.9%) | 19 (90.5%) | 13 (100%) | 41 (74.6%) |
| Calculated number and rate of possible false‐positive evaluations | ||||
| Number of possible false‐positive PE (n, % in risk group with unexpected PE) | 12 (58.1%) | 2 (9.5%) | 0 | 14 (25.4%) |
Clinicians were more likely to overtreat a patient with a possible false‐positive CT scan than to withhold treatment from a patient with a possible false‐negative diagnosis. Using the same estimates of CTPA test characteristics, the incidence of possible false‐negative diagnosis of PE was 1.6% (4 possible false‐negative diagnoses among 254 patients with negative CTPA results who were not treated for PE.) All these patients had a high pretest probability of PE.
DISCUSSION
Physicians at our institution regarded CTPA results as definitive, anticoagulating 96.5% of patients with a positive CT and withholding treatment in 95.8% of patients with a negative scan. This practice pattern may result in unnecessary anticoagulation of many patients with a low pretest probability of PE who may have had false‐positive CTPA findings. In contrast, the rate of possible false‐negative diagnosis of PE was low, consistent with the results of several other studies.16
The use of CTPA is likely to increase because of the publication of multiple algorithms advocating that CTPA be the chief imaging study used in the diagnosis of PE.1014 These algorithms recommend serial testing on patients with a negative CTPA in order to minimize the false‐negative rate, but they do not require systematic follow‐up in patients with a positive scan, even if the pretest probability was low. In management trials, this approach resulted in a low false‐negative rate (1.0%‐1.8% at 3‐month follow‐up).1114 However, the rate of major bleeding in patients treated for PE was 3.2%‐6.0% at 3 months,1214 illustrating the potential risk of anticoagulating patients who may have false‐positive diagnoses. Furthermore, premature diagnostic closure after a CTPA positive for PE may result in additional morbidity as a result of missing the true diagnosis.
One potential explanation for the large number of potential false‐positive emboli seen in low‐risk patients is that it is difficult to accurately diagnose distal pulmonary emboli with CTPA. The interrater reliability of CTPA for diagnosis of subsegmental PE is suboptimal,23 and the clinical significance of these emboli remains uncertain.24 Thus, many emboli found in patients with low pretest probability actually may have been subsegmental PE that would not have been diagnosed by another radiologist. As CTPA is more accurate for diagnosing central PE,25 clinicians should consider reviewing positive scans with the interpreting radiologist, especially when the pretest probability was low and the filling defects identified are in distal vessels.
Our results may also illustrate that clinicians have a lower treatment threshold when presented with apparently definitive evidence of pulmonary embolism. Previous proposals on the appropriate treatment threshold for PE, which used Bayesian decision‐making methods similar to ours,22 incorporated PIOPED26 data on the pretest probability of pulmonary embolism, the test characteristics of ventilation‐perfusion scans, and the clinical outcomes of patients in each test result/pretest probability category. However, there is no corresponding data for CTPA, as its test characteristics are still uncertain, and long‐term clinical outcomes have not been documented for patients treated (or not treated) on the basis of CT results.
Our study had several limitations. First, charting bias potentially was introduced by our using a retrospective method of collecting data for calculating pretest probabilities. To address this potential bias, we collected data from the entire medical record, including information available at and preceding the time of the CT scan. We believe this method was effective, as the range of pretest probabilities and the prevalence of PE in our study were very similar to those seen in a number of prospective studies.1820, 26, 27 Although other risk indices exist, the Wells score has been shown to have predictive powers equal to other algorithms and to clinicians; implicit assessments.28, 29 In our cohort, 35.1% of patients with a high pretest probability were diagnosed with PE; although this was lower than that in the initial Wells cohort,18 it was very similar to a subsequent validation study using the Wells algorithm, in which the prevalence of PE in patients with high pretest probability was 37.5%.27 Plasma D‐dimer testing is not routinely used at our hospitals, but it is a component of some CTPA‐based diagnostic algorithms.1114 Although use of D‐dimer testing may have led to fewer scans in patients with negative D‐dimer test results and low pretest probability,30 the high false‐positive rate for D‐dimer assays31 makes it difficult to predict the effect of widespread D‐dimer use on the overall pretest probability distribution. Using our assumptions about CT test characteristics, a pretest probability of more than 30% is required to generate a posttest probability of PE of at least 90% (the traditional treatment threshold for anticoagulant therapy22) with a positive scan. Extensive D‐dimer use would be unlikely to cause such a shift in the distribution of pretest probabilities.
Finally, CT technology has continued to advance, and many institutions now use 64‐slice scanners32 in contrast to the single‐slice scanners in use at the time our data were collected. Our assumptions were that CTPA has a positive likelihood ratio of 18.0 and a negative likelihood ratio of 0.1 (corresponding to a sensitivity of 90% and a specificity of 95%), although many studies of single‐detector CTPA found less impressive values.5, 7 Multidetector CT is thought to be more accurate than was earlier technology, but the true diagnostic performance of multidetector CT is not yet known. However, our findings pertain primarily to clinicians' responses to test results, so even if newer scanners are more accurate, Bayesian analysis will still be required in order to appropriately treat patients. A recent meta‐analysis of diagnostic strategies for PE found CTPA to have a positive likelihood ratio of 24.1, but even using this higher value, patients with a low pretest probability and positive CTPA still have a posttest probability of PE below the traditional treatment threshold.33 As most patients undergoing evaluation for suspected PE have a low pretest probability,17 a substantial number of false‐positive diagnoses of PE may still occur, even with a more accurate diagnostic test.
CT pulmonary angiography has become the first‐line test for pulmonary embolism at our institution, a situation likely mirrored elsewhere. CTPA is safe and rapid and offers the advantage of revealing ancillary lung findings that may be clinically significant.12 Although the test is an important addition to a clinician's diagnostic armamentarium, Bayesian analysis must be used to interpret its results, especially when CTPA is used as the first‐line diagnostic test. Our data raise the troubling concern that reliance on CTPA as the sole diagnostic test for suspected pulmonary embolism may result in a large number of patients with false‐positive CT scans receiving anticoagulation treatment.
- ,,,,.The impact of helical computed tomography on diagnostic and treatment strategies in patients with suspected pulmonary embolism.Am J Med.2004;116:84–90.
- ,,.Trends in the use of diagnostic imaging in patients hospitalized with acute pulmonary embolism.Am J Cardiol.2004;93:1316–1317.
- ,,,.Central pulmonary thromboembolism: diagnosis with spiral volumetric CT with the single‐breath‐old technique—comparison with pulmonary angiography.Radiology.1992;185:381–387.
- ,,, et al.Pulmonary embolism: validation of spiral CT angiography in 149 patients.Radiology.1996;201:467–470.
- ,,,,.Lung scintigraphy and helical computed tomography for the diagnosis of pulmonary embolism: a meta‐analysis.Clin Appl Thromb Hemost.2001;7(2):87–92.
- ,,,.The role of spiral volumetric computed tomography in the diagnosis of pulmonary embolism.Arch Intern Med.2000;160(3):293–298.
- ,,.Sensitivity and specificity of helical computed tomography in the diagnosis of pulmonary embolism: a systematic review.Ann Intern Med.2000;132(3):227–232.
- ,,, et al.Suspected acute pulmonary embolism: evaluation with multi‐detector row CT versus digital subtraction pulmonary arteriography.Radiology.2004;233:806–815.
- ,,,.Overview of Prospective Investigation of Pulmonary Embolism Diagnosis II.Semin Nucl Med.2002;32(3):173–182.
- ,,, et al.Management of suspected pulmonary embolism (PE) by D‐dimer and multi‐slice computed tomography in outpatients: an outcome study.J Thromb Haemost.2005;3:1926–1932.
- ,,, et al.Multidetector‐row computed tomography in suspected pulmonary embolism.N Engl J Med.2005;352:1760–1768.
- ,,, et al.Single‐detector helical computed tomography as the primary diagnostic test in suspected pulmonary embolism: a multicenter clinical management study of 510 patients.Ann Intern Med.2003;138:307–314.
- ,,, et al.Diagnostic strategy for patients with suspected pulmonary embolism: a prospective multicentre outcome study.Lancet.2002;260:1914–1920.
- ,,, et al.Diagnosing pulmonary embolism in outpatients with clinical assessment, D‐dimer measurement, venous ultrasound, and helical computed tomography: a multicenter management study.Am J Med.2004;116:291–299.
- ,,, et al.Clinical validity of a negative computed tomography scan in patients with suspected pulmonary embolism: a systematic review.JAMA.2005;293:2012–2017.
- ,,,.Meta‐analysis: outcomes in patients with suspected pulmonary embolism managed with computed tomographic pulmonary angiography.Ann Intern Med.2004;141:866–874.
- ,.Clinical Practice: The evaluation of suspected pulmonary embolism.N Engl J Med.2003;349:1247–1256.
- ,,, et al.Use of a clinical model for safe management of patients with suspected pulmonary embolism.Ann Intern Med.1998;129:997–1005.
- ,,.A structured clinical model for predicting the probability of pulmonary embolism.Am J Med.2003;114(3):173–179.
- ,,,,.Assessing clinical probability of pulmonary embolism in the emergency ward: a simple score.Arch Intern Med.2001;161(1):92–97.
- ,,,.Interpretation of diagnostic tests and strategies for their use in quantitative decision making. In:Diagnostic strategies for common medical problems.Philadelphia, PA:American College of Physicians,1999.
- ,,,.Strategy for diagnosis of patients with suspected acute pulmonary embolism.Chest.1993;103:1553–1559.
- ,,, et al.Prospective comparison of helical CT with angiography in pulmonary embolism: global and selective vascular territory analysis. Interobserver agreement.Eur Radiol.2003;13:823–829.
- ,.Prevalence of acute pulmonary embolism among patients in a general hospital and at autopsy.Chest.1995;108:978–981.
- ,,, et al.Performance of helical computed tomography in unselected outpatients with suspected pulmonary embolism.Ann Intern Med.2001;135(2):88–97.
- Value of the ventilation/perfusion scan in acute pulmonary embolism. Results of the prospective investigation of pulmonary embolism diagnosis (PIOPED).The PIOPED Investigators.JAMA.1990;263:2753–2759.
- ,,, et al.Excluding pulmonary embolism at the bedside without diagnostic imaging: management of patients with suspected pulmonary embolism presenting to the emergency department by using a simple clinical model and d‐dimer.Ann Intern Med.2001;135(2):98–107.
- ,,, et al.Comparison of two clinical prediction rules and implicit assessment among patients with suspected pulmonary embolism.Am J Med.2002;113(4):269–275.
- ,,, et al.Does this patient have pulmonary embolism?JAMA.2003;290:2849–2858.
- ,,,,.Diagnostic strategies for excluding pulmonary embolism in clinical outcome studies. A systematic review.Ann Intern Med.2003;138:941–951.
- ,,, et al.D‐dimer for the exclusion of acute venous thrombosis and pulmonary embolism: a systematic review.Ann Intern Med.2004;140:589–602.
- .Multislice computed tomography for pulmonary embolism—a technological marvel.N Engl J Med2005;352(17):1812–4.
- ,,,,,.Systematic review and meta‐analysis of strategies for the diagnosis of suspected pulmonary embolism.Br Med J.2005;331:259.
Spiral computed tomographic pulmonary angiography (CTPA) is a common first‐line test for the evaluation of suspected pulmonary embolism (PE). At our institution CTPA became the initial diagnostic study in 83% of patients with suspected PE within 3 years of the introduction of CT,1 and by 2001 CTPA had become the most common diagnostic test performed nationwide in patients diagnosed with PE.2 Most scans are interpreted as either positive or negative for pulmonary embolism, providing clinicians with a greater sense of diagnostic certainty than with the probabilistic results of lung scintigraphy. Initial studies of CTPA supported this appearance of diagnostic certainty, reporting sensitivity and specificity of greater than 90%,3, 4 but several subsequent studies have failed to reproduce these results.57 Newer multidetector CT scans are believed to be more accurate than earlier single‐detector CT,8 but true estimates of CTPA test characteristics will not be known until publication of the forthcoming PIOPED II study.9
Even without these data, CT‐based diagnostic algorithms have already appeared.1014 These algorithms generally focus on minimizing the false‐negative rate through use of serial testing (involving combinations of serum D‐dimer, lower‐extremity ultrasound, and CTPA). A recent meta‐analysis demonstrated that negative CTPA is highly accurate at ruling out PE, with test characteristics similar to conventional pulmonary angiography.15 Another meta‐analysis found that the 3‐month rate of subsequent venous thromboembolism after negative CTPA was 1.4% (95% CI 1.1%‐1.8%),16 supporting the strategy of withholding anticoagulants after negative CTPA in combination with other tests. However, use of serial testing to establish the diagnosis of PE and initiate anticoagulation has not been systematically evaluated or recommended, even for patients with a low pretest probability of PE.17
To assess the potential impact of these algorithms on the diagnosis of PE in clinical practice, we analyzed the clinical presentation and treatment of a cohort of patients at our institution who underwent CTPA for suspected PE.1 We calculated a range of posttest probabilities for pulmonary embolism for these patients, given the pretest probabilities, test results, and estimates of CTPA test characteristics. We then compared the treatment decisions of clinicians to the posttest probabilities of PE in order to establish the potential frequency of false‐positive and false‐negative diagnoses and to determine if patients were treated appropriately based on these estimates.
METHODS
Sites and Subjects
Details of the sites, subjects, and methods used to collect patient‐level data in this analysis have been previously published.1 The study was performed at Moffitt‐Long Hospital and San Francisco General Hospital, teaching hospitals affiliated with the University of California San Francisco School of Medicine. At both sites, single‐detector CT scans were available 24 hours a day throughout the study period and were read by attending radiologists who specialized in thoracic imaging. We excluded patients whose CTPA was not completed as the initial test in the evaluation of suspected PE, those who underwent testing for any indication other than suspected acute PE, and those with incomplete medical records or technically inadequate CTPA.
We randomly selected 345 patients who underwent CTPA between January 1, 1998, and December 31, 2000, from the Radiology Department databases. One investigator (R.L.T.) then abstracted charts of all patients. For each subject, we collected data about history and clinical presentation, diagnostic impressions of the treating clinicians, treatments administered both before and after diagnostic testing, CTPA result, results of other diagnostic tests for PE, and final clinical diagnosis. During the study period, there were no institution‐ or department‐specific guidelines or decision aids available for the diagnosis of PE. Ventilation‐perfusion scan, lower extremity ultrasound, and pulmonary angiography were available, but highly sensitive D‐dimer assays were not in use. The study was approved by the Institutional Review Boards of both sites, and requirement for written informed consent from patients was waived.
Estimates of Pretest Probabilities of Pulmonary Embolism and CTPA Test Characteristics
Several prediction rules1820 generate clinical pretest probabilities for patients with suspected PE. We used the Wells score18 to assign a pretest probability of low, moderate, or high to each patient on the basis of the following clinical variables: leg swelling, hemoptysis, tachycardia, history of recent immobilization, history of prior DVT or PE, active malignancy, and lack of a more likely alternative diagnosis. We chose this rule as (unlike other prediction rules such as the Geneva rule20) the Wells score has been validated for hospitalized patients with suspected PE and does not require arterial blood gas measurements. The prevalence of PE reported in the evaluation of the Wells score was 3.4%, 27.8%, and 78.3% for low, moderate, and high pretest probabilities, respectively.18
As in our previous study,1 we assumed CTPA to be 90% sensitive and 95% specific based on published estimates.3, 17 These values correspond to a positive likelihood ratio of 18 and a negative likelihood ratio of 0.1.21 We chose these values as a best‐case estimate of the test characteristics of CTPA, although other studies have found less impressive results.7 Using these pretest probabilities and likelihood ratios, we then used Bayes' theorem (Figure 1) to calculate the range of expected posttest probabilities of pulmonary embolism.
Calculation of Posttest Probabilities and Comparison to Treatment Outcomes
For each pretest probability category, we used the posttest probabilities calculated above to determine the number of true‐positive pulmonary emboli, as follows:
RESULTS
Patient Characteristics
After excluding 23 patients receiving anticoagulants for other indications prior to CTPA, the study cohort included 322 patients (57.7% female), with an average age of 58.6 years, of whom 20.5% had cancer and 4.5% had a prior history of thromboembolic disease. Scans were primarily ordered by the medicine service (47.7% of cases) and emergency department (22.9%). CTPA was the initial test for 9% of patients evaluated for suspected acute PE during the first 6 months of the study period, increasing to 83% by the end of 2000.1 The overall pretest probability distribution remained the same throughout the entire study period.1
Test Results and Treatment Decisions
Most patients in our cohort had a low (n = 184, 57.1%) or a moderate (n = 101, 31.4%) pretest probability of PE (Table 1). The likelihood of a positive CTPA increased as the pretest probability increased, but even among patients with high clinical risk, only 35.1% had positive CT scans. In total, scans were positive in 57 patients and negative in 265 patients. Clinicians treated 55 patients with a positive CTPA (96.5%); none of these patients underwent additional testing for DVT or PE after the imaging study. Among patients with a negative CTPA, 254 (95.8%) were not treated; none of the patients in whom anticoagulation was withheld underwent further testing, whereas the other 11 patients were treated on the basis of other tests (5 high‐probability ventilation‐perfusion scans, 3 positive leg ultrasounds, and 3 for unclear reasons). Overall, 66 patients (20.5%) were treated for pulmonary embolism.
| Pretest probability of PE (number of CTPA performed) | Low (N = 184) | Moderate (N = 101) | High (N = 37) | Total (N = 322) |
|---|---|---|---|---|
| ||||
| CTPA positive for PE (% of pretest probability group) | 22 (12.0%) | 22 (21.8%) | 13 (35.1%) | 57 (17.7%) |
| CTPA negative for PE (% of pretest probability group) | 162 (88.0%) | 79 (78.2%) | 24 (64.9%) | 265 (82.3%) |
| Patients with positive CT subsequently treated for PE (% of pretest probability group) | 21 (11.4%) | 21 (20.8%) | 13 (35.1%) | 55 (17.1%) |
| Patients treated for PE despite negative CT (% of pretest probability group) | 5 (2.7%) | 3 (3.0%) | 3 (8.1%) | 11 (3.4%) |
| Total patients treated for PE (% of pretest probability group) | 26 (14.1%) | 24 (23.8%) | 16 (43.2%) | 66 (20.5%) |
Literature‐Derived Estimates of Posttest Probabilities of Pulmonary Embolism
Patients who have a low pretest probability of PE and a positive CTPA have a posttest probability of 41.6% under our estimate of CTPA test characteristics. Patients with moderate pretest probability have a posttest probability of 87.4% and patients with a high pretest probability will have a 98.5% probability of embolism with a positive scan. The traditional treatment threshold for PE is a posttest probability of 90%.22
Observed Versus Expected PE Rates and Subsequent Treatment
Only 9 of the 22 patients (41%) with a low pretest probability and a positive CTPA likely represent true‐positive emboli. However, clinicians chose to treat 21 of the 22 patients with this combination of pretest probability and imaging findings. Thus, 12 emboli would be considered possible false‐positive diagnoses. Similarly, in the moderate pretest probability group, 2 of 21 patients with moderate pretest probability and 0 of 13 patients with high pretest probability treated for PE had a possibly false‐positive diagnosis. Thus, in total, 25.4% (14 of 55) patients treated for PE had a possible false‐positive diagnosis of pulmonary embolism and may have been unnecessarily administered anticoagulants (Table 2). All patients who potentially had a false‐positive PE had either a low or moderate pretest probability of PE; in fact, the majority (57.1%) of patients with a low pretest probability of PE who were subsequently treated for PE likely had a false‐positive diagnosis.
| Pretest probability | ||||
|---|---|---|---|---|
| Low (n = 184) | Moderate (n = 101) | High (n = 37) | Total (n = 322) | |
| ||||
| CTPA positive for PE (% of pretest probability group) | 22 (12.0%) | 22 (21.8%) | 13 (35.1%) | 57 (17.7%) |
| Patients with positive CTPA treated for pulmonary embolism (n, % treated in risk group) | 21 (95.4%) | 21 (95.4%) | 13 (100%) | 55 (96.5%) |
| Calculated number and rate of probable true‐positive evaluations | ||||
| Number of true‐positive PE (n, % treated in risk group) | 9 (42.9%) | 19 (90.5%) | 13 (100%) | 41 (74.6%) |
| Calculated number and rate of possible false‐positive evaluations | ||||
| Number of possible false‐positive PE (n, % in risk group with unexpected PE) | 12 (58.1%) | 2 (9.5%) | 0 | 14 (25.4%) |
Clinicians were more likely to overtreat a patient with a possible false‐positive CT scan than to withhold treatment from a patient with a possible false‐negative diagnosis. Using the same estimates of CTPA test characteristics, the incidence of possible false‐negative diagnosis of PE was 1.6% (4 possible false‐negative diagnoses among 254 patients with negative CTPA results who were not treated for PE.) All these patients had a high pretest probability of PE.
DISCUSSION
Physicians at our institution regarded CTPA results as definitive, anticoagulating 96.5% of patients with a positive CT and withholding treatment in 95.8% of patients with a negative scan. This practice pattern may result in unnecessary anticoagulation of many patients with a low pretest probability of PE who may have had false‐positive CTPA findings. In contrast, the rate of possible false‐negative diagnosis of PE was low, consistent with the results of several other studies.16
The use of CTPA is likely to increase because of the publication of multiple algorithms advocating that CTPA be the chief imaging study used in the diagnosis of PE.1014 These algorithms recommend serial testing on patients with a negative CTPA in order to minimize the false‐negative rate, but they do not require systematic follow‐up in patients with a positive scan, even if the pretest probability was low. In management trials, this approach resulted in a low false‐negative rate (1.0%‐1.8% at 3‐month follow‐up).1114 However, the rate of major bleeding in patients treated for PE was 3.2%‐6.0% at 3 months,1214 illustrating the potential risk of anticoagulating patients who may have false‐positive diagnoses. Furthermore, premature diagnostic closure after a CTPA positive for PE may result in additional morbidity as a result of missing the true diagnosis.
One potential explanation for the large number of potential false‐positive emboli seen in low‐risk patients is that it is difficult to accurately diagnose distal pulmonary emboli with CTPA. The interrater reliability of CTPA for diagnosis of subsegmental PE is suboptimal,23 and the clinical significance of these emboli remains uncertain.24 Thus, many emboli found in patients with low pretest probability actually may have been subsegmental PE that would not have been diagnosed by another radiologist. As CTPA is more accurate for diagnosing central PE,25 clinicians should consider reviewing positive scans with the interpreting radiologist, especially when the pretest probability was low and the filling defects identified are in distal vessels.
Our results may also illustrate that clinicians have a lower treatment threshold when presented with apparently definitive evidence of pulmonary embolism. Previous proposals on the appropriate treatment threshold for PE, which used Bayesian decision‐making methods similar to ours,22 incorporated PIOPED26 data on the pretest probability of pulmonary embolism, the test characteristics of ventilation‐perfusion scans, and the clinical outcomes of patients in each test result/pretest probability category. However, there is no corresponding data for CTPA, as its test characteristics are still uncertain, and long‐term clinical outcomes have not been documented for patients treated (or not treated) on the basis of CT results.
Our study had several limitations. First, charting bias potentially was introduced by our using a retrospective method of collecting data for calculating pretest probabilities. To address this potential bias, we collected data from the entire medical record, including information available at and preceding the time of the CT scan. We believe this method was effective, as the range of pretest probabilities and the prevalence of PE in our study were very similar to those seen in a number of prospective studies.1820, 26, 27 Although other risk indices exist, the Wells score has been shown to have predictive powers equal to other algorithms and to clinicians; implicit assessments.28, 29 In our cohort, 35.1% of patients with a high pretest probability were diagnosed with PE; although this was lower than that in the initial Wells cohort,18 it was very similar to a subsequent validation study using the Wells algorithm, in which the prevalence of PE in patients with high pretest probability was 37.5%.27 Plasma D‐dimer testing is not routinely used at our hospitals, but it is a component of some CTPA‐based diagnostic algorithms.1114 Although use of D‐dimer testing may have led to fewer scans in patients with negative D‐dimer test results and low pretest probability,30 the high false‐positive rate for D‐dimer assays31 makes it difficult to predict the effect of widespread D‐dimer use on the overall pretest probability distribution. Using our assumptions about CT test characteristics, a pretest probability of more than 30% is required to generate a posttest probability of PE of at least 90% (the traditional treatment threshold for anticoagulant therapy22) with a positive scan. Extensive D‐dimer use would be unlikely to cause such a shift in the distribution of pretest probabilities.
Finally, CT technology has continued to advance, and many institutions now use 64‐slice scanners32 in contrast to the single‐slice scanners in use at the time our data were collected. Our assumptions were that CTPA has a positive likelihood ratio of 18.0 and a negative likelihood ratio of 0.1 (corresponding to a sensitivity of 90% and a specificity of 95%), although many studies of single‐detector CTPA found less impressive values.5, 7 Multidetector CT is thought to be more accurate than was earlier technology, but the true diagnostic performance of multidetector CT is not yet known. However, our findings pertain primarily to clinicians' responses to test results, so even if newer scanners are more accurate, Bayesian analysis will still be required in order to appropriately treat patients. A recent meta‐analysis of diagnostic strategies for PE found CTPA to have a positive likelihood ratio of 24.1, but even using this higher value, patients with a low pretest probability and positive CTPA still have a posttest probability of PE below the traditional treatment threshold.33 As most patients undergoing evaluation for suspected PE have a low pretest probability,17 a substantial number of false‐positive diagnoses of PE may still occur, even with a more accurate diagnostic test.
CT pulmonary angiography has become the first‐line test for pulmonary embolism at our institution, a situation likely mirrored elsewhere. CTPA is safe and rapid and offers the advantage of revealing ancillary lung findings that may be clinically significant.12 Although the test is an important addition to a clinician's diagnostic armamentarium, Bayesian analysis must be used to interpret its results, especially when CTPA is used as the first‐line diagnostic test. Our data raise the troubling concern that reliance on CTPA as the sole diagnostic test for suspected pulmonary embolism may result in a large number of patients with false‐positive CT scans receiving anticoagulation treatment.
- ,,,,.The impact of helical computed tomography on diagnostic and treatment strategies in patients with suspected pulmonary embolism.Am J Med.2004;116:84–90.
- ,,.Trends in the use of diagnostic imaging in patients hospitalized with acute pulmonary embolism.Am J Cardiol.2004;93:1316–1317.
- ,,,.Central pulmonary thromboembolism: diagnosis with spiral volumetric CT with the single‐breath‐old technique—comparison with pulmonary angiography.Radiology.1992;185:381–387.
- ,,, et al.Pulmonary embolism: validation of spiral CT angiography in 149 patients.Radiology.1996;201:467–470.
- ,,,,.Lung scintigraphy and helical computed tomography for the diagnosis of pulmonary embolism: a meta‐analysis.Clin Appl Thromb Hemost.2001;7(2):87–92.
- ,,,.The role of spiral volumetric computed tomography in the diagnosis of pulmonary embolism.Arch Intern Med.2000;160(3):293–298.
- ,,.Sensitivity and specificity of helical computed tomography in the diagnosis of pulmonary embolism: a systematic review.Ann Intern Med.2000;132(3):227–232.
- ,,, et al.Suspected acute pulmonary embolism: evaluation with multi‐detector row CT versus digital subtraction pulmonary arteriography.Radiology.2004;233:806–815.
- ,,,.Overview of Prospective Investigation of Pulmonary Embolism Diagnosis II.Semin Nucl Med.2002;32(3):173–182.
- ,,, et al.Management of suspected pulmonary embolism (PE) by D‐dimer and multi‐slice computed tomography in outpatients: an outcome study.J Thromb Haemost.2005;3:1926–1932.
- ,,, et al.Multidetector‐row computed tomography in suspected pulmonary embolism.N Engl J Med.2005;352:1760–1768.
- ,,, et al.Single‐detector helical computed tomography as the primary diagnostic test in suspected pulmonary embolism: a multicenter clinical management study of 510 patients.Ann Intern Med.2003;138:307–314.
- ,,, et al.Diagnostic strategy for patients with suspected pulmonary embolism: a prospective multicentre outcome study.Lancet.2002;260:1914–1920.
- ,,, et al.Diagnosing pulmonary embolism in outpatients with clinical assessment, D‐dimer measurement, venous ultrasound, and helical computed tomography: a multicenter management study.Am J Med.2004;116:291–299.
- ,,, et al.Clinical validity of a negative computed tomography scan in patients with suspected pulmonary embolism: a systematic review.JAMA.2005;293:2012–2017.
- ,,,.Meta‐analysis: outcomes in patients with suspected pulmonary embolism managed with computed tomographic pulmonary angiography.Ann Intern Med.2004;141:866–874.
- ,.Clinical Practice: The evaluation of suspected pulmonary embolism.N Engl J Med.2003;349:1247–1256.
- ,,, et al.Use of a clinical model for safe management of patients with suspected pulmonary embolism.Ann Intern Med.1998;129:997–1005.
- ,,.A structured clinical model for predicting the probability of pulmonary embolism.Am J Med.2003;114(3):173–179.
- ,,,,.Assessing clinical probability of pulmonary embolism in the emergency ward: a simple score.Arch Intern Med.2001;161(1):92–97.
- ,,,.Interpretation of diagnostic tests and strategies for their use in quantitative decision making. In:Diagnostic strategies for common medical problems.Philadelphia, PA:American College of Physicians,1999.
- ,,,.Strategy for diagnosis of patients with suspected acute pulmonary embolism.Chest.1993;103:1553–1559.
- ,,, et al.Prospective comparison of helical CT with angiography in pulmonary embolism: global and selective vascular territory analysis. Interobserver agreement.Eur Radiol.2003;13:823–829.
- ,.Prevalence of acute pulmonary embolism among patients in a general hospital and at autopsy.Chest.1995;108:978–981.
- ,,, et al.Performance of helical computed tomography in unselected outpatients with suspected pulmonary embolism.Ann Intern Med.2001;135(2):88–97.
- Value of the ventilation/perfusion scan in acute pulmonary embolism. Results of the prospective investigation of pulmonary embolism diagnosis (PIOPED).The PIOPED Investigators.JAMA.1990;263:2753–2759.
- ,,, et al.Excluding pulmonary embolism at the bedside without diagnostic imaging: management of patients with suspected pulmonary embolism presenting to the emergency department by using a simple clinical model and d‐dimer.Ann Intern Med.2001;135(2):98–107.
- ,,, et al.Comparison of two clinical prediction rules and implicit assessment among patients with suspected pulmonary embolism.Am J Med.2002;113(4):269–275.
- ,,, et al.Does this patient have pulmonary embolism?JAMA.2003;290:2849–2858.
- ,,,,.Diagnostic strategies for excluding pulmonary embolism in clinical outcome studies. A systematic review.Ann Intern Med.2003;138:941–951.
- ,,, et al.D‐dimer for the exclusion of acute venous thrombosis and pulmonary embolism: a systematic review.Ann Intern Med.2004;140:589–602.
- .Multislice computed tomography for pulmonary embolism—a technological marvel.N Engl J Med2005;352(17):1812–4.
- ,,,,,.Systematic review and meta‐analysis of strategies for the diagnosis of suspected pulmonary embolism.Br Med J.2005;331:259.
Copyright © 2006 Society of Hospital Medicine
