User login
Healthcare costs continue to increase and are estimated to be approximately $3.1 trillion per year in the United States.[1] Waste is a major contributor to this cost, accounting for an estimated $910 billion/year.[2] Laboratory tests are well documented to contribute to healthcare waste, with an estimated 30% to 50% of tests for hospitalized patients being unnecessary.[3, 4, 5] This issue has been highlighted by the American Board of Internal Medicine Foundation's Choosing Wisely campaign as an area to reduce waste.[6] Evaluating this concern locally, a University Health Systems Consortium 2011 analysis indicated that the University of Utah general internal medicine hospitalist service had a higher average direct lab cost per discharge compared to top performers, indicating an opportunity for improvement.
Multiple interventions have been described in the literature to address excessive laboratory utilization, including physician education, audit and feedback, cost information display, and administrative rules restricting certain types of ordering.[7, 8, 9, 10, 11] Despite these interventions, barriers remain common and not all interventions are sustained. For example, interventions focused mainly on education see a small improvement initially that is not sustained.[4, 12, 13] Additionally, although most studies focus on individual interventions, those that target multiple factors have been found to be more successful at producing and sustaining change.[14] Therefore, the opportunity existed to incorporate multiple etiologies into a single intervention and apply a checklist to laboratory ordering to see if combined modalities could be effective at reducing laboratory costs in a sustainable manner.
In addition to cost, there is potential patient harm resulting from unnecessary laboratory testing. For prolonged hospitalizations, anemia is a well‐recognized side effect of phlebotomy,[15, 16] and a recent evaluation of cardiac surgery patients found an average cumulative blood loss due to phlebotomy of 454 mL/hospital stay.[17] The sheer number of tests ordered can lead to false positive tests that result in additional testing and monitoring. Furthermore, patients subjected to laboratory blood draws are often awakened early in the morning, which is unpleasant and could adversely affect the patient experience.
Recognizing laboratory cost as a problem, the University of Utah general internal medicine hospitalist service implemented a multifaceted quality‐improvement initiative with a goal to reduce laboratory testing. At the time of this project, University of Utah Health Care (UUHC) developed a Value Driven Outcomes (VDO) tool to give direct data related to costs of care, including the actual cost paid by the hospital to the university‐owned laboratory vendor (ARUP Laboratories, Salt Lake City, UT) for testing.[18] The hospitalist group incorporated VDO into the initiative for routine cost feedback. This study evaluates the impact of this intervention on laboratory costs.
METHODS
Design
A retrospective, controlled, interrupted time series (ITS) study was performed to compare changes in lab costs between hospitalists (intervention study group) and other providers (control study group). The intervention initiation date was February 1, 2013. The baseline period was July 1, 2012 to January 31, 2013, as that was the period in which the VDO tool became available for cost analysis prior to intervention. The intervention period was February 1, 2013 to April 30, 2014, as there was a change in the electronic health record (EHR) in May 2014 that affected data flow and could act as a major confounder. The institutional review board classified this project as quality improvement and did not require review and oversight.
Setting
UUHC is a 500‐bed academic medical center in Salt Lake City, Utah. The hospitalist service is a teaching service composed of 4 teams with internal medicine residents and medical students. The nonhospitalist services include all surgical services, as well as pulmonary, cardiology, hematology, and oncology services on which internal medicine residents rotate. All services at UUHC are staffed by academic physicians affiliated with the University of Utah School of Medicine.
Population
All patients 18 years and older admitted to the hospital to a service other than obstetrics, rehabilitation, or psychiatry between July 1, 2012 and April 30, 2014 were evaluated. Patients with missing data for outcomes or covariates were excluded.
Intervention
Initial evaluation included an informal review of patient charts and discussion with hospitalist group members, both indicating laboratory overuse. A working group was then established including hospitalists and process engineers to evaluate the workflow by which laboratory tests were ordered. Concurrently, a literature review was performed to help identify the scope of the problem and evaluate methods that had been successful at other institutions. Through this review, it was noted that interns were the most frequent orderers of tests and the largest contributors to variation of testing for inpatients.[19] Two specific studies with direct applicability to this project demonstrated that discussion of costs with attendings in a trauma intensive care unit resulted in a 30% reduction of tests ordered,[20] and discussion of testing with a senior resident in an internal medicine inpatient setting demonstrated a 20% reduction in laboratory testing.[21]
Our laboratory reduction intervention expanded on the current literature to incorporate education, process change, cost feedback, and financial incentives. Specifically, starting February 1, 2013, the following interventions were performed:
- Education of all providers involved, including the hospitalist group and all internal medicine residents at the start of their rotation with the hospitalist service. Education included a 30‐minute discussion of laboratory overuse, costs associated with laboratory overuse, previous interventions and their success, and current intervention with goals. Each resident was provided a pocket card with the most common lab tests and associated charges. Charges were used instead of costs due to concerns regarding the possible public dissemination of institutional costs.
- Standardization of the rounding process including a checklist review (see Supporting Information, Appendix, in the online version of this article) for all patients that ensured discussion of labs, telemetry, pain, lines/tubes, nursing presence, and follow‐up needed. The expectation was that all plans for lab testing would be discussed during rounds. The third‐year medical student was responsible to ensure that all items were covered daily on each patient.
- Monthly feedback at the hospitalist group meeting regarding laboratory costs using the VDO tool. Data were presented as a monthly group average and compared to preintervention baseline costs. Individual performance could be viewed and compared to other providers within the group.
- Financial incentive through a program that shares 50% of cost savings realized by the hospital with the Division of General Internal Medicine. The incentive could be used to support future quality‐improvement projects, but there was no individual physician incentive.
Data Collection and Preparation
Clinical data were collected in the inpatient EHR (Cerner Corp., Kansas City, MO) and later imported into the enterprise data warehouse (EDW) as part of the normal data flow. Billing data were imported into the EDW from the billing system. Cost data were estimated using the VDO tool developed by the University of Utah to identify clinical costs to the UUHC system.[18]
Clinical and Cost Outcomes
We hypothesized that following the intervention, the number of tests and lab costs would decrease greater for patients in the intervention group than in the control group, with no adverse effect on length of stay (LOS) or 30‐day readmissions.
Lab cost per day was calculated as the total lab cost per visit divided by the LOS. We adjusted all lab costs to 2013 US dollars using Consumer Price Index inflation data.[22] To account for different LOS, we used LOS as a weight variable when estimating descriptive characteristics and P values for lab cost per day and the number of tests. Thirty‐day readmissions included inpatient encounters followed by another inpatient encounter within 30 days excluding obstetrics, rehabilitation, and psychiatry visits.
Descriptive Variables
We included information on age at admission in years and Charlson Comorbidity Index (CCI) to evaluate differences in control and intervention groups.[23]
Statistical Analysis
First, unadjusted descriptive statistics were calculated for study outcomes and visit characteristics. Descriptive statistics were expressed as n (%) and mean standard deviation. Simple comparisons were performed based on 2 tests of homogeneity for categorical variables and on t tests for continuous variables.
Second, an ITS analysis was conducted to evaluate the impact of the intervention while accounting for baseline trends.[24] In this analysis, the dependent variable (yt) was the difference in aggregated outcome measures between the intervention and control groups every 2 weeks (eg, difference in average lab costs in a given 2‐week period between the 2 groups). Intervention impact was then evaluated in terms of changes in the level of the outcome (b2) as well as in the trend over time (b3) compared to the initial difference in means (b0) and baseline trend (b1). The following difference‐in‐differences segmented regression model was fitted using the autoreg procedure in SAS: yt = b0 + b1*timet + b2*study periodt + b3*time after the interventiont + errort, where timet is biweekly intervals after the beginning of the study, time after the interventiont is biweekly intervals after the intervention date, and study periodt is 1 postintervention and 0 preintervention. The models were fitted using maximum likelihood and stepwise autoregression to test 24 lags.
P values <0.05 were considered significant. SAS (version 9.3; SAS Institute Inc., Cary, NC) was used for data analysis.
RESULTS
We analyzed 48,327 inpatient visits that met inclusion criteria. We excluded 15,659 obstetrics, rehabilitation, and psychiatry visits. Seven hundred seventy‐two (2.4%) of the remaining visits were excluded due to missing data. A total of 31,896 inpatient visits by 22,545 patients were included in the analysis. There were 10,136 visits before the intervention and 21,760 visits after. Characteristics of the study groups for the full study timeframe (July 1, 2012April 30, 2014) are summarized in Table 1.
| Characteristic | Study Group* | |||
|---|---|---|---|---|
| Overall, N = 31,896 | Control, N = 25,586 | Intervention, N = 6,310 | P Value | |
| ||||
| Patient characteristics | ||||
| Age, y | 55.47 17.61 | 55.27 17.13 | 56.30 19.39 | <0.001 |
| Female gender | 14,995 (47%) | 11,753 (46%) | 3,242 (51%) | <0.001 |
| CCI | 3.73 3.25 | 3.61 3.17 | 4.20 3.54 | <0.001 |
| Outcomes | ||||
| Cost per day, $ | 130.95 392.16 | 131.57 423.94 | 127.68 220.40 | 0.022 |
| Cost per visit, $ | 733.75 1,693.98 | 772.30 1,847.65 | 577.40 795.29 | <0.001 |
| BMP tests per day | 0.73 1.17 | 0.74 1.19 | 0.67 1.05 | <0.001 |
| CMP tests per day | 0.20 0.67 | 0.19 0.68 | 0.26 0.62 | <0.001 |
| CBC tests per day | 0.83 1.10 | 0.84 1.15 | 0.73 0.82 | <0.001 |
| PT/INR tests per day | 0.36 1.03 | 0.36 1.07 | 0.34 0.83 | <.001 |
| LOS, d | 5.60 7.12 | 5.87 7.55 | 4.52 4.82 | <0.001 |
| 30‐day readmissions | 4,374 (14%) | 3,603 (14%) | 771 (12%) | <0.001 |
During the study period, there were 25,586 visits in the control group and 6310 visits in the intervention group. Patients in the intervention group were on average older than patients in the control group. There were more female patients in the intervention group. Mean CCI was 4.2 in the intervention group and 3.6 in the control group. The intervention group had lower LOS and 30‐day readmissions than the control group.
Descriptive statistics and simple comparisons of covariates and outcomes before and after the intervention are shown in Table 2. Age and gender distributions remained unchanged in both groups. CCI increased in the control group by 0.24 (P < 0.001) and remained unchanged in the intervention group. In the intervention group, lab cost per day was reduced from $138 before the intervention to $123 after the intervention (P < 0.001). In contrast, among control patients, cost per day increased nonsignificantly from $130 preintervention to $132 postintervention (P = 0.37). Number of tests per day significantly decreased for all specific tests in the intervention group. Readmission rates decreased significantly from 14% to 11% in the intervention group (P = 0.01). LOS remained constant in both groups.
| Characteristic* | Control | Intervention | ||||
|---|---|---|---|---|---|---|
| Preintervention, N = 8,102 | Postintervention, N = 17,484 | P Value | Preintervention, N = 2,034 | Postintervention, N = 4,276 | P Value | |
| ||||||
| Patient characteristics | ||||||
| Age, yr | 55.17 17.46 | 55.31 16.98 | 0.55 | 55.90 19.47 | 56.50 19.35 | 0.25 |
| Female gender | 3,707 (46%) | 8,046 (46%) | 0.69 | 1,039 (51%) | 2,203 (52%) | 0.74 |
| CCI | 3.45 3.06 | 3.69 3.21 | <0.001 | 4.19 3.51 | 4.20 3.56 | 0.89 |
| Outcomes | ||||||
| Cost per day, $ | 130.1 431.8 | 132.2 420.3 | 0.37 | 137.9 232.9 | 122.9 213.5 | <0.001 |
| Cost per visit, $ | 760.4 1,813.6 | 777.8 1,863.3 | 0.48 | 617.8 844.1 | 558.2 770.3 | 0.005 |
| BMP tests per day | 0.74 1.21 | 0.74 1.18 | 0.67 | 0.75 1.03 | 0.63 1.05 | <0.001 |
| CMP tests per day | 0.19 0.68 | 0.19 0.68 | 0.85 | 0.32 0.68 | 0.23 0.58 | <0.001 |
| CBC tests per day | 0.85 1.14 | 0.84 1.15 | 0.045 | 0.92 0.79 | 0.64 0.76 | <0.001 |
| PT/INR tests per day | 0.34 1.04 | 0.37 1.08 | <0.001 | 0.35 0.82 | 0.33 0.84 | 0.020 |
| LOS, d | 5.84 7.66 | 5.88 7.50 | 0.71 | 4.48 5.12 | 4.54 4.67 | 0.63 |
| 30‐day readmissions | 1,173 (14%) | 2,430 (14%) | 0.22 | 280 (14%) | 491 (11%) | 0.010 |
ITS analysis results are shown in Table 3. After the intervention, the difference in monthly means between the 2 groups dropped by $16 for cost per day (P = 0.034) and by $128 for cost per visit (P = 0.02). The decreased cost in the intervention group amounts to approximately $251,427 (95% confidence interval [CI]: $20,370‐$482,484) savings over the first year. If the intervention was rolled out for the control group and had a similar impact, it could have led to an additional cost savings of $1,321,669 (95% CI: 107,081‐2,536,256). Moreover, the number of basic metabolic panel, comprehensive metabolic panel, and complete blood count test per day were reduced significantly more in the intervention group compared to the control group (<0.001, 0.004, and <0.001).
| Outcome | Parameter* | Parameter Estimate | Standard Error | t Value | Pr > |t| |
|---|---|---|---|---|---|
| |||||
| Lab cost per day ($) | Baseline difference level (b0) | 9.3450 | 6.5640 | 1.4237 | 0.16 |
| Baseline difference trend (b1) | 0.2150 | 0.7709 | 0.2789 | 0.78 | |
| Change in difference level after intervention(b2) | 16.1200 | 7.3297 | 2.1993 | 0.034 | |
| Change in difference trend after intervention (b3) | 0.2388 | 0.8090 | 0.2952 | 0.77 | |
| Lab cost per visit ($) | Baseline difference level (b0) | 166.081 | 48.3425 | 3.4355 | 0.001 |
| Baseline difference trend (b1) | 3.6663 | 5.8571 | 0.6260 | 0.53 | |
| Change in difference level after intervention(b2) | 128.527 | 53.0278 | 2.4238 | 0.020 | |
| Change in difference trend after intervention (b3) | 2.2586 | 5.8463 | 0.3863 | 0.70 | |
| BMP tests per day | Baseline difference level (b0) | 0.0061 | 0.0250 | 0.2439 | 0.81 |
| Baseline difference trend (b1) | 0.0004 | 0.0030 | 0.1449 | 0.89 | |
| Change in difference level after intervention(b2) | 0.1034 | 0.0276 | 3.7426 | <0.001 | |
| Change in difference trend after intervention (b3) | 0.0014 | 0.0030 | 0.4588 | 0.65 | |
| CMP tests per day | Baseline difference level (b0) | 0.1226 | 0.0226 | 5.4302 | <0.001 |
| Baseline difference trend (b1) | 0.0015 | 0.0028 | 0.5539 | 0.58 | |
| Change in difference level after intervention(b2) | 0.0754 | 0.0248 | 3.0397 | 0.004 | |
| Change in difference trend after intervention (b3) | 0.0030 | 0.0028 | 1.0937 | 0.28 | |
| CBC tests per day | Baseline difference level (b0) | 0.0539 | 0.0190 | 2.8338 | 0.007 |
| Baseline difference trend (b1) | 0.0013 | 0.0023 | 0.5594 | 0.58 | |
| Change in difference level after intervention(b2) | 0.2343 | 0.0213 | 10.997 | <0.001 | |
| Change in difference trend after intervention (b3) | 0.0036 | 0.0023 | 1.5539 | 0.13 | |
| PT/INR tests per day | Baseline difference level (b0) | 0.0413 | 0.0242 | 1.7063 | 0.096 |
| Baseline difference trend (b1) | 0.0040 | 0.0028 | 1.4095 | 0.17 | |
| Change in difference level after intervention(b2) | 0.0500 | 0.0270 | 1.8507 | 0.072 | |
| Change in difference trend after intervention (b3) | 0.0054 | 0.0030 | 1.7940 | 0.080 | |
| LOS, d | Baseline difference level (b0) | 1.4211 | 0.2746 | 5.1743 | <0.001 |
| Baseline difference trend (b1) | 0.0093 | 0.0333 | 0.2807 | 0.78 | |
| Change in difference level after intervention(b2) | 0.1007 | 0.2988 | 0.3368 | 0.74 | |
| Change in difference trend after intervention (b3) | 0.0053 | 0.0331 | 0.1588 | 0.87 | |
| 30‐day readmissions | Baseline difference level (b0) | 0.0057 | 0.0185 | 0.3084 | 0.76 |
| Baseline difference trend (b1) | 0.0017 | 0.0022 | 0.8016 | 0.43 | |
| Change in difference level after intervention(b2) | 0.0110 | 0.0206 | 0.5315 | 0.60 | |
| Change in difference trend after intervention (b3) | 0.0021 | 0.0023 | 0.9111 | 0.37 | |
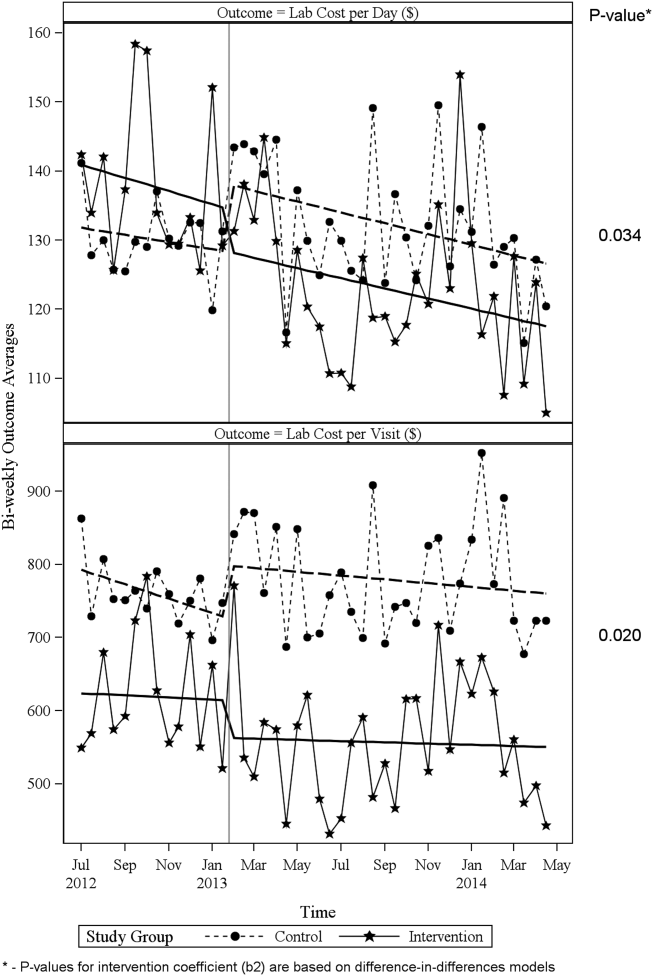
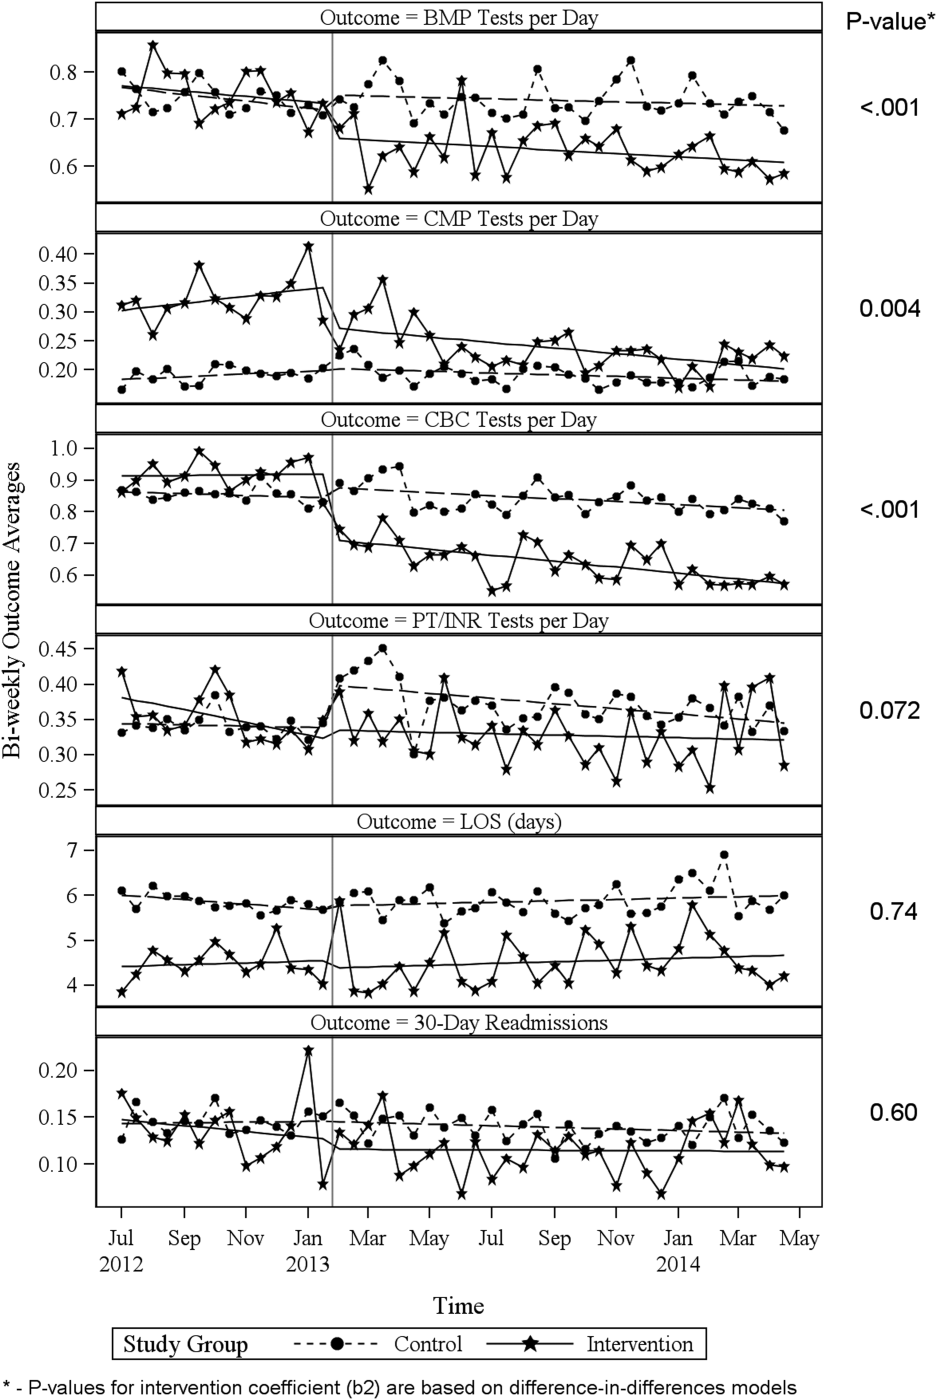
Figure 1 shows a graphical representation of the biweekly means for the 2 primary outcomeslab cost per day and lab cost per visit. Figure 2 shows all other outcomes. To the right of each figure, P values are provided for the b2 coefficients from Table 3.
DISCUSSION
Through a multifaceted quality‐improvement initiative, the UUHC hospitalist group was able to reduce lab cost per day and per visit as well as commonly ordered routine labs as compared to an institutional control group. A multifaceted approach was selected given the literature supporting this approach as the most likely method to sustain improvement.[14] At the same time, the use of a multifaceted intervention makes it difficult to rigorously determine the relative impact of different components of the intervention. In discussing this issue, however, the hospitalist group felt that the driving factors for change were those related to process change, specifically, the use of a standardized rounding checklist to discuss lab testing and the routine review of lab costs at group meetings. The ultimate goal was to change the culture of routine test ordering into a thoughtful process of needed tests and thereby reduce costs. Prior to this intervention, the least experienced person on this team (the intern) ordered any test he or she wanted, usually without discussion. The intervention focused on this issue through standardized supervision and explicit discussion of laboratory tests. Importantly, although improvements from education initiatives typically decrease over time, the incorporation of process change in this intervention was felt to likely contribute to the sustained reduction seen at 15 months. Although use of the rounding checklist added another step to daily rounds, the routine cost feedback, including comparisons to peers, helped encourage use of the checklist. Thus, we feel that routine feedback was essential to sustaining the intervention and its impact.
Inappropriate and unnecessary testing has been recognized for decades, and multiple interventions have been attempted, including a recent article that demonstrated a 10% reduction in common laboratory ordering through an initiative mainly focused on education and ordering feedback.[25] Despite reported success of several interventions, none have combined multiple interventions and explicitly required discussion of laboratory tests on rounds. For example, although the UUHC intervention used Attali et al.[21] and Barie and Hydo's[20] work to develop the intervention, neither of these studies described how laboratory testing was discussed with the attending or supervising resident. The UUHC intervention thus builds on the current literature by combining other successful modalities with explicit discussion of laboratory testing via a rounding checklist and feedback with the novel VDO tool to reduce laboratory costs. A major strength of this intervention is the relatively low cost and the generalizability of implementing rounding checklists. Initial support from the hospital was needed to provide accurate VDO information to the hospitalist group. However, ongoing costs were minimal and related to any additional time spent during rounds to discuss laboratory tests. Thus, we feel that this intervention is feasible for wide replication.
Another strength of the study is the use of the VDO tool to measure actual costs. Whereas previous studies have relied on estimated costs with extrapolation to potential cost savings, this study used direct costs to the institution as a more accurate marker of cost savings. Additionally, most studies on lab utilization have used a before/after analysis without a control group. The presence of a control group for this analysis is important to help assess for institutional trends that may not be reflected in a before/after intervention. The reduction in cost in the intervention group despite a trend toward increased cost in the institutional control group supports the impact of this intervention.
Limitations of this study include that it was a single‐center, controlled ITS study and not a randomized controlled trial. Related to this limitation, the control group reflected a different patient population compared to the intervention group, with a longer LOS, lower CCI, and inclusion of nonmedical patients. However, these differences were relatively stable before and after the intervention. Also, ITS is considered one of the most robust research designs outside of randomized controlled trials, and it accounts for baseline differences in both levels and trends.[24] Nevertheless, it remains possible that secular trends existed that we did not capture and that affected the 2 populations differently.
A further limitation is that the baseline period was only 7 months and the intervention was 15 months. As the 7 months started in July, this could have reflected the time when interns were least experienced with ordering. Unfortunately, we did not have VDO availability for a full year prior to the intervention. We believe that any major effect due to this shortened baseline period should have been seen in the control group as well, and therefore accounted for in the analysis. Additionally, it is possible that there was spillover of the intervention to the control group, as internal medicine residents rotated throughout the hospital to other medical services (pulmonary, cardiology, hematology, and oncology). However, any effect of their rotation should have been to lower the control lab cost, thus making differences less profound.
CONCLUSIONS
A multifaceted approach to laboratory reduction through education, process change, cost feedback, and financial incentive resulted in a significant reduction in laboratory cost per day, laboratory cost per visit, and the ordering of common laboratory tests at a major academic medical center.
Acknowledgements
The authors thank Mr. Michael Swanicke for his assistance in process engineering, Mr. Tony Clawson for his routine provision of VDO data, and Ms. Selma Lopez for her editorial support.
Disclosures: K.K. is or has been a consultant on clinical decision support (CDS) or electronic clinical quality measurement to the US Office of the National Coordinator for Health IT, ARUP Laboratories, McKesson InterQual, ESAC, Inc., JBS International, Inc., Inflexxion, Inc., Intelligent Automation, Inc., Partners HealthCare, Mayo Clinic, and the RAND Corporation. K.K. receives royalties for a Duke University‐owned CDS technology for infectious disease management known as CustomID that he helped develop. K.K. was formerly a consultant for Religent, Inc. and a co‐owner and consultant for Clinica Software, Inc., both of which provide commercial CDS services, including through use of a CDS technology known as SEBASTIAN that K.K. developed. K.K. no longer has a financial relationship with either Religent or Clinica Software. K.K. has no competing interest with any specific product or intervention evaluated in this article. All other authors declare no competing interests.
- , , , et al. National health expenditure projections, 2014–24: spending growth faster than recent trends. Health Aff (Millwood). 2015;34(8):1407–1417.
- , . Eliminating waste in US health care. JAMA. 2012;307(14):1513–1516.
- , , , et al. Utilization of arterial blood gas measurements in a large tertiary care hospital. Am J Clin Pathol. 2007;127:604–609.
- , . Strategies to promote rational clinical chemistry test utilization. Clin Biochem. 1996;29:291–299.
- , , , , . The landscape of inappropriate laboratory testing: a 15‐year meta‐analysis. PLoS One. 2013;8:e78962.
- ABIM Choosing Wisely Society of Hospital Medicine–Adult Hospital Medicine. Five things physicians and patients should question. Available at: http://www.choosingwisely.org/societies/society‐of‐hospital‐medicine‐adult. Published February 21, 2013. Accessed September 2, 2015.
- , , , , , . Effect of daily charge feedback on inpatient charges and physician knowledge and behavior. Arch Intern Med. 1989;149:426–429.
- , , , et al. A utilization management intervention to reduce unnecessary testing in the coronary care unit. Arch Intern Med. 2002;162:1885–1890.
- , , , et al. The impact of peer management on test‐ordering behavior. Ann Intern Med. 2004;141:196–204.
- , , , , . An administrative intervention to improve the utilization of laboratory tests within a university hospital. Int J Qual Health Care. 2005;17:243–248.
- , , , et al. Impact of providing fee data on laboratory test ordering. JAMA Intern Med. 2013;173(10):903–908.
- , , , et al. The failure of physician education as a cost containment strategy. JAMA. 1984;252:225–230.
- . Is that lab test necessary? Am J Clin Pathol. 2006;126:335–336.
- , , , . Techniques to improve physicians' use of diagnostic tests. JAMA. 1998;280:2020–2027.
- , , . Laboratory testing in the intensive care unit. Crit Care Clin. 2007;23:435–465.
- . Complications of critical care: lab testing and iatrogenic anemia. MLO Med Lab Obs. 200;33(10):28–31.
- , , , et al. Contemporary bloodletting in cardiac surgical care. Ann Thorac Surg. 2015;99:779–785.
- , , , et al. Value Driven Outcomes (VDO): a pragmatic, modular, and extensible software framework for understanding and improving health care costs and outcomes. J Am Med Inform Assoc. 2015:22:223–235.
- , , . The impact of residents, interns, and attendings on inpatient laboratory ordering patterns: a report from one university's hospitalist service. Acad Med. 2011;86:139–145.
- , . Learning to not know: results of a program for ancillary cost reduction in surgical care. J Trauma. 1996;41:714–720.
- , , , et al. A cost‐effective method for reducing the volume of laboratory tests in a university‐associated teaching hospital. Mt Sinai J Med. 2006;73:787–794.
- US Bureau of Labor Statistics. CPI inflation calculator. Available at: http://www.bls.gov/data/inflation_calculator.htm. Accessed May 22, 2015.
- , , , et al. Coding algorithms for defining comorbidities in ICD‐9‐CM and ICD‐10 administrative data. Med Care. 2005;43:113–1139.
- , , , . Segmented regression analysis of interrupted time series studies in medication use research. J Clin Pharm Ther. 2002;27(4):299–309.
- , , , et al. A multifaceted hospitalist quality improvement intervention: decreased frequency of common labs. J Hosp Med. 2015;10:390–395.
Healthcare costs continue to increase and are estimated to be approximately $3.1 trillion per year in the United States.[1] Waste is a major contributor to this cost, accounting for an estimated $910 billion/year.[2] Laboratory tests are well documented to contribute to healthcare waste, with an estimated 30% to 50% of tests for hospitalized patients being unnecessary.[3, 4, 5] This issue has been highlighted by the American Board of Internal Medicine Foundation's Choosing Wisely campaign as an area to reduce waste.[6] Evaluating this concern locally, a University Health Systems Consortium 2011 analysis indicated that the University of Utah general internal medicine hospitalist service had a higher average direct lab cost per discharge compared to top performers, indicating an opportunity for improvement.
Multiple interventions have been described in the literature to address excessive laboratory utilization, including physician education, audit and feedback, cost information display, and administrative rules restricting certain types of ordering.[7, 8, 9, 10, 11] Despite these interventions, barriers remain common and not all interventions are sustained. For example, interventions focused mainly on education see a small improvement initially that is not sustained.[4, 12, 13] Additionally, although most studies focus on individual interventions, those that target multiple factors have been found to be more successful at producing and sustaining change.[14] Therefore, the opportunity existed to incorporate multiple etiologies into a single intervention and apply a checklist to laboratory ordering to see if combined modalities could be effective at reducing laboratory costs in a sustainable manner.
In addition to cost, there is potential patient harm resulting from unnecessary laboratory testing. For prolonged hospitalizations, anemia is a well‐recognized side effect of phlebotomy,[15, 16] and a recent evaluation of cardiac surgery patients found an average cumulative blood loss due to phlebotomy of 454 mL/hospital stay.[17] The sheer number of tests ordered can lead to false positive tests that result in additional testing and monitoring. Furthermore, patients subjected to laboratory blood draws are often awakened early in the morning, which is unpleasant and could adversely affect the patient experience.
Recognizing laboratory cost as a problem, the University of Utah general internal medicine hospitalist service implemented a multifaceted quality‐improvement initiative with a goal to reduce laboratory testing. At the time of this project, University of Utah Health Care (UUHC) developed a Value Driven Outcomes (VDO) tool to give direct data related to costs of care, including the actual cost paid by the hospital to the university‐owned laboratory vendor (ARUP Laboratories, Salt Lake City, UT) for testing.[18] The hospitalist group incorporated VDO into the initiative for routine cost feedback. This study evaluates the impact of this intervention on laboratory costs.
METHODS
Design
A retrospective, controlled, interrupted time series (ITS) study was performed to compare changes in lab costs between hospitalists (intervention study group) and other providers (control study group). The intervention initiation date was February 1, 2013. The baseline period was July 1, 2012 to January 31, 2013, as that was the period in which the VDO tool became available for cost analysis prior to intervention. The intervention period was February 1, 2013 to April 30, 2014, as there was a change in the electronic health record (EHR) in May 2014 that affected data flow and could act as a major confounder. The institutional review board classified this project as quality improvement and did not require review and oversight.
Setting
UUHC is a 500‐bed academic medical center in Salt Lake City, Utah. The hospitalist service is a teaching service composed of 4 teams with internal medicine residents and medical students. The nonhospitalist services include all surgical services, as well as pulmonary, cardiology, hematology, and oncology services on which internal medicine residents rotate. All services at UUHC are staffed by academic physicians affiliated with the University of Utah School of Medicine.
Population
All patients 18 years and older admitted to the hospital to a service other than obstetrics, rehabilitation, or psychiatry between July 1, 2012 and April 30, 2014 were evaluated. Patients with missing data for outcomes or covariates were excluded.
Intervention
Initial evaluation included an informal review of patient charts and discussion with hospitalist group members, both indicating laboratory overuse. A working group was then established including hospitalists and process engineers to evaluate the workflow by which laboratory tests were ordered. Concurrently, a literature review was performed to help identify the scope of the problem and evaluate methods that had been successful at other institutions. Through this review, it was noted that interns were the most frequent orderers of tests and the largest contributors to variation of testing for inpatients.[19] Two specific studies with direct applicability to this project demonstrated that discussion of costs with attendings in a trauma intensive care unit resulted in a 30% reduction of tests ordered,[20] and discussion of testing with a senior resident in an internal medicine inpatient setting demonstrated a 20% reduction in laboratory testing.[21]
Our laboratory reduction intervention expanded on the current literature to incorporate education, process change, cost feedback, and financial incentives. Specifically, starting February 1, 2013, the following interventions were performed:
- Education of all providers involved, including the hospitalist group and all internal medicine residents at the start of their rotation with the hospitalist service. Education included a 30‐minute discussion of laboratory overuse, costs associated with laboratory overuse, previous interventions and their success, and current intervention with goals. Each resident was provided a pocket card with the most common lab tests and associated charges. Charges were used instead of costs due to concerns regarding the possible public dissemination of institutional costs.
- Standardization of the rounding process including a checklist review (see Supporting Information, Appendix, in the online version of this article) for all patients that ensured discussion of labs, telemetry, pain, lines/tubes, nursing presence, and follow‐up needed. The expectation was that all plans for lab testing would be discussed during rounds. The third‐year medical student was responsible to ensure that all items were covered daily on each patient.
- Monthly feedback at the hospitalist group meeting regarding laboratory costs using the VDO tool. Data were presented as a monthly group average and compared to preintervention baseline costs. Individual performance could be viewed and compared to other providers within the group.
- Financial incentive through a program that shares 50% of cost savings realized by the hospital with the Division of General Internal Medicine. The incentive could be used to support future quality‐improvement projects, but there was no individual physician incentive.
Data Collection and Preparation
Clinical data were collected in the inpatient EHR (Cerner Corp., Kansas City, MO) and later imported into the enterprise data warehouse (EDW) as part of the normal data flow. Billing data were imported into the EDW from the billing system. Cost data were estimated using the VDO tool developed by the University of Utah to identify clinical costs to the UUHC system.[18]
Clinical and Cost Outcomes
We hypothesized that following the intervention, the number of tests and lab costs would decrease greater for patients in the intervention group than in the control group, with no adverse effect on length of stay (LOS) or 30‐day readmissions.
Lab cost per day was calculated as the total lab cost per visit divided by the LOS. We adjusted all lab costs to 2013 US dollars using Consumer Price Index inflation data.[22] To account for different LOS, we used LOS as a weight variable when estimating descriptive characteristics and P values for lab cost per day and the number of tests. Thirty‐day readmissions included inpatient encounters followed by another inpatient encounter within 30 days excluding obstetrics, rehabilitation, and psychiatry visits.
Descriptive Variables
We included information on age at admission in years and Charlson Comorbidity Index (CCI) to evaluate differences in control and intervention groups.[23]
Statistical Analysis
First, unadjusted descriptive statistics were calculated for study outcomes and visit characteristics. Descriptive statistics were expressed as n (%) and mean standard deviation. Simple comparisons were performed based on 2 tests of homogeneity for categorical variables and on t tests for continuous variables.
Second, an ITS analysis was conducted to evaluate the impact of the intervention while accounting for baseline trends.[24] In this analysis, the dependent variable (yt) was the difference in aggregated outcome measures between the intervention and control groups every 2 weeks (eg, difference in average lab costs in a given 2‐week period between the 2 groups). Intervention impact was then evaluated in terms of changes in the level of the outcome (b2) as well as in the trend over time (b3) compared to the initial difference in means (b0) and baseline trend (b1). The following difference‐in‐differences segmented regression model was fitted using the autoreg procedure in SAS: yt = b0 + b1*timet + b2*study periodt + b3*time after the interventiont + errort, where timet is biweekly intervals after the beginning of the study, time after the interventiont is biweekly intervals after the intervention date, and study periodt is 1 postintervention and 0 preintervention. The models were fitted using maximum likelihood and stepwise autoregression to test 24 lags.
P values <0.05 were considered significant. SAS (version 9.3; SAS Institute Inc., Cary, NC) was used for data analysis.
RESULTS
We analyzed 48,327 inpatient visits that met inclusion criteria. We excluded 15,659 obstetrics, rehabilitation, and psychiatry visits. Seven hundred seventy‐two (2.4%) of the remaining visits were excluded due to missing data. A total of 31,896 inpatient visits by 22,545 patients were included in the analysis. There were 10,136 visits before the intervention and 21,760 visits after. Characteristics of the study groups for the full study timeframe (July 1, 2012April 30, 2014) are summarized in Table 1.
| Characteristic | Study Group* | |||
|---|---|---|---|---|
| Overall, N = 31,896 | Control, N = 25,586 | Intervention, N = 6,310 | P Value | |
| ||||
| Patient characteristics | ||||
| Age, y | 55.47 17.61 | 55.27 17.13 | 56.30 19.39 | <0.001 |
| Female gender | 14,995 (47%) | 11,753 (46%) | 3,242 (51%) | <0.001 |
| CCI | 3.73 3.25 | 3.61 3.17 | 4.20 3.54 | <0.001 |
| Outcomes | ||||
| Cost per day, $ | 130.95 392.16 | 131.57 423.94 | 127.68 220.40 | 0.022 |
| Cost per visit, $ | 733.75 1,693.98 | 772.30 1,847.65 | 577.40 795.29 | <0.001 |
| BMP tests per day | 0.73 1.17 | 0.74 1.19 | 0.67 1.05 | <0.001 |
| CMP tests per day | 0.20 0.67 | 0.19 0.68 | 0.26 0.62 | <0.001 |
| CBC tests per day | 0.83 1.10 | 0.84 1.15 | 0.73 0.82 | <0.001 |
| PT/INR tests per day | 0.36 1.03 | 0.36 1.07 | 0.34 0.83 | <.001 |
| LOS, d | 5.60 7.12 | 5.87 7.55 | 4.52 4.82 | <0.001 |
| 30‐day readmissions | 4,374 (14%) | 3,603 (14%) | 771 (12%) | <0.001 |
During the study period, there were 25,586 visits in the control group and 6310 visits in the intervention group. Patients in the intervention group were on average older than patients in the control group. There were more female patients in the intervention group. Mean CCI was 4.2 in the intervention group and 3.6 in the control group. The intervention group had lower LOS and 30‐day readmissions than the control group.
Descriptive statistics and simple comparisons of covariates and outcomes before and after the intervention are shown in Table 2. Age and gender distributions remained unchanged in both groups. CCI increased in the control group by 0.24 (P < 0.001) and remained unchanged in the intervention group. In the intervention group, lab cost per day was reduced from $138 before the intervention to $123 after the intervention (P < 0.001). In contrast, among control patients, cost per day increased nonsignificantly from $130 preintervention to $132 postintervention (P = 0.37). Number of tests per day significantly decreased for all specific tests in the intervention group. Readmission rates decreased significantly from 14% to 11% in the intervention group (P = 0.01). LOS remained constant in both groups.
| Characteristic* | Control | Intervention | ||||
|---|---|---|---|---|---|---|
| Preintervention, N = 8,102 | Postintervention, N = 17,484 | P Value | Preintervention, N = 2,034 | Postintervention, N = 4,276 | P Value | |
| ||||||
| Patient characteristics | ||||||
| Age, yr | 55.17 17.46 | 55.31 16.98 | 0.55 | 55.90 19.47 | 56.50 19.35 | 0.25 |
| Female gender | 3,707 (46%) | 8,046 (46%) | 0.69 | 1,039 (51%) | 2,203 (52%) | 0.74 |
| CCI | 3.45 3.06 | 3.69 3.21 | <0.001 | 4.19 3.51 | 4.20 3.56 | 0.89 |
| Outcomes | ||||||
| Cost per day, $ | 130.1 431.8 | 132.2 420.3 | 0.37 | 137.9 232.9 | 122.9 213.5 | <0.001 |
| Cost per visit, $ | 760.4 1,813.6 | 777.8 1,863.3 | 0.48 | 617.8 844.1 | 558.2 770.3 | 0.005 |
| BMP tests per day | 0.74 1.21 | 0.74 1.18 | 0.67 | 0.75 1.03 | 0.63 1.05 | <0.001 |
| CMP tests per day | 0.19 0.68 | 0.19 0.68 | 0.85 | 0.32 0.68 | 0.23 0.58 | <0.001 |
| CBC tests per day | 0.85 1.14 | 0.84 1.15 | 0.045 | 0.92 0.79 | 0.64 0.76 | <0.001 |
| PT/INR tests per day | 0.34 1.04 | 0.37 1.08 | <0.001 | 0.35 0.82 | 0.33 0.84 | 0.020 |
| LOS, d | 5.84 7.66 | 5.88 7.50 | 0.71 | 4.48 5.12 | 4.54 4.67 | 0.63 |
| 30‐day readmissions | 1,173 (14%) | 2,430 (14%) | 0.22 | 280 (14%) | 491 (11%) | 0.010 |
ITS analysis results are shown in Table 3. After the intervention, the difference in monthly means between the 2 groups dropped by $16 for cost per day (P = 0.034) and by $128 for cost per visit (P = 0.02). The decreased cost in the intervention group amounts to approximately $251,427 (95% confidence interval [CI]: $20,370‐$482,484) savings over the first year. If the intervention was rolled out for the control group and had a similar impact, it could have led to an additional cost savings of $1,321,669 (95% CI: 107,081‐2,536,256). Moreover, the number of basic metabolic panel, comprehensive metabolic panel, and complete blood count test per day were reduced significantly more in the intervention group compared to the control group (<0.001, 0.004, and <0.001).
| Outcome | Parameter* | Parameter Estimate | Standard Error | t Value | Pr > |t| |
|---|---|---|---|---|---|
| |||||
| Lab cost per day ($) | Baseline difference level (b0) | 9.3450 | 6.5640 | 1.4237 | 0.16 |
| Baseline difference trend (b1) | 0.2150 | 0.7709 | 0.2789 | 0.78 | |
| Change in difference level after intervention(b2) | 16.1200 | 7.3297 | 2.1993 | 0.034 | |
| Change in difference trend after intervention (b3) | 0.2388 | 0.8090 | 0.2952 | 0.77 | |
| Lab cost per visit ($) | Baseline difference level (b0) | 166.081 | 48.3425 | 3.4355 | 0.001 |
| Baseline difference trend (b1) | 3.6663 | 5.8571 | 0.6260 | 0.53 | |
| Change in difference level after intervention(b2) | 128.527 | 53.0278 | 2.4238 | 0.020 | |
| Change in difference trend after intervention (b3) | 2.2586 | 5.8463 | 0.3863 | 0.70 | |
| BMP tests per day | Baseline difference level (b0) | 0.0061 | 0.0250 | 0.2439 | 0.81 |
| Baseline difference trend (b1) | 0.0004 | 0.0030 | 0.1449 | 0.89 | |
| Change in difference level after intervention(b2) | 0.1034 | 0.0276 | 3.7426 | <0.001 | |
| Change in difference trend after intervention (b3) | 0.0014 | 0.0030 | 0.4588 | 0.65 | |
| CMP tests per day | Baseline difference level (b0) | 0.1226 | 0.0226 | 5.4302 | <0.001 |
| Baseline difference trend (b1) | 0.0015 | 0.0028 | 0.5539 | 0.58 | |
| Change in difference level after intervention(b2) | 0.0754 | 0.0248 | 3.0397 | 0.004 | |
| Change in difference trend after intervention (b3) | 0.0030 | 0.0028 | 1.0937 | 0.28 | |
| CBC tests per day | Baseline difference level (b0) | 0.0539 | 0.0190 | 2.8338 | 0.007 |
| Baseline difference trend (b1) | 0.0013 | 0.0023 | 0.5594 | 0.58 | |
| Change in difference level after intervention(b2) | 0.2343 | 0.0213 | 10.997 | <0.001 | |
| Change in difference trend after intervention (b3) | 0.0036 | 0.0023 | 1.5539 | 0.13 | |
| PT/INR tests per day | Baseline difference level (b0) | 0.0413 | 0.0242 | 1.7063 | 0.096 |
| Baseline difference trend (b1) | 0.0040 | 0.0028 | 1.4095 | 0.17 | |
| Change in difference level after intervention(b2) | 0.0500 | 0.0270 | 1.8507 | 0.072 | |
| Change in difference trend after intervention (b3) | 0.0054 | 0.0030 | 1.7940 | 0.080 | |
| LOS, d | Baseline difference level (b0) | 1.4211 | 0.2746 | 5.1743 | <0.001 |
| Baseline difference trend (b1) | 0.0093 | 0.0333 | 0.2807 | 0.78 | |
| Change in difference level after intervention(b2) | 0.1007 | 0.2988 | 0.3368 | 0.74 | |
| Change in difference trend after intervention (b3) | 0.0053 | 0.0331 | 0.1588 | 0.87 | |
| 30‐day readmissions | Baseline difference level (b0) | 0.0057 | 0.0185 | 0.3084 | 0.76 |
| Baseline difference trend (b1) | 0.0017 | 0.0022 | 0.8016 | 0.43 | |
| Change in difference level after intervention(b2) | 0.0110 | 0.0206 | 0.5315 | 0.60 | |
| Change in difference trend after intervention (b3) | 0.0021 | 0.0023 | 0.9111 | 0.37 | |
Figure 1 shows a graphical representation of the biweekly means for the 2 primary outcomeslab cost per day and lab cost per visit. Figure 2 shows all other outcomes. To the right of each figure, P values are provided for the b2 coefficients from Table 3.
DISCUSSION
Through a multifaceted quality‐improvement initiative, the UUHC hospitalist group was able to reduce lab cost per day and per visit as well as commonly ordered routine labs as compared to an institutional control group. A multifaceted approach was selected given the literature supporting this approach as the most likely method to sustain improvement.[14] At the same time, the use of a multifaceted intervention makes it difficult to rigorously determine the relative impact of different components of the intervention. In discussing this issue, however, the hospitalist group felt that the driving factors for change were those related to process change, specifically, the use of a standardized rounding checklist to discuss lab testing and the routine review of lab costs at group meetings. The ultimate goal was to change the culture of routine test ordering into a thoughtful process of needed tests and thereby reduce costs. Prior to this intervention, the least experienced person on this team (the intern) ordered any test he or she wanted, usually without discussion. The intervention focused on this issue through standardized supervision and explicit discussion of laboratory tests. Importantly, although improvements from education initiatives typically decrease over time, the incorporation of process change in this intervention was felt to likely contribute to the sustained reduction seen at 15 months. Although use of the rounding checklist added another step to daily rounds, the routine cost feedback, including comparisons to peers, helped encourage use of the checklist. Thus, we feel that routine feedback was essential to sustaining the intervention and its impact.
Inappropriate and unnecessary testing has been recognized for decades, and multiple interventions have been attempted, including a recent article that demonstrated a 10% reduction in common laboratory ordering through an initiative mainly focused on education and ordering feedback.[25] Despite reported success of several interventions, none have combined multiple interventions and explicitly required discussion of laboratory tests on rounds. For example, although the UUHC intervention used Attali et al.[21] and Barie and Hydo's[20] work to develop the intervention, neither of these studies described how laboratory testing was discussed with the attending or supervising resident. The UUHC intervention thus builds on the current literature by combining other successful modalities with explicit discussion of laboratory testing via a rounding checklist and feedback with the novel VDO tool to reduce laboratory costs. A major strength of this intervention is the relatively low cost and the generalizability of implementing rounding checklists. Initial support from the hospital was needed to provide accurate VDO information to the hospitalist group. However, ongoing costs were minimal and related to any additional time spent during rounds to discuss laboratory tests. Thus, we feel that this intervention is feasible for wide replication.
Another strength of the study is the use of the VDO tool to measure actual costs. Whereas previous studies have relied on estimated costs with extrapolation to potential cost savings, this study used direct costs to the institution as a more accurate marker of cost savings. Additionally, most studies on lab utilization have used a before/after analysis without a control group. The presence of a control group for this analysis is important to help assess for institutional trends that may not be reflected in a before/after intervention. The reduction in cost in the intervention group despite a trend toward increased cost in the institutional control group supports the impact of this intervention.
Limitations of this study include that it was a single‐center, controlled ITS study and not a randomized controlled trial. Related to this limitation, the control group reflected a different patient population compared to the intervention group, with a longer LOS, lower CCI, and inclusion of nonmedical patients. However, these differences were relatively stable before and after the intervention. Also, ITS is considered one of the most robust research designs outside of randomized controlled trials, and it accounts for baseline differences in both levels and trends.[24] Nevertheless, it remains possible that secular trends existed that we did not capture and that affected the 2 populations differently.
A further limitation is that the baseline period was only 7 months and the intervention was 15 months. As the 7 months started in July, this could have reflected the time when interns were least experienced with ordering. Unfortunately, we did not have VDO availability for a full year prior to the intervention. We believe that any major effect due to this shortened baseline period should have been seen in the control group as well, and therefore accounted for in the analysis. Additionally, it is possible that there was spillover of the intervention to the control group, as internal medicine residents rotated throughout the hospital to other medical services (pulmonary, cardiology, hematology, and oncology). However, any effect of their rotation should have been to lower the control lab cost, thus making differences less profound.
CONCLUSIONS
A multifaceted approach to laboratory reduction through education, process change, cost feedback, and financial incentive resulted in a significant reduction in laboratory cost per day, laboratory cost per visit, and the ordering of common laboratory tests at a major academic medical center.
Acknowledgements
The authors thank Mr. Michael Swanicke for his assistance in process engineering, Mr. Tony Clawson for his routine provision of VDO data, and Ms. Selma Lopez for her editorial support.
Disclosures: K.K. is or has been a consultant on clinical decision support (CDS) or electronic clinical quality measurement to the US Office of the National Coordinator for Health IT, ARUP Laboratories, McKesson InterQual, ESAC, Inc., JBS International, Inc., Inflexxion, Inc., Intelligent Automation, Inc., Partners HealthCare, Mayo Clinic, and the RAND Corporation. K.K. receives royalties for a Duke University‐owned CDS technology for infectious disease management known as CustomID that he helped develop. K.K. was formerly a consultant for Religent, Inc. and a co‐owner and consultant for Clinica Software, Inc., both of which provide commercial CDS services, including through use of a CDS technology known as SEBASTIAN that K.K. developed. K.K. no longer has a financial relationship with either Religent or Clinica Software. K.K. has no competing interest with any specific product or intervention evaluated in this article. All other authors declare no competing interests.
- , , , et al. National health expenditure projections, 2014–24: spending growth faster than recent trends. Health Aff (Millwood). 2015;34(8):1407–1417.
- , . Eliminating waste in US health care. JAMA. 2012;307(14):1513–1516.
- , , , et al. Utilization of arterial blood gas measurements in a large tertiary care hospital. Am J Clin Pathol. 2007;127:604–609.
- , . Strategies to promote rational clinical chemistry test utilization. Clin Biochem. 1996;29:291–299.
- , , , , . The landscape of inappropriate laboratory testing: a 15‐year meta‐analysis. PLoS One. 2013;8:e78962.
- ABIM Choosing Wisely Society of Hospital Medicine–Adult Hospital Medicine. Five things physicians and patients should question. Available at: http://www.choosingwisely.org/societies/society‐of‐hospital‐medicine‐adult. Published February 21, 2013. Accessed September 2, 2015.
- , , , , , . Effect of daily charge feedback on inpatient charges and physician knowledge and behavior. Arch Intern Med. 1989;149:426–429.
- , , , et al. A utilization management intervention to reduce unnecessary testing in the coronary care unit. Arch Intern Med. 2002;162:1885–1890.
- , , , et al. The impact of peer management on test‐ordering behavior. Ann Intern Med. 2004;141:196–204.
- , , , , . An administrative intervention to improve the utilization of laboratory tests within a university hospital. Int J Qual Health Care. 2005;17:243–248.
- , , , et al. Impact of providing fee data on laboratory test ordering. JAMA Intern Med. 2013;173(10):903–908.
- , , , et al. The failure of physician education as a cost containment strategy. JAMA. 1984;252:225–230.
- . Is that lab test necessary? Am J Clin Pathol. 2006;126:335–336.
- , , , . Techniques to improve physicians' use of diagnostic tests. JAMA. 1998;280:2020–2027.
- , , . Laboratory testing in the intensive care unit. Crit Care Clin. 2007;23:435–465.
- . Complications of critical care: lab testing and iatrogenic anemia. MLO Med Lab Obs. 200;33(10):28–31.
- , , , et al. Contemporary bloodletting in cardiac surgical care. Ann Thorac Surg. 2015;99:779–785.
- , , , et al. Value Driven Outcomes (VDO): a pragmatic, modular, and extensible software framework for understanding and improving health care costs and outcomes. J Am Med Inform Assoc. 2015:22:223–235.
- , , . The impact of residents, interns, and attendings on inpatient laboratory ordering patterns: a report from one university's hospitalist service. Acad Med. 2011;86:139–145.
- , . Learning to not know: results of a program for ancillary cost reduction in surgical care. J Trauma. 1996;41:714–720.
- , , , et al. A cost‐effective method for reducing the volume of laboratory tests in a university‐associated teaching hospital. Mt Sinai J Med. 2006;73:787–794.
- US Bureau of Labor Statistics. CPI inflation calculator. Available at: http://www.bls.gov/data/inflation_calculator.htm. Accessed May 22, 2015.
- , , , et al. Coding algorithms for defining comorbidities in ICD‐9‐CM and ICD‐10 administrative data. Med Care. 2005;43:113–1139.
- , , , . Segmented regression analysis of interrupted time series studies in medication use research. J Clin Pharm Ther. 2002;27(4):299–309.
- , , , et al. A multifaceted hospitalist quality improvement intervention: decreased frequency of common labs. J Hosp Med. 2015;10:390–395.
© 2016 Society of Hospital Medicine
