User login
Decrease in Inpatient Telemetry Utilization Through a System-Wide Electronic Health Record Change and a Multifaceted Hospitalist Intervention
Wasteful care may account for between 21% and 34% of the United States’ $3.2 trillion in annual healthcare expenditures, making it a prime target for cost-saving initiatives.1,2 Telemetry is a target for value improvement strategies because telemetry is overutilized, rarely leads to a change in management, and has associated guidelines on appropriate use.3-10 Telemetry use has been a focus of the Joint Commission’s National Patient Safety Goals since 2014, and it is also a focus of the Society of Hospital Medicine’s Choosing Wisely® campaign.11-13
Previous initiatives have evaluated how changes to telemetry orders or education and feedback affect telemetry use. Few studies have compared a system-wide electronic health record (EHR) approach to a multifaceted intervention. In seeking to address this gap, we adapted published guidelines from the American Heart Association (AHA) and incorporated them into our EHR ordering process.3 Simultaneously, we implemented a multifaceted quality improvement initiative and compared this combined program’s effectiveness to that of the EHR approach alone.
METHODS
Study Design, Setting, and Population
We performed a 2-group observational pre- to postintervention study at University of Utah Health. Hospital encounters of patients 18 years and older who had at least 1 inpatient acute care, nonintensive care unit (ICU) room charge and an admission date between January 1, 2014, and July 31, 2016, were included. Patient encounters with missing encounter-level covariates, such as case mix index (CMI) or attending provider identification, were excluded. The Institutional Review Board classified this project as quality improvement and did not require review and oversight.
Intervention
On July 6, 2015, our Epic (Epic Systems Corporation, Madison, WI) EHR telemetry order was modified to discourage unnecessary telemetry monitoring. The new order required providers ordering telemetry to choose a clinical indication and select a duration for monitoring, after which the order would expire and require physician renewal or discontinuation. These were the only changes that occurred for nonhospitalist providers. The nonhospitalist group included all admitting providers who were not hospitalists. This group included neurology (6.98%); cardiology (8.13%); other medical specialties such as pulmonology, hematology, and oncology (21.30%); cardiothoracic surgery (3.72%); orthopedic surgery (14.84%); general surgery (11.11%); neurosurgery (11.07%); and other surgical specialties, including urology, transplant, vascular surgery, and plastics (16.68%).
Between January 2015 and June 2015, we implemented a multicomponent program among our hospitalist service. The hospitalist service is composed of 4 teams with internal medicine residents and 2 teams with advanced practice providers, all staffed by academic hospitalists. Our program was composed of 5 elements, all of which were made before the hospital-wide changes to electronic telemetry orders and maintained throughout the study period, as follows: (1) a single provider education session reviewing available evidence (eg, AHA guidelines, Choosing Wisely® campaign), (2) removal of the telemetry order from hospitalist admission order set on March 23, 2015, (3) inclusion of telemetry discussion in the hospitalist group’s daily “Rounding Checklist,”14 (4) monthly feedback provided as part of hospitalist group meetings, and (5) a financial incentive, awarded to the division (no individual provider payment) if performance targets were met. See supplementary Appendix (“Implementation Manual”) for further details.
Data Source
We obtained data on patient age, gender, Medicare Severity-Diagnosis Related Group, Charlson comorbidity index (CCI), CMI, admitting unit, attending physician, admission and discharge dates, length of stay (LOS), 30-day readmission, bed charge (telemetry or nontelemetry), ICU stay, and inpatient mortality from the enterprise data warehouse. Telemetry days were determined through room billing charges, which are assigned based on the presence or absence of an active telemetry order at midnight. Code events came from a log kept by the hospital telephone operator, who is responsible for sending out all calls to the code team. Code event data were available starting July 19, 2014.
Measures
Our primary outcome was the percentage of hospital days that had telemetry charges for individual patients. All billed telemetry days on acute care floors were included regardless of admission status (inpatient vs observation), service, indication, or ordering provider. Secondary outcomes were inpatient mortality, escalation of care, code event rates, and appropriate telemetry utilization rates. Escalation of care was defined as transfer to an ICU after initially being admitted to an acute care floor. The code event rate was defined as the ratio of the number of code team activations to the number of patient days. Appropriate telemetry utilization rates were determined via chart review, as detailed below.
In order to evaluate changes in appropriateness of telemetry monitoring, 4 of the authors who are internal medicine physicians (KE, CC, JC, DG) performed chart reviews of 25 randomly selected patients in each group (hospitalist and nonhospitalist) before and after the intervention who received at least 1 day of telemetry monitoring. Each reviewer was provided a key based on AHA guidelines for monitoring indications and associated maximum allowable durations.3 Chart reviews were performed to determine the indication (if any) for monitoring, as well as the number of days that were indicated. The number of indicated days was compared to the number of telemetry days the patient received to determine the overall proportion of days that were indicated (“Telemetry appropriateness per visit”). Three reviewers (KE, AR, CC) also evaluated 100 patients on the hospitalist service after the intervention who did not receive any telemetry monitoring to evaluate whether patients with indications for telemetry monitoring were not receiving it after the intervention. For patients who had a possible indication, the indication was classified as Class I (“Cardiac monitoring is indicated in most, if not all, patients in this group”) or Class II (“Cardiac monitoring may be of benefit in some patients but is not considered essential for all patients”).3
Adjustment Variables
To account for differences in patient characteristics between hospitalist and nonhospitalist groups, we included age, gender, CMI, and CCI in statistical models. CCI was calculated according to the algorithm specified by Quan et al.15 using all patient diagnoses from previous visits and the index visit identified from the facility billing system.
Statistical Analysis
We computed descriptive statistics for study outcomes and visit characteristics for hospitalist and nonhospitalist visits for pre- and postintervention periods. Descriptive statistics were expressed as n (%) for categorical patient characteristics and outcome variables. For continuous patient characteristics, we expressed the variability of individual observations as the mean ± the standard deviation. For continuous outcomes, we expressed the precision of the mean estimates using standard error. Telemetry utilization per visit was weighted by the number of total acute care days per visit. Telemetry appropriateness per visit was weighted by the number of telemetry days per visit. Patients who did not receive any telemetry monitoring were included in the analysis and noted to have 0 telemetry days. All patients had at least 1 acute care day. Categorical variables were compared using χ2 tests, and continuous variables were compared using t tests. Code event rates were compared using the binomial probability mid-p exact test for person-time data.16
We fitted generalized linear regression models using generalized estimating equations to evaluate the relative change in outcomes of interest in the postintervention period compared with the preintervention period after adjusting for study covariates. The models included study group (hospitalist and nonhospitalist), time period (pre- and postintervention), an interaction term between study group and time period, and study covariates (age, gender, CMI, and CCI). The models were defined using a binomial distributional assumption and logit link function for mortality, escalation of care, and whether patients had at least 1 telemetry day. A gamma distributional assumption and log link function were used for LOS, telemetry acute care days per visit, and total acute care days per visit. A negative binomial distributional assumption and log link function were used for telemetry utilization and telemetry appropriateness. We used the log of the acute care days as an offset for telemetry utilization and the log of the telemetry days per visit as an offset for telemetry appropriateness. An exchangeable working correlation matrix was used to account for physician-level clustering for all outcomes. Intervention effects, representing the difference in odds for categorical variables and in amount for continuous variables, were calculated as exponentiation of the beta parameters for the covariate minus 1.
P values <.05 were considered significant. We used SAS version 9.4 statistical software (SAS Institute Inc., Cary, NC) for data analysis.
RESULTS

The percent of patients who had any telemetry charges decreased from 36.2% to 15.9% (P < .001) in the hospitalist group and from 31.8% to 28.0% in the nonhospitalist group (P < .001; Table 1). Rates of code events did not change over time (P = .9).
In the randomly selected sample of patients pre- and postintervention who received telemetry monitoring, there was an increase in telemetry appropriateness on the hospitalist service (46% to 72%, P = .025; Table 1). In the nonhospitalist group, appropriate telemetry utilization did not change significantly. Of the 100 randomly selected patients in the hospitalist group after the intervention who did not receive telemetry, no patient had an AHA Class I indication, and only 4 patients had a Class II indication.3,17
DISCUSSION
In this study, implementing a change in the EHR telemetry order produced reductions in telemetry days. However, when combined with a multicomponent program including education, audit and feedback, financial incentives, and changes to remove telemetry orders from admission orders sets, an even more marked improvement was seen. Neither intervention reduced LOS, increased code event rates, or increased rates of escalation of care.
Prior studies have evaluated interventions to reduce unnecessary telemetry monitoring with varying degrees of success. The most successful EHR intervention to date, from Dressler et al.,18 achieved a 70% reduction in overall telemetry use by integrating the AHA guidelines into their EHR and incorporating nursing discontinuation guidelines to ensure that telemetry discontinuation was both safe and timely. Other studies using stewardship approaches and standardized protocols have been less successful.19,20 One study utilizing a multidisciplinary approach but not including an EHR component showed modest improvements in telemetry.21
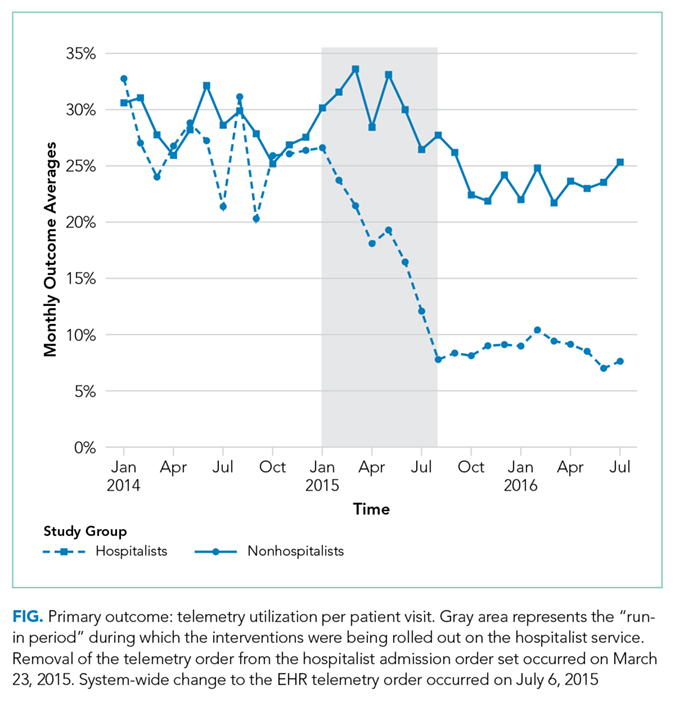
Although we are unable to differentiate the exact effect of each component of the intervention, we did note an immediate decrease in telemetry orders after removing the telemetry order from our admission order set, a trend that was magnified after the addition of broader EHR changes (Figure 1). Important additional contributors to our success seem to have been the standardization of rounds to include daily discussion of telemetry and the provision of routine feedback. We cannot discern whether other components of our program (such as the financial incentives) contributed more or less to our program, though the sum of these interventions produced an overall program that required substantial buy in and sustained focus from the hospitalist group. The importance of the hospitalist program is highlighted by the relatively large differences in improvement compared with the nonhospitalist group.
Our study has several limitations. First, the study was conducted at a single center, which may limit its generalizability. Second, the intervention was multifaceted, diminishing our ability to discern which aspects beyond the system-wide change in the telemetry order were most responsible for the observed effect among hospitalists. Third, we are unable to fully account for baseline differences in telemetry utilization between hospitalist and nonhospitalist groups. It is likely that different services utilize telemetry monitoring in different ways, and the hospitalist group may have been more aware of the existing guidelines for monitoring prior to the intervention. Furthermore, we had a limited sample size for the chart audits, which reduced the available statistical power for determining changes in the appropriateness of telemetry utilization. Additionally, because internal medicine residents rotate through various services, it is possible that the education they received on their hospitalist rotation as part of our intervention had a spillover effect in the nonhospitalist group. However, any effect should have decreased the difference between the groups. Lastly, although our postintervention time period was 1 year, we do not have data beyond that to monitor for sustainability of the results.
CONCLUSION
In this single-site study, combining EHR orders prompting physicians to choose a clinical indication and duration for monitoring with a broader program—including upstream changes in ordering as well as education, audit, and feedback—produced reductions in telemetry usage. Whether this reduction improves the appropriateness of telemetry utilization or reduces other effects of telemetry (eg, alert fatigue, calls for benign arrhythmias) cannot be discerned from our study. However, our results support the idea that multipronged approaches to telemetry use are most likely to produce improvements.
Acknowledgments
The authors thank Dr. Frank Thomas for his assistance with process engineering and Mr. Andrew Wood for his routine provision of data. The statistical analysis was supported by the University of Utah Study Design and Biostatistics Center, with funding in part from the National Center for Research Resources and the National Center for Advancing Translational Sciences, National Institutes of Health, through Grant 5UL1TR001067-05 (formerly 8UL1TR000105 and UL1RR025764).
Disclosure
The authors have no conflicts of interest to report.
1. National Health Expenditure Fact Sheet. 2015; https://www.cms.gov/Research-Statistics-Data-and-Systems/Statistics-Trends-and-Reports/NationalHealthExpendData/NHE-Fact-Sheet.html. Accessed June 27, 2017.
2. Berwick DM, Hackbarth AD. Eliminating waste in US health care. JAMA. 2012;307(14):1513-1516. PubMed
3. Drew BJ, Califf RM, Funk M, et al. Practice standards for electrocardiographic monitoring in hospital settings: an American Heart Association scientific statement from the Councils on Cardiovascular Nursing, Clinical Cardiology, and Cardiovascular Disease in the Young: endorsed by the International Society of Computerized Electrocardiology and the American Association of Critical-Care Nurses. Circulation. 2004;110(17):2721-2746. PubMed
4. Sandau KE, Funk M, Auerbach A, et al. Update to Practice Standards for Electrocardiographic Monitoring in Hospital Settings: A Scientific Statement From the American Heart Association. Circulation. 2017;136(19):e273-e344. PubMed
5. Mohammad R, Shah S, Donath E, et al. Non-critical care telemetry and in-hospital cardiac arrest outcomes. J Electrocardiol. 2015;48(3):426-429. PubMed
6. Dhillon SK, Rachko M, Hanon S, Schweitzer P, Bergmann SR. Telemetry monitoring guidelines for efficient and safe delivery of cardiac rhythm monitoring to noncritical hospital inpatients. Crit Pathw Cardiol. 2009;8(3):125-126. PubMed
7. Estrada CA, Rosman HS, Prasad NK, et al. Evaluation of guidelines for the use of telemetry in the non-intensive-care setting. J Gen Intern Med. 2000;15(1):51-55. PubMed
8. Estrada CA, Prasad NK, Rosman HS, Young MJ. Outcomes of patients hospitalized to a telemetry unit. Am J Cardiol. 1994;74(4):357-362. PubMed
9. Atzema C, Schull MJ, Borgundvaag B, Slaughter GR, Lee CK. ALARMED: adverse events in low-risk patients with chest pain receiving continuous electrocardiographic monitoring in the emergency department. A pilot study. Am J Emerg Med. 2006;24(1):62-67. PubMed
10. Schull MJ, Redelmeier DA. Continuous electrocardiographic monitoring and cardiac arrest outcomes in 8,932 telemetry ward patients. Acad Emerg Med. 2000;7(6):647-652. PubMed
11. The Joint Commission 2017 National Patient Safety Goals https://www.jointcommission.org/hap_2017_npsgs/. Accessed on February 15, 2017.
12. Joint Commission on Accreditation of Healthcare Organizations. The Joint Commission announces 2014 National Patient Safety Goal. Jt Comm Perspect. 2013;33(7):1, 3-4. PubMed
13. Bulger J, Nickel W, Messler J, et al. Choosing wisely in adult hospital medicine: five opportunities for improved healthcare value. J Hosp Med. 2013;8(9):486-492. PubMed
14. Yarbrough PM, Kukhareva PV, Horton D, Edholm K, Kawamoto K. Multifaceted intervention including education, rounding checklist implementation, cost feedback, and financial incentives reduces inpatient laboratory costs. J Hosp Med. 2016;11(5):348-354. PubMed
15. Quan H, Li B, Couris CM, et al. Updating and validating the Charlson comorbidity index and score for risk adjustment in hospital discharge abstracts using data from 6 countries. Am J Epidemiol. 2011;173(6):676-682. PubMed
16. Greenland S, Rothman KJ. Introduction to categorical statistics In: Rothman KJ, Greenland S, Lash TL, eds. Modern Epidemiology. Vol 3. Philadelphia, PA: Lippincott Williams & Wilkins; 2008: 238-257.
17. Henriques-Forsythe MN, Ivonye CC, Jamched U, Kamuguisha LK, Olejeme KA, Onwuanyi AE. Is telemetry overused? Is it as helpful as thought? Cleve Clin J Med. 2009;76(6):368-372. PubMed
18. Dressler R, Dryer MM, Coletti C, Mahoney D, Doorey AJ. Altering overuse of cardiac telemetry in non-intensive care unit settings by hardwiring the use of American Heart Association guidelines. JAMA Intern Med. 2014;174(11):1852-1854. PubMed
19. Boggan JC, Navar-Boggan AM, Patel V, Schulteis RD, Simel DL. Reductions in telemetry order duration do not reduce telemetry utilization. J Hosp Med. 2014;9(12):795-796. PubMed
20. Cantillon DJ, Loy M, Burkle A, et al. Association Between Off-site Central Monitoring Using Standardized Cardiac Telemetry and Clinical Outcomes Among Non-Critically Ill Patients. JAMA. 2016;316(5):519-524. PubMed
21. Svec D, Ahuja N, Evans KH, et al. Hospitalist intervention for appropriate use of telemetry reduces length of stay and cost. J Hosp Med. 2015;10(9):627-632. PubMed
Wasteful care may account for between 21% and 34% of the United States’ $3.2 trillion in annual healthcare expenditures, making it a prime target for cost-saving initiatives.1,2 Telemetry is a target for value improvement strategies because telemetry is overutilized, rarely leads to a change in management, and has associated guidelines on appropriate use.3-10 Telemetry use has been a focus of the Joint Commission’s National Patient Safety Goals since 2014, and it is also a focus of the Society of Hospital Medicine’s Choosing Wisely® campaign.11-13
Previous initiatives have evaluated how changes to telemetry orders or education and feedback affect telemetry use. Few studies have compared a system-wide electronic health record (EHR) approach to a multifaceted intervention. In seeking to address this gap, we adapted published guidelines from the American Heart Association (AHA) and incorporated them into our EHR ordering process.3 Simultaneously, we implemented a multifaceted quality improvement initiative and compared this combined program’s effectiveness to that of the EHR approach alone.
METHODS
Study Design, Setting, and Population
We performed a 2-group observational pre- to postintervention study at University of Utah Health. Hospital encounters of patients 18 years and older who had at least 1 inpatient acute care, nonintensive care unit (ICU) room charge and an admission date between January 1, 2014, and July 31, 2016, were included. Patient encounters with missing encounter-level covariates, such as case mix index (CMI) or attending provider identification, were excluded. The Institutional Review Board classified this project as quality improvement and did not require review and oversight.
Intervention
On July 6, 2015, our Epic (Epic Systems Corporation, Madison, WI) EHR telemetry order was modified to discourage unnecessary telemetry monitoring. The new order required providers ordering telemetry to choose a clinical indication and select a duration for monitoring, after which the order would expire and require physician renewal or discontinuation. These were the only changes that occurred for nonhospitalist providers. The nonhospitalist group included all admitting providers who were not hospitalists. This group included neurology (6.98%); cardiology (8.13%); other medical specialties such as pulmonology, hematology, and oncology (21.30%); cardiothoracic surgery (3.72%); orthopedic surgery (14.84%); general surgery (11.11%); neurosurgery (11.07%); and other surgical specialties, including urology, transplant, vascular surgery, and plastics (16.68%).
Between January 2015 and June 2015, we implemented a multicomponent program among our hospitalist service. The hospitalist service is composed of 4 teams with internal medicine residents and 2 teams with advanced practice providers, all staffed by academic hospitalists. Our program was composed of 5 elements, all of which were made before the hospital-wide changes to electronic telemetry orders and maintained throughout the study period, as follows: (1) a single provider education session reviewing available evidence (eg, AHA guidelines, Choosing Wisely® campaign), (2) removal of the telemetry order from hospitalist admission order set on March 23, 2015, (3) inclusion of telemetry discussion in the hospitalist group’s daily “Rounding Checklist,”14 (4) monthly feedback provided as part of hospitalist group meetings, and (5) a financial incentive, awarded to the division (no individual provider payment) if performance targets were met. See supplementary Appendix (“Implementation Manual”) for further details.
Data Source
We obtained data on patient age, gender, Medicare Severity-Diagnosis Related Group, Charlson comorbidity index (CCI), CMI, admitting unit, attending physician, admission and discharge dates, length of stay (LOS), 30-day readmission, bed charge (telemetry or nontelemetry), ICU stay, and inpatient mortality from the enterprise data warehouse. Telemetry days were determined through room billing charges, which are assigned based on the presence or absence of an active telemetry order at midnight. Code events came from a log kept by the hospital telephone operator, who is responsible for sending out all calls to the code team. Code event data were available starting July 19, 2014.
Measures
Our primary outcome was the percentage of hospital days that had telemetry charges for individual patients. All billed telemetry days on acute care floors were included regardless of admission status (inpatient vs observation), service, indication, or ordering provider. Secondary outcomes were inpatient mortality, escalation of care, code event rates, and appropriate telemetry utilization rates. Escalation of care was defined as transfer to an ICU after initially being admitted to an acute care floor. The code event rate was defined as the ratio of the number of code team activations to the number of patient days. Appropriate telemetry utilization rates were determined via chart review, as detailed below.
In order to evaluate changes in appropriateness of telemetry monitoring, 4 of the authors who are internal medicine physicians (KE, CC, JC, DG) performed chart reviews of 25 randomly selected patients in each group (hospitalist and nonhospitalist) before and after the intervention who received at least 1 day of telemetry monitoring. Each reviewer was provided a key based on AHA guidelines for monitoring indications and associated maximum allowable durations.3 Chart reviews were performed to determine the indication (if any) for monitoring, as well as the number of days that were indicated. The number of indicated days was compared to the number of telemetry days the patient received to determine the overall proportion of days that were indicated (“Telemetry appropriateness per visit”). Three reviewers (KE, AR, CC) also evaluated 100 patients on the hospitalist service after the intervention who did not receive any telemetry monitoring to evaluate whether patients with indications for telemetry monitoring were not receiving it after the intervention. For patients who had a possible indication, the indication was classified as Class I (“Cardiac monitoring is indicated in most, if not all, patients in this group”) or Class II (“Cardiac monitoring may be of benefit in some patients but is not considered essential for all patients”).3
Adjustment Variables
To account for differences in patient characteristics between hospitalist and nonhospitalist groups, we included age, gender, CMI, and CCI in statistical models. CCI was calculated according to the algorithm specified by Quan et al.15 using all patient diagnoses from previous visits and the index visit identified from the facility billing system.
Statistical Analysis
We computed descriptive statistics for study outcomes and visit characteristics for hospitalist and nonhospitalist visits for pre- and postintervention periods. Descriptive statistics were expressed as n (%) for categorical patient characteristics and outcome variables. For continuous patient characteristics, we expressed the variability of individual observations as the mean ± the standard deviation. For continuous outcomes, we expressed the precision of the mean estimates using standard error. Telemetry utilization per visit was weighted by the number of total acute care days per visit. Telemetry appropriateness per visit was weighted by the number of telemetry days per visit. Patients who did not receive any telemetry monitoring were included in the analysis and noted to have 0 telemetry days. All patients had at least 1 acute care day. Categorical variables were compared using χ2 tests, and continuous variables were compared using t tests. Code event rates were compared using the binomial probability mid-p exact test for person-time data.16
We fitted generalized linear regression models using generalized estimating equations to evaluate the relative change in outcomes of interest in the postintervention period compared with the preintervention period after adjusting for study covariates. The models included study group (hospitalist and nonhospitalist), time period (pre- and postintervention), an interaction term between study group and time period, and study covariates (age, gender, CMI, and CCI). The models were defined using a binomial distributional assumption and logit link function for mortality, escalation of care, and whether patients had at least 1 telemetry day. A gamma distributional assumption and log link function were used for LOS, telemetry acute care days per visit, and total acute care days per visit. A negative binomial distributional assumption and log link function were used for telemetry utilization and telemetry appropriateness. We used the log of the acute care days as an offset for telemetry utilization and the log of the telemetry days per visit as an offset for telemetry appropriateness. An exchangeable working correlation matrix was used to account for physician-level clustering for all outcomes. Intervention effects, representing the difference in odds for categorical variables and in amount for continuous variables, were calculated as exponentiation of the beta parameters for the covariate minus 1.
P values <.05 were considered significant. We used SAS version 9.4 statistical software (SAS Institute Inc., Cary, NC) for data analysis.
RESULTS
The percent of patients who had any telemetry charges decreased from 36.2% to 15.9% (P < .001) in the hospitalist group and from 31.8% to 28.0% in the nonhospitalist group (P < .001; Table 1). Rates of code events did not change over time (P = .9).
In the randomly selected sample of patients pre- and postintervention who received telemetry monitoring, there was an increase in telemetry appropriateness on the hospitalist service (46% to 72%, P = .025; Table 1). In the nonhospitalist group, appropriate telemetry utilization did not change significantly. Of the 100 randomly selected patients in the hospitalist group after the intervention who did not receive telemetry, no patient had an AHA Class I indication, and only 4 patients had a Class II indication.3,17
DISCUSSION
In this study, implementing a change in the EHR telemetry order produced reductions in telemetry days. However, when combined with a multicomponent program including education, audit and feedback, financial incentives, and changes to remove telemetry orders from admission orders sets, an even more marked improvement was seen. Neither intervention reduced LOS, increased code event rates, or increased rates of escalation of care.
Prior studies have evaluated interventions to reduce unnecessary telemetry monitoring with varying degrees of success. The most successful EHR intervention to date, from Dressler et al.,18 achieved a 70% reduction in overall telemetry use by integrating the AHA guidelines into their EHR and incorporating nursing discontinuation guidelines to ensure that telemetry discontinuation was both safe and timely. Other studies using stewardship approaches and standardized protocols have been less successful.19,20 One study utilizing a multidisciplinary approach but not including an EHR component showed modest improvements in telemetry.21
Although we are unable to differentiate the exact effect of each component of the intervention, we did note an immediate decrease in telemetry orders after removing the telemetry order from our admission order set, a trend that was magnified after the addition of broader EHR changes (Figure 1). Important additional contributors to our success seem to have been the standardization of rounds to include daily discussion of telemetry and the provision of routine feedback. We cannot discern whether other components of our program (such as the financial incentives) contributed more or less to our program, though the sum of these interventions produced an overall program that required substantial buy in and sustained focus from the hospitalist group. The importance of the hospitalist program is highlighted by the relatively large differences in improvement compared with the nonhospitalist group.
Our study has several limitations. First, the study was conducted at a single center, which may limit its generalizability. Second, the intervention was multifaceted, diminishing our ability to discern which aspects beyond the system-wide change in the telemetry order were most responsible for the observed effect among hospitalists. Third, we are unable to fully account for baseline differences in telemetry utilization between hospitalist and nonhospitalist groups. It is likely that different services utilize telemetry monitoring in different ways, and the hospitalist group may have been more aware of the existing guidelines for monitoring prior to the intervention. Furthermore, we had a limited sample size for the chart audits, which reduced the available statistical power for determining changes in the appropriateness of telemetry utilization. Additionally, because internal medicine residents rotate through various services, it is possible that the education they received on their hospitalist rotation as part of our intervention had a spillover effect in the nonhospitalist group. However, any effect should have decreased the difference between the groups. Lastly, although our postintervention time period was 1 year, we do not have data beyond that to monitor for sustainability of the results.
CONCLUSION
In this single-site study, combining EHR orders prompting physicians to choose a clinical indication and duration for monitoring with a broader program—including upstream changes in ordering as well as education, audit, and feedback—produced reductions in telemetry usage. Whether this reduction improves the appropriateness of telemetry utilization or reduces other effects of telemetry (eg, alert fatigue, calls for benign arrhythmias) cannot be discerned from our study. However, our results support the idea that multipronged approaches to telemetry use are most likely to produce improvements.
Acknowledgments
The authors thank Dr. Frank Thomas for his assistance with process engineering and Mr. Andrew Wood for his routine provision of data. The statistical analysis was supported by the University of Utah Study Design and Biostatistics Center, with funding in part from the National Center for Research Resources and the National Center for Advancing Translational Sciences, National Institutes of Health, through Grant 5UL1TR001067-05 (formerly 8UL1TR000105 and UL1RR025764).
Disclosure
The authors have no conflicts of interest to report.
1. National Health Expenditure Fact Sheet. 2015; https://www.cms.gov/Research-Statistics-Data-and-Systems/Statistics-Trends-and-Reports/NationalHealthExpendData/NHE-Fact-Sheet.html. Accessed June 27, 2017.
2. Berwick DM, Hackbarth AD. Eliminating waste in US health care. JAMA. 2012;307(14):1513-1516. PubMed
3. Drew BJ, Califf RM, Funk M, et al. Practice standards for electrocardiographic monitoring in hospital settings: an American Heart Association scientific statement from the Councils on Cardiovascular Nursing, Clinical Cardiology, and Cardiovascular Disease in the Young: endorsed by the International Society of Computerized Electrocardiology and the American Association of Critical-Care Nurses. Circulation. 2004;110(17):2721-2746. PubMed
4. Sandau KE, Funk M, Auerbach A, et al. Update to Practice Standards for Electrocardiographic Monitoring in Hospital Settings: A Scientific Statement From the American Heart Association. Circulation. 2017;136(19):e273-e344. PubMed
5. Mohammad R, Shah S, Donath E, et al. Non-critical care telemetry and in-hospital cardiac arrest outcomes. J Electrocardiol. 2015;48(3):426-429. PubMed
6. Dhillon SK, Rachko M, Hanon S, Schweitzer P, Bergmann SR. Telemetry monitoring guidelines for efficient and safe delivery of cardiac rhythm monitoring to noncritical hospital inpatients. Crit Pathw Cardiol. 2009;8(3):125-126. PubMed
7. Estrada CA, Rosman HS, Prasad NK, et al. Evaluation of guidelines for the use of telemetry in the non-intensive-care setting. J Gen Intern Med. 2000;15(1):51-55. PubMed
8. Estrada CA, Prasad NK, Rosman HS, Young MJ. Outcomes of patients hospitalized to a telemetry unit. Am J Cardiol. 1994;74(4):357-362. PubMed
9. Atzema C, Schull MJ, Borgundvaag B, Slaughter GR, Lee CK. ALARMED: adverse events in low-risk patients with chest pain receiving continuous electrocardiographic monitoring in the emergency department. A pilot study. Am J Emerg Med. 2006;24(1):62-67. PubMed
10. Schull MJ, Redelmeier DA. Continuous electrocardiographic monitoring and cardiac arrest outcomes in 8,932 telemetry ward patients. Acad Emerg Med. 2000;7(6):647-652. PubMed
11. The Joint Commission 2017 National Patient Safety Goals https://www.jointcommission.org/hap_2017_npsgs/. Accessed on February 15, 2017.
12. Joint Commission on Accreditation of Healthcare Organizations. The Joint Commission announces 2014 National Patient Safety Goal. Jt Comm Perspect. 2013;33(7):1, 3-4. PubMed
13. Bulger J, Nickel W, Messler J, et al. Choosing wisely in adult hospital medicine: five opportunities for improved healthcare value. J Hosp Med. 2013;8(9):486-492. PubMed
14. Yarbrough PM, Kukhareva PV, Horton D, Edholm K, Kawamoto K. Multifaceted intervention including education, rounding checklist implementation, cost feedback, and financial incentives reduces inpatient laboratory costs. J Hosp Med. 2016;11(5):348-354. PubMed
15. Quan H, Li B, Couris CM, et al. Updating and validating the Charlson comorbidity index and score for risk adjustment in hospital discharge abstracts using data from 6 countries. Am J Epidemiol. 2011;173(6):676-682. PubMed
16. Greenland S, Rothman KJ. Introduction to categorical statistics In: Rothman KJ, Greenland S, Lash TL, eds. Modern Epidemiology. Vol 3. Philadelphia, PA: Lippincott Williams & Wilkins; 2008: 238-257.
17. Henriques-Forsythe MN, Ivonye CC, Jamched U, Kamuguisha LK, Olejeme KA, Onwuanyi AE. Is telemetry overused? Is it as helpful as thought? Cleve Clin J Med. 2009;76(6):368-372. PubMed
18. Dressler R, Dryer MM, Coletti C, Mahoney D, Doorey AJ. Altering overuse of cardiac telemetry in non-intensive care unit settings by hardwiring the use of American Heart Association guidelines. JAMA Intern Med. 2014;174(11):1852-1854. PubMed
19. Boggan JC, Navar-Boggan AM, Patel V, Schulteis RD, Simel DL. Reductions in telemetry order duration do not reduce telemetry utilization. J Hosp Med. 2014;9(12):795-796. PubMed
20. Cantillon DJ, Loy M, Burkle A, et al. Association Between Off-site Central Monitoring Using Standardized Cardiac Telemetry and Clinical Outcomes Among Non-Critically Ill Patients. JAMA. 2016;316(5):519-524. PubMed
21. Svec D, Ahuja N, Evans KH, et al. Hospitalist intervention for appropriate use of telemetry reduces length of stay and cost. J Hosp Med. 2015;10(9):627-632. PubMed
© 2018 Society of Hospital Medicine
Multifaceted Intervention Reduces Cost
Healthcare costs continue to increase and are estimated to be approximately $3.1 trillion per year in the United States.[1] Waste is a major contributor to this cost, accounting for an estimated $910 billion/year.[2] Laboratory tests are well documented to contribute to healthcare waste, with an estimated 30% to 50% of tests for hospitalized patients being unnecessary.[3, 4, 5] This issue has been highlighted by the American Board of Internal Medicine Foundation's Choosing Wisely campaign as an area to reduce waste.[6] Evaluating this concern locally, a University Health Systems Consortium 2011 analysis indicated that the University of Utah general internal medicine hospitalist service had a higher average direct lab cost per discharge compared to top performers, indicating an opportunity for improvement.
Multiple interventions have been described in the literature to address excessive laboratory utilization, including physician education, audit and feedback, cost information display, and administrative rules restricting certain types of ordering.[7, 8, 9, 10, 11] Despite these interventions, barriers remain common and not all interventions are sustained. For example, interventions focused mainly on education see a small improvement initially that is not sustained.[4, 12, 13] Additionally, although most studies focus on individual interventions, those that target multiple factors have been found to be more successful at producing and sustaining change.[14] Therefore, the opportunity existed to incorporate multiple etiologies into a single intervention and apply a checklist to laboratory ordering to see if combined modalities could be effective at reducing laboratory costs in a sustainable manner.
In addition to cost, there is potential patient harm resulting from unnecessary laboratory testing. For prolonged hospitalizations, anemia is a well‐recognized side effect of phlebotomy,[15, 16] and a recent evaluation of cardiac surgery patients found an average cumulative blood loss due to phlebotomy of 454 mL/hospital stay.[17] The sheer number of tests ordered can lead to false positive tests that result in additional testing and monitoring. Furthermore, patients subjected to laboratory blood draws are often awakened early in the morning, which is unpleasant and could adversely affect the patient experience.
Recognizing laboratory cost as a problem, the University of Utah general internal medicine hospitalist service implemented a multifaceted quality‐improvement initiative with a goal to reduce laboratory testing. At the time of this project, University of Utah Health Care (UUHC) developed a Value Driven Outcomes (VDO) tool to give direct data related to costs of care, including the actual cost paid by the hospital to the university‐owned laboratory vendor (ARUP Laboratories, Salt Lake City, UT) for testing.[18] The hospitalist group incorporated VDO into the initiative for routine cost feedback. This study evaluates the impact of this intervention on laboratory costs.
METHODS
Design
A retrospective, controlled, interrupted time series (ITS) study was performed to compare changes in lab costs between hospitalists (intervention study group) and other providers (control study group). The intervention initiation date was February 1, 2013. The baseline period was July 1, 2012 to January 31, 2013, as that was the period in which the VDO tool became available for cost analysis prior to intervention. The intervention period was February 1, 2013 to April 30, 2014, as there was a change in the electronic health record (EHR) in May 2014 that affected data flow and could act as a major confounder. The institutional review board classified this project as quality improvement and did not require review and oversight.
Setting
UUHC is a 500‐bed academic medical center in Salt Lake City, Utah. The hospitalist service is a teaching service composed of 4 teams with internal medicine residents and medical students. The nonhospitalist services include all surgical services, as well as pulmonary, cardiology, hematology, and oncology services on which internal medicine residents rotate. All services at UUHC are staffed by academic physicians affiliated with the University of Utah School of Medicine.
Population
All patients 18 years and older admitted to the hospital to a service other than obstetrics, rehabilitation, or psychiatry between July 1, 2012 and April 30, 2014 were evaluated. Patients with missing data for outcomes or covariates were excluded.
Intervention
Initial evaluation included an informal review of patient charts and discussion with hospitalist group members, both indicating laboratory overuse. A working group was then established including hospitalists and process engineers to evaluate the workflow by which laboratory tests were ordered. Concurrently, a literature review was performed to help identify the scope of the problem and evaluate methods that had been successful at other institutions. Through this review, it was noted that interns were the most frequent orderers of tests and the largest contributors to variation of testing for inpatients.[19] Two specific studies with direct applicability to this project demonstrated that discussion of costs with attendings in a trauma intensive care unit resulted in a 30% reduction of tests ordered,[20] and discussion of testing with a senior resident in an internal medicine inpatient setting demonstrated a 20% reduction in laboratory testing.[21]
Our laboratory reduction intervention expanded on the current literature to incorporate education, process change, cost feedback, and financial incentives. Specifically, starting February 1, 2013, the following interventions were performed:
- Education of all providers involved, including the hospitalist group and all internal medicine residents at the start of their rotation with the hospitalist service. Education included a 30‐minute discussion of laboratory overuse, costs associated with laboratory overuse, previous interventions and their success, and current intervention with goals. Each resident was provided a pocket card with the most common lab tests and associated charges. Charges were used instead of costs due to concerns regarding the possible public dissemination of institutional costs.
- Standardization of the rounding process including a checklist review (see Supporting Information, Appendix, in the online version of this article) for all patients that ensured discussion of labs, telemetry, pain, lines/tubes, nursing presence, and follow‐up needed. The expectation was that all plans for lab testing would be discussed during rounds. The third‐year medical student was responsible to ensure that all items were covered daily on each patient.
- Monthly feedback at the hospitalist group meeting regarding laboratory costs using the VDO tool. Data were presented as a monthly group average and compared to preintervention baseline costs. Individual performance could be viewed and compared to other providers within the group.
- Financial incentive through a program that shares 50% of cost savings realized by the hospital with the Division of General Internal Medicine. The incentive could be used to support future quality‐improvement projects, but there was no individual physician incentive.
Data Collection and Preparation
Clinical data were collected in the inpatient EHR (Cerner Corp., Kansas City, MO) and later imported into the enterprise data warehouse (EDW) as part of the normal data flow. Billing data were imported into the EDW from the billing system. Cost data were estimated using the VDO tool developed by the University of Utah to identify clinical costs to the UUHC system.[18]
Clinical and Cost Outcomes
We hypothesized that following the intervention, the number of tests and lab costs would decrease greater for patients in the intervention group than in the control group, with no adverse effect on length of stay (LOS) or 30‐day readmissions.
Lab cost per day was calculated as the total lab cost per visit divided by the LOS. We adjusted all lab costs to 2013 US dollars using Consumer Price Index inflation data.[22] To account for different LOS, we used LOS as a weight variable when estimating descriptive characteristics and P values for lab cost per day and the number of tests. Thirty‐day readmissions included inpatient encounters followed by another inpatient encounter within 30 days excluding obstetrics, rehabilitation, and psychiatry visits.
Descriptive Variables
We included information on age at admission in years and Charlson Comorbidity Index (CCI) to evaluate differences in control and intervention groups.[23]
Statistical Analysis
First, unadjusted descriptive statistics were calculated for study outcomes and visit characteristics. Descriptive statistics were expressed as n (%) and mean standard deviation. Simple comparisons were performed based on 2 tests of homogeneity for categorical variables and on t tests for continuous variables.
Second, an ITS analysis was conducted to evaluate the impact of the intervention while accounting for baseline trends.[24] In this analysis, the dependent variable (yt) was the difference in aggregated outcome measures between the intervention and control groups every 2 weeks (eg, difference in average lab costs in a given 2‐week period between the 2 groups). Intervention impact was then evaluated in terms of changes in the level of the outcome (b2) as well as in the trend over time (b3) compared to the initial difference in means (b0) and baseline trend (b1). The following difference‐in‐differences segmented regression model was fitted using the autoreg procedure in SAS: yt = b0 + b1*timet + b2*study periodt + b3*time after the interventiont + errort, where timet is biweekly intervals after the beginning of the study, time after the interventiont is biweekly intervals after the intervention date, and study periodt is 1 postintervention and 0 preintervention. The models were fitted using maximum likelihood and stepwise autoregression to test 24 lags.
P values <0.05 were considered significant. SAS (version 9.3; SAS Institute Inc., Cary, NC) was used for data analysis.
RESULTS
We analyzed 48,327 inpatient visits that met inclusion criteria. We excluded 15,659 obstetrics, rehabilitation, and psychiatry visits. Seven hundred seventy‐two (2.4%) of the remaining visits were excluded due to missing data. A total of 31,896 inpatient visits by 22,545 patients were included in the analysis. There were 10,136 visits before the intervention and 21,760 visits after. Characteristics of the study groups for the full study timeframe (July 1, 2012April 30, 2014) are summarized in Table 1.
| Characteristic | Study Group* | |||
|---|---|---|---|---|
| Overall, N = 31,896 | Control, N = 25,586 | Intervention, N = 6,310 | P Value | |
| ||||
| Patient characteristics | ||||
| Age, y | 55.47 17.61 | 55.27 17.13 | 56.30 19.39 | <0.001 |
| Female gender | 14,995 (47%) | 11,753 (46%) | 3,242 (51%) | <0.001 |
| CCI | 3.73 3.25 | 3.61 3.17 | 4.20 3.54 | <0.001 |
| Outcomes | ||||
| Cost per day, $ | 130.95 392.16 | 131.57 423.94 | 127.68 220.40 | 0.022 |
| Cost per visit, $ | 733.75 1,693.98 | 772.30 1,847.65 | 577.40 795.29 | <0.001 |
| BMP tests per day | 0.73 1.17 | 0.74 1.19 | 0.67 1.05 | <0.001 |
| CMP tests per day | 0.20 0.67 | 0.19 0.68 | 0.26 0.62 | <0.001 |
| CBC tests per day | 0.83 1.10 | 0.84 1.15 | 0.73 0.82 | <0.001 |
| PT/INR tests per day | 0.36 1.03 | 0.36 1.07 | 0.34 0.83 | <.001 |
| LOS, d | 5.60 7.12 | 5.87 7.55 | 4.52 4.82 | <0.001 |
| 30‐day readmissions | 4,374 (14%) | 3,603 (14%) | 771 (12%) | <0.001 |
During the study period, there were 25,586 visits in the control group and 6310 visits in the intervention group. Patients in the intervention group were on average older than patients in the control group. There were more female patients in the intervention group. Mean CCI was 4.2 in the intervention group and 3.6 in the control group. The intervention group had lower LOS and 30‐day readmissions than the control group.
Descriptive statistics and simple comparisons of covariates and outcomes before and after the intervention are shown in Table 2. Age and gender distributions remained unchanged in both groups. CCI increased in the control group by 0.24 (P < 0.001) and remained unchanged in the intervention group. In the intervention group, lab cost per day was reduced from $138 before the intervention to $123 after the intervention (P < 0.001). In contrast, among control patients, cost per day increased nonsignificantly from $130 preintervention to $132 postintervention (P = 0.37). Number of tests per day significantly decreased for all specific tests in the intervention group. Readmission rates decreased significantly from 14% to 11% in the intervention group (P = 0.01). LOS remained constant in both groups.
| Characteristic* | Control | Intervention | ||||
|---|---|---|---|---|---|---|
| Preintervention, N = 8,102 | Postintervention, N = 17,484 | P Value | Preintervention, N = 2,034 | Postintervention, N = 4,276 | P Value | |
| ||||||
| Patient characteristics | ||||||
| Age, yr | 55.17 17.46 | 55.31 16.98 | 0.55 | 55.90 19.47 | 56.50 19.35 | 0.25 |
| Female gender | 3,707 (46%) | 8,046 (46%) | 0.69 | 1,039 (51%) | 2,203 (52%) | 0.74 |
| CCI | 3.45 3.06 | 3.69 3.21 | <0.001 | 4.19 3.51 | 4.20 3.56 | 0.89 |
| Outcomes | ||||||
| Cost per day, $ | 130.1 431.8 | 132.2 420.3 | 0.37 | 137.9 232.9 | 122.9 213.5 | <0.001 |
| Cost per visit, $ | 760.4 1,813.6 | 777.8 1,863.3 | 0.48 | 617.8 844.1 | 558.2 770.3 | 0.005 |
| BMP tests per day | 0.74 1.21 | 0.74 1.18 | 0.67 | 0.75 1.03 | 0.63 1.05 | <0.001 |
| CMP tests per day | 0.19 0.68 | 0.19 0.68 | 0.85 | 0.32 0.68 | 0.23 0.58 | <0.001 |
| CBC tests per day | 0.85 1.14 | 0.84 1.15 | 0.045 | 0.92 0.79 | 0.64 0.76 | <0.001 |
| PT/INR tests per day | 0.34 1.04 | 0.37 1.08 | <0.001 | 0.35 0.82 | 0.33 0.84 | 0.020 |
| LOS, d | 5.84 7.66 | 5.88 7.50 | 0.71 | 4.48 5.12 | 4.54 4.67 | 0.63 |
| 30‐day readmissions | 1,173 (14%) | 2,430 (14%) | 0.22 | 280 (14%) | 491 (11%) | 0.010 |
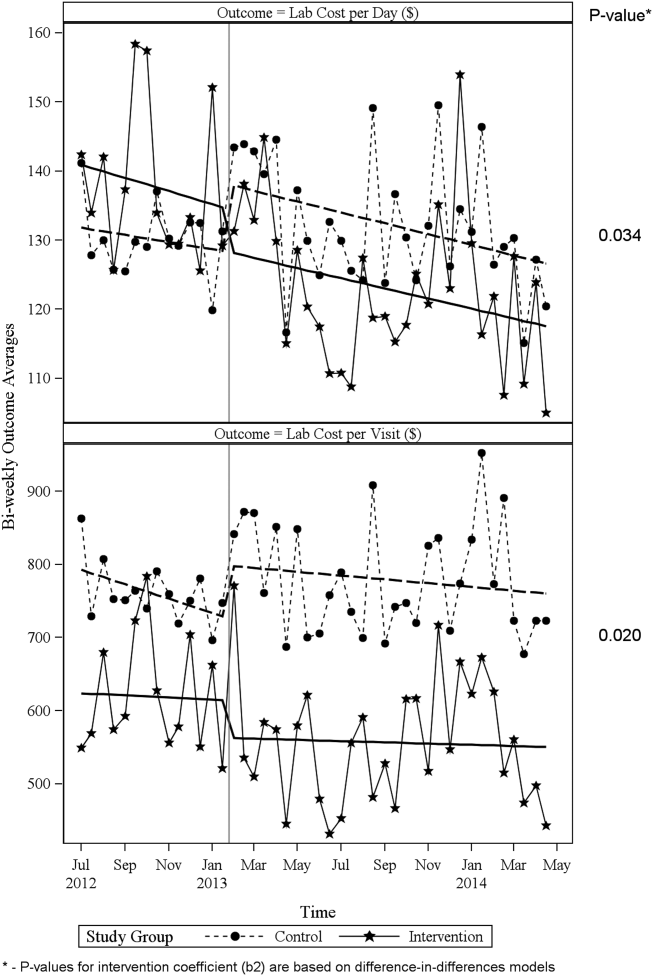
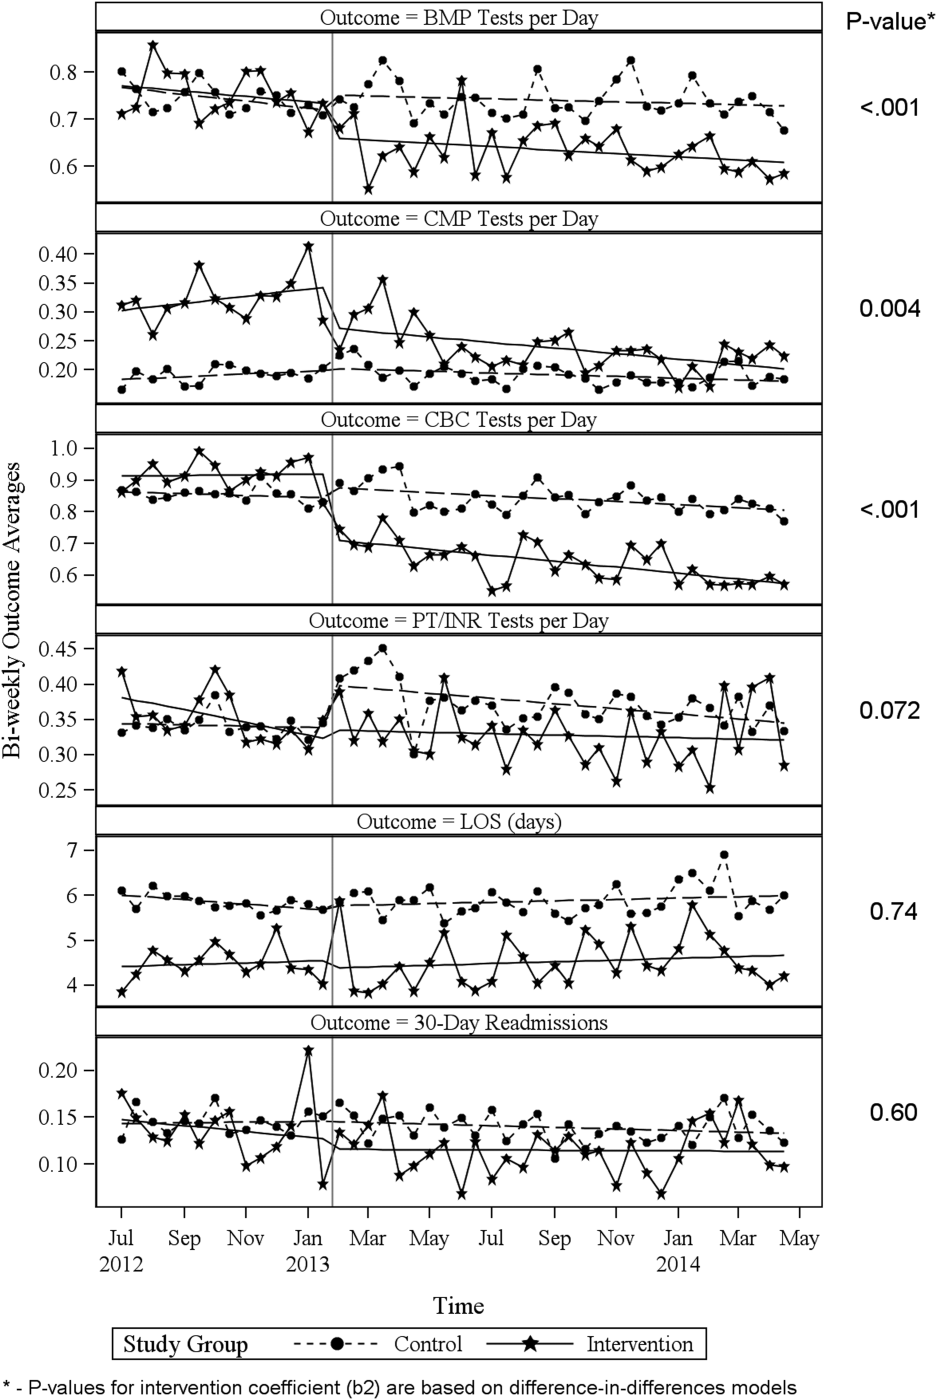
ITS analysis results are shown in Table 3. After the intervention, the difference in monthly means between the 2 groups dropped by $16 for cost per day (P = 0.034) and by $128 for cost per visit (P = 0.02). The decreased cost in the intervention group amounts to approximately $251,427 (95% confidence interval [CI]: $20,370‐$482,484) savings over the first year. If the intervention was rolled out for the control group and had a similar impact, it could have led to an additional cost savings of $1,321,669 (95% CI: 107,081‐2,536,256). Moreover, the number of basic metabolic panel, comprehensive metabolic panel, and complete blood count test per day were reduced significantly more in the intervention group compared to the control group (<0.001, 0.004, and <0.001).
| Outcome | Parameter* | Parameter Estimate | Standard Error | t Value | Pr > |t| |
|---|---|---|---|---|---|
| |||||
| Lab cost per day ($) | Baseline difference level (b0) | 9.3450 | 6.5640 | 1.4237 | 0.16 |
| Baseline difference trend (b1) | 0.2150 | 0.7709 | 0.2789 | 0.78 | |
| Change in difference level after intervention(b2) | 16.1200 | 7.3297 | 2.1993 | 0.034 | |
| Change in difference trend after intervention (b3) | 0.2388 | 0.8090 | 0.2952 | 0.77 | |
| Lab cost per visit ($) | Baseline difference level (b0) | 166.081 | 48.3425 | 3.4355 | 0.001 |
| Baseline difference trend (b1) | 3.6663 | 5.8571 | 0.6260 | 0.53 | |
| Change in difference level after intervention(b2) | 128.527 | 53.0278 | 2.4238 | 0.020 | |
| Change in difference trend after intervention (b3) | 2.2586 | 5.8463 | 0.3863 | 0.70 | |
| BMP tests per day | Baseline difference level (b0) | 0.0061 | 0.0250 | 0.2439 | 0.81 |
| Baseline difference trend (b1) | 0.0004 | 0.0030 | 0.1449 | 0.89 | |
| Change in difference level after intervention(b2) | 0.1034 | 0.0276 | 3.7426 | <0.001 | |
| Change in difference trend after intervention (b3) | 0.0014 | 0.0030 | 0.4588 | 0.65 | |
| CMP tests per day | Baseline difference level (b0) | 0.1226 | 0.0226 | 5.4302 | <0.001 |
| Baseline difference trend (b1) | 0.0015 | 0.0028 | 0.5539 | 0.58 | |
| Change in difference level after intervention(b2) | 0.0754 | 0.0248 | 3.0397 | 0.004 | |
| Change in difference trend after intervention (b3) | 0.0030 | 0.0028 | 1.0937 | 0.28 | |
| CBC tests per day | Baseline difference level (b0) | 0.0539 | 0.0190 | 2.8338 | 0.007 |
| Baseline difference trend (b1) | 0.0013 | 0.0023 | 0.5594 | 0.58 | |
| Change in difference level after intervention(b2) | 0.2343 | 0.0213 | 10.997 | <0.001 | |
| Change in difference trend after intervention (b3) | 0.0036 | 0.0023 | 1.5539 | 0.13 | |
| PT/INR tests per day | Baseline difference level (b0) | 0.0413 | 0.0242 | 1.7063 | 0.096 |
| Baseline difference trend (b1) | 0.0040 | 0.0028 | 1.4095 | 0.17 | |
| Change in difference level after intervention(b2) | 0.0500 | 0.0270 | 1.8507 | 0.072 | |
| Change in difference trend after intervention (b3) | 0.0054 | 0.0030 | 1.7940 | 0.080 | |
| LOS, d | Baseline difference level (b0) | 1.4211 | 0.2746 | 5.1743 | <0.001 |
| Baseline difference trend (b1) | 0.0093 | 0.0333 | 0.2807 | 0.78 | |
| Change in difference level after intervention(b2) | 0.1007 | 0.2988 | 0.3368 | 0.74 | |
| Change in difference trend after intervention (b3) | 0.0053 | 0.0331 | 0.1588 | 0.87 | |
| 30‐day readmissions | Baseline difference level (b0) | 0.0057 | 0.0185 | 0.3084 | 0.76 |
| Baseline difference trend (b1) | 0.0017 | 0.0022 | 0.8016 | 0.43 | |
| Change in difference level after intervention(b2) | 0.0110 | 0.0206 | 0.5315 | 0.60 | |
| Change in difference trend after intervention (b3) | 0.0021 | 0.0023 | 0.9111 | 0.37 | |
Figure 1 shows a graphical representation of the biweekly means for the 2 primary outcomeslab cost per day and lab cost per visit. Figure 2 shows all other outcomes. To the right of each figure, P values are provided for the b2 coefficients from Table 3.
DISCUSSION
Through a multifaceted quality‐improvement initiative, the UUHC hospitalist group was able to reduce lab cost per day and per visit as well as commonly ordered routine labs as compared to an institutional control group. A multifaceted approach was selected given the literature supporting this approach as the most likely method to sustain improvement.[14] At the same time, the use of a multifaceted intervention makes it difficult to rigorously determine the relative impact of different components of the intervention. In discussing this issue, however, the hospitalist group felt that the driving factors for change were those related to process change, specifically, the use of a standardized rounding checklist to discuss lab testing and the routine review of lab costs at group meetings. The ultimate goal was to change the culture of routine test ordering into a thoughtful process of needed tests and thereby reduce costs. Prior to this intervention, the least experienced person on this team (the intern) ordered any test he or she wanted, usually without discussion. The intervention focused on this issue through standardized supervision and explicit discussion of laboratory tests. Importantly, although improvements from education initiatives typically decrease over time, the incorporation of process change in this intervention was felt to likely contribute to the sustained reduction seen at 15 months. Although use of the rounding checklist added another step to daily rounds, the routine cost feedback, including comparisons to peers, helped encourage use of the checklist. Thus, we feel that routine feedback was essential to sustaining the intervention and its impact.
Inappropriate and unnecessary testing has been recognized for decades, and multiple interventions have been attempted, including a recent article that demonstrated a 10% reduction in common laboratory ordering through an initiative mainly focused on education and ordering feedback.[25] Despite reported success of several interventions, none have combined multiple interventions and explicitly required discussion of laboratory tests on rounds. For example, although the UUHC intervention used Attali et al.[21] and Barie and Hydo's[20] work to develop the intervention, neither of these studies described how laboratory testing was discussed with the attending or supervising resident. The UUHC intervention thus builds on the current literature by combining other successful modalities with explicit discussion of laboratory testing via a rounding checklist and feedback with the novel VDO tool to reduce laboratory costs. A major strength of this intervention is the relatively low cost and the generalizability of implementing rounding checklists. Initial support from the hospital was needed to provide accurate VDO information to the hospitalist group. However, ongoing costs were minimal and related to any additional time spent during rounds to discuss laboratory tests. Thus, we feel that this intervention is feasible for wide replication.
Another strength of the study is the use of the VDO tool to measure actual costs. Whereas previous studies have relied on estimated costs with extrapolation to potential cost savings, this study used direct costs to the institution as a more accurate marker of cost savings. Additionally, most studies on lab utilization have used a before/after analysis without a control group. The presence of a control group for this analysis is important to help assess for institutional trends that may not be reflected in a before/after intervention. The reduction in cost in the intervention group despite a trend toward increased cost in the institutional control group supports the impact of this intervention.
Limitations of this study include that it was a single‐center, controlled ITS study and not a randomized controlled trial. Related to this limitation, the control group reflected a different patient population compared to the intervention group, with a longer LOS, lower CCI, and inclusion of nonmedical patients. However, these differences were relatively stable before and after the intervention. Also, ITS is considered one of the most robust research designs outside of randomized controlled trials, and it accounts for baseline differences in both levels and trends.[24] Nevertheless, it remains possible that secular trends existed that we did not capture and that affected the 2 populations differently.
A further limitation is that the baseline period was only 7 months and the intervention was 15 months. As the 7 months started in July, this could have reflected the time when interns were least experienced with ordering. Unfortunately, we did not have VDO availability for a full year prior to the intervention. We believe that any major effect due to this shortened baseline period should have been seen in the control group as well, and therefore accounted for in the analysis. Additionally, it is possible that there was spillover of the intervention to the control group, as internal medicine residents rotated throughout the hospital to other medical services (pulmonary, cardiology, hematology, and oncology). However, any effect of their rotation should have been to lower the control lab cost, thus making differences less profound.
CONCLUSIONS
A multifaceted approach to laboratory reduction through education, process change, cost feedback, and financial incentive resulted in a significant reduction in laboratory cost per day, laboratory cost per visit, and the ordering of common laboratory tests at a major academic medical center.
Acknowledgements
The authors thank Mr. Michael Swanicke for his assistance in process engineering, Mr. Tony Clawson for his routine provision of VDO data, and Ms. Selma Lopez for her editorial support.
Disclosures: K.K. is or has been a consultant on clinical decision support (CDS) or electronic clinical quality measurement to the US Office of the National Coordinator for Health IT, ARUP Laboratories, McKesson InterQual, ESAC, Inc., JBS International, Inc., Inflexxion, Inc., Intelligent Automation, Inc., Partners HealthCare, Mayo Clinic, and the RAND Corporation. K.K. receives royalties for a Duke University‐owned CDS technology for infectious disease management known as CustomID that he helped develop. K.K. was formerly a consultant for Religent, Inc. and a co‐owner and consultant for Clinica Software, Inc., both of which provide commercial CDS services, including through use of a CDS technology known as SEBASTIAN that K.K. developed. K.K. no longer has a financial relationship with either Religent or Clinica Software. K.K. has no competing interest with any specific product or intervention evaluated in this article. All other authors declare no competing interests.
- , , , et al. National health expenditure projections, 2014–24: spending growth faster than recent trends. Health Aff (Millwood). 2015;34(8):1407–1417.
- , . Eliminating waste in US health care. JAMA. 2012;307(14):1513–1516.
- , , , et al. Utilization of arterial blood gas measurements in a large tertiary care hospital. Am J Clin Pathol. 2007;127:604–609.
- , . Strategies to promote rational clinical chemistry test utilization. Clin Biochem. 1996;29:291–299.
- , , , , . The landscape of inappropriate laboratory testing: a 15‐year meta‐analysis. PLoS One. 2013;8:e78962.
- ABIM Choosing Wisely Society of Hospital Medicine–Adult Hospital Medicine. Five things physicians and patients should question. Available at: http://www.choosingwisely.org/societies/society‐of‐hospital‐medicine‐adult. Published February 21, 2013. Accessed September 2, 2015.
- , , , , , . Effect of daily charge feedback on inpatient charges and physician knowledge and behavior. Arch Intern Med. 1989;149:426–429.
- , , , et al. A utilization management intervention to reduce unnecessary testing in the coronary care unit. Arch Intern Med. 2002;162:1885–1890.
- , , , et al. The impact of peer management on test‐ordering behavior. Ann Intern Med. 2004;141:196–204.
- , , , , . An administrative intervention to improve the utilization of laboratory tests within a university hospital. Int J Qual Health Care. 2005;17:243–248.
- , , , et al. Impact of providing fee data on laboratory test ordering. JAMA Intern Med. 2013;173(10):903–908.
- , , , et al. The failure of physician education as a cost containment strategy. JAMA. 1984;252:225–230.
- . Is that lab test necessary? Am J Clin Pathol. 2006;126:335–336.
- , , , . Techniques to improve physicians' use of diagnostic tests. JAMA. 1998;280:2020–2027.
- , , . Laboratory testing in the intensive care unit. Crit Care Clin. 2007;23:435–465.
- . Complications of critical care: lab testing and iatrogenic anemia. MLO Med Lab Obs. 200;33(10):28–31.
- , , , et al. Contemporary bloodletting in cardiac surgical care. Ann Thorac Surg. 2015;99:779–785.
- , , , et al. Value Driven Outcomes (VDO): a pragmatic, modular, and extensible software framework for understanding and improving health care costs and outcomes. J Am Med Inform Assoc. 2015:22:223–235.
- , , . The impact of residents, interns, and attendings on inpatient laboratory ordering patterns: a report from one university's hospitalist service. Acad Med. 2011;86:139–145.
- , . Learning to not know: results of a program for ancillary cost reduction in surgical care. J Trauma. 1996;41:714–720.
- , , , et al. A cost‐effective method for reducing the volume of laboratory tests in a university‐associated teaching hospital. Mt Sinai J Med. 2006;73:787–794.
- US Bureau of Labor Statistics. CPI inflation calculator. Available at: http://www.bls.gov/data/inflation_calculator.htm. Accessed May 22, 2015.
- , , , et al. Coding algorithms for defining comorbidities in ICD‐9‐CM and ICD‐10 administrative data. Med Care. 2005;43:113–1139.
- , , , . Segmented regression analysis of interrupted time series studies in medication use research. J Clin Pharm Ther. 2002;27(4):299–309.
- , , , et al. A multifaceted hospitalist quality improvement intervention: decreased frequency of common labs. J Hosp Med. 2015;10:390–395.
Healthcare costs continue to increase and are estimated to be approximately $3.1 trillion per year in the United States.[1] Waste is a major contributor to this cost, accounting for an estimated $910 billion/year.[2] Laboratory tests are well documented to contribute to healthcare waste, with an estimated 30% to 50% of tests for hospitalized patients being unnecessary.[3, 4, 5] This issue has been highlighted by the American Board of Internal Medicine Foundation's Choosing Wisely campaign as an area to reduce waste.[6] Evaluating this concern locally, a University Health Systems Consortium 2011 analysis indicated that the University of Utah general internal medicine hospitalist service had a higher average direct lab cost per discharge compared to top performers, indicating an opportunity for improvement.
Multiple interventions have been described in the literature to address excessive laboratory utilization, including physician education, audit and feedback, cost information display, and administrative rules restricting certain types of ordering.[7, 8, 9, 10, 11] Despite these interventions, barriers remain common and not all interventions are sustained. For example, interventions focused mainly on education see a small improvement initially that is not sustained.[4, 12, 13] Additionally, although most studies focus on individual interventions, those that target multiple factors have been found to be more successful at producing and sustaining change.[14] Therefore, the opportunity existed to incorporate multiple etiologies into a single intervention and apply a checklist to laboratory ordering to see if combined modalities could be effective at reducing laboratory costs in a sustainable manner.
In addition to cost, there is potential patient harm resulting from unnecessary laboratory testing. For prolonged hospitalizations, anemia is a well‐recognized side effect of phlebotomy,[15, 16] and a recent evaluation of cardiac surgery patients found an average cumulative blood loss due to phlebotomy of 454 mL/hospital stay.[17] The sheer number of tests ordered can lead to false positive tests that result in additional testing and monitoring. Furthermore, patients subjected to laboratory blood draws are often awakened early in the morning, which is unpleasant and could adversely affect the patient experience.
Recognizing laboratory cost as a problem, the University of Utah general internal medicine hospitalist service implemented a multifaceted quality‐improvement initiative with a goal to reduce laboratory testing. At the time of this project, University of Utah Health Care (UUHC) developed a Value Driven Outcomes (VDO) tool to give direct data related to costs of care, including the actual cost paid by the hospital to the university‐owned laboratory vendor (ARUP Laboratories, Salt Lake City, UT) for testing.[18] The hospitalist group incorporated VDO into the initiative for routine cost feedback. This study evaluates the impact of this intervention on laboratory costs.
METHODS
Design
A retrospective, controlled, interrupted time series (ITS) study was performed to compare changes in lab costs between hospitalists (intervention study group) and other providers (control study group). The intervention initiation date was February 1, 2013. The baseline period was July 1, 2012 to January 31, 2013, as that was the period in which the VDO tool became available for cost analysis prior to intervention. The intervention period was February 1, 2013 to April 30, 2014, as there was a change in the electronic health record (EHR) in May 2014 that affected data flow and could act as a major confounder. The institutional review board classified this project as quality improvement and did not require review and oversight.
Setting
UUHC is a 500‐bed academic medical center in Salt Lake City, Utah. The hospitalist service is a teaching service composed of 4 teams with internal medicine residents and medical students. The nonhospitalist services include all surgical services, as well as pulmonary, cardiology, hematology, and oncology services on which internal medicine residents rotate. All services at UUHC are staffed by academic physicians affiliated with the University of Utah School of Medicine.
Population
All patients 18 years and older admitted to the hospital to a service other than obstetrics, rehabilitation, or psychiatry between July 1, 2012 and April 30, 2014 were evaluated. Patients with missing data for outcomes or covariates were excluded.
Intervention
Initial evaluation included an informal review of patient charts and discussion with hospitalist group members, both indicating laboratory overuse. A working group was then established including hospitalists and process engineers to evaluate the workflow by which laboratory tests were ordered. Concurrently, a literature review was performed to help identify the scope of the problem and evaluate methods that had been successful at other institutions. Through this review, it was noted that interns were the most frequent orderers of tests and the largest contributors to variation of testing for inpatients.[19] Two specific studies with direct applicability to this project demonstrated that discussion of costs with attendings in a trauma intensive care unit resulted in a 30% reduction of tests ordered,[20] and discussion of testing with a senior resident in an internal medicine inpatient setting demonstrated a 20% reduction in laboratory testing.[21]
Our laboratory reduction intervention expanded on the current literature to incorporate education, process change, cost feedback, and financial incentives. Specifically, starting February 1, 2013, the following interventions were performed:
- Education of all providers involved, including the hospitalist group and all internal medicine residents at the start of their rotation with the hospitalist service. Education included a 30‐minute discussion of laboratory overuse, costs associated with laboratory overuse, previous interventions and their success, and current intervention with goals. Each resident was provided a pocket card with the most common lab tests and associated charges. Charges were used instead of costs due to concerns regarding the possible public dissemination of institutional costs.
- Standardization of the rounding process including a checklist review (see Supporting Information, Appendix, in the online version of this article) for all patients that ensured discussion of labs, telemetry, pain, lines/tubes, nursing presence, and follow‐up needed. The expectation was that all plans for lab testing would be discussed during rounds. The third‐year medical student was responsible to ensure that all items were covered daily on each patient.
- Monthly feedback at the hospitalist group meeting regarding laboratory costs using the VDO tool. Data were presented as a monthly group average and compared to preintervention baseline costs. Individual performance could be viewed and compared to other providers within the group.
- Financial incentive through a program that shares 50% of cost savings realized by the hospital with the Division of General Internal Medicine. The incentive could be used to support future quality‐improvement projects, but there was no individual physician incentive.
Data Collection and Preparation
Clinical data were collected in the inpatient EHR (Cerner Corp., Kansas City, MO) and later imported into the enterprise data warehouse (EDW) as part of the normal data flow. Billing data were imported into the EDW from the billing system. Cost data were estimated using the VDO tool developed by the University of Utah to identify clinical costs to the UUHC system.[18]
Clinical and Cost Outcomes
We hypothesized that following the intervention, the number of tests and lab costs would decrease greater for patients in the intervention group than in the control group, with no adverse effect on length of stay (LOS) or 30‐day readmissions.
Lab cost per day was calculated as the total lab cost per visit divided by the LOS. We adjusted all lab costs to 2013 US dollars using Consumer Price Index inflation data.[22] To account for different LOS, we used LOS as a weight variable when estimating descriptive characteristics and P values for lab cost per day and the number of tests. Thirty‐day readmissions included inpatient encounters followed by another inpatient encounter within 30 days excluding obstetrics, rehabilitation, and psychiatry visits.
Descriptive Variables
We included information on age at admission in years and Charlson Comorbidity Index (CCI) to evaluate differences in control and intervention groups.[23]
Statistical Analysis
First, unadjusted descriptive statistics were calculated for study outcomes and visit characteristics. Descriptive statistics were expressed as n (%) and mean standard deviation. Simple comparisons were performed based on 2 tests of homogeneity for categorical variables and on t tests for continuous variables.
Second, an ITS analysis was conducted to evaluate the impact of the intervention while accounting for baseline trends.[24] In this analysis, the dependent variable (yt) was the difference in aggregated outcome measures between the intervention and control groups every 2 weeks (eg, difference in average lab costs in a given 2‐week period between the 2 groups). Intervention impact was then evaluated in terms of changes in the level of the outcome (b2) as well as in the trend over time (b3) compared to the initial difference in means (b0) and baseline trend (b1). The following difference‐in‐differences segmented regression model was fitted using the autoreg procedure in SAS: yt = b0 + b1*timet + b2*study periodt + b3*time after the interventiont + errort, where timet is biweekly intervals after the beginning of the study, time after the interventiont is biweekly intervals after the intervention date, and study periodt is 1 postintervention and 0 preintervention. The models were fitted using maximum likelihood and stepwise autoregression to test 24 lags.
P values <0.05 were considered significant. SAS (version 9.3; SAS Institute Inc., Cary, NC) was used for data analysis.
RESULTS
We analyzed 48,327 inpatient visits that met inclusion criteria. We excluded 15,659 obstetrics, rehabilitation, and psychiatry visits. Seven hundred seventy‐two (2.4%) of the remaining visits were excluded due to missing data. A total of 31,896 inpatient visits by 22,545 patients were included in the analysis. There were 10,136 visits before the intervention and 21,760 visits after. Characteristics of the study groups for the full study timeframe (July 1, 2012April 30, 2014) are summarized in Table 1.
| Characteristic | Study Group* | |||
|---|---|---|---|---|
| Overall, N = 31,896 | Control, N = 25,586 | Intervention, N = 6,310 | P Value | |
| ||||
| Patient characteristics | ||||
| Age, y | 55.47 17.61 | 55.27 17.13 | 56.30 19.39 | <0.001 |
| Female gender | 14,995 (47%) | 11,753 (46%) | 3,242 (51%) | <0.001 |
| CCI | 3.73 3.25 | 3.61 3.17 | 4.20 3.54 | <0.001 |
| Outcomes | ||||
| Cost per day, $ | 130.95 392.16 | 131.57 423.94 | 127.68 220.40 | 0.022 |
| Cost per visit, $ | 733.75 1,693.98 | 772.30 1,847.65 | 577.40 795.29 | <0.001 |
| BMP tests per day | 0.73 1.17 | 0.74 1.19 | 0.67 1.05 | <0.001 |
| CMP tests per day | 0.20 0.67 | 0.19 0.68 | 0.26 0.62 | <0.001 |
| CBC tests per day | 0.83 1.10 | 0.84 1.15 | 0.73 0.82 | <0.001 |
| PT/INR tests per day | 0.36 1.03 | 0.36 1.07 | 0.34 0.83 | <.001 |
| LOS, d | 5.60 7.12 | 5.87 7.55 | 4.52 4.82 | <0.001 |
| 30‐day readmissions | 4,374 (14%) | 3,603 (14%) | 771 (12%) | <0.001 |
During the study period, there were 25,586 visits in the control group and 6310 visits in the intervention group. Patients in the intervention group were on average older than patients in the control group. There were more female patients in the intervention group. Mean CCI was 4.2 in the intervention group and 3.6 in the control group. The intervention group had lower LOS and 30‐day readmissions than the control group.
Descriptive statistics and simple comparisons of covariates and outcomes before and after the intervention are shown in Table 2. Age and gender distributions remained unchanged in both groups. CCI increased in the control group by 0.24 (P < 0.001) and remained unchanged in the intervention group. In the intervention group, lab cost per day was reduced from $138 before the intervention to $123 after the intervention (P < 0.001). In contrast, among control patients, cost per day increased nonsignificantly from $130 preintervention to $132 postintervention (P = 0.37). Number of tests per day significantly decreased for all specific tests in the intervention group. Readmission rates decreased significantly from 14% to 11% in the intervention group (P = 0.01). LOS remained constant in both groups.
| Characteristic* | Control | Intervention | ||||
|---|---|---|---|---|---|---|
| Preintervention, N = 8,102 | Postintervention, N = 17,484 | P Value | Preintervention, N = 2,034 | Postintervention, N = 4,276 | P Value | |
| ||||||
| Patient characteristics | ||||||
| Age, yr | 55.17 17.46 | 55.31 16.98 | 0.55 | 55.90 19.47 | 56.50 19.35 | 0.25 |
| Female gender | 3,707 (46%) | 8,046 (46%) | 0.69 | 1,039 (51%) | 2,203 (52%) | 0.74 |
| CCI | 3.45 3.06 | 3.69 3.21 | <0.001 | 4.19 3.51 | 4.20 3.56 | 0.89 |
| Outcomes | ||||||
| Cost per day, $ | 130.1 431.8 | 132.2 420.3 | 0.37 | 137.9 232.9 | 122.9 213.5 | <0.001 |
| Cost per visit, $ | 760.4 1,813.6 | 777.8 1,863.3 | 0.48 | 617.8 844.1 | 558.2 770.3 | 0.005 |
| BMP tests per day | 0.74 1.21 | 0.74 1.18 | 0.67 | 0.75 1.03 | 0.63 1.05 | <0.001 |
| CMP tests per day | 0.19 0.68 | 0.19 0.68 | 0.85 | 0.32 0.68 | 0.23 0.58 | <0.001 |
| CBC tests per day | 0.85 1.14 | 0.84 1.15 | 0.045 | 0.92 0.79 | 0.64 0.76 | <0.001 |
| PT/INR tests per day | 0.34 1.04 | 0.37 1.08 | <0.001 | 0.35 0.82 | 0.33 0.84 | 0.020 |
| LOS, d | 5.84 7.66 | 5.88 7.50 | 0.71 | 4.48 5.12 | 4.54 4.67 | 0.63 |
| 30‐day readmissions | 1,173 (14%) | 2,430 (14%) | 0.22 | 280 (14%) | 491 (11%) | 0.010 |
ITS analysis results are shown in Table 3. After the intervention, the difference in monthly means between the 2 groups dropped by $16 for cost per day (P = 0.034) and by $128 for cost per visit (P = 0.02). The decreased cost in the intervention group amounts to approximately $251,427 (95% confidence interval [CI]: $20,370‐$482,484) savings over the first year. If the intervention was rolled out for the control group and had a similar impact, it could have led to an additional cost savings of $1,321,669 (95% CI: 107,081‐2,536,256). Moreover, the number of basic metabolic panel, comprehensive metabolic panel, and complete blood count test per day were reduced significantly more in the intervention group compared to the control group (<0.001, 0.004, and <0.001).
| Outcome | Parameter* | Parameter Estimate | Standard Error | t Value | Pr > |t| |
|---|---|---|---|---|---|
| |||||
| Lab cost per day ($) | Baseline difference level (b0) | 9.3450 | 6.5640 | 1.4237 | 0.16 |
| Baseline difference trend (b1) | 0.2150 | 0.7709 | 0.2789 | 0.78 | |
| Change in difference level after intervention(b2) | 16.1200 | 7.3297 | 2.1993 | 0.034 | |
| Change in difference trend after intervention (b3) | 0.2388 | 0.8090 | 0.2952 | 0.77 | |
| Lab cost per visit ($) | Baseline difference level (b0) | 166.081 | 48.3425 | 3.4355 | 0.001 |
| Baseline difference trend (b1) | 3.6663 | 5.8571 | 0.6260 | 0.53 | |
| Change in difference level after intervention(b2) | 128.527 | 53.0278 | 2.4238 | 0.020 | |
| Change in difference trend after intervention (b3) | 2.2586 | 5.8463 | 0.3863 | 0.70 | |
| BMP tests per day | Baseline difference level (b0) | 0.0061 | 0.0250 | 0.2439 | 0.81 |
| Baseline difference trend (b1) | 0.0004 | 0.0030 | 0.1449 | 0.89 | |
| Change in difference level after intervention(b2) | 0.1034 | 0.0276 | 3.7426 | <0.001 | |
| Change in difference trend after intervention (b3) | 0.0014 | 0.0030 | 0.4588 | 0.65 | |
| CMP tests per day | Baseline difference level (b0) | 0.1226 | 0.0226 | 5.4302 | <0.001 |
| Baseline difference trend (b1) | 0.0015 | 0.0028 | 0.5539 | 0.58 | |
| Change in difference level after intervention(b2) | 0.0754 | 0.0248 | 3.0397 | 0.004 | |
| Change in difference trend after intervention (b3) | 0.0030 | 0.0028 | 1.0937 | 0.28 | |
| CBC tests per day | Baseline difference level (b0) | 0.0539 | 0.0190 | 2.8338 | 0.007 |
| Baseline difference trend (b1) | 0.0013 | 0.0023 | 0.5594 | 0.58 | |
| Change in difference level after intervention(b2) | 0.2343 | 0.0213 | 10.997 | <0.001 | |
| Change in difference trend after intervention (b3) | 0.0036 | 0.0023 | 1.5539 | 0.13 | |
| PT/INR tests per day | Baseline difference level (b0) | 0.0413 | 0.0242 | 1.7063 | 0.096 |
| Baseline difference trend (b1) | 0.0040 | 0.0028 | 1.4095 | 0.17 | |
| Change in difference level after intervention(b2) | 0.0500 | 0.0270 | 1.8507 | 0.072 | |
| Change in difference trend after intervention (b3) | 0.0054 | 0.0030 | 1.7940 | 0.080 | |
| LOS, d | Baseline difference level (b0) | 1.4211 | 0.2746 | 5.1743 | <0.001 |
| Baseline difference trend (b1) | 0.0093 | 0.0333 | 0.2807 | 0.78 | |
| Change in difference level after intervention(b2) | 0.1007 | 0.2988 | 0.3368 | 0.74 | |
| Change in difference trend after intervention (b3) | 0.0053 | 0.0331 | 0.1588 | 0.87 | |
| 30‐day readmissions | Baseline difference level (b0) | 0.0057 | 0.0185 | 0.3084 | 0.76 |
| Baseline difference trend (b1) | 0.0017 | 0.0022 | 0.8016 | 0.43 | |
| Change in difference level after intervention(b2) | 0.0110 | 0.0206 | 0.5315 | 0.60 | |
| Change in difference trend after intervention (b3) | 0.0021 | 0.0023 | 0.9111 | 0.37 | |
Figure 1 shows a graphical representation of the biweekly means for the 2 primary outcomeslab cost per day and lab cost per visit. Figure 2 shows all other outcomes. To the right of each figure, P values are provided for the b2 coefficients from Table 3.
DISCUSSION
Through a multifaceted quality‐improvement initiative, the UUHC hospitalist group was able to reduce lab cost per day and per visit as well as commonly ordered routine labs as compared to an institutional control group. A multifaceted approach was selected given the literature supporting this approach as the most likely method to sustain improvement.[14] At the same time, the use of a multifaceted intervention makes it difficult to rigorously determine the relative impact of different components of the intervention. In discussing this issue, however, the hospitalist group felt that the driving factors for change were those related to process change, specifically, the use of a standardized rounding checklist to discuss lab testing and the routine review of lab costs at group meetings. The ultimate goal was to change the culture of routine test ordering into a thoughtful process of needed tests and thereby reduce costs. Prior to this intervention, the least experienced person on this team (the intern) ordered any test he or she wanted, usually without discussion. The intervention focused on this issue through standardized supervision and explicit discussion of laboratory tests. Importantly, although improvements from education initiatives typically decrease over time, the incorporation of process change in this intervention was felt to likely contribute to the sustained reduction seen at 15 months. Although use of the rounding checklist added another step to daily rounds, the routine cost feedback, including comparisons to peers, helped encourage use of the checklist. Thus, we feel that routine feedback was essential to sustaining the intervention and its impact.
Inappropriate and unnecessary testing has been recognized for decades, and multiple interventions have been attempted, including a recent article that demonstrated a 10% reduction in common laboratory ordering through an initiative mainly focused on education and ordering feedback.[25] Despite reported success of several interventions, none have combined multiple interventions and explicitly required discussion of laboratory tests on rounds. For example, although the UUHC intervention used Attali et al.[21] and Barie and Hydo's[20] work to develop the intervention, neither of these studies described how laboratory testing was discussed with the attending or supervising resident. The UUHC intervention thus builds on the current literature by combining other successful modalities with explicit discussion of laboratory testing via a rounding checklist and feedback with the novel VDO tool to reduce laboratory costs. A major strength of this intervention is the relatively low cost and the generalizability of implementing rounding checklists. Initial support from the hospital was needed to provide accurate VDO information to the hospitalist group. However, ongoing costs were minimal and related to any additional time spent during rounds to discuss laboratory tests. Thus, we feel that this intervention is feasible for wide replication.
Another strength of the study is the use of the VDO tool to measure actual costs. Whereas previous studies have relied on estimated costs with extrapolation to potential cost savings, this study used direct costs to the institution as a more accurate marker of cost savings. Additionally, most studies on lab utilization have used a before/after analysis without a control group. The presence of a control group for this analysis is important to help assess for institutional trends that may not be reflected in a before/after intervention. The reduction in cost in the intervention group despite a trend toward increased cost in the institutional control group supports the impact of this intervention.
Limitations of this study include that it was a single‐center, controlled ITS study and not a randomized controlled trial. Related to this limitation, the control group reflected a different patient population compared to the intervention group, with a longer LOS, lower CCI, and inclusion of nonmedical patients. However, these differences were relatively stable before and after the intervention. Also, ITS is considered one of the most robust research designs outside of randomized controlled trials, and it accounts for baseline differences in both levels and trends.[24] Nevertheless, it remains possible that secular trends existed that we did not capture and that affected the 2 populations differently.
A further limitation is that the baseline period was only 7 months and the intervention was 15 months. As the 7 months started in July, this could have reflected the time when interns were least experienced with ordering. Unfortunately, we did not have VDO availability for a full year prior to the intervention. We believe that any major effect due to this shortened baseline period should have been seen in the control group as well, and therefore accounted for in the analysis. Additionally, it is possible that there was spillover of the intervention to the control group, as internal medicine residents rotated throughout the hospital to other medical services (pulmonary, cardiology, hematology, and oncology). However, any effect of their rotation should have been to lower the control lab cost, thus making differences less profound.
CONCLUSIONS
A multifaceted approach to laboratory reduction through education, process change, cost feedback, and financial incentive resulted in a significant reduction in laboratory cost per day, laboratory cost per visit, and the ordering of common laboratory tests at a major academic medical center.
Acknowledgements
The authors thank Mr. Michael Swanicke for his assistance in process engineering, Mr. Tony Clawson for his routine provision of VDO data, and Ms. Selma Lopez for her editorial support.
Disclosures: K.K. is or has been a consultant on clinical decision support (CDS) or electronic clinical quality measurement to the US Office of the National Coordinator for Health IT, ARUP Laboratories, McKesson InterQual, ESAC, Inc., JBS International, Inc., Inflexxion, Inc., Intelligent Automation, Inc., Partners HealthCare, Mayo Clinic, and the RAND Corporation. K.K. receives royalties for a Duke University‐owned CDS technology for infectious disease management known as CustomID that he helped develop. K.K. was formerly a consultant for Religent, Inc. and a co‐owner and consultant for Clinica Software, Inc., both of which provide commercial CDS services, including through use of a CDS technology known as SEBASTIAN that K.K. developed. K.K. no longer has a financial relationship with either Religent or Clinica Software. K.K. has no competing interest with any specific product or intervention evaluated in this article. All other authors declare no competing interests.
- , , , et al. National health expenditure projections, 2014–24: spending growth faster than recent trends. Health Aff (Millwood). 2015;34(8):1407–1417.
- , . Eliminating waste in US health care. JAMA. 2012;307(14):1513–1516.
- , , , et al. Utilization of arterial blood gas measurements in a large tertiary care hospital. Am J Clin Pathol. 2007;127:604–609.
- , . Strategies to promote rational clinical chemistry test utilization. Clin Biochem. 1996;29:291–299.
- , , , , . The landscape of inappropriate laboratory testing: a 15‐year meta‐analysis. PLoS One. 2013;8:e78962.
- ABIM Choosing Wisely Society of Hospital Medicine–Adult Hospital Medicine. Five things physicians and patients should question. Available at: http://www.choosingwisely.org/societies/society‐of‐hospital‐medicine‐adult. Published February 21, 2013. Accessed September 2, 2015.
- , , , , , . Effect of daily charge feedback on inpatient charges and physician knowledge and behavior. Arch Intern Med. 1989;149:426–429.
- , , , et al. A utilization management intervention to reduce unnecessary testing in the coronary care unit. Arch Intern Med. 2002;162:1885–1890.
- , , , et al. The impact of peer management on test‐ordering behavior. Ann Intern Med. 2004;141:196–204.
- , , , , . An administrative intervention to improve the utilization of laboratory tests within a university hospital. Int J Qual Health Care. 2005;17:243–248.
- , , , et al. Impact of providing fee data on laboratory test ordering. JAMA Intern Med. 2013;173(10):903–908.
- , , , et al. The failure of physician education as a cost containment strategy. JAMA. 1984;252:225–230.
- . Is that lab test necessary? Am J Clin Pathol. 2006;126:335–336.
- , , , . Techniques to improve physicians' use of diagnostic tests. JAMA. 1998;280:2020–2027.
- , , . Laboratory testing in the intensive care unit. Crit Care Clin. 2007;23:435–465.
- . Complications of critical care: lab testing and iatrogenic anemia. MLO Med Lab Obs. 200;33(10):28–31.
- , , , et al. Contemporary bloodletting in cardiac surgical care. Ann Thorac Surg. 2015;99:779–785.
- , , , et al. Value Driven Outcomes (VDO): a pragmatic, modular, and extensible software framework for understanding and improving health care costs and outcomes. J Am Med Inform Assoc. 2015:22:223–235.
- , , . The impact of residents, interns, and attendings on inpatient laboratory ordering patterns: a report from one university's hospitalist service. Acad Med. 2011;86:139–145.
- , . Learning to not know: results of a program for ancillary cost reduction in surgical care. J Trauma. 1996;41:714–720.
- , , , et al. A cost‐effective method for reducing the volume of laboratory tests in a university‐associated teaching hospital. Mt Sinai J Med. 2006;73:787–794.
- US Bureau of Labor Statistics. CPI inflation calculator. Available at: http://www.bls.gov/data/inflation_calculator.htm. Accessed May 22, 2015.
- , , , et al. Coding algorithms for defining comorbidities in ICD‐9‐CM and ICD‐10 administrative data. Med Care. 2005;43:113–1139.
- , , , . Segmented regression analysis of interrupted time series studies in medication use research. J Clin Pharm Ther. 2002;27(4):299–309.
- , , , et al. A multifaceted hospitalist quality improvement intervention: decreased frequency of common labs. J Hosp Med. 2015;10:390–395.
© 2016 Society of Hospital Medicine

Evidence‐Based Care for Cellulitis
Cellulitis is a common infection causing inflammation of the skin and subcutaneous tissues. Cellulitis has been attributed to gram‐positive organisms through historical evaluations including fine‐needle aspirates and punch biopsies of the infected tissue.[1] Neither of these diagnostic tests is currently used due to their invasiveness, poor diagnostic yield, and availability. Similarly, readily available tests such as blood cultures provide an etiology <5% of the time[1] and are not cost‐effective for most patients for diagnosing cellulitis.[2] In addition, the prevalence of methicillin‐resistant Staphylococcus aureus (MRSA) has steadily increased, complicating decisions about antibiotic selection.[3] The result of this uncertainty is a large variation in practice with respect to antibiotic and imaging selection for patients with a diagnosis of cellulitis.
University of Utah Health Care (UUHC) performed benchmarking for the management of cellulitis using the University HealthSystem Consortium (UHC) database and associated CareFx analytics tool. Benchmarking demonstrated that UUHC had a greater percentage of broad‐spectrum antibiotic use (defined as vancomycin, piperacillin/tazobactam, or carbapenems) than the top 5 performing UHC facilities for International Classification of Diseases, Ninth Revision, Clinical Modification (ICD‐9‐CM) diagnoses of cellulitis (vancomycin 83% vs 58% and carbapenem or piperacillin/tazobactam 44% vs 16%). Advanced imaging (computed tomography [CT] or magnetic resonance imaging [MRI]) for the diagnosis of cellulitis was also found to be an opportunity for improvement (CT 27% vs 20% and MRI 8% vs 5%). The hospitalist group (most patients admitted with cellulitis were on this service) believed these data reflected current practice, as there was no standard of treatment for cellulitis despite an active order set. Therefore, cellulitis was considered an opportunity to improve value to our patients. A standardized clinical care pathway was created, as such pathways have demonstrated a reduction in variation in practice and improved efficiency and effectiveness of care for multiple disease states including cellulitis.[4, 5] We hypothesized that implementation of an evidence‐based care pathway would decrease broad‐spectrum antibiotic use, cost, and use of advanced imaging without having any adverse effects on clinical outcomes such as length of stay (LOS) or readmission.
METHODS
Study Setting and Population
UUHC is a 500‐bed academic medical center in Salt Lake City, Utah. All patients admitted to the emergency department observation unit (EDOU) or the hospital with a primary ICD‐9‐CM diagnosis of cellulitis between July 1, 2011 and December 31, 2013 were evaluated.
Intervention
Initial steps involved the formation of a multidisciplinary team including key stakeholders from the hospitalist group, infectious diseases, the emergency department (ED), and nursing. This multidisciplinary team was charged with developing a clinical care pathway appropriate for local implementation. National guidance for the care pathway was mainly obtained from the Infectious Disease Society of America (IDSA) guidelines on skin and soft tissue infections (SSTIs)[6] and MRSA.[7] Specific attention was paid to recommendations on blood cultures (only when systemically ill), imaging (rarely needed), antibiotic selection (rarely gram‐negative coverage and consideration of MRSA coverage), and patient‐care principles that are often overlooked (elevation of the affected extremity). A distinction of purulent versus nonpurulent cellulitis was adopted based on the guidelines and a prospective evaluation of the care of patients with nonpurulent cellulitis.[8] The 2014 IDSA update on SSTIs incorporates this distinction more clearly in hopes of determining staphylococcal versus streptococcal infections.[9] After multiple iterations, an agreed‐upon care pathway was created that excluded patients with neutropenia, osteomyelitis, diabetic foot ulcerations; hand, perineal, periorbital, or surgical site infections; and human or animal bites (Figure 1). After the care pathway was determined, interventions were performed to implement this change.
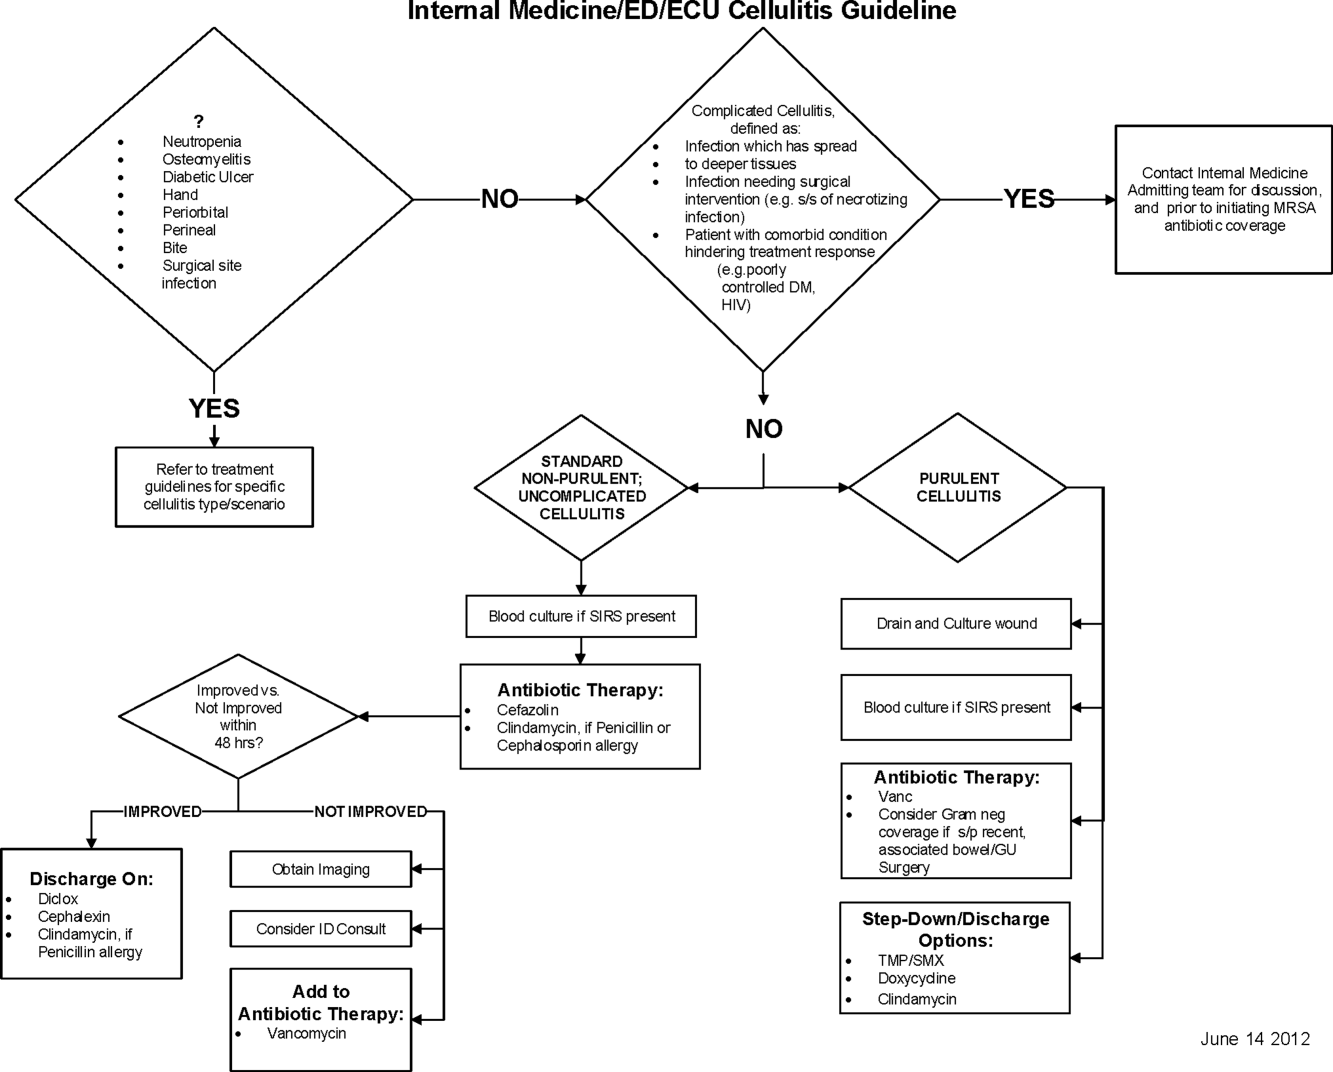
Education of all providers involved included discussion of cellulitis as a disease process, presentation of benchmarking data, dissemination of the care pathway to hospitalist and ED physicians, teaching conferences for internal medicine residents and ED residents, and reinforcement of these concepts at the beginning of resident rotations.
Incorporation of the care pathway into the existing electronic order sets for cellulitis care in the inpatient and ED settings, with links to the care pathway, links to excluded disease processes (eg, hand cellulitis), preselection of commonly needed items (eg, elevate leg), and recommendations for antibiotic selection based on categories of purulent or nonpurulent cellulitis. The electronic health record (EHR) did not allow for forced order set usage, so the order set required selection by the admitting physician if indicated. Additionally, an embedded 48‐hour order set could be accessed at any time by the ordering physician and included vancomycin dosing. Specific changes to the preexisting order set included the development of sections for purulent and nonpurulent cellulitis as well as recommended antibiotics. Piperacillin/tazobactam and nafcillin were both removed and vancomycin was limited to the purulent subheading. Additionally, elevation of the extremity was preselected, and orderables for imaging (chest x‐ray and duplex ultrasound), antiulcer prophylaxis, telemetry, and electrocardiograph were all removed.
Audit and feedback of cases of cellulitis and broad‐spectrum antibiotic usage was performed by a senior hospitalist.
Study Design
A retrospective before/after study was performed to assess overall impact of the intervention on the patient population. Additionally, a retrospective controlled pre‐/postintervention study was performed to compare changes in cellulitis management for visits where order sets were used with visits where order sets were not used. The intervention initiation date was July 9, 2012. The institutional review board classified this project as quality improvement and did not require review and oversight.
Study Population
We analyzed 2278 ED and inpatient visits for cellulitis, of which 677 met inclusion criteria. We partitioned visits into 2 groups: (1) those for which order sets were used (n = 370) and (2) control visits for which order sets were not used (n = 307). We analyzed outcomes for 2 subpopulations: hospitalized patients for whom the EDOU or admission order sets were used (n = 149) and patients not admitted and only seen in the EDOU for whom the EDOU order set was used (n = 262).
Inclusion Criteria
Inclusion criteria included hospital admission or admission to the EDOU between July 1, 2011 and December 31, 2013, age greater or equal to 18 years, and primary diagnosis of cellulitis as determined by ICD‐9‐CM billing codes 035, 457.2, 681, 681.0, 681.00, 681.01, 681.02, 681.1, 681.10, 681.11, 681.9, 680, 680.0‐9, 682.0‐9, 684, 685.0, 685.1, 686.00, 686.01, 686.09, 686.1, 686.8, 686.9, 910.1, 910.5, 910.7, 910.9, 911.1, 911.3, 911.5, 911.7, 911.9, 912.1, 912.3, 912.5, 912.7, 912.9, 913.1, 913.3, 913.5, 913.7, 913.9, 914.1, 914.3, 914.5, 914.7, 914.9, 915.1, 915.3, 915.5, 915.7, 915.9, 916.1, 916.3, 916.5, 916.7, 916.9, 917.1, 917.3, 917.5, 917.7, 917.9, 919.1, 919.3, 919.5, 919.7, or 919.9.
Data Collection and Preparation
Clinical data were collected in the inpatient EHR (Cerner Corp., Kansas City, MO) and later imported into the enterprise data warehouse (EDW) as part of the normal data flow. Billing data were imported into the EDW from the billing system. Cost data were estimated using the value‐driven outcomes (VDO) tool developed by the University of Utah to identify clinical costs to the UUHC system.[10] All data were extracted from the EDW on September 10, 2014.
Process Metrics, Clinical, and Cost Outcomes
We defined 1 primary outcome (use of broad‐spectrum antibiotics) and 8 secondary outcomes, including process metrics (MRI and CT orders), clinical outcomes (LOS and 30‐day readmissions), and cost outcomes (pharmacy, lab, imaging cost from radiology department, and total facility cost). Broad‐spectrum antibiotics were defined as any use of meropenem (UUHC's carbapenem), piperacillin/tazobactam, or vancomycin and were determined by orders. Thirty‐day readmissions included only inpatient encounters with the primary diagnosis of cellulitis.
Covariates
To control for patient demographics we included age at admission in years and gender into the statistical model. To control for background health state as well as cellulitis severity, we included Charlson Comorbidity Index (CCI) and hospitalization status. CCI was calculated according to the algorithm specified by Quan et al.[11]
Study Hypotheses
First, for all patients, we hypothesized that process metrics as well as clinical and cost outcomes would improve following the implementation of the care pathway. To evaluate this hypothesis, we estimated impact of the time interval (pre‐/postintervention) on all outcomes. Second, we hypothesized that among patients for whom order sets were used (which we deemed to be a proxy for following the agreed‐upon care pathway), there would be a greater improvement than in patients for whom order sets were not used. To evaluate this hypothesis, we estimated interactions between order set use and time period (pre‐/postintervention) for all outcomes.
Statistical Analysis
The variable time period was created to represent the time period before and after the intervention.
We provided unadjusted descriptive statistics for study outcomes and visit characteristics for all patients before and after intervention. Descriptive statistics were expressed as n (%) and mean standard deviation. Simple comparisons were performed based on 2 test of homogeneity for categorical variables and t test or Wilcoxon test for continuous variables.
For before/after analysis, we fitted generalized linear regression models to estimate the change in outcomes of interest before and after intervention for all patients simultaneously. Generalized linear model defined by a binomial distributional assumption and logit link function was used to estimate the effect of the intervention on antibiotic use, imaging orders, and readmission adjusting for effects of age, gender, CCI, and hospitalization status. A generalized linear model defined by a gamma distributional assumption and log link function was used to estimate effect of the intervention on clinical LOS and cost outcomes adjusting for the effects of the same covariates. Generalized linear models with gamma distributional assumptions were used because they are known to perform well even for zero‐inflated semicontinuous cost variables and are easier to interpret than 2‐part models.
For the controlled before/after analysis, the variable order set used was created to represent groups where order sets were used or not used. Similarly, generalized linear models were used to estimate differential effect of the intervention at 2 different order set use levels using an interaction term between order set use and the time period.
P values <0.05 were considered significant. We used SAS version 9.3 statistical software (SAS Institute Inc., Cary, NC) for data analysis.
RESULTS
Descriptive Characteristics
Patient characteristics before and after intervention for 677 EDOU and inpatient visits for cellulitis by 618 patients are summarized in the first 4 columns of Table 1. Patient age at admission ranged from 18 to 98 years. Thirty‐eight percent of visits were by female patients. There were 274 visits before the intervention and 403 visits after. Four hundred thirty‐two (64%) were admitted, and 295 (44%) were seen in the EDOU. The admission order set alone was used for 104 visits, the EDOU order set alone was used for 242 visits, and both order sets were used for 24 visits.
| Characteristic | Overall | Order Sets Not Used | Order Sets Used | ||||||
|---|---|---|---|---|---|---|---|---|---|
| Baseline, N = 274 | Intervention, N = 403 | P* | Baseline, N = 127 | Intervention, N = 180 | P* | Baseline, N = 147 | Intervention, N = 223 | P* | |
| |||||||||
| Patient Characteristics | |||||||||
| Age, y | 46.8 16.0 | 48.9 17.1 | 0.097 | 49.8 16.0 | 5.1 16.3 | 0.88 | 44.2 15.5 | 48.0 17.6 | 0.032 |
| Female gender | 105 (38%) | 155 (39%) | 0.93 | 50 (39%) | 74 (41%) | 0.73 | 55 (37%) | 81 (36%) | 0.86 |
| CCI | 2.6 3.2 | 2.6 3.0 | 0.69 | 3.2 3.5 | 3.2 3.2 | 0.82 | 2.0 2.8 | 2.1 2.7 | 0.68 |
| Clinical process characteristics | |||||||||
| EDOU admission | 122 (45%) | 173 (43%) | 0.68 | 12 (9%) | 19 (11%) | 0.75 | 110 (75%) | 154 (69%) | 0.23 |
| Hospital admission | 173 (63%) | 259 (64%) | 0.76 | 117 (92%) | 166 (92%) | 0.98 | 56 (38%) | 93 (42%) | 0.49 |
| EDOU order set used | 111 (41%) | 155 (38%) | 0.59 | NA | NA | NA | 111 (76%) | 155 (70%) | 0.21 |
| ADM order set used | 47 (17%) | 81 (20%) | 0.34 | NA | NA | NA | 47 (32%) | 81 (36%) | 0.39 |
| Process outcomes | |||||||||
| Broad‐spectrum antibiotics used | 205 (75%) | 230 (57%) | <0.001 | 90 (71%) | 121 (67%) | 0.50 | 115 (78%) | 109 (49%) | <0.001 |
| MRI done | 27 (10%) | 32 (8%) | 0.39 | 13 (10%) | 20 (11%) | 0.81 | 14 (10%) | 12 (5%) | 0.13 |
| CT done | 56 (20%) | 76 (19%) | 0.61 | 32 (25%) | 43 (24%) | 0.79 | 24 (16%) | 33 (15%) | 0.69 |
| Clinical outcomes | |||||||||
| Length of stay, d | 2.7 2.6 | 2.6 2.8 | 0.35 | 3.6 2.8 | 3.8 3.4 | 0.62 | 2.0 2.1 | 1.7 1.6 | 0.48 |
| 30‐day readmission | 14 (5%) | 17 (4%) | 0.59 | 7 (6%) | 9 (5%) | 0.84 | 7 (5%) | 8 (4%) | 0.58 |
| Cost outcomes | |||||||||
| Pharmacy cost ($) | 1 | 0.76 | 0.002 | 1 | 0.89 | 0.13 | 1 | 0.56 | 0.004 |
| Lab cost ($) | 1 | 0.52 | <0.001 | 1 | 0.53 | 0.001 | 1 | 0.51 | 0.055 |
| Imaging cost ($) | 1 | 0.82 | 0.11 | 1 | 0.95 | 0.52 | 1 | 0.67 | 0.13 |
| Total facility cost ($) | 1 | 0.85 | 0.027 | 1 | 0.91 | 0.042 | 1 | 0.77 | 0.26 |
Before/After Analysis
Among all patients, use of broad‐spectrum antibiotics decreased from 75% to 57% (Table 1). Analysis adjusted for gender, age at admission, CCI, and hospital admission status is provided in Table 2. Overall, there was a 59% decrease in the odds of ordering broad‐spectrum antibiotics (P < 0.001), a 23% decrease in pharmacy cost (P = 0.002), a 44% decrease in laboratory cost (P < 0.001), and a 13% decrease in total facility cost (P = 0.006).
| Logistic Regression | ||||
|---|---|---|---|---|
| Outcome Variables | Selected Predictor Variables | Odds* | Percent Change | P |
| Gamma Regression | ||||
| Outcome Variables | Selected Predictor Variables | Fold Change* | Percent Change | P |
| ||||
| Antibiotics used | Time period | 0.41 (0.29, 0.59) | 59% (71% to 41%) | <0.001 |
| MRI done | Time period | 0.74 (0.43, 1.30) | 26% (57% to 30%) | 0.29 |
| CT done | Time period | 0.92 (0.62, 1.36) | 8% (38% to 36%) | 0.67 |
| 30‐day readmission | Time period | 0.86 (0.41, 1.80) | 14% (59% to 80%) | 0.69 |
| Length of stay, d | Time period | 0.97 (0.91, 1.03) | 3% (9% to 3%) | 0.34 |
| Pharmacy cost ($) | Time period | 0.77 (0.65, 0.91) | 23% (35% to 9%) | 0.002 |
| Lab cost ($) | Time period | 0.56 (0.48, 0.65) | 44% (52% to 35%) | <0.001 |
| Imaging cost($) | Time period | 0.90 (0.71, 1.14) | 10% (29% to 14%) | 0.38 |
| Total facility cost ($) | Time Period | 0.87 (0.79, 0.96) | 13% (21% to 4%) | 0.006 |
Order Set Use Groups Analysis
Descriptive statistics and simple comparison before/after the intervention for the 2 study groups are shown in the last 6 columns of Table 1. Among patients for whom order sets were used, broad‐spectrum antibiotic usage significantly decreased from 78% before the intervention to 49% after the intervention (P < 0.001). In contrast, among patients for whom order sets were not used, broad‐spectrum antibiotic usage remained relatively constant71% before the intervention versus 67% after the intervention (P = 0.50). Figure 2 shows semiannual changes in the prescription of broad‐spectrum antibiotics. There is a noticeable drop after the intervention among patients for whom order sets were used.
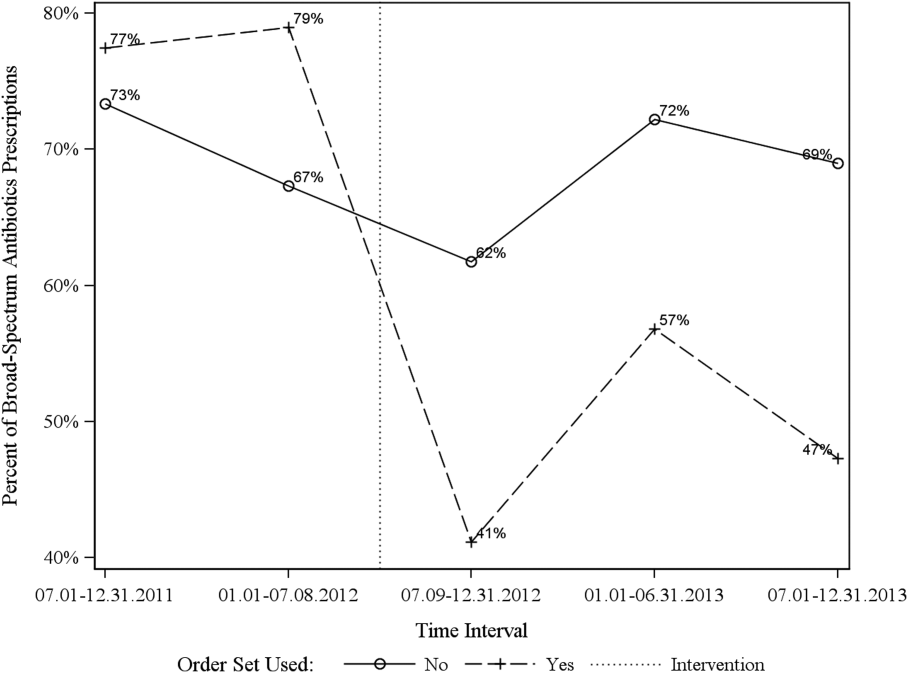
Analysis of the interaction between time period and order set usage is provided in Table 3. After the intervention, patients for whom the order sets were used had greater improvement in broad‐spectrum antibiotic selection (75% decrease, P < 0.001) and LOS (25% decrease, P = 0.041) than patients for whom order sets were not used. Pharmacy costs also decreased by 13% more among patients for whom the order sets were used, although the interaction was not statistically significant (P = 0.074). Laboratory costs decreased in both groups, but order set use did not demonstrate an interaction (P = 0.5). Similar results were found for the subgroups of admitted patients and patients seen in the EDOU.
| Logistic Regression | ||||
|---|---|---|---|---|
| Outcome Variables | Selected Predictor Variables | Odds* | Percent Change | P |
| Gamma Regression | ||||
| Outcome Variables | Selected Predictor Variables | Fold Change* | Percent Change | P |
| ||||
| Broad spectrum antibiotics | Time period | 0.84 (0.50, 1.40) | 16% (50% to 40%) | 0.50 |
| Time periodorder set | 0.25 (0.12, 0.52) | 75% (88% to 48%) | <0.001 | |
| MRI done | Time period | 1.04 (0.49, 2.20) | 4% (51% to 120%) | 0.92 |
| Time periodorder set | 0.44 (0.14, 1.38) | 56% (86% to 38%) | 0.16 | |
| CT done | Time period | 0.94 (0.55, 1.60) | 6% (45% to 60%) | 0.81 |
| Time periodorder set | 0.96 (0.44, 2.12) | 4% (56% to 112%) | 0.93 | |
| 30‐day readmission | Time period | 0.91 (0.33, 2.53) | 9% (67% to 153%) | 0.86 |
| Time periodorder set | 0.88 (0.20, 3.93) | 12% (80% to 293%) | 0.87 | |
| Clinical length of stay | Time period | 1.04 (0.95, 1.14) | 4% (5% to 14%) | 0.41 |
| Time periodorder set | 0.87 (0.77, 0.99) | 13% (23% to 1%) | 0.041 | |
| Pharmacy cost ($) | Time period | 0.88 (0.70, 1.12) | 12% (30% to 12%) | 0.31 |
| Time periodorder set | 0.75 (0.54, 1.03) | 25% (46% to 3%) | 0.074 | |
| Lab cost ($) | Time period | 0.53 (0.42, 0.66) | 47% (58% to 34%) | <0.001 |
| Time periodorder set | 1.11 (0.82, 1.50) | 11% (18% to 50%) | 0.50 | |
| Imaging cost ($) | Time period | 1.00 (0.71, 1.40) | 0% (29% to 40%) | 0.98 |
| Time periodorder set | 0.82 (0.51, 1.30) | 18% (49% to 30%) | 0.39 | |
| Facility cost ($) | Time period | 0.92 (0.80, 1.05) | 8% (20% to 5%) | 0.22 |
| Time periodorder set | 0.90 (0.75, 1.09) | 10% (25% to 9%) | 0.29 | |
Audit and feedback was initially performed for cases of cellulitis using broad‐spectrum antibiotics. However, given the complexity of cellulitis as a disease process and the frequency of broad‐spectrum antibiotic usage, in all cases of review, it was deemed reasonable to use broad‐spectrum antibiotics. Therefore, the audit was not continued.
DISCUSSION
Care pathways have demonstrated improvement across multiple different disease states including cellulitis.[4, 5] They have been noted to reduce variation in practice and improve physician agreement about treatment options.[4] The best method for implementation is not clearly understood,[12] and there remains concern about maintaining flexibility for patient care.[13] Additionally, although implementation of pathways is often well described, evaluations of the processes are noted to frequently be weak.[12] UUHC felt that the literature supported implementing a care pathway for the diagnosis of cellulitis, but that a thorough evaluation was also needed to understand any resulting benefits or harms. Through this study, we found that the implementation of this pathway resulted in a significant decrease in broad‐spectrum antibiotic use, pharmacy costs, and total facility costs. There was also a trend to decrease in imaging cost, and there were no adverse effects on LOS or 30‐day readmissions. Our findings demonstrate that care‐pathway implementation accompanied by education, pathway‐compliant electronic order sets, and audit and feedback can help drive improvements in quality while reducing costs. This finding furthers the evidence supporting standard work through the creation of clinical care pathways for cellulitis as an effective intervention.[4] Additionally, although not measured in this study, reduction of antibiotic use is supported as a measure to help reduce Clostridium difficile infections, a further potential benefit.[14]
This study has several important strengths. First, we included accurate cost analyses using the VDO tool. Given the increasing importance of improving care value, we feel the inclusion of such cost analysis is an increasingly important aspect of health service intervention evaluations. Second, we used a formal benchmarking approach to identify a priority care improvement area and to monitor changes in practice following the rollout of the intervention. We feel this approach provides a useful example on how to systematically improve care quality and value in a broader health system context. Third, we evaluated not order set implementation per se, but rather changing an existing order set. Because studies in this area generally focus on initial order set implementation, our study contributes insights on what can be expected through modifications of existing order sets based on care pathways. Fourth, the analysis accounted for a variety of variables including the CCI. Of interest, our study found that the intervention group (patients for whom order sets were used) had a lower CCI, confirming Allen et al.'s findings that diseases with predictable trajectories are the most likely to benefit from care pathways.[4] As a final strength, the narrative‐based order set intervention was relatively simple, and the inclusion criteria were broad, making the process generalizable.
Limitations of this study include that it was a single center pre‐/postintervention study and not a randomized controlled trial. Related to this limitation, the control group for which order sets were not used reflected a different patient population compared to the intervention group for which order sets were used. Specifically, it was more common for order sets to be used in the EDOU than upon admission, resulting in the order set group consisting of patients with less comorbidities than patients in the nonorder set group. Additionally, patients in the order set intervention group were older than in the baseline group (48.0 vs 44.2 years). However, these differences in population remained relatively stable before and after the intervention, and relevant variables including demographic factors and CCI were accounted for in the regression models. Nevertheless, it remains possible that secular trends existed that we did not capture that affected the 2 populations differently. For example, there was a separate project that overlapped with the intervention period to reduce unnecessary laboratory usage at UUHC. This intervention could have influenced the trend to decreased laboratory utilization in the postintervention period. However, there were no concurrent initiatives to reduce antibiotic use during the study period. As a final limitation, the statistical analyses have not corrected for multiple testing for the secondary outcomes.
CONCLUSION
Using benchmark data from UHC, an academic medical center was able to identify an opportunity for improving the care of patients with cellulitis and subsequently develop an evidence‐based care pathway. The implementation of this pathway correlated with a significant reduction of broad‐spectrum antibiotic use, pharmacy costs, and total facility costs without adverse clinical affects. An important factor in the success of the intervention was the use of electronic order sets for cellulitis, which provided support for the implementation of the care pathway. This study demonstrates that the intervention was not only effective overall, but that it was more effective for those patients for whom the order set was used. This study adds to the growing body of literature suggesting that a well‐defined care pathway can improve outcomes and reduce costs for patients and institutions.
Acknowledgements
The authors thank Ms. Pam Proctor for her assistance in implementation of the care pathway and Ms. Selma Lopez for her editorial assistance.
Disclosures: K.K. is or has been a consultant on clinical decision support (CDS) or electronic clinical quality measurement to the US Office of the National Coordinator for Health Information Technology, ARUP Laboratories, McKesson InterQual, ESAC, Inc., JBS International, Inc., Inflexxion, Inc., Intelligent Automation, Inc., Partners HealthCare, Mayo Clinic, and the RAND Corporation. K.K. receives royalties for a Duke Universityowned CDS technology for infectious disease management known as CustomID that he helped develop. K.K. was formerly a consultant for Religent, Inc. and a co‐owner and consultant for Clinica Software, Inc., both of which provide commercial CDS services, including through use of a CDS technology known as SEBASTIAN that K.K. developed. K.K. no longer has a financial relationship with either Religent or Clinica Software. K.K. has no competing interest with any specific product or intervention evaluated in this manuscript. All other authors declare no competing interests.
- . Cellulitis. N Engl J Med. 2004;350(9):904–912.
- , , , , , . Cost‐effectiveness of blood cultures for adult patients with cellulitis. Clin Infect Dis. 1999;29(6):1483–1488.
- , , , et al. Methicillin‐resistant s. aureus infectious among patients in the emergency department. N Engl J Med. 2006;355:666–674.
- , , . Systematic review of the effectiveness of integrated care pathways: what works, for whom, in which circumstances? Int J Evid Based Healthc. 2009;7:61–74.
- . Decreased antibiotic utilization after implementation of a guideline for inpatient cellulitis and cutaneous abscess. Arch Intern Med. 2011;171(12):1072–1079.
- , , , et al. Practice guidelines for the diagnosis and management of skin and soft‐tissue infections. Clin Infect Dis. 2005;41:1373–1406.
- , , , et al. Clinical practice guidelines by the Infectious Disease Society of American for the treatment of methicillin‐resistant Staphylococcus aureus infectious in adults and children. Clin Infect Dis. 2011;42:1–38.
- , , , . The role of b‐hemolytic streptococci in causing diffuse, nonculturable cellulitis. Medicine. 2010;89:217–226.
- , , , et al. Practice guidelines for the diagnosis and management of skin and soft tissue infections: 2014 update by the Infectious Disease Society of America. Clin Infect Dis. 2014;59(2):147–159.
- , , , et al. Value driven outcomes (VDO): a pragmatic, modular, and extensible software framework for understanding and improving health care costs and outcomes. J Am Med Inform Assoc. 2015;22(1):223–235.
- , , , et al. Coding algorithms for defining comorbidities in ICD‐9‐CM and ICD‐10 administrative data. Med Care. 2005;43:113–1139.
- , . Computerization of workflows, guidelines, and care pathways: a review of implementation challenges for process‐oriented health information systems. J Am Med Inform Assoc. 2011;18:738–748.
- , , , et al. Standardized clinical assessment and management plans (SCAMPs) provide a better alternative to clinical practice guidelines. Health Aff (Millwood) 2013;32(5):911–920.
- , , , et al. Clinical practice guidelines for clostridium difficile infection in adults: 2010 update by the Society for Healthcare Epidemiology of America (SHEA) and Infectious Diseases Society of America (IDSA). Infect Control Hosp Epidemiol. 2010;31:431–455.
Cellulitis is a common infection causing inflammation of the skin and subcutaneous tissues. Cellulitis has been attributed to gram‐positive organisms through historical evaluations including fine‐needle aspirates and punch biopsies of the infected tissue.[1] Neither of these diagnostic tests is currently used due to their invasiveness, poor diagnostic yield, and availability. Similarly, readily available tests such as blood cultures provide an etiology <5% of the time[1] and are not cost‐effective for most patients for diagnosing cellulitis.[2] In addition, the prevalence of methicillin‐resistant Staphylococcus aureus (MRSA) has steadily increased, complicating decisions about antibiotic selection.[3] The result of this uncertainty is a large variation in practice with respect to antibiotic and imaging selection for patients with a diagnosis of cellulitis.
University of Utah Health Care (UUHC) performed benchmarking for the management of cellulitis using the University HealthSystem Consortium (UHC) database and associated CareFx analytics tool. Benchmarking demonstrated that UUHC had a greater percentage of broad‐spectrum antibiotic use (defined as vancomycin, piperacillin/tazobactam, or carbapenems) than the top 5 performing UHC facilities for International Classification of Diseases, Ninth Revision, Clinical Modification (ICD‐9‐CM) diagnoses of cellulitis (vancomycin 83% vs 58% and carbapenem or piperacillin/tazobactam 44% vs 16%). Advanced imaging (computed tomography [CT] or magnetic resonance imaging [MRI]) for the diagnosis of cellulitis was also found to be an opportunity for improvement (CT 27% vs 20% and MRI 8% vs 5%). The hospitalist group (most patients admitted with cellulitis were on this service) believed these data reflected current practice, as there was no standard of treatment for cellulitis despite an active order set. Therefore, cellulitis was considered an opportunity to improve value to our patients. A standardized clinical care pathway was created, as such pathways have demonstrated a reduction in variation in practice and improved efficiency and effectiveness of care for multiple disease states including cellulitis.[4, 5] We hypothesized that implementation of an evidence‐based care pathway would decrease broad‐spectrum antibiotic use, cost, and use of advanced imaging without having any adverse effects on clinical outcomes such as length of stay (LOS) or readmission.
METHODS
Study Setting and Population
UUHC is a 500‐bed academic medical center in Salt Lake City, Utah. All patients admitted to the emergency department observation unit (EDOU) or the hospital with a primary ICD‐9‐CM diagnosis of cellulitis between July 1, 2011 and December 31, 2013 were evaluated.
Intervention
Initial steps involved the formation of a multidisciplinary team including key stakeholders from the hospitalist group, infectious diseases, the emergency department (ED), and nursing. This multidisciplinary team was charged with developing a clinical care pathway appropriate for local implementation. National guidance for the care pathway was mainly obtained from the Infectious Disease Society of America (IDSA) guidelines on skin and soft tissue infections (SSTIs)[6] and MRSA.[7] Specific attention was paid to recommendations on blood cultures (only when systemically ill), imaging (rarely needed), antibiotic selection (rarely gram‐negative coverage and consideration of MRSA coverage), and patient‐care principles that are often overlooked (elevation of the affected extremity). A distinction of purulent versus nonpurulent cellulitis was adopted based on the guidelines and a prospective evaluation of the care of patients with nonpurulent cellulitis.[8] The 2014 IDSA update on SSTIs incorporates this distinction more clearly in hopes of determining staphylococcal versus streptococcal infections.[9] After multiple iterations, an agreed‐upon care pathway was created that excluded patients with neutropenia, osteomyelitis, diabetic foot ulcerations; hand, perineal, periorbital, or surgical site infections; and human or animal bites (Figure 1). After the care pathway was determined, interventions were performed to implement this change.
Education of all providers involved included discussion of cellulitis as a disease process, presentation of benchmarking data, dissemination of the care pathway to hospitalist and ED physicians, teaching conferences for internal medicine residents and ED residents, and reinforcement of these concepts at the beginning of resident rotations.
Incorporation of the care pathway into the existing electronic order sets for cellulitis care in the inpatient and ED settings, with links to the care pathway, links to excluded disease processes (eg, hand cellulitis), preselection of commonly needed items (eg, elevate leg), and recommendations for antibiotic selection based on categories of purulent or nonpurulent cellulitis. The electronic health record (EHR) did not allow for forced order set usage, so the order set required selection by the admitting physician if indicated. Additionally, an embedded 48‐hour order set could be accessed at any time by the ordering physician and included vancomycin dosing. Specific changes to the preexisting order set included the development of sections for purulent and nonpurulent cellulitis as well as recommended antibiotics. Piperacillin/tazobactam and nafcillin were both removed and vancomycin was limited to the purulent subheading. Additionally, elevation of the extremity was preselected, and orderables for imaging (chest x‐ray and duplex ultrasound), antiulcer prophylaxis, telemetry, and electrocardiograph were all removed.
Audit and feedback of cases of cellulitis and broad‐spectrum antibiotic usage was performed by a senior hospitalist.
Study Design
A retrospective before/after study was performed to assess overall impact of the intervention on the patient population. Additionally, a retrospective controlled pre‐/postintervention study was performed to compare changes in cellulitis management for visits where order sets were used with visits where order sets were not used. The intervention initiation date was July 9, 2012. The institutional review board classified this project as quality improvement and did not require review and oversight.
Study Population
We analyzed 2278 ED and inpatient visits for cellulitis, of which 677 met inclusion criteria. We partitioned visits into 2 groups: (1) those for which order sets were used (n = 370) and (2) control visits for which order sets were not used (n = 307). We analyzed outcomes for 2 subpopulations: hospitalized patients for whom the EDOU or admission order sets were used (n = 149) and patients not admitted and only seen in the EDOU for whom the EDOU order set was used (n = 262).
Inclusion Criteria
Inclusion criteria included hospital admission or admission to the EDOU between July 1, 2011 and December 31, 2013, age greater or equal to 18 years, and primary diagnosis of cellulitis as determined by ICD‐9‐CM billing codes 035, 457.2, 681, 681.0, 681.00, 681.01, 681.02, 681.1, 681.10, 681.11, 681.9, 680, 680.0‐9, 682.0‐9, 684, 685.0, 685.1, 686.00, 686.01, 686.09, 686.1, 686.8, 686.9, 910.1, 910.5, 910.7, 910.9, 911.1, 911.3, 911.5, 911.7, 911.9, 912.1, 912.3, 912.5, 912.7, 912.9, 913.1, 913.3, 913.5, 913.7, 913.9, 914.1, 914.3, 914.5, 914.7, 914.9, 915.1, 915.3, 915.5, 915.7, 915.9, 916.1, 916.3, 916.5, 916.7, 916.9, 917.1, 917.3, 917.5, 917.7, 917.9, 919.1, 919.3, 919.5, 919.7, or 919.9.
Data Collection and Preparation
Clinical data were collected in the inpatient EHR (Cerner Corp., Kansas City, MO) and later imported into the enterprise data warehouse (EDW) as part of the normal data flow. Billing data were imported into the EDW from the billing system. Cost data were estimated using the value‐driven outcomes (VDO) tool developed by the University of Utah to identify clinical costs to the UUHC system.[10] All data were extracted from the EDW on September 10, 2014.
Process Metrics, Clinical, and Cost Outcomes
We defined 1 primary outcome (use of broad‐spectrum antibiotics) and 8 secondary outcomes, including process metrics (MRI and CT orders), clinical outcomes (LOS and 30‐day readmissions), and cost outcomes (pharmacy, lab, imaging cost from radiology department, and total facility cost). Broad‐spectrum antibiotics were defined as any use of meropenem (UUHC's carbapenem), piperacillin/tazobactam, or vancomycin and were determined by orders. Thirty‐day readmissions included only inpatient encounters with the primary diagnosis of cellulitis.
Covariates
To control for patient demographics we included age at admission in years and gender into the statistical model. To control for background health state as well as cellulitis severity, we included Charlson Comorbidity Index (CCI) and hospitalization status. CCI was calculated according to the algorithm specified by Quan et al.[11]
Study Hypotheses
First, for all patients, we hypothesized that process metrics as well as clinical and cost outcomes would improve following the implementation of the care pathway. To evaluate this hypothesis, we estimated impact of the time interval (pre‐/postintervention) on all outcomes. Second, we hypothesized that among patients for whom order sets were used (which we deemed to be a proxy for following the agreed‐upon care pathway), there would be a greater improvement than in patients for whom order sets were not used. To evaluate this hypothesis, we estimated interactions between order set use and time period (pre‐/postintervention) for all outcomes.
Statistical Analysis
The variable time period was created to represent the time period before and after the intervention.
We provided unadjusted descriptive statistics for study outcomes and visit characteristics for all patients before and after intervention. Descriptive statistics were expressed as n (%) and mean standard deviation. Simple comparisons were performed based on 2 test of homogeneity for categorical variables and t test or Wilcoxon test for continuous variables.
For before/after analysis, we fitted generalized linear regression models to estimate the change in outcomes of interest before and after intervention for all patients simultaneously. Generalized linear model defined by a binomial distributional assumption and logit link function was used to estimate the effect of the intervention on antibiotic use, imaging orders, and readmission adjusting for effects of age, gender, CCI, and hospitalization status. A generalized linear model defined by a gamma distributional assumption and log link function was used to estimate effect of the intervention on clinical LOS and cost outcomes adjusting for the effects of the same covariates. Generalized linear models with gamma distributional assumptions were used because they are known to perform well even for zero‐inflated semicontinuous cost variables and are easier to interpret than 2‐part models.
For the controlled before/after analysis, the variable order set used was created to represent groups where order sets were used or not used. Similarly, generalized linear models were used to estimate differential effect of the intervention at 2 different order set use levels using an interaction term between order set use and the time period.
P values <0.05 were considered significant. We used SAS version 9.3 statistical software (SAS Institute Inc., Cary, NC) for data analysis.
RESULTS
Descriptive Characteristics
Patient characteristics before and after intervention for 677 EDOU and inpatient visits for cellulitis by 618 patients are summarized in the first 4 columns of Table 1. Patient age at admission ranged from 18 to 98 years. Thirty‐eight percent of visits were by female patients. There were 274 visits before the intervention and 403 visits after. Four hundred thirty‐two (64%) were admitted, and 295 (44%) were seen in the EDOU. The admission order set alone was used for 104 visits, the EDOU order set alone was used for 242 visits, and both order sets were used for 24 visits.
| Characteristic | Overall | Order Sets Not Used | Order Sets Used | ||||||
|---|---|---|---|---|---|---|---|---|---|
| Baseline, N = 274 | Intervention, N = 403 | P* | Baseline, N = 127 | Intervention, N = 180 | P* | Baseline, N = 147 | Intervention, N = 223 | P* | |
| |||||||||
| Patient Characteristics | |||||||||
| Age, y | 46.8 16.0 | 48.9 17.1 | 0.097 | 49.8 16.0 | 5.1 16.3 | 0.88 | 44.2 15.5 | 48.0 17.6 | 0.032 |
| Female gender | 105 (38%) | 155 (39%) | 0.93 | 50 (39%) | 74 (41%) | 0.73 | 55 (37%) | 81 (36%) | 0.86 |
| CCI | 2.6 3.2 | 2.6 3.0 | 0.69 | 3.2 3.5 | 3.2 3.2 | 0.82 | 2.0 2.8 | 2.1 2.7 | 0.68 |
| Clinical process characteristics | |||||||||
| EDOU admission | 122 (45%) | 173 (43%) | 0.68 | 12 (9%) | 19 (11%) | 0.75 | 110 (75%) | 154 (69%) | 0.23 |
| Hospital admission | 173 (63%) | 259 (64%) | 0.76 | 117 (92%) | 166 (92%) | 0.98 | 56 (38%) | 93 (42%) | 0.49 |
| EDOU order set used | 111 (41%) | 155 (38%) | 0.59 | NA | NA | NA | 111 (76%) | 155 (70%) | 0.21 |
| ADM order set used | 47 (17%) | 81 (20%) | 0.34 | NA | NA | NA | 47 (32%) | 81 (36%) | 0.39 |
| Process outcomes | |||||||||
| Broad‐spectrum antibiotics used | 205 (75%) | 230 (57%) | <0.001 | 90 (71%) | 121 (67%) | 0.50 | 115 (78%) | 109 (49%) | <0.001 |
| MRI done | 27 (10%) | 32 (8%) | 0.39 | 13 (10%) | 20 (11%) | 0.81 | 14 (10%) | 12 (5%) | 0.13 |
| CT done | 56 (20%) | 76 (19%) | 0.61 | 32 (25%) | 43 (24%) | 0.79 | 24 (16%) | 33 (15%) | 0.69 |
| Clinical outcomes | |||||||||
| Length of stay, d | 2.7 2.6 | 2.6 2.8 | 0.35 | 3.6 2.8 | 3.8 3.4 | 0.62 | 2.0 2.1 | 1.7 1.6 | 0.48 |
| 30‐day readmission | 14 (5%) | 17 (4%) | 0.59 | 7 (6%) | 9 (5%) | 0.84 | 7 (5%) | 8 (4%) | 0.58 |
| Cost outcomes | |||||||||
| Pharmacy cost ($) | 1 | 0.76 | 0.002 | 1 | 0.89 | 0.13 | 1 | 0.56 | 0.004 |
| Lab cost ($) | 1 | 0.52 | <0.001 | 1 | 0.53 | 0.001 | 1 | 0.51 | 0.055 |
| Imaging cost ($) | 1 | 0.82 | 0.11 | 1 | 0.95 | 0.52 | 1 | 0.67 | 0.13 |
| Total facility cost ($) | 1 | 0.85 | 0.027 | 1 | 0.91 | 0.042 | 1 | 0.77 | 0.26 |
Before/After Analysis
Among all patients, use of broad‐spectrum antibiotics decreased from 75% to 57% (Table 1). Analysis adjusted for gender, age at admission, CCI, and hospital admission status is provided in Table 2. Overall, there was a 59% decrease in the odds of ordering broad‐spectrum antibiotics (P < 0.001), a 23% decrease in pharmacy cost (P = 0.002), a 44% decrease in laboratory cost (P < 0.001), and a 13% decrease in total facility cost (P = 0.006).
| Logistic Regression | ||||
|---|---|---|---|---|
| Outcome Variables | Selected Predictor Variables | Odds* | Percent Change | P |
| Gamma Regression | ||||
| Outcome Variables | Selected Predictor Variables | Fold Change* | Percent Change | P |
| ||||
| Antibiotics used | Time period | 0.41 (0.29, 0.59) | 59% (71% to 41%) | <0.001 |
| MRI done | Time period | 0.74 (0.43, 1.30) | 26% (57% to 30%) | 0.29 |
| CT done | Time period | 0.92 (0.62, 1.36) | 8% (38% to 36%) | 0.67 |
| 30‐day readmission | Time period | 0.86 (0.41, 1.80) | 14% (59% to 80%) | 0.69 |
| Length of stay, d | Time period | 0.97 (0.91, 1.03) | 3% (9% to 3%) | 0.34 |
| Pharmacy cost ($) | Time period | 0.77 (0.65, 0.91) | 23% (35% to 9%) | 0.002 |
| Lab cost ($) | Time period | 0.56 (0.48, 0.65) | 44% (52% to 35%) | <0.001 |
| Imaging cost($) | Time period | 0.90 (0.71, 1.14) | 10% (29% to 14%) | 0.38 |
| Total facility cost ($) | Time Period | 0.87 (0.79, 0.96) | 13% (21% to 4%) | 0.006 |
Order Set Use Groups Analysis
Descriptive statistics and simple comparison before/after the intervention for the 2 study groups are shown in the last 6 columns of Table 1. Among patients for whom order sets were used, broad‐spectrum antibiotic usage significantly decreased from 78% before the intervention to 49% after the intervention (P < 0.001). In contrast, among patients for whom order sets were not used, broad‐spectrum antibiotic usage remained relatively constant71% before the intervention versus 67% after the intervention (P = 0.50). Figure 2 shows semiannual changes in the prescription of broad‐spectrum antibiotics. There is a noticeable drop after the intervention among patients for whom order sets were used.
Analysis of the interaction between time period and order set usage is provided in Table 3. After the intervention, patients for whom the order sets were used had greater improvement in broad‐spectrum antibiotic selection (75% decrease, P < 0.001) and LOS (25% decrease, P = 0.041) than patients for whom order sets were not used. Pharmacy costs also decreased by 13% more among patients for whom the order sets were used, although the interaction was not statistically significant (P = 0.074). Laboratory costs decreased in both groups, but order set use did not demonstrate an interaction (P = 0.5). Similar results were found for the subgroups of admitted patients and patients seen in the EDOU.
| Logistic Regression | ||||
|---|---|---|---|---|
| Outcome Variables | Selected Predictor Variables | Odds* | Percent Change | P |
| Gamma Regression | ||||
| Outcome Variables | Selected Predictor Variables | Fold Change* | Percent Change | P |
| ||||
| Broad spectrum antibiotics | Time period | 0.84 (0.50, 1.40) | 16% (50% to 40%) | 0.50 |
| Time periodorder set | 0.25 (0.12, 0.52) | 75% (88% to 48%) | <0.001 | |
| MRI done | Time period | 1.04 (0.49, 2.20) | 4% (51% to 120%) | 0.92 |
| Time periodorder set | 0.44 (0.14, 1.38) | 56% (86% to 38%) | 0.16 | |
| CT done | Time period | 0.94 (0.55, 1.60) | 6% (45% to 60%) | 0.81 |
| Time periodorder set | 0.96 (0.44, 2.12) | 4% (56% to 112%) | 0.93 | |
| 30‐day readmission | Time period | 0.91 (0.33, 2.53) | 9% (67% to 153%) | 0.86 |
| Time periodorder set | 0.88 (0.20, 3.93) | 12% (80% to 293%) | 0.87 | |
| Clinical length of stay | Time period | 1.04 (0.95, 1.14) | 4% (5% to 14%) | 0.41 |
| Time periodorder set | 0.87 (0.77, 0.99) | 13% (23% to 1%) | 0.041 | |
| Pharmacy cost ($) | Time period | 0.88 (0.70, 1.12) | 12% (30% to 12%) | 0.31 |
| Time periodorder set | 0.75 (0.54, 1.03) | 25% (46% to 3%) | 0.074 | |
| Lab cost ($) | Time period | 0.53 (0.42, 0.66) | 47% (58% to 34%) | <0.001 |
| Time periodorder set | 1.11 (0.82, 1.50) | 11% (18% to 50%) | 0.50 | |
| Imaging cost ($) | Time period | 1.00 (0.71, 1.40) | 0% (29% to 40%) | 0.98 |
| Time periodorder set | 0.82 (0.51, 1.30) | 18% (49% to 30%) | 0.39 | |
| Facility cost ($) | Time period | 0.92 (0.80, 1.05) | 8% (20% to 5%) | 0.22 |
| Time periodorder set | 0.90 (0.75, 1.09) | 10% (25% to 9%) | 0.29 | |
Audit and feedback was initially performed for cases of cellulitis using broad‐spectrum antibiotics. However, given the complexity of cellulitis as a disease process and the frequency of broad‐spectrum antibiotic usage, in all cases of review, it was deemed reasonable to use broad‐spectrum antibiotics. Therefore, the audit was not continued.
DISCUSSION
Care pathways have demonstrated improvement across multiple different disease states including cellulitis.[4, 5] They have been noted to reduce variation in practice and improve physician agreement about treatment options.[4] The best method for implementation is not clearly understood,[12] and there remains concern about maintaining flexibility for patient care.[13] Additionally, although implementation of pathways is often well described, evaluations of the processes are noted to frequently be weak.[12] UUHC felt that the literature supported implementing a care pathway for the diagnosis of cellulitis, but that a thorough evaluation was also needed to understand any resulting benefits or harms. Through this study, we found that the implementation of this pathway resulted in a significant decrease in broad‐spectrum antibiotic use, pharmacy costs, and total facility costs. There was also a trend to decrease in imaging cost, and there were no adverse effects on LOS or 30‐day readmissions. Our findings demonstrate that care‐pathway implementation accompanied by education, pathway‐compliant electronic order sets, and audit and feedback can help drive improvements in quality while reducing costs. This finding furthers the evidence supporting standard work through the creation of clinical care pathways for cellulitis as an effective intervention.[4] Additionally, although not measured in this study, reduction of antibiotic use is supported as a measure to help reduce Clostridium difficile infections, a further potential benefit.[14]
This study has several important strengths. First, we included accurate cost analyses using the VDO tool. Given the increasing importance of improving care value, we feel the inclusion of such cost analysis is an increasingly important aspect of health service intervention evaluations. Second, we used a formal benchmarking approach to identify a priority care improvement area and to monitor changes in practice following the rollout of the intervention. We feel this approach provides a useful example on how to systematically improve care quality and value in a broader health system context. Third, we evaluated not order set implementation per se, but rather changing an existing order set. Because studies in this area generally focus on initial order set implementation, our study contributes insights on what can be expected through modifications of existing order sets based on care pathways. Fourth, the analysis accounted for a variety of variables including the CCI. Of interest, our study found that the intervention group (patients for whom order sets were used) had a lower CCI, confirming Allen et al.'s findings that diseases with predictable trajectories are the most likely to benefit from care pathways.[4] As a final strength, the narrative‐based order set intervention was relatively simple, and the inclusion criteria were broad, making the process generalizable.
Limitations of this study include that it was a single center pre‐/postintervention study and not a randomized controlled trial. Related to this limitation, the control group for which order sets were not used reflected a different patient population compared to the intervention group for which order sets were used. Specifically, it was more common for order sets to be used in the EDOU than upon admission, resulting in the order set group consisting of patients with less comorbidities than patients in the nonorder set group. Additionally, patients in the order set intervention group were older than in the baseline group (48.0 vs 44.2 years). However, these differences in population remained relatively stable before and after the intervention, and relevant variables including demographic factors and CCI were accounted for in the regression models. Nevertheless, it remains possible that secular trends existed that we did not capture that affected the 2 populations differently. For example, there was a separate project that overlapped with the intervention period to reduce unnecessary laboratory usage at UUHC. This intervention could have influenced the trend to decreased laboratory utilization in the postintervention period. However, there were no concurrent initiatives to reduce antibiotic use during the study period. As a final limitation, the statistical analyses have not corrected for multiple testing for the secondary outcomes.
CONCLUSION
Using benchmark data from UHC, an academic medical center was able to identify an opportunity for improving the care of patients with cellulitis and subsequently develop an evidence‐based care pathway. The implementation of this pathway correlated with a significant reduction of broad‐spectrum antibiotic use, pharmacy costs, and total facility costs without adverse clinical affects. An important factor in the success of the intervention was the use of electronic order sets for cellulitis, which provided support for the implementation of the care pathway. This study demonstrates that the intervention was not only effective overall, but that it was more effective for those patients for whom the order set was used. This study adds to the growing body of literature suggesting that a well‐defined care pathway can improve outcomes and reduce costs for patients and institutions.
Acknowledgements
The authors thank Ms. Pam Proctor for her assistance in implementation of the care pathway and Ms. Selma Lopez for her editorial assistance.
Disclosures: K.K. is or has been a consultant on clinical decision support (CDS) or electronic clinical quality measurement to the US Office of the National Coordinator for Health Information Technology, ARUP Laboratories, McKesson InterQual, ESAC, Inc., JBS International, Inc., Inflexxion, Inc., Intelligent Automation, Inc., Partners HealthCare, Mayo Clinic, and the RAND Corporation. K.K. receives royalties for a Duke Universityowned CDS technology for infectious disease management known as CustomID that he helped develop. K.K. was formerly a consultant for Religent, Inc. and a co‐owner and consultant for Clinica Software, Inc., both of which provide commercial CDS services, including through use of a CDS technology known as SEBASTIAN that K.K. developed. K.K. no longer has a financial relationship with either Religent or Clinica Software. K.K. has no competing interest with any specific product or intervention evaluated in this manuscript. All other authors declare no competing interests.
- . Cellulitis. N Engl J Med. 2004;350(9):904–912.
- , , , , , . Cost‐effectiveness of blood cultures for adult patients with cellulitis. Clin Infect Dis. 1999;29(6):1483–1488.
- , , , et al. Methicillin‐resistant s. aureus infectious among patients in the emergency department. N Engl J Med. 2006;355:666–674.
- , , . Systematic review of the effectiveness of integrated care pathways: what works, for whom, in which circumstances? Int J Evid Based Healthc. 2009;7:61–74.
- . Decreased antibiotic utilization after implementation of a guideline for inpatient cellulitis and cutaneous abscess. Arch Intern Med. 2011;171(12):1072–1079.
- , , , et al. Practice guidelines for the diagnosis and management of skin and soft‐tissue infections. Clin Infect Dis. 2005;41:1373–1406.
- , , , et al. Clinical practice guidelines by the Infectious Disease Society of American for the treatment of methicillin‐resistant Staphylococcus aureus infectious in adults and children. Clin Infect Dis. 2011;42:1–38.
- , , , . The role of b‐hemolytic streptococci in causing diffuse, nonculturable cellulitis. Medicine. 2010;89:217–226.
- , , , et al. Practice guidelines for the diagnosis and management of skin and soft tissue infections: 2014 update by the Infectious Disease Society of America. Clin Infect Dis. 2014;59(2):147–159.
- , , , et al. Value driven outcomes (VDO): a pragmatic, modular, and extensible software framework for understanding and improving health care costs and outcomes. J Am Med Inform Assoc. 2015;22(1):223–235.
- , , , et al. Coding algorithms for defining comorbidities in ICD‐9‐CM and ICD‐10 administrative data. Med Care. 2005;43:113–1139.
- , . Computerization of workflows, guidelines, and care pathways: a review of implementation challenges for process‐oriented health information systems. J Am Med Inform Assoc. 2011;18:738–748.
- , , , et al. Standardized clinical assessment and management plans (SCAMPs) provide a better alternative to clinical practice guidelines. Health Aff (Millwood) 2013;32(5):911–920.
- , , , et al. Clinical practice guidelines for clostridium difficile infection in adults: 2010 update by the Society for Healthcare Epidemiology of America (SHEA) and Infectious Diseases Society of America (IDSA). Infect Control Hosp Epidemiol. 2010;31:431–455.
© 2015 Society of Hospital Medicine
